Table of Contents
UNITED STATES
SECURITIES AND EXCHANGE COMMISSION
Washington, D.C. 20549
FormN-CSR
CERTIFIED SHAREHOLDER REPORT OF REGISTERED
MANAGEMENT INVESTMENT COMPANIES
Investment Company Act File Number:811-04000
CALVERT VARIABLE PRODUCTS, INC.
(Exact Name of Registrant as Specified in Charter)
1825 Connecticut Avenue NW, Suite 400, Washington, DC 20009
(Address of Principal Executive Offices)
Maureen A. Gemma
Two International Place, Boston, Massachusetts 02110
(Name and Address of Agent for Services)
(202)238-2200
(Registrant’s Telephone Number)
December 31
Date of Fiscal Year End
December 31, 2019
Date of Reporting Period
Table of Contents
Item 1. Reports to Stockholders
Table of Contents

Calvert
VP S&P MidCap 400 Index Portfolio
Annual Report
December 31, 2019
Important Note. Beginning on January 1, 2021, as permitted by regulations adopted by the Securities and Exchange Commission, you may not receive paper copies of the Fund’s annual and semi-annual shareholder reports from the insurance company or plan sponsor unless you specifically request paper copies. Instead, the reports will be made available on a website and you will be notified by mail each time a report is posted and provided with a website address to access the report. Instructions for requesting paper copies will be provided by the insurance company, plan sponsor or your financial intermediary, as applicable. Please contact the insurance company, plan sponsor or your financial intermediary, as applicable, or follow instructions included with this disclosure, if any, for more information.

Table of Contents
Commodity Futures Trading Commission Registration. Effective December 31, 2012, the Commodity Futures Trading Commission (“CFTC”) adopted certain regulatory changes that subject registered investment companies and advisers to regulation by the CFTC if a fund invests more than a prescribed level of its assets in certain CFTC-regulated instruments (including futures, certain options and swap agreements) or markets itself as providing investment exposure to such instruments. The Fund and its adviser have claimed an exclusion from the definition of the term “commodity pool operator” under the Commodity Exchange Act. Accordingly, neither the Fund nor the adviser is subject to CFTC regulation.
Fund shares are not insured by the FDIC and are not deposits or other obligations of, or guaranteed by, any depository institution. Shares are subject to investment risks, including possible loss of principal invested.
This report must be preceded or accompanied by a current summary prospectus or prospectus. Before investing, investors should consider carefully the investment objective, risks, and charges and expenses of a mutual fund. This and other important information is contained in the summary prospectus and prospectus, which can be obtained from a financial intermediary. Prospective investors should read the prospectus carefully before investing. For further information, please call1-800-368-2745.
Table of Contents
Annual Report December 31, 2019
Calvert
VP S&P MidCap 400 Index Portfolio
Table of Contents
Calvert
VP S&P MidCap 400 Index Portfolio
December 31, 2019
Management’s Discussion of Fund Performance1
Economic and Market Conditions
With virtually every U.S. equity index posting strong double-digit returns for the12-month period ended December 31, 2019 — and bond markets solidly in the black as well — 2019 was a good year for investments.
As the new year dawned in January 2019, investors appeared to be taking a “glass is half full” approach. Although U.S. manufacturing output and business investment remained weak — held back by slowing global growth and anon-again/off-again U.S.-China trade war — strong spending by U.S. consumers and dovish remarks by the U.S. Federal Reserve (the Fed) combined to lift investor sentiment. After four federal funds rate hikes the previous year, markets began to project the Fed might actually lower rates in 2019 to stimulate the economy. U.S. unemployment, meanwhile, remained low and hiring remained strong.
As a result, U.S. stocks across multiple markets climbed from January through April 2019. Overseas, central banks around the world began to cut interest rates and employ other tools to stimulate their respective economies. Even a global stock pullback in May — sparked by heightened concerns about the U.S.-China trade spat — proved to be temporary, and the U.S. and global stock rallies resumed in June and July.
After holding interest rates steady through the first half of the year, the Fed cut the federal funds rate on July 31, 2019 — its first reduction in over a decade — followed by two additional rate cuts in September and October to end the period at1.50%-1.75%. By end of the third quarter, 60 central banks around the world had lowered their interest rates as well.
After falling in August, U.S. equities rallied again during the final months of the period, spurred by optimism about a U.S.-China trade détente andbetter-than-expected U.S. employment reports. The year ended with two events in December that did much to allay investor concerns about international trade and tariffs: passage of the United States-Mexico-Canada Agreement by the U.S. House of Representatives and the Trump administration’s agreement to aso-called “phase–one” trade deal with China.
During the12-month period ended December 31, 2019, the blue-chip Dow Jones Industrial Average®2 returned 25.34%, while the broader U.S. equity market, as measured by the S&P 500® Index, returned 31.49%. The technology-laden Nasdaq Composite Index returned 36.69% during the period.Large-cap U.S. stocks, as measured by the S&P 500® Index, generally outperformed theirsmall-cap counterparts, as measured by the Russell 2000® Index. As a group, growth stocks outpaced value stocks in both large- andsmall-cap categories as measured by the Russell growth and value indexes.
Investment Strategy
As an index fund, Calvert VP S&P MidCap 400 Index Portfolio (the Fund) seeks to replicate, as closely as possible, the holdings and match the performance of the S&P MidCap 400® Index (the Index). The Fund seeks to accomplish this by employing a passive management approach and holding each constituent of the Index in approximately the same proportion as the Index. The Fund may also invest in exchange-traded funds (ETFs) that provide the same exposure to the Index. Cash holdings may gain exposure to the Index via futures contracts, allowing the Fund’s assets to be fully invested.
Fund Performance
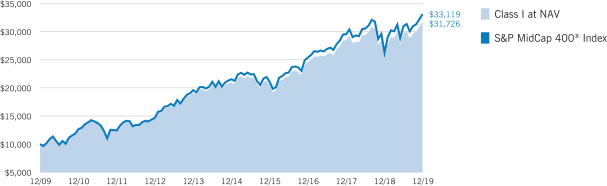
For the12-month period ended December 31, 2019, the Fund returned 25.82% for Class I shares at net asset value (NAV). By comparison, the Index returned 26.20% for the same period. The Index is unmanaged and returns do not reflect any fees and operating expenses.
During the period,mid-cap stocks trailedlarge-cap stocks, while slightly outperformingsmall-cap stocks. All market sectors within the Index had double-digit returns during the period, except for energy. Energy, among the smallest weights in the Index, had returns of 12.43% due to relatively low oil prices. Information technology and industrials had the strongest returns and, along with financials, held the greatest weights in the Index atyear-end.
Futures contracts, which are regularly used to manage uninvested cash holdings in the Fund, had a meaningful positive impact on performance during the period.
See Endnotes and Additional Disclosures in this report.
Past performance is no guarantee of future results. Returns are historical and are calculated by determining the percentage change in net asset value (NAV) or offering price (as applicable) with all distributions reinvested. Investment return and principal value will fluctuate so that shares, when redeemed, may be worth more or less than their original cost. Performance for periods less than or equal to one year is cumulative. Performance is for the stated time period only; due to market volatility, current Fund performance may be lower or higher than the quoted return.
| 2 |
Table of Contents
Calvert
VP S&P MidCap 400 Index Portfolio
December 31, 2019
Portfolio ManagerKevin L. Keene, CFA of Ameritas Investment Partners, Inc.
| % Average Annual Total Returns2,3 | Class Inception Date | Performance Inception Date | One Year | Five Years | Ten Years | |||||||||||||||
Class I at NAV | 05/03/1999 | 05/03/1999 | 25.82 | % | 8.64 | % | 12.23 | % | ||||||||||||
Class F at NAV | 10/01/2007 | 05/03/1999 | 25.55 | 8.38 | 11.96 | |||||||||||||||
| ||||||||||||||||||||
S&P MidCap 400® Index | — | — | 26.20 | % | 9.02 | % | 12.71 | % | ||||||||||||
| % Total Annual Operating Expense Ratios 4 | Class I | Class F | ||||||||||||||||||
| Gross | 0.44 | % | 0.64 | % | ||||||||||||||||
| Net | 0.33 | 0.53 | ||||||||||||||||||
Growth of $10,000
This graph shows the change in value of a hypothetical investment of $10,000 in Class I of the Fund for the period indicated. For comparison, the same investment is shown in the indicated index.
| Growth of Investment | Amount Invested | Period Beginning | At NAV | With Maximum Sales Charge | ||||||||||||
| Class F | $10,000 | 12/31/2009 | $30,972 | N.A. | ||||||||||||
See Endnotes and Additional Disclosures in this report.
Past performance is no guarantee of future results. Returns are historical and are calculated by determining the percentage change in net asset value (NAV) or offering price (as applicable) with all distributions reinvested. Investment return and principal value will fluctuate so that shares, when redeemed, may be worth more or less than their original cost. Performance for periods less than or equal to one year is cumulative. Performance is for the stated time period only; due to market volatility, current Fund performance may be lower or higher than the quoted return.
| 3 |
Table of Contents
Calvert
VP S&P MidCap 400 Index Portfolio
December 31, 2019
| Sector Allocation (% of net assets)5 | ||||
Financials | 16.1 | % | ||
Industrials | 15.1 | |||
Information Technology | 15.1 | |||
Consumer Discretionary | 13.2 | |||
Real Estate | 10.9 | |||
Health Care | 9.4 | |||
Materials | 5.9 | |||
Utilities | 4.4 | |||
Consumer Staples | 2.8 | |||
Energy | 2.0 | |||
Communication Services | 1.9 | |||
Exchange-Traded Funds | 1.3 | |||
Total | 98.1 | % | ||
| Top 10 Holdings (% of net assets) 5 | ||||
SPDR S&P MidCap 400 ETF Trust | 1.3 | % | ||
Teledyne Technologies, Inc. | 0.7 | |||
Domino’s Pizza, Inc. | 0.6 | |||
Tyler Technologies, Inc. | 0.6 | |||
Alleghany Corp. | 0.6 | |||
Teradyne, Inc. | 0.6 | |||
West Pharmaceutical Services, Inc. | 0.6 | |||
Medical Properties Trust, Inc. | 0.6 | |||
Fair Isaac Corp. | 0.6 | |||
Trimble, Inc. | 0.5 | |||
Total | 6.7 | % | ||
See Endnotes and Additional Disclosures in this report.
| 4 |
Table of Contents
Calvert
VP S&P MidCap 400 Index Portfolio
December 31, 2019
Endnotes and Additional Disclosures
| 1 | The views expressed in this report are those of the portfolio manager(s) and are current only through the date stated at the top of this page. These views are subject to change at any time based upon market or other conditions, and Calvert and the Fund(s) disclaim any responsibility to update such views. These views may not be relied upon as investment advice and, because investment decisions are based on many factors, may not be relied upon as an indication of trading intent on behalf of any Calvert fund. This commentary may contain statements that are not historical facts, referred to as “forward looking statements.” The Fund’s actual future results may differ significantly from those stated in any forward looking statement, depending on factors such as changes in securities or financial markets or general economic conditions, the volume of sales and purchases of Fund shares, the continuation of investment advisory, administrative and service contracts, and other risks discussed from time to time in the Fund’s filings with the Securities and Exchange Commission. |
| 2 | Dow Jones Industrial Average® is a price-weighted average of 30 blue-chip stocks that are generally the leaders in their industry. S&P 500® Index is an unmanaged index of large-cap stocks commonly used as a measure of U.S. stock market performance. S&P MidCap 400® Index is an unmanaged index of 400 U.S. mid-cap stocks. S&P Dow Jones Indices are a product of S&P Dow Jones Indices LLC (“S&P DJI”) and have been licensed for use. S&P® and S&P 500® are registered trademarks of S&P DJI; Dow Jones® is a registered trademark of Dow Jones Trademark Holdings LLC (“Dow Jones”); S&P DJI, Dow Jones and their respective affiliates do not sponsor, endorse, sell or promote the Fund, will not have any liability with respect thereto and do not have any liability for any errors, omissions, or interruptions of the S&P Dow Jones Indices. Nasdaq Composite Index is a market capitalization-weighted index of all domestic and international securities listed on Nasdaq. Source: Nasdaq, Inc. The information is provided by Nasdaq (with its affiliates, are referred to as the “Corporations”) and Nasdaq’s third party licensors on an “as is” basis and the Corporations make no guarantees and bear no liability of any kind with respect to the information or the Fund. Russell 2000® Index is an unmanaged index of 2,000 U.S. small-cap stocks. Unless otherwise stated, index returns do not reflect the effect of any applicable sales charges, commissions, expenses, taxes or leverage, as applicable. It is not possible to invest directly in an index. |
| 3 | There is no sales charge. Insurance-related charges are not included in the calculation of returns. If such charges were reflected, the returns would be lower. Please refer to the report for your insurance contract for performance data reflecting insurance-related charges. Performance since inception for an index, if presented, is the performance since the Fund’s or oldest share class’ inception, as applicable. |
Calvert Research and Management became the investment adviser to the Fund on December 31, 2016. Performance reflected prior to such date is that of the Fund’s former investment adviser. |
| 4 | Source: Fund prospectus. Net expense ratios reflect a contractual expense reimbursement that continues through 4/30/20. Without the reimbursement, performance would have been lower. The expense ratios for the current reporting period can be found in the Financial Highlights section of this report. |
| 5 | Excludes cash and cash equivalents. |
| 5 |
Table of Contents
Calvert
VP S&P MidCap 400 Index Portfolio
December 31, 2019
Example
As a Fund shareholder, you incur ongoing costs, including management fees; distribution and/or service fees; and other Fund expenses. This Example is intended to help you understand your ongoing costs (in dollars) of Fund investing and to compare these costs with the ongoing costs of investing in other mutual funds. The Example is based on an investment of $1,000 invested at the beginning of the period and held for the entire period (July 1, 2019 to December 31, 2019).
Actual Expenses
The first section of the table below provides information about actual account values and actual expenses. You may use the information in this section, together with the amount you invested, to estimate the expenses that you paid over the period. Simply divide your account value by $1,000 (for example, an $8,600 account value divided by $1,000 = 8.6), then multiply the result by the number in the first section under the heading entitled “Expenses Paid During Period” to estimate the expenses you paid on your account during this period.
Hypothetical Example for Comparison Purposes
The second section of the table below provides information about hypothetical account values and hypothetical expenses based on the actual Fund expense ratio and an assumed rate of return of 5% per year (before expenses), which is not the actual Fund return. The hypothetical account values and expenses may not be used to estimate the actual ending account balance or expenses you paid for the period. You may use this information to compare the ongoing costs of investing in the Fund and other funds. To do so, compare this 5% hypothetical example with the 5% hypothetical examples that appear in the shareholder reports of the other funds.
Please note that the expenses shown in the table are meant to highlight your ongoing costs only and do not reflect expenses and charges which are, or may be imposed under the variable annuity contract or variable life insurance policy (variable contracts) (if applicable) through which your investment in the Fund is made. Therefore, the second section of the table is useful in comparing ongoing costs associated with an investment in vehicles which fund benefits under variable contracts, and will not help you determine the relative total costs of investing in the Fund through variable contracts. In addition, if these expenses and charges imposed under the variable contracts were included, your costs would have been higher.
Beginning Account Value (7/1/19) | Ending Account Value (12/31/19) | Expenses Paid During Period* (7/1/19 – 12/31/19) | Annualized Expense | |||||||||||||
Actual | ||||||||||||||||
Class I | $ | 1,000.00 | $ | 1,068.10 | $ | 1.72 | ** | 0.33 | % | |||||||
Class F | $ | 1,000.00 | $ | 1,066.90 | $ | 2.76 | ** | 0.53 | % | |||||||
Hypothetical | ||||||||||||||||
(5% return per year before expenses) | ||||||||||||||||
Class I | $ | 1,000.00 | $ | 1,023.54 | $ | 1.68 | ** | 0.33 | % | |||||||
Class F | $ | 1,000.00 | $ | 1,022.53 | $ | 2.70 | ** | 0.53 | % | |||||||
| * | Expenses are equal to the Fund’s annualized expense ratio for the indicated Class, multiplied by the average account value over the period, multiplied by 184/365 (to reflect the one-half year period). The Example assumes that the $1,000 was invested at the net asset value per share determined at the close of business on June 30, 2019. Expenses shown do not include insurance-related charges. |
| ** | Absent a waiver and/or reimbursement of expenses by an affiliate, expenses would be higher. |
| 6 |
Table of Contents
Calvert
VP S&P MidCap 400 Index Portfolio
December 31, 2019
| Common Stocks — 96.8% |
| |||||||
| Security | Shares | Value | ||||||
| Aerospace & Defense — 1.4% | ||||||||
Axon Enterprise, Inc.(1) | 16,749 | $ | 1,227,367 | |||||
Curtiss-Wright Corp. | 12,078 | 1,701,669 | ||||||
Mercury Systems, Inc.(1) | 15,685 | 1,083,990 | ||||||
Teledyne Technologies, Inc.(1) | 10,229 | 3,544,758 | ||||||
| $ | 7,557,784 | |||||||
| Air Freight & Logistics — 0.4% | ||||||||
XPO Logistics, Inc.(1)(2) | 26,055 | $ | 2,076,583 | |||||
| Airlines — 0.3% | ||||||||
JetBlue Airways Corp.(1) | 80,972 | $ | 1,515,796 | |||||
| Auto Components — 1.4% | ||||||||
Adient PLC(1) | 24,610 | $ | 522,962 | |||||
Dana, Inc. | 40,679 | 740,358 | ||||||
Delphi Technologies PLC | 24,622 | 315,900 | ||||||
Gentex Corp. | 70,953 | 2,056,218 | ||||||
Goodyear Tire & Rubber Co. (The) | 65,723 | 1,022,321 | ||||||
Lear Corp. | 15,434 | 2,117,545 | ||||||
Visteon Corp.(1) | 7,901 | 684,148 | ||||||
| $ | 7,459,452 | |||||||
| Automobiles — 0.2% | ||||||||
Thor Industries, Inc. | 15,569 | $ | 1,156,621 | |||||
| Banks — 7.0% | ||||||||
Associated Banc-Corp. | 44,692 | $ | 985,012 | |||||
BancorpSouth Bank | 27,012 | 848,447 | ||||||
Bank of Hawaii Corp.(2) | 11,296 | 1,074,927 | ||||||
Bank OZK | 34,168 | 1,042,295 | ||||||
Cathay General Bancorp | 21,433 | 815,526 | ||||||
Commerce Bancshares, Inc. | 29,089 | 1,976,307 | ||||||
Cullen/Frost Bankers, Inc.(2) | 16,116 | 1,575,822 | ||||||
East West Bancorp, Inc. | 41,139 | 2,003,469 | ||||||
F.N.B. Corp. | 91,826 | 1,166,190 | ||||||
First Financial Bankshares, Inc. | 38,387 | 1,347,384 | ||||||
First Horizon National Corp. | 87,279 | 1,445,340 | ||||||
Fulton Financial Corp. | 46,033 | 802,355 | ||||||
Hancock Whitney Corp. | 24,462 | 1,073,393 | ||||||
Home BancShares, Inc. | 44,022 | 865,472 | ||||||
International Bancshares Corp. | 16,337 | 703,635 | ||||||
PacWest Bancorp | 33,411 | 1,278,639 | ||||||
Pinnacle Financial Partners, Inc. | 20,186 | 1,291,904 | ||||||
| Security | Shares | Value | ||||||
| Banks (continued) | ||||||||
Prosperity Bancshares, Inc. | 26,478 | $ | 1,903,503 | |||||
Signature Bank | 15,143 | 2,068,685 | ||||||
Sterling Bancorp | 56,669 | 1,194,582 | ||||||
Synovus Financial Corp. | 41,419 | 1,623,625 | ||||||
TCF Financial Corp. | 43,027 | 2,013,664 | ||||||
Texas Capital Bancshares, Inc.(1) | 14,218 | 807,156 | ||||||
Trustmark Corp. | 18,203 | 628,185 | ||||||
UMB Financial Corp. | 12,205 | 837,751 | ||||||
Umpqua Holdings Corp. | 62,240 | 1,101,648 | ||||||
United Bankshares, Inc. | 28,794 | 1,113,176 | ||||||
Valley National Bancorp | 110,682 | 1,267,309 | ||||||
Webster Financial Corp. | 26,049 | 1,389,975 | ||||||
Wintrust Financial Corp. | 16,023 | 1,136,031 | ||||||
| $ | 37,381,407 | |||||||
| Beverages — 0.2% | ||||||||
Boston Beer Co., Inc. (The), Class A(1)(2) | 2,597 | $ | 981,276 | |||||
| Biotechnology — 0.9% | ||||||||
Arrowhead Pharmaceuticals, Inc.(1) | 28,077 | $ | 1,780,924 | |||||
Exelixis, Inc.(1) | 85,617 | 1,508,572 | ||||||
Ligand Pharmaceuticals, Inc.(1) | 4,963 | 517,591 | ||||||
United Therapeutics Corp.(1) | 12,394 | 1,091,663 | ||||||
| $ | 4,898,750 | |||||||
| Building Products — 1.2% | ||||||||
Lennox International, Inc. | 9,835 | $ | 2,399,445 | |||||
Owens Corning | 30,512 | 1,986,941 | ||||||
Resideo Technologies, Inc.(1) | 34,704 | 414,019 | ||||||
Trex Co., Inc.(1)(2) | 16,514 | 1,484,278 | ||||||
| $ | 6,284,683 | |||||||
| Capital Markets — 2.6% | ||||||||
Affiliated Managers Group, Inc. | 13,820 | $ | 1,171,107 | |||||
Eaton Vance Corp.(3) | 31,952 | 1,491,839 | ||||||
Evercore, Inc., Class A | 10,963 | 819,594 | ||||||
FactSet Research Systems, Inc.(2) | 10,643 | 2,855,517 | ||||||
Federated Investors, Inc., Class B | 27,171 | 885,503 | ||||||
Interactive Brokers Group, Inc., Class A(2) | 21,693 | 1,011,327 | ||||||
Janus Henderson Group PLC | 43,646 | 1,067,145 | ||||||
Legg Mason, Inc. | 23,048 | 827,653 | ||||||
SEI Investments Co. | 35,400 | 2,317,992 | ||||||
Stifel Financial Corp. | 19,177 | 1,163,085 | ||||||
| $ | 13,610,762 | |||||||
| 7 | See Notes to Financial Statements. |
Table of Contents
Calvert
VP S&P MidCap 400 Index Portfolio
December 31, 2019
Schedule of Investments — continued
| Security | Shares | Value | ||||||
| Chemicals — 2.4% | ||||||||
Ashland Global Holdings, Inc. | 16,893 | $ | 1,292,821 | |||||
Cabot Corp. | 15,981 | 759,417 | ||||||
Chemours Co. (The)(2) | 46,208 | 835,903 | ||||||
Ingevity Corp.(1) | 11,831 | 1,033,793 | ||||||
Minerals Technologies, Inc. | 9,911 | 571,171 | ||||||
NewMarket Corp. | 2,087 | 1,015,367 | ||||||
Olin Corp. | 44,784 | 772,524 | ||||||
PolyOne Corp. | 21,728 | 799,373 | ||||||
RPM International, Inc. | 36,372 | 2,791,915 | ||||||
Scotts Miracle-Gro Co. (The), Class A | 11,137 | 1,182,527 | ||||||
Sensient Technologies Corp. | 11,962 | 790,568 | ||||||
Valvoline, Inc. | 53,192 | 1,138,841 | ||||||
| $ | 12,984,220 | |||||||
| Commercial Services & Supplies — 1.9% | ||||||||
Brink’s Co. (The) | 14,132 | $ | 1,281,490 | |||||
Clean Harbors, Inc.(1) | 14,526 | 1,245,604 | ||||||
Deluxe Corp. | 11,809 | 589,505 | ||||||
Healthcare Services Group, Inc. | 20,948 | 509,455 | ||||||
Herman Miller, Inc. | 16,692 | 695,222 | ||||||
HNI Corp. | 12,119 | 453,978 | ||||||
KAR Auction Services, Inc.(2) | 36,118 | 787,011 | ||||||
MSA Safety, Inc. | 10,068 | 1,272,192 | ||||||
Stericycle, Inc.(1)(2) | 25,765 | 1,644,065 | ||||||
Tetra Tech, Inc. | 15,447 | 1,330,914 | ||||||
| $ | 9,809,436 | |||||||
| Communications Equipment — 1.1% | ||||||||
Ciena Corp.(1) | 43,389 | $ | 1,852,276 | |||||
InterDigital, Inc. | 8,798 | 479,403 | ||||||
Lumentum Holdings, Inc.(1) | 21,736 | 1,723,665 | ||||||
NetScout Systems, Inc.(1) | 18,869 | 454,177 | ||||||
ViaSat, Inc.(1) | 16,286 | 1,192,054 | ||||||
| $ | 5,701,575 | |||||||
| Construction & Engineering — 1.2% | ||||||||
AECOM(1) | 44,059 | $ | 1,900,265 | |||||
Dycom Industries, Inc.(1) | 8,902 | 419,729 | ||||||
EMCOR Group, Inc. | 15,867 | 1,369,322 | ||||||
Fluor Corp. | 39,551 | 746,723 | ||||||
MasTec, Inc.(1) | 17,040 | 1,093,286 | ||||||
Valmont Industries, Inc. | 6,115 | 915,905 | ||||||
| $ | 6,445,230 | |||||||
| Security | Shares | Value | ||||||
| Construction Materials — 0.2% | ||||||||
Eagle Materials, Inc. | 11,677 | $ | 1,058,637 | |||||
| Consumer Finance — 0.6% | ||||||||
FirstCash, Inc. | 12,148 | $ | 979,493 | |||||
Green Dot Corp., Class A(1) | 13,480 | 314,084 | ||||||
Navient Corp. | 54,556 | 746,326 | ||||||
SLM Corp. | 118,409 | 1,055,024 | ||||||
| $ | 3,094,927 | |||||||
| Containers & Packaging — 1.0% | ||||||||
AptarGroup, Inc. | 17,930 | $ | 2,073,067 | |||||
Greif, Inc., Class A | 7,422 | 328,052 | ||||||
O-I Glass, Inc. | 43,651 | 520,756 | ||||||
Silgan Holdings, Inc. | 21,997 | 683,667 | ||||||
Sonoco Products Co. | 28,287 | 1,745,874 | ||||||
| $ | 5,351,416 | |||||||
| Distributors — 0.5% | ||||||||
Pool Corp. | 11,284 | $ | 2,396,496 | |||||
| Diversified Consumer Services — 1.0% | ||||||||
Adtalem Global Education, Inc.(1) | 15,524 | $ | 542,874 | |||||
Graham Holdings Co., Class B | 1,230 | 785,958 | ||||||
Grand Canyon Education, Inc.(1) | 13,526 | 1,295,656 | ||||||
Service Corp. International | 51,545 | 2,372,616 | ||||||
Weight Watchers International, Inc.(1) | 13,130 | 501,697 | ||||||
| $ | 5,498,801 | |||||||
| Diversified Financial Services — 0.3% | ||||||||
Jefferies Financial Group, Inc. | 71,240 | $ | 1,522,399 | |||||
| Electric Utilities — 1.5% | ||||||||
ALLETE, Inc. | 14,601 | $ | 1,185,163 | |||||
Hawaiian Electric Industries, Inc. | 30,801 | 1,443,335 | ||||||
IDACORP, Inc. | 14,245 | 1,521,366 | ||||||
OGE Energy Corp. | 56,145 | 2,496,768 | ||||||
PNM Resources, Inc. | 22,514 | 1,141,685 | ||||||
| $ | 7,788,317 | |||||||
| Electrical Equipment — 1.3% | ||||||||
Acuity Brands, Inc. | 11,113 | $ | 1,533,594 | |||||
EnerSys | 12,008 | 898,559 | ||||||
Hubbell, Inc. | 15,254 | 2,254,846 | ||||||
| 8 | See Notes to Financial Statements. |
Table of Contents
Calvert
VP S&P MidCap 400 Index Portfolio
December 31, 2019
Schedule of Investments — continued
| Security | Shares | Value | ||||||
| Electrical Equipment (continued) | ||||||||
nVent Electric PLC | 43,976 | $ | 1,124,906 | |||||
Regal Beloit Corp. | 11,483 | 983,060 | ||||||
| $ | 6,794,965 | |||||||
| Electronic Equipment, Instruments & Components — 3.6% | ||||||||
Arrow Electronics, Inc.(1) | 22,845 | $ | 1,935,885 | |||||
Avnet, Inc. | 28,318 | 1,201,816 | ||||||
Belden, Inc. | 10,920 | 600,600 | ||||||
Cognex Corp. | 47,933 | 2,686,165 | ||||||
Coherent, Inc.(1) | 6,779 | 1,127,687 | ||||||
II-VI, Inc.(1) | 24,495 | 824,747 | ||||||
Jabil, Inc. | 38,963 | 1,610,341 | ||||||
Littelfuse, Inc. | 6,832 | 1,306,962 | ||||||
National Instruments Corp. | 33,083 | 1,400,734 | ||||||
SYNNEX Corp. | 11,549 | 1,487,511 | ||||||
Tech Data Corp.(1) | 9,935 | 1,426,666 | ||||||
Trimble, Inc.(1) | 69,877 | 2,913,172 | ||||||
Vishay Intertechnology, Inc. | 37,408 | 796,416 | ||||||
| $ | 19,318,702 | |||||||
| Energy Equipment & Services — 0.5% | ||||||||
Apergy Corp.(1) | 21,894 | $ | 739,579 | |||||
Core Laboratories NV | 12,539 | 472,344 | ||||||
Patterson-UTI Energy, Inc. | 54,565 | 572,933 | ||||||
Transocean, Ltd.(1)(2) | 162,611 | 1,118,764 | ||||||
| $ | 2,903,620 | |||||||
| Entertainment — 0.4% | ||||||||
Cinemark Holdings, Inc.(2) | 30,133 | $ | 1,020,002 | |||||
World Wrestling Entertainment, Inc., Class A(2) | 13,448 | 872,372 | ||||||
| $ | 1,892,374 | |||||||
| Equity Real Estate Investment Trusts (REITs) — 10.4% | ||||||||
Alexander & Baldwin, Inc. | 19,194 | $ | 402,306 | |||||
American Campus Communities, Inc. | 38,837 | 1,826,504 | ||||||
Brixmor Property Group, Inc. | 84,187 | 1,819,281 | ||||||
Camden Property Trust | 27,159 | 2,881,570 | ||||||
CoreCivic, Inc. | 33,663 | 585,063 | ||||||
CoreSite Realty Corp. | 10,570 | 1,185,108 | ||||||
Corporate Office Properties Trust | 31,643 | 929,671 | ||||||
Cousins Properties, Inc. | 41,483 | 1,709,100 | ||||||
CyrusOne, Inc. | 31,750 | 2,077,403 | ||||||
Diversified Healthcare Trust | 67,197 | 567,143 | ||||||
Douglas Emmett, Inc. | 46,563 | 2,044,116 | ||||||
| Security | Shares | Value | ||||||
| Equity Real Estate Investment Trusts (REITs) (continued) | ||||||||
EastGroup Properties, Inc. | 10,810 | $ | 1,434,163 | |||||
EPR Properties | 21,969 | 1,551,890 | ||||||
First Industrial Realty Trust, Inc. | 35,752 | 1,484,066 | ||||||
GEO Group, Inc. (The) | 34,272 | 569,258 | ||||||
Healthcare Realty Trust, Inc. | 37,510 | 1,251,709 | ||||||
Highwoods Properties, Inc. | 29,318 | 1,433,943 | ||||||
JBG SMITH Properties(2) | 33,362 | 1,330,810 | ||||||
Kilroy Realty Corp. | 27,355 | 2,295,085 | ||||||
Lamar Advertising Co., Class A | 24,124 | 2,153,308 | ||||||
Liberty Property Trust | 44,252 | 2,657,333 | ||||||
Life Storage, Inc. | 13,186 | 1,427,780 | ||||||
Macerich Co. (The)(2) | 30,905 | 831,963 | ||||||
Mack-Cali Realty Corp. | 25,595 | 592,012 | ||||||
Medical Properties Trust, Inc. | 145,130 | 3,063,694 | ||||||
National Retail Properties, Inc. | 48,141 | 2,581,320 | ||||||
Omega Healthcare Investors, Inc. | 61,209 | 2,592,201 | ||||||
Park Hotels & Resorts, Inc. | 67,143 | 1,736,989 | ||||||
Pebblebrook Hotel Trust | 36,924 | 989,932 | ||||||
PotlatchDeltic Corp.(2) | 18,991 | 821,741 | ||||||
PS Business Parks, Inc. | 5,660 | 933,164 | ||||||
Rayonier, Inc. | 36,640 | 1,200,326 | ||||||
Sabra Health Care REIT, Inc. | 54,329 | 1,159,381 | ||||||
Service Properties Trust | 46,482 | 1,130,907 | ||||||
Spirit Realty Capital, Inc. | 28,152 | 1,384,515 | ||||||
Tanger Factory Outlet Centers, Inc.(2) | 26,440 | 389,461 | ||||||
Taubman Centers, Inc. | 17,301 | 537,888 | ||||||
Urban Edge Properties | 32,537 | 624,060 | ||||||
Weingarten Realty Investors | 34,187 | 1,068,002 | ||||||
| $ | 55,254,166 | |||||||
| Food & Staples Retailing — 0.6% | ||||||||
BJ’s Wholesale Club Holdings, Inc.(1)(2) | 34,461 | $ | 783,643 | |||||
Casey’s General Stores, Inc. | 10,393 | 1,652,383 | ||||||
Sprouts Farmers Market, Inc.(1) | 33,385 | 646,000 | ||||||
| $ | 3,082,026 | |||||||
| Food Products — 1.7% | ||||||||
Flowers Foods, Inc. | 54,424 | $ | 1,183,178 | |||||
Hain Celestial Group, Inc. (The)(1)(2) | 22,682 | 588,711 | ||||||
Ingredion, Inc. | 18,861 | 1,753,130 | ||||||
Lancaster Colony Corp. | 5,595 | 895,759 | ||||||
Pilgrim’s Pride Corp.(1) | 14,804 | 484,313 | ||||||
Post Holdings, Inc.(1) | 18,642 | 2,033,842 | ||||||
Sanderson Farms, Inc. | 5,573 | 982,074 | ||||||
| 9 | See Notes to Financial Statements. |
Table of Contents
Calvert
VP S&P MidCap 400 Index Portfolio
December 31, 2019
Schedule of Investments — continued
| Security | Shares | Value | ||||||
| Food Products (continued) | ||||||||
Tootsie Roll Industries, Inc. | 4,768 | $ | 162,780 | |||||
TreeHouse Foods, Inc.(1) | 15,885 | 770,423 | ||||||
| $ | 8,854,210 | |||||||
| Gas Utilities — 1.6% | ||||||||
National Fuel Gas Co. | 24,397 | $ | 1,135,436 | |||||
New Jersey Resources Corp. | 26,763 | 1,192,827 | ||||||
ONE Gas, Inc. | 14,906 | 1,394,755 | ||||||
Southwest Gas Holdings, Inc. | 15,355 | 1,166,519 | ||||||
Spire, Inc. | 14,361 | 1,196,415 | ||||||
UGI Corp. | 58,623 | 2,647,415 | ||||||
| $ | 8,733,367 | |||||||
| Health Care Equipment & Supplies — 3.3% | ||||||||
Avanos Medical, Inc.(1) | 13,758 | $ | 463,645 | |||||
Cantel Medical Corp.(2) | 10,388 | 736,509 | ||||||
Globus Medical, Inc., Class A(1) | 21,664 | 1,275,576 | ||||||
Haemonetics Corp.(1) | 14,215 | 1,633,303 | ||||||
Hill-Rom Holdings, Inc. | 18,725 | 2,125,849 | ||||||
ICU Medical, Inc.(1) | 5,434 | 1,016,810 | ||||||
Integra LifeSciences Holdings Corp.(1) | 20,066 | 1,169,446 | ||||||
LivaNova PLC(1) | 13,678 | 1,031,732 | ||||||
Masimo Corp.(1) | 13,760 | 2,174,906 | ||||||
NuVasive, Inc.(1) | 14,711 | 1,137,749 | ||||||
Penumbra, Inc.(1)(2) | 9,051 | 1,486,808 | ||||||
West Pharmaceutical Services, Inc. | 20,845 | 3,133,629 | ||||||
| $ | 17,385,962 | |||||||
| Health Care Providers & Services — 2.3% | ||||||||
Acadia Healthcare Co., Inc.(1) | 25,022 | $ | 831,231 | |||||
Amedisys, Inc.(1) | 9,098 | 1,518,638 | ||||||
Chemed Corp. | 4,500 | 1,976,670 | ||||||
Encompass Health Corp. | 27,655 | 1,915,662 | ||||||
HealthEquity, Inc.(1) | 19,961 | 1,478,511 | ||||||
Mednax, Inc.(1) | 23,803 | 661,485 | ||||||
Molina Healthcare, Inc.(1) | 17,586 | 2,386,244 | ||||||
Patterson Cos., Inc.(2) | 24,269 | 497,029 | ||||||
Tenet Healthcare Corp.(1) | 29,250 | 1,112,378 | ||||||
| $ | 12,377,848 | |||||||
| Health Care Technology — 0.1% | ||||||||
Allscripts Healthcare Solutions, Inc.(1) | 45,540 | $ | 446,975 | |||||
| Security | Shares | Value | ||||||
| Hotels, Restaurants & Leisure — 4.3% | ||||||||
Boyd Gaming Corp. | 22,618 | $ | 677,183 | |||||
Brinker International, Inc.(2) | 10,599 | 445,158 | ||||||
Caesars Entertainment Corp.(1) | 157,089 | 2,136,410 | ||||||
Cheesecake Factory, Inc. (The)(2) | 11,606 | 451,009 | ||||||
Choice Hotels International, Inc.(2) | 9,000 | 930,870 | ||||||
Churchill Downs, Inc. | 9,943 | 1,364,180 | ||||||
Cracker Barrel Old Country Store, Inc.(2) | 6,796 | 1,044,817 | ||||||
Domino’s Pizza, Inc. | 11,472 | 3,370,244 | ||||||
Dunkin’ Brands Group, Inc. | 23,380 | 1,766,125 | ||||||
Eldorado Resorts, Inc.(1)(2) | 18,464 | 1,101,193 | ||||||
Jack in the Box, Inc. | 6,684 | 521,553 | ||||||
Marriott Vacations Worldwide Corp. | 10,495 | 1,351,336 | ||||||
Papa John’s International, Inc.(2) | 6,199 | 391,467 | ||||||
Penn National Gaming, Inc.(1) | 31,111 | 795,197 | ||||||
Scientific Games Corp., Class A(1) | 15,275 | 409,064 | ||||||
Six Flags Entertainment Corp. | 22,182 | 1,000,630 | ||||||
Texas Roadhouse, Inc. | 18,485 | 1,041,075 | ||||||
Wendy’s Co. (The) | 52,144 | 1,158,118 | ||||||
Wyndham Destinations, Inc. | 25,440 | 1,314,994 | ||||||
Wyndham Hotels & Resorts, Inc. | 26,692 | 1,676,525 | ||||||
| $ | 22,947,148 | |||||||
| Household Durables — 1.0% | ||||||||
Helen of Troy, Ltd.(1) | 7,097 | $ | 1,275,969 | |||||
KB Home | 24,178 | 828,580 | ||||||
Tempur Sealy International, Inc.(1) | 12,744 | 1,109,493 | ||||||
Toll Brothers, Inc. | 36,517 | 1,442,787 | ||||||
TRI Pointe Group, Inc.(1) | 39,053 | 608,446 | ||||||
| $ | 5,265,275 | |||||||
| Household Products — 0.2% | ||||||||
Energizer Holdings, Inc. | 18,112 | $ | 909,585 | |||||
| Industrial Conglomerates — 0.5% | ||||||||
Carlisle Cos., Inc. | 15,896 | $ | 2,572,609 | |||||
| Insurance — 5.0% | ||||||||
Alleghany Corp.(1) | 4,037 | $ | 3,227,864 | |||||
American Financial Group, Inc. | 21,108 | 2,314,492 | ||||||
Brighthouse Financial, Inc.(1) | 30,646 | 1,202,243 | ||||||
Brown & Brown, Inc. | 65,589 | 2,589,454 | ||||||
CNO Financial Group, Inc. | 42,391 | 768,549 | ||||||
First American Financial Corp. | 31,685 | 1,847,869 | ||||||
Genworth Financial, Inc., Class A(1) | 142,263 | 625,957 | ||||||
| 10 | See Notes to Financial Statements. |
Table of Contents
Calvert
VP S&P MidCap 400 Index Portfolio
December 31, 2019
Schedule of Investments — continued
| Security | Shares | Value | ||||||
| Insurance (continued) | ||||||||
Hanover Insurance Group, Inc. (The) | 11,049 | $ | 1,510,067 | |||||
Kemper Corp. | 17,700 | 1,371,750 | ||||||
Mercury General Corp. | 7,667 | 373,613 | ||||||
Old Republic International Corp. | 80,558 | 1,802,082 | ||||||
Primerica, Inc. | 11,601 | 1,514,626 | ||||||
Reinsurance Group of America, Inc. | 17,561 | 2,863,497 | ||||||
RenaissanceRe Holdings, Ltd. | 12,386 | 2,427,904 | ||||||
RLI Corp. | 11,230 | 1,010,925 | ||||||
Selective Insurance Group, Inc. | 16,787 | 1,094,344 | ||||||
| $ | 26,545,236 | |||||||
| Interactive Media & Services — 0.3% | ||||||||
TripAdvisor, Inc. | 29,470 | $ | 895,299 | |||||
Yelp, Inc.(1) | 18,269 | 636,309 | ||||||
| $ | 1,531,608 | |||||||
| Internet & Direct Marketing Retail — 0.5% | ||||||||
Etsy, Inc.(1) | 33,234 | $ | 1,472,266 | |||||
GrubHub, Inc.(1)(2) | 25,821 | 1,255,934 | ||||||
| $ | 2,728,200 | |||||||
| IT Services — 2.4% | ||||||||
CACI International, Inc., Class A(1) | 7,033 | $ | 1,758,180 | |||||
CoreLogic, Inc.(1) | 22,650 | 990,032 | ||||||
KBR, Inc. | 40,011 | 1,220,336 | ||||||
LiveRamp Holdings, Inc.(1) | 19,119 | 919,050 | ||||||
MAXIMUS, Inc. | 18,036 | 1,341,698 | ||||||
Perspecta, Inc. | 38,993 | 1,030,975 | ||||||
Sabre Corp. | 77,355 | 1,735,846 | ||||||
Science Applications International Corp. | 13,863 | 1,206,358 | ||||||
WEX, Inc.(1) | 12,142 | 2,543,263 | ||||||
| $ | 12,745,738 | |||||||
| Leisure Products — 0.8% | ||||||||
Brunswick Corp. | 22,880 | $ | 1,372,343 | |||||
Mattel, Inc.(1)(2) | 97,666 | 1,323,374 | ||||||
Polaris, Inc. | 16,240 | 1,651,608 | ||||||
| $ | 4,347,325 | |||||||
| Life Sciences Tools & Services — 2.1% | ||||||||
Bio-Rad Laboratories, Inc., Class A(1) | 6,077 | $ | 2,248,672 | |||||
Bio-Techne Corp. | 10,759 | 2,361,708 | ||||||
Charles River Laboratories International, Inc.(1) | 13,795 | 2,107,324 | ||||||
PRA Health Sciences, Inc.(1) | 17,749 | 1,972,802 | ||||||
| Security | Shares | Value | ||||||
| Life Sciences Tools & Services (continued) | ||||||||
Repligen Corp.(1) | 13,114 | $ | 1,213,045 | |||||
Syneos Health, Inc.(1) | 17,550 | 1,043,786 | ||||||
| $ | 10,947,337 | |||||||
| Machinery — 4.3% | ||||||||
AGCO Corp. | 17,581 | $ | 1,358,132 | |||||
Colfax Corp.(1) | 23,614 | 859,077 | ||||||
Crane Co. | 14,403 | 1,244,131 | ||||||
Donaldson Co., Inc. | 35,498 | 2,045,395 | ||||||
Graco, Inc. | 46,778 | 2,432,456 | ||||||
ITT, Inc. | 24,598 | 1,818,038 | ||||||
Kennametal, Inc. | 23,308 | 859,832 | ||||||
Lincoln Electric Holdings, Inc. | 17,151 | 1,659,016 | ||||||
Nordson Corp. | 14,351 | 2,336,917 | ||||||
Oshkosh Corp. | 19,088 | 1,806,679 | ||||||
Terex Corp. | 18,128 | 539,852 | ||||||
Timken Co. (The) | 19,014 | 1,070,679 | ||||||
Toro Co. (The) | 29,899 | 2,382,053 | ||||||
Trinity Industries, Inc. | 27,528 | 609,745 | ||||||
Woodward, Inc. | 15,908 | 1,884,144 | ||||||
| $ | 22,906,146 | |||||||
| Marine — 0.3% | ||||||||
Kirby Corp.(1) | 16,938 | $ | 1,516,459 | |||||
| Media — 1.1% | ||||||||
AMC Networks, Inc., Class A(1) | 12,482 | $ | 493,039 | |||||
Cable One, Inc. | 1,419 | 2,112,139 | ||||||
John Wiley & Sons, Inc., Class A | 12,446 | 603,880 | ||||||
Meredith Corp. | 11,326 | 367,755 | ||||||
New York Times Co. (The), Class A | 40,626 | 1,306,939 | ||||||
TEGNA, Inc. | 61,238 | 1,022,062 | ||||||
| $ | 5,905,814 | |||||||
| Metals & Mining — 1.9% | ||||||||
Allegheny Technologies, Inc.(1)(2) | 35,636 | $ | 736,240 | |||||
Carpenter Technology Corp. | 13,472 | 670,636 | ||||||
Commercial Metals Co. | 33,331 | 742,281 | ||||||
Compass Minerals International, Inc.(2) | 9,577 | 583,814 | ||||||
Reliance Steel & Aluminum Co. | 18,696 | 2,239,033 | ||||||
Royal Gold, Inc. | 18,397 | 2,249,033 | ||||||
Steel Dynamics, Inc. | 60,429 | 2,057,003 | ||||||
United States Steel Corp.(2) | 48,261 | 550,658 | ||||||
Worthington Industries, Inc. | 10,475 | 441,836 | ||||||
| $ | 10,270,534 | |||||||
| 11 | See Notes to Financial Statements. |
Table of Contents
Calvert
VP S&P MidCap 400 Index Portfolio
December 31, 2019
Schedule of Investments — continued
| Security | Shares | Value | ||||||
| Multi-Utilities — 0.8% | ||||||||
Black Hills Corp. | 17,266 | $ | 1,356,072 | |||||
MDU Resources Group, Inc. | 56,264 | 1,671,603 | ||||||
NorthWestern Corp. | 14,258 | 1,021,871 | ||||||
| $ | 4,049,546 | |||||||
| Multiline Retail — 0.2% | ||||||||
Dillard’s, Inc., Class A(2) | 2,887 | $ | 212,137 | |||||
Ollie’s Bargain Outlet Holdings, Inc.(1)(2) | 15,463 | 1,009,888 | ||||||
| $ | 1,222,025 | |||||||
| Oil, Gas & Consumable Fuels — 1.5% | ||||||||
Antero Midstream Corp.(2) | 84,530 | $ | 641,583 | |||||
Chesapeake Energy Corp.(1)(2) | 318,885 | 263,271 | ||||||
CNX Resources Corp.(1) | 53,015 | 469,183 | ||||||
EQT Corp. | 72,217 | 787,165 | ||||||
Equitrans Midstream Corp.(2) | 57,668 | 770,445 | ||||||
Matador Resources Co.(1)(2) | 30,192 | 542,550 | ||||||
Murphy Oil Corp.(2) | 41,895 | 1,122,786 | ||||||
PBF Energy, Inc., Class A | 28,805 | 903,613 | ||||||
World Fuel Services Corp. | 18,480 | 802,402 | ||||||
WPX Energy, Inc.(1) | 116,887 | 1,606,027 | ||||||
| $ | 7,909,025 | |||||||
| Paper & Forest Products — 0.3% | ||||||||
Domtar Corp. | 15,849 | $ | 606,065 | |||||
Louisiana-Pacific Corp. | 32,943 | 977,419 | ||||||
| $ | 1,583,484 | |||||||
| Personal Products — 0.2% | ||||||||
Edgewell Personal Care Co.(1) | 15,309 | $ | 473,967 | |||||
Nu Skin Enterprises, Inc., Class A | 15,700 | 643,386 | ||||||
| $ | 1,117,353 | |||||||
| Pharmaceuticals — 0.8% | ||||||||
Catalent, Inc.(1) | 41,274 | $ | 2,323,726 | |||||
Nektar Therapeutics(1)(2) | 49,500 | 1,068,457 | ||||||
Prestige Consumer Healthcare, Inc.(1) | 14,201 | 575,141 | ||||||
| $ | 3,967,324 | |||||||
| Professional Services — 0.9% | ||||||||
ASGN, Inc.(1) | 14,952 | $ | 1,061,143 | |||||
FTI Consulting, Inc.(1) | 10,500 | 1,161,930 | ||||||
Insperity, Inc. | 10,545 | 907,292 | ||||||
ManpowerGroup, Inc. | 16,538 | 1,605,840 | ||||||
| $ | 4,736,205 | |||||||
| Security | Shares | Value | ||||||
| Real Estate Management & Development — 0.5% | ||||||||
Jones Lang LaSalle, Inc. | 14,454 | $ | 2,516,297 | |||||
| Road & Rail — 0.8% | ||||||||
Avis Budget Group, Inc.(1) | 15,944 | $ | 514,034 | |||||
Knight-Swift Transportation Holdings, Inc. | 34,701 | 1,243,684 | ||||||
Landstar System, Inc. | 11,201 | 1,275,458 | ||||||
Ryder System, Inc. | 15,075 | 818,723 | ||||||
Werner Enterprises, Inc. | 12,607 | 458,769 | ||||||
| $ | 4,310,668 | |||||||
| Semiconductors & Semiconductor Equipment — 4.0% | ||||||||
Cabot Microelectronics Corp. | 8,200 | $ | 1,183,424 | |||||
Cirrus Logic, Inc.(1) | 16,211 | 1,335,949 | ||||||
Cree, Inc.(1) | 30,237 | 1,395,438 | ||||||
Cypress Semiconductor Corp. | 103,585 | 2,416,638 | ||||||
First Solar, Inc.(1)(2) | 21,449 | 1,200,286 | ||||||
MKS Instruments, Inc. | 15,400 | 1,694,154 | ||||||
Monolithic Power Systems, Inc. | 11,367 | 2,023,553 | ||||||
Semtech Corp.(1) | 18,805 | 994,785 | ||||||
Silicon Laboratories, Inc.(1) | 12,251 | 1,420,871 | ||||||
SolarEdge Technologies, Inc.(1) | 13,570 | 1,290,371 | ||||||
Synaptics, Inc.(1) | 9,302 | 611,793 | ||||||
Teradyne, Inc. | 47,002 | 3,205,066 | ||||||
Universal Display Corp. | 11,892 | 2,450,584 | ||||||
| $ | 21,222,912 | |||||||
| Software — 3.7% | ||||||||
ACI Worldwide, Inc.(1) | 32,423 | $ | 1,228,345 | |||||
Blackbaud, Inc. | 13,899 | 1,106,360 | ||||||
CDK Global, Inc. | 34,257 | 1,873,173 | ||||||
Ceridian HCM Holding, Inc.(1)(2) | 28,179 | 1,912,791 | ||||||
Commvault Systems, Inc.(1) | 11,753 | 524,654 | ||||||
Fair Isaac Corp.(1) | 8,123 | 3,043,526 | ||||||
j2 Global, Inc. | 13,135 | 1,230,881 | ||||||
LogMeIn, Inc. | 13,692 | 1,173,952 | ||||||
Manhattan Associates, Inc.(1) | 17,923 | 1,429,359 | ||||||
PTC, Inc.(1) | 29,300 | 2,194,277 | ||||||
Teradata Corp.(1) | 31,554 | 844,701 | ||||||
Tyler Technologies, Inc.(1) | 10,971 | 3,291,519 | ||||||
| $ | 19,853,538 | |||||||
| Specialty Retail — 2.2% | ||||||||
Aaron’s, Inc. | 18,835 | $ | 1,075,667 | |||||
American Eagle Outfitters, Inc. | 44,892 | 659,912 | ||||||
AutoNation, Inc.(1) | 16,611 | 807,793 | ||||||
| 12 | See Notes to Financial Statements. |
Table of Contents
Calvert
VP S&P MidCap 400 Index Portfolio
December 31, 2019
Schedule of Investments — continued
| Security | Shares | Value | ||||||
| Specialty Retail (continued) | ||||||||
Bed Bath & Beyond, Inc. | 36,116 | $ | 624,807 | |||||
Dick’s Sporting Goods, Inc.(2) | 17,837 | 882,753 | ||||||
Five Below, Inc.(1) | 15,734 | 2,011,749 | ||||||
Foot Locker, Inc. | 30,022 | 1,170,558 | ||||||
Murphy USA, Inc.(1) | 8,110 | 948,870 | ||||||
RH(1) | 4,600 | 982,100 | ||||||
Sally Beauty Holdings, Inc.(1)(2) | 32,627 | 595,443 | ||||||
Urban Outfitters, Inc.(1)(2) | 19,951 | 554,039 | ||||||
Williams-Sonoma, Inc.(2) | 21,768 | 1,598,642 | ||||||
| $ | 11,912,333 | |||||||
| Technology Hardware, Storage & Peripherals — 0.2% | ||||||||
NCR Corp.(1) | 36,011 | $ | 1,266,147 | |||||
| Textiles, Apparel & Luxury Goods — 1.0% | ||||||||
Carter’s, Inc. | 12,382 | $ | 1,353,848 | |||||
Columbia Sportswear Co. | 8,144 | 815,947 | ||||||
Deckers Outdoor Corp.(1) | 7,847 | 1,325,045 | ||||||
Skechers U.S.A., Inc., Class A(1) | 37,805 | 1,632,798 | ||||||
| $ | 5,127,638 | |||||||
| Thrifts & Mortgage Finance — 0.6% | ||||||||
LendingTree, Inc.(1)(2) | 2,197 | $ | 666,658 | |||||
New York Community Bancorp, Inc. | 132,101 | 1,587,854 | ||||||
Washington Federal, Inc. | 21,974 | 805,347 | ||||||
| $ | 3,059,859 | |||||||
| Trading Companies & Distributors — 0.7% | ||||||||
GATX Corp. | 9,845 | $ | 815,658 | |||||
MSC Industrial Direct Co., Inc., Class A | 12,722 | 998,295 | ||||||
NOW, Inc.(1) | 31,682 | 356,106 | ||||||
Watsco, Inc. | 9,218 | 1,660,623 | ||||||
| $ | 3,830,682 | |||||||
| Water Utilities — 0.5% | ||||||||
Aqua America, Inc. | 60,539 | $ | 2,841,701 | |||||
| Wireless Telecommunication Services — 0.1% | ||||||||
Telephone & Data Systems, Inc. | 27,489 | $ | 699,045 | |||||
Total Common Stocks | $ | 513,983,579 | ||||||
| Exchange-Traded Funds — 1.3% |
| |||||||
| Security | Shares | Value | ||||||
SPDR S&P MidCap 400 ETF Trust(2) | 18,000 | $ | 6,756,840 | |||||
Total Exchange-Traded Funds | $ | 6,756,840 | ||||||
| Short-Term Investments — 1.1% |
| |||||||
| U.S. Treasury Obligations — 0.2% |
| |||||||
| Security | Principal (000’s omitted) | Value | ||||||
U.S. Treasury Bill, 0.00%, 2/27/20(4) | $ | 1,000 | $ | 997,659 | ||||
Total U.S. Treasury Obligations | $ | 997,659 | ||||||
| Securities Lending Collateral — 0.9% |
| |||||||
| Security | Shares | Value | ||||||
State Street Navigator Securities Lending Government Money Market | 5,174,093 | $ | 5,174,093 | |||||
Total Securities Lending Collateral |
| $ | 5,174,093 | |||||
Total Short-Term Investments |
| $ | 6,171,752 | |||||
Total Investments |
| $ | 526,912,171 | |||||
Other Assets, Less Liabilities — 0.8% |
| $ | 4,134,174 | |||||
Net Assets — 100.0% |
| $ | 531,046,345 | |||||
The percentage shown for each investment category in the Schedule of Investments is based on net assets.
Notes to Schedule of Investments
| (1) | Non-income producing security. |
| (2) | All or a portion of this security was on loan at December 31, 2019. The aggregate market value of securities on loan at December 31, 2019 was $42,777,256. |
| (3) | Represents an investment in an affiliate effective December 31, 2016 due to the issuer’s affiliation with the Fund’s investment adviser. |
| (4) | Security (or a portion thereof) has been pledged to cover margin requirements on open futures contracts. |
| (5) | Represents investment of cash collateral received in connection with securities lending. |
| 13 | See Notes to Financial Statements. |
Table of Contents
Calvert
VP S&P MidCap 400 Index Portfolio
December 31, 2019
Schedule of Investments — continued
| Futures Contracts | ||||||||||||||||||||
| Description | Number of Contracts | Position | Expiration Date | Notional Amount | Value/ Appreciation (Depreciation) | |||||||||||||||
| Equity Futures | ||||||||||||||||||||
E-mini S&P MidCap 400 Index | 51 | Long | 3/20/20 | $ | 10,530,480 | $ | 55,225 | |||||||||||||
| 14 | See Notes to Financial Statements. |
Table of Contents
Calvert
VP S&P MidCap 400 Index Portfolio
December 31, 2019
Statement of Assets and Liabilities
| Assets | December 31, 2019 | |||
Investments in securities of unaffiliated issuers, at value (identified cost $409,102,873) - including | $ | 525,420,332 | ||
Investments in securities of affiliated issuers, at value (identified cost $1,071,630) | 1,491,839 | |||
Receivable for variation margin on open futures contracts | 9,690 | |||
Cash | 11,063,845 | |||
Receivable for capital shares sold | 93,364 | |||
Dividends receivable | 604,888 | |||
Securities lending income receivable | 9,082 | |||
Receivable from affiliate | 54,708 | |||
Directors’ deferred compensation plan | 101,761 | |||
Other assets | 27,620 | |||
Total assets | $ | 538,877,129 | ||
| Liabilities | ||||
Payable for investments purchased | $ | 1,732,926 | ||
Payable for capital shares redeemed | 346,508 | |||
Deposits for securities loaned | 5,174,093 | |||
Payable to affiliates: | ||||
Investment advisory fee | 89,106 | |||
Administrative fee | 53,464 | |||
Distribution and service fees | 49,792 | |||
Sub-transfer agency fee | 142 | |||
Directors’ deferred compensation plan | 101,761 | |||
Accrued expenses | 282,992 | |||
Total liabilities | $ | 7,830,784 | ||
Net Assets | $ | 531,046,345 | ||
| Sources of Net Assets | ||||
Paid-in capital | $ | 389,795,840 | ||
Distributable earnings | 141,250,505 | |||
Total | $ | 531,046,345 | ||
| Class I | ||||
Net Assets | $ | 233,933,015 | ||
Shares Outstanding | 2,093,591 | |||
Net Asset Value, Offering Price and Redemption Price Per Share | ||||
(net assets ÷ shares of beneficial interest outstanding) | $ | 111.74 | ||
| Class F | ||||
Net Assets | $ | 297,113,330 | ||
Shares Outstanding | 2,644,479 | |||
Net Asset Value, Offering Price and Redemption Price Per Share | ||||
(net assets ÷ shares of beneficial interest outstanding) | $ | 112.35 | ||
| 15 | See Notes to Financial Statements. |
Table of Contents
Calvert
VP S&P MidCap 400 Index Portfolio
December 31, 2019
Statement of Operations
| Investment Income | Year Ended December 31, 2019 | |||
Dividend income (net of foreign taxes withheld of $4,283) | $ | 8,812,776 | ||
Dividend income - affiliated issuers | 47,378 | |||
Interest income | 119,024 | |||
Securities lending income, net | 96,429 | |||
Total investment income | $ | 9,075,607 | ||
| Expenses | ||||
Investment advisory fee | $ | 1,008,918 | ||
Administrative fee | 605,351 | |||
Distribution and service fees: | ||||
Class F | 558,083 | |||
Directors’ fees and expenses | 29,957 | |||
Custodian fees | 26,005 | |||
Transfer agency fees and expenses | 189,581 | |||
Accounting fees | 114,660 | |||
Professional fees | 53,732 | |||
Reports to shareholders | 67,446 | |||
Miscellaneous | 93,987 | |||
Total expenses | $ | 2,747,720 | ||
Waiver and/or reimbursement of expenses by affiliate | $ | (517,652 | ) | |
Reimbursement of expenses - other | (11,442 | ) | ||
Net expenses | $ | 2,218,626 | ||
Net investment income | $ | 6,856,981 | ||
| Realized and Unrealized Gain (Loss) | ||||
Net realized gain (loss): | ||||
Investment securities - unaffiliated issuers | $ | 15,402,815 | ||
Investment securities - affiliated issuers | 2,404 | |||
Futures contracts | 1,718,980 | |||
Net realized gain | $ | 17,124,199 | ||
Change in unrealized appreciation (depreciation): | ||||
Investment securities - unaffiliated issuers | $ | 88,267,353 | ||
Investment securities - affiliated issuers | 384,538 | |||
Futures contracts | 119,530 | |||
Net change in unrealized appreciation (depreciation) | $ | 88,771,421 | ||
Net realized and unrealized gain | $ | 105,895,620 | ||
Net increase in net assets resulting from operations | $ | 112,752,601 | ||
| 16 | See Notes to Financial Statements. |
Table of Contents
Calvert
VP S&P MidCap 400 Index Portfolio
December 31, 2019
Statements of Changes in Net Assets
| Year Ended December 31, | ||||||||
| Increase (Decrease) in Net Assets | 2019 | 2018 | ||||||
From operations: | ||||||||
Net investment income | $ | 6,856,981 | $ | 6,518,422 | ||||
Net realized gain | 17,124,199 | 35,010,240 | ||||||
Net change in unrealized appreciation (depreciation) | 88,771,421 | (98,726,336 | ) | |||||
Net increase (decrease) in net assets from operations | $ | 112,752,601 | $ | (57,197,674 | ) | |||
Distributions to shareholders: | ||||||||
Class I | $ | (18,345,023 | ) | $ | (17,139,326 | ) | ||
Class F | (22,802,015 | ) | (20,564,765 | ) | ||||
Total distributions to shareholders | $ | (41,147,038 | ) | $ | (37,704,091 | ) | ||
Capital share transactions: | ||||||||
Class I | $ | (868,512 | ) | $ | (11,340,005 | ) | ||
Class F | 11,902,788 | 3,819,388 | ||||||
Net increase (decrease) in net assets from capital share transactions | $ | 11,034,276 | $ | (7,520,617 | ) | |||
Net increase (decrease) in net assets | $ | 82,639,839 | $ | (102,422,382 | ) | |||
| Net Assets | ||||||||
At beginning of year | $ | 448,406,506 | $ | 550,828,888 | ||||
At end of year | $ | 531,046,345 | $ | 448,406,506 | ||||
| 17 | See Notes to Financial Statements. |
Table of Contents
Calvert
VP S&P MidCap 400 Index Portfolio
December 31, 2019
Financial Highlights
| Class I | ||||||||||||||||||||
| Year Ended December 31, | ||||||||||||||||||||
| 2019 | 2018 | 2017 | 2016 | 2015 | ||||||||||||||||
Net asset value — Beginning of year | $ | 97.01 | $ | 117.50 | $ | 106.11 | $ | 91.52 | $ | 95.73 | ||||||||||
| Income (Loss) From Operations | ||||||||||||||||||||
Net investment income (1) | $ | 1.63 | $ | 1.58 | $ | 1.44 | $ | 1.12 | $ | 1.02 | ||||||||||
Net realized and unrealized gain (loss) | 22.45 | (13.43 | ) | 15.18 | 17.43 | (3.56 | ) | |||||||||||||
Total income (loss) from operations | $ | 24.08 | $ | (11.85 | ) | $ | 16.62 | $ | 18.55 | $ | (2.54 | ) | ||||||||
| Less Distributions | ||||||||||||||||||||
From net investment income | $ | (1.34 | ) | $ | (1.40 | ) | $ | (0.81 | ) | $ | (0.44 | ) | $ | (0.09 | ) | |||||
From net realized gain | (8.01 | ) | (7.24 | ) | (4.42 | ) | (3.52 | ) | (1.58 | ) | ||||||||||
Total distributions | $ | (9.35 | ) | $ | (8.64 | ) | $ | (5.23 | ) | $ | (3.96 | ) | $ | (1.67 | ) | |||||
Net asset value — End of year | $ | 111.74 | $ | 97.01 | $ | 117.50 | $ | 106.11 | $ | 91.52 | ||||||||||
Total Return(2) | 25.82 | % | (11.33 | )% | 15.88 | % | 20.27 | % | (2.68 | )% | ||||||||||
| Ratios/Supplemental Data | ||||||||||||||||||||
Net assets, end of year (000’s omitted) | $ | 233,933 | $ | 202,330 | $ | 256,043 | $ | 246,310 | $ | 222,462 | ||||||||||
Ratios (as a percentage of average daily net assets):(3) | ||||||||||||||||||||
Total expenses | 0.43 | % | 0.44 | % | 0.43 | % | 0.54 | % | 0.54 | % | ||||||||||
Net expenses | 0.32 | % | 0.30 | % | 0.30 | % | 0.41 | % | 0.54 | % | ||||||||||
Net investment income | 1.48 | % | 1.35 | % | 1.29 | % | 1.15 | % | 1.05 | % | ||||||||||
Portfolio Turnover | 15 | % | 14 | % | 16 | % | 20 | % | 13 | % | ||||||||||
| (1) | Computed using average shares outstanding. |
| (2) | Returns are historical and are calculated by determining the percentage change in net asset value with all distributions reinvested and do not reflect fees and expenses imposed by variable annuity contracts or variable life insurance policies. If included, total return would be lower. |
| (3) | Total expenses do not reflect amounts reimbursed and/or waived by the adviser and certain of its affiliates, if applicable. Net expenses are net of all reductions and represent the net expenses paid by the Fund. |
| 18 | See Notes to Financial Statements. |
Table of Contents
Calvert
VP S&P MidCap 400 Index Portfolio
December 31, 2019
Financial Highlights — continued
| Class F | ||||||||||||||||||||
| Year Ended December 31, | ||||||||||||||||||||
| 2019 | 2018 | 2017 | 2016 | 2015 | ||||||||||||||||
Net asset value — Beginning of year | $ | 97.71 | $ | 118.58 | $ | 107.30 | $ | 92.83 | $ | 97.20 | ||||||||||
| Income (Loss) From Operations | ||||||||||||||||||||
Net investment income (1) | $ | 1.40 | $ | 1.31 | $ | 1.18 | $ | 1.14 | $ | 0.85 | ||||||||||
Net realized and unrealized gain (loss) | 22.59 | (13.54 | ) | 15.33 | 17.40 | (3.64 | ) | |||||||||||||
Total income (loss) from operations | $ | 23.99 | $ | (12.23 | ) | $ | 16.51 | $ | 18.54 | $ | (2.79 | ) | ||||||||
| Less Distributions | ||||||||||||||||||||
From net investment income | $ | (1.34 | ) | $ | (1.40 | ) | $ | (0.81 | ) | $ | (0.55 | ) | $ | — | ||||||
From net realized gain | (8.01 | ) | (7.24 | ) | (4.42 | ) | (3.52 | ) | (1.58 | ) | ||||||||||
Total distributions | $ | (9.35 | ) | $ | (8.64 | ) | $ | (5.23 | ) | $ | (4.07 | ) | $ | (1.58 | ) | |||||
Net asset value — End of year | $ | 112.35 | $ | 97.71 | $ | 118.58 | $ | 107.30 | $ | 92.83 | ||||||||||
Total Return(2) | 25.55 | % | (11.57 | )% | 15.63 | % | 19.96 | % | (2.90 | )% | ||||||||||
| Ratios/Supplemental Data | ||||||||||||||||||||
Net assets, end of year (000’s omitted) | $ | 297,113 | $ | 246,076 | $ | 294,786 | $ | 261,005 | $ | 13,051 | ||||||||||
Ratios (as a percentage of average daily net assets):(3) | ||||||||||||||||||||
Total expenses | 0.63 | % | 0.64 | % | 0.64 | % | 0.79 | % | 0.77 | % | ||||||||||
Net expenses | 0.54 | % | 0.55 | % | 0.55 | % | 0.66 | % | 0.77 | % | ||||||||||
Net investment income | 1.26 | % | 1.11 | % | 1.05 | % | 1.10 | % | 0.86 | % | ||||||||||
Portfolio Turnover | 15 | % | 14 | % | 16 | % | 20 | % | 13 | % | ||||||||||
| (1) | Computed using average shares outstanding. |
| (2) | Returns are historical and are calculated by determining the percentage change in net asset value with all distributions reinvested and do not reflect fees and expenses imposed by variable annuity contracts or variable life insurance policies. If included, total return would be lower. |
| (3) | Total expenses do not reflect amounts reimbursed and/or waived by the adviser and certain of its affiliates, if applicable. Net expenses are net of all reductions and represent the net expenses paid by the Fund. |
| 19 | See Notes to Financial Statements. |
Table of Contents
Calvert
VP S&P MidCap 400 Index Portfolio
December 31, 2019
Notes to Financial Statements
1 Significant Accounting Policies
Calvert VP S&P MidCap 400 Index Portfolio (the Fund) is a diversified series of Calvert Variable Products, Inc. (the Corporation). The Corporation is a Maryland corporation registered under the Investment Company Act of 1940, as amended (the 1940 Act), as an open-end management investment company. The investment objective of the Fund is to seek investment results that correspond to the total return performance of U.S. common stocks, as represented by the S&P MidCap 400® Index.
Shares of the Fund are sold without sales charge to insurance companies for allocation to certain of their variable separate accounts. The Fund offers Class I and Class F shares. Among other things, each class has different: (a) dividend rates due to differences in Distribution Plan expenses and otherclass-specific expenses; (b) exchange privileges; and (c) class-specific voting rights.
The Fund applies the accounting and reporting guidance in the Financial Accounting Standards Board (FASB) Accounting Standards Codification Topic 946,Financial Services – Investment Companies (ASC 946). Subsequent events, if any, through the date that the financial statements were issued have been evaluated in the preparation of the financial statements.
A Investment Valuation — Net asset value per share is determined every business day as of the close of the regular session of the New York Stock Exchange (generally 4:00 p.m. Eastern time). The Fund uses independent pricing services approved by the Board of Directors (the Board) to value its investments wherever possible. Investments for which market quotations are not available or deemed not reliable are fair valued in good faith under the direction of the Board.
U.S. generally accepted accounting principles (U.S. GAAP) establishes a disclosure hierarchy that categorizes the inputs to valuation techniques used to value assets and liabilities at measurement date. These inputs are summarized in the three broad levels listed below:
Level 1 - quoted prices in active markets for identical securities
Level 2 - other significant observable inputs (including quoted prices for similar securities, interest rates, prepayment speeds, credit risk, etc.)
Level 3 - significant unobservable inputs (including the Fund’s own assumptions in determining the fair value of investments)
The inputs or methodologies used for valuing securities are not necessarily an indication of the risk associated with investing in those securities.
Valuation techniques used to value the Fund’s investments by major category are as follows:
Equity Securities.Equity securities (including warrants and rights) listed on a U.S. securities exchange generally are valued at the last sale or closing price as reported by an independent pricing service on the primary market or exchange on which they are traded and are categorized as Level 1 in the hierarchy. Equity securities listed on the NASDAQ Global or Global Select Market are valued at the NASDAQ official closing price and are categorized as Level 1 in the hierarchy. Unlisted or listed securities for which closing sales prices or closing quotations are not available are valued at the mean between the latest available bid and ask prices and are categorized as Level 2 in the hierarchy.
Short-Term Debt Securities. Short-term debt securities with a remaining maturity at time of purchase of more than sixty days are valued on the basis of valuations provided by a third party pricing service. Such securities are generally categorized as Level 2 in the hierarchy. Short-term debt securities of sufficient credit quality purchased with remaining maturities of sixty days or less are valued at amortized cost, which approximates fair value, and are categorized as Level 2 in the hierarchy.
Other Securities.Exchange-traded funds are valued at the official closing price as reported by an independent pricing service on the primary market or exchange on which they are traded and are categorized as Level 1 in the hierarchy. Investments in registered investment companies (including money market funds) that do not trade on an exchange are valued at the net asset value per share on the valuation day and are categorized as Level 1 in the hierarchy.
Derivatives.Futures contracts are valued at unrealized appreciation (depreciation) based on the settlement price established each day by the board of trade or exchange on which they are traded and are categorized as Level 1 in the hierarchy.
Fair Valuation.If a market value cannot be determined for a security using the methodologies described above, or if, in the good faith opinion of the Fund’s adviser, the market value does not constitute a readily available market quotation, or if a significant event has occurred that would materially affect the value of the security, the security will be fair valued as determined in good faith by or at the direction of the Board in a manner that most fairly reflects the security’s “fair value”, which is the amount that the Fund might reasonably expect to receive for the security upon its current sale in the ordinary course. Each such determination is based on a consideration of relevant factors, which are likely to vary from one pricing context to another. These factors may include, but are not limited to, the type of security, the existence of any contractual restrictions on the security’s disposition, the price and extent of public trading in similar securities of the issuer or of comparable companies or entities, quotations or relevant information obtained from broker/dealers or other market participants, information obtained from the issuer, analysts, and/or the appropriate stock exchange (for exchange-traded securities), an analysis of the company’s or entity’s financial statements, and an evaluation of the forces that influence the issuer and the market(s) in which the security is purchased and sold.
| 20 |
Table of Contents
Calvert
VP S&P MidCap 400 Index Portfolio
December 31, 2019
Notes to Financial Statements — continued
The values assigned to fair value investments are based on available information and do not necessarily represent amounts that might ultimately be realized. Further, due to the inherent uncertainty of valuations of such investments, the fair values may differ significantly from the values that would have been used had an active market existed, and the differences could be material.
The following table summarizes the market value of the Fund’s holdings as of December 31, 2019, based on the inputs used to value them:
| Asset Description | Level 1 | Level 2 | Level 3 | Total | ||||||||||||
Common Stocks | $ | 513,983,579 | (1) | $ | — | $ | — | $ | 513,983,579 | |||||||
Exchange-Traded Funds | 6,756,840 | — | — | 6,756,840 | ||||||||||||
Short-Term Investments — | ||||||||||||||||
U.S. Treasury Obligations | — | 997,659 | — | 997,659 | ||||||||||||
Securities Lending Collateral | 5,174,093 | — | — | 5,174,093 | ||||||||||||
Total Investments | $ | 525,914,512 | $ | 997,659 | $ | — | $ | 526,912,171 | ||||||||
Futures Contracts | $ | 55,225 | $ | — | $ | — | $ | 55,225 | ||||||||
Total | $ | 525,969,737 | $ | 997,659 | $ | — | $ | 526,967,396 | ||||||||
(1) The level classification by major category of investments is the same as the category presentation in the Schedule of Investments.
Level 3 investments at the beginning and/or end of the period in relation to net assets were not significant and accordingly, a reconciliation of Level 3 assets for the year ended December 31, 2019 is not presented.
B Investment Transactions and Income — Investment transactions for financial statement purposes are accounted for on trade date. Realized gains and losses are recorded on an identified cost basis and may include proceeds from litigation. Dividend income is recorded on the ex-dividend date for dividends received in cash and/or securities or, in the case of dividends on certain foreign securities, as soon as the Fund is informed of the ex-dividend date.Non-cash dividends are recorded at the fair value of the securities received. Withholding taxes on foreign dividends, if any, have been provided for in accordance with the Fund’s understanding of the applicable country’s tax rules and rates. Distributions received that represent a return of capital are recorded as a reduction of cost of investments. Distributions received that represent a capital gain are recorded as a realized gain. Interest income, which includes amortization of premium and accretion of discount on debt securities, is accrued as earned.
C Share Class Accounting — Realized and unrealized gains and losses and net investment income and losses, other than class-specific expenses, are allocated daily to each class of shares based upon the relative net assets of each class to the total net assets of the Fund. Expenses arising in connection with a specific class are charged directly to that class.
D Foreign Currency Transactions — The Fund’s accounting records are maintained in U.S. dollars. For valuation of assets and liabilities on each date of net asset value determination, foreign denominations are converted into U.S. dollars using the current exchange rate. Security transactions, income, and expenses are translated at the prevailing rate of exchange on the date of the event. Recognized gains or losses on investment transactions attributable to changes in foreign currency exchange rates are recorded for financial statement purposes as net realized gains and losses on investments. That portion of unrealized gains and losses on investments that results from fluctuations in foreign currency exchange rates is not separately disclosed.
E Futures Contracts — The Fund may enter into futures contracts to buy or sell a financial instrument for a set price at a future date. Initial margin deposits of either cash or securities as required by the broker are made upon entering into the contract. While the contract is open, daily variation margin payments are made to or received from the broker reflecting the daily change in market value of the contract and are recorded for financial reporting purposes as unrealized gains or losses by the Fund. When a futures contract is closed, a realized gain or loss is recorded equal to the difference between the opening and closing value of the contract. The risks associated with entering into futures contracts may include the possible illiquidity of the secondary market which would limit the Fund’s ability to close out a futures contract prior to the settlement date, an imperfect correlation between the value of the contracts and the underlying financial instruments, or that the counterparty will fail to perform its obligations under the contracts’ terms. Futures contracts are designed by boards of trade, which are designated “contracts markets” by the Commodities Futures Trading Commission. Futures contracts trade on the contracts markets in a manner that is similar to the way a stock trades on a stock exchange, and the boards of trade, through their clearing corporations, guarantee the futures contracts against default. As a result, there is minimal counterparty credit risk to the Fund.
F Distributions to Shareholders — Distributions to shareholders are recorded by the Fund on ex-dividend date. The Fund distributes any net investment income and net realized capital gains at least annually. Both types of distributions are made in shares of the Fund unless an election is made on behalf of a separate account to receive some or all of the distributions in cash. Distributions are declared separately for each class of shares. Distributions are determined in accordance with income tax regulations which may differ from U.S. GAAP; accordingly, periodic reclassifications are made within the Fund’s capital accounts to reflect income and gains available for distribution under income tax regulations.
| 21 |
Table of Contents
Calvert
VP S&P MidCap 400 Index Portfolio
December 31, 2019
Notes to Financial Statements — continued
G Estimates — The preparation of financial statements in conformity with U.S. GAAP requires management to make estimates and assumptions that affect the reported amounts of assets and liabilities and disclosure of contingent assets and liabilities at the date of the financial statements and the reported amounts of increases and decreases in net assets from operations during the reporting period. Actual results could differ from those estimates.
H Indemnifications — The Corporation’s By-Laws provide for indemnification for Directors or officers of the Corporation and certain other parties, to the fullest extent permitted by Maryland law and the 1940 Act, provided certain conditions are met. Additionally, in the normal course of business, the Fund enters into agreements with service providers that may contain indemnification clauses. The Fund’s maximum exposure under these arrangements is unknown as this would involve future claims that may be made against the Fund that have not yet occurred.
I Federal Income Taxes — No provision for federal income or excise tax is required since the Fund intends to continue to qualify as a regulated investment company under the Internal Revenue Code and to distribute substantially all of its taxable earnings.
Management has analyzed the Fund’s tax positions taken for all open federal income tax years and has concluded that no provision for federal income tax is required in the Fund’s financial statements. A Fund’s federal tax return is subject to examination by the Internal Revenue Service for a period of three years from the date of filing.
2 Related Party Transactions
The investment advisory fee is earned by Calvert Research and Management (CRM), a subsidiary of Eaton Vance Management (EVM), as compensation for investment advisory services rendered to the Fund. Pursuant to the investment advisory agreement, CRM receives a fee, payable monthly, at the annual rate of 0.20% of the Fund’s average daily net assets. For the year ended December 31, 2019, the investment advisory fee amounted to $1,008,918.
Ameritas Investment Partners, Inc. (AIP) provides sub-advisory services to the Fund pursuant to a sub-advisory agreement with CRM. Sub-advisory fees are paid by CRM from its investment advisory fee.
CRM has agreed to reimburse the Fund’s operating expenses to the extent that total annual operating expenses (relating to ordinary operating expenses only and excluding expenses such as brokerage commissions, acquired fund fees and expenses of unaffiliated funds, borrowing costs, taxes or litigation expenses) exceed 0.33% and 0.53% (0.30% and 0.55% prior to May 1, 2019) for Class I and Class F, respectively, of such class’ average daiy net assets. The expense reimbursement agreement with CRM may be changed or terminated after April 30, 2020. For the year ended December 31, 2019, CRM waived or reimbursed expenses of $517,652.
The administrative fee is earned by CRM as compensation for administrative services rendered to the Fund. The fee is computed at an annual rate of 0.12% of the Fund’s average daily net assets attributable to Class I and Class F and is payable monthly. For the year ended December 31, 2019, CRM was paid administrative fees of $605,351.
The Fund has in effect a distribution plan for Class F shares (Class F Plan) pursuant to Rule 12b-1 under the 1940 Act. Pursuant to the Class F Plan, the Fund pays Eaton Vance Distributors, Inc. (EVD), an affiliate of CRM and the Fund’s principal underwriter, a distribution and service fee of 0.20% per annum of its average daily net assets attributable to Class F shares for distribution services and facilities provided to the Fund, as well as for personal and/or account maintenance services provided to the class shareholders. Distribution and service fees paid or accrued for the year ended December 31, 2019 amounted to $558,083 for Class F shares.
EVM provides sub-transfer agency and related services to the Fund pursuant to a Sub-Transfer Agency Support Services Agreement. For the year ended December 31, 2019, sub-transfer agency fees and expenses incurred to EVM amounted to $551 and are included in transfer agency fees and expenses on the Statement of Operations.
Each Director of the Fund who is not an employee of CRM or its affiliates receives a fee of $3,000 for each Board meeting attended in person and $2,000 for each Board meeting attended by phone plus an annual fee of $142,000, and $1,500 for each Committee meeting attended in person and $1,000 for each Committee meeting attended by phone plus an annual Committee fee of $2,500. The Board chair receives an additional $20,000 annual retainer and Committee chairs receive an additional $6,000 annual retainer. Eligible Directors may participate in a Deferred Compensation Plan (the Plan). Amounts deferred under the Plan are treated as though equal dollar amounts had been invested in shares of the Fund or other Calvert funds selected by the Directors. The Fund purchases shares of the funds selected equal to the dollar amounts deferred under the Plan, resulting in an asset equal to the deferred compensation liability. Obligations of the Plan are paid solely from the Fund’s assets. Directors’ fees are allocated to each of the Calvert funds served. Salaries and fees of officers and Directors of the Fund who are employees of CRM or its affiliates are paid by CRM. In addition, an advisory council was established to aid the Board and CRM in advancing the cause of responsible investing through original scholarship and thought leadership. The advisory council consists of CRM’s Chief Executive Officer and four additional members. Each member (other than CRM’s Chief Executive Officer) receives annual compensation of $75,000, which is being reimbursed by Calvert Investment Management, Inc. (CIM), the Calvert funds’ former investment adviser and Ameritas Holding Company, CIM’s parent company, through the end of 2019. For the year ended December 31, 2019, the Fund’s allocated portion of such expense and reimbursement was $11,442, which are included in miscellaneous expense and reimbursement of expenses - other, respectively, on the Statement of Operations.
| 22 |
Table of Contents
Calvert
VP S&P MidCap 400 Index Portfolio
December 31, 2019
Notes to Financial Statements — continued
3 Shareholder Servicing Plan
The Corporation, on behalf of the Fund, has adopted a Shareholder Servicing Plan (Servicing Plan), which permits the Fund to enter into shareholder servicing agreements with intermediaries that maintain accounts in the Fund for the benefit of shareholders. These services may include, but are not limited to, processing purchase and redemption requests, processing dividend payments, and providing account information to shareholders. Under the Servicing Plan, the Fund may make payments at an annual rate of up to 0.11% of its average daily net assets. For the year ended December 31, 2019, expenses incurred under the Servicing Plan amounted to $186,706 and are included in transfer agency fees and expenses on the Statement of Operations.
4 Investment Activity
During the year ended December 31, 2019, the cost of purchases and proceeds from sales of investments, other than short-term securities, were $74,826,226 and $97,591,214, respectively.
5 Distributions to Shareholders and Income Tax Information
The tax character of distributions declared for the years ended December 31, 2019 and December 31, 2018 was as follows:
| Year Ended December 31, | ||||||||
| 2019 | 2018 | |||||||
Ordinary income | $ | 8,005,851 | $ | 11,891,912 | ||||
Long-term capital gains | $ | 33,141,187 | $ | 25,812,179 | ||||
As of December 31, 2019, the components of distributable earnings (accumulated loss) on a tax basis were as follows:
Undistributed ordinary income | $ | 6,104,752 | ||
Undistributed long-term capital gains | $ | 17,915,406 | ||
Net unrealized appreciation | $ | 117,230,347 | ||
The cost and unrealized appreciation (depreciation) of investments, including open derivative contracts, of the Fund at December 31, 2019, as determined on a federal income tax basis, were as follows:
Aggregate cost | $ | 409,681,824 | ||
Gross unrealized appreciation | $ | 146,299,530 | ||
Gross unrealized depreciation | (29,069,183 | ) | ||
Net unrealized appreciation | $ | 117,230,347 | ||
6 Financial Instruments
A summary of futures contracts outstanding at December 31, 2019 is included in the Schedule of Investments. During the year ended December 31, 2019, the Fund used futures contracts to provide equity market exposure for uncommitted cash balances.
At December 31, 2019, the fair value of open derivative instruments (not considered to be hedging instruments for accounting disclosure purposes) and whose primary underlying risk exposure is equity price risk was as follows:
| Derivative | Statement of Assets and Liabilities Caption | Assets | Liabilities | |||||||||
Futures contracts | Distributable earnings | $ | 55,225 | (1) | $ | — | ||||||
| (1) | Only the current day’s variation margin is reported within the Statement of Assets and Liabilities as Receivable or Payable for variation margin on open futures contracts, as applicable. |
| 23 |
Table of Contents
Calvert
VP S&P MidCap 400 Index Portfolio
December 31, 2019
Notes to Financial Statements — continued
The effect of derivative instruments (not considered to be hedging instruments for accounting disclosure purposes) on the Statement of Operations and whose primary underlying risk exposure is equity price risk for the year ended December 31, 2019 was as follows:
| Statement of Operations Caption | ||||||||
| Derivative | Net realized gain (loss) | Change in unrealized | ||||||
Futures contracts | $ | 1,718,980 | $ | 119,530 | ||||
The average notional cost of futures contracts (long) outstanding during the year ended December 31, 2019 was approximately $8,796,000.
7 Securities Lending
To generate additional income, the Fund may lend its securities pursuant to a securities lending agency agreement with State Street Bank and Trust Company (SSBT), the securities lending agent. Security loans are subject to termination by the Fund at any time and, therefore, are not considered illiquid investments. The Fund requires that the loan be continuously collateralized by either cash or securities as collateral equal at all times to at least 102% of the market value of the domestic securities loaned and 105% of the market value of the international securities loaned (if applicable). The market value of securities loaned is determined daily and any additional required collateral is delivered to the Fund on the next business day. Cash collateral is generally invested in a money market fund registered under the 1940 Act that is managed by an affiliate of SSBT. Any gain or loss in the market price of the loaned securities that might occur and any interest earned or dividends declared during the term of the loan would accrue to the account of the Fund. Income earned on the investment of collateral, net of broker rebates and other expenses incurred by the securities lending agent, is split between the Fund and the securities lending agent on the basis of agreed upon contractual terms. Non-cash collateral, if any, is held by the lending agent on behalf of the Fund and cannot be sold or re-pledged by the Fund; accordingly, such collateral is not reflected in the Statement of Assets and Liabilities.
The risks associated with lending portfolio securities include, but are not limited to, possible delays in receiving additional collateral or in the recovery of the loaned securities, possible loss of rights to the collateral should the borrower fail financially, as well as risk of loss in the value of the collateral or the value of the investments made with the collateral. The securities lending agent shall indemnify the Fund in the case of default of any securities borrower.
At December 31, 2019, the total value of securities on loan was $42,777,256 and the total value of collateral received was $43,603,027, comprised of cash of $5,174,093 and U.S. government and/or agencies securities of $38,428,934.
The following table provides a breakdown of securities lending transactions accounted for as secured borrowings, the obligations by class of collateral pledged, and the remaining contractual maturity of those transactions as of December 31, 2019.
| Remaining Contractual Maturity of the Transactions | ||||||||||||||||||||
Overnight and Continuous | <30 days | 30 to 90 days | >90 days | Total | ||||||||||||||||
Securities Lending Transactions | ||||||||||||||||||||
Common Stocks | $ | 42,329,618 | $ | — | $ | — | $ | — | $ | 42,329,618 | ||||||||||
Exchange-Traded Funds | 1,273,409 | — | — | — | 1,273,409 | |||||||||||||||
Total | $ | 43,603,027 | $ | — | $ | — | $ | — | $ | 43,603,027 | ||||||||||
The carrying amount of the liability for deposits for securities loaned at December 31, 2019 approximated its fair value. If measured at fair value, such liability would have been considered as Level 2 in the fair value hierarchy (see Note 1A) at December 31, 2019.
8 Line of Credit
Effective October 29, 2019, the Fund participates with other portfolios and funds managed by EVM and its affiliates, including CRM, in an $800 million unsecured line of credit with a group of banks, which is in effect through October 27, 2020. Borrowings are made by the Fund solely to facilitate the handling of unusual and/or unanticipated short-term cash requirements. Interest is charged to the Fund based on its borrowings at an amount above either the Eurodollar rate or Federal Funds rate. In addition, a fee computed at an annual rate of 0.15% on the daily unused portion of the line of credit is allocated among the participating portfolios and funds at the end of each quarter. Because the line of credit is not available exclusively to the Fund, it may be unable to borrow some or all of its requested amounts at any particular time.
| 24 |
Table of Contents
Calvert
VP S&P MidCap 400 Index Portfolio
December 31, 2019
Notes to Financial Statements — continued
Prior to October 29, 2019, the Fund participated with other funds managed by CRM in a $100 million ($62.5 million prior to June 21, 2019) committed line of credit agreement with SSBT, which was terminated by the Calvert funds. Borrowings bore interest at the higher of the one-month London Interbank Offered Rate (LIBOR) in effect that day or the overnight Federal Funds rate, plus 1.00% per annum. A commitment fee of 0.20% per annum was incurred on the unused portion of the committed facility, which was allocated to all participating funds.
The Fund had no borrowings pursuant to its lines of credit during the year ended December 31, 2019.
9 Affiliated Companies
An affiliated company is a company in which a fund has a direct or indirect ownership of, control of, or voting power of 5 percent or more of the outstanding voting shares, or a company that is under common ownership or control with a fund. At December 31, 2019, the value of the Fund’s investment in affiliated companies was $1,491,839, which represents 0.28% of the Fund’s net assets. Transactions in affiliated companies by the Fund for the year ended December 31, 2019 were as follows:
| Name of Affiliated Company | Value, beginning of period | Purchases | Sales Proceeds | Net Realized Gain (Loss) | Change In Unrealized | Value, end of | Dividend Income | Capital Gain Distributions | Shares, end of period | |||||||||||||||||||||||||||
Eaton Vance Corp. | $ | 1,204,809 | $ | — | $ | (99,912 | ) | $ | 2,404 | $ | 384,538 | $ | 1,491,839 | $ | 47,378 | $ | — | 31,952 | ||||||||||||||||||
10 Capital Shares
The Corporation may issue its shares in one or more series (such as the Fund). The authorized shares of the Fund consist of 20,000,000 common shares, $0.10 par value, for each Class. Transactions in capital shares for the years ended December 31, 2019 and December 31, 2018 were as follows:
Year Ended December 31, 2019 | Year Ended December 31, 2018 | |||||||||||||||
| Shares | Amount | Shares | Amount | |||||||||||||
Class I | ||||||||||||||||
Shares sold | 87,377 | $ | 9,530,108 | 111,777 | $ | 12,820,442 | ||||||||||
Reinvestment of distributions | 181,418 | 18,345,023 | 146,678 | 17,139,326 | ||||||||||||
Shares redeemed | (260,862 | ) | (28,743,643 | ) | (351,907 | ) | (41,299,773 | ) | ||||||||
Net increase (decrease) | 7,933 | $ | (868,512 | ) | (93,452 | ) | $ | (11,340,005 | ) | |||||||
Class F | ||||||||||||||||
Shares sold | 93,788 | $ | 10,401,238 | 57,086 | $ | 6,760,577 | ||||||||||
Reinvestment of distributions | 224,165 | 22,802,015 | 174,618 | 20,564,765 | ||||||||||||
Shares redeemed | (192,009 | ) | (21,300,465 | ) | (199,149 | ) | (23,505,954 | ) | ||||||||
Net increase | 125,944 | $ | 11,902,788 | 32,555 | $ | 3,819,388 | ||||||||||
At December 31, 2019, separate accounts of an insurance company that is an affiliate of AIP and a separate account of another insurance company owned 23.1% and 52.4%, respectively, of the value of the outstanding shares of the Fund.
| 25 |
Table of Contents
Calvert
VP S&P MidCap 400 Index Portfolio
December 31, 2019
Report of Independent Registered Public Accounting Firm
To the Shareholders and Board of Directors
Calvert Variable Products, Inc.:
Opinion on the Financial Statements
We have audited the accompanying statement of assets and liabilities of Calvert VP S&P MidCap 400 Index Portfolio (the Fund), a series of Calvert Variable Products, Inc., including the schedule of investments, as of December 31, 2019, the related statement of operations for the year then ended, the statements of changes in net assets for each of the years in thetwo-year period then ended, and the related notes (collectively, the financial statements) and the financial highlights for each of the years in thefive-year period then ended. In our opinion, the financial statements and financial highlights present fairly, in all material respects, the financial position of the Fund as of December 31, 2019, the results of its operations for the year then ended, the changes in its net assets for each of the years in thetwo-year period then ended, and the financial highlights for each of the years in thefive-year period then ended, in conformity with U.S. generally accepted accounting principles.
Basis for Opinion
These financial statements and financial highlights are the responsibility of the Fund’s management. Our responsibility is to express an opinion on these financial statements and financial highlights based on our audits. We are a public accounting firm registered with the Public Company Accounting Oversight Board (United States) (PCAOB) and are required to be independent with respect to the Fund in accordance with the U.S. federal securities laws and the applicable rules and regulations of the Securities and Exchange Commission and the PCAOB.
We conducted our audits in accordance with the standards of the PCAOB. Those standards require that we plan and perform the audit to obtain reasonable assurance about whether the financial statements and financial highlights are free of material misstatement, whether due to error or fraud. Our audits included performing procedures to assess the risks of material misstatement of the financial statements and financial highlights, whether due to error or fraud, and performing procedures that respond to those risks. Such procedures included examining, on a test basis, evidence regarding the amounts and disclosures in the financial statements and financial highlights. Such procedures also included confirmation of securities owned as of December 31, 2019, by correspondence with the custodian and brokers. Our audits also included evaluating the accounting principles used and significant estimates made by management, as well as evaluating the overall presentation of the financial statements and financial highlights. We believe that our audits provide a reasonable basis for our opinion.

We have served as the auditor of one or more of the Calvert Funds since 2002.
Philadelphia, Pennsylvania
February 19, 2020
| 26 |
Table of Contents
Calvert
VP S&P MidCap 400 Index Portfolio
December 31, 2019
Federal Tax Information (Unaudited)
As required by the Internal Revenue Code and/or regulations, shareholders must be notified regarding the status of the dividends received deduction for corporations and capital gains dividends.
Dividends Received Deduction.Corporate shareholders are generally entitled to take the dividends received deduction on the portion of the Fund’s dividend distribution that qualifies under tax law. For the Fund’s fiscal 2019 ordinary income dividends, 69.60% qualifies for the corporate dividends received deduction.
Capital Gains Dividends.The Fund hereby designates as a capital gain dividend with respect to the taxable year ended December 31, 2019, $17,915,525 or, if subsequently determined to be different, the net capital gain of such year.
| 27 |
Table of Contents
Calvert
VP S&P MidCap 400 Index Portfolio
December 31, 2019
Fund Management. The Directors of Calvert Variable Products, Inc. (the Corporation) are responsible for the overall management and supervision of the Corporation’s affairs. The Directors and officers of the Corporation are listed below. Except as indicated, each individual has held the office shown or other offices in the same company for the last five years. Each Board member holds office until his or her successor is elected and qualified, or until his or her earlier death, resignation, retirement, removal or disqualification. Under the terms of the Fund’s current Board member retirement policy, an Independent Board member must retire at the end of the calendar year in which he or she turns 75. However, if such retirement would cause the Fund to be out of compliance with Section 16 of the 1940 Act or any other regulations or guidance of the SEC, then such retirement and resignation will not become effective until such time as action has been taken for the Fund to be in compliance upon a Board member’s retirement. The “Independent Directors” consist of those Directors who are not “interested persons” of the Corporation, as that term is defined under the 1940 Act. The business address of each Director and officer, with the exception of Ms. Gemma and Mr. Kirchner, is 1825 Connecticut Avenue NW, Suite 400, Washington, DC 20009. As used below, “CRM” refers to Calvert Research and Management. Each Director oversees 39 funds in the Calvert fund complex. Each officer serves as an officer of certain other Calvert funds.
| Name and Year of Birth | Position with the | Position Start Date | Principal Occupation(s) and Directorships During Past Five Years and Other Relevant Experience | |||
| Interested Director | ||||||
John H. Streur(1) 1960 | Director and President | 2015 | President and Chief Executive Officer of Calvert Research and Management (since December 31, 2016). President and Chief Executive Officer of Calvert Investments, Inc. (January 2015-December 2016); Chief Executive Officer of Calvert Investment Distributors, Inc. (August 2015-December 2016); Chief Compliance Officer of Calvert Investment Management, Inc. (August 2015-April 2016); President and Director, Portfolio 21 Investments, Inc. (through October 2014); President, Chief Executive Officer and Director, Managers Investment Group LLC (through January 2012); President and Director, The Managers Funds and Managers AMG Funds (through January 2012). Other Directorships in the Last Five Years.Portfolio 21 Investments, Inc. (asset management) (through October 2014); Managers Investment Group LLC (asset management) (through January 2012); The Managers Funds (asset management) (through January 2012); Managers AMG Funds (asset management) (through January 2012); Calvert Impact Capital, Inc. | |||
| Independent Directors | ||||||
Richard L. Baird, Jr. 1948 | Director | 2016 | Regional Disaster Recovery Lead, American Red Cross of Greater Pennsylvania (since 2017). Volunteer, American Red Cross (since 2015). Former President and CEO of Adagio Health Inc. (retired in 2014) in Pittsburgh, PA. Other Directorships in the Last Five Years. None. | |||
Alice Gresham Bullock 1950 | Chair and Director | 2016 (Chair); 2008 (Director) | Professor Emerita at Howard University School of Law. Dean Emerita of Howard University School of Law and Deputy Director of the Association of American Law Schools (1992-1994). Other Directorships in the Last Five Years. None. | |||
Cari M. Dominguez 1949 | Director | 2016 | Former Chair of the U.S. Equal Employment Opportunity Commission. Other Directorships in the Last Five Years. Manpower, Inc. (employment agency); Triple S Management Corporation (managed care); National Association of Corporate Directors. | |||
John G. Guffey, Jr.(2) 1948 | Director | 2016 | President of Aurora Press Inc., a privately held publisher of trade paperbacks (since January 1997). Other Directorships in the Last Five Years. Calvert Impact Capital, Inc. (through December 31, 2018); Calvert Ventures, LLC. | |||
Miles D. Harper, III 1962 | Director | 2016 | Partner, Carr Riggs & Ingram (public accounting firm) since October 2014. Partner, Gainer Donnelly & Desroches (public accounting firm) (now Carr Riggs & Ingram), November 1999-September 2014). Other Directorships in the Last Five Years.Bridgeway Funds (9) (asset management). | |||
| 28 |
Table of Contents
Calvert
VP S&P MidCap 400 Index Portfolio
December 31, 2019
Management and Organization — continued
| Name and Year of Birth | Position with the | Position Start Date | Principal Occupation(s) and Directorships During Past Five Years and Other Relevant Experience | |||
| Independent Directors (continued) | ||||||
Joy V. Jones 1950 | Director | 2016 | Attorney. Other Directorships in the Last Five Years.Conduit Street Restaurants SUD 2 Limited; Palm Management Restaurant Corporation. | |||
Anthony A. Williams 1951 | Director | 2016 | CEO and Executive Director of the Federal City Council (July 2012 to present); Senior Adviser and Independent Consultant for King and Spalding LLP (September 2015 to present); Executive Director of Global Government Practice at the Corporate Executive Board (January 2010 to January 2012). Other Directorships in the Last Five Years. Freddie Mac; Evoq Properties/ Meruelo Maddux Properties, Inc. (real estate management); Weston Solutions, Inc. (environmental services); Bipartisan Policy Center’s Debt Reduction Task Force; Chesapeake Bay Foundation; Catholic University of America; Urban Institute (research organization). | |||
| Name and Year of Birth | Position(s) with the Corporation | Position Start Date | Principal Occupation(s) During Past Five Years | |||
| Principal Officers who are not Directors | ||||||
Hope L. Brown 1973 | Chief Compliance Officer | 2014 | Chief Compliance Officer of 39 registered investment companies advised by CRM (since 2014). Vice President and Chief Compliance Officer, Wilmington Funds (2012-2014). | |||
Maureen A. Gemma(3) 1960 | Vice President, Secretary and Chief Legal Officer | 2016 | Vice President of CRM and officer of 39 registered investment companies advised by CRM (since 2016). Also Vice President of Eaton Vance and certain of its affiliates and officer of 159 registered investment companies advised or administered by Eaton Vance. | |||
James F. Kirchner(3) 1967 | Treasurer | 2016 | Vice President of CRM and officer of 39 registered investment companies advised by CRM (since 2016). Also Vice President of Eaton Vance and certain of its affiliates and officer of 159 registered investment companies advised or administered by Eaton Vance. | |||
| (1) | Mr. Streur is an interested person of the Fund because of his positions with the Fund’s adviser and certain affiliates. |
| (2) | Mr. Guffey is currently married to Rebecca L. Adamson, who served as a member of the Advisory Council through December 31, 2019. |
| (3) | The business address for Ms. Gemma and Mr. Kirchner is Two International Place, Boston, MA 02110. |
The SAI for the Fund includes additional information about the Directors and officers of the Fund and can be obtained without charge on Calvert’s website at www.calvert.com or by calling1-800-368-2745.
| 29 |
Table of Contents
Calvert Funds
Privacy.The Eaton Vance organization is committed to ensuring your financial privacy. Each entity listed below has adopted a privacy policy and procedures (“Privacy Program”) Eaton Vance believes is reasonably designed to protect your personal information and to govern when and with whom Eaton Vance may share your personal information.
| • | At the time of opening an account, Eaton Vance generally requires you to provide us with certain information such as name, address, social security number, tax status, account numbers, and account balances. This information is necessary for us to both open an account for you and to allow us to satisfy legal requirements such as applicable anti-money laundering reviews and know-your-customer requirements. |
| • | On an ongoing basis, in the normal course of servicing your account, Eaton Vance may share your information with unaffiliated third parties that perform various services for Eaton Vance and/or your account. These third parties include transfer agents, custodians, broker/dealers and our professional advisers, including auditors, accountants, and legal counsel. Eaton Vance may additionally share your personal information with our affiliates. |
| • | We believe our Privacy Program is reasonably designed to protect the confidentiality of your personal information and to prevent unauthorized access to that information. |
| • | We reserve the right to change our Privacy Program at any time upon proper notification to you. You may want to review our Privacy Program periodically for changes by accessing the link on our homepage: www.eatonvance.com. |
Our pledge of protecting your personal information applies to the following entities within the Eaton Vance organization: the Eaton Vance Family of Funds, Eaton Vance Management, Eaton Vance Investment Counsel, Eaton Vance Distributors, Inc., Eaton Vance Trust Company, Eaton Vance Management (International) Limited, Eaton Vance Advisers International Limited, Eaton Vance Global Advisors Limited, Eaton Vance Management’s Real Estate Investment Group, Boston Management and Research, Calvert Research and Management, and Calvert Funds. This Privacy Notice supersedes all previously issued privacy disclosures. For more information about our Privacy Program or about how your personal information may be used, please call 1-800-368-2745.
Delivery of Shareholder Documents. The Securities and Exchange Commission (SEC) permits funds to deliver only one copy of shareholder documents, including prospectuses, proxy statements and shareholder reports, to fund investors with multiple accounts at the same residential or post office box address. This practice is often called “householding” and it helps eliminate duplicate mailings to shareholders.Calvert funds, or your financial intermediary, may household the mailing of your documents indefinitely unless you instruct Calvert funds, or your financial intermediary, otherwise. If you would prefer that your Calvert fund documents not be householded, please contact Calvert fundsat 1-800-368-2745, or contact your financial intermediary. Your instructions that householding not apply to delivery of your Calvert fund documents will typically be effective within 30 days of receipt by Calvert funds or your financial intermediary. Separate statements will be generated for each separate account and will be householded as described above.
Portfolio Holdings. Each Calvert fund files a schedule of portfolio holdings on Part F to Form N-PORT with the SEC for the first and third quarters of each fiscal year. The Form N-PORT will be available on the Calvert funds’ website at www.calvert.com, by calling Calvert funds at1-800-368-2745 or in the EDGAR database on the SEC’s website at www.sec.gov.
Proxy Voting. The Proxy Voting Guidelines that each Calvert fund uses to determine how to vote proxies relating to portfolio securities is provided as an Appendix to the fund’s Statement of Additional Information. The Statement of Additional Information can be obtained free of charge by calling the Calvert funds at 1-800-368-2745, by visiting the Calvert funds’ website at www.calvert.com or visiting the SEC’s website at www.sec.gov. Information regarding how a Calvert fund voted proxies relating to portfolio securities during the most recent 12-month period ended June 30 is available by calling Calvert funds, by visiting the Calvert funds’ website at www.calvert.com or by visiting the SEC’s website at www.sec.gov.
| 30 |
Table of Contents
This Page Intentionally Left Blank
Table of Contents
This Page Intentionally Left Blank
Table of Contents
Investment Adviser and Administrator
Calvert Research and Management
1825 Connecticut Avenue NW, Suite 400
Washington, DC 20009
Investment Sub-Adviser
Ameritas Investment Partners, Inc.
5945 R Street
Lincoln, NE 68505
Principal Underwriter*
Eaton Vance Distributors, Inc.
Two International Place
Boston, MA 02110
(617) 482-8260
Custodian
State Street Bank and Trust Company
State Street Financial Center, One Lincoln Street
Boston, MA 02111
Transfer Agent
DST Asset Manager Solutions, Inc.
2000 Crown Colony Drive
Quincy, MA 02169
Independent Registered Public Accounting Firm
KPMG LLP
1601 Market Street
Philadelphia, PA 19103-2499
Fund Offices
1825 Connecticut Avenue NW, Suite 400
Washington, DC 20009
| * | FINRA BrokerCheck. Investors may check the background of their Investment Professional by contacting the Financial Industry Regulatory Authority (FINRA). FINRA BrokerCheck is a free tool to help investors check the professional background of current and former FINRA-registered securities firms and brokers. FINRA BrokerCheck is available by calling 1-800-289-9999 and at www.FINRA.org. The FINRA BrokerCheck brochure describing this program is available to investors at www.FINRA.org. |
Table of Contents
Printed on recycled paper.

24223 12.31.19
Table of Contents

Calvert
VP S&P 500 Index Portfolio
Annual Report
December 31, 2019
Important Note. Beginning on January 1, 2021, as permitted by regulations adopted by the Securities and Exchange Commission, you may not receive paper copies of the Fund’s annual and semi-annual shareholder reports from the insurance company or plan sponsor unless you specifically request paper copies. Instead, the reports will be made available on a website and you will be notified by mail each time a report is posted and provided with a website address to access the report. Instructions for requesting paper copies will be provided by the insurance company, plan sponsor or your financial intermediary, as applicable. Please contact the insurance company, plan sponsor or your financial intermediary, as applicable, or follow instructions included with this disclosure, if any, for more information.

Table of Contents
Commodity Futures Trading Commission Registration. Effective December 31, 2012, the Commodity Futures Trading Commission (“CFTC”) adopted certain regulatory changes that subject registered investment companies and advisers to regulation by the CFTC if a fund invests more than a prescribed level of its assets in certain CFTC-regulated instruments (including futures, certain options and swap agreements) or markets itself as providing investment exposure to such instruments. The Fund and its adviser have claimed an exclusion from the definition of the term “commodity pool operator” under the Commodity Exchange Act. Accordingly, neither the Fund nor the adviser is subject to CFTC regulation.
Fund shares are not insured by the FDIC and are not deposits or other obligations of, or guaranteed by, any depository institution. Shares are subject to investment risks, including possible loss of principal invested.
This report must be preceded or accompanied by a current summary prospectus or prospectus. Before investing, investors should consider carefully the investment objective, risks, and charges and expenses of a mutual fund. This and other important information is contained in the summary prospectus and prospectus, which can be obtained from a financial intermediary. Prospective investors should read the prospectus carefully before investing. For further information, please call1-800-368-2745.
Table of Contents
Annual Report December 31, 2019
Calvert
VP S&P 500 Index Portfolio
Table of Contents
Calvert
VP S&P 500 Index Portfolio
December 31, 2019
Management’s Discussion of Fund Performance 1
Economic and Market Conditions
With virtually every U.S. equity index posting strong double-digit returns for the12-month period ended December 31, 2019 — and bond markets solidly in the black as well — 2019 was a good year for investments.
As the new year dawned in January 2019, investors appeared to be taking a “glass is half full” approach. Although U.S. manufacturing output and business investment remained weak — held back by slowing global growth and anon-again/off-again U.S.-China trade war — strong spending by U.S. consumers and dovish remarks by the U.S. Federal Reserve (the Fed) combined to lift investor sentiment. After four federal funds rate hikes the previous year, markets began to project the Fed might actually lower rates in 2019 to stimulate the economy. U.S. unemployment, meanwhile, remained low and hiring remained strong.
As a result, U.S. stocks across multiple markets climbed from January through April 2019. Overseas, central banks around the world began to cut interest rates and employ other tools to stimulate their respective economies. Even a global stock pullback in May — sparked by heightened concerns about the U.S.-China trade spat — proved to be temporary, and the U.S. and global stock rallies resumed in June and July.
After holding interest rates steady through the first half of the year, the Fed cut the federal funds rate on July 31, 2019 — its first reduction in over a decade — followed by two additional rate cuts in September and October to end the period at1.50%-1.75%. By end of the third quarter, 60 central banks around the world had lowered their interest rates as well.
After falling in August, U.S. equities rallied again during the final months of the period, spurred by optimism about a U.S.-China trade détente and better-than-expected U.S. employment reports. The year ended with two events in December that did much to allay investor concerns about international trade and tariffs: passage of the United States-Mexico-Canada Agreement by the U.S. House of Representatives and the Trump administration’s agreement to aso-called “phase–one” trade deal with China.
During the12-month period ended December 31, 2019, the blue-chip Dow Jones Industrial Average®2 returned 25.34%, while the broader U.S. equity market, as measured by the S&P 500® Index, returned 31.49%. The technology-laden Nasdaq Composite Index returned 36.69% during the period.Large-cap U.S. stocks, as measured by the S&P 500® Index, generally outperformed theirsmall-cap counterparts, as measured by the Russell 2000® Index. As a group, growth stocks outpaced value stocks in both large- andsmall-cap categories as measured by the Russell growth and value indexes.
Investment Strategy
As an index fund, Calvert VP S&P 500 Index Portfolio (the Fund) seeks to replicate, as closely as possible, the holdings and match the performance of the S&P 500® Index (the Index). The Funds seeks to accomplish this by employing a passive management approach and holding each constituent of the Index in approximately the same proportion as the Index. The Fund may also invest in exchange-traded funds (ETFs) that provide the same exposure to the Index. Cash holdings may gain exposure to the Index via futures contracts, allowing the Fund’s assets to be fully invested.
Fund Performance
For the12-month period ended December 31, 2019, the Fund returned 31.16% at net asset value (NAV). By comparison, the Index returned 31.49% for the same period. The Index is unmanaged and returns do not reflect any fees and operating expenses.
Large-cap stocks outperformedmid-cap stocks andsmall-cap stocks during the period. All market sectors within the Index had positive, double-digit returns during the period, with information technology (IT), communication services, and financials outperforming other sectors. IT, health care, and financials had the largest weights in the Index atyear-end. Energy, one of the smallest sectors in the Index, was the weakest performer.
Futures contracts, which are regularly used to manage uninvested cash holdings in the Fund, had a meaningful positive impact on performance during the period.
See Endnotes and Additional Disclosures in this report.
Past performance is no guarantee of future results. Returns are historical and are calculated by determining the percentage change in net asset value (NAV) or offering price (as applicable) with all distributions reinvested. Investment return and principal value will fluctuate so that shares, when redeemed, may be worth more or less than their original cost. Performance for periods less than or equal to one year is cumulative. Performance is for the stated time period only; due to market volatility, current Fund performance may be lower or higher than the quoted return.
| 2 |
Table of Contents
Calvert
VP S&P 500 Index Portfolio
December 31, 2019
Portfolio Manager Kevin L. Keene, CFA of Ameritas Investment Partners, Inc.
| % Average Annual Total Returns 2,3 | Inception Date | Performance Inception Date | One Year | Five Years | Ten Years | |||||||||||||||
Fund at NAV | 12/29/1995 | 12/29/1995 | 31.16 | % | 11.32 | % | 13.15 | % | ||||||||||||
| ||||||||||||||||||||
S&P 500® Index | — | — | 31.49 | % | 11.69 | % | 13.55 | % | ||||||||||||
| % Total Annual Operating Expense Ratios 4 | ||||||||||||||||||||
| Gross | 0.39 | % | ||||||||||||||||||
| Net | 0.28 | |||||||||||||||||||
Growth of $10,000
This graph shows the change in value of a hypothetical investment of $10,000 in the Fund for the period indicated. For comparison, the same investment is shown in the indicated index
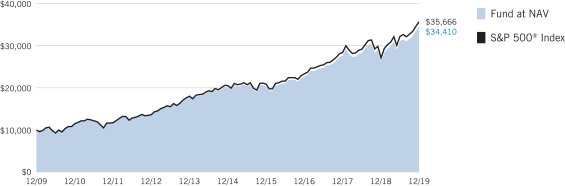
See Endnotes and Additional Disclosures in this report.
Past performance is no guarantee of future results. Returns are historical and are calculated by determining the percentage change in net asset value (NAV) or offering price (as applicable) with all distributions reinvested. Investment return and principal value will fluctuate so that shares, when redeemed, may be worth more or less than their original cost. Performance for periods less than or equal to one year is cumulative. Performance is for the stated time period only; due to market volatility, current Fund performance may be lower or higher than the quoted return.
| 3 |
Table of Contents
Calvert
VP S&P 500 Index Portfolio
December 31, 2019
| Sector Allocation (% of net assets) 5 | ||||
Information Technology | 22.8 | % | ||
Health Care | 13.9 | |||
Financials | 12.7 | |||
Communication Services | 10.2 | |||
Consumer Discretionary | 9.6 | |||
Industrials | 8.9 | |||
Consumer Staples | 7.1 | |||
Energy | 4.3 | |||
Utilities | 3.2 | |||
Real Estate | 2.9 | |||
Materials | 2.6 | |||
Exchange-Traded Funds | 0.3 | |||
Total | 98.5 | % | ||
| Top 10 Holdings (% of net assets) 5 | ||||
Apple, Inc. | 4.5 | % | ||
Microsoft Corp. | 4.4 | |||
Amazon.com, Inc. | 2.8 | |||
Facebook, Inc., Class A | 1.8 | |||
Berkshire Hathaway, Inc., Class B | 1.6 | |||
JPMorgan Chase & Co. | 1.6 | |||
Alphabet, Inc., Class A | 1.5 | |||
Alphabet, Inc., Class C | 1.5 | |||
Johnson & Johnson | 1.4 | |||
Visa, Inc., Class A | 1.2 | |||
Total | 22.3 | % | ||
See Endnotes and Additional Disclosures in this report.
| 4 |
Table of Contents
Calvert
VP S&P 500 Index Portfolio
December 31, 2019
Endnotes and Additional Disclosures
| 1 | The views expressed in this report are those of the portfolio manager(s) and are current only through the date stated at the top of this page. These views are subject to change at any time based upon market or other conditions, and Calvert and the Fund(s) disclaim any responsibility to update such views. These views may not be relied upon as investment advice and, because investment decisions are based on many factors, may not be relied upon as an indication of trading intent on behalf of any Calvert fund. This commentary may contain statements that are not historical facts, referred to as “forward looking statements.” The Fund’s actual future results may differ significantly from those stated in any forward looking statement, depending on factors such as changes in securities or financial markets or general economic conditions, the volume of sales and purchases of Fund shares, the continuation of investment advisory, administrative and service contracts, and other risks discussed from time to time in the Fund’s filings with the Securities and Exchange Commission. |
| 2 | Dow Jones Industrial Average® is a price-weighted average of 30 blue-chip stocks that are generally the leaders in their industry. S&P 500® Index is an unmanaged index of large-cap stocks commonly used as a measure of U.S. stock market performance. S&P Dow Jones Indices are a product of S&P Dow Jones Indices LLC (“S&P DJI”) and have been licensed for use. S&P® and S&P 500® are registered trademarks of S&P DJI; Dow Jones® is a registered trademark of Dow Jones Trademark Holdings LLC (“Dow Jones”); S&P DJI, Dow Jones and their respective affiliates do not sponsor, endorse, sell or promote the Fund, will not have any liability with respect thereto and do not have any liability for any errors, omissions, or interruptions of the S&P Dow Jones Indices. Nasdaq Composite Index is a market capitalization-weighted index of all domestic and international securities listed on Nasdaq. Source: Nasdaq, Inc. The information is provided by Nasdaq (with its affiliates, are referred to as the “Corporations”) and Nasdaq’s third party licensors on an “as is” basis and the Corporations make no guarantees and bear no liability of any kind with respect to the information or the Fund. Russell 2000® Index is an unmanaged index of 2,000 U.S. small-cap stocks. Unless otherwise stated, index returns do not reflect the effect of any applicable sales charges, commissions, expenses, taxes or leverage, as applicable. It is not possible to invest directly in an index. |
| 3 | There is no sales charge. Insurance-related charges are not included in the calculation of returns. If such charges were reflected, the returns would be lower. Please refer to the report for your insurance contract for performance data reflecting insurance-related charges. Performance since inception for an index, if presented, is the performance since the Fund’s or oldest share class’ inception, as applicable. |
Calvert Research and Management became the investment adviser to the Fund on December 31, 2016. Performance reflected prior to such date is that of the Fund’s former investment adviser. |
| 4 | Source: Fund prospectus. Net expense ratios reflect a contractual expense reimbursement that continues through 4/30/20. Without the reimbursement, performance would have been lower. The expense ratios for the current reporting period can be found in the Financial Highlights section of this report. |
| 5 | Excludes cash and cash equivalents. |
| 5 |
Table of Contents
Calvert
VP S&P 500 Index Portfolio
December 31, 2019
Example
As a Fund shareholder, you incur ongoing costs, including management fees and other Fund expenses. This Example is intended to help you understand your ongoing costs (in dollars) of Fund investing and to compare these costs with the ongoing costs of investing in other mutual funds. The Example is based on an investment of $1,000 invested at the beginning of the period and held for the entire period (July 1, 2019 to December 31, 2019).
Actual Expenses
The first line of the table below provides information about actual account values and actual expenses. You may use the information in this line, together with the amount you invested, to estimate the expenses that you paid over the period. Simply divide your account value by $1,000 (for example, an $8,600 account value divided by $1,000 = 8.6), then multiply the result by the number in the first line under the heading entitled “Expenses Paid During Period” to estimate the expenses you paid on your account during this period.
Hypothetical Example for Comparison Purposes
The second line of the table below provides information about hypothetical account values and hypothetical expenses based on the actual Fund expense ratio and an assumed rate of return of 5% per year (before expenses), which is not the actual Fund return. The hypothetical account values and expenses may not be used to estimate the actual ending account balance or expenses you paid for the period. You may use this information to compare the ongoing costs of investing in the Fund and other funds. To do so, compare this 5% hypothetical example with the 5% hypothetical examples that appear in the shareholder reports of the other funds.
Please note that the expenses shown in the table are meant to highlight your ongoing costs only and do not reflect expenses and charges which are, or may be imposed under the variable annuity contract or variable life insurance policy (variable contracts) (if applicable) through which your investment in the Fund is made. Therefore, the second line of the table is useful in comparing ongoing costs associated with an investment in vehicles which fund benefits under variable contracts, and will not help you determine the relative total costs of investing in the Fund through variable contracts. In addition, if these expenses and charges imposed under the variable contracts were included, your costs would have been higher.
| Beginning Account Value (7/1/19) | Ending Account Value (12/31/19) | Expenses Paid During Period* (7/1/19 – 12/31/19) | Annualized Expense Ratio | |||||||||||||
Actual | ||||||||||||||||
| $ | 1,000.00 | $ | 1,107.70 | $ | 1.49 | ** | 0.28 | % | ||||||||
Hypothetical | ||||||||||||||||
(5% return per year before expenses) | ||||||||||||||||
| $ | 1,000.00 | $ | 1,023.79 | $ | 1.43 | ** | 0.28 | % | ||||||||
| * | Expenses are equal to the Fund’s annualized expense ratio, multiplied by the average account value over the period, multiplied by 184/365 (to reflect theone-half year period). The Example assumes that the $1,000 was invested at the net asset value per share determined at the close of business on June 30, 2019. Expenses shown do not include insurance-related charges. |
| ** | Absent a waiver and/or reimbursement of expenses by an affiliate, expenses would be higher. |
| 6 |
Table of Contents
Calvert
VP S&P 500 Index Portfolio
December 31, 2019
| Common Stocks — 98.2% | ||||||||
| Security | Shares | Value | ||||||
| Aerospace & Defense — 2.4% | ||||||||
Arconic, Inc. | 6,525 | $ | 200,774 | |||||
Boeing Co. (The) | 8,969 | 2,921,741 | ||||||
General Dynamics Corp. | 3,941 | 694,995 | ||||||
Huntington Ingalls Industries, Inc. | 721 | 180,885 | ||||||
L3Harris Technologies, Inc. | 3,760 | 743,991 | ||||||
Lockheed Martin Corp. | 4,179 | 1,627,219 | ||||||
Northrop Grumman Corp. | 2,650 | 911,521 | ||||||
Raytheon Co. | 4,646 | 1,020,912 | ||||||
Textron, Inc. | 4,073 | 181,656 | ||||||
TransDigm Group, Inc. | 854 | 478,240 | ||||||
United Technologies Corp. | 13,642 | 2,043,026 | ||||||
| $ | 11,004,960 | |||||||
| Air Freight & Logistics — 0.5% | ||||||||
C.H. Robinson Worldwide, Inc. | 2,280 | $ | 178,296 | |||||
Expeditors International of Washington, Inc. | 2,876 | 224,386 | ||||||
FedEx Corp. | 4,071 | 615,576 | ||||||
United Parcel Service, Inc., Class B | 11,692 | 1,368,665 | ||||||
| $ | 2,386,923 | |||||||
| Airlines — 0.4% | ||||||||
Alaska Air Group, Inc. | 2,098 | $ | 142,139 | |||||
American Airlines Group, Inc.(1) | 6,936 | 198,924 | ||||||
Delta Air Lines, Inc. | 9,747 | 570,005 | ||||||
Southwest Airlines Co. | 7,903 | 426,604 | ||||||
United Airlines Holdings, Inc.(2) | 3,631 | 319,855 | ||||||
| $ | 1,657,527 | |||||||
| Auto Components — 0.1% | ||||||||
Aptiv PLC | 4,315 | $ | 409,796 | |||||
BorgWarner, Inc. | 3,767 | 163,412 | ||||||
| $ | 573,208 | |||||||
| Automobiles — 0.3% | ||||||||
Ford Motor Co. | 64,973 | $ | 604,249 | |||||
General Motors Co. | 21,163 | 774,566 | ||||||
Harley-Davidson, Inc.(1) | 2,871 | 106,772 | ||||||
| $ | 1,485,587 | |||||||
| Banks — 5.5% | ||||||||
Bank of America Corp. | 136,305 | $ | 4,800,662 | |||||
Citigroup, Inc. | 36,637 | 2,926,930 | ||||||
| Security | Shares | Value | ||||||
| Banks (continued) | ||||||||
Citizens Financial Group, Inc. | 7,531 | $ | 305,834 | |||||
Comerica, Inc. | 2,405 | 172,559 | ||||||
Fifth Third Bancorp | 11,841 | 363,992 | ||||||
First Republic Bank | 2,900 | 340,605 | ||||||
Huntington Bancshares, Inc. | 18,167 | 273,958 | ||||||
JPMorgan Chase & Co. | 52,741 | 7,352,095 | ||||||
KeyCorp | 17,124 | 346,590 | ||||||
M&T Bank Corp. | 2,202 | 373,790 | ||||||
People’s United Financial, Inc. | 7,516 | 127,020 | ||||||
PNC Financial Services Group, Inc. (The) | 7,311 | 1,167,055 | ||||||
Regions Financial Corp. | 16,095 | 276,190 | ||||||
SVB Financial Group(2) | 868 | 217,903 | ||||||
Truist Financial Corp. | 22,589 | 1,272,213 | ||||||
U.S. Bancorp | 23,715 | 1,406,062 | ||||||
Wells Fargo & Co. | 64,570 | 3,473,866 | ||||||
Zions BanCorp NA(1) | 3,101 | 161,004 | ||||||
| $ | 25,358,328 | |||||||
| Beverages — 1.8% | ||||||||
Brown-Forman Corp., Class B | 3,068 | $ | 207,397 | |||||
Coca-Cola Co. (The) | 64,693 | 3,580,757 | ||||||
Constellation Brands, Inc., Class A | 2,817 | 534,526 | ||||||
Molson Coors Brewing Co., Class B | 3,257 | 175,552 | ||||||
Monster Beverage Corp.(2) | 6,516 | 414,092 | ||||||
PepsiCo, Inc. | 23,509 | 3,212,975 | ||||||
| $ | 8,125,299 | |||||||
| Biotechnology — 2.0% | ||||||||
AbbVie, Inc. | 24,867 | $ | 2,201,724 | |||||
Alexion Pharmaceuticals, Inc.(2) | 3,808 | 411,835 | ||||||
Amgen, Inc. | 9,991 | 2,408,530 | ||||||
Biogen, Inc.(2) | 3,011 | 893,454 | ||||||
Gilead Sciences, Inc. | 21,109 | 1,371,663 | ||||||
Incyte Corp.(2) | 3,114 | 271,914 | ||||||
Regeneron Pharmaceuticals, Inc.(2) | 1,360 | 510,653 | ||||||
Vertex Pharmaceuticals, Inc.(2) | 4,350 | 952,433 | ||||||
| $ | 9,022,206 | |||||||
| Building Products — 0.3% | ||||||||
A.O. Smith Corp. | 2,397 | $ | 114,193 | |||||
Allegion PLC | 1,639 | 204,121 | ||||||
Fortune Brands Home & Security, Inc. | 2,381 | 155,575 | ||||||
Johnson Controls International PLC | 12,871 | 523,978 | ||||||
Masco Corp. | 4,986 | 239,278 | ||||||
| $ | 1,237,145 | |||||||
| 7 | See Notes to Financial Statements. |
Table of Contents
Calvert
VP S&P 500 Index Portfolio
December 31, 2019
Schedule of Investments — continued
| Security | Shares | Value | ||||||
| Capital Markets — 2.6% | ||||||||
Ameriprise Financial, Inc. | 2,114 | $ | 352,150 | |||||
Bank of New York Mellon Corp. (The) | 14,002 | 704,721 | ||||||
BlackRock, Inc. | 1,979 | 994,843 | ||||||
Cboe Global Markets, Inc. | 1,973 | 236,760 | ||||||
Charles Schwab Corp. (The) | 19,076 | 907,255 | ||||||
CME Group, Inc. | 5,979 | 1,200,105 | ||||||
E*Trade Financial Corp. | 4,039 | 183,249 | ||||||
Franklin Resources, Inc. | 5,128 | 133,225 | ||||||
Goldman Sachs Group, Inc. (The) | 5,317 | 1,222,538 | ||||||
Intercontinental Exchange, Inc. | 9,291 | 859,882 | ||||||
Invesco, Ltd. | 6,891 | 123,900 | ||||||
MarketAxess Holdings, Inc. | 660 | 250,213 | ||||||
Moody’s Corp. | 2,709 | 643,144 | ||||||
Morgan Stanley | 20,525 | 1,049,238 | ||||||
MSCI, Inc. | 1,438 | 371,263 | ||||||
Nasdaq, Inc. | 2,032 | 217,627 | ||||||
Northern Trust Corp. | 3,620 | 384,589 | ||||||
Raymond James Financial, Inc. | 2,081 | 186,166 | ||||||
S&P Global, Inc. | 4,078 | 1,113,498 | ||||||
State Street Corp. | 6,067 | 479,900 | ||||||
T. Rowe Price Group, Inc. | 3,968 | 483,461 | ||||||
| $ | 12,097,727 | |||||||
| Chemicals — 1.9% | ||||||||
Air Products & Chemicals, Inc. | 3,739 | $ | 878,628 | |||||
Albemarle Corp.(1) | 1,914 | 139,799 | ||||||
Celanese Corp. | 2,084 | 256,582 | ||||||
CF Industries Holdings, Inc. | 3,840 | 183,322 | ||||||
Corteva, Inc. | 12,487 | 369,116 | ||||||
Dow, Inc. | 12,372 | 677,119 | ||||||
DuPont de Nemours, Inc. | 12,361 | 793,576 | ||||||
Eastman Chemical Co. | 2,269 | 179,841 | ||||||
Ecolab, Inc. | 4,217 | 813,839 | ||||||
FMC Corp. | 2,197 | 219,304 | ||||||
International Flavors & Fragrances, Inc.(1) | 1,758 | 226,817 | ||||||
Linde PLC | 9,032 | 1,922,913 | ||||||
LyondellBasell Industries NV, Class A | 4,348 | 410,799 | ||||||
Mosaic Co. (The) | 6,258 | 135,423 | ||||||
PPG Industries, Inc. | 3,945 | 526,618 | ||||||
Sherwin-Williams Co. (The) | 1,380 | 805,285 | ||||||
| $ | 8,538,981 | |||||||
| Commercial Services & Supplies — 0.4% | ||||||||
Cintas Corp. | 1,439 | $ | 387,206 | |||||
Copart, Inc.(2) | 3,424 | 311,379 | ||||||
| Security | Shares | Value | ||||||
| Commercial Services & Supplies (continued) | ||||||||
Republic Services, Inc. | 3,659 | $ | 327,956 | |||||
Rollins, Inc. | 2,503 | 82,999 | ||||||
Waste Management, Inc. | 6,636 | 756,239 | ||||||
| $ | 1,865,779 | |||||||
| Communications Equipment — 0.9% | ||||||||
Arista Networks, Inc.(2) | 898 | $ | 182,653 | |||||
Cisco Systems, Inc. | 71,183 | 3,413,937 | ||||||
F5 Networks, Inc.(2) | 1,073 | �� | 149,845 | |||||
Juniper Networks, Inc. | 5,981 | 147,312 | ||||||
Motorola Solutions, Inc. | 2,844 | 458,282 | ||||||
| $ | 4,352,029 | |||||||
| Construction & Engineering — 0.1% | ||||||||
Jacobs Engineering Group, Inc. | 2,284 | $ | 205,172 | |||||
Quanta Services, Inc. | 2,533 | 103,118 | ||||||
| $ | 308,290 | |||||||
| Construction Materials — 0.1% | ||||||||
Martin Marietta Materials, Inc. | 1,052 | $ | 294,181 | |||||
Vulcan Materials Co. | 2,228 | 320,810 | ||||||
| $ | 614,991 | |||||||
| Consumer Finance — 0.7% | ||||||||
American Express Co. | 11,196 | $ | 1,393,790 | |||||
Capital One Financial Corp. | 7,771 | 799,714 | ||||||
Discover Financial Services | 5,230 | 443,608 | ||||||
Synchrony Financial | 10,281 | 370,219 | ||||||
| $ | 3,007,331 | |||||||
| Containers & Packaging — 0.4% | ||||||||
Amcor PLC | 28,388 | $ | 307,726 | |||||
Avery Dennison Corp. | 1,505 | 196,884 | ||||||
Ball Corp. | 5,685 | 367,649 | ||||||
International Paper Co. | 6,543 | 301,305 | ||||||
Packaging Corp. of America | 1,640 | 183,664 | ||||||
Sealed Air Corp. | 2,811 | 111,962 | ||||||
WestRock Co. | 4,502 | 193,181 | ||||||
| $ | 1,662,371 | |||||||
| Distributors — 0.1% | ||||||||
Genuine Parts Co. | 2,424 | $ | 257,502 | |||||
LKQ Corp.(2) | 5,333 | 190,388 | ||||||
| $ | 447,890 | |||||||
| 8 | See Notes to Financial Statements. |
Table of Contents
Calvert
VP S&P 500 Index Portfolio
December 31, 2019
Schedule of Investments — continued
| Security | Shares | Value | ||||||
| Diversified Consumer Services — 0.0%(3) | ||||||||
H&R Block, Inc.(1) | 3,453 | $ | 81,076 | |||||
| Diversified Financial Services — 1.6% | ||||||||
Berkshire Hathaway, Inc., Class B(2) | 32,891 | $ | 7,449,811 | |||||
| Diversified Telecommunication Services — 2.0% | ||||||||
AT&T, Inc. | 122,994 | $ | 4,806,605 | |||||
CenturyLink, Inc. | 17,457 | 230,607 | ||||||
Verizon Communications, Inc. | 69,634 | 4,275,528 | ||||||
| $ | 9,312,740 | |||||||
| Electric Utilities — 2.0% | ||||||||
Alliant Energy Corp. | 4,129 | $ | 225,939 | |||||
American Electric Power Co., Inc. | 8,380 | 791,994 | ||||||
Duke Energy Corp. | 12,164 | 1,109,478 | ||||||
Edison International | 6,062 | 457,135 | ||||||
Entergy Corp. | 3,381 | 405,044 | ||||||
Evergy, Inc. | 3,803 | 247,537 | ||||||
Eversource Energy | 5,501 | 467,970 | ||||||
Exelon Corp. | 16,490 | 751,779 | ||||||
FirstEnergy Corp. | 9,188 | 446,537 | ||||||
NextEra Energy, Inc. | 8,219 | 1,990,313 | ||||||
Pinnacle West Capital Corp. | 1,946 | 175,004 | ||||||
PPL Corp. | 12,258 | 439,817 | ||||||
Southern Co. (The) | 17,677 | 1,126,025 | ||||||
Xcel Energy, Inc. | 8,924 | 566,585 | ||||||
| $ | 9,201,157 | |||||||
| Electrical Equipment — 0.5% | ||||||||
AMETEK, Inc. | 3,870 | $ | 385,994 | |||||
Eaton Corp. PLC | 6,898 | 653,378 | ||||||
Emerson Electric Co. | 10,164 | 775,107 | ||||||
Rockwell Automation, Inc. | 1,971 | 399,463 | ||||||
| $ | 2,213,942 | |||||||
| Electronic Equipment, Instruments & Components — 0.6% | ||||||||
Amphenol Corp., Class A | 5,074 | $ | 549,159 | |||||
CDW Corp. | 2,439 | 348,387 | ||||||
Corning, Inc. | 12,833 | 373,568 | ||||||
FLIR Systems, Inc. | 2,498 | 130,071 | ||||||
IPG Photonics Corp.(2) | 616 | 89,271 | ||||||
Keysight Technologies, Inc.(2) | 3,258 | 334,368 | ||||||
TE Connectivity, Ltd. | 5,721 | 548,301 | ||||||
Zebra Technologies Corp., Class A(2) | 900 | 229,896 | ||||||
| $ | 2,603,021 | |||||||
| Security | Shares | Value | ||||||
| Energy Equipment & Services — 0.4% | ||||||||
Baker Hughes Co. | 11,232 | $ | 287,876 | |||||
Halliburton Co. | 14,843 | 363,208 | ||||||
Helmerich & Payne, Inc. | 1,982 | 90,042 | ||||||
National Oilwell Varco, Inc. | 6,752 | 169,138 | ||||||
Schlumberger, Ltd. | 23,099 | 928,580 | ||||||
TechnipFMC PLC | 7,315 | 156,834 | ||||||
| $ | 1,995,678 | |||||||
| Entertainment — 1.8% | ||||||||
Activision Blizzard, Inc. | 13,010 | $ | 773,054 | |||||
Electronic Arts, Inc.(2) | 4,872 | 523,789 | ||||||
Live Nation Entertainment, Inc.(2) | 2,351 | 168,026 | ||||||
Netflix, Inc.(2) | 7,369 | 2,384,387 | ||||||
Take-Two Interactive Software, Inc.(2) | 2,009 | 245,962 | ||||||
Walt Disney Co. (The) | 30,346 | 4,388,942 | ||||||
| $ | 8,484,160 | |||||||
| Equity Real Estate Investment Trusts (REITs) — 2.8% | ||||||||
Alexandria Real Estate Equities, Inc. | 1,918 | $ | 309,910 | |||||
American Tower Corp. | 7,457 | 1,713,768 | ||||||
Apartment Investment & Management Co., Class A | 2,585 | 133,515 | ||||||
AvalonBay Communities, Inc. | 2,330 | 488,601 | ||||||
Boston Properties, Inc. | 2,421 | 333,759 | ||||||
Crown Castle International Corp. | 6,937 | 986,095 | ||||||
Digital Realty Trust, Inc. | 3,607 | 431,902 | ||||||
Duke Realty Corp. | 6,243 | 216,445 | ||||||
Equinix, Inc. | 1,446 | 844,030 | ||||||
Equity Residential | 5,872 | 475,162 | ||||||
Essex Property Trust, Inc. | 1,116 | 335,760 | ||||||
Extra Space Storage, Inc. | 2,232 | 235,744 | ||||||
Federal Realty Investment Trust | 1,272 | 163,745 | ||||||
Healthpeak Properties, Inc. | 8,291 | 285,791 | ||||||
Host Hotels & Resorts, Inc. | 11,966 | 221,969 | ||||||
Iron Mountain, Inc.(1) | 4,836 | 154,123 | ||||||
Kimco Realty Corp.(1) | 7,168 | 148,449 | ||||||
Mid-America Apartment Communities, Inc. | 1,976 | 260,555 | ||||||
Prologis, Inc. | 10,541 | 939,625 | ||||||
Public Storage | 2,549 | 542,835 | ||||||
Realty Income Corp. | 5,445 | 400,915 | ||||||
Regency Centers Corp. | 2,902 | 183,087 | ||||||
SBA Communications Corp. | 1,923 | 463,424 | ||||||
Simon Property Group, Inc. | 5,120 | 762,675 | ||||||
SL Green Realty Corp. | 1,360 | 124,957 | ||||||
UDR, Inc. | 4,724 | 220,611 | ||||||
Ventas, Inc. | 6,416 | 370,460 | ||||||
| 9 | See Notes to Financial Statements. |
Table of Contents
Calvert
VP S&P 500 Index Portfolio
December 31, 2019
Schedule of Investments — continued
| Security | Shares | Value | ||||||
| Equity Real Estate Investment Trusts (REITs) (continued) | ||||||||
Vornado Realty Trust | 2,668 | $ | 177,422 | |||||
Welltower, Inc. | 6,877 | 562,401 | ||||||
Weyerhaeuser Co. | 12,433 | 375,477 | ||||||
| $ | 12,863,212 | |||||||
| Food & Staples Retailing — 1.5% | ||||||||
Costco Wholesale Corp. | 7,428 | $ | 2,183,238 | |||||
Kroger Co. (The) | 13,455 | 390,060 | ||||||
Sysco Corp. | 8,649 | 739,836 | ||||||
Walgreens Boots Alliance, Inc. | 12,510 | 737,590 | ||||||
Walmart, Inc. | 23,860 | 2,835,522 | ||||||
| $ | 6,886,246 | |||||||
| Food Products — 1.1% | ||||||||
Archer-Daniels-Midland Co. | 9,288 | $ | 430,499 | |||||
Campbell Soup Co.(1) | 2,841 | 140,402 | ||||||
Conagra Brands, Inc. | 8,545 | 292,581 | ||||||
General Mills, Inc. | 10,356 | 554,667 | ||||||
Hershey Co. (The) | 2,511 | 369,067 | ||||||
Hormel Foods Corp.(1) | 4,798 | 216,438 | ||||||
JM Smucker Co. (The) | 2,007 | 208,989 | ||||||
Kellogg Co. | 4,222 | 291,994 | ||||||
Kraft Heinz Co. (The) | 10,391 | 333,863 | ||||||
Lamb Weston Holdings, Inc. | 2,542 | 218,688 | ||||||
McCormick & Co., Inc. | 2,140 | 363,222 | ||||||
Mondelez International, Inc., Class A | 24,024 | 1,323,242 | ||||||
Tyson Foods, Inc., Class A | 5,007 | 455,837 | ||||||
| $ | 5,199,489 | |||||||
| Gas Utilities — 0.1% | ||||||||
Atmos Energy Corp. | 2,095 | $ | 234,347 | |||||
| Health Care Equipment & Supplies — 3.5% | ||||||||
Abbott Laboratories | 29,719 | $ | 2,581,392 | |||||
ABIOMED, Inc.(2) | 800 | 136,472 | ||||||
Align Technology, Inc.(2) | 1,197 | 334,011 | ||||||
Baxter International, Inc. | 8,605 | 719,550 | ||||||
Becton, Dickinson and Co. | 4,513 | 1,227,401 | ||||||
Boston Scientific Corp.(2) | 23,256 | 1,051,636 | ||||||
Cooper Cos., Inc. (The) | 867 | 278,559 | ||||||
Danaher Corp. | 10,763 | 1,651,905 | ||||||
DENTSPLY SIRONA, Inc. | 3,924 | 222,059 | ||||||
Edwards Lifesciences Corp.(2) | 3,503 | 817,215 | ||||||
Hologic, Inc.(2) | 4,502 | 235,049 | ||||||
IDEXX Laboratories, Inc.(2) | 1,431 | 373,677 | ||||||
| Security | Shares | Value | ||||||
| Health Care Equipment & Supplies (continued) | ||||||||
Intuitive Surgical, Inc.(2) | 1,928 | $ | 1,139,737 | |||||
Medtronic PLC | 22,539 | 2,557,050 | ||||||
ResMed, Inc. | 2,399 | 371,773 | ||||||
STERIS PLC | 1,415 | 215,674 | ||||||
Stryker Corp. | 5,372 | 1,127,798 | ||||||
Teleflex, Inc. | 800 | 301,152 | ||||||
Varian Medical Systems, Inc.(2) | 1,616 | 229,488 | ||||||
Zimmer Biomet Holdings, Inc. | 3,432 | 513,702 | ||||||
| $ | 16,085,300 | |||||||
| Health Care Providers & Services — 2.8% | ||||||||
AmerisourceBergen Corp., Class A | 2,641 | $ | 224,538 | |||||
Anthem, Inc. | 4,231 | 1,277,889 | ||||||
Cardinal Health, Inc. | 5,022 | 254,013 | ||||||
Centene Corp.(2) | 6,904 | 434,054 | ||||||
Cigna Corp. | 6,231 | 1,274,177 | ||||||
CVS Health Corp. | 21,904 | 1,627,248 | ||||||
DaVita, Inc.(2) | 1,560 | 117,047 | ||||||
HCA Healthcare, Inc. | 4,414 | 652,433 | ||||||
Henry Schein, Inc.(2) | 2,448 | 163,331 | ||||||
Humana, Inc. | 2,210 | 810,009 | ||||||
Laboratory Corp. of America Holdings(2) | 1,620 | 274,055 | ||||||
McKesson Corp. | 3,115 | 430,867 | ||||||
Quest Diagnostics, Inc. | 2,268 | 242,200 | ||||||
UnitedHealth Group, Inc. | 15,951 | 4,689,275 | ||||||
Universal Health Services, Inc., Class B | 1,408 | 201,992 | ||||||
WellCare Health Plans, Inc.(2) | 882 | 291,245 | ||||||
| $ | 12,964,373 | |||||||
| Health Care Technology — 0.1% | ||||||||
Cerner Corp. | 5,241 | $ | 384,637 | |||||
| Hotels, Restaurants & Leisure — 1.8% | ||||||||
Carnival Corp. | 6,800 | $ | 345,644 | |||||
Chipotle Mexican Grill, Inc.(2) | 434 | 363,306 | ||||||
Darden Restaurants, Inc. | 2,069 | 225,542 | ||||||
Hilton Worldwide Holdings, Inc. | 4,708 | 522,164 | ||||||
Las Vegas Sands Corp. | 5,600 | 386,624 | ||||||
Marriott International, Inc., Class A | 4,528 | 685,675 | ||||||
McDonald’s Corp. | 12,663 | 2,502,335 | ||||||
MGM Resorts International | 8,667 | 288,351 | ||||||
Norwegian Cruise Line Holdings, Ltd.(2) | 3,550 | 207,356 | ||||||
Royal Caribbean Cruises, Ltd. | 2,920 | 389,849 | ||||||
Starbucks Corp. | 19,884 | 1,748,201 | ||||||
Wynn Resorts, Ltd. | 1,681 | 233,441 | ||||||
| 10 | See Notes to Financial Statements. |
Table of Contents
Calvert
VP S&P 500 Index Portfolio
December 31, 2019
Schedule of Investments — continued
| Security | Shares | Value | ||||||
| Hotels, Restaurants & Leisure (continued) | ||||||||
Yum! Brands, Inc. | 5,047 | $ | 508,384 | |||||
| $ | 8,406,872 | |||||||
| Household Durables — 0.4% | ||||||||
D.R. Horton, Inc. | 5,669 | $ | 299,040 | |||||
Garmin, Ltd. | 2,435 | 237,558 | ||||||
Leggett & Platt, Inc.(1) | 2,459 | 124,991 | ||||||
Lennar Corp., Class A | 4,848 | 270,470 | ||||||
Mohawk Industries, Inc.(2) | 1,067 | 145,517 | ||||||
Newell Brands, Inc. | 6,971 | 133,983 | ||||||
NVR, Inc.(2) | 60 | 228,505 | ||||||
PulteGroup, Inc. | 4,425 | 171,690 | ||||||
Whirlpool Corp.(1) | 1,100 | 162,283 | ||||||
| $ | 1,774,037 | |||||||
| Household Products — 1.7% | ||||||||
Church & Dwight Co., Inc. | 4,095 | $ | 288,042 | |||||
Clorox Co. (The) | 2,163 | 332,107 | ||||||
Colgate-Palmolive Co. | 14,300 | 984,412 | ||||||
Kimberly-Clark Corp. | 5,720 | 786,786 | ||||||
Procter & Gamble Co. (The) | 41,988 | 5,244,301 | ||||||
| $ | 7,635,648 | |||||||
| Independent Power and Renewable Electricity Producers — 0.1% | ||||||||
AES Corp. (The) | 11,494 | $ | 228,731 | |||||
NRG Energy, Inc. | 4,351 | 172,952 | ||||||
| $ | 401,683 | |||||||
| Industrial Conglomerates — 1.3% | ||||||||
3M Co. | 9,682 | $ | 1,708,099 | |||||
General Electric Co. | 147,046 | 1,641,033 | ||||||
Honeywell International, Inc. | 12,015 | 2,126,655 | ||||||
Roper Technologies, Inc. | 1,764 | 624,862 | ||||||
| $ | 6,100,649 | |||||||
| Insurance — 2.3% | ||||||||
Aflac, Inc. | 12,247 | $ | 647,866 | |||||
Allstate Corp. (The) | 5,405 | 607,792 | ||||||
American International Group, Inc. | 14,772 | 758,247 | ||||||
Aon PLC | 3,973 | 827,536 | ||||||
Arthur J. Gallagher & Co. | 3,223 | 306,926 | ||||||
Assurant, Inc. | 1,106 | 144,975 | ||||||
Chubb, Ltd. | 7,562 | 1,177,101 | ||||||
Cincinnati Financial Corp. | 2,630 | 276,545 | ||||||
| Security | Shares | Value | ||||||
| Insurance (continued) | ||||||||
Everest Re Group, Ltd. | 708 | $ | 196,003 | |||||
Globe Life, Inc. | 1,760 | 185,240 | ||||||
Hartford Financial Services Group, Inc. (The) | 6,090 | 370,089 | ||||||
Lincoln National Corp. | 3,545 | 209,190 | ||||||
Loews Corp. | 4,380 | 229,906 | ||||||
Marsh & McLennan Cos., Inc. | 8,528 | 950,105 | ||||||
MetLife, Inc. | 13,043 | 664,802 | ||||||
Principal Financial Group, Inc. | 4,492 | 247,060 | ||||||
Progressive Corp. (The) | 9,918 | 717,964 | ||||||
Prudential Financial, Inc. | 6,707 | 628,714 | ||||||
Travelers Cos., Inc. (The) | 4,307 | 589,844 | ||||||
Unum Group | 3,725 | 108,621 | ||||||
Willis Towers Watson PLC | 2,195 | 443,258 | ||||||
WR Berkley Corp. | 2,400 | 165,840 | ||||||
| $ | 10,453,624 | |||||||
| Interactive Media & Services — 4.8% | ||||||||
Alphabet, Inc., Class A(2) | 5,038 | $ | 6,747,847 | |||||
Alphabet, Inc., Class C(2) | 5,033 | 6,729,222 | ||||||
Facebook, Inc., Class A(2) | 40,561 | 8,325,145 | ||||||
Twitter, Inc.(2) | 13,125 | 420,656 | ||||||
| $ | 22,222,870 | |||||||
| Internet & Direct Marketing Retail — 3.3% | ||||||||
Amazon.com, Inc.(2) | 7,014 | $ | 12,960,750 | |||||
Booking Holdings, Inc.(2) | 698 | 1,433,503 | ||||||
eBay, Inc. | 12,759 | 460,727 | ||||||
Expedia Group, Inc. | 2,369 | 256,184 | ||||||
| $ | 15,111,164 | |||||||
| IT Services — 5.3% | ||||||||
Accenture PLC, Class A | 10,678 | $ | 2,248,466 | |||||
Akamai Technologies, Inc.(2) | 2,787 | 240,741 | ||||||
Alliance Data Systems Corp. | 684 | 76,745 | ||||||
Automatic Data Processing, Inc. | 7,220 | 1,231,010 | ||||||
Broadridge Financial Solutions, Inc. | 1,925 | 237,815 | ||||||
Cognizant Technology Solutions Corp., Class A | 9,303 | 576,972 | ||||||
DXC Technology Co. | 4,556 | 171,260 | ||||||
Fidelity National Information Services, Inc. | 10,255 | 1,426,368 | ||||||
Fiserv, Inc.(2) | 9,615 | 1,111,782 | ||||||
FleetCor Technologies, Inc.(2) | 1,464 | 421,222 | ||||||
Gartner, Inc.(2) | 1,493 | 230,071 | ||||||
Global Payments, Inc. | 5,041 | 920,285 | ||||||
International Business Machines Corp. | 14,892 | 1,996,124 | ||||||
Jack Henry & Associates, Inc. | 1,297 | 188,934 | ||||||
| 11 | See Notes to Financial Statements. |
Table of Contents
Calvert
VP S&P 500 Index Portfolio
December 31, 2019
Schedule of Investments — continued
| Security | Shares | Value | ||||||
| IT Services (continued) | ||||||||
Leidos Holdings, Inc. | 2,277 | $ | 222,896 | |||||
MasterCard, Inc., Class A | 14,946 | 4,462,726 | ||||||
Paychex, Inc. | 5,315 | 452,094 | ||||||
PayPal Holdings, Inc.(2) | 19,744 | 2,135,709 | ||||||
VeriSign, Inc.(2) | 1,724 | 332,180 | ||||||
Visa, Inc., Class A | 28,822 | 5,415,654 | ||||||
Western Union Co. (The)(1) | 7,140 | 191,209 | ||||||
| $ | 24,290,263 | |||||||
| Leisure Products — 0.1% | ||||||||
Hasbro, Inc. | 2,146 | $ | 226,639 | |||||
| Life Sciences Tools & Services — 1.0% | ||||||||
Agilent Technologies, Inc. | 5,213 | $ | 444,721 | |||||
Illumina, Inc.(2) | 2,497 | 828,355 | ||||||
IQVIA Holdings, Inc.(2) | 3,070 | 474,346 | ||||||
Mettler-Toledo International, Inc.(2) | 421 | 333,971 | ||||||
PerkinElmer, Inc. | 1,923 | 186,723 | ||||||
Thermo Fisher Scientific, Inc. | 6,742 | 2,190,273 | ||||||
Waters Corp.(2) | 1,124 | 262,623 | ||||||
| $ | 4,721,012 | |||||||
| Machinery — 1.6% | ||||||||
Caterpillar, Inc. | 9,221 | $ | 1,361,757 | |||||
Cummins, Inc. | 2,556 | 457,422 | ||||||
Deere & Co. | 5,254 | 910,308 | ||||||
Dover Corp. | 2,515 | 289,879 | ||||||
Flowserve Corp. | 2,403 | 119,597 | ||||||
Fortive Corp. | 5,008 | 382,561 | ||||||
IDEX Corp. | 1,350 | 232,200 | ||||||
Illinois Tool Works, Inc. | 4,958 | 890,606 | ||||||
Ingersoll-Rand PLC | 4,096 | 544,440 | ||||||
PACCAR, Inc. | 5,771 | 456,486 | ||||||
Parker-Hannifin Corp. | 2,143 | 441,072 | ||||||
Pentair PLC | 2,736 | 125,500 | ||||||
Snap-on, Inc. | 1,000 | 169,400 | ||||||
Stanley Black & Decker, Inc. | 2,536 | 420,317 | ||||||
Westinghouse Air Brake Technologies Corp.(1) | 3,012 | 234,334 | ||||||
Xylem, Inc. | 3,170 | 249,764 | ||||||
| $ | 7,285,643 | |||||||
| Media — 1.4% | ||||||||
Charter Communications, Inc., Class A(2) | 2,616 | $ | 1,268,969 | |||||
Comcast Corp., Class A | 76,164 | 3,425,095 | ||||||
Discovery, Inc., Class A(1)(2) | 2,923 | 95,699 | ||||||
| Security | Shares | Value | ||||||
| Media (continued) | ||||||||
Discovery, Inc., Class C(2) | 5,844 | $ | 178,184 | |||||
DISH Network Corp., Class A(2) | 4,169 | 147,875 | ||||||
Fox Corp., Class A | 6,317 | 234,171 | ||||||
Fox Corp., Class B | 2,865 | 104,286 | ||||||
Interpublic Group of Cos., Inc. (The) | 6,573 | 151,836 | ||||||
News Corp., Class A | 6,766 | 95,671 | ||||||
News Corp., Class B | 2,023 | 29,354 | ||||||
Omnicom Group, Inc.(1) | 3,664 | 296,857 | ||||||
ViacomCBS, Inc., Class B | 9,230 | 387,383 | ||||||
| $ | 6,415,380 | |||||||
| Metals & Mining — 0.3% | ||||||||
Freeport-McMoRan, Inc. | 25,147 | $ | 329,929 | |||||
Newmont Goldcorp Corp. | 13,810 | 600,044 | ||||||
Nucor Corp. | 5,176 | 291,305 | ||||||
| $ | 1,221,278 | |||||||
| Multi-Utilities — 1.0% | ||||||||
Ameren Corp. | 4,105 | $ | 315,264 | |||||
CenterPoint Energy, Inc. | 8,529 | 232,586 | ||||||
CMS Energy Corp. | 4,736 | 297,610 | ||||||
Consolidated Edison, Inc. | 5,658 | 511,879 | ||||||
Dominion Energy, Inc. | 13,852 | 1,147,223 | ||||||
DTE Energy Co. | 3,205 | 416,233 | ||||||
NiSource, Inc. | 6,676 | 185,860 | ||||||
Public Service Enterprise Group, Inc. | 8,584 | 506,885 | ||||||
Sempra Energy | 4,660 | 705,897 | ||||||
WEC Energy Group, Inc. | 5,313 | 490,018 | ||||||
| $ | 4,809,455 | |||||||
| Multiline Retail — 0.5% | ||||||||
Dollar General Corp. | 4,248 | $ | 662,603 | |||||
Dollar Tree, Inc.(2) | 3,986 | 374,883 | ||||||
Kohl’s Corp. | 2,707 | 137,922 | ||||||
Macy’s, Inc.(1) | 5,802 | 98,634 | ||||||
Nordstrom, Inc. | 2,105 | 86,158 | ||||||
Target Corp. | 8,455 | 1,084,015 | ||||||
| $ | 2,444,215 | |||||||
| Oil, Gas & Consumable Fuels — 3.8% | ||||||||
Apache Corp. | 6,750 | $ | 172,733 | |||||
Cabot Oil & Gas Corp. | 7,347 | 127,911 | ||||||
Chevron Corp. | 31,725 | 3,823,180 | ||||||
Cimarex Energy Co. | 1,817 | 95,374 | ||||||
| 12 | See Notes to Financial Statements. |
Table of Contents
Calvert
VP S&P 500 Index Portfolio
December 31, 2019
Schedule of Investments — continued
| Security | Shares | Value | ||||||
| Oil, Gas & Consumable Fuels (continued) | ||||||||
Concho Resources, Inc. | 3,534 | $ | 309,472 | |||||
ConocoPhillips | 18,308 | 1,190,569 | ||||||
Devon Energy Corp. | 6,457 | 167,688 | ||||||
Diamondback Energy, Inc. | 2,750 | 255,365 | ||||||
EOG Resources, Inc. | 9,856 | 825,539 | ||||||
Exxon Mobil Corp. | 71,239 | 4,971,057 | ||||||
Hess Corp. | 4,442 | 296,770 | ||||||
HollyFrontier Corp. | 2,668 | 135,294 | ||||||
Kinder Morgan, Inc. | 33,064 | 699,965 | ||||||
Marathon Oil Corp. | 13,891 | 188,640 | ||||||
Marathon Petroleum Corp. | 10,834 | 652,749 | ||||||
Noble Energy, Inc. | 8,122 | 201,750 | ||||||
Occidental Petroleum Corp. | 15,247 | 628,329 | ||||||
ONEOK, Inc. | 6,956 | 526,361 | ||||||
Phillips 66 | 7,414 | 825,994 | ||||||
Pioneer Natural Resources Co. | 2,860 | 432,918 | ||||||
Valero Energy Corp. | 6,852 | 641,690 | ||||||
Williams Cos., Inc. (The) | 20,415 | 484,244 | ||||||
| $ | 17,653,592 | |||||||
| Personal Products — 0.2% | ||||||||
Coty, Inc., Class A | 5,288 | $ | 59,490 | |||||
Estee Lauder Cos., Inc. (The), Class A | 3,713 | 766,883 | ||||||
| $ | 826,373 | |||||||
| Pharmaceuticals — 4.5% | ||||||||
Allergan PLC | 5,529 | $ | 1,056,979 | |||||
Bristol-Myers Squibb Co. | 39,418 | 2,530,241 | ||||||
Eli Lilly & Co. | 14,207 | 1,867,226 | ||||||
Johnson & Johnson | 44,366 | 6,471,668 | ||||||
Merck & Co., Inc. | 42,720 | 3,885,384 | ||||||
Mylan NV(2) | 8,689 | 174,649 | ||||||
Perrigo Co. PLC | 2,125 | 109,778 | ||||||
Pfizer, Inc. | 93,273 | 3,654,436 | ||||||
Zoetis, Inc. | 7,947 | 1,051,786 | ||||||
| $ | 20,802,147 | |||||||
| Professional Services — 0.3% | ||||||||
Equifax, Inc. | 2,125 | $ | 297,755 | |||||
IHS Markit, Ltd.(2) | 6,760 | 509,366 | ||||||
Nielsen Holdings PLC | 6,382 | 129,555 | ||||||
Robert Half International, Inc. | 2,134 | 134,762 | ||||||
Verisk Analytics, Inc. | 2,734 | 408,295 | ||||||
| $ | 1,479,733 | |||||||
| Security | Shares | Value | ||||||
| Real Estate Management & Development — 0.1% | ||||||||
CBRE Group, Inc., Class A(2) | 5,710 | $ | 349,966 | |||||
| Road & Rail — 1.0% | ||||||||
CSX Corp. | 12,975 | $ | 938,871 | |||||
J.B. Hunt Transport Services, Inc. | 1,477 | 172,484 | ||||||
Kansas City Southern | 1,694 | 259,453 | ||||||
Norfolk Southern Corp. | 4,351 | 844,659 | ||||||
Old Dominion Freight Line, Inc. | 1,100 | 208,758 | ||||||
Union Pacific Corp. | 11,673 | 2,110,362 | ||||||
| $ | 4,534,587 | |||||||
| Semiconductors & Semiconductor Equipment — 4.2% | ||||||||
Advanced Micro Devices, Inc.(2) | 18,683 | $ | 856,802 | |||||
Analog Devices, Inc. | 6,145 | 730,272 | ||||||
Applied Materials, Inc. | 15,560 | 949,782 | ||||||
Broadcom, Inc. | 6,670 | 2,107,854 | ||||||
Intel Corp. | 73,240 | 4,383,414 | ||||||
KLA Corp. | 2,682 | 477,852 | ||||||
Lam Research Corp. | 2,435 | 711,994 | ||||||
Maxim Integrated Products, Inc. | 4,745 | 291,865 | ||||||
Microchip Technology, Inc.(1) | 4,112 | 430,609 | ||||||
Micron Technology, Inc.(2) | 18,471 | 993,370 | ||||||
NVIDIA Corp. | 10,291 | 2,421,472 | ||||||
Qorvo, Inc.(2) | 2,024 | 235,250 | ||||||
QUALCOMM, Inc. | 19,225 | 1,696,222 | ||||||
Skyworks Solutions, Inc. | 2,933 | 354,541 | ||||||
Texas Instruments, Inc. | 15,718 | 2,016,462 | ||||||
Xilinx, Inc. | 4,196 | 410,243 | ||||||
| $ | 19,068,004 | |||||||
| Software — 6.9% | ||||||||
Adobe, Inc.(2) | 8,142 | $ | 2,685,313 | |||||
ANSYS, Inc.(2) | 1,425 | 366,809 | ||||||
Autodesk, Inc.(2) | 3,730 | 684,306 | ||||||
Cadence Design Systems, Inc.(2) | 4,773 | 331,055 | ||||||
Citrix Systems, Inc. | 2,124 | 235,552 | ||||||
Fortinet, Inc.(2) | 2,369 | 252,915 | ||||||
Intuit, Inc. | 4,343 | 1,137,562 | ||||||
Microsoft Corp. | 128,599 | 20,280,062 | ||||||
NortonLifeLock, Inc. | 9,577 | 244,405 | ||||||
Oracle Corp. | 36,430 | 1,930,061 | ||||||
salesforce.com, Inc.(2) | 14,883 | 2,420,571 | ||||||
ServiceNow, Inc.(2) | 3,190 | 900,601 | ||||||
Synopsys, Inc.(2) | 2,508 | 349,114 | ||||||
| $ | 31,818,326 | |||||||
| 13 | See Notes to Financial Statements. |
Table of Contents
Calvert
VP S&P 500 Index Portfolio
December 31, 2019
Schedule of Investments — continued
| Security | Shares | Value | ||||||
| Specialty Retail — 2.2% | ||||||||
Advance Auto Parts, Inc. | 1,218 | $ | 195,075 | |||||
AutoZone, Inc.(2) | 398 | 474,141 | ||||||
Best Buy Co., Inc. | 3,800 | 333,640 | ||||||
CarMax, Inc.(2) | 2,887 | 253,103 | ||||||
Gap, Inc. (The) | 4,154 | 73,443 | ||||||
Home Depot, Inc. (The) | 18,386 | 4,015,135 | ||||||
L Brands, Inc. | 4,029 | 73,005 | ||||||
Lowe’s Cos., Inc. | 12,789 | 1,531,611 | ||||||
O’Reilly Automotive, Inc.(2) | 1,289 | 564,917 | ||||||
Ross Stores, Inc. | 6,036 | 702,711 | ||||||
Tiffany & Co. | 1,801 | 240,704 | ||||||
TJX Cos., Inc. (The) | 20,234 | 1,235,488 | ||||||
Tractor Supply Co. | 1,975 | 184,544 | ||||||
Ulta Beauty, Inc.(2) | 978 | 247,571 | ||||||
| $ | 10,125,088 | |||||||
| Technology Hardware, Storage & Peripherals — 4.9% | ||||||||
Apple, Inc. | 70,397 | $ | 20,672,079 | |||||
Hewlett Packard Enterprise Co. | 21,991 | 348,777 | ||||||
HP, Inc. | 24,726 | 508,119 | ||||||
NetApp, Inc. | 4,007 | 249,436 | ||||||
Seagate Technology PLC | 3,988 | 237,286 | ||||||
Western Digital Corp. | 5,047 | 320,333 | ||||||
Xerox Holdings Corp. | 3,205 | 118,169 | ||||||
| $ | 22,454,199 | |||||||
| Textiles, Apparel & Luxury Goods — 0.7% | ||||||||
Capri Holdings, Ltd.(2) | 2,807 | $ | 107,087 | |||||
Hanesbrands, Inc.(1) | 6,857 | 101,827 | ||||||
NIKE, Inc., Class B | 20,952 | 2,122,647 | ||||||
PVH Corp. | 1,314 | 138,167 | ||||||
Ralph Lauren Corp., Class A | 947 | 111,007 | ||||||
Tapestry, Inc. | 4,928 | 132,908 | ||||||
Under Armour, Inc., Class A(1)(2) | 3,534 | 76,334 | ||||||
Under Armour, Inc., Class C(2) | 3,507 | 67,264 | ||||||
VF Corp. | 5,531 | 551,220 | ||||||
| $ | 3,408,461 | |||||||
| Tobacco — 0.8% | ||||||||
Altria Group, Inc. | 31,453 | $ | 1,569,819 | |||||
Philip Morris International, Inc. | 26,162 | 2,226,125 | ||||||
| $ | 3,795,944 | |||||||
| Security | Shares | Value | ||||||
| Trading Companies & Distributors — 0.2% | ||||||||
Fastenal Co. | 9,659 | $ | 356,900 | |||||
United Rentals, Inc.(2) | 1,254 | 209,130 | ||||||
W.W. Grainger, Inc. | 728 | 246,442 | ||||||
| $ | 812,472 | |||||||
| Water Utilities — 0.1% | ||||||||
American Water Works Co., Inc. | 3,066 | $ | 376,658 | |||||
| Wireless Telecommunication Services — 0.1% | ||||||||
T-Mobile US, Inc.(2) | 5,325 | $ | 417,586 | |||||
Total Common Stocks |
| $ | 451,149,329 | |||||
| Exchange-Traded Funds — 0.3% |
| |||||||
| Security | Shares | Value | ||||||
SPDR S&P 500 ETF Trust | 4,000 | $ | 1,287,440 | |||||
Total Exchange-Traded Funds |
| $ | 1,287,440 | |||||
| Short-Term Investments — 0.2% |
| |||||||
| U.S. Treasury Obligations — 0.2% |
| |||||||
| Security | Principal Amount (000’s omitted) | Value | ||||||
U.S. Treasury Bill, 0.00%, 2/27/20(4) | $ | 1,000 | $ | 997,659 | ||||
Total U.S. Treasury Obligations |
| $ | 997,659 | |||||
Total Short-Term Investments |
| $ | 997,659 | |||||
Total Investments |
| $ | 453,434,428 | |||||
Other Assets, Less Liabilities — 1.3% |
| $ | 5,767,357 | |||||
Net Assets — 100.0% |
| $ | 459,201,785 | |||||
The percentage shown for each investment category in the Schedule of Investments is based on net assets.
Notes to Schedule of Investments
| (1) | All or a portion of this security was on loan at December 31, 2019. The aggregate market value of securities on loan at December 31, 2019 was $3,235,608. |
| 14 | See Notes to Financial Statements. |
Table of Contents
Calvert
VP S&P 500 Index Portfolio
December 31, 2019
Schedule of Investments — continued
| (2) | Non-income producing security. |
| (3) | Amount is less than 0.05%. |
| (4) | Security (or a portion thereof) has been pledged to cover margin requirements on open futures contracts. |
| Futures Contracts | ||||||||||||||||||||
| Description | Number of Contracts | Position | Expiration Date | Notional Amount | Value/ Unrealized | |||||||||||||||
| Equity Futures | ||||||||||||||||||||
E-mini S&P 500 Index | 46 | Long | 3/20/20 | $ | 7,431,530 | $ | 16,725 | |||||||||||||
| 15 | See Notes to Financial Statements. |
Table of Contents
Calvert
VP S&P 500 Index Portfolio
December 31, 2019
Statement of Assets and Liabilities
| Assets | December 31, 2019 | |||
Investments in securities of unaffiliated issuers, at value (identified cost $207,477,509) - including | $ | 453,434,428 | ||
Receivable for variation margin on open futures contracts | 17,737 | |||
Cash | 5,646,339 | |||
Receivable for investments sold | 321,143 | |||
Receivable for capital shares sold | 18,051 | |||
Dividends receivable | 465,119 | |||
Securities lending income receivable | 348 | |||
Receivable from affiliate | 48,516 | |||
Directors’ deferred compensation plan | 85,501 | |||
Other assets | 24,096 | |||
Total assets | $ | 460,061,278 | ||
| Liabilities |
| |||
Payable for investments purchased | $ | 127,915 | ||
Payable for capital shares redeemed | 306,507 | |||
Payable to affiliates: | ||||
Investment advisory fee | 69,421 | |||
Administrative fee | 46,281 | |||
Sub-transfer agency fee | 85 | |||
Directors’ deferred compensation plan | 85,501 | |||
Accrued expenses | 223,783 | |||
Total liabilities | $ | 859,493 | ||
Net Assets | $ | 459,201,785 | ||
| Sources of Net Assets |
| |||
Paid-in capital | $ | 195,829,517 | ||
Distributable earnings | 263,372,268 | |||
Total | $ | 459,201,785 | ||
Net Assets | $ | 459,201,785 | ||
Shares Outstanding | 3,107,130 | |||
Net Asset Value, Offering Price and Redemption Price Per Share | ||||
(net assets ÷ shares of beneficial interest outstanding) | $ | 147.79 | ||
| 16 | See Notes to Financial Statements. |
Table of Contents
Calvert
VP S&P 500 Index Portfolio
December 31, 2019
Statement of Operations
| Investment Income | Year Ended December 31, 2019 | |||
Dividend income | $ | 8,610,528 | ||
Interest income | 104,170 | |||
Securities lending income, net | 9,002 | |||
Total investment income | $ | 8,723,700 | ||
| Expenses | ||||
Investment advisory fee | $ | 782,492 | ||
Administrative fee | 521,661 | |||
Directors’ fees and expenses | 25,849 | |||
Custodian fees | 26,135 | |||
Transfer agency fees and expenses | 22,260 | |||
Accounting fees | 99,343 | |||
Professional fees | 52,430 | |||
Reports to shareholders | 63,821 | |||
Miscellaneous | 74,722 | |||
Total expenses | $ | 1,668,713 | ||
Waiver and/or reimbursement of expenses by affiliate | $ | (441,616 | ) | |
Reimbursement of expenses - other | (9,888 | ) | ||
Net expenses | $ | 1,217,209 | ||
Net investment income | $ | 7,506,491 | ||
| Realized and Unrealized Gain (Loss) | ||||
Net realized gain (loss): | ||||
Investment securities | $ | 12,445,985 | ||
Futures contracts | 1,593,008 | |||
Net realized gain | $ | 14,038,993 | ||
Change in unrealized appreciation (depreciation): | ||||
Investment securities | $ | 94,829,462 | ||
Futures contracts | 209,648 | |||
Net change in unrealized appreciation (depreciation) | $ | 95,039,110 | ||
Net realized and unrealized gain | $ | 109,078,103 | ||
Net increase in net assets resulting from operations | $ | 116,584,594 | ||
| 17 | See Notes to Financial Statements. |
Table of Contents
Calvert
VP S&P 500 Index Portfolio
December 31, 2019
Statements of Changes in Net Assets
| Year Ended December 31, | ||||||||
| Increase (Decrease) in Net Assets | 2019 | 2018 | ||||||
From operations: | ||||||||
Net investment income | $ | 7,506,491 | $ | 7,828,278 | ||||
Net realized gain | 14,038,993 | 30,559,923 | ||||||
Net change in unrealized appreciation (depreciation) | 95,039,110 | (55,432,492 | ) | |||||
Net increase (decrease) in net assets from operations | $ | 116,584,594 | $ | (17,044,291 | ) | |||
Distributions to shareholders | $ | (35,862,644 | ) | $ | (39,153,308 | ) | ||
Net decrease in net assets from capital share transactions | $ | (12,861,723 | ) | $ | (67,565,551 | ) | ||
Net increase (decrease) in net assets | $ | 67,860,227 | $ | (123,763,150 | ) | |||
| Net Assets | ||||||||
At beginning of year | $ | 391,341,558 | $ | 515,104,708 | ||||
At end of year | $ | 459,201,785 | $ | 391,341,558 | ||||
| 18 | See Notes to Financial Statements. |
Table of Contents
Calvert
VP S&P 500 Index Portfolio
December 31, 2019
Financial Highlights
| Year Ended December 31, | ||||||||||||||||||||
| 2019 | 2018 | 2017 | 2016 | 2015 | ||||||||||||||||
Net asset value — Beginning of year | $ | 123.19 | $ | 141.18 | $ | 122.44 | $ | 112.07 | $ | 113.07 | ||||||||||
| Income (Loss) From Operations | ||||||||||||||||||||
Net investment income | $ | 2.43 | $ | 2.39 | $ | 2.30 | $ | 2.14 | $ | 1.88 | ||||||||||
Net realized and unrealized gain (loss) | 34.42 | (7.33 | ) | 23.60 | 10.84 | (0.74 | ) | |||||||||||||
Total income (loss) from operations | $ | 36.85 | $ | (4.94 | ) | $ | 25.90 | $ | 12.98 | $ | 1.14 | |||||||||
| Less Distributions | ||||||||||||||||||||
From net investment income | $ | (2.63 | ) | $ | (2.84 | ) | $ | (1.99 | ) | $ | (1.48 | ) | $ | (0.21 | ) | |||||
From net realized gain | (9.62 | ) | (10.21 | ) | (5.17 | ) | (1.13 | ) | (1.93 | ) | ||||||||||
Total distributions | $ | (12.25 | ) | $ | (13.05 | ) | $ | (7.16 | ) | $ | (2.61 | ) | $ | (2.14 | ) | |||||
Net asset value — End of year | $ | 147.79 | $ | 123.19 | $ | 141.18 | $ | 122.44 | $ | 112.07 | ||||||||||
Total Return(2) | 31.16 | % | (4.74 | )% | 21.46 | % | 11.58 | % | 0.98 | % | ||||||||||
| Ratios/Supplemental Data | ||||||||||||||||||||
Net assets, end of year (000’s omitted) | $ | 459,202 | $ | 391,342 | $ | 515,105 | $ | 481,681 | $ | 347,965 | ||||||||||
Ratios (as a percentage of average daily net assets):(3) | ||||||||||||||||||||
Total expenses | 0.38 | % | 0.39 | % | 0.40 | % | 0.48 | % | 0.46 | % | ||||||||||
Net expenses | 0.28 | % | 0.28 | % | 0.28 | % | 0.40 | % | 0.42 | % | ||||||||||
Net investment income | 1.72 | % | 1.68 | % | 1.72 | % | 1.84 | % | 1.65 | % | ||||||||||
Portfolio Turnover | 6 | % | 7 | % | 5 | % | 6 | %(4) | 4 | % | ||||||||||
| (1) | Computed using average shares outstanding. |
| (2) | Returns are historical and are calculated by determining the percentage change in net asset value with all distributions reinvested and do not reflect fees and expenses imposed by variable annuity contracts or variable life insurance policies. If included, total return would be lower. |
| (3) | Total expenses do not reflect amounts reimbursed and/or waived by the adviser and certain of its affiliates, if applicable. Net expenses are net of all reductions and represent the net expenses paid by the Fund. |
| (4) | During the year ended December 31, 2016, the Fund incurred sales of $55,737,177 to realign the combined portfolio in connection with the reorganization of Calvert VP Large Cap Core Portfolio into the Fund on September 23, 2016. These sales were excluded from the portfolio turnover calculation. |
| 19 | See Notes to Financial Statements. |
Table of Contents
Calvert
VP S&P 500 Index Portfolio
December 31, 2019
Notes to Financial Statements
1 Significant Accounting Policies
Calvert VP S&P 500 Index Portfolio (the Fund) is a diversified series of Calvert Variable Products, Inc. (the Corporation). The Corporation is a Maryland corporation registered under the Investment Company Act of 1940, as amended (the 1940 Act), as anopen-end management investment company. The investment objective of the Fund is to seek investment results that correspond to the total return performance of U.S. common stocks, as represented by the S&P 500® Index.
Shares of the Fund are sold without sales charge to insurance companies for allocation to certain of their variable separate accounts.
The Fund applies the accounting and reporting guidance in the Financial Accounting Standards Board (FASB) Accounting Standards Codification Topic 946,Financial Services – Investment Companies (ASC 946). Subsequent events, if any, through the date that the financial statements were issued have been evaluated in the preparation of the financial statements.
A Investment Valuation — Net asset value per share is determined every business day as of the close of the regular session of the New York Stock Exchange (generally 4:00 p.m. Eastern time). The Fund uses independent pricing services approved by the Board ofDirectors (the Board) to value its investments wherever possible. Investments for which market quotations are not available or deemed not reliable are fair valued in good faith under the direction of the Board.
U.S. generally accepted accounting principles (U.S. GAAP) establishes a disclosure hierarchy that categorizes the inputs to valuation techniques used to value assets and liabilities at measurement date. These inputs are summarized in the three broad levels listed below:
Level 1 - quoted prices in active markets for identical securities
Level 2 - other significant observable inputs (including quoted prices for similar securities, interest rates, prepayment speeds, credit risk, etc.)
Level 3 - significant unobservable inputs (including the Fund’s own assumptions in determining the fair value of investments)
The inputs or methodologies used for valuing securities are not necessarily an indication of the risk associated with investing in those securities.
Valuation techniques used to value the Fund’s investments by major category are as follows:
Equity Securities.Equity securities (including warrants and rights) listed on a U.S. securities exchange generally are valued at the last sale or closing price as reported by an independent pricing service on the primary market or exchange on which they are traded and are categorized as Level 1 in the hierarchy. Equity securities listed on the NASDAQ Global or Global Select Market are valued at the NASDAQ official closing price and are categorized as Level 1 in the hierarchy. Unlisted or listed securities for which closing sales prices or closing quotations are not available are valued at the mean between the latest available bid and ask prices and are categorized as Level 2 in the hierarchy.
Short-Term Debt Securities. Short-term debt securities with a remaining maturity at time of purchase of more than sixty days are valued on the basis of valuations provided by a third party pricing service. Such securities are generally categorized as Level 2 in the hierarchy. Short-term debt securities of sufficient credit quality purchased with remaining maturities of sixty days or less are valued at amortized cost, which approximates fair value, and are categorized as Level 2 in the hierarchy.
Other Securities.Exchange-traded funds are valued at the official closing price as reported by an independent pricing service on the primary market or exchange on which they are traded and are categorized as Level 1 in the hierarchy. Investments in registered investment companies (including money market funds) that do not trade on an exchange are valued at the net asset value per share on the valuation day and are categorized as Level 1 in the hierarchy.
Derivatives.Futures contracts are valued at unrealized appreciation (depreciation) based on the settlement price established each day by the board of trade or exchange on which they are traded and are categorized as Level 1 in the hierarchy.
Fair Valuation.If a market value cannot be determined for a security using the methodologies described above, or if, in the good faith opinion of the Fund’s adviser, the market value does not constitute a readily available market quotation, or if a significant event has occurred that would materially affect the value of the security, the security will be fair valued as determined in good faith by or at the direction of the Board in a manner that most fairly reflects the security’s “fair value”, which is the amount that the Fund might reasonably expect to receive for the security upon its current sale in the ordinary course. Each such determination is based on a consideration of relevant factors, which are likely to vary from one pricing context to another. These factors may include, but are not limited to, the type of security, the existence of any contractual restrictions on the security’s disposition, the price and extent of public trading in similar securities of the issuer or of comparable companies or entities, quotations or relevant information obtained from broker/dealers or other market participants, information obtained from the issuer, analysts, and/or the appropriate stock exchange (for exchange-traded securities), an analysis of the company’s or entity’s financial statements, and an evaluation of the forces that influence the issuer and the market(s) in which the security is purchased and sold.
The values assigned to fair value investments are based on available information and do not necessarily represent amounts that might ultimately be realized. Further, due to the inherent uncertainty of valuations of such investments, the fair values may differ significantly from the values that would have been used had an active market existed, and the differences could be material.
| 20 |
Table of Contents
Calvert
VP S&P 500 Index Portfolio
December 31, 2019
Notes to Financial Statements — continued
The following table summarizes the market value of the Fund’s holdings as of December 31, 2019, based on the inputs used to value them:
| Asset Description | Level 1 | Level 2 | Level 3 | Total | ||||||||||||
Common Stocks | $ | 451,149,329 | (1) | $ | — | $ | — | $ | 451,149,329 | |||||||
Exchange-Traded Funds | 1,287,440 | — | — | 1,287,440 | ||||||||||||
Short-Term Investments — | ||||||||||||||||
U.S. Treasury Obligations | — | 997,659 | — | 997,659 | ||||||||||||
Total Investments | $ | 452,436,769 | $ | 997,659 | $ | — | $ | 453,434,428 | ||||||||
Futures Contracts | $ | 16,725 | $ | — | $ | — | $ | 16,725 | ||||||||
Total | $ | 452,453,494 | $ | 997,659 | $ | — | $ | 453,451,153 | ||||||||
| (1) | The level classification by major category of investments is the same as the category presentation in the Schedule of Investments. |
B Investment Transactions and Income — Investment transactions for financial statement purposes are accounted for on trade date. Realized gains and losses are recorded on an identified cost basis and may include proceeds from litigation. Dividend income is recorded on theex-dividend date for dividends received in cash and/or securities.Non-cash dividends are recorded at the fair value of the securities received. Distributions received that represent a return of capital are recorded as a reduction of cost of investments. Distributions received that represent a capital gain are recorded as a realized gain. Interest income, which includes amortization of premium and accretion of discount on debt securities, is accrued as earned.
C Futures Contracts — The Fund may enter into futures contracts to buy or sell a financial instrument for a set price at a future date. Initial margin deposits of either cash or securities as required by the broker are made upon entering into the contract. While the contract is open, daily variation margin payments are made to or received from the broker reflecting the daily change in market value of the contract and are recorded for financial reporting purposes as unrealized gains or losses by the Fund. When a futures contract is closed, a realized gain or loss is recorded equal to the difference between the opening and closing value of the contract. The risks associated with entering into futures contracts may include the possible illiquidity of the secondary market which would limit the Fund’s ability to close out a futures contract prior to the settlement date, an imperfect correlation between the value of the contracts and the underlying financial instruments, or that the counterparty will fail to perform its obligations under the contracts’ terms. Futures contracts are designed by boards of trade, which are designated “contracts markets” by the Commodities Futures Trading Commission. Futures contracts trade on the contracts markets in a manner that is similar to the way a stock trades on a stock exchange, and the boards of trade, through their clearing corporations, guarantee the futures contracts against default. As a result, there is minimal counterparty credit risk to the Fund.
D Distributions to Shareholders — Distributions to shareholders are recorded by the Fund onex-dividend date. The Fund distributes any net investment income and net realized capital gains at least annually. Both types of distributions are made in shares of the Fund unless an election is made on behalf of a separate account to receive some or all of the distributions in cash. Distributions are determined in accordance with income tax regulations which may differ from U.S. GAAP; accordingly, periodic reclassifications are made within theFund’s capital accounts to reflect income and gains available for distribution under income tax regulations.
E Estimates — The preparation of financial statements in conformity with U.S. GAAP requires management to make estimates and assumptions that affect the reported amounts of assets and liabilities and disclosure of contingent assets and liabilities at the date of the financial statements and the reported amounts of increases and decreases in net assets from operations during the reporting period. Actual results could differ from those estimates.
F Indemnifications — The Corporation’sBy-Laws provide for indemnification for Directors or officers of the Corporation and certain other parties, to the fullest extent permitted by Maryland law and the 1940 Act, provided certain conditions are met. Additionally, in the normal course of business, the Fund enters into agreements with service providers that may contain indemnification clauses. The Fund’s maximum exposure under these arrangements is unknown as this would involve future claims that may be made against the Fund that have not yet occurred.
G Federal Income Taxes — No provision for federal income or excise tax is required since the Fund intends to continue to qualify as a regulated investment company under the Internal Revenue Code and to distribute substantially all of its taxable earnings.
Management has analyzed the Fund’stax positions taken for all open federal income tax years and has concluded that no provision for federal income tax is required in the Fund’s financial statements. A Fund’s federal tax return is subject to examination by the Internal Revenue Service for a period of three years from the date of filing.
2 Related Party Transactions
The investment advisory fee is earned by Calvert Research and Management (CRM), a subsidiary of Eaton Vance Management (EVM), as compensation for investment advisory services rendered to the Fund. Pursuant to the investment advisory agreement, CRM receives a fee, payable monthly, at the annual rate of 0.18% of the Fund’s average daily net assets. For the year ended December 31, 2019, the investment advisory fee amounted to $782,492.
| 21 |
Table of Contents
Calvert
VP S&P 500 Index Portfolio
December 31, 2019
Notes to Financial Statements — continued
Ameritas Investment Partners, Inc. (AIP) providessub-advisory services to the Fund pursuant to asub-advisory agreement with CRM.Sub-advisory fees are paid by CRM from its investment advisory fee.
CRM has agreed to reimburse the Fund’s operating expenses to the extent that total annual operating expenses (relating to ordinary operating expenses only and excluding expenses such as brokerage commissions, acquired fund fees and expenses of unaffiliated funds, borrowing costs, taxes or litigation expenses) exceed 0.28% of the Fund’s average daily net assets. The expense reimbursement agreement with CRM may be changed or terminated after April 30, 2020. For the year ended December 31, 2019, CRM waived or reimbursed expenses of $441,616.
The administrative fee is earned by CRM as compensation for administrative services rendered to the Fund. The fee is computed at an annual rate of 0.12% of the Fund’s average daily net assets and is payable monthly. For the year ended December 31, 2019, CRM was paid administrative fees of $521,661.
EVM providessub-transfer agency and related services to the Fund pursuant to aSub-Transfer Agency Support Services Agreement. For the year ended December 31, 2019,sub-transfer agency fees and expenses incurred to EVM amounted to $394 and are included in transfer agency fees and expenses on the Statement of Operations.
Each Director of the Fund who is not an employee of CRM or its affiliates receives a fee of $3,000 for each Board meeting attended in person and $2,000 for each Board meeting attended by phone plus an annual fee of $142,000, and $1,500 for each Committee meeting attended in person and $1,000 for each Committee meeting attended by phone plus an annual Committee fee of $2,500. The Board chair receives an additional $20,000 annual retainer and Committee chairs receive an additional $6,000 annual retainer. Eligible Directors may participate in a Deferred Compensation Plan (the Plan). Amounts deferred under the Plan are treated as though equal dollar amounts had been invested in shares of the Fund or other Calvert funds selected by the Directors. The Fund purchases shares of the funds selected equal to the dollar amounts deferred under the Plan, resulting in an asset equal to the deferred compensation liability. Obligations of the Plan are paid solely from the Fund’s assets. Directors’ fees are allocated to each of the Calvert funds served. Salaries and fees of officers and Directors of the Fund who are employees of CRM or its affiliates are paid by CRM. In addition, an advisory council was established to aid the Board and CRM in advancing the cause of responsible investing through original scholarship and thought leadership. The advisory council consists of CRM’s Chief Executive Officer and four additional members. Each member (other than CRM’s Chief Executive Officer) receives annual compensation of $75,000, which is being reimbursed by Calvert Investment Management, Inc. (CIM), the Calvert funds’ former investment adviser and Ameritas Holding Company, CIM’s parent company, through the end of 2019. For the year ended December 31, 2019, the Fund’s allocated portion of such expense and reimbursement was $9,888, which are included in miscellaneous expense and reimbursement of expenses - other, respectively, on the Statement of Operations.
3 Shareholder Servicing Plan
The Corporation, on behalf of the Fund, has adopted a Shareholder Servicing Plan (Servicing Plan), which permits the Fund to enter into shareholder servicing agreements with intermediaries that maintain accounts in the Fund for the benefit of shareholders. These services may include, but are not limited to, processing purchase and redemption requests, processing dividend payments, and providing account information to shareholders. Under the Servicing Plan, the Fund may make payments at an annual rate of up to 0.11% of its average daily net assets. For the year ended December 31, 2019, expenses incurred under the Servicing Plan amounted to $20,561 and are included in transfer agency fees and expenses on the Statement of Operations.
4 Investment Activity
During theyear ended December 31, 2019, the cost of purchases and proceeds from sales of investments, other than short-term securities, were $25,038,491 and $60,316,677, respectively.
5 Distributions to Shareholders and Income Tax Information
The tax character of distributions declared for the years ended December 31, 2019 and December 31, 2018 was as follows:
| Year Ended December 31, | ||||||||
| 2019 | 2018 | |||||||
Ordinary income | $ | 7,871,696 | $ | 10,407,743 | ||||
Long-term capital gains | $ | 27,990,948 | $ | 28,745,565 | ||||
| 22 |
Table of Contents
Calvert
VP S&P 500 Index Portfolio
December 31, 2019
Notes to Financial Statements — continued
As of December 31, 2019, the components of distributable earnings (accumulated loss) on a tax basis were as follows:
Undistributed ordinary income | $ | 8,688,443 | ||
Undistributed long-term capital gains | $ | 12,808,265 | ||
Net unrealized appreciation | $ | 241,875,560 | ||
The cost and unrealized appreciation (depreciation) of investments, including open derivative contracts, of the Fund at December 31, 2019, as determined on a federal income tax basis, were as follows:
| Aggregate cost | $211,558,868 | |||
Gross unrealized appreciation | $ | 248,864,601 | ||
Gross unrealized depreciation | (6,989,041 | ) | ||
Net unrealized appreciation | $ | 241,875,560 | ||
6 Financial Instruments
A summary of futures contracts outstanding at December 31, 2019 is included in the Schedule of Investments. During the year ended December 31, 2019, the Fund used futures contracts to provide equity market exposure for uncommitted cash balances.
At December 31, 2019, the fair value of open derivative instruments (not considered to be hedging instruments for accounting disclosure purposes) and whose primary underlying risk exposure is equity price risk was as follows:
| Derivative | Statement of Assets and Liabilities Caption | Assets | Liabilities | |||||||||
Futures contracts | Distributable earnings | $ | 16,725 | (1) | $ | — | ||||||
| (1) | Only the current day’s variation margin is reported within the Statement of Assets and Liabilities as Receivable or Payable for variation margin on open futures contracts, as applicable. |
The effect of derivative instruments (not considered to be hedging instruments for accounting disclosure purposes) on the Statement of Operations and whose primary underlying risk exposure is equity price risk for the year ended December 31, 2019 was as follows:
| Statement of Operations Caption | ||||||||
| Derivative | Net realized on futures contracts | Change in unrealized | ||||||
Futures contracts | $ | 1,593,008 | $ | 209,648 | ||||
The average notional cost of futures contracts (long) outstanding during the year ended December 31, 2019 was approximately $7,537,000.
7 Securities Lending
To generate additional income, the Fund may lend its securities pursuant to a securities lending agency agreement with State Street Bank and Trust Company (SSBT), the securities lending agent. Security loans are subject to termination by the Fund at any time and, therefore, are not considered illiquid investments. The Fund requires that the loan be continuously collateralized by either cash or securities as collateral equal at all times to at least 102% of the market value of the domestic securities loaned and 105% of the market value of the international securities loaned (if applicable). The market value of securities loaned is determined daily and any additional required collateral is delivered to the Fund on the next business day. Cash collateral is generally invested in a money market fund registered under the 1940 Act that is managed by an affiliate of SSBT. Any gain or loss in the market price of the loaned securities that might occur and any interest earned or dividends declared during the term of the loan would accrue to the account of the Fund. Income earned on the investment of collateral, net of broker rebates and other expenses incurred by the securities lending agent, is split between the Fund and the
| 23 |
Table of Contents
Calvert
VP S&P 500 Index Portfolio
December 31, 2019
Notes to Financial Statements — continued
securities lending agent on the basis of agreed upon contractual terms.Non-cash collateral, if any, is held by the lending agent on behalf of the Fund and cannot be sold orre-pledged by the Fund; accordingly, such collateral is not reflected in the Statement of Assets and Liabilities.
The risks associated with lending portfolio securities include, but are not limited to, possible delays in receiving additional collateral or in the recovery of the loaned securities, possible loss of rights to the collateral should the borrower fail financially, as well as risk of loss in the value of the collateral or the value of the investments made with the collateral. The securities lending agent shall indemnify the Fund in the case of default of any securities borrower.
At December 31, 2019, the total value of securities on loan was $3,235,608 and the total value of collateral received was $3,296,667, comprised of U.S. government and/or agencies securities.
The following table provides a breakdown of securities lending transactions accounted for as secured borrowings, the obligations by class of collateral pledged, and the remaining contractual maturity of those transactions as of December 31, 2019.
| Remaining Contractual Maturity of the Transactions | ||||||||||||||||||||
| Overnight and Continuous | <30 days | 30 to 90 days | >90 days | Total | ||||||||||||||||
Securities Lending Transactions | ||||||||||||||||||||
Common Stocks | $ | 3,296,667 | $ | — | $ | — | $ | — | $ | 3,296,667 | ||||||||||
8 Line of Credit
Effective October 29, 2019, the Fund participates with other portfolios and funds managed by EVM and its affiliates, including CRM, in an $800 million unsecured line of credit with a group of banks, which is in effect through October 27, 2020. Borrowings are made by the Fund solely to facilitate the handling of unusual and/or unanticipated short-term cash requirements. Interest is charged to the Fund based on its borrowings at an amount above either the Eurodollar rate or Federal Funds rate. In addition, a fee computed at an annual rate of 0.15% on the daily unused portion of the line of credit is allocated among the participating portfolios and funds at the end of each quarter. Because the line of credit is not available exclusively to the Fund, it may be unable to borrow some or all of its requested amounts at any particular time.
Prior to October 29, 2019, the Fund participated with other funds managed by CRM in a $100 million ($62.5 million prior to June 21, 2019) committed line of credit agreement with SSBT, which was terminated by the Calvert funds. Borrowings bore interest at the higher of theone-month London Interbank Offered Rate (LIBOR) in effect that day or the overnight Federal Funds rate, plus 1.00% per annum. A commitment fee of 0.20% per annum was incurred on the unused portion of the committed facility, which was allocated to all participating funds.
The Fund had no borrowings pursuant to its lines of credit during the year ended December 31, 2019.
9 Capital Shares
The Corporation may issue its shares in one or more series (such as the Fund). The authorized shares of the Fund consist of 30,000,000 common shares, $0.10 par value.
Transactions in capital shares for the years ended December 31, 2019 and December 31, 2018 were as follows:
| Year Ended December 31, 2019 | Year Ended December 31, 2018 | |||||||||||||||
| Shares | Amount | Shares | Amount | |||||||||||||
Shares sold | 117,188 | $ | 16,294,985 | 94,820 | $ | 13,407,566 | ||||||||||
Reinvestment of distributions | 272,678 | 35,862,644 | 275,378 | 39,153,308 | ||||||||||||
Shares redeemed | (459,343 | ) | (65,019,352 | ) | (842,048 | ) | (120,126,425 | ) | ||||||||
Net decrease | (69,477 | ) | $ | (12,861,723 | ) | (471,850 | ) | $ | (67,565,551 | ) | ||||||
At December 31, 2019, separate accounts of an insurance company that is an affiliate of AIP owned 90.9% of the value of the outstanding shares of the Fund.
| 24 |
Table of Contents
Calvert
VP S&P 500 Index Portfolio
December 31, 2019
Report of Independent Registered Public Accounting Firm
To the Shareholders and Board of Directors
Calvert Variable Products, Inc.:
Opinion on the Financial Statements
We have audited the accompanying statement of assets and liabilities of Calvert VP S&P 500 Index Portfolio (the Fund), a series of Calvert Variable Products, Inc., including the schedule of investments, as of December 31, 2019, the related statement of operations for the year then ended, the statements of changes in net assets for each of the years in thetwo-year period then ended, and the related notes (collectively, the financial statements) and the financial highlights for each of the years in thefive-year period then ended. In our opinion, the financial statements and financial highlights present fairly, in all material respects, the financial position of the Fund as of December 31, 2019, the results of its operations for the year then ended, the changes in its net assets for each of the years in thetwo-year period then ended, and the financial highlights for each of the years in thefive-year period then ended, in conformity with U.S. generally accepted accounting principles.
Basis for Opinion
These financial statements and financial highlights are the responsibility of the Fund’s management. Our responsibility is to express an opinion on these financial statements and financial highlights based on our audits. We are a public accounting firm registered with the Public Company Accounting Oversight Board (United States) (PCAOB) and are required to be independent with respect to the Fund in accordance with the U.S. federal securities laws and the applicable rules and regulations of the Securities and Exchange Commission and the PCAOB.
We conducted our audits in accordance with the standards of the PCAOB. Those standards require that we plan and perform the audit to obtain reasonable assurance about whether the financial statements and financial highlights are free of material misstatement, whether due to error or fraud. Our audits included performing procedures to assess the risks of material misstatement of the financial statements and financial highlights, whether due to error or fraud, and performing procedures that respond to those risks. Such procedures included examining, on a test basis, evidence regarding the amounts and disclosures in the financial statements and financial highlights. Such procedures also included confirmation of securities owned as of December 31, 2019, by correspondence with the custodian and brokers. Our audits also included evaluating the accounting principles used and significant estimates made by management, as well as evaluating the overall presentation of the financial statements and financial highlights. We believe that our audits provide a reasonable basis for our opinion.

We have served as the auditor of one or more of the Calvert Funds since 2002.
Philadelphia, Pennsylvania
February 19, 2020
| 25 |
Table of Contents
Calvert
VP S&P 500 Index Portfolio
December 31, 2019
Federal Tax Information (Unaudited)
As required by the Internal Revenue Code and/or regulations, shareholders must be notified regarding the status of the dividends received deduction for corporations and capital gains dividends.
Dividends Received Deduction.Corporate shareholders are generally entitled to take the dividends received deduction on the portion of the Fund’s dividend distribution that qualifies under tax law. For the Fund’s fiscal 2019 ordinary income dividends, 99.39% qualifies for the corporate dividends received deduction.
Capital Gains Dividends.The Fund hereby designates as a capital gain dividend with respect to the taxable year ended December 31, 2019, $12,808,320 or, if subsequently determined to be different, the net capital gain of such year.
| 26 |
Table of Contents
Calvert
VP S&P 500 Index Portfolio
December 31, 2019
Fund Management.The Directors of Calvert Variable Products, Inc. (the Corporation) are responsible for the overall management and supervision of the Corporation’s affairs. The Directors and officers of the Corporation are listed below. Except as indicated, each individual has held the office shown or other offices in the same company for the last five years. Each Board member holds office until his or her successor is elected and qualified, or until his or her earlier death, resignation, retirement, removal or disqualification. Under the terms of the Fund’s current Board member retirement policy, an Independent Board member must retire at the end of the calendar year in which he or she turns 75. However, if such retirement would cause the Fund to be out of compliance with Section 16 of the 1940 Act or any other regulations or guidance of the SEC, then such retirement and resignation will not become effective until such time as action has been taken for the Fund to be in compliance upon a Board member’s retirement. The “Independent Directors” consist of those Directors who are not “interested persons” of the Corporation, as that term is defined under the 1940 Act. The business address of each Director and officer, with the exception of Ms. Gemma and Mr. Kirchner, is 1825 Connecticut Avenue NW, Suite 400, Washington, DC 20009. As used below, “CRM” refers to Calvert Research and Management. Each Director oversees 39 funds in the Calvert fund complex. Each officer serves as an officer of certain other Calvert funds.
| Name and Year of Birth | Position with the | Position Start Date | Principal Occupation(s) and Directorships During Past Five Years and Other Relevant Experience | |||
| Interested Director | ||||||
John H. Streur(1) 1960 | Director and President | 2015 | President and Chief Executive Officer of Calvert Research and Management (since December 31, 2016). President and Chief Executive Officer of Calvert Investments, Inc. (January 2015-December 2016); Chief Executive Officer of Calvert Investment Distributors, Inc. (August 2015-December 2016); Chief Compliance Officer of Calvert Investment Management, Inc. (August 2015-April 2016); President and Director, Portfolio 21 Investments, Inc. (through October 2014); President, Chief Executive Officer and Director, Managers Investment Group LLC (through January 2012); President and Director, The Managers Funds and Managers AMG Funds (through January 2012). Other Directorships in the Last Five Years.Portfolio 21 Investments, Inc. (asset management) (through October 2014); Managers Investment Group LLC (asset management) (through January 2012); The Managers Funds (asset management) (through January 2012); Managers AMG Funds (asset management) (through January 2012); Calvert Impact Capital, Inc. | |||
| Independent Directors | ||||||
Richard L. Baird, Jr. 1948 | Director | 2016 | Regional Disaster Recovery Lead, American Red Cross of Greater Pennsylvania (since 2017). Volunteer, American Red Cross (since 2015). Former President and CEO of Adagio Health Inc. (retired in 2014) in Pittsburgh, PA. Other Directorships in the Last Five Years. None. | |||
Alice Gresham Bullock 1950 | Chair and Director | 2016 (Chair); 2008 (Director) | Professor Emerita at Howard University School of Law. Dean Emerita of Howard University School of Law and Deputy Director of the Association of American Law Schools (1992-1994). Other Directorships in the Last Five Years. None. | |||
Cari M. Dominguez 1949 | Director | 2016 | Former Chair of the U.S. Equal Employment Opportunity Commission. Other Directorships in the Last Five Years. Manpower, Inc. (employment agency); Triple S Management Corporation (managed care); National Association of Corporate Directors. | |||
John G. Guffey, Jr.(2) 1948 | Director | 2016 | President of Aurora Press Inc., a privately held publisher of trade paperbacks (since January 1997). Other Directorships in the Last Five Years. Calvert Impact Capital, Inc. (through December 31, 2018); Calvert Ventures, LLC. | |||
Miles D. Harper, III 1962 | Director | 2016 | Partner, Carr Riggs & Ingram (public accounting firm) since October 2014. Partner, Gainer Donnelly & Desroches (public accounting firm) (now Carr Riggs & Ingram), November 1999-September 2014). Other Directorships in the Last Five Years.Bridgeway Funds (9) (asset management). | |||
Joy V. Jones 1950 | Director | 2016 | Attorney. Other Directorships in the Last Five Years.Conduit Street Restaurants SUD 2 Limited; Palm Management Restaurant Corporation. | |||
| 27 |
Table of Contents
Calvert
VP S&P 500 Index Portfolio
December 31, 2019
Management and Organization — continued
| Name and Year of Birth | Position with the | Position Start Date | Principal Occupation(s) and Directorships During Past Five Years and Other Relevant Experience | |||
| Independent Directors (continued) | ||||||
Anthony A. Williams 1951 | Director | 2016 | CEO and Executive Director of the Federal City Council (July 2012 to present); Senior Adviser and Independent Consultant for King and Spalding LLP (September 2015 to present); Executive Director of Global Government Practice at the Corporate Executive Board (January 2010 to January 2012). Other Directorships in the Last Five Years. Freddie Mac; Evoq Properties/ Meruelo Maddux Properties, Inc. (real estate management); Weston Solutions, Inc. (environmental services); Bipartisan Policy Center’s Debt Reduction Task Force; Chesapeake Bay Foundation; Catholic University of America; Urban Institute (research organization). | |||
| Name and Year of Birth | Position(s) with the Corporation | Position Start Date | Principal Occupation(s) During Past Five Years | |||
| Principal Officers who are not Directors | ||||||
Hope L. Brown 1973 | Chief Compliance Officer | 2014 | Chief Compliance Officer of 39 registered investment companies advised by CRM (since 2014). Vice President and Chief Compliance Officer, Wilmington Funds (2012-2014). | |||
Maureen A. Gemma(3) 1960 | Vice President, Secretary and Chief Legal Officer | 2016 | Vice President of CRM and officer of 39 registered investment companies advised by CRM (since 2016). Also Vice President of Eaton Vance and certain of its affiliates and officer of 159 registered investment companies advised or administered by Eaton Vance. | |||
James F. Kirchner(3) 1967 | Treasurer | 2016 | Vice President of CRM and officer of 39 registered investment companies advised by CRM (since 2016). Also Vice President of Eaton Vance and certain of its affiliates and officer of 159 registered investment companies advised or administered by Eaton Vance. | |||
| (1) | Mr. Streur is an interested person of the Fund because of his positions with the Fund’s adviser and certain affiliates. |
| (2) | Mr. Guffey is currently married to Rebecca L. Adamson, who served as a member of the Advisory Council through December 31, 2019. |
| (3) | The business address for Ms. Gemma and Mr. Kirchner is Two International Place, Boston, MA 02110. |
The SAI for the Fund includes additional information about the Directors and officers of the Fund and can be obtained without charge on Calvert’s website at www.calvert.com or by calling1-800-368-2745.
| 28 |
Table of Contents
Calvert Funds
Privacy. The Eaton Vance organization is committed to ensuring your financial privacy. Each entity listed below has adopted a privacy policy and procedures (“Privacy Program”) Eaton Vance believes is reasonably designed to protect your personal information and to govern when and with whom Eaton Vance may share your personal information.
| • | At the time of opening an account, Eaton Vance generally requires you to provide us with certain information such as name, address, social security number, tax status, account numbers, and account balances. This information is necessary for us to both open an account for you and to allow us to satisfy legal requirements such as applicable anti-money laundering reviews and know-your-customer requirements. |
| • | On an ongoing basis, in the normal course of servicing your account, Eaton Vance may share your information with unaffiliated third parties that perform various services for Eaton Vance and/or your account. These third parties include transfer agents, custodians, broker/dealers and our professional advisers, including auditors, accountants, and legal counsel. Eaton Vance may additionally share your personal information with our affiliates. |
| • | We believe our Privacy Program is reasonably designed to protect the confidentiality of your personal information and to prevent unauthorized access to that information. |
| • | We reserve the right to change our Privacy Program at any time upon proper notification to you. You may want to review our Privacy Program periodically for changes by accessing the link on our homepage: www.eatonvance.com. |
Our pledge of protecting your personal information applies to the following entities within the Eaton Vance organization: the Eaton Vance Family of Funds, Eaton Vance Management, Eaton Vance Investment Counsel, Eaton Vance Distributors, Inc., Eaton Vance Trust Company, Eaton Vance Management (International) Limited, Eaton Vance Advisers International Limited, Eaton Vance Global Advisors Limited, Eaton Vance Management’s Real Estate Investment Group, Boston Management and Research, Calvert Research and Management, and Calvert Funds. This Privacy Notice supersedes all previously issued privacy disclosures. For more information about our Privacy Program or about how your personal information may be used, please call 1-800-368-2745.
Delivery of Shareholder Documents. The Securities and Exchange Commission (SEC) permits funds to deliver only one copy of shareholder documents, including prospectuses, proxy statements and shareholder reports, to fund investors with multiple accounts at the same residential or post office box address. This practice is often called “householding” and it helps eliminate duplicate mailings to shareholders.Calvert funds, or your financial intermediary, may household the mailing of your documents indefinitely unless you instruct Calvert funds, or your financial intermediary, otherwise. If you would prefer that your Calvert fund documents not be householded, please contact Calvert fundsat 1-800-368-2745, or contact your financial intermediary. Your instructions that householding not apply to delivery of your Calvert fund documents will typically be effective within 30 days of receipt by Calvert funds or your financial intermediary. Separate statements will be generated for each separate account and will be householded as described above.
Portfolio Holdings. Each Calvert fund files a schedule of portfolio holdings on Part F to Form N-PORT with the SEC for the first and third quarters of each fiscal year. The Form N-PORT will be available on the Calvert funds’ website at www.calvert.com, by calling Calvert fundsat 1-800-368-2745 or in the EDGAR database on the SEC’s website at www.sec.gov.
Proxy Voting. The Proxy Voting Guidelines that each Calvert fund uses to determine how to vote proxies relating to portfolio securities is provided as an Appendix to the fund’s Statement of Additional Information. The Statement of Additional Information can be obtained free of charge by calling the Calvert funds at 1-800-368-2745, by visiting the Calvert funds’ website at www.calvert.com or visiting the SEC’s website at www.sec.gov. Information regarding how a Calvert fund voted proxies relating to portfolio securities during the most recent 12-month period ended June 30 is available by calling Calvert funds, by visiting the Calvert funds’ website at www.calvert.com or by visiting the SEC’s website at www.sec.gov.
| 29 |
Table of Contents
This Page Intentionally Left Blank
Table of Contents
This Page Intentionally Left Blank
Table of Contents
This Page Intentionally Left Blank
Table of Contents
Investment Adviser and Administrator
Calvert Research and Management
1825 Connecticut Avenue NW, Suite 400
Washington, DC 20009
Investment Sub-Adviser
Ameritas Investment Partners, Inc.
5945 R Street
Lincoln, NE 68505
Principal Underwriter*
Eaton Vance Distributors, Inc.
Two International Place
Boston, MA 02110
(617)482-8260
Custodian
State Street Bank and Trust Company
State Street Financial Center, One Lincoln Street
Boston, MA 02111
Transfer Agent
DST Asset Manager Solutions, Inc.
2000 Crown Colony Drive
Quincy, MA 02169
Independent Registered Public Accounting Firm
KPMG LLP
1601 Market Street
Philadelphia, PA 19103-2499
Fund Offices
1825 Connecticut Avenue NW, Suite 400
Washington, DC 20009
| * | FINRA BrokerCheck. Investors may check the background of their Investment Professional by contacting the Financial Industry Regulatory Authority (FINRA). FINRA BrokerCheck is a free tool to help investors check the professional background of current and former FINRA-registered securities firms and brokers. FINRA BrokerCheck is available by calling1-800-289-9999 and at www.FINRA.org. The FINRA BrokerCheck brochure describing this program is available to investors at www.FINRA.org. |
Table of Contents
Printed on recycled paper.

24221 12.31.19
Table of Contents

Calvert
VP Nasdaq 100 Index Portfolio
Annual Report
December 31, 2019
Important Note. Beginning on January 1, 2021, as permitted by regulations adopted by the Securities and Exchange Commission, you may not receive paper copies of the Fund’s annual and semi-annual shareholder reports from the insurance company or plan sponsor unless you specifically request paper copies. Instead, the reports will be made available on a website and you will be notified by mail each time a report is posted and provided with a website address to access the report. Instructions for requesting paper copies will be provided by the insurance company, plan sponsor or your financial intermediary, as applicable. Please contact the insurance company, plan sponsor or your financial intermediary, as applicable, or follow instructions included with this disclosure, if any, for more information.

Table of Contents
Commodity Futures Trading Commission Registration. Effective December 31, 2012, the Commodity Futures Trading Commission (“CFTC”) adopted certain regulatory changes that subject registered investment companies and advisers to regulation by the CFTC if a fund invests more than a prescribed level of its assets in certain CFTC-regulated instruments (including futures, certain options and swap agreements) or markets itself as providing investment exposure to such instruments. The Fund and its adviser have claimed an exclusion from the definition of the term “commodity pool operator” under the Commodity Exchange Act. Accordingly, neither the Fund nor the adviser is subject to CFTC regulation.
Fund shares are not insured by the FDIC and are not deposits or other obligations of, or guaranteed by, any depository institution. Shares are subject to investment risks, including possible loss of principal invested.
This report must be preceded or accompanied by a current summary prospectus or prospectus. Before investing, investors should consider carefully the investment objective, risks, and charges and expenses of a mutual fund. This and other important information is contained in the summary prospectus and prospectus, which can be obtained from a financial intermediary. Prospective investors should read the prospectus carefully before investing. For further information, please call1-800-368-2745.
Table of Contents
Annual Report December 31, 2019
Calvert
VP Nasdaq 100 Index Portfolio
Table of Contents
Calvert
VP Nasdaq 100 Index Portfolio
December 31, 2019
Management’s Discussion of Fund Performance 1
Economic and Market Conditions
With virtually every U.S. equity index posting strong double-digit returns for the12-month period ended December 31, 2019 — and bond markets solidly in the black as well — 2019 was a good year for investments.
As the new year dawned in January 2019, investors appeared to be taking a “glass is half full” approach. Although U.S. manufacturing output and business investment remained weak — held back by slowing global growth and anon-again/off-again U.S.-China trade war — strong spending by U.S. consumers and dovish remarks by the U.S. Federal Reserve (the Fed) combined to lift investor sentiment. After four federal funds rate hikes the previous year, markets began to project the Fed might actually lower rates in 2019 to stimulate the economy. U.S. unemployment, meanwhile, remained low and hiring remained strong.
As a result, U.S. stocks across multiple markets climbed from January through April 2019. Overseas, central banks around the world began to cut interest rates and employ other tools to stimulate their respective economies. Even a global stock pullback in May — sparked by heightened concerns about the U.S.-China trade spat — proved to be temporary, and the U.S. and global stock rallies resumed in June and July.
After holding interest rates steady through the first half of the year, the Fed cut the federal funds rate on July 31, 2019 — its first reduction in over a decade — followed by two additional rate cuts in September and October to end the period at1.50%-1.75%. By end of the third quarter, 60 central banks around the world had lowered their interest rates as well.
After falling in August, U.S. equities rallied again during the final months of the period, spurred by optimism about a U.S.-China trade détente and better-than-expected U.S. employment reports. The year ended with two events in December that did much to allay investor concerns about international trade and tariffs: passage of the United States-Mexico-Canada Agreement by the U.S. House of Representatives and the Trump administration’s agreement to aso-called “phase–one” trade deal with China.
During the12-month period ended December 31, 2019, the blue-chip Dow Jones Industrial Average®2 returned 25.34%, while the broader U.S. equity market, as measured by the S&P 500® Index, returned 31.49%. The technology-laden Nasdaq Composite Index returned 36.69% during the period.Large-cap U.S. stocks, as measured by the S&P 500® Index, generally outperformed theirsmall-cap counterparts, as measured by the Russell 2000® Index. As a group, growth stocks outpaced value stocks in both large- andsmall-cap categories, as measured by the Russell growth and value indexes.
Investment Strategy
As an index fund, Calvert VP Nasdaq 100 Index Portfolio (the Fund) seeks to replicate, as closely as possible, the holdings and match the performance of theNASDAQ-100® Index (the Index). The Fund seeks to accomplish this by employing a passive management approach and holding each constituent of the Index in approximately the same proportion as the Index. The Fund may also invest in exchange-traded funds (ETFs) that provide the same exposure to the index. Cash holdings may gain exposure to the Index via futures contracts, allowing the Fund’s assets to be fully invested.
Fund Performance
For the12-month period ended December 31, 2019, the Fund returned 38.77% for Class I shares at net asset value (NAV). By comparison, the Index returned 39.46% for the same period. The Index is unmanaged and returns do not reflect any fees and operating expenses.
The Index outperformed most other stock indexes in 2019 as it was heavily skewed to the technology sector, the best-performing market sector during the period. The Index had no energy exposure, the worst-performing market sector during the period.
Futures contracts, which are regularly used to manage uninvested cash holdings in the Fund, had a meaningful positive impact on performance during the period.
See Endnotes and Additional Disclosures in this report.
Past performance is no guarantee of future results. Returns are historical and are calculated by determining the percentage change in net asset value (NAV) or offering price (as applicable) with all distributions reinvested. Investment return and principal value will fluctuate so that shares, when redeemed, may be worth more or less than their original cost. Performance for periods less than or equal to one year is cumulative. Performance is for the stated time period only; due to market volatility, current Fund performance may be lower or higher than the quoted return.
| 2 |
Table of Contents
Calvert
VP Nasdaq 100 Index Portfolio
December 31, 2019
Portfolio Manager Kevin L. Keene, CFA of Ameritas Investment Partners, Inc.
| % Average Annual Total Returns 2,3 | Class Inception Date | Performance Inception Date | One Year | Five Years | Ten Years | |||||||||||||||
Class I at NAV | 04/27/2000 | 04/27/2000 | 38.77 | % | 16.27 | % | 17.39 | % | ||||||||||||
Class F at NAV | 10/30/2015 | 04/27/2000 | 38.44 | 16.02 | 17.26 | |||||||||||||||
| ||||||||||||||||||||
Nasdaq-100® Index | — | — | 39.46 | % | 16.90 | % | 18.06 | % | ||||||||||||
| % Total Annual Operating Expense Ratios 4 | Class I | Class F | ||||||||||||||||||
| Gross | 0.60 | % | 0.84 | % | ||||||||||||||||
| Net | 0.48 | 0.73 | ||||||||||||||||||
Growth of $10,000
This graph shows the change in value of a hypothetical investment of $10,000 in Class I of the Fund for the period indicated. For comparison, the same investment is shown in the indicated index.
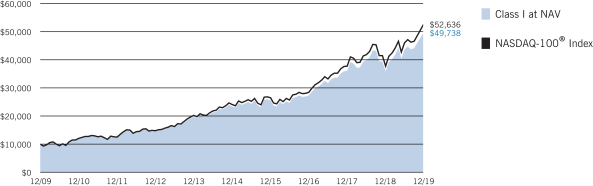
| Growth of Investment 3 | Amount Invested | Period Beginning | At NAV | With Maximum Sales Charge | ||||||||||||
| Class F | $10,000 | 12/31/2009 | $49,198 | N.A. | ||||||||||||
See Endnotes and Additional Disclosures in this report.
Past performance is no guarantee of future results. Returns are historical and are calculated by determining the percentage change in net asset value (NAV) or offering price (as applicable) with all distributions reinvested. Investment return and principal value will fluctuate so that shares, when redeemed, may be worth more or less than their original cost. Performance for periods less than or equal to one year is cumulative. Performance is for the stated time period only; due to market volatility, current Fund performance may be lower or higher than the quoted return.
| 3 |
Table of Contents
Calvert
VP Nasdaq 100 Index Portfolio
December 31, 2019
| Sector Allocation (% of net assets)5 | ||||
Information Technology | 45.8 | % | ||
Communication Services | 20.2 | |||
Consumer Discretionary | 14.2 | |||
Health Care | 7.0 | |||
Consumer Staples | 5.8 | |||
Industrials | 2.6 | |||
Exchange-Traded Funds | 1.8 | |||
Utilities | 0.9 | |||
Financials | 0.3 | |||
Total | 98.6 | % | ||
| Top 10 Holdings (% of net assets) 5 | ||||
Apple, Inc. | 11.2 | % | ||
Microsoft Corp. | 10.3 | |||
Amazon.com, Inc. | 7.9 | |||
Facebook, Inc., Class A | 4.2 | |||
Alphabet, Inc., Class A | 4.0 | |||
Alphabet, Inc., Class C | 4.0 | |||
Intel Corp. | 2.9 | |||
Comcast Corp., Class A | 2.2 | |||
Cisco Systems, Inc. | 2.2 | |||
PepsiCo, Inc. | 2.1 | |||
Total | 51.0 | % | ||
See Endnotes and Additional Disclosures in this report.
| 4 |
Table of Contents
Calvert
VP Nasdaq 100 Index Portfolio
December 31, 2019
Endnotes and Additional Disclosures
| 1 | The views expressed in this report are those of the portfolio manager(s) and are current only through the date stated at the top of this page. These views are subject to change at any time based upon market or other conditions, and Calvert and the Fund(s) disclaim any responsibility to update such views. These views may not be relied upon as investment advice and, because investment decisions are based on many factors, may not be relied upon as an indication of trading intent on behalf of any Calvert fund. This commentary may contain statements that are not historical facts, referred to as “forward looking statements.” The Fund’s actual future results may differ significantly from those stated in any forward looking statement, depending on factors such as changes in securities or financial markets or general economic conditions, the volume of sales and purchases of Fund shares, the continuation of investment advisory, administrative and service contracts, and other risks discussed from time to time in the Fund’s filings with the Securities and Exchange Commission. |
| 2 | Dow Jones Industrial Average® is a price-weighted average of 30 blue-chip stocks that are generally the leaders in their industry. S&P 500® Index is an unmanaged index of large-cap stocks commonly used as a measure of U.S. stock market performance. S&P Dow Jones Indices are a product of S&P Dow Jones Indices LLC (“S&P DJI”) and have been licensed for use. S&P® and S&P 500® are registered trademarks of S&P DJI; Dow Jones® is a registered trademark of Dow Jones Trademark Holdings LLC (“Dow Jones”); S&P DJI, Dow Jones and their respective affiliates do not sponsor, endorse, sell or promote the Fund, will not have any liability with respect thereto and do not have any liability for any errors, omissions, or interruptions of the S&P Dow Jones Indices. Nasdaq Composite Index is a market capitalization-weighted index of all domestic and international securities listed on Nasdaq. NASDAQ–100® Index includes 100 of the largest domestic and international securities (by market cap), excluding financials, listed on Nasdaq. Source: Nasdaq, Inc. The information is provided by Nasdaq (with its affiliates, are referred to as the “Corporations”) and Nasdaq’s third party licensors on an “as is” basis and the Corporations make no guarantees and bear no liability of any kind with respect to the information or the Fund. Russell 2000® Index is an unmanaged index of 2,000 U.S. small-cap stocks. Unless otherwise stated, index returns do not reflect the effect of any applicable sales charges, commissions, expenses, taxes or leverage, as applicable. It is not possible to invest directly in an index. |
| 3 | There is no sales charge. Insurance-related charges are not included in the calculation of returns. If such charges were reflected, the returns would be lower. Please refer to the report for your insurance contract for performance data reflecting insurance-related charges. |
Performance prior to the inception date of a class may be linked to the performance of an older class of the Fund. This linked performance is adjusted for any applicable sales charge, but is not adjusted for class expense differences. If adjusted for such differences, the performance would be different. The performance of Class F is linked to Class I. Performance presented in the Financial Highlights included in the financial statements is not linked. |
Calvert Research and Management became the investment adviser to the Fund on December 31, 2016. Performance reflected prior to such date is that of the Fund’s former investment adviser. |
| 4 | Source: Fund prospectus. Net expense ratios reflect a contractual expense reimbursement that continues through 4/30/20. Without the reimbursement, performance would have been lower. The expense ratios for the current reporting period can be found in the Financial Highlights section of this report. |
| 5 | Excludes cash and cash equivalents. |
| 5 |
Table of Contents
Calvert
VP Nasdaq 100 Index Portfolio
December 31, 2019
Example
As a Fund shareholder, you incur ongoing costs, including management fees; distribution and/or service fees; and other Fund expenses. This Example is intended to help you understand your ongoing costs (in dollars) of Fund investing and to compare these costs with the ongoing costs of investing in other mutual funds. The Example is based on an investment of $1,000 invested at the beginning of the period and held for the entire period (July 1, 2019 to December 31, 2019).
Actual Expenses
The first section of the table below provides information about actual account values and actual expenses. You may use the information in this section, together with the amount you invested, to estimate the expenses that you paid over the period. Simply divide your account value by $1,000 (for example, an $8,600 account value divided by $1,000 = 8.6), then multiply the result by the number in the first section under the heading entitled “Expenses Paid During Period” to estimate the expenses you paid on your account during this period.
Hypothetical Example for Comparison Purposes
The second section of the table below provides information about hypothetical account values and hypothetical expenses based on the actual Fund expense ratio and an assumed rate of return of 5% per year (before expenses), which is not the actual Fund return. The hypothetical account values and expenses may not be used to estimate the actual ending account balance or expenses you paid for the period. You may use this information to compare the ongoing costs of investing in the Fund and other funds. To do so, compare this 5% hypothetical example with the 5% hypothetical examples that appear in the shareholder reports of the other funds.
Please note that the expenses shown in the table are meant to highlight your ongoing costs only and do not reflect expenses and charges which are, or may be imposed under the variable annuity contract or variable life insurance policy (variable contracts) (if applicable) through which your investment in the Fund is made. Therefore, the second section of the table is useful in comparing ongoing costs associated with an investment in vehicles which fund benefits under variable contracts, and will not help you determine the relative total costs of investing in the Fund through variable contracts. In addition, if these expenses and charges imposed under the variable contracts were included, your costs would have been higher.
| Beginning Account Value (7/1/19) | Ending Account Value (12/31/19) | Expenses Paid During Period* (7/1/19 – 12/31/19) | Annualized Expense Ratio | |||||||||||||
Actual | ||||||||||||||||
Class I | $ | 1,000.00 | $ | 1,141.50 | $ | 2.59 | ** | 0.48 | % | |||||||
Class F | $ | 1,000.00 | $ | 1,140.20 | $ | 3.94 | ** | 0.73 | % | |||||||
Hypothetical | ||||||||||||||||
(5% return per year before expenses) | ||||||||||||||||
Class I | $ | 1,000.00 | $ | 1,022.79 | $ | 2.45 | ** | 0.48 | % | |||||||
Class F | $ | 1,000.00 | $ | 1,021.53 | $ | 3.72 | ** | 0.73 | % | |||||||
| * | Expenses are equal to the Fund’s annualized expense ratio for the indicated Class, multiplied by the average account value over the period, multiplied by 184/365 (to reflect theone-half year period). The Example assumes that the $1,000 was invested at the net asset value per share determined at the close of business on June 30, 2019. Expenses shown do not include insurance-related charges. |
| ** | Absent a waiver and/or reimbursement of expenses by an affiliate, expenses would be higher. |
| 6 |
Table of Contents
Calvert
VP Nasdaq 100 Index Portfolio
December 31, 2019
| Common Stocks — 96.6% |
| |||||||
| Security | Shares | Value | ||||||
| Airlines — 0.4% | ||||||||
American Airlines Group, Inc.(1) | 8,730 | $ | 250,376 | |||||
United Airlines Holdings, Inc. (2) | 5,043 | 444,238 | ||||||
| $ | 694,614 | |||||||
| Automobiles — 0.8% | ||||||||
Tesla, Inc. (2) | 3,592 | $ | 1,502,641 | |||||
| Beverages — 2.5% | ||||||||
Monster Beverage Corp. (2) | 10,715 | $ | 680,938 | |||||
PepsiCo, Inc. | 27,790 | 3,798,060 | ||||||
| $ | 4,478,998 | |||||||
| Biotechnology — 5.0% | ||||||||
Alexion Pharmaceuticals, Inc. (2) | 4,410 | $ | 476,941 | |||||
Amgen, Inc. | 11,842 | 2,854,751 | ||||||
Biogen, Inc. (2) | 3,596 | 1,067,041 | ||||||
BioMarin Pharmaceutical, Inc. (2) | 3,580 | 302,689 | ||||||
Gilead Sciences, Inc. | 25,213 | 1,638,341 | ||||||
Incyte Corp. (2) | 4,293 | 374,865 | ||||||
Regeneron Pharmaceuticals, Inc. (2) | 2,151 | 807,657 | ||||||
Seattle Genetics, Inc. (2) | 3,416 | 390,312 | ||||||
Vertex Pharmaceuticals, Inc. (2) | 5,125 | 1,122,119 | ||||||
| $ | 9,034,716 | |||||||
| Commercial Services & Supplies — 0.5% | ||||||||
Cintas Corp. | 2,063 | $ | 555,112 | |||||
Copart, Inc. (2) | 4,633 | 421,325 | ||||||
| $ | 976,437 | |||||||
| Communications Equipment — 2.2% | ||||||||
Cisco Systems, Inc. | 84,544 | $ | 4,054,730 | |||||
| Electric Utilities — 0.9% | ||||||||
Exelon Corp. | 19,373 | $ | 883,215 | |||||
Xcel Energy, Inc. | 10,687 | 678,518 | ||||||
| $ | 1,561,733 | |||||||
| Electronic Equipment, Instruments & Components — 0.2% | ||||||||
CDW Corp. | 2,863 | $ | 408,951 | |||||
| Entertainment — 2.8% | ||||||||
Activision Blizzard, Inc. | 15,311 | $ | 909,780 | |||||
| Security | Shares | Value | ||||||
| Entertainment (continued) | ||||||||
Electronic Arts, Inc. (2) | 5,819 | $ | 625,601 | |||||
NetEase, Inc. ADR | 1,454 | 445,855 | ||||||
Netflix, Inc. (2) | 8,734 | 2,826,060 | ||||||
Take-Two Interactive Software, Inc. (2) | 2,259 | 276,569 | ||||||
| $ | 5,083,865 | |||||||
| Food & Staples Retailing — 2.0% | ||||||||
Costco Wholesale Corp. | 8,804 | $ | 2,587,672 | |||||
Walgreens Boots Alliance, Inc. | 17,788 | 1,048,780 | ||||||
| $ | 3,636,452 | |||||||
| Food Products — 1.3% | ||||||||
Kraft Heinz Co. (The) | 24,337 | $ | 781,948 | |||||
Mondelez International, Inc., Class A | 28,694 | 1,580,465 | ||||||
| $ | 2,362,413 | |||||||
| Health Care Equipment & Supplies — 1.2% | ||||||||
Align Technology, Inc. (2) | 1,571 | $ | 438,372 | |||||
IDEXX Laboratories, Inc. (2) | 1,710 | 446,532 | ||||||
Intuitive Surgical, Inc. (2) | 2,303 | 1,361,419 | ||||||
| $ | 2,246,323 | |||||||
| Health Care Technology — 0.3% | ||||||||
Cerner Corp. | 6,260 | $ | 459,421 | |||||
| Hotels, Restaurants & Leisure — 1.7% | ||||||||
Marriott International, Inc., Class A | 6,516 | $ | 986,718 | |||||
Starbucks Corp. | 23,536 | 2,069,285 | ||||||
| $ | 3,056,003 | |||||||
| Insurance — 0.3% | ||||||||
Willis Towers Watson PLC | 2,562 | $ | 517,370 | |||||
| Interactive Media & Services — 12.5% | ||||||||
Alphabet, Inc., Class A (2) | 5,371 | $ | 7,193,864 | |||||
Alphabet, Inc., Class C (2) | 5,367 | 7,175,786 | ||||||
Baidu, Inc. ADR (2) | 5,510 | 696,464 | ||||||
Facebook, Inc., Class A (2) | 37,597 | 7,716,784 | ||||||
| $ | 22,782,898 | |||||||
| Internet & Direct Marketing Retail — 10.2% | ||||||||
Amazon.com, Inc. (2) | 7,746 | $ | 14,313,369 | |||||
Booking Holdings, Inc. (2) | 834 | 1,712,811 | ||||||
| 7 | See Notes to Financial Statements. |
Table of Contents
Calvert
VP Nasdaq 100 Index Portfolio
December 31, 2019
Schedule of Investments — continued
| Security | Shares | Value | ||||||
| Internet & Direct Marketing Retail (continued) | ||||||||
eBay, Inc. | 16,213 | $ | 585,451 | |||||
Expedia Group, Inc. | 2,777 | 300,305 | ||||||
JD.com, Inc. ADR (2) | 18,473 | 650,804 | ||||||
MercadoLibre, Inc. (2) | 991 | 566,792 | ||||||
Trip.com Group, Ltd. ADR (2) | 10,422 | 349,554 | ||||||
| $ | 18,479,086 | |||||||
| IT Services — 4.0% | ||||||||
Automatic Data Processing, Inc. | 8,623 | $ | 1,470,222 | |||||
Cognizant Technology Solutions Corp., Class A | 10,912 | 676,762 | ||||||
Fiserv, Inc. (2) | 13,550 | 1,566,787 | ||||||
Paychex, Inc. | 7,133 | 606,733 | ||||||
PayPal Holdings, Inc. (2) | 23,401 | 2,531,286 | ||||||
VeriSign, Inc. (2) | 2,340 | 450,871 | ||||||
| $ | 7,302,661 | |||||||
| Life Sciences Tools & Services — 0.5% | ||||||||
Illumina, Inc. (2) | 2,930 | $ | 971,998 | |||||
| Machinery — 0.3% | ||||||||
PACCAR, Inc. | 6,893 | $ | 545,236 | |||||
| Media — 4.1% | ||||||||
Charter Communications, Inc., Class A (2) | 4,280 | $ | 2,076,143 | |||||
Comcast Corp., Class A | 90,474 | 4,068,616 | ||||||
Fox Corp., Class A | 7,065 | 261,900 | ||||||
Fox Corp., Class B (2) | 5,305 | 193,102 | ||||||
Liberty Global PLC, Class A (2) | 3,618 | 82,273 | ||||||
Liberty Global PLC, Class C (2) | 8,745 | 190,597 | ||||||
Sirius XM Holdings, Inc.(1) | 88,161 | 630,351 | ||||||
| $ | 7,502,982 | |||||||
| Multiline Retail — 0.3% | ||||||||
Dollar Tree, Inc. (2) | 4,716 | $ | 443,540 | |||||
| Professional Services — 0.5% | ||||||||
CoStar Group, Inc. (2) | 730 | $ | 436,759 | |||||
Verisk Analytics, Inc. | 3,266 | 487,744 | ||||||
| $ | 924,503 | |||||||
| Road & Rail — 0.6% | ||||||||
CSX Corp. | 15,591 | $ | 1,128,165 | |||||
| Security | Shares | Value | ||||||
| Semiconductors & Semiconductor Equipment — 12.9% | ||||||||
Advanced Micro Devices, Inc. (2) | 22,194 | $ | 1,017,817 | |||||
Analog Devices, Inc. | 7,340 | 872,286 | ||||||
Applied Materials, Inc. | 18,410 | 1,123,746 | ||||||
ASML Holding NV — NY Shares | 1,476 | 436,808 | ||||||
Broadcom, Inc. | 7,905 | 2,498,138 | ||||||
Intel Corp. | 86,691 | 5,188,456 | ||||||
KLA Corp. | 3,145 | 560,345 | ||||||
Lam Research Corp. | 2,891 | 845,328 | ||||||
Maxim Integrated Products, Inc. | 5,393 | 331,724 | ||||||
Microchip Technology, Inc.(1) | 4,763 | 498,781 | ||||||
Micron Technology, Inc. (2) | 22,062 | 1,186,494 | ||||||
NVIDIA Corp. | 12,197 | 2,869,954 | ||||||
NXP Semiconductors NV | 5,571 | 708,966 | ||||||
QUALCOMM, Inc. | 22,756 | 2,007,762 | ||||||
Skyworks Solutions, Inc. | 3,395 | 410,388 | ||||||
Texas Instruments, Inc. | 18,629 | 2,389,914 | ||||||
Xilinx, Inc. | 5,012 | 490,023 | ||||||
| $ | 23,436,930 | |||||||
| Software — 14.8% | ||||||||
Adobe, Inc. (2) | 9,647 | $ | 3,181,677 | |||||
ANSYS, Inc. (2) | 1,678 | 431,934 | ||||||
Autodesk, Inc. (2) | 4,376 | 802,821 | ||||||
Cadence Design Systems, Inc. (2) | 5,592 | 387,861 | ||||||
Check Point Software Technologies, Ltd. (2) | 3,034 | 336,653 | ||||||
Citrix Systems, Inc. | 2,595 | 287,785 | ||||||
Intuit, Inc. | 5,188 | 1,358,893 | ||||||
Microsoft Corp. | 119,186 | 18,795,632 | ||||||
Splunk, Inc. (2) | 3,016 | 451,706 | ||||||
Synopsys, Inc. (2) | 2,995 | 416,904 | ||||||
Workday, Inc., Class A (2) | 3,268 | 537,423 | ||||||
| $ | 26,989,289 | |||||||
| Specialty Retail — 1.0% | ||||||||
O’Reilly Automotive, Inc. (2) | 1,508 | $ | 660,896 | |||||
Ross Stores, Inc. | 7,209 | 839,272 | ||||||
Ulta Beauty, Inc. (2) | 1,173 | 296,933 | ||||||
| $ | 1,797,101 | |||||||
| Technology Hardware, Storage & Peripherals — 11.6% | ||||||||
Apple, Inc. | 69,418 | $ | 20,384,596 | |||||
NetApp, Inc. | 4,553 | 283,424 | ||||||
Western Digital Corp. | 5,927 | 376,187 | ||||||
| $ | 21,044,207 | |||||||
| 8 | See Notes to Financial Statements. |
Table of Contents
Calvert
VP Nasdaq 100 Index Portfolio
December 31, 2019
Schedule of Investments — continued
| Security | Shares | Value | ||||||
| Textiles, Apparel & Luxury Goods — 0.3% | ||||||||
lululemon Athletica, Inc. (2) | 2,454 | $ | 568,518 | |||||
| Trading Companies & Distributors — 0.2% | ||||||||
Fastenal Co. | 11,430 | $ | 422,339 | |||||
| Wireless Telecommunication Services — 0.7% | ||||||||
T-Mobile US, Inc. (2) | 17,051 | $ | 1,337,139 | |||||
Total Common Stocks |
| $ | 175,751,259 | |||||
| Exchange-Traded Funds — 1.8% |
| |||||||
| Security | Shares | Value | ||||||
Invesco QQQTM Trust, Series 1(1) | 15,000 | $ | 3,189,150 | |||||
Total Exchange-Traded Funds |
| $ | 3,189,150 | |||||
| Short-Term Investments — 0.7% | ||||||||
| U.S. Treasury Obligations — 0.2% | ||||||||
| Security | Principal Amount (000’s omitted) | Value | ||||||
U.S. Treasury Bill, 0.00%, 2/27/20(3) | $ | 400 | $ | 399,064 | ||||
Total U.S. Treasury Obligations | $ | 399,064 | ||||||
| Securities Lending Collateral — 0.5% |
| |||||||
| Security | Shares | Value | ||||||
State Street Navigator Securities Lending Government Money Market Portfolio, 1.56%(4) | 962,047 | $ | 962,047 | |||||
Total Securities Lending Collateral | $ | 962,047 | ||||||
Total Short-Term Investments | $ | 1,361,111 | ||||||
Total Investments | $ | 180,301,520 | ||||||
Other Assets, less Liabilities — 0.9% | $ | 1,577,659 | ||||||
Net Assets — 100.0% | $ | 181,879,179 | ||||||
The percentage shown for each investment category in the Schedule of Investments is based on net assets.
Notes to Schedule of Investments
| (1) | All or a portion of this security was on loan at December 31, 2019. The aggregate market value of securities on loan at December 31, 2019 was $4,491,704. |
| (2) | Non-income producing security. |
| (3) | Security (or a portion thereof) has been pledged to cover margin requirements on open futures contracts. |
| (4) | Represents investment of cash collateral received in connection with securities lending. |
| Futures Contracts | ||||||||||||||||||||
| Description | Number of Contracts | Position | Expiration Date | Notional Amount | Value/ Unrealized | |||||||||||||||
| Equity Futures | ||||||||||||||||||||
E-mini NASDAQ 100 Index | 19 | Long | 3/20/20 | $ | 3,325,855 | $ | 53,610 | |||||||||||||
Abbreviations:
| ADR | – | American Depositary Receipt | ||
| 9 | See Notes to Financial Statements. |
Table of Contents
Calvert
VP Nasdaq 100 Index Portfolio
December 31, 2019
Statement of Assets and Liabilities
| Assets | December 31, 2019 | |||
Investments in securities of unaffiliated issuers, at value (identified cost $63,765,586) - including | $ | 180,301,520 | ||
Receivable for variation margin on open futures contracts | 7,030 | |||
Cash | 2,655,882 | |||
Receivable for capital shares sold | 12,047 | |||
Dividends and interest receivable | 67,586 | |||
Securities lending income receivable | 417 | |||
Receivable from affiliate | 24,696 | |||
Directors’ deferred compensation plan | 28,485 | |||
Other assets | 8,010 | |||
Total assets | $ | 183,105,673 | ||
| Liabilities | ||||
Payable for capital shares redeemed | $ | 60,383 | ||
Deposits for securities loaned | 962,047 | |||
Payable to affiliates: | ||||
Investment advisory fee | 45,365 | |||
Administrative fee | 18,146 | |||
Distribution and service fees | 1,129 | |||
Sub-transfer agency fee | 40 | |||
Directors’ deferred compensation plan | 28,485 | |||
Accrued expenses | 110,899 | |||
Total liabilities | $ | 1,226,494 | ||
Net Assets | $ | 181,879,179 | ||
| Sources of Net Assets | ||||
Paid-in capital | $ | 56,747,188 | ||
Distributable earnings | 125,131,991 | |||
Total | $ | 181,879,179 | ||
| Class I | ||||
Net Assets | $ | 176,210,160 | ||
Shares Outstanding | 2,047,765 | |||
Net Asset Value, Offering Price and Redemption Price Per Share | ||||
(net assets ÷ shares of beneficial interest outstanding) | $ | 86.05 | ||
| Class F | ||||
Net Assets | $ | 5,669,019 | ||
Shares Outstanding | 66,672 | |||
Net Asset Value, Offering Price and Redemption Price Per Share | ||||
(net assets ÷ shares of beneficial interest outstanding) | $ | 85.03 | ||
| 10 | See Notes to Financial Statements. |
Table of Contents
Calvert
VP Nasdaq 100 Index Portfolio
December 31, 2019
Statement of Operations
| Investment Income | Year Ended December 31, 2019 | |||
Dividend income (net of foreign taxes withheld of $1,801) | $ | 1,618,579 | ||
Interest income | 64,203 | |||
Securities lending income, net | 12,084 | |||
Total investment income | $ | 1,694,866 | ||
| Expenses | ||||
Investment advisory fee | $ | 480,247 | ||
Administrative fee | 192,099 | |||
Distribution and service fees: | ||||
Class F | 8,175 | |||
Directors’ fees and expenses | 9,522 | |||
Custodian fees | 11,685 | |||
Transfer agency fees and expenses | 83,335 | |||
Accounting fees | 39,070 | |||
Professional fees | 38,611 | |||
Reports to shareholders | 33,787 | |||
Licensing fees | 48,875 | |||
Miscellaneous | 10,596 | |||
Total expenses | $ | 956,002 | ||
Waiver and/or reimbursement of expenses by affiliate | $ | (175,866 | ) | |
Reimbursement of expenses - other | (3,565 | ) | ||
Net expenses | $ | 776,571 | ||
Net investment income | $ | 918,295 | ||
| Realized and Unrealized Gain (Loss) | ||||
Net realized gain (loss): | ||||
Investment securities | $ | 6,153,087 | ||
Futures contracts | 1,351,484 | |||
Net realized gain | $ | 7,504,571 | ||
Change in unrealized appreciation (depreciation): | ||||
Investment securities | $ | 42,857,788 | ||
Futures contracts | 133,975 | |||
Net change in unrealized appreciation (depreciation) | $ | 42,991,763 | ||
Net realized and unrealized gain | $ | 50,496,334 | ||
Net increase in net assets resulting from operations | $ | 51,414,629 | ||
| 11 | See Notes to Financial Statements. |
Table of Contents
Calvert
VP Nasdaq 100 Index Portfolio
December 31, 2019
Statements of Changes in Net Assets
| Year Ended December 31, | ||||||||
| Increase (Decrease) in Net Assets | 2019 | 2018 | ||||||
From operations: | ||||||||
Net investment income | $ | 918,295 | $ | 838,857 | ||||
Net realized gain | 7,504,571 | 4,129,083 | ||||||
Net change in unrealized appreciation (depreciation) | 42,991,763 | (5,525,226 | ) | |||||
Net increase (decrease) in net assets from operations | $ | 51,414,629 | $ | (557,286 | ) | |||
Distributions to shareholders: | ||||||||
Class I | $ | (4,765,571 | ) | $ | (3,147,915 | ) | ||
Class F | (116,646 | ) | (43,192 | ) | ||||
Total distributions to shareholders | $ | (4,882,217 | ) | $ | (3,191,107 | ) | ||
Capital share transactions: | ||||||||
Class I | $ | (187,499 | ) | $ | 1,014,102 | |||
Class F | 2,987,301 | (133,295 | ) | |||||
Net increase in net assets from capital share transactions | $ | 2,799,802 | $ | 880,807 | ||||
Net increase (decrease) in net assets | $ | 49,332,214 | $ | (2,867,586 | ) | |||
| Net Assets | ||||||||
At beginning of year | $ | 132,546,965 | $ | 135,414,551 | ||||
At end of year | $ | 181,879,179 | $ | 132,546,965 | ||||
| 12 | See Notes to Financial Statements. |
Table of Contents
Calvert
VP Nasdaq 100 Index Portfolio
December 31, 2019
Financial Highlights
| Class I | ||||||||||||||||||||
| Year Ended December 31, | ||||||||||||||||||||
| 2019 | 2018 | 2017 | 2016 | 2015 | ||||||||||||||||
Net asset value — Beginning of year | $ | 63.98 | $ | 65.60 | $ | 50.26 | $ | 48.91 | $ | 45.59 | ||||||||||
| Income (Loss) From Operations | ||||||||||||||||||||
Net investment income (1) | $ | 0.44 | $ | 0.41 | $ | 0.40 | $ | 0.34 | $ | 0.29 | ||||||||||
Net realized and unrealized gain (loss) | 24.00 | (0.46 | ) | 15.82 | 2.91 | 3.87 | ||||||||||||||
Total income (loss) from operations | $ | 24.44 | $ | (0.05 | ) | $ | 16.22 | $ | 3.25 | $ | 4.16 | |||||||||
| Less Distributions | ||||||||||||||||||||
From net investment income | $ | (0.41 | ) | $ | (0.40 | ) | $ | (0.30 | ) | $ | (0.26 | ) | $ | (0.03 | ) | |||||
From net realized gain | (1.96 | ) | (1.17 | ) | (0.58 | ) | (1.64 | ) | (0.81 | ) | ||||||||||
Total distributions | $ | (2.37 | ) | $ | (1.57 | ) | $ | (0.88 | ) | $ | (1.90 | ) | $ | (0.84 | ) | |||||
Net asset value — End of year | $ | 86.05 | $ | 63.98 | $ | 65.60 | $ | 50.26 | $ | 48.91 | ||||||||||
Total Return(2) | 38.77 | % | (0.47 | )% | 32.35 | % | 6.59 | % | 9.07 | % | ||||||||||
| Ratios/Supplemental Data | ||||||||||||||||||||
Net assets, end of year (000’s omitted) | $ | 176,210 | $ | 130,777 | $ | 133,473 | $ | 104,449 | $ | 93,676 | ||||||||||
Ratios (as a percentage of average daily net assets):(3) | ||||||||||||||||||||
Total expenses | 0.59 | % | 0.60 | % | 0.60 | % | 0.66 | % | 0.62 | % | ||||||||||
Net expenses | 0.48 | % | 0.48 | % | 0.48 | % | 0.64 | % | 0.62 | % | ||||||||||
Net investment income | 0.58 | % | 0.58 | % | 0.67 | % | 0.69 | % | 0.61 | % | ||||||||||
Portfolio Turnover | 8 | % | 7 | % | 3 | % | 5 | % | 8 | % | ||||||||||
| (1) | Computed using average shares outstanding. |
| (2) | Returns are historical and are calculated by determining the percentage change in net asset value with all distributions reinvested and do not reflect fees and expenses imposed by variable annuity contracts or variable life insurance policies. If included, total return would be lower. |
| (3) | Total expenses do not reflect amounts reimbursed and/or waived by the adviser and certain of its affiliates, if applicable. Net expenses are net of all reductions and represent the net expenses paid by the Fund. |
| 13 | See Notes to Financial Statements. |
Table of Contents
Calvert
VP Nasdaq 100 Index Portfolio
December 31, 2019
Financial Highlights — continued
| Class F | ||||||||||||||||||||
| Year Ended December 31, | Period Ended December 31, 2015(1) | |||||||||||||||||||
| 2019 | 2018 | 2017 | 2016 | |||||||||||||||||
Net asset value — Beginning of year | $ | 63.40 | $ | 65.18 | $ | 50.07 | $ | 48.91 | $ | 50.24 | ||||||||||
| Income (Loss) From Operations | ||||||||||||||||||||
Net investment income(2) | $ | 0.25 | $ | 0.23 | $ | 0.23 | $ | 0.18 | $ | 0.06 | ||||||||||
Net realized and unrealized gain (loss) | 23.75 | (0.44 | ) | 15.76 | 2.93 | (0.58 | ) | |||||||||||||
Total income (loss) from operations | $ | 24.00 | $ | (0.21 | ) | $ | 15.99 | $ | 3.11 | $ | (0.52 | ) | ||||||||
| Less Distributions | ||||||||||||||||||||
From net investment income | $ | (0.41 | ) | $ | (0.40 | ) | $ | (0.30 | ) | $ | (0.31 | ) | $ | — | ||||||
From net realized gain | (1.96 | ) | (1.17 | ) | (0.58 | ) | (1.64 | ) | (0.81 | ) | ||||||||||
Total distributions | $ | (2.37 | ) | $ | (1.57 | ) | $ | (0.88 | ) | $ | (1.95 | ) | $ | (0.81 | ) | |||||
Net asset value — End of year | $ | 85.03 | $ | 63.40 | $ | 65.18 | $ | 50.07 | $ | 48.91 | ||||||||||
Total Return(3) | 38.44 | % | (0.72 | )% | 32.01 | % | 6.3 | % | (1.07 | )%(4) | ||||||||||
| Ratios/Supplemental Data | ||||||||||||||||||||
Net assets, end of year (000’s omitted) | $ | 5,669 | $ | 1,770 | $ | 1,942 | $ | 1,088 | $ | 99 | ||||||||||
Ratios (as a percentage of average daily net assets):(5) | ||||||||||||||||||||
Total expenses | 0.84 | % | 0.84 | % | 1.01 | % | 1.48 | % | 0.87 | %(6) | ||||||||||
Net expenses | 0.73 | % | 0.73 | % | 0.73 | % | 0.94 | % | 0.87 | %(6) | ||||||||||
Net investment income | 0.32 | % | 0.33 | % | 0.39 | % | 0.36 | % | 0.71 | %(6) | ||||||||||
Portfolio Turnover | 8 | % | 7 | % | 3 | % | 5 | % | 8 | %(4) | ||||||||||
| (1) | From October 30, 2015 inception. |
| (2) | Computed using average shares outstanding. |
| (3) | Returns are historical and are calculated by determining the percentage change in net asset value with all distributions reinvested and do not reflect fees and expenses imposed by variable annuity contracts or variable life insurance policies. If included, total return would be lower. |
| (4) | Not annualized. |
| (5) | Total expenses do not reflect amounts reimbursed and/or waived by the adviser and certain of its affiliates, if applicable. Net expenses are net of all reductions and represent the net expenses paid by the Fund. |
| (6) | Annualized. |
| 14 | See Notes to Financial Statements. |
Table of Contents
Calvert
VP Nasdaq 100 Index Portfolio
December 31, 2019
Notes to Financial Statements
1 Significant Accounting Policies
Calvert VP Nasdaq 100 Index Portfolio (the Fund) is anon-diversified series of Calvert Variable Products, Inc. (the Corporation). The Corporation is a Maryland corporation registered under the Investment Company Act of 1940, as amended (the 1940 Act), as anopen-end management investment company. The investment objective of the Fund is to seek investment results that correspond to the investment performance of U.S. common stocks, as represented by theNASDAQ-100 Index.
Shares of the Fund are sold without sales charge to insurance companies for allocation to certain of their variable separate accounts. The Fund offers Class I and Class F shares. Among other things, each class has different: (a) dividend rates due to differences in Distribution Plan expenses and other class-specific expenses; (b) exchange privileges; and (c) class-specific voting rights.
The Fund applies the accounting and reporting guidance in the Financial Accounting Standards Board (FASB) Accounting Standards Codification Topic 946,Financial Services – Investment Companies (ASC 946). Subsequent events, if any, through the date that the financial statements were issued have been evaluated in the preparation of the financial statements.
A Investment Valuation — Net asset value per share is determined every business day as of the close of the regular session of the New York Stock Exchange (generally 4:00 p.m. Eastern time). The Fund uses independent pricing services approved by the Board ofDirectors (the Board) to value its investments wherever possible. Investments for which market quotations are not available or deemed not reliable are fair valued in good faith under the direction of the Board.
U.S. generally accepted accounting principles (U.S. GAAP) establishes a disclosure hierarchy that categorizes the inputs to valuation techniques used to value assets and liabilities at measurement date. These inputs are summarized in the three broad levels listed below:
Level 1 - quoted prices in active markets for identical securities
Level 2 - other significant observable inputs (including quoted prices for similar securities, interest rates, prepayment speeds, credit risk, etc.)
Level 3 - significant unobservable inputs (including the Fund’s own assumptions in determining the fair value of investments)
The inputs or methodologies used for valuing securities are not necessarily an indication of the risk associated with investing in those securities.
Valuation techniques used to value the Fund’s investments by major category are as follows:
Equity Securities.Equity securities (including warrants and rights) listed on a U.S. securities exchange generally are valued at the last sale or closing price as reported by an independent pricing service on the primary market or exchange on which they are traded and are categorized as Level 1 in the hierarchy. Equity securities listed on the NASDAQ Global or Global Select Market are valued at the NASDAQ official closing price and are categorized as Level 1 in the hierarchy. Unlisted or listed securities for which closing sales prices or closing quotations are not available are valued at the mean between the latest available bid and ask prices and are categorized as Level 2 in the hierarchy.
Short-Term Debt Securities. Short-term debt securities with a remaining maturity at time of purchase of more than sixty days are valued on the basis of valuations provided by a third party pricing service. Such securities are generally categorized as Level 2 in the hierarchy. Short-term debt securities of sufficient credit quality purchased with remaining maturities of sixty days or less are valued at amortized cost, which approximates fair value, and are categorized as Level 2 in the hierarchy.
Other Securities.Exchange-traded funds are valued at the official closing price as reported by an independent pricing service on the primary market or exchange on which they are traded and are categorized as Level 1 in the hierarchy. Investments in registered investment companies (including money market funds) that do not trade on an exchange are valued at the net asset value per share on the valuation day and are categorized as Level 1 in the hierarchy.
Derivatives.Futures contracts are valued at unrealized appreciation (depreciation) based on the settlement price established each day by the board of trade or exchange on which they are traded and are categorized as Level 1 in the hierarchy.
Fair Valuation.If a market value cannot be determined for a security using the methodologies described above, or if, in the good faith opinion of the Fund’s adviser, the market value does not constitute a readily available market quotation, or if a significant event has occurred that would materially affect the value of the security, the security will be fair valued as determined in good faith by or at the direction of the Board in a manner that most fairly reflects the security’s “fair value”, which is the amount that the Fund might reasonably expect to receive for the security upon its current sale in the ordinary course. Each such determination is based on a consideration of relevant factors, which are likely to vary from one pricing context to another. These factors may include, but are not limited to, the type of security, the existence of any contractual restrictions on the security’s disposition, the price and extent of public trading in similar securities of the issuer or of comparable companies or entities, quotations or relevant information obtained from broker/dealers or other market participants, information obtained from the issuer, analysts, and/or the appropriate stock exchange (for exchange-traded securities), an analysis of the company’s or entity’s financial statements, and an evaluation of the forces that influence the issuer and the market(s) in which the security is purchased and sold.
The values assigned to fair value investments are based on available information and do not necessarily represent amounts that might ultimately be realized. Further, due to the inherent uncertainty of valuations of such investments, the fair values may differ significantly from the values that would have been used had an active market existed, and the differences could be material.
| 15 |
Table of Contents
Calvert
VP Nasdaq 100 Index Portfolio
December 31, 2019
Notes to Financial Statements — continued
The following table summarizes the market value of the Fund’s holdings as of December 31, 2019, based on the inputs used to value them:
| Asset Description | Level 1 | Level 2 | Level 3 | Total | ||||||||||||
Common Stocks | $ | 175,751,259 | (1) | $ | — | $ | — | $ | 175,751,259 | |||||||
Exchange-Traded Funds | 3,189,150 | — | — | 3,189,150 | ||||||||||||
Short-Term Investments - | ||||||||||||||||
U.S. Treasury Obligations | — | 399,064 | — | 399,064 | ||||||||||||
Securities Lending Collateral | 962,047 | — | — | 962,047 | ||||||||||||
Total Investments | $ | 179,902,456 | $ | 399,064 | $ | — | $ | 180,301,520 | ||||||||
Futures Contracts | $ | 53,610 | $ | — | $ | — | $ | 53,610 | ||||||||
Total | $ | 179,956,066 | $ | 399,064 | $ | — | $ | 180,355,130 | ||||||||
| (1) | The level classification by major category of investments is the same as the category presentation in the Schedule of Investments. |
B Investment Transactions and Income — Investment transactions for financial statement purposes are accounted for on trade date. Realized gains and losses are recorded on an identified cost basis and may include proceeds from litigation. Dividend income is recorded on theex-dividend date for dividends received in cash and/or securities.Non-cash dividends are recorded at the fair value of the securities received. Withholding taxes on foreign dividends, if any, have been provided for in accordance with the Fund’s understanding of the applicable country’s tax rules and rates. Distributions received that represent a return of capital are recorded as a reduction of cost of investments. Distributions received that represent a capital gain are recorded as a realized gain. Interest income, which includes amortization of premium and accretion of discount on debt securities, is accrued as earned.
C Share Class Accounting — Realized and unrealized gains and losses and net investment income and losses, other than class-specific expenses, are allocated daily to each class of shares based upon the relative net assets of each class to the total net assets of the Fund. Expenses arising in connection with a specific class are charged directly to that class.
D Futures Contracts — The Fund may enter into futures contracts to buy or sell a financial instrument for a set price at a future date. Initial margin deposits of either cash or securities as required by the broker are made upon entering into the contract. While the contract is open, daily variation margin payments are made to or received from the broker reflecting the daily change in market value of the contract and are recorded for financial reporting purposes as unrealized gains or losses by the Fund. When a futures contract is closed, a realized gain or loss is recorded equal to the difference between the opening and closing value of the contract. The risks associated with entering into futures contracts may include the possible illiquidity of the secondary market which would limit the Fund’s ability to close out a futures contract prior to the settlement date, an imperfect correlation between the value of the contracts and the underlying financial instruments, or that the counterparty will fail to perform its obligations under the contracts’ terms. Futures contracts are designed by boards of trade, which are designated “contracts markets” by the Commodities Futures Trading Commission. Futures contracts trade on the contracts markets in a manner that is similar to the way a stock trades on a stock exchange, and the boards of trade, through their clearing corporations, guarantee the futures contracts against default. As a result, there is minimal counterparty credit risk to the Fund.
E Distributions to Shareholders — Distributions to shareholders are recorded by the Fund onex-dividend date. The Fund distributes any net investment income and net realized capital gains at least annually. Both types of distributions are made in shares of the Fund unless an election is made on behalf of a separate account to receive some or all of the distributions in cash. Distributions are declared separately for each class of shares. Distributions are determined in accordance with income tax regulations which may differ from U.S. GAAP; accordingly, periodic reclassifications are made within theFund’s capital accounts to reflect income and gains available for distribution under income tax regulations.
F Estimates — The preparation of financial statements in conformity with U.S. GAAP requires management to make estimates and assumptions that affect the reported amounts of assets and liabilities and disclosure of contingent assets and liabilities at the date of the financial statements and the reported amounts of increases and decreases in net assets from operations during the reporting period. Actual results could differ from those estimates.
G Indemnifications — The Corporation’s By-Laws provide for indemnification for Directors or officers of the Corporation and certain other parties, to the fullest extent permitted by Maryland law and the 1940 Act, provided certain conditions are met. Additionally, in the normal course of business, the Fund enters into agreements with service providers that may contain indemnification clauses. The Fund’s maximum exposure under these arrangements is unknown as this would involve future claims that may be made against the Fund that have not yet occurred.
H Federal Income Taxes — No provision for federal income or excise tax is required since the Fund intends to continue to qualify as a regulated investment company under the Internal Revenue Code and to distribute substantially all of its taxable earnings.
Management has analyzed the Fund’stax positions taken for all open federal income tax years and has concluded that no provision for federal income tax is required in the Fund’s financial statements. A Fund’s federal tax return is subject to examination by the Internal Revenue Service for a period of three years from the date of filing.
| 16 |
Table of Contents
Calvert
VP Nasdaq 100 Index Portfolio
December 31, 2019
Notes to Financial Statements — continued
2 Related Party Transactions
The investment advisory fee is earned by Calvert Research and Management (CRM), a subsidiary of Eaton Vance Management (EVM), as compensation for investment advisory services rendered to the Fund. Pursuant to the investment advisory agreement, CRM receives a fee, payable monthly, at the annual rate of 0.30% of the Fund’s average daily net assets. For the year ended December 31, 2019, the investment advisory fee amounted to $480,247.
Ameritas Investment Partners, Inc. (AIP) providessub-advisory services to the Fund pursuant to asub-advisory agreement with CRM.Sub-advisory fees are paid by CRM from its investment advisory fee.
CRM has agreed to reimburse the Fund’s operating expenses to the extent that total annual operating expenses (relating to ordinary operating expenses only and excluding expenses such as brokerage commissions, acquired fund fees and expenses of unaffiliated funds, borrowing costs, taxes or litigation expenses) exceed 0.48% for Class I and 0.73% for Class F of such class’ average daily net assets. The expense reimbursement agreement with CRM may be changed or terminated after April 30, 2020. For the year ended December 31, 2019, CRM waived or reimbursed expenses of $175,866.
The administrative fee is earned by CRM as compensation for administrative services rendered to the Fund. The fee is computed at an annual rate of 0.12% of the Fund’s average daily net assets attributable to Class I and Class F and is payable monthly. For the year ended December 31, 2019, CRM was paid administrative fees of $192,099.
The Fund has in effect a distribution plan for Class F shares (Class F Plan) pursuant to Rule12b-1 under the 1940 Act. Pursuant to the Class F Plan, the Fund pays Eaton Vance Distributors, Inc. (EVD), an affiliate of CRM and the Fund’s principal underwriter, a distribution and service fee of 0.25% per annum of its average daily net assets attributable to Class F shares for distribution services and facilities provided to the Fund, as well as for personal and/or account maintenance services provided to the class shareholders. Distribution and service fees paid or accrued for the year ended December 31, 2019 amounted to $8,175 for Class F shares.
EVM providessub-transfer agency and related services to the Fund pursuant to aSub-Transfer Agency Support Services Agreement. For the year ended December 31, 2019,sub-transfer agency fees and expenses incurred to EVM amounted to $185 and are included in transfer agency fees and expenses on the Statement of Operations.
Each Director of the Fund who is not an employee of CRM or its affiliates receives a fee of $3,000 for each Board meeting attended in person and $2,000 for each Board meeting attended by phone plus an annual fee of $142,000, and $1,500 for each Committee meeting attended in person and $1,000 for each Committee meeting attended by phone plus an annual Committee fee of $2,500. The Board chair receives an additional $20,000 annual retainer and Committee chairs receive an additional $6,000 annual retainer. Eligible Directors may participate in a Deferred Compensation Plan (the Plan). Amounts deferred under the Plan are treated as though equal dollar amounts had been invested in shares of the Fund or other Calvert funds selected by the Directors. The Fund purchases shares of the funds selected equal to the dollar amounts deferred under the Plan, resulting in an asset equal to the deferred compensation liability. Obligations of the Plan are paid solely from the Fund’s assets. Directors’ fees are allocated to each of the Calvert funds served. Salaries and fees of officers and Directors of the Fund who are employees of CRM or its affiliates are paid by CRM. In addition, an advisory council was established to aid the Board and CRM in advancing the cause of responsible investing through original scholarship and thought leadership. The advisory council consists of CRM’s Chief Executive Officer and four additional members. Each member (other than CRM’s Chief Executive Officer) receives annual compensation of $75,000, which is being reimbursed by Calvert Investment Management, Inc. (CIM), the Calvert funds’ former investment adviser and Ameritas Holding Company, CIM’s parent company, through the end of 2019. For the year ended December 31, 2019, the Fund’s allocated portion of such expense and reimbursement was $3,565, which are included in miscellaneous expense and reimbursement of expenses-other, respectively, on the Statement of Operations.
3 Shareholder Servicing Plan
The Corporation, on behalf of the Fund, has adopted a Shareholder Servicing Plan (Servicing Plan), which permits the Fund to enter into shareholder servicing agreements with intermediaries that maintain accounts in the Fund for the benefit of shareholders. These services may include, but are not limited to, processing purchase and redemption requests, processing dividend payments, and providing account information to shareholders. Under the Servicing Plan, the Fund may make payments at an annual rate of up to 0.11% of its average daily net assets. For the year ended December 31, 2019, expenses incurred under the Servicing Plan amounted to $81,353 and are included in transfer agency fees and expenses on the Statement of Operations.
4 Investment Activity
During theyear ended December 31, 2019, the cost of purchases and proceeds from sales of investments, other than short-term securities, were $13,880,219 and $12,011,322, respectively.
| 17 |
Table of Contents
Calvert
VP Nasdaq 100 Index Portfolio
December 31, 2019
Notes to Financial Statements — continued
5 Distributions to Shareholders and Income Tax Information
The tax character of distributions declared for the years ended December 31, 2019 and December 31, 2018 was as follows:
| Year Ended December 31, | ||||||||
| 2019 | 2018 | |||||||
Ordinary income | $ | 837,264 | $ | 1,026,171 | ||||
Long-term capital gains | $ | 4,044,953 | $ | 2,164,936 | ||||
As of December 31, 2019, the components of distributable earnings (accumulated loss) on a tax basis were as follows:
Undistributed ordinary income | $ | 1,787,254 | ||
Undistributed long-term capital gains | $ | 6,833,335 | ||
Net unrealized appreciation | $ | 116,511,402 | ||
The cost and unrealized appreciation (depreciation) of investments, including open derivative contracts, of the Fund at December 31, 2019, as determined on a federal income tax basis, were as follows:
Aggregate cost | $ | 63,790,118 | ||
Gross unrealized appreciation | $ | 118,490,839 | ||
Gross unrealized depreciation | (1,979,437 | ) | ||
Net unrealized appreciation | $ | 116,511,402 | ||
6 Financial Instruments
A summary of futures contracts outstanding at December 31, 2019 is included in the Schedule of Investments. During the year ended December 31, 2019, the Fund used futures contracts to provide equity market exposure for uncommitted cash balances.
At December 31, 2019, the fair value of open derivative instruments (not considered to be hedging instruments for accounting disclosure purposes) and whose primary underlying risk exposure is equity price risk was as follows:
| Derivative | Statement of Assets and Liabilities Caption | Assets | Liabilities | |||||||||
Futures contracts | Distributable earnings | $ | 53,610 | (1) | $ | — | ||||||
| (1) | Only the current day’s variation margin is reported within the Statement of Assets and Liabilities as Receivable or Payable for variation margin on open futures contracts, as applicable. |
The effect of derivative instruments (not considered to be hedging instruments for accounting disclosure purposes) on the Statement of Operations and whose primary underlying risk exposure is equity price risk for the year ended December 31, 2019 was as follows:
| Statement of Operations Caption | ||||||||
| Derivative | Net realized gain (loss) | Change in unrealized appreciation on futures contracts | ||||||
Futures contracts | $ | 1,351,484 | $ | 133,975 | ||||
| 18 |
Table of Contents
Calvert
VP Nasdaq 100 Index Portfolio
December 31, 2019
Notes to Financial Statements — continued
The average notional cost of futures contracts (long) outstanding during the year ended December 31, 2019 was approximately $4,259,000.
7 Securities Lending
To generate additional income, the Fund may lend its securities pursuant to a securities lending agency agreement with State Street Bank and Trust Company (SSBT), the securities lending agent. Security loans are subject to termination by the Fund at any time and, therefore, are not considered illiquid investments. The Fund requires that the loan be continuously collateralized by either cash or securities as collateral equal at all times to at least 102% of the market value of the domestic securities loaned and 105% of the market value of the international securities loaned (if applicable). The market value of securities loaned is determined daily and any additional required collateral is delivered to the Fund on the next business day. Cash collateral is generally invested in a money market fund registered under the 1940 Act that is managed by an affiliate of SSBT. Any gain or loss in the market price of the loaned securities that might occur and any interest earned or dividends declared during the term of the loan would accrue to the account of the Fund. Income earned on the investment of collateral, net of broker rebates and other expenses incurred by the securities lending agent, is split between the Fund and the securities lending agent on the basis of agreed upon contractual terms.Non-cash collateral, if any, is held by the lending agent on behalf of the Fund and cannot be sold orre-pledged by the Fund; accordingly, such collateral is not reflected in the Statement of Assets and Liabilities.
The risks associated with lending portfolio securities include, but are not limited to, possible delays in receiving additional collateral or in the recovery of the loaned securities, possible loss of rights to the collateral should the borrower fail financially, as well as risk of loss in the value of the collateral or the value of the investments made with the collateral. The securities lending agent shall indemnify the Fund in the case of default of any securities borrower.
At December 31, 2019, the total value of securities on loan was $4,491,704 and the total value of collateral received was $4,572,139, comprised of cash of $962,047 and U.S. government and/or agencies securities of $3,610,092.
The following table provides a breakdown of securities lending transactions accounted for as secured borrowings, the obligations by class of collateral pledged, and the remaining contractual maturity of those transactions as of December 31, 2019.
| Remaining Contractual Maturity of the Transactions | ||||||||||||||||||||
| Overnight and Continuous | <30 days | 30 to 90 days | >90 days | Total | ||||||||||||||||
Securities Lending Transactions |
| |||||||||||||||||||
Common Stocks | $ | 1,357,114 | $ | — | $ | — | $ | — | $ | 1,357,114 | ||||||||||
Exchange-Traded Funds | 3,215,025 | — | — | — | 3,215,025 | |||||||||||||||
Total | $ | 4,572,139 | $ | — | $ | — | $ | — | $ | 4,572,139 | ||||||||||
The carrying amount of the liability for deposits for securities loaned at December 31, 2019 approximated its fair value. If measured at fair value, such liability would have been considered as Level 2 in the fair value hierarchy (see Note 1A) at December 31, 2019.
8 Line of Credit
Effective October 29, 2019, the Fund participates with other portfolios and funds managed by EVM and its affiliates, including CRM, in an $800 million unsecured line of credit with a group of banks, which is in effect through October 27, 2020. Borrowings are made by the Fund solely to facilitate the handling of unusual and/or unanticipated short-term cash requirements. Interest is charged to the Fund based on its borrowings at an amount above either the Eurodollar rate or Federal Funds rate. In addition, a fee computed at an annual rate of 0.15% on the daily unused portion of the line of credit is allocated among the participating portfolios and funds at the end of each quarter. Because the line of credit is not available exclusively to the Fund, it may be unable to borrow some or all of its requested amounts at any particular time.
Prior to October 29, 2019, the Fund participated with other funds managed by CRM in a $100 million ($62.5 million prior to June 21, 2019) committed line of credit agreement with SSBT, which was terminated by the Calvert funds. Borrowings bore interest at the higher of theone-month London Interbank Offered Rate (LIBOR) in effect that day or the overnight Federal Funds rate, plus 1.00% per annum. A commitment fee of 0.20% per annum was incurred on the unused portion of the committed facility, which was allocated to all participating funds.
The Fund had no borrowings pursuant to its lines of credit during the year ended December 31, 2019.
9 Capital Shares
The Corporation may issue its shares in one or more series (such as the Fund). The authorized shares of the Fund consist of 10,000,000 common shares, $0.10 par value, for each Class.
| 19 |
Table of Contents
Calvert
VP Nasdaq 100 Index Portfolio
December 31, 2019
Notes to Financial Statements — continued
Transactions in capital shares for the years ended December 31, 2019 and December 31, 2018 were as follows:
| Year Ended December 31, 2019 | Year Ended December 31, 2018 | |||||||||||||||
| Shares | Amount | Shares | Amount | |||||||||||||
Class I |
| |||||||||||||||
Shares sold | 177,906 | $ | 13,382,179 | 231,179 | $ | 16,599,420 | ||||||||||
Reinvestment of distributions | 64,140 | 4,765,571 | 41,241 | 3,147,915 | ||||||||||||
Shares redeemed | (238,195 | ) | (18,335,249 | ) | (263,254 | ) | (18,733,233 | ) | ||||||||
Net increase (decrease) | 3,851 | $ | (187,499 | ) | 9,166 | $ | 1,014,102 | |||||||||
Class F |
| |||||||||||||||
Shares sold | 39,507 | $ | 3,051,745 | 657 | $ | 43,443 | ||||||||||
Reinvestment of distributions | 1,588 | 116,646 | 571 | 43,192 | ||||||||||||
Shares redeemed | (2,340 | ) | (181,090 | ) | (3,106 | ) | (219,930 | ) | ||||||||
Net increase (decrease) | 38,755 | $ | 2,987,301 | (1,878 | ) | $ | (133,295 | ) | ||||||||
At December 31, 2019, separate accounts of an insurance company that is an affiliate of AIP owned 44.7% of the value of the outstanding shares of the Fund and separate accounts of two other insurance companies each owned more than 10% of the value of the outstanding shares of the Fund, aggregating 39.8%.
| 20 |
Table of Contents
Calvert
VP Nasdaq 100 Index Portfolio
December 31, 2019
Report of Independent Registered Public Accounting Firm
To the Shareholders and Board of Directors
Calvert Variable Products, Inc.:
Opinion on the Financial Statements
We have audited the accompanying statement of assets and liabilities of Calvert VP Nasdaq 100 Index Portfolio (the Fund), a series of Calvert Variable Products, Inc., including the schedule of investments, as of December 31, 2019, the related statement of operations for the year then ended, the statements of changes in net assets for each of the years in thetwo-year period then ended, and the related notes (collectively, the financial statements) and the financial highlights for each of the years or periods in thefive-year period then ended. In our opinion, the financial statements and financial highlights present fairly, in all material respects, the financial position of the Fund as of December 31, 2019, the results of its operations for the year then ended, the changes in its net assets for each of the years in thetwo-year period then ended, and the financial highlights for each of the years or periods in thefive-year period then ended, in conformity with U.S. generally accepted accounting principles.
Basis for Opinion
These financial statements and financial highlights are the responsibility of the Fund’s management. Our responsibility is to express an opinion on these financial statements and financial highlights based on our audits. We are a public accounting firm registered with the Public Company Accounting Oversight Board (United States) (PCAOB) and are required to be independent with respect to the Fund in accordance with the U.S. federal securities laws and the applicable rules and regulations of the Securities and Exchange Commission and the PCAOB.
We conducted our audits in accordance with the standards of the PCAOB. Those standards require that we plan and perform the audit to obtain reasonable assurance about whether the financial statements and financial highlights are free of material misstatement, whether due to error or fraud. Our audits included performing procedures to assess the risks of material misstatement of the financial statements and financial highlights, whether due to error or fraud, and performing procedures that respond to those risks. Such procedures included examining, on a test basis, evidence regarding the amounts and disclosures in the financial statements and financial highlights. Such procedures also included confirmation of securities owned as of December 31, 2019, by correspondence with the custodian and brokers. Our audits also included evaluating the accounting principles used and significant estimates made by management, as well as evaluating the overall presentation of the financial statements and financial highlights. We believe that our audits provide a reasonable basis for our opinion.

We have served as the auditor of one or more of the Calvert Funds since 2002.
Philadelphia, Pennsylvania
February 19, 2020
| 21 |
Table of Contents
Calvert
VP Nasdaq 100 Index Portfolio
December 31, 2019
Federal Tax Information (Unaudited)
As required by the Internal Revenue Code and/or regulations, shareholders must be notified regarding the status of the dividends received deduction for corporations and capital gains dividends.
Dividends Received Deduction.Corporate shareholders are generally entitled to take the dividends received deduction on the portion of the Fund’s dividend distribution that qualifies under tax law. For the Fund’s fiscal 2019 ordinary income dividends, 100% qualifies for the corporate dividends received deduction.
Capital Gains Dividends.The Fund hereby designates as a capital gain dividend with respect to the taxable year ended December 31, 2019, $6,833,359 or, if subsequently determined to be different, the net capital gain of such year.
| 22 |
Table of Contents
Calvert
VP Nasdaq 100 Index Portfolio
December 31, 2019
Fund Management.The Directors of Calvert Variable Products, Inc. (the Corporation) are responsible for the overall management and supervision of the Corporation’s affairs. The Directors and officers of the Corporation are listed below. Except as indicated, each individual has held the office shown or other offices in the same company for the last five years. Each Board member holds office until his or her successor is elected and qualified, or until his or her earlier death, resignation, retirement, removal or disqualification. Under the terms of the Fund’s current Board member retirement policy, an Independent Board member must retire at the end of the calendar year in which he or she turns 75. However, if such retirement would cause the Fund to be out of compliance with Section 16 of the 1940 Act or any other regulations or guidance of the SEC, then such retirement and resignation will not become effective until such time as action has been taken for the Fund to be in compliance upon a Board member’s retirement. The “Independent Directors” consist of those Directors who are not “interested persons” of the Corporation, as that term is defined under the 1940 Act. The business address of each Director and officer, with the exception of Ms. Gemma and Mr. Kirchner, is 1825 Connecticut Avenue NW, Suite 400, Washington, DC 20009. As used below, “CRM” refers to Calvert Research and Management. Each Director oversees 39 funds in the Calvert fund complex. Each officer serves as an officer of certain other Calvert funds.
| Name and Year of Birth | Position with the | Position Start Date | Principal Occupation(s) and Directorships During Past Five Years and Other Relevant Experience | |||
| Interested Director | ||||||
John H. Streur(1) 1960 | Director and President | 2015 | President and Chief Executive Officer of Calvert Research and Management (since December 31, 2016). President and Chief Executive Officer of Calvert Investments, Inc. (January 2015-December 2016); Chief Executive Officer of Calvert Investment Distributors, Inc. (August 2015-December 2016); Chief Compliance Officer of Calvert Investment Management, Inc. (August 2015-April 2016); President and Director, Portfolio 21 Investments, Inc. (through October 2014); President, Chief Executive Officer and Director, Managers Investment Group LLC (through January 2012); President and Director, The Managers Funds and Managers AMG Funds (through January 2012). Other Directorships in the Last Five Years.Portfolio 21 Investments, Inc. (asset management) (through October 2014); Managers Investment Group LLC (asset management) (through January 2012); The Managers Funds (asset management) (through January 2012); Managers AMG Funds (asset management) (through January 2012); Calvert Impact Capital, Inc. | |||
| Independent Directors | ||||||
Richard L. Baird, Jr. 1948 | Director | 2016 | Regional Disaster Recovery Lead, American Red Cross of Greater Pennsylvania (since 2017). Volunteer, American Red Cross (since 2015). Former President and CEO of Adagio Health Inc. (retired in 2014) in Pittsburgh, PA. Other Directorships in the Last Five Years. None. | |||
Alice Gresham Bullock 1950 | Chair and Director | 2016 (Chair); 2008 (Director) | Professor Emerita at Howard University School of Law. Dean Emerita of Howard University School of Law and Deputy Director of the Association of American Law Schools (1992-1994). Other Directorships in the Last Five Years. None. | |||
Cari M. Dominguez 1949 | Director | 2016 | Former Chair of the U.S. Equal Employment Opportunity Commission. Other Directorships in the Last Five Years. Manpower, Inc. (employment agency); Triple S Management Corporation (managed care); National Association of Corporate Directors. | |||
John G. Guffey, Jr.(2) 1948 | Director | 2016 | President of Aurora Press Inc., a privately held publisher of trade paperbacks (since January 1997). Other Directorships in the Last Five Years. Calvert Impact Capital, Inc. (through December 31, 2018); Calvert Ventures, LLC. | |||
Miles D. Harper, III 1962 | Director | 2016 | Partner, Carr Riggs & Ingram (public accounting firm) since October 2014. Partner, Gainer Donnelly & Desroches (public accounting firm) (now Carr Riggs & Ingram), November 1999-September 2014). Other Directorships in the Last Five Years.Bridgeway Funds (9) (asset management). | |||
| 23 |
Table of Contents
Calvert
VP Nasdaq 100 Index Portfolio
December 31, 2019
Management and Organization — continued
| Name and Year of Birth | Position with the | Position Start Date | Principal Occupation(s) and Directorships During Past Five Years and Other Relevant Experience | |||
| Independent Directors (continued) | ||||||
Joy V. Jones 1950 | Director | 2016 | Attorney. Other Directorships in the Last Five Years.Conduit Street Restaurants SUD 2 Limited; Palm Management Restaurant Corporation. | |||
Anthony A. Williams 1951 | Director | 2016 | CEO and Executive Director of the Federal City Council (July 2012 to present); Senior Adviser and Independent Consultant for King and Spalding LLP (September 2015 to present); Executive Director of Global Government Practice at the Corporate Executive Board (January 2010 to January 2012). Other Directorships in the Last Five Years. Freddie Mac; Evoq Properties/ Meruelo Maddux Properties, Inc. (real estate management); Weston Solutions, Inc. (environmental services); Bipartisan Policy Center’s Debt Reduction Task Force; Chesapeake Bay Foundation; Catholic University of America; Urban Institute (research organization). | |||
| Name and Year of Birth | Position(s) with the | Position Start Date | Principal Occupation(s) During Past Five Years | |||
| Principal Officers who are not Directors | ||||||
Hope L. Brown 1973 | Chief Compliance Officer | 2014 | Chief Compliance Officer of 39 registered investment companies advised by CRM (since 2014). Vice President and Chief Compliance Officer, Wilmington Funds (2012-2014). | |||
Maureen A. Gemma(3) 1960 | Vice President, Secretary and Chief Legal Officer | 2016 | Vice President of CRM and officer of 39 registered investment companies advised by CRM (since 2016). Also Vice President of Eaton Vance and certain of its affiliates and officer of 159 registered investment companies advised or administered by Eaton Vance. | |||
James F. Kirchner(3) 1967 | Treasurer | 2016 | Vice President of CRM and officer of 39 registered investment companies advised by CRM (since 2016). Also Vice President of Eaton Vance and certain of its affiliates and officer of 159 registered investment companies advised or administered by Eaton Vance. | |||
| (1) | Mr. Streur is an interested person of the Fund because of his positions with the Fund’s adviser and certain affiliates. |
| (2) | Mr. Guffey is currently married to Rebecca L. Adamson, who served as a member of the Advisory Council through December 31, 2019. |
| (3) | The business address for Ms. Gemma and Mr. Kirchner is Two International Place, Boston, MA 02110. |
The SAI for the Fund includes additional information about the Directors and officers of the Fund and can be obtained without charge on Calvert’s website at www.calvert.com or by calling1-800-368-2745.
| 24 |
Table of Contents
Calvert Funds
Privacy.The Eaton Vance organization is committed to ensuring your financial privacy. Each entity listed below has adopted a privacy policy and procedures (“Privacy Program”) Eaton Vance believes is reasonably designed to protect your personal information and to govern when and with whom Eaton Vance may share your personal information.
| • | At the time of opening an account, Eaton Vance generally requires you to provide us with certain information such as name, address, social security number, tax status, account numbers, and account balances. This information is necessary for us to both open an account for you and to allow us to satisfy legal requirements such as applicable anti-money laundering reviews and know-your-customer requirements. |
| • | On an ongoing basis, in the normal course of servicing your account, Eaton Vance may share your information with unaffiliated third parties that perform various services for Eaton Vance and/or your account. These third parties include transfer agents, custodians, broker/dealers and our professional advisers, including auditors, accountants, and legal counsel. Eaton Vance may additionally share your personal information with our affiliates. |
| • | We believe our Privacy Program is reasonably designed to protect the confidentiality of your personal information and to prevent unauthorized access to that information. |
| • | We reserve the right to change our Privacy Program at any time upon proper notification to you. You may want to review our Privacy Program periodically for changes by accessing the link on our homepage: www.eatonvance.com. |
Our pledge of protecting your personal information applies to the following entities within the Eaton Vance organization: the Eaton Vance Family of Funds, Eaton Vance Management, Eaton Vance Investment Counsel, Eaton Vance Distributors, Inc., Eaton Vance Trust Company, Eaton Vance Management (International) Limited, Eaton Vance Advisers International Limited, Eaton Vance Global Advisors Limited, Eaton Vance Management’s Real Estate Investment Group, Boston Management and Research, Calvert Research and Management, and Calvert Funds. This Privacy Notice supersedes all previously issued privacy disclosures. For more information about our Privacy Program or about how your personal information may be used, please call 1-800-368-2745.
Delivery of Shareholder Documents. The Securities and Exchange Commission (SEC) permits funds to deliver only one copy of shareholder documents, including prospectuses, proxy statements and shareholder reports, to fund investors with multiple accounts at the same residential or post office box address. This practice is often called “householding” and it helps eliminate duplicate mailings to shareholders.Calvert funds, or your financial intermediary, may household the mailing of your documents indefinitely unless you instruct Calvert funds, or your financial intermediary, otherwise. If you would prefer that your Calvert fund documents not be householded, please contact Calvert funds at1-800-368-2745, or contact your financial intermediary. Your instructions that householding not apply to delivery of your Calvert fund documents will typically be effective within 30 days of receipt by Calvert funds or your financial intermediary. Separate statements will be generated for each separate account and will be householded as described above.
Portfolio Holdings. Each Calvert fund files a schedule of portfolio holdings on Part F to FormN-PORT with the SEC for the first and third quarters of each fiscal year. The FormN-PORT will be available on the Calvert funds’ website at www.calvert.com, by calling Calvert funds at1-800-368-2745 or in the EDGAR database on the SEC’s website at www.sec.gov.
Proxy Voting. The Proxy Voting Guidelines that each Calvert fund uses to determine how to vote proxies relating to portfolio securities is provided as an Appendix to the fund’s Statement of Additional Information. The Statement of Additional Information can be obtained free of charge by calling the Calvert funds at1-800-368-2745, by visiting the Calvert funds’ website at www.calvert.com or visiting the SEC’s website at www.sec.gov. Information regarding how a Calvert fund voted proxies relating to portfolio securities during the most recent12-month period ended June 30 is available by calling Calvert funds, by visiting the Calvert funds’ website at www.calvert.com or by visiting the SEC’s website at www.sec.gov.
| 25 |
Table of Contents
This Page Intentionally Left Blank
Table of Contents
This Page Intentionally Left Blank
Table of Contents
This Page Intentionally Left Blank
Table of Contents
Investment Adviser and Administrator
Calvert Research and Management
1825 Connecticut Avenue NW, Suite 400
Washington, DC 20009
Investment Sub-Adviser
Ameritas Investment Partners, Inc.
5945 R Street
Lincoln, NE 68505
Principal Underwriter*
Eaton Vance Distributors, Inc.
Two International Place
Boston, MA 02110
(617)482-8260
Custodian
State Street Bank and Trust Company
State Street Financial Center, One Lincoln Street
Boston, MA 02111
Transfer Agent
DST Asset Manager Solutions, Inc.
2000 Crown Colony Drive
Quincy, MA 02169
Independent Registered Public Accounting Firm
KPMG LLP
1601 Market Street
Philadelphia, PA 19103-2499
Fund Offices
1825 Connecticut Avenue NW, Suite 400
Washington, DC 20009
| * | FINRA BrokerCheck. Investors may check the background of their Investment Professional by contacting the Financial Industry Regulatory Authority (FINRA). FINRA BrokerCheck is a free tool to help investors check the professional background of current and former FINRA-registered securities firms and brokers. FINRA BrokerCheck is available by calling1-800-289-9999 and at www.FINRA.org. The FINRA BrokerCheck brochure describing this program is available to investors at www.FINRA.org. |
Table of Contents
Printed on recycled paper.

24229 12.31.19
Table of Contents

Calvert
VP Russell 2000® Small Cap Index Portfolio
Annual Report
December 31, 2019
Important Note. Beginning on January 1, 2021, as permitted by regulations adopted by the Securities and Exchange Commission, you may not receive paper copies of the Fund’s annual and semi-annual shareholder reports from the insurance company or plan sponsor unless you specifically request paper copies. Instead, the reports will be made available on a website and you will be notified by mail each time a report is posted and provided with a website address to access the report. Instructions for requesting paper copies will be provided by the insurance company, plan sponsor or your financial intermediary, as applicable. Please contact the insurance company, plan sponsor or your financial intermediary, as applicable, or follow instructions included with this disclosure, if any, for more information.

Table of Contents
Commodity Futures Trading Commission Registration. Effective December 31, 2012, the Commodity Futures Trading Commission (“CFTC”) adopted certain regulatory changes that subject registered investment companies and advisers to regulation by the CFTC if a fund invests more than a prescribed level of its assets in certain CFTC-regulated instruments (including futures, certain options and swap agreements) or markets itself as providing investment exposure to such instruments. The Fund and its adviser have claimed an exclusion from the definition of the term “commodity pool operator” under the Commodity Exchange Act. Accordingly, neither the Fund nor the adviser is subject to CFTC regulation.
Fund shares are not insured by the FDIC and are not deposits or other obligations of, or guaranteed by, any depository institution. Shares are subject to investment risks, including possible loss of principal invested.
This report must be preceded or accompanied by a current summary prospectus or prospectus. Before investing, investors should consider carefully the investment objective, risks, and charges and expenses of a mutual fund. This and other important information is contained in the summary prospectus and prospectus, which can be obtained from a financial intermediary. Prospective investors should read the prospectus carefully before investing. For further information, please call1-800-368-2745.
Table of Contents
Annual Report December 31, 2019
Calvert
VP Russell 2000® Small Cap Index Portfolio
Table of Contents
Calvert
VP Russell 2000® Small Cap Index Portfolio
December 31, 2019
Management’s Discussion of Fund Performance 1
Economic and Market Conditions
With virtually every U.S. equity index posting strong double-digit returns for the12-month period ended December 31, 2019 — and bond markets solidly in the black as well — 2019 was a good year for investments.
As the new year dawned in January 2019, investors appeared to be taking a “glass is half full” approach. Although U.S. manufacturing output and business investment remained weak — held back by slowing global growth and anon-again/off-again U.S.-China trade war — strong spending by U.S. consumers and dovish remarks by the U.S. Federal Reserve (the Fed) combined to lift investor sentiment. After four federal funds rate hikes the previous year, markets began to project the Fed might actually lower rates in 2019 to stimulate the economy. U.S. unemployment, meanwhile, remained low and hiring remained strong.
As a result, U.S. stocks across multiple markets climbed from January through April 2019. Overseas, central banks around the world began to cut interest rates and employ other tools to stimulate their respective economies. Even a global stock pullback in May — sparked by heightened concerns about the U.S.-China trade spat — proved to be temporary, and the U.S. and global stock rallies resumed in June and July.
After holding interest rates steady through the first half of the year, the Fed cut the federal funds rate on July 31, 2019 — its first reduction in over a decade — followed by two additional rate cuts in September and October to end the period at1.50%-1.75%. By end of the third quarter, 60 central banks around the world had lowered their interest rates as well.
After falling in August, U.S. equities rallied again during the final months of the period, spurred by optimism about a U.S.-China trade détente and better-than-expected U.S. employment reports. The year ended with two events in December that did much to allay investor concerns about international trade and tariffs: passage of the United States-Mexico-Canada Agreement by the U.S. House of Representatives and the Trump administration’s agreement to aso-called “phase–one” trade deal with China.
During the12-month period ended December 31, 2019, the blue-chip Dow Jones Industrial Average®2 returned 25.34%, while the broader U.S. equity market, as measured by the S&P 500® Index, returned 31.49%. The technology-laden Nasdaq Composite Index returned 36.69% during the period.Large-cap U.S. stocks, as measured by the S&P 500® Index, generally outperformed theirsmall-cap counterparts, as measured by the Russell 2000® Index. As a group, growth stocks outpaced value stocks in both large- andsmall-cap categories, as measured by the Russell growth and value indexes.
Investment Strategy
As an index fund, Calvert VP Russell 2000®Small Cap Index Portfolio (the Fund) seeks to replicate as closely as possible the holdings and match the performance of the Russell 2000®Index (the Index). To accomplish this, the Fund employs a passive management approach and holds each constituent of the Index in approximately the same proportion as the Index. The Fund may also invest in exchange-traded funds (ETFs) that provide the same exposure to the Index. Cash holdings may gain exposure to the Index via futures contracts, allowing the Fund’s assets to be fully invested.
Fund Performance
For the12-month period ended December 31, 2019, the Fund returned 25.08% for Class I shares at net asset value (NAV). By comparison, the Index returned 25.52% for the same period. The Index is unmanaged and returns do not reflect any fees and operating expenses.
Small-cap stocks had strong returns during the period, but lagged larger capitalization domestic stocks. Most sectors in the Index had positive, double-digit returns. Energy was the only sector with negative performance. Information technology, industrials, and real estate were the best performing sectors. Health care, financials, and industrials had the largest weights in the Index. The energy sector, which had one of the smallest weights, returned-7.01% during the period.
Futures contracts, which are regularly used to manage uninvested cash holdings in the Fund, had a meaningful positive impact on performance during the period.
See Endnotes and Additional Disclosures in this report.
Past performance is no guarantee of future results. Returns are historical and are calculated by determining the percentage change in net asset value (NAV) or offering price (as applicable) with all distributions reinvested. Investment return and principal value will fluctuate so that shares, when redeemed, may be worth more or less than their original cost. Performance for periods less than or equal to one year is cumulative. Performance is for the stated time period only; due to market volatility, current Fund performance may be lower or higher than the quoted return.
| 2 |
Table of Contents
Calvert
VP Russell 2000® Small Cap Index Portfolio
December 31, 2019
Portfolio Manager Kevin L. Keene, CFA of Ameritas Investment Partners, Inc.
| % Average Annual Total Returns 2,3 | Class Inception Date | Performance Inception Date | One Year | Five Years | Ten Years | |||||||||||||||
Class I at NAV | 04/27/2000 | 04/27/2000 | 25.08 | % | 7.80 | % | 11.21 | % | ||||||||||||
Class F at NAV | 10/04/2005 | 04/27/2000 | 24.82 | 7.54 | 10.97 | |||||||||||||||
| ||||||||||||||||||||
Russell 2000® Index | — | — | 25.52 | % | 8.22 | % | 11.82 | % | ||||||||||||
| % Total Annual Operating Expense Ratios 4 | Class I | Class F | ||||||||||||||||||
| Gross | 0.59 | % | 0.79 | % | ||||||||||||||||
| Net | 0.39 | 0.59 | ||||||||||||||||||
Growth of $10,000
This graph shows the change in value of a hypothetical investment of $10,000 in Class I of the Fund for the period indicated. For comparison, the same investment is shown in the indicated index.
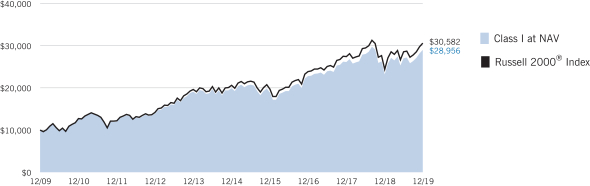
| Growth of Investment | Amount Invested | Period Beginning | At NAV | With Maximum Sales Charge | ||||||||||||
| Class F | $10,000 | 12/31/2009 | $28,327 | N.A. | ||||||||||||
See Endnotes and Additional Disclosures in this report.
Past performance is no guarantee of future results. Returns are historical and are calculated by determining the percentage change in net asset value (NAV) or offering price (as applicable) with all distributions reinvested. Investment return and principal value will fluctuate so that shares, when redeemed, may be worth more or less than their original cost. Performance for periods less than or equal to one year is cumulative. Performance is for the stated time period only; due to market volatility, current Fund performance may be lower or higher than the quoted return.
| 3 |
Table of Contents
Calvert
VP Russell 2000® Small Cap Index Portfolio
December 31, 2019
| Sector Allocation (% of net assets) 5 | ||||
Health Care | 16.5 | % | ||
Financials | 16.3 | |||
Industrials | 14.6 | |||
Information Technology | 12.4 | |||
Consumer Discretionary | 10.0 | |||
Real Estate | 7.1 | |||
Materials | 3.6 | |||
Utilities | 3.3 | |||
Energy | 2.9 | |||
Consumer Staples | 2.8 | |||
Exchange-Traded Funds | 2.1 | |||
Communication Services | 2.1 | |||
Total | 93.7 | % | ||
| Top 10 Holdings (% of net assets) 5 | ||||
iShares Russell 2000 ETF | 2.1 | % | ||
Novocure, Ltd. | 0.3 | |||
Medicines Co. (The) | 0.3 | |||
Lumentum Holdings, Inc. | 0.3 | |||
Generac Holdings, Inc. | 0.3 | |||
Arrowhead Pharmaceuticals, Inc. | 0.3 | |||
Haemonetics Corp. | 0.3 | |||
Teladoc Health, Inc. | 0.2 | |||
Performance Food Group Co. | 0.2 | |||
Marriott Vacations Worldwide Corp. | 0.2 | |||
Total | 4.5 | % | ||
See Endnotes and Additional Disclosures in this report.
| 4 |
Table of Contents
Calvert
VP Russell 2000® Small Cap Index Portfolio
December 31, 2019
Endnotes and Additional Disclosures
| 1 | The views expressed in this report are those of the portfolio manager(s) and are current only through the date stated at the top of this page. These views are subject to change at any time based upon market or other conditions, and Calvert and the Fund(s) disclaim any responsibility to update such views. These views may not be relied upon as investment advice and, because investment decisions are based on many factors, may not be relied upon as an indication of trading intent on behalf of any Calvert fund. This commentary may contain statements that are not historical facts, referred to as “forward looking statements.” The Fund’s actual future results may differ significantly from those stated in any forward looking statement, depending on factors such as changes in securities or financial markets or general economic conditions, the volume of sales and purchases of Fund shares, the continuation of investment advisory, administrative and service contracts, and other risks discussed from time to time in the Fund’s filings with the Securities and Exchange Commission. |
| 2 | Dow Jones Industrial Average® is a price-weighted average of 30 blue-chip stocks that are generally the leaders in their industry. S&P 500® Index is an unmanaged index of large-cap stocks commonly used as a measure of U.S. stock market performance. S&P Dow Jones Indices are a product of S&P Dow Jones Indices LLC (“S&P DJI”) and have been licensed for use. S&P® and S&P 500® are registered trademarks of S&P DJI; Dow Jones® is a registered trademark of Dow Jones Trademark Holdings LLC (“Dow Jones”); S&P DJI, Dow Jones and their respective affiliates do not sponsor, endorse, sell or promote the Fund, will not have any liability with respect thereto and do not have any liability for any errors, omissions, or interruptions of the S&P Dow Jones Indices. Nasdaq Composite Index is a market capitalization-weighted index of all domestic and international securities listed on Nasdaq. Source: Nasdaq, Inc. The information is provided by Nasdaq (with its affiliates, are referred to as the “Corporations”) and Nasdaq’s third party licensors on an “as is” basis and the Corporations make no guarantees and bear no liability of any kind with respect to the information or the Fund. Russell 2000® Index is an unmanaged index of 2,000 U.S. small-cap stocks. Unless otherwise stated, index returns do not reflect the effect of any applicable sales charges, commissions, expenses, taxes or leverage, as applicable. It is not possible to invest directly in an index. |
| 3 | There is no sales charge. Insurance-related charges are not included in the calculation of returns. If such charges were reflected, the returns would be lower. Please refer to the report for your insurance contract for performance data reflecting insurance-related charges. |
Calvert Research and Management became the investment adviser to the Fund on December 31, 2016. Performance reflected prior to such date is that of the Fund’s former investment adviser. |
| 4 | Source: Fund prospectus. Net expense ratios reflect a contractual expense reimbursement that continues through 4/30/20. Without the reimbursement, performance would have been lower. The expense ratios for the current reporting period can be found in the Financial Highlights section of this report. |
| 5 | Excludes cash and cash equivalents. |
| 5 |
Table of Contents
Calvert
VP Russell 2000® Small Cap Index Portfolio
December 31, 2019
Example
As a Fund shareholder, you incur ongoing costs, including management fees; distribution and/or service fees; and other Fund expenses. This Example is intended to help you understand your ongoing costs (in dollars) of Fund investing and to compare these costs with the ongoing costs of investing in other mutual funds. The Example is based on an investment of $1,000 invested at the beginning of the period and held for the entire period (July 1, 2019 to December 31, 2019).
Actual Expenses
The first section of the table below provides information about actual account values and actual expenses. You may use the information in this section, together with the amount you invested, to estimate the expenses that you paid over the period. Simply divide your account value by $1,000 (for example, an $8,600 account value divided by $1,000 = 8.6), then multiply the result by the number in the first section under the heading entitled “Expenses Paid During Period” to estimate the expenses you paid on your account during this period.
Hypothetical Example for Comparison Purposes
The second section of the table below provides information about hypothetical account values and hypothetical expenses based on the actual Fund expense ratio and an assumed rate of return of 5% per year (before expenses), which is not the actual Fund return. The hypothetical account values and expenses may not be used to estimate the actual ending account balance or expenses you paid for the period. You may use this information to compare the ongoing costs of investing in the Fund and other funds. To do so, compare this 5% hypothetical example with the 5% hypothetical examples that appear in the shareholder reports of the other funds.
Please note that the expenses shown in the table are meant to highlight your ongoing costs only and do not reflect expenses and charges which are, or may be imposed under the variable annuity contract or variable life insurance policy (variable contracts) (if applicable) through which your investment in the Fund is made. Therefore, the second section of the table is useful in comparing ongoing costs associated with an investment in vehicles which fund benefits under variable contracts, and will not help you determine the relative total costs of investing in the Fund through variable contracts. In addition, if these expenses and charges imposed under the variable contracts were included, your costs would have been higher.
| Beginning Account Value (7/1/19) | Ending Account Value (12/31/19) | Expenses Paid During Period* (7/1/19 – 12/31/19) | Annualized Expense Ratio | |||||||||||||
Actual | ||||||||||||||||
Class I | $ | 1,000.00 | $ | 1,071.10 | $ | 2.04 | ** | 0.39 | % | |||||||
Class F | $ | 1,000.00 | $ | 1,070.00 | $ | 3.08 | ** | 0.59 | % | |||||||
Hypothetical | ||||||||||||||||
(5% return per year before expenses) | ||||||||||||||||
Class I | $ | 1,000.00 | $ | 1,023.24 | $ | 1.99 | ** | 0.39 | % | |||||||
Class F | $ | 1,000.00 | $ | 1,022.23 | $ | 3.01 | ** | 0.59 | % | |||||||
| * | Expenses are equal to the Fund’s annualized expense ratio for the indicated Class, multiplied by the average account value over the period, multiplied by 184/365 (to reflect theone-half year period). The Example assumes that the $1,000 was invested at the net asset value per share determined at the close of business on June 30, 2019. Expenses shown do not include insurance-related charges. |
| ** | Absent a waiver and/or reimbursement of expenses by an affiliate, expenses would be higher. |
| 6 |
Table of Contents
Calvert
VP Russell 2000® Small Cap Index Portfolio
December 31, 2019
Schedule of Investments
| Common Stocks — 91.6% |
| |||||||
| Security | Shares | Value | ||||||
| Aerospace & Defense — 1.2% | ||||||||
AAR Corp. | 2,929 | $ | 132,098 | |||||
Aerojet Rocketdyne Holdings, Inc.(1) | 6,419 | 293,092 | ||||||
AeroVironment, Inc.(1) | 1,860 | 114,836 | ||||||
Astronics Corp.(1) | 2,153 | 60,176 | ||||||
Axon Enterprise, Inc.(1) | 5,092 | 373,142 | ||||||
Cubic Corp. | 2,731 | 173,610 | ||||||
Ducommun, Inc.(1) | 914 | 46,184 | ||||||
Kratos Defense & Security Solutions, Inc.(1) | 7,918 | 142,603 | ||||||
Maxar Technologies, Inc. | 4,750 | 74,432 | ||||||
Mercury Systems, Inc.(1) | 4,732 | 327,029 | ||||||
Moog, Inc., Class A | 2,801 | 239,009 | ||||||
National Presto Industries, Inc.(2) | 420 | 37,124 | ||||||
Park Aerospace Corp. | 1,804 | 29,351 | ||||||
Parsons Corp.(1) | 1,648 | 68,029 | ||||||
Triumph Group, Inc. | 4,259 | 107,625 | ||||||
Vectrus, Inc.(1) | 987 | 50,594 | ||||||
Wesco Aircraft Holdings, Inc.(1) | 4,699 | 51,783 | ||||||
| $ | 2,320,717 | |||||||
| Air Freight & Logistics — 0.3% | ||||||||
Air Transport Services Group, Inc.(1) | 5,010 | $ | 117,535 | |||||
Atlas Air Worldwide Holdings, Inc.(1) | 1,930 | 53,210 | ||||||
Echo Global Logistics, Inc.(1) | 2,286 | 47,320 | ||||||
Forward Air Corp. | 2,396 | 167,600 | ||||||
Hub Group, Inc., Class A(1) | 2,840 | 145,664 | ||||||
Radiant Logistics, Inc.(1) | 3,434 | 19,127 | ||||||
| $ | 550,456 | |||||||
| Airlines — 0.4% | ||||||||
Allegiant Travel Co., Class A | 1,137 | $ | 197,883 | |||||
Hawaiian Holdings, Inc. | 3,989 | 116,838 | ||||||
Mesa Air Group, Inc.(1) | 1,804 | 16,128 | ||||||
SkyWest, Inc. | 4,235 | 273,708 | ||||||
Spirit Airlines, Inc.(1) | 6,027 | 242,948 | ||||||
| $ | 847,505 | |||||||
| Auto Components — 1.0% | ||||||||
Adient PLC (1) | 7,706 | $ | 163,752 | |||||
American Axle & Manufacturing Holdings, Inc.(1) | 9,789 | 105,330 | ||||||
Cooper Tire & Rubber Co. | 4,233 | 121,699 | ||||||
Cooper-Standard Holdings, Inc.(1) | 1,470 | 48,745 | ||||||
Dana, Inc. | 12,607 | 229,447 | ||||||
Dorman Products, Inc.(1) | 2,276 | 172,339 | ||||||
| Security | Shares | Value | ||||||
| Auto Components (continued) | ||||||||
Fox Factory Holding Corp.(1) | 3,306 | $ | 229,998 | |||||
Gentherm, Inc.(1) | 2,898 | 128,642 | ||||||
LCI Industries | 2,130 | 228,187 | ||||||
Modine Manufacturing Co.(1) | 4,047 | 31,162 | ||||||
Motorcar Parts of America, Inc.(1) | 1,400 | 30,842 | ||||||
Standard Motor Products, Inc. | 1,855 | 98,723 | ||||||
Stoneridge, Inc.(1) | 2,174 | 63,742 | ||||||
Tenneco, Inc., Class A | 4,240 | 55,544 | ||||||
Visteon Corp.(1) | 2,454 | 212,492 | ||||||
| $ | 1,920,644 | |||||||
| Automobiles — 0.1% | ||||||||
Winnebago Industries, Inc. | 2,733 | $ | 144,794 | |||||
| Banks — 9.0% | ||||||||
1st Constitution Bancorp | 623 | $ | 13,787 | |||||
1st Source Corp. | 1,262 | 65,473 | ||||||
ACNB Corp. | 464 | 17,548 | ||||||
Alerus Financial Corp. | 260 | 5,941 | ||||||
Allegiance Bancshares, Inc.(1) | 1,683 | 63,281 | ||||||
Amalgamated Bank, Class A | 1,217 | 23,671 | ||||||
Amerant Bancorp, Inc.(1) | 1,707 | 37,196 | ||||||
American National Bankshares, Inc. | 942 | 37,275 | ||||||
Ameris Bancorp | 5,343 | 227,291 | ||||||
Ames National Corp. | 756 | 21,213 | ||||||
Arrow Financial Corp. | 1,126 | 42,563 | ||||||
Atlantic Capital Bancshares, Inc.(1) | 1,833 | 33,636 | ||||||
Atlantic Union Bankshares Corp. | 6,867 | 257,856 | ||||||
Banc of California, Inc. | 3,886 | 66,761 | ||||||
BancFirst Corp. | 1,626 | 101,527 | ||||||
Bancorp, Inc. (The)(1) | 4,384 | 56,860 | ||||||
BancorpSouth Bank | 8,353 | 262,368 | ||||||
Bank First Corp. | 510 | 35,705 | ||||||
Bank of Commerce Holdings | 1,360 | 15,735 | ||||||
Bank of Marin Bancorp | 1,090 | 49,104 | ||||||
Bank of NT Butterfield & Son, Ltd. (The) | 4,785 | 177,141 | ||||||
Bank of Princeton (The) | 486 | 15,304 | ||||||
Bank7 Corp. | 280 | 5,309 | ||||||
BankFinancial Corp. | 1,183 | 15,474 | ||||||
Bankwell Financial Group, Inc. | 446 | 12,863 | ||||||
Banner Corp. | 2,944 | 166,601 | ||||||
Bar Harbor Bankshares | 1,146 | 29,097 | ||||||
Baycom Corp.(1) | 848 | 19,284 | ||||||
BCB Bancorp, Inc. | 832 | 11,473 | ||||||
Berkshire Hills Bancorp, Inc. | 4,064 | 133,624 | ||||||
Boston Private Financial Holdings, Inc. | 7,071 | 85,064 | ||||||
| 7 | See Notes to Financial Statements. |
Table of Contents
Calvert
VP Russell 2000® Small Cap Index Portfolio
December 31, 2019
Schedule of Investments — continued
| Security | Shares | Value | ||||||
| Banks (continued) | ||||||||
Bridge Bancorp, Inc. | 1,543 | $ | 51,737 | |||||
Brookline Bancorp, Inc. | 6,592 | 108,504 | ||||||
Bryn Mawr Bank Corp. | 1,617 | 66,685 | ||||||
Business First Bancshares, Inc. | 1,096 | 27,323 | ||||||
Byline Bancorp, Inc. | 1,998 | 39,101 | ||||||
C&F Financial Corp. | 251 | 13,888 | ||||||
Cadence BanCorp, Class A | 10,674 | 193,520 | ||||||
Cambridge Bancorp(2) | 320 | 25,648 | ||||||
Camden National Corp. | 1,318 | 60,707 | ||||||
Capital Bancorp, Inc.(1) | 525 | 7,817 | ||||||
Capital City Bank Group, Inc. | 1,232 | 37,576 | ||||||
Capstar Financial Holdings, Inc. | 1,274 | 21,212 | ||||||
Carolina Financial Corp. | 1,839 | 79,500 | ||||||
Carter Bank & Trust(1) | 1,998 | 47,393 | ||||||
Cathay General Bancorp | 6,691 | 254,593 | ||||||
CBTX, Inc. | 1,510 | 46,991 | ||||||
CenterState Bank Corp. | 10,365 | 258,918 | ||||||
Central Pacific Financial Corp. | 2,337 | 69,128 | ||||||
Central Valley Community Bancorp | 682 | 14,779 | ||||||
Century Bancorp, Inc., Class A | 277 | 24,919 | ||||||
Chemung Financial Corp. | 245 | 10,413 | ||||||
Citizens & Northern Corp. | 1,125 | 31,781 | ||||||
City Holding Co. | 1,332 | 109,157 | ||||||
Civista Bancshares, Inc. | 1,318 | 31,632 | ||||||
CNB Financial Corp. | 1,282 | 41,896 | ||||||
Coastal Financial Corp.(1) | 530 | 8,729 | ||||||
Codorus Valley Bancorp, Inc. | 729 | 16,789 | ||||||
Colony Bankcorp, Inc. | 655 | 10,807 | ||||||
Columbia Banking System, Inc. | 6,187 | 251,718 | ||||||
Community Bank System, Inc. | 4,439 | 314,903 | ||||||
Community Bankers Trust Corp. | 1,884 | 16,730 | ||||||
Community Financial Corp. (The) | 347 | 12,343 | ||||||
Community Trust Bancorp, Inc. | 1,316 | 61,378 | ||||||
ConnectOne Bancorp, Inc. | 2,830 | 72,788 | ||||||
CrossFirst Bankshares, Inc.(1)(2) | 550 | 7,931 | ||||||
Customers Bancorp, Inc.(1) | 2,287 | 54,453 | ||||||
CVB Financial Corp. | 11,410 | 246,228 | ||||||
Dime Community Bancshares, Inc. | 2,786 | 58,200 | ||||||
Eagle Bancorp, Inc. | 2,865 | 139,325 | ||||||
Enterprise Bancorp, Inc. | 790 | 26,757 | ||||||
Enterprise Financial Services Corp. | 2,151 | 103,700 | ||||||
Equity Bancshares, Inc., Class A(1) | 1,296 | 40,008 | ||||||
Esquire Financial Holdings, Inc.(1) | 506 | 13,191 | ||||||
Evans Bancorp, Inc. | 406 | 16,281 | ||||||
Farmers & Merchants Bancorp, Inc.(2) | 778 | 23,457 | ||||||
Farmers National Banc Corp. | 1,937 | 31,612 | ||||||
| Security | Shares | Value | ||||||
| Banks (continued) | ||||||||
FB Financial Corp. | 1,361 | $ | 53,882 | |||||
Fidelity D&D Bancorp, Inc.(2) | 249 | 15,490 | ||||||
Financial Institutions, Inc. | 1,360 | 43,656 | ||||||
First Bancorp, Inc | 2,504 | 99,935 | ||||||
First Bancorp, Inc. / ME | 691 | 20,889 | ||||||
First BanCorp. / Puerto Rico | 18,815 | 199,251 | ||||||
First Bancshares, Inc. (The) | 1,422 | 50,509 | ||||||
First Bank / Hamilton | 1,315 | 14,531 | ||||||
First Busey Corp. | 4,434 | 121,935 | ||||||
First Business Financial Services, Inc. | 708 | 18,642 | ||||||
First Capital, Inc. | 286 | 20,878 | ||||||
First Choice Bancorp | 879 | 23,698 | ||||||
First Commonwealth Financial Corp. | 8,496 | 123,277 | ||||||
First Community Bankshares, Inc. | 1,464 | 45,413 | ||||||
First Financial Bancorp | 8,499 | 216,215 | ||||||
First Financial Bankshares, Inc. | 11,357 | 398,631 | ||||||
First Financial Corp. / IN | 1,151 | 52,624 | ||||||
First Financial Northwest, Inc. | 708 | 10,578 | ||||||
First Foundation, Inc. | 3,136 | 54,566 | ||||||
First Guaranty Bancshares, Inc. | 412 | 8,969 | ||||||
First Internet Bancorp | 680 | 16,123 | ||||||
First Interstate BancSystem, Inc., Class A | 3,196 | 133,976 | ||||||
First Merchants Corp. | 4,648 | 193,310 | ||||||
First Mid Bancshares, Inc. | 1,248 | 43,992 | ||||||
First Midwest Bancorp, Inc. | 9,316 | 214,827 | ||||||
First Northwest Bancorp | 864 | 15,664 | ||||||
First of Long Island Corp. (The) | 2,051 | 51,439 | ||||||
Flushing Financial Corp. | 2,270 | 49,043 | ||||||
FNCB Bancorp, Inc. | 1,509 | 12,751 | ||||||
Franklin Financial Network, Inc. | 950 | 32,613 | ||||||
Franklin Financial Services Corp. | 369 | 14,277 | ||||||
Fulton Financial Corp. | 14,198 | 247,471 | ||||||
FVCBankcorp, Inc.(1) | 1,064 | 18,588 | ||||||
German American Bancorp, Inc. | 2,058 | 73,306 | ||||||
Glacier Bancorp, Inc. | 7,594 | 349,248 | ||||||
Great Southern Bancorp, Inc. | 940 | 59,521 | ||||||
Great Western Bancorp, Inc. | 4,997 | 173,596 | ||||||
Guaranty Bancshares, Inc. | 666 | 21,898 | ||||||
Hancock Whitney Corp. | 7,461 | 327,389 | ||||||
Hanmi Financial Corp. | 2,767 | 55,326 | ||||||
HarborOne Bancorp, Inc.(1) | 2,211 | 24,299 | ||||||
Hawthorn Bancshares, Inc. | 499 | 12,724 | ||||||
HBT Financial, Inc.(1) | 782 | 14,850 | ||||||
Heartland Financial USA, Inc. | 3,037 | 151,060 | ||||||
Heritage Commerce Corp. | 4,704 | 60,352 | ||||||
Heritage Financial Corp. | 3,121 | 88,324 | ||||||
| 8 | See Notes to Financial Statements. |
Table of Contents
Calvert
VP Russell 2000® Small Cap Index Portfolio
December 31, 2019
Schedule of Investments — continued
| Security | Shares | Value | ||||||
| Banks (continued) | ||||||||
Hilltop Holdings, Inc. | 6,020 | $ | 150,079 | |||||
Home BancShares, Inc. | 13,516 | 265,725 | ||||||
HomeTrust Bancshares, Inc. | 1,500 | 40,245 | ||||||
Hope Bancorp, Inc. | 10,521 | 156,342 | ||||||
Horizon Bancorp | 3,088 | 58,672 | ||||||
Howard Bancorp, Inc.(1) | 773 | 13,048 | ||||||
IBERIABANK Corp. | 4,562 | 341,374 | ||||||
Independent Bank Corp. | 2,918 | 242,923 | ||||||
Independent Bank Corp. / MI | 1,901 | 43,058 | ||||||
Independent Bank Group, Inc. | 3,094 | 171,531 | ||||||
International Bancshares Corp. | 4,729 | 203,678 | ||||||
Investar Holding Corp. | 717 | 17,208 | ||||||
Investors Bancorp, Inc. | 20,179 | 240,433 | ||||||
Lakeland Bancorp, Inc. | 3,940 | 68,477 | ||||||
Lakeland Financial Corp. | 2,121 | 103,781 | ||||||
LCNB Corp. | 1,068 | 20,612 | ||||||
Level One Bancorp, Inc. | 443 | 11,146 | ||||||
Live Oak Bancshares, Inc.(2) | 1,938 | 36,841 | ||||||
Macatawa Bank Corp. | 2,061 | 22,939 | ||||||
Mackinac Financial Corp. | 813 | 14,195 | ||||||
MainStreet Bancshares, Inc.(1) | 626 | 14,398 | ||||||
Malvern Bancorp, Inc.(1) | 564 | 13,023 | ||||||
Mercantile Bank Corp. | 1,239 | 45,186 | ||||||
Metrocity Bankshares, Inc. | 1,365 | 23,901 | ||||||
Metropolitan Bank Holding Corp.(1) | 542 | 26,141 | ||||||
Mid Penn Bancorp, Inc. | 399 | 11,491 | ||||||
Midland States Bancorp, Inc. | 1,739 | 50,361 | ||||||
MidWestOne Financial Group, Inc. | 980 | 35,505 | ||||||
MutualFirst Financial, Inc. | 424 | 16,820 | ||||||
MVB Financial Corp. | 740 | 18,441 | ||||||
National Bank Holdings Corp., Class A | 2,417 | 85,127 | ||||||
National Bankshares, Inc. | 531 | 23,858 | ||||||
NBT Bancorp, Inc. | 3,663 | 148,571 | ||||||
Nicolet Bankshares, Inc.(1) | 802 | 59,228 | ||||||
Northeast Bank | 637 | 14,008 | ||||||
Northrim BanCorp, Inc. | 525 | 20,107 | ||||||
Norwood Financial Corp. | 502 | 19,528 | ||||||
Oak Valley Bancorp | 573 | 11,151 | ||||||
OFG Bancorp | 4,325 | 102,113 | ||||||
Ohio Valley Banc Corp. | 358 | 14,184 | ||||||
Old National Bancorp | 14,955 | 273,527 | ||||||
Old Second Bancorp, Inc. | 2,274 | 30,631 | ||||||
Opus Bank | 1,820 | 47,083 | ||||||
Origin Bancorp, Inc.(2) | 1,666 | 63,041 | ||||||
Orrstown Financial Services, Inc. | 900 | 20,358 | ||||||
Pacific Mercantile Bancorp(1) | 1,193 | 9,687 | ||||||
| Security | Shares | Value | ||||||
| Banks (continued) | ||||||||
Pacific Premier Bancorp, Inc. | 5,168 | $ | 168,503 | |||||
Park National Corp. | 1,149 | 117,635 | ||||||
Parke Bancorp, Inc. | 552 | 14,015 | ||||||
PCB Bancorp | 976 | 16,865 | ||||||
Peapack Gladstone Financial Corp. | 1,655 | 51,139 | ||||||
Penns Woods Bancorp, Inc. | 622 | 22,118 | ||||||
Peoples Bancorp of North Carolina, Inc. | 408 | 13,403 | ||||||
Peoples Bancorp, Inc. | 1,418 | 49,148 | ||||||
Peoples Financial Services Corp. | 676 | 34,037 | ||||||
People’s Utah Bancorp | 1,248 | 37,590 | ||||||
Preferred Bank | 1,229 | 73,851 | ||||||
Premier Financial Bancorp, Inc. | 911 | 16,526 | ||||||
QCR Holdings, Inc. | 1,290 | 56,579 | ||||||
RBB Bancorp | 1,147 | 24,282 | ||||||
Red River Bancshares, Inc.(1) | 422 | 23,657 | ||||||
Reliant Bancorp, Inc. | 609 | 13,544 | ||||||
Renasant Corp. | 4,869 | 172,460 | ||||||
Republic Bancorp, Inc., Class A | 907 | 42,448 | ||||||
Republic First Bancorp, Inc.(1) | 4,071 | 17,017 | ||||||
Richmond Mutual Bancorporation, Inc.(1) | 1,092 | 17,428 | ||||||
S&T Bancorp, Inc. | 3,252 | 131,023 | ||||||
Sandy Spring Bancorp, Inc. | 3,090 | 117,049 | ||||||
SB One Bancorp | 601 | 14,977 | ||||||
Seacoast Banking Corp. of Florida(1) | 4,301 | 131,482 | ||||||
Select Bancorp, Inc.(1) | 954 | 11,734 | ||||||
ServisFirst Bancshares, Inc. | 4,180 | 157,502 | ||||||
Shore Bancshares, Inc. | 977 | 16,961 | ||||||
Sierra Bancorp | 1,243 | 36,196 | ||||||
Silvergate Capital Corp., Class A(1) | 275 | 4,375 | ||||||
Simmons First National Corp., Class A | 7,977 | 213,704 | ||||||
SmartFinancial, Inc. | 1,098 | 25,968 | ||||||
South Plains Financial, Inc. | 868 | 18,115 | ||||||
South State Corp. | 2,956 | 256,433 | ||||||
Southern First Bancshares, Inc.(1) | 613 | 26,046 | ||||||
Southern National Bancorp of Virginia, Inc. | 1,573 | 25,719 | ||||||
Southside Bancshares, Inc. | 2,786 | 103,472 | ||||||
Spirit of Texas Bancshares, Inc.(1) | 1,176 | 27,048 | ||||||
Stock Yards Bancorp, Inc. | 1,843 | 75,674 | ||||||
Summit Financial Group, Inc. | 955 | 25,871 | ||||||
Tompkins Financial Corp. | 1,253 | 114,649 | ||||||
TowneBank | 5,819 | 161,885 | ||||||
TriCo Bancshares | 2,280 | 93,047 | ||||||
TriState Capital Holdings, Inc.(1) | 1,979 | 51,691 | ||||||
Triumph Bancorp, Inc.(1) | 1,993 | 75,774 | ||||||
Trustmark Corp. | 5,505 | 189,978 | ||||||
UMB Financial Corp. | 3,879 | 266,255 | ||||||
| 9 | See Notes to Financial Statements. |
Table of Contents
Calvert
VP Russell 2000® Small Cap Index Portfolio
December 31, 2019
Schedule of Investments — continued
| Security | Shares | Value | ||||||
| Banks (continued) | ||||||||
Union Bankshares, Inc. | 303 | $ | 10,987 | |||||
United Bankshares, Inc. | 8,520 | 329,383 | ||||||
United Community Banks, Inc. | 6,890 | 212,763 | ||||||
United Security Bancshares | 1,143 | 12,264 | ||||||
Unity Bancorp, Inc. | 677 | 15,280 | ||||||
Univest Financial Corp. | 2,279 | 61,032 | ||||||
Valley National Bancorp | 33,841 | 387,479 | ||||||
Veritex Holdings, Inc. | 4,496 | 130,968 | ||||||
Washington Trust Bancorp, Inc. | 1,232 | 66,269 | ||||||
WesBanco, Inc. | 5,658 | 213,816 | ||||||
West Bancorporation, Inc. | 1,387 | 35,549 | ||||||
Westamerica BanCorp. | 2,275 | 154,177 | ||||||
| $ | 17,762,323 | |||||||
| Beverages — 0.3% | ||||||||
Boston Beer Co., Inc. (The), Class A(1)(2) | 734 | $ | 277,342 | |||||
Celsius Holdings, Inc.(1) | 1,928 | 9,312 | ||||||
Coca-Cola Consolidated, Inc. | 389 | 110,496 | ||||||
Craft Brew Alliance, Inc.(1) | 855 | 14,108 | ||||||
MGP Ingredients, Inc.(2) | 1,083 | 52,471 | ||||||
National Beverage Corp.(1)(2) | 989 | 50,459 | ||||||
New Age Beverages Corp.(1)(2) | 6,381 | 11,613 | ||||||
Primo Water Corp.(1)(2) | 2,722 | 30,554 | ||||||
| $ | 556,355 | |||||||
| Biotechnology — 7.4% | ||||||||
89bio, Inc.(1) | 255 | $ | 6,704 | |||||
Abeona Therapeutics, Inc.(1) | 2,704 | 8,842 | ||||||
ACADIA Pharmaceuticals, Inc.(1)(2) | 9,675 | 413,896 | ||||||
Acceleron Pharma, Inc.(1) | 3,829 | 203,014 | ||||||
Achillion Pharmaceuticals, Inc.(1) | 11,893 | 71,715 | ||||||
Acorda Therapeutics, Inc.(1) | 3,713 | 7,575 | ||||||
Adamas Pharmaceuticals, Inc.(1) | 1,883 | 7,137 | ||||||
ADMA Biologics, Inc.(1) | 4,185 | 16,740 | ||||||
Aduro Biotech, Inc.(1) | 5,545 | 6,543 | ||||||
Adverum Biotechnologies, Inc.(1) | 4,398 | 50,665 | ||||||
Aeglea BioTherapeutics, Inc.(1) | 1,379 | 10,536 | ||||||
Affimed NV(1) | 5,312 | 14,555 | ||||||
Agenus, Inc.(1) | 9,008 | 36,663 | ||||||
AgeX Therapeutics, Inc.(1)(2) | 600 | 1,092 | ||||||
Aimmune Therapeutics, Inc.(1)(2) | 3,876 | 129,730 | ||||||
Akcea Therapeutics, Inc.(1)(2) | 1,275 | 21,599 | ||||||
Akebia Therapeutics, Inc.(1)(2) | 10,148 | 64,135 | ||||||
Akero Therapeutics, Inc.(1) | 400 | 8,878 | ||||||
Albireo Pharma, Inc.(1) | 688 | 17,489 | ||||||
| Security | Shares | Value | ||||||
| Biotechnology (continued) | ||||||||
Aldeyra Therapeutics, Inc.(1) | 1,388 | $ | 8,064 | |||||
Alector, Inc.(1)(2) | 2,519 | 43,402 | ||||||
Allakos, Inc.(1)(2) | 1,711 | 163,161 | ||||||
Allogene Therapeutics, Inc.(1)(2) | 3,351 | 87,059 | ||||||
AMAG Pharmaceuticals, Inc.(1)(2) | 3,012 | 36,656 | ||||||
Amicus Therapeutics, Inc.(1) | 22,362 | 217,806 | ||||||
AnaptysBio, Inc.(1) | 2,097 | 34,076 | ||||||
Anavex Life Sciences Corp.(1)(2) | 3,787 | 9,808 | ||||||
Anika Therapeutics, Inc.(1) | 1,202 | 62,324 | ||||||
Apellis Pharmaceuticals, Inc.(1) | 4,140 | 126,767 | ||||||
Applied Therapeutics, Inc.(1)(2) | 549 | 14,977 | ||||||
Aprea Therapeutics, Inc.(1) | 555 | 25,469 | ||||||
Arcus Biosciences, Inc.(1) | 2,532 | 25,573 | ||||||
Ardelyx, Inc.(1) | 3,393 | 25,464 | ||||||
Arena Pharmaceuticals, Inc.(1) | 4,389 | 199,348 | ||||||
ArQule, Inc.(1) | 9,797 | 195,548 | ||||||
Arrowhead Pharmaceuticals, Inc.(1)(2) | 8,120 | 515,052 | ||||||
Assembly Biosciences, Inc.(1) | 1,696 | 34,700 | ||||||
Atara Biotherapeutics, Inc.(1) | 4,491 | 73,967 | ||||||
Athenex, Inc.(1)(2) | 5,678 | 86,703 | ||||||
Athersys, Inc.(1)(2) | 11,234 | 13,818 | ||||||
Atreca, Inc., Class A(1)(2) | 550 | 8,509 | ||||||
Audentes Therapeutics, Inc.(1) | 3,930 | 235,171 | ||||||
Avid Bioservices, Inc.(1) | 4,695 | 36,011 | ||||||
Avrobio, Inc.(1) | 1,713 | 34,483 | ||||||
Axcella Health, Inc.(1)(2) | 145 | 581 | ||||||
Baudax Bio, Inc.(1) | 478 | 3,308 | ||||||
Beyondspring, Inc.(1)(2) | 944 | 14,632 | ||||||
BioCryst Pharmaceuticals, Inc.(1)(2) | 12,730 | 43,918 | ||||||
Biohaven Pharmaceutical Holding Co., Ltd.(1) | 3,460 | 188,362 | ||||||
BioSpecifics Technologies Corp.(1) | 496 | 28,242 | ||||||
Bioxcel Therapeutics, Inc.(1) | 531 | 7,758 | ||||||
Blueprint Medicines Corp.(1)(2) | 4,267 | 341,829 | ||||||
Bridgebio Pharma, Inc.(1) | 1,878 | 65,824 | ||||||
Cabaletta Bio, Inc.(1) | 560 | 7,823 | ||||||
Calithera Biosciences, Inc.(1) | 4,050 | 23,125 | ||||||
Calyxt, Inc.(1)(2) | 700 | 4,907 | ||||||
CareDx, Inc.(1) | 3,511 | 75,732 | ||||||
CASI Pharmaceuticals, Inc.(1)(2) | 4,345 | 13,426 | ||||||
Castle Biosciences, Inc.(1) | 310 | 10,655 | ||||||
Catalyst Pharmaceuticals, Inc.(1) | 9,063 | 33,986 | ||||||
CEL-SCI Corp.(1) | 2,325 | 21,274 | ||||||
Celcuity, Inc.(1)(2) | 240 | 2,554 | ||||||
Cellular Biomedicine Group, Inc.(1) | 958 | 15,558 | ||||||
Centogene NV(1) | 160 | 1,611 | ||||||
Checkpoint Therapeutics, Inc.(1) | 2,033 | 3,497 | ||||||
| 10 | See Notes to Financial Statements. |
Table of Contents
Calvert
VP Russell 2000® Small Cap Index Portfolio
December 31, 2019
Schedule of Investments — continued
| Security | Shares | Value | ||||||
| Biotechnology (continued) | ||||||||
ChemoCentryx, Inc.(1) | 3,509 | $ | 138,781 | |||||
Chimerix, Inc.(1) | 3,539 | 7,184 | ||||||
Clovis Oncology, Inc.(1)(2) | 3,967 | 41,356 | ||||||
Coherus Biosciences, Inc.(1)(2) | 5,288 | 95,210 | ||||||
Concert Pharmaceuticals, Inc.(1) | 1,527 | 14,087 | ||||||
Constellation Pharmaceuticals, Inc.(1)(2) | 1,306 | 61,526 | ||||||
Corbus Pharmaceuticals Holdings, Inc.(1)(2) | 3,888 | 21,228 | ||||||
Cortexyme, Inc.(1)(2) | 978 | 54,905 | ||||||
Crinetics Pharmaceuticals, Inc.(1)(2) | 952 | 23,886 | ||||||
Cue Biopharma, Inc.(1) | 1,576 | 25,019 | ||||||
Cyclerion Therapeutics, Inc.(1)(2) | 2,036 | 5,538 | ||||||
Cytokinetics, Inc.(1)(2) | 4,685 | 49,708 | ||||||
CytomX Therapeutics, Inc.(1) | 3,689 | 30,656 | ||||||
Deciphera Pharmaceuticals, Inc.(1) | 1,576 | 98,090 | ||||||
Denali Therapeutics, Inc.(1)(2) | 4,193 | 73,042 | ||||||
Dicerna Pharmaceuticals, Inc.(1) | 4,450 | 98,033 | ||||||
Dynavax Technologies Corp.(1)(2) | 6,886 | 39,388 | ||||||
Eagle Pharmaceuticals, Inc.(1) | 867 | 52,089 | ||||||
Editas Medicine, Inc.(1)(2) | 4,234 | 125,369 | ||||||
Eidos Therapeutics, Inc.(1) | 939 | 53,889 | ||||||
Eiger BioPharmaceuticals, Inc.(1) | 2,068 | 30,813 | ||||||
Emergent BioSolutions, Inc.(1) | 3,967 | 214,020 | ||||||
Enanta Pharmaceuticals, Inc.(1) | 1,508 | 93,164 | ||||||
Enochian Biosciences, Inc.(1)(2) | 355 | 1,782 | ||||||
Epizyme, Inc.(1)(2) | 6,653 | 163,664 | ||||||
Esperion Therapeutics, Inc.(1)(2) | 2,166 | 129,159 | ||||||
Evelo Biosciences, Inc.(1) | 1,133 | 4,600 | ||||||
Exagen, Inc.(1) | 285 | 7,239 | ||||||
Fate Therapeutics, Inc.(1) | 5,214 | 102,038 | ||||||
FibroGen, Inc.(1) | 6,777 | 290,666 | ||||||
Five Prime Therapeutics, Inc.(1) | 2,790 | 12,806 | ||||||
Flexion Therapeutics, Inc.(1)(2) | 2,654 | 54,938 | ||||||
Forty Seven, Inc.(1) | 1,961 | 77,205 | ||||||
Frequency Therapeutics, Inc.(1) | 494 | 8,660 | ||||||
G1 Therapeutics, Inc.(1)(2) | 2,920 | 77,176 | ||||||
Galectin Therapeutics, Inc.(1) | 2,845 | 8,137 | ||||||
Galera Therapeutics, Inc.(1) | 145 | 1,908 | ||||||
Geron Corp.(1)(2) | 13,270 | 18,047 | ||||||
Global Blood Therapeutics, Inc.(1)(2) | 5,062 | 402,378 | ||||||
GlycoMimetics, Inc.(1) | 2,997 | 15,854 | ||||||
Gossamer Bio, Inc.(1)(2) | 3,566 | 55,737 | ||||||
Gritstone Oncology, Inc.(1)(2) | 2,176 | 19,519 | ||||||
Halozyme Therapeutics, Inc.(1) | 12,201 | 216,324 | ||||||
Harpoon Therapeutics, Inc.(1) | 637 | 9,421 | ||||||
Heron Therapeutics, Inc.(1)(2) | 7,225 | 169,787 | ||||||
Homology Medicines, Inc.(1)(2) | 2,088 | 43,222 | ||||||
| Security | Shares | Value | ||||||
| Biotechnology (continued) | ||||||||
Hookipa Pharma, Inc.(1)(2) | 184 | $ | 2,250 | |||||
IGM Biosciences, Inc.(1) | 426 | 16,256 | ||||||
ImmunoGen, Inc.(1) | 11,811 | 60,295 | ||||||
Immunomedics, Inc.(1)(2) | 15,377 | 325,377 | ||||||
Inovio Pharmaceuticals, Inc.(1)(2) | 6,941 | 22,905 | ||||||
Insmed, Inc.(1)(2) | 7,785 | 185,906 | ||||||
Intellia Therapeutics, Inc.(1)(2) | 3,046 | 44,685 | ||||||
Intercept Pharmaceuticals, Inc.(1)(2) | 2,193 | 271,757 | ||||||
Intrexon Corp.(1)(2) | 5,972 | 32,727 | ||||||
Invitae Corp.(1)(2) | 7,411 | 119,539 | ||||||
Iovance Biotherapeutics, Inc.(1) | 10,075 | 278,876 | ||||||
Ironwood Pharmaceuticals, Inc.(1)(2) | 13,086 | 174,175 | ||||||
Jounce Therapeutics, Inc.(1) | 1,233 | 10,764 | ||||||
Kadmon Holdings, Inc.(1)(2) | 13,434 | 60,856 | ||||||
KalVista Pharmaceuticals, Inc.(1)(2) | 1,030 | 18,344 | ||||||
Karuna Therapeutics, Inc.(1)(2) | 380 | 28,629 | ||||||
Karyopharm Therapeutics, Inc.(1) | 4,886 | 93,665 | ||||||
Kezar Life Sciences, Inc.(1) | 1,038 | 4,162 | ||||||
Kindred Biosciences, Inc.(1) | 2,568 | 21,777 | ||||||
Kiniksa Pharmaceuticals, Ltd., Class A(1) | 975 | 10,784 | ||||||
Kodiak Sciences, Inc.(1)(2) | 2,049 | 147,426 | ||||||
Krystal Biotech, Inc.(1) | 916 | 50,728 | ||||||
Kura Oncology, Inc.(1) | 2,853 | 39,229 | ||||||
La Jolla Pharmaceutical Co.(1) | 1,535 | 6,033 | ||||||
Lexicon Pharmaceuticals, Inc.(1)(2) | 3,782 | 15,695 | ||||||
Ligand Pharmaceuticals, Inc.(1)(2) | 1,471 | 153,411 | ||||||
Lineage Cell Therapeutics, Inc.(2) | 6,005 | 5,344 | ||||||
LogicBio Therapeutics, Inc.(1)(2) | 670 | 4,824 | ||||||
MacroGenics, Inc.(1) | 4,075 | 44,336 | ||||||
Madrigal Pharmaceuticals, Inc.(1)(2) | 687 | 62,593 | ||||||
Magenta Therapeutics, Inc.(1)(2) | 1,188 | 18,010 | ||||||
MannKind Corp.(1)(2) | 11,365 | 14,661 | ||||||
Marker Therapeutics, Inc.(1)(2) | 2,391 | 6,886 | ||||||
Medicines Co. (The)(1)(2) | 6,457 | 548,458 | ||||||
MediciNova, Inc.(1)(2) | 3,274 | 22,067 | ||||||
MEI Pharma, Inc.(1) | 6,012 | 14,910 | ||||||
MeiraGTx Holdings PLC(1) | 1,306 | 26,146 | ||||||
Mersana Therapeutics, Inc.(1) | 3,004 | 17,213 | ||||||
Millendo Therapeutics, Inc.(1) | 829 | 5,587 | ||||||
Minerva Neurosciences, Inc.(1) | 2,206 | 15,685 | ||||||
Mirati Therapeutics, Inc.(1)(2) | 2,373 | 305,785 | ||||||
Mirum Pharmaceuticals, Inc.(1)(2) | 225 | 5,517 | ||||||
Molecular Templates, Inc.(1) | 1,423 | 19,901 | ||||||
Momenta Pharmaceuticals, Inc.(1) | 8,604 | 169,757 | ||||||
Morphic Holding, Inc.(1)(2) | 400 | 6,864 | ||||||
Mustang Bio, Inc.(1) | 1,620 | 6,610 | ||||||
| 11 | See Notes to Financial Statements. |
Table of Contents
Calvert
VP Russell 2000® Small Cap Index Portfolio
December 31, 2019
Schedule of Investments — continued
| Security | Shares | Value | ||||||
| Biotechnology (continued) | ||||||||
Myriad Genetics, Inc.(1) | 6,149 | $ | 167,437 | |||||
Natera, Inc.(1) | 5,357 | 180,477 | ||||||
Neon Therapeutics, Inc.(1) | 485 | 572 | ||||||
NextCure, Inc.(1) | 1,210 | 68,159 | ||||||
Novavax, Inc.(1)(2) | 1,636 | 6,511 | ||||||
Oncocyte Corp.(1)(2) | 1,896 | 4,266 | ||||||
OPKO Health, Inc.(1)(2) | 33,101 | 48,658 | ||||||
Organogenesis Holdings, Inc.(1) | 930 | 4,473 | ||||||
Oyster Point Pharma, Inc.(1) | 485 | 11,853 | ||||||
Palatin Technologies, Inc.(1)(2) | 16,946 | 13,255 | ||||||
PDL BioPharma, Inc.(1) | 9,974 | 32,366 | ||||||
Pfenex, Inc.(1) | 2,583 | 28,361 | ||||||
PhaseBio Pharmaceuticals, Inc.(1)(2) | 1,211 | 7,399 | ||||||
Pieris Pharmaceuticals, Inc.(1) | 3,015 | 10,914 | ||||||
PolarityTE, Inc.(1) | 503 | 1,308 | ||||||
Portola Pharmaceuticals, Inc.(1)(2) | 6,565 | 156,772 | ||||||
Precision BioSciences, Inc.(1)(2) | 3,088 | 42,892 | ||||||
Prevail Therapeutics, Inc.(1)(2) | 616 | 9,751 | ||||||
Principia Biopharma, Inc.(1) | 1,581 | 86,607 | ||||||
Progenics Pharmaceuticals, Inc.(1) | 7,261 | 36,958 | ||||||
Protagonist Therapeutics, Inc.(1) | 1,337 | 9,426 | ||||||
Prothena Corp. PLC(1) | 3,249 | 51,432 | ||||||
PTC Therapeutics, Inc.(1) | 5,192 | 249,372 | ||||||
Puma Biotechnology, Inc.(1)(2) | 2,522 | 22,067 | ||||||
Ra Pharmaceuticals, Inc.(1) | 3,058 | 143,512 | ||||||
Radius Health, Inc.(1)(2) | 3,845 | 77,515 | ||||||
Rapt Therapeutics, Inc.(1) | 135 | 3,727 | ||||||
REGENXBIO, Inc.(1)(2) | 2,841 | 116,396 | ||||||
Replimune Group, Inc.(1) | 616 | 8,840 | ||||||
Retrophin, Inc.(1) | 3,493 | 49,601 | ||||||
Rhythm Pharmaceuticals, Inc.(1)(2) | 2,515 | 57,744 | ||||||
Rigel Pharmaceuticals, Inc.(1) | 12,610 | 26,985 | ||||||
Rocket Pharmaceuticals, Inc.(1)(2) | 2,549 | 58,015 | ||||||
Rubius Therapeutics, Inc.(1)(2) | 2,811 | 26,704 | ||||||
Sangamo Therapeutics, Inc.(1)(2) | 9,803 | 82,051 | ||||||
Savara, Inc.(1)(2) | 2,257 | 10,111 | ||||||
Scholar Rock Holding Corp.(1)(2) | 1,228 | 16,185 | ||||||
Seres Therapeutics, Inc.(1) | 3,205 | 11,057 | ||||||
Solid Biosciences, Inc.(1)(2) | 1,002 | 4,459 | ||||||
Sorrento Therapeutics, Inc.(1)(2) | 9,475 | 32,025 | ||||||
Spectrum Pharmaceuticals, Inc.(1) | 9,499 | 34,576 | ||||||
Spero Therapeutics, Inc.(1) | 500 | 4,808 | ||||||
SpringWorks Therapeutics, Inc.(1) | 897 | 34,526 | ||||||
Stemline Therapeutics, Inc.(1)(2) | 3,938 | 41,861 | ||||||
Stoke Therapeutics, Inc.(1) | 761 | 21,552 | ||||||
Sutro Biopharma, Inc.(1) | 525 | 5,775 | ||||||
| Security | Shares | Value | ||||||
| Biotechnology (continued) | ||||||||
Syndax Pharmaceuticals, Inc.(1) | 1,000 | $ | 8,780 | |||||
Synlogic, Inc.(1) | 1,223 | 3,155 | ||||||
Synthorx, Inc.(1) | 798 | 55,772 | ||||||
Syros Pharmaceuticals, Inc.(1) | 2,602 | 17,980 | ||||||
TCR2 Therapeutics, Inc.(1) | 974 | 13,909 | ||||||
TG Therapeutics, Inc.(1)(2) | 6,740 | 74,814 | ||||||
Tocagen, Inc.(1)(2) | 1,527 | 814 | ||||||
Translate Bio, Inc.(1)(2) | 2,436 | 19,829 | ||||||
Turning Point Therapeutics(1)(2) | 2,380 | 148,250 | ||||||
Twist Bioscience Corp.(1) | 1,859 | 39,039 | ||||||
Tyme Technologies, Inc.(1)(2) | 6,120 | 8,568 | ||||||
Ultragenyx Pharmaceutical, Inc.(1)(2) | 4,646 | 198,431 | ||||||
UNITY Biotechnology, Inc.(1)(2) | 2,053 | 14,802 | ||||||
UroGen Pharma, Ltd.(1)(2) | 1,653 | 55,161 | ||||||
Vanda Pharmaceuticals, Inc.(1) | 4,281 | 70,251 | ||||||
VBI Vaccines, Inc.(1)(2) | 7,403 | 10,216 | ||||||
Veracyte, Inc.(1)(2) | 4,016 | 112,127 | ||||||
Vericel Corp.(1) | 3,863 | 67,216 | ||||||
Viela Bio, Inc.(1) | 469 | 12,733 | ||||||
Viking Therapeutics, Inc.(1)(2) | 5,553 | 44,535 | ||||||
Vir Biotechnology, Inc.(1) | 620 | 7,797 | ||||||
Voyager Therapeutics, Inc.(1) | 2,021 | 28,193 | ||||||
X4 Pharmaceuticals, Inc.(1) | 987 | 10,561 | ||||||
XBiotech, Inc.(1)(2) | 1,474 | 27,512 | ||||||
Xencor, Inc.(1)(2) | 4,142 | 142,443 | ||||||
Y-mAbs Therapeutics, Inc.(1) | 2,029 | 63,406 | ||||||
ZIOPHARM Oncology, Inc.(1)(2) | 13,722 | 64,768 | ||||||
| $ | 14,615,052 | |||||||
| Building Products — 1.4% | ||||||||
AAON, Inc. | 3,489 | $ | 172,392 | |||||
Advanced Drainage Systems, Inc. | 3,730 | 144,873 | ||||||
American Woodmark Corp.(1) | 1,481 | 154,779 | ||||||
Apogee Enterprises, Inc. | 2,204 | 71,630 | ||||||
Armstrong Flooring, Inc.(1) | 1,823 | 7,784 | ||||||
Builders FirstSource, Inc.(1) | 9,970 | 253,338 | ||||||
Caesarstone, Ltd. | 1,950 | 29,387 | ||||||
Continental Building Products, Inc.(1) | 3,099 | 112,897 | ||||||
Cornerstone Building Brands, Inc.(1) | 3,510 | 29,870 | ||||||
CSW Industrials, Inc. | 1,308 | 100,716 | ||||||
Gibraltar Industries, Inc.(1) | 2,724 | 137,399 | ||||||
Griffon Corp. | 3,034 | 61,681 | ||||||
Insteel Industries, Inc. | 1,366 | 29,355 | ||||||
JELD-WEN Holding, Inc.(1) | 5,765 | 134,959 | ||||||
Masonite International Corp.(1) | 2,187 | 157,923 | ||||||
Patrick Industries, Inc. | 1,955 | 102,501 | ||||||
| 12 | See Notes to Financial Statements. |
Table of Contents
Calvert
VP Russell 2000® Small Cap Index Portfolio
December 31, 2019
Schedule of Investments — continued
| Security | Shares | Value | ||||||
| Building Products (continued) | ||||||||
PGT Innovations, Inc.(1) | 4,695 | $ | 70,002 | |||||
Quanex Building Products Corp. | 3,015 | 51,496 | ||||||
Simpson Manufacturing Co., Inc. | 3,936 | 315,785 | ||||||
Trex Co., Inc.(1)(2) | 5,022 | 451,377 | ||||||
Universal Forest Products, Inc. | 5,184 | 247,277 | ||||||
| $ | 2,837,421 | |||||||
| Capital Markets — 1.3% | ||||||||
Ares Management Corp., Class A | 6,138 | $ | 219,065 | |||||
Artisan Partners Asset Management, Inc., Class A | 4,258 | 137,619 | ||||||
Assetmark Financial Holdings, Inc. | 1,145 | 33,228 | ||||||
Associated Capital Group, Inc., Class A(2) | 224 | 8,781 | ||||||
B. Riley Financial, Inc. | 1,801 | 45,349 | ||||||
Blucora, Inc.(1) | 4,225 | 110,441 | ||||||
BrightSphere Investment Group, Inc. | 6,175 | 63,108 | ||||||
Cohen & Steers, Inc. | 2,001 | 125,583 | ||||||
Cowen, Inc., Class A(1) | 2,148 | 33,831 | ||||||
Diamond Hill Investment Group, Inc. | 250 | 35,115 | ||||||
Donnelley Financial Solutions, Inc.(1) | 2,855 | 29,892 | ||||||
Federated Investors, Inc., Class B | 8,411 | 274,114 | ||||||
Focus Financial Partners, Inc., Class A(1) | 2,587 | 76,239 | ||||||
GAIN Capital Holdings, Inc.(2) | 1,604 | 6,336 | ||||||
GAMCO Investors, Inc., Class A | 342 | 6,666 | ||||||
Greenhill & Co., Inc. | 1,714 | 29,275 | ||||||
Hamilton Lane, Inc., Class A | 1,868 | 111,333 | ||||||
Houlihan Lokey, Inc., Class A | 3,600 | 175,932 | ||||||
INTL FCStone, Inc.(1) | 1,391 | 67,923 | ||||||
Ladenburg Thalmann Financial Services, Inc. | 8,462 | 29,448 | ||||||
Moelis & Co., Class A | 4,043 | 129,053 | ||||||
Oppenheimer Holdings, Inc., Class A | 932 | 25,611 | ||||||
Piper Jaffray Cos. | 1,194 | 95,448 | ||||||
PJT Partners, Inc., Class A | 1,985 | 89,583 | ||||||
Pzena Investment Management, Inc., Class A | 1,231 | 10,611 | ||||||
Safeguard Scientifics, Inc. | 1,902 | 20,884 | ||||||
Sculptor Capital Management, Inc. | 1,486 | 32,841 | ||||||
Siebert Financial Corp.(1) | 596 | 5,155 | ||||||
Silvercrest Asset Management Group, Inc., Class A | 548 | 6,894 | ||||||
Stifel Financial Corp. | 5,713 | 346,493 | ||||||
Value Line, Inc. | 91 | 2,631 | ||||||
Virtus Investment Partners, Inc. | 589 | 71,693 | ||||||
Waddell & Reed Financial, Inc., Class A(2) | 6,178 | 103,296 | ||||||
Westwood Holdings Group, Inc. | 603 | 17,861 | ||||||
WisdomTree Investments, Inc. | 11,656 | 56,415 | ||||||
| $ | 2,633,747 | |||||||
| Security | Shares | Value | ||||||
| Chemicals — 1.7% | ||||||||
Advanced Emissions Solutions, Inc.(2) | 1,851 | $ | 19,435 | |||||
AdvanSix, Inc.(1) | 2,631 | 52,515 | ||||||
American Vanguard Corp. | 2,506 | 48,792 | ||||||
Amyris, Inc.(1)(2) | 5,121 | 15,824 | ||||||
Balchem Corp. | 2,818 | 286,393 | ||||||
Chase Corp. | 627 | 74,287 | ||||||
Ferro Corp.(1) | 7,188 | 106,598 | ||||||
Flotek Industries, Inc.(1) | 4,728 | 9,456 | ||||||
FutureFuel Corp. | 1,874 | 23,219 | ||||||
GCP Applied Technologies, Inc.(1) | 4,589 | 104,216 | ||||||
Hawkins, Inc. | 749 | 34,312 | ||||||
HB Fuller Co.(2) | 4,475 | 230,776 | ||||||
Ingevity Corp.(1) | 3,673 | 320,947 | ||||||
Innophos Holdings, Inc. | 1,613 | 51,584 | ||||||
Innospec, Inc. | 2,126 | 219,913 | ||||||
Intrepid Potash, Inc.(1) | 8,313 | 22,528 | ||||||
Koppers Holdings, Inc.(1) | 1,571 | 60,044 | ||||||
Kraton Corp.(1) | 2,659 | 67,326 | ||||||
Kronos Worldwide, Inc. | 1,877 | 25,152 | ||||||
Livent Corp.(1)(2) | 12,684 | 108,448 | ||||||
LSB Industries, Inc.(1) | 1,588 | 6,670 | ||||||
Marrone Bio Innovations, Inc.(1) | 4,928 | 4,977 | ||||||
Minerals Technologies, Inc. | 2,994 | 172,544 | ||||||
OMNOVA Solutions, Inc.(1) | 3,910 | 39,530 | ||||||
Orion Engineered Carbons SA | 5,256 | 101,441 | ||||||
PolyOne Corp. | 6,743 | 248,075 | ||||||
PQ Group Holdings, Inc.(1) | 3,089 | 53,069 | ||||||
Quaker Chemical Corp. | 1,117 | 183,769 | ||||||
Rayonier Advanced Materials, Inc. | 4,190 | 16,090 | ||||||
Sensient Technologies Corp. | 3,703 | 244,731 | ||||||
Stepan Co. | 1,782 | 182,548 | ||||||
Trecora Resources(1) | 1,798 | 12,856 | ||||||
Tredegar Corp. | 2,145 | 47,941 | ||||||
Trinseo SA | 3,353 | 124,765 | ||||||
Tronox Holdings PLC, Class A | 7,808 | 89,167 | ||||||
Valhi, Inc. | 1,474 | 2,756 | ||||||
| $ | 3,412,694 | |||||||
| Commercial Services & Supplies — 2.6% | ||||||||
ABM Industries, Inc. | 5,683 | $ | 214,306 | |||||
ACCO Brands Corp. | 8,823 | 82,583 | ||||||
Advanced Disposal Services, Inc.(1) | 6,349 | 208,692 | ||||||
Brady Corp., Class A | 4,179 | 239,290 | ||||||
BrightView Holdings, Inc.(1) | 2,671 | 45,060 | ||||||
Brink’s Co. (The) | 4,361 | 395,455 | ||||||
| 13 | See Notes to Financial Statements. |
Table of Contents
Calvert
VP Russell 2000® Small Cap Index Portfolio
December 31, 2019
Schedule of Investments — continued
| Security | Shares | Value | ||||||
| Commercial Services & Supplies (continued) | ||||||||
Casella Waste Systems, Inc., Class A(1) | 3,899 | $ | 179,471 | |||||
CECO Environmental Corp.(1) | 2,281 | 17,472 | ||||||
Charah Solutions, Inc.(1)(2) | 610 | 1,488 | ||||||
Cimpress PLC(1)(2) | 1,712 | 215,318 | ||||||
CompX International, Inc. | 124 | 1,809 | ||||||
Covanta Holding Corp. | 10,319 | 153,134 | ||||||
Deluxe Corp. | 3,758 | 187,599 | ||||||
Ennis, Inc. | 2,271 | 49,167 | ||||||
Harsco Corp.(1) | 6,801 | 156,491 | ||||||
Healthcare Services Group, Inc. | 6,468 | 157,302 | ||||||
Heritage-Crystal Clean, Inc.(1) | 1,244 | 39,024 | ||||||
Herman Miller, Inc. | 5,154 | 214,664 | ||||||
HNI Corp. | 3,661 | 137,141 | ||||||
Interface, Inc. | 5,094 | 84,509 | ||||||
Kimball International, Inc., Class B | 2,797 | 57,814 | ||||||
Knoll, Inc. | 4,151 | 104,854 | ||||||
Matthews International Corp., Class A | 2,709 | 103,403 | ||||||
McGrath RentCorp | 2,127 | 162,801 | ||||||
Mobile Mini, Inc. | 3,826 | 145,044 | ||||||
MSA Safety, Inc. | 3,077 | 388,810 | ||||||
NL Industries, Inc.(1) | 532 | 2,080 | ||||||
PICO Holdings, Inc.(1) | 1,974 | 21,951 | ||||||
Pitney Bowes, Inc.(2) | 15,446 | 62,247 | ||||||
Quad / Graphics, Inc. | 2,476 | 11,563 | ||||||
RR Donnelley & Sons Co.(2) | 6,159 | 24,328 | ||||||
SP Plus Corp.(1) | 1,895 | 80,405 | ||||||
Steelcase, Inc., Class A | 7,435 | 152,120 | ||||||
Team, Inc.(1)(2) | 2,411 | 38,504 | ||||||
Tetra Tech, Inc. | 4,778 | 411,672 | ||||||
UniFirst Corp. | 1,322 | 267,018 | ||||||
US Ecology, Inc. | 2,060 | 119,295 | ||||||
Viad Corp. | 1,775 | 119,813 | ||||||
VSE Corp. | 650 | 24,726 | ||||||
| $ | 5,078,423 | |||||||
| Communications Equipment — 1.0% | ||||||||
Acacia Communications, Inc.(1) | 3,332 | $ | 225,943 | |||||
ADTRAN, Inc. | 4,115 | 40,697 | ||||||
Applied Optoelectronics, Inc.(1)(2) | 1,515 | 17,998 | ||||||
CalAmp Corp.(1) | 3,105 | 29,746 | ||||||
Calix, Inc.(1) | 4,105 | 32,840 | ||||||
Cambium Networks Corp.(1) | 360 | 3,146 | ||||||
Casa Systems, Inc.(1) | 2,241 | 9,166 | ||||||
Clearfield, Inc.(1) | 1,022 | 14,247 | ||||||
Comtech Telecommunications Corp. | 2,055 | 72,932 | ||||||
DASAN Zhone Solutions, Inc.(1) | 513 | 4,545 | ||||||
| Security | Shares | Value | ||||||
| Communications Equipment (continued) | ||||||||
Digi International, Inc.(1) | 2,313 | $ | 40,986 | |||||
Extreme Networks, Inc.(1) | 9,584 | 70,634 | ||||||
Harmonic, Inc.(1) | 7,210 | 56,238 | ||||||
Infinera Corp.(1)(2) | 15,265 | 121,204 | ||||||
Inseego Corp.(1)(2) | 3,931 | 28,814 | ||||||
InterDigital, Inc. | 2,697 | 146,960 | ||||||
KVH Industries, Inc.(1) | 1,491 | 16,595 | ||||||
Lumentum Holdings, Inc.(1) | 6,644 | 526,869 | ||||||
NETGEAR, Inc.(1) | 2,672 | 65,491 | ||||||
NetScout Systems, Inc.(1) | 6,378 | 153,519 | ||||||
Plantronics, Inc.(2) | 2,716 | 74,256 | ||||||
Ribbon Communications, Inc.(1) | 4,404 | 13,652 | ||||||
TESSCO Technologies, Inc. | 546 | 6,126 | ||||||
Viavi Solutions, Inc.(1) | 20,045 | 300,675 | ||||||
| $ | 2,073,279 | |||||||
| Construction & Engineering — 1.0% | ||||||||
Aegion Corp.(1) | 2,830 | $ | 63,307 | |||||
Ameresco, Inc., Class A(1) | 1,930 | 33,775 | ||||||
Arcosa, Inc. | 4,248 | 189,248 | ||||||
Argan, Inc. | 1,155 | 46,362 | ||||||
Comfort Systems USA, Inc. | 3,196 | 159,321 | ||||||
Concrete Pumping Holdings, Inc.(1)(2) | 980 | 5,361 | ||||||
Construction Partners, Inc., Class A(1) | 1,060 | 17,882 | ||||||
Dycom Industries, Inc.(1) | 2,549 | 120,185 | ||||||
EMCOR Group, Inc. | 4,880 | 421,144 | ||||||
Granite Construction, Inc.(2) | 3,992 | 110,459 | ||||||
Great Lakes Dredge & Dock Corp.(1) | 5,123 | 58,044 | ||||||
IES Holdings, Inc.(1) | 610 | 15,653 | ||||||
MasTec, Inc.(1) | 5,243 | 336,391 | ||||||
MYR Group, Inc.(1) | 1,414 | 46,082 | ||||||
Northwest Pipe Co.(1) | 837 | 27,880 | ||||||
NV5 Global, Inc.(1) | 775 | 39,099 | ||||||
Primoris Services Corp. | 3,859 | 85,824 | ||||||
Sterling Construction Co., Inc.(1) | 2,268 | 31,933 | ||||||
Tutor Perini Corp.(1) | 3,186 | 40,972 | ||||||
Willscot Corp.(1) | 4,448 | 82,243 | ||||||
| $ | 1,931,165 | |||||||
| Construction Materials — 0.2% | ||||||||
Forterra, Inc.(1) | 1,612 | $ | 18,635 | |||||
Summit Materials, Inc., Class A(1) | 9,887 | 236,299 | ||||||
United States Lime & Minerals, Inc. | 156 | 14,087 | ||||||
US Concrete, Inc.(1) | 1,337 | 55,699 | ||||||
| $ | 324,720 | |||||||
| 14 | See Notes to Financial Statements. |
Table of Contents
Calvert
VP Russell 2000® Small Cap Index Portfolio
December 31, 2019
Schedule of Investments — continued
| Security | Shares | Value | ||||||
| Consumer Finance — 0.5% | ||||||||
Curo Group Holdings Corp.(1)(2) | 974 | $ | 11,863 | |||||
Elevate Credit, Inc.(1) | 1,265 | 5,629 | ||||||
Encore Capital Group, Inc.(1)(2) | 2,642 | 93,421 | ||||||
Enova International, Inc.(1) | 2,903 | 69,846 | ||||||
EZCORP, Inc., Class A(1) | 4,319 | 29,456 | ||||||
FirstCash, Inc. | 3,681 | 296,799 | ||||||
Green Dot Corp., Class A(1) | 4,218 | 98,280 | ||||||
LendingClub Corp.(1) | 5,781 | 72,956 | ||||||
Medallion Financial Corp.(1) | 1,820 | 13,231 | ||||||
Nelnet, Inc., Class A | 1,533 | 89,282 | ||||||
PRA Group, Inc.(1)(2) | 3,955 | 143,567 | ||||||
Regional Management Corp.(1) | 935 | 28,078 | ||||||
World Acceptance Corp.(1) | 470 | 40,608 | ||||||
| $ | 993,016 | |||||||
| Containers & Packaging — 0.1% | ||||||||
Greif, Inc., Class A | 2,211 | $ | 97,726 | |||||
Greif, Inc., Class B | 446 | 23,090 | ||||||
Myers Industries, Inc. | 3,117 | 51,992 | ||||||
UFP Technologies, Inc.(1) | 499 | 24,755 | ||||||
| $ | 197,563 | |||||||
| Distributors — 0.1% | ||||||||
Core-Mark Holding Co., Inc. | 3,796 | $ | 103,213 | |||||
Funko, Inc., Class A(1)(2) | 1,464 | 25,122 | ||||||
Greenlane Holdings, Inc., Class A(1)(2) | 547 | 1,781 | ||||||
Weyco Group, Inc. | 562 | 14,865 | ||||||
| $ | 144,981 | |||||||
| Diversified Consumer Services — 0.8% | ||||||||
Adtalem Global Education, Inc.(1) | 4,632 | $ | 161,981 | |||||
American Public Education, Inc.(1) | 1,323 | 36,237 | ||||||
Carriage Services, Inc. | 1,443 | 36,941 | ||||||
Chegg, Inc.(1) | 10,166 | 385,393 | ||||||
Collectors Universe, Inc. | 706 | 16,273 | ||||||
Houghton Mifflin Harcourt Co.(1) | 9,080 | 56,750 | ||||||
K12, Inc.(1) | 3,081 | 62,698 | ||||||
Laureate Education, Inc., Class A(1) | 10,150 | 178,741 | ||||||
OneSpaWorld Holdings, Ltd.(1)(2) | 4,007 | 67,478 | ||||||
Perdoceo Education Corp.(1) | 5,930 | 109,053 | ||||||
Regis Corp.(1) | 2,003 | 35,794 | ||||||
Select Interior Concepts, Inc., Class A(1) | 1,888 | 16,973 | ||||||
Strategic Education, Inc. | 1,874 | 297,779 | ||||||
Weight Watchers International, Inc.(1) | 3,995 | 152,649 | ||||||
| $ | 1,614,740 | |||||||
| Security | Shares | Value | ||||||
| Diversified Financial Services — 0.2% | ||||||||
Banco Latinoamericano de Comercio Exterior SA | 2,614 | $ | 55,887 | |||||
Cannae Holdings, Inc.(1) | 5,905 | 219,607 | ||||||
FGL Holdings | 12,744 | 135,724 | ||||||
GWG Holdings, Inc.(1)(2) | 160 | 1,571 | ||||||
Marlin Business Services Corp. | 795 | 17,474 | ||||||
On Deck Capital, Inc.(1) | 5,807 | 24,041 | ||||||
| $ | 454,304 | |||||||
| Diversified Telecommunication Services — 0.5% | ||||||||
Anterix, Inc.(2) | 782 | $ | 33,790 | |||||
ATN International, Inc. | 967 | 53,562 | ||||||
Bandwidth, Inc., Class A(1)(2) | 1,419 | 90,887 | ||||||
Cincinnati Bell, Inc.(1)(2) | 3,835 | 40,152 | ||||||
Cogent Communications Holdings, Inc. | 3,590 | 236,258 | ||||||
Consolidated Communications Holdings, Inc.(2) | 5,584 | 21,666 | ||||||
Frontier Communications Corp.(1)(2) | 8,904 | 7,921 | ||||||
IDT Corp., Class B(1) | 1,470 | 10,599 | ||||||
Intelsat SA(1)(2) | 5,730 | 40,282 | ||||||
Iridium Communications, Inc.(1) | 8,418 | 207,420 | ||||||
Ooma, Inc.(1) | 1,488 | 19,686 | ||||||
ORBCOMM, Inc.(1) | 5,583 | 23,504 | ||||||
Pareteum Corp.(1)(2) | 9,476 | 4,144 | ||||||
Vonage Holdings Corp.(1) | 18,939 | 140,338 | ||||||
| $ | 930,209 | |||||||
| Electric Utilities — 0.9% | ||||||||
ALLETE, Inc. | 4,534 | $ | 368,025 | |||||
El Paso Electric Co. | 3,548 | 240,874 | ||||||
Genie Energy, Ltd., Class B | 1,269 | 9,809 | ||||||
MGE Energy, Inc. | 3,067 | 241,741 | ||||||
Otter Tail Corp. | 3,441 | 176,489 | ||||||
PNM Resources, Inc. | 6,941 | 351,978 | ||||||
Portland General Electric Co. | 7,857 | 438,342 | ||||||
Spark Energy, Inc., Class A(2) | 1,012 | 9,341 | ||||||
| $ | 1,836,599 | |||||||
| Electrical Equipment — 0.9% | ||||||||
Allied Motion Technologies, Inc. | 482 | $ | 23,377 | |||||
American Superconductor Corp.(1)(2) | 1,853 | 14,546 | ||||||
Atkore International Group, Inc.(1) | 3,944 | 159,574 | ||||||
AZZ, Inc. | 2,237 | 102,790 | ||||||
Bloom Energy Corp., Class A(1) | 4,863 | 36,327 | ||||||
Encore Wire Corp. | 1,778 | 102,057 | ||||||
Energous Corp.(1)(2) | 1,605 | 2,841 | ||||||
EnerSys | 3,721 | 278,442 | ||||||
| 15 | See Notes to Financial Statements. |
Table of Contents
Calvert
VP Russell 2000® Small Cap Index Portfolio
December 31, 2019
Schedule of Investments — continued
| Security | Shares | Value | ||||||
| Electrical Equipment (continued) | ||||||||
Generac Holdings, Inc.(1) | 5,229 | $ | 525,985 | |||||
Plug Power, Inc.(1)(2) | 19,616 | 61,987 | ||||||
Powell Industries, Inc. | 811 | 39,731 | ||||||
Preformed Line Products Co. | 222 | 13,398 | ||||||
Sunrun, Inc.(1)(2) | 9,929 | 137,119 | ||||||
Thermon Group Holdings, Inc.(1) | 2,669 | 71,529 | ||||||
TPI Composites, Inc.(1)(2) | 2,500 | 46,275 | ||||||
Vicor Corp.(1) | 1,422 | 66,436 | ||||||
Vivint Solar, Inc.(1)(2) | 3,275 | 23,777 | ||||||
| $ | 1,706,191 | |||||||
| Electronic Equipment, Instruments & Components — 2.4% | ||||||||
Airgain, Inc.(1) | 816 | $ | 8,723 | |||||
Akoustis Technologies, Inc.(1) | 2,215 | 17,720 | ||||||
Anixter International, Inc.(1) | 2,667 | 245,631 | ||||||
Arlo Technologies, Inc.(1) | 6,268 | 26,388 | ||||||
AVX Corp. | 4,115 | 84,234 | ||||||
Badger Meter, Inc. | 2,464 | 159,988 | ||||||
Bel Fuse, Inc., Class B | 968 | 19,844 | ||||||
Belden, Inc. | 3,395 | 186,725 | ||||||
Benchmark Electronics, Inc. | 3,272 | 112,426 | ||||||
Coda Octopus Group, Inc.(1)(2) | 409 | 3,423 | ||||||
CTS Corp. | 2,855 | 85,679 | ||||||
Daktronics, Inc. | 2,960 | 18,026 | ||||||
ePlus, Inc.(1) | 1,163 | 98,029 | ||||||
Fabrinet(1) | 3,188 | 206,710 | ||||||
FARO Technologies, Inc.(1) | 1,514 | 76,230 | ||||||
Fitbit, Inc., Class A(1) | 19,650 | 129,100 | ||||||
II-VI, Inc.(1) | 7,794 | 262,424 | ||||||
Insight Enterprises, Inc.(1) | 2,999 | 210,800 | ||||||
Iteris, Inc.(1) | 3,527 | 17,600 | ||||||
Itron, Inc.(1) | 2,995 | 251,430 | ||||||
KEMET Corp. | 5,002 | 135,304 | ||||||
Kimball Electronics, Inc.(1) | 2,097 | 36,802 | ||||||
Knowles Corp.(1) | 6,901 | 145,956 | ||||||
Methode Electronics, Inc. | 3,192 | 125,605 | ||||||
MTS Systems Corp. | 1,475 | 70,844 | ||||||
Napco Security Technologies, Inc.(1) | 1,045 | 30,713 | ||||||
nLight, Inc.(1) | 2,790 | 56,581 | ||||||
Novanta, Inc.(1) | 2,959 | 261,694 | ||||||
OSI Systems, Inc.(1) | 1,463 | 147,383 | ||||||
PAR Technology Corp.(1) | 873 | 26,836 | ||||||
PC Connection, Inc. | 941 | 46,730 | ||||||
Plexus Corp.(1) | 2,529 | 194,581 | ||||||
Rogers Corp.(1) | 1,620 | 202,063 | ||||||
Sanmina Corp.(1) | 5,948 | 203,659 | ||||||
| Security | Shares | Value | ||||||
| Electronic Equipment, Instruments & Components (continued) | ||||||||
ScanSource, Inc.(1) | 2,089 | $ | 77,189 | |||||
Tech Data Corp.(1) | 3,053 | 438,411 | ||||||
TTM Technologies, Inc.(1) | 8,703 | 130,980 | ||||||
Vishay Intertechnology, Inc. | 11,658 | 248,199 | ||||||
Vishay Precision Group, Inc.(1) | 1,011 | 34,374 | ||||||
Wrap Technologies, Inc.(1)(2) | 671 | 4,288 | ||||||
| $ | 4,839,322 | |||||||
| Energy Equipment & Services — 0.9% | ||||||||
Archrock, Inc. | 11,297 | $ | 113,422 | |||||
Cactus, Inc., Class A | 4,031 | 138,344 | ||||||
Covia Holdings Corp.(1)(2) | 2,723 | 5,555 | ||||||
Diamond Offshore Drilling, Inc.(1)(2) | 5,679 | 40,832 | ||||||
DMC Global, Inc.(2) | 1,092 | 49,074 | ||||||
Dril-Quip, Inc.(1) | 3,073 | 144,154 | ||||||
Era Group, Inc.(1) | 1,735 | 17,645 | ||||||
Exterran Corp.(1) | 2,624 | 20,546 | ||||||
Forum Energy Technologies, Inc.(1) | 6,985 | 11,735 | ||||||
Frank’s International NV(1) | 9,148 | 47,295 | ||||||
FTS International, Inc.(1)(2) | 2,704 | 2,812 | ||||||
Geospace Technologies Corp.(1) | 1,167 | 19,571 | ||||||
Helix Energy Solutions Group, Inc.(1) | 12,468 | 120,067 | ||||||
Independence Contract Drilling, Inc.(1) | 2,336 | 2,329 | ||||||
KLX Energy Services Holdings, Inc.(1) | 1,703 | 10,967 | ||||||
Liberty Oilfield Services, Inc., Class A(2) | 4,426 | 49,217 | ||||||
Mammoth Energy Services, Inc.(2) | 1,056 | 2,323 | ||||||
Matrix Service Co.(1) | 2,252 | 51,526 | ||||||
McDermott International, Inc.(1)(2) | 15,081 | 10,204 | ||||||
Nabors Industries, Ltd. | 31,112 | 89,603 | ||||||
National Energy Services Reunited Corp.(1) | 2,092 | 19,079 | ||||||
Natural Gas Services Group, Inc.(1) | 1,066 | 13,069 | ||||||
NCS Multistage Holdings, Inc.(1) | 969 | 2,035 | ||||||
Newpark Resources, Inc.(1) | 7,671 | 48,097 | ||||||
NexTier Oilfield Solutions, Inc.(1) | 13,416 | 89,887 | ||||||
Nine Energy Service, Inc.(1)(2) | 1,242 | 9,712 | ||||||
Noble Corp. PLC(1) | 21,442 | 26,159 | ||||||
Oceaneering International, Inc.(1) | 8,672 | 129,300 | ||||||
Oil States International, Inc.(1) | 5,061 | 82,545 | ||||||
Pacific Drilling SA(1) | 2,633 | 10,743 | ||||||
Parker Drilling Co.(1)(2) | 823 | 18,517 | ||||||
ProPetro Holding Corp.(1) | 6,820 | 76,725 | ||||||
RigNet, Inc.(1) | 1,109 | 7,319 | ||||||
RPC, Inc.(2) | 5,124 | 26,850 | ||||||
SEACOR Holdings, Inc.(1) | 1,397 | 60,281 | ||||||
SEACOR Marine Holdings, Inc.(1) | 1,248 | 17,210 | ||||||
Seadrill, Ltd.(1)(2) | 5,172 | 13,137 | ||||||
| 16 | See Notes to Financial Statements. |
Table of Contents
Calvert
VP Russell 2000® Small Cap Index Portfolio
December 31, 2019
Schedule of Investments — continued
| Security | Shares | Value | ||||||
| Energy Equipment & Services (continued) | ||||||||
Select Energy Services, Inc., Class A(1) | 5,076 | $ | 47,105 | |||||
Smart Sand, Inc.(1)(2) | 1,879 | 4,735 | ||||||
Solaris Oilfield Infrastructure, Inc., Class A(2) | 2,541 | 35,574 | ||||||
TETRA Technologies, Inc.(1) | 9,415 | 18,453 | ||||||
Tidewater, Inc.(1) | 3,229 | 62,255 | ||||||
US Silica Holdings, Inc.(2) | 6,531 | 40,166 | ||||||
US Well Services, Inc.(1) | 1,770 | 3,345 | ||||||
| $ | 1,809,519 | |||||||
| Entertainment — 0.2% | ||||||||
AMC Entertainment Holdings, Inc., Class A(2) | 3,946 | $ | 28,569 | |||||
Eros International PLC(1)(2) | 6,068 | 20,571 | ||||||
Gaia, Inc.(1)(2) | 1,050 | 8,390 | ||||||
Glu Mobile, Inc.(1) | 9,287 | 56,186 | ||||||
IMAX Corp.(1) | 4,366 | 89,197 | ||||||
Liberty Braves Group, Series A(1) | 713 | 21,140 | ||||||
Liberty Braves Group, Series C(1) | 3,012 | 88,975 | ||||||
LiveXLive Media, Inc.(1) | 2,426 | 3,748 | ||||||
Marcus Corp. (The) | 1,876 | 59,601 | ||||||
Reading International, Inc., Class A(1) | 1,506 | 16,852 | ||||||
| $ | 393,229 | |||||||
| Equity Real Estate Investment Trusts (REITs) — 6.5% | ||||||||
Acadia Realty Trust | 7,248 | $ | 187,941 | |||||
Agree Realty Corp. | 3,586 | 251,630 | ||||||
Alexander & Baldwin, Inc. | 5,720 | 119,891 | ||||||
Alexander’s, Inc. | 184 | 60,784 | ||||||
American Assets Trust, Inc. | 4,223 | 193,836 | ||||||
American Finance Trust, Inc. | 9,434 | 125,095 | ||||||
Armada Hoffler Properties, Inc. | 4,377 | 80,318 | ||||||
Ashford Hospitality Trust, Inc. | 6,276 | 17,510 | ||||||
Bluerock Residential Growth REIT, Inc. | 1,454 | 17,521 | ||||||
Braemar Hotels & Resorts, Inc. | 2,002 | 17,878 | ||||||
BRT Apartments Corp. | 682 | 11,574 | ||||||
CareTrust REIT, Inc. | 8,148 | 168,093 | ||||||
CatchMark Timber Trust, Inc., Class A | 3,692 | 42,347 | ||||||
CBL & Associates Properties, Inc.(2) | 14,116 | 14,822 | ||||||
Cedar Realty Trust, Inc. | 7,099 | 20,942 | ||||||
Chatham Lodging Trust | 3,800 | 69,692 | ||||||
CIM Commercial Trust Corp. | 118 | 1,711 | ||||||
City Office REIT, Inc. | 4,586 | 62,003 | ||||||
Clipper Realty, Inc. | 1,313 | 13,918 | ||||||
Community Healthcare Trust, Inc. | 1,465 | 62,790 | ||||||
CoreCivic, Inc. | 10,458 | 181,760 | ||||||
CorEnergy Infrastructure Trust, Inc.(2) | 1,103 | 49,315 | ||||||
| Security | Shares | Value | ||||||
| Equity Real Estate Investment Trusts (REITs) (continued) | ||||||||
CorePoint Lodging, Inc. | 3,663 | $ | 39,121 | |||||
DiamondRock Hospitality Co. | 17,564 | 194,609 | ||||||
Diversified Healthcare Trust | 19,849 | 167,526 | ||||||
Easterly Government Properties, Inc. | 6,397 | 151,801 | ||||||
EastGroup Properties, Inc. | 3,230 | 428,524 | ||||||
Essential Properties Realty Trust, Inc.(2) | 6,639 | 164,714 | ||||||
Farmland Partners, Inc.(2) | 2,798 | 18,970 | ||||||
First Industrial Realty Trust, Inc. | 11,029 | 457,814 | ||||||
Four Corners Property Trust, Inc. | 5,983 | 168,661 | ||||||
Franklin Street Properties Corp. | 9,022 | 77,228 | ||||||
Front Yard Residential Corp. | 4,415 | 54,481 | ||||||
GEO Group, Inc. (The) | 10,121 | 168,110 | ||||||
Getty Realty Corp. | 2,913 | 95,750 | ||||||
Gladstone Commercial Corp. | 2,560 | 55,962 | ||||||
Gladstone Land Corp.(2) | 1,115 | 14,462 | ||||||
Global Medical REIT, Inc. | 2,662 | 35,218 | ||||||
Global Net Lease, Inc. | 7,731 | 156,785 | ||||||
Hannon Armstrong Sustainable Infrastructure Capital, Inc.(2) | 5,564 | 179,049 | ||||||
Healthcare Realty Trust, Inc. | 11,176 | 372,943 | ||||||
Hersha Hospitality Trust | 3,227 | 46,953 | ||||||
Independence Realty Trust, Inc. | 7,851 | 110,542 | ||||||
Industrial Logistics Properties Trust | 5,413 | 121,359 | ||||||
Innovative Industrial Properties, Inc.(2) | 898 | 68,131 | ||||||
Investors Real Estate Trust | 989 | 71,702 | ||||||
iStar, Inc. | 4,942 | 71,708 | ||||||
Jernigan Capital, Inc.(2) | 1,875 | 35,887 | ||||||
Kite Realty Group Trust | 7,232 | 141,241 | ||||||
Lexington Realty Trust | 20,786 | 220,747 | ||||||
LTC Properties, Inc. | 3,459 | 154,859 | ||||||
Mack-Cali Realty Corp. | 7,612 | 176,066 | ||||||
Monmouth Real Estate Investment Corp. | 8,073 | 116,897 | ||||||
National Health Investors, Inc. | 3,678 | 299,683 | ||||||
National Storage Affiliates Trust | 5,194 | 174,622 | ||||||
New Senior Investment Group, Inc. | 7,208 | 55,141 | ||||||
NexPoint Residential Trust, Inc. | 1,658 | 74,610 | ||||||
Office Properties Income Trust | 4,192 | 134,731 | ||||||
One Liberty Properties, Inc. | 1,287 | 34,994 | ||||||
Pebblebrook Hotel Trust | 11,429 | 306,411 | ||||||
Pennsylvania Real Estate Investment Trust(2) | 5,900 | 31,447 | ||||||
Physicians Realty Trust | 16,246 | 307,699 | ||||||
Piedmont Office Realty Trust, Inc., Class A | 11,004 | 244,729 | ||||||
PotlatchDeltic Corp.(2) | 5,812 | 251,485 | ||||||
Preferred Apartment Communities, Inc., Class A(2) | 3,903 | 51,988 | ||||||
PS Business Parks, Inc. | 1,759 | 290,006 | ||||||
QTS Realty Trust, Inc., Class A | 4,809 | 260,984 | ||||||
Retail Opportunity Investments Corp. | 9,833 | 173,651 | ||||||
| 17 | See Notes to Financial Statements. |
Table of Contents
Calvert
VP Russell 2000® Small Cap Index Portfolio
December 31, 2019
Schedule of Investments — continued
| Security | Shares | Value | ||||||
| Equity Real Estate Investment Trusts (REITs) (continued) | ||||||||
Retail Value, Inc. | 1,316 | $ | 48,429 | |||||
Rexford Industrial Realty, Inc. | 9,568 | 436,971 | ||||||
RLJ Lodging Trust | 14,520 | 257,294 | ||||||
RPT Realty | 6,804 | 102,332 | ||||||
Ryman Hospitality Properties, Inc. | 3,995 | 346,207 | ||||||
Sabra Health Care REIT, Inc. | 16,496 | 352,025 | ||||||
Safehold, Inc. | 887 | 35,746 | ||||||
Saul Centers, Inc. | 978 | 51,619 | ||||||
Seritage Growth Properties, Class A(2) | 2,944 | 117,996 | ||||||
STAG Industrial, Inc. | 11,492 | 362,802 | ||||||
Summit Hotel Properties, Inc.(2) | 8,982 | 110,838 | ||||||
Sunstone Hotel Investors, Inc. | 19,593 | 272,735 | ||||||
Tanger Factory Outlet Centers, Inc.(2) | 7,997 | 117,796 | ||||||
Terreno Realty Corp. | 5,636 | 305,133 | ||||||
UMH Properties, Inc. | 3,128 | 49,203 | ||||||
Uniti Group, Inc.(2) | 16,329 | 134,061 | ||||||
Universal Health Realty Income Trust | 1,113 | 130,622 | ||||||
Urban Edge Properties | 9,798 | 187,926 | ||||||
Urstadt Biddle Properties, Inc., Class A | 2,599 | 64,559 | ||||||
Washington Prime Group, Inc.(2) | 16,051 | 58,426 | ||||||
Washington Real Estate Investment Trust | 7,049 | 205,690 | ||||||
Whitestone REIT(2) | 3,231 | 44,006 | ||||||
Xenia Hotels & Resorts, Inc. | 9,886 | 213,636 | ||||||
| $ | 12,807,424 | |||||||
| Food & Staples Retailing — 0.6% | ||||||||
Andersons, Inc. (The) | 2,690 | $ | 68,003 | |||||
BJ’s Wholesale Club Holdings, Inc.(1)(2) | 9,766 | 222,079 | ||||||
Chefs’ Warehouse, Inc. (The)(1) | 2,031 | 77,402 | ||||||
HF Foods Group, Inc.(1)(2) | 664 | 12,948 | ||||||
Ingles Markets, Inc., Class A | �� | 1,243 | 59,055 | |||||
Natural Grocers by Vitamin Cottage, Inc. | 875 | 8,636 | ||||||
Performance Food Group Co.(1) | 8,973 | 461,930 | ||||||
PriceSmart, Inc. | 1,964 | 139,483 | ||||||
Rite Aid Corp.(1) | 4,349 | 67,279 | ||||||
SpartanNash Co. | 3,190 | 45,426 | ||||||
United Natural Foods, Inc.(1) | 4,050 | 35,478 | ||||||
Village Super Market, Inc., Class A | 640 | 14,848 | ||||||
Weis Markets, Inc. | 747 | 30,246 | ||||||
| $ | 1,242,813 | |||||||
| Food Products — 1.2% | ||||||||
Alico, Inc. | 267 | $ | 9,567 | |||||
B&G Foods, Inc. | 5,687 | 101,968 | ||||||
BellRing Brands, Inc., Class A(1) | 3,419 | 72,791 | ||||||
| Security | Shares | Value | ||||||
| Food Products (continued) | ||||||||
Bridgford Foods Corp.(1) | 153 | $ | 3,793 | |||||
Cal-Maine Foods, Inc. | 2,682 | 114,656 | ||||||
Calavo Growers, Inc.(2) | 1,424 | 129,000 | ||||||
Darling Ingredients, Inc.(1) | 14,316 | 401,993 | ||||||
Farmer Bros Co.(1) | 847 | 12,756 | ||||||
Fresh Del Monte Produce, Inc. | 2,531 | 88,534 | ||||||
Freshpet, Inc.(1) | 3,024 | 178,688 | ||||||
Hostess Brands, Inc.(1) | 10,500 | 152,670 | ||||||
J&J Snack Foods Corp. | 1,320 | 243,236 | ||||||
John B. Sanfilippo & Son, Inc. | 716 | 65,357 | ||||||
Lancaster Colony Corp. | 1,648 | 263,845 | ||||||
Landec Corp.(1) | 2,282 | 25,809 | ||||||
Limoneira Co. | 1,228 | 23,614 | ||||||
Sanderson Farms, Inc. | 1,738 | 306,270 | ||||||
Seneca Foods Corp., Class A(1) | 594 | 24,229 | ||||||
Simply Good Foods Co. (The)(1) | 7,196 | 205,374 | ||||||
Tootsie Roll Industries, Inc. | 1,396 | 47,660 | ||||||
| $ | 2,471,810 | |||||||
| Gas Utilities — 1.1% | ||||||||
Chesapeake Utilities Corp. | 1,388 | $ | 133,012 | |||||
New Jersey Resources Corp. | 7,742 | 345,061 | ||||||
Northwest Natural Holding Co. | 2,642 | 194,795 | ||||||
ONE Gas, Inc. | 4,563 | 426,960 | ||||||
RGC Resources, Inc. | 587 | 16,776 | ||||||
South Jersey Industries, Inc.(2) | 8,112 | 267,534 | ||||||
Southwest Gas Holdings, Inc. | 4,744 | 360,402 | ||||||
Spire, Inc. | 4,343 | 361,815 | ||||||
| $ | 2,106,355 | |||||||
| Health Care Equipment & Supplies — 3.6% | ||||||||
Accuray, Inc.(1) | 6,420 | $ | 18,104 | |||||
Alphatec Holdings, Inc.(1) | 2,633 | 18,681 | ||||||
AngioDynamics, Inc.(1) | 3,206 | 51,328 | ||||||
Antares Pharma, Inc.(1) | 14,209 | 66,782 | ||||||
Apyx Medical Corp. | 2,938 | 24,855 | ||||||
AtriCure, Inc.(1) | 3,162 | 102,797 | ||||||
Atrion Corp. | 121 | 90,932 | ||||||
Avanos Medical, Inc.(1) | 4,156 | 140,057 | ||||||
AxoGen, Inc.(1) | 2,668 | 47,731 | ||||||
Axonics Modulation Technologies, Inc.(1)(2) | 1,340 | 37,131 | ||||||
BioLife Solutions, Inc.(1)(2) | 589 | 9,530 | ||||||
BioSig Technologies, Inc.(1)(2) | 1,382 | 8,181 | ||||||
Cardiovascular Systems, Inc.(1) | 2,986 | 145,090 | ||||||
Cerus Corp.(1) | 10,738 | 45,314 | ||||||
| 18 | See Notes to Financial Statements. |
Table of Contents
Calvert
VP Russell 2000® Small Cap Index Portfolio
December 31, 2019
Schedule of Investments — continued
| Security | Shares | Value | ||||||
| Health Care Equipment & Supplies (continued) | ||||||||
Conformis, Inc.(1) | 5,635 | $ | 8,453 | |||||
CONMED Corp. | 2,394 | 267,721 | ||||||
CryoLife, Inc.(1) | 3,149 | 85,306 | ||||||
CryoPort, Inc.(1)(2) | 2,620 | 43,125 | ||||||
Cutera, Inc.(1) | 1,118 | 40,036 | ||||||
CytoSorbents Corp.(1)(2) | 2,668 | 10,272 | ||||||
ElectroCore, Inc.(1)(2) | 480 | 763 | ||||||
GenMark Diagnostics, Inc.(1)(2) | 3,729 | 17,937 | ||||||
Glaukos Corp.(1)(2) | 3,390 | 184,653 | ||||||
Globus Medical, Inc., Class A(1) | 6,625 | 390,080 | ||||||
Haemonetics Corp.(1) | 4,474 | 514,063 | ||||||
Heska Corp.(1) | 603 | 57,852 | ||||||
Inogen, Inc.(1) | 1,598 | 109,191 | ||||||
Integer Holdings Corp.(1) | 2,856 | 229,708 | ||||||
IntriCon Corp.(1)(2) | 564 | 10,152 | ||||||
Invacare Corp.(2) | 2,498 | 22,532 | ||||||
iRadimed Corp.(1) | 282 | 6,593 | ||||||
iRhythm Technologies, Inc.(1)(2) | 2,272 | 154,701 | ||||||
Lantheus Holdings, Inc.(1) | 3,109 | 63,766 | ||||||
LeMaitre Vascular, Inc. | 1,302 | 46,807 | ||||||
LivaNova PLC(1) | 4,245 | 320,200 | ||||||
Meridian Bioscience, Inc. | 3,556 | 34,742 | ||||||
Merit Medical Systems, Inc.(1) | 4,551 | 142,082 | ||||||
Mesa Laboratories, Inc. | 319 | 79,559 | ||||||
Misonix, Inc.(1) | 649 | 12,078 | ||||||
Natus Medical, Inc.(1) | 2,809 | 92,669 | ||||||
Neogen Corp.(1) | 4,475 | 292,039 | ||||||
Neuronetics, Inc.(1) | 1,051 | 4,719 | ||||||
Nevro Corp.(1) | 2,612 | 307,015 | ||||||
Novocure, Ltd.(1) | 7,423 | 625,536 | ||||||
NuVasive, Inc.(1) | 4,526 | 350,041 | ||||||
OraSure Technologies, Inc.(1) | 4,811 | 38,632 | ||||||
Orthofix Medical, Inc.(1) | 1,448 | 66,869 | ||||||
OrthoPediatrics Corp.(1) | 650 | 30,544 | ||||||
Pulse Biosciences, Inc.(1) | 800 | 10,728 | ||||||
Quidel Corp.(1) | 3,013 | 226,065 | ||||||
Rockwell Medical, Inc.(1)(2) | 3,471 | 8,469 | ||||||
RTI Surgical Holdings, Inc.(1) | 4,427 | 12,130 | ||||||
SeaSpine Holdings Corp.(1) | 1,048 | 12,586 | ||||||
Senseonics Holdings, Inc.(1)(2) | 7,040 | 6,449 | ||||||
Shockwave Medical, Inc.(1)(2) | 2,190 | 96,185 | ||||||
SI-BONE, Inc.(1) | 1,391 | 29,907 | ||||||
Sientra, Inc.(1) | 3,217 | 28,760 | ||||||
Silk Road Medical, Inc.(1)(2) | 1,382 | 55,805 | ||||||
Soliton, Inc.(1)(2) | 193 | 2,119 | ||||||
STAAR Surgical Co.(1)(2) | 3,782 | 133,013 | ||||||
| Security | Shares | Value | ||||||
| Health Care Equipment & Supplies (continued) | ||||||||
SurModics, Inc.(1) | 1,145 | $ | 47,437 | |||||
Tactile Systems Technology, Inc.(1) | 1,512 | 102,075 | ||||||
Tandem Diabetes Care, Inc.(1)(2) | 4,905 | 292,387 | ||||||
TransEnterix, Inc.(1)(2) | 962 | 1,414 | ||||||
TransMedics Group, Inc.(1)(2) | 1,222 | 23,230 | ||||||
Utah Medical Products, Inc. | 296 | 31,938 | ||||||
Vapotherm, Inc.(1) | 1,219 | 14,823 | ||||||
Varex Imaging Corp.(1) | 3,308 | 98,612 | ||||||
ViewRay, Inc.(1)(2) | 5,951 | 25,113 | ||||||
Wright Medical Group NV(1) | 11,023 | 335,981 | ||||||
Zynex, Inc.(1)(2) | 1,374 | 10,813 | ||||||
| $ | 7,072,988 | |||||||
| Health Care Providers & Services — 2.1% | ||||||||
Addus HomeCare Corp.(1) | 1,070 | $ | 104,025 | |||||
Amedisys, Inc.(1) | 2,740 | 457,361 | ||||||
American Renal Associates Holdings, Inc.(1) | 1,530 | 15,866 | ||||||
AMN Healthcare Services, Inc.(1) | 4,023 | 250,673 | ||||||
Apollo Medical Holdings, Inc.(1) | 575 | 10,586 | ||||||
Avalon GloboCare Corp.(1) | 1,913 | 3,692 | ||||||
BioTelemetry, Inc.(1) | 2,899 | 134,224 | ||||||
Brookdale Senior Living, Inc.(1) | 15,634 | 113,659 | ||||||
Catasys, Inc.(1)(2) | 623 | 10,161 | ||||||
Community Health Systems, Inc.(1)(2) | 8,353 | 24,224 | ||||||
CorVel Corp.(1) | 831 | 72,596 | ||||||
Cross Country Healthcare, Inc.(1) | 2,877 | 33,431 | ||||||
Diplomat Pharmacy, Inc.(1) | 4,672 | 18,688 | ||||||
Ensign Group, Inc. (The) | 4,299 | 195,046 | ||||||
Enzo Biochem, Inc.(1) | 3,092 | 8,132 | ||||||
Genesis Healthcare, Inc.(1) | 7,358 | 12,067 | ||||||
Hanger, Inc.(1) | 3,196 | 88,241 | ||||||
HealthEquity, Inc.(1) | 6,045 | 447,753 | ||||||
Joint Corp. (The)(1) | 1,152 | 18,593 | ||||||
LHC Group, Inc.(1) | 2,632 | 362,584 | ||||||
Magellan Health, Inc.(1) | 1,928 | 150,866 | ||||||
National HealthCare Corp. | 1,074 | 92,826 | ||||||
National Research Corp., Class A | 1,033 | 68,116 | ||||||
Option Care Health, Inc.(1) | 9,711 | 36,222 | ||||||
Owens & Minor, Inc. | 5,393 | 27,882 | ||||||
Patterson Cos., Inc.(2) | 7,112 | 145,654 | ||||||
Pennant Group, Inc. (The)(1) | 2,149 | 71,067 | ||||||
PetIQ, Inc.(1)(2) | 1,614 | 40,431 | ||||||
Progyny, Inc.(1) | 997 | 27,368 | ||||||
Providence Service Corp. (The)(1) | 931 | 55,097 | ||||||
R1 RCM, Inc.(1) | 8,804 | 114,276 | ||||||
RadNet, Inc.(1) | 3,530 | 71,659 | ||||||
| 19 | See Notes to Financial Statements. |
Table of Contents
Calvert
VP Russell 2000® Small Cap Index Portfolio
December 31, 2019
Schedule of Investments — continued
| Security | Shares | Value | ||||||
| Health Care Providers & Services (continued) | ||||||||
Select Medical Holdings Corp.(1) | 9,598 | $ | 224,017 | |||||
Surgery Partners, Inc.(1) | 2,112 | 33,063 | ||||||
Tenet Healthcare Corp.(1) | 9,038 | 343,715 | ||||||
Tivity Health, Inc.(1)(2) | 4,170 | 84,839 | ||||||
Triple-S Management Corp., Class B(1) | 1,726 | 31,914 | ||||||
US Physical Therapy, Inc. | 1,104 | 126,242 | ||||||
| $ | 4,126,856 | |||||||
| Health Care Technology — 0.9% | ||||||||
Allscripts Healthcare Solutions, Inc.(1) | 13,910 | $ | 136,527 | |||||
Castlight Health, Inc., Class B(1) | 8,657 | 11,514 | ||||||
Computer Programs & Systems, Inc. | 938 | 24,763 | ||||||
Evolent Health, Inc., Class A(1)(2) | 5,757 | 52,101 | ||||||
Health Catalyst, Inc. | 675 | 23,422 | ||||||
HealthStream, Inc.(1) | 2,289 | 62,261 | ||||||
HMS Holdings Corp.(1) | 7,627 | 225,759 | ||||||
Inovalon Holdings, Inc., Class A(1) | 6,210 | 116,872 | ||||||
Inspire Medical Systems, Inc.(1) | 1,219 | 90,462 | ||||||
Livongo Health, Inc.(1)(2) | 1,206 | 30,222 | ||||||
NextGen Healthcare, Inc.(1) | 4,587 | 73,713 | ||||||
Omnicell, Inc.(1) | 3,628 | 296,480 | ||||||
OptimizeRx Corp.(1)(2) | 1,058 | 10,866 | ||||||
Phreesia, Inc.(1)(2) | 851 | 22,671 | ||||||
Simulations Plus, Inc. | 960 | 27,907 | ||||||
Tabula Rasa HealthCare, Inc.(1)(2) | 1,665 | 81,052 | ||||||
Teladoc Health, Inc.(1)(2) | 6,104 | 511,027 | ||||||
Vocera Communications, Inc.(1) | 2,455 | 50,966 | ||||||
| $ | 1,848,585 | |||||||
| Hotels, Restaurants & Leisure — 2.5% | ||||||||
BBX Capital Corp. | 5,432 | $ | 25,911 | |||||
Biglari Holdings, Inc., Class B(1) | 80 | 9,154 | ||||||
BJ’s Restaurants, Inc. | 1,671 | 63,431 | ||||||
Bloomin’ Brands, Inc. | 7,647 | 168,769 | ||||||
Bluegreen Vacations Corp.(2) | 637 | 6,587 | ||||||
Boyd Gaming Corp. | 6,857 | 205,299 | ||||||
Brinker International, Inc.(2) | 3,201 | 134,442 | ||||||
Carrols Restaurant Group, Inc.(1) | 3,096 | 21,827 | ||||||
Century Casinos, Inc.(1) | 1,662 | 13,163 | ||||||
Cheesecake Factory, Inc. (The)(2) | 3,655 | 142,033 | ||||||
Churchill Downs, Inc. | 3,071 | 421,341 | ||||||
Chuy’s Holdings, Inc.(1) | 1,271 | 32,944 | ||||||
Cracker Barrel Old Country Store, Inc. | 2,066 | 317,627 | ||||||
Dave & Buster’s Entertainment, Inc.(2) | 2,653 | 106,571 | ||||||
Del Taco Restaurants, Inc.(1) | 2,895 | 22,885 | ||||||
| Security | Shares | Value | ||||||
| Hotels, Restaurants & Leisure (continued) | ||||||||
Denny’s Corp.(1) | 4,997 | $ | 99,340 | |||||
Dine Brands Global, Inc.(2) | 1,363 | 113,838 | ||||||
Drive Shack, Inc.(1)(2) | 5,300 | 19,398 | ||||||
El Pollo Loco Holdings, Inc.(1) | 1,580 | 23,921 | ||||||
Eldorado Resorts, Inc.(1)(2) | 5,762 | 343,646 | ||||||
Everi Holdings, Inc.(1) | 5,591 | 75,087 | ||||||
Fiesta Restaurant Group, Inc.(1) | 2,070 | 20,472 | ||||||
Golden Entertainment, Inc.(1) | 1,501 | 28,849 | ||||||
Habit Restaurants, Inc. (The), Class A(1) | 1,773 | 18,492 | ||||||
Inspired Entertainment, Inc.(1) | 780 | 5,265 | ||||||
J. Alexander’s Holdings, Inc.(1) | 1,066 | 10,191 | ||||||
Jack in the Box, Inc. | 2,247 | 175,333 | ||||||
Kura Sushi USA, Inc., Class A(1) | 280 | 7,126 | ||||||
Lindblad Expeditions Holdings, Inc.(1) | 1,767 | 28,890 | ||||||
Marriott Vacations Worldwide Corp. | 3,560 | 458,386 | ||||||
Monarch Casino & Resort, Inc.(1) | 917 | 44,520 | ||||||
Nathan’s Famous, Inc. | 237 | 16,799 | ||||||
Noodles & Co.(1)(2) | 2,480 | 13,739 | ||||||
Papa John’s International, Inc. | 1,920 | 121,248 | ||||||
Penn National Gaming, Inc.(1) | 9,442 | 241,338 | ||||||
PlayAGS, Inc.(1) | 1,838 | 22,295 | ||||||
Potbelly Corp.(1) | 1,684 | 7,106 | ||||||
RCI Hospitality Holdings, Inc. | 797 | 16,339 | ||||||
Red Lion Hotels Corp.(1) | 1,106 | 4,125 | ||||||
Red Robin Gourmet Burgers, Inc.(1) | 1,090 | 35,992 | ||||||
Red Rock Resorts, Inc., Class A | 5,966 | 142,886 | ||||||
Ruth’s Hospitality Group, Inc. | 2,317 | 50,430 | ||||||
Scientific Games Corp., Class A(1) | 4,901 | 131,249 | ||||||
SeaWorld Entertainment, Inc.(1) | 3,923 | 124,398 | ||||||
Shake Shack, Inc., Class A(1)(2) | 2,549 | 151,844 | ||||||
Target Hospitality Corp.(1) | 2,913 | 14,565 | ||||||
Texas Roadhouse, Inc. | 5,779 | 325,473 | ||||||
Twin River Worldwide Holdings, Inc. | 1,497 | 38,398 | ||||||
Wingstop, Inc. | 2,554 | 220,231 | ||||||
| $ | 4,843,193 | |||||||
| Household Durables — 1.6% | ||||||||
Bassett Furniture Industries, Inc. | 830 | $ | 13,844 | |||||
Beazer Homes USA, Inc.(1) | 2,686 | 37,953 | ||||||
Cavco Industries, Inc.(1) | 750 | 146,535 | ||||||
Century Communities, Inc.(1) | 2,337 | 63,917 | ||||||
Ethan Allen Interiors, Inc. | 1,924 | 36,671 | ||||||
Flexsteel Industries, Inc. | 560 | 11,155 | ||||||
GoPro, Inc., Class A(1)(2) | 10,449 | 45,349 | ||||||
Green Brick Partners, Inc.(1) | 1,909 | 21,915 | ||||||
Hamilton Beach Brands Holding Co., Class A | 584 | 11,154 | ||||||
| 20 | See Notes to Financial Statements. |
Table of Contents
Calvert
VP Russell 2000® Small Cap Index Portfolio
December 31, 2019
Schedule of Investments — continued
| Security | Shares | Value | ||||||
| Household Durables (continued) | ||||||||
Helen of Troy, Ltd.(1) | 2,194 | $ | 394,459 | |||||
Hooker Furniture Corp. | 834 | 21,425 | ||||||
Installed Building Products, Inc.(1) | 1,894 | 130,440 | ||||||
iRobot Corp.(1)(2) | 2,332 | 118,069 | ||||||
KB Home | 7,483 | 256,442 | ||||||
La-Z-Boy, Inc. | 3,892 | 122,520 | ||||||
Legacy Housing Corp.(1) | 380 | 6,323 | ||||||
LGI Homes, Inc.(1) | 1,706 | 120,529 | ||||||
Lifetime Brands, Inc. | 858 | 5,963 | ||||||
Lovesac Co. (The)(1) | 730 | 11,717 | ||||||
M / I Homes, Inc.(1) | 2,260 | 88,931 | ||||||
MDC Holdings, Inc. | 4,336 | 165,462 | ||||||
Meritage Homes Corp.(1) | 3,074 | 187,852 | ||||||
Purple Innovation, Inc.(1) | 356 | 3,101 | ||||||
Skyline Champion Corp.(1) | 4,331 | 137,293 | ||||||
Sonos, Inc.(1) | 6,101 | 95,298 | ||||||
Taylor Morrison Home Corp., Class A(1) | 8,995 | 196,631 | ||||||
TopBuild Corp.(1) | 2,877 | 296,561 | ||||||
TRI Pointe Group, Inc.(1) | 12,325 | 192,024 | ||||||
Tupperware Brands Corp. | 4,044 | 34,698 | ||||||
Universal Electronics, Inc.(1) | 1,223 | 63,914 | ||||||
William Lyon Homes, Class A(1) | 2,707 | 54,086 | ||||||
ZAGG, Inc.(1) | 2,279 | 18,483 | ||||||
| $ | 3,110,714 | |||||||
| Household Products — 0.2% | ||||||||
Central Garden & Pet Co.(1) | 789 | $ | 24,514 | |||||
Central Garden & Pet Co., Class A(1) | 3,454 | 101,409 | ||||||
Oil-Dri Corp. of America | 406 | 14,718 | ||||||
WD-40 Co.(2) | 1,200 | 232,968 | ||||||
| $ | 373,609 | |||||||
| Independent Power and Renewable Electricity Producers — 0.4% | ||||||||
Atlantic Power Corp.(1)(2) | 10,236 | $ | 23,850 | |||||
Clearway Energy, Inc., Class A | 3,063 | 58,565 | ||||||
Clearway Energy, Inc., Class C | 6,480 | 129,276 | ||||||
Ormat Technologies, Inc. | 3,487 | 259,851 | ||||||
Pattern Energy Group, Inc., Class A | 7,520 | 201,198 | ||||||
Sunnova Energy International, Inc.(1) | 1,115 | 12,443 | ||||||
TerraForm Power, Inc., Class A | 6,811 | 104,821 | ||||||
| $ | 790,004 | |||||||
| Industrial Conglomerates — 0.1% | ||||||||
Raven Industries, Inc. | 3,174 | $ | 109,376 | |||||
| Security | Shares | Value | ||||||
| Insurance — 2.1% | ||||||||
Ambac Financial Group, Inc.(1) | 3,798 | $ | 81,923 | |||||
American Equity Investment Life Holding Co. | 7,921 | 237,076 | ||||||
AMERISAFE, Inc. | 1,636 | 108,025 | ||||||
Argo Group International Holdings, Ltd. | 2,857 | 187,848 | ||||||
BRP Group, Inc., Class A(1) | 1,294 | 20,769 | ||||||
Citizens, Inc.(1)(2) | 3,380 | 22,815 | ||||||
CNO Financial Group, Inc. | 13,005 | 235,781 | ||||||
Crawford & Co., Class A | 1,459 | 16,735 | ||||||
Donegal Group, Inc., Class A | 916 | 13,575 | ||||||
eHealth, Inc.(1)(2) | 1,954 | 187,740 | ||||||
Employers Holdings, Inc. | 2,669 | 111,431 | ||||||
Enstar Group, Ltd.(1) | 983 | 203,343 | ||||||
FBL Financial Group, Inc., Class A | 766 | 45,140 | ||||||
FedNat Holding Co. | 1,014 | 16,863 | ||||||
Genworth Financial, Inc., Class A(1) | 43,475 | 191,290 | ||||||
Global Indemnity, Ltd. | 810 | 24,000 | ||||||
Goosehead Insurance, Inc., Class A(2) | 957 | 40,577 | ||||||
Greenlight Capital Re, Ltd., Class A(1) | 2,647 | 26,761 | ||||||
Hallmark Financial Services, Inc.(1) | 1,205 | 21,172 | ||||||
HCI Group, Inc. | 611 | 27,892 | ||||||
Health Insurance Innovations, Inc., Class A(1)(2) | 983 | 18,962 | ||||||
Heritage Insurance Holdings, Inc. | 1,906 | 25,254 | ||||||
Horace Mann Educators Corp. | 3,502 | 152,897 | ||||||
Independence Holding Co. | 394 | 16,579 | ||||||
Investors Title Co. | 111 | 17,671 | ||||||
James River Group Holdings, Ltd. | 2,526 | 104,096 | ||||||
Kinsale Capital Group, Inc. | 1,780 | 180,955 | ||||||
MBIA, Inc.(1) | 7,302 | 67,909 | ||||||
National General Holdings Corp. | 5,773 | 127,583 | ||||||
National Western Life Group, Inc., Class A | 193 | 56,140 | ||||||
NI Holdings, Inc.(1) | 903 | 15,532 | ||||||
Palomar Holdings, Inc.(1) | 1,076 | 54,327 | ||||||
ProAssurance Corp. | 4,666 | 168,629 | ||||||
ProSight Global, Inc.(1) | 758 | 12,227 | ||||||
Protective Insurance Corp., Class B | 853 | 13,725 | ||||||
RLI Corp. | 3,510 | 315,970 | ||||||
Safety Insurance Group, Inc. | 1,242 | 114,922 | ||||||
Selective Insurance Group, Inc. | 5,107 | 332,925 | ||||||
State Auto Financial Corp. | 1,338 | 41,505 | ||||||
Stewart Information Services Corp. | 1,974 | 80,519 | ||||||
Third Point Reinsurance, Ltd.(1) | 6,160 | 64,803 | ||||||
Tiptree, Inc., Class A | 2,311 | 18,812 | ||||||
Trupanion, Inc.(1)(2) | 2,430 | 91,028 | ||||||
United Fire Group, Inc. | 1,866 | 81,600 | ||||||
United Insurance Holdings Co. | 1,483 | 18,701 | ||||||
Universal Insurance Holdings, Inc. | 2,530 | 70,815 | ||||||
| 21 | See Notes to Financial Statements. |
Table of Contents
Calvert
VP Russell 2000® Small Cap Index Portfolio
December 31, 2019
Schedule of Investments — continued
| Security | Shares | Value | ||||||
| Insurance (continued) | ||||||||
Watford Holdings, Ltd.(1) | 1,786 | $ | 44,936 | |||||
| $ | 4,129,778 | |||||||
| Interactive Media & Services — 0.4% | ||||||||
Care.com, Inc.(1) | 1,627 | $ | 24,454 | |||||
Cargurus, Inc.(1) | 6,385 | 224,624 | ||||||
Cars.com, Inc.(1) | 5,846 | 71,438 | ||||||
DHI Group, Inc.(1) | 4,512 | 13,581 | ||||||
Eventbrite, Inc., Class A(1) | 3,223 | 65,008 | ||||||
EverQuote, Inc., Class A(1) | 749 | 25,728 | ||||||
Liberty TripAdvisor Holdings, Inc., Series A(1) | 6,271 | 46,092 | ||||||
Meet Group, Inc. (The)(1) | 5,878 | 29,449 | ||||||
QuinStreet, Inc.(1) | 3,693 | 56,540 | ||||||
Travelzoo, Inc.(1) | 416 | 4,451 | ||||||
TrueCar, Inc.(1) | 7,838 | 37,231 | ||||||
Yelp, Inc.(1) | 6,057 | 210,965 | ||||||
| $ | 809,561 | |||||||
| Internet & Direct Marketing Retail — 0.3% | ||||||||
1-800-Flowers.com, Inc., Class A(1) | 2,081 | $ | 30,175 | |||||
Duluth Holdings, Inc., Class B(1)(2) | 634 | 6,676 | ||||||
Groupon, Inc.(1) | 36,777 | 87,897 | ||||||
Lands’ End, Inc.(1)(2) | 879 | 14,767 | ||||||
Leaf Group, Ltd.(1) | 1,040 | 4,160 | ||||||
Liquidity Services, Inc.(1) | 2,122 | 12,647 | ||||||
Overstock.com, Inc.(1) | 2,250 | 15,863 | ||||||
PetMed Express, Inc.(2) | 1,778 | 41,819 | ||||||
Quotient Technology, Inc.(1) | 6,468 | 63,774 | ||||||
RealReal, Inc. (The)(1)(2) | 1,453 | 27,389 | ||||||
Rubicon Project, Inc. (The)(1) | 4,228 | 34,500 | ||||||
Shutterstock, Inc.(1) | 1,515 | 64,963 | ||||||
Stamps.com, Inc.(1) | 1,448 | 120,937 | ||||||
Stitch Fix, Inc. Class A(1)(2) | 3,700 | 94,942 | ||||||
Waitr Holdings, Inc.(1)(2) | 4,628 | 1,490 | ||||||
| $ | 621,999 | |||||||
| IT Services — 2.0% | ||||||||
Brightcove, Inc.(1) | 3,175 | $ | 27,591 | |||||
Cardtronics PLC, Class A(1) | 3,306 | 147,613 | ||||||
Cass Information Systems, Inc. | 1,244 | 71,829 | ||||||
Conduent, Inc.(1) | 15,269 | 94,668 | ||||||
CSG Systems International, Inc. | 2,770 | 143,431 | ||||||
Endurance International Group Holdings, Inc.(1) | 5,998 | 28,191 | ||||||
EVERTEC, Inc. | 5,329 | 181,399 | ||||||
Evo Payments, Inc., Class A(1) | 2,960 | 78,174 | ||||||
| Security | Shares | Value | ||||||
| IT Services (continued) | ||||||||
Exela Technologies, Inc.(1) | 4,038 | $ | 1,646 | |||||
ExlService Holdings, Inc.(1) | 2,930 | 203,518 | ||||||
GTT Communications, Inc.(1)(2) | 2,822 | 32,030 | ||||||
Hackett Group, Inc. (The) | 1,931 | 31,166 | ||||||
I3 Verticals, Inc., Class A(1) | 1,204 | 34,013 | ||||||
Information Services Group, Inc.(1) | 2,421 | 6,125 | ||||||
International Money Express, Inc.(1) | 1,143 | 13,762 | ||||||
KBR, Inc. | 12,362 | 377,041 | ||||||
Limelight Networks, Inc.(1) | 9,183 | 37,467 | ||||||
LiveRamp Holdings, Inc.(1) | 5,856 | 281,498 | ||||||
ManTech International Corp., Class A | 2,262 | 180,689 | ||||||
MAXIMUS, Inc. | 5,550 | 412,864 | ||||||
NIC, Inc. | 5,484 | 122,567 | ||||||
Paysign, Inc.(2) | 2,627 | 26,664 | ||||||
Perficient, Inc.(1) | 2,876 | 132,497 | ||||||
Perspecta, Inc. | 12,010 | 317,544 | ||||||
PRGX Global, Inc.(1) | 1,817 | 8,940 | ||||||
Priority Technology Holdings, Inc.(1) | 578 | 1,416 | ||||||
Science Applications International Corp. | 4,977 | 433,098 | ||||||
StarTek, Inc.(1) | 1,434 | 11,443 | ||||||
Sykes Enterprises, Inc.(1) | 3,342 | 123,621 | ||||||
TTEC Holdings, Inc. | 1,255 | 49,723 | ||||||
Tucows, Inc., Class A(1)(2) | 790 | 48,806 | ||||||
Unisys Corp.(1) | 4,476 | 53,085 | ||||||
Verra Mobility Corp.(1) | 10,953 | 153,232 | ||||||
Virtusa Corp.(1) | 2,429 | 110,107 | ||||||
| $ | 3,977,458 | |||||||
| Leisure Products — 0.4% | ||||||||
Acushnet Holdings Corp. | 3,081 | $ | 100,132 | |||||
American Outdoor Brands Corp.(1) | 4,733 | 43,922 | ||||||
Callaway Golf Co. | 8,143 | 172,632 | ||||||
Clarus Corp. | 1,804 | 24,462 | ||||||
Escalade, Inc. | 888 | 8,729 | ||||||
Johnson Outdoors, Inc., Class A | 405 | 31,064 | ||||||
Malibu Boats, Inc., Class A(1) | 1,736 | 71,089 | ||||||
Marine Products Corp. | 813 | 11,707 | ||||||
MasterCraft Boat Holdings, Inc.(1) | 1,615 | 25,436 | ||||||
Sturm Ruger & Co., Inc. | �� | 1,458 | 68,570 | |||||
Vista Outdoor, Inc.(1) | 5,021 | 37,557 | ||||||
YETI Holdings, Inc.(1)(2) | 3,419 | 118,913 | ||||||
| $ | 714,213 | |||||||
| Life Sciences Tools & Services — 0.8% | ||||||||
Accelerate Diagnostics, Inc.(1)(2) | 2,287 | $ | 38,650 | |||||
ChromaDex Corp.(1)(2) | 3,310 | 14,266 | ||||||
| 22 | See Notes to Financial Statements. |
Table of Contents
Calvert
VP Russell 2000® Small Cap Index Portfolio
December 31, 2019
Schedule of Investments — continued
| Security | Shares | Value | ||||||
| Life Sciences Tools & Services (continued) | ||||||||
Codexis, Inc.(1)(2) | 4,645 | $ | 74,274 | |||||
Fluidigm Corp.(1) | 6,011 | 20,918 | ||||||
Luminex Corp. | 3,659 | 84,742 | ||||||
Medpace Holdings, Inc.(1) | 2,363 | 198,634 | ||||||
NanoString Technologies, Inc.(1) | 2,833 | 78,814 | ||||||
NeoGenomics, Inc.(1) | 8,290 | 242,483 | ||||||
Pacific Biosciences of California, Inc.(1) | 11,309 | 58,128 | ||||||
Personalis, Inc.(1) | 740 | 8,066 | ||||||
Quanterix Corp.(1)(2) | 1,142 | 26,985 | ||||||
Repligen Corp.(1) | 4,522 | 418,285 | ||||||
Syneos Health, Inc.(1) | 5,433 | 323,128 | ||||||
| $ | 1,587,373 | |||||||
| Machinery — 3.5% | ||||||||
Actuant Corp., Class A | 4,678 | $ | 121,768 | |||||
Alamo Group, Inc. | 815 | 102,323 | ||||||
Albany International Corp., Class A | 2,680 | 203,466 | ||||||
Altra Industrial Motion Corp. | 5,472 | 198,141 | ||||||
Astec Industries, Inc. | 1,870 | 78,540 | ||||||
Barnes Group, Inc. | 4,112 | 254,779 | ||||||
Blue Bird Corp.(1) | 1,311 | 30,048 | ||||||
Briggs & Stratton Corp.(2) | 3,442 | 22,924 | ||||||
Chart Industries, Inc.(1) | 3,153 | 212,796 | ||||||
CIRCOR International, Inc.(1) | 1,669 | 77,175 | ||||||
Columbus McKinnon Corp. | 1,943 | 77,778 | ||||||
Commercial Vehicle Group, Inc.(1) | 2,209 | 14,027 | ||||||
Douglas Dynamics, Inc. | 1,952 | 107,360 | ||||||
Eastern Co. (The) | 490 | 14,960 | ||||||
Energy Recovery, Inc.(1)(2) | 2,683 | 26,267 | ||||||
EnPro Industries, Inc. | 1,761 | 117,776 | ||||||
ESCO Technologies, Inc. | 2,195 | 203,037 | ||||||
Evoqua Water Technologies Corp.(1) | 6,364 | 120,598 | ||||||
Federal Signal Corp. | 5,217 | 168,248 | ||||||
Franklin Electric Co., Inc. | 3,978 | 228,019 | ||||||
Gencor Industries, Inc.(1) | 603 | 7,037 | ||||||
Gorman-Rupp Co. (The) | 1,373 | 51,487 | ||||||
Graham Corp. | 863 | 18,882 | ||||||
Greenbrier Cos., Inc. (The) | 2,628 | 85,226 | ||||||
Helios Technologies, Inc. | 2,542 | 117,517 | ||||||
Hillenbrand, Inc. | 6,378 | 212,451 | ||||||
Hurco Cos., Inc. | 529 | 20,292 | ||||||
Hyster-Yale Materials Handling, Inc. | 907 | 53,477 | ||||||
John Bean Technologies Corp. | 2,741 | 308,801 | ||||||
Kadant, Inc. | 952 | 100,284 | ||||||
Kennametal, Inc. | 7,167 | 264,391 | ||||||
LB Foster Co., Class A(1) | 731 | 14,167 | ||||||
| Security | Shares | Value | ||||||
| Machinery (continued) | ||||||||
Lindsay Corp. | 920 | $ | 88,311 | |||||
Luxfer Holdings PLC | 2,400 | 44,424 | ||||||
Lydall, Inc.(1) | 1,313 | 26,943 | ||||||
Manitowoc Co., Inc. (The)(1) | 2,727 | 47,722 | ||||||
Meritor, Inc.(1) | 6,745 | 176,652 | ||||||
Miller Industries, Inc. | 1,050 | 38,986 | ||||||
Mueller Industries, Inc. | 4,874 | 154,749 | ||||||
Mueller Water Products, Inc., Class A | 13,464 | 161,299 | ||||||
Navistar International Corp.(1) | 4,357 | 126,092 | ||||||
NN, Inc. | 3,488 | 32,264 | ||||||
Omega Flex, Inc. | 248 | 26,608 | ||||||
Park-Ohio Holdings Corp. | 726 | 24,430 | ||||||
Proto Labs, Inc.(1) | 2,312 | 234,784 | ||||||
RBC Bearings, Inc.(1) | 2,131 | 337,422 | ||||||
REV Group, Inc. | 2,574 | 31,480 | ||||||
Rexnord Corp.(1) | 9,190 | 299,778 | ||||||
Spartan Motors, Inc. | 3,015 | 54,511 | ||||||
SPX Corp.(1) | 3,739 | 190,240 | ||||||
SPX FLOW, Inc.(1) | 3,637 | 177,740 | ||||||
Standex International Corp. | 1,097 | 87,047 | ||||||
Tennant Co. | 1,548 | 120,620 | ||||||
Terex Corp. | 5,568 | 165,815 | ||||||
Titan International, Inc. | 3,947 | 14,288 | ||||||
TriMas Corp.(1) | 3,997 | 125,546 | ||||||
Twin Disc, Inc.(1) | 749 | 8,254 | ||||||
Wabash National Corp. | 4,465 | 65,591 | ||||||
Watts Water Technologies, Inc., Class A | 2,413 | 240,721 | ||||||
Welbilt, Inc.(1) | 11,411 | 178,126 | ||||||
| $ | 6,914,485 | |||||||
| Marine — 0.1% | ||||||||
Costamare, Inc. | 4,298 | $ | 40,960 | |||||
Eagle Bulk Shipping, Inc.(1) | 3,373 | 15,516 | ||||||
Genco Shipping & Trading, Ltd. | 675 | 7,169 | ||||||
Matson, Inc. | 3,735 | 152,388 | ||||||
Safe Bulkers, Inc.(1) | 4,225 | 7,182 | ||||||
Scorpio Bulkers, Inc. | 4,249 | 27,066 | ||||||
| $ | 250,281 | |||||||
| Media — 0.8% | ||||||||
Boston Omaha Corp., Class A(1)(2) | 868 | $ | 18,263 | |||||
Cardlytics, Inc.(1)(2) | 1,181 | 74,238 | ||||||
Central European Media Enterprises, Ltd., Class A(1) | 6,603 | 29,912 | ||||||
Clear Channel Outdoor Holdings, Inc.(1) | 3,136 | 8,969 | ||||||
comScore, Inc.(1) | 4,319 | 21,336 | ||||||
| 23 | See Notes to Financial Statements. |
Table of Contents
Calvert
VP Russell 2000® Small Cap Index Portfolio
December 31, 2019
Schedule of Investments — continued
| Security | Shares | Value | ||||||
| Media (continued) | ||||||||
Cumulus Media, Inc., Class A(1) | 1,252 | $ | 21,998 | |||||
Daily Journal Corp.(1) | 88 | 25,557 | ||||||
Emerald Expositions Events, Inc. | 2,053 | 21,659 | ||||||
Entercom Communications Corp., Class A(2) | 10,833 | 50,265 | ||||||
Entravision Communications Corp., Class A | 5,618 | 14,719 | ||||||
EW Scripps Co. (The), Class A | 4,675 | 73,444 | ||||||
Fluent, Inc.(1) | 2,683 | 6,708 | ||||||
Gannett Co., Inc.(2) | 10,067 | 64,227 | ||||||
Gray Television, Inc.(1) | 7,762 | 166,417 | ||||||
Hemisphere Media Group, Inc.(1) | 1,449 | 21,518 | ||||||
Lee Enterprises, Inc.(1) | 4,724 | 6,708 | ||||||
Liberty Latin America, Ltd., Class A(1) | 3,700 | 71,410 | ||||||
Liberty Latin America, Ltd., Class C(1) | 9,988 | 194,366 | ||||||
Loral Space & Communications, Inc.(1) | 1,011 | 32,676 | ||||||
Marchex, Inc., Class B(1) | 3,059 | 11,563 | ||||||
MDC Partners, Inc., Class A(1) | 4,777 | 13,280 | ||||||
Meredith Corp. | 3,302 | 107,216 | ||||||
MSG Networks, Inc., Class A(1) | 3,693 | 64,258 | ||||||
National CineMedia, Inc. | 5,225 | 38,090 | ||||||
Saga Communications, Inc., Class A | 394 | 11,978 | ||||||
Scholastic Corp. | 2,583 | 99,316 | ||||||
TechTarget, Inc.(1) | 1,981 | 51,704 | ||||||
TEGNA, Inc. | 19,031 | 317,627 | ||||||
Tribune Publishing Co. | 1,415 | 18,621 | ||||||
WideOpenWest, Inc.(1) | 1,802 | 13,371 | ||||||
| $ | 1,671,414 | |||||||
| Metals & Mining — 1.2% | ||||||||
AK Steel Holding Corp.(1)(2) | 27,698 | $ | 91,126 | |||||
Allegheny Technologies, Inc.(1)(2) | 11,028 | 227,839 | ||||||
Carpenter Technology Corp. | 4,139 | 206,040 | ||||||
Century Aluminum Co.(1) | 4,377 | 32,893 | ||||||
Cleveland-Cliffs, Inc.(2) | 23,455 | 197,022 | ||||||
Coeur Mining, Inc.(1) | 20,477 | 165,454 | ||||||
Commercial Metals Co. | 10,307 | 229,537 | ||||||
Compass Minerals International, Inc. | 2,990 | 182,270 | ||||||
Ferroglobe Representation & Warranty Insurance | 5,015 | — | ||||||
Gold Resource Corp. | 5,333 | 29,545 | ||||||
Haynes International, Inc. | 1,062 | 37,998 | ||||||
Hecla Mining Co. | 42,085 | 142,668 | ||||||
Kaiser Aluminum Corp. | 1,405 | 155,801 | ||||||
Materion Corp. | 1,729 | 102,789 | ||||||
Mayville Engineering Co., Inc.(1) | 556 | 5,215 | ||||||
Novagold Resources, Inc.(1) | 20,420 | 182,963 | ||||||
Olympic Steel, Inc. | 846 | 15,160 | ||||||
| Security | Shares | Value | ||||||
| Metals & Mining (continued) | ||||||||
Ramaco Resources, Inc.(1) | 430 | $ | 1,539 | |||||
Ryerson Holding Corp.(1) | 965 | 11,416 | ||||||
Schnitzer Steel Industries, Inc., Class A | 2,273 | 49,279 | ||||||
SunCoke Energy, Inc. | 6,534 | 40,707 | ||||||
Synalloy Corp.(1) | 692 | 8,934 | ||||||
TimkenSteel Corp.(1) | 3,081 | 24,217 | ||||||
Warrior Met Coal, Inc. | 4,424 | 93,479 | ||||||
Worthington Industries, Inc. | 3,367 | 142,020 | ||||||
| $ | 2,375,911 | |||||||
| Mortgage Real Estate Investment Trusts (REITs) — 1.2% | ||||||||
AG Mortgage Investment Trust, Inc. | 2,859 | $ | 44,086 | |||||
Anworth Mortgage Asset Corp. | 8,089 | 28,473 | ||||||
Apollo Commercial Real Estate Finance, Inc. | 13,478 | 246,513 | ||||||
Ares Commercial Real Estate Corp. | 2,562 | 40,582 | ||||||
Arlington Asset Investment Corp., Class A(2) | 1,962 | 10,928 | ||||||
ARMOUR Residential REIT, Inc. | 5,083 | 90,833 | ||||||
Blackstone Mortgage Trust, Inc., Class A(2) | 11,023 | 410,276 | ||||||
Capstead Mortgage Corp. | 8,164 | 64,659 | ||||||
Cherry Hill Mortgage Investment Corp.(2) | 1,030 | 15,028 | ||||||
Colony Credit Real Estate, Inc.(2) | 6,877 | 90,501 | ||||||
Dynex Capital, Inc.(2) | 1,888 | 31,983 | ||||||
Ellington Financial, Inc. | 2,380 | 43,625 | ||||||
Exantas Capital Corp. | 2,766 | 32,667 | ||||||
Granite Point Mortgage Trust, Inc. | 4,738 | 87,085 | ||||||
Great Ajax Corp. | 1,009 | 14,943 | ||||||
Invesco Mortgage Capital, Inc. | 12,551 | 208,974 | ||||||
KKR Real Estate Finance Trust, Inc.(2) | 2,170 | 44,312 | ||||||
Ladder Capital Corp. | 8,796 | 158,680 | ||||||
New York Mortgage Trust, Inc. | 22,619 | 140,916 | ||||||
Orchid Island Capital, Inc.(2) | 5,266 | 30,806 | ||||||
PennyMac Mortgage Investment Trust | 7,577 | 168,891 | ||||||
Ready Capital Corp. | 2,418 | 37,286 | ||||||
Redwood Trust, Inc. | 9,615 | 159,032 | ||||||
TPG RE Finance Trust, Inc. | 4,268 | 86,512 | ||||||
Western Asset Mortgage Capital Corp. | 4,545 | 46,950 | ||||||
| $ | 2,334,541 | |||||||
| Multi-Utilities — 0.6% | ||||||||
Avista Corp. | 5,752 | $ | 276,614 | |||||
Black Hills Corp. | 5,347 | 419,953 | ||||||
NorthWestern Corp. | 4,432 | 317,642 | ||||||
Unitil Corp. | 1,244 | 76,904 | ||||||
| $ | 1,091,113 | |||||||
| 24 | See Notes to Financial Statements. |
Table of Contents
Calvert
VP Russell 2000® Small Cap Index Portfolio
December 31, 2019
Schedule of Investments — continued
| Security | Shares | Value | ||||||
| Multiline Retail — 0.1% | ||||||||
Big Lots, Inc. | 3,466 | $ | 99,543 | |||||
Dillard’s, Inc., Class A(2) | 920 | 67,602 | ||||||
J.C. Penney Co., Inc.(1)(2) | 27,238 | 30,507 | ||||||
| $ | 197,652 | |||||||
| Oil, Gas & Consumable Fuels — 2.0% | ||||||||
Abraxas Petroleum Corp.(1) | 12,335 | $ | 4,331 | |||||
Altus Midstream Co., Class A(1)(2) | 4,444 | 12,710 | ||||||
Amplify Energy Corp. | 983 | 6,498 | ||||||
Arch Coal, Inc., Class A(2) | 1,294 | 92,832 | ||||||
Ardmore Shipping Corp.(1) | 2,717 | 24,589 | ||||||
Berry Petroleum Corp. | 5,491 | 51,780 | ||||||
Bonanza Creek Energy, Inc.(1) | 1,784 | 41,639 | ||||||
Brigham Minerals, Inc., Class A | 1,420 | 30,445 | ||||||
California Resources Corp.(1)(2) | 3,768 | 34,025 | ||||||
Callon Petroleum Co.(1) | 31,559 | 152,431 | ||||||
Chaparral Energy, Inc., Class A(1)(2) | 2,740 | 4,822 | ||||||
Clean Energy Fuels Corp.(1) | 11,983 | 28,040 | ||||||
CNX Resources Corp.(1) | 16,381 | 144,972 | ||||||
Comstock Resources, Inc.(1)(2) | 1,329 | 10,938 | ||||||
CONSOL Energy, Inc.(1) | 2,417 | 35,071 | ||||||
Contura Energy, Inc.(1) | 1,675 | 15,159 | ||||||
CVR Energy, Inc. | 2,550 | 103,096 | ||||||
Delek US Holdings, Inc. | 6,590 | 220,963 | ||||||
Denbury Resources, Inc.(1)(2) | 38,168 | 53,817 | ||||||
DHT Holdings, Inc. | 7,166 | 59,334 | ||||||
Diamond S Shipping, Inc.(1) | 1,939 | 32,459 | ||||||
Dorian LPG, Ltd.(1) | 2,207 | 34,164 | ||||||
Earthstone Energy, Inc., Class A(1) | 1,654 | 10,470 | ||||||
Energy Fuels, Inc.(1)(2) | 5,894 | 11,258 | ||||||
Evolution Petroleum Corp. | 1,370 | 7,494 | ||||||
Extraction Oil & Gas, Inc.(1)(2) | 8,830 | 18,720 | ||||||
Falcon Minerals Corp. | 3,404 | 24,032 | ||||||
GasLog, Ltd. | 3,212 | 31,445 | ||||||
Golar LNG, Ltd. | 7,867 | 111,869 | ||||||
Goodrich Petroleum Corp.(1) | 727 | 7,299 | ||||||
Green Plains, Inc.(2) | 3,369 | 51,984 | ||||||
Gulfport Energy Corp.(1) | 14,500 | 44,080 | ||||||
Hallador Energy Co. | 1,408 | 4,182 | ||||||
HighPoint Resources Corp.(1) | 8,393 | 14,184 | ||||||
International Seaways, Inc.(1) | 2,158 | 64,222 | ||||||
Jagged Peak Energy, Inc.(1)(2) | 4,878 | 41,414 | ||||||
Laredo Petroleum, Inc.(1) | 15,854 | 45,501 | ||||||
Magnolia Oil & Gas Corp., Class A(1)(2) | 8,916 | 112,163 | ||||||
Matador Resources Co.(1)(2) | 9,448 | 169,781 | ||||||
Montage Resources Corp.(1) | 1,875 | 14,888 | ||||||
| Security | Shares | Value | ||||||
| Oil, Gas & Consumable Fuels (continued) | ||||||||
NACCO Industries, Inc., Class A | 302 | $ | 14,143 | |||||
NextDecade Corp.(1) | 638 | 3,917 | ||||||
Nordic American Tankers, Ltd. | 11,683 | 57,480 | ||||||
Northern Oil and Gas, Inc.(1)(2) | 23,984 | 56,123 | ||||||
Oasis Petroleum, Inc.(1) | 27,278 | 88,926 | ||||||
Overseas Shipholding Group, Inc., Class A(1) | 2,804 | 6,449 | ||||||
Panhandle Oil and Gas, Inc., Class A | 1,238 | 13,878 | ||||||
Par Pacific Holdings, Inc.(1) | 3,112 | 72,323 | ||||||
PDC Energy, Inc.(1) | 5,418 | 141,789 | ||||||
Peabody Energy Corp. | 6,004 | 54,756 | ||||||
Penn Virginia Corp.(1) | 1,007 | 30,562 | ||||||
PrimeEnergy Resources Corp.(1) | 46 | 6,958 | ||||||
QEP Resources, Inc. | 21,110 | 94,995 | ||||||
Renewable Energy Group, Inc.(1)(2) | 3,095 | 83,410 | ||||||
REX American Resources Corp.(1) | 441 | 36,144 | ||||||
Ring Energy, Inc.(1)(2) | 5,049 | 13,329 | ||||||
Rosehill Resources, Inc.(1) | 220 | 282 | ||||||
SandRidge Energy, Inc.(1) | 2,381 | 10,095 | ||||||
Scorpio Tankers, Inc. | 3,833 | 150,790 | ||||||
SFL Corp., Ltd. | 6,931 | 100,777 | ||||||
SilverBow Resources, Inc.(1) | 612 | 6,059 | ||||||
SM Energy Co. | 9,886 | 111,119 | ||||||
Southwestern Energy Co.(1)(2) | 46,120 | 111,610 | ||||||
SRC Energy, Inc.(1) | 20,639 | 85,033 | ||||||
Talos Energy, Inc.(1) | 1,713 | 51,647 | ||||||
Teekay Corp. | 5,307 | 28,233 | ||||||
Teekay Tankers, Ltd., Class A(1) | 1,891 | 45,327 | ||||||
Tellurian, Inc.(1)(2) | 8,061 | 58,684 | ||||||
Unit Corp.(1) | 4,371 | 3,040 | ||||||
Uranium Energy Corp.(1)(2) | 11,981 | 11,013 | ||||||
W&T Offshore, Inc.(1) | 8,233 | 45,775 | ||||||
Whiting Petroleum Corp.(1)(2) | 8,028 | 58,926 | ||||||
World Fuel Services Corp. | 5,635 | 244,672 | ||||||
| $ | 3,877,365 | |||||||
| Paper & Forest Products — 0.4% | ||||||||
Boise Cascade Co. | 3,372 | $ | 123,179 | |||||
Clearwater Paper Corp.(1) | 1,465 | 31,292 | ||||||
Louisiana-Pacific Corp. | 10,157 | 301,358 | ||||||
Neenah, Inc. | 1,433 | 100,926 | ||||||
PH Glatfelter Co. | 3,755 | 68,717 | ||||||
Schweitzer-Mauduit International, Inc. | 2,615 | 109,804 | ||||||
Verso Corp., Class A(1) | 2,960 | 53,369 | ||||||
| $ | 788,645 | |||||||
| 25 | See Notes to Financial Statements. |
Table of Contents
Calvert
VP Russell 2000® Small Cap Index Portfolio
December 31, 2019
Schedule of Investments — continued
| Security | Shares | Value | ||||||
| Personal Products — 0.3% | ||||||||
Edgewell Personal Care Co.(1) | 4,548 | $ | 140,806 | |||||
elf Beauty, Inc.(1) | 2,305 | 37,180 | ||||||
Inter Parfums, Inc. | 1,484 | 107,902 | ||||||
Lifevantage Corp.(1) | 1,232 | 19,231 | ||||||
Medifast, Inc.(2) | 975 | 106,840 | ||||||
Nature’s Sunshine Products, Inc.(1) | 1,018 | 9,091 | ||||||
Revlon, Inc., Class A(1)(2) | 576 | 12,338 | ||||||
USANA Health Sciences, Inc.(1) | 1,152 | 90,490 | ||||||
Youngevity International, Inc.(1)(2) | 728 | 2,373 | ||||||
| $ | 526,251 | |||||||
| Pharmaceuticals — 1.7% | ||||||||
AcelRx Pharmaceuticals, Inc.(1)(2) | 6,913 | $ | 14,586 | |||||
Acer Therapeutics, Inc.(1) | 443 | 1,776 | ||||||
Aclaris Therapeutics, Inc.(1)(2) | 2,238 | 4,230 | ||||||
Aerie Pharmaceuticals, Inc.(1)(2) | 3,606 | 87,157 | ||||||
Akorn, Inc.(1) | 7,647 | 11,471 | ||||||
Amneal Pharmaceuticals, Inc.(1) | 10,162 | 48,981 | ||||||
Amphastar Pharmaceuticals, Inc.(1) | 3,073 | 59,278 | ||||||
ANI Pharmaceuticals, Inc.(1) | 781 | 48,164 | ||||||
Arvinas Holding Co., LLC(1)(2) | 1,821 | 74,825 | ||||||
Assertio Therapeutics, Inc.(1) | 5,272 | 6,590 | ||||||
Axsome Therapeutics, Inc.(1)(2) | 2,149 | 222,121 | ||||||
BioDelivery Sciences International, Inc.(1) | 7,195 | 45,472 | ||||||
Cara Therapeutics, Inc.(1)(2) | 3,311 | 53,340 | ||||||
cbdMD, Inc.(1)(2) | 832 | 1,880 | ||||||
Cerecor, Inc.(1) | 1,893 | 10,203 | ||||||
Chiasma, Inc.(1)(2) | 2,297 | 11,393 | ||||||
Collegium Pharmaceutical, Inc.(1) | 2,817 | 57,974 | ||||||
Corcept Therapeutics, Inc.(1) | 8,144 | 98,542 | ||||||
CorMedix, Inc.(1) | 2,079 | 15,135 | ||||||
Cymabay Therapeutics, Inc.(1) | 4,918 | 9,639 | ||||||
Dermira, Inc.(1)(2) | 4,173 | 63,263 | ||||||
Eloxx Pharmaceuticals, Inc.(1)(2) | 2,227 | 16,391 | ||||||
Endo International PLC(1) | 18,600 | 87,234 | ||||||
Evofem Biosciences, Inc.(1)(2) | 1,248 | 7,700 | ||||||
Evolus, Inc.(1)(2) | 1,256 | 15,286 | ||||||
EyePoint Pharmaceuticals, Inc.(1)(2) | 5,461 | 8,465 | ||||||
Fulcrum Therapeutics, Inc.(1) | 380 | 6,323 | ||||||
Innoviva, Inc.(1) | 5,742 | 81,307 | ||||||
Intersect ENT, Inc.(1) | 2,690 | 66,981 | ||||||
Intra-Cellular Therapies, Inc.(1)(2) | 3,739 | 128,285 | ||||||
Kala Pharmaceuticals, Inc.(1)(2) | 1,204 | 4,443 | ||||||
Kaleido Biosciences, Inc.(1)(2) | 445 | 2,234 | ||||||
Lannett Co., Inc.(1)(2) | 2,393 | 21,106 | ||||||
Liquidia Technologies, Inc.(1) | 390 | 1,667 | ||||||
| Security | Shares | Value | ||||||
| Pharmaceuticals (continued) | ||||||||
Mallinckrodt PLC(1)(2) | 6,794 | $ | 23,711 | |||||
Marinus Pharmaceuticals, Inc.(1)(2) | 3,474 | 7,504 | ||||||
Menlo Therapeutics, Inc.(1) | 543 | 2,520 | ||||||
MyoKardia, Inc.(1)(2) | 3,807 | 277,473 | ||||||
NGM Biopharmaceuticals, Inc.(1)(2) | 2,099 | 38,811 | ||||||
Ocular Therapeutix, Inc.(1)(2) | 1,979 | 7,817 | ||||||
Odonate Therapeutics, Inc.(1) | 975 | 31,639 | ||||||
Omeros Corp.(1)(2) | 4,139 | 58,319 | ||||||
Optinose, Inc.(1)(2) | 2,084 | 19,214 | ||||||
Osmotica Pharmaceuticals PLC(1)(2) | 800 | 5,592 | ||||||
Pacira BioSciences, Inc.(1) | 3,449 | 156,240 | ||||||
Paratek Pharmaceuticals, Inc.(1)(2) | 2,069 | 8,338 | ||||||
Phathom Pharmaceuticals, Inc.(1) | 925 | 28,805 | ||||||
Phibro Animal Health Corp., Class A | 1,619 | 40,200 | ||||||
Prestige Consumer Healthcare, Inc.(1) | 4,347 | 176,054 | ||||||
Reata Pharmaceuticals, Inc., Class A(1)(2) | 1,886 | 385,555 | ||||||
Recro Pharma, Inc.(1) | 1,686 | 30,904 | ||||||
resTORbio, Inc.(1) | 555 | 827 | ||||||
Revance Therapeutics, Inc.(1) | 3,771 | 61,203 | ||||||
Satsuma Pharmaceuticals, Inc.(1) | 380 | 7,478 | ||||||
SIGA Technologies, Inc.(1)(2) | 4,584 | 21,866 | ||||||
Strongbridge Biopharma PLC(1) | 3,193 | 6,673 | ||||||
Supernus Pharmaceuticals, Inc.(1) | 4,082 | 96,825 | ||||||
TherapeuticsMD, Inc.(1)(2) | 19,010 | 46,004 | ||||||
Theravance Biopharma, Inc.(1)(2) | 3,666 | 94,913 | ||||||
Tricida, Inc.(1)(2) | 1,867 | 70,461 | ||||||
Verrica Pharmaceuticals, Inc.(1)(2) | 1,080 | 17,161 | ||||||
WaVe Life Sciences, Ltd.(1) | 1,666 | 13,353 | ||||||
Xeris Pharmaceuticals, Inc.(1) | 1,688 | 11,900 | ||||||
Zogenix, Inc.(1) | 3,626 | 189,023 | ||||||
Zynerba Pharmaceuticals, Inc.(1)(2) | 1,835 | 11,083 | ||||||
| $ | 3,340,908 | |||||||
| Professional Services — 1.4% | ||||||||
Acacia Research Corp.(1) | 4,242 | $ | 11,284 | |||||
ASGN, Inc.(1) | 4,455 | 316,171 | ||||||
Barrett Business Services, Inc. | 606 | 54,819 | ||||||
BG Staffing, Inc. | 608 | 13,309 | ||||||
CBIZ, Inc.(1) | 4,490 | 121,050 | ||||||
CRA International, Inc. | 707 | 38,510 | ||||||
Exponent, Inc. | 4,516 | 311,649 | ||||||
Forrester Research, Inc. | 776 | 32,359 | ||||||
Franklin Covey Co.(1) | 1,007 | 32,456 | ||||||
FTI Consulting, Inc.(1) | 3,245 | 359,092 | ||||||
GP Strategies Corp.(1) | 1,007 | 13,323 | ||||||
Heidrick & Struggles International, Inc. | 1,525 | 49,563 | ||||||
| 26 | See Notes to Financial Statements. |
Table of Contents
Calvert
VP Russell 2000® Small Cap Index Portfolio
December 31, 2019
Schedule of Investments — continued
| Security | Shares | Value | ||||||
| Professional Services (continued) | ||||||||
Huron Consulting Group, Inc.(1) | 1,867 | $ | 128,300 | |||||
ICF International, Inc. | 1,595 | 146,134 | ||||||
InnerWorkings, Inc.(1) | 3,972 | 21,886 | ||||||
Insperity, Inc. | 3,230 | 277,909 | ||||||
Kelly Services, Inc., Class A | 2,680 | 60,514 | ||||||
Kforce, Inc. | 1,903 | 75,549 | ||||||
Korn Ferry | 4,787 | 202,969 | ||||||
Mistras Group, Inc.(1) | 1,338 | 19,093 | ||||||
Resources Connection, Inc. | 2,400 | 39,192 | ||||||
TriNet Group, Inc.(1) | 3,927 | 222,308 | ||||||
TrueBlue, Inc.(1) | 3,417 | 82,213 | ||||||
Upwork, Inc.(1) | 4,803 | 51,248 | ||||||
Willdan Group, Inc.(1) | 662 | 21,038 | ||||||
| $ | 2,701,938 | |||||||
| Real Estate Management & Development — 0.6% | ||||||||
Altisource Portfolio Solutions SA(1) | 495 | $ | 9,568 | |||||
American Realty Investors, Inc.(1) | 174 | 2,981 | ||||||
Consolidated-Tomoka Land Co. | 377 | 22,741 | ||||||
Cushman & Wakefield PLC(1) | 9,686 | 197,982 | ||||||
eXp World Holdings, Inc.(1)(2) | 1,407 | 15,941 | ||||||
Forestar Group, Inc.(1) | 995 | 20,746 | ||||||
FRP Holdings, Inc.(1) | 588 | 29,288 | ||||||
Griffin Industrial Realty, Inc. | 55 | 2,175 | ||||||
Kennedy-Wilson Holdings, Inc. | 10,725 | 239,167 | ||||||
Marcus & Millichap, Inc.(1) | 1,962 | 73,085 | ||||||
Maui Land & Pineapple Co., Inc.(1) | 589 | 6,626 | ||||||
Newmark Group, Inc., Class A | 12,362 | 166,331 | ||||||
Rafael Holdings, Inc., Class B(1) | 930 | 16,591 | ||||||
RE / MAX Holdings, Inc., Class A | 1,564 | 60,198 | ||||||
Realogy Holdings Corp.(2) | 10,040 | 97,187 | ||||||
Redfin Corp.(1) | 7,527 | 159,121 | ||||||
RMR Group, Inc. (The), Class A | 1,193 | 54,449 | ||||||
St. Joe Co. (The)(1)(2) | 3,093 | 61,334 | ||||||
Stratus Properties, Inc.(1) | 485 | 15,025 | ||||||
Tejon Ranch Co.(1) | 1,572 | 25,121 | ||||||
Transcontinental Realty Investors, Inc.(1) | 147 | 5,862 | ||||||
| $ | 1,281,519 | |||||||
| Road & Rail — 0.5% | ||||||||
ArcBest Corp. | 2,213 | $ | 61,079 | |||||
Avis Budget Group, Inc.(1) | 5,019 | 161,813 | ||||||
Covenant Transportation Group, Inc., Class A(1) | 905 | 11,697 | ||||||
Daseke, Inc.(1)(2) | 2,780 | 8,785 | ||||||
Heartland Express, Inc. | 3,887 | 81,821 | ||||||
| Security | Shares | Value | ||||||
| Road & Rail (continued) | ||||||||
Hertz Global Holdings, Inc.(1) | 8,647 | $ | 136,190 | |||||
Marten Transport, Ltd. | 3,366 | 72,335 | ||||||
PAM Transportation Services, Inc.(1) | 187 | 10,792 | ||||||
Roadrunner Transportation Systems, Inc.(1)(2) | 315 | 2,901 | ||||||
Saia, Inc.(1) | 2,258 | 210,265 | ||||||
Universal Truckload Services, Inc. | 475 | 9,006 | ||||||
US Xpress Enterprises, Inc., Class A(1)(2) | 1,727 | 8,687 | ||||||
Werner Enterprises, Inc. | 3,888 | 141,484 | ||||||
YRC Worldwide, Inc.(1)(2) | 2,802 | 7,145 | ||||||
| $ | 924,000 | |||||||
| Semiconductors & Semiconductor Equipment — 2.6% | ||||||||
Adesto Technologies Corp.(1)(2) | 1,702 | $ | 14,467 | |||||
Advanced Energy Industries, Inc.(1) | 3,267 | 232,610 | ||||||
Alpha & Omega Semiconductor, Ltd.(1) | 1,700 | 23,154 | ||||||
Ambarella, Inc.(1) | 2,758 | 167,024 | ||||||
Amkor Technology, Inc.(1) | 8,647 | 112,411 | ||||||
Axcelis Technologies, Inc.(1) | 2,813 | 67,779 | ||||||
AXT, Inc.(1) | 3,267 | 14,211 | ||||||
Brooks Automation, Inc. | 6,236 | 261,663 | ||||||
Cabot Microelectronics Corp. | 2,540 | 366,573 | ||||||
CEVA, Inc.(1) | 1,882 | 50,739 | ||||||
Cirrus Logic, Inc.(1) | 5,088 | 419,302 | ||||||
Cohu, Inc. | 3,255 | 74,377 | ||||||
Diodes, Inc.(1) | 3,611 | 203,552 | ||||||
DSP Group, Inc.(1) | 1,922 | 30,252 | ||||||
Enphase Energy, Inc.(1)(2) | 7,816 | 204,232 | ||||||
FormFactor, Inc.(1) | 6,498 | 168,753 | ||||||
GSI Technology, Inc.(1) | 1,348 | 9,557 | ||||||
Ichor Holdings, Ltd.(1) | 1,836 | 61,084 | ||||||
Impinj, Inc.(1) | 1,253 | 32,403 | ||||||
Inphi Corp.(1) | 3,917 | 289,936 | ||||||
Lattice Semiconductor Corp.(1) | 10,616 | 203,190 | ||||||
MACOM Technology Solutions Holdings, Inc.(1) | 4,015 | 106,799 | ||||||
MaxLinear, Inc., Class A(1) | 5,692 | 120,784 | ||||||
NeoPhotonics Corp.(1) | 2,662 | 23,479 | ||||||
NVE Corp. | 408 | 29,131 | ||||||
Onto Innovation, Inc.(1) | 4,090 | 149,449 | ||||||
PDF Solutions, Inc.(1) | 2,083 | 35,182 | ||||||
Photronics, Inc.(1) | 5,437 | 85,687 | ||||||
Power Integrations, Inc. | 2,488 | 246,088 | ||||||
Rambus, Inc.(1) | 9,662 | 133,094 | ||||||
Semtech Corp.(1) | 5,791 | 306,344 | ||||||
Silicon Laboratories, Inc.(1) | 3,674 | 426,111 | ||||||
SMART Global Holdings, Inc.(1) | 1,094 | 41,506 | ||||||
SunPower Corp.(1)(2) | 5,246 | 40,919 | ||||||
| 27 | See Notes to Financial Statements. |
Table of Contents
Calvert
VP Russell 2000® Small Cap Index Portfolio
December 31, 2019
Schedule of Investments — continued
| Security | Shares | Value | ||||||
| Semiconductors & Semiconductor Equipment (continued) | ||||||||
Synaptics, Inc.(1) | 2,889 | $ | 190,010 | |||||
Ultra Clean Holdings, Inc.(1) | 3,194 | 74,963 | ||||||
Veeco Instruments, Inc.(1) | 4,143 | 60,840 | ||||||
Xperi Corp. | 4,254 | 78,699 | ||||||
| $ | 5,156,354 | |||||||
| Software — 4.2% | ||||||||
8x8, Inc.(1)(2) | 8,167 | $ | 149,456 | |||||
A10 Networks, Inc.(1) | 4,968 | 34,130 | ||||||
ACI Worldwide, Inc.(1) | 10,049 | 380,706 | ||||||
Agilysys, Inc.(1) | 1,720 | 43,705 | ||||||
Alarm.com Holdings, Inc.(1) | 3,139 | 134,883 | ||||||
Altair Engineering, Inc., Class A(1)(2) | 3,319 | 119,185 | ||||||
American Software, Inc., Class A | 2,315 | 34,447 | ||||||
Appfolio, Inc., Class A(1) | 1,373 | 150,961 | ||||||
Appian Corp.(1)(2) | 2,928 | 111,879 | ||||||
Avaya Holdings Corp.(1) | 9,298 | 125,523 | ||||||
Benefitfocus, Inc.(1)(2) | 2,338 | 51,296 | ||||||
Blackbaud, Inc. | 4,270 | 339,892 | ||||||
Blackline, Inc.(1) | 3,651 | 188,246 | ||||||
Bottomline Technologies (de), Inc.(1) | 3,647 | 195,479 | ||||||
Box, Inc., Class A(1) | 12,234 | 205,286 | ||||||
ChannelAdvisor Corp.(1) | 1,855 | 16,769 | ||||||
Cision, Ltd.(1) | 7,857 | 78,334 | ||||||
Cloudera, Inc.(1)(2) | 20,163 | 234,496 | ||||||
Commvault Systems, Inc.(1) | 3,548 | 158,383 | ||||||
Cornerstone OnDemand, Inc.(1) | 4,968 | 290,876 | ||||||
Digimarc Corp.(1)(2) | 926 | 31,077 | ||||||
Digital Turbine, Inc.(1) | 6,827 | 48,676 | ||||||
Domo, Inc., Class B(1) | 1,382 | 30,017 | ||||||
Ebix, Inc. | 2,069 | 69,125 | ||||||
eGain Corp.(1) | 1,491 | 11,809 | ||||||
Envestnet, Inc.(1) | 4,198 | 292,307 | ||||||
Everbridge, Inc.(1)(2) | 2,912 | 227,369 | ||||||
Five9, Inc.(1) | 5,220 | 342,328 | ||||||
ForeScout Technologies, Inc.(1) | 3,483 | 114,242 | ||||||
GTY Gov.tech, Inc.(1)(2) | 2,663 | 15,685 | ||||||
Ideanomics, Inc.(1)(2) | 4,513 | 3,862 | ||||||
Instructure, Inc.(1) | 2,863 | 138,025 | ||||||
Intelligent Systems Corp.(1) | 601 | 24,004 | ||||||
j2 Global, Inc. | 4,067 | 381,119 | ||||||
LivePerson, Inc.(1)(2) | 5,342 | 197,654 | ||||||
Majesco(1) | 457 | 3,770 | ||||||
MicroStrategy, Inc., Class A(1) | 712 | 101,553 | ||||||
Mitek Systems, Inc.(1) | 3,089 | 23,631 | ||||||
MobileIron, Inc.(1) | 8,191 | 39,808 | ||||||
| Security | Shares | Value | ||||||
| Software (continued) | ||||||||
Model N, Inc.(1) | 2,795 | $ | 98,021 | |||||
OneSpan, Inc.(1) | 2,735 | 46,823 | ||||||
Phunware, Inc.(1)(2) | 382 | 455 | ||||||
Ping Identity Holding Corp.(1) | 1,184 | 28,771 | ||||||
Progress Software Corp. | 3,776 | 156,893 | ||||||
PROS Holdings, Inc.(1) | 2,801 | 167,836 | ||||||
Q2 Holdings, Inc.(1)(2) | 3,770 | 305,672 | ||||||
QAD, Inc., Class A | 961 | 48,944 | ||||||
Qualys, Inc.(1) | 2,888 | 240,773 | ||||||
Rapid7, Inc.(1) | 4,283 | 239,934 | ||||||
Rimini Street, Inc.(1) | 770 | 2,988 | ||||||
Rosetta Stone, Inc.(1) | 1,504 | 27,283 | ||||||
SailPoint Technologies Holding, Inc.(1) | 7,335 | 173,106 | ||||||
SecureWorks Corp., Class A(1)(2) | 472 | 7,864 | ||||||
SharpSpring, Inc.(1)(2) | 756 | 8,671 | ||||||
ShotSpotter, Inc.(1)(2) | 604 | 15,402 | ||||||
SPS Commerce, Inc.(1) | 3,056 | 169,363 | ||||||
SVMK, Inc.(1) | 7,344 | 131,237 | ||||||
Synchronoss Technologies, Inc.(1)(2) | 3,376 | 16,036 | ||||||
Telaria, Inc.(1) | 3,708 | 32,667 | ||||||
Telenav, Inc.(1) | 2,354 | 11,440 | ||||||
Tenable Holdings, Inc.(1) | 3,168 | 75,905 | ||||||
TiVo Corp. | 10,113 | 85,758 | ||||||
Upland Software, Inc.(1)(2) | 1,927 | 68,813 | ||||||
Varonis Systems, Inc.(1)(2) | 2,522 | 195,985 | ||||||
Verint Systems, Inc.(1) | 5,749 | 318,265 | ||||||
VirnetX Holding Corp.(1)(2) | 5,078 | 19,296 | ||||||
Workiva, Inc.(1) | 3,228 | 135,737 | ||||||
Yext, Inc.(1)(2) | 7,921 | 114,221 | ||||||
Zix Corp.(1) | 5,001 | 33,907 | ||||||
Zuora, Inc., Class A(1) | 7,520 | 107,762 | ||||||
| $ | 8,225,821 | |||||||
| Specialty Retail — 2.3% | ||||||||
Aaron’s, Inc. | 5,909 | $ | 337,463 | |||||
Abercrombie & Fitch Co., Class A(2) | 5,673 | 98,086 | ||||||
America’sCar-Mart, Inc.(1) | 548 | 60,094 | ||||||
American Eagle Outfitters, Inc. | 14,181 | 208,461 | ||||||
Asbury Automotive Group, Inc.(1) | 1,683 | 188,143 | ||||||
Ascena Retail Group, Inc.(1)(2) | 747 | 5,726 | ||||||
At Home Group, Inc.(1) | 3,637 | 20,003 | ||||||
Barnes & Noble Education, Inc.(1) | 3,122 | 13,331 | ||||||
Bed Bath & Beyond, Inc. | 10,664 | 184,487 | ||||||
Boot Barn Holdings, Inc.(1) | 2,323 | 103,443 | ||||||
Buckle, Inc. (The)(2) | 2,523 | 68,222 | ||||||
Caleres, Inc. | 3,593 | 85,334 | ||||||
| 28 | See Notes to Financial Statements. |
Table of Contents
Calvert
VP Russell 2000® Small Cap Index Portfolio
December 31, 2019
Schedule of Investments — continued
| Security | Shares | Value | ||||||
| Specialty Retail (continued) | ||||||||
Camping World Holdings, Inc., Class A | 2,590 | $ | 38,177 | |||||
Cato Corp. (The), Class A | 2,030 | 35,322 | ||||||
Chico’s FAS, Inc. | 11,271 | 42,943 | ||||||
Children’s Place, Inc. (The)(2) | 1,345 | 84,089 | ||||||
Citi Trends, Inc. | 1,298 | 30,010 | ||||||
Conn’s, Inc.(1)(2) | 1,614 | 19,997 | ||||||
Container Store Group, Inc. (The)(1) | 1,542 | 6,507 | ||||||
Designer Brands, Inc., Class A(2) | 5,812 | 91,481 | ||||||
Express, Inc.(1) | 6,091 | 29,663 | ||||||
GameStop Corp., Class A(2) | 8,361 | 50,835 | ||||||
Genesco, Inc.(1) | 1,328 | 63,638 | ||||||
GNC Holdings, Inc., Class A(1)(2) | 5,928 | 16,006 | ||||||
Group 1 Automotive, Inc. | 1,529 | 152,900 | ||||||
Guess?, Inc.(2) | 4,178 | 93,504 | ||||||
Haverty Furniture Cos., Inc. | 1,689 | 34,050 | ||||||
Hibbett Sports, Inc.(1) | 1,464 | 41,051 | ||||||
Hudson, Ltd., Class A(1) | 3,363 | 51,588 | ||||||
J. Jill, Inc.(2) | 1,035 | 1,170 | ||||||
Lithia Motors, Inc., Class A | 1,930 | 283,710 | ||||||
Lumber Liquidators Holdings, Inc.(1)(2) | 2,470 | 24,132 | ||||||
MarineMax, Inc.(1) | 2,047 | 34,164 | ||||||
Michaels Cos., Inc. (The)(1)(2) | 7,538 | 60,982 | ||||||
Monro, Inc.(2) | 2,869 | 224,356 | ||||||
Murphy USA, Inc.(1) | 2,506 | 293,202 | ||||||
National Vision Holdings, Inc.(1) | 6,874 | 222,924 | ||||||
Office Depot, Inc. | 45,195 | 123,834 | ||||||
Party City Holdco, Inc.(1)(2) | 4,747 | 11,108 | ||||||
Rent-A-Center, Inc. | 4,149 | 119,657 | ||||||
RH(1)(2) | 1,439 | 307,226 | ||||||
RTW RetailWinds, Inc.(1) | 2,329 | 1,866 | ||||||
Sally Beauty Holdings, Inc.(1)(2) | 10,541 | 192,373 | ||||||
Shoe Carnival, Inc.(2) | 872 | 32,508 | ||||||
Signet Jewelers, Ltd.(2) | 4,300 | 93,482 | ||||||
Sleep Number Corp.(1) | 2,487 | 122,460 | ||||||
Sonic Automotive, Inc., Class A | 2,180 | 67,580 | ||||||
Sportsman’s Warehouse Holdings, Inc.(1) | 3,542 | 28,442 | ||||||
Tailored Brands, Inc.(2) | 4,129 | 17,094 | ||||||
Tilly’s, Inc., Class A | 1,890 | 23,152 | ||||||
Winmark Corp. | 223 | 44,221 | ||||||
Zumiez, Inc.(1) | 1,698 | 58,649 | ||||||
| $ | 4,642,846 | |||||||
| Technology Hardware, Storage & Peripherals — 0.1% | ||||||||
3D Systems Corp.(1) | 10,106 | $ | 88,427 | |||||
AstroNova, Inc. | 603 | 8,273 | ||||||
Avid Technology, Inc.(1) | 2,494 | 21,399 | ||||||
| Security | Shares | Value | ||||||
| Technology Hardware, Storage & Peripherals (continued) | ||||||||
Diebold Nixdorf, Inc.(1)(2) | 6,637 | $ | 70,087 | |||||
Immersion Corp.(1) | 2,323 | 17,260 | ||||||
Sonim Technologies, Inc.(1)(2) | 318 | 1,154 | ||||||
Stratasys, Ltd.(1) | 4,388 | 88,747 | ||||||
| $ | 295,347 | |||||||
| Textiles, Apparel & Luxury Goods — 0.9% | ||||||||
Centric Brands, Inc.(1) | 1,456 | $ | 3,160 | |||||
Crocs, Inc.(1) | 5,932 | 248,491 | ||||||
Culp, Inc. | 785 | 10,692 | ||||||
Deckers Outdoor Corp.(1) | 2,415 | 407,797 | ||||||
Delta Apparel, Inc.(1) | 545 | 16,950 | ||||||
Fossil Group, Inc.(1)(2) | 3,623 | 28,549 | ||||||
G-III Apparel Group, Ltd.(1) | 3,957 | 132,560 | ||||||
Kontoor Brands, Inc.(2) | 3,887 | 163,215 | ||||||
Movado Group, Inc. | 1,238 | 26,914 | ||||||
Oxford Industries, Inc.(2) | 1,446 | 109,057 | ||||||
Rocky Brands, Inc. | 588 | 17,305 | ||||||
Steven Madden, Ltd. | 7,336 | 315,521 | ||||||
Superior Group of Cos., Inc. | 573 | 7,758 | ||||||
Unifi, Inc.(1) | 1,199 | 30,287 | ||||||
Vera Bradley, Inc.(1) | 1,814 | 21,405 | ||||||
Vince Holding Corp.(1)(2) | 272 | 4,708 | ||||||
Wolverine World Wide, Inc. | 6,844 | 230,917 | ||||||
| $ | 1,775,286 | |||||||
| Thrifts & Mortgage Finance — 1.9% | ||||||||
Axos Financial, Inc.(1) | 5,080 | $ | 153,822 | |||||
Bridgewater Bancshares, Inc.(1) | 1,907 | 26,279 | ||||||
Capitol Federal Financial, Inc. | 11,605 | 159,337 | ||||||
Columbia Financial, Inc.(1) | 4,649 | 78,754 | ||||||
Entegra Financial Corp.(1) | 555 | 16,739 | ||||||
ESSA Bancorp, Inc. | 636 | 10,780 | ||||||
Essent Group, Ltd. | 8,396 | 436,508 | ||||||
Federal Agricultural Mortgage Corp., Class C | 788 | 65,798 | ||||||
First Defiance Financial Corp. | 1,598 | 50,321 | ||||||
Flagstar Bancorp, Inc. | 2,981 | 114,023 | ||||||
FS Bancorp, Inc. | 267 | 17,032 | ||||||
Greene County Bancorp, Inc. | 235 | 6,766 | ||||||
Hingham Institution for Savings | 102 | 21,440 | ||||||
Home Bancorp, Inc. | 638 | 25,003 | ||||||
HomeStreet, Inc.(1) | 2,092 | 71,128 | ||||||
Kearny Financial Corp. | 7,280 | 100,682 | ||||||
Luther Burbank Corp. | 1,189 | 13,709 | ||||||
Merchants Bancorp | 731 | 14,408 | ||||||
| 29 | See Notes to Financial Statements. |
Table of Contents
Calvert
VP Russell 2000® Small Cap Index Portfolio
December 31, 2019
Schedule of Investments — continued
| Security | Shares | Value | ||||||
| Thrifts & Mortgage Finance (continued) | ||||||||
Meridian Bancorp, Inc. | 4,190 | $ | 84,177 | |||||
Meta Financial Group, Inc. | 3,149 | 114,970 | ||||||
MMA Capital Holdings, Inc.(1) | 433 | 13,769 | ||||||
Mr. Cooper Group, Inc.(1) | 6,138 | 76,786 | ||||||
NMI Holdings, Inc., Class A(1) | 5,689 | 188,761 | ||||||
Northfield Bancorp, Inc. | 3,620 | 61,395 | ||||||
Northwest Bancshares, Inc. | 8,819 | 146,660 | ||||||
OceanFirst Financial Corp. | 4,703 | 120,115 | ||||||
Ocwen Financial Corp.(1) | 8,291 | 11,359 | ||||||
OP Bancorp | 999 | 10,360 | ||||||
Oportun Financial Corp.(1) | 623 | 14,827 | ||||||
PCSB Financial Corp. | 1,589 | 32,177 | ||||||
PennyMac Financial Services, Inc. | 2,137 | 72,744 | ||||||
Pioneer Bancorp, Inc.(1) | 918 | 14,055 | ||||||
Ponce de Leon Federal Bank(1) | 736 | 10,819 | ||||||
Provident Bancorp, Inc.(1) | 695 | 8,653 | ||||||
Provident Financial Holdings, Inc. | 517 | 11,322 | ||||||
Provident Financial Services, Inc. | 5,275 | 130,029 | ||||||
Prudential Bancorp, Inc. | 713 | 13,212 | ||||||
Radian Group, Inc. | 17,399 | 437,759 | ||||||
Riverview Bancorp, Inc. | 1,689 | 13,867 | ||||||
Southern Missouri Bancorp, Inc. | 690 | 26,468 | ||||||
Sterling Bancorp, Inc. | 1,471 | 11,915 | ||||||
Territorial Bancorp, Inc. | 665 | 20,575 | ||||||
Timberland Bancorp, Inc. | 546 | 16,238 | ||||||
TrustCo Bank Corp. | 7,825 | 67,843 | ||||||
United Community Financial Corp. | 4,136 | 48,226 | ||||||
Walker & Dunlop, Inc. | 2,377 | 153,744 | ||||||
Washington Federal, Inc. | 6,900 | 252,885 | ||||||
Waterstone Financial, Inc. | 2,330 | 44,340 | ||||||
Western New England Bancorp, Inc. | 2,115 | 20,368 | ||||||
WSFS Financial Corp. | 4,470 | 196,635 | ||||||
| $ | 3,829,582 | |||||||
| Tobacco — 0.1% | ||||||||
22nd Century Group, Inc.(1)(2) | 9,590 | $ | 10,549 | |||||
Pyxus International, Inc.(1)(2) | 727 | 6,499 | ||||||
Turning Point Brands, Inc.(2) | 663 | 18,962 | ||||||
Universal Corp. | 2,076 | 118,457 | ||||||
Vector Group, Ltd.(2) | 9,270 | 124,125 | ||||||
| $ | 278,592 | |||||||
| Trading Companies & Distributors — 1.3% | ||||||||
Aircastle, Ltd. | 4,389 | $ | 140,492 | |||||
Applied Industrial Technologies, Inc. | 3,370 | 224,745 | ||||||
| Security | Shares | Value | ||||||
| Trading Companies & Distributors (continued) | ||||||||
Beacon Roofing Supply, Inc.(1) | 5,968 | $ | 190,857 | |||||
BlueLinx Holdings, Inc.(1)(2) | 888 | 12,654 | ||||||
BMC Stock Holdings, Inc.(1) | 5,748 | 164,910 | ||||||
CAI International, Inc.(1) | 1,481 | 42,919 | ||||||
DXP Enterprises, Inc.(1) | 1,272 | 50,638 | ||||||
EVI Industries, Inc.(2) | 308 | 8,328 | ||||||
Foundation Building Materials, Inc.(1) | 1,746 | 33,785 | ||||||
GATX Corp. | 3,011 | 249,461 | ||||||
General Finance Corp.(1) | 827 | 9,155 | ||||||
GMS, Inc.(1) | 3,426 | 92,776 | ||||||
H&E Equipment Services, Inc. | 2,694 | 90,061 | ||||||
Herc Holdings, Inc.(1) | 2,118 | 103,655 | ||||||
Kaman Corp. | 2,432 | 160,318 | ||||||
Lawson Products, Inc.(1) | 447 | 23,289 | ||||||
MRC Global, Inc.(1) | 6,928 | 94,498 | ||||||
NOW, Inc.(1) | 9,243 | 103,891 | ||||||
Rush Enterprises, Inc., Class A | 2,335 | 108,578 | ||||||
Rush Enterprises, Inc., Class B | 513 | 23,444 | ||||||
SiteOne Landscape Supply, Inc.(1)(2) | 3,591 | 325,524 | ||||||
Systemax, Inc. | 1,000 | 25,160 | ||||||
Textainer Group Holdings, Ltd.(1) | 4,237 | 45,378 | ||||||
Titan Machinery, Inc.(1) | 1,521 | 22,480 | ||||||
Transcat, Inc.(1) | 601 | 19,148 | ||||||
Triton International, Ltd. | 4,847 | 194,850 | ||||||
Veritiv Corp.(1) | 1,008 | 19,827 | ||||||
Willis Lease Finance Corp.(1) | 332 | 19,558 | ||||||
| $ | 2,600,379 | |||||||
| Water Utilities — 0.5% | ||||||||
American States Water Co. | 3,205 | $ | 277,681 | |||||
AquaVenture Holdings, Ltd.(1) | 1,166 | 31,622 | ||||||
Artesian Resources Corp., Class A | 703 | 26,159 | ||||||
Cadiz, Inc.(1) | 1,074 | 11,836 | ||||||
California Water Service Group | 4,213 | 217,222 | ||||||
Consolidated Water Co., Ltd. | 1,137 | 18,533 | ||||||
Global Water Resources, Inc. | 641 | 8,429 | ||||||
Middlesex Water Co. | 1,398 | 88,871 | ||||||
Pure Cycle Corp.(1) | 1,502 | 18,910 | ||||||
SJW Group | 2,244 | 159,459 | ||||||
York Water Co. (The) | 992 | 45,741 | ||||||
| $ | 904,463 | |||||||
| Wireless Telecommunication Services — 0.1% | ||||||||
Boingo Wireless, Inc.(1) | 3,250 | $ | 35,588 | |||||
Gogo, Inc.(1)(2) | 5,004 | 32,026 | ||||||
| 30 | See Notes to Financial Statements. |
Table of Contents
Calvert
VP Russell 2000® Small Cap Index Portfolio
December 31, 2019
Schedule of Investments — continued
| Security | Shares | Value | ||||||
| Wireless Telecommunication Services (continued) | ||||||||
Shenandoah Telecommunications Co. | 4,181 | $ | 173,971 | |||||
Spok Holdings, Inc. | 1,597 | 19,531 | ||||||
| $ | 261,116 | |||||||
Total Common Stocks |
| $ | 180,918,886 | |||||
| Exchange-Traded Funds — 2.1% |
| |||||||
| Security | Shares | Value | ||||||
iShares Russell 2000 ETF | 25,000 | $ | 4,141,750 | |||||
Total Exchange-Traded Funds |
| $ | 4,141,750 | |||||
| Rights — 0.0%(4) |
| |||||||
| Security | Shares | Value | ||||||
| Biotechnology — 0.0%(4) | ||||||||
GTx, Inc. CVR(1)(3)(5) | 57 | $ | — | |||||
Tobira Therapeutics, Inc. CVR(1)(3)(5) | 690 | 9,481 | ||||||
| $ | 9,481 | |||||||
| Chemicals — 0.0%(4) | ||||||||
A Schulman, Inc. CVR(1)(3)(5) | 2,260 | $ | 978 | |||||
| Health Care Equipment & Supplies — 0.0%(4) | ||||||||
Elanco Animal Health, Inc. CVR(1)(3)(5) | 3,555 | $ | 379 | |||||
| Pharmaceuticals — 0.0%(4) | ||||||||
Omthera Pharmaceutical, Inc. CVR(1)(3)(5) | 508 | $ | 305 | |||||
Total Rights | $ | 11,143 | ||||||
| Short-Term Investments — 3.2% |
| |||||||
| Securities Lending Collateral — 2.7% |
| |||||||
| Security | Shares | Value | ||||||
State Street Navigator Securities Lending Government Money Market Portfolio, 1.56%(6) | 5,366,477 | $ | 5,366,477 | |||||
Total Securities Lending Collateral |
| $ | 5,366,477 | |||||
| U.S. Treasury Obligations — 0.5% |
| |||||||
| Security | Principal Amount (000’s omitted) | Value | ||||||
U.S. Treasury Bill, 0.00%, 2/27/20(7) | $ | 1,000 | $ | 997,659 | ||||
Total U.S. Treasury Obligations |
| $ | 997,659 | |||||
Total Short-Term Investments |
| $ | 6,364,136 | |||||
Total Investments |
| $ | 191,435,915 | |||||
Other Assets, Less Liabilities — 3.1% |
| $ | 6,132,037 | |||||
Net Assets — 100.0% |
| $ | 197,567,952 | |||||
The percentage shown for each investment category in the Schedule of Investments is based on net assets.
Notes to Schedule of Investments
| (1) | Non-income producing security. |
| (2) | All or a portion of this security was on loan at December 31, 2019. The aggregate market value of securities on loan at December 31, 2019 was $24,110,628. |
| (3) | For fair value measurement disclosure purposes, security is categorized as Level 3 (see Note 1A). |
| (4) | Amount is less than 0.05%. |
| (5) | Restricted security. Total market value of restricted securities amounts to $11,143, which represents less than 0.05% of the net assets of the Fund as of December 31, 2019. |
| (6) | Represents investment of cash collateral received in connection with securities lending. |
| (7) | Security (or a portion thereof) has been pledged to cover margin requirements on open futures contracts. |
Abbreviations:
| CVR | – | Contingent Value Rights | ||
| 31 | See Notes to Financial Statements. |
Table of Contents
Calvert
VP Russell 2000® Small Cap Index Portfolio
December 31, 2019
Schedule of Investments — continued
| Futures Contracts | ||||||||||||||||||||
| Description | Number of Contracts | Position | Expiration Date | Notional Amount | Value/ Unrealized | |||||||||||||||
| Equity Futures | ||||||||||||||||||||
E-mini Russell 2000 Index | 149 | Long | 3/20/20 | $ | 12,445,970 | $ | 116,568 | |||||||||||||
| Restricted Securities | ||||||||
| Description | Acquisition Dates | Cost | ||||||
A Schulman, Inc. CVR | 8/22/18 | $ | 979 | |||||
GTx, Inc. CVR | 6/10/19 | 117 | ||||||
Elanco Animal Health, Inc. CVR | 7/19/19 | 89 | ||||||
Omthera Pharmaceutical, Inc. CVR | 7/19/13 | — | ||||||
Tobira Therapeutics, Inc. CVR | 11/2/16 | 41 | ||||||
| 32 | See Notes to Financial Statements. |
Table of Contents
Calvert
VP Russell 2000® Small Cap Index Portfolio
December 31, 2019
Statement of Assets and Liabilities
| Assets | December 31, 2019 | |||
Investments in securities of unaffiliated issuers, at value (identified cost $147,351,200) - including | $ | 191,435,915 | ||
Receivable for variation margin on open futures contracts | 16,391 | |||
Cash | 11,399,872 | |||
Receivable for investments sold | 66,483 | |||
Receivable for capital shares sold | 88,649 | |||
Dividends receivable | 217,141 | |||
Securities lending income receivable | 20,656 | |||
Receivable from affiliate | 37,854 | |||
Directors’ deferred compensation plan | 36,861 | |||
Other assets | 9,860 | |||
Total assets | $ | 203,329,682 | ||
| Liabilities | ||||
Payable for investments purchased | $ | 10,220 | ||
Payable for capital shares redeemed | 78,974 | |||
Deposits for securities loaned | 5,366,477 | |||
Payable to affiliates: | ||||
Investment advisory fee | 41,375 | |||
Administrative fee | 19,860 | |||
Distribution and service fees | 7,166 | |||
Sub-transfer agency fee | 115 | |||
Directors’ deferred compensation plan | 36,861 | |||
Accrued expenses | 200,682 | |||
Total liabilities | $ | 5,761,730 | ||
Net Assets | $ | 197,567,952 | ||
| Sources of Net Assets | ||||
Paid-in capital | $ | 140,781,884 | ||
Distributable earnings | 56,786,068 | |||
Total | $ | 197,567,952 | ||
| Class I | ||||
Net Assets | $ | 154,334,689 | ||
Shares Outstanding | 1,909,791 | |||
Net Asset Value, Offering Price and Redemption Price Per Share | ||||
(net assets ÷ shares of beneficial interest outstanding) | $ | 80.81 | ||
| Class F | ||||
Net Assets | $ | 43,233,263 | ||
Shares Outstanding | 535,917 | |||
Net Asset Value, Offering Price and Redemption Price Per Share | ||||
(net assets ÷ shares of beneficial interest outstanding) | $ | 80.67 | ||
| 33 | See Notes to Financial Statements. |
Table of Contents
Calvert
VP Russell 2000® Small Cap Index Portfolio
December 31, 2019
Statement of Operations
| Investment Income | Year Ended December 31, 2019 | |||
Dividend income (net of foreign taxes withheld of $917) | $ | 2,413,860 | ||
Interest income | 150,661 | |||
Securities lending income, net | 187,414 | |||
Total investment income | $ | 2,751,935 | ||
| Expenses | ||||
Investment advisory fee | $ | 453,473 | ||
Administrative fee | 217,667 | |||
Distribution and service fees: | ||||
Class F | 73,490 | |||
Directors’ fees and expenses | 10,787 | |||
Custodian fees | 33,580 | |||
Transfer agency fees and expenses | 74,939 | |||
Accounting fees | 42,700 | |||
Professional fees | 44,738 | |||
Reports to shareholders | 85,797 | |||
Licensing fees | 91,600 | |||
Miscellaneous | 6,757 | |||
Total expenses | $ | 1,135,528 | ||
Waiver and/or reimbursement of expenses by affiliate | $ | (350,596 | ) | |
Reimbursement of expenses - other | (4,132 | ) | ||
Net expenses | $ | 780,800 | ||
Net investment income | $ | 1,971,135 | ||
| Realized and Unrealized Gain (Loss) | ||||
Net realized gain (loss): | ||||
Investment securities | $ | 8,079,439 | ||
Futures contracts | 1,914,705 | |||
Foreign currency transactions | (5 | ) | ||
Net realized gain | $ | 9,994,139 | ||
Change in unrealized appreciation (depreciation): | ||||
Investment securities | $ | 27,315,006 | ||
Futures contracts | 306,753 | |||
Net change in unrealized appreciation (depreciation) | $ | 27,621,759 | ||
Net realized and unrealized gain | $ | 37,615,898 | ||
Net increase in net assets resulting from operations | $ | 39,587,033 | ||
| 34 | See Notes to Financial Statements. |
Table of Contents
Calvert
VP Russell 2000® Small Cap Index Portfolio
December 31, 2019
Statements of Changes in Net Assets
| Year Ended December 31, | ||||||||
| Increase (Decrease) in Net Assets | 2019 | 2018 | ||||||
From operations: | ||||||||
Net investment income | $ | 1,971,135 | $ | 2,059,428 | ||||
Net realized gain | 9,994,139 | 14,044,120 | ||||||
Net change in unrealized appreciation (depreciation) | 27,621,759 | (35,617,028 | ) | |||||
Net increase (decrease) in net assets from operations | $ | 39,587,033 | $ | (19,513,480 | ) | |||
Distributions to shareholders: | ||||||||
Class I | $ | (12,492,232 | ) | $ | (9,045,101 | ) | ||
Class F | (3,317,360 | ) | (2,190,621 | ) | ||||
Total distributions to shareholders | $ | (15,809,592 | ) | $ | (11,235,722 | ) | ||
Capital share transactions: | ||||||||
Class I | $ | 7,653,177 | $ | (6,653,351 | ) | |||
Class F | 8,164,991 | 4,181,421 | ||||||
Net increase (decrease) in net assets from capital share transactions | $ | 15,818,168 | $ | (2,471,930 | ) | |||
Net increase (decrease) in net assets | $ | 39,595,609 | $ | (33,221,132 | ) | |||
| Net Assets | ||||||||
At beginning of year | $ | 157,972,343 | $ | 191,193,475 | ||||
At end of year | $ | 197,567,952 | $ | 157,972,343 | ||||
| 35 | See Notes to Financial Statements. |
Table of Contents
Calvert
VP Russell 2000® Small Cap Index Portfolio
December 31, 2019
Financial Highlights
| Class I | ||||||||||||||||||||
| Year Ended December 31, | ||||||||||||||||||||
| 2019 | 2018 | 2017 | 2016 | 2015 | ||||||||||||||||
Net asset value — Beginning of year | $ | 71.03 | $ | 84.82 | $ | 77.43 | $ | 69.72 | $ | 75.83 | ||||||||||
| Income (Loss) From Operations | ||||||||||||||||||||
Net investment income(1) | $ | 0.90 | $ | 0.98 | $ | 0.93 | $ | 0.90 | $ | 0.55 | ||||||||||
Net realized and unrealized gain (loss) | 15.99 | (9.44 | ) | 10.12 | 13.70 | (4.44 | ) | |||||||||||||
Total income (loss) from operations | $ | 16.89 | $ | (8.46 | ) | $ | 11.05 | $ | 14.60 | $ | (3.89 | ) | ||||||||
| Less Distributions | ||||||||||||||||||||
From net investment income | $ | (0.77 | ) | $ | (0.96 | ) | $ | (0.64 | ) | $ | (0.41 | ) | $ | (0.12 | ) | |||||
From net realized gain | (6.34 | ) | (4.37 | ) | (3.02 | ) | (6.48 | ) | (2.10 | ) | ||||||||||
Total distributions | $ | (7.11 | ) | $ | (5.33 | ) | $ | (3.66 | ) | $ | (6.89 | ) | $ | (2.22 | ) | |||||
Net asset value — End of year | $ | 80.81 | $ | 71.03 | $ | 84.82 | $ | 77.43 | $ | 69.72 | ||||||||||
Total Return(2) | 25.08 | % | (11.23 | )% | 14.37 | % | 20.92 | % | (5.19 | )% | ||||||||||
| Ratios/Supplemental Data | ||||||||||||||||||||
Net assets, end of year (000’s omitted) | $ | 154,335 | $ | 127,473 | $ | 158,646 | $ | 149,739 | $ | 119,674 | ||||||||||
Ratios (as a percentage of average daily net assets):(3) | ||||||||||||||||||||
Total expenses | 0.58 | % | 0.59 | % | 0.65 | % | 0.75 | % | 0.79 | % | ||||||||||
Net expenses | 0.39 | % | 0.38 | % | 0.38 | % | 0.53 | % | 0.74 | % | ||||||||||
Net investment income | 1.13 | % | 1.13 | % | 1.15 | % | 1.25 | % | 0.72 | % | ||||||||||
Portfolio Turnover | 15 | % | 15 | % | 15 | % | 17 | %(4) | 14 | % | ||||||||||
| (1) | Computed using average shares outstanding. |
| (2) | Returns are historical and are calculated by determining the percentage change in net asset value with all distributions reinvested and do not reflect fees and expenses imposed by variable annuity contracts or variable life insurance policies. If included, total return would be lower. |
| (3) | Total expenses do not reflect amounts reimbursed and/or waived by the adviser and certain of its affiliates, if applicable. Net expenses are net of all reductions and represent the net expenses paid by the Fund. |
| (4) | During the year ended December 31, 2016, the Fund incurred sales of $9,332,219 to realign the combined portfolio in connection with the reorganization of Calvert VP Natural Resources Portfolio into the Fund on September 23, 2016. These sales were excluded from the portfolio turnover calculation. |
| 36 | See Notes to Financial Statements. |
Table of Contents
Calvert
VP Russell 2000® Small Cap Index Portfolio
December 31, 2019
Financial Highlights — continued
| Class F | ||||||||||||||||||||
| Year Ended December 31, | ||||||||||||||||||||
| 2019 | 2018 | 2017 | 2016 | 2015 | ||||||||||||||||
Net asset value — Beginning of year | $ | 71.07 | $ | 85.07 | $ | 77.84 | $ | 70.13 | $ | 76.31 | ||||||||||
| Income (Loss) From Operations | ||||||||||||||||||||
Net investment income(1) | $ | 0.73 | $ | 0.77 | $ | 0.74 | $ | 0.73 | $ | 0.40 | ||||||||||
Net realized and unrealized gain (loss) | 15.98 | (9.44 | ) | 10.15 | 13.76 | (4.48 | ) | |||||||||||||
Total income (loss) from operations | $ | 16.71 | $ | (8.67 | ) | $ | 10.89 | $ | 14.49 | $ | (4.08 | ) | ||||||||
| Less Distributions | ||||||||||||||||||||
From net investment income | $ | (0.77 | ) | $ | (0.96 | ) | $ | (0.64 | ) | $ | (0.30 | ) | $ | 0.00 | ||||||
From net realized gain | (6.34 | ) | (4.37 | ) | (3.02 | ) | (6.48 | ) | (2.10 | ) | ||||||||||
Total distributions | $ | (7.11 | ) | $ | (5.33 | ) | $ | (3.66 | ) | $ | (6.78 | ) | $ | (2.10 | ) | |||||
Net asset value — End of year | $ | 80.67 | $ | 71.07 | $ | 85.07 | $ | 77.84 | $ | 70.13 | ||||||||||
Total Return(2) | 24.82 | % | (11.46 | )% | 14.08 | % | 20.63 | % | (5.40 | )% | ||||||||||
| Ratios/Supplemental Data | ||||||||||||||||||||
Net assets, end of year (000’s omitted) | $ | 43,233 | $ | 30,499 | $ | 32,547 | $ | 24,959 | $ | 17,439 | ||||||||||
Ratios (as a percentage of average daily net assets):(3) | ||||||||||||||||||||
Total expenses | 0.78 | % | 0.79 | % | 0.86 | % | 0.96 | % | 1.01 | % | ||||||||||
Net expenses | 0.60 | % | 0.63 | % | 0.63 | % | 0.78 | % | 0.95 | % | ||||||||||
Net investment income | 0.92 | % | 0.89 | % | 0.91 | % | 1.00 | % | 0.52 | % | ||||||||||
Portfolio Turnover | 15 | % | 15 | % | 15 | % | 17 | %(4) | 14 | % | ||||||||||
| (1) | Computed using average shares outstanding. |
| (2) | Returns are historical and are calculated by determining the percentage change in net asset value with all distributions reinvested and do not reflect fees and expenses imposed by variable annuity contracts or variable life insurance policies. If included, total return would be lower. |
| (3) | Total expenses do not reflect amounts reimbursed and/or waived by the adviser and certain of its affiliates, if applicable. Net expenses are net of all reductions and represent the net expenses paid by the Fund. |
| (4) | During the year ended December 31, 2016, the Fund incurred sales of $9,332,219 to realign the combined portfolio in connection with the reorganization of Calvert VP Natural Resources Portfolio into the Fund on September 23, 2016. These sales were excluded from the portfolio turnover calculation. |
| 37 | See Notes to Financial Statements. |
Table of Contents
Calvert
VP Russell 2000® Small Cap Index Portfolio
December 31, 2019
Notes to Financial Statements
1 Significant Accounting Policies
Calvert VP Russell 2000® Small Cap Index Portfolio (the Fund) is a diversified series of Calvert Variable Products, Inc. (the Corporation). The Corporation is a Maryland corporation registered under the Investment Company Act of 1940, as amended (the 1940 Act), as anopen-end management investment company. The investment objective of the Fund is to seek investment results that correspond to the investment performance of U.S. common stocks, as represented by the Russell 2000®Index.
Shares of the Fund are sold without sales charge to insurance companies for allocation to certain of their variable separate accounts. The Fund offers Class I and Class F shares. Among other things, each class has different: (a) dividend rates due to differences in Distribution Plan expenses and other class-specific expenses; (b) exchange privileges; and (c) class-specific voting rights.
The Fund applies the accounting and reporting guidance in the Financial Accounting Standards Board (FASB) Accounting Standards Codification Topic 946,Financial Services – Investment Companies (ASC 946). Subsequent events, if any, through the date that the financial statements were issued have been evaluated in the preparation of the financial statements.
A Investment Valuation — Net asset value per share is determined every business day as of the close of the regular session of the New York Stock Exchange (generally 4:00 p.m. Eastern time). The Fund uses independent pricing services approved by the Board of Directors (the Board) to value its investments wherever possible. Investments for which market quotations are not available or deemed not reliable are fair valued in good faith under the direction of the Board.
U.S. generally accepted accounting principles (U.S. GAAP) establishes a disclosure hierarchy that categorizes the inputs to valuation techniques used to value assets and liabilities at measurement date. These inputs are summarized in the three broad levels listed below:
Level 1 - quoted prices in active markets for identical securities
Level 2 - other significant observable inputs (including quoted prices for similar securities, interest rates, prepayment speeds, credit risk, etc.)
Level 3 - significant unobservable inputs (including the Fund’s own assumptions in determining the fair value of investments)
The inputs or methodologies used for valuing securities are not necessarily an indication of the risk associated with investing in those securities.
Valuation techniques used to value the Fund’s investments by major category are as follows:
Equity Securities.Equity securities (including warrants and rights) listed on a U.S. securities exchange generally are valued at the last sale or closing price as reported by an independent pricing service on the primary market or exchange on which they are traded and are categorized as Level 1 in the hierarchy. Equity securities listed on the NASDAQ Global or Global Select Market are valued at the NASDAQ official closing price and are categorized as Level 1 in the hierarchy. Unlisted or listed securities for which closing sales prices or closing quotations are not available are valued at the mean between the latest available bid and ask prices and are categorized as Level 2 in the hierarchy.
Short-Term Debt Securities. Short-term debt securities with a remaining maturity at time of purchase of more than sixty days are valued on the basis of valuations provided by a third party pricing service. Such securities are generally categorized as Level 2 in the hierarchy. Short-term debt securities of sufficient credit quality purchased with remaining maturities of sixty days or less are valued at amortized cost, which approximates fair value, and are categorized as Level 2 in the hierarchy.
Other Securities.Exchange-traded funds are valued at the official closing price as reported by an independent pricing service on the primary market or exchange on which they are traded and are categorized as Level 1 in the hierarchy. Investments in registered investment companies (including money market funds) that do not trade on an exchange are valued at the net asset value per share on the valuation day and are categorized as Level 1 in the hierarchy.
Derivatives.Futures contracts are valued at unrealized appreciation (depreciation) based on the settlement price established each day by the board of trade or exchange on which they are traded and are categorized as Level 1 in the hierarchy.
Fair Valuation.If a market value cannot be determined for a security using the methodologies described above, or if, in the good faith opinion of the Fund’s adviser, the market value does not constitute a readily available market quotation, or if a significant event has occurred that would materially affect the value of the security, the security will be fair valued as determined in good faith by or at the direction of the Board in a manner that most fairly reflects the security’s “fair value”, which is the amount that the Fund might reasonably expect to receive for the security upon its current sale in the ordinary course. Each such determination is based on a consideration of relevant factors, which are likely to vary from one pricing context to another. These factors may include, but are not limited to, the type of security, the existence of any contractual restrictions on the security’s disposition, the price and extent of public trading in similar securities of the issuer or of comparable companies or entities, quotations or relevant information obtained from broker/dealers or other market participants, information obtained from the issuer, analysts, and/or the appropriate stock exchange (for exchange-traded securities), an analysis of the company’s or entity’s financial statements, and an evaluation of the forces that influence the issuer and the market(s) in which the security is purchased and sold.
The values assigned to fair value investments are based on available information and do not necessarily represent amounts that might ultimately be realized. Further, due to the inherent uncertainty of valuations of such investments, the fair values may differ significantly from the values that would have been used had an active market existed, and the differences could be material.
| 38 |
Table of Contents
Calvert
VP Russell 2000® Small Cap Index Portfolio
December 31, 2019
Notes to Financial Statements — continued
The following table summarizes the market value of the Fund’s holdings as of December 31, 2019, based on the inputs used to value them:
| Asset Description | Level 1 | Level 2 | Level 3(1) | Total | ||||||||||||
Common Stocks | $ | 180,918,886 | (2) | $ | — | $ | — | $ | 180,918,886 | |||||||
Exchange-Traded Funds | 4,141,750 | — | — | 4,141,750 | ||||||||||||
Rights | — | — | 11,143 | 11,143 | ||||||||||||
Short-Term Investments - | ||||||||||||||||
Securities Lending Collateral | 5,366,477 | — | — | 5,366,477 | ||||||||||||
U.S. Treasury Obligations | — | 997,659 | — | 997,659 | ||||||||||||
Total Investments | $ | 190,427,113 | $ | 997,659 | $ | 11,143 | $ | 191,435,915 | ||||||||
Futures Contracts | $ | 116,568 | $ | — | $ | — | $ | 116,568 | ||||||||
Total | $ | 190,543,681 | $ | 997,659 | $ | 11,143 | $ | 191,552,483 | ||||||||
| (1) | None of the unobservable inputs for Level 3 assets, individually or collectively, had a material impact on the Fund. |
| (2) | The level classification by major category of investments is the same as the category presentation in the Schedule of Investments. |
Level 3 investments at the beginning and/or end of the period in relation to net assets were not significant and accordingly, a reconciliation of Level 3 assets for the year ended December 31, 2019 is not presented.
B Investment Transactions and Income — Investment transactions for financial statement purposes are accounted for on trade date. Realized gains and losses are recorded on an identified cost basis and may include proceeds from litigation. Dividend income is recorded on theex-dividend date for dividends received in cash and/or securities or, in the case of dividends on certain foreign securities, as soon as the Fund is informed of theex-dividend date.Non-cash dividends are recorded at the fair value of the securities received. Withholding taxes on foreign dividends, if any, have been provided for in accordance with the Fund’s understanding of the applicable country’s tax rules and rates. Distributions received that represent a return of capital are recorded as a reduction of cost of investments. Distributions received that represent a capital gain are recorded as a realized gain. Interest income, which includes amortization of premium and accretion of discount on debt securities, is accrued as earned.
C Share Class Accounting — Realized and unrealized gains and losses and net investment income and losses, other than class-specific expenses, are allocated daily to each class of shares based upon the relative net assets of each class to the total net assets of the Fund. Expenses arising in connection with a specific class are charged directly to that class.
D Foreign Currency Transactions — The Fund’s accounting records are maintained in U.S. dollars. For valuation of assets and liabilities on each date of net asset value determination, foreign denominations are converted into U.S. dollars using the current exchange rate. Security transactions, income, and expenses are translated at the prevailing rate of exchange on the date of the event. Recognized gains or losses on investment transactions attributable to changes in foreign currency exchange rates are recorded for financial statement purposes as net realized gains and losses on investments. That portion of unrealized gains and losses on investments that results from fluctuations in foreign currency exchange rates is not separately disclosed.
E Futures Contracts — The Fund may enter into futures contracts to buy or sell a financial instrument for a set price at a future date. Initial margin deposits of either cash or securities as required by the broker are made upon entering into the contract. While the contract is open, daily variation margin payments are made to or received from the broker reflecting the daily change in market value of the contract and are recorded for financial reporting purposes as unrealized gains or losses by the Fund. When a futures contract is closed, a realized gain or loss is recorded equal to the difference between the opening and closing value of the contract. The risks associated with entering into futures contracts may include the possible illiquidity of the secondary market which would limit the Fund’s ability to close out a futures contract prior to the settlement date, an imperfect correlation between the value of the contracts and the underlying financial instruments, or that the counterparty will fail to perform its obligations under the contracts’ terms. Futures contracts are designed by boards of trade, which are designated “contracts markets” by the Commodities Futures Trading Commission. Futures contracts trade on the contracts markets in a manner that is similar to the way a stock trades on a stock exchange, and the boards of trade, through their clearing corporations, guarantee the futures contracts against default. As a result, there is minimal counterparty credit risk to the Fund.
F Restricted Securities — The Fund may invest in securities that are subject to legal or contractual restrictions on resale. Generally, these securities may only be sold publicly upon registration under the Securities Act of 1933 or in transactions exempt from such registration. Information regarding restricted securities (excluding Rule 144A securities) is included at the end of the Schedule of Investments.
G Distributions to Shareholders — Distributions to shareholders are recorded by the Fund onex-dividend date. The Fund distributes any net investment income and net realized capital gains at least annually. Both types of distributions are made in shares of the Fund unless an election is made on behalf of a separate account to receive some or all of the distributions in cash. Distributions are declared separately for each class of shares. Distributions are determined in accordance with income tax regulations which may differ from U.S. GAAP; accordingly, periodic reclassifications are made within theFund’s capital accounts to reflect income and gains available for distribution under income tax regulations.
| 39 |
Table of Contents
Calvert
VP Russell 2000® Small Cap Index Portfolio
December 31, 2019
Notes to Financial Statements — continued
H Estimates — The preparation of financial statements in conformity with U.S. GAAP requires management to make estimates and assumptions that affect the reported amounts of assets and liabilities and disclosure of contingent assets and liabilities at the date of the financial statements and the reported amounts of increases and decreases in net assets from operations during the reporting period. Actual results could differ from those estimates.
I Indemnifications — The Corporation’sBy-Laws provide for indemnification for Directors or officers of the Corporation and certain other parties, to the fullest extent permitted by Maryland law and the 1940 Act, provided certain conditions are met. Additionally, in the normal course of business, the Fund enters into agreements with service providers that may contain indemnification clauses. The Fund’s maximum exposure under these arrangements is unknown as this would involve future claims that may be made against the Fund that have not yet occurred.
J Federal Income Taxes — No provision for federal income or excise tax is required since the Fund intends to continue to qualify as a regulated investment company under the Internal Revenue Code and to distribute substantially all of its taxable earnings.
Management has analyzed the Fund’stax positions taken for all open federal income tax years and has concluded that no provision for federal income tax is required in the Fund’s financial statements. A Fund’s federal tax return is subject to examination by the Internal Revenue Service for a period of three years from the date of filing.
2 Related Party Transactions
The investment advisory fee is earned by Calvert Research and Management (CRM), a subsidiary of Eaton Vance Management (EVM), as compensation for investment advisory services rendered to the Fund. Pursuant to the investment advisory agreement, CRM receives a fee, payable monthly, at the annual rate of 0.25% of the Fund’s average daily net assets. For the year ended December 31, 2019, the investment advisory fee amounted to $453,473.
Ameritas Investment Partners, Inc. (AIP) providessub-advisory services to the Fund pursuant to asub-advisory agreement with CRM.Sub-advisory fees are paid by CRM from its investment advisory fee.
CRM has agreed to reimburse the Fund’s operating expenses to the extent that total annual operating expenses (relating to ordinary operating expenses only and excluding expenses such as brokerage commissions, acquired fund fees and expenses of unaffiliated funds, borrowing costs, taxes or litigation expenses) exceed 0.39% and 0.59% (0.38% and 0.63% prior to May 1, 2019) of the Fund’s average daily net assets for Class I and Class F, respectively. The expense reimbursement agreement with CRM may be changed or terminated after April 30, 2020. For the year ended December 31, 2019, CRM waived or reimbursed expenses of $350,596.
The administrative fee is earned by CRM as compensation for administrative services rendered to the Fund. The fee is computed at an annual rate of 0.12% of the Fund’s average daily net assets attributable to Class I and Class F and is payable monthly. For the year ended December 31, 2019, CRM was paid administrative fees of $217,667.
The Fund has in effect a distribution plan for Class F shares (Class F Plan) pursuant to Rule12b-1 under the 1940 Act. Pursuant to the Class F Plan, the Fund pays Eaton Vance Distributors, Inc. (EVD), an affiliate of CRM and the Fund’s principal underwriter, a distribution and service fee of 0.20% per annum of its average daily net assets attributable to Class F shares for distribution services and facilities provided to the Fund, as well as for personal and/or account maintenance services provided to the class shareholders. Distribution and service fees paid or accrued for the year ended December 31, 2019 amounted to $73,490 for Class F shares.
EVM providessub-transfer agency and related services to the Fund pursuant to aSub-Transfer Agency Support Services Agreement. For the year ended December 31, 2019,sub-transfer agency fees and expenses incurred to EVM amounted to $499 and are included in transfer agency fees and expenses on the Statement of Operations.
Each Director of the Fund who is not an employee of CRM or its affiliates receives a fee of $3,000 for each Board meeting attended in person and $2,000 for each Board meeting attended by phone plus an annual fee of $142,000, and $1,500 for each Committee meeting attended in person and $1,000 for each Committee meeting attended by phone plus an annual Committee fee of $2,500. The Board chair receives an additional $20,000 annual retainer and Committee chairs receive an additional $6,000 annual retainer. Eligible Directors may participate in a Deferred Compensation Plan (the Plan). Amounts deferred under the Plan are treated as though equal dollar amounts had been invested in shares of the Fund or other Calvert funds selected by the Directors. The Fund purchases shares of the funds selected equal to the dollar amounts deferred under the Plan, resulting in an asset equal to the deferred compensation liability. Obligations of the Plan are paid solely from the Fund’s assets. Directors’ fees are allocated to each of the Calvert funds served. Salaries and fees of officers and Directors of the Fund who are employees of CRM or its affiliates are paid by CRM. In addition, an advisory council was established to aid the Board and CRM in advancing the cause of responsible investing through original scholarship and thought leadership. The advisory council consists of CRM’s Chief Executive Officer and four additional members. Each member (other than CRM’s Chief Executive Officer) receives annual compensation of $75,000, which is being reimbursed by Calvert Investment Management, Inc. (CIM), the Calvert funds’ former investment adviser and Ameritas Holding Company, CIM’s parent company, through the end of 2019. For the year ended December 31, 2019, the Fund’s allocated portion of such expense and reimbursement was $4,132, which are included in miscellaneous expense and reimbursement of expenses-other, respectively, on the Statement of Operations.
| 40 |
Table of Contents
Calvert
VP Russell 2000® Small Cap Index Portfolio
December 31, 2019
Notes to Financial Statements — continued
3 Shareholder Servicing Plan
The Corporation, on behalf of the Fund, has adopted a Shareholder Servicing Plan (Servicing Plan), which permits the Fund to enter into shareholder servicing agreements with intermediaries that maintain accounts in the Fund for the benefit of shareholders. These services may include, but are not limited to, processing purchase and redemption requests, processing dividend payments, and providing account information to shareholders. Under the Servicing Plan, the Fund may make payments at an annual rate of up to 0.11% of its average daily net assets. For the year ended December 31, 2019, expenses incurred under the Servicing Plan amounted to $72,199 and are included in transfer agency fees and expenses on the Statement of Operations.
4 Investment Activity
During theyear ended December 31, 2019, the cost of purchases and proceeds from sales of investments, other than short-term securities, were $24,913,588 and $26,527,871, respectively.
5 Distributions to Shareholders and Income Tax Information
The tax character of distributions declared for the years ended December 31, 2019 and December 31, 2018 was as follows:
| Year Ended December 31, | ||||||||
| 2019 | 2018 | |||||||
Ordinary income | $ | 2,673,624 | $ | 3,544,138 | ||||
Long-term capital gains | $ | 13,135,968 | $ | 7,691,584 | ||||
As of December 31, 2019, the components of distributable earnings (accumulated loss) on a tax basis were as follows:
Undistributed ordinary income | $ | 3,233,013 | ||
Undistributed long-term capital gains | $ | 9,227,018 | ||
Net unrealized appreciation | $ | 44,326,037 | ||
The cost and unrealized appreciation (depreciation) of investments, including open derivative contracts, of the Fund at December 31, 2019, as determined on a federal income tax basis, were as follows:
Aggregate cost | $ | 147,109,878 | ||
Gross unrealized appreciation | $ | 66,280,101 | ||
Gross unrealized depreciation | (21,954,064 | ) | ||
Net unrealized appreciation | $ | 44,326,037 | ||
6 Financial Instruments
A summary of futures contracts outstanding at December 31, 2019 is included in the Schedule of Investments. During the year ended December 31, 2019, the Fund used futures contracts to provide equity market exposure for uncommitted cash balances.
At December 31, 2019, the fair value of open derivative instruments (not considered to be hedging instruments for accounting disclosure purposes) and whose primary underlying risk exposure is equity price risk was as follows:
| Derivative | Statement of Assets and Liabilities Caption | Assets | Liabilities | |||||||||
Futures contracts | Distributable earnings | $ | 116,568 | (1) | $ | — | ||||||
| (1) | Only the current day’s variation margin is reported within the Statement of Assets and Liabilities as Receivable or Payable for variation margin on open futures contracts, as applicable. |
| 41 |
Table of Contents
Calvert
VP Russell 2000® Small Cap Index Portfolio
December 31, 2019
Notes to Financial Statements — continued
The effect of derivative instruments (not considered to be hedging instruments for accounting disclosure purposes) on the Statement of Operations and whose primary underlying risk exposure is equity price risk for the year ended December 31, 2019 was as follows:
| Statement of Operations Caption | ||||||||
| Derivative | Net realized gain (loss) | Net change in unrealized | ||||||
Futures contracts | $ | 1,914,705 | $ | 306,753 | ||||
The average notional cost of futures contracts (long) outstanding during the year ended December 31, 2019 was approximately $11,441,000.
7 Securities Lending
To generate additional income, the Fund may lend its securities pursuant to a securities lending agency agreement with State Street Bank and Trust Company (SSBT), the securities lending agent. Security loans are subject to termination by the Fund at any time and, therefore, are not considered illiquid investments. The Fund requires that the loan be continuously collateralized by either cash or securities as collateral equal at all times to at least 102% of the market value of the domestic securities loaned and 105% of the market value of the international securities loaned (if applicable). The market value of securities loaned is determined daily and any additional required collateral is delivered to the Fund on the next business day. Cash collateral is generally invested in a money market fund registered under the 1940 Act that is managed by an affiliate of SSBT. Any gain or loss in the market price of the loaned securities that might occur and any interest earned or dividends declared during the term of the loan would accrue to the account of the Fund. Income earned on the investment of collateral, net of broker rebates and other expenses incurred by the securities lending agent, is split between the Fund and the securities lending agent on the basis of agreed upon contractual terms.Non-cash collateral, if any, is held by the lending agent on behalf of the Fund and cannot be sold orre-pledged by the Fund; accordingly, such collateral is not reflected in the Statement of Assets and Liabilities.
The risks associated with lending portfolio securities include, but are not limited to, possible delays in receiving additional collateral or in the recovery of the loaned securities, possible loss of rights to the collateral should the borrower fail financially, as well as risk of loss in the value of the collateral or the value of the investments made with the collateral. The securities lending agent shall indemnify the Fund in the case of default of any securities borrower.
At December 31, 2019, the total value of securities on loan was $24,110,628 and the total value of collateral received was $24,734,589 comprised of cash of $5,366,477 and U.S. government and/or agencies securities of $19,368,112.
The following table provides a breakdown of securities lending transactions accounted for as secured borrowings, the obligations by class of collateral pledged, and the remaining contractual maturity of those transactions as of December 31, 2019.
| Remaining Contractual Maturity of the Transactions | ||||||||||||||||||||
| Overnight and Continuous | <30 days | 30 to 90 days | >90 days | Total | ||||||||||||||||
Securities Lending Transactions | ||||||||||||||||||||
Common Stocks | $ | 24,734,589 | $ | — | $ | — | $ | — | $ | 24,734,589 | ||||||||||
The carrying amount of the liability for deposits for securities loaned at December 31, 2019 approximated its fair value. If measured at fair value, such liability would have been considered as Level 2 in the fair value hierarchy (see Note 1A) at December 31, 2019.
8 Line of Credit
Effective October 29, 2019, the Fund participates with other portfolios and funds managed by EVM and its affiliates, including CRM, in an $800 million unsecured line of credit with a group of banks, which is in effect through October 27, 2020. Borrowings are made by the Fund solely to facilitate the handling of unusual and/or unanticipated short-term cash requirements. Interest is charged to the Fund based on its borrowings at an amount above either the Eurodollar rate or Federal Funds rate. In addition, a fee computed at an annual rate of 0.15% on the daily unused portion of the line of credit is allocated among the participating portfolios and funds at the end of each quarter. Because the line of credit is not available exclusively to the Fund, it may be unable to borrow some or all of its requested amounts at any particular time.
Prior to October 29, 2019, the Fund participated with other funds managed by CRM in a $100 million ($62.5 million prior to June 21, 2019) committed line of credit agreement with SSBT, which was terminated by the Calvert funds. Borrowings bore interest at the higher of theone-month London Interbank Offered Rate (LIBOR) in effect that day or the overnight Federal Funds rate, plus 1.00% per annum. A commitment fee of 0.20% per annum was incurred on the unused portion of the committed facility, which was allocated to all participating funds.
| 42 |
Table of Contents
Calvert
VP Russell 2000® Small Cap Index Portfolio
December 31, 2019
Notes to Financial Statements — continued
The Fund had no borrowings pursuant to its lines of credit during the year ended December 31, 2019.
9 Capital Shares
The Corporation may issue its shares in one or more series (such as the Fund). The authorized shares of the Fund consist of 20,000,000 common shares, $0.10 par value, for each Class. Transactions in capital shares for the years ended December 31, 2019 and December 31, 2018 were as follows:
| Year Ended December 31, 2019 | Year Ended December 31, 2018 | |||||||||||||||
| Shares | Amount | Shares | Amount | |||||||||||||
Class I | ||||||||||||||||
Shares sold | 165,668 | $ | 13,210,295 | 141,642 | $ | 12,114,837 | ||||||||||
Reinvestment of distributions | 174,765 | 12,492,232 | 101,905 | 9,045,101 | ||||||||||||
Shares redeemed | (225,259 | ) | (18,049,350 | ) | (319,334 | ) | (27,813,289 | ) | ||||||||
Net increase (decrease) | 115,174 | $ | 7,653,177 | (75,787 | ) | $ | (6,653,351 | ) | ||||||||
Class F | ||||||||||||||||
Shares sold | 133,706 | $ | 10,758,734 | 139,194 | $ | 12,310,410 | ||||||||||
Reinvestment of distributions | 46,469 | 3,317,360 | 24,653 | 2,190,621 | ||||||||||||
Shares redeemed | (73,403 | ) | (5,911,103 | ) | (117,291 | ) | (10,319,610 | ) | ||||||||
Net increase | 106,772 | $ | 8,164,991 | 46,556 | $ | 4,181,421 | ||||||||||
At December 31, 2019, separate accounts of an insurance company that is an affiliate of AIP owned 50.0% of the value of the outstanding shares of the Fund and separate accounts of two other insurance companies each owned more than 10% of the value of the outstanding shares of the Fund, aggregating 27.8%.
| 43 |
Table of Contents
Calvert
VP Russell 2000® Small Cap Index Portfolio
December 31, 2019
Report of Independent Registered Public Accounting Firm
To the Shareholders and Board of Directors
Calvert Variable Products, Inc.:
Opinion on the Financial Statements
We have audited the accompanying statement of assets and liabilities of Calvert VP Russell 2000® Small Cap Index Portfolio (the Fund), a series of Calvert Variable Products, Inc., including the schedule of investments, as of December 31, 2019, the related statement of operations for the year then ended, the statements of changes in net assets for each of the years in thetwo-year period then ended, and the related notes (collectively, the financial statements) and the financial highlights for each of the years in thefive-year period then ended. In our opinion, the financial statements and financial highlights present fairly, in all material respects, the financial position of the Fund as of December 31, 2019, the results of its operations for the year then ended, the changes in its net assets for each of the years in thetwo-year period then ended, and the financial highlights for each of the years in thefive-year period then ended, in conformity with U.S. generally accepted accounting principles.
Basis for Opinion
These financial statements and financial highlights are the responsibility of the Fund’s management. Our responsibility is to express an opinion on these financial statements and financial highlights based on our audits. We are a public accounting firm registered with the Public Company Accounting Oversight Board (United States) (PCAOB) and are required to be independent with respect to the Fund in accordance with the U.S. federal securities laws and the applicable rules and regulations of the Securities and Exchange Commission and the PCAOB.
We conducted our audits in accordance with the standards of the PCAOB. Those standards require that we plan and perform the audit to obtain reasonable assurance about whether the financial statements and financial highlights are free of material misstatement, whether due to error or fraud. Our audits included performing procedures to assess the risks of material misstatement of the financial statements and financial highlights, whether due to error or fraud, and performing procedures that respond to those risks. Such procedures included examining, on a test basis, evidence regarding the amounts and disclosures in the financial statements and financial highlights. Such procedures also included confirmation of securities owned as of December 31, 2019, by correspondence with the custodian and brokers. Our audits also included evaluating the accounting principles used and significant estimates made by management, as well as evaluating the overall presentation of the financial statements and financial highlights. We believe that our audits provide a reasonable basis for our opinion.

We have served as the auditor of one or more of the Calvert Funds since 2002.
Philadelphia, Pennsylvania
February 19, 2020
| 44 |
Table of Contents
Calvert
VP Russell 2000® Small Cap Index Portfolio
December 31, 2019
Federal Tax Information (Unaudited)
As required by the Internal Revenue Code and/or regulations, shareholders must be notified regarding the status of the dividends received deduction for corporations and capital gains dividends.
Dividends Received Deduction.Corporate shareholders are generally entitled to take the dividends received deduction on the portion of the Fund’s dividend distribution that qualifies under tax law. For the Fund’s fiscal 2019 ordinary income dividends, 55.27% qualifies for the corporate dividends received deduction.
Capital Gains Dividends.The Fund hereby designates as a capital gain dividend with respect to the taxable year ended December 31, 2019, $9,227,228 or, if subsequently determined to be different, the net capital gain of such year.
| 45 |
Table of Contents
Calvert
VP Russell 2000® Small Cap Index Portfolio
December 31, 2019
Fund Management.The Directors of Calvert Variable Products, Inc. (the Corporation) are responsible for the overall management and supervision of the Corporation’s affairs. The Directors and officers of the Corporation are listed below. Except as indicated, each individual has held the office shown or other offices in the same company for the last five years. Each Board member holds office until his or her successor is elected and qualified, or until his or her earlier death, resignation, retirement, removal or disqualification. Under the terms of the Fund’s current Board member retirement policy, an Independent Board member must retire at the end of the calendar year in which he or she turns 75. However, if such retirement would cause the Fund to be out of compliance with Section 16 of the 1940 Act or any other regulations or guidance of the SEC, then such retirement and resignation will not become effective until such time as action has been taken for the Fund to be in compliance upon a Board member’s retirement. The “Independent Directors” consist of those Directors who are not “interested persons” of the Corporation, as that term is defined under the 1940 Act. The business address of each Director and officer, with the exception of Ms. Gemma and Mr. Kirchner, is 1825 Connecticut Avenue NW, Suite 400, Washington, DC 20009. As used below, “CRM” refers to Calvert Research and Management. Each Director oversees 39 funds in the Calvert fund complex. Each officer serves as an officer of certain other Calvert funds.
| Name and Year of Birth | Position with the | Position Start Date | Principal Occupation(s) and Directorships During Past Five Years and Other Relevant Experience | |||
| Interested Director | ||||||
John H. Streur(1) 1960 | Director and President | 2015 | President and Chief Executive Officer of Calvert Research and Management (since December 31, 2016). President and Chief Executive Officer of Calvert Investments, Inc. (January 2015-December 2016); Chief Executive Officer of Calvert Investment Distributors, Inc. (August 2015-December 2016); Chief Compliance Officer of Calvert Investment Management, Inc. (August 2015-April 2016); President and Director, Portfolio 21 Investments, Inc. (through October 2014); President, Chief Executive Officer and Director, Managers Investment Group LLC (through January 2012); President and Director, The Managers Funds and Managers AMG Funds (through January 2012). Other Directorships in the Last Five Years. Portfolio 21 Investments, Inc. (asset management) (through October 2014); Managers Investment Group LLC (asset management) (through January 2012); The Managers Funds (asset management) (through January 2012); Managers AMG Funds (asset management) (through January 2012); Calvert Impact Capital, Inc | |||
| Independent Directors | ||||||
Richard L. Baird, Jr. 1948 | Director | 2016 | Regional Disaster Recovery Lead, American Red Cross of Greater Pennsylvania (since 2017). Volunteer, American Red Cross (since 2015). Former President and CEO of Adagio Health Inc. (retired in 2014) in Pittsburgh, PA. Other Directorships in the Last Five Years. None. | |||
Alice Gresham Bullock 1950 | Chair and Director | 2016 (Chair); 2008 (Director) | Professor Emerita at Howard University School of Law. Dean Emerita of Howard University School of Law and Deputy Director of the Association of American Law Schools (1992-1994). Other Directorships in the Last Five Years. None. | |||
Cari M. Dominguez 1949 | Director | 2016 | Former Chair of the U.S. Equal Employment Opportunity Commission. Other Directorships in the Last Five Years. Manpower, Inc. (employment agency); Triple S Management Corporation (managed care); National Association of Corporate Directors. | |||
John G. Guffey, Jr.(2) 1948 | Director | 2016 | President of Aurora Press Inc., a privately held publisher of trade paperbacks (since January 1997). Other Directorships in the Last Five Years. Calvert Impact Capital, Inc. (through December 31, 2018); Calvert Ventures, LLC. | |||
Miles D. Harper, III 1962 | Director | 2016 | Partner, Carr Riggs & Ingram (public accounting firm) since October 2014. Partner, Gainer Donnelly & Desroches (public accounting firm) (now Carr Riggs & Ingram), November 1999-September 2014). Other Directorships in the Last Five Years. Bridgeway Funds (9) (asset management). | |||
| 46 |
Table of Contents
Calvert
VP Russell 2000® Small Cap Index Portfolio
December 31, 2019
Management and Organization — continued
| Name and Year of Birth | Position with the | Position Start Date | Principal Occupation(s) and Directorships During Past Five Years and Other Relevant Experience | |||
| Independent Directors (continued) | ||||||
Joy V. Jones 1950 | Director | 2016 | Attorney. Other Directorships in the Last Five Years. Conduit Street Restaurants SUD 2 Limited; Palm Management Restaurant Corporation. | |||
Anthony A. Williams 1951 | Director | 2016 | CEO and Executive Director of the Federal City Council (July 2012 to present); Senior Adviser and Independent Consultant for King and Spalding LLP (September 2015 to present); Executive Director of Global Government Practice at the Corporate Executive Board (January 2010 to January 2012). Other Directorships in the Last Five Years. Freddie Mac; Evoq Properties/ Meruelo Maddux Properties, Inc. (real estate management); Weston Solutions, Inc. (environmental services); Bipartisan Policy Center’s Debt Reduction Task Force; Chesapeake Bay Foundation; Catholic University of America; Urban Institute (research organization). | |||
| Name and Year of Birth | Position(s) with the | Position Start Date | Principal Occupation(s) During Past Five Years | |||
| Principal Officers who are not Directors | ||||||
Hope L. Brown 1973 | Chief Compliance Officer | 2014 | Chief Compliance Officer of 39 registered investment companies advised by CRM (since 2014). Vice President and Chief Compliance Officer, Wilmington Funds (2012-2014). | |||
Maureen A. Gemma(3) 1960 | Vice President, Secretary and Chief Legal Officer | 2016 | Vice President of CRM and officer of 39 registered investment companies advised by CRM (since 2016). Also Vice President of Eaton Vance and certain of its affiliates and officer of 159 registered investment companies advised or administered by Eaton Vance. | |||
James F. Kirchner(3) 1967 | Treasurer | 2016 | Vice President of CRM and officer of 39 registered investment companies advised by CRM (since 2016). Also Vice President of Eaton Vance and certain of its affiliates and officer of 159 registered investment companies advised or administered by Eaton Vance. | |||
| (1) | Mr. Streur is an interested person of the Fund because of his positions with the Fund’s adviser and certain affiliates. |
| (2) | Mr. Guffey is currently married to Rebecca L. Adamson, who served as a member of the Advisory Council through December 31, 2019. |
| (3) | The business address for Ms. Gemma and Mr. Kirchner is Two International Place, Boston, MA 02110. |
The SAI for the Fund includes additional information about the Directors and officers of the Fund and can be obtained without charge on Calvert’s website at www.calvert.com or by calling1-800-368-2745.
| 47 |
Table of Contents
Calvert Funds
Privacy. The Eaton Vance organization is committed to ensuring your financial privacy. Each entity listed below has adopted a privacy policy and procedures (“Privacy Program”) Eaton Vance believes is reasonably designed to protect your personal information and to govern when and with whom Eaton Vance may share your personal information.
| • | At the time of opening an account, Eaton Vance generally requires you to provide us with certain information such as name, address, social security number, tax status, account numbers, and account balances. This information is necessary for us to both open an account for you and to allow us to satisfy legal requirements such as applicable anti-money laundering reviews and know-your-customer requirements. |
| • | On an ongoing basis, in the normal course of servicing your account, Eaton Vance may share your information with unaffiliated third parties that perform various services for Eaton Vance and/or your account. These third parties include transfer agents, custodians, broker/dealers and our professional advisers, including auditors, accountants, and legal counsel. Eaton Vance may additionally share your personal information with our affiliates. |
| • | We believe our Privacy Program is reasonably designed to protect the confidentiality of your personal information and to prevent unauthorized access to that information. |
| • | We reserve the right to change our Privacy Program at any time upon proper notification to you. You may want to review our Privacy Program periodically for changes by accessing the link on our homepage: www.eatonvance.com. |
Our pledge of protecting your personal information applies to the following entities within the Eaton Vance organization: the Eaton Vance Family of Funds, Eaton Vance Management, Eaton Vance Investment Counsel, Eaton Vance Distributors, Inc., Eaton Vance Trust Company, Eaton Vance Management (International) Limited, Eaton Vance Advisers International Limited, Eaton Vance Global Advisors Limited, Eaton Vance Management’s Real Estate Investment Group, Boston Management and Research, Calvert Research and Management, and Calvert Funds. This Privacy Notice supersedes all previously issued privacy disclosures. For more information about our Privacy Program or about how your personal information may be used, please call 1-800-368-2745.
Delivery of Shareholder Documents. The Securities and Exchange Commission (SEC) permits funds to deliver only one copy of shareholder documents, including prospectuses, proxy statements and shareholder reports, to fund investors with multiple accounts at the same residential or post office box address. This practice is often called “householding” and it helps eliminate duplicate mailings to shareholders.Calvert funds, or your financial intermediary, may household the mailing of your documents indefinitely unless you instruct Calvert funds, or your financial intermediary, otherwise. If you would prefer that your Calvert fund documents not be householded, please contact Calvert fundsat 1-800-368-2745, or contact your financial intermediary. Your instructions that householding not apply to delivery of your Calvert fund documents will typically be effective within 30 days of receipt by Calvert funds or your financial intermediary. Separate statements will be generated for each separate account and will be householded as described above.
Portfolio Holdings. Each Calvert fund files a schedule of portfolio holdings on Part F to Form N-PORT with the SEC for the first and third quarters of each fiscal year. The Form N-PORT will be available on the Calvert funds’ website at www.calvert.com, by calling Calvert fundsat 1-800-368-2745 or in the EDGAR database on the SEC’s website at www.sec.gov.
Proxy Voting. The Proxy Voting Guidelines that each Calvert fund uses to determine how to vote proxies relating to portfolio securities is provided as an Appendix to the fund’s Statement of Additional Information. The Statement of Additional Information can be obtained free of charge by calling the Calvert funds at 1-800-368-2745, by visiting the Calvert funds’ website at www.calvert.com or visiting the SEC’s website at www.sec.gov. Information regarding how a Calvert fund voted proxies relating to portfolio securities during the most recent 12-month period ended June 30 is available by calling Calvert funds, by visiting the Calvert funds’ website at www.calvert.com or by visiting the SEC’s website at www.sec.gov.
| 48 |
Table of Contents
Investment Adviser and Administrator
Calvert Research and Management
1825 Connecticut Avenue NW, Suite 400
Washington, DC 20009
Investment Sub-Adviser
Ameritas Investment Partners, Inc.
5945 R Street
Lincoln, NE 68505
Principal Underwriter*
Eaton Vance Distributors, Inc.
Two International Place
Boston, MA 02110
(617) 482-8260
Custodian
State Street Bank and Trust Company
State Street Financial Center, One Lincoln Street
Boston, MA 02111
Transfer Agent
DST Asset Manager Solutions, Inc.
2000 Crown Colony Drive
Quincy, MA 02169
Independent Registered Public Accounting Firm
KPMG LLP
1601 Market Street
Philadelphia, PA 19103-2499
Fund Offices
1825 Connecticut Avenue NW, Suite 400
Washington, DC 20009
| * | FINRA BrokerCheck. Investors may check the background of their Investment Professional by contacting the Financial Industry Regulatory Authority (FINRA). FINRA BrokerCheck is a free tool to help investors check the professional background of current and former FINRA-registered securities firms and brokers. FINRA BrokerCheck is available by calling 1-800-289-9999 and at www.FINRA.org. The FINRA BrokerCheck brochure describing this program is available to investors at www.FINRA.org. |
Table of Contents
Printed on recycled paper.

24225 12.31.19
Table of Contents

Calvert
VP EAFE International Index Portfolio
Annual Report
December 31, 2019
Important Note. Beginning on January 1, 2021, as permitted by regulations adopted by the Securities and Exchange Commission, you may not receive paper copies of the Fund’s annual and semi-annual shareholder reports from the insurance company or plan sponsor unless you specifically request paper copies. Instead, the reports will be made available on a website and you will be notified by mail each time a report is posted and provided with a website address to access the report. Instructions for requesting paper copies will be provided by the insurance company, plan sponsor or your financial intermediary, as applicable. Please contact the insurance company, plan sponsor or your financial intermediary, as applicable, or follow instructions included with this disclosure, if any, for more information.

Table of Contents
Commodity Futures Trading Commission Registration. Effective December 31, 2012, the Commodity Futures Trading Commission (“CFTC”) adopted certain regulatory changes that subject registered investment companies and advisers to regulation by the CFTC if a fund invests more than a prescribed level of its assets in certain CFTC-regulated instruments (including futures, certain options and swap agreements) or markets itself as providing investment exposure to such instruments. The Fund and its adviser have claimed an exclusion from the definition of the term “commodity pool operator” under the Commodity Exchange Act. Accordingly, neither the Fund nor the adviser is subject to CFTC regulation.
Fund shares are not insured by the FDIC and are not deposits or other obligations of, or guaranteed by, any depository institution. Shares are subject to investment risks, including possible loss of principal invested.
This report must be preceded or accompanied by a current summary prospectus or prospectus. Before investing, investors should consider carefully the investment objective, risks, and charges and expenses of a mutual fund. This and other important information is contained in the summary prospectus and prospectus, which can be obtained from a financial intermediary. Prospective investors should read the prospectus carefully before investing. For further information, please call1-800-368-2745.
Table of Contents
Annual Report December 31, 2019
Calvert
VP EAFE International Index Portfolio
Table of Contents
Calvert
VP EAFE International Index Portfolio
December 31, 2019
Management’s Discussion of Fund Performance 1
Economic and Market Conditions
With virtually every U.S. and global equity index posting double-digit returns for the12-month period ended December 31, 2019 — and bond markets in the black as well — 2019 was a good year for investments.
As the new year dawned in January 2019, investors appeared to be taking a “glass is half full” approach. Although U.S. manufacturing output and business investment remained weak — held back by slowing global growth and anon-again/off-again U.S.-China trade war — strong spending by U.S. consumers and dovish remarks by the U.S. Federal Reserve (the Fed) combined to lift investor sentiment. After four federal funds rate hikes in the previous year, markets began to project the Fed might actually lower rates in 2019 to stimulate the economy. U.S. unemployment, meanwhile, remained low and hiring remained strong.
As a result, U.S. stocks started the year with a climb, and international stocks followed. Facing concerns about slowing global growth and potential fallout from Brexit and U.S.-China trade issues, central banks around the world began to cut interest rates and employ other tools to stimulate their respective economies. For the first four months of 2019, the S&P 500®,2 the MSCI EAFE, the MSCI Emerging Markets, and the MSCI World indexes all reported strongly positive returns. Even a global stock pullback in May — sparked by heightened concerns about the U.S.-China trade spat — proved to be temporary, and the global stock rally resumed in June and July.
After holding interest rates steady through the first half of the year, the Fed cut the federal funds rate on July 31, 2019 — its first reduction in over a decade — followed by two additional rate cuts in September and October, to end the period at1.50%-1.75%. By end of the third quarter, 60 central banks around the world had lowered their interest rates.
After falling in August, global equities rallied again during the final months of the period, spurred by central bank actions; improved numbers from Chinese manufacturing, which had previously weakened; and optimism about a U.S.-China trade détente. Two events in December did much to allay investor concerns about trade and tariffs: passage of the United States-Mexico-Canada Agreement by the U.S. House of Representatives and the Trump administration’s agreement to aso-called“phase-one” trade deal with China.
During the12-month period ended December 31, 2019, the MSCI World Index, an index of developed market equity securities, returned 27.67%. The S&P 500® Index, a broad measure of U.S. stocks, returned 31.49%, hitting anall-time high the day after Christmas. The MSCI EAFE Index of developed-market international equities returned 22.01%, and the MSCI Emerging Markets Index returned 18.42%.
Investment Strategy
Calvert VP EAFE International Index Portfolio (the Fund) seeks to substantially replicate the performance of the MSCI EAFE Index (the Index). This is accomplished by investing in all, or virtually all, of the larger capitalization stocks in the Index in approximately the same proportion as the Index and in a sampling of the smaller capitalization stocks. The Index is a widely accepted benchmark of international stock performance that is designed to represent the performance of large- andmid-cap securities in 21 developed markets, including countries in Europe, Australasia, and the Far East, but excluding the United States and Canada.
Fund Performance
For the12-month period ended December 31, 2019, the Fund returned 21.26% for Class I shares at net asset value (NAV). By comparison, the Index returned 22.01% for the same period. The Index is unmanaged and returns do not reflect any fees, dividend withholding taxes, and operating expenses.
All 21 countries within the Index had positive returns on a U.S. dollar basis during the period, with almost all countries experiencing double-digit returns for 2019. Easing trade tensions and central bank stimulus boosted equity returns across the developed world. Similarly, almost all market sectors had positive, double-digit returns, led by information technology, which was up 37.68% during the period.
See Endnotes and Additional Disclosures in this report.
Past performance is no guarantee of future results. Returns are historical and are calculated by determining the percentage change in net asset value (NAV) or offering price (as applicable) with all distributions reinvested. Investment return and principal value will fluctuate so that shares, when redeemed, may be worth more or less than their original cost. Performance for periods less than or equal to one year is cumulative. Performance is for the stated time period only; due to market volatility, current Fund performance may be lower or higher than the quoted return.
| 2 |
Table of Contents
Calvert
VP EAFE International Index Portfolio
December 31, 2019
Portfolio Manager Thomas Seto of Calvert Research and Management
| % Average Annual Total Returns 2,3 | Class Inception Date | Performance Inception Date | One Year | Five Years | Ten Years | |||||||||||||||
Class I at NAV | 11/12/2002 | 11/12/2002 | 21.26 | % | 5.26 | % | 4.78 | % | ||||||||||||
Class F at NAV | 12/17/2007 | 11/12/2002 | 21.00 | 5.01 | 4.54 | |||||||||||||||
| ||||||||||||||||||||
MSCI EAFE Index | — | — | 22.01 | % | 5.67 | % | 5.50 | % | ||||||||||||
| % Total Annual Operating Expense Ratios 4 | Class I | Class F | ||||||||||||||||||
| Gross | 0.69 | % | 0.89 | % | ||||||||||||||||
| Net | 0.49 | 0.69 | ||||||||||||||||||
Growth of $10,000
This graph shows the change in value of a hypothetical investment of $10,000 in Class I of the Fund for the period indicated. For comparison, the same investment is shown in the indicated index.
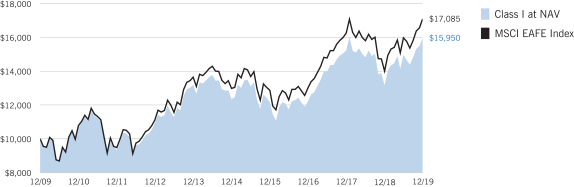
| Growth of Investment | Amount Invested | Period Beginning | At NAV | With Maximum Sales Charge | ||||||||||||
| Class F | $10,000 | 12/31/2009 | $15,599 | N.A. | ||||||||||||
See Endnotes and Additional Disclosures in this report.
Past performance is no guarantee of future results. Returns are historical and are calculated by determining the percentage change in net asset value (NAV) or offering price (as applicable) with all distributions reinvested. Investment return and principal value will fluctuate so that shares, when redeemed, may be worth more or less than their original cost. Performance for periods less than or equal to one year is cumulative. Performance is for the stated time period only; due to market volatility, current Fund performance may be lower or higher than the quoted return.
| 3 |
Table of Contents
Calvert
VP EAFE International Index Portfolio
December 31, 2019
| Sector Allocation (% of net assets) 5 | ||||
Financials | 18.4 | % | ||
Industrials | 15.0 | |||
Health Care | 12.1 | |||
Consumer Discretionary | 11.5 | |||
Consumer Staples | 11.2 | |||
Materials | 7.1 | |||
Information Technology | 6.9 | |||
Communication Services | 5.2 | |||
Energy | 4.8 | |||
Utilities | 3.7 | |||
Real Estate | 3.5 | |||
Total | 99.4 | % | ||
| Top 10 Holdings (% of net assets) 5 | ||||
Nestle SA | 2.2 | % | ||
Roche Holding AG PC | 1.5 | |||
Novartis AG | 1.4 | |||
Toyota Motor Corp. | 1.1 | |||
HSBC Holdings PLC | 1.1 | |||
SAP SE | 0.9 | |||
Total SA | 0.9 | |||
AstraZeneca PLC | 0.9 | |||
LVMH Moet Hennessy Louis Vuitton SE | 0.9 | |||
BP PLC | 0.9 | |||
Total | 11.8 | % | ||
See Endnotes and Additional Disclosures in this report.
| 4 |
Table of Contents
Calvert
VP EAFE International Index Portfolio
December 31, 2019
Endnotes and Additional Disclosures
| 1 | The views expressed in this report are those of the portfolio manager(s) and are current only through the date stated at the top of this page. These views are subject to change at any time based upon market or other conditions, and Calvert and the Fund(s) disclaim any responsibility to update such views. These views may not be relied upon as investment advice and, because investment decisions are based on many factors, may not be relied upon as an indication of trading intent on behalf of any Calvert fund. This commentary may contain statements that are not historical facts, referred to as “forward looking statements.” The Fund’s actual future results may differ significantly from those stated in any forward looking statement, depending on factors such as changes in securities or financial markets or general economic conditions, the volume of sales and purchases of Fund shares, the continuation of investment advisory, administrative and service contracts, and other risks discussed from time to time in the Fund’s filings with the Securities and Exchange Commission. |
| 2 | S&P 500® Index is an unmanaged index of large-cap stocks commonly used as a measure of U.S. stock market performance. S&P Dow Jones Indices are a product of S&P Dow Jones Indices LLC (“S&P DJI”) and have been licensed for use. S&P® and S&P 500® are registered trademarks of S&P DJI; Dow Jones® is a registered trademark of Dow Jones Trademark Holdings LLC (“Dow Jones”); S&P DJI, Dow Jones and their respective affiliates do not sponsor, endorse, sell or promote the Fund, will not have any liability with respect thereto and do not have any liability for any errors, omissions, or interruptions of the S&P Dow Jones Indices. MSCI EAFE Index is an unmanaged index of equities in the developed markets, excluding the U.S. and Canada. MSCI Emerging Markets Index is an unmanaged index of emerging markets common stocks. MSCI World Index is an unmanaged index of equity securities in the developed markets. MSCI indexes are net of foreign withholding taxes. Source: MSCI. MSCI data may not be reproduced or used for any other purpose. MSCI provides no warranties, has not prepared or approved this report, and has no liability hereunder. Unless otherwise stated, index returns do not reflect the effect of any applicable sales charges, commissions, expenses, taxes or leverage, as applicable. It is not possible to invest directly in an index. |
| 3 | There is no sales charge. Insurance-related charges are not included in the calculation of returns. If such charges were reflected, the returns would be lower. Please refer to the report for your insurance contract for performance data reflecting insurance-related charges. |
Calvert Research and Management became the investment adviser to the Fund on December 31, 2016. Performance reflected prior to such date is that of the Fund’s former investment adviser. |
| 4 | Source: Fund prospectus. Net expense ratios reflect a contractual expense reimbursement that continues through 4/30/20. Without the reimbursement, performance would have been lower. The expense ratios for the current reporting period can be found in the Financial Highlights section of this report. |
| 5 | Excludes cash and cash equivalents. |
| 5 |
Table of Contents
Calvert
VP EAFE International Index Portfolio
December 31, 2019
Example
As a Fund shareholder, you incur ongoing costs, including management fees; distribution and/or service fees; and other Fund expenses. This Example is intended to help you understand your ongoing costs (in dollars) of Fund investing and to compare these costs with the ongoing costs of investing in other mutual funds. The Example is based on an investment of $1,000 invested at the beginning of the period and held for the entire period (July 1, 2019 to December 31, 2019).
Actual Expenses
The first section of the table below provides information about actual account values and actual expenses. You may use the information in this section, together with the amount you invested, to estimate the expenses that you paid over the period. Simply divide your account value by $1,000 (for example, an $8,600 account value divided by $1,000 = 8.6), then multiply the result by the number in the first section under the heading entitled “Expenses Paid During Period” to estimate the expenses you paid on your account during this period.
Hypothetical Example for Comparison Purposes
The second section of the table below provides information about hypothetical account values and hypothetical expenses based on the actual Fund expense ratio and an assumed rate of return of 5% per year (before expenses), which is not the actual Fund return. The hypothetical account values and expenses may not be used to estimate the actual ending account balance or expenses you paid for the period. You may use this information to compare the ongoing costs of investing in the Fund and other funds. To do so, compare this 5% hypothetical example with the 5% hypothetical examples that appear in the shareholder reports of the other funds.
Please note that the expenses shown in the table are meant to highlight your ongoing costs only and do not reflect expenses and charges which are, or may be imposed under the variable annuity contract or variable life insurance policy (variable contracts) (if applicable) through which your investment in the Fund is made. Therefore, the second section of the table is useful in comparing ongoing costs associated with an investment in vehicles which fund benefits under variable contracts, and will not help you determine the relative total costs of investing in the Fund through variable contracts. In addition, if these expenses and charges imposed under the variable contracts were included, your costs would have been higher.
| Beginning Account Value (7/1/19) | Ending Account Value (12/31/19) | Expenses Paid During Period* (7/1/19 – 12/31/19) | Annualized Expense Ratio | |||||||||||||
Actual | ||||||||||||||||
Class I | $ | 1,000.00 | $ | 1,065.80 | $ | 2.50 | ** | 0.48 | % | |||||||
Class F | $ | 1,000.00 | $ | 1,064.70 | $ | 3.54 | ** | 0.68 | % | |||||||
Hypothetical | ||||||||||||||||
(5% return per year before expenses) | ||||||||||||||||
Class I | $ | 1,000.00 | $ | 1,022.79 | $ | 2.45 | ** | 0.48 | % | |||||||
Class F | $ | 1,000.00 | $ | 1,021.78 | $ | 3.47 | ** | 0.68 | % | |||||||
| * | Expenses are equal to the Fund’s annualized expense ratio for the indicated Class, multiplied by the average account value over the period, multiplied by 184/365 (to reflect theone-half year period). The Example assumes that the $1,000 was invested at the net asset value per share determined at the close of business on June 30, 2019. Expenses shown do not include insurance-related charges. |
| ** | Absent a waiver and/or reimbursement of expenses by an affiliate, expenses would be higher. |
| 6 |
Table of Contents
Calvert
VP EAFE International Index Portfolio
December 31, 2019
| Common Stocks — 99.4% |
| |||||||
| Security | Shares | Value | ||||||
| Australia — 6.7% | ||||||||
AGL Energy, Ltd. | 6,090 | $ | 87,657 | |||||
Alumina, Ltd. | 14,501 | 23,422 | ||||||
AMP, Ltd.(1) | 10,568 | 14,216 | ||||||
APA Group(1) | 11,361 | 88,439 | ||||||
Aristocrat Leisure, Ltd. | 4,773 | 112,782 | ||||||
ASX, Ltd. | 1,623 | 89,363 | ||||||
Aurizon Holdings, Ltd. | 16,477 | 60,469 | ||||||
AusNet Services | 27,031 | 32,234 | ||||||
Australia & New Zealand Banking Group, Ltd. | 24,210 | 417,525 | ||||||
Bendigo & Adelaide Bank, Ltd.(1) | 4,706 | 32,292 | ||||||
BGP Holdings PLC(2)(3) | 77,172 | 0 | ||||||
BHP Group, Ltd. | 25,518 | 698,742 | ||||||
BlueScope Steel, Ltd. | 4,388 | 46,476 | ||||||
Boral, Ltd. | 10,917 | 34,346 | ||||||
Brambles, Ltd. | 14,024 | 115,427 | ||||||
Caltex Australia, Ltd. | 2,659 | 63,402 | ||||||
Challenger, Ltd.(1) | 5,824 | 33,142 | ||||||
CIMIC Group, Ltd. | 1,008 | 23,436 | ||||||
Coca-Cola Amatil, Ltd. | 2,449 | 19,018 | ||||||
Cochlear, Ltd. | 420 | 66,195 | ||||||
Coles Group, Ltd. | 8,634 | 89,878 | ||||||
Commonwealth Bank of Australia | 15,098 | 846,965 | ||||||
Computershare, Ltd.(1) | 3,586 | 42,279 | ||||||
Crown Resorts, Ltd. | 3,713 | 31,305 | ||||||
CSL, Ltd. | 3,904 | 756,916 | ||||||
Dexus | 9,023 | 74,275 | ||||||
Flight Centre Travel Group, Ltd. | 565 | 17,475 | ||||||
Fortescue Metals Group, Ltd. | 11,558 | 87,128 | ||||||
Goodman Group | 14,771 | 138,806 | ||||||
GPT Group (The) | 14,077 | 55,450 | ||||||
Harvey Norman Holdings, Ltd.(1) | 5,671 | 16,197 | ||||||
Incitec Pivot, Ltd. | 17,202 | 38,431 | ||||||
Insurance Australia Group, Ltd.(1) | 21,017 | 112,927 | ||||||
Lend Lease Group | 5,044 | 62,362 | ||||||
Macquarie Group, Ltd.(1) | 2,900 | 280,848 | ||||||
Magellan Financial Group, Ltd. | 712 | 28,526 | ||||||
Medibank Pvt, Ltd. | 21,199 | 46,982 | ||||||
Mirvac Group | 28,589 | 63,991 | ||||||
National Australia Bank, Ltd. | 24,625 | 426,113 | ||||||
Newcrest Mining, Ltd. | 6,846 | 144,580 | ||||||
Oil Search, Ltd.(1) | 12,475 | 63,610 | ||||||
Orica, Ltd. | 3,401 | 52,445 | ||||||
Origin Energy, Ltd. | 13,013 | 77,157 | ||||||
Qantas Airways, Ltd. | 7,283 | 36,302 | ||||||
| Security | Shares | Value | ||||||
| Australia (continued) | ||||||||
QBE Insurance Group, Ltd. | 11,896 | $ | 107,498 | |||||
Ramsay Health Care, Ltd. | 1,442 | 73,366 | ||||||
REA Group, Ltd. | 537 | 39,011 | ||||||
Rio Tinto, Ltd. | 3,172 | 224,419 | ||||||
Santos, Ltd. | 13,517 | 77,763 | ||||||
Scentre Group | 45,895 | 123,515 | ||||||
Seek, Ltd. | 3,323 | 52,595 | ||||||
Sonic Healthcare, Ltd. | 4,020 | 81,055 | ||||||
South32, Ltd. | 48,353 | 91,296 | ||||||
Stockland | 19,317 | 62,675 | ||||||
Suncorp Group, Ltd. | 11,330 | 102,920 | ||||||
Sydney Airport | 11,138 | 67,671 | ||||||
Tabcorp Holdings, Ltd. | 15,814 | 50,274 | ||||||
Telstra Corp., Ltd. | 37,215 | 92,442 | ||||||
TPG Telecom, Ltd. | 3,460 | 16,302 | ||||||
Transurban Group | 24,274 | 254,077 | ||||||
Treasury Wine Estates, Ltd. | 6,449 | 73,459 | ||||||
Vicinity Centres | 25,959 | 45,404 | ||||||
Washington H. Soul Pattinson & Co., Ltd.(1) | 1,000 | 15,086 | ||||||
Wesfarmers, Ltd. | 10,212 | 296,778 | ||||||
Westpac Banking Corp. | 30,242 | 516,435 | ||||||
WiseTech Global, Ltd.(1) | 1,431 | 23,500 | ||||||
Woodside Petroleum, Ltd. | 7,595 | 183,636 | ||||||
Woolworths Group, Ltd. | 10,747 | 272,581 | ||||||
WorleyParsons, Ltd.(1) | 1,653 | 17,857 | ||||||
| $ | 8,611,146 | |||||||
| Austria — 0.2% | ||||||||
Andritz AG | 669 | $ | 28,761 | |||||
Erste Group Bank AG | 2,528 | 94,957 | ||||||
OMV AG | 1,054 | 59,050 | ||||||
Raiffeisen Bank International AG | 1,194 | 29,885 | ||||||
Verbund AG | 502 | 25,200 | ||||||
Voestalpine AG | 1,159 | 32,146 | ||||||
| $ | 269,999 | |||||||
| Belgium — 1.0% | ||||||||
Ageas | 1,514 | $ | 89,527 | |||||
Anheuser-Busch InBev SA/NV | 6,687 | 547,668 | ||||||
Colruyt SA | 686 | 35,776 | ||||||
Galapagos NV(1)(2) | 317 | 66,014 | ||||||
Groupe Bruxelles Lambert SA | 572 | 60,358 | ||||||
KBC Group NV | 1,991 | 150,111 | ||||||
Proximus SA | 920 | 26,361 | ||||||
Solvay SA | 647 | 75,306 | ||||||
| 7 | See Notes to Financial Statements. |
Table of Contents
Calvert
VP EAFE International Index Portfolio
December 31, 2019
Schedule of Investments — continued
| Security | Shares | Value | ||||||
| Belgium (continued) | ||||||||
Telenet Group Holding NV | 537 | $ | 24,140 | |||||
UCB SA | 958 | 76,232 | ||||||
Umicore SA | 1,940 | 94,544 | ||||||
| $ | 1,246,037 | |||||||
| Denmark — 1.8% | ||||||||
AP Moller — Maersk A/S, Class A | 38 | $ | 51,488 | |||||
AP Moller — Maersk A/S, Class B | 63 | 90,898 | ||||||
Carlsberg A/S, Class B | 953 | 142,222 | ||||||
Chr. Hansen Holding A/S | 842 | 66,935 | ||||||
Coloplast A/S, Class B | 1,084 | 134,482 | ||||||
Danske Bank A/S | 6,396 | 103,476 | ||||||
Demant A/S(1)(2) | 1,207 | 38,013 | ||||||
DSV PANALPINA A/S | 1,502 | 173,145 | ||||||
Genmab A/S(2) | 610 | 135,666 | ||||||
H Lundbeck A/S | 411 | 15,713 | ||||||
ISS A/S | 1,075 | 25,784 | ||||||
Novo Nordisk A/S, Class B | 15,469 | 896,410 | ||||||
Novozymes A/S, Class B | 2,046 | 100,146 | ||||||
Orsted A/S(4) | 1,567 | 162,110 | ||||||
Pandora A/S | 992 | 43,141 | ||||||
Tryg A/S | 1,180 | 34,996 | ||||||
Vestas Wind Systems A/S | 1,533 | 154,843 | ||||||
| $ | 2,369,468 | |||||||
| Finland — 1.1% | ||||||||
Elisa Oyj | 1,450 | $ | 80,119 | |||||
Fortum Oyj | 3,869 | 95,500 | ||||||
Kone Oyj, Class B | 3,003 | 196,360 | ||||||
Metso Oyj | 1,149 | 45,391 | ||||||
Neste Oyj | 3,315 | 115,365 | ||||||
Nokia Oyj | 42,143 | 155,881 | ||||||
Nokian Renkaat Oyj | 1,167 | 33,565 | ||||||
Nordea Bank Abp | 28,251 | 228,556 | ||||||
Orion Oyj, Class B | 1,045 | 48,396 | ||||||
Sampo Oyj, Class A | 3,936 | 171,858 | ||||||
Stora Enso Oyj, Class R | 4,859 | 70,702 | ||||||
UPM-Kymmene Oyj | 4,913 | 170,454 | ||||||
Wartsila Oyj Abp | 3,830 | 42,335 | ||||||
| $ | 1,454,482 | |||||||
| France — 10.7% | ||||||||
Accor SA | 1,534 | $ | 72,004 | |||||
Aeroports de Paris | 234 | 46,331 | ||||||
Air Liquide SA | 4,211 | 596,997 | ||||||
| Security | Shares | Value | ||||||
| France (continued) | ||||||||
Alstom SA | 1,576 | $ | 74,890 | |||||
Amundi SA(4) | 600 | 47,182 | ||||||
ArcelorMittal SA | 5,939 | 104,643 | ||||||
Arkema SA | 578 | 61,804 | ||||||
Atos SE | 785 | 65,597 | ||||||
AXA SA | 17,154 | 484,708 | ||||||
BioMerieux | 321 | 28,618 | ||||||
BNP Paribas SA | 9,829 | 584,217 | ||||||
Bollore SA | 8,863 | 38,731 | ||||||
Bouygues SA | 2,111 | 89,985 | ||||||
Bureau Veritas SA | 2,318 | 60,597 | ||||||
Capgemini SE | 1,303 | 159,363 | ||||||
Carrefour SA | 3,994 | 67,174 | ||||||
Casino Guichard Perrachon SA | 619 | 28,998 | ||||||
Cie de Saint-Gobain | 4,545 | 186,190 | ||||||
Cie Generale des Etablissements Michelin SCA | 1,561 | 192,095 | ||||||
CNP Assurances | 992 | 19,766 | ||||||
Covivio | 345 | 39,182 | ||||||
Credit Agricole SA | 10,461 | 152,222 | ||||||
Danone SA | 5,408 | 449,112 | ||||||
Dassault Aviation SA | 27 | 35,430 | ||||||
Dassault Systemes SE | 1,153 | 190,159 | ||||||
Edenred | 2,118 | 109,764 | ||||||
Eiffage SA | 600 | 68,836 | ||||||
Electricite de France SA | 2,761 | 30,808 | ||||||
Engie SA | 15,203 | 246,263 | ||||||
EssilorLuxottica SA | 2,499 | 382,051 | ||||||
Eurazeo SE | 476 | 32,673 | ||||||
Eurofins Scientific SE(1) | 110 | 61,109 | ||||||
Eutelsat Communications SA | 1,779 | 28,987 | ||||||
Faurecia SE | 412 | 22,367 | ||||||
Gecina SA | 419 | 75,117 | ||||||
Getlink SE | 3,977 | 69,338 | ||||||
Hermes International | 288 | 215,743 | ||||||
Icade SA | 224 | 24,391 | ||||||
Iliad SA(1) | 269 | 34,989 | ||||||
Ingenico Group SA | 559 | 60,807 | ||||||
Ipsen SA | 305 | 27,074 | ||||||
JC Decaux SA | 757 | 23,390 | ||||||
Kering SA | 675 | 444,767 | ||||||
Klepierre SA | 2,139 | 81,376 | ||||||
L’Oreal SA | 2,154 | 636,954 | ||||||
Legrand SA | 2,379 | 194,278 | ||||||
LVMH Moet Hennessy Louis Vuitton SE | 2,386 | 1,111,765 | ||||||
Natixis SA | 7,719 | 34,384 | ||||||
Orange SA(1) | 17,649 | 259,373 | ||||||
| 8 | See Notes to Financial Statements. |
Table of Contents
Calvert
VP EAFE International Index Portfolio
December 31, 2019
Schedule of Investments — continued
| Security | Shares | Value | ||||||
| France (continued) | ||||||||
Pernod-Ricard SA | 1,784 | $ | 319,225 | |||||
Peugeot SA | 4,946 | 119,086 | ||||||
Publicis Groupe SA | 1,961 | 88,914 | ||||||
Remy Cointreau SA | 223 | 27,407 | ||||||
Renault SA | 1,759 | 83,530 | ||||||
Safran SA | 2,812 | 434,339 | ||||||
Sanofi SA | 9,738 | 977,962 | ||||||
Sartorius Stedim Biotech | 147 | 24,400 | ||||||
Schneider Electric SE | 4,674 | 480,205 | ||||||
SCOR SE | 1,419 | 59,734 | ||||||
SEB SA | 175 | 26,027 | ||||||
SES SA FDR | 3,178 | 44,669 | ||||||
Societe Generale SA | 6,891 | 240,482 | ||||||
Sodexo SA | 778 | 92,279 | ||||||
Suez | 2,099 | 31,807 | ||||||
Teleperformance | 519 | 126,801 | ||||||
Thales SA | 954 | 99,268 | ||||||
Total SA | 20,645 | 1,145,602 | ||||||
Ubisoft Entertainment SA(2) | 595 | 41,223 | ||||||
Unibail-Rodamco-Westfield | 1,158 | 182,772 | ||||||
Valeo SA | 2,186 | 77,479 | ||||||
Veolia Environnement SA | 4,212 | 112,074 | ||||||
Vinci SA | 4,302 | 479,129 | ||||||
Vivendi SA | 7,584 | 219,614 | ||||||
Wendel SA | 198 | 26,375 | ||||||
Worldline SA(2)(4) | 817 | 57,918 | ||||||
| $ | 13,770,920 | |||||||
| Germany — 8.6% | ||||||||
adidas AG | 1,576 | $ | 513,016 | |||||
Allianz SE | 3,751 | 919,099 | ||||||
Aroundtown SA | 6,058 | 54,412 | ||||||
BASF SE | 7,787 | 586,646 | ||||||
Bayer AG | 8,078 | 656,714 | ||||||
Bayerische Motoren Werke AG | 2,757 | 225,814 | ||||||
Bayerische Motoren Werke AG, PFC Shares | 555 | 34,167 | ||||||
Beiersdorf AG | 943 | 112,607 | ||||||
Brenntag AG | 1,412 | 76,610 | ||||||
Carl Zeiss Meditec AG | 239 | 30,384 | ||||||
Commerzbank AG | 9,705 | 59,938 | ||||||
Continental AG | 995 | 128,584 | ||||||
Covestro AG(4) | 1,407 | 65,468 | ||||||
Daimler AG | 7,922 | 437,962 | ||||||
Delivery Hero SE(2)(4) | 811 | 64,279 | ||||||
Deutsche Bank AG | 13,741 | 106,472 | ||||||
Deutsche Boerse AG | 1,754 | 275,049 | ||||||
| Security | Shares | Value | ||||||
| Germany (continued) | ||||||||
Deutsche Lufthansa AG | 2,376 | $ | 43,649 | |||||
Deutsche Post AG | 8,335 | 316,931 | ||||||
Deutsche Telekom AG | 29,068 | 475,034 | ||||||
Deutsche Wohnen SE | 3,115 | 126,708 | ||||||
E.ON SE | 17,229 | 184,124 | ||||||
Evonik Industries AG | 1,690 | 51,617 | ||||||
Fraport AG Frankfurt Airport Services Worldwide | 424 | 35,991 | ||||||
Fresenius Medical Care AG & Co. KGaA | 1,903 | 140,114 | ||||||
Fresenius SE & Co. KGaA | 3,759 | 211,532 | ||||||
Fuchs Petrolub SE, PFC Shares | 708 | 35,176 | ||||||
GEA Group AG | 1,575 | 52,132 | ||||||
Hannover Rueck SE | 541 | 104,313 | ||||||
HeidelbergCement AG | 1,352 | 98,243 | ||||||
Henkel AG & Co. KGaA | 931 | 87,507 | ||||||
Henkel AG & Co. KGaA, PFC Shares | 1,492 | 154,124 | ||||||
Hochtief AG | 211 | 26,864 | ||||||
Infineon Technologies AG | 10,311 | 232,970 | ||||||
KION Group AG | 671 | 46,143 | ||||||
Knorr-Bremse AG | 433 | 44,017 | ||||||
Lanxess AG | 810 | 54,386 | ||||||
Merck KGaA | 1,141 | 134,517 | ||||||
METRO AG | 1,662 | 26,744 | ||||||
MTU Aero Engines AG | 460 | 131,066 | ||||||
Muenchener Rueckversicherungs-Gesellschaft AG | 1,188 | 350,570 | ||||||
Porsche Automobil Holding SE, PFC Shares | 1,254 | 93,045 | ||||||
Puma SE | 560 | 42,942 | ||||||
RWE AG | 4,542 | 139,176 | ||||||
SAP SE | 8,521 | 1,146,911 | ||||||
Sartorius AG, PFC Shares | 314 | 67,121 | ||||||
Siemens AG | 6,547 | 854,983 | ||||||
Siemens Healthineers AG(4) | 983 | 47,122 | ||||||
Symrise AG | 1,151 | 120,980 | ||||||
Telefonica Deutschland Holding AG | 7,582 | 21,995 | ||||||
ThyssenKrupp AG | 3,750 | 50,389 | ||||||
TUI AG | 4,204 | 53,056 | ||||||
Uniper SE | 1,361 | 44,983 | ||||||
United Internet AG | 1,054 | 34,518 | ||||||
Volkswagen AG | 330 | 63,916 | ||||||
Volkswagen AG, PFC Shares | 1,662 | 327,145 | ||||||
Vonovia SE | 4,410 | 236,858 | ||||||
Wirecard AG | 1,088 | 130,309 | ||||||
Zalando SE(2)(4) | 881 | 44,429 | ||||||
| $ | 11,031,571 | |||||||
| Hong Kong — 3.5% | ||||||||
AIA Group, Ltd. | 103,766 | $ | 1,091,407 | |||||
ASM Pacific Technology, Ltd. | 2,174 | 30,176 | ||||||
| 9 | See Notes to Financial Statements. |
Table of Contents
Calvert
VP EAFE International Index Portfolio
December 31, 2019
Schedule of Investments — continued
| Security | Shares | Value | ||||||
| Hong Kong (continued) | ||||||||
Bank of East Asia, Ltd. (The) | 7,110 | $ | 15,874 | |||||
BeiGene, Ltd. ADR(2) | 376 | 62,326 | ||||||
BOC Hong Kong Holdings, Ltd. | 33,956 | 117,876 | ||||||
Budweiser Brewing Co. APAC, Ltd. (2)(4) | 6,000 | 20,259 | ||||||
CK Asset Holdings, Ltd. | 23,066 | 166,449 | ||||||
CK Hutchison Holdings, Ltd. | 24,347 | 232,160 | ||||||
CK Infrastructure Holdings, Ltd. | 4,104 | 29,207 | ||||||
CLP Holdings, Ltd. | 14,122 | 148,244 | ||||||
Dairy Farm International Holdings, Ltd. | 3,000 | 17,130 | ||||||
Galaxy Entertainment Group, Ltd. | 17,913 | 131,869 | ||||||
Hang Lung Properties, Ltd. | 13,000 | 28,545 | ||||||
Hang Seng Bank, Ltd. | 6,440 | 133,115 | ||||||
Henderson Land Development Co., Ltd. | 14,806 | 72,654 | ||||||
HK Electric Investments & HK Electric Investments, Ltd. | 27,027 | 26,638 | ||||||
HKT Trust and HKT, Ltd. | 27,020 | 38,079 | ||||||
Hong Kong & China Gas Co., Ltd. | 94,325 | 184,299 | ||||||
Hong Kong Exchanges and Clearing, Ltd. | 10,306 | 334,818 | ||||||
Hongkong Land Holdings, Ltd. | 9,294 | 53,460 | ||||||
Jardine Matheson Holdings, Ltd. | 2,019 | 112,353 | ||||||
Jardine Strategic Holdings, Ltd. | 2,100 | 64,403 | ||||||
Kerry Properties, Ltd. | 6,621 | 21,029 | ||||||
Link REIT | 18,689 | 197,991 | ||||||
Melco Resorts & Entertainment, Ltd. | 1,940 | 46,890 | ||||||
MTR Corp., Ltd. | 11,981 | 70,802 | ||||||
New World Development Co., Ltd. | 57,431 | 78,723 | ||||||
NWS Holdings, Ltd. | 15,628 | 21,904 | ||||||
PCCW, Ltd. | 42,738 | 25,288 | ||||||
Power Assets Holdings, Ltd. | 11,042 | 80,779 | ||||||
Sands China, Ltd. | 19,483 | 104,099 | ||||||
Sino Land Co., Ltd. | 31,433 | 45,625 | ||||||
SJM Holdings, Ltd. | 21,000 | 23,912 | ||||||
Sun Hung Kai Properties, Ltd. | 14,152 | 216,736 | ||||||
Swire Pacific, Ltd., Class A | 4,537 | 42,147 | ||||||
Swire Properties, Ltd. | 11,929 | 39,519 | ||||||
Techtronic Industries Co., Ltd. | 12,025 | 98,144 | ||||||
Vitasoy International Holdings, Ltd. | 8,000 | 29,021 | ||||||
WH Group, Ltd.(4) | 81,549 | 84,319 | ||||||
Wharf Real Estate Investment Co., Ltd. | 11,905 | 72,639 | ||||||
Wheelock & Co., Ltd. | 6,286 | 41,904 | ||||||
Wynn Macau, Ltd. | 15,891 | 39,157 | ||||||
Yue Yuen Industrial Holdings, Ltd. | 7,565 | 22,326 | ||||||
| $ | 4,514,295 | |||||||
| Ireland — 0.9% | ||||||||
AIB Group PLC | 8,000 | $ | 27,948 | |||||
Bank of Ireland Group PLC | 7,679 | 42,262 | ||||||
| Security | Shares | Value | ||||||
| Ireland (continued) | ||||||||
CRH PLC | 6,804 | $ | 272,901 | |||||
DCC PLC | 788 | 68,350 | ||||||
Experian PLC | 7,613 | 258,077 | ||||||
Flutter Entertainment PLC | 443 | 53,990 | ||||||
James Hardie Industries PLC CDI | 3,691 | 72,139 | ||||||
Kerry Group plc, Class A | 1,467 | 183,053 | ||||||
Kingspan Group PLC | 1,458 | 89,277 | ||||||
Smurfit Kappa Group PLC | 1,686 | 65,007 | ||||||
| $ | 1,133,004 | |||||||
| Israel — 0.5% | ||||||||
Azrieli Group, Ltd. | 315 | $ | 23,075 | |||||
Bank Hapoalim B.M. | 10,950 | 90,937 | ||||||
Bank LeumiLe-Israel B.M. | 13,251 | 96,639 | ||||||
Check Point Software Technologies, Ltd.(2) | 1,150 | 127,604 | ||||||
CyberArk Software, Ltd.(2) | 218 | 25,414 | ||||||
Elbit Systems, Ltd. | 141 | 21,970 | ||||||
Israel Chemicals, Ltd. | 5,940 | 28,052 | ||||||
Israel Discount Bank Ltd., Class A | 9,880 | 45,885 | ||||||
Mizrahi Tefahot Bank, Ltd. | 860 | 22,940 | ||||||
Nice, Ltd.(2) | 513 | 79,545 | ||||||
Teva Pharmaceutical Industries, Ltd.(1)(2) | 9,908 | 97,098 | ||||||
Wix.com, Ltd.(2) | 425 | 52,012 | ||||||
| $ | 711,171 | |||||||
| Italy — 2.1% | ||||||||
Assicurazioni Generali SpA | 9,589 | $ | 197,963 | |||||
Atlantia SpA | 4,209 | 98,233 | ||||||
Davide Campari-Milano SpA | 5,508 | 50,328 | ||||||
Enel SpA | 72,788 | 578,215 | ||||||
Eni SpA | 21,945 | 340,833 | ||||||
Ferrari NV | 978 | 162,383 | ||||||
FinecoBank Banca Fineco SpA | 4,632 | 55,565 | ||||||
Intesa Sanpaolo SpA | 130,530 | 343,841 | ||||||
Leonardo SpA | 3,780 | 44,329 | ||||||
Mediobanca Banca di Credito Finanziario SpA | 4,282 | 47,147 | ||||||
Moncler SpA | 1,356 | 61,030 | ||||||
Pirelli & C SpA(4) | 2,992 | 17,269 | ||||||
Poste Italiane SpA(4) | 5,326 | 60,519 | ||||||
Prysmian SpA | 1,988 | 47,989 | ||||||
Recordati SpA | 751 | 31,658 | ||||||
Snam SpA | 16,457 | 86,528 | ||||||
Telecom Italia SpA(2) | 60,818 | 37,981 | ||||||
Telecom Italia SpA, PFC Shares(2) | 61,458 | 37,638 | ||||||
Tenaris SA | 4,814 | 54,542 | ||||||
| 10 | See Notes to Financial Statements. |
Table of Contents
Calvert
VP EAFE International Index Portfolio
December 31, 2019
Schedule of Investments — continued
| Security | Shares | Value | ||||||
| Italy (continued) | ||||||||
Terna Rete Elettrica Nazionale SpA | 12,851 | $ | 85,946 | |||||
UniCredit SpA | 16,810 | 245,711 | ||||||
| $ | 2,685,648 | |||||||
| Japan — 24.3% | ||||||||
ABC-Mart, Inc. | 336 | $ | 22,936 | |||||
Acom Co., Ltd. | 4,068 | 18,457 | ||||||
Advantest Corp. | 1,500 | 84,597 | ||||||
AEON Co. Ltd. | 5,948 | 122,745 | ||||||
AEON Financial Service Co., Ltd.(1) | 1,135 | 17,884 | ||||||
Aeon Mall Co., Ltd.(1) | 1,161 | 20,593 | ||||||
AGC, Inc. | 1,656 | 59,215 | ||||||
Air Water, Inc. | 1,519 | 22,165 | ||||||
Aisin Seiki Co., Ltd. | 1,652 | 61,190 | ||||||
Ajinomoto Co., Inc. | 2,599 | 43,266 | ||||||
Alfresa Holdings Corp. | 1,916 | 38,924 | ||||||
Alps Alpine Co., Ltd. | 1,919 | 43,560 | ||||||
Amada Holdings Co., Ltd. | 2,469 | 28,082 | ||||||
ANA Holdings, Inc. | 883 | 29,478 | ||||||
Aozora Bank, Ltd. | 906 | 23,935 | ||||||
Asahi Group Holdings, Ltd. | 3,315 | 151,232 | ||||||
Asahi Intecc Co., Ltd.(1) | 1,600 | 46,850 | ||||||
Asahi Kasei Corp. | 11,670 | 131,035 | ||||||
Astellas Pharma, Inc. | 15,601 | 266,309 | ||||||
Bandai Namco Holdings, Inc. | 1,737 | 105,666 | ||||||
Bank of Kyoto, Ltd. (The) | 618 | 26,352 | ||||||
Benesse Holdings, Inc. | 678 | 17,821 | ||||||
Bridgestone Corp. | 5,084 | 188,871 | ||||||
Brother Industries, Ltd. | 1,905 | 39,344 | ||||||
Calbee, Inc. | 818 | 26,652 | ||||||
Canon, Inc.(1) | 9,000 | 246,316 | ||||||
Casio Computer Co., Ltd. | 1,531 | 30,595 | ||||||
Central Japan Railway Co. | 1,259 | 253,146 | ||||||
Chiba Bank, Ltd. (The) | 5,241 | 30,135 | ||||||
Chubu Electric Power Co., Inc. | 5,569 | 78,723 | ||||||
Chugai Pharmaceutical Co., Ltd. | 1,982 | 182,533 | ||||||
Chugoku Electric Power Co., Inc. (The) | 2,837 | 37,293 | ||||||
Coca-Cola Bottlers Japan Holdings, Inc.(1) | 1,200 | 30,660 | ||||||
Concordia Financial Group, Ltd. | 9,831 | 40,373 | ||||||
Credit Saison Co., Ltd.(1) | 1,512 | 26,224 | ||||||
CyberAgent, Inc.(1) | 600 | 20,901 | ||||||
Dai Nippon Printing Co., Ltd. | 2,105 | 56,935 | ||||||
Dai-ichi Life Holdings, Inc. | 9,813 | 161,721 | ||||||
Daicel Corp. | 2,854 | 27,285 | ||||||
Daifuku Co., Ltd.(1) | 900 | 54,391 | ||||||
Daiichi Sankyo Co., Ltd. | 4,800 | 317,012 | ||||||
| Security | Shares | Value | ||||||
| Japan (continued) | ||||||||
Daikin Industries, Ltd. | 2,058 | $ | 290,363 | |||||
Daito Trust Construction Co., Ltd. | 616 | 76,123 | ||||||
Daiwa House Industry Co., Ltd. | 5,132 | 158,871 | ||||||
Daiwa House REIT Investment Corp. | 11 | 28,763 | ||||||
Daiwa Securities Group, Inc. | 14,525 | 73,328 | ||||||
Denso Corp. | 3,934 | 177,669 | ||||||
Dentsu, Inc.(1) | 1,905 | 65,638 | ||||||
Disco Corp.(1) | 200 | 46,965 | ||||||
East Japan Railway Co. | 2,650 | 239,194 | ||||||
Eisai Co., Ltd. | 2,251 | 168,433 | ||||||
Electric Power Development Co., Ltd. | 1,493 | 36,239 | ||||||
FamilyMart Co., Ltd.(1) | 2,532 | 60,641 | ||||||
FANUC Corp. | 1,662 | 306,913 | ||||||
Fast Retailing Co., Ltd. | 536 | 318,424 | ||||||
Fuji Electric Co., Ltd. | 1,141 | 34,660 | ||||||
FUJIFILM Holdings Corp. | 3,027 | 144,557 | ||||||
Fujitsu, Ltd. | 1,652 | 155,380 | ||||||
Fukuoka Financial Group, Inc. | 1,577 | 30,130 | ||||||
GMO Payment Gateway, Inc.(1) | 400 | 27,393 | ||||||
Hakuhodo DY Holdings, Inc. | 2,178 | 35,046 | ||||||
Hamamatsu Photonics K.K. | 1,351 | 55,365 | ||||||
Hankyu Hanshin Holdings, Inc. | 2,062 | 88,203 | ||||||
Hikari Tsushin, Inc. | 219 | 55,034 | ||||||
Hino Motors, Ltd. | 2,636 | 27,877 | ||||||
Hirose Electric Co., Ltd.(1) | 142 | 18,152 | ||||||
Hisamitsu Pharmaceutical Co., Inc.(1) | 630 | 30,682 | ||||||
Hitachi Chemical Co., Ltd. | 1,062 | 44,493 | ||||||
Hitachi Construction Machinery Co., Ltd.(1) | 1,096 | 32,647 | ||||||
Hitachi High-Technologies Corp. | 702 | 49,715 | ||||||
Hitachi Metals, Ltd. | 2,186 | 32,177 | ||||||
Hitachi, Ltd. | 8,184 | 345,330 | ||||||
Honda Motor Co., Ltd. | 13,901 | 393,420 | ||||||
Hoshizaki Corp. | 316 | 28,175 | ||||||
HOYA Corp. | 3,223 | 307,674 | ||||||
Hulic Co., Ltd.(1) | 3,040 | 36,602 | ||||||
Idemitsu Kosan Co., Ltd. | 1,684 | 46,532 | ||||||
IHI Corp.(1) | 1,298 | 30,374 | ||||||
Iida Group Holdings Co., Ltd. | 1,500 | 26,288 | ||||||
INPEX Corp. | 8,491 | 87,964 | ||||||
Isetan Mitsukoshi Holdings, Ltd. | 3,424 | 30,747 | ||||||
Isuzu Motors, Ltd. | 5,055 | 59,754 | ||||||
ITOCHU Corp. | 11,548 | 267,644 | ||||||
Itochu Techno-Solutions Corp. | 1,000 | 28,162 | ||||||
J. Front Retailing Co., Ltd. | 2,460 | 34,310 | ||||||
Japan Airlines Co., Ltd. | 820 | 25,531 | ||||||
Japan Airport Terminal Co., Ltd.(1) | 400 | 22,194 | ||||||
| 11 | See Notes to Financial Statements. |
Table of Contents
Calvert
VP EAFE International Index Portfolio
December 31, 2019
Schedule of Investments — continued
| Security | Shares | Value | ||||||
| Japan (continued) | ||||||||
Japan Exchange Group, Inc. | 4,518 | $ | 79,540 | |||||
Japan Post Bank Co., Ltd. | 2,400 | 23,027 | ||||||
Japan Post Holdings Co., Ltd. | 11,100 | 104,390 | ||||||
Japan Post Insurance Co., Ltd. | 1,500 | 25,570 | ||||||
Japan Prime Realty Investment Corp. | 8 | 35,175 | ||||||
Japan Real Estate Investment Corp. | 10 | 66,365 | ||||||
Japan Retail Fund Investment Corp. | 20 | 43,038 | ||||||
Japan Tobacco, Inc. | 9,934 | 221,494 | ||||||
JFE Holdings, Inc.(1) | 2,625 | 33,683 | ||||||
JGC Holdings Corp.(1) | 2,113 | 33,631 | ||||||
JSR Corp. | 1,959 | 35,835 | ||||||
JTEKT Corp. | 2,275 | 26,875 | ||||||
JXTG Holdings, Inc. | 26,738 | 121,352 | ||||||
Kajima Corp. | 3,581 | 47,610 | ||||||
Kakaku.com, Inc. | 1,455 | 37,151 | ||||||
Kamigumi Co., Ltd. | 1,188 | 26,114 | ||||||
Kansai Electric Power Co., Inc. (The)(1) | 6,078 | 70,412 | ||||||
Kansai Paint Co., Ltd. | 1,523 | 37,206 | ||||||
Kao Corp. | 4,201 | 346,478 | ||||||
Kawasaki Heavy Industries, Ltd. | 1,447 | 31,627 | ||||||
KDDI Corp. | 15,067 | 449,544 | ||||||
Keihan Holdings Co., Ltd. | 838 | 40,690 | ||||||
Keikyu Corp. | 2,389 | 46,057 | ||||||
Keio Corp. | 979 | 59,239 | ||||||
Keisei Electric Railway Co., Ltd. | 1,406 | 54,482 | ||||||
Keyence Corp. | 1,660 | 582,890 | ||||||
Kikkoman Corp.(1) | 1,101 | 53,899 | ||||||
Kintetsu Group Holdings Co., Ltd. | 1,546 | 83,855 | ||||||
Kirin Holdings Co., Ltd. | 7,326 | 159,901 | ||||||
Kobayashi Pharmaceutical Co., Ltd. | 400 | 33,880 | ||||||
Koito Manufacturing Co., Ltd. | 947 | 43,852 | ||||||
Komatsu, Ltd. | 8,246 | 197,916 | ||||||
Konami Holdings Corp. | 951 | 39,079 | ||||||
Konica Minolta, Inc. | 4,612 | 30,043 | ||||||
Kose Corp. | 308 | 44,895 | ||||||
Kubota Corp. | 9,011 | 141,502 | ||||||
Kuraray Co., Ltd.(1) | 2,718 | 32,936 | ||||||
Kurita Water Industries, Ltd. | 1,032 | 30,625 | ||||||
Kyocera Corp. | 2,948 | 200,923 | ||||||
Kyowa Kirin Co., Ltd. | 2,644 | 62,294 | ||||||
Kyushu Electric Power Co., Inc. | 3,051 | 26,470 | ||||||
Kyushu Railway Co. | 1,700 | 56,912 | ||||||
Lawson, Inc. | 500 | 28,381 | ||||||
LINE Corp.(1)(2) | 439 | 21,569 | ||||||
Lion Corp.(1) | 1,722 | 33,473 | ||||||
LIXIL Group Corp. | 2,113 | 36,464 | ||||||
| Security | Shares | Value | ||||||
| Japan (continued) | ||||||||
M3, Inc. | 3,958 | $ | 119,356 | |||||
Makita Corp. | 1,948 | 67,274 | ||||||
Marubeni Corp. | 14,833 | 109,592 | ||||||
Marui Group Co., Ltd. | 1,130 | 27,552 | ||||||
Maruichi Steel Tube, Ltd. | 575 | 16,159 | ||||||
Mazda Motor Corp. | 4,510 | 38,432 | ||||||
McDonald’s Holdings Co. (Japan), Ltd.(1) | 677 | 32,617 | ||||||
Mebuki Financial Group, Inc. | 9,500 | 24,221 | ||||||
Medipal Holdings Corp. | 1,745 | 38,513 | ||||||
MEIJI Holdings Co., Ltd. | 967 | 65,350 | ||||||
Mercari, Inc.(2) | 1,000 | 20,444 | ||||||
MINEBEA MITSUMI, Inc. | 3,459 | 71,450 | ||||||
MISUMI Group, Inc. | 2,280 | 56,430 | ||||||
Mitsubishi Chemical Holdings Corp. | 11,222 | 83,617 | ||||||
Mitsubishi Corp. | 11,890 | 314,982 | ||||||
Mitsubishi Electric Corp. | 14,860 | 202,329 | ||||||
Mitsubishi Estate Co., Ltd. | 10,768 | 206,044 | ||||||
Mitsubishi Gas Chemical Co., Inc. | 1,148 | 17,489 | ||||||
Mitsubishi Heavy Industries, Ltd. | 2,944 | 114,159 | ||||||
Mitsubishi Materials Corp. | 1,000 | 27,140 | ||||||
Mitsubishi Motors Corp.(1) | 3,200 | 13,338 | ||||||
Mitsubishi Tanabe Pharma Corp. | 1,789 | 32,819 | ||||||
Mitsubishi UFJ Financial Group, Inc. | 106,276 | 574,564 | ||||||
Mitsubishi UFJ Lease & Finance Co., Ltd. | 4,566 | 29,394 | ||||||
Mitsui & Co., Ltd. | 13,675 | 243,080 | ||||||
Mitsui Chemicals, Inc. | 1,475 | 35,930 | ||||||
Mitsui Fudosan Co., Ltd. | 7,831 | 191,389 | ||||||
Mitsui OSK Lines, Ltd. | 1,100 | 30,250 | ||||||
Mizuho Financial Group, Inc. | 208,814 | 321,661 | ||||||
MonotaRO Co., Ltd.(1) | 600 | 15,973 | ||||||
MS&AD Insurance Group Holdings, Inc. | 4,228 | 139,561 | ||||||
Murata Manufacturing Co., Ltd. | 4,914 | 302,450 | ||||||
Nabtesco Corp.(1) | 1,148 | 33,828 | ||||||
Nagoya Railroad Co., Ltd.(1) | 1,275 | 39,592 | ||||||
NEC Corp. | 1,755 | 72,630 | ||||||
Nexon Co., Ltd.(2) | 3,550 | 47,092 | ||||||
NGK Insulators, Ltd. | 1,971 | 34,288 | ||||||
NGK Spark Plug Co., Ltd. | 1,223 | 23,707 | ||||||
NH Foods, Ltd. | 883 | 36,577 | ||||||
Nidec Corp. | 2,014 | 275,080 | ||||||
Nikon Corp. | 2,874 | 35,148 | ||||||
Nintendo Co., Ltd. | 921 | 368,363 | ||||||
Nippon Building Fund, Inc. | 12 | 87,963 | ||||||
Nippon Express Co., Ltd. | 576 | 33,765 | ||||||
Nippon Paint Holdings Co., Ltd. | 958 | 49,319 | ||||||
Nippon Prologis REIT, Inc. | 18 | 45,844 | ||||||
| 12 | See Notes to Financial Statements. |
Table of Contents
Calvert
VP EAFE International Index Portfolio
December 31, 2019
Schedule of Investments — continued
| Security | Shares | Value | ||||||
| Japan (continued) | ||||||||
Nippon Shinyaku Co., Ltd. | 300 | $ | 25,978 | |||||
Nippon Steel Corp. | 5,375 | 81,017 | ||||||
Nippon Telegraph & Telephone Corp. | 10,804 | 273,057 | ||||||
Nippon Yusen KK | 1,300 | 23,431 | ||||||
Nissan Chemical Corp. | 647 | 27,095 | ||||||
Nissan Motor Co., Ltd. | 20,743 | 120,200 | ||||||
Nisshin Seifun Group, Inc. | 1,417 | 24,723 | ||||||
Nissin Foods Holdings Co., Ltd. | 498 | 36,988 | ||||||
Nitori Holdings Co., Ltd. | 716 | 113,021 | ||||||
Nitto Denko Corp. | 1,470 | 82,655 | ||||||
Nomura Holdings, Inc. | 26,657 | 137,171 | ||||||
Nomura Real Estate Holdings, Inc. | 1,270 | 30,461 | ||||||
Nomura Real Estate Master Fund, Inc. | 29 | 49,605 | ||||||
Nomura Research Institute, Ltd. | 3,000 | 64,158 | ||||||
NSK, Ltd. | 3,396 | 32,103 | ||||||
NTT Data Corp. | 5,530 | 73,958 | ||||||
NTT DoCoMo, Inc. | 11,724 | 326,585 | ||||||
Obayashi Corp. | 5,320 | 59,087 | ||||||
Obic Co., Ltd. | 660 | 88,903 | ||||||
Odakyu Electric Railway Co., Ltd. | 2,305 | 53,773 | ||||||
Oji Holdings Corp. | 8,273 | 44,740 | ||||||
Olympus Corp. | 10,276 | 158,381 | ||||||
Omron Corp. | 1,663 | 96,933 | ||||||
Ono Pharmaceutical Co., Ltd. | 3,505 | 80,020 | ||||||
Oracle Corp. Japan | 389 | 35,305 | ||||||
Oriental Land Co., Ltd. | 1,624 | 221,581 | ||||||
ORIX Corp. | 12,002 | 198,889 | ||||||
Orix JREIT, Inc. | 17 | 36,848 | ||||||
Osaka Gas Co., Ltd. | 3,123 | 59,722 | ||||||
Otsuka Corp. | 1,064 | 42,491 | ||||||
Otsuka Holdings Co., Ltd. | 3,552 | 158,328 | ||||||
Pan Pacific International Holdings Corp. | 3,636 | 60,326 | ||||||
Panasonic Corp. | 19,947 | 187,086 | ||||||
Park24 Co., Ltd. | 1,041 | 25,490 | ||||||
PeptiDream, Inc.(2) | 1,000 | 51,103 | ||||||
Persol Holdings Co., Ltd. | 1,200 | 22,489 | ||||||
Pigeon Corp.(1) | 900 | 32,955 | ||||||
Pola Orbis Holdings, Inc.(1) | 932 | 22,199 | ||||||
Rakuten, Inc.(1) | 8,000 | 68,345 | ||||||
Recruit Holdings Co., Ltd. | 11,857 | 444,108 | ||||||
Renesas Electronics Corp.(2) | 5,000 | 34,160 | ||||||
Resona Holdings, Inc. | 19,311 | 84,168 | ||||||
Ricoh Co., Ltd. | 5,835 | 63,494 | ||||||
Rinnai Corp. | 346 | 27,040 | ||||||
Rohm Co., Ltd. | 907 | 72,369 | ||||||
Ryohin Keikaku Co., Ltd. | 2,430 | 56,634 | ||||||
| Security | Shares | Value | ||||||
| Japan (continued) | ||||||||
Sankyo Co., Ltd. | 600 | $ | 19,928 | |||||
Santen Pharmaceutical Co., Ltd. | 2,900 | 55,225 | ||||||
SBI Holdings, Inc. | 1,575 | 33,252 | ||||||
SECOM Co., Ltd. | 1,748 | 155,996 | ||||||
Sega Sammy Holdings, Inc. | 1,500 | 21,719 | ||||||
Seibu Holdings, Inc. | 1,400 | 23,030 | ||||||
Seiko Epson Corp. | 2,252 | 34,003 | ||||||
Sekisui Chemical Co., Ltd. | 3,264 | 56,630 | ||||||
Sekisui House, Ltd. | 4,450 | 95,029 | ||||||
Seven & i Holdings Co., Ltd. | 6,226 | 228,217 | ||||||
Seven Bank, Ltd. | 6,071 | 19,889 | ||||||
SG Holdings Co., Ltd. | 1,400 | 31,536 | ||||||
Sharp Corp. | 1,524 | 23,291 | ||||||
Shimadzu Corp. | 2,014 | 62,984 | ||||||
Shimamura Co., Ltd. | 225 | 17,105 | ||||||
Shimano, Inc. | 650 | 105,450 | ||||||
Shimizu Corp. | 5,627 | 57,321 | ||||||
Shin-Etsu Chemical Co., Ltd. | 3,085 | 339,267 | ||||||
Shinsei Bank, Ltd. | 1,822 | 27,799 | ||||||
Shionogi & Co., Ltd. | 2,421 | 149,767 | ||||||
Shiseido Co., Ltd.(1) | 3,374 | 239,588 | ||||||
Shizuoka Bank, Ltd. (The) | 3,925 | 29,195 | ||||||
Showa Denko KK(1) | 1,300 | 34,262 | ||||||
SMC Corp. | 479 | 219,054 | ||||||
SoftBank Corp. | 15,200 | 203,827 | ||||||
SoftBank Group Corp. | 13,484 | 585,435 | ||||||
Sohgo Security Services Co., Ltd. | 728 | 39,403 | ||||||
Sompo Holdings, Inc. | 2,899 | 113,843 | ||||||
Sony Corp. | 10,980 | 745,516 | ||||||
Sony Financial Holdings, Inc. | 574 | 13,779 | ||||||
Square Enix Holdings Co., Ltd. | 700 | 34,856 | ||||||
Stanley Electric Co., Ltd. | 1,134 | 32,751 | ||||||
Subaru Corp. | 5,128 | 127,020 | ||||||
Sumco Corp.(1) | 1,600 | 26,510 | ||||||
Sumitomo Chemical Co., Ltd. | 13,034 | 59,182 | ||||||
Sumitomo Corp. | 10,225 | 151,875 | ||||||
Sumitomo Dainippon Pharma Co., Ltd.(1) | 1,622 | 31,426 | ||||||
Sumitomo Electric Industries, Ltd. | 6,690 | 100,471 | ||||||
Sumitomo Heavy Industries, Ltd. | 1,127 | 32,012 | ||||||
Sumitomo Metal Mining Co., Ltd. | 2,120 | 68,264 | ||||||
Sumitomo Mitsui Financial Group, Inc. | 11,497 | 424,646 | ||||||
Sumitomo Mitsui Trust Holdings, Inc. | 2,582 | 102,069 | ||||||
Sumitomo Realty & Development Co., Ltd. | 3,168 | 110,530 | ||||||
Sumitomo Rubber Industries, Ltd.(1) | 1,700 | 20,729 | ||||||
Sundrug Co., Ltd. | 700 | 25,327 | ||||||
Suntory Beverage & Food, Ltd. | 1,117 | 46,633 | ||||||
| 13 | See Notes to Financial Statements. |
Table of Contents
Calvert
VP EAFE International Index Portfolio
December 31, 2019
Schedule of Investments — continued
| Security | Shares | Value | ||||||
| Japan (continued) | ||||||||
Suzuken Co., Ltd. | 500 | $ | 20,379 | |||||
Suzuki Motor Corp. | 2,978 | 124,307 | ||||||
Sysmex Corp. | 1,393 | 94,842 | ||||||
T&D Holdings, Inc. | 5,006 | 63,304 | ||||||
Taiheiyo Cement Corp. | 1,231 | 36,134 | ||||||
Taisei Corp. | 1,849 | 76,587 | ||||||
Taisho Pharmaceutical Holdings Co., Ltd. | 167 | 12,324 | ||||||
Taiyo Nippon Sanso Corp. | 1,324 | 29,305 | ||||||
Takeda Pharmaceutical Co., Ltd. | 13,024 | 515,128 | ||||||
TDK Corp. | 1,055 | 118,560 | ||||||
TEIJIN, Ltd. | 1,307 | 24,418 | ||||||
Terumo Corp. | 5,318 | 188,652 | ||||||
THK Co., Ltd. | 1,228 | 32,970 | ||||||
Tobu Railway Co., Ltd. | 1,273 | 46,084 | ||||||
Toho Co., Ltd. | 1,156 | 48,173 | ||||||
Toho Gas Co., Ltd. | 772 | 31,522 | ||||||
Tohoku Electric Power Co., Inc. | 3,514 | 34,836 | ||||||
Tokio Marine Holdings, Inc. | 5,600 | 313,537 | ||||||
Tokyo Century Corp. | 500 | 26,622 | ||||||
Tokyo Electric Power Co. Holdings, Inc.(2) | 11,600 | 49,654 | ||||||
Tokyo Electron, Ltd. | 1,379 | 301,077 | ||||||
Tokyo Gas Co., Ltd. | 3,362 | 81,693 | ||||||
Tokyu Corp. | 4,384 | 81,072 | ||||||
Tokyu Fudosan Holdings Corp. | 5,227 | 36,094 | ||||||
Toppan Printing Co., Ltd. | 2,674 | 55,240 | ||||||
Toray Industries, Inc. | 11,862 | 80,371 | ||||||
Toshiba Corp. | 4,074 | 138,279 | ||||||
Tosoh Corp. | 1,600 | 24,649 | ||||||
TOTO, Ltd. | 1,143 | 48,266 | ||||||
Toyo Seikan Group Holdings, Ltd. | 1,665 | 28,662 | ||||||
Toyo Suisan Kaisha, Ltd. | 904 | 38,389 | ||||||
Toyoda Gosei Co., Ltd. | 662 | 16,530 | ||||||
Toyota Industries Corp. | 1,361 | 78,312 | ||||||
Toyota Motor Corp. | 19,630 | 1,383,159 | ||||||
Toyota Tsusho Corp. | 1,765 | 62,000 | ||||||
Trend Micro, Inc. | 1,144 | 58,538 | ||||||
Tsuruha Holdings, Inc. | 372 | 47,764 | ||||||
Unicharm Corp. | 3,314 | 111,905 | ||||||
United Urban Investment Corp. | 22 | 41,317 | ||||||
USS Co., Ltd. | 2,235 | 42,249 | ||||||
Welcia Holdings Co., Ltd. | 300 | 19,059 | ||||||
West Japan Railway Co. | 1,478 | 127,837 | ||||||
Yakult Honsha Co., Ltd. | 896 | 49,381 | ||||||
Yamada Denki Co., Ltd. | 6,405 | 33,985 | ||||||
Yamaha Corp. | 1,409 | 78,120 | ||||||
Yamaha Motor Co., Ltd.(1) | 2,354 | 47,158 | ||||||
| Security | Shares | Value | ||||||
| Japan (continued) | ||||||||
Yamato Holdings Co., Ltd. | 2,964 | $ | 50,535 | |||||
Yamazaki Baking Co., Ltd.(1) | 1,347 | 24,070 | ||||||
Yaskawa Electric Corp.(1) | 2,183 | 82,236 | ||||||
Yokogawa Electric Corp. | 2,328 | 40,882 | ||||||
Yokohama Rubber Co., Ltd. (The) | 1,123 | 21,781 | ||||||
Z Holdings Corp. | 23,517 | 99,291 | ||||||
ZOZO, Inc. | 607 | 11,609 | ||||||
| $ | 31,329,939 | |||||||
| Netherlands — 6.5% | ||||||||
ABN AMRO Bank NV(4) | 3,966 | $ | 72,286 | |||||
Adyen NV(1)(2)(4) | 94 | 77,324 | ||||||
Aegon NV | 16,563 | 75,819 | ||||||
AerCap Holdings NV(2) | 863 | 53,049 | ||||||
Airbus SE | 4,998 | 733,532 | ||||||
Akzo Nobel NV | 2,042 | 208,537 | ||||||
Altice Europe NV(2) | 5,630 | 36,457 | ||||||
ASML Holding NV | 3,712 | 1,098,961 | ||||||
CNH Industrial NV | 9,151 | 100,477 | ||||||
EXOR NV | 898 | 69,623 | ||||||
Fiat Chrysler Automobiles NV | 9,199 | 136,389 | ||||||
Heineken Holding NV | 1,027 | 99,817 | ||||||
Heineken NV | 2,121 | 226,370 | ||||||
ING Groep NV | 33,790 | 406,237 | ||||||
Koninklijke Ahold Delhaize NV | 10,626 | 266,419 | ||||||
Koninklijke DSM NV | 1,668 | 218,084 | ||||||
Koninklijke KPN NV(1) | 27,289 | 80,758 | ||||||
Koninklijke Philips NV | 7,848 | 383,639 | ||||||
Koninklijke Vopak NV | 716 | 38,908 | ||||||
NN Group NV | 2,795 | 106,274 | ||||||
NXP Semiconductors NV | 2,468 | 314,078 | ||||||
Prosus NV(2) | 3,800 | 284,398 | ||||||
QIAGEN NV(2) | 2,172 | 74,007 | ||||||
Randstad NV | 975 | 59,743 | ||||||
Royal Dutch Shell PLC, Class A | 36,841 | 1,091,017 | ||||||
Royal Dutch Shell PLC, Class B | 32,633 | 968,667 | ||||||
STMicroelectronics NV | 5,943 | 160,346 | ||||||
Unilever NV | 12,905 | 740,627 | ||||||
Wolters Kluwer NV | 2,422 | 176,843 | ||||||
| $ | 8,358,686 | |||||||
| New Zealand — 0.3% | ||||||||
a2 Milk Co., Ltd.(1)(2) | 6,592 | $ | 66,746 | |||||
Auckland International Airport, Ltd. | 7,512 | 44,279 | ||||||
Fisher & Paykel Healthcare Corp., Ltd. | 5,320 | 79,619 | ||||||
| 14 | See Notes to Financial Statements. |
Table of Contents
Calvert
VP EAFE International Index Portfolio
December 31, 2019
Schedule of Investments — continued
| Security | Shares | Value | ||||||
| New Zealand (continued) | ||||||||
Fletcher Building, Ltd. | 7,060 | $ | 24,199 | |||||
Mercury NZ, Ltd. | 8,000 | 27,213 | ||||||
Meridian Energy, Ltd. | 13,065 | 44,010 | ||||||
Ryman Healthcare, Ltd. | 3,823 | 42,017 | ||||||
Spark New Zealand, Ltd. | 18,656 | 54,401 | ||||||
| $ | 382,484 | |||||||
| Norway — 0.6% | ||||||||
Aker BP ASA | 1,331 | $ | 43,684 | |||||
DNB ASA | 8,213 | 153,689 | ||||||
Equinor ASA | 8,130 | 162,131 | ||||||
Gjensidige Forsikring ASA | 2,039 | 42,800 | ||||||
Mowi ASA(1) | 3,437 | 89,365 | ||||||
Norsk Hydro ASA | 12,075 | 44,902 | ||||||
Orkla ASA | 6,708 | 68,025 | ||||||
Schibsted ASA, Class B | 908 | 25,948 | ||||||
Telenor ASA | 5,788 | 103,754 | ||||||
Yara International ASA | 1,585 | 66,037 | ||||||
| $ | 800,335 | |||||||
| Portugal — 0.2% | ||||||||
EDP-Energias de Portugal SA | 23,611 | 102,458 | ||||||
Galp Energia SGPS SA, Class B | 5,073 | 85,166 | ||||||
Jeronimo Martins SGPS SA | 1,795 | 29,580 | ||||||
| $ | 217,204 | |||||||
| Singapore — 1.3% | ||||||||
Ascendas Real Estate Investment Trust | 19,131 | $ | 42,267 | |||||
CapitaLand Commercial Trust, Ltd. | 21,099 | 31,248 | ||||||
CapitaLand Mall Trust | 25,281 | 46,279 | ||||||
CapitaLand, Ltd. | 17,948 | 50,084 | ||||||
City Developments, Ltd. | 4,171 | 33,947 | ||||||
ComfortDelGro Corp., Ltd. | 21,978 | 38,888 | ||||||
DBS Group Holdings, Ltd. | 16,148 | 311,354 | ||||||
Genting Singapore, Ltd. | 48,954 | 33,523 | ||||||
Jardine Cycle & Carriage, Ltd. | 1,007 | 22,519 | ||||||
Keppel Corp., Ltd. | 9,728 | 49,015 | ||||||
Mapletree Commercial Trust | 19,300 | 34,320 | ||||||
Oversea-Chinese Banking Corp., Ltd. | 28,436 | 232,622 | ||||||
SATS, Ltd. | 6,826 | 25,694 | ||||||
Sembcorp Industries, Ltd. | 12,300 | 20,947 | ||||||
Singapore Airlines, Ltd. | 3,300 | 22,187 | ||||||
Singapore Exchange, Ltd. | 5,000 | 32,931 | ||||||
Singapore Press Holdings, Ltd.(1) | 7,319 | 11,856 | ||||||
Singapore Technologies Engineering, Ltd. | 10,618 | 31,096 | ||||||
| Security | Shares | Value | ||||||
| Singapore (continued) | ||||||||
Singapore Telecommunications, Ltd. | 76,291 | $ | 191,270 | |||||
Suntec Real Estate Investment Trust | 24,465 | 33,491 | ||||||
United Overseas Bank, Ltd. | 10,214 | 200,875 | ||||||
UOL Group, Ltd. | 4,870 | 30,141 | ||||||
Venture Corp., Ltd. | 2,000 | 24,128 | ||||||
Wilmar International, Ltd. | 20,300 | 62,193 | ||||||
Yangzijiang Shipbuilding Holdings, Ltd. | 20,000 | 16,671 | ||||||
| $ | 1,629,546 | |||||||
| Spain — 2.8% | ||||||||
ACS Actividades de Construccion y Servicios SA | 2,064 | $ | 82,796 | |||||
Aena SME SA(4) | 615 | 117,906 | ||||||
Amadeus IT Group SA | 3,651 | 299,005 | ||||||
Banco Bilbao Vizcaya Argentaria SA | 59,631 | 334,788 | ||||||
Banco de Sabadell SA | 46,977 | 55,006 | ||||||
Banco Santander SA | 140,688 | 589,869 | ||||||
Bankia SA | 11,742 | 25,141 | ||||||
Bankinter SA | 5,419 | 39,804 | ||||||
CaixaBank SA | 33,360 | 105,053 | ||||||
Cellnex Telecom SA(4) | 1,732 | 74,711 | ||||||
Enagas SA | 2,312 | 59,054 | ||||||
Endesa SA | 3,009 | 80,354 | ||||||
Ferrovial SA | 4,562 | 138,216 | ||||||
Grifols SA(1) | 2,499 | 88,293 | ||||||
Iberdrola SA | 51,699 | 532,787 | ||||||
Industria de Diseno Textil SA | 9,793 | 346,090 | ||||||
Mapfre SA | 10,989 | 29,138 | ||||||
Naturgy Energy Group SA | 2,975 | 74,913 | ||||||
Red Electrica Corp. SA | 4,173 | 84,085 | ||||||
Repsol SA | 13,282 | 208,662 | ||||||
Siemens Gamesa Renewable Energy SA(1) | 1,846 | 32,509 | ||||||
Telefonica SA | 37,483 | 262,122 | ||||||
| $ | 3,660,302 | |||||||
| Sweden — 2.5% | ||||||||
Alfa Laval AB | 2,793 | $ | 70,340 | |||||
Assa Abloy AB, Class B | 8,723 | 203,904 | ||||||
Atlas Copco AB, Class A | 5,827 | 232,589 | ||||||
Atlas Copco AB, Class B | 3,558 | 123,537 | ||||||
Boliden AB | 2,356 | 62,572 | ||||||
Electrolux AB, Series B | 1,958 | 48,134 | ||||||
Epiroc AB, Class A | 5,827 | 71,260 | ||||||
Epiroc AB, Class B | 3,558 | 42,286 | ||||||
Essity AB, Class B | 4,895 | 157,650 | ||||||
Hennes & Mauritz AB, Class B | 7,113 | 145,088 | ||||||
| 15 | See Notes to Financial Statements. |
Table of Contents
Calvert
VP EAFE International Index Portfolio
December 31, 2019
Schedule of Investments — continued
| Security | Shares | Value | ||||||
| Sweden (continued) | ||||||||
Hexagon AB, Class B | 2,400 | $ | 134,523 | |||||
Husqvarna AB, Class B | 4,245 | 34,018 | ||||||
ICA Gruppen AB | 820 | 38,304 | ||||||
Industrivarden AB, Class C | 1,673 | 40,345 | ||||||
Investor AB, Class B | 4,143 | 226,182 | ||||||
Kinnevik AB, Class B | 1,988 | 48,716 | ||||||
L E Lundbergforetagen AB, Class B | 510 | 22,388 | ||||||
Lundin Petroleum AB | 1,724 | 58,537 | ||||||
Millicom International Cellular SA SDR | 674 | 32,368 | ||||||
Sandvik AB | 9,185 | 178,900 | ||||||
Securitas AB, Class B | 3,192 | 54,996 | ||||||
Skandinaviska Enskilda Banken AB, Class A | 12,685 | 119,237 | ||||||
Skanska AB, Class B | 2,734 | 61,847 | ||||||
SKF AB, Class B | 3,325 | 67,319 | ||||||
Svenska Handelsbanken AB, Class A | 12,961 | 139,593 | ||||||
Swedbank AB, Class A | 7,827 | 116,356 | ||||||
Swedish Match AB | 1,590 | 81,912 | ||||||
Tele2 AB, Class B | 3,663 | 53,165 | ||||||
Telefonaktiebolaget LM Ericsson, Class B | 27,017 | 236,069 | ||||||
Telia Co. AB | 25,833 | 110,992 | ||||||
Volvo AB, Class B | 12,539 | 209,918 | ||||||
| $ | 3,223,045 | |||||||
| Switzerland — 9.5% | ||||||||
ABB, Ltd. | 15,488 | $ | 373,619 | |||||
Adecco Group AG | 1,418 | 89,649 | ||||||
Alcon, Inc.(2) | 3,448 | 195,300 | ||||||
Baloise Holding AG | 415 | 75,109 | ||||||
Barry Callebaut AG | 22 | 48,565 | ||||||
Chocoladefabriken Lindt & Sprungli AG | 1 | 88,307 | ||||||
Chocoladefabriken Lindt & Sprungli AG PC | 10 | 77,593 | ||||||
Cie Financiere Richemont SA | 4,675 | 365,355 | ||||||
Clariant AG | 1,110 | 24,807 | ||||||
Coca-Cola HBC AG | 1,844 | 62,678 | ||||||
Credit Suisse Group AG | 20,415 | 275,963 | ||||||
Dufry AG | 383 | 37,979 | ||||||
EMS-Chemie Holding AG | 32 | 21,038 | ||||||
Geberit AG | 344 | 193,081 | ||||||
Givaudan SA | 78 | 244,374 | ||||||
Glencore PLC | 91,138 | 283,778 | ||||||
Julius Baer Group, Ltd. | 2,030 | 104,652 | ||||||
Kuehne & Nagel International AG | 489 | 82,478 | ||||||
LafargeHolcim, Ltd. | 4,164 | 231,008 | ||||||
Lonza Group AG | 693 | 252,811 | ||||||
Nestle SA | 25,802 | 2,793,459 | ||||||
Novartis AG | 18,523 | 1,753,935 | ||||||
| Security | Shares | Value | ||||||
| Switzerland (continued) | ||||||||
Pargesa Holding SA, Bearer Shares | 354 | $ | 29,411 | |||||
Partners Group Holding AG(1) | 156 | 142,978 | ||||||
Roche Holding AG | 6,035 | 1,961,391 | ||||||
Schindler Holding AG | 114 | 27,918 | ||||||
Schindler Holding AG PC | 303 | 77,053 | ||||||
SGS SA | 49 | 134,195 | ||||||
Sika AG | 1,066 | 200,190 | ||||||
Sonova Holding AG | 543 | 124,134 | ||||||
Straumann Holding AG | 95 | 93,189 | ||||||
Swatch Group AG (The) | 505 | 26,714 | ||||||
Swatch Group AG (The), Bearer Shares | 228 | 63,659 | ||||||
Swiss Life Holding AG | 289 | 144,983 | ||||||
Swiss Prime Site AG | 646 | 74,738 | ||||||
Swiss Re AG | 2,565 | 288,158 | ||||||
Swisscom AG | 201 | 106,404 | ||||||
Temenos AG | 579 | 91,592 | ||||||
UBS Group AG | 34,696 | 437,842 | ||||||
Vifor Pharma AG | 390 | 71,177 | ||||||
Zurich Insurance Group AG | 1,299 | 532,849 | ||||||
| $ | 12,304,113 | |||||||
| United Kingdom — 14.3% | ||||||||
3i Group PLC | 8,757 | $ | 127,429 | |||||
Admiral Group PLC | 1,608 | 49,138 | ||||||
Anglo American PLC | 8,630 | 247,922 | ||||||
Antofagasta PLC | 4,020 | 48,673 | ||||||
Ashtead Group PLC | 3,570 | 114,150 | ||||||
Associated British Foods PLC | 3,229 | 111,080 | ||||||
AstraZeneca PLC | 11,420 | 1,143,050 | ||||||
Auto Trader Group PLC (4) | 8,362 | 66,036 | ||||||
AVEVA Group PLC | 442 | 27,268 | ||||||
Aviva PLC | 31,418 | 174,387 | ||||||
BAE Systems PLC | 28,922 | 216,548 | ||||||
Barclays PLC | 148,320 | 353,665 | ||||||
Barratt Developments PLC | 8,797 | 87,103 | ||||||
Berkeley Group Holdings PLC | 1,068 | 68,751 | ||||||
BHP Group PLC | 18,083 | 423,755 | ||||||
BP PLC | 174,910 | 1,100,324 | ||||||
British American Tobacco PLC | 19,976 | 849,021 | ||||||
British Land Co. PLC (The) | 8,346 | 70,671 | ||||||
BT Group PLC | 72,149 | 183,849 | ||||||
Bunzl PLC | 2,897 | 79,235 | ||||||
Burberry Group PLC | 3,124 | 91,207 | ||||||
Carnival PLC | 1,546 | 74,105 | ||||||
Centrica PLC | 49,569 | 58,600 | ||||||
Coca-Cola European Partners PLC(5) | 369 | 18,775 | ||||||
| 16 | See Notes to Financial Statements. |
Table of Contents
Calvert
VP EAFE International Index Portfolio
December 31, 2019
Schedule of Investments — continued
| Security | Shares | Value | ||||||
| United Kingdom (continued) | ||||||||
Coca-Cola European Partners PLC(5) | 1,736 | $ | 86,896 | |||||
Compass Group PLC | 13,326 | 333,973 | ||||||
Croda International PLC | 1,162 | 78,933 | ||||||
Diageo PLC | 20,245 | 853,057 | ||||||
Direct Line Insurance Group PLC | 11,922 | 49,328 | ||||||
easyJet PLC | 1,619 | 30,497 | ||||||
Evraz PLC | 3,425 | 18,340 | ||||||
Ferguson PLC | 1,893 | 172,276 | ||||||
G4S PLC | 12,759 | 36,897 | ||||||
GlaxoSmithKline PLC | 42,589 | 1,000,715 | ||||||
GVC Holdings PLC | 4,677 | 54,840 | ||||||
Halma PLC | 2,850 | 79,808 | ||||||
Hargreaves Lansdown PLC | 2,659 | 68,207 | ||||||
HSBC Holdings PLC | 173,641 | 1,359,337 | ||||||
Imperial Brands PLC | 8,611 | 213,039 | ||||||
Informa PLC | 11,094 | 126,179 | ||||||
InterContinental Hotels Group PLC | 1,531 | 105,202 | ||||||
Intertek Group PLC | 1,422 | 110,188 | ||||||
ITV PLC | 34,182 | 68,391 | ||||||
J Sainsbury PLC | 11,121 | 33,911 | ||||||
JD Sports Fashion PLC | 2,807 | 31,179 | ||||||
Johnson Matthey PLC | 1,639 | 65,169 | ||||||
Kingfisher PLC | 19,212 | 55,306 | ||||||
Land Securities Group PLC | 6,865 | 90,113 | ||||||
Legal & General Group PLC | 49,194 | 197,615 | ||||||
Lloyds Banking Group PLC | 599,101 | 496,308 | ||||||
London Stock Exchange Group PLC | 2,871 | 295,058 | ||||||
M&G PLC(2) | 22,322 | 70,135 | ||||||
Marks & Spencer Group PLC | 6,638 | 18,822 | ||||||
Meggitt PLC | 7,904 | 68,844 | ||||||
Melrose Industries PLC | 36,836 | 117,331 | ||||||
Micro Focus International PLC | 3,164 | 44,409 | ||||||
Mondi PLC | 4,348 | 101,957 | ||||||
National Grid PLC | 28,641 | 357,931 | ||||||
Next PLC | 1,210 | 112,751 | ||||||
NMC Health PLC(1) | 541 | 12,675 | ||||||
Ocado Group PLC(2) | 4,198 | 71,228 | ||||||
Pearson PLC | 7,041 | 59,483 | ||||||
Persimmon PLC | 2,734 | 97,656 | ||||||
Prudential PLC | 22,322 | 427,704 | ||||||
Reckitt Benckiser Group PLC | 6,010 | 488,183 | ||||||
RELX PLC(5) | 9,036 | 228,099 | ||||||
RELX PLC(5) | 7,771 | 196,006 | ||||||
Rentokil Initial PLC | 15,508 | 92,948 | ||||||
Rio Tinto PLC | 10,032 | 593,844 | ||||||
Rolls-Royce Holdings PLC | 15,214 | 137,504 | ||||||
| Security | Shares | Value | ||||||
| United Kingdom (continued) | ||||||||
Royal Bank of Scotland Group PLC | 43,321 | $ | 138,971 | |||||
RSA Insurance Group PLC | 8,671 | 64,987 | ||||||
Sage Group PLC (The) | 9,664 | 95,874 | ||||||
Schroders PLC | 934 | 41,242 | ||||||
Segro PLC | 8,386 | 99,856 | ||||||
Severn Trent PLC | 2,400 | 80,018 | ||||||
Smith & Nephew PLC | 7,814 | 188,323 | ||||||
Smiths Group PLC | 3,491 | 77,972 | ||||||
Spirax-Sarco Engineering PLC | 587 | 69,098 | ||||||
SSE PLC | 9,191 | 175,293 | ||||||
St. James’s Place PLC | 4,702 | 72,480 | ||||||
Standard Chartered PLC | 24,032 | 226,456 | ||||||
Standard Life Aberdeen PLC | 21,252 | 92,459 | ||||||
Taylor Wimpey PLC | 27,593 | 70,750 | ||||||
Tesco PLC | 84,614 | 285,964 | ||||||
Unilever PLC | 9,591 | 549,014 | ||||||
United Utilities Group PLC | 6,144 | 76,885 | ||||||
Vodafone Group PLC | 239,405 | 464,774 | ||||||
Weir Group PLC (The) | 2,420 | 48,400 | ||||||
Whitbread PLC | 1,129 | 72,458 | ||||||
WM Morrison Supermarkets PLC | 18,613 | 49,290 | ||||||
WPP PLC | 11,769 | 165,616 | ||||||
| $ | 18,399,194 | |||||||
Total Common Stocks | $ | 128,102,589 | ||||||
| Rights — 0.0%(6) |
| |||||||
| Security | Shares | Value | ||||||
| Spain — 0.0%(6) | ||||||||
Repsol SA, Exp. 1/21/20 (2) | 13,282 | $ | 6,302 | |||||
| $ | 6,302 | |||||||
Total Rights |
| $ | 6,302 | |||||
| 17 | See Notes to Financial Statements. |
Table of Contents
Calvert
VP EAFE International Index Portfolio
December 31, 2019
Schedule of Investments — continued
| Short-Term Investments — 1.6% |
| |||||||
| Security | Shares | Value | ||||||
State Street Navigator Securities Lending Government Money Market Portfolio, 1.56% (7) | 1,992,518 | $ | 1,992,518 | |||||
Total Short-Term Investments |
| $ | 1,992,518 | |||||
Total Investments |
| $ | 130,101,409 | |||||
Other Assets, Less Liabilities — (1.0%) |
| $ | (1,260,955 | ) | ||||
Net Assets — 100.0% |
| $ | 128,840,454 | |||||
The percentage shown for each investment category in the Schedule of Investments is based on net assets.
Notes to Schedule of Investments
| (1) | All or a portion of this security was on loan at December 31, 2019. The aggregate market value of securities on loan at December 31, 2019 was $3,480,763. |
| (2) | Non-income producing security. |
| (3) | For fair value measurement disclosure purposes, security is categorized as Level 3 (See Note 1A). |
| (4) | Security is exempt from registration under Rule 144A of the Securities Act of 1933. These securities may be resold in transactions exempt from registration, normally to qualified institutional buyers. Total market value of Rule 144A securities amounts to $1,079,137, which represents 0.8% of the net assets of the Fund as of December 31, 2019. |
| (5) | Securities are traded on separate exchanges for the same entity. |
| (6) | Amount is less than 0.05%. |
| (7) | Represents investment of cash collateral received in connection with securities lending. |
At December 31, 2019, the concentration of the Fund’s investments in the various sectors, determined as a percentage of net assets, was as follows:
| Economic Sectors | % of net assets | |||
Financials | 18.4 | % | ||
Industrials | 15.0 | |||
Health Care | 12.1 | |||
Consumer Discretionary | 11.5 | |||
Consumer Staples | 11.2 | |||
Materials | 7.1 | |||
Information Technology | 6.9 | |||
Communication Services | 5.2 | |||
Energy | 4.8 | |||
Utilities | 3.7 | |||
Real Estate | 3.5 | |||
Total Common Stocks | 99.4 | % | ||
Abbreviations:
| ADR | – | American Depositary Receipt | ||
| CDI | – | CHESS Depositary Interest | ||
| FDR | – | Fiduciary Depositary Receipt | ||
| PC | – | Participation Certificate | ||
| PFC Shares | – | Preference Shares | ||
| SDR | – | Swedish Depositary Receipt | ||
| 18 | See Notes to Financial Statements. |
Table of Contents
Calvert
VP EAFE International Index Portfolio
December 31, 2019
Statement of Assets and Liabilities
| Assets | December 31, 2019 | |||
Investments in securities of unaffiliated issuers, at value (identified cost $93,650,058) - including | $ | 130,101,409 | ||
Cash | 66,179 | |||
Cash denominated in foreign currency, at value (cost $51,973) | 52,672 | |||
Receivable for investments sold | 262,053 | |||
Receivable for capital shares sold | 115,769 | |||
Dividends receivable | 120,279 | |||
Securities lending income receivable | 1,447 | |||
Tax reclaims receivable | 303,701 | |||
Receivable from affiliate | 26,900 | |||
Directors’ deferred compensation plan | 23,747 | |||
Other assets | 6,750 | |||
Total assets | $ | 131,080,906 | ||
| Liabilities | ||||
Payable for capital shares redeemed | $ | 45,453 | ||
Deposits for securities loaned | 1,992,518 | |||
Payable to affiliates: | ||||
Investment advisory fee | 32,544 | |||
Administrative fee | 13,017 | |||
Distribution and service fees | 2,144 | |||
Sub-transfer agency fee | 130 | |||
Directors’ deferred compensation plan | 23,747 | |||
Accrued expenses | 130,899 | |||
Total liabilities | $ | 2,240,452 | ||
Net Assets | $ | 128,840,454 | ||
| Sources of Net Assets | ||||
Paid-in capital | $ | 94,669,995 | ||
Distributable earnings | 34,170,459 | |||
Total | $ | 128,840,454 | ||
| Class I | ||||
Net Assets | $ | 115,802,775 | ||
Shares Outstanding | 1,286,414 | |||
Net Asset Value, Offering Price and Redemption Price Per Share | ||||
(net assets ÷ shares of beneficial interest outstanding) | $ | 90.02 | ||
| Class F | ||||
Net Assets | $ | 13,037,679 | ||
Shares Outstanding | 144,795 | |||
Net Asset Value, Offering Price and Redemption Price Per Share | ||||
(net assets ÷ shares of beneficial interest outstanding) | $ | 90.04 | ||
| 19 | See Notes to Financial Statements. |
Table of Contents
Calvert
VP EAFE International Index Portfolio
December 31, 2019
Statement of Operations
| Investment Income | Year Ended December 31, 2019 | |||
Dividend income (net of foreign taxes withheld of $365,130) | $ | 4,028,913 | ||
Interest income | 2,211 | |||
Securities lending income, net | 29,680 | |||
Total investment income | $ | 4,060,804 | ||
| Expenses | ||||
Investment advisory fee | $ | 364,485 | ||
Administrative fee | 145,794 | |||
Distribution and service fees: | ||||
Class F | 20,623 | |||
Directors’ fees and expenses | 7,195 | |||
Custodian fees | 45,735 | |||
Transfer agency fees and expenses | 21,433 | |||
Accounting fees | 46,030 | |||
Professional fees | 42,698 | |||
Reports to shareholders | 44,567 | |||
Licensing fees | 58,439 | |||
Miscellaneous | 51,883 | |||
Total expenses | $ | 848,882 | ||
Waiver and/or reimbursement of expenses by affiliate | $ | (238,565 | ) | |
Reimbursement of expenses - other | (2,761 | ) | ||
Net expenses | $ | 607,556 | ||
Net investment income | $ | 3,453,248 | ||
| Realized and Unrealized Gain (Loss) | ||||
Net realized gain (loss): | ||||
Investment securities | $ | (160,775 | ) | |
Foreign currency transactions | 14,439 | |||
Net realized loss | $ | (146,336 | ) | |
Change in unrealized appreciation (depreciation): | ||||
Investment securities | $ | 19,823,521 | ||
Foreign currency | 2,410 | |||
Net change in unrealized appreciation (depreciation) | $ | 19,825,931 | ||
Net realized and unrealized gain | $ | 19,679,595 | ||
Net increase in net assets resulting from operations | $ | 23,132,843 | ||
| 20 | See Notes to Financial Statements. |
Table of Contents
Calvert
VP EAFE International Index Portfolio
December 31, 2019
Statements of Changes in Net Assets
| Year Ended December 31, | ||||||||
| Increase (Decrease) in Net Assets | 2019 | 2018 | ||||||
From operations: | ||||||||
Net investment income | $ | 3,453,248 | $ | 3,507,120 | ||||
Net realized loss | (146,336 | ) | (1,133,794 | ) | ||||
Net change in unrealized appreciation (depreciation) | 19,825,931 | (19,786,341 | ) | |||||
Net increase (decrease) in net assets from operations | $ | 23,132,843 | $ | (17,413,015 | ) | |||
Distributions to shareholders: | ||||||||
Class I | $ | (2,945,173 | ) | $ | (3,852,123 | ) | ||
Class F | (298,614 | ) | (275,444 | ) | ||||
Total distributions to shareholders | $ | (3,243,787 | ) | $ | (4,127,567 | ) | ||
Capital share transactions: | ||||||||
Class I | $ | (5,687,218 | ) | $ | (17,855,847 | ) | ||
Class F | 3,826,505 | 1,900,879 | ||||||
Net decrease in net assets from capital share transactions | $ | (1,860,713 | ) | $ | (15,954,968 | ) | ||
Net increase (decrease) in net assets | $ | 18,028,343 | $ | (37,495,550 | ) | |||
| Net Assets | ||||||||
At beginning of year | $ | 110,812,111 | $ | 148,307,661 | ||||
At end of year | $ | 128,840,454 | $ | 110,812,111 | ||||
| 21 | See Notes to Financial Statements. |
Table of Contents
Calvert
VP EAFE International Index Portfolio
December 31, 2019
Financial Highlights
| Class I | ||||||||||||||||||||
| Year Ended December 31, | ||||||||||||||||||||
| 2019 | 2018 | 2017 | 2016 | 2015 | ||||||||||||||||
Net asset value — Beginning of year | $ | 76.31 | $ | 91.21 | $ | 74.93 | $ | 76.87 | $ | 78.33 | ||||||||||
| Income (Loss) From Operations | ||||||||||||||||||||
Net investment income(1) | $ | 2.43 | 2.36 | 2.11 | 1.88 | 1.63 | ||||||||||||||
Net realized and unrealized gain (loss) | 13.55 | (14.36 | ) | 16.39 | (1.54 | ) | (2.88 | ) | ||||||||||||
Total income (loss) from operations | $ | 15.98 | (12.00 | ) | 18.50 | 0.34 | (1.25 | ) | ||||||||||||
| Less Distributions | ||||||||||||||||||||
From net investment income | $ | (2.27 | ) | (2.90 | ) | (2.22 | ) | (2.28 | ) | (0.21 | ) | |||||||||
Total distributions | $ | (2.27 | ) | (2.90 | ) | (2.22 | ) | (2.28 | ) | (0.21 | ) | |||||||||
Net asset value — End of year | $ | 90.02 | $ | 76.31 | $ | 91.21 | $ | 74.93 | $ | 76.87 | ||||||||||
Total Return(2) | 21.26 | % | (13.58 | )% | 24.76 | % | 0.46 | % | (1.61 | )% | ||||||||||
| Ratios/Supplemental Data | ||||||||||||||||||||
Net assets, end of year (000’s omitted) | $ | 115,803 | $ | 103,168 | $ | 141,082 | $ | 124,685 | $ | 154,811 | ||||||||||
Ratios (as a percentage of average daily net assets):(3) | ||||||||||||||||||||
Total expenses | 0.68 | % | 0.69 | %(4) | 0.68 | % | 0.98 | % | 0.95 | % | ||||||||||
Net expenses | 0.48 | % | 0.49 | %(4) | 0.48 | % | 0.97 | % | 0.95 | % | ||||||||||
Net investment income | 2.87 | % | 2.67 | % | 2.49 | % | 2.50 | % | 2.01 | % | ||||||||||
Portfolio Turnover | 7 | % | 6 | % | 3 | % | 22 | % | 10 | % | ||||||||||
| (1) | Computed using average shares outstanding. |
| (2) | Returns are historical and are calculated by determining the percentage change in net asset value with all distributions reinvested and do not reflect fees and expenses imposed by variable annuity contracts or variable life insurance policies. If included, total return would be lower. |
| (3) | Total expenses do not reflect amounts reimbursed and/or waived by the adviser and certain of its affiliates, if applicable. Net expenses are net of all reductions and represent the net expenses paid by the Fund. |
| (4) | Includes interest expense of 0.01%. |
| 22 | See Notes to Financial Statements. |
Table of Contents
Calvert
VP EAFE International Index Portfolio
December 31, 2019
Financial Highlights — continued
| Class F | ||||||||||||||||||||
| Year Ended December 31, | ||||||||||||||||||||
| 2019 | 2018 | 2017 | 2016 | 2015 | ||||||||||||||||
Net asset value — Beginning of year | $ | 76.49 | $ | 91.65 | $ | 75.47 | $ | 77.45 | $ | 78.93 | ||||||||||
| Income (Loss) From Operations | ||||||||||||||||||||
Net investment income(1) | $ | 2.14 | 2.09 | 1.87 | 1.60 | 1.44 | ||||||||||||||
Net realized and unrealized gain (loss) | 13.68 | (14.35 | ) | 16.53 | (1.43 | ) | (2.90 | ) | ||||||||||||
Total income (loss) from operations | $ | 15.82 | (12.26 | ) | 18.40 | 0.17 | (1.46 | ) | ||||||||||||
| Less Distributions | ||||||||||||||||||||
From net investment income | $ | (2.27 | ) | (2.90 | ) | (2.22 | ) | (2.15 | ) | (0.02 | ) | |||||||||
Total distributions | $ | (2.27 | ) | (2.90 | ) | (2.22 | ) | (2.15 | ) | (0.02 | ) | |||||||||
Net asset value — End of year | $ | 90.04 | $ | 76.49 | $ | 91.65 | $ | 75.47 | $ | 77.45 | ||||||||||
Total Return(2) | 21.00 | % | (13.80 | )% | 24.44 | % | 0.24 | % | (1.84 | )% | ||||||||||
| Ratios/Supplemental Data | ||||||||||||||||||||
Net assets, end of year (000’s omitted) | $ | 13,038 | $ | 7,645 | $ | 7,226 | $ | 4,486 | $ | 3,906 | ||||||||||
Ratios (as a percentage of average daily net assets):(3) | ||||||||||||||||||||
Total expenses | 0.88 | % | 0.89 | %(4) | 0.91 | % | 1.26 | % | 1.24 | % | ||||||||||
Net expenses | 0.69 | % | 0.74 | %(4) | 0.73 | % | 1.19 | % | 1.19 | % | ||||||||||
Net investment income | 2.52 | % | 2.37 | % | 2.18 | % | 2.11 | % | 1.75 | % | ||||||||||
Portfolio Turnover | 7 | % | 6 | % | 3 | % | 22 | % | 10 | % | ||||||||||
| (1) | Computed using average shares outstanding. |
| (2) | Returns are historical and are calculated by determining the percentage change in net asset value with all distributions reinvested and do not reflect fees and expenses imposed by variable annuity contracts or variable life insurance policies. If included, total return would be lower. |
| (3) | Total expenses do not reflect amounts reimbursed and/or waived by the adviser and certain of its affiliates, if applicable. Net expenses are net of all reductions and represent the net expenses paid by the Fund. |
| (4) | Includes interest expense of 0.01%. |
| 23 | See Notes to Financial Statements. |
Table of Contents
Calvert
VP EAFE International Index Portfolio
December 31, 2019
Notes to Financial Statements
1 Significant Accounting Policies
Calvert VP EAFE International Index Portfolio (the Fund) is a diversified series of Calvert Variable Products, Inc. (the Corporation). The Corporation is a Maryland corporation registered under the Investment Company Act of 1940, as amended (the 1940 Act), as anopen-end management investment company. The investment objective of the Fund is to seek investment results that correspond to the total return performance of common stocks as represented by the MSCI EAFE Index.
Shares of the Fund are sold without sales charge to insurance companies for allocation to certain of their variable separate accounts. The Fund offers Class I and Class F shares. Among other things, each class has different: (a) dividend rates due to differences in Distribution Plan expenses and other class-specific expenses; (b) exchange privileges; and (c) class-specific voting rights.
The Fund applies the accounting and reporting guidance in the Financial Accounting Standards Board (FASB) Accounting Standards Codification Topic 946,Financial Services – Investment Companies (ASC 946). Subsequent events, if any, through the date that the financial statements were issued have been evaluated in the preparation of the financial statements.
A Investment Valuation — Net asset value per share is determined every business day as of the close of the regular session of the New York Stock Exchange (generally 4:00 p.m. Eastern time). The Fund uses independent pricing services approved by the Board ofDirectors (the Board) to value its investments wherever possible. Investments for which market quotations are not available or deemed not reliable are fair valued in good faith under the direction of the Board.
U.S. generally accepted accounting principles (U.S. GAAP) establishes a disclosure hierarchy that categorizes the inputs to valuation techniques used to value assets and liabilities at measurement date. These inputs are summarized in the three broad levels listed below:
Level 1 - quoted prices in active markets for identical securities
Level 2 - other significant observable inputs (including quoted prices for similar securities, interest rates, prepayment speeds, credit risk, etc.)
Level 3 - significant unobservable inputs (including the Fund’s own assumptions in determining the fair value of investments)
The inputs or methodologies used for valuing securities are not necessarily an indication of the risk associated with investing in those securities.
Valuation techniques used to value the Fund’s investments by major category are as follows:
Equity Securities.Equity securities (including warrants and rights) listed on a U.S. securities exchange generally are valued at the last sale or closing price as reported by an independent pricing service on the primary market or exchange on which they are traded and are categorized as Level 1 in the hierarchy. Equity securities listed on the NASDAQ Global or Global Select Market are valued at the NASDAQ official closing price and are categorized as Level 1 in the hierarchy. Unlisted or listed securities for which closing sales prices or closing quotations are not available are valued at the mean between the latest available bid and ask prices and are categorized as Level 2 in the hierarchy. The daily valuation of exchange-traded foreign securities generally is determined as of the close of trading on the principal exchange on which such securities trade. Events occurring after the close of trading on foreign exchanges may result in adjustments to the valuation of foreign securities to more accurately reflect their fair value as of the close of regular trading on the New York Stock Exchange. When valuing foreign equity securities that meet certain criteria, the Fund’s Board has approved the use of a fair value service that values such securities to reflect market trading that occurs after the close of the applicable foreign markets of comparable securities or other instruments that have a strong correlation to the fair-valued securities. Such securities are categorized as Level 2 in the hierarchy.
Other Securities.Investments in registered investment companies (including money market funds) that do not trade on an exchange are valued at the net asset value per share on the valuation day and are categorized as Level 1 in the hierarchy.
Fair Valuation.If a market value cannot be determined for a security using the methodologies described above, or if, in the good faith opinion of the Fund’s adviser, the market value does not constitute a readily available market quotation, or if a significant event has occurred that would materially affect the value of the security, the security will be fair valued as determined in good faith by or at the direction of the Board in a manner that most fairly reflects the security’s “fair value”, which is the amount that the Fund might reasonably expect to receive for the security upon its current sale in the ordinary course. Each such determination is based on a consideration of relevant factors, which are likely to vary from one pricing context to another. These factors may include, but are not limited to, the type of security, the existence of any contractual restrictions on the security’s disposition, the price and extent of public trading in similar securities of the issuer or of comparable companies or entities, quotations or relevant information obtained from broker/dealers or other market participants, information obtained from the issuer, analysts, and/or the appropriate stock exchange (for exchange-traded securities), an analysis of the company’s or entity’s financial statements, and an evaluation of the forces that influence the issuer and the market(s) in which the security is purchased and sold.
The values assigned to fair value investments are based on available information and do not necessarily represent amounts that might ultimately be realized. Further, due to the inherent uncertainty of valuations of such investments, the fair values may differ significantly from the values that would have been used had an active market existed, and the differences could be material.
| 24 |
Table of Contents
Calvert
VP EAFE International Index Portfolio
December 31, 2019
Notes to Financial Statements — continued
The following table summarizes the market value of the Fund’s holdings as of December 31, 2019, based on the inputs used to value them:
| Asset Description | Level 1 | Level 2 | Level 3(1) | Total | ||||||||||||
Common Stocks | ||||||||||||||||
Hong Kong | $ | 109,216 | $ | 4,405,079 | $ | — | $ | 4,514,295 | ||||||||
Israel | 302,128 | 409,043 | — | 711,171 | ||||||||||||
Netherlands | 367,127 | 7,991,559 | — | 8,358,686 | ||||||||||||
United Kingdom | 88,910 | 18,310,284 | — | 18,399,194 | ||||||||||||
Other Countries (2) | — | 96,119,243 | 0 | 96,119,243 | ||||||||||||
Total Common Stocks | $ | 867,381 | $ | 127,235,208 | (3) | $ | 0 | $ | 128,102,589 | |||||||
Rights | 6,302 | — | — | 6,302 | ||||||||||||
Short-Term Investments | 1,992,518 | — | — | 1,992,518 | ||||||||||||
Total Investments | $ | 2,866,201 | $ | 127,235,208 | $ | 0 | $ | 130,101,409 | ||||||||
| (1) | None of the unobservable inputs for Level 3 assets, individually or collectively, had a material impact on the Fund. |
| (2) | For further breakdown of equity securities by country, please refer to the Schedule of Investments. |
| (3) | Includes foreign equity securities whose values were adjusted to reflect market trading of comparable securities or other correlated instruments that occurred after the close of trading in their applicable foreign markets. |
Level 3 investments at the beginning and end of the period were valued at $0 and accordingly, a reconciliation of Level 3 assets for the year ended December 31, 2019 is not presented.
B Investment Transactions and Income — Investment transactions for financial statement purposes are accounted for on trade date. Realized gains and losses are recorded on an identified cost basis and may include proceeds from litigation. Dividend income is recorded on theex-dividend date for dividends received in cash and/or securities or, in the case of dividends on certain foreign securities, as soon as the Fund is informed of theex-dividend date.Non-cash dividends are recorded at the fair value of the securities received. Withholding taxes on foreign dividends, if any, have been provided for in accordance with the Fund’s understanding of the applicable country’s tax rules and rates. In consideration of recent decisions rendered by European courts, the Fund has filed additional tax reclaims for previously withheld taxes on dividends earned in certain European Union countries. These filings are subject to various administrative and judicial proceedings within these countries. Due to the uncertainty as to the ultimate resolution of these proceedings, the likelihood of receipt of these reclaims, and the potential timing of payment, no amounts are reflected in the financial statements for such outstanding reclaims. Distributions received that represent a return of capital are recorded as a reduction of cost of investments. Distributions received that represent a capital gain are recorded as a realized gain. Interest income is accrued as earned.
C Share Class Accounting — Realized and unrealized gains and losses and net investment income and losses, other than class-specific expenses, are allocated daily to each class of shares based upon the relative net assets of each class to the total net assets of the Fund. Expenses arising in connection with a specific class are charged directly to that class.
D Foreign Currency Transactions — The Fund’s accounting records are maintained in U.S. dollars. For valuation of assets and liabilities on each date of net asset value determination, foreign denominations are converted into U.S. dollars using the current exchange rate. Security transactions, income, and expenses are translated at the prevailing rate of exchange on the date of the event. Recognized gains or losses on investment transactions attributable to changes in foreign currency exchange rates are recorded for financial statement purposes as net realized gains and losses on investments. That portion of unrealized gains and losses on investments that results from fluctuations in foreign currency exchange rates is not separately disclosed.
E Distributions to Shareholders — Distributions to shareholders are recorded by the Fund onex-dividend date. The Fund distributes any net investment income and net realized capital gains at least annually. Both types of distributions are made in shares of the Fund unless an election is made on behalf of a separate account to receive some or all of the distributions in cash. Distributions are declared separately for each class of shares. Distributions are determined in accordance with income tax regulations which may differ from U.S. GAAP; accordingly, periodic reclassifications are made within theFund’s capital accounts to reflect income and gains available for distribution under income tax regulations.
F Estimates — The preparation of financial statements in conformity with U.S. GAAP requires management to make estimates and assumptions that affect the reported amounts of assets and liabilities and disclosure of contingent assets and liabilities at the date of the financial statements and the reported amounts of increases and decreases in net assets from operations during the reporting period. Actual results could differ from those estimates.
G Indemnifications — The Corporation’sBy-Laws provide for indemnification for Directors or officers of the Corporation and certain other parties, to the fullest extent permitted by Maryland law and the 1940 Act, provided certain conditions are met. Additionally, in the normal course of business, the Fund enters into agreements with service providers that may contain indemnification clauses. The Fund’s maximum exposure under these arrangements is unknown as this would involve future claims that may be made against the Fund that have not yet occurred.
| 25 |
Table of Contents
Calvert
VP EAFE International Index Portfolio
December 31, 2019
Notes to Financial Statements — continued
H Federal Income Taxes — No provision for federal income or excise tax is required since the Fund intends to continue to qualify as a regulated investment company under the Internal Revenue Code and to distribute substantially all of its taxable earnings.
Management has analyzed the Fund’stax positions taken for all open federal income tax years and has concluded that no provision for federal income tax is required in the Fund’s financial statements. A Fund’s federal tax return is subject to examination by the Internal Revenue Service for a period of three years from the date of filing.
2 Related Party Transactions
The investment advisory fee is earned by Calvert Research and Management (CRM), a subsidiary of Eaton Vance Management (EVM), as compensation for investment advisory services rendered to the Fund. Pursuant to the investment advisory agreement, CRM receives a fee, payable monthly, at the annual rate of 0.30% of the Fund’s average daily net assets. For the year ended December 31, 2019, the investment advisory fee amounted to $364,485.
CRM has agreed to reimburse the Fund’s operating expenses to the extent that total annual operating expenses (relating to ordinary operating expenses only and excluding expenses such as brokerage commissions, acquired fund fees and expenses of unaffiliated funds, borrowing costs, taxes or litigation expenses) exceed 0.48% for Class I and 0.68% (0.73% prior to May 1, 2019) for Class F of such class’ average daily net assets. The expense reimbursement agreement with CRM may be changed or terminated after April 30, 2020. For the year ended December 31, 2019, CRM waived or reimbursed expenses of $238,565.
The administrative fee is earned by CRM as compensation for administrative services rendered to the Fund. The fee is computed at an annual rate of 0.12% of the Fund’s average daily net assets attributable to Class I and Class F and is payable monthly. For the year ended December 31, 2019, CRM was paid administrative fees of $145,794.
The Fund has in effect a distribution plan for Class F shares (Class F Plan) pursuant to Rule12b-1 under the 1940 Act. Pursuant to the Class F Plan, the Fund pays Eaton Vance Distributors, Inc. (EVD), an affiliate of CRM and the Fund’s principal underwriter, a distribution and service fee of 0.20% per annum of its average daily net assets attributable to Class F shares for distribution services and facilities provided to the Fund, as well as for personal and/or account maintenance services provided to the class shareholders. Distribution and service fees paid or accrued for the year ended December 31, 2019 amounted to $20,623 for Class F shares.
EVM providessub-transfer agency and related services to the Fund pursuant to aSub-Transfer Agency Support Services Agreement. For the year ended December 31, 2019,sub-transfer agency fees and expenses incurred to EVM amounted to $483 and are included in transfer agency fees and expenses on the Statement of Operations.
Each Director of the Fund who is not an employee of CRM or its affiliates receives a fee of $3,000 for each Board meeting attended in person and $2,000 for each Board meeting attended by phone plus an annual fee of $142,000, and $1,500 for each Committee meeting attended in person and $1,000 for each Committee meeting attended by phone plus an annual Committee fee of $2,500. The Board chair receives an additional $20,000 annual retainer and Committee chairs receive an additional $6,000 annual retainer. Eligible Directors may participate in a Deferred Compensation Plan (the Plan). Amounts deferred under the Plan are treated as though equal dollar amounts had been invested in shares of the Fund or other Calvert funds selected by the Directors. The Fund purchases shares of the funds selected equal to the dollar amounts deferred under the Plan, resulting in an asset equal to the deferred compensation liability. Obligations of the Plan are paid solely from the Fund’s assets. Directors’ fees are allocated to each of the Calvert funds served. Salaries and fees of officers and Directors of the Fund who are employees of CRM or its affiliates are paid by CRM. In addition, an advisory council was established to aid the Board and CRM in advancing the cause of responsible investing through original scholarship and thought leadership. The advisory council consists of CRM’s Chief Executive Officer and four additional members. Each member (other than CRM’s Chief Executive Officer) receives annual compensation of $75,000, which is being reimbursed by Calvert Investment Management, Inc. (CIM), the Calvert funds’ former investment adviser and Ameritas Holding Company, CIM’s parent company, through the end of 2019. For the year ended December 31, 2019, the Fund’s allocated portion of such expense and reimbursement was $2,761, which are included in miscellaneous expense and reimbursement of expenses-other, respectively, on the Statement of Operations.
3 Shareholder Servicing Plan
The Corporation, on behalf of the Fund, has adopted a Shareholder Servicing Plan (Servicing Plan), which permits the Fund to enter into shareholder servicing agreements with intermediaries that maintain accounts in the Fund for the benefit of shareholders. These services may include, but are not limited to, processing purchase and redemption requests, processing dividend payments, and providing account information to shareholders. Under the Servicing Plan, the Fund may make payments at an annual rate of up to 0.11% of its average daily net assets. For the year ended December 31, 2019, expenses incurred under the Servicing Plan amounted to $18,988 and are included in transfer agency fees and expenses on the Statement of Operations.
4 Investment Activity
During theyear ended December 31, 2019, the cost of purchases and proceeds from sales of investments, other than short-term securities, were $7,964,000 and $9,671,331, respectively.
| 26 |
Table of Contents
Calvert
VP EAFE International Index Portfolio
December 31, 2019
Notes to Financial Statements — continued
5 Distributions to Shareholders and Income Tax Information
The tax character of distributions declared for the years ended December 31, 2019 and December 31, 2018 was as follows:
| Year Ended December 31, | ||||||||
| 2019 | 2018 | |||||||
Ordinary income | $ | 3,243,787 | $ | 4,127,567 | ||||
As of December 31, 2019, the components of distributable earnings (accumulated loss) on a tax basis were as follows:
Undistributed ordinary income | $ | 3,784,561 | ||
Deferred capital losses | $ | (2,941,472 | ) | |
Net unrealized appreciation | $ | 33,327,370 | ||
At December 31, 2019, the Fund, for federal income tax purposes, had deferred capital losses of $2,941,472 which would reduce the Fund’s taxable income arising from future net realized gains on investment transactions, if any, to the extent permitted by the Internal Revenue Code, and thus would reduce the amount of distributions to shareholders, which would otherwise be necessary to relieve the Fund of any liability for federal income or excise tax. The deferred capital losses are treated as arising on the first day of the Fund’s next taxable year, can be carried forward for an unlimited period, and retain the same short-term or long-term character as when originally deferred. Of the deferred capital losses at December 31, 2019, $20,849 are short-term and $2,920,623 are long-term.
The cost and unrealized appreciation (depreciation) of investments of the Fund at December 31, 2019, as determined on a federal income tax basis, were as follows:
Aggregate cost | $ | 96,775,994 | ||
Gross unrealized appreciation | $ | 40,613,976 | ||
Gross unrealized depreciation | (7,288,561 | ) | ||
Net unrealized appreciation | $ | 33,325,415 | ||
6 Securities Lending
To generate additional income, the Fund may lend its securities pursuant to a securities lending agency agreement with State Street Bank and Trust Company (SSBT), the securities lending agent. Security loans are subject to termination by the Fund at any time and, therefore, are not considered illiquid investments. The Fund requires that the loan be continuously collateralized by either cash or securities as collateral equal at all times to at least 102% of the market value of the domestic securities loaned and 105% of the market value of the international securities loaned (if applicable). The market value of securities loaned is determined daily and any additional required collateral is delivered to the Fund on the next business day. Cash collateral is generally invested in a money market fund registered under the 1940 Act that is managed by an affiliate of SSBT. Any gain or loss in the market price of the loaned securities that might occur and any interest earned or dividends declared during the term of the loan would accrue to the account of the Fund. Income earned on the investment of collateral, net of broker rebates and other expenses incurred by the securities lending agent, is split between the Fund and the securities lending agent on the basis of agreed upon contractual terms.Non-cash collateral, if any, is held by the lending agent on behalf of the Fund and cannot be sold orre-pledged by the Fund; accordingly, such collateral is not reflected in the Statement of Assets and Liabilities.
The risks associated with lending portfolio securities include, but are not limited to, possible delays in receiving additional collateral or in the recovery of the loaned securities, possible loss of rights to the collateral should the borrower fail financially, as well as risk of loss in the value of the collateral or the value of the investments made with the collateral. The securities lending agent shall indemnify the Fund in the case of default of any securities borrower.
At December 31, 2019, the total value of securities on loan was $3,480,763 and the total value of collateral received was $3,672,631, comprised of cash of $1,992,518 and U.S. government and/or agencies securities of $1,680,113.
| 27 |
Table of Contents
Calvert
VP EAFE International Index Portfolio
December 31, 2019
Notes to Financial Statements — continued
The following table provides a breakdown of securities lending transactions accounted for as secured borrowings, the obligations by class of collateral pledged, and the remaining contractual maturity of those transactions as of December 31, 2019.
| Remaining Contractual Maturity of the Transactions | ||||||||||||||||||||
| Overnight and Continuous | <30 days | 30 to 90 days | >90 days | Total | ||||||||||||||||
Securities Lending Transactions | ||||||||||||||||||||
Common Stocks | $ | 3,672,631 | $ | — | $ | — | $ | — | $ | 3,672,631 | ||||||||||
The carrying amount of the liability for deposits for securities loaned at December 31, 2019 approximated its fair value. If measured at fair value, such liability would have been considered as Level 2 in the fair value hierarchy (see Note 1A) at December 31, 2019.
7 Line of Credit
Effective October 29, 2019, the Fund participates with other portfolios and funds managed by EVM and its affiliates, including CRM, in an $800 million unsecured line of credit with a group of banks, which is in effect through October 27, 2020. Borrowings are made by the Fund solely to facilitate the handling of unusual and/or unanticipated short-term cash requirements. Interest is charged to the Fund based on its borrowings at an amount above either the Eurodollar rate or Federal Funds rate. In addition, a fee computed at an annual rate of 0.15% on the daily unused portion of the line of credit is allocated among the participating portfolios and funds at the end of each quarter. Because the line of credit is not available exclusively to the Fund, it may be unable to borrow some or all of its requested amounts at any particular time.
Prior to October 29, 2019, the Fund participated with other funds managed by CRM in a $100 million ($62.5 million prior to June 21, 2019) committed line of credit agreement with SSBT, which was terminated by the Calvert funds. Borrowings bore interest at the higher of theone-month London Interbank Offered Rate (LIBOR) in effect that day or the overnight Federal Funds rate, plus 1.00% per annum. A commitment fee of 0.20% per annum was incurred on the unused portion of the committed facility, which was allocated to all participating funds.
The Fund had no borrowings outstanding pursuant to its line of credit at December 31, 2019. The Fund did not have any significant borrowings or allocated fees during the year ended December 31, 2019.
8 Capital Shares
The Corporation may issue its shares in one or more series (such as the Fund). The authorized shares of the Fund consist of 20,000,000 common shares, $0.10 par value, for each Class. Transactions in capital shares for the years ended December 31, 2019 and December 31, 2018 were as follows:
| Year Ended December 31, 2019 | Year Ended December 31, 2018 | |||||||||||||||
| Shares | Amount | Shares | Amount | |||||||||||||
Class I | ||||||||||||||||
Shares sold | 73,012 | $ | 6,133,994 | 114,272 | $ | 10,056,808 | ||||||||||
Reinvestment of distributions | 36,186 | 2,945,173 | 43,749 | 3,852,123 | ||||||||||||
Shares redeemed | (174,715 | ) | (14,766,385 | ) | (352,849 | ) | (31,764,778 | ) | ||||||||
Net decrease | (65,517 | ) | $ | (5,687,218 | ) | (194,828 | ) | $ | (17,855,847 | ) | ||||||
Class F | ||||||||||||||||
Shares sold | 60,554 | $ | 5,179,234 | 36,805 | $ | 3,296,228 | ||||||||||
Reinvestment of distributions | 3,666 | 298,614 | 3,119 | 275,444 | ||||||||||||
Shares redeemed | (19,363 | ) | (1,651,343 | ) | (18,831 | ) | (1,670,793 | ) | ||||||||
Net increase | 44,857 | $ | 3,826,505 | 21,093 | $ | 1,900,879 | ||||||||||
At December 31, 2019, separate accounts of an insurance company owned 70.0% of the value of the outstanding shares of the Fund.
| 28 |
Table of Contents
Calvert
VP EAFE International Index Portfolio
December 31, 2019
Notes to Financial Statements — continued
9 Risks Associated with Foreign Investments
Investing in foreign securities involves additional risks relating to political, social, and economic developments abroad. Other risks result from differences between regulations that apply to U.S. and foreign issuers and markets, and the potential for foreign markets to be less liquid and more volatile than U.S. markets. Securities that trade or are denominated in currencies other than the U.S. dollar may be adversely affected by fluctuations in currency exchange rates.
| 29 |
Table of Contents
Calvert
VP EAFE International Index Portfolio
December 31, 2019
Report of Independent Registered Public Accounting Firm
To the Shareholders and Board of Directors
Calvert Variable Products, Inc.:
Opinion on the Financial Statements
We have audited the accompanying statement of assets and liabilities of Calvert VP EAFE International Index Portfolio (the Fund), a series of Calvert Variable Products, Inc., including the schedule of investments, as of December 31, 2019, the related statement of operations for the year then ended, the statements of changes in net assets for each of the years in thetwo-year period then ended, and the related notes (collectively, the financial statements) and the financial highlights for each of the years in thefive-year period then ended. In our opinion, the financial statements and financial highlights present fairly, in all material respects, the financial position of the Fund as of December 31, 2019, the results of its operations for the year then ended, the changes in its net assets for each of the years in thetwo-year period then ended, and the financial highlights for each of the years in thefive-year period then ended, in conformity with U.S. generally accepted accounting principles.
Basis for Opinion
These financial statements and financial highlights are the responsibility of the Fund’s management. Our responsibility is to express an opinion on these financial statements and financial highlights based on our audits. We are a public accounting firm registered with the Public Company Accounting Oversight Board (United States) (PCAOB) and are required to be independent with respect to the Fund in accordance with the U.S. federal securities laws and the applicable rules and regulations of the Securities and Exchange Commission and the PCAOB.
We conducted our audits in accordance with the standards of the PCAOB. Those standards require that we plan and perform the audit to obtain reasonable assurance about whether the financial statements and financial highlights are free of material misstatement, whether due to error or fraud. Our audits included performing procedures to assess the risks of material misstatement of the financial statements and financial highlights, whether due to error or fraud, and performing procedures that respond to those risks. Such procedures included examining, on a test basis, evidence regarding the amounts and disclosures in the financial statements and financial highlights. Such procedures also included confirmation of securities owned as of December 31, 2019, by correspondence with the custodian and brokers. Our audits also included evaluating the accounting principles used and significant estimates made by management, as well as evaluating the overall presentation of the financial statements and financial highlights. We believe that our audits provide a reasonable basis for our opinion.

We have served as the auditor of one or more of the Calvert Funds since 2002.
Philadelphia, Pennsylvania
February 19, 2020
| 30 |
Table of Contents
Calvert
VP EAFE International Index Portfolio
December 31, 2019
Federal Tax Information (Unaudited)
As required by the Internal Revenue Code and/or regulations, shareholders must be notified regarding the status of the foreign tax credit.
Foreign Tax Credit. For the fiscal year ended December 31, 2019, the Fund paid foreign taxes of $274,736 and recognized foreign source income of $3,709,413.
| 31 |
Table of Contents
Calvert
VP EAFE International Index Portfolio
December 31, 2019
Fund Management.The Directors of Calvert Variable Products, Inc. (the Corporation) are responsible for the overall management and supervision of the Corporation’s affairs. The Directors and officers of the Corporation are listed below. Except as indicated, each individual has held the office shown or other offices in the same company for the last five years. Each Board member holds office until his or her successor is elected and qualified, or until his or her earlier death, resignation, retirement, removal or disqualification. Under the terms of the Fund’s current Board member retirement policy, an Independent Board member must retire at the end of the calendar year in which he or she turns 75. However, if such retirement would cause the Fund to be out of compliance with Section 16 of the 1940 Act or any other regulations or guidance of the SEC, then such retirement and resignation will not become effective until such time as action has been taken for the Fund to be in compliance upon a Board member’s retirement. The “Independent Directors” consist of those Directors who are not “interested persons” of the Corporation, as that term is defined under the 1940 Act. The business address of each Director and officer, with the exception of Ms. Gemma and Mr. Kirchner, is 1825 Connecticut Avenue NW, Suite 400, Washington, DC 20009. As used below, “CRM” refers to Calvert Research and Management. Each Director oversees 39 funds in the Calvert fund complex. Each officer serves as an officer of certain other Calvert funds.
| Name and Year of Birth | Position with the | Position Start Date | Principal Occupation(s) and Directorships During Past Five Years and Other Relevant Experience | |||
| Interested Director | ||||||
John H. Streur(1) 1960 | Director and President | 2015 | President and Chief Executive Officer of Calvert Research and Management (since December 31, 2016). President and Chief Executive Officer of Calvert Investments, Inc. (January 2015-December 2016); Chief Executive Officer of Calvert Investment Distributors, Inc. (August 2015-December 2016); Chief Compliance Officer of Calvert Investment Management, Inc. (August 2015-April 2016); President and Director, Portfolio 21 Investments, Inc. (through October 2014); President, Chief Executive Officer and Director, Managers Investment Group LLC (through January 2012); President and Director, The Managers Funds and Managers AMG Funds (through January 2012). Other Directorships in the Last Five Years. Portfolio 21 Investments, Inc. (asset management) (through October 2014); Managers Investment Group LLC (asset management) (through January 2012); The Managers Funds (asset management) (through January 2012); Managers AMG Funds (asset management) (through January 2012); Calvert Impact Capital, Inc. | |||
| Independent Directors | ||||||
Richard L. Baird, Jr. 1948 | Director | 2016 | Regional Disaster Recovery Lead, American Red Cross of Greater Pennsylvania (since 2017). Volunteer, American Red Cross (since 2015). Former President and CEO of Adagio Health Inc. (retired in 2014) in Pittsburgh, PA. Other Directorships in the Last Five Years. None. | |||
Alice Gresham Bullock 1950 | Chair and Director | 2016 (Chair); 2008 (Director) | Professor Emerita at Howard University School of Law. Dean Emerita of Howard University School of Law and Deputy Director of the Association of American Law Schools (1992-1994). Other Directorships in the Last Five Years. None. | |||
Cari M. Dominguez 1949 | Director | 2016 | Former Chair of the U.S. Equal Employment Opportunity Commission. Other Directorships in the Last Five Years. Manpower, Inc. (employment agency); Triple S Management Corporation (managed care); National Association of Corporate Directors. | |||
John G. Guffey, Jr. (2) 1948 | Director | 2016 | President of Aurora Press Inc., a privately held publisher of trade paperbacks (since January 1997). Other Directorships in the Last Five Years. Calvert Impact Capital, Inc. (through December 31, 2018); Calvert Ventures, LLC. | |||
Miles D. Harper, III 1962 | Director | 2016 | Partner, Carr Riggs & Ingram (public accounting firm) since October 2014. Partner, Gainer Donnelly & Desroches (public accounting firm) (now Carr Riggs & Ingram), November 1999-September 2014). Other Directorships in the Last Five Years. Bridgeway Funds (9) (asset management). | |||
| 32 |
Table of Contents
Calvert
VP EAFE International Index Portfolio
December 31, 2019
Management and Organization — continued
| Name and Year of Birth | Position with the | Position Start Date | Principal Occupation(s) and Directorships During Past Five Years and Other Relevant Experience | |||
| Independent Directors (continued) | ||||||
Joy V. Jones 1950 | Director | 2016 | Attorney. Other Directorships in the Last Five Years. Conduit Street Restaurants SUD 2 Limited; Palm Management Restaurant Corporation. | |||
Anthony A. Williams 1951 | Director | 2016 | CEO and Executive Director of the Federal City Council (July 2012 to present); Senior Adviser and Independent Consultant for King and Spalding LLP (September 2015 to present); Executive Director of Global Government Practice at the Corporate Executive Board (January 2010 to January 2012). Other Directorships in the Last Five Years. Freddie Mac; Evoq Properties/ Meruelo Maddux Properties, Inc. (real estate management); Weston Solutions, Inc. (environmental services); Bipartisan Policy Center’s Debt Reduction Task Force; Chesapeake Bay Foundation; Catholic University of America; Urban Institute (research organization). | |||
| Name and Year of Birth | Position(s) with the Corporation | Position Start Date | Principal Occupation(s) During Past Five Years | |||
| Principal Officers who are not Directors | ||||||
Hope Brown 1973 | Chief Compliance Officer | 2014 | Chief Compliance Officer of 39 registered investment companies advised by CRM (since 2014). Vice President and Chief Compliance Officer, Wilmington Funds (2012-2014). | |||
Maureen A. Gemma(3) 1960 | Vice President, Secretary and Chief Legal Officer | 2016 | Vice President of CRM and officer of 39 registered investment companies advised by CRM (since 2016). Also Vice President of Eaton Vance and certain of its affiliates and officer of 159 registered investment companies advised or administered by Eaton Vance. | |||
James F. Kirchner(3) 1967 | Treasurer | 2016 | Vice President of CRM and officer of 39 registered investment companies advised by CRM (since 2016). Also Vice President of Eaton Vance and certain of its affiliates and officer of 159 registered investment companies advised or administered by Eaton Vance. | |||
| (1) | Mr. Streur is an interested person of the Fund because of his positions with the Fund’s adviser and certain affiliates. |
| (2) | Mr. Guffey is currently married to Rebecca L. Adamson, who served as a member of the Advisory Council through December 31, 2019. |
| (3) | The business address for Ms. Gemma and Mr. Kirchner is Two International Place, Boston, MA 02110. |
The SAI for the Fund includes additional information about the Directors and officers of the Fund and can be obtained without charge on Calvert’s website at www.calvert.com or by calling1-800-368-2745.
| 33 |
Table of Contents
Calvert Funds
Privacy. The Eaton Vance organization is committed to ensuring your financial privacy. Each entity listed below has adopted a privacy policy and procedures (“Privacy Program”) Eaton Vance believes is reasonably designed to protect your personal information and to govern when and with whom Eaton Vance may share your personal information.
| • | At the time of opening an account, Eaton Vance generally requires you to provide us with certain information such as name, address, social security number, tax status, account numbers, and account balances. This information is necessary for us to both open an account for you and to allow us to satisfy legal requirements such as applicable anti-money laundering reviews and know-your-customer requirements. |
| • | On an ongoing basis, in the normal course of servicing your account, Eaton Vance may share your information with unaffiliated third parties that perform various services for Eaton Vance and/or your account. These third parties include transfer agents, custodians, broker/dealers and our professional advisers, including auditors, accountants, and legal counsel. Eaton Vance may additionally share your personal information with our affiliates. |
| • | We believe our Privacy Program is reasonably designed to protect the confidentiality of your personal information and to prevent unauthorized access to that information. |
| • | We reserve the right to change our Privacy Program at any time upon proper notification to you. You may want to review our Privacy Program periodically for changes by accessing the link on our homepage: www.eatonvance.com. |
Our pledge of protecting your personal information applies to the following entities within the Eaton Vance organization: the Eaton Vance Family of Funds, Eaton Vance Management, Eaton Vance Investment Counsel, Eaton Vance Distributors, Inc., Eaton Vance Trust Company, Eaton Vance Management (International) Limited, Eaton Vance Advisers International Limited, Eaton Vance Global Advisors Limited, Eaton Vance Management’s Real Estate Investment Group, Boston Management and Research, Calvert Research and Management, and Calvert Funds. This Privacy Notice supersedes all previously issued privacy disclosures. For more information about our Privacy Program or about how your personal information may be used, please call 1-800-368-2745.
Delivery of Shareholder Documents. The Securities and Exchange Commission (SEC) permits funds to deliver only one copy of shareholder documents, including prospectuses, proxy statements and shareholder reports, to fund investors with multiple accounts at the same residential or post office box address. This practice is often called “householding” and it helps eliminate duplicate mailings to shareholders.Calvert funds, or your financial intermediary, may household the mailing of your documents indefinitely unless you instruct Calvert funds, or your financial intermediary, otherwise. If you would prefer that your Calvert fund documents not be householded, please contact Calvert funds at1-800-368-2745, or contact your financial intermediary. Your instructions that householding not apply to delivery of your Calvert fund documents will typically be effective within 30 days of receipt by Calvert funds or your financial intermediary. Separate statements will be generated for each separate account and will be householded as described above.
Portfolio Holdings. Each Calvert fund files a schedule of portfolio holdings on Part F to Form N-PORT with the SEC for the first and third quarters of each fiscal year. The Form N-PORT will be available on the Calvert funds’ website at www.calvert.com, by calling Calvert funds at1-800-368-2745 or in the EDGAR database on the SEC’s website at www.sec.gov.
Proxy Voting. The Proxy Voting Guidelines that each Calvert fund uses to determine how to vote proxies relating to portfolio securities is provided as an Appendix to the fund’s Statement of Additional Information. The Statement of Additional Information can be obtained free of charge by calling the Calvert funds at 1-800-368-2745, by visiting the Calvert funds’ website at www.calvert.com or visiting the SEC’s website at www.sec.gov. Information regarding how a Calvert fund voted proxies relating to portfolio securities during the most recent 12-month period ended June 30 is available by calling Calvert funds, by visiting the Calvert funds’ website at www.calvert.com or by visiting the SEC’s website at www.sec.gov.
| 34 |
Table of Contents
This Page Intentionally Left Blank
Table of Contents
This Page Intentionally Left Blank
Table of Contents
Investment Adviser and Administrator
Calvert Research and Management
1825 Connecticut Avenue NW, Suite 400
Washington, DC 20009
Principal Underwriter*
Eaton Vance Distributors, Inc.
Two International Place
Boston, MA 02110
(617) 482-8260
Custodian
State Street Bank and Trust Company
State Street Financial Center, One Lincoln Street
Boston, MA 02111
Transfer Agent
DST Asset Manager Solutions, Inc.
2000 Crown Colony Drive
Quincy, MA 02169
Independent Registered Public Accounting Firm
KPMG LLP
1601 Market Street
Philadelphia, PA 19103-2499
Fund Offices
1825 Connecticut Avenue NW, Suite 400
Washington, DC 20009
| * | FINRA BrokerCheck. Investors may check the background of their Investment Professional by contacting the Financial Industry Regulatory Authority (FINRA). FINRA BrokerCheck is a free tool to help investors check the professional background of current and former FINRA-registered securities firms and brokers. FINRA BrokerCheck is available by calling 1-800-289-9999 and at www.FINRA.org. The FINRA BrokerCheck brochure describing this program is available to investors at www.FINRA.org. |
Table of Contents
Printed on recycled paper.

24227 12.31.19
Table of Contents

Calvert
VP Investment Grade Bond Index Portfolio
Annual Report
December 31, 2019
Important Note. Beginning on January 1, 2021, as permitted by regulations adopted by the Securities and Exchange Commission, you may not receive paper copies of the Fund’s annual and semi-annual shareholder reports from the insurance company or plan sponsor unless you specifically request paper copies. Instead, the reports will be made available on a website and you will be notified by mail each time a report is posted and provided with a website address to access the report. Instructions for requesting paper copies will be provided by the insurance company, plan sponsor or your financial intermediary, as applicable. Please contact the insurance company, plan sponsor or your financial intermediary, as applicable, or follow instructions included with this disclosure, if any, for more information.

Table of Contents
Commodity Futures Trading Commission Registration. Effective December 31, 2012, the Commodity Futures Trading Commission (“CFTC”) adopted certain regulatory changes that subject registered investment companies and advisers to regulation by the CFTC if a fund invests more than a prescribed level of its assets in certain CFTC-regulated instruments (including futures, certain options and swap agreements) or markets itself as providing investment exposure to such instruments. The Fund and its adviser have claimed an exclusion from the definition of the term “commodity pool operator” under the Commodity Exchange Act. Accordingly, neither the Fund nor the adviser is subject to CFTC regulation.
Fund shares are not insured by the FDIC and are not deposits or other obligations of, or guaranteed by, any depository institution. Shares are subject to investment risks, including possible loss of principal invested.
This report must be preceded or accompanied by a current summary prospectus or prospectus. Before investing, investors should consider carefully the investment objective, risks, and charges and expenses of a mutual fund. This and other important information is contained in the summary prospectus and prospectus, which can be obtained from a financial intermediary. Prospective investors should read the prospectus carefully before investing. For further information, please call1-800-368-2745.
Table of Contents
Annual Report December 31, 2019
Calvert
VP Investment Grade Bond Index Portfolio
Table of Contents
Calvert
VP Investment Grade Bond Index Portfolio
December 31, 2019
Management’s Discussion of Fund Performance 1
Economic and Market Conditions
The12-month period ended December 31, 2019 marked a dramatic turnaround in fixed-income markets from the prior year as the rising interest rate environment of 2018 gave way to a falling interest-rate climate against the backdrop of multiple domestic and international uncertainties.
After a bond rally at the end of 2018 sparked by the U.S. Federal Reserve (the Fed) lowering the number of rate increases projected for 2019, the first two months of 2019 were relatively quiet for bonds. Downward pressure on interest rates and upward pressure on bond prices resumed in March 2019 and continued through most of the period propelled by lower-than-desired inflation, low European interest rates, and anon-again/off-again U.S.-China trade conflict. These factors fueled investor concerns about both U.S. and global growth potential.
After holding interest rates steady through the first half of 2019, the Fed cut its benchmark interest rate to2.00%-2.25% on July 31 — its first reduction in over a decade — followed by two more quarter-point interest-rate drops in September and October to a range of1.50%-1.75%. Lower rates are intended to help stimulate economic activity by making borrowing costs relatively more affordable.
Late in the year, economic data suggested that international policymaker efforts to bolster their respective economies were starting to pay off. Although U.S. manufacturing activity remained weak, the services sector of the economy — nearly 90% of GDP — continued to expand and holiday retail sales grew at a solid pace.
Adding to economic optimism, the U.S. and China announced aso-called“phase-one” trade agreement on December 13. Days later, British lawmakers endorsed Prime Minister Johnson’s plan for the U.K.’s departure from the European Union, lowering fears of a“no-deal exit” scenario.
As a whole, the period was marked by strong performance across U.S. bond markets. The Bloomberg Barclays U.S. Aggregate Bond Index,2 a broad measure of the U.S. bond market, returned 8.72%. The Bloomberg Barclays U.S. Corporate Bond Index, a measure of U.S. corporate investment-grade bonds, finished 2019 with a 14.54% return — its best calendar-year performance since 2009. High yield fixed-income securities also performed well with the ICE BofAML U.S. High Yield Index returning 14.41% during the period ended December 31, 2019.
Investment Strategy
Calvert VP Investment Grade Bond Index Portfolio (the Fund) employs a passive management approach in an effort to track, as closely as possible, the performance of the Bloomberg Barclays U.S. Aggregate Bond Index (the Index). With more than 11,000 securities in the Index, however, full replication is not feasible. The Fund, therefore, uses a representative sampling method to create a portfolio of securities with similar economic characteristics as the Index, including duration,5 sector allocation, and quality6.
Fund Performance
For the12-month period ended December 31, 2019, the Fund returned 8.41% for Class I shares at net asset value (NAV). By comparison, the Index returned 8.72% for the same period. The Index is unmanaged and returns do not reflect any fees and operating expenses.
Corporate bond spreads tightened over the course of the year, making the corporate sector the best-performing sector in both the Index and the Fund during the period.
See Endnotes and Additional Disclosures in this report.
Past performance is no guarantee of future results. Returns are historical and are calculated by determining the percentage change in net asset value (NAV) or offering price (as applicable) with all distributions reinvested. Investment return and principal value will fluctuate so that shares, when redeemed, may be worth more or less than their original cost. Performance for periods less than or equal to one year is cumulative. Performance is for the stated time period only; due to market volatility, current Fund performance may be lower or higher than the quoted return.
| 2 |
Table of Contents
Calvert
VP Investment Grade Bond Index Portfolio
December 31, 2019
Portfolio Manager Tina J. Udell, CFA of Ameritas Investment Partners, Inc.
| % Average Annual Total Returns 2,3 | Class Inception Date | Performance Inception Date | One Year | Five Years | Ten Years | |||||||||||||||
Class I at NAV | 03/31/2003 | 03/31/2003 | 8.41 | % | 2.78 | % | 3.52 | % | ||||||||||||
Class F at NAV | 10/30/2015 | 03/31/2003 | 8.15 | 2.57 | 3.42 | |||||||||||||||
| ||||||||||||||||||||
Bloomberg Barclays U.S. Aggregate Bond Index | — | — | 8.72 | % | 3.05 | % | 3.74 | % | ||||||||||||
| % Total Annual Operating Expense Ratios 4 | Class I | Class F | ||||||||||||||||||
| Gross | 0.44 | % | 0.69 | % | ||||||||||||||||
| Net | 0.32 | 0.57 | ||||||||||||||||||
Growth of $10,000
This graph shows the change in value of a hypothetical investment of $10,000 in Class I of the Fund for the period indicated. For comparison, the same investment is shown in the indicated index.
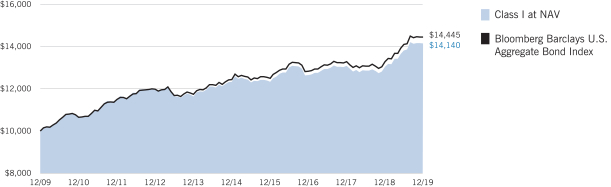
| Growth of Investment 3 | Amount Invested | Period Beginning | At NAV | With Maximum Sales Charge | ||||||||||||
| Class F | $10,000 | 12/31/2009 | $13,995 | N.A. | ||||||||||||
See Endnotes and Additional Disclosures in this report.
Past performance is no guarantee of future results. Returns are historical and are calculated by determining the percentage change in net asset value (NAV) or offering price (as applicable) with all distributions reinvested. Investment return and principal value will fluctuate so that shares, when redeemed, may be worth more or less than their original cost. Performance for periods less than or equal to one year is cumulative. Performance is for the stated time period only; due to market volatility, current Fund performance may be lower or higher than the quoted return.
| 3 |
Table of Contents
Calvert
VP Investment Grade Bond Index Portfolio
December 31, 2019
| Asset Allocation (% of total investments) | ||||
U.S. Treasury Obligations | 38.0 | % | ||
Corporate Bonds | 26.5 | |||
U.S. Government Agency Mortgage-Backed Securities | 25.9 | |||
U.S. Government Agencies and Instrumentalities | 3.3 | |||
Short-Term Investments | 2.3 | |||
Commercial Mortgage-Backed Securities | 2.2 | |||
Sovereign Government Bonds | 0.8 | |||
Taxable Municipal Obligations | 0.7 | |||
Asset-Backed Securities | 0.3 | |||
Floating Rate Loans | 0.0 | * | ||
Total | 100.0 | % | ||
| * | Amount is less than 0.05%. |
See Endnotes and Additional Disclosures in this report.
| 4 |
Table of Contents
Calvert
VP Investment Grade Bond Index Portfolio
December 31, 2019
Endnotes and Additional Disclosures
| 1 | The views expressed in this report are those of the portfolio manager(s) and are current only through the date stated at the top of this page. These views are subject to change at any time based upon market or other conditions, and Calvert and the Fund(s) disclaim any responsibility to update such views. These views may not be relied upon as investment advice and, because investment decisions are based on many factors, may not be relied upon as an indication of trading intent on behalf of any Calvert fund. This commentary may contain statements that are not historical facts, referred to as “forward looking statements.” The Fund’s actual future results may differ significantly from those stated in any forward looking statement, depending on factors such as changes in securities or financial markets or general economic conditions, the volume of sales and purchases of Fund shares, the continuation of investment advisory, administrative and service contracts, and other risks discussed from time to time in the Fund’s filings with the Securities and Exchange Commission. |
| 2 | Bloomberg Barclays U.S. Aggregate Bond Index is an unmanaged index of domestic investment-grade bonds, including corporate, government and mortgage-backed securities. Bloomberg Barclays U.S. Corporate Bond Index measures the performance of investment-grade U.S. corporate securities with a maturity of one year or more. ICE BofAML U.S. High Yield Index is an unmanaged index of below-investment grade U.S. corporate bonds. ICE® BofAML® indices are not for redistribution or other uses; provided “as is”, without warranties, and with no liability. Eaton Vance has prepared this report and ICE Data Indices, LLC does not endorse it, or guarantee, review, or endorse Eaton Vance’s products. BofAML® is a licensed registered trademark of Bank of America Corporation in the United States and other countries. Unless otherwise stated, index returns do not reflect the effect of any applicable sales charges, commissions, expenses, taxes or leverage, as applicable. It is not possible to invest directly in an index. |
| 3 | There is no sales charge. Insurance-related charges are not included in the calculation of returns. If such charges were reflected, the returns would be lower. Please refer to the report for your insurance contract for performance data reflecting insurance-related charges. |
Performance prior to the inception date of a class may be linked to the performance of an older class of the Fund. This linked performance is adjusted for any applicable sales charge, but is not adjusted for class expense differences. If adjusted for such differences, the performance would be different. The performance of Class F is linked to Class I. Performance presented in the Financial Highlights included in the financial statements is not linked. |
Calvert Research and Management became the investment adviser to the Fund on December 31, 2016. Performance reflected prior to such date is that of the Fund’s former investment adviser. |
| 4 | Source: Fund prospectus. Net expense ratios reflect a contractual expense reimbursement that continues through 4/30/20. Without the reimbursement, performance would have been lower. The expense ratios for the current reporting period can be found in the Financial Highlights section of this report. |
| 5 | Duration is a measure of the expected change in price of a bond — in percentage terms — given a one percent change in interest rates, all else being constant. Securities with lower durations tend to be less sensitive to interest rate changes. |
| 6 | Ratings are based on Moody’s Investors Service, Inc. (“Moody’s”), S&P Global Ratings (“S&P”) or Fitch Ratings (“Fitch”), as applicable. If securities are rated differently by the ratings agencies, the highest rating is applied. Ratings, which are subject to change, apply to the creditworthiness of the issuers of the underlying securities and not to the Fund or its shares. Credit ratings measure the quality of a bond based on the issuer’s creditworthiness, with ratings ranging from AAA, being the highest, to D, being the lowest based on S&P’s measures. Ratings of BBB or higher by S&P or Fitch (Baa or higher by Moody’s) are considered to be investment-grade quality. Credit ratings are based largely on the ratings agency’s analysis at the time of rating. The rating assigned to any particular security is not necessarily a reflection of the issuer’s current financial condition and does not necessarily reflect its assessment of the volatility of a security’s market value or of the liquidity of an investment in the security. |
| 5 |
Table of Contents
Calvert
VP Investment Grade Bond Index Portfolio
December 31, 2019
Example
As a Fund shareholder, you incur ongoing costs, including management fees; distribution and/or service fees; and other Fund expenses. This Example is intended to help you understand your ongoing costs (in dollars) of Fund investing and to compare these costs with the ongoing costs of investing in other mutual funds. The Example is based on an investment of $1,000 invested at the beginning of the period and held for the entire period (July 1, 2019 to December 31, 2019).
Actual Expenses
The first section of the table below provides information about actual account values and actual expenses. You may use the information in this section, together with the amount you invested, to estimate the expenses that you paid over the period. Simply divide your account value by $1,000 (for example, an $8,600 account value divided by $1,000 = 8.6), then multiply the result by the number in the first section under the heading entitled “Expenses Paid During Period” to estimate the expenses you paid on your account during this period.
Hypothetical Example for Comparison Purposes
The second section of the table below provides information about hypothetical account values and hypothetical expenses based on the actual Fund expense ratio and an assumed rate of return of 5% per year (before expenses), which is not the actual Fund return. The hypothetical account values and expenses may not be used to estimate the actual ending account balance or expenses you paid for the period. You may use this information to compare the ongoing costs of investing in the Fund and other funds. To do so, compare this 5% hypothetical example with the 5% hypothetical examples that appear in the shareholder reports of the other funds.
Please note that the expenses shown in the table are meant to highlight your ongoing costs only and do not reflect expenses and charges which are, or may be imposed under the variable annuity contract or variable life insurance policy (variable contracts) (if applicable) through which your investment in the Fund is made. Therefore, the second section of the table is useful in comparing ongoing costs associated with an investment in vehicles which fund benefits under variable contracts, and will not help you determine the relative total costs of investing in the Fund through variable contracts. In addition, if these expenses and charges imposed under the variable contracts were included, your costs would have been higher.
| Beginning Account Value (7/1/19) | Ending Account Value (12/31/19) | Expenses Paid During Period* (7/1/19 – 12/31/19) | Annualized Expense Ratio | |||||||||||||
Actual | ||||||||||||||||
Class I | $ | 1,000.00 | $ | 1,023.10 | $ | 1.63 | ** | 0.32 | % | |||||||
Class F | $ | 1,000.00 | $ | 1,021.70 | $ | 2.90 | ** | 0.57 | % | |||||||
Hypothetical | ||||||||||||||||
(5% return per year before expenses) | ||||||||||||||||
Class I | $ | 1,000.00 | $ | 1,023.59 | $ | 1.63 | ** | 0.32 | % | |||||||
Class F | $ | 1,000.00 | $ | 1,022.33 | $ | 2.91 | ** | 0.57 | % | |||||||
| * | Expenses are equal to the Fund’s annualized expense ratio for the indicated Class, multiplied by the average account value over the period, multiplied by 184/365 (to reflect theone-half year period). The Example assumes that the $1,000 was invested at the net asset value per share determined at the close of business on June 30, 2019. Expenses shown do not include insurance-related charges. |
| ** | Absent a waiver and/or reimbursement of expenses by an affiliate, expenses would be higher. |
| 6 |
Table of Contents
Calvert
VP Investment Grade Bond Index Portfolio
December 31, 2019
| Asset-Backed Securities — 0.3% |
| |||||||
| Security | Principal Amount (000’s omitted) | Value | ||||||
American Express Credit Account Master Trust,Series 2019-1, Class A, 2.87%, 10/15/24 | $ | 300 | $ | 306,786 | ||||
Avis Budget Rental Car Funding AESOP, LLC,Series 2014-2A, Class A, 2.50%, 2/20/21(1) | 50 | 50,004 | ||||||
MVW Owner Trust, Series2013-1A, Class A, 2.15%, 4/22/30(1) | 10 | 10,065 | ||||||
Total Asset-Backed Securities |
| $ | 366,855 | |||||
| Commercial Mortgage-Backed Securities — 2.2% |
| |||||||
| Security | Principal Amount (000’s omitted) | Value | ||||||
Citigroup Commercial Mortgage Trust: | ||||||||
Series 2013-GC17, Class A4, 4.131%, 11/10/46 | $ | 422 | $ | 448,308 | ||||
Series 2014-GC21, Class A5, 3.855%, 5/10/47 | 645 | 682,559 | ||||||
UBS-Barclays Commercial Mortgage Trust,Series 2012-C4, Class A5, 2.85%, 12/10/45 | 625 | 635,365 | ||||||
Wells Fargo Commercial Mortgage Trust,Series 2015-C26, Class A4, 3.166%, 2/15/48 | 1,275 | 1,321,889 | ||||||
Total Commercial Mortgage-Backed Securities |
| $ | 3,088,121 | |||||
| Corporate Bonds — 26.8% |
| |||||||
| Security | Principal Amount (000’s omitted) | Value | ||||||
| Basic Materials — 0.7% | ||||||||
Barrick North America Finance, LLC, 5.75%, 5/1/43 | $ | 100 | $ | 127,209 | ||||
Dow Chemical Co. (The), 4.375%, 11/15/42 | 100 | 107,139 | ||||||
Ecolab, Inc., 4.35%, 12/8/21 | 122 | 127,756 | ||||||
LYB International Finance BV, 5.25%, 7/15/43 | 100 | 118,025 | ||||||
Reliance Steel & Aluminum Co., 4.50%, 4/15/23 | 200 | 211,397 | ||||||
Sherwin-Williams Co. (The), 4.20%, 1/15/22 | 300 | 311,449 | ||||||
| $ | 1,002,975 | |||||||
| Communications — 4.2% | ||||||||
AT&T, Inc.: | ||||||||
3.90%, 3/11/24 | $ | 200 | $ | 212,715 | ||||
4.00%, 1/15/22 | 290 | 301,471 | ||||||
4.90%, 6/15/42 | 200 | 228,562 | ||||||
5.375%, 10/15/41 | 100 | 119,104 | ||||||
5.45%, 3/1/47 | 1,000 | 1,240,501 | ||||||
| Security | Principal Amount (000’s omitted) | Value | ||||||
| Communications (continued) | ||||||||
Charter Communications Operating, LLC / Charter Communications Operating Capital, 4.908%, 7/23/25 | $ | 500 | $ | 550,780 | ||||
Comcast Corp., 3.125%, 7/15/22 | 100 | 103,122 | ||||||
Discovery Communications, LLC, 4.125%, 5/15/29 | 200 | 216,056 | ||||||
NBCUniversal Media, LLC: | ||||||||
2.875%, 1/15/23 | 100 | 102,797 | ||||||
4.45%, 1/15/43 | 200 | 233,205 | ||||||
Rogers Communications, Inc., 3.625%, 12/15/25 | 1,000 | 1,066,305 | ||||||
Verizon Communications, Inc., 5.15%, 9/15/23 | 300 | 332,787 | ||||||
Walt Disney Co. (The), 5.40%, 10/1/43 | 100 | 136,076 | ||||||
WPP Finance 2010, 3.75%, 9/19/24 | 1,000 | 1,055,044 | ||||||
| $ | 5,898,525 | |||||||
| Consumer, Cyclical — 2.2% | ||||||||
Cintas Corp. No. 2, 3.25%, 6/1/22 | $ | 350 | $ | 359,992 | ||||
Ford Motor Co., 5.291%, 12/8/46 | 1,000 | 949,927 | ||||||
Ford Motor Credit Co., LLC, 5.875%, 8/2/21 | 200 | 209,386 | ||||||
General Motors Co., 5.00%, 4/1/35 | 1,000 | 1,033,412 | ||||||
Lowe’s Cos., Inc., 3.875%, 9/15/23 | 100 | 106,097 | ||||||
Wal-Mart Stores, Inc., 6.50%, 8/15/37 | 250 | 370,479 | ||||||
| $ | 3,029,293 | |||||||
| Consumer,Non-cyclical — 3.9% | ||||||||
AbbVie, Inc., 2.90%, 11/6/22 | $ | 200 | $ | 204,134 | ||||
Amgen, Inc., 4.10%, 6/15/21 | 700 | 719,388 | ||||||
Anheuser-Busch InBev Finance, Inc.: | ||||||||
4.00%, 1/17/43 | 100 | 106,877 | ||||||
4.625%, 2/1/44 | 1,000 | 1,132,877 | ||||||
Conagra Brands, Inc., 4.85%, 11/1/28 | 300 | 344,040 | ||||||
CVS Health Corp., 4.30%, 3/25/28 | 500 | 546,063 | ||||||
CVS Pass-Through Trust, 6.036%, 12/10/28 | 74 | 82,142 | ||||||
Dr Pepper Snapple Group, Inc., 3.20%, 11/15/21 | 75 | 76,202 | ||||||
Equifax, Inc., 3.30%, 12/15/22 | 450 | 463,225 | ||||||
Gilead Sciences, Inc., 3.70%, 4/1/24 | 100 | 106,037 | ||||||
Kroger Co. (The), 3.85%, 8/1/23 | 100 | 105,767 | ||||||
Laboratory Corporation of America Holdings, 4.00%, 11/1/23 | 100 | 105,826 | ||||||
Molson Coors Brewing Co., 5.00%, 5/1/42 | 100 | 109,265 | ||||||
Pfizer, Inc., 4.40%, 5/15/44 | 1,000 | 1,192,454 | ||||||
Tyson Foods, Inc., 3.95%, 8/15/24 | 100 | 107,207 | ||||||
Zoetis, Inc., 4.70%, 2/1/43 | 100 | 119,033 | ||||||
| $ | 5,520,537 | |||||||
| 7 | See Notes to Financial Statements. |
Table of Contents
Calvert
VP Investment Grade Bond Index Portfolio
December 31, 2019
Schedule of Investments — continued
| Security | Principal Amount (000’s omitted) | Value | ||||||
| Energy — 3.8% | ||||||||
BP Capital Markets PLC, 2.50%, 11/6/22 | $ | 500 | $ | 509,231 | ||||
CNOOC Curtis Funding No. 1 Pty., Ltd., 4.50%, 10/3/23(1) | 100 | 107,209 | ||||||
Colonial Pipeline Co., 6.58%, 8/28/32(1) | 100 | 133,856 | ||||||
HollyFrontier Corp., 5.875%, 4/1/26 | 1,000 | 1,127,217 | ||||||
Shell International Finance BV: | ||||||||
2.25%, 1/6/23 | 200 | 201,662 | ||||||
4.125%, 5/11/35 | 1,350 | 1,578,716 | ||||||
4.55%, 8/12/43 | 100 | 121,986 | ||||||
Texas Eastern Transmission LP, 2.80%, 10/15/22(1) | 400 | 403,923 | ||||||
TransCanada PipeLines Ltd., 4.875%, 1/15/26 | 1,000 | 1,119,642 | ||||||
TransContinental Gas Pipe Line Co., LLC, 4.45%, 8/1/42 | 100 | 105,278 | ||||||
| $ | 5,408,720 | |||||||
| Financial — 6.3% | ||||||||
American International Group, Inc., 4.875%, 6/1/22 | $ | 250 | $ | 266,865 | ||||
Australia & New Zealand Banking Group, Ltd., 4.875%, 1/12/21(1) | 800 | 822,717 | ||||||
Bank of America Corp., 4.125%, 1/22/24 | 300 | 322,860 | ||||||
Berkshire Hathaway Finance Corp.: | ||||||||
3.00%, 5/15/22 | 200 | 205,454 | ||||||
4.30%, 5/15/43 | 1,000 | 1,154,850 | ||||||
Boston Properties, L.P., 3.85%, 2/1/23 | 100 | 104,786 | ||||||
Capital One Bank, 3.375%, 2/15/23 | 200 | 206,640 | ||||||
Citigroup, Inc.: | ||||||||
4.075% to 4/23/28, 4/23/29(2) | 500 | 547,853 | ||||||
5.50%, 9/13/25 | 80 | 91,453 | ||||||
Discover Financial Services, 3.85%, 11/21/22 | 200 | 209,101 | ||||||
ERP Operating LP, 4.625%, 12/15/21 | 100 | 104,479 | ||||||
Excalibur One 77B, LLC, 1.492%, 1/1/25 | 19 | 19,198 | ||||||
General Electric Co., 4.625%, 1/7/21 | 100 | 102,250 | ||||||
Goldman Sachs Group, Inc. (The): | ||||||||
4.00%, 3/3/24 | 500 | 532,744 | ||||||
5.375%, 3/15/20 | 150 | 151,050 | ||||||
JPMorgan Chase & Co.: | ||||||||
3.375%, 5/1/23 | 700 | 727,477 | ||||||
4.50%, 1/24/22 | 400 | 419,995 | ||||||
Liberty Property LP, 3.375%, 6/15/23 | 350 | 363,845 | ||||||
MetLife, Inc., 4.875%, 11/13/43 | 100 | 123,823 | ||||||
Morgan Stanley: | ||||||||
4.10%, 5/22/23 | 500 | 528,149 | ||||||
5.00%, 11/24/25 | 150 | 168,949 | ||||||
Prudential Financial, Inc., 5.10%, 8/15/43 | 1,000 | 1,176,412 | ||||||
| Security | Principal Amount (000’s omitted) | Value | ||||||
| Financial (continued) | ||||||||
SunTrust Banks, Inc., 2.90%, 3/3/21 | $ | 200 | $ | 202,101 | ||||
Wells Fargo & Co., 2.625%, 7/22/22 | 400 | 405,906 | ||||||
| $ | 8,958,957 | |||||||
| Industrial — 2.7% | ||||||||
BNSF Funding Trust I, 6.613% to 1/15/26, 12/15/55 (2) | $ | 540 | $ | 605,621 | ||||
Cummins, Inc., 4.875%, 10/1/43 | 100 | 123,184 | ||||||
Deere & Co., 6.55%, 10/1/28 | 250 | 321,832 | ||||||
GATX Corp., 4.85%, 6/1/21 | 900 | 934,336 | ||||||
General Electric Co., 3.375%, 3/11/24 | 400 | 414,335 | ||||||
Parker-Hannifin Corp., 3.25%, 3/1/27 | 200 | 208,584 | ||||||
Stanley Black & Decker, Inc., 2.90%, 11/1/22 | 650 | 664,965 | ||||||
United Parcel Service, Inc., 6.20%, 1/15/38 | 250 | 348,132 | ||||||
United Technologies Corp., 4.50%, 6/1/42 | 100 | 119,771 | ||||||
| $ | 3,740,760 | |||||||
| Technology — 1.8% | ||||||||
Apple, Inc., 3.85%, 5/4/43 | $ | 1,100 | $ | 1,233,647 | ||||
Broadcom Corp. / Broadcom Cayman Finance, Ltd.: | ||||||||
3.125%, 1/15/25 | 200 | 202,462 | ||||||
3.875%, 1/15/27 | 500 | 519,276 | ||||||
Dell International, LLC / EMC Corp., 5.30%, 10/1/29 (1) | 250 | 281,752 | ||||||
International Business Machines Corp.: | ||||||||
2.90%, 11/1/21 | 100 | 101,828 | ||||||
3.625%, 2/12/24 | 100 | 105,964 | ||||||
NetApp, Inc., 3.25%, 12/15/22 | 100 | 102,923 | ||||||
| $ | 2,547,852 | |||||||
| Utilities — 1.2% | ||||||||
Duke Energy Corp., 3.15%, 8/15/27 | $ | 500 | $ | 515,131 | ||||
PacifiCorp, 4.10%, 2/1/42 | 100 | 111,517 | ||||||
Public Service Electric & Gas Co., 3.95%, 5/1/42 | 1,000 | 1,108,550 | ||||||
| $ | 1,735,198 | |||||||
Total Corporate Bonds |
| $ | 37,842,817 | |||||
| 8 | See Notes to Financial Statements. |
Table of Contents
Calvert
VP Investment Grade Bond Index Portfolio
December 31, 2019
Schedule of Investments — continued
| Floating Rate Loans(3) — 0.0%(4) | ||||||||
| Security | Principal Amount (000’s omitted) | Value | ||||||
| Financial — 0.0%(4) | ||||||||
Alliance Mortgage Investments, Term Loan, 0.00%, 6/1/10(5)(6)(7) | $ | 96 | $ | 1,520 | ||||
Total Floating Rate Loans |
| $ | 1,520 | |||||
| Sovereign Government Bonds — 0.8% |
| |||||||
| Security | Principal Amount (000’s omitted) | Value | ||||||
Mexico Government International Bond, 5.55%, 1/21/45(8) | $ | 500 | $ | 617,217 | ||||
Province of Ontario Canada, 2.45%, 6/29/22 | 400 | 406,118 | ||||||
Province of Quebec Canada, 2.625%, 2/13/23(8) | 75 | 76,979 | ||||||
Total Sovereign Government Bonds |
| $ | 1,100,314 | |||||
| Taxable Municipal Obligations — 0.7% |
| |||||||
| Security | Principal Amount (000’s omitted) | Value | ||||||
| General Obligations — 0.7% | ||||||||
New York, NY, 3.60%, 8/1/28 | $ | 1,000 | $ | 1,054,870 | ||||
Total Taxable Municipal Obligations |
| $ | 1,054,870 | |||||
| U.S. Government Agencies and Instrumentalities — 3.3% |
| |||||||
| Security | Principal Amount (000’s omitted) | Value | ||||||
Federal Home Loan Bank, 2.375%, 3/30/20 | $ | 1,100 | $ | 1,102,125 | ||||
Federal Home Loan Mortgage Corp.: | ||||||||
1.625%, 9/29/20 | 1,000 | 1,000,011 | ||||||
6.75%, 3/15/31 | 1,300 | 1,882,582 | ||||||
Federal National Mortgage Association: | ||||||||
2.00%, 1/5/22 | 400 | 403,119 | ||||||
2.125%, 4/24/26 | 300 | 304,400 | ||||||
Total U.S. Government Agencies and Instrumentalities |
| $ | 4,692,237 | |||||
| U.S. Government Agency Mortgage-Backed Securities — 26.1% |
| |||||||
| Security | Principal Amount (000’s omitted) | Value | ||||||
Federal Home Loan Mortgage Corp.: | ||||||||
2.50%, with various maturities to 2035 | $ | 2,203 | $ | 2,229,854 | ||||
3.00%, with maturity at 1/1/43 | 836 | 860,482 | ||||||
3.50%, with various maturities to 2048 | 1,612 | 1,689,553 | ||||||
4.00%, with various maturities to 2048 | 1,120 | 1,179,923 | ||||||
4.50%, with various maturities to 2044 | 1,414 | 1,531,235 | ||||||
5.00%, with various maturities to 2040 | 943 | 1,042,343 | ||||||
6.00%, with various maturities to 2040 | 71 | 81,844 | ||||||
6.50%, with maturity at 10/1/37 | 14 | 15,635 | ||||||
Federal National Mortgage Association: | ||||||||
2.50%, with various maturities to 2043 | 2,488 | 2,506,429 | ||||||
3.00%, with various maturities to 2049 | 6,801 | 6,996,430 | ||||||
3.50%, with various maturities to 2049 | 7,984 | 8,336,558 | ||||||
3.933%, (1 yr. USD LIBOR + 1.723%), with maturity at 9/1/38(9) | 157 | 165,225 | ||||||
4.00%, with various maturities to 2047 | 4,138 | 4,382,564 | ||||||
4.50%, with various maturities to 2044 | 2,201 | 2,379,575 | ||||||
5.00%, with various maturities to 2034 | 102 | 112,318 | ||||||
5.50%, with various maturities to 2038 | 457 | 511,444 | ||||||
6.00%, with various maturities to 2038 | 436 | 501,049 | ||||||
6.50%, with various maturities to 2036 | 85 | 95,541 | ||||||
Government National Mortgage Association: | ||||||||
4.00%, with various maturities to 2042 | 1,109 | 1,174,073 | ||||||
4.50%, with maturity at 7/20/33 | 128 | 138,101 | ||||||
5.00%, with various maturities to 2039 | 504 | 558,269 | ||||||
5.50%, with maturity at 7/20/34 | 57 | 63,482 | ||||||
6.00%, with various maturities to 2038 | 367 | 419,970 | ||||||
Total U.S. Government Agency Mortgage-Backed Securities |
| $ | 36,971,897 | |||||
| U.S. Treasury Obligations — 38.3% | ||||||||
| Security | Principal Amount (000’s omitted) | Value | ||||||
U.S. Treasury Bonds: | ||||||||
2.25%, 8/15/49(8) | $ | 650 | $ | 630,004 | ||||
2.50%, 2/15/45 | 1,000 | 1,019,477 | ||||||
3.00%, 5/15/42 | 1,000 | 1,111,640 | ||||||
3.00%, 5/15/47 | 1,000 | 1,122,586 | ||||||
3.125%, 11/15/41 | 1,000 | 1,133,415 | ||||||
3.125%, 8/15/44 | 1,600 | 1,818,557 | ||||||
3.125%, 5/15/48 | 750 | 862,868 | ||||||
3.75%, 11/15/43 | 1,045 | 1,305,717 | ||||||
3.875%, 8/15/40 | 1,000 | 1,259,479 | ||||||
| 9 | See Notes to Financial Statements. |
Table of Contents
Calvert
VP Investment Grade Bond Index Portfolio
December 31, 2019
Schedule of Investments — continued
| Security | Principal Amount (000’s omitted) | Value | ||||||
U.S. Treasury Bonds: (continued) | ||||||||
4.375%, 5/15/41 | $ | 1,200 | $ | 1,616,405 | ||||
6.25%, 8/15/23 | 1,000 | 1,161,628 | ||||||
8.00%, 11/15/21 | 1,000 | 1,117,248 | ||||||
8.125%, 5/15/21 | 1,000 | 1,088,335 | ||||||
U.S. Treasury Notes: | ||||||||
1.125%, 4/30/20 | 1,000 | 998,314 | ||||||
1.625%, 11/15/22(8) | 2,500 | 2,500,810 | ||||||
1.75%, 5/15/22 | 1,600 | 1,605,593 | ||||||
1.875%, 7/31/22 | 1,250 | 1,258,524 | ||||||
1.875%, 7/31/26 | 1,100 | 1,103,779 | ||||||
2.00%, 2/15/22 | 2,000 | 2,016,816 | ||||||
2.00%, 2/15/25 | 1,500 | 1,520,633 | ||||||
2.125%, 8/15/21 | 150 | 151,253 | ||||||
2.125%, 9/30/24 | 2,750 | 2,802,962 | ||||||
2.25%, 3/31/21 | 200 | 201,547 | ||||||
2.25%, 11/15/24 | 2,000 | 2,051,019 | ||||||
2.25%, 3/31/26 | 1,000 | 1,026,631 | ||||||
2.25%, 2/15/27 | 2,100 | 2,156,912 | ||||||
2.25%, 11/15/27 | 1,750 | 1,797,850 | ||||||
2.625%, 8/15/20 | 2,750 | 2,766,675 | ||||||
2.625%, 11/15/20 | 3,000 | 3,025,279 | ||||||
2.625%, 6/30/23 | 250 | 258,301 | ||||||
2.625%, 2/15/29 | 1,000 | 1,059,245 | ||||||
2.75%, 11/15/23 | 1,000 | 1,040,278 | ||||||
2.75%, 2/15/24 | 3,000 | 3,127,404 | ||||||
3.125%, 5/15/21 | 3,500 | 3,571,421 | ||||||
3.125%, 11/15/28 | 800 | 879,206 | ||||||
3.625%, 2/15/20 | 1,000 | 1,002,330 | ||||||
3.625%, 2/15/21 | 1,000 | 1,021,876 | ||||||
Total U.S. Treasury Obligations |
| $ | 54,192,017 | |||||
| Short-Term Investments — 2.3% |
| |||||||
| Security | Shares | Value | ||||||
State Street Navigator Securities Lending Government Money Market Portfolio, 1.56%(10) | 3,219,829 | $ | 3,219,829 | |||||
Total Short-Term Investments |
| $ | 3,219,829 | |||||
Total Investments |
| $ | 142,530,477 | |||||
Other Assets, Less Liabilities — (0.8%) |
| $ | (1,096,823 | ) | ||||
Net Assets — 100.0% |
| $ | 141,433,654 | |||||
The percentage shown for each investment category in the Schedule of Investments is based on net assets.
Notes to Schedule of Investments
| (1) | Security is exempt from registration under Rule 144A of the Securities Act of 1933. These securities may be resold in transactions exempt from registration, normally to qualified institutional buyers. Total market value of Rule 144A securities amounts to $1,809,526, which represents 1.3% of the net assets of the Fund as of December 31, 2019. |
| (2) | Security converts to variable rate after the indicated fixed-rate coupon period. |
| (3) | Floating rate loans are generally considered restrictive in that the Fund is ordinarily contractually obligated to receive consent from the Agent Bank and/or Borrower prior to disposition of a floating rate loan. |
| (4) | Amount is less than 0.05%. |
| (5) | For fair value measurement disclosure purposes, security is categorized as Level 3 (see Note 1A). |
| (6) | Alliance Bancorp and its affiliates filed for Chapter 7 bankruptcy on July 13, 2007. This security is no longer accruing interest. |
| (7) | Restricted security. Total market value of restricted securities amounts to $1,520, which represents less than 0.05% of the net assets of the Fund as of December 31, 2019. |
| (8) | All or a portion of this security was on loan at December 31, 2019. The aggregate market value of securities on loan at December 31, 2019 was $3,755,195. |
| (9) | Adjustable rate mortgage security whose interest rate generally adjusts monthly based on a weighted average of interest rates on the underlying mortgages. The coupon rate may not reflect the applicable index value as interest rates on the underlying mortgages may adjust on various dates and at various intervals and may be subject to lifetime ceilings and lifetime floors and lookback periods. Rate shown is the coupon rate at December 31, 2019. |
| (10) | Represents investment of cash collateral received in connection with securities lending. |
| 10 | See Notes to Financial Statements. |
Table of Contents
Calvert
VP Investment Grade Bond Index Portfolio
December 31, 2019
Schedule of Investments — continued
| Restricted Securities | ||||||||
| Description | Acquisition Dates | Cost | ||||||
Alliance Mortgage Investments, Term Loan, 0.00%, 6/1/10 | 5/26/05-6/13/07 | $ | 96,336 | |||||
Abbreviations:
| LIBOR | – | London Interbank Offered Rate | ||
Currency Abbreviations:
| USD | – | United States Dollar | ||
| 11 | See Notes to Financial Statements. |
Table of Contents
Calvert
VP Investment Grade Bond Index Portfolio
December 31, 2019
Statement of Assets and Liabilities
| Assets | December 31, 2019 | |||
Investments in securities of unaffiliated issuers, at value (identified cost $135,667,453) - including | $ | 142,530,477 | ||
Cash | 1,986,308 | |||
Receivable for capital shares sold | 131,142 | |||
Interest receivable | 921,317 | |||
Securities lending income receivable | 384 | |||
Receivable from affiliate | 13,905 | |||
Directors’ deferred compensation plan | 27,457 | |||
Other assets | 7,912 | |||
Total assets | $ | 145,618,902 | ||
| Liabilities | ||||
Payable for investments purchased | $ | 796,607 | ||
Payable for capital shares redeemed | 23,663 | |||
Deposits for securities loaned | 3,219,829 | |||
Payable to affiliates: | ||||
Investment advisory fee | 23,954 | |||
Administrative fee | 14,372 | |||
Distribution and service fees | 266 | |||
Sub-transfer agency fee | 83 | |||
Directors’ deferred compensation plan | 27,457 | |||
Accrued expenses | 79,017 | |||
Total liabilities | $ | 4,185,248 | ||
Net Assets | $ | 141,433,654 | ||
| Sources of Net Assets | ||||
Paid-in capital | $ | 132,708,356 | ||
Distributable earnings | 8,725,298 | |||
Total | $ | 141,433,654 | ||
| Class I | ||||
Net Assets | $ | 140,168,935 | ||
Shares Outstanding | 2,517,434 | |||
Net Asset Value, Offering Price and Redemption Price Per Share | ||||
(net assets ÷ shares of beneficial interest outstanding) | $ | 55.68 | ||
| Class F | ||||
Net Assets | $ | 1,264,719 | ||
Shares Outstanding | 23,006 | |||
Net Asset Value, Offering Price and Redemption Price Per Share | ||||
(net assets ÷ shares of beneficial interest outstanding) | $ | 54.97 | ||
| 12 | See Notes to Financial Statements. |
Table of Contents
Calvert
VP Investment Grade Bond Index Portfolio
December 31, 2019
Statement of Operations
| Investment Income | Year Ended December 31, 2019 | |||
Interest income | $ | 4,285,801 | ||
Securities lending income, net | 2,514 | |||
Total investment income | $ | 4,288,315 | ||
| Expenses | ||||
Investment advisory fee | $ | 283,291 | ||
Administrative fee | 169,975 | |||
Distribution and service fees: | ||||
Class F | 1,881 | |||
Directors’ fees and expenses | 8,357 | |||
Custodian fees | 17,347 | |||
Transfer agency fees and expenses | 12,961 | |||
Accounting fees | 34,035 | |||
Professional fees | 41,171 | |||
Reports to shareholders | 30,856 | |||
Miscellaneous | 16,263 | |||
Total expenses | $ | 616,137 | ||
Waiver and/or reimbursement of expenses by affiliate | $ | (157,774 | ) | |
Reimbursement of expenses - other | (3,217 | ) | ||
Net expenses | $ | 455,146 | ||
Net investment income | $ | 3,833,169 | ||
| Realized and Unrealized Gain (Loss) | ||||
Net realized gain (loss): | ||||
Investment securities | $ | 79,167 | ||
Net realized gain | $ | 79,167 | ||
Change in unrealized appreciation (depreciation): | ||||
Investment securities | $ | 7,563,201 | ||
Net change in unrealized appreciation (depreciation) | $ | 7,563,201 | ||
Net realized and unrealized gain | $ | 7,642,368 | ||
Net increase in net assets resulting from operations | $ | 11,475,537 | ||
| 13 | See Notes to Financial Statements. |
Table of Contents
Calvert
VP Investment Grade Bond Index Portfolio
December 31, 2019
Statements of Changes in Net Assets
| Year Ended December 31, | ||||||||
| Increase (Decrease) in Net Assets | 2019 | 2018 | ||||||
From operations: | ||||||||
Net investment income | $ | 3,833,169 | $ | 4,261,351 | ||||
Net realized gain (loss) | 79,167 | (128,338 | ) | |||||
Net change in unrealized appreciation (depreciation) | 7,563,201 | (5,189,619 | ) | |||||
Net increase (decrease) in net assets from operations | $ | 11,475,537 | $ | (1,056,606 | ) | |||
Distributions to shareholders: | ||||||||
Class I | $ | (4,426,996 | ) | $ | (4,586,530 | ) | ||
Class F | (33,669 | ) | (14,184 | ) | ||||
Total distributions to shareholders | $ | (4,460,665 | ) | $ | (4,600,714 | ) | ||
Capital share transactions: | ||||||||
Class I | $ | (6,563,466 | ) | $ | (21,278,138 | ) | ||
Class F | 791,625 | (18,417 | ) | |||||
Net decrease in net assets from capital share transactions | $ | (5,771,841 | ) | $ | (21,296,555 | ) | ||
Net increase (decrease) in net assets | $ | 1,243,031 | $ | (26,953,875 | ) | |||
| Net Assets | ||||||||
At beginning of year | $ | 140,190,623 | $ | 167,144,498 | ||||
At end of year | $ | 141,433,654 | $ | 140,190,623 | ||||
| 14 | See Notes to Financial Statements. |
Table of Contents
Calvert
VP Investment Grade Bond Index Portfolio
December 31, 2019
Financial Highlights
| Class I | ||||||||||||||||||||
| Year Ended December 31, | ||||||||||||||||||||
| 2019 | 2018 | 2017 | 2016 | 2015 | ||||||||||||||||
Net asset value — Beginning of year | $ | 53.01 | $ | 54.93 | $ | 54.60 | $ | 54.84 | $ | 54.90 | ||||||||||
| Income (Loss) From Operations | ||||||||||||||||||||
Net investment income(1) | $ | 1.50 | $ | 1.50 | $ | 1.44 | $ | 1.33 | $ | 1.19 | ||||||||||
Net realized and unrealized gain (loss) | 2.96 | (1.73 | ) | 0.46 | 0.08 | (1.17 | ) | |||||||||||||
Total income (loss) from operations | $ | 4.46 | $ | (0.23 | ) | $ | 1.90 | $ | 1.41 | $ | 0.02 | |||||||||
| Less Distributions | ||||||||||||||||||||
From net investment income | $ | (1.79 | ) | $ | (1.69 | ) | $ | (1.57 | ) | $ | (1.65 | ) | $ | (0.08 | ) | |||||
Total distributions | $ | (1.79 | ) | $ | (1.69 | ) | $ | (1.57 | ) | $ | (1.65 | ) | $ | (0.08 | ) | |||||
Net asset value — End of year | $ | 55.68 | $ | 53.01 | $ | 54.93 | $ | 54.60 | $ | 54.84 | ||||||||||
Total Return(2) | 8.41 | % | (0.37 | )% | 3.49 | % | 2.59 | % | 0.04 | % | ||||||||||
| Ratios/Supplemental Data | ||||||||||||||||||||
Net assets, end of year (000’s omitted) | $ | 140,169 | $ | 139,729 | $ | 166,650 | $ | 166,414 | $ | 190,437 | ||||||||||
Ratios (as a percentage of average daily net assets):(3) | ||||||||||||||||||||
Total expenses | 0.43 | % | 0.44 | % | 0.45 | % | 0.54 | % | 0.52 | % | ||||||||||
Net expenses | 0.32 | % | 0.32 | % | 0.32 | % | 0.46 | % | 0.52 | % | ||||||||||
Net investment income | 2.71 | % | 2.81 | % | 2.60 | % | 2.34 | % | 2.16 | % | ||||||||||
Portfolio Turnover | 10 | % | 7 | % | 14 | % | 10 | % | 6 | % | ||||||||||
| (1) | Computed using average shares outstanding. |
| (2) | Returns are historical and are calculated by determining the percentage change in net asset value with all distributions reinvested and do not reflect fees and expenses imposed by variable annuity contracts or variable life insurance policies. If included, total return would be lower. |
| (3) | Total expenses do not reflect amounts reimbursed and/or waived by the adviser and certain of its affiliates, if applicable. Net expenses are net of all reductions and represent the net expenses paid by the Fund. |
| 15 | See Notes to Financial Statements. |
Table of Contents
Calvert
VP Investment Grade Bond Index Portfolio
December 31, 2019
Financial Highlights — continued
| Class F | ||||||||||||||||||||
| Year Ended December 31, | Period Ended December 31, 2015(1) | |||||||||||||||||||
| 2019 | 2018 | 2017 | 2016 | |||||||||||||||||
Net asset value — Beginning of period | $ | 52.48 | $ | 54.53 | $ | 54.36 | $ | 54.79 | $ | 55.33 | ||||||||||
| Income (Loss) From Operations | ||||||||||||||||||||
Net investment income(2) | $ | 1.33 | $ | 1.36 | $ | 1.30 | $ | 1.19 | $ | 0.19 | ||||||||||
Net realized and unrealized gain (loss) | 2.95 | (1.72 | ) | 0.44 | 0.09 | (0.62 | ) | |||||||||||||
Total income (loss) from operations | $ | 4.28 | $ | (0.36 | ) | $ | 1.74 | $ | 1.28 | $ | (0.43 | ) | ||||||||
| Less Distributions | ||||||||||||||||||||
From net investment income | $ | (1.79 | ) | $ | (1.69 | ) | $ | (1.57 | ) | $ | (1.71 | ) | $ | (0.11 | ) | |||||
Total distributions | $ | (1.79 | ) | $ | (1.69 | ) | $ | (1.57 | ) | $ | (1.71 | ) | $ | (0.11 | ) | |||||
Net asset value — End of period | $ | 54.97 | $ | 52.48 | $ | 54.53 | $ | 54.36 | $ | 54.79 | ||||||||||
Total Return(3) | 8.15 | % | (0.61 | )% | 3.21 | % | 2.36 | % | (0.78 | )%(4) | ||||||||||
| Ratios/Supplemental Data | ||||||||||||||||||||
Net assets, end of period (000’s omitted) | $ | 1,265 | $ | 461 | $ | 495 | $ | 206 | $ | 99 | ||||||||||
Ratios (as a percentage of average daily net assets):(5) | ||||||||||||||||||||
Total expenses | 0.68 | % | 0.69 | % | 1.21 | % | 3.18 | % | 0.78 | %(6) | ||||||||||
Net expenses | 0.57 | % | 0.57 | % | 0.57 | % | 0.71 | % | 0.78 | %(6) | ||||||||||
Net investment income | 2.42 | % | 2.57 | % | 2.37 | % | 2.09 | % | 2.01 | %(6) | ||||||||||
Portfolio Turnover | 10 | % | 7 | % | 14 | % | 10 | % | 6 | %(4) | ||||||||||
| (1) | From October 30, 2015 inception. |
| (2) | Computed using average shares outstanding. |
| (3) | Returns are historical and are calculated by determining the percentage change in net asset value with all distributions reinvested and do not reflect fees and expenses imposed by variable annuity contracts or variable life insurance policies. If included, total return would be lower. |
| (4) | Not annualized. |
| (5) | Total expenses do not reflect amounts reimbursed and/or waived by the adviser and certain of its affiliates, if applicable. Net expenses are net of all reductions and represent the net expenses paid by the Fund. |
| (6) | Annualized. |
| 16 | See Notes to Financial Statements. |
Table of Contents
Calvert
VP Investment Grade Bond Index Portfolio
December 31, 2019
Notes to Financial Statements
1 Significant Accounting Policies
Calvert VP Investment Grade Bond Index Portfolio (the Fund) is a diversified series of Calvert Variable Products, Inc. (the Corporation). The Corporation is a Maryland corporation registered under the Investment Company Act of 1940, as amended (the 1940 Act), as anopen-end management investment company. The investment objective of the Fund is to seek investment results that correspond to the total return performance of the bond market, as represented by the Bloomberg Barclays U.S. Aggregate Bond Index.
Shares of the Fund are sold without sales charge to insurance companies for allocation to certain of their variable separate accounts. The Fund offers Class I and Class F shares. Among other things, each class has different: (a) dividend rates due to differences in Distribution Plan expenses and other class-specific expenses; (b) exchange privileges; and (c) class-specific voting rights.
The Fund applies the accounting and reporting guidance in the Financial Accounting Standards Board (FASB) Accounting Standards Codification Topic 946,Financial Services – Investment Companies (ASC 946). Subsequent events, if any, through the date that the financial statements were issued have been evaluated in the preparation of the financial statements.
A Investment Valuation — Net asset value per share is determined every business day as of the close of the regular session of the New York Stock Exchange (generally 4:00 p.m. Eastern time). The Fund uses independent pricing services approved by the Board ofDirectors (the Board) to value its investments wherever possible. Investments for which market quotations are not available or deemed not reliable are fair valued in good faith under the direction of the Board.
U.S. generally accepted accounting principles (U.S. GAAP) establishes a disclosure hierarchy that categorizes the inputs to valuation techniques used to value assets and liabilities at measurement date. These inputs are summarized in the three broad levels listed below:
Level 1 - quoted prices in active markets for identical securities
Level 2 - other significant observable inputs (including quoted prices for similar securities, interest rates, prepayment speeds, credit risk, etc.)
Level 3 - significant unobservable inputs (including the Fund’s own assumptions in determining the fair value of investments)
The inputs or methodologies used for valuing securities are not necessarily an indication of the risk associated with investing in those securities.
Valuation techniques used to value the Fund’s investments by major category are as follows:
Debt Securities.Debt securities are generally valued on the basis of valuations provided by third party pricing services, as derived from such services’ pricing models. Inputs to the models may include, but are not limited to, reported trades, executable bid and ask prices, broker/dealer quotations, prices or yields of securities with similar characteristics, interest rates, anticipated prepayments, benchmark curves or information pertaining to the issuer, as well as industry and economic events. Accordingly, debt securities are generally categorized as Level 2 in the hierarchy. Short-term debt securities with a remaining maturity at time of purchase of more than sixty days are valued on the basis of valuations provided by a third party pricing service. Such securities are generally categorized as Level 2 in the hierarchy. Short-term debt securities of sufficient credit quality purchased with remaining maturities of sixty days or less are valued at amortized cost, which approximates fair value, and are categorized as Level 2 in the hierarchy.
Floating Rate Loans. Interests in floating rate loans for which reliable market quotations are readily available are valued generally at the average mean of bid and ask quotations obtained from a third party pricing service, and are categorized as Level 2 in the hierarchy.
Other Securities.Investments in registered investment companies (including money market funds) that do not trade on an exchange are valued at the net asset value per share on the valuation day and are categorized as Level 1 in the hierarchy.
Fair Valuation.If a market value cannot be determined for a security using the methodologies described above, or if, in the good faith opinion of the Fund’s adviser, the market value does not constitute a readily available market quotation, or if a significant event has occurred that would materially affect the value of the security, the security will be fair valued as determined in good faith by or at the direction of the Board in a manner that most fairly reflects the security’s “fair value”, which is the amount that the Fund might reasonably expect to receive for the security upon its current sale in the ordinary course. Each such determination is based on a consideration of relevant factors, which are likely to vary from one pricing context to another. These factors may include, but are not limited to, the type of security, the existence of any contractual restrictions on the security’s disposition, the price and extent of public trading in similar securities of the issuer or of comparable companies or entities, quotations or relevant information obtained from broker/dealers or other market participants, information obtained from the issuer, analysts, and/or the appropriate stock exchange (for exchange-traded securities), an analysis of the company’s or entity’s financial statements, and an evaluation of the forces that influence the issuer and the market(s) in which the security is purchased and sold.
The values assigned to fair value investments are based on available information and do not necessarily represent amounts that might ultimately be realized. Further, due to the inherent uncertainty of valuations of such investments, the fair values may differ significantly from the values that would have been used had an active market existed, and the differences could be material.
| 17 |
Table of Contents
Calvert
VP Investment Grade Bond Index Portfolio
December 31, 2019
Notes to Financial Statements — continued
The following table summarizes the market value of the Fund’s holdings as of December 31, 2019, based on the inputs used to value them:
| Asset Description | Level 1 | Level 2 | Level 3(1) | Total | ||||||||||||
Asset-Backed Securities | $ | — | $ | 366,855 | $ | — | $ | 366,855 | ||||||||
Commercial Mortgage-Backed Securities | — | 3,088,121 | — | 3,088,121 | ||||||||||||
Corporate Bonds | — | 37,842,817 | — | 37,842,817 | ||||||||||||
Floating Rate Loans | — | — | 1,520 | 1,520 | ||||||||||||
Sovereign Government Bonds | — | 1,100,314 | — | 1,100,314 | ||||||||||||
Taxable Municipal Obligations | — | 1,054,870 | — | 1,054,870 | ||||||||||||
U.S. Government Agencies and Instrumentalities | — | 4,692,237 | — | 4,692,237 | ||||||||||||
U.S. Government Agency Mortgage-Backed Securities | — | 36,971,897 | — | 36,971,897 | ||||||||||||
U.S. Treasury Obligations | — | 54,192,017 | — | 54,192,017 | ||||||||||||
Short-Term Investments | 3,219,829 | — | — | 3,219,829 | ||||||||||||
Total Investments | $ | 3,219,829 | $ | 139,309,128 | $ | 1,520 | $ | 142,530,477 | ||||||||
| (1) | None of the unobservable inputs for Level 3 assets, individually or collectively, had a material impact on the Fund. |
Level 3 investments at the beginning and/or end of the period in relation to net assets were not significant and accordingly, a reconciliation of Level 3 assets for the year ended December 31, 2019 is not presented.
B Investment Transactions and Income — Investment transactions for financial statement purposes are accounted for on trade date. Realized gains and losses are recorded on an identified cost basis and may include proceeds from litigation. Interest income, which includes amortization of premium and accretion of discount on debt securities, is accrued as earned.
C Share Class Accounting — Realized and unrealized gains and losses and net investment income and losses, other than class-specific expenses, are allocated daily to each class of shares based upon the relative net assets of each class to the total net assets of the Fund. Expenses arising in connection with a specific class are charged directly to that class.
D Floating Rate Loans — The Fund may invest in direct debt instruments, which are interests in amounts owed to lenders or lending syndicates by corporate, governmental, or other borrowers. The Fund’s investment in loans may be in the form of participations in loans or assignments of all or a portion of loans from third parties. A loan is often administered by a bank or other financial institution (the lender) that acts as agent for all holders. The agent administers the terms of the loan, as specified in the loan agreement. The Fund may invest in multiple series or tranches of a loan, which may have varying terms and carry different associated risks. When the Fund purchases assignments from lenders, it acquires direct rights against the borrower of the loan. When investing in a loan participation, the Fund has the right to receive payments of principal, interest and any fees to which it is entitled only from the lender selling the loan agreement and only upon receipt of such payments by the lender from the borrower. The Fund generally has no right to enforce compliance by the borrower with the terms of the loan agreement. As a result, the Fund may be subject to the credit risk of both the borrower and the lender that is issuing the participation interest.
E Restricted Securities — The Fund may invest in securities that are subject to legal or contractual restrictions on resale. Generally, these securities may only be sold publicly upon registration under the Securities Act of 1933 or in transactions exempt from such registration. Information regarding restricted securities (excluding Rule 144A securities) is included at the end of the Schedule of Investments.
F Distributions to Shareholders — Distributions to shareholders are recorded by the Fund onex-dividend date. The Fund distributes any net investment income and net realized capital gains at least annually. Both types of distributions are made in shares of the Fund unless an election is made on behalf of a separate account to receive some or all of the distributions in cash. Distributions are declared separately for each class of shares. Distributions are determined in accordance with income tax regulations which may differ from U.S. GAAP; accordingly, periodic reclassifications are made within theFund’s capital accounts to reflect income and gains available for distribution under income tax regulations.
G Estimates — The preparation of financial statements in conformity with U.S. GAAP requires management to make estimates and assumptions that affect the reported amounts of assets and liabilities and disclosure of contingent assets and liabilities at the date of the financial statements and the reported amounts of increases and decreases in net assets from operations during the reporting period. Actual results could differ from those estimates.
H Indemnifications — The Corporation’sBy-Laws provide for indemnification for Directors or officers of the Corporation and certain other parties, to the fullest extent permitted by Maryland law and the 1940 Act, provided certain conditions are met. Additionally, in the normal course of business, the Fund enters into agreements with service providers that may contain indemnification clauses. The Fund’s maximum exposure under these arrangements is unknown as this would involve future claims that may be made against the Fund that have not yet occurred.
I Federal Income Taxes — No provision for federal income or excise tax is required since the Fund intends to continue to qualify as a regulated investment company under the Internal Revenue Code and to distribute substantially all of its taxable earnings.
| 18 |
Table of Contents
Calvert
VP Investment Grade Bond Index Portfolio
December 31, 2019
Notes to Financial Statements — continued
Management has analyzed the Fund’stax positions taken for all open federal income tax years and has concluded that no provision for federal income tax is required in the Fund’s financial statements. A Fund’s federal tax return is subject to examination by the Internal Revenue Service for a period of three years from the date of filing.
2 Related Party Transactions
The investment advisory fee is earned by Calvert Research and Management (CRM), a subsidiary of Eaton Vance Management (EVM), as compensation for investment advisory services rendered to the Fund. Pursuant to the investment advisory agreement, CRM receives a fee, payable monthly, at the annual rate of 0.20% of the Fund’s average daily net assets. For the year ended December 31, 2019, the investment advisory fee amounted to $283,291.
Ameritas Investment Partners, Inc. (AIP) providessub-advisory services to the Fund pursuant to asub-advisory agreement with CRM.Sub-advisory fees are paid by CRM from its investment advisory fee.
CRM has agreed to reimburse the Fund’s operating expenses to the extent that total annual operating expenses (relating to ordinary operating expenses only and excluding expenses such as brokerage commissions, acquired fund fees and expenses of unaffiliated funds, borrowing costs, taxes or litigation expenses) exceed 0.32% for Class I and 0.57% for Class F of such class’ average daily net assets. The expense reimbursement agreement with CRM may be changed or terminated after April 30, 2020. For the year ended December 31, 2019, CRM waived or reimbursed expenses of $157,774.
The administrative fee is earned by CRM as compensation for administrative services rendered to the Fund. The fee is computed at an annual rate of 0.12% of the Fund’s average daily net assets attributable to Class I and Class F and is payable monthly. For the year ended December 31, 2019, CRM was paid administrative fees of $169,975.
The Fund has in effect a distribution plan for Class F shares (Class F Plan) pursuant to Rule12b-1 under the 1940 Act. Pursuant to the Class F Plan, the Fund pays Eaton Vance Distributors, Inc. (EVD), an affiliate of CRM and the Fund’s principal underwriter, a distribution and service fee of 0.25% per annum of its average daily net assets attributable to Class F shares for distribution services and facilities provided to the Fund, as well as for personal and/or account maintenance services provided to the class shareholders. Distribution and service fees paid or accrued for the year ended December 31, 2019 amounted to $1,881 for Class F shares.
EVM providessub-transfer agency and related services to the Fund pursuant to aSub-Transfer Agency Support Services Agreement. For the year ended December 31, 2019,sub-transfer agency fees and expenses incurred to EVM amounted to $290 and are included in transfer agency fees and expenses on the Statement of Operations.
Each Director of the Fund who is not an employee of CRM or its affiliates receives a fee of $3,000 for each Board meeting attended in person and $2,000 for each Board meeting attended by phone plus an annual fee of $142,000, and $1,500 for each Committee meeting attended in person and $1,000 for each Committee meeting attended by phone plus an annual Committee fee of $2,500. The Board chair receives an additional $20,000 annual retainer and Committee chairs receive an additional $6,000 annual retainer. Eligible Directors may participate in a Deferred Compensation Plan (the Plan). Amounts deferred under the Plan are treated as though equal dollar amounts had been invested in shares of the Fund or other Calvert funds selected by the Directors. The Fund purchases shares of the funds selected equal to the dollar amounts deferred under the Plan, resulting in an asset equal to the deferred compensation liability. Obligations of the Plan are paid solely from the Fund’s assets. Directors’ fees are allocated to each of the Calvert funds served. Salaries and fees of officers and Directors of the Fund who are employees of CRM or its affiliates are paid by CRM. In addition, an advisory council was established to aid the Board and CRM in advancing the cause of responsible investing through original scholarship and thought leadership. The advisory council consists of CRM’s Chief Executive Officer and four additional members. Each member (other than CRM’s Chief Executive Officer) receives annual compensation of $75,000, which is being reimbursed by Calvert Investment Management, Inc. (CIM), the Calvert funds’ former investment adviser and Ameritas Holding Company, CIM’s parent company, through the end of 2019. For the year ended December 31, 2019, the Fund’s allocated portion of such expense and reimbursement was $3,217, which are included in miscellaneous expense and reimbursement of expenses-other, respectively, on the Statement of Operations.
3 Shareholder Servicing Plan
The Corporation, on behalf of the Fund, has adopted a Shareholder Servicing Plan (Servicing Plan), which permits the Fund to enter into shareholder servicing agreements with intermediaries that maintain accounts in the Fund for the benefit of shareholders. These services may include, but are not limited to, processing purchase and redemption requests, processing dividend payments, and providing account information to shareholders. Under the Servicing Plan, the Fund may make payments at an annual rate of up to 0.11% of its average daily net assets. For the year ended December 31, 2019, expenses incurred under the Servicing Plan amounted to $10,721 and are included in transfer agency fees and expenses on the Statement of Operations.
4 Investment Activity
During the year ended December 31, 2019, the cost of purchases and proceeds from sales of investments, other than U.S. government and agency securities and short-term securities, and including maturities and paydowns, were $2,445,676 and $6,374,281,respectively. Purchases and sales of U.S. government and agency securities, including paydowns, were $10,966,785 and $13,472,585, respectively.
| 19 |
Table of Contents
Calvert
VP Investment Grade Bond Index Portfolio
December 31, 2019
Notes to Financial Statements — continued
5 Distributions to Shareholders and Income Tax Information
The tax character of distributions declared for the years ended December 31, 2019 and December 31, 2018 was as follows:
| Year Ended December 31, | ||||||||
| 2019 | 2018 | |||||||
Ordinary income | $ | 4,460,665 | $ | 4,600,714 | ||||
As of December 31, 2019, the components of distributable earnings (accumulated loss) on a tax basis were as follows:
Undistributed ordinary income | $ | 4,045,687 | ||
Deferred capital losses | $ | (1,676,834 | ) | |
Net unrealized appreciation | $ | 6,356,445 | ||
At December 31, 2019, the Fund, for federal income tax purposes, had deferred capital losses of $1,676,834 which would reduce the Fund’s taxable income arising from future net realized gains on investment transactions, if any, to the extent permitted by the Internal Revenue Code, and thus would reduce the amount of distributions to shareholders, which would otherwise be necessary to relieve the Fund of any liability for federal income or excise tax. The deferred capital losses are treated as arising on the first day of the Fund’s next taxable year, can be carried forward for an unlimited period, and retain the same short-term or long-term character as when originally deferred. Of the deferred capital losses at December 31, 2019, $589,665 are short-term and $1,087,169 are long-term.
The cost and unrealized appreciation (depreciation) of investments of the Fund at December 31, 2019, as determined on a federal income tax basis, were as follows:
Aggregate cost | $ | 136,174,032 | ||
Gross unrealized appreciation | $ | 6,646,637 | ||
Gross unrealized depreciation | (290,192 | ) | ||
Net unrealized appreciation | $ | 6,356,445 | ||
6 Securities Lending
To generate additional income, the Fund may lend its securities pursuant to a securities lending agency agreement with State Street Bank and Trust Company (SSBT), the securities lending agent. Security loans are subject to termination by the Fund at any time and, therefore, are not considered illiquid investments. The Fund requires that the loan be continuously collateralized by either cash or securities as collateral equal at all times to at least 102% of the market value of the domestic securities loaned and 105% of the market value of the international securities loaned (if applicable). The market value of securities loaned is determined daily and any additional required collateral is delivered to the Fund on the next business day. Cash collateral is generally invested in a money market fund registered under the 1940 Act that is managed by an affiliate of SSBT. Any gain or loss in the market price of the loaned securities that might occur and any interest earned or dividends declared during the term of the loan would accrue to the account of the Fund. Income earned on the investment of collateral, net of broker rebates and other expenses incurred by the securities lending agent, is split between the Fund and the securities lending agent on the basis of agreed upon contractual terms.Non-cash collateral, if any, is held by the lending agent on behalf of the Fund and cannot be sold orre-pledged by the Fund; accordingly, such collateral is not reflected in the Statement of Assets and Liabilities.
The risks associated with lending portfolio securities include, but are not limited to, possible delays in receiving additional collateral or in the recovery of the loaned securities, possible loss of rights to the collateral should the borrower fail financially, as well as risk of loss in the value of the collateral or the value of the investments made with the collateral. The securities lending agent shall indemnify the Fund in the case of default of any securities borrower.
At December 31, 2019, the total value of securities on loan, including accrued interest, was $3,780,461 and the total value of collateral received was $3,849,716, comprised of cash of $3,219,829 and U.S. government and/or agencies securities of $629,887.
| 20 |
Table of Contents
Calvert
VP Investment Grade Bond Index Portfolio
December 31, 2019
Notes to Financial Statements — continued
The following table provides a breakdown of securities lending transactions accounted for as secured borrowings, the obligations by class of collateral pledged, and the remaining contractual maturity of those transactions as of December 31, 2019.
| Remaining Contractual Maturity of the Transactions | ||||||||||||||||||||
| Overnight and Continuous | <30 days | 30 to 90 days | >90 days | Total | ||||||||||||||||
Securities Lending Transactions | ||||||||||||||||||||
Sovereign Government Bonds | $ | 708,142 | $ | — | $ | — | $ | — | $ | 708,142 | ||||||||||
U.S. Treasury Obligations | 3,141,574 | — | — | — | 3,141,574 | |||||||||||||||
Total | $ | 3,849,716 | $ | — | $ | — | $ | — | $ | 3,849,716 | ||||||||||
The carrying amount of the liability for deposits for securities loaned at December 31, 2019 approximated its fair value. If measured at fair value, such liability would have been considered as Level 2 in the fair value hierarchy (see Note 1A) at December 31, 2019.
7 Line of Credit
Effective October 29, 2019, the Fund participates with other portfolios and funds managed by EVM and its affiliates, including CRM, in an $800 million unsecured line of credit with a group of banks, which is in effect through October 27, 2020. Borrowings are made by the Fund solely to facilitate the handling of unusual and/or unanticipated short-term cash requirements. Interest is charged to the Fund based on its borrowings at an amount above either the Eurodollar rate or Federal Funds rate. In addition, a fee computed at an annual rate of 0.15% on the daily unused portion of the line of credit is allocated among the participating portfolios and funds at the end of each quarter. Because the line of credit is not available exclusively to the Fund, it may be unable to borrow some or all of its requested amounts at any particular time.
Prior to October 29, 2019, the Fund participated with other funds managed by CRM in a $100 million ($62.5 million prior to June 21, 2019) committed line of credit agreement with SSBT, which was terminated by the Calvert funds. Borrowings bore interest at the higher of theone-month London Interbank Offered Rate (LIBOR) in effect that day or the overnight Federal Funds rate, plus 1.00% per annum. A commitment fee of 0.20% per annum was incurred on the unused portion of the committed facility, which was allocated to all participating funds.
The Fund had no borrowings pursuant to its lines of credit during the year ended December 31, 2019.
8 Capital Shares
The Corporation may issue its shares in one or more series (such as the Fund). The authorized shares of the Fund consist of 20,000,000 common shares, $0.10 par value, for each Class. Transactions in capital shares for the years ended December 31, 2019 and December 31, 2018 were as follows:
| Year Ended December 31, 2019 | Year Ended December 31, 2018 | |||||||||||||||
| Shares | Amount | Shares | Amount | |||||||||||||
Class I | ||||||||||||||||
Shares sold | 156,495 | $ | 8,596,436 | 122,409 | $ | 6,586,407 | ||||||||||
Reinvestment of distributions | 79,337 | 4,426,996 | 87,865 | 4,586,530 | ||||||||||||
Shares redeemed | (354,477 | ) | (19,586,898 | ) | (608,227 | ) | (32,451,075 | ) | ||||||||
Net decrease | (118,645 | ) | $ | (6,563,466 | ) | (397,953 | ) | $ | (21,278,138 | ) | ||||||
Class F | ||||||||||||||||
Shares sold | 14,986 | $ | 834,093 | 4,097 | $ | 218,257 | ||||||||||
Reinvestment of distributions | 611 | 33,669 | 274 | 14,184 | ||||||||||||
Shares redeemed | (1,380 | ) | (76,137 | ) | (4,656 | ) | (250,858 | ) | ||||||||
Net increase (decrease) | 14,217 | $ | 791,625 | (285 | ) | $ | (18,417 | ) | ||||||||
At December 31, 2019, separate accounts of an insurance company that is an affiliate of AIP owned 85.7% of the value of the outstanding shares of the Fund.
| 21 |
Table of Contents
Calvert
VP Investment Grade Bond Index Portfolio
December 31, 2019
Report of Independent Registered Public Accounting Firm
To the Shareholders and Board of Directors
Calvert Variable Products, Inc.:
Opinion on the Financial Statements
We have audited the accompanying statement of assets and liabilities of Calvert VP Investment Grade Bond Index Portfolio (the Fund), a series of Calvert Variable Products, Inc., including the schedule of investments, as of December 31, 2019, the related statement of operations for the year then ended, the statements of changes in net assets for each of the years in thetwo-year period then ended, and the related notes (collectively, the financial statements) and the financial highlights for each of the years or periods in the five-year period then ended. In our opinion, the financial statements and financial highlights present fairly, in all material respects, the financial position of the Fund as of December 31, 2019, the results of its operations for the year then ended, the changes in its net assets for each of the years in thetwo-year period then ended, and the financial highlights for each of the years or periods in thefive-year period then ended, in conformity with U.S. generally accepted accounting principles.
Basis for Opinion
These financial statements and financial highlights are the responsibility of the Fund’s management. Our responsibility is to express an opinion on these financial statements and financial highlights based on our audits. We are a public accounting firm registered with the Public Company Accounting Oversight Board (United States) (PCAOB) and are required to be independent with respect to the Fund in accordance with the U.S. federal securities laws and the applicable rules and regulations of the Securities and Exchange Commission and the PCAOB.
We conducted our audits in accordance with the standards of the PCAOB. Those standards require that we plan and perform the audit to obtain reasonable assurance about whether the financial statements and financial highlights are free of material misstatement, whether due to error or fraud. Our audits included performing procedures to assess the risks of material misstatement of the financial statements and financial highlights, whether due to error or fraud, and performing procedures that respond to those risks. Such procedures included examining, on a test basis, evidence regarding the amounts and disclosures in the financial statements and financial highlights. Such procedures also included confirmation of securities owned as of December 31, 2019, by correspondence with the custodian and brokers. Our audits also included evaluating the accounting principles used and significant estimates made by management, as well as evaluating the overall presentation of the financial statements and financial highlights. We believe that our audits provide a reasonable basis for our opinion.

We have served as the auditor of one or more of the Calvert Funds since 2002.
Philadelphia, Pennsylvania
February 19, 2020
| 22 |
Table of Contents
Calvert
VP Investment Grade Bond Index Portfolio
December 31, 2019
Fund Management.The Directors of Calvert Variable Products, Inc. (the Corporation) are responsible for the overall management and supervision of the Corporation’s affairs. The Directors and officers of the Corporation are listed below. Except as indicated, each individual has held the office shown or other offices in the same company for the last five years. Each Board member holds office until his or her successor is elected and qualified, or until his or her earlier death, resignation, retirement, removal or disqualification. Under the terms of the Fund’s current Board member retirement policy, an Independent Board member must retire at the end of the calendar year in which he or she turns 75. However, if such retirement would cause the Fund to be out of compliance with Section 16 of the 1940 Act or any other regulations or guidance of the SEC, then such retirement and resignation will not become effective until such time as action has been taken for the Fund to be in compliance upon a Board member’s retirement. The “Independent Directors” consist of those Directors who are not “interested persons” of the Corporation, as that term is defined under the 1940 Act. The business address of each Director and officer, with the exception of Ms. Gemma and Mr. Kirchner, is 1825 Connecticut Avenue NW, Suite 400, Washington, DC 20009. As used below, “CRM” refers to Calvert Research and Management. Each Director oversees 39 funds in the Calvert fund complex. Each officer serves as an officer of certain other Calvert funds.
| Name and Year of Birth | Position with the | Position Start Date | Principal Occupation(s) and Directorships During Past Five Years and Other Relevant Experience | |||
| Interested Director | ||||||
John H. Streur(1) 1960 | Director and President | 2015 | President and Chief Executive Officer of Calvert Research and Management (since December 31, 2016). President and Chief Executive Officer of Calvert Investments, Inc. (January 2015-December 2016); Chief Executive Officer of Calvert Investment Distributors, Inc. (August 2015-December 2016); Chief Compliance Officer of Calvert Investment Management, Inc. (August 2015-April 2016); President and Director, Portfolio 21 Investments, Inc. (through October 2014); President, Chief Executive Officer and Director, Managers Investment Group LLC (through January 2012); President and Director, The Managers Funds and Managers AMG Funds (through January 2012). Other Directorships in the Last Five Years. Portfolio 21 Investments, Inc. (asset management) (through October 2014); Managers Investment Group LLC (asset management) (through January 2012); The Managers Funds (asset management) (through January 2012); Managers AMG Funds (asset management) (through January 2012); Calvert Impact Capital, Inc. | |||
| Independent Directors | ||||||
Richard L. Baird, Jr 1948 | Director | 2016 | Regional Disaster Recovery Lead, American Red Cross of Greater Pennsylvania (since 2017). Volunteer, American Red Cross (since 2015). Former President and CEO of Adagio Health Inc. (retired in 2014) in Pittsburgh, PA. Other Directorships in the Last Five Years. None. | |||
Alice Gresham Bullock 1950 | Chair and Director | 2016 (Chair); 2008 (Director) | Professor Emerita at Howard University School of Law. Dean Emerita of Howard University School of Law and Deputy Director of the Association of American Law Schools (1992-1994). Other Directorships in the Last Five Years. None. | |||
Cari M. Dominguez 1949 | Director | 2016 | Former Chair of the U.S. Equal Employment Opportunity Commission. Other Directorships in the Last Five Years. Manpower, Inc. (employment agency); Triple S Management Corporation (managed care); National Association of Corporate Directors. | |||
John G. Guffey, Jr.(2) 1948 | Director | 2016 | President of Aurora Press Inc., a privately held publisher of trade paperbacks (since January 1997). Other Directorships in the Last Five Years. Calvert Impact Capital, Inc. (through December 31, 2018); Calvert Ventures, LLC. | |||
Miles D. Harper, III 1962 | Director | 2016 | Partner, Carr Riggs & Ingram (public accounting firm) since October 2014. Partner, Gainer Donnelly & Desroches (public accounting firm) (now Carr Riggs & Ingram), November 1999-September 2014). Other Directorships in the Last Five Years. Bridgeway Funds (9) (asset management). | |||
Joy V. Jones 1950 | Director | 2016 | Attorney. Other Directorships in the Last Five Years. Conduit Street Restaurants SUD 2 Limited; Palm Management Restaurant Corporation. | |||
| 23 |
Table of Contents
Calvert
VP Investment Grade Bond Index Portfolio
December 31, 2019
Management and Organization — continued
| Name and Year of Birth | Position with the | Position Start Date | Principal Occupation(s) and Directorships During Past Five Years and Other Relevant Experience | |||
| Independent Directors (continued) | ||||||
Anthony A. Williams 1951 | Director | 2016 | CEO and Executive Director of the Federal City Council (July 2012 to present); Senior Adviser and Independent Consultant for King and Spalding LLP (September 2015 to present); Executive Director of Global Government Practice at the Corporate Executive Board (January 2010 to January 2012). Other Directorships in the Last Five Years. Freddie Mac; Evoq Properties/ Meruelo Maddux Properties, Inc. (real estate management); Weston Solutions, Inc. (environmental services); Bipartisan Policy Center’s Debt Reduction Task Force; Chesapeake Bay Foundation; Catholic University of America; Urban Institute (research organization). | |||
| Name and Year of Birth | Position(s) with the | Position Start Date | Principal Occupation(s) During Past Five Years | |||
| Principal Officers who are not Directors | ||||||
Hope L. Brown 1973 | Chief Compliance Officer | 2014 | Chief Compliance Officer of 39 registered investment companies advised by CRM (since 2014). Vice President and Chief Compliance Officer, Wilmington Funds (2012-2014). | |||
Maureen A. Gemma(3) 1960 | Vice President, Secretary and Chief Legal Officer | 2016 | Vice President of CRM and officer of 39 registered investment companies advised by CRM (since 2016). Also Vice President of Eaton Vance and certain of its affiliates and officer of 159 registered investment companies advised or administered by Eaton Vance. | |||
James F. Kirchner(3) 1967 | Treasurer | 2016 | Vice President of CRM and officer of 39 registered investment companies advised by CRM (since 2016). Also Vice President of Eaton Vance and certain of its affiliates and officer of 159 registered investment companies advised or administered by Eaton Vance. | |||
| (1) | Mr. Streur is an interested person of the Fund because of his positions with the Fund’s adviser and certain affiliates. |
| (2) | Mr. Guffey is currently married to Rebecca L. Adamson, who served as a member of the Advisory Council through December 31, 2019. |
| (3) | The business address for Ms. Gemma and Mr. Kirchner is Two International Place, Boston, MA 02110. |
The SAI for the Fund includes additional information about the Directors and officers of the Fund and can be obtained without charge on Calvert’s website at www.calvert.com or by calling1-800-368-2745.
| 24 |
Table of Contents
Calvert Funds
Privacy. The Eaton Vance organization is committed to ensuring your financial privacy. Each entity listed below has adopted a privacy policy and procedures (“Privacy Program”) Eaton Vance believes is reasonably designed to protect your personal information and to govern when and with whom Eaton Vance may share your personal information.
| • | At the time of opening an account, Eaton Vance generally requires you to provide us with certain information such as name, address, social security number, tax status, account numbers, and account balances. This information is necessary for us to both open an account for you and to allow us to satisfy legal requirements such as applicable anti-money laundering reviews and know-your-customer requirements. |
| • | On an ongoing basis, in the normal course of servicing your account, Eaton Vance may share your information with unaffiliated third parties that perform various services for Eaton Vance and/or your account. These third parties include transfer agents, custodians, broker/dealers and our professional advisers, including auditors, accountants, and legal counsel. Eaton Vance may additionally share your personal information with our affiliates. |
| • | We believe our Privacy Program is reasonably designed to protect the confidentiality of your personal information and to prevent unauthorized access to that information. |
| • | We reserve the right to change our Privacy Program at any time upon proper notification to you. You may want to review our Privacy Program periodically for changes by accessing the link on our homepage: www.eatonvance.com. |
Our pledge of protecting your personal information applies to the following entities within the Eaton Vance organization: the Eaton Vance Family of Funds, Eaton Vance Management, Eaton Vance Investment Counsel, Eaton Vance Distributors, Inc., Eaton Vance Trust Company, Eaton Vance Management (International) Limited, Eaton Vance Advisers International Limited, Eaton Vance Global Advisors Limited, Eaton Vance Management’s Real Estate Investment Group, Boston Management and Research, Calvert Research and Management, and Calvert Funds. This Privacy Notice supersedes all previously issued privacy disclosures. For more information about our Privacy Program or about how your personal information may be used, please call 1-800-368-2745.
Delivery of Shareholder Documents. The Securities and Exchange Commission (SEC) permits funds to deliver only one copy of shareholder documents, including prospectuses, proxy statements and shareholder reports, to fund investors with multiple accounts at the same residential or post office box address. This practice is often called “householding” and it helps eliminate duplicate mailings to shareholders.Calvert funds, or your financial intermediary, may household the mailing of your documents indefinitely unless you instruct Calvert funds, or your financial intermediary, otherwise. If you would prefer that your Calvert fund documents not be householded, please contact Calvert funds at1-800-368-2745, or contact your financial intermediary. Your instructions that householding not apply to delivery of your Calvert fund documents will typically be effective within 30 days of receipt by Calvert funds or your financial intermediary. Separate statements will be generated for each separate account and will be householded as described above.
Portfolio Holdings. Each Calvert fund files a schedule of portfolio holdings on Part F to Form N-PORT with the SEC for the first and third quarters of each fiscal year. The Form N-PORT will be available on the Calvert funds’ website at www.calvert.com, by calling Calvert funds at1-800-368-2745 or in the EDGAR database on the SEC’s website at www.sec.gov.
Proxy Voting. The Proxy Voting Guidelines that each Calvert fund uses to determine how to vote proxies relating to portfolio securities is provided as an Appendix to the fund’s Statement of Additional Information. The Statement of Additional Information can be obtained free of charge by calling the Calvert funds at 1-800-368-2745, by visiting the Calvert funds’ website at www.calvert.com or visiting the SEC’s website at www.sec.gov. Information regarding how a Calvert fund voted proxies relating to portfolio securities during the most recent 12-month period ended June 30 is available by calling Calvert funds, by visiting the Calvert funds’ website at www.calvert.com or by visiting the SEC’s website at www.sec.gov.
| 25 |
Table of Contents
This Page Intentionally Left Blank
Table of Contents
This Page Intentionally Left Blank
Table of Contents
This Page Intentionally Left Blank
Table of Contents
Investment Adviser and Administrator
Calvert Research and Management
1825 Connecticut Avenue NW, Suite 400
Washington, DC 20009
Investment Sub-Adviser
Ameritas Investment Partners, Inc.
5945 R Street
Lincoln, NE 68505
Principal Underwriter*
Eaton Vance Distributors, Inc.
Two International Place
Boston, MA 02110
(617)482-8260
Custodian
State Street Bank and Trust Company
State Street Financial Center, One Lincoln Street
Boston, MA 02111
Transfer Agent
DST Asset Manager Solutions, Inc.
2000 Crown Colony Drive
Quincy, MA 02169
Independent Registered Public Accounting Firm
KPMG LLP
1601 Market Street
Philadelphia, PA 19103-2499
Fund Offices
1825 Connecticut Avenue NW, Suite 400
Washington, DC 20009
| * | FINRA BrokerCheck. Investors may check the background of their Investment Professional by contacting the Financial Industry Regulatory Authority (FINRA). FINRA BrokerCheck is a free tool to help investors check the professional background of current and former FINRA-registered securities firms and brokers. FINRA BrokerCheck is available by calling1-800-289-9999 and at www.FINRA.org. The FINRA BrokerCheck brochure describing this program is available to investors at www.FINRA.org. |
Table of Contents
Printed on recycled paper.

24231 12.31.19
Table of Contents

Calvert
VP Volatility Managed Growth Portfolio
Annual Report
December 31, 2019
Important Note. Beginning on January 1, 2021, as permitted by regulations adopted by the Securities and Exchange Commission, you may not receive paper copies of the Fund’s annual and semi-annual shareholder reports from the insurance company or plan sponsor unless you specifically request paper copies. Instead, the reports will be made available on a website and you will be notified by mail each time a report is posted and provided with a website address to access the report. Instructions for requesting paper copies will be provided by the insurance company, plan sponsor or your financial intermediary, as applicable. Please contact the insurance company, plan sponsor or your financial intermediary, as applicable, or follow instructions included with this disclosure, if any, for more information.

Table of Contents
Commodity Futures Trading Commission Registration. Effective December 31, 2012, the Commodity Futures Trading Commission (“CFTC”) adopted certain regulatory changes that subject registered investment companies and advisers to regulation by the CFTC if a fund invests more than a prescribed level of its assets in certain CFTC-regulated instruments (including futures, certain options and swap agreements) or markets itself as providing investment exposure to such instruments. The Fund and its adviser have claimed an exclusion from the definition of the term “commodity pool operator” under the Commodity Exchange Act. Accordingly, neither the Fund nor the adviser is subject to CFTC regulation.
Fund shares are not insured by the FDIC and are not deposits or other obligations of, or guaranteed by, any depository institution. Shares are subject to investment risks, including possible loss of principal invested.
This report must be preceded or accompanied by a current summary prospectus or prospectus. Before investing, investors should consider carefully the investment objective, risks, and charges and expenses of a mutual fund. This and other important information is contained in the summary prospectus and prospectus, which can be obtained from a financial intermediary. Prospective investors should read the prospectus carefully before investing. For further information, please call1-800-368-2745.
Table of Contents
Annual Report December 31, 2019
Calvert
VP Volatility Managed Growth Portfolio
Table of Contents
Calvert
VP Volatility Managed Growth Portfolio
December 31, 2019
Management’s Discussion of Fund Performance 1
Economic and Market Conditions
Virtually every U.S. and global equity index posted double-digit returns for the 12-month period ended December 31, 2019, making it a good year for stock investments. The period was also marked by strong performance across U.S. bond markets.
In January 2019, investors appeared to take a “glass is half full” approach. Although U.S. manufacturing output and business investment was weak — held back by slowing global growth and an on-again/off-again U.S.-China trade rift — low U.S. unemployment, strong consumer spending, and the easing of the federal funds rate by the U.S. Federal Reserve (the Fed) combined to lift investor sentiment.
As a result, U.S. stocks started the year on a climb, and international stocks followed. The period was also notable for a dramatic turnaround in fixed-income markets as the rising interest-rate environment of 2018 gave way to falling interest-rate expectations in 2019 against the backdrop of multiple domestic and international uncertainties.
After holding interest rates steady through the first half of the year, the Fed cut the federal funds rate on July 31, 2019 — its first reduction in over a decade — followed by two additional rate cuts in September and October to end the period at 1.50%-1.75%. By end of the third quarter, 60 central banks around the world had lowered their interest rates as well. Lower rates are intended to help stimulate economic activity by making borrowing costs relatively more affordable.
Downward pressure on interest rates and upward pressure on bond prices continued through most of the period propelled by lower-than-desired inflation, low European interest rates, and the U.S.-China trade conflict.
During the period, the blue-chip Dow Jones Industrial Average®2 returned 25.34%, while the broader U.S. equity market, as measured by the S&P 500® Index, returned 31.49%. The technology-laden Nasdaq Composite Index returned 36.69% during the period. Large-cap U.S. stocks, as measured by the S&P 500® Index, generally outperformed their small-cap counterparts, as measured by the Russell 2000® Index.
Overseas, the MSCI World Index, a measure of developed market equity securities, returned 27.67%. The MSCI EAFE Index of developed-market international equities returned 22.01%, and the MSCI Emerging Markets Index returned 18.42%.
On the fixed-income side, the Bloomberg Barclays U.S. Aggregate Bond Index, a broad measure of the U.S. bond market, returned 8.72%. The Bloomberg Barclays U.S. Corporate Bond Index, a measure of U.S. corporate investment-grade bonds, finished 2019 with a 14.54% return — its best calendar-year performance since 2009. High yield fixed-income securities also performed well with the ICE BofAML U.S. High Yield Index returning 14.41% during the period ended December 31, 2019.
Investment Strategy
Calvert VP Volatility Managed Growth Portfolio (the Fund) seeks to achieve its objectives by investing in exchange-traded funds (ETFs)
representing a broad range of asset classes and employing derivatives to manage overall portfolio volatility. The Fund sets a targeted asset allocation and typical asset allocation range among equity andfixed-income ETFs. The subadvisor seeks ETFs that are representative of the desired asset class and whose underlying fundamentals appear to have the potential for above-average long-term performance. The volatility-management strategy is implemented by entering into futures contracts based on one or more stock market indexes, to attempt to hedge against changes in market volatility and declines in the value of the Fund’s investments in ETFs.
Fund Performance
For the 12-month period ended December 31, 2019, the Fund returned 19.22% for Class F shares at net asset value (NAV), underperforming its primary benchmark, the S&P 500 Daily Risk Control 12% Index (the Index), which returned 20.88% during the period.
Fund performance is also measured against a custom blended benchmark (the Secondary Blended Benchmark) based on a mix of market indexes that more closely reflects the impact of the Fund’s asset-allocation strategy than the single asset-class Index. The Index is used to capture the impact of the Fund’s volatility-management strategy. The Fund underperformed the Secondary Blended Benchmark, which returned 24.15% during the period.
The Fund underperformed the Index by 1.66% during the period. The Fund consists of multiple asset classes, while the Index consists of two components: the S&P 500® Index and cash. Furthermore, the Index allows for up to 50% leverage in an attempt to harvest market gains in periods of low volatility, such as during the fourth quarter of 2019. As a largely unlevered investment, the Fund underperformed in the fourth quarter relative to the Index, but outperformed during the first three quarters.
The Fund’s volatility-management strategy contributed negatively to performance relative to the Index. As the volatility-management strategy attempts to reduce the Fund’s exposure to equities during periods of elevated volatility, the Fund’s futures overlay is likely to result in losses during market recoveries, as the Fund typically unwinds defensive hedges gradually.
The Fund started the year with substantial hedges in place as a defensive reaction to the volatile decline in the fourth quarter of 2018. The Fund gradually returned to full equity allocation by mid-February 2019. Subsequently, the Fund re-engaged defensive hedges to a much smaller extent in May, August, and October 2019, as a response to brief periods of market turmoil. In cumulative terms, the net detraction from derivative positions throughout the year was 3.20%, the vast majority of which is attributable to the first month of the year.
The Fund underperformed the Secondary Blended Benchmark. Allocation to the technology sector, the best performing market sector, was a positive contributor while an overweight position in cash in lieu of investment-grade bonds was a detractor as bonds turned in one of their best periods in several years.
See Endnotes and Additional Disclosures in this report.
Past performance is no guarantee of future results. Returns are historical and are calculated by determining the percentage change in net asset value (NAV) or offering price (as applicable) with all distributions reinvested. Investment return and principal value will fluctuate so that shares, when redeemed, may be worth more or less than their original cost. Performance for periods less than or equal to one year is cumulative. Performance is for the stated time period only; due to market volatility, current Fund performance may be lower or higher than the quoted return.
| 2 |
Table of Contents
Calvert
VP Volatility Managed Growth Portfolio
December 31, 2019
Portfolio Managers Kevin L. Keene, CFA of Ameritas Investment Partners, Inc.; Adam Schenck, CFA, FRM and Maria Schiopu, CFA, each of Milliman Financial Risk Management LLC
| % Average Annual Total Returns 2,3 | Class Inception Date | Performance Inception Date | One Year | Five Years | Since Inception | |||||||||||||||
Class F at NAV | 04/30/2013 | 04/30/2013 | 19.22 | % | 5.60 | % | 6.03 | % | ||||||||||||
| ||||||||||||||||||||
S&P 500 Daily Risk Control 12% Index | — | — | 20.88 | % | 9.83 | % | 11.18 | % | ||||||||||||
Growth Portfolio Blended Benchmark | — | — | 24.15 | 8.44 | 9.27 | |||||||||||||||
| % Total Annual Operating Expense Ratios 4 | Class F | |||||||||||||||||||
| Gross | 0.97 | % | ||||||||||||||||||
| Net | 0.93 | |||||||||||||||||||
Growth of $10,000
This graph shows the change in value of a hypothetical investment of $10,000 in Class F of the Fund for the period indicated. For comparison, the same investment is shown in the indicated index.
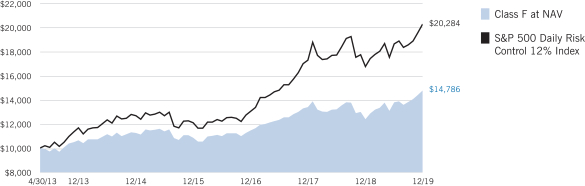
See Endnotes and Additional Disclosures in this report.
Past performance is no guarantee of future results. Returns are historical and are calculated by determining the percentage change in net asset value (NAV) or offering price (as applicable) with all distributions reinvested. Investment return and principal value will fluctuate so that shares, when redeemed, may be worth more or less than their original cost. Performance for periods less than or equal to one year is cumulative. Performance is for the stated time period only; due to market volatility, current Fund performance may be lower or higher than the quoted return.
| 3 |
Table of Contents
Calvert
VP Volatility Managed Growth Portfolio
December 31, 2019
| Asset Allocation (% of total investments) | ||||
Equity Exchange-Traded Funds | 84.4 | % | ||
Fixed-Income Exchange-Traded Funds | 15.2 | |||
Short-Term Investments | 0.4 | |||
Total | 100.0 | % | ||
See Endnotes and Additional Disclosures in this report.
| 4 |
Table of Contents
Calvert
VP Volatility Managed Growth Portfolio
December 31, 2019
Endnotes and Additional Disclosures
| 1 | The views expressed in this report are those of the portfolio manager(s) and are current only through the date stated at the top of this page. These views are subject to change at any time based upon market or other conditions, and Calvert and the Fund(s) disclaim any responsibility to update such views. These views may not be relied upon as investment advice and, because investment decisions are based on many factors, may not be relied upon as an indication of trading intent on behalf of any Calvert fund. This commentary may contain statements that are not historical facts, referred to as “forward looking statements.” The Fund’s actual future results may differ significantly from those stated in any forward looking statement, depending on factors such as changes in securities or financial markets or general economic conditions, the volume of sales and purchases of Fund shares, the continuation of investment advisory, administrative and service contracts, and other risks discussed from time to time in the Fund’s filings with the Securities and Exchange Commission. |
| 2 | Dow Jones Industrial Average® is a price-weighted average of 30 blue-chip stocks that are generally the leaders in their industry. S&P 500® Index is an unmanaged index of large-cap stocks commonly used as a measure of U.S. stock market performance. S&P 500 Daily Risk Control 12% Index is an unmanaged index of U.S. large-cap stocks with a volatility target of 12%. S&P Dow Jones Indices are a product of S&P Dow Jones Indices LLC (“S&P DJI”) and have been licensed for use. S&P® and S&P 500® are registered trademarks of S&P DJI; Dow Jones® is a registered trademark of Dow Jones Trademark Holdings LLC (“Dow Jones”); S&P DJI, Dow Jones and their respective affiliates do not sponsor, endorse, sell or promote the Fund, will not have any liability with respect thereto and do not have any liability for any errors, omissions, or interruptions of the S&P Dow Jones Indices. Nasdaq Composite Index is a market capitalization-weighted index of all domestic and international securities listed on Nasdaq. Source: Nasdaq, Inc. The information is provided by Nasdaq (with its affiliates, are referred to as the “Corporations”) and Nasdaq’s third party licensors on an “as is” basis and the Corporations make no guarantees and bear no liability of any kind with respect to the information or the Fund. Russell 2000® Index is an unmanaged index of 2,000 U.S. small-cap stocks. Russell 3000® Index is an unmanaged index of the 3,000 largest U.S. stocks. MSCI World Index is an unmanaged index of equity securities in the developed markets. MSCI EAFE Index is an unmanaged index of equities in the developed markets, excluding the U.S. and Canada. MSCI Emerging Markets Index is an unmanaged index of emerging markets common stocks. MSCI USA IMI/Equity REITs Index is an unmanaged index of U.S. equity REITs. MSCI indexes are net of foreign withholding taxes. Source: MSCI. MSCI data may not be reproduced or used for any other purpose. MSCI provides no warranties, has not prepared or approved this report, and has no liability hereunder. Bloomberg Barclays U.S. Aggregate Bond |
| Index is an unmanaged index of domestic investment-grade bonds, including corporate, government and mortgage-backed securities. Bloomberg Barclays U.S. Corporate Bond Index measures the performance of investment-grade U.S. corporate securities with a maturity of one year or more. ICE BofAML U.S. High Yield Index is an unmanaged index of below-investment grade U.S. corporate bonds. ICE BofAML 3-Month U.S. Treasury Bill Index is an unmanaged index of U.S. Treasury securities maturing in 90 days. ICE® BofAML® indices are not for redistribution or other uses; provided “as is”, without warranties, and with no liability. Eaton Vance has prepared this report and ICE Data Indices, LLC does not endorse it, or guarantee, review, or endorse Eaton Vance’s products. BofAML® is a licensed registered trademark of Bank of America Corporation in the United States and other countries. Growth Portfolio Blended Benchmark is an internally constructed benchmark which is comprised of a blend of 58% Russell 3000® Index, 18% Bloomberg Barclays U.S. Aggregate Bond Index, 16% MSCI EAFE Index, 4% ICE BofAML 3-Month U.S. Treasury Bill Index, and 4% MSCI USA IMI/Equity REITs Index, which is rebalanced monthly. Unless otherwise stated, index returns do not reflect the effect of any applicable sales charges, commissions, expenses, taxes or leverage, as applicable. It is not possible to invest directly in an index. |
| 3 | There is no sales charge. Insurance-related charges are not included in the calculation of returns. If such charges were reflected, the returns would be lower. Please refer to the report for your insurance contract for performance data reflecting insurance-related charges. Performance since inception for an index, if presented, is the performance since the Fund’s or oldest share class’ inception, as applicable. |
Calvert Research and Management became the investment adviser to the Fund on December 31, 2016. Performance reflected prior to such date is that of the Fund’s former investment adviser. |
| 4 | Source: Fund prospectus. Net expense ratio reflects a contractual expense reimbursement that continues through 4/30/20. Without the reimbursement, performance would have been lower. The expense ratios for the current reporting period can be found in the Financial Highlights section of this report. |
Fund profile subject to change due to active management. |
| 5 |
Table of Contents
Calvert
VP Volatility Managed Growth Portfolio
December 31, 2019
Example
As a Fund shareholder, you incur ongoing costs, including management fees; distribution and/or service fees; and other Fund expenses. This Example is intended to help you understand your ongoing costs (in dollars) of Fund investing and to compare these costs with the ongoing costs of investing in other mutual funds. The Example is based on an investment of $1,000 invested at the beginning of the period and held for the entire period (July 1, 2019 to December 31, 2019).
Actual Expenses
The first line of the table below provides information about actual account values and actual expenses. You may use the information in this line, together with the amount you invested, to estimate the expenses that you paid over the period. Simply divide your account value by $1,000 (for example, an $8,600 account value divided by $1,000 = 8.6), then multiply the result by the number in the first line under the heading entitled “Expenses Paid During Period” to estimate the expenses you paid on your account during this period.
Hypothetical Example for Comparison Purposes
The second line of the table below provides information about hypothetical account values and hypothetical expenses based on the actual Fund expense ratio and an assumed rate of return of 5% per year (before expenses), which is not the actual Fund return. The hypothetical account values and expenses may not be used to estimate the actual ending account balance or expenses you paid for the period. You may use this information to compare the ongoing costs of investing in the Fund and other funds. To do so, compare this 5% hypothetical example with the 5% hypothetical examples that appear in the shareholder reports of the other funds.
Please note that the expenses shown in the table are meant to highlight your ongoing costs only and do not reflect expenses and charges which are, or may be imposed under the variable annuity contract or variable life insurance policy (variable contracts) (if applicable) through which your investment in the Fund is made. Therefore, the second line of the table is useful in comparing ongoing costs associated with an investment in vehicles which fund benefits under variable contracts, and will not help you determine the relative total costs of investing in the Fund through variable contracts. In addition, if these expenses and charges imposed under the variable contracts were included, your costs would have been higher.
| Beginning Account Value (7/1/19) | Ending Account Value (12/31/19) | Expenses Paid During Period* (7/1/19 – 12/31/19) | Annualized Expense Ratio | |||||||||||||
Actual | ||||||||||||||||
Class F | $ | 1,000.00 | $ | 1,072.10 | $ | 4.33 | ** | 0.83 | % | |||||||
Hypothetical | ||||||||||||||||
(5% return per year before expenses) | ||||||||||||||||
Class F | $ | 1,000.00 | $ | 1,021.02 | $ | 4.23 | ** | 0.83 | % | |||||||
| * | Expenses are equal to the Fund’s annualized expense ratio, multiplied by the average account value over the period, multiplied by 184/365 (to reflect the one-half year period). The Example assumes that the $1,000 was invested at the net asset value per share determined at the close of business on June 30, 2019. Expenses shown do not include insurance-related charges. Expenses do not include fees and expenses incurred indirectly from investment in underlying affiliated and/or unaffiliated funds. |
| ** | Absent a waiver and/or reimbursement of expenses by an affiliate, expenses would be higher. |
| 6 |
Table of Contents
Calvert
VP Volatility Managed Growth Portfolio
December 31, 2019
| Exchange-Traded Funds — 93.2% |
| |||||||
| Security | Shares | Value | ||||||
| Equity Exchange-Traded Funds — 79.0% | ||||||||
Financial Select Sector SPDR Fund(1) | 123,000 | $ | 3,785,940 | |||||
iShares Core S&P Mid-Cap ETF | 44,000 | 9,056,080 | ||||||
iShares Russell 2000 ETF | 45,000 | 7,455,150 | ||||||
iShares S&P 500 Growth ETF | 86,000 | 16,653,040 | ||||||
iShares S&P 500 Value ETF(1) | 110,000 | 14,309,900 | ||||||
iShares S&P Mid-Cap 400 Value ETF(1) | 7,000 | 1,195,110 | ||||||
Vanguard FTSE Developed Markets ETF(1) | 507,000 | 22,338,420 | ||||||
Vanguard FTSE Emerging Markets ETF | 67,000 | 2,979,490 | ||||||
Vanguard REIT ETF(1) | 63,000 | 5,845,770 | ||||||
Vanguard S&P 500 ETF | 122,000 | 36,087,600 | ||||||
| $ | 119,706,500 | |||||||
| Fixed-Income Exchange-Traded Funds — 14.2% | ||||||||
iShares Core U.S. Aggregate Bond ETF | 191,000 | $ | 21,462,670 | |||||
Total Exchange-Traded Funds |
| $ | 141,169,170 | |||||
| Short-Term Investments — 0.4% |
| |||||||
| Security | Shares | Value | ||||||
State Street Navigator Securities Lending Government Money Market Portfolio, 1.56%(2) | 593,375 | $ | 593,375 | |||||
Total Short-Term Investments |
| $ | 593,375 | |||||
Total Investments |
| $ | 141,762,545 | |||||
Other Assets, Less Liabilities — 6.4% |
| $ | 9,620,257 | |||||
Net Assets — 100.0% |
| $ | 151,382,802 | |||||
The percentage shown for each investment category in the Schedule of Investments is based on net assets.
Notes to Schedule of Investments
| (1) | All or a portion of this security was on loan at December 31, 2019. The aggregate market value of securities on loan at December 31, 2019 was $15,437,422. |
| (2) | Represents investment of cash collateral received in connection with securities lending. |
| Futures Contracts | ||||||||||||||||||||
| Description | Number of Contracts | Position | Expiration Date | Notional Amount | Value/ Unrealized Appreciation (Depreciation) | |||||||||||||||
| Equity Futures | ||||||||||||||||||||
E-mini Russell 2000 Index | 19 | Long | 3/20/20 | $ | 1,587,070 | $ | 20,601 | |||||||||||||
E-mini S&P 500 Index | 37 | Long | 3/20/20 | 5,977,535 | 111,157 | |||||||||||||||
E-mini S&P MidCap 400 Index | 5 | Long | 3/20/20 | 1,032,400 | 12,221 | |||||||||||||||
MSCI EAFE Index | 23 | Long | 3/20/20 | 2,341,975 | 19,878 | |||||||||||||||
| $ | 163,857 | |||||||||||||||||||
| 7 | See Notes to Financial Statements. |
Table of Contents
Calvert
VP Volatility Managed Growth Portfolio
December 31, 2019
Statement of Assets and Liabilities
| Assets | December 31, 2019 | |||
Investments in securities of unaffiliated issuers, at value (identified cost $106,897,507) - including | $ | 141,762,545 | ||
Receivable for variation margin on open futures contracts | 29,015 | |||
Cash | 9,996,506 | |||
Securities lending income receivable | 2,657 | |||
Receivable from affiliate | 13,879 | |||
Deposits at broker for futures contracts | 429,600 | |||
Directors’ deferred compensation plan | 30,166 | |||
Other assets | 8,263 | |||
Total assets | $ | 152,272,631 | ||
| Liabilities | ||||
Payable for capital shares redeemed | $ | 88,395 | ||
Deposits for securities loaned | 593,375 | |||
Payable to affiliates: | ||||
Investment advisory fee | 53,367 | |||
Administrative fee | 15,248 | |||
Distribution and service fees | 31,766 | |||
Sub-transfer agency fee | 21 | |||
Directors’ deferred compensation plan | 30,166 | |||
Accrued expenses | 77,491 | |||
Total liabilities | $ | 889,829 | ||
Net Assets | $ | 151,382,802 | ||
| Sources of Net Assets | ||||
Paid-in capital | $ | 115,600,197 | ||
Distributable earnings | 35,782,605 | |||
Total | $ | 151,382,802 | ||
| Class F | ||||
Net Assets | $ | 151,382,802 | ||
Shares Outstanding | 7,287,096 | |||
Net Asset Value, Offering Price and Redemption Price Per Share | ||||
(net assets ÷ shares of beneficial interest outstanding) | $ | 20.77 | ||
| 8 | See Notes to Financial Statements. |
Table of Contents
Calvert
VP Volatility Managed Growth Portfolio
December 31, 2019
Statement of Operations
| Investment Income | Year Ended December 31, 2019 | |||
Dividend income | $ | 3,417,340 | ||
Interest income | 105,638 | |||
Securities lending income, net | 48,757 | |||
Total investment income | $ | 3,571,735 | ||
| Expenses | ||||
Investment advisory fee | $ | 647,893 | ||
Administrative fee | 185,112 | |||
Distribution and service fees | 385,651 | |||
Directors’ fees and expenses | 9,068 | |||
Custodian fees | 50,426 | |||
Transfer agency fees and expenses | 849 | |||
Accounting fees | 33,051 | |||
Professional fees | 35,423 | |||
Reports to shareholders | 5,636 | |||
Miscellaneous | 13,002 | |||
Total expenses | $ | 1,366,111 | ||
Waiver and/or reimbursement of expenses by affiliate | $ | (82,292 | ) | |
Reimbursement of expenses - other | (3,459 | ) | ||
Net expenses | $ | 1,280,360 | ||
Net investment income | $ | 2,291,375 | ||
| Realized and Unrealized Gain (Loss) | ||||
Net realized gain (loss): | ||||
Investment securities | $ | 3,613,056 | ||
Futures contracts | (2,893,179 | ) | ||
Net realized gain | $ | 719,877 | ||
Change in unrealized appreciation (depreciation): | ||||
Investment securities | $ | 25,810,952 | ||
Futures contracts | (1,991,415 | ) | ||
Net change in unrealized appreciation (depreciation) | $ | 23,819,537 | ||
Net realized and unrealized gain | $ | 24,539,414 | ||
Net increase in net assets resulting from operations | $ | 26,830,789 | ||
| 9 | See Notes to Financial Statements. |
Table of Contents
Calvert
VP Volatility Managed Growth Portfolio
December 31, 2019
Statements of Changes in Net Assets
| Year Ended December 31, | ||||||||
| Increase (Decrease) in Net Assets | 2019 | 2018 | ||||||
From operations: | ||||||||
Net investment income | $ | 2,291,375 | $ | 2,105,190 | ||||
Net realized gain (loss) | 719,877 | (584,737 | ) | |||||
Net change in unrealized appreciation (depreciation) | 23,819,537 | (13,670,021 | ) | |||||
Net increase (decrease) in net assets from operations | $ | 26,830,789 | $ | (12,149,568 | ) | |||
Distributions to shareholders | $ | (2,046,756 | ) | $ | (1,781,206 | ) | ||
Net increase (decrease) in net assets from capital share transactions | $ | (23,448,227 | ) | $ | 7,698,944 | |||
Net increase (decrease) in net assets | $ | 1,335,806 | $ | (6,231,830 | ) | |||
| Net Assets | ||||||||
At beginning of year | $ | 150,046,996 | $ | 156,278,826 | ||||
At end of year | $ | 151,382,802 | $ | 150,046,996 | ||||
| 10 | See Notes to Financial Statements. |
Table of Contents
Calvert
VP Volatility Managed Growth Portfolio
December 31, 2019
Financial Highlights
| Class F | ||||||||||||||||||||
| Year Ended December 31, | ||||||||||||||||||||
| 2019 | 2018 | 2017 | 2016 | 2015 | ||||||||||||||||
Net asset value — Beginning of year | $ | 17.67 | $ | 19.31 | $ | 16.70 | $ | 15.82 | $ | 16.60 | ||||||||||
| Income (Loss) From Operations | ||||||||||||||||||||
Net investment income(1) | $ | 0.29 | $ | 0.25 | $ | 0.23 | $ | 0.24 | $ | 0.23 | ||||||||||
Net realized and unrealized gain (loss) | 3.08 | (1.68 | ) | 2.59 | 0.64 | (0.82 | ) | |||||||||||||
Total income (loss) from operations | $ | 3.37 | $ | (1.43 | ) | $ | 2.82 | $ | 0.88 | $ | (0.59 | ) | ||||||||
| Less Distributions | ||||||||||||||||||||
From net investment income | $ | (0.27 | ) | $ | (0.21 | ) | $ | (0.21 | ) | $ | — | $ | (0.19 | ) | ||||||
From net realized gain | — | — | — | — | — | (2) | ||||||||||||||
Total distributions | $ | (0.27 | ) | $ | (0.21 | ) | $ | (0.21 | ) | $ | — | $ | (0.19 | ) | ||||||
Net asset value — End of year | $ | 20.77 | $ | 17.67 | $ | 19.31 | $ | 16.70 | $ | 15.82 | ||||||||||
Total Return(3) | 19.22 | % | (7.50 | )% | 16.92 | % | 5.56 | % | (3.51 | )% | ||||||||||
| Ratios/Supplemental Data | ||||||||||||||||||||
Net assets, end of year (000’s omitted) | $ | 151,383 | $ | 150,047 | $ | 156,279 | $ | 128,460 | $ | 113,084 | ||||||||||
Ratios (as a percentage of average daily net assets):(4)(5) | ||||||||||||||||||||
Total expenses | 0.89 | % | 0.87 | % | 0.87 | % | 0.90 | % | 0.86 | % | ||||||||||
Net expenses | 0.83 | % | 0.83 | % | 0.83 | % | 0.83 | % | 0.83 | % | ||||||||||
Net investment income | 1.48 | % | 1.32 | % | 1.25 | % | 1.48 | % | 1.37 | % | ||||||||||
Portfolio Turnover | 7 | % | 13 | % | 7 | % | 10 | % | 17 | % | ||||||||||
| (1) | Computed using average shares outstanding. |
| (2) | Amount is less than $(0.005). |
| (3) | Returns are historical and are calculated by determining the percentage change in net asset value with all distributions reinvested and do not reflect fees and expenses imposed by variable annuity contracts or variable life insurance policies. If included, total return would be lower. |
| (4) | Total expenses do not reflect amounts reimbursed and/or waived by the adviser and certain of its affiliates, if applicable. Net expenses are net of all reductions and represent the net expenses paid by the Fund. |
| (5) | Amounts do not include the expenses of the Underlying Funds. |
| 11 | See Notes to Financial Statements. |
Table of Contents
Calvert
VP Volatility Managed Growth Portfolio
December 31, 2019
Notes to Financial Statements
1 Significant Accounting Policies
Calvert VP Volatility Managed Growth Portfolio (the Fund) is a diversified series of Calvert Variable Products, Inc. (the Corporation). The Corporation is a Maryland corporation registered under the Investment Company Act of 1940, as amended (the 1940 Act), as an open-end management investment company. The investment objective of the Fund is to pursue growth potential and some current income, while seeking to manage overall portfolio volatility. The Fund invests primarily in exchange-traded funds representing a broad range of asset classes (the Underlying Funds).
Shares of the Fund are sold without sales charge to insurance companies for allocation to certain of their variable separate accounts. The Fund offers Class F shares.
The Fund applies the accounting and reporting guidance in the Financial Accounting Standards Board (FASB) Accounting Standards Codification Topic 946,Financial Services – Investment Companies (ASC 946). Subsequent events, if any, through the date that the financial statements were issued have been evaluated in the preparation of the financial statements.
A Investment Valuation — Net asset value per share is determined every business day as of the close of the regular session of the New York Stock Exchange (generally 4:00 p.m. Eastern time). The Fund uses independent pricing services approved by the Board of Directors (the Board) to value its investments wherever possible. Investments for which market quotations are not available or deemed not reliable are fair valued in good faith under the direction of the Board.
U.S. generally accepted accounting principles (U.S. GAAP) establishes a disclosure hierarchy that categorizes the inputs to valuation techniques used to value assets and liabilities at measurement date. These inputs are summarized in the three broad levels listed below:
Level 1 - quoted prices in active markets for identical securities
Level 2 - other significant observable inputs (including quoted prices for similar securities, interest rates, prepayment speeds, credit risk, etc.)
Level 3 - significant unobservable inputs (including the Fund’s own assumptions in determining the fair value of investments)
The inputs or methodologies used for valuing securities are not necessarily an indication of the risk associated with investing in those securities.
Valuation techniques used to value the Fund’s investments by major category are as follows:
Securities.Exchange-traded funds are valued at the official closing price as reported by an independent pricing service on the primary market or exchange on which they are traded and are categorized as Level 1 in the hierarchy. Investments in registered investment companies (including money market funds) that do not trade on an exchange are valued at the net asset value per share on the valuation day and are categorized as Level 1 in the hierarchy.
Derivatives.Futures contracts are valued at unrealized appreciation (depreciation) based on the settlement price established each day by the board of trade or exchange on which they are traded and are categorized as Level 1 in the hierarchy.
Fair Valuation.If a market value cannot be determined for a security using the methodologies described above, or if, in the good faith opinion of the Fund’s adviser, the market value does not constitute a readily available market quotation, or if a significant event has occurred that would materially affect the value of the security, the security will be fair valued as determined in good faith by or at the direction of the Board in a manner that most fairly reflects the security’s “fair value”, which is the amount that the Fund might reasonably expect to receive for the security upon its current sale in the ordinary course. Each such determination is based on a consideration of relevant factors, which are likely to vary from one pricing context to another. These factors may include, but are not limited to, the type of security, the existence of any contractual restrictions on the security’s disposition, the price and extent of public trading in similar securities of the issuer or of comparable companies or entities, quotations or relevant information obtained from broker/dealers or other market participants, information obtained from the issuer, analysts, and/or the appropriate stock exchange (for exchange-traded securities), an analysis of the company’s or entity’s financial statements, and an evaluation of the forces that influence the issuer and the market(s) in which the security is purchased and sold.
The values assigned to fair value investments are based on available information and do not necessarily represent amounts that might ultimately be realized. Further, due to the inherent uncertainty of valuations of such investments, the fair values may differ significantly from the values that would have been used had an active market existed, and the differences could be material.
The following table summarizes the market value of the Fund’s holdings as of December 31, 2019, based on the inputs used to value them:
| Asset Description | Level 1 | Level 2 | Level 3 | Total | ||||||||||||
Exchange-Traded Funds | $ | 141,169,170 | $ | — | $ | — | $ | 141,169,170 | ||||||||
Short-Term Investments | 593,375 | — | — | 593,375 | ||||||||||||
Total Investments | $ | 141,762,545 | $ | — | $ | — | $ | 141,762,545 | ||||||||
Futures Contracts | $ | 163,857 | $ | — | $ | — | $ | 163,857 | ||||||||
Total | $ | 141,926,402 | $ | — | $ | — | $ | 141,926,402 | ||||||||
| 12 |
Table of Contents
Calvert
VP Volatility Managed Growth Portfolio
December 31, 2019
Notes to Financial Statements — continued
B Investment Transactions and Income — Investment transactions for financial statement purposes are accounted for on trade date. Realized gains and losses are recorded on an identified cost basis and may include proceeds from litigation. Distributions from the Underlying Funds are recorded on theex-dividend date. Distributions received that represent a return of capital are recorded as a reduction of cost of investments. Distributions received that represent a capital gain are recorded as a realized gain. Interest income is accrued as earned. Expenses included in the accompanying financial statements reflect the expenses of the Fund and do not include any expenses associated with the Underlying Funds.
C Futures Contracts — The Fund may enter into futures contracts to buy or sell a financial instrument for a set price at a future date. Initial margin deposits of either cash or securities as required by the broker are made upon entering into the contract. While the contract is open, daily variation margin payments are made to or received from the broker reflecting the daily change in market value of the contract and are recorded for financial reporting purposes as unrealized gains or losses by the Fund. When a futures contract is closed, a realized gain or loss is recorded equal to the difference between the opening and closing value of the contract. The risks associated with entering into futures contracts may include the possible illiquidity of the secondary market which would limit the Fund’s ability to close out a futures contract prior to the settlement date, an imperfect correlation between the value of the contracts and the underlying financial instruments, or that the counterparty will fail to perform its obligations under the contracts’ terms. Futures contracts are designed by boards of trade, which are designated “contracts markets” by the Commodities Futures Trading Commission. Futures contracts trade on the contracts markets in a manner that is similar to the way a stock trades on a stock exchange, and the boards of trade, through their clearing corporations, guarantee the futures contracts against default. As a result, there is minimal counterparty credit risk to the Fund.
D Distributions to Shareholders — Distributions to shareholders are recorded by the Fund on ex-dividend date. The Fund distributes any net investment income and net realized capital gains at least annually. Both types of distributions are made in shares of the Fund unless an election is made on behalf of a separate account to receive some or all of the distributions in cash. Distributions are determined in accordance with income tax regulations which may differ from U.S. GAAP; accordingly, periodic reclassifications are made within the Fund’s capital accounts to reflect income and gains available for distribution under income tax regulations.
E Estimates — The preparation of financial statements in conformity with U.S. GAAP requires management to make estimates and assumptions that affect the reported amounts of assets and liabilities and disclosure of contingent assets and liabilities at the date of the financial statements and the reported amounts of increases and decreases in net assets from operations during the reporting period. Actual results could differ from those estimates.
F Indemnifications — The Corporation’s By-Laws provide for indemnification for Directors or officers of the Corporation and certain other parties, to the fullest extent permitted by Maryland law and the 1940 Act, provided certain conditions are met. Additionally, in the normal course of business, the Fund enters into agreements with service providers that may contain indemnification clauses. The Fund’s maximum exposure under these arrangements is unknown as this would involve future claims that may be made against the Fund that have not yet occurred.
G Federal Income Taxes — No provision for federal income or excise tax is required since the Fund intends to continue to qualify as a regulated investment company under the Internal Revenue Code and to distribute substantially all of its taxable earnings.
Management has analyzed the Fund’s tax positions taken for all open federal income tax years and has concluded that no provision for federal income tax is required in the Fund’s financial statements. A Fund’s federal tax return is subject to examination by the Internal Revenue Service for a period of three years from the date of filing.
2 Related Party Transactions
The investment advisory fee is earned by Calvert Research and Management (CRM), a subsidiary of Eaton Vance Management (EVM), as compensation for investment advisory services rendered to the Fund. Pursuant to the investment advisory agreement, CRM receives a fee, payable monthly, at the annual rate of 0.42% of the Fund’s average daily net assets. For the year ended December 31, 2019, the investment advisory fee amounted to $647,893.
Ameritas Investment Partners, Inc. (AIP) and Milliman Financial Risk Management LLC provide sub-advisory services to the Fund pursuant to sub-advisory agreements with CRM. Sub-advisory fees are paid by CRM from its investment advisory fee.
CRM has agreed to reimburse the Fund’s operating expenses to the extent that total annual operating expenses (relating to ordinary operating expenses only and excluding expenses such as brokerage commissions, acquired fund fees and expenses of unaffiliated funds, borrowing costs, taxes or litigation expenses) exceed 0.83% of the Fund’s average daily net assets. The expense reimbursement agreement with CRM may be changed or terminated after April 30, 2020. For the year ended December 31, 2019, CRM waived or reimbursed expenses of $82,292.
The administrative fee is earned by CRM as compensation for administrative services rendered to the Fund. The fee is computed at an annual rate of 0.12% of the Fund’s average daily net assets and is payable monthly. For the year ended December 31, 2019, CRM was paid administrative fees of $185,112.
The Fund has in effect a distribution plan for Class F shares (Class F Plan) pursuant to Rule 12b-1 under the 1940 Act. Pursuant to the Class F Plan, the Fund pays Eaton Vance Distributors, Inc. (EVD), an affiliate of CRM and the Fund’s principal underwriter, a distribution and service fee of 0.25% per annum of its average daily net assets attributable to Class F shares for distribution services and facilities provided to the Fund, as well as for personal and/or account maintenance services provided to the class shareholders. Distribution and service fees paid or accrued for the year ended December 31, 2019 amounted to $385,651 for Class F shares.
| 13 |
Table of Contents
Calvert
VP Volatility Managed Growth Portfolio
December 31, 2019
Notes to Financial Statements — continued
EVM provides sub-transfer agency and related services to the Fund pursuant to a Sub-Transfer Agency Support Services Agreement. For the year ended December 31, 2019, sub-transfer agency fees and expenses incurred to EVM amounted to $57 and are included in transfer agency fees and expenses on the Statement of Operations.
Each Director of the Fund who is not an employee of CRM or its affiliates receives a fee of $3,000 for each Board meeting attended in person and $2,000 for each Board meeting attended by phone plus an annual fee of $142,000, and $1,500 for each Committee meeting attended in person and $1,000 for each Committee meeting attended by phone plus an annual Committee fee of $2,500. The Board chair receives an additional $20,000 annual retainer and Committee chairs receive an additional $6,000 annual retainer. Eligible Directors may participate in a Deferred Compensation Plan (the Plan). Amounts deferred under the Plan are treated as though equal dollar amounts had been invested in shares of the Fund or other Calvert funds selected by the Directors. The Fund purchases shares of the funds selected equal to the dollar amounts deferred under the Plan, resulting in an asset equal to the deferred compensation liability. Obligations of the Plan are paid solely from the Fund’s assets. Directors’ fees are allocated to each of the Calvert funds served. Salaries and fees of officers and Directors of the Fund who are employees of CRM or its affiliates are paid by CRM. In addition, an advisory council was established to aid the Board and CRM in advancing the cause of responsible investing through original scholarship and thought leadership. The advisory council consists of CRM’s Chief Executive Officer and four additional members. Each member (other than CRM’s Chief Executive Officer) receives annual compensation of $75,000, which is being reimbursed by Calvert Investment Management, Inc. (CIM), the Calvert funds’ former investment adviser and Ameritas Holding Company, CIM’s parent company, through the end of 2019. For the year ended December 31, 2019, the Fund’s allocated portion of such expense and reimbursement was $3,459, which are included in miscellaneous expense and reimbursement of expenses- other, respectively, on the Statement of Operations.
3 Shareholder Servicing Plan
The Corporation, on behalf of the Fund, has adopted a Shareholder Servicing Plan (Servicing Plan), which permits the Fund to enter into shareholder servicing agreements with intermediaries that maintain accounts in the Fund for the benefit of shareholders. These services may include, but are not limited to, processing purchase and redemption requests, processing dividend payments, and providing account information to shareholders. Under the Servicing Plan, the Fund may make payments at an annual rate of up to 0.11% of its average daily net assets. For the year ended December 31, 2019, no expenses were incurred under the Servicing Plan.
4 Investment Activity
During the year ended December 31, 2019, the cost of purchases and proceeds from sales of investments, other than short-term securities, were $10,702,908 and $39,654,575, respectively.
5 Distributions to Shareholders and Income Tax Information
The tax character of distributions declared for the years ended December 31, 2019 and December 31, 2018 was as follows:
| Year Ended December 31, | ||||||||
| 2019 | 2018 | |||||||
Ordinary income | $ | 2,046,756 | $ | 1,781,206 | ||||
As of December 31, 2019, the components of distributable earnings (accumulated loss) on a tax basis were as follows:
Undistributed ordinary income | $ | 2,223,197 | ||
Deferred capital losses | $ | (1,043,887 | ) | |
Net unrealized appreciation | $ | 34,603,295 | ||
At December 31, 2019, the Fund, for federal income tax purposes, had deferred capital losses of $1,043,887 which would reduce the Fund’s taxable income arising from future net realized gains on investment transactions, if any, to the extent permitted by the Internal Revenue Code, and thus would reduce the amount of distributions to shareholders, which would otherwise be necessary to relieve the Fund of any liability for federal income or excise tax. The deferred capital losses are treated as arising on the first day of the Fund’s next taxable year and retain the same short-term or long-term character as when originally deferred. Of the deferred capital losses at December 31, 2019, $1,043,887 are short-term.
| 14 |
Table of Contents
Calvert
VP Volatility Managed Growth Portfolio
December 31, 2019
Notes to Financial Statements — continued
The cost and unrealized appreciation (depreciation) of investments, including open derivative contracts, of the Fund at December 31, 2019, as determined on a federal income tax basis, were as follows:
Aggregate cost | $ | 107,159,250 | ||
Gross unrealized appreciation | $ | 34,603,295 | ||
Gross unrealized depreciation | — | |||
Net unrealized appreciation | $ | 34,603,295 | ||
6 Financial Instruments
A summary of futures contracts outstanding at December 31, 2019 is included in the Schedule of Investments. During the year ended December 31, 2019, the Fund used futures contracts to hedge against changes in market volatility and declines in the value of the Fund’s investments and to adjust the Fund’s overall equity exposure in an effort to stabilize portfolio volatility around a target level.
At December 31, 2019, the fair value of open derivative instruments (not considered to be hedging instruments for accounting disclosure purposes) and whose primary underlying risk exposure is equity price risk was as follows:
| Derivative | Statement of Assets and Liabilities Caption | Assets | Liabilities | |||||||||
Futures contracts | Distributable earnings | $ | 163,857 | (1) | $ | — | ||||||
| (1) | Only the current day’s variation margin is reported within the Statement of Assets and Liabilities as Receivable or Payable for variation margin on open futures contracts, as applicable. |
The effect of derivative instruments (not considered to be hedging instruments for accounting disclosure purposes) on the Statement of Operations and whose primary underlying risk exposure is equity price risk for the year ended December 31, 2019 was as follows:
| Statement of Operations Caption | ||||||||
| Derivative | Net realized gain (loss) on futures contracts | Change in unrealized appreciation (depreciation) on futures contracts | ||||||
Futures contracts | $ | (2,893,179 | ) | $ | (1,991,415 | ) | ||
The average notional cost of futures contracts (long) and futures contracts (short) outstanding during the year ended December 31, 2019 was approximately $6,614,000 and $8,117,000, respectively.
7 Securities Lending
To generate additional income, the Fund may lend its securities pursuant to a securities lending agency agreement with State Street Bank and Trust Company (SSBT), the securities lending agent. Security loans are subject to termination by the Fund at any time and, therefore, are not considered illiquid investments. The Fund requires that the loan be continuously collateralized by either cash or securities as collateral equal at all times to at least 102% of the market value of the domestic securities loaned and 105% of the market value of the international securities loaned (if applicable). The market value of securities loaned is determined daily and any additional required collateral is delivered to the Fund on the next business day. Cash collateral is generally invested in a money market fund registered under the 1940 Act that is managed by an affiliate of SSBT. Any gain or loss in the market price of the loaned securities that might occur and any interest earned or dividends declared during the term of the loan would accrue to the account of the Fund. Income earned on the investment of collateral, net of broker rebates and other expenses incurred by the securities lending agent, is split between the Fund and the securities lending agent on the basis of agreed upon contractual terms. Non-cash collateral, if any, is held by the lending agent on behalf of the Fund and cannot be sold or re-pledged by the Fund; accordingly, such collateral is not reflected in the Statement of Assets and Liabilities.
| 15 |
Table of Contents
Calvert
VP Volatility Managed Growth Portfolio
December 31, 2019
Notes to Financial Statements — continued
The risks associated with lending portfolio securities include, but are not limited to, possible delays in receiving additional collateral or in the recovery of the loaned securities, possible loss of rights to the collateral should the borrower fail financially, as well as risk of loss in the value of the collateral or the value of the investments made with the collateral. The securities lending agent shall indemnify the Fund in the case of default of any securities borrower.
At December 31, 2019, the total value of securities on loan was $15,437,422 and the total value of collateral received was $15,680,698, comprised of cash of $593,375 and U.S. government and/or agencies securities of $15,087,323.
The following table provides a breakdown of securities lending transactions accounted for as secured borrowings, the obligations by class of collateral pledged, and the remaining contractual maturity of those transactions as of December 31, 2019.
| Remaining Contractual Maturity of the Transactions | ||||||||||||||||||||
| Overnight and Continuous | <30 days | 30 to 90 days | >90 days | Total | ||||||||||||||||
Securities Lending Transactions |
| |||||||||||||||||||
Exchange-Traded Funds | $ | 15,680,698 | $ | — | $ | — | $ | — | $ | 15,680,698 | ||||||||||
The carrying amount of the liability for deposits for securities loaned at December 31, 2019 approximated its fair value. If measured at fair value, such liability would have been considered as Level 2 in the fair value hierarchy (see Note 1A) at December 31, 2019.
8 Line of Credit
Effective October 29, 2019, the Fund participates with other portfolios and funds managed by EVM and its affiliates, including CRM, in an $800 million unsecured line of credit with a group of banks, which is in effect through October 27, 2020. Borrowings are made by the Fund solely to facilitate the handling of unusual and/or unanticipated short-term cash requirements. Interest is charged to the Fund based on its borrowings at an amount above either the Eurodollar rate or Federal Funds rate. In addition, a fee computed at an annual rate of 0.15% on the daily unused portion of the line of credit is allocated among the participating portfolios and funds at the end of each quarter. Because the line of credit is not available exclusively to the Fund, it may be unable to borrow some or all of its requested amounts at any particular time.
Prior to October 29, 2019, the Fund participated with other funds managed by CRM in a $100 million ($62.5 million prior to June 21, 2019) committed line of credit agreement with SSBT, which was terminated by the Calvert funds. Borrowings bore interest at the higher of the one-month London Interbank Offered Rate (LIBOR) in effect that day or the overnight Federal Funds rate, plus 1.00% per annum. A commitment fee of 0.20% per annum was incurred on the unused portion of the committed facility, which was allocated to all participating funds.
The Fund had no borrowings pursuant to its lines of credit during the year ended December 31, 2019.
9 Capital Shares
The Corporation may issue its shares in one or more series (such as the Fund). The authorized shares of the Fund consist of 100,000,000 common shares, $0.10 par value.
Transactions in capital shares for the years ended December 31, 2019 and December 31, 2018 were as follows:
| Year Ended December 31, 2019 | Year Ended December 31, 2018 | |||||||||||||||
| Shares | Amount | Shares | Amount | |||||||||||||
Class F |
| |||||||||||||||
Shares sold | 296,898 | $ | 5,709,104 | 780,219 | $ | 15,007,871 | ||||||||||
Reinvestment of distributions | 107,951 | 2,046,756 | 90,785 | 1,781,206 | ||||||||||||
Shares redeemed | (1,607,914 | ) | (31,204,087 | ) | (475,248 | ) | (9,090,133 | ) | ||||||||
Net increase (decrease) | (1,203,065 | ) | $ | (23,448,227 | ) | 395,756 | $ | 7,698,944 | ||||||||
At December 31, 2019, separate accounts of an insurance company that is an affiliate of AIP owned 100% of the value of the outstanding shares of the Fund.
| 16 |
Table of Contents
Calvert
VP Volatility Managed Growth Portfolio
December 31, 2019
Report of Independent Registered Public Accounting Firm
To the Shareholders and Board of Directors
Calvert Variable Products, Inc.:
Opinion on the Financial Statements
We have audited the accompanying statement of assets and liabilities of Calvert VP Volatility Managed Growth Portfolio (the Fund), a series of Calvert Variable Products, Inc., including the schedule of investments, as of December 31, 2019, the related statement of operations for the year then ended, the statements of changes in net assets for each of the years in thetwo-year period then ended, and the related notes (collectively, the financial statements) and the financial highlights for each of the years in the five-year period then ended. In our opinion, the financial statements and financial highlights present fairly, in all material respects, the financial position of the Fund as of December 31, 2019, the results of its operations for the year then ended, the changes in its net assets for each of the years in thetwo-year period then ended, and the financial highlights for each of the years in thefive-year period then ended, in conformity with U.S. generally accepted accounting principles.
Basis for Opinion
These financial statements and financial highlights are the responsibility of the Fund’s management. Our responsibility is to express an opinion on these financial statements and financial highlights based on our audits. We are a public accounting firm registered with the Public Company Accounting Oversight Board (United States) (PCAOB) and are required to be independent with respect to the Fund in accordance with the U.S. federal securities laws and the applicable rules and regulations of the Securities and Exchange Commission and the PCAOB.
We conducted our audits in accordance with the standards of the PCAOB. Those standards require that we plan and perform the audit to obtain reasonable assurance about whether the financial statements and financial highlights are free of material misstatement, whether due to error or fraud. Our audits included performing procedures to assess the risks of material misstatement of the financial statements and financial highlights, whether due to error or fraud, and performing procedures that respond to those risks. Such procedures included examining, on a test basis, evidence regarding the amounts and disclosures in the financial statements and financial highlights. Such procedures also included confirmation of securities owned as of December 31, 2019, by correspondence with the custodian and brokers. Our audits also included evaluating the accounting principles used and significant estimates made by management, as well as evaluating the overall presentation of the financial statements and financial highlights. We believe that our audits provide a reasonable basis for our opinion.

We have served as the auditor of one or more of the Calvert Funds since 2002.
Philadelphia, Pennsylvania
February 19, 2020
| 17 |
Table of Contents
Calvert
VP Volatility Managed Growth Portfolio
December 31, 2019
Federal Tax Information (Unaudited)
As required by the Internal Revenue Code and/or regulations, shareholders must be notified regarding the status of the dividends received deduction for corporations.
Dividends Received Deduction.Corporate shareholders are generally entitled to take the dividends received deduction on the portion of the Fund’s dividend distribution that qualifies under tax law. For the Fund’s fiscal 2019 ordinary income dividends, 6.85% qualifies for the corporate dividends received deduction.
| 18 |
Table of Contents
Calvert
VP Volatility Managed Growth Portfolio
December 31, 2019
Fund Management.The Directors of Calvert Variable Products, Inc. (the Corporation) are responsible for the overall management and supervision of the Corporation’s affairs. The Directors and officers of the Corporation are listed below. Except as indicated, each individual has held the office shown or other offices in the same company for the last five years. Each Board member holds office until his or her successor is elected and qualified, or until his or her earlier death, resignation, retirement, removal or disqualification. Under the terms of the Fund’s current Board member retirement policy, an Independent Board member must retire at the end of the calendar year in which he or she turns 75. However, if such retirement would cause the Fund to be out of compliance with Section 16 of the 1940 Act or any other regulations or guidance of the SEC, then such retirement and resignation will not become effective until such time as action has been taken for the Fund to be in compliance upon a Board member’s retirement. The “Independent Directors” consist of those Directors who are not “interested persons” of the Corporation, as that term is defined under the 1940 Act. The business address of each Director and officer, with the exception of Ms. Gemma and Mr. Kirchner, is 1825 Connecticut Avenue NW, Suite 400, Washington, DC 20009. As used below, “CRM” refers to Calvert Research and Management. Each Director oversees 39 funds in the Calvert fund complex. Each officer serves as an officer of certain other Calvert funds.
| Name and Year of Birth | Position with the | Position Start Date | Principal Occupation(s) and Directorships During Past Five Years and Other Relevant Experience | |||
| Interested Director | ||||||
John H. Streur(1) 1960 | Director and President | 2015 | President and Chief Executive Officer of Calvert Research and Management (since December 31, 2016). President and Chief Executive Officer of Calvert Investments, Inc. (January 2015-December 2016); Chief Executive Officer of Calvert Investment Distributors, Inc. (August 2015-December 2016); Chief Compliance Officer of Calvert Investment Management, Inc. (August 2015-April 2016); President and Director, Portfolio 21 Investments, Inc. (through October 2014); President, Chief Executive Officer and Director, Managers Investment Group LLC (through January 2012); President and Director, The Managers Funds and Managers AMG Funds (through January 2012). Other Directorships in the Last Five Years. Portfolio 21 Investments, Inc. (asset management) (through October 2014); Managers Investment Group LLC (asset management) (through January 2012); The Managers Funds (asset management) (through January 2012); Managers AMG Funds (asset management) (through January 2012); Calvert Impact Capital, Inc. | |||
| Independent Directors | ||||||
Richard L. Baird, Jr. 1948 | Director | 2016 | Regional Disaster Recovery Lead, American Red Cross of Greater Pennsylvania (since 2017). Volunteer, American Red Cross (since 2015). Former President and CEO of Adagio Health Inc. (retired in 2014) in Pittsburgh, PA. Other Directorships in the Last Five Years. None. | |||
Alice Gresham Bullock 1950 | Chair and Director | 2016 (Chair); 2008 (Director) | Professor Emerita at Howard University School of Law. Dean Emerita of Howard University School of Law and Deputy Director of the Association of American Law Schools (1992-1994). Other Directorships in the Last Five Years. None. | |||
Cari M. Dominguez 1949 | Director | 2016 | Former Chair of the U.S. Equal Employment Opportunity Commission. Other Directorships in the Last Five Years. Manpower, Inc. (employment agency); Triple S Management Corporation (managed care); National Association of Corporate Directors. | |||
John G. Guffey, Jr.(2) 1948 | Director | 2016 | President of Aurora Press Inc., a privately held publisher of trade paperbacks (since January 1997). Other Directorships in the Last Five Years. Calvert Impact Capital, Inc. (through December 31, 2018); Calvert Ventures, LLC. | |||
Miles D. Harper, III 1962 | Director | 2016 | Partner, Carr Riggs & Ingram (public accounting firm) since October 2014. Partner, Gainer Donnelly & Desroches (public accounting firm) (now Carr Riggs & Ingram), November 1999-September 2014). Other Directorships in the Last Five Years. Bridgeway Funds (9) (asset management). | |||
Joy V. Jones 1950 | Director | 2016 | Attorney. Other Directorships in the Last Five Years. Conduit Street Restaurants SUD 2 Limited; Palm Management Restaurant Corporation. | |||
| 19 |
Table of Contents
Calvert
VP Volatility Managed Growth Portfolio
December 31, 2019
Management and Organization — continued
| Name and Year of Birth | Position with the | Position Start Date | Principal Occupation(s) and Directorships During Past Five Years and Other Relevant Experience | |||
| Independent Directors (continued) | ||||||
Anthony A. Williams 1951 | Director | 2016 | CEO and Executive Director of the Federal City Council (July 2012 to present); Senior Adviser and Independent Consultant for King and Spalding LLP (September 2015 to present); Executive Director of Global Government Practice at the Corporate Executive Board (January 2010 to January 2012). Other Directorships in the Last Five Years. Freddie Mac; Evoq Properties/ Meruelo Maddux Properties, Inc. (real estate management); Weston Solutions, Inc. (environmental services); Bipartisan Policy Center’s Debt Reduction Task Force; Chesapeake Bay Foundation; Catholic University of America; Urban Institute (research organization). | |||
| Name and Year of Birth | Position(s) with the Corporation | Position Start Date | Principal Occupation(s) During Past Five Years | |||
| Principal Officers who are not Directors | ||||||
Hope L. Brown 1973 | Chief Compliance Officer | 2014 | Chief Compliance Officer of 39 registered investment companies advised by CRM (since 2014). Vice President and Chief Compliance Officer, Wilmington Funds (2012-2014). | |||
Maureen A. Gemma(3) 1960 | Vice President, Secretary and Chief Legal Officer | 2016 | Vice President of CRM and officer of 39 registered investment companies advised by CRM (since 2016). Also Vice President of Eaton Vance and certain of its affiliates and officer of 159 registered investment companies advised or administered by Eaton Vance. | |||
James F. Kirchner(3) 1967 | Treasurer | 2016 | Vice President of CRM and officer of 39 registered investment companies advised by CRM (since 2016). Also Vice President of Eaton Vance and certain of its affiliates and officer of 159 registered investment companies advised or administered by Eaton Vance. | |||
| (1) | Mr. Streur is an interested person of the Fund because of his positions with the Fund’s adviser and certain affiliates. |
| (2) | Mr. Guffey is currently married to Rebecca L. Adamson, who served as a member of the Advisory Council through December 31, 2019. |
| (3) | The business address for Ms. Gemma and Mr. Kirchner is Two International Place, Boston, MA 02110. |
The SAI for the Fund includes additional information about the Directors and officers of the Fund and can be obtained without charge on Calvert’s website at www.calvert.com or by calling 1-800-368-2745.
| 20 |
Table of Contents
Calvert Funds
Privacy. The Eaton Vance organization is committed to ensuring your financial privacy. Each entity listed below has adopted a privacy policy and procedures (“Privacy Program”) Eaton Vance believes is reasonably designed to protect your personal information and to govern when and with whom Eaton Vance may share your personal information.
| • | At the time of opening an account, Eaton Vance generally requires you to provide us with certain information such as name, address, social security number, tax status, account numbers, and account balances. This information is necessary for us to both open an account for you and to allow us to satisfy legal requirements such as applicable anti-money laundering reviews and know-your-customer requirements. |
| • | On an ongoing basis, in the normal course of servicing your account, Eaton Vance may share your information with unaffiliated third parties that perform various services for Eaton Vance and/or your account. These third parties include transfer agents, custodians, broker/dealers and our professional advisers, including auditors, accountants, and legal counsel. Eaton Vance may additionally share your personal information with our affiliates. |
| • | We believe our Privacy Program is reasonably designed to protect the confidentiality of your personal information and to prevent unauthorized access to that information. |
| • | We reserve the right to change our Privacy Program at any time upon proper notification to you. You may want to review our Privacy Program periodically for changes by accessing the link on our homepage: www.eatonvance.com. |
Our pledge of protecting your personal information applies to the following entities within the Eaton Vance organization: the Eaton Vance Family of Funds, Eaton Vance Management, Eaton Vance Investment Counsel, Eaton Vance Distributors, Inc., Eaton Vance Trust Company, EatonVanceManagement (International) Limited, Eaton Vance Advisers International Limited, Eaton Vance Global Advisors Limited, Eaton Vance Management’s Real Estate Investment Group, Boston Management and Research, Calvert Research and Management, and Calvert Funds. This Privacy Notice supersedes all previously issued privacy disclosures. For more information about our Privacy Program or about how your personal information may be used, please call 1-800-368-2745.
Delivery of Shareholder Documents. The Securities and Exchange Commission (SEC) permits funds to deliver only one copy of shareholder documents, including prospectuses, proxy statements and shareholder reports, to fund investors with multiple accounts at the same residential or post office box address. This practice is often called “householding” and it helps eliminate duplicate mailings to shareholders.Calvert funds, or your financial intermediary, may household the mailing of your documents indefinitely unless you instruct Calvert funds, or your financial intermediary, otherwise. If you would prefer that your Calvert fund documents not be householded, please contact Calvert funds at1-800-368-2745, or contact your financial intermediary. Your instructions that householding not apply to delivery of your Calvert fund documents will typically be effective within 30 days of receipt by Calvert funds or your financial intermediary. Separate statements will be generated for each separate account and will be householded as described above.
Portfolio Holdings. Each Calvert fund files a schedule of portfolio holdings on Part F to Form N-PORT with the SEC for the first and third quarters of each fiscal year. The Form N-PORT will be available on the Calvert funds’ website at www.calvert.com, by calling Calvert funds at1-800-368-2745 or in the EDGAR database on the SEC’s website at www.sec.gov.
Proxy Voting. The Proxy Voting Guidelines that each Calvert fund uses to determine how to vote proxies relating to portfolio securities is provided as an Appendix to the fund’s Statement of Additional Information. The Statement of Additional Information can be obtained free of charge by calling the Calvert funds at 1-800-368-2745, by visiting the Calvert funds’ website at www.calvert.com or visiting the SEC’s website at www.sec.gov. Information regarding how a Calvert fund voted proxies relating to portfolio securities during the most recent 12-month period ended June 30 is available by calling Calvert funds, by visiting the Calvert funds’ website at www.calvert.com or by visiting the SEC’s website at www.sec.gov.
| 21 |
Table of Contents
This Page Intentionally Left Blank
Table of Contents
This Page Intentionally Left Blank
Table of Contents
This Page Intentionally Left Blank
Table of Contents
Investment Adviser and Administrator
Calvert Research and Management
1825 Connecticut Avenue NW, Suite 400
Washington, DC 20009
Investment Sub-Advisers
Ameritas Investment Partners, Inc.
5945 R Street
Lincoln, NE 68505
Milliman Financial Risk Management LLC
71 South Wacker Drive, 31st Floor
Chicago, IL 60606
Principal Underwriter*
Eaton Vance Distributors, Inc.
Two International Place
Boston, MA 02110
(617)482-8260
Custodian
State Street Bank and Trust Company
State Street Financial Center, One Lincoln Street
Boston, MA 02111
Transfer Agent
DST Asset Manager Solutions, Inc.
2000 Crown Colony Drive
Quincy, MA 02169
Independent Registered Public Accounting Firm
KPMG LLP
1601 Market Street
Philadelphia, PA 19103-2499
Fund Offices
1825 Connecticut Avenue NW, Suite 400
Washington, DC 20009
| * | FINRA BrokerCheck. Investors may check the background of their Investment Professional by contacting the Financial Industry Regulatory Authority (FINRA). FINRA BrokerCheck is a free tool to help investors check the professional background of current and former FINRA-registered securities firms and brokers. FINRA BrokerCheck is available by calling1-800-289-9999 and at www.FINRA.org. The FINRA BrokerCheck brochure describing this program is available to investors at www.FINRA.org. |
Table of Contents
Printed on recycled paper.

24237 12.31.19
Table of Contents

Calvert
VP Volatility Managed Moderate Growth Portfolio
Annual Report
December 31, 2019
Important Note. Beginning on January 1, 2021, as permitted by regulations adopted by the Securities and Exchange Commission, you may not receive paper copies of the Fund’s annual and semi-annual shareholder reports from the insurance company or plan sponsor unless you specifically request paper copies. Instead, the reports will be made available on a website and you will be notified by mail each time a report is posted and provided with a website address to access the report. Instructions for requesting paper copies will be provided by the insurance company, plan sponsor or your financial intermediary, as applicable. Please contact the insurance company, plan sponsor or your financial intermediary, as applicable, or follow instructions included with this disclosure, if any, for more information.

Table of Contents
Commodity Futures Trading Commission Registration. Effective December 31, 2012, the Commodity Futures Trading Commission (“CFTC”) adopted certain regulatory changes that subject registered investment companies and advisers to regulation by the CFTC if a fund invests more than a prescribed level of its assets in certain CFTC-regulated instruments (including futures, certain options and swap agreements) or markets itself as providing investment exposure to such instruments. The Fund and its adviser have claimed an exclusion from the definition of the term “commodity pool operator” under the Commodity Exchange Act. Accordingly, neither the Fund nor the adviser is subject to CFTC regulation.
Fund shares are not insured by the FDIC and are not deposits or other obligations of, or guaranteed by, any depository institution. Shares are subject to investment risks, including possible loss of principal invested.
This report must be preceded or accompanied by a current summary prospectus or prospectus. Before investing, investors should consider carefully the investment objective, risks, and charges and expenses of a mutual fund. This and other important information is contained in the summary prospectus and prospectus, which can be obtained from a financial intermediary. Prospective investors should read the prospectus carefully before investing. For further information, please call1-800-368-2745.
Table of Contents
Annual Report December 31, 2019
Calvert
VP Volatility Managed Moderate Growth Portfolio
Table of Contents
Calvert
VP Volatility Managed Moderate Growth Portfolio
December 31, 2019
Management’s Discussion of Fund Performance 1
Economic and Market Conditions
Virtually every U.S. and global equity index posted double-digit returns for the12-month period ended December 31, 2019, making it a good year for stock investments. The period was also marked by strong performance across U.S. bond markets.
In January 2019, investors appeared to take a “glass is half full” approach. Although U.S. manufacturing output and business investment was weak — held back by slowing global growth and anon-again/off-again U.S.-China trade rift — low U.S. unemployment, strong consumer spending, and the easing of the federal funds rate by the U.S. Federal Reserve (the Fed) combined to lift investor sentiment.
As a result, U.S. stocks started the year on a climb, and international stocks followed. The period was also notable for a dramatic turnaround infixed-income markets as the rising interest-rate environment of 2018 gave way to falling interest-rate expectations in 2019 against the backdrop of multiple domestic and international uncertainties.
After holding interest rates steady through the first half of the year, the Fed cut the federal funds rate on July 31, 2019 — its first reduction in over a decade — followed by two additional rate cuts in September and October to end the period at1.50%-1.75%. By end of the third quarter, 60 central banks around the world had lowered their interest rates as well. Lower rates are intended to help stimulate economic activity by making borrowing costs relatively more affordable.
Downward pressure on interest rates and upward pressure on bond prices continued through most of the period propelled by lower-than-desired inflation, low European interest rates, and the U.S.-China trade conflict.
During the period, the blue-chip Dow Jones Industrial Average®2 returned 25.34%, while the broader U.S. equity market, as measured by the S&P 500® Index, returned 31.49%. The technology-laden Nasdaq Composite Index returned 36.69% during the period.Large-cap U.S. stocks, as measured by the S&P 500® Index, generally outperformed theirsmall-cap counterparts, as measured by the Russell 2000® Index.
Overseas, the MSCI World Index, a measure of developed market equity securities, returned 27.67%. The MSCI EAFE Index of developed-market international equities returned 22.01%, and the MSCI Emerging Markets Index returned 18.42%.
On the fixed-income side, the Bloomberg Barclays U.S. Aggregate Bond Index, a broad measure of the U.S. bond market, returned 8.72%. The Bloomberg Barclays U.S. Corporate Bond Index, a measure of U.S. corporate investment-grade bonds, finished 2019 with a 14.54% return — its best calendar-year performance since 2009. High yield fixed-income securities also performed well with the ICE BofAML U.S. High Yield Index returning 14.41% during the period ended December 31, 2019.
Investment Strategy
Calvert VP Volatility Managed Moderate Growth Portfolio (the Fund) seeks to achieve its objectives by investing in exchange-traded
funds (ETFs) representing a broad range of asset classes and employing derivatives to manage overall portfolio volatility. The Fund sets a targeted asset allocation and typical asset allocation range among equity and fixed-income ETFs. The subadvisor seeks ETFs that are representative of the desired asset class and whose underlying fundamentals appear to have the potential for above-average long-term performance. The volatility-management strategy is implemented by entering into futures contracts based on one or more stock market indices, to attempt to hedge against changes in market volatility and declines in the value of the Fund’s investments in ETFs.
Fund Performance
For the12-month period ended December 31, 2019, the Fund returned 18.56% for Class F shares at net asset value (NAV), outperforming its primary benchmark, the S&P 500 Daily Risk Control 10% Index (the Index), which returned 17.63% during the period.
Fund performance is also measured against a custom blended benchmark (the Secondary Blended Benchmark) based on a mix of market indexes that more closely reflects the impact of the Fund’s asset-allocation strategy than the single asset-class Index. The Index is used to capture the impact of the Fund’s volatility-management strategy. The Fund underperformed the Secondary Blended Benchmark, which returned 21.08% during the period.
The Fund outperformed the Index by 0.93% during the period. The Fund consists of multiple asset classes, while the Index consists of two components: the S&P 500® Index and cash. Furthermore, the Index allows for up to 50% leverage in an attempt to harvest market gains in periods of low volatility, such as during the fourth quarter of 2019. As a largely unlevered investment, the Fund underperformed in the fourth quarter relative to the Index, but outperformed in the first three quarters.
The Fund’s volatility-management strategy contributed negatively to performance relative to the Index. As the volatility-management strategy attempts to reduce the Fund’s exposure to equities during periods of elevated volatility, the Fund’s futures overlay is likely to result in losses during market recoveries, as the Fund typically unwinds defensive hedges gradually.
The Fund started the year with substantial hedges in place as a defensive reaction to the volatile decline in the fourth quarter of 2018. The Fund gradually returned to full equity allocation by early February 2019. Subsequently, the Fundre-engaged defensive hedges to a much smaller extent in August 2019, as a response to a brief period of market turmoil. In cumulative terms, the net detraction from derivative positions throughout the year was 1.06%, entirely attributable to the first month of the year.
The Fund underperformed the Secondary Blended Benchmark. Allocation to the technology sector, the best performing market sector, was a positive contributor while an overweight position in cash in lieu of investment-grade bonds was a detractor as bonds turned in one of their best periods in several years.
See Endnotes and Additional Disclosures in this report.
Past performance is no guarantee of future results. Returns are historical and are calculated by determining the percentage change in net asset value (NAV) or offering price (as applicable) with all distributions reinvested. Investment return and principal value will fluctuate so that shares, when redeemed, may be worth more or less than their original cost. Performance for periods less than or equal to one year is cumulative. Performance is for the stated time period only; due to market volatility, current Fund performance may be lower or higher than the quoted return.
| 2 |
Table of Contents
Calvert
VP Volatility Managed Moderate Growth Portfolio
December 31, 2019
Portfolio Managers Kevin L. Keene, CFA of Ameritas Investment Partners, Inc.; Adam Schenck, CFA, FRM and Maria Schiopu, CFA, each of Milliman Financial Risk Management LLC
| % Average Annual Total Returns 2,3 | Class Inception Date | Performance Inception Date | One Year | Five Years | Since Inception | |||||||||||||||
Class F at NAV | 04/30/2013 | 04/30/2013 | 18.56 | % | 5.74 | % | 5.95 | % | ||||||||||||
| ||||||||||||||||||||
S&P 500 Daily Risk Control 10% Index | — | — | 17.63 | % | 8.99 | % | 9.92 | % | ||||||||||||
Moderate Growth Portfolio Blended Benchmark | — | — | 21.08 | 7.45 | 8.04 | |||||||||||||||
| % Total Annual Operating Expense Ratios 4 | Class F | |||||||||||||||||||
| Gross | 0.98 | % | ||||||||||||||||||
| Net | 0.92 | |||||||||||||||||||
Growth of $10,000
This graph shows the change in value of a hypothetical investment of $10,000 in Class F of the Fund for the period indicated. For comparison, the same investment is shown in the indicated index.
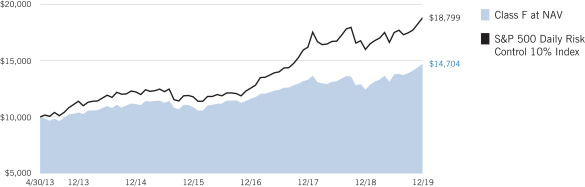
See Endnotes and Additional Disclosures in this report.
Past performance is no guarantee of future results. Returns are historical and are calculated by determining the percentage change in net asset value (NAV) or offering price (as applicable) with all distributions reinvested. Investment return and principal value will fluctuate so that shares, when redeemed, may be worth more or less than their original cost. Performance for periods less than or equal to one year is cumulative. Performance is for the stated time period only; due to market volatility, current Fund performance may be lower or higher than the quoted return.
| 3 |
Table of Contents
Calvert
VP Volatility Managed Moderate Growth Portfolio
December 31, 2019
| Asset Allocation (% of total investments) | ||||
Equity Exchange-Traded Funds | 67.3 | % | ||
Fixed-Income Exchange-Traded Funds | 32.2 | |||
Short-Term Investments | 0.5 | |||
Total | 100.0 | % | ||
See Endnotes and Additional Disclosures in this report.
| 4 |
Table of Contents
Calvert
VP Volatility Managed Moderate Growth Portfolio
December 31, 2019
Endnotes and Additional Disclosures
| 1 | The views expressed in this report are those of the portfolio manager(s) and are current only through the date stated at the top of this page. These views are subject to change at any time based upon market or other conditions, and Calvert and the Fund(s) disclaim any responsibility to update such views. These views may not be relied upon as investment advice and, because investment decisions are based on many factors, may not be relied upon as an indication of trading intent on behalf of any Calvert fund. This commentary may contain statements that are not historical facts, referred to as “forward looking statements.” The Fund’s actual future results may differ significantly from those stated in any forward looking statement, depending on factors such as changes in securities or financial markets or general economic conditions, the volume of sales and purchases of Fund shares, the continuation of investment advisory, administrative and service contracts, and other risks discussed from time to time in the Fund’s filings with the Securities and Exchange Commission. |
| 2 | Dow Jones Industrial Average® is a price-weighted average of 30 blue-chip stocks that are generally the leaders in their industry. S&P 500® Index is an unmanaged index of large-cap stocks commonly used as a measure of U.S. stock market performance. S&P 500 Daily Risk Control 10% Index is an unmanaged index of U.S. large-cap stocks with a volatility target of 10%. S&P Dow Jones Indices are a product of S&P Dow Jones Indices LLC (“S&P DJI”) and have been licensed for use. S&P® and S&P 500® are registered trademarks of S&P DJI; Dow Jones® is a registered trademark of Dow Jones Trademark Holdings LLC (“Dow Jones”); S&P DJI, Dow Jones and their respective affiliates do not sponsor, endorse, sell or promote the Fund, will not have any liability with respect thereto and do not have any liability for any errors, omissions, or interruptions of the S&P Dow Jones Indices. Nasdaq Composite Index is a market capitalization-weighted index of all domestic and international securities listed on Nasdaq. Source: Nasdaq, Inc. The information is provided by Nasdaq (with its affiliates, are referred to as the “Corporations”) and Nasdaq’s third party licensors on an “as is” basis and the Corporations make no guarantees and bear no liability of any kind with respect to the information or the Fund. Russell 2000® Index is an unmanaged index of 2,000 U.S. small-cap stocks. Russell 3000® Index is an unmanaged index of the 3,000 largest U.S. stocks. MSCI World Index is an unmanaged index of equity securities in the developed markets. MSCI EAFE Index is an unmanaged index of equities in the developed markets, excluding the U.S. and Canada. MSCI Emerging Markets Index is an unmanaged index of emerging markets common stocks. MSCI USA IMI/Equity REITs Index is an unmanaged index of U.S. equity REITs. MSCI indexes are net of foreign withholding taxes. Source: MSCI. MSCI data may not be reproduced or used for any other purpose. MSCI provides no warranties, has not prepared or approved this report, and has no liability hereunder. Bloomberg Barclays U.S. Aggregate Bond |
| Index is an unmanaged index of domestic investment-grade bonds, including corporate, government and mortgage-backed securities. Bloomberg Barclays U.S. Corporate Bond Index measures the performance of investment-grade U.S. corporate securities with a maturity of one year or more. ICE BofAML U.S. High Yield Index is an unmanaged index of below-investment grade U.S. corporate bonds. ICE BofAML 3-Month U.S. Treasury Bill Index is an unmanaged index of U.S. Treasury securities maturing in 90 days. ICE® BofAML® indices are not for redistribution or other uses; provided “as is”, without warranties, and with no liability. Eaton Vance has prepared this report and ICE Data Indices, LLC does not endorse it, or guarantee, review, or endorse Eaton Vance’s products. BofAML® is a licensed registered trademark of Bank of America Corporation in the United States and other countries. Moderate Growth Portfolio Blended Benchmark is an internally constructed benchmark which is comprised of a blend of 47% Russell 3000® Index, 33% Bloomberg Barclays U.S. Aggregate Bond Index, 13% MSCI EAFE Index, 4% ICE BofAML 3-Month U.S. Treasury Bill Index, and 3% MSCI USA IMI/Equity REITs Index, which is rebalanced monthly. Unless otherwise stated, index returns do not reflect the effect of any applicable sales charges, commissions, expenses, taxes or leverage, as applicable. It is not possible to invest directly in an index. |
| 3 | There is no sales charge. Insurance-related charges are not included in the calculation of returns. If such charges were reflected, the returns would be lower. Please refer to the report for your insurance contract for performance data reflecting insurance-related charges. Performance since inception for an index, if presented, is the performance since the Fund’s or oldest share class’ inception, as applicable. |
Calvert Research and Management became the investment adviser to the Fund on December 31, 2016. Performance reflected prior to such date is that of the Fund’s former investment adviser. |
| 4 | Source: Fund prospectus. Net expense ratio reflects a contractual expense reimbursement that continues through 4/30/20. Without the reimbursement, performance would have been lower. The expense ratios for the current reporting period can be found in the Financial Highlights section of this report. |
Fund profile subject to change due to active management. |
| 5 |
Table of Contents
Calvert
VP Volatility Managed Moderate Growth Portfolio
December 31, 2019
Example
As a Fund shareholder, you incur ongoing costs, including management fees; distribution and/or service fees; and other Fund expenses. This Example is intended to help you understand your ongoing costs (in dollars) of Fund investing and to compare these costs with the ongoing costs of investing in other mutual funds. The Example is based on an investment of $1,000 invested at the beginning of the period and held for the entire period (July 1, 2019 to December 31, 2019).
Actual Expenses
The first line of the table below provides information about actual account values and actual expenses. You may use the information in this line, together with the amount you invested, to estimate the expenses that you paid over the period. Simply divide your account value by $1,000 (for example, an $8,600 account value divided by $1,000 = 8.6), then multiply the result by the number in the first line under the heading entitled “Expenses Paid During Period” to estimate the expenses you paid on your account during this period.
Hypothetical Example for Comparison Purposes
The second line of the table below provides information about hypothetical account values and hypothetical expenses based on the actual Fund expense ratio and an assumed rate of return of 5% per year (before expenses), which is not the actual Fund return. The hypothetical account values and expenses may not be used to estimate the actual ending account balance or expenses you paid for the period. You may use this information to compare the ongoing costs of investing in the Fund and other funds. To do so, compare this 5% hypothetical example with the 5% hypothetical examples that appear in the shareholder reports of the other funds.
Please note that the expenses shown in the table are meant to highlight your ongoing costs only and do not reflect expenses and charges which are, or may be imposed under the variable annuity contract or variable life insurance policy (variable contracts) (if applicable) through which your investment in the Fund is made. Therefore, the second line of the table is useful in comparing ongoing costs associated with an investment in vehicles which fund benefits under variable contracts, and will not help you determine the relative total costs of investing in the Fund through variable contracts. In addition, if these expenses and charges imposed under the variable contracts were included, your costs would have been higher.
| Beginning Account Value (7/1/19) | Ending Account Value (12/31/19) | Expenses Paid During Period* (7/1/19 – 12/31/19) | Annualized Expense Ratio | |||||||||||||
Actual | ||||||||||||||||
Class F | $ | 1,000.00 | $ | 1,068.10 | $ | 4.33 | ** | 0.83 | % | |||||||
Hypothetical | ||||||||||||||||
(5% return per year before expenses) | ||||||||||||||||
Class F | $ | 1,000.00 | $ | 1,021.02 | $ | 4.23 | ** | 0.83 | % | |||||||
| * | Expenses are equal to the Fund’s annualized expense ratio, multiplied by the average account value over the period, multiplied by 184/365 (to reflect theone-half year period). The Example assumes that the $1,000 was invested at the net asset value per share determined at the close of business on June 30, 2019. Expenses shown do not include insurance-related charges. Expenses do not include fees and expenses incurred indirectly from investment in underlying affiliated and/or unaffiliated funds. |
| ** | Absent a waiver and/or reimbursement of expenses by an affiliate, expenses would be higher. |
| 6 |
Table of Contents
Calvert
VP Volatility Managed Moderate Growth Portfolio
December 31, 2019
| Exchange-Traded Funds — 93.7% |
| |||||||
| Security | Shares | Value | ||||||
| Equity Exchange-Traded Funds — 63.4% | ||||||||
Financial Select Sector SPDR Fund | 61,000 | $ | 1,877,580 | |||||
iShares Core S&PMid-Cap ETF | 19,000 | 3,910,580 | ||||||
iShares Russell 2000 ETF (1) | 21,000 | 3,479,070 | ||||||
iShares S&P 500 Growth ETF (1) | 29,000 | 5,615,560 | ||||||
iShares S&P 500 Value ETF | 37,000 | 4,813,330 | ||||||
iShares S&PMid-Cap 400 Value ETF (1) | 4,000 | 682,920 | ||||||
Vanguard FTSE Developed Markets ETF | 241,000 | 10,618,460 | ||||||
Vanguard FTSE Emerging Markets ETF | 36,000 | 1,600,920 | ||||||
Vanguard REIT ETF(1) | 28,000 | 2,598,120 | ||||||
Vanguard S&P 500 ETF | 72,000 | 21,297,600 | ||||||
| $ | 56,494,140 | |||||||
| Fixed-Income Exchange-Traded Funds — 30.3% | ||||||||
iShares Core U.S. Aggregate Bond ETF | 157,000 | $ | 17,642,090 | |||||
Vanguard Total Bond Market ETF | 112,000 | 9,392,320 | ||||||
| $ | 27,034,410 | |||||||
Total Exchange-Traded Funds |
| $ | 83,528,550 | |||||
| Short-Term Investments — 0.4% |
| |||||||
| Security | Shares | Value | ||||||
State Street Navigator Securities Lending Government Money Market Portfolio, 1.56% (2) | 382,250 | $ | 382,250 | |||||
Total Short-Term Investments |
| $ | 382,250 | |||||
Total Investments |
| $ | 83,910,800 | |||||
Other Assets, Less Liabilities — 5.9% |
| $ | 5,269,933 | |||||
Net Assets — 100.0% |
| $ | 89,180,733 | |||||
The percentage shown for each investment category in the Schedule of Investments is based on net assets.
Notes to Schedule of Investments
| (1) | All or a portion of this security was on loan at December 31, 2019. The aggregate market value of securities on loan at December 31, 2019 was $4,145,691. |
| (2) | Represents investment of cash collateral received in connection with securities lending. |
| Futures Contracts | ||||||||||||||||||||
| Description | Number of Contracts | Position | Expiration Date | Notional Amount | Value/ Unrealized Appreciation (Depreciation) | |||||||||||||||
| Equity Futures | ||||||||||||||||||||
E-mini Russell 2000 Index | 10 | Long | 3/20/20 | $ | 835,300 | $ | 10,792 | |||||||||||||
E-mini S&P 500 Index | 20 | Long | 3/20/20 | 3,231,100 | 60,085 | |||||||||||||||
E-mini S&P MidCap 400 Index | 3 | Long | 3/20/20 | 619,440 | 7,318 | |||||||||||||||
MSCI EAFE Index | 12 | Long | 3/20/20 | 1,221,900 | 10,491 | |||||||||||||||
| $ | 88,686 | |||||||||||||||||||
| 7 | See Notes to Financial Statements. |
Table of Contents
Calvert
VP Volatility Managed Moderate Growth Portfolio
December 31, 2019
Statement of Assets and Liabilities
| Assets | December 31, 2019 | |||
Investments in securities of unaffiliated issuers, at value (identified cost $67,794,329) - including | $ | 83,910,800 | ||
Receivable for variation margin on open futures contracts | 15,540 | |||
Cash | 5,751,397 | |||
Receivable for capital shares sold | 3,273 | |||
Securities lending income receivable | 791 | |||
Receivable from affiliate | 12,424 | |||
Deposits at broker for futures contracts | 231,600 | |||
Directors’ deferred compensation plan | 17,121 | |||
Other assets | 4,756 | |||
Total assets | $ | 89,947,702 | ||
| Liabilities | ||||
Payable for investments purchased | $ | 251,370 | ||
Payable for capital shares redeemed | 1,774 | |||
Deposits for securities loaned | 382,250 | |||
Payable to affiliates: | ||||
Investment advisory fee | 31,564 | |||
Administrative fee | 9,018 | |||
Distribution and service fees | 18,788 | |||
Sub-transfer agency fee | 58 | |||
Directors’ deferred compensation plan | 17,121 | |||
Accrued expenses | 55,026 | |||
Total liabilities | $ | 766,969 | ||
Net Assets | $ | 89,180,733 | ||
| Sources of Net Assets | ||||
Paid-in capital | $ | 70,934,516 | ||
Distributable earnings | 18,246,217 | |||
Total | $ | 89,180,733 | ||
| Class F | ||||
Net Assets | $ | 89,180,733 | ||
Shares Outstanding | 4,501,486 | |||
Net Asset Value, Offering Price and Redemption Price Per Share | ||||
(net assets ÷ shares of beneficial interest outstanding) | $ | 19.81 | ||
| 8 | See Notes to Financial Statements. |
Table of Contents
Calvert
VP Volatility Managed Moderate Growth Portfolio
December 31, 2019
Statement of Operations
| Investment Income | Year Ended December 31, 2019 | |||
Dividend income | $ | 2,004,646 | ||
Interest income | 61,981 | |||
Securities lending income, net | 20,587 | |||
Total investment income | $ | 2,087,214 | ||
| Expenses | ||||
Investment advisory fee | $ | 366,654 | ||
Administrative fee | 104,758 | |||
Distribution and service fees | 218,246 | |||
Directors’ fees and expenses | 5,165 | |||
Custodian fees | 24,095 | |||
Transfer agency fees and expenses | 983 | |||
Accounting fees | 20,897 | |||
Professional fees | 31,676 | |||
Reports to shareholders | 10,251 | |||
Miscellaneous | 9,112 | |||
Total expenses | $ | 791,837 | ||
Waiver and/or reimbursement of expenses by affiliate | $ | (65,282 | ) | |
Reimbursement of expenses - other | (1,978 | ) | ||
Net expenses | $ | 724,577 | ||
Net investment income | $ | 1,362,637 | ||
| Realized and Unrealized Gain (Loss) | ||||
Net realized gain (loss): | ||||
Investment securities | $ | 1,629,159 | ||
Futures contracts | (265,342 | ) | ||
Net realized gain | $ | 1,363,817 | ||
Change in unrealized appreciation (depreciation): | ||||
Investment securities | $ | 12,717,555 | ||
Futures contracts | (566,018 | ) | ||
Net change in unrealized appreciation (depreciation) | $ | 12,151,537 | ||
Net realized and unrealized gain | $ | 13,515,354 | ||
Net increase in net assets resulting from operations | $ | 14,877,991 | ||
| 9 | See Notes to Financial Statements. |
Table of Contents
Calvert
VP Volatility Managed Moderate Growth Portfolio
December 31, 2019
Statements of Changes in Net Assets
| Year Ended December 31, | ||||||||
| Increase (Decrease) in Net Assets | 2019 | 2018 | ||||||
From operations: | ||||||||
Net investment income | $ | 1,362,637 | $ | 1,281,410 | ||||
Net realized gain | 1,363,817 | 445,369 | ||||||
Net change in unrealized appreciation (depreciation) | 12,151,537 | (7,774,168 | ) | |||||
Net increase (decrease) in net assets from operations | $ | 14,877,991 | $ | (6,047,389 | ) | |||
Distributions to shareholders | $ | (2,326,382 | ) | $ | (2,393,411 | ) | ||
Net decrease in net assets from capital share transactions | $ | (6,715,494 | ) | $ | (2,903,536 | ) | ||
Net increase (decrease) in net assets | $ | 5,836,115 | $ | (11,344,336 | ) | |||
| Net Assets | ||||||||
At beginning of year | $ | 83,344,618 | $ | 94,688,954 | ||||
At end of year | $ | 89,180,733 | $ | 83,344,618 | ||||
| 10 | See Notes to Financial Statements. |
Table of Contents
Calvert
VP Volatility Managed Moderate Growth Portfolio
December 31, 2019
Financial Highlights
| Class F | ||||||||||||||||||||
| Year Ended December 31, | ||||||||||||||||||||
| 2019 | 2018 | 2017 | 2016 | 2015 | ||||||||||||||||
Net asset value — Beginning of year | $ | 17.18 | $ | 18.90 | $ | 16.69 | $ | 15.65 | $ | 16.20 | ||||||||||
| Income (Loss) From Operations | ||||||||||||||||||||
Net investment income (1) | $ | 0.29 | $ | 0.26 | $ | 0.23 | $ | 0.24 | $ | 0.24 | ||||||||||
Net realized and unrealized gain (loss) | 2.86 | (1.49 | ) | 2.19 | 0.82 | (0.61 | ) | |||||||||||||
Total income (loss) from operations | $ | 3.15 | $ | (1.23 | ) | $ | 2.42 | $ | 1.06 | $ | (0.37 | ) | ||||||||
| Less Distributions | ||||||||||||||||||||
From net investment income | $ | (0.28 | ) | $ | (0.23 | ) | $ | (0.21 | ) | $ | (0.02 | ) | $ | (0.16 | ) | |||||
From net realized gain | (0.24 | ) | (0.26 | ) | — | — | (0.02 | ) | ||||||||||||
Total distributions | $ | (0.52 | ) | $ | (0.49 | ) | $ | (0.21 | ) | $ | (0.02 | ) | $ | (0.18 | ) | |||||
Net asset value — End of year | $ | 19.81 | $ | 17.18 | $ | 18.90 | $ | 16.69 | $ | 15.65 | ||||||||||
Total Return (2) | 18.56 | % | (6.69 | )% | 14.55 | % | 6.78 | % | (2.29 | )% | ||||||||||
| Ratios/Supplemental Data | ||||||||||||||||||||
Net assets, end of year (000’s omitted) | $ | 89,181 | $ | 83,345 | $ | 94,689 | $ | 81,859 | $ | 64,310 | ||||||||||
Ratios (as a percentage of average daily net assets): (3)(4) | ||||||||||||||||||||
Total expenses | 0.91 | % | 0.89 | % | 0.91 | % | 0.94 | % | 0.90 | % | ||||||||||
Net expenses | 0.83 | % | 0.83 | % | 0.83 | % | 0.83 | % | 0.83 | % | ||||||||||
Net investment income | 1.56 | % | 1.40 | % | 1.29 | % | 1.49 | % | 1.48 | % | ||||||||||
Portfolio Turnover | 7 | % | 14 | % | 8 | % | 6 | % | 16 | % | ||||||||||
| (1) | Computed using average shares outstanding. |
| (2) | Returns are historical and are calculated by determining the percentage change in net asset value with all distributions reinvested and do not reflect fees and expenses imposed by variable annuity contracts or variable life insurance policies. If included, total return would be lower. |
| (3) | Total expenses do not reflect amounts reimbursed and/or waived by the adviser and certain of its affiliates, if applicable. Net expenses are net of all reductions and represent the net expenses paid by the Fund. |
| (4) | Amounts do not include the expenses of the Underlying Funds. |
| 11 | See Notes to Financial Statements. |
Table of Contents
Calvert
VP Volatility Managed Moderate Growth Portfolio
December 31, 2019
Notes to Financial Statements
1 Significant Accounting Policies
Calvert VP Volatility Managed Moderate Growth Portfolio (the Fund) is a diversified series of Calvert Variable Products, Inc. (the Corporation). The Corporation is a Maryland corporation registered under the Investment Company Act of 1940, as amended (the 1940 Act), as anopen-end management investment company. The investment objective of the Fund is to pursue a balance of current income and growth potential, while seeking to manage overall portfolio volatility. The Fund invests primarily in exchange-traded funds representing a broad range of asset classes (the Underlying Funds).
Shares of the Fund are sold without sales charge to insurance companies for allocation to certain of their variable separate accounts. The Fund offers Class F shares.
The Fund applies the accounting and reporting guidance in the Financial Accounting Standards Board (FASB) Accounting Standards Codification Topic 946,Financial Services – Investment Companies (ASC 946). Subsequent events, if any, through the date that the financial statements were issued have been evaluated in the preparation of the financial statements.
A Investment Valuation — Net asset value per share is determined every business day as of the close of the regular session of the New York Stock Exchange (generally 4:00 p.m. Eastern time). The Fund uses independent pricing services approved by the Board of Directors (the Board) to value its investments wherever possible. Investments for which market quotations are not available or deemed not reliable are fair valued in good faith under the direction of the Board.
U.S. generally accepted accounting principles (U.S. GAAP) establishes a disclosure hierarchy that categorizes the inputs to valuation techniques used to value assets and liabilities at measurement date. These inputs are summarized in the three broad levels listed below:
Level 1 - quoted prices in active markets for identical securities
Level 2 - other significant observable inputs (including quoted prices for similar securities, interest rates, prepayment speeds, credit risk, etc.)
Level 3 - significant unobservable inputs (including the Fund’s own assumptions in determining the fair value of investments)
The inputs or methodologies used for valuing securities are not necessarily an indication of the risk associated with investing in those securities.
Valuation techniques used to value the Fund’s investments by major category are as follows:
Securities. Exchange-traded funds are valued at the official closing price as reported by an independent pricing service on the primary market or exchange on which they are traded and are categorized as Level 1 in the hierarchy. Investments in registered investment companies (including money market funds) that do not trade on an exchange are valued at the net asset value per share on the valuation day and are categorized as Level 1 in the hierarchy.
Derivatives. Futures contracts are valued at unrealized appreciation (depreciation) based on the settlement price established each day by the board of trade or exchange on which they are traded and are categorized as Level 1 in the hierarchy.
Fair Valuation. If a market value cannot be determined for a security using the methodologies described above, or if, in the good faith opinion of the Fund’s adviser, the market value does not constitute a readily available market quotation, or if a significant event has occurred that would materially affect the value of the security, the security will be fair valued as determined in good faith by or at the direction of the Board in a manner that most fairly reflects the security’s “fair value”, which is the amount that the Fund might reasonably expect to receive for the security upon its current sale in the ordinary course. Each such determination is based on a consideration of relevant factors, which are likely to vary from one pricing context to another. These factors may include, but are not limited to, the type of security, the existence of any contractual restrictions on the security’s disposition, the price and extent of public trading in similar securities of the issuer or of comparable companies or entities, quotations or relevant information obtained from broker/dealers or other market participants, information obtained from the issuer, analysts, and/or the appropriate stock exchange (for exchange-traded securities), an analysis of the company’s or entity’s financial statements, and an evaluation of the forces that influence the issuer and the market(s) in which the security is purchased and sold.
The values assigned to fair value investments are based on available information and do not necessarily represent amounts that might ultimately be realized. Further, due to the inherent uncertainty of valuations of such investments, the fair values may differ significantly from the values that would have been used had an active market existed, and the differences could be material.
The following table summarizes the market value of the Fund’s holdings as of December 31, 2019, based on the inputs used to value them:
| Asset Description | Level 1 | Level 2 | Level 3 | Total | ||||||||||||
Exchange-Traded Funds | $ | 83,528,550 | $ | — | $ | — | $ | 83,528,550 | ||||||||
Short-Term Investments | 382,250 | — | — | 382,250 | ||||||||||||
Total Investments | $ | 83,910,800 | $ | — | $ | — | $ | 83,910,800 | ||||||||
Futures Contracts | $ | 88,686 | $ | — | $ | — | $ | 88,686 | ||||||||
Total | $ | 83,999,486 | $ | — | $ | — | $ | 83,999,486 | ||||||||
| 12 |
Table of Contents
Calvert
VP Volatility Managed Moderate Growth Portfolio
December 31, 2019
Notes to Financial Statements — continued
B Investment Transactions and Income — Investment transactions for financial statement purposes are accounted for on trade date. Realized gains and losses are recorded on an identified cost basis and may include proceeds from litigation. Distributions from the Underlying Funds are recorded on theex-dividend date. Distributions received that represent a return of capital are recorded as a reduction of cost of investments. Distributions received that represent a capital gain are recorded as a realized gain. Interest income is accrued as earned. Expenses included in the accompanying financial statements reflect the expenses of the Fund and do not include any expenses associated with the Underlying Funds.
C Futures Contracts — The Fund may enter into futures contracts to buy or sell a financial instrument for a set price at a future date. Initial margin deposits of either cash or securities as required by the broker are made upon entering into the contract. While the contract is open, daily variation margin payments are made to or received from the broker reflecting the daily change in market value of the contract and are recorded for financial reporting purposes as unrealized gains or losses by the Fund. When a futures contract is closed, a realized gain or loss is recorded equal to the difference between the opening and closing value of the contract. The risks associated with entering into futures contracts may include the possible illiquidity of the secondary market which would limit the Fund’s ability to close out a futures contract prior to the settlement date, an imperfect correlation between the value of the contracts and the underlying financial instruments, or that the counterparty will fail to perform its obligations under the contracts’ terms. Futures contracts are designed by boards of trade, which are designated “contracts markets” by the Commodities Futures Trading Commission. Futures contracts trade on the contracts markets in a manner that is similar to the way a stock trades on a stock exchange, and the boards of trade, through their clearing corporations, guarantee the futures contracts against default. As a result, there is minimal counterparty credit risk to the Fund.
D Distributions to Shareholders — Distributions to shareholders are recorded by the Fund onex-dividend date. The Fund distributes any net investment income and net realized capital gains at least annually. Both types of distributions are made in shares of the Fund unless an election is made on behalf of a separate account to receive some or all of the distributions in cash. Distributions are determined in accordance with income tax regulations which may differ from U.S. GAAP; accordingly, periodic reclassifications are made within the Fund’s capital accounts to reflect income and gains available for distribution under income tax regulations.
E Estimates — The preparation of financial statements in conformity with U.S. GAAP requires management to make estimates and assumptions that affect the reported amounts of assets and liabilities and disclosure of contingent assets and liabilities at the date of the financial statements and the reported amounts of increases and decreases in net assets from operations during the reporting period. Actual results could differ from those estimates.
F Indemnifications — The Corporation’sBy-Laws provide for indemnification for Directors or officers of the Corporation and certain other parties, to the fullest extent permitted by Maryland law and the 1940 Act, provided certain conditions are met. Additionally, in the normal course of business, the Fund enters into agreements with service providers that may contain indemnification clauses. The Fund’s maximum exposure under these arrangements is unknown as this would involve future claims that may be made against the Fund that have not yet occurred.
G Federal Income Taxes — No provision for federal income or excise tax is required since the Fund intends to continue to qualify as a regulated investment company under the Internal Revenue Code and to distribute substantially all of its taxable earnings.
Management has analyzed the Fund’s tax positions taken for all open federal income tax years and has concluded that no provision for federal income tax is required in the Fund’s financial statements. A Fund’s federal tax return is subject to examination by the Internal Revenue Service for a period of three years from the date of filing.
2 Related Party Transactions
The investment advisory fee is earned by Calvert Research and Management (CRM), a subsidiary of Eaton Vance Management (EVM), as compensation for investment advisory services rendered to the Fund. Pursuant to the investment advisory agreement, CRM receives a fee, payable monthly, at the annual rate of 0.42% of the Fund’s average daily net assets. For the year ended December 31, 2019, the investment advisory fee amounted to $366,654.
Ameritas Investment Partners, Inc. (AIP) and Milliman Financial Risk Management LLC providesub-advisory services to the Fund pursuant tosub-advisory agreements with CRM.Sub-advisory fees are paid by CRM from its investment advisory fee.
CRM has agreed to reimburse the Fund’s operating expenses to the extent that total annual operating expenses (relating to ordinary operating expenses only and excluding expenses such as brokerage commissions, acquired fund fees and expenses of unaffiliated funds, borrowing costs, taxes or litigation expenses) exceed 0.83% of the Fund’s average daily net assets. The expense reimbursement agreement with CRM may be changed or terminated after April 30, 2020. For the year ended December 31, 2019, CRM waived or reimbursed expenses of $65,282.
The administrative fee is earned by CRM as compensation for administrative services rendered to the Fund. The fee is computed at an annual rate of 0.12% of the Fund’s average daily net assets and is payable monthly. For the year ended December 31, 2019, CRM was paid administrative fees of $104,758.
The Fund has in effect a distribution plan for Class F shares (Class F Plan) pursuant to Rule12b-1 under the 1940 Act. Pursuant to the Class F Plan, the Fund pays Eaton Vance Distributors, Inc. (EVD), an affiliate of CRM and the Fund’s principal underwriter, a distribution and service fee of 0.25% per annum of its average daily net assets attributable to Class F shares for distribution services and facilities provided to the Fund, as well as for personal and/or account maintenance services provided to the class shareholders. Distribution and service fees paid or accrued for the year ended December 31, 2019 amounted to $218,246 for Class F shares.
| 13 |
Table of Contents
Calvert
VP Volatility Managed Moderate Growth Portfolio
December 31, 2019
Notes to Financial Statements — continued
EVM providessub-transfer agency and related services to the Fund pursuant to aSub-Transfer Agency Support Services Agreement. For the year ended December 31, 2019,sub-transfer agency fees and expenses incurred to EVM amounted to $123 and are included in transfer agency fees and expenses on the Statement of Operations.
Each Director of the Fund who is not an employee of CRM or its affiliates receives a fee of $3,000 for each Board meeting attended in person and $2,000 for each Board meeting attended by phone plus an annual fee of $142,000, and $1,500 for each Committee meeting attended in person and $1,000 for each Committee meeting attended by phone plus an annual Committee fee of $2,500. The Board chair receives an additional $20,000 annual retainer and Committee chairs receive an additional $6,000 annual retainer. Eligible Directors may participate in a Deferred Compensation Plan (the Plan). Amounts deferred under the Plan are treated as though equal dollar amounts had been invested in shares of the Fund or other Calvert funds selected by the Directors. The Fund purchases shares of the funds selected equal to the dollar amounts deferred under the Plan, resulting in an asset equal to the deferred compensation liability. Obligations of the Plan are paid solely from the Fund’s assets. Directors’ fees are allocated to each of the Calvert funds served. Salaries and fees of officers and Directors of the Fund who are employees of CRM or its affiliates are paid by CRM. In addition, an advisory council was established to aid the Board and CRM in advancing the cause of responsible investing through original scholarship and thought leadership. The advisory council consists of CRM’s Chief Executive Officer and four additional members. Each member (other than CRM’s Chief Executive Officer) receives annual compensation of $75,000, which is being reimbursed by Calvert Investment Management, Inc. (CIM), the Calvert funds’ former investment adviser and Ameritas Holding Company, CIM’s parent company, through the end of 2019. For the year ended December 31, 2019, the Fund’s allocated portion of such expense and reimbursement was $1,978, which are included in miscellaneous expense and reimbursement of expenses - other, respectively, on the Statement of Operations.
3 Shareholder Servicing Plan
The Corporation, on behalf of the Fund, has adopted a Shareholder Servicing Plan (Servicing Plan), which permits the Fund to enter into shareholder servicing agreements with intermediaries that maintain accounts in the Fund for the benefit of shareholders. These services may include, but are not limited to, processing purchase and redemption requests, processing dividend payments, and providing account information to shareholders. Under the Servicing Plan, the Fund may make payments at an annual rate of up to 0.11% of its average daily net assets. For the year ended December 31, 2019, no expenses were incurred under the Servicing Plan.
4 Investment Activity
During the year ended December 31, 2019, the cost of purchases and proceeds from sales of investments, other than short-term securities, were $5,931,266 and $15,584,950, respectively.
5 Distributions to Shareholders and Income Tax Information
The tax character of distributions declared for the years ended December 31, 2019 and December 31, 2018 was as follows:
| Year Ended December 31, | ||||||||
| 2019 | 2018 | |||||||
Ordinary income | $ | 1,253,634 | $ | 1,124,083 | ||||
Long-term capital gains | $ | 1,072,748 | $ | 1,269,328 | ||||
As of December 31, 2019, the components of distributable earnings (accumulated loss) on a tax basis were as follows:
Undistributed ordinary income | $ | 1,333,664 | ||
Undistributed long-term capital gains | $ | 921,278 | ||
Net unrealized appreciation | $ | 15,991,275 | ||
The cost and unrealized appreciation (depreciation) of investments, including open derivative contracts, of the Fund at December 31, 2019, as determined on a federal income tax basis, were as follows:
Aggregate cost | $ | 67,919,525 | ||
Gross unrealized appreciation | $ | 15,991,275 | ||
Gross unrealized depreciation | — | |||
Net unrealized appreciation | $ | 15,991,275 | ||
| 14 |
Table of Contents
Calvert
VP Volatility Managed Moderate Growth Portfolio
December 31, 2019
Notes to Financial Statements — continued
6 Financial Instruments
A summary of futures contracts outstanding at December 31, 2019 is included in the Schedule of Investments. During the year ended December 31, 2019, the Fund use futures contracts to hedge against changes in market volatility and declines in the value of the Fund’s investments and to adjust the Fund’s overall equity exposure in an effort to stabilize portfolio volatility around a target level.
At December 31, 2019, the fair value of open derivative instruments (not considered to be hedging instruments for accounting disclosure purposes) and whose primary underlying risk exposure is equity price risk was as follows:
| Derivative | Statement of Assets and Liabilities Caption | Assets | Liabilities | |||||||||
Futures contracts | Distributable earnings | $ | 88,686 | (1) | $ | — | ||||||
| (1) | Only the current day’s variation margin is reported within the Statement of Assets and Liabilities as Receivable or Payable for variation margin on open futures contracts, as applicable. |
The effect of derivative instruments (not considered to be hedging instruments for accounting disclosure purposes) on the Statement of Operations and whose primary underlying risk exposure is equity price risk for the year ended December 31, 2019 was as follows:
| Statement of Operations Caption | ||||||||
| Derivative | Net realized gain (loss) on futures contracts | Change in unrealized appreciation (depreciation) on futures contracts | ||||||
Futures contracts | $ | (265,342 | ) | $ | (566,018 | ) | ||
The average notional cost of futures contracts (long) and futures contracts (short) outstanding during the year ended December 31, 2019 was approximately $4,831,000 and $2,206,000, respectively.
7 Securities Lending
To generate additional income, the Fund may lend its securities pursuant to a securities lending agency agreement with State Street Bank and Trust Company (SSBT), the securities lending agent. Security loans are subject to termination by the Fund at any time and, therefore, are not considered illiquid investments. The Fund requires that the loan be continuously collateralized by either cash or securities as collateral equal at all times to at least 102% of the market value of the domestic securities loaned and 105% of the market value of the international securities loaned (if applicable). The market value of securities loaned is determined daily and any additional required collateral is delivered to the Fund on the next business day. Cash collateral is generally invested in a money market fund registered under the 1940 Act that is managed by an affiliate of SSBT. Any gain or loss in the market price of the loaned securities that might occur and any interest earned or dividends declared during the term of the loan would accrue to the account of the Fund. Income earned on the investment of collateral, net of broker rebates and other expenses incurred by the securities lending agent, is split between the Fund and the securities lending agent on the basis of agreed upon contractual terms.Non-cash collateral, if any, is held by the lending agent on behalf of the Fund and cannot be sold orre-pledged by the Fund; accordingly, such collateral is not reflected in the Statement of Assets and Liabilities.
The risks associated with lending portfolio securities include, but are not limited to, possible delays in receiving additional collateral or in the recovery of the loaned securities, possible loss of rights to the collateral should the borrower fail financially, as well as risk of loss in the value of the collateral or the value of the investments made with the collateral. The securities lending agent shall indemnify the Fund in the case of default of any securities borrower.
At December 31, 2019, the total value of securities on loan was $4,145,691 and the total value of collateral received was $4,212,310, comprised of cash of $382,250 and U.S. government and/or agencies securities of $3,830,060.
| 15 |
Table of Contents
Calvert
VP Volatility Managed Moderate Growth Portfolio
December 31, 2019
Notes to Financial Statements — continued
The following table provides a breakdown of securities lending transactions accounted for as secured borrowings, the obligations by class of collateral pledged, and the remaining contractual maturity of those transactions as of December 31, 2019.
| Remaining Contractual Maturity of the Transactions | ||||||||||||||||||||
| Overnight and Continuous | <30 days | 30 to 90 days | >90 days | Total | ||||||||||||||||
Securities Lending Transactions |
| |||||||||||||||||||
Exchange-Traded Funds | $ | 4,212,310 | $ | — | $ | — | $ | — | $ | 4,212,310 | ||||||||||
The carrying amount of the liability for deposits for securities loaned at December 31, 2019 approximated its fair value. If measured at fair value, such liability would have been considered as Level 2 in the fair value hierarchy (see Note 1A) at December 31, 2019.
8 Line of Credit
Effective October 29, 2019, the Fund participates with other portfolios and funds managed by EVM and its affiliates, including CRM, in an $800 million unsecured line of credit with a group of banks, which is in effect through October 27, 2020. Borrowings are made by the Fund solely to facilitate the handling of unusual and/or unanticipated short-term cash requirements. Interest is charged to the Fund based on its borrowings at an amount above either the Eurodollar rate or Federal Funds rate. In addition, a fee computed at an annual rate of 0.15% on the daily unused portion of the line of credit is allocated among the participating portfolios and funds at the end of each quarter. Because the line of credit is not available exclusively to the Fund, it may be unable to borrow some or all of its requested amounts at any particular time.
Prior to October 29, 2019, the Fund participated with other funds managed by CRM in a $100 million ($62.5 million prior to June 21, 2019) committed line of credit agreement with SSBT, which was terminated by the Calvert funds. Borrowings bore interest at the higher of theone-month London Interbank Offered Rate (LIBOR) in effect that day or the overnight Federal Funds rate, plus 1.00% per annum. A commitment fee of 0.20% per annum was incurred on the unused portion of the committed facility, which was allocated to all participating funds.
The Fund had no borrowings pursuant to its lines of credit during the year ended December 31, 2019.
9 Capital Shares
The Corporation may issue its shares in one or more series (such as the Fund). The authorized shares of the Fund consist of 100,000,000 common shares, $0.10 par value.
Transactions in capital shares for the years ended December 31, 2019 and December 31, 2018 were as follows:
| Year Ended December 31, 2019 | Year Ended December 31, 2018 | |||||||||||||||
| Shares | Amount | Shares | Amount | |||||||||||||
Class F |
| |||||||||||||||
Shares sold | 119,457 | $ | 2,227,334 | 262,606 | $ | 4,913,488 | ||||||||||
Reinvestment of distributions | 126,709 | 2,326,382 | 127,241 | 2,393,411 | ||||||||||||
Shares redeemed | (596,765 | ) | (11,269,210 | ) | (547,958 | ) | (10,210,435 | ) | ||||||||
Net decrease | (350,599 | ) | $ | (6,715,494 | ) | (158,111 | ) | $ | (2,903,536 | ) | ||||||
At December 31, 2019, separate accounts of an insurance company that is an affiliate of AIP owned 100% of the value of the outstanding shares of the Fund.
| 16 |
Table of Contents
Calvert
VP Volatility Managed Moderate Growth Portfolio
December 31, 2019
Report of Independent Registered Public Accounting Firm
To the Shareholders and Board of Directors
Calvert Variable Products, Inc.:
Opinion on the Financial Statements
We have audited the accompanying statement of assets and liabilities of Calvert VP Volatility Managed Moderate Growth Portfolio (the Fund), a series of Calvert Variable Products, Inc., including the schedule of investments, as of December 31, 2019, the related statement of operations for the year then ended, the statements of changes in net assets for each of the years in thetwo-year period then ended, and the related notes (collectively, the financial statements) and the financial highlights for each of the years in the five-year period then ended. In our opinion, the financial statements and financial highlights present fairly, in all material respects, the financial position of the Fund as of December 31, 2019, the results of its operations for the year then ended, the changes in its net assets for each of the years in thetwo-year period then ended, and the financial highlights for each of the years in thefive-year period then ended, in conformity with U.S. generally accepted accounting principles.
Basis for Opinion
These financial statements and financial highlights are the responsibility of the Fund’s management. Our responsibility is to express an opinion on these financial statements and financial highlights based on our audits. We are a public accounting firm registered with the Public Company Accounting Oversight Board (United States) (PCAOB) and are required to be independent with respect to the Fund in accordance with the U.S. federal securities laws and the applicable rules and regulations of the Securities and Exchange Commission and the PCAOB.
We conducted our audits in accordance with the standards of the PCAOB. Those standards require that we plan and perform the audit to obtain reasonable assurance about whether the financial statements and financial highlights are free of material misstatement, whether due to error or fraud. Our audits included performing procedures to assess the risks of material misstatement of the financial statements and financial highlights, whether due to error or fraud, and performing procedures that respond to those risks. Such procedures included examining, on a test basis, evidence regarding the amounts and disclosures in the financial statements and financial highlights. Such procedures also included confirmation of securities owned as of December 31, 2019, by correspondence with the custodian and brokers. Our audits also included evaluating the accounting principles used and significant estimates made by management, as well as evaluating the overall presentation of the financial statements and financial highlights. We believe that our audits provide a reasonable basis for our opinion.

We have served as the auditor of one or more of the Calvert Funds since 2002.
Philadelphia, Pennsylvania
February 19, 2020
| 17 |
Table of Contents
Calvert
VP Volatility Managed Moderate Growth Portfolio
December 31, 2019
Federal Tax Information (Unaudited)
As required by the Internal Revenue Code and/or regulations, shareholders must be notified regarding the status of the dividends received deduction for corporations and capital gains dividends.
Dividends Received Deduction. Corporate shareholders are generally entitled to take the dividends received deduction on the portion of the Fund’s dividend distribution that qualifies under tax law. For the Fund’s fiscal 2019 ordinary income dividends, 5.79% qualifies for the corporate dividends received deduction.
Capital Gains Dividends. The Fund hereby designates as a capital gain dividend with respect to the taxable year ended December 31, 2019, $921,533 or, if subsequently determined to be different, the net capital gain of such year.
| 18 |
Table of Contents
Calvert
VP Volatility Managed Moderate Growth Portfolio
December 31, 2019
Fund Management. The Directors of Calvert Variable Products, Inc. (the Corporation) are responsible for the overall management and supervision of the Corporation’s affairs. The Directors and officers of the Corporation are listed below. Except as indicated, each individual has held the office shown or other offices in the same company for the last five years. Each Board member holds office until his or her successor is elected and qualified, or until his or her earlier death, resignation, retirement, removal or disqualification. Under the terms of the Fund’s current Board member retirement policy, an Independent Board member must retire at the end of the calendar year in which he or she turns 75. However, if such retirement would cause the Fund to be out of compliance with Section 16 of the 1940 Act or any other regulations or guidance of the SEC, then such retirement and resignation will not become effective until such time as action has been taken for the Fund to be in compliance upon a Board member’s retirement. The “Independent Directors” consist of those Directors who are not “interested persons” of the Corporation, as that term is defined under the 1940 Act. The business address of each Director and officer, with the exception of Ms. Gemma and Mr. Kirchner, is 1825 Connecticut Avenue NW, Suite 400, Washington, DC 20009. As used below, “CRM” refers to Calvert Research and Management. Each Director oversees 39 funds in the Calvert fund complex. Each officer serves as an officer of certain other Calvert funds.
| Name and Year of Birth | Position with the | Position Start Date | Principal Occupation(s) and Directorships During Past Five Years and Other Relevant Experience | |||
| Interested Director | ||||||
John H. Streur(1) 1960 | Director and President | 2015 | President and Chief Executive Officer of Calvert Research and Management (since December 31, 2016). President and Chief Executive Officer of Calvert Investments, Inc. (January 2015-December 2016); Chief Executive Officer of Calvert Investment Distributors, Inc. (August 2015-December 2016); Chief Compliance Officer of Calvert Investment Management, Inc. (August 2015-April 2016); President and Director, Portfolio 21 Investments, Inc. (through October 2014); President, Chief Executive Officer and Director, Managers Investment Group LLC (through January 2012); President and Director, The Managers Funds and Managers AMG Funds (through January 2012). Other Directorships in the Last Five Years.Portfolio 21 Investments, Inc. (asset management) (through October 2014); Managers Investment Group LLC (asset management) (through January 2012); The Managers Funds (asset management) (through January 2012); Managers AMG Funds (asset management) (through January 2012); Calvert Impact Capital, Inc. | |||
| Independent Directors | ||||||
Richard L. Baird, Jr. 1948 | Director | 2016 | Regional Disaster Recovery Lead, American Red Cross of Greater Pennsylvania (since 2017). Volunteer, American Red Cross (since 2015). Former President and CEO of Adagio Health Inc. (retired in 2014) in Pittsburgh, PA. Other Directorships in the Last Five Years. None. | |||
Alice Gresham Bullock 1950 | Chair and Director | 2016 (Chair); 2008 (Director) | Professor Emerita at Howard University School of Law. Dean Emerita of Howard University School of Law and Deputy Director of the Association of American Law Schools (1992-1994). Other Directorships in the Last Five Years. None. | |||
Cari M. Dominguez 1949 | Director | 2016 | Former Chair of the U.S. Equal Employment Opportunity Commission. Other Directorships in the Last Five Years. Manpower, Inc. (employment agency); Triple S Management Corporation (managed care); National Association of Corporate Directors. | |||
John G. Guffey, Jr.(2) 1948 | Director | 2016 | President of Aurora Press Inc., a privately held publisher of trade paperbacks (since January 1997). Other Directorships in the Last Five Years. Calvert Impact Capital, Inc. (through December 31, 2018); Calvert Ventures, LLC. | |||
Miles D. Harper, III 1962 | Director | 2016 | Partner, Carr Riggs & Ingram (public accounting firm) since October 2014. Partner, Gainer Donnelly & Desroches (public accounting firm) (now Carr Riggs & Ingram), November 1999-September 2014). Other Directorships in the Last Five Years.Bridgeway Funds (9) (asset management). | |||
Joy V. Jones 1950 | Director | 2016 | Attorney. Other Directorships in the Last Five Years.Conduit Street Restaurants SUD 2 Limited; Palm Management Restaurant Corporation. | |||
| 19 |
Table of Contents
Calvert
VP Volatility Managed Moderate Growth Portfolio
December 31, 2019
Management and Organization — continued
| Name and Year of Birth | Position with the | Position Start Date | Principal Occupation(s) and Directorships During Past Five Years and Other Relevant Experience | |||
| Independent Directors (continued) | ||||||
Anthony A. Williams 1951 | Director | 2016 | CEO and Executive Director of the Federal City Council (July 2012 to present); Senior Adviser and Independent Consultant for King and Spalding LLP (September 2015 to present); Executive Director of Global Government Practice at the Corporate Executive Board (January 2010 to January 2012). Directorships in the Last Five Years. Freddie Mac; Evoq Properties/Meruelo Maddux Properties, Inc. (real estate management); Weston Solutions, Inc. (environmental services); Bipartisan Policy Center’s Debt Reduction Task Force; Chesapeake Bay Foundation; Catholic University of America; Urban Institute (research organization). | |||
| Name and Year of Birth | Position(s) with the | Position Start Date | Principal Occupation(s) During Past Five Years | |||
| Principal Officers who are not Directors | ||||||
Hope L. Brown 1973 | Chief Compliance Officer | 2014 | Chief Compliance Officer of 39 registered investment companies advised by CRM (since 2014). Vice President and Chief Compliance Officer, Wilmington Funds (2012-2014). | |||
Maureen A. Gemma(3) 1960 | Vice President, Secretary and Chief Legal Officer | 2016 | Vice President of CRM and officer of 39 registered investment companies advised by CRM (since 2016). Also Vice President of Eaton Vance and certain of its affiliates and officer of 159 registered investment companies advised or administered by Eaton Vance. | |||
James F. Kirchner(3) 1967 | Treasurer | 2016 | Vice President of CRM and officer of 39 registered investment companies advised by CRM (since 2016). Also Vice President of Eaton Vance and certain of its affiliates and officer of 159 registered investment companies advised or administered by Eaton Vance. | |||
| (1) | Mr. Streur is an interested person of the Fund because of his positions with the Fund’s adviser and certain affiliates. |
| (2) | Mr. Guffey is currently married to Rebecca L. Adamson, who served as a member of the Advisory Council through December 31, 2019. |
| (3) | The business address for Ms. Gemma and Mr. Kirchner is Two International Place, Boston, MA 02110. |
The SAI for the Fund includes additional information about the Directors and officers of the Fund and can be obtained without charge on Calvert’s website at www.calvert.com or by calling1-800-368-2745.
| 20 |
Table of Contents
Calvert Funds
Privacy. The Eaton Vance organization is committed to ensuring your financial privacy. Each entity listed below has adopted a privacy policy and procedures (“Privacy Program”) Eaton Vance believes is reasonably designed to protect your personal information and to govern when and with whom Eaton Vance may share your personal information.
| • | At the time of opening an account, Eaton Vance generally requires you to provide us with certain information such as name, address, social security number, tax status, account numbers, and account balances. This information is necessary for us to both open an account for you and to allow us to satisfy legal requirements such as applicable anti-money laundering reviews and know-your-customer requirements. |
| • | On an ongoing basis, in the normal course of servicing your account, Eaton Vance may share your information with unaffiliated third parties that perform various services for Eaton Vance and/or your account. These third parties include transfer agents, custodians, broker/dealers and our professional advisers, including auditors, accountants, and legal counsel. Eaton Vance may additionally share your personal information with our affiliates. |
| • | We believe our Privacy Program is reasonably designed to protect the confidentiality of your personal information and to prevent unauthorized access to that information. |
| • | We reserve the right to change our Privacy Program at any time upon proper notification to you. You may want to review our Privacy Program periodically for changes by accessing the link on our homepage: www.eatonvance.com. |
Our pledge of protecting your personal information applies to the following entities within the Eaton Vance organization: the Eaton Vance Family of Funds, Eaton Vance Management, Eaton Vance Investment Counsel, Eaton Vance Distributors, Inc., Eaton Vance Trust Company, Eaton Vance Management (International) Limited, Eaton Vance Advisers International Limited, Eaton Vance Global Advisors Limited, Eaton Vance Management’s Real Estate Investment Group, Boston Management and Research, Calvert Research and Management, and Calvert Funds. This Privacy Notice supersedes all previously issued privacy disclosures. For more information about our Privacy Program or about how your personal information may be used, please call 1-800-368-2745.
Delivery of Shareholder Documents. The Securities and Exchange Commission (SEC) permits funds to deliver only one copy of shareholder documents, including prospectuses, proxy statements and shareholder reports, to fund investors with multiple accounts at the same residential or post office box address. This practice is often called “householding” and it helps eliminate duplicate mailings to shareholders.Calvert funds, or your financial intermediary, may household the mailing of your documents indefinitely unless you instruct Calvert funds, or your financial intermediary, otherwise. If you would prefer that your Calvert fund documents not be householded, please contact Calvert funds at1-800-368-2745, or contact your financial intermediary. Your instructions that householding not apply to delivery of your Calvert fund documents will typically be effective within 30 days of receipt by Calvert funds or your financial intermediary. Separate statements will be generated for each separate account and will be householded as described above.
Portfolio Holdings. Each Calvert fund files a schedule of portfolio holdings on Part F to FormN-PORT with the SEC for the first and third quarters of each fiscal year. The FormN-PORT will be available on the Calvert funds’ website at www.calvert.com, by calling Calvert funds at1-800-368-2745 or in the EDGAR database on the SEC’s website at www.sec.gov.
Proxy Voting. The Proxy Voting Guidelines that each Calvert fund uses to determine how to vote proxies relating to portfolio securities is provided as an Appendix to the fund’s Statement of Additional Information. The Statement of Additional Information can be obtained free of charge by calling the Calvert funds at1-800-368-2745, by visiting the Calvert funds’ website at www.calvert.com or visiting the SEC’s website at www.sec.gov. Information regarding how a Calvert fund voted proxies relating to portfolio securities during the most recent12-month period ended June 30 is available by calling Calvert funds, by visiting the Calvert funds’ website at www.calvert.com or by visiting the SEC’s website at www.sec.gov.
| 21 |
Table of Contents
This Page Intentionally Left Blank
Table of Contents
This Page Intentionally Left Blank
Table of Contents
This Page Intentionally Left Blank
Table of Contents
Investment Adviser and Administrator
Calvert Research and Management
1825 Connecticut Avenue NW, Suite 400
Washington, DC 20009
Investment Sub-Advisers
Ameritas Investment Partners, Inc.
5945 R Street
Lincoln, NE 68505
Milliman Financial Risk Management LLC
71 South Wacker Drive, 31st Floor
Chicago, IL 60606
Principal Underwriter*
Eaton Vance Distributors, Inc.
Two International Place
Boston, MA 02110
(617)482-8260
Custodian
State Street Bank and Trust Company
State Street Financial Center, One Lincoln Street
Boston, MA 02111
Transfer Agent
DST Asset Manager Solutions, Inc.
2000 Crown Colony Drive
Quincy, MA 02169
Independent Registered Public Accounting Firm
KPMG LLP
1601 Market Street
Philadelphia, PA 19103-2499
Fund Offices
1825 Connecticut Avenue NW, Suite 400
Washington, DC 20009
| * | FINRA BrokerCheck. Investors may check the background of their Investment Professional by contacting the Financial Industry Regulatory Authority (FINRA). FINRA BrokerCheck is a free tool to help investors check the professional background of current and former FINRA-registered securities firms and brokers. FINRA BrokerCheck is available by calling1-800-289-9999 and at www.FINRA.org. The FINRA BrokerCheck brochure describing this program is available to investors at www.FINRA.org. |
Table of Contents
Printed on recycled paper.

24235 12.31.19
Table of Contents

Calvert
VP Volatility Managed Moderate Portfolio
Annual Report
December 31, 2019
Important Note. Beginning on January 1, 2021, as permitted by regulations adopted by the Securities and Exchange Commission, you may not receive paper copies of the Fund’s annual and semi-annual shareholder reports from the insurance company or plan sponsor unless you specifically request paper copies. Instead, the reports will be made available on a website and you will be notified by mail each time a report is posted and provided with a website address to access the report. Instructions for requesting paper copies will be provided by the insurance company, plan sponsor or your financial intermediary, as applicable. Please contact the insurance company, plan sponsor or your financial intermediary, as applicable, or follow instructions included with this disclosure, if any, for more information.

Table of Contents
Commodity Futures Trading Commission Registration. Effective December 31, 2012, the Commodity Futures Trading Commission (“CFTC”) adopted certain regulatory changes that subject registered investment companies and advisers to regulation by the CFTC if a fund invests more than a prescribed level of its assets in certain CFTC-regulated instruments (including futures, certain options and swap agreements) or markets itself as providing investment exposure to such instruments. The Fund and its adviser have claimed an exclusion from the definition of the term “commodity pool operator” under the Commodity Exchange Act. Accordingly, neither the Fund nor the adviser is subject to CFTC regulation.
Fund shares are not insured by the FDIC and are not deposits or other obligations of, or guaranteed by, any depository institution. Shares are subject to investment risks, including possible loss of principal invested.
This report must be preceded or accompanied by a current summary prospectus or prospectus. Before investing, investors should consider carefully the investment objective, risks, and charges and expenses of a mutual fund. This and other important information is contained in the summary prospectus and prospectus, which can be obtained from a financial intermediary. Prospective investors should read the prospectus carefully before investing. For further information, please call1-800-368-2745.
Table of Contents
Annual Report December 31, 2019
Calvert
VP Volatility Managed Moderate Portfolio
Table of Contents
Calvert
VP Volatility Managed Moderate Portfolio
December 31, 2019
Management’s Discussion of Fund Performance 1
Economic and Market Conditions
Virtually every U.S. and global equity index posted double-digit returns for the 12-month period ended December 31, 2019, making it a good year for stock investments. The period was also marked by strong performance across U.S. bond markets.
In January 2019, investors appeared to take a “glass is half full” approach. Although U.S. manufacturing output and business investment was weak — held back by slowing global growth and an on-again/off-again U.S.-China trade rift — low U.S. unemployment, strong consumer spending, and the easing of the federal funds rate by the U.S. Federal Reserve (the Fed) combined to lift investor sentiment.
As a result, U.S. stocks started the year on a climb, and international stocks followed. The period was also notable for a dramatic turnaround in fixed-income markets as the rising interest-rate environment of 2018 gave way to falling interest-rate expectations in 2019 against the backdrop of multiple domestic and international uncertainties.
After holding interest rates steady through the first half of the year, the Fed cut the federal funds rate on July 31, 2019 — its first reduction in over a decade — followed by two additional rate cuts in September and October to end the period at 1.50%-1.75%. By end of the third quarter, 60 central banks around the world had lowered their interest rates as well. Lower rates are intended to help stimulate economic activity by making borrowing costs relatively more affordable.
Downward pressure on interest rates and upward pressure on bond prices continued through most of the period propelled by lower-than-desired inflation, low European interest rates, and the U.S.-China trade conflict.
During the period, the blue-chip Dow Jones Industrial Average®2 returned 25.34%, while the broader U.S. equity market, as measured by the S&P 500® Index, returned 31.49%.The technology-laden Nasdaq Composite Index returned 36.69% during the period. Large-cap U.S. stocks, as measured by the S&P 500® Index, generally outperformed theirsmall-cap counterparts, as measured by the Russell 2000® Index.
Overseas, the MSCI World Index, a measure of developed market equity securities, returned 27.67%. The MSCI EAFE Index of developed-market international equities returned 22.01%, and the MSCI Emerging Markets Index returned 18.42%.
On the fixed-income side, the Bloomberg Barclays U.S. Aggregate Bond Index, a broad measure of the U.S. bond market, returned 8.72%. The Bloomberg Barclays U.S. Corporate Bond Index, a measure of U.S. corporate investment-grade bonds, finished 2019 with a 14.54% return — its best calendar-year performance since 2009. High yield fixed-income securities also performed well with the ICE BofAML U.S. High Yield Index returning 14.41% during the period ended December 31, 2019.
Investment Strategy
Calvert VP Volatility Managed Moderate Portfolio (the Fund) seeks to achieve its objectives by investing in exchange-traded funds (ETFs)
representing a broad range of asset classes and employing derivatives to manage overall portfolio volatility. The Fund sets a targeted asset allocation and typical asset allocation range among equity andfixed-income ETFs. The subadvisor seeks ETFs that are representative of the desired asset class and whose underlying fundamentals appear to have the potential for above-average long-term performance. The volatility-management strategy is implemented by entering into futures contracts based on one or more stock market indices, to attempt to hedge against changes in market volatility and declines in the value of the Fund’s investments in ETFs.
Fund Performance
For the 12-month period ended December 31, 2019, the Fund returned 17.02% for Class F shares at net asset value (NAV), outperforming its primary benchmark, the S&P 500 Daily Risk Control 7.5% Index (the Index), which returned 13.69% during the period.
Fund performance is also measured against a custom blended benchmark (the Secondary Blended Benchmark) based on a mix of market indexes that more closely reflects the impact of the Fund’s asset-allocation strategy than the single asset-class Index. The Index is used to capture the impact of the Fund’s volatility-management strategy. The Fund underperformed the Secondary Blended Benchmark, which returned 18.04% during the period.
The Fund outperformed the Index by 3.33% during the period. The Fund consists of multiple asset classes, while the Index consists of two components: the S&P 500® Index and cash. Furthermore, the Index allows for up to 50% leverage in an attempt to harvest market gains in periods of low volatility, such as during the fourth quarter of 2019. As a largely unlevered investment, the Fund underperformed in the fourth quarter relative to the Index, but outperformed during the first three quarters.
The Fund’s volatility-management strategy contributed positively to performance relative to the Index. As the volatility-management strategy attempts to reduce the Fund’s exposure to equities during periods of elevated volatility, the Fund’s futures overlay is likely to result in losses during market recoveries, as the Fund typically unwinds defensive hedges gradually.
The Fund started the year with substantial hedges in place as a defensive reaction to the volatile decline in the fourth quarter of 2018. The Fund gradually returned to full equity allocation by late January 2019. Subsequently, the Fund’s strategy did not require re-engagement of defensive hedges for the remainder of the year. In cumulative terms, the net contribution from derivative positions throughout the year was 0.10%.
The Fund underperformed the Secondary Blended Benchmark. Allocation to the technology sector, the best performing market sector, was a positive contributor while an overweight position in cash in lieu of investment-grade bonds was a detractor, as bonds turned in one of their best periods in several years.
See Endnotes and Additional Disclosures in this report.
Past performance is no guarantee of future results. Returns are historical and are calculated by determining the percentage change in net asset value (NAV) or offering price (as applicable) with all distributions reinvested. Investment return and principal value will fluctuate so that shares, when redeemed, may be worth more or less than their original cost. Performance for periods less than or equal to one year is cumulative. Performance is for the stated time period only; due to market volatility, current Fund performance may be lower or higher than the quoted return.
| 2 |
Table of Contents
Calvert
VP Volatility Managed Moderate Portfolio
December 31, 2019
Portfolio ManagersKevin L. Keene, CFA of Ameritas Investment Partners, Inc.; Adam Schenck, CFA, FRM and Maria Schiopu, CFA, each of Milliman Financial Risk Management LLC
| % Average Annual Total Returns 2,3 | Class Inception Date | Performance Inception Date | One Year | Five Years | Since Inception | |||||||||||||||
Class F at NAV | 04/30/2013 | 04/30/2013 | 17.02 | % | 5.43 | % | 5.45 | % | ||||||||||||
| ||||||||||||||||||||
S&P 500 Daily Risk Control 7.5% Index | — | — | 13.69 | % | 6.97 | % | 7.66 | % | ||||||||||||
Moderate Portfolio Blended Benchmark | — | — | 18.04 | 6.43 | 6.79 | |||||||||||||||
| % Total Annual Operating Expense Ratios 4 | Class F | |||||||||||||||||||
| Gross | 0.97 | % | ||||||||||||||||||
| Net | 0.91 | |||||||||||||||||||
Growth of $10,000
This graph shows the change in value of a hypothetical investment of $10,000 in Class F of the Fund for the period indicated. For comparison, the same investment is shown in the indicated index.
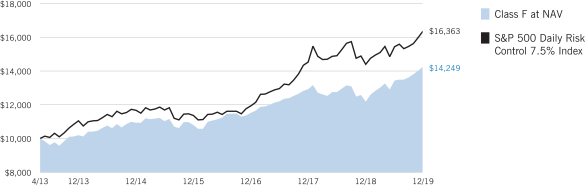
See Endnotes and Additional Disclosures in this report.
Past performance is no guarantee of future results. Returns are historical and are calculated by determining the percentage change in net asset value (NAV) or offering price (as applicable) with all distributions reinvested. Investment return and principal value will fluctuate so that shares, when redeemed, may be worth more or less than their original cost. Performance for periods less than or equal to one year is cumulative. Performance is for the stated time period only; due to market volatility, current Fund performance may be lower or higher than the quoted return.
| 3 |
Table of Contents
Calvert
VP Volatility Managed Moderate Portfolio
December 31, 2019
| Asset Allocation (% of total investments) | ||||
Equity Exchange-Traded Funds | 51.0 | % | ||
Fixed-Income Exchange-Traded Funds | 49.0 | |||
Total | 100.0 | % | ||
See Endnotes and Additional Disclosures in this report.
| 4 |
Table of Contents
Calvert
VP Volatility Managed Moderate Portfolio
December 31, 2019
Endnotes and Additional Disclosures
| 1 | The views expressed in this report are those of the portfolio manager(s) and are current only through the date stated at the top of this page. These views are subject to change at any time based upon market or other conditions, and Calvert and the Fund(s) disclaim any responsibility to update such views. These views may not be relied upon as investment advice and, because investment decisions are based on many factors, may not be relied upon as an indication of trading intent on behalf of any Calvert fund. This commentary may contain statements that are not historical facts, referred to as “forward looking statements.” The Fund’s actual future results may differ significantly from those stated in any forward looking statement, depending on factors such as changes in securities or financial markets or general economic conditions, the volume of sales and purchases of Fund shares, the continuation of investment advisory, administrative and service contracts, and other risks discussed from time to time in the Fund’s filings with the Securities and Exchange Commission. |
| 2 | Dow Jones Industrial Average® is a price-weighted average of 30 blue-chip stocks that are generally the leaders in their industry. S&P 500® Index is an unmanaged index of large-cap stocks commonly used as a measure of U.S. stock market performance. S&P 500 Daily Risk Control 7.5% Index is an unmanaged index of U.S. large-cap stocks with a volatility target of 7.5%. S&P Dow Jones Indices are a product of S&P Dow Jones Indices LLC (“S&P DJI”) and have been licensed for use. S&P® and S&P 500® are registered trademarks of S&P DJI; Dow Jones® is a registered trademark of Dow Jones Trademark Holdings LLC (“Dow Jones”); S&P DJI, Dow Jones and their respective affiliates do not sponsor, endorse, sell or promote the Fund, will not have any liability with respect thereto and do not have any liability for any errors, omissions, or interruptions of the S&P Dow Jones Indices. Nasdaq Composite Index is a market capitalization-weighted index of all domestic and international securities listed on Nasdaq. Source: Nasdaq, Inc. The information is provided by Nasdaq (with its affiliates, are referred to as the “Corporations”) and Nasdaq’s third party licensors on an “as is” basis and the Corporations make no guarantees and bear no liability of any kind with respect to the information or the Fund. Russell 2000® Index is an unmanaged index of 2,000 U.S. small-cap stocks. Russell 3000® Index is an unmanaged index of the 3,000 largest U.S. stocks. MSCI World Index is an unmanaged index of equity securities in the developed markets. MSCI EAFE Index is an unmanaged index of equities in the developed markets, excluding the U.S. and Canada. MSCI Emerging Markets Index is an unmanaged index of emerging markets common stocks. MSCI USA IMI/Equity REITs Index is an unmanaged index of U.S. equity REITs. MSCI indexes are net of foreign withholding taxes. Source: MSCI. MSCI data may not be reproduced or used for any other purpose. MSCI provides no warranties, has not prepared or approved this report, and has no liability hereunder. Bloomberg Barclays U.S. Aggregate Bond Index is an unmanaged index of |
| domestic investment-grade bonds, including corporate, government and mortgage-backed securities. Bloomberg Barclays U.S. Corporate Bond Index measures the performance of investment-grade U.S. corporate securities with a maturity of one year or more. ICE BofAML U.S. High Yield Index is an unmanaged index of below-investment grade U.S. corporate bonds. ICE BofAML 3-Month U.S. Treasury Bill Index is an unmanaged index of U.S. Treasury securities maturing in 90 days. ICE® BofAML® indices are not for redistribution or other uses; provided “as is”, without warranties, and with no liability. Eaton Vance has prepared this report and ICE Data Indices, LLC does not endorse it, or guarantee, review, or endorse Eaton Vance’s products. BofAML® is a licensed registered trademark of Bank of America Corporation in the United States and other countries. Moderate Portfolio Blended Benchmark is an internally constructed benchmark which is comprised of a blend of 48% Bloomberg Barclays U.S. Aggregate Bond Index, 36% Russell 3000® Index, 10% MSCI EAFE Index, 4% ICE BofAML 3-Month U.S. Treasury Bill Index, and 2% MSCI USA IMI/Equity REITs Index, which is rebalanced monthly. Unless otherwise stated, index returns do not reflect the effect of any applicable sales charges, commissions, expenses, taxes or leverage, as applicable. It is not possible to invest directly in an index. |
| 3 | There is no sales charge. Insurance-related charges are not included in the calculation of returns. If such charges were reflected, the returns would be lower. Please refer to the report for your insurance contract for performance data reflecting insurance-related charges. Performance since inception for an index, if presented, is the performance since the Fund’s or oldest share class’ inception, as applicable. |
Calvert Research and Management became the investment adviser to the Fund on December 31, 2016. Performance reflected prior to such date is that of the Fund’s former investment adviser. |
| 4 | Source: Fund prospectus. Net expense ratio reflects a contractual expense reimbursement that continues through 4/30/20. Without the reimbursement, performance would have been lower. The expense ratios for the current reporting period can be found in the Financial Highlights section of this report. |
Fund profile subject to change due to active management. |
| 5 |
Table of Contents
Calvert
VP Volatility Managed Moderate Portfolio
December 31, 2019
Example
As a Fund shareholder, you incur ongoing costs, including management fees; distribution and/or service fees; and other Fund expenses. This Example is intended to help you understand your ongoing costs (in dollars) of Fund investing and to compare these costs with the ongoing costs of investing in other mutual funds. The Example is based on an investment of $1,000 invested at the beginning of the period and held for the entire period (July 1, 2019 to December 31, 2019).
Actual Expenses
The first line of the table below provides information about actual account values and actual expenses. You may use the information in this line, together with the amount you invested, to estimate the expenses that you paid over the period. Simply divide your account value by $1,000 (for example, an $8,600 account value divided by $1,000 = 8.6), then multiply the result by the number in the first line under the heading entitled “Expenses Paid During Period” to estimate the expenses you paid on your account during this period.
Hypothetical Example for Comparison Purposes
The second line of the table below provides information about hypothetical account values and hypothetical expenses based on the actual Fund expense ratio and an assumed rate of return of 5% per year (before expenses), which is not the actual Fund return. The hypothetical account values and expenses may not be used to estimate the actual ending account balance or expenses you paid for the period. You may use this information to compare the ongoing costs of investing in the Fund and other funds. To do so, compare this 5% hypothetical example with the 5% hypothetical examples that appear in the shareholder reports of the other funds.
Please note that the expenses shown in the table are meant to highlight your ongoing costs only and do not reflect expenses and charges which are, or may be imposed under the variable annuity contract or variable life insurance policy (variable contracts) (if applicable) through which your investment in the Fund is made. Therefore, the second line of the table is useful in comparing ongoing costs associated with an investment in vehicles which fund benefits under variable contracts, and will not help you determine the relative total costs of investing in the Fund through variable contracts. In addition, if these expenses and charges imposed under the variable contracts were included, your costs would have been higher.
| Beginning Account Value (7/1/19) | Ending Account Value (12/31/19) | Expenses Paid During Period* (7/1/19 – 12/31/19) | Annualized Expense Ratio | |||||||||||||
Actual | ||||||||||||||||
Class F | $ | 1,000.00 | $ | 1,060.20 | $ | 4.31 | ** | 0.83 | % | |||||||
Hypothetical | ||||||||||||||||
(5% return per year before expenses) | ||||||||||||||||
Class F | $ | 1,000.00 | $ | 1,021.02 | $ | 4.23 | ** | 0.83 | % | |||||||
| * | Expenses are equal to the Fund’s annualized expense ratio, multiplied by the average account value over the period, multiplied by 184/365 (to reflect the one-half year period). The Example assumes that the $1,000 was invested at the net asset value per share determined at the close of business on June 30, 2019. Expenses shown do not include insurance-related charges. Expenses do not include fees and expenses incurred indirectly from investment in underlying affiliated and/or unaffiliated funds. |
| ** | Absent a waiver and/or reimbursement of expenses by an affiliate, expenses would be higher. |
| 6 |
Table of Contents
Calvert
VP Volatility Managed Moderate Portfolio
December 31, 2019
| Exchange-Traded Funds — 94.2% | ||||||||
| Security | Shares | Value | ||||||
| Equity Exchange-Traded Funds — 48.0% | ||||||||
Financial Select Sector SPDR Fund | 59,000 | $ | 1,816,020 | |||||
iShares Core S&P Mid-Cap ETF | 16,000 | 3,293,120 | ||||||
iShares Russell 2000 ETF | 17,000 | 2,816,390 | ||||||
iShares S&P 500 Growth ETF | 22,000 | 4,260,080 | ||||||
iShares S&P 500 Value ETF | 30,000 | 3,902,700 | ||||||
iShares S&P Mid-Cap 400 Value ETF | 5,000 | 853,650 | ||||||
Vanguard FTSE Developed Markets ETF | 225,000 | 9,913,500 | ||||||
Vanguard FTSE Emerging Markets ETF | 38,000 | 1,689,860 | ||||||
Vanguard REIT ETF | 23,000 | 2,134,170 | ||||||
Vanguard S&P 500 ETF | 75,000 | 22,185,000 | ||||||
| $ | 52,864,490 | |||||||
| Security | Shares | Value | ||||||
| Fixed-Income Exchange-Traded Funds — 46.2% | ||||||||
iShares Core U.S. Aggregate Bond ETF | 227,000 | $ | 25,507,990 | |||||
Vanguard Total Bond Market ETF | 302,000 | 25,325,720 | ||||||
| $ | 50,833,710 | |||||||
Total Exchange-Traded Funds |
| $ | 103,698,200 | |||||
Total Investments |
| $ | 103,698,200 | |||||
Other Assets, Less Liabilities — 5.8% |
| $ | 6,432,722 | |||||
Net Assets — 100.0% |
| $ | 110,130,922 | |||||
The percentage shown for each investment category in the Schedule of Investments is based on net assets.
| Futures Contracts | ||||||||||||||||||||
| Description | Number of Contracts | Position | Expiration Date | Notional Amount | Value/ Unrealized Appreciation (Depreciation) | |||||||||||||||
| Equity Futures | ||||||||||||||||||||
E-mini Russell 2000 Index | 12 | Long | 3/20/20 | $ | 1,002,360 | $ | 13,011 | |||||||||||||
E-mini S&P 500 Index | 29 | Long | 3/20/20 | 4,685,095 | 87,123 | |||||||||||||||
E-mini S&P MidCap 400 Index | 4 | Long | 3/20/20 | 825,920 | 9,777 | |||||||||||||||
MSCI EAFE Index | 18 | Long | 3/20/20 | 1,832,850 | 15,917 | |||||||||||||||
| $ | 125,828 | |||||||||||||||||||
| 7 | See Notes to Financial Statements. |
Table of Contents
Calvert
VP Volatility Managed Moderate Portfolio
December 31, 2019
Statement of Assets and Liabilities
| Assets | December 31, 2019 | |||
Investments in securities of unaffiliated issuers, at value (identified cost $87,635,338) | $ | 103,698,200 | ||
Receivable for variation margin on open futures contracts | 22,471 | |||
Cash | 6,216,986 | |||
Receivable for capital shares sold | 3,244 | |||
Securities lending income receivable | 708 | |||
Receivable from affiliate | 13,132 | |||
Deposits at broker for futures contracts | 328,500 | |||
Directors’ deferred compensation plan | 21,132 | |||
Other assets | 5,914 | |||
Total assets | $ | 110,310,287 | ||
| Liabilities |
| |||
Payable for capital shares redeemed | $ | 20,813 | ||
Payable to affiliates: | ||||
Investment advisory fee | 39,126 | |||
Administrative fee | 11,179 | |||
Distribution and service fees | 23,289 | |||
Sub-transfer agency fee | 27 | |||
Directors’ deferred compensation plan | 21,132 | |||
Accrued expenses | 63,799 | |||
Total liabilities | $ | 179,365 | ||
Net Assets | $ | 110,130,922 | ||
| Sources of Net Assets |
| |||
Paid-in capital | $ | 90,433,535 | ||
Distributable earnings | 19,697,387 | |||
Total | $ | 110,130,922 | ||
| Class F | ||||
Net Assets | $ | 110,130,922 | ||
Shares Outstanding | 5,838,674 | |||
Net Asset Value, Offering Price and Redemption Price Per Share | ||||
(net assets ÷ shares of beneficial interest outstanding) | $ | 18.86 | ||
| 8 | See Notes to Financial Statements. |
Table of Contents
Calvert
VP Volatility Managed Moderate Portfolio
December 31, 2019
Statement of Operations
| Investment Income | Year Ended December 31, 2019 | |||
Dividend income | $ | 2,577,288 | ||
Interest income | 71,539 | |||
Securities lending income, net | 17,333 | |||
Total investment income | $ | 2,666,160 | ||
| Expenses | ||||
Investment advisory fee | $ | 454,617 | ||
Administrative fee | 129,891 | |||
Distribution and service fees | 270,606 | |||
Directors’ fees and expenses | 6,405 | |||
Custodian fees | 28,513 | |||
Transfer agency fees and expenses | 952 | |||
Accounting fees | 26,024 | |||
Professional fees | 32,692 | |||
Reports to shareholders | 10,501 | |||
Miscellaneous | 10,272 | |||
Total expenses | $ | 970,473 | ||
Waiver and/or reimbursement of expenses by affiliate | $ | (69,608 | ) | |
Reimbursement of expenses - other | (2,455 | ) | ||
Net expenses | $ | 898,410 | ||
Net investment income | $ | 1,767,750 | ||
| Realized and Unrealized Gain (Loss) | ||||
Net realized gain (loss): | ||||
Investment securities | $ | 1,917,980 | ||
Futures contracts | 383,873 | |||
Net realized gain | $ | 2,301,853 | ||
Change in unrealized appreciation (depreciation): | ||||
Investment securities | $ | 13,039,002 | ||
Futures contracts | (201,277 | ) | ||
Net change in unrealized appreciation (depreciation) | $ | 12,837,725 | ||
Net realized and unrealized gain | $ | 15,139,578 | ||
Net increase in net assets resulting from operations | $ | 16,907,328 | ||
| 9 | See Notes to Financial Statements. |
Table of Contents
Calvert
VP Volatility Managed Moderate Portfolio
December 31, 2019
Statements of Changes in Net Assets
| Year Ended December 31, | ||||||||
| Increase (Decrease) in Net Assets | 2019 | 2018 | ||||||
From operations: | ||||||||
Net investment income | $ | 1,767,750 | $ | 1,698,494 | ||||
Net realized gain | 2,301,853 | 471,294 | ||||||
Net change in unrealized appreciation (depreciation) | 12,837,725 | (8,544,603 | ) | |||||
Net increase (decrease) in net assets from operations | $ | 16,907,328 | $ | (6,374,815 | ) | |||
Distributions to shareholders | $ | (2,410,264 | ) | $ | (4,315,296 | ) | ||
Net decrease in net assets from capital share transactions | $ | (7,571,178 | ) | $ | (4,582,374 | ) | ||
Net increase (decrease) in net assets | $ | 6,925,886 | $ | (15,272,485 | ) | |||
| Net Assets | ||||||||
At beginning of year | $ | 103,205,036 | $ | 118,477,521 | ||||
At end of year | $ | 110,130,922 | $ | 103,205,036 | ||||
| 10 | See Notes to Financial Statements. |
Table of Contents
Calvert
VP Volatility Managed Moderate Portfolio
December 31, 2019
Financial Highlights
| Class F | ||||||||||||||||||||
| Year Ended December 31, | ||||||||||||||||||||
| 2019 | 2018 | 2017 | 2016 | 2015 | ||||||||||||||||
Net asset value — Beginning of year | $ | 16.49 | $ | 18.18 | $ | 16.52 | $ | 15.50 | $ | 16.01 | ||||||||||
| Income (Loss) From Operations | ||||||||||||||||||||
Net investment income (1) | $ | 0.29 | $ | 0.27 | $ | 0.23 | $ | 0.24 | $ | 0.23 | ||||||||||
Net realized and unrealized gain (loss) | 2.49 | (1.26 | ) | 1.77 | 0.78 | (0.42 | ) | |||||||||||||
Total income (loss) from operations | $ | 2.78 | $ | (0.99 | ) | $ | 2.00 | $ | 1.02 | $ | (0.19 | ) | ||||||||
| Less Distributions | ||||||||||||||||||||
From net investment income | $ | (0.28 | ) | $ | (0.25 | ) | $ | (0.23 | ) | $ | — | (2) | $ | (0.22 | ) | |||||
From net realized gain | (0.13 | ) | (0.45 | ) | (0.11 | ) | — | (2) | (0.10 | ) | ||||||||||
Total distributions | $ | (0.41 | ) | $ | (0.70 | ) | $ | (0.34 | ) | $ | — | (2) | $ | (0.32 | ) | |||||
Net asset value — End of year | $ | 18.86 | $ | 16.49 | $ | 18.18 | $ | 16.52 | $ | 15.50 | ||||||||||
Total Return(3) | 17.02 | % | (5.73 | )% | 12.16 | % | 6.61 | % | (1.22 | )% | ||||||||||
| Ratios/Supplemental Data | ||||||||||||||||||||
Net assets, end of year (000’s omitted) | $ | 110,131 | $ | 103,205 | $ | 118,478 | $ | 110,067 | $ | 96,245 | ||||||||||
Ratios (as a percentage of average daily net assets): (4)(5) | ||||||||||||||||||||
Total expenses | 0.90 | % | 0.89 | % | 0.89 | % | 0.90 | % | 0.88 | % | ||||||||||
Net expenses | 0.83 | % | 0.83 | % | 0.83 | % | 0.83 | % | 0.83 | % | ||||||||||
Net investment income | 1.63 | % | 1.51 | % | 1.33 | % | 1.48 | % | 1.42 | % | ||||||||||
Portfolio Turnover | 6 | % | 11 | % | 9 | % | 10 | % | 21 | % | ||||||||||
| (1) | Computed using average shares outstanding. |
| (2) | Amount is less than $(0.005). |
| (3) | Returns are historical and are calculated by determining the percentage change in net asset value with all distributions reinvested and do not reflect fees and expenses imposed by variable annuity contracts or variable life insurance policies. If included, total return would be lower. |
| (4) | Total expenses do not reflect amounts reimbursed and/or waived by the adviser and certain of its affiliates, if applicable. Net expenses are net of all reductions and represent the net expenses paid by the Fund. |
| (5) | Amounts do not include the expenses of the Underlying Funds. |
| 11 | See Notes to Financial Statements. |
Table of Contents
Calvert
VP Volatility Managed Moderate Portfolio
December 31, 2019
Notes to Financial Statements
1 Significant Accounting Policies
Calvert VP Volatility Managed Moderate Portfolio (the Fund) is a diversified series of Calvert Variable Products, Inc. (the Corporation). The Corporation is a Maryland corporation registered under the Investment Company Act of 1940, as amended (the 1940 Act), as an open-end management investment company. The investment objective of the Fund is to pursue current income and modest growth potential consistent with preservation of capital, while seeking to manage overall portfolio volatility. The Fund invests primarily in exchange-traded funds representing a broad range of asset classes (the Underlying Funds).
Shares of the Fund are sold without sales charge to insurance companies for allocation to certain of their variable separate accounts. The Fund offers Class F shares.
The Fund applies the accounting and reporting guidance in the Financial Accounting Standards Board (FASB) Accounting Standards Codification Topic 946,Financial Services – Investment Companies (ASC 946). Subsequent events, if any, through the date that the financial statements were issued have been evaluated in the preparation of the financial statements.
A Investment Valuation — Net asset value per share is determined every business day as of the close of the regular session of the New York Stock Exchange (generally 4:00 p.m. Eastern time). The Fund uses independent pricing services approved by the Board of Directors (the Board) to value its investments wherever possible. Investments for which market quotations are not available or deemed not reliable are fair valued in good faith under the direction of the Board.
U.S. generally accepted accounting principles (U.S. GAAP) establishes a disclosure hierarchy that categorizes the inputs to valuation techniques used to value assets and liabilities at measurement date. These inputs are summarized in the three broad levels listed below:
Level 1 - quoted prices in active markets for identical securities
Level 2 - other significant observable inputs (including quoted prices for similar securities, interest rates, prepayment speeds, credit risk, etc.)
Level 3 - significant unobservable inputs (including the Fund’s own assumptions in determining the fair value of investments)
The inputs or methodologies used for valuing securities are not necessarily an indication of the risk associated with investing in those securities.
Valuation techniques used to value the Fund’s investments by major category are as follows:
Securities.Exchange-traded funds are valued at the official closing price as reported by an independent pricing service on the primary market or exchange on which they are traded and are categorized as Level 1 in the hierarchy. Investments in registered investment companies (including money market funds) that do not trade on an exchange are valued at the net asset value per share on the valuation day and are categorized as Level 1 in the hierarchy.
Derivatives.Futures contracts are valued at unrealized appreciation (depreciation) based on the settlement price established each day by the board of trade or exchange on which they are traded and are categorized as Level 1 in the hierarchy.
Fair Valuation.If a market value cannot be determined for a security using the methodologies described above, or if, in the good faith opinion of the Fund’s adviser, the market value does not constitute a readily available market quotation, or if a significant event has occurred that would materially affect the value of the security, the security will be fair valued as determined in good faith by or at the direction of the Board in a manner that most fairly reflects the security’s “fair value”, which is the amount that the Fund might reasonably expect to receive for the security upon its current sale in the ordinary course. Each such determination is based on a consideration of relevant factors, which are likely to vary from one pricing context to another. These factors may include, but are not limited to, the type of security, the existence of any contractual restrictions on the security’s disposition, the price and extent of public trading in similar securities of the issuer or of comparable companies or entities, quotations or relevant information obtained from broker/dealers or other market participants, information obtained from the issuer, analysts, and/or the appropriate stock exchange (for exchange-traded securities), an analysis of the company’s or entity’s financial statements, and an evaluation of the forces that influence the issuer and the market(s) in which the security is purchased and sold.
The values assigned to fair value investments are based on available information and do not necessarily represent amounts that might ultimately be realized. Further, due to the inherent uncertainty of valuations of such investments, the fair values may differ significantly from the values that would have been used had an active market existed, and the differences could be material.
The following table summarizes the market value of the Fund’s holdings as of December 31, 2019, based on the inputs used to value them:
| Asset Description | Level 1 | Level 2 | Level 3 | Total | ||||||||||||
Exchange-Traded Funds | $ | 103,698,200 | $ | — | $ | — | $ | 103,698,200 | ||||||||
Total Investments | $ | 103,698,200 | $ | — | $ | — | $ | 103,698,200 | ||||||||
Futures Contracts | $ | 125,828 | $ | — | $ | — | $ | 125,828 | ||||||||
Total | $ | 103,824,028 | $ | — | $ | — | $ | 103,824,028 | ||||||||
| 12 |
Table of Contents
Calvert
VP Volatility Managed Moderate Portfolio
December 31, 2019
Notes to Financial Statements — continued
B Investment Transactions and Income — Investment transactions for financial statement purposes are accounted for on trade date. Realized gains and losses are recorded on an identified cost basis and may include proceeds from litigation. Distributions from the Underlying Funds are recorded on theex-dividend date. Distributions received that represent a return of capital are recorded as a reduction of cost of investments. Distributions received that represent a capital gain are recorded as a realized gain. Interest income is accrued as earned. Expenses included in the accompanying financial statements reflect the expenses of the Fund and do not include any expenses associated with the Underlying Funds.
C Futures Contracts — The Fund may enter into futures contracts to buy or sell a financial instrument for a set price at a future date. Initial margin deposits of either cash or securities as required by the broker are made upon entering into the contract. While the contract is open, daily variation margin payments are made to or received from the broker reflecting the daily change in market value of the contract and are recorded for financial reporting purposes as unrealized gains or losses by the Fund. When a futures contract is closed, a realized gain or loss is recorded equal to the difference between the opening and closing value of the contract. The risks associated with entering into futures contracts may include the possible illiquidity of the secondary market which would limit the Fund’s ability to close out a futures contract prior to the settlement date, an imperfect correlation between the value of the contracts and the underlying financial instruments, or that the counterparty will fail to perform its obligations under the contracts’ terms. Futures contracts are designed by boards of trade, which are designated “contracts markets” by the Commodities Futures Trading Commission. Futures contracts trade on the contracts markets in a manner that is similar to the way a stock trades on a stock exchange, and the boards of trade, through their clearing corporations, guarantee the futures contracts against default. As a result, there is minimal counterparty credit risk to the Fund.
D Distributions to Shareholders — Distributions to shareholders are recorded by the Fund on ex-dividend date. The Fund distributes any net investment income and net realized capital gains at least annually. Both types of distributions are made in shares of the Fund unless an election is made on behalf of a separate account to receive some or all of the distributions in cash. Distributions are determined in accordance with income tax regulations which may differ from U.S. GAAP; accordingly, periodic reclassifications are made within the Fund’s capital accounts to reflect income and gains available for distribution under income tax regulations.
E Estimates — The preparation of financial statements in conformity with U.S. GAAP requires management to make estimates and assumptions that affect the reported amounts of assets and liabilities and disclosure of contingent assets and liabilities at the date of the financial statements and the reported amounts of increases and decreases in net assets from operations during the reporting period. Actual results could differ from those estimates.
F Indemnifications — The Corporation’s By-Laws provide for indemnification for Directors or officers of the Corporation and certain other parties, to the fullest extent permitted by Maryland law and the 1940 Act, provided certain conditions are met. Additionally, in the normal course of business, the Fund enters into agreements with service providers that may contain indemnification clauses. The Fund’s maximum exposure under these arrangements is unknown as this would involve future claims that may be made against the Fund that have not yet occurred.
G Federal Income Taxes — No provision for federal income or excise tax is required since the Fund intends to continue to qualify as a regulated investment company under the Internal Revenue Code and to distribute substantially all of its taxable earnings.
Management has analyzed the Fund’s tax positions taken for all open federal income tax years and has concluded that no provision for federal income tax is required in the Fund’s financial statements. A Fund’s federal tax return is subject to examination by the Internal Revenue Service for a period of three years from the date of filing.
2 Related Party Transactions
The investment advisory fee is earned by Calvert Research and Management (CRM), a subsidiary of Eaton Vance Management (EVM), as compensation for investment advisory services rendered to the Fund. Pursuant to the investment advisory agreement, CRM receives a fee, payable monthly, at the annual rate of 0.42% of the Fund’s average daily net assets. For the year ended December 31, 2019, the investment advisory fee amounted to $454,617.
Ameritas Investment Partners, Inc. (AIP) and Milliman Financial Risk Management LLC provide sub-advisory services to the Fund pursuant to sub-advisory agreements with CRM. Sub-advisory fees are paid by CRM from its investment advisory fee.
CRM has agreed to reimburse the Fund’s operating expenses to the extent that total annual operating expenses (relating to ordinary operating expenses only and excluding expenses such as brokerage commissions, acquired fund fees and expenses of unaffiliated funds, borrowing costs, taxes or litigation expenses) exceed 0.83% of the Fund’s average daily net assets. The expense reimbursement agreement with CRM may be changed or terminated after April 30, 2020. For the year ended December 31, 2019, CRM waived or reimbursed expenses of $69,608.
The administrative fee is earned by CRM as compensation for administrative services rendered to the Fund. The fee is computed at an annual rate of 0.12% of the Fund’s average daily net assets and is payable monthly. For the year ended December 31, 2019, CRM was paid administrative fees of $129,891.
The Fund has in effect a distribution plan for Class F shares (Class F Plan) pursuant to Rule 12b-1 under the 1940 Act. Pursuant to the Class F Plan, the Fund pays Eaton Vance Distributors, Inc. (EVD), an affiliate of CRM and the Fund’s principal underwriter, a distribution and service fee of 0.25% per annum of its average daily net assets attributable to Class F shares for distribution services and facilities provided to the Fund, as well as for personal and/or account maintenance services provided to the class shareholders. Distribution and service fees paid or accrued for the year ended December 31, 2019 amounted to $270,606 for Class F shares.
| 13 |
Table of Contents
Calvert
VP Volatility Managed Moderate Portfolio
December 31, 2019
Notes to Financial Statements — continued
EVM provides sub-transfer agency and related services to the Fund pursuant to a Sub-Transfer Agency Support Services Agreement. For the year ended December 31, 2019, sub-transfer agency fees and expenses incurred to EVM amounted to $91 and are included in transfer agency fees and expenses on the Statement of Operations.
Each Director of the Fund who is not an employee of CRM or its affiliates receives a fee of $3,000 for each Board meeting attended in person and $2,000 for each Board meeting attended by phone plus an annual fee of $142,000, and $1,500 for each Committee meeting attended in person and $1,000 for each Committee meeting attended by phone plus an annual Committee fee of $2,500. The Board chair receives an additional $20,000 annual retainer and Committee chairs receive an additional $6,000 annual retainer. Eligible Directors may participate in a Deferred Compensation Plan (the Plan). Amounts deferred under the Plan are treated as though equal dollar amounts had been invested in shares of the Fund or other Calvert funds selected by the Directors. The Fund purchases shares of the funds selected equal to the dollar amounts deferred under the Plan, resulting in an asset equal to the deferred compensation liability. Obligations of the Plan are paid solely from the Fund’s assets. Directors’ fees are allocated to each of the Calvert funds served. Salaries and fees of officers and Directors of the Fund who are employees of CRM or its affiliates are paid by CRM. In addition, an advisory council was established to aid the Board and CRM in advancing the cause of responsible investing through original scholarship and thought leadership. The advisory council consists of CRM’s Chief Executive Officer and four additional members. Each member (other than CRM’s Chief Executive Officer) receives annual compensation of $75,000, which is being reimbursed by Calvert Investment Management, Inc. (CIM), the Calvert funds’ former investment adviser and Ameritas Holding Company, CIM’s parent company, through the end of 2019. For the year ended December 31, 2019, the Fund’s allocated portion of such expense and reimbursement was $2,455, which are included in miscellaneous expense and reimbursement of expenses - other, respectively, on the Statement of Operations.
3 Shareholder Servicing Plan
The Corporation, on behalf of the Fund, has adopted a Shareholder Servicing Plan (Servicing Plan), which permits the Fund to enter into shareholder servicing agreements with intermediaries that maintain accounts in the Fund for the benefit of shareholders. These services may include, but are not limited to, processing purchase and redemption requests, processing dividend payments, and providing account information to shareholders. Under the Servicing Plan, the Fund may make payments at an annual rate of up to 0.11% of its average daily net assets. For the year ended December 31, 2019, no expenses were incurred under the Servicing Plan.
4 Investment Activity
During the year ended December 31, 2019, the cost of purchases and proceeds from sales of investments, other than short-term securities, were $6,089,627 and $15,649,499, respectively.
5 Distributions to Shareholders and Income Tax Information
The tax character of distributions declared for the years ended December 31, 2019 and December 31, 2018 was as follows:
| Year Ended December 31, | ||||||||
| 2019 | 2018 | |||||||
Ordinary income | $ | 1,673,566 | $ | 2,102,260 | ||||
Long-term capital gains | $ | 736,698 | $ | 2,213,036 | ||||
As of December 31, 2019, the components of distributable earnings (accumulated loss) on a tax basis were as follows:
Undistributed ordinary income | $ | 1,948,894 | ||
Undistributed long-term capital gains | $ | 2,079,116 | ||
Net unrealized appreciation | $ | 15,669,377 | ||
The cost and unrealized appreciation (depreciation) of investments, including open derivative contracts, of the Fund at December 31, 2019, as determined on a federal income tax basis, were as follows:
| Aggregate cost | $88,028,823 | |||
Gross unrealized appreciation | $ | 15,669,377 | ||
Gross unrealized depreciation | — | |||
Net unrealized appreciation | $ | 15,669,377 | ||
| 14 |
Table of Contents
Calvert
VP Volatility Managed Moderate Portfolio
December 31, 2019
Notes to Financial Statements — continued
6 Financial Instruments
A summary of futures contracts outstanding at December 31, 2019 is included in the Schedule of Investments. During the year ended December 31, 2019, the Fund used futures contracts to hedge against changes in market volatility and declines in the value of the Fund’s investments and to adjust the Fund’s overall equity exposure in an effort to stabilize portfolio volatility around a target level.
At December 31, 2019, the fair value of open derivative instruments (not considered to be hedging instruments for accounting disclosure purposes) and whose primary underlying risk exposure is equity price risk was as follows:
| Derivative | Statement of Assets and Liabilities Caption | Assets | Liabilities | |||||||||
Futures contracts | Distributable earnings | $ | 125,828 | (1) | $ | — | ||||||
| (1) | Only the current day’s variation margin is reported within the Statement of Assets and Liabilities as Receivable or Payable for variation margin on open futures contracts, as applicable. |
The effect of derivative instruments (not considered to be hedging instruments for accounting disclosure purposes) on the Statement of Operations and whose primary underlying risk exposure is equity price risk for the year ended December 31, 2019 was as follows:
| Statement of Operations Caption | ||||||||
| Derivative | Net realized contracts | Change contracts | ||||||
Futures contracts | $ | 383,873 | $ | (201,277 | ) | |||
The average notional cost of futures contracts (long) and futures contracts (short) outstanding during the year ended December 31, 2019 was approximately $6,784,000 and $1,644,000, respectively.
7 Securities Lending
To generate additional income, the Fund may lend its securities pursuant to a securities lending agency agreement with State Street Bank and Trust Company (SSBT), the securities lending agent. Security loans are subject to termination by the Fund at any time and, therefore, are not considered illiquid investments. The Fund requires that the loan be continuously collateralized by either cash or securities as collateral equal at all times to at least 102% of the market value of the domestic securities loaned and 105% of the market value of the international securities loaned (if applicable). The market value of securities loaned is determined daily and any additional required collateral is delivered to the Fund on the next business day. Cash collateral is generally invested in a money market fund registered under the 1940 Act that is managed by an affiliate of SSBT. Any gain or loss in the market price of the loaned securities that might occur and any interest earned or dividends declared during the term of the loan would accrue to the account of the Fund. Income earned on the investment of collateral, net of broker rebates and other expenses incurred by the securities lending agent, is split between the Fund and the securities lending agent on the basis of agreed upon contractual terms. Non-cash collateral, if any, is held by the lending agent on behalf of the Fund and cannot be sold or re-pledged by the Fund; accordingly, such collateral is not reflected in the Statement of Assets and Liabilities.
The risks associated with lending portfolio securities include, but are not limited to, possible delays in receiving additional collateral or in the recovery of the loaned securities, possible loss of rights to the collateral should the borrower fail financially, as well as risk of loss in the value of the collateral or the value of the investments made with the collateral. The securities lending agent shall indemnify the Fund in the case of default of any securities borrower.
The Fund did not have any securities on loan at December 31, 2019.
8 Line of Credit
Effective October 29, 2019, the Fund participates with other portfolios and funds managed by EVM and its affiliates, including CRM, in an $800 million unsecured line of credit with a group of banks, which is in effect through October 27, 2020. Borrowings are made by the Fund solely to facilitate the handling of unusual and/or unanticipated short-term cash requirements. Interest is charged to the Fund based on its borrowings at an amount above either the Eurodollar rate or Federal Funds rate. In addition, a fee computed at an annual rate of 0.15% on the daily unused portion of the line of credit is allocated among the participating portfolios and funds at the end of each quarter. Because the line of credit is not available exclusively to the Fund, it may be unable to borrow some or all of its requested amounts at any particular time.
| 15 |
Table of Contents
Calvert
VP Volatility Managed Moderate Portfolio
December 31, 2019
Notes to Financial Statements — continued
Prior to October 29, 2019, the Fund participated with other funds managed by CRM in a $100 million ($62.5 million prior to June 21, 2019) committed line of credit agreement with SSBT, which was terminated by the Calvert funds. Borrowings bore interest at the higher of the one-month London Interbank Offered Rate (LIBOR) in effect that day or the overnight Federal Funds rate, plus 1.00% per annum. A commitment fee of 0.20% per annum was incurred on the unused portion of the committed facility, which was allocated to all participating funds.
The Fund had no borrowings pursuant to its lines of credit during the year ended December 31, 2019.
9 Capital Shares
The Corporation may issue its shares in one or more series (such as the Fund). The authorized shares of the Fund consist of 100,000,000 common shares, $0.10 par value.
Transactions in capital shares for the years ended December 31, 2019 and December 31, 2018 were as follows:
| Year Ended December 31, 2019 | Year Ended December 31, 2018 | |||||||||||||||
| Shares | Amount | Shares | Amount | |||||||||||||
Class F | ||||||||||||||||
Shares sold | 59,653 | $ | 1,048,610 | 113,620 | $ | 2,049,417 | ||||||||||
Reinvestment of distributions | 135,713 | 2,410,264 | 243,252 | 4,315,296 | ||||||||||||
Shares redeemed | (614,232 | ) | (11,030,052 | ) | (615,999 | ) | (10,947,087 | ) | ||||||||
Net decrease | (418,866 | ) | $ | (7,571,178 | ) | (259,127 | ) | $ | (4,582,374 | ) | ||||||
At December 31, 2019, separate accounts of an insurance company that is an affiliate of AIP owned 100% of the value of the outstanding shares of the Fund.
| 16 |
Table of Contents
Calvert
VP Volatility Managed Moderate Portfolio
December 31, 2019
Report of Independent Registered Public Accounting Firm
To the Shareholders and Board of Directors
Calvert Variable Products, Inc.:
Opinion on the Financial Statements
We have audited the accompanying statement of assets and liabilities of Calvert VP Volatility Managed Moderate Portfolio (the Fund), a series of Calvert Variable Products, Inc., including the schedule of investments, as of December 31, 2019, the related statement of operations for the year then ended, the statements of changes in net assets for each of the years in thetwo-year period then ended, and the related notes (collectively, the financial statements) and the financial highlights for each of the years in thefive-year period then ended. In our opinion, the financial statements and financial highlights present fairly, in all material respects, the financial position of the Fund as of December 31, 2019, the results of its operations for the year then ended, the changes in its net assets for each of the years in thetwo-year period then ended, and the financial highlights for each of the years in thefive-year period then ended, in conformity with U.S. generally accepted accounting principles.
Basis for Opinion
These financial statements and financial highlights are the responsibility of the Fund’s management. Our responsibility is to express an opinion on these financial statements and financial highlights based on our audits. We are a public accounting firm registered with the Public Company Accounting Oversight Board (United States) (PCAOB) and are required to be independent with respect to the Fund in accordance with the U.S. federal securities laws and the applicable rules and regulations of the Securities and Exchange Commission and the PCAOB.
We conducted our audits in accordance with the standards of the PCAOB. Those standards require that we plan and perform the audit to obtain reasonable assurance about whether the financial statements and financial highlights are free of material misstatement, whether due to error or fraud. Our audits included performing procedures to assess the risks of material misstatement of the financial statements and financial highlights, whether due to error or fraud, and performing procedures that respond to those risks. Such procedures included examining, on a test basis, evidence regarding the amounts and disclosures in the financial statements and financial highlights. Such procedures also included confirmation of securities owned as of December 31, 2019, by correspondence with the custodian and brokers. Our audits also included evaluating the accounting principles used and significant estimates made by management, as well as evaluating the overall presentation of the financial statements and financial highlights. We believe that our audits provide a reasonable basis for our opinion.

We have served as the auditor of one or more of the Calvert Funds since 2002.
Philadelphia, Pennsylvania
February 19, 2020
| 17 |
Table of Contents
Calvert
VP Volatility Managed Moderate Portfolio
December 31, 2019
Federal Tax Information (Unaudited)
As required by the Internal Revenue Code and/or regulations, shareholders must be notified regarding the status of the dividends received deduction for corporations and capital gains dividends.
Dividends Received Deduction.Corporate shareholders are generally entitled to take the dividends received deduction on the portion of the Fund’s dividend distribution that qualifies under tax law. For the Fund’s fiscal 2019 ordinary income dividends, 20.16% qualifies for the corporate dividends received deduction.
Capital Gains Dividends.The Fund hereby designates as a capital gain dividend with respect to the taxable year ended December 31, 2019, $2,079,429 or, if subsequently determined to be different, the net capital gain of such year.
| 18 |
Table of Contents
Calvert
VP Volatility Managed Moderate Portfolio
December 31, 2019
Fund Management.The Directors of Calvert Variable Products, Inc. (the Corporation) are responsible for the overall management and supervision of the Corporation’s affairs. The Directors and officers of the Corporation are listed below. Except as indicated, each individual has held the office shown or other offices in the same company for the last five years. Each Board member holds office until his or her successor is elected and qualified, or until his or her earlier death, resignation, retirement, removal or disqualification. Under the terms of the Fund’s current Board member retirement policy, an Independent Board member must retire at the end of the calendar year in which he or she turns 75. However, if such retirement would cause the Fund to be out of compliance with Section 16 of the 1940 Act or any other regulations or guidance of the SEC, then such retirement and resignation will not become effective until such time as action has been taken for the Fund to be in compliance upon a Board member’s retirement. The “Independent Directors” consist of those Directors who are not “interested persons” of the Corporation, as that term is defined under the 1940 Act. The business address of each Director and officer, with the exception of Ms. Gemma and Mr. Kirchner, is 1825 Connecticut Avenue NW, Suite 400, Washington, DC 20009. As used below, “CRM” refers to Calvert Research and Management. Each Director oversees 39 funds in the Calvert fund complex. Each officer serves as an officer of certain other Calvert funds.
| Name and Year of Birth | Position with the Corporation | Position Start Date | Principal Occupation(s) and Directorships During Past Five Years and Other Relevant Experience | |||
| Interested Director | ||||||
John H. Streur(1) 1960 | Director and President | 2015 | President and Chief Executive Officer of Calvert Research and Management (since December 31, 2016). President and Chief Executive Officer of Calvert Investments, Inc. (January 2015-December 2016); Chief Executive Officer of Calvert Investment Distributors, Inc. (August 2015-December 2016); Chief Compliance Officer of Calvert Investment Management, Inc. (August 2015-April 2016); President and Director, Portfolio 21 Investments, Inc. (through October 2014); President, Chief Executive Officer and Director, Managers Investment Group LLC (through January 2012); President and Director, The Managers Funds and Managers AMG Funds (through January 2012). Other Directorships in the Last Five Years. Portfolio 21 Investments, Inc. (asset management) (through October 2014); Managers Investment Group LLC (asset management) (through January 2012); The Managers Funds (asset management) (through January 2012); Managers AMG Funds (asset management) (through January 2012); Calvert Impact Capital, Inc. | |||
| Independent Directors | ||||||
Richard L. Baird, Jr. 1948 | Director | 2016 | Regional Disaster Recovery Lead, American Red Cross of Greater Pennsylvania (since 2017). Volunteer, American Red Cross (since 2015). Former President and CEO of Adagio Health Inc. (retired in 2014) in Pittsburgh, PA. Other Directorships in the Last Five Years. None. | |||
Alice Gresham Bullock 1950 | Chair and Director | 2016 (Chair); 2008 (Director) | Professor Emerita at Howard University School of Law. Dean Emerita of Howard University School of Law and Deputy Director of the Association of American Law Schools (1992-1994). Other Directorships in the Last Five Years. None. | |||
Cari M. Dominguez 1949 | Director | 2016 | Former Chair of the U.S. Equal Employment Opportunity Commission. Other Directorships in the Last Five Years. Manpower, Inc. (employment agency); Triple S Management Corporation (managed care); National Association of Corporate Directors. | |||
John G. Guffey, Jr.(2) 1948 | Director | 2016 | President of Aurora Press Inc., a privately held publisher of trade paperbacks (since January 1997). Other Directorships in the Last Five Years. Calvert Impact Capital, Inc. (through December 31, 2018); Calvert Ventures, LLC. | |||
Miles D. Harper, III 1962 | Director | 2016 | Partner, Carr Riggs & Ingram (public accounting firm) since October 2014. Partner, Gainer Donnelly & Desroches (public accounting firm) (now Carr Riggs & Ingram), November 1999-September 2014). Other Directorships in the Last Five Years. Bridgeway Funds (9) (asset management). | |||
Joy V. Jones 1950 | Director | 2016 | Attorney. Other Directorships in the Last Five Years. Conduit Street Restaurants SUD 2 Limited; Palm Management Restaurant Corporation. | |||
| 19 |
Table of Contents
Calvert
VP Volatility Managed Moderate Portfolio
December 31, 2019
Management and Organization — continued
| Name and Year of Birth | Position with the Corporation | Position Start Date | Principal Occupation(s) and Directorships During Past Five Years and Other Relevant Experience | |||
| Independent Directors (continued) | ||||||
Anthony A. Williams 1951 | Director | 2016 | CEO and Executive Director of the Federal City Council (July 2012 to present); Senior Adviser and Independent Consultant for King and Spalding LLP (September 2015 to present); Executive Director of Global Government Practice at the Corporate Executive Board (January 2010 to January 2012). Other Directorships in the Last Five Years. Freddie Mac; Evoq Properties/ Meruelo Maddux Properties, Inc. (real estate management); Weston Solutions, Inc. (environmental services); Bipartisan Policy Center’s Debt Reduction Task Force; Chesapeake Bay Foundation; Catholic University of America; Urban Institute (research organization). | |||
| Name and Year of Birth | Position(s) Corporation | Position Start Date | Principal Occupation(s) During Past Five Years | |||
| Principal Officers who are not Directors | ||||||
Hope L. Brown 1973 | Chief Compliance Officer | 2014 | Chief Compliance Officer of 39 registered investment companies advised by CRM (since 2014). Vice President and Chief Compliance Officer, Wilmington Funds (2012-2014). | |||
Maureen A. Gemma(3) 1960 | Vice President, Secretary and Chief Legal Officer | 2016 | Vice President of CRM and officer of 39 registered investment companies advised by CRM (since 2016). Also Vice President of Eaton Vance and certain of its affiliates and officer of 159 registered investment companies advised or administered by Eaton Vance. | |||
James F. Kirchner(3) 1967 | Treasurer | 2016 | Vice President of CRM and officer of 39 registered investment companies advised by CRM (since 2016). Also Vice President of Eaton Vance and certain of its affiliates and officer of 159 registered investment companies advised or administered by Eaton Vance. | |||
| (1) | Mr. Streur is an interested person of the Fund because of his positions with the Fund’s adviser and certain affiliates. |
| (2) | Mr. Guffey is currently married to Rebecca L. Adamson, who served as a member of the Advisory Council through December 31, 2019. |
| (3) | The business address for Ms. Gemma and Mr. Kirchner is Two International Place, Boston, MA 02110. |
The SAI for the Fund includes additional information about the Directors and officers of the Fund and can be obtained without charge on Calvert’s website at www.calvert.com or by calling 1-800-368-2745.
| 20 |
Table of Contents
Calvert Funds
Privacy. The Eaton Vance organization is committed to ensuring your financial privacy. Each entity listed below has adopted a privacy policy and procedures (“Privacy Program”) Eaton Vance believes is reasonably designed to protect your personal information and to govern when and with whom Eaton Vance may share your personal information.
| • | At the time of opening an account, Eaton Vance generally requires you to provide us with certain information such as name, address, social security number, tax status, account numbers, and account balances. This information is necessary for us to both open an account for you and to allow us to satisfy legal requirements such as applicable anti-money laundering reviews and know-your-customer requirements. |
| • | On an ongoing basis, in the normal course of servicing your account, Eaton Vance may share your information with unaffiliated third parties that perform various services for Eaton Vance and/or your account. These third parties include transfer agents, custodians, broker/dealers and our professional advisers, including auditors, accountants, and legal counsel. Eaton Vance may additionally share your personal information with our affiliates. |
| • | We believe our Privacy Program is reasonably designed to protect the confidentiality of your personal information and to prevent unauthorized access to that information. |
| • | We reserve the right to change our Privacy Program at any time upon proper notification to you. You may want to review our Privacy Program periodically for changes by accessing the link on our homepage: www.eatonvance.com. |
Our pledge of protecting your personal information applies to the following entities within the Eaton Vance organization: the Eaton Vance Family of Funds, Eaton Vance Management, Eaton Vance Investment Counsel, Eaton Vance Distributors, Inc., Eaton Vance Trust Company, Eaton Vance Management (International) Limited, Eaton Vance Advisers International Limited, Eaton Vance Global Advisors Limited, Eaton Vance Management’s Real Estate Investment Group, Boston Management and Research, Calvert Research and Management, and Calvert Funds. This Privacy Notice supersedes all previously issued privacy disclosures. For more information about our Privacy Program or about how your personal information may be used, please call 1-800-368-2745.
Delivery of Shareholder Documents. The Securities and Exchange Commission (SEC) permits funds to deliver only one copy of shareholder documents, including prospectuses, proxy statements and shareholder reports, to fund investors with multiple accounts at the same residential or post office box address. This practice is often called “householding” and it helps eliminate duplicate mailings to shareholders. Calvert funds, or your financial intermediary, may household the mailing of your documents indefinitely unless you instruct Calvert funds, or your financial intermediary, otherwise. If you would prefer that your Calvert fund documents not be householded, please contact Calvert funds at1-800-368-2745, or contact your financial intermediary. Your instructions that householding not apply to delivery of your Calvert fund documents will typically be effective within 30 days of receipt by Calvert funds or your financial intermediary. Separate statements will be generated for each separate account and will be householded as described above.
Portfolio Holdings. Each Calvert fund files a schedule of portfolio holdings on Part F to FormN-PORT with the SEC for the first and third quarters of each fiscal year. The FormN-PORT will be available on the Calvert funds’ website at www.calvert.com, by calling Calvert funds at1-800-368-2745 or in the EDGAR database on the SEC’s website at www.sec.gov.
Proxy Voting. The Proxy Voting Guidelines that each Calvert fund uses to determine how to vote proxies relating to portfolio securities is provided as an Appendix to the fund’s Statement of Additional Information. The Statement of Additional Information can be obtained free of charge by calling the Calvert funds at1-800-368-2745, by visiting the Calvert funds’ website at www.calvert.com or visiting the SEC’s website at www.sec.gov. Information regarding how a Calvert fund voted proxies relating to portfolio securities during the most recent12-month period ended June 30 is available by calling Calvert funds, by visiting the Calvert funds’ website at www.calvert.com or by visiting the SEC’s website at www.sec.gov.
| 21 |
Table of Contents
This Page Intentionally Left Blank
Table of Contents
This Page Intentionally Left Blank
Table of Contents
This Page Intentionally Left Blank
Table of Contents
Investment Adviser and Administrator
Calvert Research and Management
1825 Connecticut Avenue NW, Suite 400
Washington, DC 20009
Investment Sub-Advisers
Ameritas Investment Partners, Inc.
5945 R Street
Lincoln, NE 68505
Milliman Financial Risk Management LLC
71 South Wacker Drive, 31st Floor
Chicago, IL 60606
Principal Underwriter*
Eaton Vance Distributors, Inc.
Two International Place
Boston, MA 02110
(617)482-8260
Custodian
State Street Bank and Trust Company
State Street Financial Center, One Lincoln Street
Boston, MA 02111
Transfer Agent
DST Asset Manager Solutions, Inc.
2000 Crown Colony Drive
Quincy, MA 02169
Independent Registered Public Accounting Firm
KPMG LLP
1601 Market Street
Philadelphia, PA 19103-2499
Fund Offices
1825 Connecticut Avenue NW, Suite 400
Washington, DC 20009
| * | FINRA BrokerCheck. Investors may check the background of their Investment Professional by contacting the Financial Industry Regulatory Authority (FINRA). FINRA BrokerCheck is a free tool to help investors check the professional background of current and former FINRA-registered securities firms and brokers. FINRA BrokerCheck is available by calling1-800-289-9999 and at www.FINRA.org. The FINRA BrokerCheck brochure describing this program is available to investors at www.FINRA.org. |
Table of Contents
Printed on recycled paper.

24233 12.31.19
Table of Contents
Item 2. Code of Ethics
The registrant has adopted a code of ethics applicable to its Principal Executive Officer, Principal Financial Officer and Principal Accounting Officer. The registrant undertakes to provide a copy of such code of ethics to any person upon request, without charge, by calling1-800-368-2745. The registrant has not amended the code of ethics as described in FormN-CSR during the period covered by this report. The registrant has not granted any waiver, including an implicit waiver, from a provision of the code of ethics as described in FormN-CSR during the period covered by this report.
Item 3. Audit Committee Financial Expert
The registrant’s Board of Directors has determined that Miles D. Harper III, an “independent” Director serving on the registrant’s audit committee, is an “audit committee financial expert,” as defined in Item 3 of FormN-CSR. Under applicable securities laws, a person who is determined to be an audit committee financial expert will not be deemed an “expert” for any purpose, including without limitation for the purposes of Section 11 of the Securities Act of 1933, as a result of being designated or identified as an audit committee financial expert. The designation or identification of a person as an audit committee financial expert does not impose on such person any duties, obligations, or liabilities that are greater than the duties, obligations, and liabilities imposed on such person as a member of the audit committee and Board of Directors in the absence of such designation or identification.
Item 4. Principal Accountant Fees and Services
(a) –(d)
The following table presents the aggregate fees billed to the registrant for the registrant’s fiscal years ended December 31, 2018 and December 31, 2019 by KPMG for professional services rendered for the audit of the registrant’s annual financial statements and fees billed for other services rendered by KPMG during such periods.
Fiscal Years Ended | 12/31/18 | %* | 12/31/19 | %* | ||||||||||||
Audit Fees | $ | 180,007 | 0 | % | $ | 200,850 | 0 | % | ||||||||
Audit-Related Fees(1) | $ | 0 | 0 | % | $ | 0 | 0 | % | ||||||||
Tax Fees(2) | $ | 31,950 | 0 | % | $ | 34,650 | 0 | % | ||||||||
All Other Fees(3) | $ | 0 | 0 | % | $ | 0 | 0 | % | ||||||||
|
|
|
|
|
|
|
| |||||||||
Total | $ | 211,957 | 0 | % | $ | 235,500 | 0 | % | ||||||||
|
|
|
|
|
|
|
| |||||||||
| * | Percentage of fees approved by the Audit Committee pursuant to (c)(7)(i)(C) of Rule2-01 of Reg.S-X (statutory de minimus waiver of Committee’s requirement topre-approve). |
| (1) | Audit-related fees consist of the aggregate fees billed for assurance and related services that are reasonably related to the performance of the audit of the registrant’s financial statements and are not reported under the category of audit fees. |
| (2) | Tax fees consist of the aggregate fees billed for professional services rendered by the principal accountant relating to tax compliance, tax advice, and tax planning and specifically include fees for tax return preparation and other related tax compliance/planning matters. |
| (3) | All other fees consist of the aggregate fees billed for products and services provided by the principal accountant other than audit, audit-related, and tax services. |
Table of Contents
(e) The Audit Committee is required topre-approve all audit andnon-audit services provided to the registrant by the auditors, and to the registrant’s investment adviser, and any entity controlling, controlled by, or under common control with the adviser that provides ongoing services to the registrant. In determining whether topre-approvenon-audit services, the Audit Committee considers whether the services are consistent with maintaining the independence of the auditors. The Committee may delegate its authority topre-approve certain matters to one or more of its members. In this regard, the Committee has delegated authority jointly to the Audit Committee Chair together with another Committee member with respect tonon-audit services not exceeding $25,000 in each instance. In addition, the Committee haspre-approved the retention of the auditors to providetax-related services related to the tax treatment and tax accounting of newly acquired securities, upon request by the investment adviser in each instance.
(f) Not applicable.
(g) Aggregatenon-audit fees billed by the registrant’s accountant for services rendered to the registrant, and rendered to the registrant’s investment adviser, and any entity controlling, controlled by, or under common control with the adviser that provides ongoing services to the registrant for each of the last two fiscal years of the registrant:
Fiscal Year ended 12/31/18 | Fiscal Year ended 12/31/19 | |||||
$ | %* | $ | %* | |||
$31,950 | 0% | $34,650 | 0% | |||
| * | Percentage of fees approved by the Audit Committee pursuant to (c)(7)(i)(C) of Rule2-01 of Reg.S-X (statutory de minimus waiver of Committee’s requirement topre-approve) |
(h) The registrant’s audit committee has considered whether the provision by the registrant’s principal accountant ofnon-audit services to the registrant’s investment adviser and any entity controlling, controlled by, or under common control with the adviser that provides ongoing services to the registrant that were notpre-approved pursuant to Rule2-01(c)(7)(ii) of RegulationS-X is compatible with maintaining the principal accountant’s independence.
Item 5. Audit Committee of Listed Registrants
Not applicable.
Item 6. Schedule of Investments
Please see schedule of investments contained in the Report to Stockholders included under Item 1 of this FormN-CSR.
Item 7. Disclosure of Proxy Voting Policies and Procedures forClosed-End Management Investment Companies
Not applicable.
Item 8. Portfolio Managers ofClosed-End Management Investment Companies
Not applicable.
Table of Contents
Item 9. Purchases of Equity Securities byClosed-End Management Investment Company and Affiliated Purchasers
Not applicable.
Item 10. Submission of Matters to a Vote of Security Holders
No material changes.
Item 11. Controls and Procedures
(a) The registrant’s principal executive and principal financial officers have concluded that the registrant’s disclosure controls and procedures (as defined in Rule30a-3(c) under the Investment Company Act of 1940 Act, as amended (the “1940 Act”) are effective, based on the evaluation of these controls and procedures required by Rule30a-3(b) under the 1940 Act and Rules13a-15(b) or15d-15(b) under the Securities Exchange Act of 1934 (“Exchange Act”), as of a date within 90 days of the filing date of this report.
(b) There was no change in the registrant’s internal control over financial reporting (as defined in Rule30a-3(d) under the 1940 Act) that occurred during the period covered by this report that has materially affected, or is reasonably likely to materially affect, the registrant’s internal control over financial reporting.
Item 12. Disclosure of Securities Lending Activities forClosed-End Management Investment Companies.
Not applicable.
Item 13. Exhibits
| (a)(1) | Registrant’s Code of Ethics – Not applicable (please see Item 2). | |
| (a)(2)(i) | Treasurer’s Section 302 certification. | |
| (a)(2)(ii) | President’s Section 302 certification. | |
| (b) | Combined Section 906 certification. | |
Table of Contents
Signatures
Pursuant to the requirements of the Securities Exchange Act of 1934 and the Investment Company Act of 1940, the registrant has duly caused this report to be signed on its behalf by the undersigned, thereunto duly authorized.
| CALVERT VARIABLE PRODUCTS, INC. | ||
| By: | /s/ John H. Streur | |
| John H. Streur | ||
| President | ||
Date: | February 24, 2020 | |
Pursuant to the requirements of the Securities Exchange Act of 1934 and the Investment Company Act of 1940, this report has been signed below by the following persons on behalf of the registrant and in the capacities and on the dates indicated.
| By: | /s/ James F. Kirchner | |
| James F. Kirchner | ||
| Treasurer | ||
| Date: | February 24, 2020 | |
| By: | /s/ John H. Streur | |
| John H. Streur | ||
| President | ||
| Date: | February 24, 2020 | |