UNITED STATES
SECURITIES AND EXCHANGE COMMISSION
Washington, D.C. 20549
Form N-CSR
CERTIFIED SHAREHOLDER REPORT OF REGISTERED
MANAGEMENT INVESTMENT COMPANIES
Investment Company Act File Number: 811-04000
CALVERT VARIABLE PRODUCTS, INC.
(Exact Name of Registrant as Specified in Charter)
1825 Connecticut Avenue NW, Suite 400, Washington, DC 20009
(Address of Principal Executive Offices)
Deidre E. Walsh
Two International Place, Boston, Massachusetts 02110
(Name and Address of Agent for Services)
(202) 238-2200
(Registrant’s Telephone Number)
December 31
Date of Fiscal Year End
December 31, 2021
Date of Reporting Period
Item 1. Reports to Stockholders
Calvert
VP S&P MidCap 400 Index Portfolio
Annual Report
December 31, 2021
Commodity Futures Trading Commission Registration. The Commodity Futures Trading Commission (“CFTC”) has adopted regulations that subject registered investment companies and advisers to regulation by the CFTC if a fund invests more than a prescribed level of its assets in certain CFTC-regulated instruments (including futures, certain options and swap agreements) or markets itself as providing investment exposure to such instruments. The adviser has claimed an exclusion from the definition of “commodity pool operator” under the Commodity Exchange Act with respect to its management of the Fund and the other funds it manages. Accordingly, neither the Fund nor the adviser is subject to CFTC regulation.
Fund shares are not insured by the FDIC and are not deposits or other obligations of, or guaranteed by, any depository institution. Shares are subject to investment risks, including possible loss of principal invested.
This report must be preceded or accompanied by a current summary prospectus or prospectus. Before investing, investors should consider carefully the investment objective, risks, and charges and expenses of a mutual fund. This and other important information is contained in the summary prospectus and prospectus, which can be obtained from a financial intermediary. Prospective investors should read the prospectus carefully before investing. For further information, please call 1-800-368-2745.
Annual Report December 31, 2021
Calvert
VP S&P MidCap 400 Index Portfolio
Calvert
VP S&P MidCap 400 Index Portfolio
December 31, 2021
Management's Discussion of Fund Performance†
Economic and Market Conditions
The 12-month period starting January 1, 2021, was notable for a U.S. equity rally that lasted for most of the period and resulted in U.S. stocks outperforming most other stock markets in developed economies. Except for temporary retreats in September and November, broad-market indexes generally posted strong returns during the period. Investors cheered the reopening of businesses that had been affected by the pandemic and the rollout of several highly effective COVID-19 vaccines.
COVID-19, however, continued to have a firm grip on the U.S. economy. Disease rates advanced and declined with second, third, and fourth waves of infections. Worker shortages led to global supply-chain disruptions. From computer chips to shipping containers, scarcities of key items led to temporary factory shutdowns and empty store shelves. Those shortages — combined with high demand from consumers eager to spend money saved earlier in the pandemic — led to higher year-over-year inflation than the U.S. had seen in decades.
Still, investor optimism about a recovering economy drove stock prices up during most of the period. A significant pullback, however, occurred in September 2021 when virtually every major U.S. stock index reported negative returns. Unexpectedly weak job creation in August and the U.S. Federal Reserve’s (the Fed’s) announcement that it might soon begin tapering its monthly bond purchases — which had stimulated the economy earlier — combined to drive stocks into negative territory. Rising COVID-19 infections also weighed on equity performance in September.
In the final quarter of 2021, however, stock prices came roaring back. Even the late-November news of a new and more transmissible COVID-19 variant — Omicron — caused only a temporary market retreat. The Fed’s actions to tamp down inflation were applauded by investors, with stocks gaining ground after the central bank announced that tapering would be accelerated and that three possible interest rate hikes were forecast for 2022. Just two trading days before year-end, the S&P 500® Index closed at its 70th new all-time high for the period, and the Dow Jones Industrial Average® (DJIA) closed at an all-time high as well.
For the period as a whole, the broad-market S&P 500® Index returned 28.71%; the blue-chip DJIA was up 20.95%; and the technology-laden Nasdaq Composite Index rose 22.18%. Large-cap U.S. stocks, as measured by the Russell 1000® Index, outperformed their small-cap counterparts, as measured by the Russell 2000® Index. In the large-cap space, growth stocks modestly outperformed value stocks, but in the small-cap space, value stocks strongly outperformed growth stocks during the period.
Investment Strategy
As an index fund, Calvert VP S&P MidCap 400 Index Portfolio (the Fund) seeks to replicate as closely as possible the holdings and match the performance of the S&P MidCap 400® Index (the Index). The Fund seeks to accomplish this by employing a passive management approach and holding each constituent of the Index in approximately the same proportion as the Index. The Fund may also invest in exchange-traded funds (ETFs) that provide the same exposure to the Index. Cash holdings may gain exposure to the Index via futures contracts, allowing the Fund’s assets to be fully invested.
Fund Performance
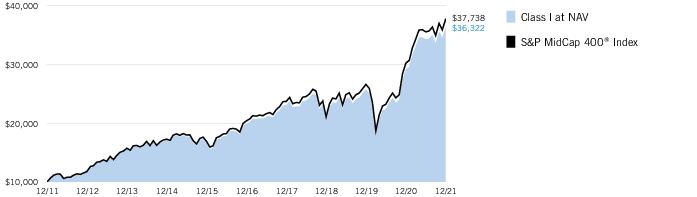
For the 12-month period ended December 31, 2021, Calvert VP S&P MidCap 400 Index Portfolio (the Fund) returned 24.41% for Class I shares at net asset value (NAV). By comparison, its benchmark, the S&P MidCap 400® Index (the Index), returned 24.76% during the period.
The Index is unmanaged and returns do not reflect any fees or operating expenses.
During the period, mid-cap stocks underperformed both large-cap stocks and small-cap stocks within the S&P family of indexes.
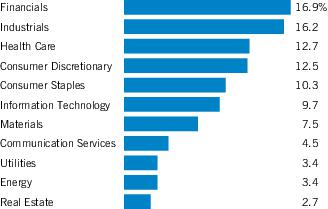
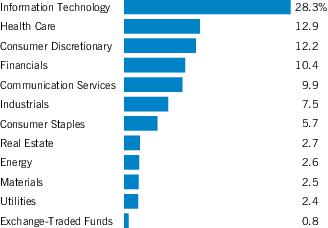
Most Index market sectors had positive, double-digit returns during the period. The top-performing sectors were energy, real estate, financials, and materials, all posting gains of greater than 30%. The communication services sector was the weakest performer within the Index, declining more than 3% during the period.
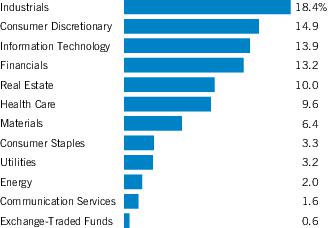
The industrials, consumer discretionary, information technology, and financials sectors had the largest weights within the Index at period-end. The communication services, energy, utilities, and consumer staples sectors had the smallest weights within the Index at period-end.
Futures contracts, which are regularly used to manage uninvested cash holdings in the Fund, had a meaningful positive impact on performance during the period.
See Endnotes and Additional Disclosures in this report.
Past performance is no guarantee of future results. Returns are historical and are calculated by determining the percentage change in net asset value (NAV) or offering price (as applicable) with all distributions reinvested. Investment return and principal value will fluctuate so that shares, when redeemed, may be worth more or less than their original cost. Performance for periods less than or equal to one year is cumulative. Performance is for the stated time period only; due to market volatility, current Fund performance may be lower or higher than the quoted return.
Calvert
VP S&P MidCap 400 Index Portfolio
December 31, 2021
Performance
Portfolio Manager(s) Kevin L. Keene, CFA of Ameritas Investment Partners, Inc.
| % Average Annual Total Returns1,2 | Class
Inception Date | Performance
Inception Date | One Year | Five Years | Ten Years |
| Class I at NAV | 05/03/1999 | 05/03/1999 | 24.41% | 12.75% | 13.76% |
| Class F at NAV | 10/01/2007 | 05/03/1999 | 24.17 | 12.50 | 13.49 |
|
| S&P MidCap 400® Index | — | — | 24.76% | 13.08% | 14.19% |
| % Total Annual Operating Expense Ratios3 | Class I | Class F |
| Gross | 0.45% | 0.65% |
| Net | 0.33 | 0.53 |
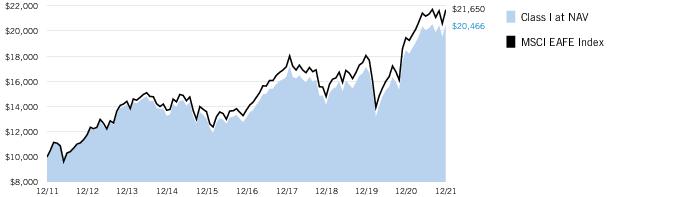
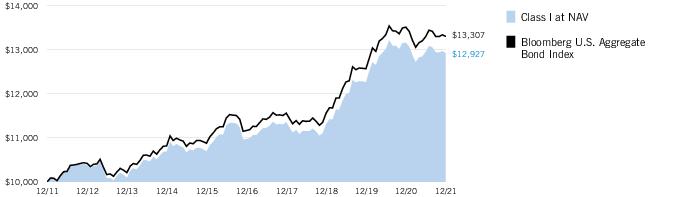
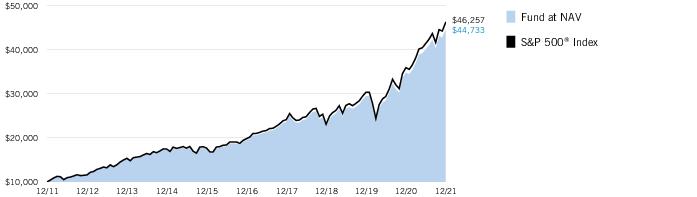
Growth of $10,000
This graph shows the change in value of a hypothetical investment of $10,000 in Class I of the Fund for the period indicated. For comparison, the same investment is shown in the indicated index.
| Growth of Investment | Amount Invested | Period Beginning | At NAV | With Maximum Sales Charge |
| Class F | $10,000 | 12/31/2011 | $35,477 | N.A. |
See Endnotes and Additional Disclosures in this report.
Past performance is no guarantee of future results. Returns are historical and are calculated by determining the percentage change in net asset value (NAV) or offering price (as applicable) with all distributions reinvested. Investment return and principal value will fluctuate so that shares, when redeemed, may be worth more or less than their original cost. Performance for periods less than or equal to one year is cumulative. Performance is for the stated time period only; due to market volatility, current Fund performance may be lower or higher than the quoted return.
Calvert
VP S&P MidCap 400 Index Portfolio
December 31, 2021
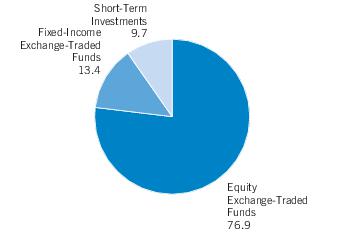
Sector Allocation (% of net assets)*
* Excludes cash and cash equivalents.
| Top 10 Holdings (% of net assets)* | |
| Molina Healthcare, Inc. | 0.7% |
| Camden Property Trust | 0.7 |
| SPDR S&P MidCap 400 ETF Trust | 0.6 |
| Builders FirstSource, Inc. | 0.6 |
| Trex Co., Inc. | 0.6 |
| Masimo Corp. | 0.6 |
| Medical Properties Trust, Inc. | 0.6 |
| Nordson Corp. | 0.5 |
| Cognex Corp. | 0.5 |
| Graco, Inc. | 0.5 |
| Total | 5.9% |
| * | Excludes cash and cash equivalents. |
Calvert
VP S&P MidCap 400 Index Portfolio
December 31, 2021
Endnotes and Additional Disclosures
| † | The views expressed in this report are those of the portfolio manager(s) and are current only through the date stated at the top of this page. These views are subject to change at any time based upon market or other conditions, and Calvert and the Fund(s) disclaim any responsibility to update such views. These views may not be relied upon as investment advice and, because investment decisions are based on many factors, may not be relied upon as an indication of trading intent on behalf of any Calvert fund. This commentary may contain statements that are not historical facts, referred to as “forward-looking statements.” The Fund’s actual future results may differ significantly from those stated in any forward-looking statement, depending on factors such as changes in securities or financial markets or general economic conditions, the volume of sales and purchases of Fund shares, the continuation of investment advisory, administrative and service contracts, and other risks discussed from time to time in the Fund’s filings with the Securities and Exchange Commission. |
| | |
| 1 | S&P MidCap 400® Index is an unmanaged index of 400 U.S. midcap stocks. S&P Dow Jones Indices are a product of S&P Dow Jones Indices LLC (“S&P DJI”) and have been licensed for use. S&P® and S&P 500®are registered trademarks of S&P DJI; Dow Jones® is a registered trademark of Dow Jones Trademark Holdings LLC (“Dow Jones”); S&P DJI, Dow Jones and their respective affiliates do not sponsor, endorse, sell or promote the Fund, will not have any liability with respect thereto and do not have any liability for any errors, omissions, or interruptions of the S&P Dow Jones Indices. Unless otherwise stated, index returns do not reflect the effect of any applicable sales charges, commissions, expenses, taxes or leverage, as applicable. It is not possible to invest directly in an index. |
| 2 | There is no sales charge. Insurance-related charges are not included in the calculation of returns. If such charges were reflected, the returns would be lower. Please refer to the report for your insurance contract for performance data reflecting insurance-related charges.Calvert Research and Management became the investment adviser to the Fund on December 31, 2016. Performance reflected prior to such date is that of the Fund’s former investment adviser. |
| 3 | Source: Fund prospectus. Net expense ratios reflect a contractual expense reimbursement that continues through 4/30/22. The expense ratios for the current reporting period can be found in the Financial Highlights section of this report. Performance reflects expenses waived and/or reimbursed, if applicable. Without such waivers and/or reimbursements, performance would have been lower. |
Additional Information
| | S&P 500® Index is an unmanaged index of large-cap stocks commonly used as a measure of U.S. stock market performance. Dow Jones Industrial Average® is a price-weighted average of 30 blue-chip stocks that are generally the leaders in their industry. S&P Dow Jones Indices are a product of S&P Dow Jones Indices LLC (“S&P DJI”) and have been licensed for use. S&P® and S&P 500® are registered trademarks of S&P DJI; Dow Jones® is a registered trademark of Dow Jones Trademark Holdings LLC (“Dow Jones”); S&P DJI, Dow Jones and their respective affiliates do not sponsor, endorse, sell or promote the Fund, will not have any liability with respect thereto and do not have any liability for any errors, omissions, or interruptions of the S&P Dow Jones Indices. Nasdaq Composite Index is a market capitalization-weighted index of all domestic and international securities listed on Nasdaq. Source: Nasdaq, Inc. The information is provided by Nasdaq (with its affiliates, are referred to as the “Corporations”) and Nasdaq’s third party licensors on an “as is” basis and the Corporations make no guarantees and bear no liability of any kind with respect to the information or the Fund. Russell 2000® Index is an unmanaged index of 2,000 U.S. small-cap stocks. Russell 1000® Index is an unmanaged index of 1,000 U.S. large-cap stocks. |
Calvert
VP S&P MidCap 400 Index Portfolio
December 31, 2021
Example
As a Fund shareholder, you incur ongoing costs, including management fees; distribution and/or service fees; and other Fund expenses. This Example is intended to help you understand your ongoing costs (in dollars) of Fund investing and to compare these costs with the ongoing costs of investing in other mutual funds. The Example is based on an investment of $1,000 invested at the beginning of the period and held for the entire period (July 1, 2021 to December 31, 2021).
Actual Expenses
The first section of the table below provides information about actual account values and actual expenses. You may use the information in this section, together with the amount you invested, to estimate the expenses that you paid over the period. Simply divide your account value by $1,000 (for example, an $8,600 account value divided by $1,000 = 8.6), then multiply the result by the number in the first section under the heading entitled “Expenses Paid During Period” to estimate the expenses you paid on your account during this period.
Hypothetical Example for Comparison Purposes
The second section of the table below provides information about hypothetical account values and hypothetical expenses based on the actual Fund expense ratio and an assumed rate of return of 5% per year (before expenses), which is not the actual Fund return. The hypothetical account values and expenses may not be used to estimate the actual ending account balance or expenses you paid for the period. You may use this information to compare the ongoing costs of investing in the Fund and other funds. To do so, compare this 5% hypothetical example with the 5% hypothetical examples that appear in the shareholder reports of the other funds.
Please note that the expenses shown in the table are meant to highlight your ongoing costs only and do not reflect expenses and charges which are, or may be imposed under the variable annuity contract or variable life insurance policy (variable contracts) (if applicable) or qualified pension or retirement plans (Qualified Plans) through which your investment in the Fund is made. Therefore, the second section of the table is useful in comparing ongoing costs associated with an investment in vehicles which fund benefits under variable contracts and Qualified Plans, and will not help you determine the relative total costs of investing in the Fund through variable contracts or Qualified Plans. In addition, if these expenses and charges imposed under the variable contracts or Qualified Plans were included, your costs would have been higher.
| | Beginning
Account Value
(7/1/21) | Ending
Account Value
(12/31/21) | Expenses Paid
During Period*
(7/1/21 – 12/31/21) | Annualized
Expense
Ratio |
| Actual | | | | |
| Class I | $1,000.00 | $1,059.50 | $1.71 ** | 0.33% |
| Class F | $1,000.00 | $1,058.40 | $2.75 ** | 0.53% |
| Hypothetical | | | | |
| (5% return per year before expenses) | | | | |
| Class I | $1,000.00 | $1,023.54 | $1.68 ** | 0.33% |
| Class F | $1,000.00 | $1,022.53 | $2.70 ** | 0.53% |
| * | Expenses are equal to the Fund's annualized expense ratio for the indicated Class, multiplied by the average account value over the period, multiplied by 184/365 (to reflect the one-half year period). The Example assumes that the $1,000 was invested at the net asset value per share determined at the close of business on June 30, 2021. Expenses shown do not include insurance-related charges or direct expenses of Qualified Plans. |
| ** | Absent a waiver and/or reimbursement of expenses by an affiliate, expenses would be higher. |
Calvert
VP S&P MidCap 400 Index Portfolio
December 31, 2021
| Security | Shares | Value |
| Aerospace & Defense — 0.9% | |
| Axon Enterprise, Inc.(1) | | 17,560 | $ 2,756,920 |
| Curtiss-Wright Corp. | | 10,492 | 1,454,925 |
| Hexcel Corp.(1) | | 22,211 | 1,150,530 |
| Mercury Systems, Inc.(1) | | 15,180 | 835,811 |
| | | | $ 6,198,186 |
| Air Freight & Logistics — 0.4% | |
| GXO Logistics, Inc.(1) | | 26,362 | $ 2,394,460 |
| | | | $ 2,394,460 |
| Airlines — 0.2% | |
| JetBlue Airways Corp.(1) | | 84,241 | $ 1,199,592 |
| | | | $ 1,199,592 |
| Auto Components — 1.7% | |
| Adient PLC(1) | | 24,958 | $ 1,194,989 |
| Dana, Inc. | | 38,470 | 877,885 |
| Fox Factory Holding Corp.(1) | | 11,153 | 1,897,125 |
| Gentex Corp. | | 63,297 | 2,205,901 |
| Goodyear Tire & Rubber Co. (The)(1) | | 74,488 | 1,588,084 |
| Lear Corp. | | 15,940 | 2,916,223 |
| Visteon Corp.(1) | | 7,413 | 823,881 |
| | | | $ 11,504,088 |
| Automobiles — 0.5% | |
| Harley-Davidson, Inc. | | 40,752 | $ 1,535,943 |
| Thor Industries, Inc. | | 14,848 | 1,540,777 |
| | | | $ 3,076,720 |
| Banks — 6.0% | |
| Associated Banc-Corp. | | 40,126 | $ 906,446 |
| Bank of Hawaii Corp. | | 10,722 | 898,075 |
| Bank OZK | | 32,294 | 1,502,640 |
| Cadence Bank | | 51,867 | 1,545,118 |
| Cathay General Bancorp | | 20,704 | 890,065 |
| CIT Group, Inc. | | 26,262 | 1,348,291 |
| Commerce Bancshares, Inc. | | 29,563 | 2,032,161 |
| Cullen/Frost Bankers, Inc. | | 15,162 | 1,911,473 |
| East West Bancorp, Inc. | | 37,943 | 2,985,355 |
| F.N.B. Corp. | | 84,638 | 1,026,659 |
| First Financial Bankshares, Inc. | | 33,939 | 1,725,459 |
| First Horizon Corp. | | 145,513 | 2,376,227 |
| Fulton Financial Corp. | | 43,197 | 734,349 |
| Glacier Bancorp, Inc. | | 28,699 | 1,627,233 |
| Security | Shares | Value |
| Banks (continued) | |
| Hancock Whitney Corp. | | 23,006 | $ 1,150,760 |
| Home BancShares, Inc. | | 39,988 | 973,708 |
| International Bancshares Corp. | | 14,101 | 597,741 |
| PacWest Bancorp | | 31,049 | 1,402,483 |
| Pinnacle Financial Partners, Inc. | | 20,357 | 1,944,094 |
| Prosperity Bancshares, Inc. | | 24,616 | 1,779,737 |
| Sterling Bancorp | | 51,043 | 1,316,399 |
| Synovus Financial Corp. | | 38,792 | 1,856,973 |
| Texas Capital Bancshares, Inc.(1) | | 13,672 | 823,738 |
| UMB Financial Corp. | | 11,398 | 1,209,442 |
| Umpqua Holdings Corp. | | 58,311 | 1,121,904 |
| United Bankshares, Inc. | | 36,125 | 1,310,615 |
| Valley National Bancorp | | 107,707 | 1,480,971 |
| Webster Financial Corp. | | 23,997 | 1,339,993 |
| Wintrust Financial Corp. | | 15,110 | 1,372,290 |
| | | | $ 41,190,399 |
| Beverages — 0.2% | |
| Boston Beer Co., Inc. (The), Class A(1) | | 2,487 | $ 1,256,184 |
| | | | $ 1,256,184 |
| Biotechnology — 1.4% | |
| Arrowhead Pharmaceuticals, Inc.(1) | | 27,617 | $ 1,831,007 |
| Exelixis, Inc.(1) | | 84,598 | 1,546,452 |
| Halozyme Therapeutics, Inc.(1) | | 37,703 | 1,516,038 |
| Neurocrine Biosciences, Inc.(1) | | 25,365 | 2,160,337 |
| United Therapeutics Corp.(1) | | 12,042 | 2,602,035 |
| | | | $ 9,655,869 |
| Building Products — 2.8% | |
| Builders FirstSource, Inc.(1) | | 51,203 | $ 4,388,609 |
| Carlisle Cos., Inc. | | 13,980 | 3,468,718 |
| Lennox International, Inc. | | 9,000 | 2,919,240 |
| Owens Corning | | 26,868 | 2,431,554 |
| Simpson Manufacturing Co., Inc. | | 11,507 | 1,600,279 |
| Trex Co., Inc.(1) | | 30,780 | 4,156,223 |
| | | | $ 18,964,623 |
| Capital Markets — 2.0% | |
| Affiliated Managers Group, Inc. | | 10,915 | $ 1,795,626 |
| Evercore, Inc., Class A | | 10,505 | 1,427,104 |
| Federated Hermes, Inc., Class B | | 25,862 | 971,894 |
| Interactive Brokers Group, Inc., Class A | | 23,138 | 1,837,620 |
| Janus Henderson Group PLC | | 45,654 | 1,914,729 |
| Jefferies Financial Group, Inc. | | 52,350 | 2,031,180 |
| SEI Investments Co. | | 28,401 | 1,730,757 |
7
See Notes to Financial Statements.
Calvert
VP S&P MidCap 400 Index Portfolio
December 31, 2021
Schedule of Investments — continued
| Security | Shares | Value |
| Capital Markets (continued) | |
| Stifel Financial Corp. | | 27,757 | $ 1,954,648 |
| | | | $ 13,663,558 |
| Chemicals — 2.6% | |
| Ashland Global Holdings, Inc. | | 14,962 | $ 1,610,809 |
| Avient Corp. | | 24,184 | 1,353,095 |
| Cabot Corp. | | 15,026 | 844,461 |
| Chemours Co. (The) | | 43,750 | 1,468,250 |
| Ingevity Corp.(1) | | 10,469 | 750,627 |
| Minerals Technologies, Inc. | | 9,117 | 666,908 |
| NewMarket Corp. | | 1,847 | 633,004 |
| Olin Corp. | | 38,254 | 2,200,370 |
| RPM International, Inc. | | 34,683 | 3,502,983 |
| Scotts Miracle-Gro Co. (The), Class A | | 10,790 | 1,737,190 |
| Sensient Technologies Corp. | | 11,167 | 1,117,370 |
| Valvoline, Inc. | | 47,882 | 1,785,520 |
| | | | $ 17,670,587 |
| Commercial Services & Supplies — 1.5% | |
| Brink's Co. (The) | | 13,189 | $ 864,803 |
| Clean Harbors, Inc.(1) | | 13,258 | 1,322,751 |
| IAA, Inc.(1) | | 35,707 | 1,807,488 |
| MillerKnoll, Inc. | | 19,970 | 782,624 |
| MSA Safety, Inc. | | 9,654 | 1,457,368 |
| Stericycle, Inc.(1) | | 24,331 | 1,451,101 |
| Tetra Tech, Inc. | | 14,457 | 2,454,798 |
| | | | $ 10,140,933 |
| Communications Equipment — 0.9% | |
| Ciena Corp.(1) | | 41,425 | $ 3,188,482 |
| Lumentum Holdings, Inc.(1) | | 19,331 | 2,044,640 |
| ViaSat, Inc.(1) | | 19,423 | 865,101 |
| | | | $ 6,098,223 |
| Construction & Engineering — 1.4% | |
| AECOM (1) | | 38,519 | $ 2,979,445 |
| Dycom Industries, Inc.(1) | | 8,159 | 764,988 |
| EMCOR Group, Inc. | | 14,239 | 1,813,906 |
| Fluor Corp.(1) | | 37,460 | 927,884 |
| MasTec, Inc.(1) | | 15,265 | 1,408,654 |
| Valmont Industries, Inc. | | 5,619 | 1,407,560 |
| | | | $ 9,302,437 |
| Construction Materials — 0.3% | |
| Eagle Materials, Inc. | | 10,875 | $ 1,810,253 |
| | | | $ 1,810,253 |
| Security | Shares | Value |
| Consumer Finance — 0.6% | |
| FirstCash Holdings, Inc. | | 10,715 | $ 801,589 |
| Navient Corp. | | 43,094 | 914,455 |
| PROG Holdings, Inc.(1) | | 15,315 | 690,860 |
| SLM Corp. | | 78,389 | 1,541,911 |
| | | | $ 3,948,815 |
| Containers & Packaging — 0.7% | |
| AptarGroup, Inc. | | 17,472 | $ 2,139,970 |
| Greif, Inc., Class A | | 7,033 | 424,582 |
| Silgan Holdings, Inc. | | 22,227 | 952,205 |
| Sonoco Products Co. | | 26,045 | 1,507,745 |
| | | | $ 5,024,502 |
| Diversified Consumer Services — 0.9% | |
| Graham Holdings Co., Class B | | 1,069 | $ 673,288 |
| Grand Canyon Education, Inc.(1) | | 10,715 | 918,383 |
| H&R Block, Inc. | | 47,165 | 1,111,207 |
| Service Corp. International | | 44,094 | 3,130,233 |
| | | | $ 5,833,111 |
| Diversified Financial Services — 0.3% | |
| Voya Financial, Inc. | | 29,600 | $ 1,962,776 |
| | | | $ 1,962,776 |
| Diversified Telecommunication Services — 0.2% | |
| Iridium Communications, Inc.(1) | | 34,948 | $ 1,443,003 |
| | | | $ 1,443,003 |
| Electric Utilities — 1.0% | |
| ALLETE, Inc. | | 14,106 | $ 935,933 |
| Hawaiian Electric Industries, Inc. | | 28,956 | 1,201,674 |
| IDACORP, Inc. | | 13,381 | 1,516,201 |
| OGE Energy Corp. | | 53,522 | 2,054,174 |
| PNM Resources, Inc. | | 22,737 | 1,037,035 |
| | | | $ 6,745,017 |
| Electrical Equipment — 2.0% | |
| Acuity Brands, Inc. | | 9,338 | $ 1,977,041 |
| EnerSys | | 11,261 | 890,295 |
| Hubbell, Inc. | | 14,548 | 3,029,912 |
| nVent Electric PLC | | 44,530 | 1,692,140 |
| Regal Rexnord Corp. | | 18,117 | 3,083,151 |
| Sunrun, Inc.(1) | | 55,349 | 1,898,471 |
| Vicor Corp.(1) | | 5,734 | 728,103 |
| | | | $ 13,299,113 |
8
See Notes to Financial Statements.
Calvert
VP S&P MidCap 400 Index Portfolio
December 31, 2021
Schedule of Investments — continued
| Security | Shares | Value |
| Electronic Equipment, Instruments & Components — 3.1% | |
| Arrow Electronics, Inc.(1) | | 18,617 | $ 2,499,705 |
| Avnet, Inc. | | 26,358 | 1,086,740 |
| Belden, Inc. | | 12,092 | 794,807 |
| Cognex Corp. | | 47,272 | 3,675,871 |
| Coherent, Inc.(1) | | 6,499 | 1,732,243 |
| II-VI, Inc.(1)(2) | | 28,379 | 1,939,137 |
| Jabil, Inc. | | 38,325 | 2,696,164 |
| Littelfuse, Inc. | | 6,586 | 2,072,483 |
| National Instruments Corp. | | 35,572 | 1,553,429 |
| TD SYNNEX Corp. | | 11,006 | 1,258,646 |
| Vishay Intertechnology, Inc. | | 35,870 | 784,477 |
| Vontier Corp. | | 44,747 | 1,375,075 |
| | | | $ 21,468,777 |
| Energy Equipment & Services — 0.4% | |
| ChampionX Corp.(1) | | 53,456 | $ 1,080,346 |
| NOV, Inc. | | 103,494 | 1,402,343 |
| | | | $ 2,482,689 |
| Entertainment — 0.1% | |
| World Wrestling Entertainment, Inc., Class A | | 12,234 | $ 603,626 |
| | | | $ 603,626 |
| Equity Real Estate Investment Trusts (REITs) — 9.5% | |
| American Campus Communities, Inc. | | 37,208 | $ 2,131,646 |
| Apartment Income REIT Corp. | | 41,974 | 2,294,719 |
| Brixmor Property Group, Inc. | | 78,667 | 1,998,929 |
| Camden Property Trust | | 27,325 | 4,882,431 |
| Corporate Office Properties Trust | | 30,361 | 849,197 |
| Cousins Properties, Inc. | | 39,386 | 1,586,468 |
| CyrusOne, Inc. | | 33,933 | 3,044,469 |
| Douglas Emmett, Inc. | | 46,481 | 1,557,114 |
| EastGroup Properties, Inc. | | 10,878 | 2,478,552 |
| EPR Properties | | 19,815 | 941,014 |
| First Industrial Realty Trust, Inc. | | 34,837 | 2,306,209 |
| Healthcare Realty Trust, Inc. | | 39,449 | 1,248,166 |
| Highwoods Properties, Inc. | | 27,604 | 1,230,862 |
| Hudson Pacific Properties, Inc. | | 40,390 | 998,037 |
| JBG SMITH Properties | | 30,756 | 883,005 |
| Kilroy Realty Corp. | | 27,763 | 1,845,129 |
| Kite Realty Group Trust | | 57,800 | 1,258,884 |
| Lamar Advertising Co., Class A | | 23,213 | 2,815,737 |
| Life Storage, Inc. | | 21,931 | 3,359,391 |
| Macerich Co. (The) | | 56,424 | 975,007 |
| Medical Properties Trust, Inc. | | 159,437 | 3,767,496 |
| National Retail Properties, Inc. | | 46,956 | 2,257,175 |
| Security | Shares | Value |
| Equity Real Estate Investment Trusts (REITs) (continued) | |
| National Storage Affiliates Trust | | 21,910 | $ 1,516,172 |
| Omega Healthcare Investors, Inc. | | 63,546 | 1,880,326 |
| Park Hotels & Resorts, Inc.(1) | | 62,645 | 1,182,738 |
| Pebblebrook Hotel Trust | | 34,802 | 778,521 |
| Physicians Realty Trust | | 58,900 | 1,109,087 |
| PotlatchDeltic Corp. | | 17,760 | 1,069,507 |
| PS Business Parks, Inc. | | 5,332 | 981,994 |
| Rayonier, Inc. | | 38,276 | 1,544,819 |
| Rexford Industrial Realty, Inc. | | 40,504 | 3,285,280 |
| Sabra Health Care REIT, Inc. | | 61,143 | 827,876 |
| SL Green Realty Corp. | | 17,790 | 1,275,543 |
| Spirit Realty Capital, Inc. | | 32,972 | 1,588,921 |
| STORE Capital Corp. | | 65,616 | 2,257,190 |
| Urban Edge Properties | | 29,733 | 564,927 |
| | | | $ 64,572,538 |
| Food & Staples Retailing — 1.2% | |
| BJ's Wholesale Club Holdings, Inc.(1) | | 36,326 | $ 2,432,752 |
| Casey's General Stores, Inc. | | 9,920 | 1,957,712 |
| Grocery Outlet Holding Corp.(1) | | 23,599 | 667,380 |
| Performance Food Group Co.(1) | | 41,260 | 1,893,421 |
| Sprouts Farmers Market, Inc.(1) | | 30,248 | 897,761 |
| | | | $ 7,849,026 |
| Food Products — 1.7% | |
| Darling Ingredients, Inc.(1) | | 43,264 | $ 2,997,763 |
| Flowers Foods, Inc. | | 53,220 | 1,461,953 |
| Hain Celestial Group, Inc. (The)(1) | | 24,927 | 1,062,139 |
| Ingredion, Inc. | | 17,749 | 1,715,263 |
| Lancaster Colony Corp. | | 5,286 | 875,362 |
| Pilgrim's Pride Corp.(1) | | 12,910 | 364,062 |
| Post Holdings, Inc.(1) | | 15,525 | 1,750,133 |
| Sanderson Farms, Inc. | | 5,619 | 1,073,679 |
| | | | $ 11,300,354 |
| Gas Utilities — 1.2% | |
| National Fuel Gas Co. | | 24,153 | $ 1,544,343 |
| New Jersey Resources Corp. | | 25,565 | 1,049,699 |
| ONE Gas, Inc. | | 14,392 | 1,116,675 |
| Southwest Gas Holdings, Inc. | | 16,146 | 1,131,028 |
| Spire, Inc. | | 13,969 | 911,058 |
| UGI Corp. | | 55,908 | 2,566,736 |
| | | | $ 8,319,539 |
| Health Care Equipment & Supplies — 3.2% | |
| Envista Holdings Corp.(1) | | 42,716 | $ 1,924,783 |
9
See Notes to Financial Statements.
Calvert
VP S&P MidCap 400 Index Portfolio
December 31, 2021
Schedule of Investments — continued
| Security | Shares | Value |
| Health Care Equipment & Supplies (continued) | |
| Globus Medical, Inc., Class A(1) | | 21,134 | $ 1,525,875 |
| Haemonetics Corp.(1) | | 13,500 | 716,040 |
| ICU Medical, Inc.(1) | | 5,281 | 1,253,393 |
| Integra LifeSciences Holdings Corp.(1) | | 19,476 | 1,304,697 |
| LivaNova PLC(1) | | 14,206 | 1,242,031 |
| Masimo Corp.(1) | | 13,584 | 3,977,123 |
| Neogen Corp.(1) | | 28,470 | 1,292,823 |
| NuVasive, Inc.(1) | | 13,686 | 718,241 |
| Penumbra, Inc.(1) | | 9,390 | 2,697,935 |
| Quidel Corp.(1) | | 10,036 | 1,354,760 |
| STAAR Surgical Co.(1) | | 12,555 | 1,146,271 |
| Tandem Diabetes Care, Inc.(1) | | 16,987 | 2,556,883 |
| | | | $ 21,710,855 |
| Health Care Providers & Services — 2.9% | |
| Acadia Healthcare Co., Inc.(1) | | 23,804 | $ 1,444,903 |
| Amedisys, Inc.(1) | | 8,644 | 1,399,291 |
| Chemed Corp. | | 4,116 | 2,177,529 |
| Encompass Health Corp. | | 26,358 | 1,720,123 |
| HealthEquity, Inc.(1) | | 22,089 | 977,217 |
| LHC Group, Inc.(1) | | 8,389 | 1,151,223 |
| Molina Healthcare, Inc.(1) | | 15,615 | 4,966,819 |
| Option Care Health, Inc.(1) | | 36,705 | 1,043,890 |
| Patterson Cos., Inc. | | 22,840 | 670,354 |
| Progyny, Inc.(1) | | 18,618 | 937,416 |
| R1 RCM, Inc.(1) | | 35,458 | 903,824 |
| Tenet Healthcare Corp.(1) | | 28,643 | 2,339,847 |
| | | | $ 19,732,436 |
| Hotels, Restaurants & Leisure — 2.9% | |
| Boyd Gaming Corp.(1) | | 21,812 | $ 1,430,213 |
| Choice Hotels International, Inc. | | 8,694 | 1,356,177 |
| Churchill Downs, Inc. | | 9,183 | 2,212,185 |
| Cracker Barrel Old Country Store, Inc. | | 6,288 | 808,888 |
| Jack in the Box, Inc. | | 5,741 | 502,223 |
| Marriott Vacations Worldwide Corp. | | 11,313 | 1,911,671 |
| Papa John's International, Inc. | | 8,620 | 1,150,511 |
| Scientific Games Corp., Class A(1) | | 25,528 | 1,706,036 |
| Six Flags Entertainment Corp.(1) | | 20,472 | 871,698 |
| Texas Roadhouse, Inc. | | 18,497 | 1,651,412 |
| Travel + Leisure Co. | | 22,860 | 1,263,472 |
| Wendy's Co. (The) | | 47,865 | 1,141,580 |
| Wingstop, Inc. | | 7,879 | 1,361,491 |
| Wyndham Hotels & Resorts, Inc. | | 24,773 | 2,220,900 |
| | | | $ 19,588,457 |
| Security | Shares | Value |
| Household Durables — 1.9% | |
| Helen of Troy, Ltd.(1) | | 6,384 | $ 1,560,697 |
| KB Home | | 22,916 | 1,025,033 |
| Leggett & Platt, Inc. | | 35,662 | 1,467,848 |
| Taylor Morrison Home Corp.(1) | | 33,188 | 1,160,252 |
| Tempur Sealy International, Inc. | | 51,473 | 2,420,775 |
| Toll Brothers, Inc. | | 30,720 | 2,223,821 |
| TopBuild Corp.(1) | | 8,803 | 2,428,836 |
| TRI Pointe Homes, Inc.(1) | | 30,142 | 840,660 |
| | | | $ 13,127,922 |
| Household Products — 0.1% | |
| Energizer Holdings, Inc. | | 16,662 | $ 668,146 |
| | | | $ 668,146 |
| Insurance — 3.6% | |
| Alleghany Corp.(1) | | 3,674 | $ 2,452,726 |
| American Financial Group, Inc. | | 17,687 | 2,428,779 |
| Brighthouse Financial, Inc.(1) | | 21,342 | 1,105,515 |
| CNO Financial Group, Inc. | | 32,971 | 786,029 |
| First American Financial Corp. | | 29,117 | 2,277,823 |
| Hanover Insurance Group, Inc. (The) | | 9,458 | 1,239,565 |
| Kemper Corp. | | 15,843 | 931,410 |
| Kinsale Capital Group, Inc. | | 5,679 | 1,350,977 |
| Mercury General Corp. | | 7,040 | 373,542 |
| Old Republic International Corp. | | 76,341 | 1,876,462 |
| Primerica, Inc. | | 10,455 | 1,602,438 |
| Reinsurance Group of America, Inc. | | 18,012 | 1,972,134 |
| RenaissanceRe Holdings, Ltd. | | 12,305 | 2,083,606 |
| RLI Corp. | | 10,542 | 1,181,758 |
| Selective Insurance Group, Inc. | | 15,922 | 1,304,649 |
| Unum Group | | 54,142 | 1,330,269 |
| | | | $ 24,297,682 |
| Interactive Media & Services — 0.4% | |
| TripAdvisor, Inc.(1) | | 26,076 | $ 710,832 |
| Yelp, Inc.(1) | | 18,318 | 663,844 |
| Ziff Davis, Inc.(1) | | 12,769 | 1,415,571 |
| | | | $ 2,790,247 |
| IT Services — 1.9% | |
| Alliance Data Systems Corp. | | 13,180 | $ 877,392 |
| Concentrix Corp. | | 11,471 | 2,048,950 |
| Genpact, Ltd. | | 46,260 | 2,455,481 |
| Kyndryl Holdings, Inc.(1) | | 47,450 | 858,845 |
| LiveRamp Holdings, Inc.(1) | | 18,002 | 863,196 |
| MAXIMUS, Inc. | | 16,283 | 1,297,267 |
10
See Notes to Financial Statements.
Calvert
VP S&P MidCap 400 Index Portfolio
December 31, 2021
Schedule of Investments — continued
| Security | Shares | Value |
| IT Services (continued) | |
| Sabre Corp.(1) | | 85,547 | $ 734,849 |
| Western Union Co. (The) | | 107,488 | 1,917,586 |
| WEX, Inc.(1) | | 11,867 | 1,666,008 |
| | | | $ 12,719,574 |
| Leisure Products — 1.3% | |
| Brunswick Corp. | | 20,529 | $ 2,067,886 |
| Callaway Golf Co.(1) | | 31,446 | 862,878 |
| Mattel, Inc.(1) | | 93,673 | 2,019,590 |
| Polaris, Inc. | | 15,252 | 1,676,348 |
| YETI Holdings, Inc.(1) | | 23,434 | 1,941,038 |
| | | | $ 8,567,740 |
| Life Sciences Tools & Services — 1.5% | |
| Bruker Corp. | | 27,168 | $ 2,279,667 |
| Medpace Holdings, Inc.(1) | | 7,687 | 1,672,999 |
| Repligen Corp.(1) | | 13,748 | 3,641,020 |
| Syneos Health, Inc.(1) | | 27,725 | 2,846,803 |
| | | | $ 10,440,489 |
| Machinery — 4.8% | |
| AGCO Corp. | | 16,375 | $ 1,899,827 |
| Colfax Corp.(1) | | 36,005 | 1,655,150 |
| Crane Co. | | 13,201 | 1,342,938 |
| Donaldson Co., Inc. | | 33,266 | 1,971,343 |
| Flowserve Corp. | | 34,506 | 1,055,884 |
| Graco, Inc. | | 45,445 | 3,663,776 |
| ITT, Inc. | | 22,807 | 2,330,647 |
| Kennametal, Inc. | | 22,149 | 795,371 |
| Lincoln Electric Holdings, Inc. | | 15,731 | 2,194,003 |
| Middleby Corp. (The)(1) | | 14,873 | 2,926,411 |
| Nordson Corp. | | 14,451 | 3,688,907 |
| Oshkosh Corp. | | 18,352 | 2,068,454 |
| Terex Corp. | | 18,489 | 812,591 |
| Timken Co. (The) | | 18,484 | 1,280,756 |
| Toro Co. (The) | | 28,360 | 2,833,448 |
| Trinity Industries, Inc. | | 21,870 | 660,474 |
| Woodward, Inc. | | 16,849 | 1,844,291 |
| | | | $ 33,024,271 |
| Marine — 0.1% | |
| Kirby Corp.(1) | | 16,246 | $ 965,337 |
| | | | $ 965,337 |
| Media — 0.9% | |
| Cable One, Inc. | | 1,325 | $ 2,336,571 |
| Security | Shares | Value |
| Media (continued) | |
| John Wiley & Sons, Inc., Class A | | 11,529 | $ 660,266 |
| New York Times Co. (The), Class A | | 44,677 | 2,157,899 |
| TEGNA, Inc. | | 58,563 | 1,086,929 |
| | | | $ 6,241,665 |
| Metals & Mining — 2.5% | |
| Alcoa Corp. | | 50,027 | $ 2,980,609 |
| Cleveland-Cliffs, Inc.(1) | | 121,679 | 2,648,952 |
| Commercial Metals Co. | | 31,942 | 1,159,175 |
| Compass Minerals International, Inc. | | 9,190 | 469,425 |
| Reliance Steel & Aluminum Co. | | 16,816 | 2,727,891 |
| Royal Gold, Inc. | | 17,379 | 1,828,445 |
| Steel Dynamics, Inc. | | 50,408 | 3,128,825 |
| United States Steel Corp. | | 71,555 | 1,703,725 |
| Worthington Industries, Inc. | | 8,772 | 479,477 |
| | | | $ 17,126,524 |
| Multiline Retail — 0.8% | |
| Kohl's Corp. | | 40,249 | $ 1,987,898 |
| Macy's, Inc. | | 82,808 | 2,167,913 |
| Nordstrom, Inc.(1) | | 29,424 | 665,571 |
| Ollie's Bargain Outlet Holdings, Inc.(1) | | 16,083 | 823,289 |
| | | | $ 5,644,671 |
| Multi-Utilities — 0.5% | |
| Black Hills Corp. | | 16,994 | $ 1,199,267 |
| MDU Resources Group, Inc. | | 54,372 | 1,676,832 |
| NorthWestern Corp.(2) | | 14,079 | 804,756 |
| | | | $ 3,680,855 |
| Oil, Gas & Consumable Fuels — 1.6% | |
| Antero Midstream Corp. | | 86,003 | $ 832,509 |
| CNX Resources Corp.(1) | | 56,325 | 774,469 |
| DT Midstream, Inc. | | 25,658 | 1,231,071 |
| EQT Corp.(1) | | 80,097 | 1,746,916 |
| Equitrans Midstream Corp. | | 107,697 | 1,113,587 |
| HollyFrontier Corp. | | 39,599 | 1,298,055 |
| Murphy Oil Corp. | | 38,454 | 1,004,034 |
| Targa Resources Corp. | | 61,222 | 3,198,237 |
| | | | $ 11,198,878 |
| Paper & Forest Products — 0.3% | |
| Louisiana-Pacific Corp. | | 23,526 | $ 1,843,262 |
| | | | $ 1,843,262 |
11
See Notes to Financial Statements.
Calvert
VP S&P MidCap 400 Index Portfolio
December 31, 2021
Schedule of Investments — continued
| Security | Shares | Value |
| Personal Products — 0.2% | |
| Coty, Inc., Class A(1) | | 88,786 | $ 932,253 |
| Nu Skin Enterprises, Inc., Class A | | 13,526 | 686,445 |
| | | | $ 1,618,698 |
| Pharmaceuticals — 0.5% | |
| Jazz Pharmaceuticals PLC(1) | | 16,436 | $ 2,093,946 |
| Perrigo Co. PLC | | 35,420 | 1,377,838 |
| | | | $ 3,471,784 |
| Professional Services — 1.5% | |
| ASGN, Inc.(1) | | 14,013 | $ 1,729,204 |
| CACI International, Inc., Class A(1) | | 6,238 | 1,679,332 |
| FTI Consulting, Inc.(1) | | 9,080 | 1,393,054 |
| Insperity, Inc. | | 9,510 | 1,123,226 |
| KBR, Inc. | | 37,292 | 1,775,845 |
| ManpowerGroup, Inc. | | 14,366 | 1,398,243 |
| Science Applications International Corp. | | 15,353 | 1,283,357 |
| | | | $ 10,382,261 |
| Real Estate Management & Development — 0.5% | |
| Jones Lang LaSalle, Inc.(1) | | 13,431 | $ 3,617,506 |
| | | | $ 3,617,506 |
| Road & Rail — 1.9% | |
| Avis Budget Group, Inc.(1) | | 10,716 | $ 2,222,177 |
| Knight-Swift Transportation Holdings, Inc. | | 44,373 | 2,704,091 |
| Landstar System, Inc. | | 10,139 | 1,815,084 |
| Ryder System, Inc. | | 14,244 | 1,174,133 |
| Saia, Inc.(1) | | 7,042 | 2,373,365 |
| Werner Enterprises, Inc. | | 16,375 | 780,432 |
| XPO Logistics, Inc.(1) | | 26,377 | 2,042,371 |
| | | | $ 13,111,653 |
| Semiconductors & Semiconductor Equipment — 4.2% | |
| Amkor Technology, Inc. | | 26,537 | $ 657,852 |
| Azenta, Inc. | | 19,879 | 2,049,724 |
| Cirrus Logic, Inc.(1) | | 15,257 | 1,403,949 |
| CMC Materials, Inc. | | 7,600 | 1,456,844 |
| First Solar, Inc.(1) | | 26,439 | 2,304,423 |
| Lattice Semiconductor Corp.(1) | | 36,615 | 2,821,552 |
| MKS Instruments, Inc. | | 14,829 | 2,582,767 |
| Power Integrations, Inc. | | 16,131 | 1,498,409 |
| Semtech Corp.(1) | | 17,198 | 1,529,418 |
| Silicon Laboratories, Inc.(1) | | 10,759 | 2,220,873 |
| SiTime Corp.(1) | | 4,007 | 1,172,208 |
| SunPower Corp.(1)(2) | | 22,000 | 459,140 |
| Security | Shares | Value |
| Semiconductors & Semiconductor Equipment (continued) | |
| Synaptics, Inc.(1) | | 10,500 | $ 3,039,855 |
| Universal Display Corp. | | 11,483 | 1,895,039 |
| Wolfspeed, Inc.(1) | | 30,987 | 3,463,417 |
| | | | $ 28,555,470 |
| Software — 3.6% | |
| ACI Worldwide, Inc.(1) | | 31,120 | $ 1,079,864 |
| Aspen Technology, Inc.(1) | | 17,849 | 2,716,618 |
| Blackbaud, Inc.(1) | | 11,136 | 879,521 |
| CDK Global, Inc. | | 31,640 | 1,320,653 |
| Cerence, Inc.(1)(2) | | 10,200 | 781,728 |
| Commvault Systems, Inc.(1) | | 12,151 | 837,447 |
| Digital Turbine, Inc.(1)(2) | | 23,510 | 1,433,875 |
| Envestnet, Inc.(1) | | 14,441 | 1,145,749 |
| Fair Isaac Corp.(1) | | 7,315 | 3,172,296 |
| Manhattan Associates, Inc.(1) | | 16,920 | 2,630,891 |
| Mimecast, Ltd.(1) | | 16,510 | 1,313,700 |
| NCR Corp.(1) | | 35,294 | 1,418,819 |
| Paylocity Holding Corp.(1) | | 10,593 | 2,501,643 |
| Qualys, Inc.(1) | | 8,872 | 1,217,416 |
| SailPoint Technologies Holdings, Inc.(1)(2) | | 24,620 | 1,190,131 |
| Teradata Corp.(1) | | 28,900 | 1,227,383 |
| | | | $ 24,867,734 |
| Specialty Retail — 3.2% | |
| American Eagle Outfitters, Inc.(2) | | 40,799 | $ 1,033,031 |
| AutoNation, Inc.(1) | | 10,689 | 1,249,010 |
| Dick's Sporting Goods, Inc.(2) | | 17,359 | 1,996,111 |
| Five Below, Inc.(1) | | 14,979 | 3,099,005 |
| Foot Locker, Inc. | | 23,862 | 1,041,099 |
| GameStop Corp., Class A(1)(2) | | 16,482 | 2,445,764 |
| Lithia Motors, Inc., Class A | | 8,043 | 2,388,369 |
| Murphy USA, Inc. | | 6,298 | 1,254,813 |
| RH (1) | | 4,638 | 2,485,690 |
| Urban Outfitters, Inc.(1) | | 17,453 | 512,420 |
| Victoria's Secret & Co.(1) | | 19,372 | 1,075,921 |
| Williams-Sonoma, Inc. | | 19,898 | 3,365,349 |
| | | | $ 21,946,582 |
| Technology Hardware, Storage & Peripherals — 0.1% | |
| Xerox Holdings Corp. | | 36,405 | $ 824,209 |
| | | | $ 824,209 |
| Textiles, Apparel & Luxury Goods — 1.8% | |
| Capri Holdings, Ltd.(1) | | 40,267 | $ 2,613,731 |
| Carter's, Inc. | | 11,301 | 1,143,887 |
12
See Notes to Financial Statements.
Calvert
VP S&P MidCap 400 Index Portfolio
December 31, 2021
Schedule of Investments — continued
| Security | Shares | Value |
| Textiles, Apparel & Luxury Goods (continued) | |
| Columbia Sportswear Co. | | 9,261 | $ 902,392 |
| Crocs, Inc.(1) | | 15,734 | 2,017,413 |
| Deckers Outdoor Corp.(1) | | 7,328 | 2,684,320 |
| Hanesbrands, Inc. | | 93,370 | 1,561,146 |
| Skechers USA, Inc., Class A(1) | | 35,732 | 1,550,769 |
| | | | $ 12,473,658 |
| Thrifts & Mortgage Finance — 0.7% | |
| Essent Group, Ltd. | | 29,634 | $ 1,349,236 |
| MGIC Investment Corp. | | 87,054 | 1,255,319 |
| New York Community Bancorp, Inc. | | 123,183 | 1,504,064 |
| Washington Federal, Inc. | | 17,418 | 581,413 |
| | | | $ 4,690,032 |
| Trading Companies & Distributors — 0.9% | |
| GATX Corp. | | 9,404 | $ 979,803 |
| MSC Industrial Direct Co., Inc., Class A | | 12,448 | 1,046,379 |
| Univar Solutions, Inc.(1) | | 45,838 | 1,299,507 |
| Watsco, Inc. | | 8,830 | 2,762,730 |
| | | | $ 6,088,419 |
| Water Utilities — 0.5% | |
| Essential Utilities, Inc. | | 61,496 | $ 3,301,720 |
| | | | $ 3,301,720 |
Total Common Stocks
(identified cost $422,516,339) | | | $657,297,735 |
| Exchange-Traded Funds — 0.6% |
| Security | Shares | Value |
| Equity Funds — 0.6% | |
| SPDR S&P MidCap 400 ETF Trust | | 8,500 | $ 4,400,280 |
Total Exchange-Traded Funds
(identified cost $3,322,539) | | | $ 4,400,280 |
| Short-Term Investments — 3.0% | | | |
| Affiliated Fund — 2.6% |
| Description | Units | Value |
| Calvert Cash Reserves Fund, LLC, 0.06%(3) | | 17,905,958 | $ 17,905,958 |
Total Affiliated Fund
(identified cost $17,905,923) | | | $ 17,905,958 |
| Securities Lending Collateral — 0.1% |
| Security | Shares | Value |
| State Street Navigator Securities Lending Government Money Market Portfolio, 0.03%(4) | | 470,125 | $ 470,125 |
Total Securities Lending Collateral
(identified cost $470,125) | | | $ 470,125 |
| U.S. Treasury Obligations — 0.3% |
| Security | Principal
Amount
(000's omitted) | Value |
| U.S. Treasury Bill, 0.00%, 2/24/22(5) | $ | 2,000 | $ 1,999,935 |
Total U.S. Treasury Obligations
(identified cost $1,999,798) | | | $ 1,999,935 |
Total Short-Term Investments
(identified cost $20,375,846) | | | $ 20,376,018 |
Total Investments — 100.1%
(identified cost $446,214,724) | | | $682,074,033 |
| Other Assets, Less Liabilities — (0.1)% | | | $ (756,748) |
| Net Assets — 100.0% | | | $ 681,317,285 |
| The percentage shown for each investment category in the Schedule of Investments is based on net assets. |
| (1) | Non-income producing security. |
| (2) | All or a portion of this security was on loan at December 31, 2021. The aggregate market value of securities on loan at December 31, 2021 was $9,452,451. |
| (3) | Affiliated investment company, available to Calvert portfolios and funds, which invests in high quality, U.S. dollar denominated money market instruments. The rate shown is the annualized seven-day yield as of December 31, 2021. |
| (4) | Represents investment of cash collateral received in connection with securities lending. |
| (5) | Security (or a portion thereof) has been pledged to cover margin requirements on open futures contracts. |
13
See Notes to Financial Statements.
Calvert
VP S&P MidCap 400 Index Portfolio
December 31, 2021
Schedule of Investments — continued
Futures Contracts
| Description | Number of
Contracts | Position | Expiration
Date | Notional
Amount | Value/
Unrealized
Appreciation
(Depreciation) |
| Equity Futures | | | | | |
| E-mini S&P MidCap 400 Index | 71 | Long | 3/18/22 | $20,147,670 | $ 732,015 |
| | | | | | $732,015 |
14
See Notes to Financial Statements.
Calvert
VP S&P MidCap 400 Index Portfolio
December 31, 2021
Statement of Assets and Liabilities
| | December 31, 2021 |
| Assets | |
Investments in securities of unaffiliated issuers, at value (identified cost $428,308,801) - including
$9,452,451 of securities on loan | $ 664,168,075 |
| Investments in securities of affiliated issuers, at value (identified cost $17,905,923) | 17,905,958 |
| Receivable for variation margin on open futures contracts | 7,810 |
| Receivable for capital shares sold | 120,070 |
| Dividends receivable | 615,952 |
| Dividends receivable - affiliated | 842 |
| Securities lending income receivable | 1,661 |
| Receivable from affiliate | 10,223 |
| Directors' deferred compensation plan | 129,794 |
| Total assets | $682,960,385 |
| Liabilities | |
| Payable for capital shares redeemed | $ 616,763 |
| Deposits for securities loaned | 470,125 |
| Payable to affiliates: | |
| Investment advisory fee | 112,624 |
| Administrative fee | 67,575 |
| Distribution and service fees | 64,103 |
| Sub-transfer agency fee | 146 |
| Directors' deferred compensation plan | 129,794 |
| Accrued expenses | 181,970 |
| Total liabilities | $ 1,643,100 |
| Net Assets | $681,317,285 |
| Sources of Net Assets | |
| Paid-in capital | $ 378,129,974 |
| Distributable earnings | 303,187,311 |
| Net Assets | $681,317,285 |
| Class I Shares | |
| Net Assets | $ 293,421,800 |
| Shares Outstanding | 2,031,023 |
Net Asset Value, Offering Price and Redemption Price Per Share
(net assets ÷ shares of beneficial interest outstanding) | $ 144.47 |
| Class F Shares | |
| Net Assets | $ 387,895,485 |
| Shares Outstanding | 2,680,179 |
Net Asset Value, Offering Price and Redemption Price Per Share
(net assets ÷ shares of beneficial interest outstanding) | $ 144.73 |
15
See Notes to Financial Statements.
Calvert
VP S&P MidCap 400 Index Portfolio
December 31, 2021
| | Year Ended |
| | December 31, 2021 |
| Investment Income | |
| Dividend income | $ 8,999,718 |
| Dividend income - affiliated issuers | 20,508 |
| Interest income | 1,665 |
| Securities lending income, net | 27,227 |
| Total investment income | $ 9,049,118 |
| Expenses | |
| Investment advisory fee | $ 1,302,994 |
| Administrative fee | 781,797 |
| Distribution and service fees: | |
| Class F | 736,258 |
| Directors' fees and expenses | 23,960 |
| Custodian fees | 18,813 |
| Transfer agency fees and expenses | 409,767 |
| Accounting fees | 147,016 |
| Professional fees | 33,050 |
| Reports to shareholders | 136 |
| Miscellaneous | 75,206 |
| Total expenses | $ 3,528,997 |
| Waiver and/or reimbursement of expenses by affiliate | $ (642,251) |
| Net expenses | $ 2,886,746 |
| Net investment income | $ 6,162,372 |
| Realized and Unrealized Gain (Loss) | |
| Net realized gain (loss): | |
| Investment securities | $ 55,903,089 |
| Investment securities - affiliated issuers | 1,246,634 |
| Futures contracts | 2,947,555 |
| Net realized gain | $ 60,097,278 |
| Change in unrealized appreciation (depreciation): | |
| Investment securities | $ 72,012,242 |
| Investment securities - affiliated issuers | (1,087,973) |
| Futures contracts | 576,835 |
| Net change in unrealized appreciation (depreciation) | $ 71,501,104 |
| Net realized and unrealized gain | $131,598,382 |
| Net increase in net assets from operations | $137,760,754 |
16
See Notes to Financial Statements.
Calvert
VP S&P MidCap 400 Index Portfolio
December 31, 2021
Statements of Changes in Net Assets
| | Year Ended December 31, |
| | 2021 | 2020 |
| Increase (Decrease) in Net Assets | | |
| From operations: | | |
| Net investment income | $ 6,162,372 | $ 6,275,091 |
| Net realized gain | 60,097,278 | 17,626,539 |
| Net change in unrealized appreciation (depreciation) | 71,501,104 | 48,297,327 |
| Net increase in net assets from operations | $137,760,754 | $ 72,198,957 |
| Distributions to shareholders: | | |
| Class I | $ (10,392,540) | $ (10,841,521) |
| Class F | (13,609,987) | (13,178,857) |
| Total distributions to shareholders | $ (24,002,527) | $ (24,020,378) |
| Capital share transactions: | | |
| Class I | $ (15,837,733) | $ 1,479,371 |
| Class F | (621,362) | 3,313,858 |
| Net increase (decrease) in net assets from capital share transactions | $ (16,459,095) | $ 4,793,229 |
| Net increase in net assets | $ 97,299,132 | $ 52,971,808 |
| Net Assets | | |
| At beginning of year | $ 584,018,153 | $ 531,046,345 |
| At end of year | $681,317,285 | $584,018,153 |
17
See Notes to Financial Statements.
Calvert
VP S&P MidCap 400 Index Portfolio
December 31, 2021
| | Class I |
| | Year Ended December 31, |
| | 2021 | 2020 | 2019 | 2018 | 2017 |
| Net asset value — Beginning of year | $ 120.57 | $ 111.74 | $ 97.01 | $ 117.50 | $ 106.11 |
| Income (Loss) From Operations | | | | | |
| Net investment income(1) | $ 1.47 | $ 1.42 | $ 1.63 | $ 1.58 | $ 1.44 |
| Net realized and unrealized gain (loss) | 27.67 | 12.48 | 22.45 | (13.43) | 15.18 |
| Total income (loss) from operations | $ 29.14 | $ 13.90 | $ 24.08 | $ (11.85) | $ 16.62 |
| Less Distributions | | | | | |
| From net investment income | $ (1.19) | $ (1.29) | $ (1.34) | $ (1.40) | $ (0.81) |
| From net realized gain | (4.05) | (3.78) | (8.01) | (7.24) | (4.42) |
| Total distributions | $ (5.24) | $ (5.07) | $ (9.35) | $ (8.64) | $ (5.23) |
| Net asset value — End of year | $ 144.47 | $ 120.57 | $ 111.74 | $ 97.01 | $ 117.50 |
| Total Return(2) | 24.41% | 13.31% | 25.82% | (11.33)% | 15.88% |
| Ratios/Supplemental Data | | | | | |
| Net assets, end of year (000’s omitted) | $293,422 | $259,042 | $233,933 | $202,330 | $256,043 |
| Ratios (as a percentage of average daily net assets):(3) | | | | | |
| Total expenses | 0.43% | 0.45% | 0.43% | 0.44% | 0.43% |
| Net expenses | 0.33% | 0.33% | 0.32% | 0.30% | 0.30% |
| Net investment income | 1.06% | 1.40% | 1.48% | 1.35% | 1.29% |
| Portfolio Turnover | 15% | 20% | 15% | 14% | 16% |
| (1) | Computed using average shares outstanding. |
| (2) | Returns are historical and are calculated by determining the percentage change in net asset value with all distributions reinvested and do not reflect fees and expenses imposed by variable annuity contracts or variable life insurance policies. If included, total return would be lower. |
| (3) | Total expenses do not reflect amounts reimbursed and/or waived by the adviser and certain of its affiliates, if applicable. Net expenses are net of all reductions and represent the net expenses paid by the Fund. |
18
See Notes to Financial Statements.
Calvert
VP S&P MidCap 400 Index Portfolio
December 31, 2021
Financial Highlights — continued
| | Class F |
| | Year Ended December 31, |
| | 2021 | 2020 | 2019 | 2018 | 2017 |
| Net asset value — Beginning of year | $ 121.01 | $ 112.35 | $ 97.71 | $ 118.58 | $ 107.30 |
| Income (Loss) From Operations | | | | | |
| Net investment income(1) | $ 1.20 | $ 1.22 | $ 1.40 | $ 1.31 | $ 1.18 |
| Net realized and unrealized gain (loss) | 27.76 | 12.51 | 22.59 | (13.54) | 15.33 |
| Total income (loss) from operations | $ 28.96 | $ 13.73 | $ 23.99 | $ (12.23) | $ 16.51 |
| Less Distributions | | | | | |
| From net investment income | $ (1.19) | $ (1.29) | $ (1.34) | $ (1.40) | $ (0.81) |
| From net realized gain | (4.05) | (3.78) | (8.01) | (7.24) | (4.42) |
| Total distributions | $ (5.24) | $ (5.07) | $ (9.35) | $ (8.64) | $ (5.23) |
| Net asset value — End of year | $ 144.73 | $ 121.01 | $ 112.35 | $ 97.71 | $ 118.58 |
| Total Return(2) | 24.17% | 13.10% | 25.55% | (11.57)% | 15.63% |
| Ratios/Supplemental Data | | | | | |
| Net assets, end of year (000’s omitted) | $387,895 | $324,976 | $297,113 | $246,076 | $294,786 |
| Ratios (as a percentage of average daily net assets):(3) | | | | | |
| Total expenses | 0.63% | 0.65% | 0.63% | 0.64% | 0.64% |
| Net expenses | 0.53% | 0.53% | 0.54% | 0.55% | 0.55% |
| Net investment income | 0.86% | 1.20% | 1.26% | 1.11% | 1.05% |
| Portfolio Turnover | 15% | 20% | 15% | 14% | 16% |
| (1) | Computed using average shares outstanding. |
| (2) | Returns are historical and are calculated by determining the percentage change in net asset value with all distributions reinvested and do not reflect fees and expenses imposed by variable annuity contracts or variable life insurance policies. If included, total return would be lower. |
| (3) | Total expenses do not reflect amounts reimbursed and/or waived by the adviser and certain of its affiliates, if applicable. Net expenses are net of all reductions and represent the net expenses paid by the Fund. |
19
See Notes to Financial Statements.
Calvert
VP S&P MidCap 400 Index Portfolio
December 31, 2021
Notes to Financial Statements
1 Significant Accounting Policies
Calvert VP S&P MidCap 400 Index Portfolio (the Fund) is a diversified series of Calvert Variable Products, Inc. (the Corporation). The Corporation is a Maryland corporation registered under the Investment Company Act of 1940, as amended (the 1940 Act), as an open-end management investment company. The investment objective of the Fund is to seek investment results that correspond to the total return performance of U.S. common stocks, as represented by the S& P MidCap 400® Index.
Shares of the Fund are sold without sales charge to insurance companies for allocation to certain of their variable separate accounts and to qualified pension and retirement plans and other eligible investors. The Fund offers Class I and Class F shares. Among other things, each class has different: (a) dividend rates due to differences in Distribution Plan expenses and other class-specific expenses; (b) exchange privileges; and (c) class-specific voting rights.
The Fund applies the accounting and reporting guidance in the Financial Accounting Standards Board (FASB) Accounting Standards Codification Topic 946, Financial Services – Investment Companies (ASC 946). Subsequent events, if any, through the date that the financial statements were issued have been evaluated in the preparation of the financial statements.
A Investment Valuation— Net asset value per share is determined every business day as of the close of the regular session of the New York Stock Exchange (generally 4:00 p.m. Eastern time). The Fund uses independent pricing services approved by the Board of Directors (the Board) to value its investments wherever possible. Investments for which market quotations are not available or deemed not reliable are fair valued in good faith under the direction of the Board.
U.S. generally accepted accounting principles (U.S. GAAP) establishes a disclosure hierarchy that categorizes the inputs to valuation techniques used to value assets and liabilities at measurement date. These inputs are summarized in the three broad levels listed below:
Level 1 - quoted prices in active markets for identical securities
Level 2 - other significant observable inputs (including quoted prices for similar securities, interest rates, prepayment speeds, credit risk, etc.)
Level 3 - significant unobservable inputs (including the Fund’s own assumptions in determining the fair value of investments)
The inputs or methodologies used for valuing securities are not necessarily an indication of the risk associated with investing in those securities.
Valuation techniques used to value the Fund’s investments by major category are as follows:
Equity Securities. Equity securities (including warrants and rights) listed on a U.S. securities exchange generally are valued at the last sale or closing price as reported by an independent pricing service on the primary market or exchange on which they are traded and are categorized as Level 1 in the hierarchy. Equity securities listed on the NASDAQ National Market System are valued at the NASDAQ official closing price and are categorized as Level 1 in the hierarchy. Unlisted or listed securities for which closing sales prices or closing quotations are not available are valued at the mean between the latest available bid and ask prices and are categorized as Level 2 in the hierarchy.
Short-Term Debt Securities. Short-term debt securities with a remaining maturity at time of purchase of more than sixty days are valued based on valuations provided by a third party pricing service. Such securities are generally categorized as Level 2 in the hierarchy. Short-term debt securities of sufficient credit quality purchased with remaining maturities of sixty days or less for which a valuation from a third party pricing service is not readily available may be valued at amortized cost, which approximates fair value, and are categorized as Level 2 in the hierarchy.
Affiliated Fund. The Fund may invest in Calvert Cash Reserves Fund, LLC (Cash Reserves Fund), an affiliated investment company managed by Calvert Research and Management (CRM). While Cash Reserves Fund is not a registered money market mutual fund, it conducts all of its investment activities in accordance with the requirements of Rule 2a-7 under the 1940 Act. Investments in Cash Reserves Fund are valued at the closing net asset value per unit on the valuation day and are categorized as Level 2 in the hierarchy. Cash Reserves Fund generally values its investment securities based on available market quotations provided by a third party pricing service.
Other Securities. Exchange-traded funds are valued at the official closing price as reported by an independent pricing service on the primary market or exchange on which they are traded and are categorized as Level 1 in the hierarchy. Investments in registered investment companies (including money market funds) that do not trade on an exchange are valued at the net asset value per share on the valuation day and are categorized as Level 1 in the hierarchy.
Derivatives. Futures contracts are valued at unrealized appreciation (depreciation) based on the settlement price established each day by the board of trade or exchange on which they are traded and are categorized as Level 1 in the hierarchy.
Fair Valuation. If a market value cannot be determined for a security using the methodologies described above, or if, in the good faith opinion of the Fund's adviser, the market value does not constitute a readily available market quotation, or if a significant event has occurred that would materially affect the value of the security, the security will be fair valued as determined in good faith by or at the direction of the Board in a manner that most fairly reflects the security’s “fair value”, which is the amount that the Fund might reasonably expect to receive for the security upon its current sale in the ordinary course. Each such determination is based on a consideration of relevant factors, which are likely to vary from one pricing context to another. These factors may
Calvert
VP S&P MidCap 400 Index Portfolio
December 31, 2021
Notes to Financial Statements — continued
include, but are not limited to, the type of security, the existence of any contractual restrictions on the security’s disposition, the price and extent of public trading in similar securities of the issuer or of comparable companies or entities, quotations or relevant information obtained from broker/dealers or other market participants, information obtained from the issuer, analysts, and/or the appropriate stock exchange (for exchange-traded securities), an analysis of the company’s or entity’s financial statements, and an evaluation of the forces that influence the issuer and the market(s) in which the security is purchased and sold.
The values assigned to fair value investments are based on available information and do not necessarily represent amounts that might ultimately be realized. Further, due to the inherent uncertainty of valuations of such investments, the fair values may differ significantly from the values that would have been used had an active market existed, and the differences could be material.
The following table summarizes the market value of the Fund's holdings as of December 31, 2021, based on the inputs used to value them:
| Asset Description | Level 1 | Level 2 | Level 3 | Total |
| Common Stocks | $ 657,297,735(1) | $ — | $ — | $ 657,297,735 |
| Exchange-Traded Funds | 4,400,280 | — | — | 4,400,280 |
| Short-Term Investments: | | | | |
| Affiliated Fund | — | 17,905,958 | — | 17,905,958 |
| Securities Lending Collateral | 470,125 | — | — | 470,125 |
| U.S. Treasury Obligations | — | 1,999,935 | — | 1,999,935 |
| Total Investments | $662,168,140 | $19,905,893 | $ — | $682,074,033 |
| Futures Contracts | $ 732,015 | $ — | $ — | $ 732,015 |
| Total | $662,900,155 | $19,905,893 | $ — | $682,806,048 |
| (1) | The level classification by major category of investments is the same as the category presentation in the Schedule of Investments. |
B Investment Transactions and Income— Investment transactions for financial statement purposes are accounted for on trade date. Realized gains and losses are recorded on an identified cost basis and may include proceeds from litigation. Dividend income is recorded on the ex-dividend date for dividends received in cash and/or securities or, in the case of dividends on certain foreign securities, as soon as the Fund is informed of the ex-dividend date. Non-cash dividends are recorded at the fair value of the securities received. Withholding taxes on foreign dividends, if any, have been provided for in accordance with the Fund's understanding of the applicable country’s tax rules and rates. Distributions received that represent a return of capital are recorded as a reduction of cost of investments. Distributions received that represent a capital gain are recorded as a realized gain. Interest income, which includes amortization of premium and accretion of discount on debt securities, is accrued as earned.
C Share Class Accounting— Realized and unrealized gains and losses and net investment income and losses, other than class-specific expenses, are allocated daily to each class of shares based upon the relative net assets of each class to the total net assets of the Fund. Expenses arising in connection with a specific class are charged directly to that class.
D Futures Contracts— The Fund may enter into futures contracts to buy or sell a financial instrument for a set price at a future date. Initial margin deposits of either cash or securities as required by the broker are made upon entering into the contract. While the contract is open, daily variation margin payments are made to or received from the broker reflecting the daily change in market value of the contract and are recorded for financial reporting purposes as unrealized gains or losses by the Fund. When a futures contract is closed, a realized gain or loss is recorded equal to the difference between the opening and closing value of the contract. The risks associated with entering into futures contracts may include the possible illiquidity of the secondary market which would limit the Fund’s ability to close out a futures contract prior to the settlement date, an imperfect correlation between the value of the contracts and the underlying financial instruments, or that the counterparty will fail to perform its obligations under the contracts’ terms. Futures contracts are designed by boards of trade, which are designated “contracts markets” by the Commodities Futures Trading Commission. Futures contracts trade on the contracts markets in a manner that is similar to the way a stock trades on a stock exchange, and the boards of trade, through their clearing corporations, guarantee the futures contracts against default. As a result, there is minimal counterparty credit risk to the Fund.
E Distributions to Shareholders— Distributions to shareholders are recorded by the Fund on ex-dividend date. The Fund distributes any net investment income and net realized capital gains at least annually. Both types of distributions are made in shares of the Fund unless an election is made on behalf of a separate account to receive some or all of the distributions in cash. Distributions are declared separately for each class of shares. Distributions are determined in accordance with income tax regulations, which may differ from U.S. GAAP; accordingly, periodic reclassifications are made within the Fund's capital accounts to reflect income and gains available for distribution under income tax regulations.
Calvert
VP S&P MidCap 400 Index Portfolio
December 31, 2021
Notes to Financial Statements — continued
F Estimates— The preparation of financial statements in conformity with U.S. GAAP requires management to make estimates and assumptions that affect the reported amounts of assets and liabilities and disclosure of contingent assets and liabilities at the date of the financial statements and the reported amounts of increases and decreases in net assets from operations during the reporting period. Actual results could differ from those estimates.
G Indemnifications— The Corporation’s By-Laws provide for indemnification for Directors or officers of the Corporation and certain other parties, to the fullest extent permitted by Maryland law and the 1940 Act, provided certain conditions are met. Additionally, in the normal course of business, the Fund enters into agreements with service providers that may contain indemnification clauses. The Fund’s maximum exposure under these arrangements is unknown as this would involve future claims that may be made against the Fund that have not yet occurred.
H Federal Income Taxes— No provision for federal income or excise tax is required since the Fund intends to continue to qualify as a regulated investment company under the Internal Revenue Code and to distribute substantially all of its taxable earnings.
Management has analyzed the Fund's tax positions taken for all open federal income tax years and has concluded that no provision for federal income tax is required in the Fund's financial statements. A Fund's federal tax return is subject to examination by the Internal Revenue Service for a period of three years from the date of filing.
2 Related Party Transactions
The investment advisory fee is earned by CRM as compensation for investment advisory services rendered to the Fund. On March 1, 2021, Morgan Stanley acquired Eaton Vance Corp. (the “Transaction”) and CRM became an indirect, wholly-owned subsidiary of Morgan Stanley. In connection with the Transaction, the Fund entered into a new investment advisory agreement (the “New Agreement”) with CRM, which took effect on March 1, 2021. Pursuant to the New Agreement (and the Fund’s investment advisory agreement with CRM in effect prior to March 1, 2021), the fee is computed at the annual rate of 0.20% of the Fund’s average daily net assets and is payable monthly. For the year ended December 31, 2021, the investment advisory fee amounted to $1,302,994. The Fund may invest its cash in Cash Reserves Fund. CRM does not currently receive a fee for advisory services provided to Cash Reserves Fund.
Pursuant to an investment sub-advisory agreement, CRM has delegated the investment management of the Fund to Ameritas Investment Partners, Inc. (AIP). In connection with the Transaction, CRM entered into a new investment sub-advisory agreement with AIP, which took effect on March 1, 2021. CRM pays AIP a portion of its investment advisory fee for sub-advisory services provided to the Fund.
CRM has agreed to reimburse the Fund’s operating expenses to the extent that total annual operating expenses (relating to ordinary operating expenses only and excluding expenses such as brokerage commissions, acquired fund fees and expenses of unaffiliated funds, borrowing costs, taxes or litigation expenses) exceed 0.33% for Class I and 0.53% for Class F of such class's average daily net assets. The expense reimbursement agreement with CRM may be changed or terminated after April 30, 2022. For the year ended December 31, 2021, CRM waived or reimbursed expenses of $642,251.
The administrative fee is earned by CRM as compensation for administrative services rendered to the Fund. The fee is computed at an annual rate of 0.12% of the Fund’s average daily net assets attributable to Class I and Class F and is payable monthly. For the year ended December 31, 2021, CRM was paid administrative fees of $781,797.
The Fund has in effect a distribution plan for Class F shares (Class F Plan) pursuant to Rule 12b-1 under the 1940 Act. Pursuant to the Class F Plan, the Fund pays Eaton Vance Distributors, Inc. (EVD), an affiliate of CRM and the Fund’s principal underwriter, a distribution and service fee of 0.20% per annum of its average daily net assets attributable to Class F shares for distribution services and facilities provided to the Fund, as well as for personal and/or account maintenance services provided to the class shareholders. Distribution and service fees paid or accrued for the year ended December 31, 2021 amounted to $736,258 for Class F shares.
Eaton Vance Management (EVM), an affiliate of CRM, provides sub-transfer agency and related services to the Fund pursuant to a Sub-Transfer Agency Support Services Agreement. For the year ended December 31, 2021, sub-transfer agency fees and expenses incurred to EVM amounted to $630 and are included in transfer agency fees and expenses on the Statement of Operations.
Each Director of the Fund who is not an employee of CRM or its affiliates receives an annual fee of $154,000 ($214,000 effective January 1, 2022), plus an annual Committee fee ranging from $8,500 to $16,500 depending on the Committee. The Board chair receives an additional $30,000 annual fee, Committee chairs receive an additional $6,000 annual fee and the special equities liaison receives an additional $2,500 annual fee. Eligible Directors may participate in a Deferred Compensation Plan (the Plan). Amounts deferred under the Plan are treated as though equal dollar amounts had been invested in shares of the Fund or other Calvert funds selected by the Directors. The Fund purchases shares of the funds selected equal to the dollar amounts deferred under the Plan, resulting in an asset equal to the deferred compensation liability. Obligations of the Plan are paid solely from the Fund's assets. Directors’ fees are allocated to each of the Calvert funds served. Salaries and fees of officers and Directors of the Fund who are employees of CRM or its affiliates are paid by CRM.
Calvert
VP S&P MidCap 400 Index Portfolio
December 31, 2021
Notes to Financial Statements — continued
3 Shareholder Servicing Plan
The Corporation, on behalf of the Fund, has adopted a Shareholder Servicing Plan (Servicing Plan), which permits the Fund to enter into shareholder servicing agreements with intermediaries that maintain accounts in the Fund for the benefit of shareholders. These services may include, but are not limited to, processing purchase and redemption requests, processing dividend payments, and providing account information to shareholders. Under the Servicing Plan, the Fund may make payments at an annual rate of up to 0.11% of its average daily net assets. For the year ended December 31, 2021, expenses incurred under the Servicing Plan amounted to $408,352, of which $139,478 were payable to an affiliate of AIP, and are included in transfer agency fees and expenses on the Statement of Operations. Included in accrued expenses at December 31, 2021 are amounts payable to an affiliate of AIP under the Servicing Plan of $11,887.
4 Investment Activity
During the year ended December 31, 2021, the cost of purchases and proceeds from sales of investments, other than short-term securities, were $94,081,734 and $135,403,888, respectively.
5 Distributions to Shareholders and Income Tax Information
The tax character of distributions declared for the years ended December 31, 2021 and December 31, 2020 was as follows:
| | Year Ended December 31, |
| | 2021 | 2020 |
| Ordinary income | $11,316,301 | $ 6,104,804 |
| Long-term capital gains | $12,686,226 | $17,915,574 |
As of December 31, 2021, the components of distributable earnings (accumulated loss) on a tax basis were as follows:
| Undistributed ordinary income | $ 15,904,078 |
| Undistributed long-term capital gains | 50,672,729 |
| Net unrealized appreciation | 236,610,504 |
| Distributable earnings | $303,187,311 |
The cost and unrealized appreciation (depreciation) of investments, including open derivative contracts, of the Fund at December 31, 2021, as determined on a federal income tax basis, were as follows:
| Aggregate cost | $445,463,529 |
| Gross unrealized appreciation | $ 253,436,185 |
| Gross unrealized depreciation | (16,825,681) |
| Net unrealized appreciation | $236,610,504 |
6 Financial Instruments
A summary of futures contracts outstanding at December 31, 2021 is included in the Schedule of Investments. During the year ended December 31, 2021, the Fund used futures contracts to provide equity market exposure for uncommitted cash balances.
Calvert
VP S&P MidCap 400 Index Portfolio
December 31, 2021
Notes to Financial Statements — continued
At December 31, 2021, the fair value of open derivative instruments (not considered to be hedging instruments for accounting disclosure purposes) and whose primary underlying risk exposure is equity price risk was as follows:
| Derivative | Statement of Assets and Liabilities Caption | Assets | Liabilities |
| Futures contracts | Distributable earnings | | $732,015 (1) | $ — |
| (1) | Only the current day's variation margin is reported within the Statement of Assets and Liabilities as Receivable or Payable for variation margin on open futures contracts, as applicable. |
The effect of derivative instruments (not considered to be hedging instruments for accounting disclosure purposes) on the Statement of Operations and whose primary underlying risk exposure is equity price risk for the year ended December 31, 2021 was as follows:
| | Statement of Operations Caption | |
| Derivative | Net realized gain (loss): Futures
contracts | Change in unrealized appreciation
(depreciation): Futures contracts |
| Futures contracts | $ 2,947,555 | $ 576,835 |
The average notional cost of futures contracts (long) outstanding during the year ended December 31, 2021 was approximately $15,018,000.
7 Securities Lending
To generate additional income, the Fund may lend its securities pursuant to a securities lending agency agreement with State Street Bank and Trust Company (SSBT), the securities lending agent. Security loans are subject to termination by the Fund at any time and, therefore, are not considered illiquid investments. The Fund requires that the loan be continuously collateralized by either cash or securities in an amount at least equal to the market value of the securities on loan. The market value of securities loaned is determined daily and any additional required collateral is delivered to the Fund on the next business day. Cash collateral is generally invested in a money market fund registered under the 1940 Act that is managed by an affiliate of SSBT. Any gain or loss in the market price of the loaned securities that might occur and any interest earned or dividends declared during the term of the loan would accrue to the account of the Fund. Income earned on the investment of collateral, net of broker rebates and other expenses incurred by the securities lending agent, is split between the Fund and the securities lending agent based on agreed upon contractual terms. Non-cash collateral, if any, is held by the lending agent on behalf of the Fund and cannot be sold or re-pledged by the Fund; accordingly, such collateral is not reflected in the Statement of Assets and Liabilities.
The risks associated with lending portfolio securities include, but are not limited to, possible delays in receiving additional collateral or in the recovery of the loaned securities, possible loss of rights to the collateral should the borrower fail financially, as well as risk of loss in the value of the collateral or the value of the investments made with the collateral. The securities lending agent shall indemnify the Fund in the case of default of any securities borrower.
At December 31, 2021, the total value of securities on loan was $9,452,451 and the total value of collateral received was $9,837,480, comprised of cash of $470,125 and U.S. government and/or agencies securities of $9,367,355.
The following table provides a breakdown of securities lending transactions accounted for as secured borrowings, the obligations by class of collateral pledged, and the remaining contractual maturity of those transactions as of December 31, 2021.
| | Remaining Contractual Maturity of the Transactions |
| | Overnight and
Continuous | <30 days | 30 to 90 days | >90 days | Total |
| Common Stocks | $470,125 | $ — | $ — | $ — | $470,125 |
The carrying amount of the liability for deposits for securities loaned at December 31, 2021 approximated its fair value. If measured at fair value, such liability would have been considered as Level 2 in the fair value hierarchy (see Note 1A) at December 31, 2021.
Calvert
VP S&P MidCap 400 Index Portfolio
December 31, 2021
Notes to Financial Statements — continued
8 Line of Credit
The Fund participates with other portfolios and funds managed by EVM and its affiliates, including CRM, in an $800 million unsecured line of credit with a group of banks, which is in effect through October 25, 2022. Borrowings are made by the Fund solely for temporary purposes related to redemptions and other short-term cash needs. Interest is charged to the Fund based on its borrowings at an amount above either the Secured Overnight Financing Rate (SOFR) or Federal Funds rate. In addition, a fee computed at an annual rate of 0.15% on the daily unused portion of the line of credit is allocated among the participating portfolios and funds at the end of each quarter. In connection with the renewal of the agreement in October 2021, an arrangement fee of $150,000 was incurred that was allocated to the participating portfolios and funds. Because the line of credit is not available exclusively to the Fund, it may be unable to borrow some or all of its requested amounts at any particular time.
The Fund had no borrowings pursuant to its line of credit during the year ended December 31, 2021.
9 Affiliated Companies and Funds
An affiliated company is a company in which a fund has a direct or indirect ownership of, control of, or voting power of 5 percent or more of the outstanding voting shares, or a company that is under common ownership or control with a fund. At December 31, 2021, the value of the Fund's investment in affiliated companies and funds was $17,905,958, which represents 2.6% of the Fund's net assets. Transactions in affiliated companies and funds by the Fund for the year ended December 31, 2021 were as follows:
| Name | Value,
beginning
of period | Purchases | Sales
proceeds | Net
realized
gain
(loss) | Change in
unrealized
appreciation
(depreciation) | Value,
end of
period | Dividend
income | Shares/Units,
end of period |
| Common Stocks | | | | | | |
| Eaton Vance Corp. | $2,143,939 | $ — | $ (2,303,953) | $ 1,248,022 | $ (1,088,008) | $ — | $ 11,835 | — |
| Short-Term Investments | | | | | | |
| Calvert Cash Reserves Fund, LLC | 8,616,630 | 88,854,868 | (79,564,187) | (1,388) | 35 | 17,905,958 | 8,673 | 17,905,958 |
| Totals | | | | $1,246,634 | $ (1,087,973) | $17,905,958 | $20,508 | |
10 Capital Shares
The Corporation may issue its shares in one or more series (such as the Fund). The authorized shares of the Fund consist of 20,000,000 common shares, $0.10 par value, for each Class.
Transactions in capital shares for the years ended December 31, 2021 and December 31, 2020 were as follows:
| | Year Ended
December 31, 2021 | | Year Ended
December 31, 2020 |
| | Shares | Amount | | Shares | Amount |
| Class I | | | | | |
| Shares sold | 147,712 | $ 20,487,908 | | 355,592 | $ 32,312,348 |
| Reinvestment of distributions | 75,913 | 10,392,540 | | 107,406 | 10,841,521 |
| Shares redeemed | (341,118) | (46,718,181) | | (408,073) | (41,674,498) |
| Net increase (decrease) | (117,493) | $(15,837,733) | | 54,925 | $ 1,479,371 |
| Class F | | | | | |
| Shares sold | 127,650 | $ 17,794,835 | | 147,926 | $ 14,400,066 |
| Reinvestment of distributions | 99,191 | 13,609,987 | | 130,020 | 13,178,857 |
| Shares redeemed | (232,102) | (32,026,184) | | (236,985) | (24,265,065) |
| Net increase (decrease) | (5,261) | $ (621,362) | | 40,961 | $ 3,313,858 |
At December 31, 2021, separate accounts of an insurance company that is an affiliate of AIP and a separate account of another insurance company owned 19.7% and 50.1%, respectively, of the value of the outstanding shares of the Fund.
Calvert
VP S&P MidCap 400 Index Portfolio
December 31, 2021
Notes to Financial Statements — continued
11 Risks and Uncertainties
Pandemic Risk
An outbreak of respiratory disease caused by a novel coronavirus was first detected in China in late 2019 and subsequently spread internationally. This coronavirus has resulted in closing borders, enhanced health screenings, changes to healthcare service preparation and delivery, quarantines, cancellations, disruptions to supply chains and customer activity, as well as general concern and uncertainty. Health crises caused by outbreaks, such as the coronavirus outbreak, may exacerbate other pre-existing political, social and economic risks and disrupt normal market conditions and operations. The impact of this outbreak has negatively affected the worldwide economy, the economies of individual countries, individual companies, and the market in general, and may continue to do so in significant and unforeseen ways, as may other epidemics and pandemics that may arise in the future. Any such impact could adversely affect the Fund's performance, or the performance of the securities in which the Fund invests.
12 Change in Independent Registered Public Accounting Firm
On July 30, 2021, KPMG LLP (“KPMG”) informed the Audit Committee and Board of the Corporation that it was resigning as the independent registered public accounting firm to the Corporation, as upon Morgan Stanley’s acquisition of Eaton Vance Corp., the parent company of CRM (the investment adviser to each series of the Corporation), KPMG would no longer be independent of the Corporation. The Audit Committee of the Board and the Board approved the selection of Deloitte & Touche LLP (“Deloitte”) as the independent registered public accounting firm for the funds that are series of the Corporation (the “Funds”) for the fiscal year ending December 31, 2021 to be effective upon KPMG’s resignation and Deloitte’s acceptance of the engagement which became effective July 30, 2021.
KPMG’s reports on the financial statements for the Funds for the fiscal periods ended December 31, 2019 and December 31, 2020 contained no adverse opinion or disclaimer of opinion nor were they qualified or modified as to uncertainty, audit scope or accounting principles. During the fiscal periods ended December 31, 2019 and December 31, 2020, and during the subsequent interim period through July 30, 2021: (i) there were no disagreements with KPMG on any matter of accounting principles or practices, financial statement disclosure or auditing scope or procedure, which disagreements, if not resolved to the satisfaction of KPMG, would have caused KPMG to make reference to the subject matter of the disagreements in connection with its reports on the Funds’ financial statements for such periods; and (ii) there were no “reportable events” of the kind described in Item 304(a)(1)(v) of Regulation S-K under the Securities Exchange Act of 1934, as amended.
During the fiscal periods ended December 31, 2019 and December 31, 2020, and during the subsequent interim period through July 30, 2021: neither the Funds, nor anyone on their behalf, consulted with Deloitte on items which: (i) concerned the application of accounting principles to a specified transaction, either completed or proposed, or the type of audit opinion that might be rendered on the Funds’ financial statements; or (ii) concerned the subject of a disagreement (as defined in paragraph (a)(1)(iv) of Item 304 of Regulation S-K) or reportable events (as described in paragraph (a)(1)(v) of Item 304).
Calvert
VP S&P MidCap 400 Index Portfolio
December 31, 2021
Report of Independent Registered Public Accounting Firm
To the Board of Directors of Calvert Variable Products, Inc. and Shareholders of Calvert VP S&P MidCap 400 Index Portfolio:
Opinion on the Financial Statements and Financial Highlights
We have audited the accompanying statement of assets and liabilities of Calvert VP S&P MidCap 400 Index Portfolio (the "Fund") (one of the funds constituting Calvert Variable Products, Inc.), including the schedule of investments, as of December 31, 2021, the related statements of operations, changes in net assets, and the financial highlights for the year then ended, and the related notes. In our opinion, the financial statements and financial highlights present fairly, in all material respects, the financial position of the Fund as of December 31, 2021, and the results of its operations, changes in its net assets, and the financial highlights for the year then ended in conformity with accounting principles generally accepted in the United States of America. The statement of changes in net assets for the year ended December 31, 2020, and the financial highlights for the years ended December 31, 2020, 2019, 2018, and 2017 were audited by other auditors whose report, dated February 18, 2021, expressed an unqualified opinion on that financial statement and those financial highlights.
Basis for Opinion
These financial statements and financial highlights are the responsibility of the Fund's management. Our responsibility is to express an opinion on the Fund's financial statements and financial highlights based on our audit. We are a public accounting firm registered with the Public Company Accounting Oversight Board (United States) (PCAOB) and are required to be independent with respect to the Fund in accordance with the U.S. federal securities laws and the applicable rules and regulations of the Securities and Exchange Commission and the PCAOB.
We conducted our audit in accordance with the standards of the PCAOB. Those standards require that we plan and perform the audit to obtain reasonable assurance about whether the financial statements and financial highlights are free of material misstatement, whether due to error or fraud. The Fund is not required to have, nor were we engaged to perform, an audit of its internal control over financial reporting. As part of our audit, we are required to obtain an understanding of internal control over financial reporting but not for the purpose of expressing an opinion on the effectiveness of the Fund’s internal control over financial reporting. Accordingly, we express no such opinion.
Our audit included performing procedures to assess the risks of material misstatement of the financial statements and financial highlights, whether due to error or fraud, and performing procedures that respond to those risks. Such procedures included examining, on a test basis, evidence regarding the amounts and disclosures in the financial statements and financial highlights. Our audit also included evaluating the accounting principles used and significant estimates made by management, as well as evaluating the overall presentation of the financial statements and financial highlights. Our procedures included confirmation of securities owned as of December 31, 2021, by correspondence with the custodian and brokers; when replies were not received from brokers, we performed other auditing procedures. We believe that our audit provides a reasonable basis for our opinion.
/s/ Deloitte & Touche LLP
Boston, Massachusetts
February 18, 2022
We have served as the auditor of one or more Calvert investment companies since 2021.
Calvert
VP S&P MidCap 400 Index Portfolio
December 31, 2021
Federal Tax Information (Unaudited)
As required by the Internal Revenue Code and/or regulations, shareholders must be notified regarding the status of the dividends received deduction for corporations and capital gains dividends.
Dividends Received Deduction. Corporate shareholders are generally entitled to take the dividends received deduction on the portion of the Fund's dividend distribution that qualifies under tax law. For the Fund's fiscal 2021 ordinary income dividends, 51.39% qualifies for the corporate dividends received deduction.
Capital Gains Dividends. The Fund hereby designates as a capital gain dividend with respect to the taxable year ended December 31, 2021, $50,672,954 or, if subsequently determined to be different, the net capital gain of such year.
Calvert
VP S&P MidCap 400 Index Portfolio
December 31, 2021
Management and Organization
Fund Management. The Directors of Calvert Variable Products, Inc. (the Corporation) are responsible for the overall management and supervision of the affairs of the Corporation. The Board members and officers of the Corporation are listed below. Except as indicated, each individual has held the office shown or other offices in the same company for the last five years. Board members hold indefinite terms of office. Each Board member holds office until his or her successor is elected and qualified, or until his or her earlier death, resignation, retirement, removal or disqualification. Under the terms of the Fund’s current Board member retirement policy, an Independent Board member must retire at the end of the calendar year in which he or she turns 75. However, if such retirement would cause the Fund to be out of compliance with Section 16 of the 1940 Act or any other regulations or guidance of the SEC, then such retirement will not become effective until such time as action has been taken for the Fund to be in compliance therewith. The “noninterested Directors” consist of those Directors who are not “interested persons” of the Corporation, as that term is defined under the 1940 Act. The business address of each Board member and the Chief Compliance Officer is 1825 Connecticut Avenue, NW, Suite 400, Washington, DC 20009 and the business address of the Secretary, Vice President and Chief Legal Officer and the Treasurer is Two International Place, Boston, Massachusetts 02110. As used below, “CRM” refers to Calvert Research and Management and “Eaton Vance” refers to Eaton Vance Management. Each Director oversees 39 funds in the Calvert fund complex. Effective March 1, 2021, each of Eaton Vance and CRM are indirect, wholly-owned subsidiaries of Morgan Stanley. Each officer affiliated with CRM may hold a position with other CRM affiliates that is comparable to his or her position with CRM listed below.
| Name and Year of Birth | Corporation
Position(s) | Length of
Service | Principal Occupation(s) and Other Directorships
During Past Five Years and Other Relevant Experience |
| Interested Director |
John H. Streur(1)
1960 | Director and
President | Since 2015 | President and Chief Executive Officer of CRM (since December 31, 2016). President and Chief Executive Officer of Calvert Investments, Inc.
(January 2015 - December 2016); Chief Executive Officer of Calvert
Investment Distributors, Inc. (August 2015 - December 2016); Chief
Compliance Officer of Calvert Investment Management, Inc. (August 2015 -
April 2016); President and Director, Portfolio 21 Investments, Inc.
(through October 2014); President, Chief Executive Officer and
Director, Managers Investment Group LLC (through January 2012);
President and Director, The Managers Funds and Managers AMG
Funds (through January 2012).
Other Directorships. Portfolio 21 Investments, Inc. (asset management)
(through October 2014); Managers Investment Group LLC (asset management)
(through January 2012); The Managers Funds (asset management)
(through January 2012); Managers AMG Funds (asset management)
(through January 2012); Calvert Impact Capital, Inc. |
| Noninterested Directors |
Richard L. Baird, Jr.
1948 | Director | Since 2016 | Regional Disaster Recovery Lead, American Red Cross of Greater
Pennsylvania (since 2017). Volunteer, American Red Cross (since 2015).
Former President and CEO of Adagio Health Inc. (retired in 2014) in
Pittsburgh, PA.
Other Directorships. None. |
Alice Gresham Bullock
1950 | Chair and
Director | Since 2016 (Chair);
Since 2008 (Director) | Professor Emerita at Howard University School of Law. Dean Emerita of
Howard University School of Law and Deputy Director of the Association
of American Law Schools (1992-1994).
Other Directorships. None. |
Cari M. Dominguez
1949 | Director | Since 2016 | Former Chair of the U.S. Equal Employment Opportunity Commission.
Other Directorships. ManpowerGroup Inc. (workforce solutions company);
Triple S Management Corporation (managed care); National Association of Corporate Directors. |
John G. Guffey, Jr.
1948 | Director | Since 2016 | President of Aurora Press Inc., a privately held publisher of trade
paperbacks (since January 1997).
Other Directorships. Calvert Impact Capital, Inc. (through
December 31, 2018); Calvert Ventures, LLC. |
Miles D. Harper, III
1962 | Director | Since 2016 | Partner, Carr Riggs & Ingram (public accounting firm) since October 2014.
Partner, Gainer Donnelly & Desroches (public accounting firm) (now Carr
Riggs & Ingram) (November 1999 - September 2014).
Other Directorships. Bridgeway Funds (9) (asset management). |
Joy V. Jones
1950 | Director | Since 2016 | Attorney.
Other Directorships. Palm Management Corporation. |
Calvert
VP S&P MidCap 400 Index Portfolio
December 31, 2021
Management and Organization — continued
| Name and Year of Birth | Corporation
Position(s) | Length of
Service | Principal Occupation(s) and Other Directorships
During Past Five Years and Other Relevant Experience |
| Noninterested Directors (continued) |
Anthony A. Williams
1951 | Director | Since 2016 | CEO and Executive Director of the Federal City Council (July 2012 to
present); Senior Adviser and Independent Consultant for King and
Spalding LLP (September 2015 to present); Executive Director of Global
Government Practice at the Corporate Executive Board (January 2010 to
January 2012).
Other Directorships. Freddie Mac; Evoq Properties/Meruelo Maddux
Properties, Inc. (real estate management); Weston Solutions, Inc.
(environmental services); Bipartisan Policy Center’s Debt Reduction Task Force;
Chesapeake Bay Foundation; Catholic University of America; Urban Institute (research organization); The Howard Hughes Corporation (real estate development). |
| Name and Year of Birth | Corporation
Position(s) | Length of
Service | Principal Occupation(s)
During Past Five Years |
| Principal Officers who are not Directors |
Hope L. Brown
1973 | Chief
Compliance
Officer | Since 2014 | Chief Compliance Officer of 39 registered investment companies advised
by CRM (since 2014). Vice President and Chief Compliance Officer,
Wilmington Funds (2012-2014). |
Deidre E. Walsh
1971 | Secretary,
Vice President
and Chief
Legal Officer | Since 2021 | Vice President of CRM and officer of 39 registered investment companies
advised by CRM (since 2021). Also Vice President of Eaton Vance and
certain of its affiliates and officer of 138 registered investment companies
advised or administered by Eaton Vance. |
James F. Kirchner
1967 | Treasurer | Since 2016 | Vice President of CRM and officer of 39 registered investment companies
advised by CRM (since 2016). Also Vice President of Eaton Vance and
certain of its affiliates and officer of 138 registered investment companies
advised or administered by Eaton Vance. |
| | | | |
| (1) Mr. Streur is an interested person of the Fund because of his positions with the Fund’s adviser and certain affiliates. |
The SAI for the Fund includes additional information about the Directors and officers of the Fund and can be obtained without charge on Calvert’s website at www.calvert.com or by calling 1-800-368-2745.
| FACTS | WHAT DOES EATON VANCE DO WITH YOUR
PERSONAL INFORMATION? |
| Why? | Financial companies choose how they share your personal information. Federal law gives consumers the right to limit some but not all sharing. Federal law also requires us to tell you how we collect, share, and protect your personal information. Please read this notice carefully to understand what we do. |
| |
| What? | The types of personal information we collect and share depend on the product or service you have with us. This information can include:■ Social Security number and income
■
investment experience and risk tolerance
■
checking account number and wire transfer instructions |
| |
| How? | All financial companies need to share customers’ personal information to run their everyday business. In the section below, we list the reasons financial companies can share their customers’ personal information; the reasons Eaton Vance chooses to share; and whether you can limit this sharing. |
Reasons we can share your
personal information | Does Eaton Vance
share? | Can you limit
this sharing? |
| For our everyday business purposes — such as to process your transactions, maintain your account(s), respond to court orders and legal investigations, or report to credit bureaus | Yes | No |
| For our marketing purposes — to offer our products and services to you | Yes | No |
| For joint marketing with other financial companies | No | We don’t share |
| For our investment management affiliates’ everyday business purposes — information about your transactions, experiences, and creditworthiness | Yes | Yes |
| For our affiliates’ everyday business purposes — information about your transactions and experiences | Yes | No |
| For our affiliates’ everyday business purposes — information about your creditworthiness | No | We don’t share |
| For our investment management affiliates to market to you | Yes | Yes |
| For our affiliates to market to you | No | We don’t share |
| For nonaffiliates to market to you | No | We don’t share |
To limit our
sharing | Call toll-free 1-800-368-2745 or email: CRMPrivacy@calvert.comPlease note:If you are a new customer, we can begin sharing your information 30 days from the date we sent this notice. When you are no longer our customer, we continue to share your information as described in this notice. However, you can contact us at any time to limit our sharing. |
| Questions? | Call toll-free 1-800-368-2745 or email: CRMPrivacy@calvert.com |
| Privacy Notice — continued | April 2021 |
| Who we are |
| Who is providing this notice? | Eaton Vance Management, Eaton Vance Distributors, Inc., Eaton Vance Trust Company, Eaton Vance Management (International) Limited, Eaton Vance Advisers International Ltd., Eaton Vance Global Advisors Limited, Eaton Vance Management’s Real Estate Investment Group, Boston Management and Research, Calvert Research and Management, Eaton Vance and Calvert Fund Families and our investment advisory affiliates (“Eaton Vance”) (see Investment Management Affiliates definition below) |
| What we do |
How does Eaton Vance
protect my personal
information? | To protect your personal information from unauthorized access and use, we use security measures that comply with federal law. These measures include computer safeguards and secured files and buildings. We have policies governing the proper handling of customer information by personnel and requiring third parties that provide support to adhere to appropriate security standards with respect to such information. |
How does Eaton Vance
collect my personal
information? | We collect your personal information, for example, when you■ open an account or make deposits or withdrawals from your account
■
buy securities from us or make a wire transfer
■
give us your contact informationWe also collect your personal information from others, such as credit bureaus, affiliates, or other companies. |
| Why can’t I limit all sharing? | Federal law gives you the right to limit only■ sharing for affiliates’ everyday business purposes — information about your creditworthiness
■
affiliates from using your information to market to you
■
sharing for nonaffiliates to market to youState laws and individual companies may give you additional rights to limit sharing. See below for more on your rights under state law. |
| Definitions |
Investment Management
Affiliates | Eaton Vance Investment Management Affiliates include registered investment advisers, registered broker- dealers, and registered and unregistered funds. Investment Management Affiliates does not include entities associated with Morgan Stanley Wealth Management, such as Morgan Stanley Smith Barney LLC and Morgan Stanley & Co. |
| Affiliates | Companies related by common ownership or control. They can be financial and nonfinancial companies.■ Our affiliates include companies with a Morgan Stanley name and financial companies such as Morgan Stanley Smith Barney LLC and Morgan Stanley & Co. |
| Nonaffiliates | Companies not related by common ownership or control. They can be financial and nonfinancial companies.■ Eaton Vance does not share with nonaffiliates so they can market to you. |
| Joint marketing | A formal agreement between nonaffiliated financial companies that together market financial products or services to you.■ Eaton Vance doesn’t jointly market. |
| Other important information |
| Vermont: Except as permitted by law, we will not share personal information we collect about Vermont residents with Nonaffiliates unless you provide us with your written consent to share such information.California: Except as permitted by law, we will not share personal information we collect about California residents with Nonaffiliates and we will limit sharing such personal information with our Affiliates to comply with California privacy laws that apply to us. |
Delivery of Shareholder Documents. The Securities and Exchange Commission (SEC) permits funds to deliver only one copy of shareholder documents, including prospectuses, proxy statements and shareholder reports, to fund investors with multiple accounts at the same residential or post office box address. This practice is often called “householding” and it helps eliminate duplicate mailings to shareholders. Calvert funds, or your financial intermediary, may household the mailing of your documents indefinitely unless you instruct Calvert funds, or your financial intermediary, otherwise. If you would prefer that your Calvert fund documents not be householded, please contact Calvert funds at 1-800-368-2745, or contact your financial intermediary. Your instructions that householding not apply to delivery of your Calvert fund documents will typically be effective within 30 days of receipt by Calvert funds or your financial intermediary. Separate statements will be generated for each separate account and will be householded as described above.
Portfolio Holdings. Each Calvert fund files a schedule of portfolio holdings on Part F to Form N-PORT with the SEC. Certain information filed on Form N-PORT may be viewed on the Calvert website at www.calvert.com, by calling Calvert at 1-800-368-2745 or in the EDGAR database on the SEC’s website at www.sec.gov.
Proxy Voting. The Proxy Voting Guidelines that each Calvert fund uses to determine how to vote proxies relating to portfolio securities is provided as an Appendix to the fund’s Statement of Additional Information. The Statement of Additional Information can be obtained free of charge by calling the Calvert funds at 1-800-368-2745, by visiting the Calvert funds’ website at www.calvert.com or visiting the SEC’s website at www.sec.gov. Information regarding how a Calvert fund voted proxies relating to portfolio securities during the most recent 12-month period ended June 30 is available by calling Calvert funds, by visiting the Calvert funds’ website at www.calvert.com or by visiting the SEC’s website at www.sec.gov.
This Page Intentionally Left Blank
This Page Intentionally Left Blank
This Page Intentionally Left Blank
Investment Adviser and Administrator
Calvert Research and Management
1825 Connecticut Avenue NW, Suite 400
Washington, DC 20009
Investment Sub-Adviser
Ameritas Investment Partners, Inc.
5945 R Street
Lincoln, NE 68505
Principal Underwriter*
Eaton Vance Distributors, Inc.
Two International Place
Boston, MA 02110
(617) 482-8260
Custodian
State Street Bank and Trust Company
State Street Financial Center, One Lincoln Street
Boston, MA 02111
Transfer Agent
DST Asset Manager Solutions, Inc.
2000 Crown Colony Drive
Quincy, MA 02169
Independent Registered Public Accounting Firm
Deloitte & Touche LLP
200 Berkeley Street
Boston, MA 02116-5022
Fund Offices
1825 Connecticut Avenue NW, Suite 400
Washington, DC 20009
* FINRA BrokerCheck. Investors may check the background of their Investment Professional by contacting the Financial Industry Regulatory Authority (FINRA). FINRA BrokerCheck is a free tool to help investors check the professional background of current and former FINRA-registered securities firms and brokers. FINRA BrokerCheck is available by calling 1-800-289-9999 and at www.FINRA.org. The FINRA BrokerCheck brochure describing this program is available to investors at www.FINRA.org.
Printed on recycled paper.
24223 12.31.21
Calvert
VP Russell 2000® Small Cap Index Portfolio
Annual Report
December 31, 2021
Commodity Futures Trading Commission Registration. The Commodity Futures Trading Commission (“CFTC”) has adopted regulations that subject registered investment companies and advisers to regulation by the CFTC if a fund invests more than a prescribed level of its assets in certain CFTC-regulated instruments (including futures, certain options and swap agreements) or markets itself as providing investment exposure to such instruments. The adviser has claimed an exclusion from the definition of “commodity pool operator” under the Commodity Exchange Act with respect to its management of the Fund and the other funds it manages. Accordingly, neither the Fund nor the adviser is subject to CFTC regulation.
Fund shares are not insured by the FDIC and are not deposits or other obligations of, or guaranteed by, any depository institution. Shares are subject to investment risks, including possible loss of principal invested.
This report must be preceded or accompanied by a current summary prospectus or prospectus. Before investing, investors should consider carefully the investment objective, risks, and charges and expenses of a mutual fund. This and other important information is contained in the summary prospectus and prospectus, which can be obtained from a financial intermediary. Prospective investors should read the prospectus carefully before investing. For further information, please call 1-800-368-2745.
Annual Report December 31, 2021
Calvert
VP Russell 2000® Small Cap Index Portfolio
Calvert
VP Russell 2000® Small Cap Index Portfolio
December 31, 2021
Management's Discussion of Fund Performance†
Economic and Market Conditions
The 12-month period starting January 1, 2021, was notable for a U.S. equity rally that lasted for most of the period and resulted in U.S. stocks outperforming most other stock markets in developed economies. Except for temporary retreats in September and November, broad-market indexes generally posted strong returns during the period. Investors cheered the reopening of businesses that had been affected by the pandemic and the rollout of several highly effective COVID-19 vaccines.
COVID-19, however, continued to have a firm grip on the U.S. economy. Disease rates advanced and declined with second, third, and fourth waves of infections. Worker shortages led to global supply-chain disruptions. From computer chips to shipping containers, scarcities of key items led to temporary factory shutdowns and empty store shelves. Those shortages — combined with high demand from consumers eager to spend money saved earlier in the pandemic — led to higher year-over-year inflation than the U.S. had seen in decades.
Still, investor optimism about a recovering economy drove stock prices up during most of the period. A significant pullback, however, occurred in September 2021 when virtually every major U.S. stock index reported negative returns. Unexpectedly weak job creation in August and the U.S. Federal Reserve’s (the Fed’s) announcement that it might soon begin tapering its monthly bond purchases — which had stimulated the economy earlier — combined to drive stocks into negative territory. Rising COVID-19 infections also weighed on equity performance in September.
In the final quarter of 2021, however, stock prices came roaring back. Even the late-November news of a new and more transmissible COVID-19 variant — Omicron — caused only a temporary market retreat. The Fed’s actions to tamp down inflation were applauded by investors, with stocks gaining ground after the central bank announced that tapering would be accelerated and that three possible interest rate hikes were forecast for 2022. Just two trading days before year-end, the S&P 500® Index closed at its 70th new all-time high for the period, and the Dow Jones Industrial Average® (DJIA) closed at an all-time high as well.
For the period as a whole, the broad-market S&P 500® Index returned 28.71%; the blue-chip DJIA was up 20.95%; and the technology-laden Nasdaq Composite Index rose 22.18%. Large-cap U.S. stocks, as measured by the Russell 1000® Index, outperformed their small-cap counterparts, as measured by the Russell 2000® Index. In the large-cap space, growth stocks modestly outperformed value stocks, but in the small-cap space, value stocks strongly outperformed growth stocks during the period.
Investment Strategy
As an index fund, Calvert VP Russell 2000® Small Cap Index Portfolio (the Fund) seeks to replicate as closely as possible the holdings and match the performance of the Russell 2000® Index (the Index). To accomplish this, the Fund employs a passive management approach and holds each constituent of the Index in approximately the same proportion as the Index. The Fund may also invest in exchange-traded funds (ETFs) that provide the same exposure to the Index. Cash holdings may gain exposure to the Index via futures contracts, allowing the Fund’s assets to be fully invested.
Fund Performance
For the 12-month period ended December 31, 2021, the Fund returned 14.53% for Class I shares at net asset value (NAV). By comparison, its benchmark, the Index, returned 14.82% during the period.
The Index is unmanaged and returns do not reflect any fees, or operating expenses.
During the period, small-cap stocks underperformed both mid-cap stocks and large-cap stocks within the Russell family of indexes.
Most market sectors within the Index had positive, double-digit returns during the period. They were led by the energy sector, which returned nearly 68%; real estate, which returned almost 30%; and financials, which returned nearly 28%. The consumer discretionary and industrials sectors also performed strongly during the period. Health care was the weakest-performing sector, declining almost 17%.
The health care sector had the largest weight within the Index during the period, followed by financials and industrials. The utilities and communication services sectors had the smallest weights within the Index during the period.
Futures contracts, which are regularly used to manage uninvested cash holdings in the Fund, had a meaningful positive impact on performance during the period.
See Endnotes and Additional Disclosures in this report.
Past performance is no guarantee of future results. Returns are historical and are calculated by determining the percentage change in net asset value (NAV) or offering price (as applicable) with all distributions reinvested. Investment return and principal value will fluctuate so that shares, when redeemed, may be worth more or less than their original cost. Performance for periods less than or equal to one year is cumulative. Performance is for the stated time period only; due to market volatility, current Fund performance may be lower or higher than the quoted return.
Calvert
VP Russell 2000® Small Cap Index Portfolio
December 31, 2021
Performance
Portfolio Manager(s) Kevin L. Keene, CFA of Ameritas Investment Partners, Inc.
| % Average Annual Total Returns1,2 | Class
Inception Date | Performance
Inception Date | One Year | Five Years | Ten Years |
| Class I at NAV | 04/27/2000 | 04/27/2000 | 14.53% | 11.71% | 12.70% |
| Class F at NAV | 10/04/2005 | 04/27/2000 | 14.30 | 11.46 | 12.45 |
|
| Russell 2000® Index | — | — | 14.82% | 12.01% | 13.22% |
| % Total Annual Operating Expense Ratios3 | Class I | Class F |
| Gross | 0.59% | 0.79% |
| Net | 0.39 | 0.59 |
Growth of $10,000
This graph shows the change in value of a hypothetical investment of $10,000 in Class I of the Fund for the period indicated. For comparison, the same investment is shown in the indicated index.
| Growth of Investment | Amount Invested | Period Beginning | At NAV | With Maximum Sales Charge |
| Class F | $10,000 | 12/31/2011 | $32,364 | N.A. |
See Endnotes and Additional Disclosures in this report.
Past performance is no guarantee of future results. Returns are historical and are calculated by determining the percentage change in net asset value (NAV) or offering price (as applicable) with all distributions reinvested. Investment return and principal value will fluctuate so that shares, when redeemed, may be worth more or less than their original cost. Performance for periods less than or equal to one year is cumulative. Performance is for the stated time period only; due to market volatility, current Fund performance may be lower or higher than the quoted return.
Calvert
VP Russell 2000® Small Cap Index Portfolio
December 31, 2021
Sector Allocation (% of net assets)*
* Excludes cash and cash equivalents.
| Top 10 Holdings (% of net assets)* | |
| iShares Russell 2000 ETF | 1.3% |
| AMC Entertainment Holdings, Inc., Class A | 0.4 |
| Synaptics, Inc. | 0.4 |
| Lattice Semiconductor Corp. | 0.3 |
| BJ's Wholesale Club Holdings, Inc. | 0.3 |
| Tetra Tech, Inc. | 0.3 |
| EastGroup Properties, Inc. | 0.3 |
| Saia, Inc. | 0.3 |
| Ovintiv, Inc. | 0.3 |
| Tenet Healthcare Corp. | 0.3 |
| Total | 4.2% |
| * | Excludes cash and cash equivalents. |
Calvert
VP Russell 2000® Small Cap Index Portfolio
December 31, 2021
Endnotes and Additional Disclosures
| † | The views expressed in this report are those of the portfolio manager(s) and are current only through the date stated at the top of this page. These views are subject to change at any time based upon market or other conditions, and Calvert and the Fund(s) disclaim any responsibility to update such views. These views may not be relied upon as investment advice and, because investment decisions are based on many factors, may not be relied upon as an indication of trading intent on behalf of any Calvert fund. This commentary may contain statements that are not historical facts, referred to as “forward-looking statements.” The Fund’s actual future results may differ significantly from those stated in any forward-looking statement, depending on factors such as changes in securities or financial markets or general economic conditions, the volume of sales and purchases of Fund shares, the continuation of investment advisory, administrative and service contracts, and other risks discussed from time to time in the Fund’s filings with the Securities and Exchange Commission. |
| | |
| 1 | Russell 2000® Index is an unmanaged index of 2,000 U.S. small-cap stocks. Unless otherwise stated, index returns do not reflect the effect of any applicable sales charges, commissions, expenses, taxes or leverage, as applicable. It is not possible to invest directly in an index. |
| 2 | There is no sales charge. Insurance-related charges are not included in the calculation of returns. If such charges were reflected, the returns would be lower. Please refer to the report for your insurance contract for performance data reflecting insurance-related charges.Calvert Research and Management became the investment adviser to the Fund on December 31, 2016. Performance reflected prior to such date is that of the Fund’s former investment adviser. |
| 3 | Source: Fund prospectus. Net expense ratios reflect a contractual expense reimbursement that continues through 4/30/22. The expense ratios for the current reporting period can be found in the Financial Highlights section of this report. Performance reflects expenses waived and/or reimbursed, if applicable. Without such waivers and/or reimbursements, performance would have been lower. |
| | Additional Information |
| | S&P 500® Index is an unmanaged index of large-cap stocks commonly used as a measure of U.S. stock market performance. Dow Jones Industrial Average® is a price-weighted average of 30 blue-chip stocks that are generally the leaders in their industry. S&P Dow Jones Indices are a product of S&P Dow Jones Indices LLC (“S&P DJI”) and have been licensed for use. S&P® and S&P 500® are registered trademarks of S&P DJI; Dow Jones® is a registered trademark of Dow Jones Trademark Holdings LLC (“Dow Jones”); S&P DJI, Dow Jones and their respective affiliates do not sponsor, endorse, sell or promote the Fund, will not have any liability with respect thereto and do not have any liability for any errors, omissions, or interruptions of the S&P Dow Jones Indices. Nasdaq Composite Index is a market capitalization-weighted index of all domestic and international securities listed on Nasdaq. Source: Nasdaq, Inc. The information is provided by Nasdaq (with its affiliates, are referred to as the “Corporations”) and Nasdaq’s third party licensors on an “as is” basis and the Corporations make no guarantees and bear no liability of any kind with respect to the information or the Fund. Russell 1000® Index is an unmanaged index of 1,000 U.S. large- cap stocks. |
Calvert
VP Russell 2000® Small Cap Index Portfolio
December 31, 2021
Example
As a Fund shareholder, you incur ongoing costs, including management fees; distribution and/or service fees; and other Fund expenses. This Example is intended to help you understand your ongoing costs (in dollars) of Fund investing and to compare these costs with the ongoing costs of investing in other mutual funds. The Example is based on an investment of $1,000 invested at the beginning of the period and held for the entire period (July 1, 2021 to December 31, 2021).
Actual Expenses
The first section of the table below provides information about actual account values and actual expenses. You may use the information in this section, together with the amount you invested, to estimate the expenses that you paid over the period. Simply divide your account value by $1,000 (for example, an $8,600 account value divided by $1,000 = 8.6), then multiply the result by the number in the first section under the heading entitled “Expenses Paid During Period” to estimate the expenses you paid on your account during this period.
Hypothetical Example for Comparison Purposes
The second section of the table below provides information about hypothetical account values and hypothetical expenses based on the actual Fund expense ratio and an assumed rate of return of 5% per year (before expenses), which is not the actual Fund return. The hypothetical account values and expenses may not be used to estimate the actual ending account balance or expenses you paid for the period. You may use this information to compare the ongoing costs of investing in the Fund and other funds. To do so, compare this 5% hypothetical example with the 5% hypothetical examples that appear in the shareholder reports of the other funds.
Please note that the expenses shown in the table are meant to highlight your ongoing costs only and do not reflect expenses and charges which are, or may be imposed under the variable annuity contract or variable life insurance policy (variable contracts) (if applicable) or qualified pension or retirement plans (Qualified Plans) through which your investment in the Fund is made. Therefore, the second section of the table is useful in comparing ongoing costs associated with an investment in vehicles which fund benefits under variable contracts and Qualified Plans, and will not help you determine the relative total costs of investing in the Fund through variable contracts or Qualified Plans. In addition, if these expenses and charges imposed under the variable contracts or Qualified Plans were included, your costs would have been higher.
| | Beginning
Account Value
(7/1/21) | Ending
Account Value
(12/31/21) | Expenses Paid
During Period*
(7/1/21 – 12/31/21) | Annualized
Expense
Ratio |
| Actual | | | | |
| Class I | $1,000.00 | $ 975.90 | $1.94 ** | 0.39% |
| Class F | $1,000.00 | $ 975.00 | $2.94 ** | 0.59% |
| Hypothetical | | | | |
| (5% return per year before expenses) | | | | |
| Class I | $1,000.00 | $1,023.24 | $1.99 ** | 0.39% |
| Class F | $1,000.00 | $1,022.23 | $3.01 ** | 0.59% |
| * | Expenses are equal to the Fund's annualized expense ratio for the indicated Class, multiplied by the average account value over the period, multiplied by 184/365 (to reflect the one-half year period). The Example assumes that the $1,000 was invested at the net asset value per share determined at the close of business on June 30, 2021. Expenses shown do not include insurance-related charges or direct expenses of Qualified Plans. |
| ** | Absent a waiver and/or reimbursement of expenses by an affiliate, expenses would be higher. |
Calvert
VP Russell 2000® Small Cap Index Portfolio
December 31, 2021
| Security | Shares | Value |
| Aerospace & Defense — 0.6% | |
| AAR Corp.(1) | | 2,667 | $ 104,093 |
| Aerojet Rocketdyne Holdings, Inc. | | 5,740 | 268,402 |
| AeroVironment, Inc.(1) | | 1,761 | 109,235 |
| AerSale Corp.(1) | | 709 | 12,578 |
| Astronics Corp.(1) | | 2,153 | 25,836 |
| Byrna Technologies, Inc.(1) | | 1,414 | 18,877 |
| Cadre Holdings, Inc. | | 491 | 12,481 |
| Ducommun, Inc.(1) | | 914 | 42,748 |
| Kaman Corp. | | 2,245 | 96,872 |
| Kratos Defense & Security Solutions, Inc.(1) | | 9,405 | 182,457 |
| Maxar Technologies, Inc. | | 5,624 | 166,077 |
| Moog, Inc., Class A | | 2,219 | 179,672 |
| National Presto Industries, Inc. | | 420 | 34,452 |
| PAE, Inc.(1) | | 5,218 | 51,815 |
| Park Aerospace Corp. | | 1,804 | 23,813 |
| Parsons Corp.(1) | | 1,992 | 67,031 |
| Triumph Group, Inc.(1) | | 4,884 | 90,500 |
| Vectrus, Inc.(1) | | 987 | 45,175 |
| | | | $ 1,532,114 |
| Air Freight & Logistics — 0.3% | |
| Air Transport Services Group, Inc.(1) | | 4,525 | $ 132,944 |
| Atlas Air Worldwide Holdings, Inc.(1) | | 2,258 | 212,523 |
| Forward Air Corp. | | 2,084 | 252,352 |
| Hub Group, Inc., Class A(1) | | 2,559 | 215,570 |
| Radiant Logistics, Inc.(1) | | 3,434 | 25,034 |
| | | | $ 838,423 |
| Airlines — 0.3% | |
| Allegiant Travel Co.(1) | | 1,188 | $ 222,204 |
| Frontier Group Holdings, Inc.(1) | | 2,730 | 37,046 |
| Hawaiian Holdings, Inc.(1) | | 3,989 | 73,278 |
| Mesa Air Group, Inc.(1) | | 2,494 | 13,966 |
| SkyWest, Inc.(1) | | 3,905 | 153,466 |
| Spirit Airlines, Inc.(1) | | 7,711 | 168,485 |
| Sun Country Airlines Holdings, Inc.(1) | | 2,490 | 67,853 |
| | | | $ 736,298 |
| Auto Components — 1.3% | |
| Adient PLC(1) | | 7,428 | $ 355,653 |
| American Axle & Manufacturing Holdings, Inc.(1) | | 8,845 | 82,524 |
| Cooper-Standard Holdings, Inc.(1) | | 1,470 | 32,943 |
| Dana, Inc. | | 11,400 | 260,148 |
| Dorman Products, Inc.(1) | | 2,051 | 231,783 |
| Fox Factory Holding Corp.(1) | | 3,304 | 562,010 |
| Security | Shares | Value |
| Auto Components (continued) | |
| Gentherm, Inc.(1) | | 2,608 | $ 226,635 |
| Goodyear Tire & Rubber Co. (The)(1) | | 21,674 | 462,090 |
| LCI Industries | | 1,944 | 303,011 |
| Modine Manufacturing Co.(1) | | 4,047 | 40,834 |
| Motorcar Parts of America, Inc.(1) | | 1,400 | 23,898 |
| Patrick Industries, Inc. | | 1,816 | 146,533 |
| Standard Motor Products, Inc. | | 1,640 | 85,919 |
| Stoneridge, Inc.(1) | | 2,174 | 42,915 |
| Tenneco, Inc., Class A(1) | | 5,542 | 62,625 |
| Visteon Corp.(1) | | 2,177 | 241,952 |
| XL Fleet Corp.(1) | | 3,007 | 9,953 |
| XPEL, Inc.(1) | | 1,474 | 100,645 |
| | | | $ 3,272,071 |
| Automobiles — 0.2% | |
| Arcimoto, Inc.(1) | | 2,147 | $ 16,704 |
| Canoo, Inc.(1)(2) | | 8,156 | 62,964 |
| Fisker, Inc.(1) | | 12,446 | 195,775 |
| Lordstown Motors Corp., Class A(1) | | 11,997 | 41,390 |
| Winnebago Industries, Inc. | | 2,534 | 189,847 |
| Workhorse Group, Inc.(1) | | 9,691 | 42,253 |
| | | | $ 548,933 |
| Banks — 8.1% | |
| 1st Source Corp. | | 1,262 | $ 62,595 |
| Allegiance Bancshares, Inc. | | 1,683 | 71,039 |
| Amalgamated Financial Corp. | | 1,217 | 20,409 |
| Amerant Bancorp, Inc. | | 2,132 | 73,661 |
| American National Bankshares, Inc. | | 942 | 35,495 |
| Ameris Bancorp | | 5,215 | 259,081 |
| Arrow Financial Corp. | | 1,193 | 42,029 |
| Associated Banc-Corp. | | 11,494 | 259,650 |
| Atlantic Capital Bancshares, Inc.(1) | | 1,521 | 43,759 |
| Atlantic Union Bankshares Corp. | | 5,882 | 219,340 |
| Banc of California, Inc. | | 4,366 | 85,661 |
| BancFirst Corp. | | 1,347 | 95,044 |
| Bancorp, Inc. (The)(1) | | 4,094 | 103,619 |
| Bank First Corp. | | 510 | 36,842 |
| Bank of Marin Bancorp | | 1,090 | 40,581 |
| Bank of NT Butterfield & Son, Ltd. (The) | | 4,076 | 155,336 |
| BankUnited, Inc. | | 6,880 | 291,093 |
| Banner Corp. | | 2,719 | 164,962 |
| Bar Harbor Bankshares | | 1,146 | 33,154 |
| Berkshire Hills Bancorp, Inc. | | 3,744 | 106,442 |
| Blue Ridge Bankshares, Inc. | | 1,360 | 24,344 |
| Brookline Bancorp, Inc. | | 6,307 | 102,110 |
7
See Notes to Financial Statements.
Calvert
VP Russell 2000® Small Cap Index Portfolio
December 31, 2021
Schedule of Investments — continued
| Security | Shares | Value |
| Banks (continued) | |
| Bryn Mawr Bank Corp. | | 1,617 | $ 72,781 |
| Business First Bancshares, Inc. | | 1,656 | 46,881 |
| Byline Bancorp, Inc. | | 1,998 | 54,645 |
| Cadence Bank | | 14,717 | 438,419 |
| Cambridge Bancorp | | 500 | 46,795 |
| Camden National Corp. | | 1,318 | 63,475 |
| Capital Bancorp, Inc. | | 525 | 13,755 |
| Capital City Bank Group, Inc. | | 1,232 | 32,525 |
| Capstar Financial Holdings, Inc. | | 1,274 | 26,792 |
| Carter Bankshares, Inc.(1) | | 1,998 | 30,749 |
| Cathay General Bancorp | | 5,753 | 247,322 |
| CBTX, Inc. | | 1,510 | 43,790 |
| Central Pacific Financial Corp. | | 2,337 | 65,833 |
| CIT Group, Inc. | | 7,786 | 399,733 |
| Citizens & Northern Corp. | | 1,125 | 29,385 |
| City Holding Co. | | 1,154 | 94,386 |
| Civista Bancshares, Inc. | | 1,318 | 32,159 |
| CNB Financial Corp. | | 1,282 | 33,973 |
| Coastal Financial Corp.(1) | | 740 | 37,459 |
| Columbia Banking System, Inc. | | 6,118 | 200,181 |
| Community Bank System, Inc. | | 4,105 | 305,740 |
| Community Trust Bancorp, Inc. | | 1,316 | 57,391 |
| ConnectOne Bancorp, Inc. | | 2,830 | 92,569 |
| CrossFirst Bankshares, Inc.(1) | | 4,100 | 64,001 |
| Customers Bancorp, Inc.(1) | | 2,287 | 149,501 |
| CVB Financial Corp. | | 10,136 | 217,012 |
| Dime Community Bancshares, Inc. | | 2,653 | 93,280 |
| Eagle Bancorp, Inc. | | 2,481 | 144,742 |
| Eastern Bankshares, Inc. | | 13,170 | 265,639 |
| Enterprise Bancorp, Inc. | | 790 | 35,487 |
| Enterprise Financial Services Corp. | | 2,847 | 134,065 |
| Equity Bancshares, Inc., Class A | | 1,296 | 43,973 |
| Farmers National Banc Corp. | | 2,422 | 44,928 |
| FB Financial Corp. | | 2,671 | 117,043 |
| Fidelity D&D Bancorp, Inc. | | 249 | 14,691 |
| Financial Institutions, Inc. | | 1,360 | 43,248 |
| First Bancorp, Inc. (The) | | 691 | 21,697 |
| First Bancorp. | | 2,711 | 123,947 |
| First BanCorp. / Puerto Rico | | 15,759 | 217,159 |
| First Bancshares, Inc. (The) | | 1,589 | 61,367 |
| First Bank / Hamilton | | 1,315 | 19,081 |
| First Busey Corp. | | 3,985 | 108,073 |
| First Commonwealth Financial Corp. | | 7,774 | 125,084 |
| First Community Bankshares, Inc. | | 1,464 | 48,927 |
| First Financial Bancorp | | 7,256 | 176,901 |
| First Financial Bankshares, Inc. | | 10,163 | 516,687 |
| First Financial Corp. / IN | | 891 | 40,353 |
| Security | Shares | Value |
| Banks (continued) | |
| First Foundation, Inc. | | 3,136 | $ 77,961 |
| First Internet Bancorp | | 680 | 31,987 |
| First Interstate BancSystem, Inc., Class A | | 3,139 | 127,663 |
| First Merchants Corp. | | 4,390 | 183,897 |
| First Mid Bancshares, Inc. | | 1,248 | 53,402 |
| First Midwest Bancorp, Inc. | | 8,933 | 182,948 |
| First of Long Island Corp. (The) | | 2,051 | 44,281 |
| Five Star Bancorp | | 963 | 28,890 |
| Flushing Financial Corp. | | 2,270 | 55,161 |
| Fulton Financial Corp. | | 12,466 | 211,922 |
| German American Bancorp, Inc. | | 2,058 | 80,221 |
| Glacier Bancorp, Inc. | | 8,510 | 482,517 |
| Great Southern Bancorp, Inc. | | 796 | 47,163 |
| Great Western Bancorp, Inc. | | 4,345 | 147,556 |
| Guaranty Bancshares, Inc. | | 732 | 27,509 |
| Hancock Whitney Corp. | | 6,785 | 339,386 |
| Hanmi Financial Corp. | | 2,358 | 55,837 |
| HarborOne Bancorp, Inc. | | 3,960 | 58,766 |
| HBT Financial, Inc. | | 782 | 14,647 |
| Heartland Financial USA, Inc. | | 3,161 | 159,978 |
| Heritage Commerce Corp. | | 4,704 | 56,166 |
| Heritage Financial Corp. | | 2,776 | 67,845 |
| Hilltop Holdings, Inc. | | 4,785 | 168,145 |
| Home BancShares, Inc. | | 11,961 | 291,250 |
| HomeStreet, Inc. | | 1,583 | 82,316 |
| HomeTrust Bancshares, Inc. | | 1,190 | 36,866 |
| Hope Bancorp, Inc. | | 9,119 | 134,141 |
| Horizon Bancorp | | 3,678 | 76,686 |
| Howard Bancorp, Inc.(1) | | 1,153 | 25,124 |
| Independent Bank Corp. | | 3,592 | 292,856 |
| Independent Bank Corp. / MI | | 1,901 | 45,377 |
| Independent Bank Group, Inc. | | 2,952 | 212,987 |
| International Bancshares Corp. | | 4,217 | 178,759 |
| Investors Bancorp, Inc. | | 17,941 | 271,806 |
| Lakeland Bancorp, Inc. | | 3,834 | 72,808 |
| Lakeland Financial Corp. | | 1,974 | 158,196 |
| Live Oak Bancshares, Inc. | | 2,492 | 217,527 |
| Macatawa Bank Corp. | | 2,061 | 18,178 |
| Mercantile Bank Corp. | | 1,185 | 41,511 |
| Meta Financial Group, Inc. | | 2,526 | 150,701 |
| Metrocity Bankshares, Inc. | | 1,365 | 37,579 |
| Metropolitan Bank Holding Corp.(1) | | 758 | 80,750 |
| Mid Penn Bancorp, Inc. | | 1,112 | 35,295 |
| Midland States Bancorp, Inc. | | 1,739 | 43,110 |
| MidWestOne Financial Group, Inc. | | 980 | 31,723 |
| MVB Financial Corp. | | 740 | 30,725 |
| National Bank Holdings Corp., Class A | | 2,394 | 105,192 |
8
See Notes to Financial Statements.
Calvert
VP Russell 2000® Small Cap Index Portfolio
December 31, 2021
Schedule of Investments — continued
| Security | Shares | Value |
| Banks (continued) | |
| NBT Bancorp, Inc. | | 3,309 | $ 127,463 |
| Nicolet Bankshares, Inc.(1) | | 962 | 82,492 |
| Northrim BanCorp, Inc. | | 525 | 22,817 |
| OceanFirst Financial Corp. | | 4,703 | 104,407 |
| OFG Bancorp | | 3,897 | 103,504 |
| Old National Bancorp | | 12,960 | 234,835 |
| Old Second Bancorp, Inc. | | 2,274 | 28,630 |
| Origin Bancorp, Inc. | | 1,666 | 71,505 |
| Orrstown Financial Services, Inc. | | 900 | 22,680 |
| Pacific Premier Bancorp, Inc. | | 7,352 | 294,301 |
| Park National Corp. | | 1,166 | 160,104 |
| Peapack-Gladstone Financial Corp. | | 1,387 | 49,100 |
| Peoples Bancorp, Inc. | | 1,946 | 61,902 |
| Peoples Financial Services Corp. | | 676 | 35,618 |
| Preferred Bank / Los Angeles | | 1,081 | 77,605 |
| Primis Financial Corp. | | 1,573 | 23,658 |
| QCR Holdings, Inc. | | 1,290 | 72,240 |
| RBB Bancorp | | 1,147 | 30,051 |
| Red River Bancshares, Inc. | | 422 | 22,577 |
| Reliant Bancorp, Inc. | | 1,251 | 44,411 |
| Renasant Corp. | | 4,333 | 164,437 |
| Republic Bancorp, Inc., Class A | | 737 | 37,469 |
| Republic First Bancorp, Inc.(1) | | 4,071 | 15,144 |
| S&T Bancorp, Inc. | | 3,252 | 102,503 |
| Sandy Spring Bancorp, Inc. | | 3,460 | 166,357 |
| Seacoast Banking Corp. of Florida | | 4,024 | 142,409 |
| ServisFirst Bancshares, Inc. | | 3,828 | 325,150 |
| Sierra Bancorp | | 1,243 | 33,747 |
| Silvergate Capital Corp., Class A(1) | | 2,146 | 318,037 |
| Simmons First National Corp., Class A | | 8,799 | 260,274 |
| SmartFinancial, Inc. | | 1,098 | 30,041 |
| South Plains Financial, Inc. | | 868 | 24,139 |
| Southern First Bancshares, Inc.(1) | | 613 | 38,306 |
| Southside Bancshares, Inc. | | 2,444 | 102,208 |
| SouthState Corp. | | 5,355 | 428,989 |
| Spirit of Texas Bancshares, Inc. | | 1,176 | 33,845 |
| Stock Yards Bancorp, Inc. | | 1,847 | 117,986 |
| Summit Financial Group, Inc. | | 955 | 26,215 |
| Texas Capital Bancshares, Inc.(1) | | 3,977 | 239,614 |
| Third Coast Bancshares, Inc.(1) | | 273 | 7,093 |
| Tompkins Financial Corp. | | 1,120 | 93,610 |
| TowneBank | | 5,446 | 172,039 |
| TriCo Bancshares | | 2,280 | 97,949 |
| TriState Capital Holdings, Inc.(1) | | 2,329 | 70,476 |
| Triumph Bancorp, Inc.(1) | | 1,845 | 219,703 |
| Trustmark Corp. | | 4,949 | 160,645 |
| UMB Financial Corp. | | 3,434 | 364,382 |
| Security | Shares | Value |
| Banks (continued) | |
| United Bankshares, Inc. | | 10,340 | $ 375,135 |
| United Community Banks, Inc. | | 6,824 | 245,255 |
| Univest Financial Corp. | | 2,262 | 67,679 |
| Valley National Bancorp | | 31,413 | 431,929 |
| Veritex Holdings, Inc. | | 3,730 | 148,379 |
| Washington Trust Bancorp, Inc. | | 1,312 | 73,957 |
| WesBanco, Inc. | | 4,866 | 170,261 |
| West BanCorp, Inc. | | 1,387 | 43,094 |
| Westamerica BanCorp. | | 2,125 | 122,676 |
| | | | $ 20,136,213 |
| Beverages — 0.4% | |
| Celsius Holdings, Inc.(1)(2) | | 4,135 | $ 308,347 |
| Coca-Cola Consolidated, Inc. | | 363 | 224,766 |
| Duckhorn Portfolio, Inc. (The)(1) | | 2,773 | 64,722 |
| MGP Ingredients, Inc. | | 1,083 | 92,044 |
| National Beverage Corp. | | 1,978 | 89,663 |
| NewAge, Inc.(1) | | 10,439 | 10,752 |
| Primo Water Corp. | | 12,333 | 217,431 |
| Zevia PBC, Class A(1) | | 786 | 5,541 |
| | | | $ 1,013,266 |
| Biotechnology — 7.8% | |
| 2seventy bio, Inc.(1) | | 1,765 | $ 45,237 |
| 4D Molecular Therapeutics, Inc.(1)(2) | | 2,159 | 47,368 |
| 89bio, Inc.(1)(2) | | 560 | 7,319 |
| ACADIA Pharmaceuticals, Inc.(1) | | 9,384 | 219,023 |
| Acumen Pharmaceuticals, Inc.(1) | | 735 | 4,969 |
| Adagio Therapeutics, Inc.(1) | | 1,619 | 11,754 |
| Adicet Bio, Inc.(1) | | 1,640 | 28,684 |
| Adverum Biotechnologies, Inc.(1) | | 7,403 | 13,029 |
| Aeglea BioTherapeutics, Inc.(1) | | 3,710 | 17,623 |
| Aerovate Therapeutics, Inc.(1) | | 772 | 9,102 |
| Affimed NV(1) | | 9,178 | 50,663 |
| Agenus, Inc.(1) | | 15,457 | 49,772 |
| Agios Pharmaceuticals, Inc.(1) | | 4,200 | 138,054 |
| Akebia Therapeutics, Inc.(1) | | 11,500 | 25,990 |
| Akero Therapeutics, Inc.(1) | | 2,016 | 42,638 |
| Akouos, Inc.(1)(2) | | 1,992 | 16,932 |
| Albireo Pharma, Inc.(1) | | 1,419 | 33,049 |
| Aldeyra Therapeutics, Inc.(1) | | 3,805 | 15,220 |
| Alector, Inc.(1) | | 4,559 | 94,143 |
| Aligos Therapeutics, Inc.(1) | | 1,471 | 17,461 |
| Alkermes PLC(1) | | 12,578 | 292,564 |
| Allakos, Inc.(1) | | 2,740 | 26,825 |
| Allogene Therapeutics, Inc.(1) | | 5,332 | 79,553 |
9
See Notes to Financial Statements.
Calvert
VP Russell 2000® Small Cap Index Portfolio
December 31, 2021
Schedule of Investments — continued
| Security | Shares | Value |
| Biotechnology (continued) | |
| Allovir, Inc.(1) | | 2,408 | $ 31,160 |
| Alpine Immune Sciences, Inc.(1) | | 911 | 12,617 |
| Altimmune, Inc.(1)(2) | | 3,098 | 28,378 |
| ALX Oncology Holdings, Inc.(1) | | 1,419 | 30,494 |
| Amicus Therapeutics, Inc.(1) | | 20,619 | 238,149 |
| AnaptysBio, Inc.(1) | | 1,512 | 52,542 |
| Anavex Life Sciences Corp.(1)(2) | | 4,866 | 84,376 |
| Anika Therapeutics, Inc.(1) | | 1,202 | 43,068 |
| Annexon, Inc.(1) | | 2,169 | 24,922 |
| Apellis Pharmaceuticals, Inc.(1) | | 5,580 | 263,822 |
| Applied Molecular Transport, Inc.(1) | | 1,806 | 25,248 |
| Applied Therapeutics, Inc.(1) | | 1,179 | 10,552 |
| AquaBounty Technologies, Inc.(1) | | 4,115 | 8,642 |
| Arbutus Biopharma Corp.(1)(2) | | 6,124 | 23,822 |
| Arcturus Therapeutics Holdings, Inc.(1) | | 1,638 | 60,622 |
| Arcus Biosciences, Inc.(1) | | 3,592 | 145,368 |
| Arcutis Biotherapeutics, Inc.(1) | | 1,880 | 38,991 |
| Ardelyx, Inc.(1)(2) | | 6,633 | 7,296 |
| Arena Pharmaceuticals, Inc.(1) | | 4,824 | 448,343 |
| Arrowhead Pharmaceuticals, Inc.(1) | | 7,925 | 525,427 |
| Atara Biotherapeutics, Inc.(1) | | 6,782 | 106,884 |
| Athenex, Inc.(1) | | 5,991 | 8,148 |
| Athersys, Inc.(1)(2) | | 15,321 | 13,829 |
| Atossa Therapeutics, Inc.(1) | | 9,173 | 14,677 |
| Atreca, Inc., Class A(1) | | 2,420 | 7,333 |
| Aura Biosciences, Inc.(1) | | 421 | 7,149 |
| Avalo Therapeutics, Inc.(1) | | 1,893 | 3,218 |
| Avid Bioservices, Inc.(1) | | 4,695 | 137,000 |
| Avidity Biosciences, Inc.(1) | | 2,887 | 68,624 |
| Avita Medical, Inc.(1) | | 1,872 | 22,427 |
| Avrobio, Inc.(1)(2) | | 2,729 | 10,507 |
| Beam Therapeutics, Inc.(1)(2) | | 3,956 | 315,254 |
| Beyondspring, Inc.(1)(2) | | 1,774 | 8,036 |
| BioAtla, Inc.(1) | | 1,190 | 23,360 |
| BioCryst Pharmaceuticals, Inc.(1)(2) | | 13,940 | 193,069 |
| Biohaven Pharmaceutical Holding Co., Ltd.(1) | | 4,351 | 599,611 |
| Biomea Fusion, Inc.(1)(2) | | 677 | 5,044 |
| Bioxcel Therapeutics, Inc.(1)(2) | | 1,350 | 27,445 |
| Black Diamond Therapeutics, Inc.(1)(2) | | 1,541 | 8,214 |
| Bluebird Bio, Inc.(1)(2) | | 5,296 | 52,907 |
| Blueprint Medicines Corp.(1) | | 4,576 | 490,135 |
| Bolt Biotherapeutics, Inc.(1)(2) | | 1,754 | 8,595 |
| Bridgebio Pharma, Inc.(1)(2) | | 8,200 | 136,776 |
| Brooklyn ImmunoTherapeutics, Inc.(1)(2) | | 1,867 | 7,785 |
| C4 Therapeutics, Inc.(1) | | 2,962 | 95,376 |
| Cardiff Oncology, Inc.(1)(2) | | 2,835 | 17,038 |
| CareDx, Inc.(1) | | 3,924 | 178,464 |
| Security | Shares | Value |
| Biotechnology (continued) | |
| Caribou Biosciences, Inc.(1) | | 1,470 | $ 22,182 |
| Catalyst Pharmaceuticals, Inc.(1) | | 7,603 | 51,472 |
| Celcuity, Inc.(1) | | 625 | 8,244 |
| Celldex Therapeutics, Inc.(1) | | 3,525 | 136,206 |
| CEL-SCI Corp.(1)(2) | | 2,865 | 20,342 |
| Century Therapeutics, Inc.(1) | | 905 | 14,353 |
| Cerevel Therapeutics Holdings, Inc.(1) | | 3,073 | 99,627 |
| ChemoCentryx, Inc.(1) | | 4,033 | 146,842 |
| Chimerix, Inc.(1) | | 4,840 | 31,121 |
| Chinook Therapeutics, Inc.(1) | | 3,020 | 49,256 |
| Clene, Inc.(1) | | 1,794 | 7,355 |
| Clovis Oncology, Inc.(1) | | 7,887 | 21,374 |
| Codiak Biosciences, Inc.(1) | | 1,231 | 13,713 |
| Cogent Biosciences, Inc.(1) | | 2,913 | 24,994 |
| Coherus Biosciences, Inc.(1)(2) | | 5,115 | 81,635 |
| Cortexyme, Inc.(1)(2) | | 1,564 | 19,738 |
| Crinetics Pharmaceuticals, Inc.(1) | | 3,562 | 101,196 |
| Cue Biopharma, Inc.(1) | | 2,450 | 27,709 |
| Cullinan Oncology, Inc.(1)(2) | | 1,984 | 30,613 |
| Curis, Inc.(1) | | 6,790 | 32,320 |
| Cyteir Therapeutics, Inc.(1) | | 641 | 7,288 |
| Cytokinetics, Inc.(1) | | 6,145 | 280,089 |
| CytomX Therapeutics, Inc.(1) | | 5,010 | 21,693 |
| Day One Biopharmaceuticals, Inc.(1)(2) | | 845 | 14,238 |
| Deciphera Pharmaceuticals, Inc.(1) | | 3,305 | 32,290 |
| Denali Therapeutics, Inc.(1) | | 7,134 | 318,176 |
| DermTech, Inc.(1)(2) | | 1,859 | 29,372 |
| Design Therapeutics, Inc.(1)(2) | | 2,055 | 43,998 |
| Dynavax Technologies Corp.(1) | | 8,264 | 116,274 |
| Dyne Therapeutics, Inc.(1)(2) | | 2,355 | 28,001 |
| Eagle Pharmaceuticals, Inc.(1) | | 867 | 44,148 |
| Editas Medicine, Inc.(1) | | 5,352 | 142,096 |
| Eiger BioPharmaceuticals, Inc.(1)(2) | | 2,068 | 10,733 |
| Eliem Therapeutics, Inc.(1)(2) | | 541 | 5,659 |
| Emergent BioSolutions, Inc.(1) | | 3,841 | 166,968 |
| Enanta Pharmaceuticals, Inc.(1) | | 1,477 | 110,450 |
| Entrada Therapeutics, Inc.(1)(2) | | 708 | 12,121 |
| Epizyme, Inc.(1) | | 7,880 | 19,700 |
| Erasca, Inc.(1) | | 1,585 | 24,694 |
| Evelo Biosciences, Inc.(1)(2) | | 2,381 | 14,453 |
| Exagen, Inc.(1) | | 849 | 9,874 |
| Fate Therapeutics, Inc.(1) | | 6,294 | 368,262 |
| FibroGen, Inc.(1) | | 7,057 | 99,504 |
| Finch Therapeutics Group, Inc.(1) | | 593 | 5,912 |
| Foghorn Therapeutics, Inc.(1) | | 1,534 | 35,083 |
| Forma Therapeutics Holdings, Inc.(1) | | 2,458 | 34,953 |
| Forte Biosciences, Inc.(1)(2) | | 885 | 1,894 |
10
See Notes to Financial Statements.
Calvert
VP Russell 2000® Small Cap Index Portfolio
December 31, 2021
Schedule of Investments — continued
| Security | Shares | Value |
| Biotechnology (continued) | |
| Fortress Biotech, Inc.(1) | | 5,129 | $ 12,823 |
| Frequency Therapeutics, Inc.(1) | | 2,140 | 10,978 |
| G1 Therapeutics, Inc.(1)(2) | | 2,920 | 29,813 |
| Gemini Therapeutics, Inc.(1)(2) | | 1,718 | 4,999 |
| Generation Bio Co.(1) | | 3,277 | 23,201 |
| Geron Corp.(1)(2) | | 24,481 | 29,867 |
| Global Blood Therapeutics, Inc.(1)(2) | | 4,693 | 137,364 |
| Gossamer Bio, Inc.(1) | | 4,379 | 49,526 |
| Graphite Bio, Inc.(1) | | 1,246 | 15,488 |
| Greenwich Lifesciences, Inc.(1)(2) | | 316 | 7,688 |
| Gritstone bio, Inc.(1) | | 3,302 | 42,464 |
| GT Biopharma, Inc.(1) | | 1,870 | 5,704 |
| Halozyme Therapeutics, Inc.(1) | | 10,701 | 430,287 |
| Harpoon Therapeutics, Inc.(1) | | 1,102 | 8,320 |
| Heron Therapeutics, Inc.(1)(2) | | 7,128 | 65,079 |
| Homology Medicines, Inc.(1) | | 3,003 | 10,931 |
| Hookipa Pharma, Inc.(1) | | 859 | 2,001 |
| Humanigen, Inc.(1) | | 3,517 | 13,083 |
| iBio, Inc.(1) | | 15,089 | 8,284 |
| Icosavax, Inc.(1) | | 1,025 | 23,452 |
| Ideaya Biosciences, Inc.(1) | | 2,556 | 60,424 |
| IGM Biosciences, Inc.(1) | | 627 | 18,390 |
| Imago Biosciences, Inc.(1) | | 747 | 17,711 |
| Immuneering Corp., Class A(1)(2) | | 634 | 10,252 |
| Immunic, Inc.(1) | | 1,216 | 11,637 |
| ImmunityBio, Inc.(1)(2) | | 5,244 | 31,884 |
| ImmunoGen, Inc.(1) | | 15,644 | 116,078 |
| Immunovant, Inc.(1) | | 3,141 | 26,761 |
| Impel Neuropharma, Inc.(1)(2) | | 422 | 3,642 |
| Infinity Pharmaceuticals, Inc.(1) | | 6,863 | 15,442 |
| Inhibrx, Inc.(1)(2) | | 2,189 | 95,594 |
| Inovio Pharmaceuticals, Inc.(1) | | 16,212 | 80,898 |
| Inozyme Pharma, Inc.(1) | | 692 | 4,719 |
| Insmed, Inc.(1)(2) | | 9,219 | 251,126 |
| Instil Bio, Inc.(1)(2) | | 4,179 | 71,503 |
| Intellia Therapeutics, Inc.(1) | | 5,380 | 636,131 |
| Intercept Pharmaceuticals, Inc.(1)(2) | | 2,290 | 37,304 |
| Invitae Corp.(1)(2) | | 15,672 | 239,311 |
| Ironwood Pharmaceuticals, Inc.(1) | | 11,391 | 132,819 |
| iTeos Therapeutics, Inc.(1) | | 1,605 | 74,729 |
| IVERIC bio, Inc.(1) | | 8,892 | 148,674 |
| Janux Therapeutics, Inc.(1)(2) | | 1,014 | 20,006 |
| Jounce Therapeutics, Inc.(1) | | 2,585 | 21,585 |
| KalVista Pharmaceuticals, Inc.(1) | | 1,550 | 20,506 |
| Karuna Therapeutics, Inc.(1) | | 1,741 | 228,071 |
| Karyopharm Therapeutics, Inc.(1)(2) | | 6,194 | 39,827 |
| Keros Therapeutics, Inc.(1) | | 1,092 | 63,893 |
| Security | Shares | Value |
| Biotechnology (continued) | |
| Kezar Life Sciences, Inc.(1) | | 2,239 | $ 37,436 |
| Kiniksa Pharmaceuticals, Ltd., Class A(1) | | 2,278 | 26,812 |
| Kinnate Biopharma, Inc.(1) | | 1,973 | 34,962 |
| Kodiak Sciences, Inc.(1) | | 2,568 | 217,715 |
| Kronos Bio, Inc.(1) | | 3,044 | 41,368 |
| Krystal Biotech, Inc.(1) | | 1,406 | 98,350 |
| Kura Oncology, Inc.(1) | | 5,246 | 73,444 |
| Kymera Therapeutics, Inc.(1) | | 2,634 | 167,233 |
| Lexicon Pharmaceuticals, Inc.(1) | | 5,367 | 21,146 |
| Ligand Pharmaceuticals, Inc.(1) | | 1,219 | 188,287 |
| Lineage Cell Therapeutics, Inc.(1) | | 9,508 | 23,295 |
| Lyell Immunopharma, Inc.(1) | | 1,811 | 14,017 |
| MacroGenics, Inc.(1) | | 4,499 | 72,209 |
| Madrigal Pharmaceuticals, Inc.(1) | | 890 | 75,419 |
| Magenta Therapeutics, Inc.(1) | | 1,719 | 7,615 |
| MannKind Corp.(1)(2) | | 18,965 | 82,877 |
| MEI Pharma, Inc.(1) | | 7,667 | 20,471 |
| MeiraGTx Holdings PLC(1)(2) | | 2,356 | 55,931 |
| Mersana Therapeutics, Inc.(1) | | 5,400 | 33,588 |
| MiMedx Group, Inc.(1) | | 8,710 | 52,608 |
| MiNK Therapeutics, Inc.(1) | | 150 | 669 |
| Mirum Pharmaceuticals, Inc.(1) | | 225 | 3,589 |
| Molecular Templates, Inc.(1) | | 2,142 | 8,397 |
| Monte Rosa Therapeutics, Inc.(1) | | 887 | 18,113 |
| Morphic Holding, Inc.(1) | | 1,626 | 77,040 |
| Mustang Bio, Inc.(1) | | 4,255 | 7,063 |
| Myriad Genetics, Inc.(1) | | 6,066 | 167,422 |
| Neoleukin Therapeutics, Inc.(1) | | 2,623 | 12,643 |
| NexImmune, Inc.(1) | | 1,353 | 6,237 |
| Nkarta, Inc.(1) | | 1,106 | 16,977 |
| Nurix Therapeutics, Inc.(1) | | 2,456 | 71,101 |
| Nuvalent, Inc., Class A(1) | | 821 | 15,632 |
| Ocugen, Inc.(1)(2) | | 14,478 | 65,875 |
| Olema Pharmaceuticals, Inc.(1)(2) | | 1,931 | 18,074 |
| Omega Therapeutics, Inc.(1) | | 567 | 6,424 |
| Oncocyte Corp.(1) | | 5,296 | 11,492 |
| Oncorus, Inc.(1)(2) | | 1,601 | 8,437 |
| Oncternal Therapeutics, Inc.(1) | | 3,470 | 7,877 |
| OPKO Health, Inc.(1) | | 32,353 | 155,618 |
| Organogenesis Holdings, Inc.(1)(2) | | 2,990 | 27,628 |
| ORIC Pharmaceuticals, Inc.(1) | | 2,339 | 34,383 |
| Outlook Therapeutics, Inc.(1)(2) | | 6,867 | 9,339 |
| Oyster Point Pharma, Inc.(1)(2) | | 485 | 8,856 |
| Passage Bio, Inc.(1) | | 2,908 | 18,466 |
| PMV Pharmaceuticals, Inc.(1) | | 2,057 | 47,517 |
| Portage Biotech, Inc.(1) | | 283 | 3,037 |
| Poseida Therapeutics, Inc.(1) | | 2,693 | 18,339 |
11
See Notes to Financial Statements.
Calvert
VP Russell 2000® Small Cap Index Portfolio
December 31, 2021
Schedule of Investments — continued
| Security | Shares | Value |
| Biotechnology (continued) | |
| Praxis Precision Medicines, Inc.(1) | | 2,483 | $ 48,915 |
| Precigen, Inc.(1) | | 7,437 | 27,591 |
| Precision BioSciences, Inc.(1) | | 4,034 | 29,852 |
| Prelude Therapeutics, Inc.(1) | | 769 | 9,574 |
| Prometheus Biosciences, Inc.(1) | | 2,316 | 91,575 |
| Protagonist Therapeutics, Inc.(1) | | 3,501 | 119,734 |
| Prothena Corp. PLC(1) | | 2,702 | 133,479 |
| PTC Therapeutics, Inc.(1) | | 5,446 | 216,914 |
| Puma Biotechnology, Inc.(1) | | 2,522 | 7,667 |
| Pyxis Oncology, Inc.(1) | | 822 | 9,017 |
| Radius Health, Inc.(1)(2) | | 3,845 | 26,607 |
| Rallybio Corp.(1) | | 550 | 5,247 |
| Rapt Therapeutics, Inc.(1) | | 1,664 | 61,119 |
| Recursion Pharmaceuticals, Inc., Class A(1) | | 8,908 | 152,594 |
| REGENXBIO, Inc.(1) | | 2,991 | 97,806 |
| Relay Therapeutics, Inc.(1) | | 5,408 | 166,080 |
| Reneo Pharmaceuticals, Inc.(1)(2) | | 494 | 4,224 |
| Replimune Group, Inc.(1) | | 2,280 | 61,788 |
| REVOLUTION Medicines, Inc.(1) | | 4,657 | 117,217 |
| Rhythm Pharmaceuticals, Inc.(1) | | 3,454 | 34,471 |
| Rigel Pharmaceuticals, Inc.(1) | | 14,810 | 39,246 |
| Rocket Pharmaceuticals, Inc.(1) | | 3,009 | 65,686 |
| Rubius Therapeutics, Inc.(1) | | 3,535 | 34,219 |
| Sana Biotechnology, Inc.(1)(2) | | 6,618 | 102,447 |
| Sangamo Therapeutics, Inc.(1) | | 9,803 | 73,522 |
| Scholar Rock Holding Corp.(1) | | 2,162 | 53,704 |
| Selecta Biosciences, Inc.(1) | | 5,991 | 19,531 |
| Sensei Biotherapeutics, Inc.(1) | | 1,602 | 9,292 |
| Sera Prognostics, Inc., Class A(1)(2) | | 365 | 2,508 |
| Seres Therapeutics, Inc.(1)(2) | | 5,457 | 45,457 |
| Sesen Bio, Inc.(1) | | 13,404 | 10,924 |
| Shattuck Labs, Inc.(1) | | 2,086 | 17,752 |
| Sigilon Therapeutics, Inc.(1) | | 628 | 1,733 |
| Silverback Therapeutics, Inc.(1) | | 1,032 | 6,873 |
| Solid Biosciences, Inc.(1) | | 4,720 | 8,260 |
| Sorrento Therapeutics, Inc.(1)(2) | | 23,089 | 107,364 |
| Spectrum Pharmaceuticals, Inc.(1)(2) | | 12,291 | 15,610 |
| Spero Therapeutics, Inc.(1) | | 1,713 | 27,425 |
| SpringWorks Therapeutics, Inc.(1) | | 2,289 | 141,872 |
| Spruce Biosciences, Inc.(1)(2) | | 584 | 2,605 |
| SQZ Biotechnologies Co.(1) | | 1,785 | 15,940 |
| Stoke Therapeutics, Inc.(1) | | 1,497 | 35,913 |
| Summit Therapeutics, Inc.(1)(2) | | 1,762 | 4,740 |
| Surface Oncology, Inc.(1) | | 2,609 | 12,471 |
| Sutro Biopharma, Inc.(1) | | 3,400 | 50,592 |
| Syndax Pharmaceuticals, Inc.(1) | | 3,525 | 77,162 |
| Syros Pharmaceuticals, Inc.(1)(2) | | 3,667 | 11,954 |
| Security | Shares | Value |
| Biotechnology (continued) | |
| Talaris Therapeutics, Inc.(1) | | 1,647 | $ 25,183 |
| Taysha Gene Therapies, Inc.(1)(2) | | 1,745 | 20,329 |
| TCR2 Therapeutics, Inc.(1) | | 2,165 | 10,089 |
| Tenaya Therapeutics, Inc.(1) | | 1,068 | 20,239 |
| TG Therapeutics, Inc.(1) | | 9,827 | 186,713 |
| Tonix Pharmaceuticals Holding Corp.(1) | | 25,614 | 9,162 |
| Travere Therapeutics, Inc.(1) | | 4,501 | 139,711 |
| Trevena, Inc.(1) | | 12,822 | 7,469 |
| Turning Point Therapeutics, Inc.(1) | | 3,605 | 171,958 |
| Twist Bioscience Corp.(1) | | 3,702 | 286,498 |
| Tyra Biosciences, Inc.(1) | | 940 | 13,226 |
| UroGen Pharma, Ltd.(1)(2) | | 1,653 | 15,720 |
| Vanda Pharmaceuticals, Inc.(1) | | 4,281 | 67,169 |
| Vaxart, Inc.(1) | | 9,366 | 58,725 |
| Vaxcyte, Inc.(1) | | 3,117 | 74,153 |
| VBI Vaccines, Inc.(1) | | 14,103 | 33,001 |
| Vera Therapeutics, Inc.(1) | | 542 | 14,482 |
| Veracyte, Inc.(1) | | 5,172 | 213,086 |
| Verastem, Inc.(1) | | 14,449 | 29,620 |
| Vericel Corp.(1) | | 3,645 | 143,248 |
| Verve Therapeutics, Inc.(1)(2) | | 1,211 | 44,650 |
| Viking Therapeutics, Inc.(1) | | 5,553 | 25,544 |
| Vincerx Pharma, Inc.(1) | | 1,000 | 10,190 |
| Vir Biotechnology, Inc.(1) | | 4,713 | 197,333 |
| Viracta Therapeutics, Inc.(1) | | 2,843 | 10,377 |
| VistaGen Therapeutics, Inc.(1) | | 15,000 | 29,250 |
| Vor BioPharma, Inc.(1) | | 1,483 | 17,232 |
| Werewolf Therapeutics, Inc.(1) | | 2,041 | 24,308 |
| XBiotech, Inc. | | 1,143 | 12,722 |
| Xencor, Inc.(1) | | 4,334 | 173,880 |
| Xilio Therapeutics, Inc.(1) | | 573 | 9,168 |
| XOMA Corp.(1) | | 537 | 11,196 |
| Y-mAbs Therapeutics, Inc.(1) | | 2,645 | 42,875 |
| Zentalis Pharmaceuticals, Inc.(1) | | 2,752 | 231,333 |
| ZIOPHARM Oncology, Inc.(1)(2) | | 18,832 | 20,527 |
| | | | $ 19,313,867 |
| Building Products — 1.3% | |
| AAON, Inc. | | 3,340 | $ 265,296 |
| American Woodmark Corp.(1) | | 1,377 | 89,780 |
| Apogee Enterprises, Inc. | | 1,940 | 93,411 |
| Caesarstone, Ltd. | | 1,950 | 22,113 |
| Cornerstone Building Brands, Inc.(1) | | 4,293 | 74,870 |
| CSW Industrials, Inc. | | 1,163 | 140,560 |
| Gibraltar Industries, Inc.(1) | | 2,573 | 171,568 |
| Griffon Corp. | | 3,669 | 104,493 |
| Insteel Industries, Inc. | | 1,366 | 54,380 |
12
See Notes to Financial Statements.
Calvert
VP Russell 2000® Small Cap Index Portfolio
December 31, 2021
Schedule of Investments — continued
| Security | Shares | Value |
| Building Products (continued) | |
| JELD-WEN Holding, Inc.(1) | | 7,072 | $ 186,418 |
| Masonite International Corp.(1) | | 1,850 | 218,208 |
| PGT Innovations, Inc.(1) | | 4,639 | 104,331 |
| Quanex Building Products Corp. | | 2,627 | 65,097 |
| Resideo Technologies, Inc.(1) | | 11,338 | 295,128 |
| Simpson Manufacturing Co., Inc. | | 3,417 | 475,202 |
| UFP Industries, Inc. | | 4,722 | 434,471 |
| View, Inc.(1) | | 10,783 | 42,162 |
| Zurn Water Solutions Corp. | | 9,407 | 342,415 |
| | | | $ 3,179,903 |
| Capital Markets — 1.6% | |
| Artisan Partners Asset Management, Inc., Class A | | 4,606 | $ 219,430 |
| Assetmark Financial Holdings(1) | | 1,445 | 37,873 |
| Associated Capital Group, Inc., Class A | | 224 | 9,632 |
| B. Riley Financial, Inc. | | 1,590 | 141,287 |
| BGC Partners, Inc., Class A | | 24,450 | 113,692 |
| Blucora, Inc.(1) | | 4,225 | 73,177 |
| Brightsphere Investment Group, Inc. | | 4,548 | 116,429 |
| Cohen & Steers, Inc. | | 1,907 | 176,417 |
| Cowen, Inc., Class A | | 2,148 | 77,543 |
| Diamond Hill Investment Group, Inc. | | 250 | 48,557 |
| Donnelley Financial Solutions, Inc.(1) | | 2,310 | 108,893 |
| Federated Hermes, Inc., Class B | | 7,409 | 278,430 |
| Focus Financial Partners, Inc., Class A(1) | | 4,568 | 272,801 |
| GAMCO Investors, Inc., Class A | | 342 | 8,543 |
| GCM Grosvenor, Inc., Class A(2) | | 3,365 | 35,333 |
| Greenhill & Co., Inc. | | 1,309 | 23,470 |
| Hamilton Lane, Inc., Class A | | 2,688 | 278,531 |
| Houlihan Lokey, Inc. | | 4,017 | 415,840 |
| Moelis & Co., Class A | | 4,797 | 299,860 |
| Open Lending Corp., Class A(1) | | 8,176 | 183,796 |
| Oppenheimer Holdings, Inc., Class A | | 724 | 33,572 |
| Piper Sandler Cos. | | 1,341 | 239,382 |
| PJT Partners, Inc., Class A | | 1,843 | 136,548 |
| Pzena Investment Management, Inc., Class A | | 1,231 | 11,658 |
| Sculptor Capital Management, Inc. | | 1,486 | 31,726 |
| StepStone Group, Inc., Class A | | 3,158 | 131,278 |
| StoneX Group, Inc.(1) | | 1,391 | 85,199 |
| Value Line, Inc. | | 91 | 4,261 |
| Virtus Investment Partners, Inc. | | 560 | 166,376 |
| WisdomTree Investments, Inc.(2) | | 11,656 | 71,335 |
| | | | $ 3,830,869 |
| Chemicals — 1.9% | |
| AdvanSix, Inc. | | 2,111 | $ 99,745 |
| Security | Shares | Value |
| Chemicals (continued) | |
| American Vanguard Corp. | | 2,506 | $ 41,073 |
| Amyris, Inc.(1)(2) | | 13,112 | 70,936 |
| Avient Corp. | | 7,139 | 399,427 |
| Balchem Corp. | | 2,529 | 426,390 |
| Cabot Corp. | | 4,401 | 247,336 |
| Chase Corp. | | 627 | 62,424 |
| Danimer Scientific, Inc.(1)(2) | | 7,000 | 59,640 |
| Ecovyst, Inc. | | 4,026 | 41,226 |
| Ferro Corp.(1) | | 6,659 | 145,366 |
| FutureFuel Corp. | | 1,874 | 14,317 |
| GCP Applied Technologies, Inc.(1) | | 3,858 | 122,144 |
| Hawkins, Inc. | | 1,498 | 59,096 |
| HB Fuller Co. | | 4,089 | 331,209 |
| Ingevity Corp.(1) | | 3,156 | 226,285 |
| Innospec, Inc. | | 1,881 | 169,930 |
| Intrepid Potash, Inc.(1) | | 831 | 35,509 |
| Koppers Holdings, Inc.(1) | | 1,571 | 49,172 |
| Kraton Corp.(1) | | 2,409 | 111,585 |
| Kronos Worldwide, Inc. | | 1,877 | 28,174 |
| Livent Corp.(1)(2) | | 12,423 | 302,873 |
| Marrone Bio Innovations, Inc.(1) | | 4,928 | 3,549 |
| Minerals Technologies, Inc. | | 2,636 | 192,823 |
| Orion Engineered Carbons S.A.(1) | | 4,752 | 87,247 |
| PureCycle Technologies, Inc.(1) | | 4,127 | 39,495 |
| Quaker Chemical Corp. | | 1,058 | 244,165 |
| Rayonier Advanced Materials, Inc.(1) | | 5,330 | 30,434 |
| Sensient Technologies Corp. | | 3,317 | 331,899 |
| Stepan Co. | | 1,690 | 210,050 |
| Tredegar Corp. | | 2,145 | 25,354 |
| Trinseo PLC | | 3,113 | 163,308 |
| Tronox Holdings PLC, Class A | | 8,787 | 211,152 |
| Valhi, Inc. | | 189 | 5,434 |
| Zymergen, Inc.(1) | | 6,197 | 41,458 |
| | | | $ 4,630,225 |
| Commercial Services & Supplies — 1.6% | |
| ABM Industries, Inc. | | 5,284 | $ 215,851 |
| ACCO Brands Corp. | | 7,737 | 63,908 |
| Aris Water Solution, Inc.(1) | | 1,504 | 19,477 |
| Brady Corp., Class A | | 3,699 | 199,376 |
| BrightView Holdings, Inc.(1) | | 3,485 | 49,069 |
| Brink's Co. (The) | | 3,816 | 250,215 |
| Casella Waste Systems, Inc., Class A(1) | | 3,858 | 329,550 |
| CECO Environmental Corp.(1) | | 2,281 | 14,211 |
| Cimpress PLC(1) | | 1,294 | 92,663 |
| CompX International, Inc. | | 124 | 2,786 |
| CoreCivic, Inc.(1) | | 9,406 | 93,778 |
13
See Notes to Financial Statements.
Calvert
VP Russell 2000® Small Cap Index Portfolio
December 31, 2021
Schedule of Investments — continued
| Security | Shares | Value |
| Commercial Services & Supplies (continued) | |
| Deluxe Corp. | | 3,303 | $ 106,059 |
| Ennis, Inc. | | 2,271 | 44,353 |
| Harsco Corp.(1) | | 6,141 | 102,616 |
| Healthcare Services Group, Inc. | | 6,075 | 108,074 |
| Heritage-Crystal Clean, Inc.(1) | | 1,244 | 39,833 |
| HNI Corp. | | 3,365 | 141,498 |
| Interface, Inc. | | 4,493 | 71,663 |
| KAR Auction Services, Inc.(1) | | 9,114 | 142,361 |
| Kimball International, Inc., Class B | | 3,203 | 32,767 |
| Matthews International Corp., Class A | | 2,426 | 88,961 |
| MillerKnoll, Inc. | | 5,702 | 223,461 |
| Montrose Environmental Group, Inc.(1) | | 2,024 | 142,712 |
| NL Industries, Inc. | | 532 | 3,937 |
| Pitney Bowes, Inc. | | 14,661 | 97,203 |
| RR Donnelley & Sons Co.(1) | | 5,556 | 62,561 |
| SP Plus Corp.(1) | | 1,895 | 53,477 |
| Steelcase, Inc., Class A | | 7,018 | 82,251 |
| Team, Inc.(1) | | 2,411 | 2,628 |
| Tetra Tech, Inc. | | 4,210 | 714,858 |
| UniFirst Corp. | | 1,183 | 248,903 |
| US Ecology, Inc.(1) | | 2,470 | 78,892 |
| Viad Corp.(1) | | 1,592 | 68,122 |
| VSE Corp. | | 830 | 50,580 |
| | | | $ 4,038,654 |
| Communications Equipment — 0.8% | |
| ADTRAN, Inc. | | 4,115 | $ 93,946 |
| Aviat Networks, Inc.(1) | | 756 | 24,253 |
| CalAmp Corp.(1) | | 3,105 | 21,921 |
| Calix, Inc.(1) | | 4,281 | 342,352 |
| Cambium Networks Corp.(1) | | 659 | 16,890 |
| Casa Systems, Inc.(1) | | 2,241 | 12,707 |
| Clearfield, Inc.(1) | | 881 | 74,374 |
| Comtech Telecommunications Corp. | | 2,055 | 48,683 |
| Digi International, Inc.(1) | | 2,313 | 56,830 |
| DZS, Inc.(1) | | 1,018 | 16,512 |
| EMCORE Corp.(1) | | 2,864 | 19,991 |
| Extreme Networks, Inc.(1) | | 9,679 | 151,960 |
| Harmonic, Inc.(1) | | 7,210 | 84,790 |
| Infinera Corp.(1) | | 13,753 | 131,891 |
| Inseego Corp.(1)(2) | | 6,022 | 35,108 |
| KVH Industries, Inc.(1) | | 1,491 | 13,702 |
| NETGEAR, Inc.(1) | | 2,438 | 71,214 |
| NetScout Systems, Inc.(1) | | 5,503 | 182,039 |
| Plantronics, Inc.(1) | | 3,236 | 94,944 |
| Ribbon Communications, Inc.(1) | | 5,864 | 35,477 |
| Security | Shares | Value |
| Communications Equipment (continued) | |
| Viavi Solutions, Inc.(1) | | 18,511 | $ 326,164 |
| | | | $ 1,855,748 |
| Construction & Engineering — 1.5% | |
| Ameresco, Inc., Class A(1) | | 2,423 | $ 197,329 |
| API Group Corp.(1) | | 15,597 | 401,935 |
| Arcosa, Inc. | | 3,800 | 200,260 |
| Argan, Inc. | | 1,319 | 51,032 |
| Comfort Systems USA, Inc. | | 2,796 | 276,636 |
| Concrete Pumping Holdings, Inc.(1)(2) | | 2,145 | 17,589 |
| Construction Partners, Inc., Class A(1) | | 2,244 | 65,996 |
| Dycom Industries, Inc.(1) | | 2,344 | 219,773 |
| EMCOR Group, Inc. | | 4,167 | 530,834 |
| Fluor Corp.(1) | | 11,138 | 275,888 |
| Granite Construction, Inc. | | 3,588 | 138,856 |
| Great Lakes Dredge & Dock Corp.(1) | | 5,123 | 80,534 |
| IES Holdings, Inc.(1) | | 610 | 30,890 |
| Infrastructure and Energy Alternatives, Inc.(1) | | 1,639 | 15,079 |
| INNOVATE Corp.(1)(2) | | 3,868 | 14,312 |
| Matrix Service Co.(1) | | 2,252 | 16,935 |
| MYR Group, Inc.(1) | | 1,295 | 143,162 |
| Northwest Pipe Co.(1) | | 837 | 26,617 |
| NV5 Global, Inc.(1) | | 1,020 | 140,882 |
| Primoris Services Corp. | | 4,194 | 100,572 |
| Sterling Construction Co., Inc.(1) | | 2,268 | 59,648 |
| Tutor Perini Corp.(1) | | 3,186 | 39,411 |
| WillScot Mobile Mini Holdings Corp.(1) | | 16,359 | 668,102 |
| | | | $ 3,712,272 |
| Construction Materials — 0.2% | |
| Forterra, Inc.(1) | | 2,437 | $ 57,952 |
| Summit Materials, Inc., Class A(1) | | 9,325 | 374,305 |
| United States Lime & Minerals, Inc. | | 156 | 20,127 |
| | | | $ 452,384 |
| Consumer Finance — 0.8% | |
| Atlanticus Holdings Corp.(1) | | 446 | $ 31,809 |
| Curo Group Holdings Corp. | | 1,544 | 24,719 |
| Encore Capital Group, Inc.(1)(2) | | 2,254 | 139,996 |
| Enova International, Inc.(1) | | 2,903 | 118,907 |
| EZCORP, Inc., Class A(1) | | 4,319 | 31,831 |
| FirstCash Holdings, Inc. | | 3,044 | 227,722 |
| Green Dot Corp., Class A(1) | | 4,100 | 148,584 |
| LendingClub Corp.(1) | | 7,566 | 182,946 |
| LendingTree, Inc.(1) | | 911 | 111,689 |
| Navient Corp. | | 12,231 | 259,542 |
14
See Notes to Financial Statements.
Calvert
VP Russell 2000® Small Cap Index Portfolio
December 31, 2021
Schedule of Investments — continued
| Security | Shares | Value |
| Consumer Finance (continued) | |
| Nelnet, Inc., Class A | | 1,312 | $ 128,156 |
| Oportun Financial Corp.(1) | | 1,717 | 34,769 |
| PRA Group, Inc.(1) | | 3,343 | 167,852 |
| PROG Holdings, Inc.(1) | | 5,038 | 227,264 |
| Regional Management Corp. | | 671 | 38,556 |
| World Acceptance Corp.(1) | | 366 | 89,827 |
| | | | $ 1,964,169 |
| Containers & Packaging — 0.3% | |
| Greif, Inc., Class A | | 2,023 | $ 122,128 |
| Greif, Inc., Class B | | 446 | 26,662 |
| Myers Industries, Inc. | | 3,117 | 62,371 |
| O-I Glass, Inc.(1) | | 12,390 | 149,052 |
| Pactiv Evergreen, Inc. | | 3,313 | 42,009 |
| Ranpak Holdings Corp.(1) | | 2,883 | 108,343 |
| TriMas Corp. | | 3,443 | 127,391 |
| UFP Technologies, Inc.(1) | | 499 | 35,060 |
| | | | $ 673,016 |
| Distributors — 0.0%(3) | |
| Funko, Inc., Class A(1) | | 1,732 | $ 32,562 |
| Greenlane Holdings, Inc., Class A(1) | | 547 | 527 |
| | | | $ 33,089 |
| Diversified Consumer Services — 0.6% | |
| 2U, Inc.(1)(2) | | 5,625 | $ 112,894 |
| Adtalem Global Education, Inc.(1) | | 3,796 | 112,210 |
| American Public Education, Inc.(1) | | 1,323 | 29,437 |
| Carriage Services, Inc. | | 1,188 | 76,555 |
| Coursera, Inc.(1) | | 5,644 | 137,939 |
| European Wax Center, Inc., Class A(1) | | 779 | 23,643 |
| Graham Holdings Co., Class B | | 304 | 191,468 |
| Houghton Mifflin Harcourt Co.(1) | | 9,969 | 160,501 |
| Laureate Education, Inc., Class A | | 7,612 | 93,171 |
| OneSpaWorld Holdings, Ltd.(1) | | 4,007 | 40,150 |
| Perdoceo Education Corp.(1) | | 5,930 | 69,737 |
| PowerSchool Holdings, Inc., Class A(1) | | 4,155 | 68,433 |
| Regis Corp.(1) | | 2,003 | 3,485 |
| StoneMor, Inc.(1) | | 2,522 | 5,750 |
| Strategic Education, Inc. | | 1,912 | 110,590 |
| Stride, Inc.(1) | | 3,159 | 105,289 |
| Udemy, Inc.(1) | | 1,074 | 20,986 |
| Vivint Smart Home, Inc.(1) | | 7,248 | 70,885 |
| WW International, Inc.(1) | | 4,129 | 66,601 |
| | | | $ 1,499,724 |
| Security | Shares | Value |
| Diversified Financial Services — 0.2% | |
| Alerus Financial Corp. | | 1,321 | $ 38,679 |
| A-Mark Precious Metals, Inc. | | 684 | 41,792 |
| Banco Latinoamericano de Comercio Exterior S.A. | | 2,614 | 43,392 |
| Cannae Holdings, Inc.(1) | | 6,497 | 228,370 |
| Marlin Business Services Corp. | | 795 | 18,508 |
| | | | $ 370,741 |
| Diversified Telecommunication Services — 0.6% | |
| Anterix, Inc.(1) | | 926 | $ 54,412 |
| ATN International, Inc. | | 967 | 38,632 |
| Bandwidth, Inc., Class A(1)(2) | | 1,790 | 128,450 |
| Cogent Communications Holdings, Inc. | | 3,270 | 239,298 |
| Consolidated Communications Holdings, Inc.(1) | | 5,584 | 41,768 |
| EchoStar Corp., Class A(1) | | 2,885 | 76,020 |
| Globalstar, Inc.(1)(2) | | 47,604 | 55,221 |
| IDT Corp., Class B(1) | | 1,470 | 64,915 |
| Iridium Communications, Inc.(1) | | 9,057 | 373,963 |
| Liberty Latin America, Ltd., Class A(1) | | 3,362 | 39,201 |
| Liberty Latin America, Ltd., Class C(1) | | 11,849 | 135,079 |
| Ooma, Inc.(1) | | 1,488 | 30,415 |
| Radius Global Infrastructure, Inc., Class A(1) | | 4,520 | 72,772 |
| Telesat Corp.(1) | | 1,000 | 28,670 |
| | | | $ 1,378,816 |
| Electric Utilities — 0.6% | |
| ALLETE, Inc. | | 4,025 | $ 267,059 |
| MGE Energy, Inc. | | 2,857 | 234,988 |
| Otter Tail Corp. | | 3,227 | 230,472 |
| PNM Resources, Inc. | | 6,714 | 306,226 |
| Portland General Electric Co. | | 7,059 | 373,562 |
| Via Renewables, Inc. | | 1,012 | 11,567 |
| | | | $ 1,423,874 |
| Electrical Equipment — 1.0% | |
| Advent Technologies Holdings, Inc.(1)(2) | | 1,339 | $ 9,386 |
| Allied Motion Technologies, Inc. | | 952 | 34,738 |
| American Superconductor Corp.(1) | | 2,255 | 24,534 |
| Array Technologies, Inc.(1) | | 10,015 | 157,135 |
| Atkore, Inc.(1) | | 3,535 | 393,057 |
| AZZ, Inc. | | 2,055 | 113,621 |
| Babcock & Wilcox Enterprises, Inc.(1) | | 4,352 | 39,255 |
| Beam Global(1)(2) | | 689 | 12,815 |
| Blink Charging Co.(1)(2) | | 2,863 | 75,898 |
| Bloom Energy Corp., Class A(1)(2) | | 10,919 | 239,454 |
| Encore Wire Corp. | | 1,578 | 225,812 |
| EnerSys | | 3,363 | 265,879 |
15
See Notes to Financial Statements.
Calvert
VP Russell 2000® Small Cap Index Portfolio
December 31, 2021
Schedule of Investments — continued
| Security | Shares | Value |
| Electrical Equipment (continued) | |
| Eos Energy Enterprises, Inc.(1)(2) | | 3,294 | $ 24,771 |
| FTC Solar, Inc.(1) | | 1,491 | 11,272 |
| FuelCell Energy, Inc.(1)(2) | | 28,578 | 148,606 |
| GrafTech International, Ltd. | | 15,608 | 184,643 |
| Powell Industries, Inc. | | 811 | 23,916 |
| Preformed Line Products Co. | | 222 | 14,363 |
| Romeo Power, Inc.(1)(2) | | 9,655 | 35,241 |
| Stem, Inc.(1) | | 8,813 | 167,183 |
| Thermon Group Holdings, Inc.(1) | | 2,669 | 45,186 |
| TPI Composites, Inc.(1) | | 2,801 | 41,903 |
| Vicor Corp.(1) | | 1,651 | 209,644 |
| | | | $ 2,498,312 |
| Electronic Equipment, Instruments & Components — 2.2% | |
| 908 Devices, Inc.(1) | | 1,442 | $ 37,305 |
| Advanced Energy Industries, Inc. | | 2,950 | 268,627 |
| Aeva Technologies, Inc.(1)(2) | | 8,168 | 61,750 |
| Akoustis Technologies, Inc.(1)(2) | | 2,785 | 18,604 |
| Arlo Technologies, Inc.(1) | | 6,268 | 65,751 |
| Badger Meter, Inc. | | 2,290 | 244,022 |
| Belden, Inc. | | 3,469 | 228,017 |
| Benchmark Electronics, Inc. | | 2,968 | 80,433 |
| CTS Corp. | | 2,503 | 91,910 |
| Daktronics, Inc.(1) | | 2,960 | 14,948 |
| ePlus, Inc.(1) | | 2,086 | 112,394 |
| Fabrinet (1) | | 2,899 | 343,445 |
| FARO Technologies, Inc.(1) | | 1,514 | 106,010 |
| Identiv, Inc.(1) | | 1,620 | 45,587 |
| II-VI, Inc.(1)(2) | | 8,179 | 558,871 |
| Insight Enterprises, Inc.(1) | | 2,644 | 281,850 |
| Iteris, Inc.(1) | | 3,527 | 14,108 |
| Itron, Inc.(1) | | 3,579 | 245,233 |
| Kimball Electronics, Inc.(1) | | 2,097 | 45,631 |
| Knowles Corp.(1) | | 7,204 | 168,213 |
| Luna Innovations, Inc.(1) | | 2,558 | 21,590 |
| Methode Electronics, Inc. | | 2,986 | 146,822 |
| MicroVision, Inc.(1)(2) | | 12,416 | 62,204 |
| Napco Security Technologies, Inc.(1) | | 1,045 | 52,229 |
| nLight, Inc.(1) | | 3,335 | 79,873 |
| Novanta, Inc.(1) | | 2,760 | 486,671 |
| OSI Systems, Inc.(1) | | 1,328 | 123,770 |
| Ouster, Inc.(1)(2) | | 12,105 | 62,946 |
| PAR Technology Corp.(1)(2) | | 1,860 | 98,152 |
| PC Connection, Inc. | | 941 | 40,585 |
| Plexus Corp.(1) | | 2,220 | 212,876 |
| Rogers Corp.(1) | | 1,467 | 400,491 |
| Sanmina Corp.(1) | | 5,037 | 208,834 |
| Security | Shares | Value |
| Electronic Equipment, Instruments & Components (continued) | |
| ScanSource, Inc.(1) | | 2,089 | $ 73,282 |
| TTM Technologies, Inc.(1) | | 8,062 | 120,124 |
| Velodyne Lidar, Inc.(1) | | 5,543 | 25,719 |
| Vishay Intertechnology, Inc. | | 10,456 | 228,673 |
| Vishay Precision Group, Inc.(1) | | 1,011 | 37,528 |
| | | | $ 5,515,078 |
| Energy Equipment & Services — 0.7% | |
| Archrock, Inc. | | 11,297 | $ 84,502 |
| Aspen Aerogels, Inc.(1) | | 1,806 | 89,921 |
| Bristow Group, Inc.(1) | | 1,813 | 57,418 |
| Cactus, Inc., Class A | | 4,280 | 163,196 |
| ChampionX Corp.(1) | | 15,905 | 321,440 |
| DMC Global, Inc.(1) | | 1,457 | 57,712 |
| Dril-Quip, Inc.(1) | | 2,927 | 57,603 |
| Expro Group Holdings NV(1) | | 3,593 | 51,559 |
| FTS International, Inc., Class A(1) | | 697 | 18,296 |
| Helix Energy Solutions Group, Inc.(1) | | 12,468 | 38,900 |
| Helmerich & Payne, Inc. | | 8,257 | 195,691 |
| Liberty Oilfield Services, Inc., Class A(1) | | 6,846 | 66,406 |
| Nabors Industries, Ltd.(1) | | 552 | 44,762 |
| National Energy Services Reunited Corp.(1)(2) | | 2,911 | 27,509 |
| Newpark Resources, Inc.(1) | | 7,671 | 22,553 |
| NexTier Oilfield Solutions, Inc.(1) | | 13,416 | 47,627 |
| Oceaneering International, Inc.(1) | | 7,810 | 88,331 |
| Oil States International, Inc.(1) | | 5,061 | 25,153 |
| Patterson-UTI Energy, Inc. | | 14,898 | 125,888 |
| ProPetro Holding Corp.(1) | | 6,820 | 55,242 |
| RPC, Inc.(1) | | 5,124 | 23,263 |
| Select Energy Services, Inc., Class A(1) | | 5,076 | 31,623 |
| Solaris Oilfield Infrastructure, Inc., Class A | | 2,541 | 16,644 |
| TETRA Technologies, Inc.(1) | | 9,623 | 27,329 |
| Tidewater, Inc.(1) | | 3,229 | 34,583 |
| US Silica Holdings, Inc.(1) | | 5,760 | 54,144 |
| | | | $ 1,827,295 |
| Entertainment — 0.7% | |
| AMC Entertainment Holdings, Inc., Class A(1) | | 40,288 | $ 1,095,834 |
| Chicken Soup for the Soul Entertainment, Inc.(1) | | 902 | 12,484 |
| Cinemark Holdings, Inc.(1)(2) | | 8,475 | 136,617 |
| CuriosityStream, Inc.(1) | | 2,040 | 12,097 |
| Eros STX Global Corp.(1) | | 24,908 | 5,970 |
| IMAX Corp.(1) | | 3,908 | 69,719 |
| Liberty Braves Group, Series A(1)(2) | | 713 | 20,499 |
| Liberty Braves Group, Series C(1) | | 3,012 | 84,637 |
| Lions Gate Entertainment Corp., Class A(1) | | 4,567 | 75,995 |
16
See Notes to Financial Statements.
Calvert
VP Russell 2000® Small Cap Index Portfolio
December 31, 2021
Schedule of Investments — continued
| Security | Shares | Value |
| Entertainment (continued) | |
| Lions Gate Entertainment Corp., Class B(1) | | 9,036 | $ 139,064 |
| LiveXLive Media, Inc.(1) | | 4,111 | 5,262 |
| Madison Square Garden Entertainment Corp.(1)(2) | | 2,038 | 143,353 |
| Marcus Corp. (The)(1)(2) | | 1,876 | 33,505 |
| | | | $ 1,835,036 |
| Equity Real Estate Investment Trusts (REITs) — 6.3% | |
| Acadia Realty Trust | | 6,900 | $ 150,627 |
| Agree Realty Corp. | | 5,274 | 376,353 |
| Alexander & Baldwin, Inc. | | 5,556 | 139,400 |
| Alexander's, Inc. | | 184 | 47,895 |
| American Assets Trust, Inc. | | 3,916 | 146,968 |
| American Finance Trust, Inc. | | 9,434 | 86,132 |
| Apartment Investment and Management Co., Class A(1) | | 11,681 | 90,177 |
| Apple Hospitality REIT, Inc. | | 16,468 | 265,958 |
| Armada Hoffler Properties, Inc. | | 4,892 | 74,456 |
| Ashford Hospitality Trust, Inc.(1) | | 858 | 8,237 |
| Braemar Hotels & Resorts, Inc.(1) | | 3,489 | 17,794 |
| Brandywine Realty Trust | | 13,308 | 178,593 |
| Broadstone Net Lease, Inc. | | 12,287 | 304,963 |
| BRT Apartments Corp. | | 682 | 16,361 |
| CareTrust REIT, Inc. | | 7,568 | 172,777 |
| CatchMark Timber Trust, Inc., Class A | | 4,393 | 38,263 |
| Centerspace | | 1,104 | 122,434 |
| Chatham Lodging Trust(1) | | 3,800 | 52,136 |
| City Office REIT, Inc. | | 3,686 | 72,688 |
| Clipper Realty, Inc. | | 1,313 | 13,051 |
| Community Healthcare Trust, Inc. | | 1,862 | 88,017 |
| CorePoint Lodging, Inc.(1) | | 3,016 | 47,351 |
| Corporate Office Properties Trust | | 8,859 | 247,786 |
| CTO Realty Growth, Inc.(2) | | 466 | 28,622 |
| DiamondRock Hospitality Co.(1) | | 16,248 | 156,143 |
| DigitalBridge Group, Inc.(1) | | 37,494 | 312,325 |
| Diversified Healthcare Trust | | 18,611 | 57,508 |
| Douglas Elliman, Inc.(1) | | 5,632 | 64,768 |
| Easterly Government Properties, Inc. | | 6,683 | 153,174 |
| EastGroup Properties, Inc. | | 3,111 | 708,841 |
| Empire State Realty Trust, Inc., Class A | | 11,214 | 99,805 |
| Equity Commonwealth(1) | | 9,198 | 238,228 |
| Essential Properties Realty Trust, Inc. | | 9,181 | 264,688 |
| Farmland Partners, Inc. | | 2,123 | 25,370 |
| Four Corners Property Trust, Inc. | | 5,983 | 175,960 |
| Franklin Street Properties Corp. | | 9,022 | 53,681 |
| GEO Group, Inc. (The)(2) | | 9,238 | 71,595 |
| Getty Realty Corp. | | 2,913 | 93,478 |
| Gladstone Commercial Corp. | | 2,560 | 65,971 |
| Gladstone Land Corp.(2) | | 2,199 | 74,238 |
| Security | Shares | Value |
| Equity Real Estate Investment Trusts (REITs) (continued) | |
| Global Medical REIT, Inc. | | 4,446 | $ 78,917 |
| Global Net Lease, Inc. | | 8,143 | 124,425 |
| Healthcare Realty Trust, Inc. | | 11,320 | 358,165 |
| Hersha Hospitality Trust(1) | | 3,227 | 29,592 |
| Independence Realty Trust, Inc. | | 8,416 | 217,385 |
| Indus Realty Trust, Inc. | | 445 | 36,072 |
| Industrial Logistics Properties Trust | | 4,982 | 124,799 |
| Innovative Industrial Properties, Inc.(2) | | 1,855 | 487,698 |
| iStar, Inc.(2) | | 5,550 | 143,357 |
| Kite Realty Group Trust | | 16,779 | 365,447 |
| LTC Properties, Inc. | | 3,163 | 107,985 |
| LXP Industrial Trust | | 21,605 | 337,470 |
| Macerich Co. (The) | | 16,397 | 283,340 |
| Monmouth Real Estate Investment Corp. | | 7,470 | 156,945 |
| National Health Investors, Inc. | | 3,431 | 197,180 |
| National Storage Affiliates Trust | | 6,350 | 439,420 |
| NETSTREIT Corp. | | 3,112 | 71,265 |
| NexPoint Residential Trust, Inc. | | 1,745 | 146,283 |
| Office Properties Income Trust | | 3,755 | 93,274 |
| One Liberty Properties, Inc. | | 1,306 | 46,076 |
| Outfront Media, Inc. | | 11,413 | 306,097 |
| Paramount Group, Inc. | | 14,640 | 122,098 |
| Pebblebrook Hotel Trust | | 10,195 | 228,062 |
| Phillips Edison & Co., Inc. | | 1,437 | 47,478 |
| Physicians Realty Trust | | 16,980 | 319,733 |
| Piedmont Office Realty Trust, Inc., Class A | | 9,509 | 174,775 |
| Plymouth Industrial REIT, Inc. | | 2,417 | 77,344 |
| Postal Realty Trust, Inc., Class A | | 945 | 18,711 |
| PotlatchDeltic Corp. | | 5,063 | 304,894 |
| Preferred Apartment Communities, Inc., Class A | | 3,903 | 70,488 |
| PS Business Parks, Inc. | | 1,575 | 290,068 |
| Retail Opportunity Investments Corp. | | 9,412 | 184,475 |
| Retail Value, Inc. | | 1,452 | 9,322 |
| RLJ Lodging Trust | | 12,682 | 176,660 |
| RPT Realty | | 6,804 | 91,038 |
| Ryman Hospitality Properties, Inc.(1) | | 4,218 | 387,887 |
| Sabra Health Care REIT, Inc. | | 17,253 | 233,606 |
| Safehold, Inc. | | 1,606 | 128,239 |
| Saul Centers, Inc. | | 978 | 51,854 |
| Seritage Growth Properties, Class A(1)(2) | | 2,944 | 39,067 |
| Service Properties Trust | | 12,870 | 113,127 |
| SITE Centers Corp. | | 13,589 | 215,114 |
| STAG Industrial, Inc. | | 13,634 | 653,887 |
| Summit Hotel Properties, Inc.(1) | | 7,954 | 77,631 |
| Sunstone Hotel Investors, Inc.(1) | | 16,856 | 197,721 |
| Tanger Factory Outlet Centers, Inc. | | 7,847 | 151,290 |
| Terreno Realty Corp. | | 5,701 | 486,238 |
17
See Notes to Financial Statements.
Calvert
VP Russell 2000® Small Cap Index Portfolio
December 31, 2021
Schedule of Investments — continued
| Security | Shares | Value |
| Equity Real Estate Investment Trusts (REITs) (continued) | |
| UMH Properties, Inc. | | 3,128 | $ 85,488 |
| Uniti Group, Inc. | | 15,252 | 213,681 |
| Universal Health Realty Income Trust | | 1,113 | 66,190 |
| Urban Edge Properties | | 8,878 | 168,682 |
| Urstadt Biddle Properties, Inc., Class A | | 2,599 | 55,359 |
| Veris Residential, Inc.(1) | | 6,888 | 126,601 |
| Washington Real Estate Investment Trust(2) | | 6,640 | 171,644 |
| Whitestone REIT | | 3,231 | 32,730 |
| Xenia Hotels & Resorts, Inc.(1) | | 9,217 | 166,920 |
| | | | $ 15,492,106 |
| Food & Staples Retailing — 1.0% | |
| Andersons, Inc. (The) | | 2,432 | $ 94,143 |
| BJ's Wholesale Club Holdings, Inc.(1) | | 10,704 | 716,847 |
| Chefs' Warehouse, Inc. (The)(1) | | 2,573 | 85,681 |
| HF Foods Group, Inc.(1) | | 3,141 | 26,573 |
| Ingles Markets, Inc., Class A | | 1,077 | 92,988 |
| MedAvail Holdings, Inc.(1) | | 919 | 1,287 |
| Natural Grocers by Vitamin Cottage, Inc. | | 875 | 12,469 |
| Performance Food Group Co.(1) | | 11,843 | 543,475 |
| PriceSmart, Inc. | | 1,850 | 135,364 |
| Rite Aid Corp.(1)(2) | | 4,628 | 67,985 |
| SpartanNash Co. | | 2,800 | 72,128 |
| Sprouts Farmers Market, Inc.(1) | | 8,798 | 261,125 |
| United Natural Foods, Inc.(1) | | 4,376 | 214,774 |
| Village Super Market, Inc., Class A | | 640 | 14,970 |
| Weis Markets, Inc. | | 1,290 | 84,985 |
| | | | $ 2,424,794 |
| Food Products — 0.9% | |
| AppHarvest, Inc.(1)(2) | | 5,348 | $ 20,804 |
| B&G Foods, Inc. | | 5,023 | 154,357 |
| Calavo Growers, Inc. | | 1,424 | 60,378 |
| Cal-Maine Foods, Inc. | | 3,155 | 116,704 |
| Fresh Del Monte Produce, Inc. | | 2,749 | 75,872 |
| Hostess Brands, Inc.(1) | | 10,500 | 214,410 |
| J&J Snack Foods Corp. | | 1,156 | 182,602 |
| John B. Sanfilippo & Son, Inc. | | 716 | 64,555 |
| Laird Superfood, Inc.(1)(2) | | 261 | 3,403 |
| Lancaster Colony Corp. | | 1,489 | 246,578 |
| Landec Corp.(1) | | 2,282 | 25,330 |
| Limoneira Co. | | 1,228 | 18,420 |
| Mission Produce, Inc.(1) | | 2,908 | 45,656 |
| Sanderson Farms, Inc. | | 1,593 | 304,390 |
| Seneca Foods Corp., Class A(1) | | 594 | 28,482 |
| Simply Good Foods Co. (The)(1) | | 6,676 | 277,521 |
| Security | Shares | Value |
| Food Products (continued) | |
| Sovos Brands, Inc.(1) | | 1,988 | $ 29,919 |
| Tattooed Chef, Inc.(1)(2) | | 3,667 | 56,985 |
| Tootsie Roll Industries, Inc. | | 1,220 | 44,201 |
| TreeHouse Foods, Inc.(1) | | 4,077 | 165,241 |
| Utz Brands, Inc.(2) | | 4,623 | 73,737 |
| Vita Coco Co., Inc. (The)(1) | | 852 | 9,517 |
| Vital Farms, Inc.(1) | | 1,946 | 35,145 |
| Whole Earth Brands, Inc.(1) | | 2,930 | 31,468 |
| | | | $ 2,285,675 |
| Gas Utilities — 0.8% | |
| Brookfield Infrastructure Corp., Class A(2) | | 4,831 | $ 329,764 |
| Chesapeake Utilities Corp. | | 1,388 | 202,384 |
| New Jersey Resources Corp. | | 7,408 | 304,173 |
| Northwest Natural Holding Co. | | 2,394 | 116,779 |
| ONE Gas, Inc. | | 4,136 | 320,912 |
| South Jersey Industries, Inc.(2) | | 8,079 | 211,024 |
| Southwest Gas Holdings, Inc. | | 4,716 | 330,356 |
| Spire, Inc. | | 3,887 | 253,510 |
| | | | $ 2,068,902 |
| Health Care Equipment & Supplies — 3.0% | |
| Accelerate Diagnostics, Inc.(1) | | 2,287 | $ 11,938 |
| Accuray, Inc.(1) | | 6,420 | 30,623 |
| Acutus Medical, Inc.(1)(2) | | 838 | 2,858 |
| Alphatec Holdings, Inc.(1)(2) | | 5,397 | 61,688 |
| AngioDynamics, Inc.(1) | | 2,837 | 78,244 |
| Apyx Medical Corp.(1) | | 2,938 | 37,665 |
| Asensus Surgical, Inc.(1)(2) | | 18,346 | 20,364 |
| Aspira Women's Health, Inc.(1)(2) | | 6,816 | 12,064 |
| AtriCure, Inc.(1) | | 3,557 | 247,318 |
| Atrion Corp. | | 107 | 75,424 |
| Avanos Medical, Inc.(1) | | 3,690 | 127,932 |
| AxoGen, Inc.(1) | | 3,047 | 28,550 |
| Axonics, Inc.(1) | | 3,513 | 196,728 |
| BioLife Solutions, Inc.(1) | | 803 | 29,928 |
| Bioventus, Inc., Class A(1) | | 2,087 | 30,241 |
| Butterfly Network, Inc.(1) | | 9,650 | 64,558 |
| Cardiovascular Systems, Inc.(1) | | 3,081 | 57,861 |
| Cerus Corp.(1) | | 13,159 | 89,613 |
| ClearPoint Neuro, Inc.(1) | | 1,475 | 16,549 |
| CONMED Corp. | | 2,277 | 322,788 |
| CryoLife, Inc.(1) | | 3,149 | 64,082 |
| CryoPort, Inc.(1) | | 3,246 | 192,066 |
| Cue Health, Inc.(1) | | 1,127 | 15,113 |
| Cutera, Inc.(1)(2) | | 1,488 | 61,484 |
18
See Notes to Financial Statements.
Calvert
VP Russell 2000® Small Cap Index Portfolio
December 31, 2021
Schedule of Investments — continued
| Security | Shares | Value |
| Health Care Equipment & Supplies (continued) | |
| CVRx, Inc.(1) | | 623 | $ 7,619 |
| CytoSorbents Corp.(1)(2) | | 3,468 | 14,531 |
| DarioHealth Corp.(1)(2) | | 1,057 | 13,709 |
| Eargo, Inc.(1) | | 1,514 | 7,721 |
| Glaukos Corp.(1) | | 3,577 | 158,962 |
| Haemonetics Corp.(1) | | 3,956 | 209,826 |
| Heska Corp.(1) | | 751 | 137,050 |
| Inari Medical, Inc.(1) | | 2,665 | 243,235 |
| Inogen, Inc.(1) | | 1,598 | 54,332 |
| Integer Holdings Corp.(1) | | 2,576 | 220,480 |
| Intersect ENT, Inc.(1) | | 2,690 | 73,464 |
| Invacare Corp.(1) | | 2,498 | 6,795 |
| iRadimed Corp.(1) | | 490 | 22,643 |
| iRhythm Technologies, Inc.(1) | | 2,350 | 276,571 |
| Lantheus Holdings, Inc.(1) | | 5,359 | 154,821 |
| LeMaitre Vascular, Inc. | | 1,477 | 74,190 |
| LivaNova PLC(1) | | 4,172 | 364,758 |
| Lucid Diagnostics, Inc.(1) | | 390 | 2,094 |
| Meridian Bioscience, Inc.(1) | | 3,556 | 72,542 |
| Merit Medical Systems, Inc.(1) | | 4,025 | 250,757 |
| Mesa Laboratories, Inc. | | 404 | 132,548 |
| Natus Medical, Inc.(1) | | 2,645 | 62,766 |
| Neogen Corp.(1) | | 8,253 | 374,769 |
| Neuronetics, Inc.(1) | | 1,958 | 8,733 |
| NeuroPace, Inc.(1)(2) | | 546 | 5,504 |
| Nevro Corp.(1) | | 2,713 | 219,943 |
| NuVasive, Inc.(1) | | 4,062 | 213,174 |
| OraSure Technologies, Inc.(1) | | 6,111 | 53,105 |
| Ortho Clinical Diagnostics Holdings PLC(1) | | 9,309 | 199,119 |
| Orthofix Medical, Inc.(1) | | 1,619 | 50,335 |
| OrthoPediatrics Corp.(1) | | 1,056 | 63,212 |
| Outset Medical, Inc.(1)(2) | | 3,587 | 165,325 |
| Paragon 28, Inc.(1) | | 701 | 12,401 |
| PAVmed, Inc.(1)(2) | | 5,168 | 12,713 |
| PROCEPT BioRobotics Corp.(1)(2) | | 559 | 13,981 |
| Pulmonx Corp.(1)(2) | | 1,991 | 63,851 |
| Pulse Biosciences, Inc.(1)(2) | | 1,155 | 17,106 |
| Quotient, Ltd.(1)(2) | | 5,345 | 13,844 |
| Retractable Technologies, Inc.(1)(2) | | 1,172 | 8,122 |
| RxSight, Inc.(1) | | 640 | 7,200 |
| SeaSpine Holdings Corp.(1) | | 2,490 | 33,914 |
| Senseonics Holdings, Inc.(1)(2) | | 32,570 | 86,962 |
| Shockwave Medical, Inc.(1) | | 2,637 | 470,256 |
| SI-BONE, Inc.(1) | | 2,542 | 56,458 |
| Sientra, Inc.(1) | | 4,505 | 16,533 |
| Sight Sciences, Inc.(1) | | 854 | 15,005 |
| Silk Road Medical, Inc.(1) | | 2,660 | 113,343 |
| Security | Shares | Value |
| Health Care Equipment & Supplies (continued) | |
| STAAR Surgical Co.(1) | | 3,713 | $ 338,997 |
| Stereotaxis, Inc.(1) | | 3,905 | 24,211 |
| SurModics, Inc.(1) | | 1,145 | 55,132 |
| Tactile Systems Technology, Inc.(1) | | 1,650 | 31,399 |
| Talis Biomedical Corp.(1) | | 1,077 | 4,319 |
| TransMedics Group, Inc.(1) | | 2,122 | 40,658 |
| Treace Medical Concepts, Inc.(1) | | 2,325 | 43,338 |
| Utah Medical Products, Inc. | | 296 | 29,600 |
| Vapotherm, Inc.(1) | | 1,694 | 35,083 |
| Varex Imaging Corp.(1) | | 2,939 | 92,725 |
| ViewRay, Inc.(1) | | 10,682 | 58,858 |
| Zynex, Inc.(1)(2) | | 1,374 | 13,699 |
| | | | $ 7,500,020 |
| Health Care Providers & Services — 2.8% | |
| 1Life Healthcare, Inc.(1) | | 9,143 | $ 160,643 |
| Accolade, Inc.(1) | | 3,947 | 104,043 |
| AdaptHealth Corp.(1) | | 5,494 | 134,383 |
| Addus HomeCare Corp.(1) | | 1,220 | 114,082 |
| Agiliti, Inc.(1) | | 1,772 | 41,040 |
| AirSculpt Technologies, Inc.(1)(2) | | 508 | 8,733 |
| Alignment Healthcare, Inc.(1) | | 6,131 | 86,202 |
| AMN Healthcare Services, Inc.(1) | | 3,697 | 452,254 |
| Apollo Medical Holdings, Inc.(1) | | 2,944 | 216,325 |
| Apria, Inc.(1) | | 1,517 | 49,454 |
| Aveanna Healthcare Holdings, Inc.(1) | | 3,026 | 22,392 |
| Biodesix, Inc.(1) | | 963 | 5,094 |
| Brookdale Senior Living, Inc.(1) | | 14,512 | 74,882 |
| Castle Biosciences, Inc.(1) | | 1,671 | 71,636 |
| Community Health Systems, Inc.(1) | | 9,743 | 129,679 |
| CorVel Corp.(1) | | 676 | 140,608 |
| Covetrus, Inc.(1) | | 8,115 | 162,057 |
| Cross Country Healthcare, Inc.(1) | | 2,877 | 79,866 |
| Ensign Group, Inc. (The) | | 4,029 | 338,275 |
| Fulgent Genetics, Inc.(1)(2) | | 1,591 | 160,039 |
| Hanger, Inc.(1) | | 3,196 | 57,943 |
| HealthEquity, Inc.(1) | | 6,415 | 283,800 |
| InfuSystem Holdings, Inc.(1) | | 1,278 | 21,764 |
| Innovage Holding Corp.(1) | | 1,437 | 7,185 |
| Joint Corp. (The)(1) | | 1,060 | 69,631 |
| LHC Group, Inc.(1) | | 2,395 | 328,666 |
| LifeStance Health Group, Inc.(1) | | 3,559 | 33,882 |
| Magellan Health, Inc.(1) | | 1,861 | 176,776 |
| MEDNAX, Inc.(1) | | 5,969 | 162,416 |
| ModivCare, Inc.(1) | | 983 | 145,769 |
| National HealthCare Corp. | | 1,074 | 72,968 |
| National Research Corp. | | 1,192 | 49,492 |
19
See Notes to Financial Statements.
Calvert
VP Russell 2000® Small Cap Index Portfolio
December 31, 2021
Schedule of Investments — continued
| Security | Shares | Value |
| Health Care Providers & Services (continued) | |
| Ontrak, Inc.(1) | | 623 | $ 3,919 |
| Option Care Health, Inc.(1) | | 12,287 | 349,442 |
| Owens & Minor, Inc. | | 5,688 | 247,428 |
| Patterson Cos., Inc. | | 6,720 | 197,232 |
| Pennant Group, Inc. (The)(1) | | 2,149 | 49,599 |
| PetIQ, Inc.(1)(2) | | 2,070 | 47,010 |
| Privia Health Group, Inc.(1) | | 1,537 | 39,762 |
| Progyny, Inc.(1) | | 4,947 | 249,081 |
| R1 RCM, Inc.(1) | | 9,108 | 232,163 |
| RadNet, Inc.(1) | | 3,530 | 106,288 |
| Select Medical Holdings Corp. | | 8,471 | 249,047 |
| Sharps Compliance Corp.(1) | | 1,261 | 8,991 |
| SOC Telemed, Inc.(1)(2) | | 3,210 | 4,109 |
| Surgery Partners, Inc.(1) | | 2,485 | 132,724 |
| Tenet Healthcare Corp.(1) | | 8,293 | 677,455 |
| Tivity Health, Inc.(1) | | 3,730 | 98,621 |
| Triple-S Management Corp., Class B(1) | | 1,726 | 61,584 |
| US Physical Therapy, Inc. | | 1,002 | 95,741 |
| Viemed Healthcare, Inc.(1) | | 3,037 | 15,853 |
| | | | $ 6,828,028 |
| Health Care Technology — 1.1% | |
| Allscripts Healthcare Solutions, Inc.(1) | | 9,502 | $ 175,312 |
| American Well Corp., Class A(1) | | 14,037 | 84,784 |
| Castlight Health, Inc., Class B(1) | | 9,363 | 14,419 |
| Computer Programs and Systems, Inc.(1) | | 938 | 27,483 |
| Convey Health Solutions Holdings, Inc.(1) | | 1,032 | 8,628 |
| Evolent Health, Inc., Class A(1) | | 6,141 | 169,921 |
| Forian, Inc.(1) | | 1,423 | 12,835 |
| Health Catalyst, Inc.(1)(2) | | 4,079 | 161,610 |
| HealthStream, Inc.(1) | | 1,939 | 51,112 |
| iCad, Inc.(1) | | 1,776 | 12,787 |
| Inspire Medical Systems, Inc.(1) | | 2,102 | 483,586 |
| Multiplan Corp.(1)(2) | | 29,434 | 130,393 |
| NantHealth, Inc.(1) | | 2,382 | 2,513 |
| NextGen Healthcare, Inc.(1) | | 4,587 | 81,603 |
| Omnicell, Inc.(1) | | 3,419 | 616,924 |
| OptimizeRx Corp.(1) | | 1,258 | 78,134 |
| Phreesia, Inc.(1) | | 3,747 | 156,100 |
| Schrodinger, Inc.(1) | | 3,553 | 123,751 |
| Simulations Plus, Inc.(2) | | 1,252 | 59,220 |
| Tabula Rasa HealthCare, Inc.(1) | | 1,809 | 27,135 |
| Vocera Communications, Inc.(1) | | 2,799 | 181,487 |
| | | | $ 2,659,737 |
| Security | Shares | Value |
| Hotels, Restaurants & Leisure — 2.2% | |
| Accel Entertainment, Inc.(1) | | 4,464 | $ 58,121 |
| Bally's Corp.(1) | | 2,560 | 97,434 |
| Biglari Holdings, Inc., Class B(1) | | 80 | 11,406 |
| BJ's Restaurants, Inc.(1) | | 1,896 | 65,507 |
| Bloomin' Brands, Inc.(1) | | 7,121 | 149,399 |
| Bluegreen Vacations Holding Corp.(1) | | 1,107 | 38,856 |
| Brinker International, Inc.(1) | | 3,483 | 127,443 |
| Carrols Restaurant Group, Inc. | | 3,096 | 9,164 |
| Century Casinos, Inc.(1) | | 1,662 | 20,243 |
| Cheesecake Factory, Inc. (The)(1) | | 3,448 | 134,989 |
| Chuy's Holdings, Inc.(1) | | 1,681 | 50,632 |
| Cracker Barrel Old Country Store, Inc. | | 1,860 | 239,270 |
| Dave & Buster's Entertainment, Inc.(1) | | 3,314 | 127,258 |
| Del Taco Restaurants, Inc. | | 2,895 | 36,043 |
| Denny's Corp.(1) | | 4,997 | 79,952 |
| Dine Brands Global, Inc. | | 1,363 | 103,329 |
| Drive Shack, Inc.(1) | | 6,477 | 9,262 |
| El Pollo Loco Holdings, Inc.(1) | | 1,580 | 22,420 |
| Esports Technologies, Inc.(1) | | 849 | 17,455 |
| Everi Holdings, Inc.(1) | | 6,554 | 139,928 |
| F45 Training Holdings, Inc.(1) | | 1,571 | 17,108 |
| Fiesta Restaurant Group, Inc.(1) | | 1,520 | 16,735 |
| First Watch Restaurant Group, Inc.(1) | | 848 | 14,213 |
| Full House Resorts, Inc.(1) | | 2,565 | 31,062 |
| GAN, Ltd.(1) | | 3,146 | 28,912 |
| Golden Entertainment, Inc.(1) | | 1,501 | 75,846 |
| Golden Nugget Online Gaming, Inc.(1) | | 3,058 | 30,427 |
| Hall of Fame Resort & Entertainment Co.(1) | | 4,311 | 6,553 |
| Hilton Grand Vacations, Inc.(1) | | 6,710 | 349,658 |
| International Game Technology PLC(2) | | 7,729 | 223,445 |
| Jack in the Box, Inc. | | 1,673 | 146,354 |
| Krispy Kreme, Inc. | | 1,684 | 31,861 |
| Kura Sushi USA, Inc., Class A(1) | | 280 | 22,635 |
| Life Time Group Holdings, Inc.(1) | | 3,007 | 51,751 |
| Lindblad Expeditions Holdings, Inc.(1)(2) | | 2,177 | 33,961 |
| Monarch Casino & Resort, Inc.(1) | | 1,097 | 81,123 |
| Nathan's Famous, Inc. | | 237 | 13,838 |
| NeoGames S.A.(1) | | 799 | 22,196 |
| Noodles & Co.(1) | | 3,189 | 28,924 |
| ONE Group Hospitality, Inc. (The)(1) | | 1,532 | 19,319 |
| Papa John's International, Inc. | | 2,594 | 346,221 |
| PlayAGS, Inc.(1) | | 1,838 | 12,480 |
| Portillo's, Inc., Class A(1) | | 1,818 | 68,248 |
| RCI Hospitality Holdings, Inc. | | 655 | 51,011 |
| Red Robin Gourmet Burgers, Inc.(1) | | 1,310 | 21,654 |
| Red Rock Resorts, Inc., Class A | | 4,611 | 253,651 |
20
See Notes to Financial Statements.
Calvert
VP Russell 2000® Small Cap Index Portfolio
December 31, 2021
Schedule of Investments — continued
| Security | Shares | Value |
| Hotels, Restaurants & Leisure (continued) | |
| Rush Street Interactive, Inc.(1) | | 4,103 | $ 67,700 |
| Ruth's Hospitality Group, Inc.(1) | | 2,742 | 54,566 |
| Scientific Games Corp., Class A(1) | | 7,513 | 502,094 |
| SeaWorld Entertainment, Inc.(1) | | 3,949 | 256,132 |
| Shake Shack, Inc., Class A(1) | | 2,959 | 213,522 |
| Target Hospitality Corp.(1) | | 2,913 | 10,370 |
| Texas Roadhouse, Inc. | | 5,477 | 488,987 |
| Wingstop, Inc. | | 2,288 | 395,366 |
| Xponential Fitness, Inc., Class A(1) | | 710 | 14,512 |
| | | | $ 5,540,546 |
| Household Durables — 1.9% | |
| Aterian, Inc.(1) | | 1,551 | $ 6,375 |
| Bassett Furniture Industries, Inc. | | 730 | 12,242 |
| Beazer Homes USA, Inc.(1) | | 2,263 | 52,547 |
| Casper Sleep, Inc.(1) | | 2,157 | 14,409 |
| Cavco Industries, Inc.(1) | | 708 | 224,896 |
| Century Communities, Inc. | | 2,378 | 194,497 |
| Ethan Allen Interiors, Inc. | | 1,924 | 50,582 |
| Flexsteel Industries, Inc. | | 521 | 13,994 |
| GoPro, Inc., Class A(1) | | 10,449 | 107,729 |
| Green Brick Partners, Inc.(1) | | 2,495 | 75,673 |
| Hamilton Beach Brands Holding Co., Class A | | 584 | 8,386 |
| Helen of Troy, Ltd.(1) | | 1,886 | 461,070 |
| Hooker Furnishings Corp. | | 834 | 19,415 |
| Hovnanian Enterprises, Inc., Class A(1) | | 401 | 51,043 |
| Installed Building Products, Inc. | | 1,819 | 254,151 |
| iRobot Corp.(1) | | 2,193 | 144,475 |
| KB Home | | 6,143 | 274,776 |
| Landsea Homes Corp.(1) | | 471 | 3,448 |
| La-Z-Boy, Inc. | | 3,625 | 131,624 |
| Legacy Housing Corp.(1) | | 380 | 10,059 |
| LGI Homes, Inc.(1) | | 1,679 | 259,372 |
| Lifetime Brands, Inc. | | 858 | 13,702 |
| Lovesac Co. (The)(1) | | 1,001 | 66,326 |
| M / I Homes, Inc.(1) | | 2,268 | 141,024 |
| MDC Holdings, Inc. | | 4,484 | 250,342 |
| Meritage Homes Corp.(1) | | 2,857 | 348,725 |
| Purple Innovation, Inc.(1)(2) | | 4,415 | 58,587 |
| Skyline Champion Corp.(1) | | 4,028 | 318,131 |
| Snap One Holdings Corp.(1) | | 1,018 | 21,459 |
| Sonos, Inc.(1) | | 9,429 | 280,984 |
| Taylor Morrison Home Corp.(1) | | 9,353 | 326,981 |
| Traeger, Inc.(1) | | 1,729 | 21,025 |
| TRI Pointe Homes, Inc.(1) | | 8,664 | 241,639 |
| Tupperware Brands Corp.(1) | | 4,044 | 61,833 |
| Universal Electronics, Inc.(1) | | 1,001 | 40,791 |
| Security | Shares | Value |
| Household Durables (continued) | |
| VOXX International Corp.(1) | | 1,752 | $ 17,818 |
| Vuzix Corp.(1) | | 4,601 | 39,891 |
| Weber, Inc., Class A | | 1,304 | 16,861 |
| | | | $ 4,636,882 |
| Household Products — 0.3% | |
| Central Garden & Pet Co.(1) | | 789 | $ 41,525 |
| Central Garden & Pet Co., Class A(1) | | 3,253 | 155,656 |
| Energizer Holdings, Inc. | | 5,338 | 214,054 |
| Oil-Dri Corp. of America | | 406 | 13,288 |
| WD-40 Co.(2) | | 1,071 | 262,010 |
| | | | $ 686,533 |
| Independent Power and Renewable Electricity Producers — 0.3% | |
| Clearway Energy, Inc., Class A | | 2,672 | $ 89,458 |
| Clearway Energy, Inc., Class C | | 6,435 | 231,853 |
| Ormat Technologies, Inc.(2) | | 3,562 | 282,467 |
| Sunnova Energy International, Inc.(1) | | 6,748 | 188,404 |
| | | | $ 792,182 |
| Insurance — 1.9% | |
| Ambac Financial Group, Inc.(1) | | 3,798 | $ 60,958 |
| American Equity Investment Life Holding Co. | | 6,343 | 246,870 |
| American National Group, Inc. | | 584 | 110,283 |
| AMERISAFE, Inc. | | 1,636 | 88,066 |
| Argo Group International Holdings, Ltd. | | 2,431 | 141,265 |
| Bright Health Group, Inc.(1) | | 4,069 | 13,997 |
| BRP Group, Inc., Class A(1) | | 3,625 | 130,899 |
| Citizens, Inc.(1) | | 4,427 | 23,507 |
| CNO Financial Group, Inc. | | 9,779 | 233,131 |
| Crawford & Co., Class A | | 1,459 | 10,928 |
| Donegal Group, Inc., Class A | | 916 | 13,090 |
| eHealth, Inc.(1) | | 1,915 | 48,832 |
| Employers Holdings, Inc. | | 2,341 | 96,871 |
| Enstar Group, Ltd.(1) | | 952 | 235,706 |
| Genworth Financial, Inc., Class A(1) | | 39,760 | 161,028 |
| Goosehead Insurance, Inc., Class A | | 1,389 | 180,681 |
| Greenlight Capital Re, Ltd., Class A(1) | | 2,647 | 20,752 |
| HCI Group, Inc. | | 444 | 37,092 |
| Heritage Insurance Holdings, Inc. | | 1,906 | 11,207 |
| Horace Mann Educators Corp. | | 3,199 | 123,801 |
| Independence Holding Co. | | 394 | 22,332 |
| Investors Title Co. | | 111 | 21,884 |
| James River Group Holdings, Ltd. | | 2,807 | 80,870 |
| Kinsale Capital Group, Inc. | | 1,686 | 401,082 |
| Maiden Holdings, Ltd.(1) | | 5,451 | 16,680 |
21
See Notes to Financial Statements.
Calvert
VP Russell 2000® Small Cap Index Portfolio
December 31, 2021
Schedule of Investments — continued
| Security | Shares | Value |
| Insurance (continued) | |
| MBIA, Inc.(1) | | 3,800 | $ 60,002 |
| MetroMile, Inc.(1) | | 7,444 | 16,302 |
| National Western Life Group, Inc., Class A | | 193 | 41,387 |
| NI Holdings, Inc.(1) | | 903 | 17,076 |
| Palomar Holdings, Inc.(1) | | 1,927 | 124,812 |
| ProAssurance Corp. | | 4,215 | 106,639 |
| RLI Corp. | | 3,068 | 343,923 |
| Safety Insurance Group, Inc. | | 1,197 | 101,781 |
| Selective Insurance Group, Inc. | | 4,660 | 381,840 |
| Selectquote, Inc.(1) | | 10,628 | 96,290 |
| SiriusPoint, Ltd.(1) | | 7,085 | 57,601 |
| State Auto Financial Corp. | | 1,338 | 69,161 |
| Stewart Information Services Corp. | | 2,046 | 163,128 |
| Tiptree, Inc. | | 2,311 | 31,961 |
| Trean Insurance Group, Inc.(1) | | 1,026 | 9,142 |
| Trupanion, Inc.(1)(2) | | 2,994 | 395,298 |
| United Fire Group, Inc. | | 1,866 | 43,273 |
| United Insurance Holdings Corp. | | 1,483 | 6,436 |
| Universal Insurance Holdings, Inc. | | 2,530 | 43,010 |
| | | | $ 4,640,874 |
| Interactive Media & Services — 0.5% | |
| CarGurus, Inc.(1) | | 7,351 | $ 247,288 |
| Cars.com, Inc.(1) | | 5,290 | 85,116 |
| Eventbrite, Inc., Class A(1) | | 5,885 | 102,634 |
| EverQuote, Inc., Class A(1) | | 1,239 | 19,403 |
| fuboTV, Inc.(1)(2) | | 10,311 | 160,027 |
| Liberty TripAdvisor Holdings, Inc., Class A(1) | | 6,271 | 13,608 |
| MediaAlpha, Inc., Class A(1) | | 1,490 | 23,006 |
| Outbrain, Inc.(1) | | 619 | 8,666 |
| QuinStreet, Inc.(1) | | 4,141 | 75,325 |
| Society Pass, Inc.(1) | | 245 | 2,550 |
| TrueCar, Inc.(1) | | 7,838 | 26,649 |
| Yelp, Inc.(1) | | 5,683 | 205,952 |
| Ziff Davis, Inc.(1) | | 3,400 | 376,924 |
| | | | $ 1,347,148 |
| Internet & Direct Marketing Retail — 0.5% | |
| 1-800-Flowers.com, Inc., Class A(1) | | 2,081 | $ 48,633 |
| 1stdibs.com, Inc.(1) | | 515 | 6,443 |
| aka Brands Holding Corp.(1) | | 737 | 6,817 |
| CarParts.com, Inc.(1) | | 3,715 | 41,608 |
| Duluth Holdings, Inc., Class B(1) | | 634 | 9,624 |
| Groupon, Inc.(1)(2) | | 2,006 | 46,459 |
| Lands' End, Inc.(1) | | 1,134 | 22,260 |
| Liquidity Services, Inc.(1) | | 2,122 | 46,854 |
| Security | Shares | Value |
| Internet & Direct Marketing Retail (continued) | |
| Lulu's Fashion Lounge Holdings, Inc.(1) | | 448 | $ 4,583 |
| Overstock.com, Inc.(1) | | 3,371 | 198,923 |
| PetMed Express, Inc.(2) | | 1,778 | 44,912 |
| Porch Group, Inc.(1) | | 5,911 | 92,152 |
| Quotient Technology, Inc.(1) | | 7,590 | 56,318 |
| RealReal, Inc. (The)(1)(2) | | 6,166 | 71,587 |
| Rent the Runway, Inc., Class A(1) | | 1,326 | 10,807 |
| Revolve Group, Inc.(1) | | 2,816 | 157,809 |
| Shutterstock, Inc. | | 1,794 | 198,919 |
| Stitch Fix, Inc., Class A(1) | | 6,294 | 119,082 |
| Xometry, Inc., Class A(1) | | 618 | 31,673 |
| | | | $ 1,215,463 |
| IT Services — 1.5% | |
| BigCommerce Holdings, Inc., Series 1(1) | | 3,684 | $ 130,303 |
| Brightcove, Inc.(1) | | 3,175 | 32,449 |
| Cantaloupe, Inc.(1) | | 4,569 | 40,573 |
| Cass Information Systems, Inc. | | 1,244 | 48,914 |
| Conduent, Inc.(1) | | 13,421 | 71,668 |
| CSG Systems International, Inc. | | 2,496 | 143,820 |
| DigitalOcean Holdings, Inc.(1) | | 3,898 | 313,126 |
| EVERTEC, Inc. | | 4,750 | 237,405 |
| Evo Payments, Inc., Class A(1) | | 3,485 | 89,216 |
| ExlService Holdings, Inc.(1) | | 2,575 | 372,783 |
| Flywire Corp.(1) | | 4,869 | 185,314 |
| GreenBox POS(1) | | 1,362 | 5,720 |
| Grid Dynamics Holdings, Inc.(1) | | 3,515 | 133,465 |
| Hackett Group, Inc. (The) | | 1,931 | 39,643 |
| I3 Verticals, Inc., Class A(1) | | 1,552 | 35,370 |
| IBEX Holdings, Ltd.(1) | | 410 | 5,285 |
| International Money Express, Inc.(1) | | 2,539 | 40,522 |
| Limelight Networks, Inc.(1) | | 10,253 | 35,168 |
| LiveRamp Holdings, Inc.(1) | | 5,104 | 244,737 |
| MAXIMUS, Inc. | | 4,809 | 383,133 |
| MoneyGram International, Inc.(1) | | 6,865 | 54,165 |
| Paya Holdings, Inc.(1) | | 6,446 | 40,868 |
| Perficient, Inc.(1) | | 2,495 | 322,579 |
| Priority Technology Holdings, Inc.(1) | | 578 | 4,092 |
| Rackspace Technology, Inc.(1) | | 4,217 | 56,803 |
| Remitly Global, Inc.(1) | | 949 | 19,568 |
| Repay Holdings Corp.(1)(2) | | 6,641 | 121,331 |
| StarTek, Inc.(1) | | 1,434 | 7,485 |
| TTEC Holdings, Inc. | | 1,476 | 133,652 |
| Tucows, Inc., Class A(1) | | 790 | 66,218 |
| Unisys Corp.(1) | | 5,033 | 103,529 |
22
See Notes to Financial Statements.
Calvert
VP Russell 2000® Small Cap Index Portfolio
December 31, 2021
Schedule of Investments — continued
| Security | Shares | Value |
| IT Services (continued) | |
| Verra Mobility Corp.(1) | | 11,124 | $ 171,643 |
| | | | $ 3,690,547 |
| Leisure Products — 0.5% | |
| Acushnet Holdings Corp. | | 2,628 | $ 139,494 |
| American Outdoor Brands, Inc.(1) | | 1,183 | 23,577 |
| AMMO, Inc.(1)(2) | | 6,601 | 35,975 |
| Callaway Golf Co.(1) | | 9,076 | 249,045 |
| Clarus Corp. | | 1,811 | 50,201 |
| Escalade, Inc. | | 888 | 14,022 |
| Genius Brands International, Inc.(1)(2) | | 22,131 | 23,238 |
| Johnson Outdoors, Inc., Class A | | 405 | 37,944 |
| Latham Group, Inc.(1) | | 2,466 | 61,724 |
| Malibu Boats, Inc., Class A(1) | | 1,589 | 109,212 |
| Marine Products Corp. | | 813 | 10,163 |
| MasterCraft Boat Holdings, Inc.(1) | | 1,615 | 45,753 |
| Nautilus, Inc.(1)(2) | | 2,617 | 16,042 |
| Smith + Wesson Brands, Inc. | | 3,675 | 65,415 |
| Solo Brands, Inc., Class A(1) | | 906 | 14,161 |
| Sturm Ruger & Co., Inc.(2) | | 1,347 | 91,623 |
| Vista Outdoor, Inc.(1) | | 4,408 | 203,077 |
| | | | $ 1,190,666 |
| Life Sciences Tools & Services — 0.8% | |
| Absci Corp.(1) | | 1,064 | $ 8,725 |
| Akoya Biosciences, Inc.(1) | | 599 | 9,171 |
| Alpha Teknova, Inc.(1) | | 534 | 10,936 |
| Berkeley Lights, Inc.(1)(2) | | 3,760 | 68,357 |
| Bionano Genomics, Inc.(1)(2) | | 22,055 | 65,944 |
| ChromaDex Corp.(1) | | 3,310 | 12,379 |
| Codex DNA, Inc.(1)(2) | | 595 | 6,426 |
| Codexis, Inc.(1) | | 4,645 | 145,249 |
| Cytek Biosciences, Inc.(1) | | 1,231 | 20,090 |
| Fluidigm Corp.(1)(2) | | 6,011 | 23,563 |
| Harvard Bioscience, Inc.(1) | | 3,333 | 23,498 |
| Inotiv, Inc.(1)(2) | | 1,015 | 42,701 |
| IsoPlexis Corp.(1) | | 650 | 5,974 |
| MaxCyte, Inc.(1)(2) | | 7,417 | 75,579 |
| Medpace Holdings, Inc.(1) | | 2,268 | 493,608 |
| NanoString Technologies, Inc.(1) | | 3,557 | 150,212 |
| NeoGenomics, Inc.(1) | | 8,828 | 301,211 |
| Pacific Biosciences of California, Inc.(1)(2) | | 14,908 | 305,018 |
| Personalis, Inc.(1) | | 2,791 | 39,828 |
| Quanterix Corp.(1) | | 2,420 | 102,608 |
| Rapid Micro Biosystems, Inc., Class A(1) | | 613 | 6,522 |
| Seer, Inc.(1)(2) | | 3,190 | 72,764 |
| Security | Shares | Value |
| Life Sciences Tools & Services (continued) | |
| Singular Genomics Systems, Inc.(1) | | 908 | $ 10,496 |
| | | | $ 2,000,859 |
| Machinery — 3.5% | |
| AgEagle Aerial Systems, Inc.(1)(2) | | 5,233 | $ 8,216 |
| Alamo Group, Inc. | | 804 | 118,333 |
| Albany International Corp., Class A | | 2,359 | 208,653 |
| Altra Industrial Motion Corp. | | 5,081 | 262,027 |
| Astec Industries, Inc. | | 1,870 | 129,535 |
| Barnes Group, Inc. | | 3,822 | 178,067 |
| Blue Bird Corp.(1) | | 1,311 | 20,504 |
| Chart Industries, Inc.(1) | | 2,855 | 455,344 |
| CIRCOR International, Inc.(1) | | 1,669 | 45,363 |
| Columbus McKinnon Corp. | | 2,183 | 100,986 |
| Commercial Vehicle Group, Inc.(1) | | 2,513 | 20,255 |
| Desktop Metal, Inc., Class A(1)(2) | | 13,685 | 67,741 |
| Douglas Dynamics, Inc. | | 1,952 | 76,245 |
| Energy Recovery, Inc.(1) | | 3,367 | 72,357 |
| Enerpac Tool Group Corp. | | 4,678 | 94,870 |
| EnPro Industries, Inc. | | 1,619 | 178,203 |
| ESCO Technologies, Inc. | | 1,961 | 176,470 |
| Evoqua Water Technologies Corp.(1) | | 9,075 | 424,256 |
| Federal Signal Corp. | | 4,620 | 200,231 |
| Franklin Electric Co., Inc. | | 3,555 | 336,161 |
| Gorman-Rupp Co. (The) | | 1,774 | 79,032 |
| Greenbrier Cos., Inc. (The) | | 2,622 | 120,323 |
| Helios Technologies, Inc. | | 2,542 | 267,342 |
| Hillenbrand, Inc. | | 5,594 | 290,832 |
| Hydrofarm Holdings Group, Inc.(1) | | 2,984 | 84,417 |
| Hyliion Holdings Corp.(1)(2) | | 9,193 | 56,997 |
| Hyster-Yale Materials Handling, Inc. | | 806 | 33,127 |
| Ideanomics, Inc.(1)(2) | | 32,035 | 38,442 |
| John Bean Technologies Corp. | | 2,461 | 377,911 |
| Kadant, Inc. | | 883 | 203,514 |
| Kennametal, Inc. | | 6,410 | 230,183 |
| Lindsay Corp. | | 855 | 129,960 |
| Luxfer Holdings PLC | | 2,400 | 46,344 |
| Manitowoc Co., Inc. (The)(1) | | 2,727 | 50,695 |
| Mayville Engineering Co., Inc.(1) | | 556 | 8,290 |
| Meritor, Inc.(1) | | 5,202 | 128,905 |
| Miller Industries, Inc. | | 1,050 | 35,070 |
| Mueller Industries, Inc. | | 4,308 | 255,723 |
| Mueller Water Products, Inc., Class A | | 12,351 | 177,854 |
| Nikola Corp.(1) | | 17,252 | 170,277 |
| NN, Inc.(1) | | 3,488 | 14,301 |
| Omega Flex, Inc. | | 248 | 31,484 |
| Park-Ohio Holdings Corp. | | 726 | 15,369 |
23
See Notes to Financial Statements.
Calvert
VP Russell 2000® Small Cap Index Portfolio
December 31, 2021
Schedule of Investments — continued
| Security | Shares | Value |
| Machinery (continued) | |
| Proto Labs, Inc.(1) | | 2,175 | $ 111,686 |
| RBC Bearings, Inc.(1) | | 2,180 | 440,295 |
| REV Group, Inc. | | 2,574 | 36,422 |
| Shyft Group, Inc. (The) | | 2,714 | 133,339 |
| SPX Corp.(1) | | 3,497 | 208,701 |
| SPX FLOW, Inc. | | 3,305 | 285,816 |
| Standex International Corp. | | 1,000 | 110,660 |
| Tennant Co. | | 1,415 | 114,672 |
| Terex Corp. | | 5,366 | 235,836 |
| Titan International, Inc.(1) | | 3,959 | 43,391 |
| Trinity Industries, Inc. | | 6,042 | 182,468 |
| Wabash National Corp. | | 3,910 | 76,323 |
| Watts Water Technologies, Inc., Class A | | 2,158 | 419,019 |
| Welbilt, Inc.(1) | | 10,023 | 238,247 |
| | | | $ 8,657,084 |
| Marine — 0.2% | |
| Costamare, Inc. | | 4,298 | $ 54,370 |
| Eagle Bulk Shipping, Inc. | | 653 | 29,712 |
| Genco Shipping & Trading, Ltd. | | 2,519 | 40,304 |
| Matson, Inc. | | 3,214 | 289,356 |
| Safe Bulkers, Inc.(1) | | 4,225 | 15,928 |
| | | | $ 429,670 |
| Media — 0.9% | |
| Advantage Solutions, Inc.(1)(2) | | 5,990 | $ 48,040 |
| AMC Networks, Inc., Class A(1) | | 2,381 | 82,002 |
| Audacy, Inc.(1) | | 10,833 | 27,841 |
| Boston Omaha Corp., Class A(1) | | 1,383 | 39,734 |
| Cardlytics, Inc.(1) | | 2,507 | 165,688 |
| Clear Channel Outdoor Holdings, Inc.(1) | | 28,478 | 94,262 |
| comScore, Inc.(1) | | 4,319 | 14,425 |
| Daily Journal Corp.(1) | | 88 | 31,392 |
| Digital Media Solutions, Inc., Class A(1) | | 236 | 1,128 |
| Emerald Holding, Inc.(1) | | 2,053 | 8,150 |
| Entravision Communications Corp., Class A | | 5,618 | 38,090 |
| EW Scripps Co. (The), Class A(1) | | 4,675 | 90,461 |
| Fluent, Inc.(1) | | 2,683 | 5,339 |
| Gannett Co., Inc.(1) | | 10,067 | 53,657 |
| Gray Television, Inc. | | 6,701 | 135,092 |
| Hemisphere Media Group, Inc.(1) | | 1,449 | 10,534 |
| iHeartMedia, Inc., Class A(1) | | 8,782 | 184,773 |
| Integral Ad Science Holding Corp.(1) | | 1,301 | 28,895 |
| John Wiley & Sons, Inc., Class A | | 3,384 | 193,802 |
| Magnite, Inc.(1)(2) | | 9,955 | 174,213 |
| National CineMedia, Inc. | | 5,225 | 14,682 |
| Security | Shares | Value |
| Media (continued) | |
| Scholastic Corp. | | 2,038 | $ 81,439 |
| Sinclair Broadcast Group, Inc., Class A | | 3,764 | 99,483 |
| Stagwell, Inc.(1) | | 4,901 | 42,492 |
| TechTarget, Inc.(1) | | 1,981 | 189,502 |
| TEGNA, Inc. | | 17,344 | 321,905 |
| Thryv Holdings, Inc.(1) | | 507 | 20,853 |
| WideOpenWest, Inc.(1) | | 4,110 | 88,447 |
| | | | $ 2,286,321 |
| Metals & Mining — 1.1% | |
| Allegheny Technologies, Inc.(1) | | 9,766 | $ 155,572 |
| Arconic Corp.(1) | | 8,259 | 272,630 |
| Carpenter Technology Corp. | | 3,863 | 112,761 |
| Century Aluminum Co.(1) | | 4,377 | 72,483 |
| Coeur Mining, Inc.(1) | | 19,006 | 95,790 |
| Commercial Metals Co. | | 9,208 | 334,158 |
| Compass Minerals International, Inc. | | 2,622 | 133,932 |
| Constellium SE(1) | | 9,626 | 172,402 |
| Ferroglobe Representation & Warranty Insurance Trust(1)(4) | | 5,015 | 0 |
| Gatos Silver, Inc.(1) | | 3,557 | 36,922 |
| Haynes International, Inc. | | 1,062 | 42,831 |
| Hecla Mining Co. | | 41,687 | 217,606 |
| Kaiser Aluminum Corp. | | 1,239 | 116,392 |
| Materion Corp. | | 1,598 | 146,920 |
| MP Materials Corp.(1) | | 5,920 | 268,886 |
| Novagold Resources, Inc.(1) | | 19,333 | 132,624 |
| Olympic Steel, Inc. | | 846 | 19,881 |
| Perpetua Resources Corp.(1) | | 2,101 | 9,980 |
| PolyMet Mining Corp.(1) | | 2,264 | 5,660 |
| Ryerson Holding Corp. | | 965 | 25,138 |
| Schnitzer Steel Industries, Inc., Class A | | 2,033 | 105,553 |
| SunCoke Energy, Inc. | | 6,534 | 43,059 |
| TimkenSteel Corp.(1) | | 3,716 | 61,314 |
| Warrior Met Coal, Inc. | | 3,946 | 101,452 |
| Worthington Industries, Inc. | | 2,593 | 141,733 |
| | | | $ 2,825,679 |
| Mortgage Real Estate Investment Trusts (REITs) — 1.2% | |
| AFC Gamma, Inc. | | 569 | $ 12,950 |
| Angel Oak Mortgage, Inc. | | 557 | 9,124 |
| Apollo Commercial Real Estate Finance, Inc. | | 11,004 | 144,813 |
| Arbor Realty Trust, Inc.(2) | | 11,125 | 203,810 |
| Ares Commercial Real Estate Corp. | | 3,355 | 48,782 |
| ARMOUR Residential REIT, Inc.(2) | | 6,323 | 62,029 |
| Blackstone Mortgage Trust, Inc., Class A | | 12,289 | 376,289 |
| BrightSpire Capital, Inc. | | 6,877 | 70,558 |
24
See Notes to Financial Statements.
Calvert
VP Russell 2000® Small Cap Index Portfolio
December 31, 2021
Schedule of Investments — continued
| Security | Shares | Value |
| Mortgage Real Estate Investment Trusts (REITs) (continued) | |
| Broadmark Realty Capital, Inc.(2) | | 10,466 | $ 98,694 |
| Chimera Investment Corp. | | 18,054 | 272,254 |
| Dynex Capital, Inc.(2) | | 2,384 | 39,837 |
| Ellington Financial, Inc. | | 4,162 | 71,129 |
| Franklin BSP Realty Trust, Inc. | | 2,684 | 40,099 |
| Granite Point Mortgage Trust, Inc. | | 4,738 | 55,482 |
| Great Ajax Corp. | | 1,593 | 20,964 |
| Hannon Armstrong Sustainable Infrastructure Capital, Inc.(2) | | 5,976 | 317,445 |
| Invesco Mortgage Capital, Inc. | | 22,370 | 62,189 |
| KKR Real Estate Finance Trust, Inc. | | 2,732 | 56,908 |
| Ladder Capital Corp. | | 9,254 | 110,955 |
| MFA Financial, Inc. | | 34,716 | 158,305 |
| New York Mortgage Trust, Inc. | | 29,773 | 110,756 |
| Orchid Island Capital, Inc.(2) | | 9,475 | 42,637 |
| PennyMac Mortgage Investment Trust | | 7,980 | 138,293 |
| Ready Capital Corp. | | 4,965 | 77,603 |
| Redwood Trust, Inc. | | 9,115 | 120,227 |
| TPG RE Finance Trust, Inc. | | 5,301 | 65,308 |
| Two Harbors Investment Corp. | | 26,598 | 153,470 |
| | | | $ 2,940,910 |
| Multiline Retail — 0.4% | |
| Big Lots, Inc. | | 2,489 | $ 112,129 |
| Dillard's, Inc., Class A | | 451 | 110,504 |
| Franchise Group, Inc. | | 2,222 | 115,900 |
| Macy's, Inc. | | 24,537 | 642,379 |
| | | | $ 980,912 |
| Multi-Utilities — 0.4% | |
| Avista Corp. | | 5,527 | $ 234,842 |
| Black Hills Corp. | | 4,945 | 348,969 |
| NorthWestern Corp.(2) | | 3,983 | 227,668 |
| Unitil Corp. | | 1,244 | 57,212 |
| | | | $ 868,691 |
| Oil, Gas & Consumable Fuels — 3.3% | |
| Aemetis, Inc.(1) | | 1,820 | $ 22,386 |
| Alto Ingredients, Inc.(1) | | 5,608 | 26,974 |
| Altus Midstream Co., Class A | | 256 | 15,695 |
| Antero Resources Corp.(1) | | 22,440 | 392,700 |
| Arch Resources, Inc.(2) | | 1,159 | 105,840 |
| Berry Corp. | | 5,491 | 46,234 |
| Brigham Minerals, Inc., Class A | | 3,175 | 66,961 |
| California Resources Corp. | | 6,335 | 270,568 |
| Callon Petroleum Co.(1)(2) | | 3,675 | 173,644 |
| Centennial Resource Development, Inc., Class A(1) | | 14,198 | 84,904 |
| Security | Shares | Value |
| Oil, Gas & Consumable Fuels (continued) | |
| Centrus Energy Corp., Class A(1) | | 741 | $ 36,983 |
| Chesapeake Energy Corp.(2) | | 8,126 | 524,290 |
| Civitas Resources, Inc. | | 3,360 | 164,539 |
| Clean Energy Fuels Corp.(1) | | 12,133 | 74,375 |
| CNX Resources Corp.(1) | | 16,595 | 228,181 |
| Comstock Resources, Inc.(1) | | 7,181 | 58,094 |
| CONSOL Energy, Inc.(1) | | 2,417 | 54,890 |
| Crescent Energy, Inc., Class A(1)(2) | | 2,320 | 29,418 |
| CVR Energy, Inc. | | 2,550 | 42,866 |
| Delek US Holdings, Inc.(1) | | 5,349 | 80,182 |
| Denbury, Inc.(1) | | 3,956 | 302,990 |
| DHT Holdings, Inc. | | 11,353 | 58,922 |
| Dorian LPG, Ltd. | | 2,343 | 29,733 |
| Earthstone Energy, Inc., Class A(1) | | 1,654 | 18,095 |
| Energy Fuels, Inc.(1) | | 11,554 | 88,157 |
| Equitrans Midstream Corp. | | 32,071 | 331,614 |
| Falcon Minerals Corp. | | 3,404 | 16,577 |
| Frontline, Ltd. / Bermuda(1) | | 9,366 | 66,218 |
| Gevo, Inc.(1)(2) | | 15,305 | 65,505 |
| Golar LNG, Ltd.(1) | | 8,457 | 104,782 |
| Green Plains, Inc.(1) | | 3,659 | 127,187 |
| HighPeak Energy, Inc. | | 391 | 5,724 |
| International Seaways, Inc. | | 3,231 | 47,431 |
| Kosmos Energy, Ltd.(1) | | 34,681 | 119,996 |
| Laredo Petroleum, Inc.(1)(2) | | 986 | 59,288 |
| Magnolia Oil & Gas Corp., Class A | | 10,918 | 206,023 |
| Matador Resources Co. | | 8,684 | 320,613 |
| Murphy Oil Corp. | | 11,492 | 300,056 |
| Nordic American Tankers, Ltd.(2) | | 11,683 | 19,744 |
| Northern Oil and Gas, Inc. | | 3,751 | 77,196 |
| Oasis Petroleum, Inc. | | 1,582 | 199,316 |
| Ovintiv, Inc. | | 20,462 | 689,569 |
| Par Pacific Holdings, Inc.(1) | | 3,112 | 51,317 |
| PBF Energy, Inc., Class A(1) | | 7,855 | 101,879 |
| PDC Energy, Inc. | | 7,536 | 367,606 |
| Peabody Energy Corp.(1) | | 6,948 | 69,966 |
| Range Resources Corp.(1) | | 18,749 | 334,295 |
| Ranger Oil Corp.(1) | | 1,641 | 44,176 |
| Renewable Energy Group, Inc.(1) | | 3,508 | 148,880 |
| REX American Resources Corp.(1) | | 441 | 42,336 |
| Riley Exploration Permian, Inc. | | 180 | 3,478 |
| Scorpio Tankers, Inc. | | 3,824 | 48,985 |
| SFL Corp., Ltd. | | 9,585 | 78,118 |
| SM Energy Co. | | 9,284 | 273,692 |
| Southwestern Energy Co.(1) | | 78,553 | 366,057 |
| Talos Energy, Inc.(1) | | 2,891 | 28,332 |
| Teekay Corp.(1) | | 5,446 | 17,100 |
25
See Notes to Financial Statements.
Calvert
VP Russell 2000® Small Cap Index Portfolio
December 31, 2021
Schedule of Investments — continued
| Security | Shares | Value |
| Oil, Gas & Consumable Fuels (continued) | |
| Teekay Tankers, Ltd., Class A(1) | | 1,870 | $ 20,383 |
| Tellurian, Inc.(1)(2) | | 27,611 | 85,042 |
| Uranium Energy Corp.(1) | | 19,805 | 66,347 |
| Ur-Energy, Inc.(1) | | 14,187 | 17,308 |
| W&T Offshore, Inc.(1) | | 8,233 | 26,593 |
| Whiting Petroleum Corp.(1) | | 3,089 | 199,797 |
| World Fuel Services Corp. | | 4,892 | 129,491 |
| | | | $ 8,275,638 |
| Paper & Forest Products — 0.1% | |
| Clearwater Paper Corp.(1) | | 1,465 | $ 53,722 |
| Glatfelter Corp. | | 3,755 | 64,586 |
| Neenah, Inc. | | 1,433 | 66,319 |
| Schweitzer-Mauduit International, Inc. | | 2,615 | 78,188 |
| Verso Corp., Class A | | 2,350 | 63,497 |
| | | | $ 326,312 |
| Personal Products — 0.5% | |
| Beauty Health Co. (The)(1) | | 6,686 | $ 161,534 |
| BellRing Brands, Inc., Class A(1) | | 3,123 | 89,099 |
| Edgewell Personal Care Co. | | 4,259 | 194,679 |
| elf Beauty, Inc.(1) | | 3,854 | 127,991 |
| Honest Co. Inc. (The)(1)(2) | | 6,574 | 53,184 |
| Inter Parfums, Inc. | | 1,382 | 147,736 |
| Medifast, Inc. | | 919 | 192,466 |
| Nature's Sunshine Products, Inc. | | 1,018 | 18,833 |
| Nu Skin Enterprises, Inc., Class A | | 3,897 | 197,773 |
| Revlon, Inc., Class A(1) | | 576 | 6,532 |
| Thorne HealthTech, Inc.(1) | | 519 | 3,223 |
| USANA Health Sciences, Inc.(1) | | 927 | 93,812 |
| Veru, Inc.(1) | | 4,379 | 25,792 |
| | | | $ 1,312,654 |
| Pharmaceuticals — 1.4% | |
| 9 Meters Biopharma, Inc.(1) | | 16,663 | $ 16,308 |
| Aclaris Therapeutics, Inc.(1) | | 3,979 | 57,855 |
| Aerie Pharmaceuticals, Inc.(1)(2) | | 3,106 | 21,804 |
| Amneal Pharmaceuticals, Inc.(1) | | 8,537 | 40,892 |
| Amphastar Pharmaceuticals, Inc.(1) | | 3,073 | 71,570 |
| Ampio Pharmaceuticals, Inc.(1) | | 14,914 | 8,501 |
| Angion Biomedica Corp.(1) | | 1,669 | 4,840 |
| ANI Pharmaceuticals, Inc.(1) | | 781 | 35,988 |
| Antares Pharma, Inc.(1) | | 14,209 | 50,726 |
| Arvinas, Inc.(1) | | 3,641 | 299,072 |
| Atea Pharmaceuticals, Inc.(1) | | 5,064 | 45,272 |
| Athira Pharma, Inc.(1)(2) | | 2,529 | 32,953 |
| Security | Shares | Value |
| Pharmaceuticals (continued) | |
| Axsome Therapeutics, Inc.(1)(2) | | 2,179 | $ 82,323 |
| BioDelivery Sciences International, Inc.(1) | | 7,195 | 22,304 |
| Cara Therapeutics, Inc.(1) | | 3,311 | 40,328 |
| Cassava Sciences, Inc.(1)(2) | | 3,000 | 131,100 |
| Citius Pharmaceuticals, Inc.(1)(2) | | 8,903 | 13,711 |
| Collegium Pharmaceutical, Inc.(1) | | 2,817 | 52,622 |
| Corcept Therapeutics, Inc.(1) | | 7,581 | 150,104 |
| CorMedix, Inc.(1) | | 2,679 | 12,189 |
| Cymabay Therapeutics, Inc.(1)(2) | | 5,958 | 20,138 |
| DICE Therapeutics, Inc.(1) | | 1,076 | 27,234 |
| Durect Corp.(1)(2) | | 17,472 | 17,226 |
| Edgewise Therapeutics, Inc.(1)(2) | | 2,990 | 45,687 |
| Endo International PLC(1) | | 18,425 | 69,278 |
| Esperion Therapeutics, Inc.(1) | | 2,273 | 11,365 |
| Evolus, Inc.(1) | | 2,529 | 16,464 |
| EyePoint Pharmaceuticals, Inc.(1) | | 1,657 | 20,282 |
| Fulcrum Therapeutics, Inc.(1)(2) | | 2,042 | 36,123 |
| Harmony Biosciences Holdings, Inc.(1) | | 1,753 | 74,748 |
| Ikena Oncology, Inc.(1)(2) | | 2,142 | 26,861 |
| Innoviva, Inc.(1) | | 3,324 | 57,339 |
| Intra-Cellular Therapies, Inc.(1) | | 5,570 | 291,534 |
| Kala Pharmaceuticals, Inc.(1)(2) | | 3,497 | 4,231 |
| Kaleido Biosciences, Inc.(1) | | 995 | 2,378 |
| KemPharm, Inc.(1)(2) | | 2,241 | 19,519 |
| Landos Biopharma, Inc.(1) | | 515 | 2,472 |
| Marinus Pharmaceuticals, Inc.(1)(2) | | 2,896 | 34,404 |
| Mind Medicine MindMed, Inc.(1) | | 25,253 | 34,849 |
| NGM Biopharmaceuticals, Inc.(1) | | 2,499 | 44,257 |
| Nuvation Bio, Inc.(1)(2) | | 12,286 | 104,431 |
| Ocular Therapeutix, Inc.(1) | | 5,745 | 40,043 |
| Omeros Corp.(1)(2) | | 4,994 | 32,111 |
| Oramed Pharmaceuticals, Inc.(1) | | 2,094 | 29,902 |
| Pacira BioSciences, Inc.(1) | | 3,468 | 208,670 |
| Paratek Pharmaceuticals, Inc.(1)(2) | | 3,554 | 15,957 |
| Phathom Pharmaceuticals, Inc.(1) | | 1,588 | 31,236 |
| Phibro Animal Health Corp., Class A | | 1,619 | 33,060 |
| Pliant Therapeutics, Inc.(1)(2) | | 1,954 | 26,379 |
| Prestige Consumer Healthcare, Inc.(1) | | 3,927 | 238,173 |
| Provention Bio, Inc.(1)(2) | | 3,744 | 21,041 |
| Rain Therapeutics, Inc.(1) | | 1,230 | 15,842 |
| Reata Pharmaceuticals, Inc., Class A(1)(2) | | 2,153 | 56,775 |
| Relmada Therapeutics, Inc.(1) | | 1,242 | 27,982 |
| Revance Therapeutics, Inc.(1) | | 5,362 | 87,508 |
| Seelos Therapeutics, Inc.(1)(2) | | 5,944 | 9,689 |
| SIGA Technologies, Inc.(1) | | 4,584 | 34,472 |
| Supernus Pharmaceuticals, Inc.(1) | | 3,766 | 109,817 |
| Tarsus Pharmaceuticals, Inc.(1) | | 515 | 11,587 |
26
See Notes to Financial Statements.
Calvert
VP Russell 2000® Small Cap Index Portfolio
December 31, 2021
Schedule of Investments — continued
| Security | Shares | Value |
| Pharmaceuticals (continued) | |
| Terns Pharmaceuticals, Inc.(1) | | 708 | $ 5,006 |
| TherapeuticsMD, Inc.(1)(2) | | 27,432 | 9,752 |
| Theravance Biopharma, Inc.(1) | | 4,637 | 51,239 |
| Theseus Pharmaceuticals, Inc.(1) | | 889 | 11,272 |
| Ventyx Biosciences, Inc.(1) | | 807 | 16,027 |
| Verrica Pharmaceuticals, Inc.(1)(2) | | 1,080 | 9,893 |
| WaVe Life Sciences, Ltd.(1) | | 2,106 | 6,613 |
| Zogenix, Inc.(1) | | 4,397 | 71,451 |
| | | | $ 3,362,779 |
| Professional Services — 1.6% | |
| Acacia Research Corp.(1) | | 4,242 | $ 21,762 |
| ASGN, Inc.(1) | | 3,985 | 491,749 |
| Atlas Technical Consultants, Inc.(1) | | 1,056 | 8,892 |
| Barrett Business Services, Inc. | | 606 | 41,850 |
| CBIZ, Inc.(1) | | 3,836 | 150,064 |
| CRA International, Inc. | | 558 | 52,095 |
| Exponent, Inc. | | 4,062 | 474,157 |
| First Advantage Corp.(1) | | 4,254 | 80,996 |
| Forrester Research, Inc.(1) | | 966 | 56,733 |
| Franklin Covey Co.(1) | | 1,007 | 46,685 |
| Heidrick & Struggles International, Inc. | | 1,525 | 66,688 |
| HireQuest, Inc. | | 399 | 8,044 |
| HireRight Holdings Corp.(1) | | 1,733 | 27,728 |
| Huron Consulting Group, Inc.(1) | | 1,753 | 87,475 |
| ICF International, Inc. | | 1,480 | 151,774 |
| Insperity, Inc. | | 2,849 | 336,495 |
| KBR, Inc. | | 11,041 | 525,772 |
| Kelly Services, Inc., Class A | | 2,680 | 44,944 |
| Kforce, Inc. | | 1,567 | 117,870 |
| Korn Ferry | | 4,165 | 315,415 |
| ManTech International Corp. / VA, Class A | | 2,150 | 156,800 |
| Mistras Group, Inc.(1) | | 1,338 | 9,941 |
| Resources Connection, Inc. | | 2,400 | 42,816 |
| Sterling Check Corp.(1) | | 1,281 | 26,273 |
| TriNet Group, Inc.(1) | | 3,179 | 302,832 |
| TrueBlue, Inc.(1) | | 2,943 | 81,433 |
| Upwork, Inc.(1) | | 9,146 | 312,427 |
| Willdan Group, Inc.(1) | | 898 | 31,610 |
| | | | $ 4,071,320 |
| Real Estate Management & Development — 0.7% | |
| Cushman & Wakefield PLC(1) | | 10,637 | $ 236,567 |
| eXp World Holdings, Inc. | | 4,867 | 163,969 |
| Fathom Holdings, Inc.(1)(2) | | 407 | 8,327 |
| Forestar Group, Inc.(1) | | 1,430 | 31,103 |
| Security | Shares | Value |
| Real Estate Management & Development (continued) | |
| FRP Holdings, Inc.(1) | | 588 | $ 33,986 |
| Kennedy-Wilson Holdings, Inc. | | 9,417 | 224,878 |
| Marcus & Millichap, Inc.(1) | | 1,962 | 100,965 |
| Newmark Group, Inc., Class A | | 11,440 | 213,928 |
| Rafael Holdings, Inc., Class B(1) | | 770 | 3,927 |
| RE / MAX Holdings, Inc., Class A | | 1,564 | 47,686 |
| Realogy Holdings Corp.(1) | | 9,326 | 156,770 |
| Redfin Corp.(1)(2) | | 7,977 | 306,237 |
| RMR Group, Inc. (The), Class A | | 1,361 | 47,199 |
| St. Joe Co. (The) | | 2,613 | 136,007 |
| Tejon Ranch Co.(1) | | 1,572 | 29,994 |
| | | | $ 1,741,543 |
| Road & Rail — 0.9% | |
| ArcBest Corp. | | 1,957 | $ 234,546 |
| Avis Budget Group, Inc.(1) | | 3,195 | 662,547 |
| Covenant Logistics Group, Inc.(1) | | 905 | 23,919 |
| Daseke, Inc.(1) | | 3,920 | 39,357 |
| Heartland Express, Inc. | | 3,887 | 65,379 |
| HyreCar, Inc.(1)(2) | | 1,374 | 6,472 |
| Marten Transport, Ltd. | | 5,049 | 86,641 |
| PAM Transportation Services, Inc.(1) | | 374 | 26,558 |
| Saia, Inc.(1) | | 2,074 | 699,000 |
| Universal Truckload Services, Inc. | | 475 | 8,959 |
| US Xpress Enterprises, Inc., Class A(1) | | 1,727 | 10,137 |
| Werner Enterprises, Inc. | | 4,874 | 232,295 |
| Yellow Corp.(1) | | 3,948 | 49,705 |
| | | | $ 2,145,515 |
| Semiconductors & Semiconductor Equipment — 3.5% | |
| Alpha & Omega Semiconductor, Ltd.(1) | | 1,700 | $ 102,952 |
| Ambarella, Inc.(1) | | 2,735 | 554,904 |
| Amkor Technology, Inc. | | 8,120 | 201,295 |
| Atomera, Inc.(1)(2) | | 1,466 | 29,496 |
| Axcelis Technologies, Inc.(1) | | 2,553 | 190,352 |
| AXT, Inc.(1) | | 3,267 | 28,782 |
| CEVA, Inc.(1) | | 1,882 | 81,378 |
| CMC Materials, Inc. | | 2,194 | 420,568 |
| Cohu, Inc.(1) | | 3,598 | 137,048 |
| Diodes, Inc.(1) | | 3,342 | 366,985 |
| FormFactor, Inc.(1) | | 6,098 | 278,801 |
| Ichor Holdings, Ltd.(1) | | 2,200 | 101,266 |
| Impinj, Inc.(1) | | 1,504 | 133,405 |
| Kopin Corp.(1)(2) | | 6,085 | 24,888 |
| Kulicke & Soffa Industries, Inc. | | 4,801 | 290,652 |
| Lattice Semiconductor Corp.(1) | | 10,595 | 816,451 |
27
See Notes to Financial Statements.
Calvert
VP Russell 2000® Small Cap Index Portfolio
December 31, 2021
Schedule of Investments — continued
| Security | Shares | Value |
| Semiconductors & Semiconductor Equipment (continued) | |
| MACOM Technology Solutions Holdings, Inc.(1) | | 3,818 | $ 298,949 |
| MaxLinear, Inc.(1) | | 5,440 | 410,122 |
| Meta Materials, Inc.(1)(2) | | 16,796 | 41,318 |
| NeoPhotonics Corp.(1) | | 4,198 | 64,523 |
| NVE Corp. | | 408 | 27,866 |
| Onto Innovation, Inc.(1) | | 3,734 | 377,993 |
| PDF Solutions, Inc.(1) | | 2,532 | 80,492 |
| Photronics, Inc.(1) | | 4,620 | 87,087 |
| Power Integrations, Inc. | | 4,719 | 438,348 |
| Rambus, Inc.(1) | | 8,317 | 244,437 |
| Semtech Corp.(1) | | 5,072 | 451,053 |
| Silicon Laboratories, Inc.(1) | | 3,083 | 636,393 |
| SiTime Corp.(1) | | 1,231 | 360,117 |
| SkyWater Technology, Inc.(1) | | 616 | 9,991 |
| SMART Global Holdings, Inc.(1) | | 1,343 | 95,340 |
| SunPower Corp.(1)(2) | | 6,461 | 134,841 |
| Synaptics, Inc.(1) | | 3,030 | 877,215 |
| Ultra Clean Holdings, Inc.(1) | | 3,443 | 197,490 |
| Veeco Instruments, Inc.(1)(2) | | 4,143 | 117,951 |
| | | | $ 8,710,749 |
| Software — 5.3% | |
| 8x8, Inc.(1) | | 8,347 | $ 139,896 |
| A10 Networks, Inc. | | 4,968 | 82,369 |
| ACI Worldwide, Inc.(1) | | 9,317 | 323,300 |
| Agilysys, Inc.(1) | | 1,551 | 68,957 |
| Alarm.com Holdings, Inc.(1) | | 3,708 | 314,475 |
| Alkami Technology, Inc.(1)(2) | | 2,198 | 44,092 |
| Altair Engineering, Inc., Class A(1) | | 3,545 | 274,099 |
| American Software, Inc., Class A | | 2,315 | 60,584 |
| Appfolio, Inc., Class A(1) | | 1,469 | 177,837 |
| Appian Corp.(1) | | 3,084 | 201,108 |
| Arteris, Inc.(1) | | 390 | 8,233 |
| Asana, Inc., Class A(1) | | 5,506 | 410,472 |
| Avaya Holdings Corp.(1) | | 6,471 | 128,126 |
| AvidXchange Holdings, Inc.(1) | | 1,956 | 29,457 |
| Benefitfocus, Inc.(1) | | 2,338 | 24,923 |
| Blackbaud, Inc.(1) | | 3,795 | 299,729 |
| Blackline, Inc.(1) | | 4,193 | 434,143 |
| Bottomline Technologies (de), Inc.(1) | | 3,610 | 203,857 |
| Box, Inc., Class A(1) | | 10,927 | 286,178 |
| BTRS Holdings, Inc.(1) | | 4,961 | 38,795 |
| Cerence, Inc.(1)(2) | | 2,967 | 227,391 |
| ChannelAdvisor Corp.(1) | | 2,410 | 59,479 |
| Cleanspark, Inc.(1) | | 2,567 | 24,438 |
| Commvault Systems, Inc.(1) | | 3,514 | 242,185 |
| Consensus Cloud Solutions, Inc.(1) | | 1,133 | 65,567 |
| Security | Shares | Value |
| Software (continued) | |
| CoreCard Corp.(1) | | 601 | $ 23,319 |
| Couchbase, Inc.(1) | | 742 | 18,520 |
| CS Disco, Inc.(1) | | 593 | 21,200 |
| Digimarc Corp.(1)(2) | | 926 | 36,558 |
| Digital Turbine, Inc.(1)(2) | | 7,101 | 433,090 |
| Domo, Inc., Class B(1) | | 2,113 | 104,805 |
| E2open Parent Holdings, Inc.(1)(2) | | 15,369 | 173,055 |
| Ebix, Inc. | | 2,269 | 68,978 |
| eGain Corp.(1) | | 1,491 | 14,880 |
| Enfusion, Inc., Class A(1) | | 1,682 | 35,221 |
| EngageSmart, Inc.(1) | | 1,240 | 29,909 |
| Envestnet, Inc.(1) | | 4,165 | 330,451 |
| EverCommerce, Inc.(1) | | 1,274 | 20,065 |
| GTY Technology Holdings, Inc.(1) | | 2,543 | 17,038 |
| Instructure Holdings, Inc.(1) | | 919 | 22,038 |
| Intapp, Inc.(1) | | 772 | 19,424 |
| InterDigital, Inc. | | 2,504 | 179,361 |
| JFrog, Ltd.(1) | | 4,046 | 120,166 |
| Kaltura, Inc.(1) | | 1,335 | 4,499 |
| LivePerson, Inc.(1) | | 5,071 | 181,136 |
| Marathon Digital Holdings, Inc.(1)(2) | | 7,486 | 245,990 |
| MeridianLink, Inc.(1) | | 970 | 20,933 |
| MicroStrategy, Inc., Class A(1) | | 655 | 356,641 |
| Mimecast, Ltd.(1) | | 4,786 | 380,822 |
| Mitek Systems, Inc.(1) | | 3,089 | 54,830 |
| Model N, Inc.(1) | | 2,795 | 83,934 |
| Momentive Global, Inc.(1) | | 9,991 | 211,310 |
| ON24, Inc.(1) | | 2,062 | 35,776 |
| OneSpan, Inc.(1) | | 2,735 | 46,304 |
| PagerDuty, Inc.(1) | | 6,330 | 219,967 |
| Ping Identity Holding Corp.(1) | | 4,625 | 105,820 |
| Progress Software Corp. | | 3,448 | 166,435 |
| PROS Holdings, Inc.(1) | | 3,289 | 113,438 |
| Q2 Holdings, Inc.(1) | | 4,288 | 340,639 |
| Qualys, Inc.(1) | | 2,673 | 366,789 |
| Rapid7, Inc.(1) | | 4,392 | 516,894 |
| Rekor Systems, Inc.(1) | | 2,460 | 16,113 |
| Rimini Street, Inc.(1) | | 3,438 | 20,525 |
| Riot Blockchain, Inc.(1)(2) | | 6,946 | 155,104 |
| SailPoint Technologies Holdings, Inc.(1)(2) | | 7,161 | 346,163 |
| Sapiens International Corp. NV | | 2,264 | 77,995 |
| SecureWorks Corp., Class A(1) | | 472 | 7,538 |
| ShotSpotter, Inc.(1)(2) | | 604 | 17,830 |
| Smith Micro Software, Inc.(1) | | 2,954 | 14,534 |
| Sprout Social, Inc., Class A(1) | | 3,464 | 314,150 |
| SPS Commerce, Inc.(1) | | 2,829 | 402,708 |
| Stronghold Digital Mining, Inc., Class A(1) | | 570 | 7,324 |
28
See Notes to Financial Statements.
Calvert
VP Russell 2000® Small Cap Index Portfolio
December 31, 2021
Schedule of Investments — continued
| Security | Shares | Value |
| Software (continued) | |
| Sumo Logic, Inc.(1) | | 6,397 | $ 86,743 |
| Telos Corp.(1)(2) | | 3,061 | 47,201 |
| Tenable Holdings, Inc.(1) | | 7,115 | 391,823 |
| Upland Software, Inc.(1) | | 2,219 | 39,809 |
| Varonis Systems, Inc.(1) | | 8,251 | 402,484 |
| Verint Systems, Inc.(1) | | 5,052 | 265,280 |
| Veritone, Inc.(1)(2) | | 2,028 | 45,589 |
| Viant Technology, Inc., Class A(1) | | 874 | 8,482 |
| VirnetX Holding Corp.(1)(2) | | 5,078 | 13,203 |
| Vonage Holdings Corp.(1) | | 19,068 | 396,424 |
| Weave Communications, Inc.(1) | | 361 | 5,480 |
| Workiva, Inc.(1) | | 3,326 | 434,010 |
| Xperi Holding Corp. | | 8,231 | 155,648 |
| Yext, Inc.(1) | | 8,933 | 88,615 |
| Zuora, Inc., Class A(1) | | 8,630 | 161,208 |
| | | | $ 13,211,908 |
| Specialty Retail — 2.3% | |
| Aaron's Co., Inc. (The) | | 2,660 | $ 65,569 |
| Abercrombie & Fitch Co., Class A(1) | | 4,524 | 157,571 |
| Academy Sports & Outdoors, Inc.(1) | | 5,957 | 261,512 |
| American Eagle Outfitters, Inc.(2) | | 11,935 | 302,194 |
| America's Car-Mart, Inc.(1) | | 476 | 48,742 |
| Arko Corp.(1) | | 9,255 | 81,166 |
| Asbury Automotive Group, Inc.(1) | | 1,809 | 312,469 |
| Barnes & Noble Education, Inc.(1) | | 3,013 | 20,519 |
| Bed Bath & Beyond, Inc.(1) | | 8,060 | 117,515 |
| Big 5 Sporting Goods Corp. | | 1,632 | 31,024 |
| Boot Barn Holdings, Inc.(1) | | 2,323 | 285,845 |
| Buckle, Inc. (The) | | 2,282 | 96,551 |
| Caleres, Inc. | | 3,058 | 69,355 |
| Camping World Holdings, Inc., Class A(2) | | 3,347 | 135,219 |
| CarLotz, Inc.(1) | | 5,599 | 12,710 |
| Cato Corp. (The), Class A | | 1,550 | 26,598 |
| Chico's FAS, Inc.(1) | | 9,433 | 50,750 |
| Children's Place, Inc. (The)(1) | | 1,078 | 85,475 |
| Citi Trends, Inc.(1) | | 699 | 66,230 |
| Conn's, Inc.(1) | | 1,614 | 37,961 |
| Container Store Group, Inc. (The)(1) | | 2,581 | 25,758 |
| Designer Brands, Inc., Class A(1) | | 5,217 | 74,134 |
| Genesco, Inc.(1) | | 1,150 | 73,796 |
| Group 1 Automotive, Inc. | | 1,378 | 269,013 |
| GrowGeneration Corp.(1) | | 4,242 | 55,358 |
| Guess?, Inc. | | 3,234 | 76,581 |
| Haverty Furniture Cos., Inc. | | 1,371 | 41,911 |
| Hibbett, Inc. | | 1,274 | 91,639 |
| JOANN, Inc. | | 910 | 9,446 |
| Security | Shares | Value |
| Specialty Retail (continued) | |
| Kirkland's, Inc.(1)(2) | | 1,099 | $ 16,408 |
| Lazydays Holdings, Inc.(1) | | 576 | 12,407 |
| Lumber Liquidators Holdings, Inc.(1) | | 2,470 | 42,163 |
| MarineMax, Inc.(1) | | 1,632 | 96,353 |
| Monro, Inc. | | 2,683 | 156,338 |
| Murphy USA, Inc. | | 1,854 | 369,391 |
| National Vision Holdings, Inc.(1) | | 6,258 | 300,321 |
| ODP Corp. (The)(1) | | 3,565 | 140,033 |
| OneWater Marine, Inc., Class A | | 718 | 43,776 |
| Party City Holdco, Inc.(1) | | 8,666 | 48,270 |
| Rent-A-Center, Inc. | | 5,170 | 248,367 |
| Sally Beauty Holdings, Inc.(1) | | 8,712 | 160,824 |
| Shift Technologies, Inc.(1)(2) | | 4,866 | 16,593 |
| Shoe Carnival, Inc. | | 1,384 | 54,087 |
| Signet Jewelers, Ltd. | | 4,089 | 355,866 |
| Sleep Number Corp.(1) | | 1,771 | 135,659 |
| Sonic Automotive, Inc., Class A | | 1,716 | 84,856 |
| Sportsman's Warehouse Holdings, Inc.(1) | | 3,542 | 41,796 |
| Tilly's, Inc., Class A | | 1,890 | 30,448 |
| Torrid Holdings, Inc.(1) | | 979 | 9,673 |
| TravelCenters of America, Inc.(1) | | 979 | 50,536 |
| Urban Outfitters, Inc.(1) | | 5,380 | 157,957 |
| Winmark Corp. | | 277 | 68,776 |
| Zumiez, Inc.(1) | | 1,698 | 81,487 |
| | | | $ 5,704,996 |
| Technology Hardware, Storage & Peripherals — 0.3% | |
| 3D Systems Corp.(1) | | 9,520 | $ 205,061 |
| Avid Technology, Inc.(1) | | 2,835 | 92,336 |
| Corsair Gaming, Inc.(1)(2) | | 1,920 | 40,339 |
| Diebold Nixdorf, Inc.(1) | | 5,880 | 53,214 |
| Eastman Kodak Co.(1)(2) | | 3,518 | 16,464 |
| Quantum Corp.(1) | | 4,380 | 24,178 |
| Super Micro Computer, Inc.(1) | | 3,523 | 154,836 |
| Turtle Beach Corp.(1) | | 1,190 | 26,489 |
| | | | $ 612,917 |
| Textiles, Apparel & Luxury Goods — 0.7% | |
| Crocs, Inc.(1) | | 4,504 | $ 577,503 |
| Fossil Group, Inc.(1) | | 3,623 | 37,281 |
| G-III Apparel Group, Ltd.(1) | | 3,579 | 98,924 |
| Kontoor Brands, Inc. | | 4,067 | 208,434 |
| Movado Group, Inc. | | 1,238 | 51,785 |
| Oxford Industries, Inc. | | 1,242 | 126,088 |
| PLBY Group, Inc.(1) | | 2,227 | 59,327 |
| Rocky Brands, Inc. | | 588 | 23,402 |
29
See Notes to Financial Statements.
Calvert
VP Russell 2000® Small Cap Index Portfolio
December 31, 2021
Schedule of Investments — continued
| Security | Shares | Value |
| Textiles, Apparel & Luxury Goods (continued) | |
| Steven Madden, Ltd. | | 6,236 | $ 289,787 |
| Superior Group of Cos., Inc. | | 933 | 20,470 |
| Unifi, Inc.(1) | | 1,199 | 27,757 |
| Vera Bradley, Inc.(1) | | 1,814 | 15,437 |
| Wolverine World Wide, Inc. | | 6,377 | 183,721 |
| | | | $ 1,719,916 |
| Thrifts & Mortgage Finance — 1.4% | |
| Axos Financial, Inc.(1) | | 4,474 | $ 250,141 |
| Blue Foundry Bancorp(1) | | 2,149 | 31,440 |
| Bridgewater Bancshares, Inc.(1) | | 1,907 | 33,735 |
| Capitol Federal Financial, Inc. | | 9,963 | 112,881 |
| Columbia Financial, Inc.(1) | | 3,148 | 65,667 |
| Enact Holdings, Inc. | | 1,142 | 23,605 |
| Essent Group, Ltd. | | 8,375 | 381,314 |
| Federal Agricultural Mortgage Corp., Class C | | 688 | 85,264 |
| Finance of America Cos., Inc., Class A(1)(2) | | 2,618 | 10,394 |
| Flagstar Bancorp, Inc. | | 4,030 | 193,198 |
| FS Bancorp, Inc. | | 534 | 17,958 |
| Hingham Institution for Savings (The) | | 102 | 42,828 |
| Home Bancorp, Inc. | | 638 | 26,483 |
| Home Point Capital, Inc.(2) | | 600 | 2,700 |
| Kearny Financial Corp. | | 5,244 | 69,483 |
| Luther Burbank Corp. | | 1,786 | 25,075 |
| Merchants Bancorp | | 731 | 34,598 |
| Mr. Cooper Group, Inc.(1) | | 4,782 | 198,979 |
| NMI Holdings, Inc., Class A(1) | | 6,584 | 143,860 |
| Northfield Bancorp, Inc. | | 3,620 | 58,499 |
| Northwest Bancshares, Inc. | | 9,836 | 139,278 |
| Ocwen Financial Corp.(1) | | 641 | 25,621 |
| PCSB Financial Corp. | | 1,066 | 20,297 |
| PennyMac Financial Services, Inc. | | 2,518 | 175,706 |
| Pioneer Bancorp, Inc.(1) | | 918 | 10,392 |
| Premier Financial Corp. | | 3,134 | 96,872 |
| Provident Bancorp, Inc. | | 1,419 | 26,393 |
| Provident Financial Services, Inc. | | 6,090 | 147,500 |
| Radian Group, Inc. | | 14,296 | 302,075 |
| Southern Missouri Bancorp, Inc. | | 690 | 35,997 |
| TrustCo Bank Corp. | | 1,565 | 52,130 |
| Velocity Financial, Inc.(1)(2) | | 672 | 9,206 |
| Walker & Dunlop, Inc. | | 2,242 | 338,273 |
| Washington Federal, Inc. | | 5,193 | 173,342 |
| Waterstone Financial, Inc. | | 1,822 | 39,829 |
| WSFS Financial Corp. | | 3,604 | 180,633 |
| | | | $ 3,581,646 |
| Security | Shares | Value |
| Tobacco — 0.1% | |
| 22nd Century Group, Inc.(1)(2) | | 11,838 | $ 36,579 |
| Turning Point Brands, Inc. | | 1,011 | 38,196 |
| Universal Corp. | | 1,896 | 104,128 |
| Vector Group, Ltd. | | 11,264 | 129,311 |
| | | | $ 308,214 |
| Trading Companies & Distributors — 1.5% | |
| Alta Equipment Group, Inc.(1) | | 1,505 | $ 22,033 |
| Applied Industrial Technologies, Inc. | | 3,044 | 312,619 |
| Beacon Roofing Supply, Inc.(1) | | 4,442 | 254,749 |
| BlueLinx Holdings, Inc.(1) | | 703 | 67,319 |
| Boise Cascade Co. | | 3,044 | 216,733 |
| Custom Truck One Source, Inc.(1)(2) | | 3,543 | 28,344 |
| DXP Enterprises, Inc.(1) | | 1,272 | 32,652 |
| EVI Industries, Inc.(1) | | 308 | 9,619 |
| GATX Corp. | | 2,708 | 282,147 |
| Global Industrial Co. | | 1,000 | 40,900 |
| GMS, Inc.(1) | | 3,426 | 205,937 |
| H&E Equipment Services, Inc. | | 2,486 | 110,055 |
| Herc Holdings, Inc. | | 1,979 | 309,813 |
| Karat Packaging, Inc.(1) | | 359 | 7,255 |
| Lawson Products, Inc.(1) | | 447 | 24,473 |
| McGrath RentCorp | | 1,962 | 157,470 |
| MRC Global, Inc.(1) | | 6,928 | 47,665 |
| NOW, Inc.(1) | | 9,243 | 78,935 |
| Rush Enterprises, Inc., Class A | | 3,238 | 180,162 |
| Rush Enterprises, Inc., Class B | | 564 | 30,439 |
| Textainer Group Holdings, Ltd. | | 3,758 | 134,198 |
| Titan Machinery, Inc.(1) | | 1,521 | 51,243 |
| Transcat, Inc.(1) | | 601 | 55,550 |
| Triton International, Ltd. | | 5,234 | 315,244 |
| Veritiv Corp.(1) | | 1,183 | 145,000 |
| WESCO International, Inc.(1) | | 3,492 | 459,512 |
| Willis Lease Finance Corp.(1) | | 332 | 12,500 |
| | | | $ 3,592,566 |
| Water Utilities — 0.4% | |
| American States Water Co. | | 2,893 | $ 299,252 |
| Artesian Resources Corp., Class A | | 703 | 32,570 |
| Cadiz, Inc.(1) | | 1,074 | 4,146 |
| California Water Service Group | | 4,020 | 288,877 |
| Global Water Resources, Inc. | | 641 | 10,961 |
| Middlesex Water Co. | | 1,398 | 168,179 |
| Pure Cycle Corp.(1) | | 1,502 | 21,929 |
| SJW Group | | 2,210 | 161,772 |
30
See Notes to Financial Statements.
Calvert
VP Russell 2000® Small Cap Index Portfolio
December 31, 2021
Schedule of Investments — continued
| Security | Shares | Value |
| Water Utilities (continued) | |
| York Water Co. (The) | | 1,157 | $ 57,596 |
| | | | $ 1,045,282 |
| Wireless Telecommunication Services — 0.2% | |
| Gogo, Inc.(1)(2) | | 5,004 | $ 67,704 |
| Shenandoah Telecommunications Co. | | 3,920 | 99,960 |
| Telephone & Data Systems, Inc. | | 7,925 | 159,689 |
| United States Cellular Corp.(1) | | 1,199 | 37,792 |
| | | | $ 365,145 |
Total Common Stocks
(identified cost $154,406,224) | | | $232,189,719 |
| Exchange-Traded Funds — 1.3% |
| Security | Shares | Value |
| Equity Funds — 1.3% | |
| iShares Russell 2000 ETF(2) | | 15,000 | $ 3,336,750 |
Total Exchange-Traded Funds
(identified cost $2,523,039) | | | $ 3,336,750 |
| Security | Shares | Value |
| Biotechnology — 0.0%(3) | |
| Aduro Biotech, Inc. CVR(1)(4)(5) | | 1,109 | $ 0 |
| GTx, Inc. CVR(1)(4)(5) | | 57 | 0 |
| Prevail Therapeutics, Inc. CVR(1)(2)(4)(5) | | 1,221 | 610 |
| Tobira Therapeutics, Inc. CVR(1)(4)(5) | | 690 | 9,481 |
| | | | $ 10,091 |
| Health Care Equipment & Supplies — 0.0%(3) | |
| Elanco Animal Health, Inc. CVR(1)(4)(5) | | 3,555 | $ 379 |
| Flexion Therapeutics, Inc. CVR(1)(4)(5) | | 3,730 | 2,313 |
| | | | $ 2,692 |
| Pharmaceuticals — 0.0% | |
| Progenic Pharmaceuticals, Inc. CVR(1)(4)(5) | | 7,261 | $ 0 |
| | | | $ 0 |
Total Rights
(identified cost $3,172) | | | $ 12,783 |
| Short-Term Investments — 8.4% | | | |
| Affiliated Fund — 4.5% |
| Description | Units | Value |
| Calvert Cash Reserves Fund, LLC, 0.06%(6) | | 11,109,283 | $ 11,109,283 |
Total Affiliated Fund
(identified cost $11,109,184) | | | $ 11,109,283 |
| Securities Lending Collateral — 3.5% |
| Security | Shares | Value |
| State Street Navigator Securities Lending Government Money Market Portfolio, 0.03%(7) | | 8,541,296 | $ 8,541,296 |
Total Securities Lending Collateral
(identified cost $8,541,296) | | | $ 8,541,296 |
| U.S. Treasury Obligations — 0.4% |
| Security | Principal
Amount
(000's omitted) | Value |
| U.S. Treasury Bill, 0.00%, 2/24/22(8) | $ | 1,000 | $ 999,967 |
Total U.S. Treasury Obligations
(identified cost $999,899) | | | $ 999,967 |
Total Short-Term Investments
(identified cost $20,650,379) | | | $ 20,650,546 |
Total Investments — 103.5%
(identified cost $177,582,814) | | | $256,189,798 |
| Other Assets, Less Liabilities — (3.5)% | | | $ (8,547,364) |
| Net Assets — 100.0% | | | $ 247,642,434 |
| The percentage shown for each investment category in the Schedule of Investments is based on net assets. |
| (1) | Non-income producing security. |
| (2) | All or a portion of this security was on loan at December 31, 2021. The aggregate market value of securities on loan at December 31, 2021 was $18,152,867. |
| (3) | Amount is less than 0.05%. |
| (4) | For fair value measurement disclosure purposes, security is categorized as Level 3 (see Note 1A). |
| (5) | Restricted security. Total market value of restricted securities amounts to $12,783, which represents less than 0.05% of the net assets of the Fund as of December 31, 2021. |
| (6) | Affiliated investment company, available to Calvert portfolios and funds, which invests in high quality, U.S. dollar denominated money market instruments. The rate shown is the annualized seven-day yield as of December 31, 2021. |
31
See Notes to Financial Statements.
Calvert
VP Russell 2000® Small Cap Index Portfolio
December 31, 2021
Schedule of Investments — continued
| (7) | Represents investment of cash collateral received in connection with securities lending. |
| (8) | Security (or a portion thereof) has been pledged to cover margin requirements on open futures contracts. |
Futures Contracts
| Description | Number of
Contracts | Position | Expiration
Date | Notional
Amount | Value/
Unrealized
Appreciation
(Depreciation) |
| Equity Futures | | | | | |
| E-mini Russell 2000 Index | 106 | Long | 3/18/22 | $11,886,840 | $ 331,010 |
| | | | | | $331,010 |
Restricted Securities
| Description | Acquisition Dates | Cost |
| Aduro Biotech, Inc. CVR | 10/2/20 | $ 0 |
| Elanco Animal Health, Inc. CVR | 7/19/19 | 90 |
| Flexion Therapeutics, Inc. CVR | 11/22/21 | 2,313 |
| GTx, Inc. CVR | 6/10/19 | 117 |
| Prevail Therapeutics, Inc. CVR | 1/25/21 | 611 |
| Progenic Pharmaceuticals, Inc. CVR | 6/22/20 | 0 |
| Tobira Therapeutics, Inc. CVR | 11/2/16 | 41 |
| Abbreviations: |
| CVR | – Contingent Value Rights |
32
See Notes to Financial Statements.
Calvert
VP Russell 2000® Small Cap Index Portfolio
December 31, 2021
Statement of Assets and Liabilities
| | December 31, 2021 |
| Assets | |
Investments in securities of unaffiliated issuers, at value (identified cost $166,473,630) - including
$18,152,867 of securities on loan | $ 245,080,515 |
| Investments in securities of affiliated issuers, at value (identified cost $11,109,184) | 11,109,283 |
| Cash | 5,971 |
| Receivable for investments sold | 42,284 |
| Receivable for capital shares sold | 140,452 |
| Dividends receivable | 184,040 |
| Dividends receivable - affiliated | 601 |
| Securities lending income receivable | 6,865 |
| Receivable from affiliate | 37,854 |
| Directors' deferred compensation plan | 47,041 |
| Total assets | $256,654,906 |
| Liabilities | |
| Payable for variation margin on open futures contracts | $ 21,690 |
| Payable for capital shares redeemed | 153,823 |
| Deposits for securities loaned | 8,541,296 |
| Payable to affiliates: | |
| Investment advisory fee | 51,474 |
| Administrative fee | 24,707 |
| Distribution and service fees | 10,607 |
| Sub-transfer agency fee | 145 |
| Directors' deferred compensation plan | 47,041 |
| Accrued expenses | 161,689 |
| Total liabilities | $ 9,012,472 |
| Net Assets | $247,642,434 |
| Sources of Net Assets | |
| Paid-in capital | $ 145,476,334 |
| Distributable earnings | 102,166,100 |
| Net Assets | $247,642,434 |
| Class I Shares | |
| Net Assets | $ 183,595,257 |
| Shares Outstanding | 1,848,076 |
Net Asset Value, Offering Price and Redemption Price Per Share
(net assets ÷ shares of beneficial interest outstanding) | $ 99.34 |
| Class F Shares | |
| Net Assets | $ 64,047,177 |
| Shares Outstanding | 648,696 |
Net Asset Value, Offering Price and Redemption Price Per Share
(net assets ÷ shares of beneficial interest outstanding) | $ 98.73 |
33
See Notes to Financial Statements.
Calvert
VP Russell 2000® Small Cap Index Portfolio
December 31, 2021
| | Year Ended |
| | December 31, 2021 |
| Investment Income | |
| Dividend income (net of foreign taxes withheld of $3,673) | $ 2,853,899 |
| Dividend income - affiliated issuers | 6,191 |
| Interest income | 833 |
| Securities lending income, net | 96,694 |
| Total investment income | $ 2,957,617 |
| Expenses | |
| Investment advisory fee | $ 616,307 |
| Administrative fee | 295,827 |
| Distribution and service fees: | |
| Class F | 123,250 |
| Directors' fees and expenses | 9,020 |
| Custodian fees | 16,973 |
| Transfer agency fees and expenses | 220,107 |
| Accounting fees | 56,452 |
| Professional fees | 35,426 |
| Licensing fees | 127,960 |
| Miscellaneous | 22,930 |
| Total expenses | $ 1,524,252 |
| Waiver and/or reimbursement of expenses by affiliate | $ (439,412) |
| Net expenses | $ 1,084,840 |
| Net investment income | $ 1,872,777 |
| Realized and Unrealized Gain (Loss) | |
| Net realized gain (loss): | |
| Investment securities | $ 21,007,484 |
| Investment securities - affiliated issuers | (835) |
| Futures contracts | 372,215 |
| Net realized gain | $21,378,864 |
| Change in unrealized appreciation (depreciation): | |
| Investment securities | $ 7,875,733 |
| Investment securities - affiliated issuers | 99 |
| Futures contracts | 261,820 |
| Net change in unrealized appreciation (depreciation) | $ 8,137,652 |
| Net realized and unrealized gain | $29,516,516 |
| Net increase in net assets from operations | $31,389,293 |
34
See Notes to Financial Statements.
Calvert
VP Russell 2000® Small Cap Index Portfolio
December 31, 2021
Statements of Changes in Net Assets
| | Year Ended December 31, |
| | 2021 | 2020 |
| Increase (Decrease) in Net Assets | | |
| From operations: | | |
| Net investment income | $ 1,872,777 | $ 1,813,462 |
| Net realized gain | 21,378,864 | 6,760,350 |
| Net change in unrealized appreciation (depreciation) | 8,137,652 | 26,599,059 |
| Net increase in net assets from operations | $ 31,389,293 | $ 35,172,871 |
| Distributions to shareholders: | | |
| Class I | $ (6,490,617) | $ (9,760,402) |
| Class F | (2,231,132) | (2,699,981) |
| Total distributions to shareholders | $ (8,721,749) | $ (12,460,383) |
| Capital share transactions: | | |
| Class I | $ (2,752,812) | $ (3,896,570) |
| Class F | 9,925,895 | 1,417,937 |
| Net increase (decrease) in net assets from capital share transactions | $ 7,173,083 | $ (2,478,633) |
| Net increase in net assets | $ 29,840,627 | $ 20,233,855 |
| Net Assets | | |
| At beginning of year | $ 217,801,807 | $ 197,567,952 |
| At end of year | $247,642,434 | $217,801,807 |
35
See Notes to Financial Statements.
Calvert
VP Russell 2000® Small Cap Index Portfolio
December 31, 2021
| | Class I |
| | Year Ended December 31, |
| | 2021 | 2020 | 2019 | 2018 | 2017 |
| Net asset value — Beginning of year | $ 89.92 | $ 80.81 | $ 71.03 | $ 84.82 | $ 77.43 |
| Income (Loss) From Operations | | | | | |
| Net investment income(1) | $ 0.82 | $ 0.79 | $ 0.90 | $ 0.98 | $ 0.93 |
| Net realized and unrealized gain (loss) | 12.22 | 13.71 | 15.99 | (9.44) | 10.12 |
| Total income (loss) from operations | $ 13.04 | $ 14.50 | $ 16.89 | $ (8.46) | $ 11.05 |
| Less Distributions | | | | | |
| From net investment income | $ (0.77) | $ (0.82) | $ (0.77) | $ (0.96) | $ (0.64) |
| From net realized gain | (2.85) | (4.57) | (6.34) | (4.37) | (3.02) |
| Total distributions | $ (3.62) | $ (5.39) | $ (7.11) | $ (5.33) | $ (3.66) |
| Net asset value — End of year | $ 99.34 | $ 89.92 | $ 80.81 | $ 71.03 | $ 84.82 |
| Total Return(2) | 14.53% | 19.64% | 25.08% | (11.23)% | 14.37% |
| Ratios/Supplemental Data | | | | | |
| Net assets, end of year (000’s omitted) | $183,595 | $168,541 | $154,335 | $127,473 | $158,646 |
| Ratios (as a percentage of average daily net assets):(3) | | | | | |
| Total expenses | 0.57% | 0.59% | 0.58% | 0.59% | 0.65% |
| Net expenses | 0.39% | 0.39% | 0.39% | 0.38% | 0.38% |
| Net investment income | 0.81% | 1.08% | 1.13% | 1.13% | 1.15% |
| Portfolio Turnover | 19% | 16% | 15% | 15% | 15% |
| (1) | Computed using average shares outstanding. |
| (2) | Returns are historical and are calculated by determining the percentage change in net asset value with all distributions reinvested and do not reflect fees and expenses imposed by variable annuity contracts or variable life insurance policies. If included, total return would be lower. |
| (3) | Total expenses do not reflect amounts reimbursed and/or waived by the adviser and certain of its affiliates, if applicable. Net expenses are net of all reductions and represent the net expenses paid by the Fund. |
36
See Notes to Financial Statements.
Calvert
VP Russell 2000® Small Cap Index Portfolio
December 31, 2021
Financial Highlights — continued
| | Class F |
| | Year Ended December 31, |
| | 2021 | 2020 | 2019 | 2018 | 2017 |
| Net asset value — Beginning of year | $ 89.56 | $ 80.67 | $ 71.07 | $ 85.07 | $ 77.84 |
| Income (Loss) From Operations | | | | | |
| Net investment income(1) | $ 0.62 | $ 0.64 | $ 0.73 | $ 0.77 | $ 0.74 |
| Net realized and unrealized gain (loss) | 12.17 | 13.64 | 15.98 | (9.44) | 10.15 |
| Total income (loss) from operations | $ 12.79 | $ 14.28 | $ 16.71 | $ (8.67) | $ 10.89 |
| Less Distributions | | | | | |
| From net investment income | $ (0.77) | $ (0.82) | $ (0.77) | $ (0.96) | $ (0.64) |
| From net realized gain | (2.85) | (4.57) | (6.34) | (4.37) | (3.02) |
| Total distributions | $ (3.62) | $ (5.39) | $ (7.11) | $ (5.33) | $ (3.66) |
| Net asset value — End of year | $ 98.73 | $ 89.56 | $ 80.67 | $ 71.07 | $ 85.07 |
| Total Return(2) | 14.30% | 19.40% | 24.82% | (11.46)% | 14.08% |
| Ratios/Supplemental Data | | | | | |
| Net assets, end of year (000’s omitted) | $64,047 | $49,261 | $43,233 | $30,499 | $32,547 |
| Ratios (as a percentage of average daily net assets):(3) | | | | | |
| Total expenses | 0.77% | 0.79% | 0.78% | 0.79% | 0.86% |
| Net expenses | 0.59% | 0.59% | 0.60% | 0.63% | 0.63% |
| Net investment income | 0.62% | 0.88% | 0.92% | 0.89% | 0.91% |
| Portfolio Turnover | 19% | 16% | 15% | 15% | 15% |
| (1) | Computed using average shares outstanding. |
| (2) | Returns are historical and are calculated by determining the percentage change in net asset value with all distributions reinvested and do not reflect fees and expenses imposed by variable annuity contracts or variable life insurance policies. If included, total return would be lower. |
| (3) | Total expenses do not reflect amounts reimbursed and/or waived by the adviser and certain of its affiliates, if applicable. Net expenses are net of all reductions and represent the net expenses paid by the Fund. |
37
See Notes to Financial Statements.
Calvert
VP Russell 2000® Small Cap Index Portfolio
December 31, 2021
Notes to Financial Statements
1 Significant Accounting Policies
Calvert VP Russell 2000® Small Cap Index Portfolio (the Fund) is a diversified series of Calvert Variable Products, Inc. (the Corporation). The Corporation is a Maryland corporation registered under the Investment Company Act of 1940, as amended (the 1940 Act), as an open-end management investment company. The investment objective of the Fund is to seek investment results that correspond to the investment performance of U.S. common stocks, as represented by the Russell 2000® Index.
Shares of the Fund are sold without sales charge to insurance companies for allocation to certain of their variable separate accounts and to qualified pension and retirement plans and other eligible investors. The Fund offers Class I and Class F shares. Among other things, each class has different: (a) dividend rates due to differences in Distribution Plan expenses and other class-specific expenses; (b) exchange privileges; and (c) class-specific voting rights.
The Fund applies the accounting and reporting guidance in the Financial Accounting Standards Board (FASB) Accounting Standards Codification Topic 946, Financial Services – Investment Companies (ASC 946). Subsequent events, if any, through the date that the financial statements were issued have been evaluated in the preparation of the financial statements.
A Investment Valuation— Net asset value per share is determined every business day as of the close of the regular session of the New York Stock Exchange (generally 4:00 p.m. Eastern time). The Fund uses independent pricing services approved by the Board of Directors (the Board) to value its investments wherever possible. Investments for which market quotations are not available or deemed not reliable are fair valued in good faith under the direction of the Board.
U.S. generally accepted accounting principles (U.S. GAAP) establishes a disclosure hierarchy that categorizes the inputs to valuation techniques used to value assets and liabilities at measurement date. These inputs are summarized in the three broad levels listed below:
Level 1 - quoted prices in active markets for identical securities
Level 2 - other significant observable inputs (including quoted prices for similar securities, interest rates, prepayment speeds, credit risk, etc.)
Level 3 - significant unobservable inputs (including the Fund’s own assumptions in determining the fair value of investments)
The inputs or methodologies used for valuing securities are not necessarily an indication of the risk associated with investing in those securities.
Valuation techniques used to value the Fund’s investments by major category are as follows:
Equity Securities. Equity securities (including warrants and rights) listed on a U.S. securities exchange generally are valued at the last sale or closing price as reported by an independent pricing service on the primary market or exchange on which they are traded and are categorized as Level 1 in the hierarchy. Equity securities listed on the NASDAQ National Market System are valued at the NASDAQ official closing price and are categorized as Level 1 in the hierarchy. Unlisted or listed securities for which closing sales prices or closing quotations are not available are valued at the mean between the latest available bid and ask prices and are categorized as Level 2 in the hierarchy.
Short-Term Debt Securities. Short-term debt securities with a remaining maturity at time of purchase of more than sixty days are valued based on valuations provided by a third party pricing service. Such securities are generally categorized as Level 2 in the hierarchy. Short-term debt securities of sufficient credit quality purchased with remaining maturities of sixty days or less for which a valuation from a third party pricing service is not readily available may be valued at amortized cost, which approximates fair value, and are categorized as Level 2 in the hierarchy.
Affiliated Fund. The Fund may invest in Calvert Cash Reserves Fund, LLC (Cash Reserves Fund), an affiliated investment company managed by Calvert Research and Management (CRM). While Cash Reserves Fund is not a registered money market mutual fund, it conducts all of its investment activities in accordance with the requirements of Rule 2a-7 under the 1940 Act. Investments in Cash Reserves Fund are valued at the closing net asset value per unit on the valuation day and are categorized as Level 2 in the hierarchy. Cash Reserves Fund generally values its investment securities based on available market quotations provided by a third party pricing service.
Other Securities. Exchange-traded funds are valued at the official closing price as reported by an independent pricing service on the primary market or exchange on which they are traded and are categorized as Level 1 in the hierarchy. Investments in registered investment companies (including money market funds) that do not trade on an exchange are valued at the net asset value per share on the valuation day and are categorized as Level 1 in the hierarchy.
Derivatives. Futures contracts are valued at unrealized appreciation (depreciation) based on the settlement price established each day by the board of trade or exchange on which they are traded and are categorized as Level 1 in the hierarchy.
Fair Valuation. If a market value cannot be determined for a security using the methodologies described above, or if, in the good faith opinion of the Fund's adviser, the market value does not constitute a readily available market quotation, or if a significant event has occurred that would materially affect the value of the security, the security will be fair valued as determined in good faith by or at the direction of the Board in a manner that most fairly reflects the security’s “fair value”, which is the amount that the Fund might reasonably expect to receive for the security upon its current sale in the ordinary course. Each such determination is based on a consideration of relevant factors, which are likely to vary from one pricing context to another. These factors may
Calvert
VP Russell 2000® Small Cap Index Portfolio
December 31, 2021
Notes to Financial Statements — continued
include, but are not limited to, the type of security, the existence of any contractual restrictions on the security’s disposition, the price and extent of public trading in similar securities of the issuer or of comparable companies or entities, quotations or relevant information obtained from broker/dealers or other market participants, information obtained from the issuer, analysts, and/or the appropriate stock exchange (for exchange-traded securities), an analysis of the company’s or entity’s financial statements, and an evaluation of the forces that influence the issuer and the market(s) in which the security is purchased and sold.
The values assigned to fair value investments are based on available information and do not necessarily represent amounts that might ultimately be realized. Further, due to the inherent uncertainty of valuations of such investments, the fair values may differ significantly from the values that would have been used had an active market existed, and the differences could be material.
The following table summarizes the market value of the Fund's holdings as of December 31, 2021, based on the inputs used to value them:
| Asset Description | Level 1 | Level 2 | Level 3(1) | Total |
| Common Stocks | $ 232,189,719(2) | $ — | $ 0 | $ 232,189,719 |
| Exchange-Traded Funds | 3,336,750 | — | — | 3,336,750 |
| Rights | — | — | 12,783 | 12,783 |
| Short-Term Investments: | | | | |
| Affiliated Fund | — | 11,109,283 | — | 11,109,283 |
| Securities Lending Collateral | 8,541,296 | — | — | 8,541,296 |
| U.S. Treasury Obligations | — | 999,967 | — | 999,967 |
| Total Investments | $244,067,765 | $12,109,250 | $12,783 | $256,189,798 |
| Futures Contracts | $ 331,010 | $ — | $ — | $ 331,010 |
| Total | $244,398,775 | $12,109,250 | $12,783 | $256,520,808 |
| (1) | None of the unobservable inputs for Level 3 assets, individually or collectively, had a material impact on the Fund. |
| (2) | The level classification by major category of investments is the same as the category presentation in the Schedule of Investments. |
Level 3 investments at the beginning and/or end of the period in relation to net assets were not significant and accordingly, a reconciliation of Level 3 assets for the year ended December 31, 2021 is not presented.
B Investment Transactions and Income— Investment transactions for financial statement purposes are accounted for on trade date. Realized gains and losses are recorded on an identified cost basis and may include proceeds from litigation. Dividend income is recorded on the ex-dividend date for dividends received in cash and/or securities or, in the case of dividends on certain foreign securities, as soon as the Fund is informed of the ex-dividend date. Non-cash dividends are recorded at the fair value of the securities received. Withholding taxes on foreign dividends, if any, have been provided for in accordance with the Fund's understanding of the applicable country’s tax rules and rates. Distributions received that represent a return of capital are recorded as a reduction of cost of investments. Distributions received that represent a capital gain are recorded as a realized gain. Interest income, which includes amortization of premium and accretion of discount on debt securities, is accrued as earned.
C Share Class Accounting— Realized and unrealized gains and losses and net investment income and losses, other than class-specific expenses, are allocated daily to each class of shares based upon the relative net assets of each class to the total net assets of the Fund. Expenses arising in connection with a specific class are charged directly to that class.
D Futures Contracts— The Fund may enter into futures contracts to buy or sell a financial instrument for a set price at a future date. Initial margin deposits of either cash or securities as required by the broker are made upon entering into the contract. While the contract is open, daily variation margin payments are made to or received from the broker reflecting the daily change in market value of the contract and are recorded for financial reporting purposes as unrealized gains or losses by the Fund. When a futures contract is closed, a realized gain or loss is recorded equal to the difference between the opening and closing value of the contract. The risks associated with entering into futures contracts may include the possible illiquidity of the secondary market which would limit the Fund’s ability to close out a futures contract prior to the settlement date, an imperfect correlation between the value of the contracts and the underlying financial instruments, or that the counterparty will fail to perform its obligations under the contracts’ terms. Futures contracts are designed by boards of trade, which are designated “contracts markets” by the Commodities Futures Trading Commission. Futures contracts trade on the contracts markets in a manner that is similar to the way a stock trades on a stock exchange, and the boards of trade, through their clearing corporations, guarantee the futures contracts against default. As a result, there is minimal counterparty credit risk to the Fund.
E Restricted Securities— The Fund may invest in securities that are subject to legal or contractual restrictions on resale. Generally, these securities may only be sold publicly upon registration under the Securities Act of 1933 or in transactions exempt from such registration. Information regarding restricted securities (excluding Rule 144A securities) is included at the end of the Schedule of Investments.
Calvert
VP Russell 2000® Small Cap Index Portfolio
December 31, 2021
Notes to Financial Statements — continued
F Distributions to Shareholders— Distributions to shareholders are recorded by the Fund on ex-dividend date. The Fund distributes any net investment income and net realized capital gains at least annually. Both types of distributions are made in shares of the Fund unless an election is made on behalf of a separate account to receive some or all of the distributions in cash. Distributions are declared separately for each class of shares. Distributions are determined in accordance with income tax regulations, which may differ from U.S. GAAP; accordingly, periodic reclassifications are made within the Fund's capital accounts to reflect income and gains available for distribution under income tax regulations.
G Estimates— The preparation of financial statements in conformity with U.S. GAAP requires management to make estimates and assumptions that affect the reported amounts of assets and liabilities and disclosure of contingent assets and liabilities at the date of the financial statements and the reported amounts of increases and decreases in net assets from operations during the reporting period. Actual results could differ from those estimates.
H Indemnifications— The Corporation’s By-Laws provide for indemnification for Directors or officers of the Corporation and certain other parties, to the fullest extent permitted by Maryland law and the 1940 Act, provided certain conditions are met. Additionally, in the normal course of business, the Fund enters into agreements with service providers that may contain indemnification clauses. The Fund’s maximum exposure under these arrangements is unknown as this would involve future claims that may be made against the Fund that have not yet occurred.
I Federal Income Taxes— No provision for federal income or excise tax is required since the Fund intends to continue to qualify as a regulated investment company under the Internal Revenue Code and to distribute substantially all of its taxable earnings.
Management has analyzed the Fund's tax positions taken for all open federal income tax years and has concluded that no provision for federal income tax is required in the Fund's financial statements. A Fund's federal tax return is subject to examination by the Internal Revenue Service for a period of three years from the date of filing.
2 Related Party Transactions
The investment advisory fee is earned by CRM as compensation for investment advisory services rendered to the Fund. On March 1, 2021, Morgan Stanley acquired Eaton Vance Corp. (the “Transaction”) and CRM became an indirect, wholly-owned subsidiary of Morgan Stanley. In connection with the Transaction, the Fund entered into a new investment advisory agreement (the “New Agreement”) with CRM, which took effect on March 1, 2021. Pursuant to the New Agreement (and the Fund’s investment advisory agreement with CRM in effect prior to March 1, 2021), the fee is computed at the annual rate of 0.25% of the Fund’s average daily net assets and is payable monthly. For the year ended December 31, 2021, the investment advisory fee amounted to $616,307. The Fund may invest its cash in Cash Reserves Fund. CRM does not currently receive a fee for advisory services provided to Cash Reserves Fund.
Pursuant to an investment sub-advisory agreement, CRM has delegated the investment management of the Fund to Ameritas Investment Partners, Inc. (AIP). In connection with the Transaction, CRM entered into a new investment sub-advisory agreement with AIP, which took effect on March 1, 2021. CRM pays AIP a portion of its investment advisory fee for sub-advisory services provided to the Fund.
CRM has agreed to reimburse the Fund’s operating expenses to the extent that total annual operating expenses (relating to ordinary operating expenses only and excluding expenses such as brokerage commissions, acquired fund fees and expenses of unaffiliated funds, borrowing costs, taxes or litigation expenses) exceed 0.39% for Class I and 0.59% for Class F of such class’s average daily net assets. The expense reimbursement agreement with CRM may be changed or terminated after April 30, 2022. For the year ended December 31, 2021, CRM waived or reimbursed expenses of $439,412.
The administrative fee is earned by CRM as compensation for administrative services rendered to the Fund. The fee is computed at an annual rate of 0.12% of the Fund’s average daily net assets attributable to Class I and Class F and is payable monthly. For the year ended December 31, 2021, CRM was paid administrative fees of $295,827.
The Fund has in effect a distribution plan for Class F shares (Class F Plan) pursuant to Rule 12b-1 under the 1940 Act. Pursuant to the Class F Plan, the Fund pays Eaton Vance Distributors, Inc. (EVD), an affiliate of CRM and the Fund’s principal underwriter, a distribution and service fee of 0.20% per annum of its average daily net assets attributable to Class F shares for distribution services and facilities provided to the Fund, as well as for personal and/or account maintenance services provided to the class shareholders. Distribution and service fees paid or accrued for the year ended December 31, 2021 amounted to $123,250 for Class F shares.
Eaton Vance Management (EVM), an affiliate of CRM, provides sub-transfer agency and related services to the Fund pursuant to a Sub-Transfer Agency Support Services Agreement. For the year ended December 31, 2021, sub-transfer agency fees and expenses incurred to EVM amounted to $655 and are included in transfer agency fees and expenses on the Statement of Operations.
Each Director of the Fund who is not an employee of CRM or its affiliates receives an annual fee of $154,000 ($214,000 effective January 1, 2022), plus an annual Committee fee ranging from $8,500 to $16,500 depending on the Committee. The Board chair receives an additional $30,000 annual fee, Committee chairs receive an additional $6,000 annual fee and the special equities liaison receives an additional $2,500 annual fee. Eligible Directors may participate in a Deferred Compensation Plan (the Plan). Amounts deferred under the Plan are treated as though equal dollar amounts had been invested in
Calvert
VP Russell 2000® Small Cap Index Portfolio
December 31, 2021
Notes to Financial Statements — continued
shares of the Fund or other Calvert funds selected by the Directors. The Fund purchases shares of the funds selected equal to the dollar amounts deferred under the Plan, resulting in an asset equal to the deferred compensation liability. Obligations of the Plan are paid solely from the Fund's assets. Directors’ fees are allocated to each of the Calvert funds served. Salaries and fees of officers and Directors of the Fund who are employees of CRM or its affiliates are paid by CRM.
3 Shareholder Servicing Plan
The Corporation, on behalf of the Fund, has adopted a Shareholder Servicing Plan (Servicing Plan), which permits the Fund to enter into shareholder servicing agreements with intermediaries that maintain accounts in the Fund for the benefit of shareholders. These services may include, but are not limited to, processing purchase and redemption requests, processing dividend payments, and providing account information to shareholders. Under the Servicing Plan, the Fund may make payments at an annual rate of up to 0.11% of its average daily net assets. For the year ended December 31, 2021, expenses incurred under the Servicing Plan amounted to $218,797, of which $87,308 were payable to an affiliate of AIP, and are included in transfer agency fees and expenses on the Statement of Operations. Included in accrued expenses at December 31, 2021 are amounts payable to an affiliate of AIP under the Servicing Plan of $7,329.
4 Investment Activity
During the year ended December 31, 2021, the cost of purchases and proceeds from sales of investments, other than short-term securities, were $44,725,541 and $50,586,277, respectively.
5 Distributions to Shareholders and Income Tax Information
The tax character of distributions declared for the years ended December 31, 2021 and December 31, 2020 was as follows:
| | Year Ended December 31, |
| | 2021 | 2020 |
| Ordinary income | $2,549,882 | $3,233,185 |
| Long-term capital gains | $6,171,867 | $9,227,198 |
As of December 31, 2021, the components of distributable earnings (accumulated loss) on a tax basis were as follows:
| Undistributed ordinary income | $ 4,071,608 |
| Undistributed long-term capital gains | 19,111,251 |
| Net unrealized appreciation | 78,983,241 |
| Distributable earnings | $102,166,100 |
The cost and unrealized appreciation (depreciation) of investments, including open derivative contracts, of the Fund at December 31, 2021, as determined on a federal income tax basis, were as follows:
| Aggregate cost | $177,206,557 |
| Gross unrealized appreciation | $ 104,048,358 |
| Gross unrealized depreciation | (25,065,117) |
| Net unrealized appreciation | $ 78,983,241 |
6 Financial Instruments
A summary of futures contracts outstanding at December 31, 2021 is included in the Schedule of Investments. During the year ended December 31, 2021, the Fund used futures contracts to provide equity market exposure for uncommitted cash balances.
Calvert
VP Russell 2000® Small Cap Index Portfolio
December 31, 2021
Notes to Financial Statements — continued
At December 31, 2021, the fair value of open derivative instruments (not considered to be hedging instruments for accounting disclosure purposes) and whose primary underlying risk exposure is equity price risk was as follows:
| Derivative | Statement of Assets and Liabilities Caption | Assets | Liabilities |
| Futures contracts | Distributable earnings | | $331,010 (1) | $ — |
| (1) | Only the current day's variation margin is reported within the Statement of Assets and Liabilities as Receivable or Payable for variation margin on open futures contracts, as applicable. |
The effect of derivative instruments (not considered to be hedging instruments for accounting disclosure purposes) on the Statement of Operations and whose primary underlying risk exposure is equity price risk for the year ended December 31, 2021 was as follows:
| | Statement of Operations Caption | |
| Derivative | Net realized gain (loss): Futures
contracts | Change in unrealized appreciation
(depreciation): Futures contracts |
| Futures contracts | $ 372,215 | $ 261,820 |
The average notional cost of futures contracts (long) outstanding during the year ended December 31, 2021 was approximately $10,098,000.
7 Securities Lending
To generate additional income, the Fund may lend its securities pursuant to a securities lending agency agreement with State Street Bank and Trust Company (SSBT), the securities lending agent. Security loans are subject to termination by the Fund at any time and, therefore, are not considered illiquid investments. The Fund requires that the loan be continuously collateralized by either cash or securities in an amount at least equal to the market value of the securities on loan. The market value of securities loaned is determined daily and any additional required collateral is delivered to the Fund on the next business day. Cash collateral is generally invested in a money market fund registered under the 1940 Act that is managed by an affiliate of SSBT. Any gain or loss in the market price of the loaned securities that might occur and any interest earned or dividends declared during the term of the loan would accrue to the account of the Fund. Income earned on the investment of collateral, net of broker rebates and other expenses incurred by the securities lending agent, is split between the Fund and the securities lending agent based on agreed upon contractual terms. Non-cash collateral, if any, is held by the lending agent on behalf of the Fund and cannot be sold or re-pledged by the Fund; accordingly, such collateral is not reflected in the Statement of Assets and Liabilities.
The risks associated with lending portfolio securities include, but are not limited to, possible delays in receiving additional collateral or in the recovery of the loaned securities, possible loss of rights to the collateral should the borrower fail financially, as well as risk of loss in the value of the collateral or the value of the investments made with the collateral. The securities lending agent shall indemnify the Fund in the case of default of any securities borrower.
At December 31, 2021, the total value of securities on loan was $18,152,867 and the total value of collateral received was $18,951,760, comprised of cash of $8,541,296 and U.S. government and/or agencies securities of $10,410,464.
The following table provides a breakdown of securities lending transactions accounted for as secured borrowings, the obligations by class of collateral pledged, and the remaining contractual maturity of those transactions as of December 31, 2021.
| | Remaining Contractual Maturity of the Transactions |
| | Overnight and
Continuous | <30 days | 30 to 90 days | >90 days | Total |
| Common Stocks | $8,541,296 | $ — | $ — | $ — | $8,541,296 |
The carrying amount of the liability for deposits for securities loaned at December 31, 2021 approximated its fair value. If measured at fair value, such liability would have been considered as Level 2 in the fair value hierarchy (see Note 1A) at December 31, 2021.
Calvert
VP Russell 2000® Small Cap Index Portfolio
December 31, 2021
Notes to Financial Statements — continued
8 Line of Credit
The Fund participates with other portfolios and funds managed by EVM and its affiliates, including CRM, in an $800 million unsecured line of credit with a group of banks, which is in effect through October 25, 2022. Borrowings are made by the Fund solely for temporary purposes related to redemptions and other short-term cash needs. Interest is charged to the Fund based on its borrowings at an amount above either the Secured Overnight Financing Rate (SOFR) or Federal Funds rate. In addition, a fee computed at an annual rate of 0.15% on the daily unused portion of the line of credit is allocated among the participating portfolios and funds at the end of each quarter. In connection with the renewal of the agreement in October 2021, an arrangement fee of $150,000 was incurred that was allocated to the participating portfolios and funds. Because the line of credit is not available exclusively to the Fund, it may be unable to borrow some or all of its requested amounts at any particular time.
The Fund had no borrowings pursuant to its line of credit during the year ended December 31, 2021.
9 Affiliated Funds
At December 31, 2021, the value of the Fund’s investment in affiliated funds was $11,109,283, which represents 4.5% of the Fund’s net assets. Transactions in affiliated funds by the Fund for the year ended December 31, 2021 were as follows:
| Name | Value,
beginning
of period | Purchases | Sales
proceeds | Net
realized
gain
(loss) | Change in
unrealized
appreciation
(depreciation) | Value,
end of
period | Dividend
income | Units,
end of
period |
| Short-Term Investments | | | | | | |
| Calvert Cash Reserves Fund, LLC | $4,844,825 | $33,955,079 | $(27,689,885) | $(835) | $99 | $11,109,283 | $6,191 | 11,109,283 |
10 Capital Shares
The Corporation may issue its shares in one or more series (such as the Fund). The authorized shares of the Fund consist of 20,000,000 common shares, $0.10 par value, for each Class.
Transactions in capital shares for the years ended December 31, 2021 and December 31, 2020 were as follows:
| | Year Ended
December 31, 2021 | | Year Ended
December 31, 2020 |
| | Shares | Amount | | Shares | Amount |
| Class I | | | | | |
| Shares sold | 210,954 | $ 21,302,381 | | 280,479 | $ 19,443,152 |
| Reinvestment of distributions | 65,581 | 6,490,617 | | 136,242 | 9,760,402 |
| Shares redeemed | (302,828) | (30,545,810) | | (452,143) | (33,100,124) |
| Net decrease | (26,293) | $ (2,752,812) | | (35,422) | $ (3,896,570) |
| Class F | | | | | |
| Shares sold | 185,362 | $ 18,663,731 | | 142,429 | $ 10,333,138 |
| Reinvestment of distributions | 22,672 | 2,231,132 | | 37,820 | 2,699,981 |
| Shares redeemed | (109,357) | (10,968,968) | | (166,147) | (11,615,182) |
| Net increase | 98,677 | $ 9,925,895 | | 14,102 | $ 1,417,937 |
At December 31, 2021, separate accounts of an insurance company that is an affiliate of AIP owned 47.0% of the value of the outstanding shares of the Fund and separate accounts of two other insurance companies each owned more than 10% of the value of the outstanding shares of the Fund, aggregating 32.1%.
Calvert
VP Russell 2000® Small Cap Index Portfolio
December 31, 2021
Notes to Financial Statements — continued
11 Risks and Uncertainties
Pandemic Risk
An outbreak of respiratory disease caused by a novel coronavirus was first detected in China in late 2019 and subsequently spread internationally. This coronavirus has resulted in closing borders, enhanced health screenings, changes to healthcare service preparation and delivery, quarantines, cancellations, disruptions to supply chains and customer activity, as well as general concern and uncertainty. Health crises caused by outbreaks, such as the coronavirus outbreak, may exacerbate other pre-existing political, social and economic risks and disrupt normal market conditions and operations. The impact of this outbreak has negatively affected the worldwide economy, the economies of individual countries, individual companies, and the market in general, and may continue to do so in significant and unforeseen ways, as may other epidemics and pandemics that may arise in the future. Any such impact could adversely affect the Fund's performance, or the performance of the securities in which the Fund invests.
12 Change in Independent Registered Public Accounting Firm
On July 30, 2021, KPMG LLP (“KPMG”) informed the Audit Committee and Board of the Corporation that it was resigning as the independent registered public accounting firm to the Corporation, as upon Morgan Stanley’s acquisition of Eaton Vance Corp., the parent company of CRM (the investment adviser to each series of the Corporation), KPMG would no longer be independent of the Corporation. The Audit Committee of the Board and the Board approved the selection of Deloitte & Touche LLP (“Deloitte”) as the independent registered public accounting firm for the funds that are series of the Corporation (the “Funds”) for the fiscal year ending December 31, 2021 to be effective upon KPMG’s resignation and Deloitte’s acceptance of the engagement which became effective July 30, 2021.
KPMG’s reports on the financial statements for the Funds for the fiscal periods ended December 31, 2019 and December 31, 2020 contained no adverse opinion or disclaimer of opinion nor were they qualified or modified as to uncertainty, audit scope or accounting principles. During the fiscal periods ended December 31, 2019 and December 31, 2020, and during the subsequent interim period through July 30, 2021: (i) there were no disagreements with KPMG on any matter of accounting principles or practices, financial statement disclosure or auditing scope or procedure, which disagreements, if not resolved to the satisfaction of KPMG, would have caused KPMG to make reference to the subject matter of the disagreements in connection with its reports on the Funds’ financial statements for such periods; and (ii) there were no “reportable events” of the kind described in Item 304(a)(1)(v) of Regulation S-K under the Securities Exchange Act of 1934, as amended.
During the fiscal periods ended December 31, 2019 and December 31, 2020, and during the subsequent interim period through July 30, 2021: neither the Funds, nor anyone on their behalf, consulted with Deloitte on items which: (i) concerned the application of accounting principles to a specified transaction, either completed or proposed, or the type of audit opinion that might be rendered on the Funds’ financial statements; or (ii) concerned the subject of a disagreement (as defined in paragraph (a)(1)(iv) of Item 304 of Regulation S-K) or reportable events (as described in paragraph (a)(1)(v) of Item 304).
Calvert
VP Russell 2000® Small Cap Index Portfolio
December 31, 2021
Report of Independent Registered Public Accounting Firm
To the Board of Directors of Calvert Variable Products, Inc. and Shareholders of Calvert VP Russell 2000® Small Cap Index Portfolio:
Opinion on the Financial Statements and Financial Highlights
We have audited the accompanying statement of assets and liabilities of Calvert VP Russell 2000® Small Cap Index Portfolio (the "Fund") (one of the funds constituting Calvert Variable Products, Inc.), including the schedule of investments, as of December 31, 2021, the related statements of operations, changes in net assets, and the financial highlights for the year then ended, and the related notes. In our opinion, the financial statements and financial highlights present fairly, in all material respects, the financial position of the Fund as of December 31, 2021, and the results of its operations, changes in its net assets, and the financial highlights for the year then ended in conformity with accounting principles generally accepted in the United States of America. The statement of changes in net assets for the year ended December 31, 2020, and the financial highlights for the years ended December 31, 2020, 2019, 2018, and 2017 were audited by other auditors whose report, dated February 18, 2021, expressed an unqualified opinion on that financial statement and those financial highlights.
Basis for Opinion
These financial statements and financial highlights are the responsibility of the Fund's management. Our responsibility is to express an opinion on the Fund's financial statements and financial highlights based on our audit. We are a public accounting firm registered with the Public Company Accounting Oversight Board (United States) (PCAOB) and are required to be independent with respect to the Fund in accordance with the U.S. federal securities laws and the applicable rules and regulations of the Securities and Exchange Commission and the PCAOB.
We conducted our audit in accordance with the standards of the PCAOB. Those standards require that we plan and perform the audit to obtain reasonable assurance about whether the financial statements and financial highlights are free of material misstatement, whether due to error or fraud. The Fund is not required to have, nor were we engaged to perform, an audit of its internal control over financial reporting. As part of our audit, we are required to obtain an understanding of internal control over financial reporting but not for the purpose of expressing an opinion on the effectiveness of the Fund’s internal control over financial reporting. Accordingly, we express no such opinion.
Our audit included performing procedures to assess the risks of material misstatement of the financial statements and financial highlights, whether due to error or fraud, and performing procedures that respond to those risks. Such procedures included examining, on a test basis, evidence regarding the amounts and disclosures in the financial statements and financial highlights. Our audit also included evaluating the accounting principles used and significant estimates made by management, as well as evaluating the overall presentation of the financial statements and financial highlights. Our procedures included confirmation of securities owned as of December 31, 2021, by correspondence with the custodian and brokers; when replies were not received from brokers, we performed other auditing procedures. We believe that our audit provides a reasonable basis for our opinion.
/s/ Deloitte & Touche LLP
Boston, Massachusetts
February 18, 2022
We have served as the auditor of one or more Calvert investment companies since 2021.
Calvert
VP Russell 2000® Small Cap Index Portfolio
December 31, 2021
Federal Tax Information (Unaudited)
As required by the Internal Revenue Code and/or regulations, shareholders must be notified regarding the status of the dividends received deduction for corporations and capital gains dividends.
Dividends Received Deduction. Corporate shareholders are generally entitled to take the dividends received deduction on the portion of the Fund's dividend distribution that qualifies under tax law. For the Fund's fiscal 2021 ordinary income dividends, 58.92% qualifies for the corporate dividends received deduction.
Capital Gains Dividends. The Fund hereby designates as a capital gain dividend with respect to the taxable year ended December 31, 2021, $19,111,292 or, if subsequently determined to be different, the net capital gain of such year.
Calvert
VP Russell 2000® Small Cap Index Portfolio
December 31, 2021
Management and Organization
Fund Management. The Directors of Calvert Variable Products, Inc. (the Corporation) are responsible for the overall management and supervision of the affairs of the Corporation. The Board members and officers of the Corporation are listed below. Except as indicated, each individual has held the office shown or other offices in the same company for the last five years. Board members hold indefinite terms of office. Each Board member holds office until his or her successor is elected and qualified, or until his or her earlier death, resignation, retirement, removal or disqualification. Under the terms of the Fund’s current Board member retirement policy, an Independent Board member must retire at the end of the calendar year in which he or she turns 75. However, if such retirement would cause the Fund to be out of compliance with Section 16 of the 1940 Act or any other regulations or guidance of the SEC, then such retirement will not become effective until such time as action has been taken for the Fund to be in compliance therewith. The “noninterested Directors” consist of those Directors who are not “interested persons” of the Corporation, as that term is defined under the 1940 Act. The business address of each Board member and the Chief Compliance Officer is 1825 Connecticut Avenue, NW, Suite 400, Washington, DC 20009 and the business address of the Secretary, Vice President and Chief Legal Officer and the Treasurer is Two International Place, Boston, Massachusetts 02110. As used below, “CRM” refers to Calvert Research and Management and “Eaton Vance” refers to Eaton Vance Management. Each Director oversees 39 funds in the Calvert fund complex. Effective March 1, 2021, each of Eaton Vance and CRM are indirect, wholly-owned subsidiaries of Morgan Stanley. Each officer affiliated with CRM may hold a position with other CRM affiliates that is comparable to his or her position with CRM listed below.
| Name and Year of Birth | Corporation
Position(s) | Length of
Service | Principal Occupation(s) and Other Directorships
During Past Five Years and Other Relevant Experience |
| Interested Director |
John H. Streur(1)
1960 | Director and
President | Since 2015 | President and Chief Executive Officer of CRM (since December 31, 2016). President and Chief Executive Officer of Calvert Investments, Inc.
(January 2015 - December 2016); Chief Executive Officer of Calvert
Investment Distributors, Inc. (August 2015 - December 2016); Chief
Compliance Officer of Calvert Investment Management, Inc. (August 2015 -
April 2016); President and Director, Portfolio 21 Investments, Inc.
(through October 2014); President, Chief Executive Officer and
Director, Managers Investment Group LLC (through January 2012);
President and Director, The Managers Funds and Managers AMG
Funds (through January 2012).
Other Directorships. Portfolio 21 Investments, Inc. (asset management)
(through October 2014); Managers Investment Group LLC (asset management)
(through January 2012); The Managers Funds (asset management)
(through January 2012); Managers AMG Funds (asset management)
(through January 2012); Calvert Impact Capital, Inc. |
| Noninterested Directors |
Richard L. Baird, Jr.
1948 | Director | Since 2016 | Regional Disaster Recovery Lead, American Red Cross of Greater
Pennsylvania (since 2017). Volunteer, American Red Cross (since 2015).
Former President and CEO of Adagio Health Inc. (retired in 2014) in
Pittsburgh, PA.
Other Directorships. None. |
Alice Gresham Bullock
1950 | Chair and
Director | Since 2016 (Chair);
Since 2008 (Director) | Professor Emerita at Howard University School of Law. Dean Emerita of
Howard University School of Law and Deputy Director of the Association
of American Law Schools (1992-1994).
Other Directorships. None. |
Cari M. Dominguez
1949 | Director | Since 2016 | Former Chair of the U.S. Equal Employment Opportunity Commission.
Other Directorships. ManpowerGroup Inc. (workforce solutions company);
Triple S Management Corporation (managed care); National Association of Corporate Directors. |
John G. Guffey, Jr.
1948 | Director | Since 2016 | President of Aurora Press Inc., a privately held publisher of trade
paperbacks (since January 1997).
Other Directorships. Calvert Impact Capital, Inc. (through
December 31, 2018); Calvert Ventures, LLC. |
Miles D. Harper, III
1962 | Director | Since 2016 | Partner, Carr Riggs & Ingram (public accounting firm) since October 2014.
Partner, Gainer Donnelly & Desroches (public accounting firm) (now Carr
Riggs & Ingram) (November 1999 - September 2014).
Other Directorships. Bridgeway Funds (9) (asset management). |
Joy V. Jones
1950 | Director | Since 2016 | Attorney.
Other Directorships. Palm Management Corporation. |
Calvert
VP Russell 2000® Small Cap Index Portfolio
December 31, 2021
Management and Organization — continued
| Name and Year of Birth | Corporation
Position(s) | Length of
Service | Principal Occupation(s) and Other Directorships
During Past Five Years and Other Relevant Experience |
| Noninterested Directors (continued) |
Anthony A. Williams
1951 | Director | Since 2016 | CEO and Executive Director of the Federal City Council (July 2012 to
present); Senior Adviser and Independent Consultant for King and
Spalding LLP (September 2015 to present); Executive Director of Global
Government Practice at the Corporate Executive Board (January 2010 to
January 2012).
Other Directorships. Freddie Mac; Evoq Properties/Meruelo Maddux
Properties, Inc. (real estate management); Weston Solutions, Inc.
(environmental services); Bipartisan Policy Center’s Debt Reduction Task Force;
Chesapeake Bay Foundation; Catholic University of America; Urban Institute (research organization); The Howard Hughes Corporation (real estate development). |
| Name and Year of Birth | Corporation
Position(s) | Length of
Service | Principal Occupation(s)
During Past Five Years |
| Principal Officers who are not Directors |
Hope L. Brown
1973 | Chief
Compliance
Officer | Since 2014 | Chief Compliance Officer of 39 registered investment companies advised
by CRM (since 2014). Vice President and Chief Compliance Officer,
Wilmington Funds (2012-2014). |
Deidre E. Walsh
1971 | Secretary,
Vice President
and Chief
Legal Officer | Since 2021 | Vice President of CRM and officer of 39 registered investment companies
advised by CRM (since 2021). Also Vice President of Eaton Vance and
certain of its affiliates and officer of 138 registered investment companies
advised or administered by Eaton Vance. |
James F. Kirchner
1967 | Treasurer | Since 2016 | Vice President of CRM and officer of 39 registered investment companies
advised by CRM (since 2016). Also Vice President of Eaton Vance and
certain of its affiliates and officer of 138 registered investment companies
advised or administered by Eaton Vance. |
| | | | |
| (1) Mr. Streur is an interested person of the Fund because of his positions with the Fund’s adviser and certain affiliates. |
The SAI for the Fund includes additional information about the Directors and officers of the Fund and can be obtained without charge on Calvert’s website at www.calvert.com or by calling 1-800-368-2745.
| FACTS | WHAT DOES EATON VANCE DO WITH YOUR
PERSONAL INFORMATION? |
| Why? | Financial companies choose how they share your personal information. Federal law gives consumers the right to limit some but not all sharing. Federal law also requires us to tell you how we collect, share, and protect your personal information. Please read this notice carefully to understand what we do. |
| |
| What? | The types of personal information we collect and share depend on the product or service you have with us. This information can include:■ Social Security number and income
■
investment experience and risk tolerance
■
checking account number and wire transfer instructions |
| |
| How? | All financial companies need to share customers’ personal information to run their everyday business. In the section below, we list the reasons financial companies can share their customers’ personal information; the reasons Eaton Vance chooses to share; and whether you can limit this sharing. |
Reasons we can share your
personal information | Does Eaton Vance
share? | Can you limit
this sharing? |
| For our everyday business purposes — such as to process your transactions, maintain your account(s), respond to court orders and legal investigations, or report to credit bureaus | Yes | No |
| For our marketing purposes — to offer our products and services to you | Yes | No |
| For joint marketing with other financial companies | No | We don’t share |
| For our investment management affiliates’ everyday business purposes — information about your transactions, experiences, and creditworthiness | Yes | Yes |
| For our affiliates’ everyday business purposes — information about your transactions and experiences | Yes | No |
| For our affiliates’ everyday business purposes — information about your creditworthiness | No | We don’t share |
| For our investment management affiliates to market to you | Yes | Yes |
| For our affiliates to market to you | No | We don’t share |
| For nonaffiliates to market to you | No | We don’t share |
To limit our
sharing | Call toll-free 1-800-368-2745 or email: CRMPrivacy@calvert.comPlease note:If you are a new customer, we can begin sharing your information 30 days from the date we sent this notice. When you are no longer our customer, we continue to share your information as described in this notice. However, you can contact us at any time to limit our sharing. |
| Questions? | Call toll-free 1-800-368-2745 or email: CRMPrivacy@calvert.com |
| Privacy Notice — continued | April 2021 |
| Who we are |
| Who is providing this notice? | Eaton Vance Management, Eaton Vance Distributors, Inc., Eaton Vance Trust Company, Eaton Vance Management (International) Limited, Eaton Vance Advisers International Ltd., Eaton Vance Global Advisors Limited, Eaton Vance Management’s Real Estate Investment Group, Boston Management and Research, Calvert Research and Management, Eaton Vance and Calvert Fund Families and our investment advisory affiliates (“Eaton Vance”) (see Investment Management Affiliates definition below) |
| What we do |
How does Eaton Vance
protect my personal
information? | To protect your personal information from unauthorized access and use, we use security measures that comply with federal law. These measures include computer safeguards and secured files and buildings. We have policies governing the proper handling of customer information by personnel and requiring third parties that provide support to adhere to appropriate security standards with respect to such information. |
How does Eaton Vance
collect my personal
information? | We collect your personal information, for example, when you■ open an account or make deposits or withdrawals from your account
■
buy securities from us or make a wire transfer
■
give us your contact informationWe also collect your personal information from others, such as credit bureaus, affiliates, or other companies. |
| Why can’t I limit all sharing? | Federal law gives you the right to limit only■ sharing for affiliates’ everyday business purposes — information about your creditworthiness
■
affiliates from using your information to market to you
■
sharing for nonaffiliates to market to youState laws and individual companies may give you additional rights to limit sharing. See below for more on your rights under state law. |
| Definitions |
Investment Management
Affiliates | Eaton Vance Investment Management Affiliates include registered investment advisers, registered broker- dealers, and registered and unregistered funds. Investment Management Affiliates does not include entities associated with Morgan Stanley Wealth Management, such as Morgan Stanley Smith Barney LLC and Morgan Stanley & Co. |
| Affiliates | Companies related by common ownership or control. They can be financial and nonfinancial companies.■ Our affiliates include companies with a Morgan Stanley name and financial companies such as Morgan Stanley Smith Barney LLC and Morgan Stanley & Co. |
| Nonaffiliates | Companies not related by common ownership or control. They can be financial and nonfinancial companies.■ Eaton Vance does not share with nonaffiliates so they can market to you. |
| Joint marketing | A formal agreement between nonaffiliated financial companies that together market financial products or services to you.■ Eaton Vance doesn’t jointly market. |
| Other important information |
| Vermont: Except as permitted by law, we will not share personal information we collect about Vermont residents with Nonaffiliates unless you provide us with your written consent to share such information.California: Except as permitted by law, we will not share personal information we collect about California residents with Nonaffiliates and we will limit sharing such personal information with our Affiliates to comply with California privacy laws that apply to us. |
Delivery of Shareholder Documents. The Securities and Exchange Commission (SEC) permits funds to deliver only one copy of shareholder documents, including prospectuses, proxy statements and shareholder reports, to fund investors with multiple accounts at the same residential or post office box address. This practice is often called “householding” and it helps eliminate duplicate mailings to shareholders. Calvert funds, or your financial intermediary, may household the mailing of your documents indefinitely unless you instruct Calvert funds, or your financial intermediary, otherwise. If you would prefer that your Calvert fund documents not be householded, please contact Calvert funds at 1-800-368-2745, or contact your financial intermediary. Your instructions that householding not apply to delivery of your Calvert fund documents will typically be effective within 30 days of receipt by Calvert funds or your financial intermediary. Separate statements will be generated for each separate account and will be householded as described above.
Portfolio Holdings. Each Calvert fund files a schedule of portfolio holdings on Part F to Form N-PORT with the SEC. Certain information filed on Form N-PORT may be viewed on the Calvert website at www.calvert.com, by calling Calvert at 1-800-368-2745 or in the EDGAR database on the SEC’s website at www.sec.gov.
Proxy Voting. The Proxy Voting Guidelines that each Calvert fund uses to determine how to vote proxies relating to portfolio securities is provided as an Appendix to the fund’s Statement of Additional Information. The Statement of Additional Information can be obtained free of charge by calling the Calvert funds at 1-800-368-2745, by visiting the Calvert funds’ website at www.calvert.com or visiting the SEC’s website at www.sec.gov. Information regarding how a Calvert fund voted proxies relating to portfolio securities during the most recent 12-month period ended June 30 is available by calling Calvert funds, by visiting the Calvert funds’ website at www.calvert.com or by visiting the SEC’s website at www.sec.gov.
This Page Intentionally Left Blank
Investment Adviser and Administrator
Calvert Research and Management
1825 Connecticut Avenue NW, Suite 400
Washington, DC 20009
Investment Sub-Adviser
Ameritas Investment Partners, Inc.
5945 R Street
Lincoln, NE 68505
Principal Underwriter*
Eaton Vance Distributors, Inc.
Two International Place
Boston, MA 02110
(617) 482-8260
Custodian
State Street Bank and Trust Company
State Street Financial Center, One Lincoln Street
Boston, MA 02111
Transfer Agent
DST Asset Manager Solutions, Inc.
2000 Crown Colony Drive
Quincy, MA 02169
Independent Registered Public Accounting Firm
Deloitte & Touche LLP
200 Berkeley Street
Boston, MA 02116-5022
Fund Offices
1825 Connecticut Avenue NW, Suite 400
Washington, DC 20009
* FINRA BrokerCheck. Investors may check the background of their Investment Professional by contacting the Financial Industry Regulatory Authority (FINRA). FINRA BrokerCheck is a free tool to help investors check the professional background of current and former FINRA-registered securities firms and brokers. FINRA BrokerCheck is available by calling 1-800-289-9999 and at www.FINRA.org. The FINRA BrokerCheck brochure describing this program is available to investors at www.FINRA.org.
Printed on recycled paper.
24225 12.31.21
Calvert
VP EAFE International Index Portfolio
Annual Report
December 31, 2021
Commodity Futures Trading Commission Registration. The Commodity Futures Trading Commission (“CFTC”) has adopted regulations that subject registered investment companies and advisers to regulation by the CFTC if a fund invests more than a prescribed level of its assets in certain CFTC-regulated instruments (including futures, certain options and swap agreements) or markets itself as providing investment exposure to such instruments. The adviser has claimed an exclusion from the definition of “commodity pool operator” under the Commodity Exchange Act with respect to its management of the Fund and the other funds it manages. Accordingly, neither the Fund nor the adviser is subject to CFTC regulation.
Fund shares are not insured by the FDIC and are not deposits or other obligations of, or guaranteed by, any depository institution. Shares are subject to investment risks, including possible loss of principal invested.
This report must be preceded or accompanied by a current summary prospectus or prospectus. Before investing, investors should consider carefully the investment objective, risks, and charges and expenses of a mutual fund. This and other important information is contained in the summary prospectus and prospectus, which can be obtained from a financial intermediary. Prospective investors should read the prospectus carefully before investing. For further information, please call 1-800-368-2745.
Annual Report December 31, 2021
Calvert
VP EAFE International Index Portfolio
Calvert
VP EAFE International Index Portfolio
December 31, 2021
Management's Discussion of Fund Performance†
Economic and Market Conditions
The 12-month period starting January 1, 2021, was notable for a global equity rally that lasted for most of the period. Except for temporary retreats in September and November, broad-market stock indexes generally posted strong returns during the period. Investors cheered the reopening of businesses that had been affected by the pandemic and the rollout of several highly effective COVID-19 vaccines.
COVID-19, however, continued to have a firm grip on the global economy. Disease rates advanced and declined with second, third, and fourth waves of infections. Worker shortages led to global supply-chain disruptions. From computer chips to shipping containers, scarcities of key items led to temporary factory shutdowns and empty store shelves. In the U.S., those shortages — combined with high demand from consumers eager to spend money saved earlier in the pandemic — led to higher year-over-year inflation than had been seen in decades.
Still, investor optimism about a recovering economy drove stock prices up during most of the period. A significant pullback, however, occurred in September 2021 when stock indexes around the world reported negative returns. In the U.S., unexpectedly weak job creation in August and the U.S. Federal Reserve’s (the Fed’s) announcement that it might soon begin tapering its monthly bond purchases — which had stimulated the economy earlier — combined to drive U.S. stocks into negative territory. Around the globe, rising COVID-19 infections also weighed on equity performance in September.
In the final quarter of 2021, however, stock prices came roaring back. Even the late-November news of a new and more transmissible COVID-19 variant — Omicron — caused only a temporary market retreat. The Fed’s actions to tamp down inflation were applauded by investors, with stocks gaining ground after the central bank announced that tapering would be accelerated and that three possible interest rate hikes were forecast for 2022. Just two trading days before year-end, the S&P 500® Index closed at its 70th new all-time high for the period, and the Dow Jones Industrial Average® (DJIA) closed at an all-time high as well.
In China, the world’s second-largest economy, the Communist Party’s efforts to dial back capitalism and take control of China’s surging technology sector were not applauded by global investors. The MSCI Golden Dragon Index, a measure of Chinese large-cap and mid-cap stocks, was one of the worst-performing major indexes for the period, returning (9.47)%.
Most other indexes fared significantly better. The MSCI World Index, a broad measure of global equities, returned 21.82% during the period; while the S&P 500® Index returned 28.71%; and the Nasdaq Composite Index rose 22.18%. The MSCI EAFE Index of developed-market international equities returned 11.26%; while the MSCI Emerging Markets Index — dragged down in part by its China component — returned (2.54)%; and the MSCI Frontier Markets Index returned 19.73%.
Investment Strategy
Calvert VP EAFE International Index Portfolio (the Fund) seeks to substantially replicate the performance of the MSCI EAFE Index (the Index). This is pursued by investing in all, or virtually all, of the stocks within the Index in approximately the same proportion as the Index. The Index is a widely accepted benchmark of international stock performance that is designed to represent the performance of large- and mid-cap securities in 21 developed markets, including countries in Europe, Asia, Australia, and the Far East, but excluding the U.S. and Canada.
Fund Performance
For the 12-month period ended December 31, 2021, the Fund returned 10.88% for Class I shares at net asset value (NAV). By comparison, its benchmark, the Index, returned 11.26% during the period.
The Index is unmanaged and returns do not reflect any fees, dividend withholding taxes, or operating expenses.
While the Fund’s return was positive during the period, the U.S. dollar’s relative strength hurt the performance of the internationally diversified Fund. The currencies in which many of the Fund's holdings were denominated weakened relative to the U.S. dollar during the period. During the period, the U.S. Dollar Index gained more than 6%. At the country level, Austria performed best within the Fund during the period, returning 41.02%. New Zealand was the worst-performing country, returning (17.31)%. Hong Kong was the only other country besides New Zealand that had negative returns. The other 19 countries held by the Fund had positive returns during the period.
At the market sector level, 9 of 11 sectors within the Fund had positive returns during the period. The energy and information technology (IT) sectors led the way with both returning more than 20%. Technology stocks helped drive global stock returns in 2021, but only 9% of the Fund was invested in the IT sector. Communication services was the worst-performing sector, declining 5.66% during the period.
See Endnotes and Additional Disclosures in this report.
Past performance is no guarantee of future results. Returns are historical and are calculated by determining the percentage change in net asset value (NAV) or offering price (as applicable) with all distributions reinvested. Investment return and principal value will fluctuate so that shares, when redeemed, may be worth more or less than their original cost. Performance for periods less than or equal to one year is cumulative. Performance is for the stated time period only; due to market volatility, current Fund performance may be lower or higher than the quoted return.
Calvert
VP EAFE International Index Portfolio
December 31, 2021
Performance
Portfolio Manager(s) Thomas Seto of Calvert Research and Management
| % Average Annual Total Returns1,2 | Class
Inception Date | Performance
Inception Date | One Year | Five Years | Ten Years |
| Class I at NAV | 11/12/2002 | 11/12/2002 | 10.88% | 9.33% | 7.42% |
| Class F at NAV | 12/17/2007 | 11/12/2002 | 10.66 | 9.08 | 7.18 |
|
| MSCI EAFE Index | — | — | 11.26% | 9.54% | 8.02% |
| % Total Annual Operating Expense Ratios3 | Class I | Class F |
| Gross | 0.74% | 0.94% |
| Net | 0.48 | 0.68 |
Growth of $10,000
This graph shows the change in value of a hypothetical investment of $10,000 in Class I of the Fund for the period indicated. For comparison, the same investment is shown in the indicated index.
| Growth of Investment | Amount Invested | Period Beginning | At NAV | With Maximum Sales Charge |
| Class F | $10,000 | 12/31/2011 | $20,015 | N.A. |
See Endnotes and Additional Disclosures in this report.
Past performance is no guarantee of future results. Returns are historical and are calculated by determining the percentage change in net asset value (NAV) or offering price (as applicable) with all distributions reinvested. Investment return and principal value will fluctuate so that shares, when redeemed, may be worth more or less than their original cost. Performance for periods less than or equal to one year is cumulative. Performance is for the stated time period only; due to market volatility, current Fund performance may be lower or higher than the quoted return.
Calvert
VP EAFE International Index Portfolio
December 31, 2021
Sector Allocation (% of net assets)*
* Excludes cash and cash equivalents.
| Top 10 Holdings (% of net assets)* | |
| Nestle S.A. | 2.3% |
| ASML Holding NV | 1.9 |
| Roche Holding AG PC | 1.7 |
| LVMH Moet Hennessy Louis Vuitton SE | 1.3 |
| Toyota Motor Corp. | 1.1 |
| Novartis AG | 1.1 |
| Novo Nordisk A/S, Class B | 1.1 |
| AstraZeneca PLC | 1.0 |
| Sony Group Corp. | 0.9 |
| SAP SE | 0.8 |
| Total | 13.2% |
| * | Excludes cash and cash equivalents. |
Calvert
VP EAFE International Index Portfolio
December 31, 2021
Endnotes and Additional Disclosures
| † | The views expressed in this report are those of the portfolio manager(s) and are current only through the date stated at the top of this page. These views are subject to change at any time based upon market or other conditions, and Calvert and the Fund(s) disclaim any responsibility to update such views. These views may not be relied upon as investment advice and, because investment decisions are based on many factors, may not be relied upon as an indication of trading intent on behalf of any Calvert fund. This commentary may contain statements that are not historical facts, referred to as “forward-looking statements.” The Fund’s actual future results may differ significantly from those stated in any forward-looking statement, depending on factors such as changes in securities or financial markets or general economic conditions, the volume of sales and purchases of Fund shares, the continuation of investment advisory, administrative and service contracts, and other risks discussed from time to time in the Fund’s filings with the Securities and Exchange Commission. |
| | |
| 1 | MSCI EAFE Index is an unmanaged index of equities in the developed markets, excluding the U.S. and Canada. MSCI indexes are net of foreign withholding taxes. Source: MSCI. MSCI data may not be reproduced or used for any other purpose. MSCI provides no warranties, has not prepared or approved this report, and has no liability hereunder. Unless otherwise stated, index returns do not reflect the effect of any applicable sales charges, commissions, expenses, taxes or leverage, as applicable. It is not possible to invest directly in an index. |
| 2 | There is no sales charge. Insurance-related charges are not included in the calculation of returns. If such charges were reflected, the returns would be lower. Please refer to the report for your insurance contract for performance data reflecting insurance-related charges.Calvert Research and Management became the investment adviser to the Fund on December 31, 2016. Performance reflected prior to such date is that of the Fund’s former investment adviser. |
| 3 | Source: Fund prospectus. Net expense ratios reflect a contractual expense reimbursement that continues through 4/30/22. The expense ratios for the current reporting period can be found in the Financial Highlights section of this report. Performance reflects expenses waived and/or reimbursed, if applicable. Without such waivers and/or reimbursements, performance would have been lower. |
| | Additional Information |
| | S&P 500® Index is an unmanaged index of large-cap stocks commonly used as a measure of U.S. stock market performance. Dow Jones Industrial Average® is a price-weighted average of 30 blue-chip stocks that are generally the leaders in their industry. S&P Dow Jones Indices are a product of S&P Dow Jones Indices LLC (“S&P DJI”) and have been licensed for use. S&P® and S&P 500® are registered trademarks of S&P DJI; Dow Jones® is a registered trademark of Dow Jones Trademark Holdings LLC (“Dow Jones”); S&P DJI, Dow Jones and their respective affiliates do not sponsor, endorse, sell or promote the Fund, will not have any liability with respect thereto and do not have any liability for any errors, omissions, or interruptions of the S&P Dow Jones Indices. Nasdaq Composite Index is a market capitalization-weighted index of all domestic and international securities listed on Nasdaq. Source: Nasdaq, Inc. The information is provided by Nasdaq (with its affiliates, are referred to as the “Corporations”) and Nasdaq’s third party licensors on an “as is” basis and the Corporations make no guarantees and bear no liability of any kind with respect to the information or the Fund. MSCI Golden Dragon Index is an unmanaged index of common stocks traded in China, Hong Kong and Taiwan. MSCI World Index is an unmanaged index of equity securities in the developed markets. MSCI Emerging Markets Index is an unmanaged index of emerging markets common stocks. MSCI Frontier Markets Index is an unmanaged index that measures the performance of stock markets with less-developed economies and financial markets than emerging markets, and that typically have more restrictions on foreign stock ownership. The U.S. Dollar Index is an index of the value of the United States dollar relative to a basket of foreign currencies. |
Calvert
VP EAFE International Index Portfolio
December 31, 2021
Example
As a Fund shareholder, you incur ongoing costs, including management fees; distribution and/or service fees; and other Fund expenses. This Example is intended to help you understand your ongoing costs (in dollars) of Fund investing and to compare these costs with the ongoing costs of investing in other mutual funds. The Example is based on an investment of $1,000 invested at the beginning of the period and held for the entire period (July 1, 2021 to December 31, 2021).
Actual Expenses
The first section of the table below provides information about actual account values and actual expenses. You may use the information in this section, together with the amount you invested, to estimate the expenses that you paid over the period. Simply divide your account value by $1,000 (for example, an $8,600 account value divided by $1,000 = 8.6), then multiply the result by the number in the first section under the heading entitled “Expenses Paid During Period” to estimate the expenses you paid on your account during this period.
Hypothetical Example for Comparison Purposes
The second section of the table below provides information about hypothetical account values and hypothetical expenses based on the actual Fund expense ratio and an assumed rate of return of 5% per year (before expenses), which is not the actual Fund return. The hypothetical account values and expenses may not be used to estimate the actual ending account balance or expenses you paid for the period. You may use this information to compare the ongoing costs of investing in the Fund and other funds. To do so, compare this 5% hypothetical example with the 5% hypothetical examples that appear in the shareholder reports of the other funds.
Please note that the expenses shown in the table are meant to highlight your ongoing costs only and do not reflect expenses and charges which are, or may be imposed under the variable annuity contract or variable life insurance policy (variable contracts) (if applicable) or qualified pension or retirement plans (Qualified Plans) through which your investment in the Fund is made. Therefore, the second section of the table is useful in comparing ongoing costs associated with an investment in vehicles which fund benefits under variable contracts and Qualified Plans, and will not help you determine the relative total costs of investing in the Fund through variable contracts or Qualified Plans. In addition, if these expenses and charges imposed under the variable contracts or Qualified Plans were included, your costs would have been higher.
| | Beginning
Account Value
(7/1/21) | Ending
Account Value
(12/31/21) | Expenses Paid
During Period*
(7/1/21 – 12/31/21) | Annualized
Expense
Ratio |
| Actual | | | | |
| Class I | $1,000.00 | $1,019.80 | $2.44 ** | 0.48% |
| Class F | $1,000.00 | $1,018.80 | $3.46 ** | 0.68% |
| Hypothetical | | | | |
| (5% return per year before expenses) | | | | |
| Class I | $1,000.00 | $1,022.79 | $2.45 ** | 0.48% |
| Class F | $1,000.00 | $1,021.78 | $3.47 ** | 0.68% |
| * | Expenses are equal to the Fund's annualized expense ratio for the indicated Class, multiplied by the average account value over the period, multiplied by 184/365 (to reflect the one-half year period). The Example assumes that the $1,000 was invested at the net asset value per share determined at the close of business on June 30, 2021. Expenses shown do not include insurance-related charges or direct expenses of Qualified Plans. |
| ** | Absent a waiver and/or reimbursement of expenses by an affiliate, expenses would be higher. |
Calvert
VP EAFE International Index Portfolio
December 31, 2021
| Security | Shares | Value |
| Australia — 6.7% | |
| Afterpay, Ltd.(1) | | 1,693 | $ 102,202 |
| Ampol, Ltd. | | 1,867 | 40,314 |
| APA Group(2) | | 9,428 | 68,973 |
| Aristocrat Leisure, Ltd. | | 4,746 | 150,555 |
| ASX, Ltd.(2) | | 1,431 | 96,713 |
| Aurizon Holdings, Ltd. | | 13,234 | 33,623 |
| AusNet Services, Ltd. | | 15,503 | 29,001 |
| Australia & New Zealand Banking Group, Ltd. | | 21,979 | 440,269 |
| BHP Group, Ltd.(2) | | 23,200 | 700,448 |
| BlueScope Steel, Ltd. | | 3,687 | 56,287 |
| Brambles, Ltd. | | 11,380 | 88,039 |
| Cochlear, Ltd.(2) | | 497 | 78,004 |
| Coles Group, Ltd. | | 10,242 | 133,638 |
| Commonwealth Bank of Australia | | 13,773 | 1,012,471 |
| Computershare, Ltd. | | 4,516 | 65,740 |
| Crown Resorts, Ltd.(1)(2) | | 2,437 | 21,214 |
| CSL, Ltd. | | 3,530 | 746,596 |
| Dexus | | 9,023 | 72,959 |
| Domino's Pizza Enterprises, Ltd.(2) | | 498 | 42,744 |
| Endeavour Group, Ltd. | | 9,763 | 47,911 |
| Evolution Mining, Ltd. | | 13,620 | 40,408 |
| Fortescue Metals Group, Ltd. | | 13,023 | 183,061 |
| Goodman Group | | 12,738 | 245,548 |
| GPT Group (The) | | 14,328 | 56,498 |
| IDP Education, Ltd. | | 1,633 | 41,139 |
| Insurance Australia Group, Ltd.(2) | | 18,559 | 57,515 |
| Lendlease Corp., Ltd. | | 5,044 | 39,275 |
| Macquarie Group, Ltd. | | 2,730 | 408,095 |
| Magellan Financial Group, Ltd.(2) | | 1,187 | 18,342 |
| Medibank Pvt, Ltd. | | 21,199 | 51,632 |
| Mirvac Group | | 32,152 | 68,059 |
| National Australia Bank, Ltd. | | 25,463 | 534,649 |
| Newcrest Mining, Ltd. | | 6,199 | 111,025 |
| Northern Star Resources, Ltd. | | 9,013 | 61,986 |
| Orica, Ltd. | | 3,401 | 33,916 |
| Origin Energy, Ltd.(2) | | 14,411 | 54,999 |
| Qantas Airways, Ltd.(1) | | 7,283 | 26,567 |
| QBE Insurance Group, Ltd. | | 11,557 | 95,435 |
| Ramsay Health Care, Ltd. | | 1,442 | 74,941 |
| REA Group, Ltd. | | 374 | 45,606 |
| Reece, Ltd. | | 2,401 | 47,219 |
| Rio Tinto, Ltd. | | 2,874 | 209,722 |
| Santos, Ltd.(2) | | 24,651 | 113,554 |
| Scentre Group | | 42,781 | 98,412 |
| Seek, Ltd. | | 2,474 | 58,979 |
| Security | Shares | Value |
| Australia (continued) | |
| Sonic Healthcare, Ltd. | | 3,614 | $ 122,574 |
| South32, Ltd. | | 34,581 | 101,135 |
| Stockland | | 19,317 | 59,593 |
| Suncorp Group, Ltd. | | 10,030 | 80,752 |
| Sydney Airport(1)(2) | | 10,017 | 63,242 |
| Tabcorp Holdings, Ltd.(2) | | 15,814 | 57,773 |
| Telstra Corp., Ltd. | | 33,270 | 101,114 |
| Transurban Group | | 23,850 | 239,556 |
| Treasury Wine Estates, Ltd. | | 5,227 | 47,128 |
| Vicinity Centres | | 26,887 | 33,067 |
| Washington H. Soul Pattinson & Co., Ltd.(2) | | 1,836 | 39,571 |
| Wesfarmers, Ltd. | | 8,792 | 379,343 |
| Westpac Banking Corp. | | 28,515 | 442,368 |
| WiseTech Global, Ltd. | | 995 | 42,199 |
| Woodside Petroleum, Ltd.(2) | | 7,630 | 121,637 |
| Woolworths Group, Ltd. | | 9,763 | 269,884 |
| | | | $ 9,005,219 |
| Austria — 0.2% | |
| Erste Group Bank AG | | 2,695 | $ 126,343 |
| OMV AG | | 1,058 | 59,833 |
| Raiffeisen Bank International AG | | 1,194 | 35,068 |
| Verbund AG | | 502 | 56,417 |
| Voestalpine AG | | 996 | 36,138 |
| | | | $ 313,799 |
| Belgium — 0.8% | |
| Ageas S.A./NV | | 1,428 | $ 73,952 |
| Anheuser-Busch InBev S.A./NV(1) | | 5,942 | 358,243 |
| Elia Group S.A./NV(2) | | 260 | 34,270 |
| Etablissements Franz Colruyt NV(2) | | 493 | 20,919 |
| Groupe Bruxelles Lambert S.A. | | 917 | 102,417 |
| KBC Group NV | | 2,019 | 173,475 |
| Proximus S.A. | | 1,301 | 25,408 |
| Sofina S.A. | | 130 | 63,857 |
| Solvay S.A. | | 606 | 70,451 |
| UCB S.A. | | 1,003 | 114,468 |
| Umicore S.A. | | 1,462 | 59,642 |
| | | | $ 1,097,102 |
| Denmark — 2.7% | |
| Ambu A/S, Class B | | 1,373 | $ 36,239 |
| AP Moller - Maersk A/S, Class A | | 26 | 86,257 |
| AP Moller - Maersk A/S, Class B | | 45 | 160,619 |
| Carlsberg A/S, Class B | | 793 | 136,910 |
| Chr. Hansen Holding A/S | | 842 | 66,392 |
| Coloplast A/S, Class B | | 961 | 169,208 |
7
See Notes to Financial Statements.
Calvert
VP EAFE International Index Portfolio
December 31, 2021
Schedule of Investments — continued
| Security | Shares | Value |
| Denmark (continued) | |
| Danske Bank A/S | | 5,328 | $ 91,983 |
| Demant A/S(1) | | 798 | 40,862 |
| DSV A/S | | 1,585 | 369,350 |
| Genmab A/S(1) | | 504 | 201,173 |
| GN Store Nord A/S | | 974 | 61,114 |
| Novo Nordisk A/S, Class B | | 13,094 | 1,470,795 |
| Novozymes A/S, Class B | | 1,592 | 130,719 |
| Orsted A/S(3) | | 1,476 | 189,027 |
| Pandora A/S | | 798 | 99,264 |
| ROCKWOOL International A/S, Class B | | 61 | 26,637 |
| Tryg A/S | | 2,723 | 67,197 |
| Vestas Wind Systems A/S | | 7,954 | 242,240 |
| | | | $ 3,645,986 |
| Finland — 1.2% | |
| Elisa Oyj | | 1,026 | $ 63,177 |
| Fortum Oyj | | 3,297 | 101,120 |
| Kesko Oyj, Class B | | 2,174 | 72,461 |
| Kone Oyj, Class B | | 2,644 | 189,730 |
| Neste Oyj | | 3,281 | 161,477 |
| Nokia Oyj(1) | | 43,215 | 273,710 |
| Nordea Bank Abp | | 24,852 | 303,158 |
| Orion Oyj, Class B(2) | | 819 | 34,020 |
| Sampo Oyj, Class A | | 3,912 | 195,788 |
| Stora Enso Oyj, Class R | | 4,366 | 80,131 |
| UPM-Kymmene Oyj | | 4,106 | 156,228 |
| Wartsila Oyj Abp | | 3,830 | 53,719 |
| | | | $ 1,684,719 |
| France — 11.0% | |
| Accor S.A.(1) | | 1,179 | $ 38,215 |
| Aeroports de Paris(1) | | 234 | 30,187 |
| Air Liquide S.A. | | 3,669 | 639,889 |
| Alstom S.A. | | 2,516 | 89,344 |
| Amundi S.A.(3) | | 448 | 36,953 |
| ArcelorMittal S.A. | | 5,460 | 175,149 |
| Arkema S.A. | | 475 | 67,044 |
| AXA S.A. | | 14,963 | 445,348 |
| BioMerieux | | 321 | 45,652 |
| BNP Paribas S.A. | | 8,728 | 603,463 |
| Bollore S.A. | | 6,375 | 35,659 |
| Bouygues S.A. | | 1,786 | 63,932 |
| Bureau Veritas S.A. | | 2,318 | 76,955 |
| Capgemini SE | | 1,239 | 303,655 |
| Carrefour S.A. | | 4,895 | 89,742 |
| Cie de Saint-Gobain | | 4,045 | 284,552 |
| Cie Generale des Etablissements Michelin SCA | | 1,289 | 211,118 |
| Security | Shares | Value |
| France (continued) | |
| CNP Assurances | | 1,220 | $ 30,177 |
| Covivio | | 345 | 28,320 |
| Credit Agricole S.A. | | 9,189 | 131,010 |
| Danone S.A. | | 5,082 | 315,894 |
| Dassault Aviation S.A. | | 170 | 18,387 |
| Dassault Systemes SE | | 5,286 | 313,700 |
| Edenred | | 1,978 | 91,341 |
| Eiffage S.A. | | 616 | 63,512 |
| Electricite de France S.A. | | 3,598 | 42,317 |
| Engie S.A. | | 14,078 | 208,430 |
| EssilorLuxottica S.A. | | 2,262 | 481,527 |
| Eurazeo SE | | 286 | 24,952 |
| Eurofins Scientific SE | | 1,075 | 133,183 |
| Faurecia SE | | 1,001 | 47,624 |
| Gecina S.A. | | 366 | 51,215 |
| Getlink SE(2) | | 3,525 | 58,382 |
| Hermes International | | 244 | 426,359 |
| Ipsen S.A. | | 305 | 27,911 |
| Kering S.A. | | 579 | 464,562 |
| Klepierre S.A. | | 1,482 | 35,067 |
| La Francaise des Jeux SAEM(3) | | 723 | 32,042 |
| Legrand S.A. | | 2,068 | 242,206 |
| L'Oreal S.A. | | 1,964 | 936,460 |
| LVMH Moet Hennessy Louis Vuitton SE | | 2,165 | 1,789,229 |
| Orange S.A. | | 15,668 | 167,368 |
| Orpea S.A. | | 435 | 43,625 |
| Pernod-Ricard S.A. | | 1,643 | 395,269 |
| Publicis Groupe S.A. | | 1,677 | 112,986 |
| Remy Cointreau S.A. | | 149 | 36,217 |
| Renault S.A.(1) | | 1,531 | 53,111 |
| Safran S.A. | | 2,662 | 325,891 |
| Sanofi | | 8,813 | 884,331 |
| Sartorius Stedim Biotech | | 208 | 114,235 |
| Schneider Electric SE | | 4,188 | 823,342 |
| SEB S.A. | | 192 | 29,920 |
| Societe Generale S.A. | | 6,513 | 223,843 |
| Sodexo S.A. | | 722 | 63,296 |
| Suez S.A. | | 2,884 | 65,014 |
| Teleperformance | | 446 | 199,396 |
| Thales S.A. | | 840 | 71,456 |
| TotalEnergies SE | | 19,688 | 1,002,123 |
| Ubisoft Entertainment S.A.(1) | | 727 | 35,463 |
| Unibail-Rodamco-Westfield (1) | | 1,030 | 72,079 |
| Valeo | | 1,737 | 52,382 |
| Veolia Environnement S.A. | | 5,227 | 191,956 |
| Vinci S.A. | | 4,142 | 437,456 |
| Vivendi SE | | 5,507 | 74,493 |
8
See Notes to Financial Statements.
Calvert
VP EAFE International Index Portfolio
December 31, 2021
Schedule of Investments — continued
| Security | Shares | Value |
| France (continued) | |
| Wendel SE | | 198 | $ 23,725 |
| Worldline S.A.(1)(3) | | 1,885 | 104,919 |
| | | | $ 14,834,560 |
| Germany — 8.7% | |
| adidas AG | | 1,475 | $ 424,719 |
| Allianz SE | | 3,196 | 753,804 |
| Aroundtown S.A. | | 8,106 | 48,898 |
| BASF SE | | 7,119 | 499,650 |
| Bayer AG | | 7,793 | 416,180 |
| Bayerische Motoren Werke AG | | 2,554 | 255,508 |
| Bayerische Motoren Werke AG, PFC Shares | | 525 | 43,537 |
| Bechtle AG | | 660 | 46,965 |
| Beiersdorf AG | | 754 | 77,289 |
| Brenntag SE | | 1,248 | 112,699 |
| Carl Zeiss Meditec AG | | 333 | 69,856 |
| Commerzbank AG(1) | | 8,316 | 62,915 |
| Continental AG(1) | | 892 | 93,718 |
| Covestro AG(3) | | 1,407 | 86,598 |
| Daimler AG | | 6,629 | 506,483 |
| Daimler Truck Holding AG(1) | | 3,314 | 121,830 |
| Delivery Hero SE(1)(3) | | 1,234 | 136,592 |
| Deutsche Bank AG(1) | | 16,163 | 201,310 |
| Deutsche Boerse AG | | 1,467 | 244,951 |
| Deutsche Lufthansa AG(1) | | 4,675 | 32,734 |
| Deutsche Post AG | | 7,648 | 491,925 |
| Deutsche Telekom AG | | 26,054 | 481,412 |
| E.ON SE | | 17,390 | 241,676 |
| Evonik Industries AG | | 1,690 | 54,596 |
| Fresenius Medical Care AG & Co. KGaA | | 1,614 | 104,633 |
| Fresenius SE & Co. KGaA | | 3,202 | 128,699 |
| Fuchs Petrolub SE, PFC Shares | | 612 | 27,656 |
| GEA Group AG | | 1,175 | 64,178 |
| Hannover Rueck SE | | 489 | 92,713 |
| HeidelbergCement AG | | 1,195 | 80,874 |
| HelloFresh SE(1) | | 1,318 | 101,009 |
| Henkel AG & Co. KGaA | | 829 | 64,622 |
| Henkel AG & Co. KGaA, PFC Shares | | 1,428 | 115,227 |
| Infineon Technologies AG | | 10,098 | 464,896 |
| KION Group AG | | 600 | 65,535 |
| Knorr-Bremse AG | | 597 | 58,962 |
| Lanxess AG | | 652 | 40,319 |
| LEG Immobilien SE | | 523 | 72,918 |
| Merck KGaA | | 995 | 255,971 |
| MTU Aero Engines AG | | 398 | 80,811 |
| Muenchener Rueckversicherungs-Gesellschaft AG | | 1,083 | 319,711 |
| Nemetschek SE | | 486 | 62,142 |
| Security | Shares | Value |
| Germany (continued) | |
| Porsche Automobil Holding SE, PFC Shares | | 1,133 | $ 106,970 |
| Puma SE | | 797 | 97,333 |
| Rational AG | | 41 | 41,933 |
| RWE AG | | 4,927 | 199,625 |
| SAP SE | | 8,112 | 1,141,679 |
| Sartorius AG, PFC Shares | | 203 | 137,297 |
| Scout24 SE(3) | | 615 | 42,943 |
| Siemens AG | | 5,940 | 1,028,825 |
| Siemens Energy AG(1) | | 3,088 | 78,788 |
| Siemens Healthineers AG(3) | | 2,224 | 165,820 |
| Symrise AG | | 968 | 143,162 |
| Telefonica Deutschland Holding AG(3) | | 7,582 | 21,031 |
| Uniper SE | | 708 | 33,616 |
| United Internet AG | | 763 | 30,250 |
| Volkswagen AG | | 260 | 76,007 |
| Volkswagen AG, PFC Shares | | 1,504 | 302,128 |
| Vonovia SE | | 5,771 | 317,995 |
| Zalando SE(1)(3) | | 1,718 | 138,396 |
| | | | $ 11,810,519 |
| Hong Kong — 2.8% | |
| AIA Group, Ltd. | | 93,966 | $ 948,384 |
| BOC Hong Kong Holdings, Ltd. | | 29,956 | 98,241 |
| Budweiser Brewing Co. APAC, Ltd.(3) | | 12,300 | 32,336 |
| Chow Tai Fook Jewellery Group, Ltd. | | 16,800 | 30,272 |
| CK Asset Holdings, Ltd. | | 14,709 | 92,784 |
| CK Hutchison Holdings, Ltd. | | 21,347 | 137,441 |
| CK Infrastructure Holdings, Ltd. | | 4,104 | 26,147 |
| CLP Holdings, Ltd. | | 13,122 | 132,595 |
| ESR Cayman, Ltd.(1)(3) | | 13,600 | 46,003 |
| Futu Holdings, Ltd.(1)(2) | | 406 | 17,580 |
| Galaxy Entertainment Group, Ltd.(1) | | 16,913 | 87,738 |
| Hang Lung Properties, Ltd. | | 14,000 | 28,825 |
| Hang Seng Bank, Ltd. | | 6,140 | 112,433 |
| Henderson Land Development Co., Ltd. | | 11,806 | 50,359 |
| HK Electric Investments & HK Electric Investments, Ltd. | | 20,027 | 19,650 |
| HKT Trust & HKT, Ltd. | | 33,020 | 44,368 |
| Hong Kong & China Gas Co., Ltd. | | 83,675 | 130,513 |
| Hong Kong Exchanges & Clearing, Ltd. | | 9,406 | 550,100 |
| Hongkong Land Holdings, Ltd. | | 9,294 | 48,325 |
| Jardine Matheson Holdings, Ltd. | | 1,619 | 89,025 |
| Link REIT | | 15,789 | 139,090 |
| Melco Resorts & Entertainment Ltd. ADR(1) | | 1,471 | 14,975 |
| MTR Corp., Ltd. | | 12,481 | 66,999 |
| New World Development Co., Ltd. | | 12,107 | 47,935 |
| Power Assets Holdings, Ltd. | | 11,042 | 68,828 |
| Sands China, Ltd.(1) | | 19,483 | 45,216 |
9
See Notes to Financial Statements.
Calvert
VP EAFE International Index Portfolio
December 31, 2021
Schedule of Investments — continued
| Security | Shares | Value |
| Hong Kong (continued) | |
| Sino Land Co., Ltd. | | 23,433 | $ 29,178 |
| SITC International Holdings Co., Ltd. | | 10,000 | 36,167 |
| Sun Hung Kai Properties, Ltd. | | 10,152 | 123,187 |
| Swire Pacific, Ltd., Class A | | 4,537 | 25,806 |
| Swire Properties, Ltd. | | 8,529 | 21,381 |
| Techtronic Industries Co., Ltd. | | 10,525 | 209,815 |
| WH Group, Ltd.(3) | | 105,733 | 66,374 |
| Wharf Real Estate Investment Co., Ltd. | | 13,118 | 66,656 |
| Xinyi Glass Holdings, Ltd. | | 14,000 | 35,068 |
| | | | $ 3,719,794 |
| Ireland — 1.1% | |
| CRH PLC | | 6,047 | $ 320,128 |
| DCC PLC | | 788 | 64,508 |
| Experian PLC | | 7,088 | 349,126 |
| Flutter Entertainment PLC(1) | | 1,339 | 211,982 |
| James Hardie Industries PLC CDI | | 3,369 | 135,609 |
| Kerry Group PLC, Class A | | 1,223 | 157,786 |
| Kingspan Group PLC | | 1,176 | 140,279 |
| Smurfit Kappa Group PLC | | 1,810 | 99,761 |
| | | | $ 1,479,179 |
| Israel — 0.7% | |
| Azrieli Group, Ltd. | | 315 | $ 30,054 |
| Bank Hapoalim B.M. | | 9,053 | 93,173 |
| Bank Leumi Le-Israel B.M. | | 11,623 | 124,668 |
| Check Point Software Technologies, Ltd.(1) | | 841 | 98,027 |
| CyberArk Software, Ltd.(1) | | 327 | 56,663 |
| Elbit Systems, Ltd. | | 215 | 37,164 |
| Fiverr International, Ltd.(1)(2) | | 229 | 26,037 |
| ICL Group, Ltd. | | 5,940 | 57,215 |
| Inmode, Ltd.(1) | | 388 | 27,385 |
| Israel Discount Bank, Ltd., Class A | | 9,880 | 66,337 |
| Kornit Digital, Ltd.(1) | | 362 | 55,115 |
| Mizrahi Tefahot Bank, Ltd. | | 995 | 38,318 |
| Nice, Ltd.(1) | | 498 | 151,021 |
| Teva Pharmaceutical Industries, Ltd. ADR(1) | | 8,820 | 70,648 |
| Wix.com, Ltd.(1) | | 433 | 68,323 |
| | | | $ 1,000,148 |
| Italy — 2.1% | |
| Amplifon SpA | | 989 | $ 53,216 |
| Assicurazioni Generali SpA(2) | | 8,378 | 177,067 |
| Atlantia SpA(1) | | 3,751 | 74,426 |
| Davide Campari-Milano NV | | 3,681 | 53,714 |
| DiaSorin SpA | | 212 | 40,332 |
| Enel SpA(2) | | 63,649 | 508,942 |
| Security | Shares | Value |
| Italy (continued) | |
| Eni SpA | | 19,584 | $ 272,174 |
| Ferrari NV | | 971 | 249,941 |
| FinecoBank Banca Fineco SpA | | 4,632 | 81,118 |
| Infrastrutture Wireless Italiane SpA(2)(3) | | 2,913 | 35,323 |
| Intesa Sanpaolo SpA | | 129,469 | 334,409 |
| Mediobanca Banca di Credito Finanziario SpA | | 4,446 | 51,042 |
| Moncler SpA | | 1,629 | 117,725 |
| Nexi SpA(1)(3) | | 3,930 | 62,276 |
| Poste Italiane SpA(3) | | 4,086 | 53,528 |
| Prysmian SpA | | 1,988 | 74,781 |
| Recordati Industria Chimica e Farmaceutica SpA | | 757 | 48,610 |
| Snam SpA(2) | | 16,457 | 99,123 |
| Telecom Italia SpA | | 66,564 | 32,748 |
| Tenaris S.A. | | 3,576 | 37,323 |
| Terna - Rete Elettrica Nazionale | | 11,610 | 93,921 |
| UniCredit SpA | | 16,782 | 257,962 |
| | | | $ 2,809,701 |
| Japan — 22.6% | |
| Advantest Corp. | | 1,600 | $ 151,519 |
| AEON Co., Ltd. | | 5,248 | 123,675 |
| AGC, Inc. | | 1,556 | 74,335 |
| Aisin Corp. | | 1,252 | 48,036 |
| Ajinomoto Co., Inc. | | 3,799 | 115,650 |
| ANA Holdings, Inc.(1) | | 1,383 | 28,911 |
| Asahi Group Holdings, Ltd. | | 3,515 | 136,835 |
| Asahi Intecc Co., Ltd.(2) | | 1,600 | 34,374 |
| Asahi Kasei Corp. | | 10,170 | 95,805 |
| Astellas Pharma, Inc. | | 14,301 | 232,756 |
| Azbil Corp. | | 1,000 | 45,609 |
| Bandai Namco Holdings, Inc. | | 1,537 | 120,176 |
| Benefit One, Inc. | | 600 | 25,779 |
| Bridgestone Corp. | | 4,484 | 192,510 |
| Brother Industries, Ltd. | | 1,905 | 36,718 |
| Canon, Inc. | | 7,600 | 185,392 |
| Capcom Co., Ltd. | | 1,400 | 32,972 |
| Central Japan Railway Co. | | 1,159 | 154,230 |
| Chiba Bank, Ltd. (The) | | 4,141 | 23,689 |
| Chubu Electric Power Co., Inc. | | 5,369 | 56,710 |
| Chugai Pharmaceutical Co., Ltd. | | 5,246 | 170,999 |
| Concordia Financial Group, Ltd. | | 8,031 | 29,165 |
| Cosmos Pharmaceutical Corp. | | 200 | 29,403 |
| CyberAgent, Inc. | | 3,200 | 53,343 |
| Dai Nippon Printing Co., Ltd. | | 1,505 | 37,876 |
| Daifuku Co., Ltd. | | 800 | 65,420 |
| Dai-ichi Life Holdings, Inc. | | 8,013 | 161,622 |
| Daiichi Sankyo Co., Ltd. | | 13,900 | 353,775 |
10
See Notes to Financial Statements.
Calvert
VP EAFE International Index Portfolio
December 31, 2021
Schedule of Investments — continued
| Security | Shares | Value |
| Japan (continued) | |
| Daikin Industries, Ltd. | | 1,958 | $ 443,525 |
| Daito Trust Construction Co., Ltd. | | 516 | 59,196 |
| Daiwa House Industry Co., Ltd. | | 4,332 | 124,498 |
| Daiwa House REIT Investment Corp. | | 16 | 48,470 |
| Daiwa Securities Group, Inc. | | 12,125 | 68,421 |
| Denso Corp. | | 3,334 | 276,291 |
| Dentsu Group, Inc. | | 1,805 | 64,246 |
| Disco Corp. | | 200 | 61,131 |
| East Japan Railway Co. | | 2,350 | 144,467 |
| Eisai Co., Ltd. | | 1,951 | 110,754 |
| ENEOS Holdings, Inc. | | 24,938 | 93,164 |
| FANUC Corp. | | 1,462 | 310,765 |
| Fast Retailing Co., Ltd. | | 500 | 284,222 |
| Fuji Electric Co., Ltd. | | 1,041 | 56,868 |
| FUJIFILM Holdings Corp. | | 2,727 | 202,164 |
| Fujitsu, Ltd. | | 1,552 | 266,675 |
| GLP J-REIT | | 31 | 53,584 |
| GMO Payment Gateway, Inc. | | 300 | 37,358 |
| Hakuhodo DY Holdings, Inc. | | 1,578 | 26,258 |
| Hamamatsu Photonics K.K. | | 1,151 | 73,514 |
| Hankyu Hanshin Holdings, Inc. | | 1,862 | 52,916 |
| Hikari Tsushin, Inc. | | 119 | 18,327 |
| Hino Motors, Ltd. | | 2,636 | 21,736 |
| Hirose Electric Co., Ltd. | | 242 | 40,670 |
| Hitachi Construction Machinery Co., Ltd. | | 796 | 23,000 |
| Hitachi Metals, Ltd.(1) | | 1,286 | 23,828 |
| Hitachi, Ltd. | | 7,484 | 405,433 |
| Honda Motor Co., Ltd. | | 12,601 | 358,508 |
| Hoshizaki Corp. | | 416 | 31,299 |
| HOYA Corp. | | 2,923 | 433,749 |
| Hulic Co., Ltd. | | 2,340 | 22,252 |
| Ibiden Co., Ltd. | | 900 | 53,447 |
| Idemitsu Kosan Co., Ltd. | | 1,684 | 42,975 |
| Iida Group Holdings Co., Ltd. | | 1,100 | 25,583 |
| INPEX Corp. | | 8,491 | 73,834 |
| Isuzu Motors, Ltd. | | 4,355 | 54,204 |
| Ito En, Ltd. | | 400 | 21,017 |
| ITOCHU Corp. | | 9,248 | 282,932 |
| Itochu Techno-Solutions Corp. | | 700 | 22,517 |
| Japan Airlines Co., Ltd.(1) | | 1,320 | 25,058 |
| Japan Exchange Group, Inc. | | 4,118 | 90,223 |
| Japan Metropolitan Fund Investment Corp. | | 60 | 51,690 |
| Japan Post Bank Co., Ltd. | | 3,400 | 31,167 |
| Japan Post Holdings Co., Ltd. | | 19,300 | 150,352 |
| Japan Post Insurance Co., Ltd. | | 2,000 | 32,128 |
| Japan Real Estate Investment Corp. | | 10 | 56,766 |
| Japan Tobacco, Inc. | | 9,134 | 184,433 |
| Security | Shares | Value |
| Japan (continued) | |
| JFE Holdings, Inc. | | 4,025 | $ 51,351 |
| JSR Corp. | | 1,459 | 55,447 |
| Kajima Corp. | | 3,581 | 41,155 |
| Kakaku.com, Inc. | | 955 | 25,530 |
| Kansai Electric Power Co., Inc. (The) | | 5,178 | 48,399 |
| Kansai Paint Co., Ltd. | | 1,523 | 33,119 |
| Kao Corp. | | 3,801 | 199,075 |
| KDDI Corp. | | 12,467 | 364,581 |
| Keio Corp. | | 779 | 34,371 |
| Keisei Electric Railway Co., Ltd. | | 1,005 | 27,188 |
| Keyence Corp. | | 1,560 | 980,863 |
| Kikkoman Corp. | | 1,201 | 101,137 |
| Kintetsu Group Holdings Co., Ltd.(1) | | 1,346 | 37,627 |
| Kirin Holdings Co., Ltd. | | 6,326 | 101,892 |
| Kobayashi Pharmaceutical Co., Ltd. | | 400 | 31,463 |
| Kobe Bussan Co., Ltd. | | 1,000 | 38,717 |
| Koei Tecmo Holdings Co., Ltd. | | 520 | 20,418 |
| Koito Manufacturing Co., Ltd. | | 747 | 39,564 |
| Komatsu, Ltd. | | 6,946 | 162,439 |
| Konami Holdings Corp. | | 751 | 36,048 |
| Kose Corp. | | 208 | 23,596 |
| Kubota Corp. | | 8,011 | 178,133 |
| Kurita Water Industries, Ltd. | | 732 | 34,703 |
| Kyocera Corp. | | 2,548 | 159,316 |
| Kyowa Kirin Co., Ltd. | | 1,944 | 53,005 |
| Lasertec Corp.(2) | | 600 | 183,781 |
| Lawson, Inc. | | 500 | 23,725 |
| Lion Corp. | | 1,722 | 23,020 |
| Lixil Corp. | | 2,113 | 56,368 |
| M3, Inc. | | 3,458 | 174,357 |
| Makita Corp. | | 1,748 | 74,202 |
| Marubeni Corp. | | 12,333 | 120,160 |
| Mazda Motor Corp.(1) | | 4,510 | 34,605 |
| McDonald's Holdings Co. (Japan), Ltd. | | 577 | 25,536 |
| Medipal Holdings Corp. | | 1,645 | 30,835 |
| MEIJI Holdings Co., Ltd. | | 867 | 51,754 |
| Mercari, Inc.(1)(2) | | 700 | 35,614 |
| MINEBEA MITSUMI, Inc. | | 2,859 | 81,235 |
| MISUMI Group, Inc. | | 2,280 | 93,667 |
| Mitsubishi Chemical Holdings Corp. | | 10,522 | 78,046 |
| Mitsubishi Corp. | | 9,790 | 310,863 |
| Mitsubishi Electric Corp. | | 14,060 | 178,464 |
| Mitsubishi Estate Co., Ltd. | | 9,168 | 127,183 |
| Mitsubishi Gas Chemical Co., Inc. | | 1,148 | 19,460 |
| Mitsubishi HC Capital, Inc. | | 5,566 | 27,538 |
| Mitsubishi Heavy Industries, Ltd. | | 2,544 | 58,818 |
| Mitsubishi UFJ Financial Group, Inc.(4) | | 95,076 | 517,430 |
11
See Notes to Financial Statements.
Calvert
VP EAFE International Index Portfolio
December 31, 2021
Schedule of Investments — continued
| Security | Shares | Value |
| Japan (continued) | |
| Mitsui & Co., Ltd. | | 12,375 | $ 293,261 |
| Mitsui Chemicals, Inc. | | 1,475 | 39,648 |
| Mitsui Fudosan Co., Ltd. | | 7,031 | 139,360 |
| Miura Co., Ltd. | | 700 | 24,098 |
| Mizuho Financial Group, Inc. | | 18,700 | 237,513 |
| MonotaRO Co., Ltd. | | 1,800 | 32,375 |
| MS&AD Insurance Group Holdings, Inc. | | 3,328 | 102,477 |
| Murata Manufacturing Co., Ltd. | | 4,514 | 360,048 |
| NEC Corp. | | 1,855 | 85,775 |
| Nexon Co., Ltd. | | 3,850 | 74,445 |
| NGK Insulators, Ltd. | | 1,971 | 33,359 |
| Nidec Corp. | | 3,528 | 417,342 |
| Nihon M&A Center Holdings, Inc. | | 2,400 | 58,870 |
| Nintendo Co., Ltd. | | 921 | 430,896 |
| Nippon Building Fund, Inc. | | 12 | 69,896 |
| Nippon Express Co., Ltd. | | 576 | 33,997 |
| Nippon Paint Holdings Co., Ltd. | | 5,790 | 63,231 |
| Nippon Prologis REIT, Inc. | | 16 | 56,556 |
| Nippon Sanso Holdings Corp. | | 1,324 | 28,959 |
| Nippon Shinyaku Co., Ltd. | | 400 | 27,854 |
| Nippon Steel Corp. | | 6,475 | 105,776 |
| Nippon Telegraph & Telephone Corp. | | 9,904 | 270,857 |
| Nippon Yusen KK | | 1,300 | 99,129 |
| Nissan Chemical Corp. | | 1,047 | 60,894 |
| Nissan Motor Co., Ltd.(1) | | 17,743 | 85,460 |
| Nisshin Seifun Group, Inc. | | 1,417 | 20,442 |
| Nissin Foods Holdings Co., Ltd. | | 498 | 36,346 |
| Nitori Holdings Co., Ltd. | | 616 | 92,136 |
| Nitto Denko Corp. | | 1,070 | 82,660 |
| Nomura Holdings, Inc. | | 24,357 | 106,091 |
| Nomura Real Estate Holdings, Inc. | | 870 | 20,046 |
| Nomura Real Estate Master Fund, Inc. | | 30 | 42,220 |
| Nomura Research Institute, Ltd. | | 2,700 | 115,427 |
| NTT Data Corp. | | 5,030 | 107,900 |
| Obayashi Corp. | | 5,320 | 41,173 |
| Obic Co., Ltd. | | 560 | 104,804 |
| Odakyu Electric Railway Co., Ltd.(2) | | 2,305 | 42,853 |
| Oji Holdings Corp. | | 6,573 | 31,847 |
| Olympus Corp. | | 8,476 | 195,179 |
| Omron Corp. | | 1,463 | 145,784 |
| Ono Pharmaceutical Co., Ltd. | | 3,005 | 74,690 |
| Open House Co., Ltd. | | 600 | 31,354 |
| Oracle Corp. Japan | | 289 | 21,956 |
| Oriental Land Co., Ltd. | | 1,524 | 256,988 |
| ORIX Corp. | | 9,502 | 193,918 |
| Orix JREIT, Inc. | | 18 | 28,138 |
| Osaka Gas Co., Ltd. | | 3,123 | 51,652 |
| Security | Shares | Value |
| Japan (continued) | |
| Otsuka Corp. | | 864 | $ 41,198 |
| Otsuka Holdings Co., Ltd. | | 3,152 | 114,673 |
| Pan Pacific International Holdings Corp. | | 3,336 | 45,983 |
| Panasonic Corp. | | 16,847 | 185,195 |
| Persol Holdings Co., Ltd. | | 1,200 | 34,888 |
| Pola Orbis Holdings, Inc. | | 932 | 15,533 |
| Rakuten Group, Inc. | | 6,900 | 69,229 |
| Recruit Holdings Co., Ltd. | | 10,557 | 642,453 |
| Renesas Electronics Corp.(1) | | 10,100 | 125,449 |
| Resona Holdings, Inc. | | 16,411 | 63,776 |
| Ricoh Co., Ltd. | | 4,735 | 44,135 |
| Rinnai Corp. | | 246 | 22,201 |
| Rohm Co., Ltd. | | 707 | 64,315 |
| Ryohin Keikaku Co., Ltd. | | 1,730 | 26,379 |
| Santen Pharmaceutical Co., Ltd. | | 2,900 | 35,405 |
| SBI Holdings, Inc. | | 1,875 | 51,142 |
| SCSK Corp. | | 1,200 | 23,883 |
| Secom Co., Ltd. | | 1,648 | 114,513 |
| Seiko Epson Corp. | | 2,252 | 40,559 |
| Sekisui Chemical Co., Ltd. | | 2,964 | 49,570 |
| Sekisui House, Ltd. | | 4,950 | 106,503 |
| Seven & i Holdings Co., Ltd. | | 5,826 | 256,274 |
| SG Holdings Co., Ltd. | | 2,600 | 60,966 |
| Sharp Corp. | | 1,524 | 17,502 |
| Shimadzu Corp. | | 1,814 | 76,620 |
| Shimano, Inc. | | 550 | 146,476 |
| Shimizu Corp. | | 4,127 | 25,589 |
| Shin-Etsu Chemical Co., Ltd. | | 2,785 | 483,407 |
| Shionogi & Co., Ltd. | | 2,021 | 142,170 |
| Shiseido Co., Ltd. | | 3,174 | 177,066 |
| Shizuoka Bank, Ltd. (The)(2) | | 3,925 | 28,021 |
| SMC Corp. | | 479 | 323,736 |
| SoftBank Corp. | | 22,200 | 280,399 |
| SoftBank Group Corp. | | 9,384 | 449,870 |
| Sohgo Security Services Co., Ltd. | | 528 | 20,981 |
| Sompo Holdings, Inc. | | 2,599 | 109,609 |
| Sony Group Corp. | | 9,880 | 1,247,628 |
| Square Enix Holdings Co., Ltd. | | 700 | 35,910 |
| Stanley Electric Co., Ltd. | | 1,134 | 28,471 |
| Subaru Corp. | | 4,728 | 84,479 |
| Sumco Corp. | | 2,700 | 54,980 |
| Sumitomo Chemical Co., Ltd. | | 10,634 | 50,148 |
| Sumitomo Corp. | | 9,025 | 133,564 |
| Sumitomo Dainippon Pharma Co., Ltd. | | 1,622 | 18,714 |
| Sumitomo Electric Industries, Ltd. | | 5,990 | 78,175 |
| Sumitomo Metal Mining Co., Ltd. | | 2,020 | 76,506 |
| Sumitomo Mitsui Financial Group, Inc. | | 10,097 | 344,785 |
12
See Notes to Financial Statements.
Calvert
VP EAFE International Index Portfolio
December 31, 2021
Schedule of Investments — continued
| Security | Shares | Value |
| Japan (continued) | |
| Sumitomo Mitsui Trust Holdings, Inc. | | 2,482 | $ 82,994 |
| Sumitomo Realty & Development Co., Ltd. | | 2,268 | 66,863 |
| Suntory Beverage & Food, Ltd. | | 1,117 | 40,450 |
| Suzuki Motor Corp. | | 2,778 | 107,128 |
| Sysmex Corp. | | 1,293 | 174,531 |
| T&D Holdings, Inc. | | 4,306 | 55,012 |
| Taisei Corp. | | 1,549 | 47,105 |
| Taisho Pharmaceutical Holdings Co., Ltd. | | 267 | 12,325 |
| Takeda Pharmaceutical Co., Ltd. | | 12,224 | 333,817 |
| TDK Corp. | | 3,165 | 123,517 |
| Terumo Corp. | | 5,118 | 216,187 |
| TIS, Inc. | | 1,900 | 56,498 |
| Tobu Railway Co., Ltd. | | 1,573 | 35,896 |
| Toho Co., Ltd. | | 856 | 36,630 |
| Tokio Marine Holdings, Inc. | | 4,900 | 272,781 |
| Tokyo Century Corp.(2) | | 300 | 14,563 |
| Tokyo Electric Power Co. Holdings, Inc.(1) | | 11,600 | 29,988 |
| Tokyo Electron, Ltd. | | 1,179 | 678,600 |
| Tokyo Gas Co., Ltd. | | 2,962 | 53,169 |
| Tokyu Corp. | | 3,584 | 47,645 |
| TOPPAN, Inc. | | 2,074 | 38,920 |
| Toray Industries, Inc. | | 10,262 | 60,799 |
| Toshiba Corp. | | 3,274 | 134,720 |
| Tosoh Corp. | | 2,300 | 34,170 |
| TOTO, Ltd. | | 1,143 | 52,735 |
| Toyo Suisan Kaisha, Ltd. | | 704 | 29,848 |
| Toyota Industries Corp. | | 1,161 | 92,872 |
| Toyota Motor Corp. | | 82,750 | 1,529,434 |
| Toyota Tsusho Corp. | | 1,765 | 81,361 |
| Trend Micro, Inc. | | 1,144 | 63,510 |
| Tsuruha Holdings, Inc. | | 272 | 26,117 |
| Unicharm Corp. | | 3,214 | 139,832 |
| USS Co., Ltd. | | 1,635 | 25,545 |
| Welcia Holdings Co., Ltd. | | 800 | 24,986 |
| West Japan Railway Co. | | 1,778 | 74,361 |
| Yakult Honsha Co., Ltd. | | 996 | 51,961 |
| Yamaha Corp. | | 1,109 | 54,713 |
| Yamaha Motor Co., Ltd. | | 2,354 | 56,541 |
| Yamato Holdings Co., Ltd. | | 2,464 | 57,883 |
| Yaskawa Electric Corp. | | 1,883 | 92,391 |
| Yokogawa Electric Corp. | | 1,628 | 29,384 |
| Z Holdings Corp. | | 20,817 | 120,114 |
| ZOZO, Inc. | | 1,007 | 31,398 |
| | | | $ 30,592,699 |
| Netherlands — 7.0% | |
| ABN AMRO Bank NV(2)(3) | | 3,112 | $ 45,745 |
| Security | Shares | Value |
| Netherlands (continued) | |
| Adyen NV(1)(3) | | 154 | $ 404,250 |
| Aegon NV | | 12,975 | 64,506 |
| Airbus SE(1) | | 4,555 | 582,784 |
| Akzo Nobel NV | | 1,505 | 165,347 |
| Argenx SE(1) | | 363 | 129,086 |
| ASM International NV | | 368 | 162,442 |
| ASML Holding NV | | 3,232 | 2,588,896 |
| CNH Industrial NV | | 8,310 | 160,667 |
| Euronext NV(3) | | 670 | 69,656 |
| EXOR NV | | 898 | 80,387 |
| Heineken Holding NV(2) | | 927 | 85,474 |
| Heineken NV(2) | | 1,986 | 223,504 |
| IMCD NV | | 446 | 98,567 |
| ING Groep NV | | 30,089 | 418,327 |
| JDE Peet's NV | | 587 | 18,169 |
| Just Eat Takeaway.com NV(1)(2)(3) | | 1,437 | 78,073 |
| Koninklijke Ahold Delhaize NV | | 8,349 | 286,507 |
| Koninklijke DSM NV | | 1,394 | 313,938 |
| Koninklijke KPN NV | | 24,529 | 76,055 |
| Koninklijke Philips NV | | 7,038 | 260,488 |
| NN Group NV | | 2,075 | 112,217 |
| Prosus NV | | 7,233 | 599,073 |
| QIAGEN NV(1) | | 1,873 | 103,859 |
| Randstad NV | | 975 | 66,512 |
| Royal Dutch Shell PLC, Class A | | 32,032 | 701,962 |
| Royal Dutch Shell PLC, Class B | | 28,936 | 635,335 |
| Stellantis NV | | 15,632 | 295,110 |
| STMicroelectronics NV | | 5,354 | 263,282 |
| Universal Music Group NV | | 5,507 | 155,634 |
| Wolters Kluwer NV | | 2,106 | 247,878 |
| | | | $ 9,493,730 |
| New Zealand — 0.3% | |
| Auckland International Airport, Ltd.(1) | | 10,551 | $ 55,539 |
| Fisher & Paykel Healthcare Corp., Ltd. | | 4,305 | 96,447 |
| Mercury NZ, Ltd. | | 4,384 | 18,366 |
| Meridian Energy, Ltd. | | 9,757 | 32,386 |
| Ryman Healthcare, Ltd.(2) | | 2,935 | 24,611 |
| Spark New Zealand, Ltd. | | 13,480 | 41,687 |
| Xero, Ltd.(1) | | 981 | 100,414 |
| | | | $ 369,450 |
| Norway — 0.7% | |
| Adevinta ASA(1) | | 1,949 | $ 25,891 |
| Aker BP ASA | | 986 | 30,318 |
| DNB Bank ASA | | 7,510 | 171,782 |
| Equinor ASA | | 7,555 | 200,051 |
13
See Notes to Financial Statements.
Calvert
VP EAFE International Index Portfolio
December 31, 2021
Schedule of Investments — continued
| Security | Shares | Value |
| Norway (continued) | |
| Gjensidige Forsikring ASA | | 1,602 | $ 38,866 |
| Mowi ASA | | 3,437 | 81,342 |
| Norsk Hydro ASA | | 9,871 | 77,671 |
| Orkla ASA | | 6,067 | 60,813 |
| Schibsted ASA, Class A | | 610 | 23,518 |
| Schibsted ASA, Class B | | 899 | 30,240 |
| Telenor ASA | | 5,236 | 82,305 |
| Yara International ASA | | 1,431 | 72,148 |
| | | | $ 894,945 |
| Poland — 0.0%(5) | |
| InPost S.A.(1) | | 1,684 | $ 20,223 |
| | | | $ 20,223 |
| Portugal — 0.2% | |
| EDP - Energias de Portugal S.A. | | 21,198 | $ 116,447 |
| Galp Energia SGPS S.A. | | 3,597 | 34,902 |
| Jeronimo Martins SGPS S.A. | | 2,402 | 54,924 |
| | | | $ 206,273 |
| Singapore — 1.2% | |
| Ascendas Real Estate Investment Trust | | 23,731 | $ 51,994 |
| CapitaLand Integrated Commercial Trust | | 38,366 | 58,047 |
| CapitaLand Investment, Ltd.(1) | | 21,948 | 55,494 |
| City Developments, Ltd. | | 4,171 | 21,103 |
| DBS Group Holdings, Ltd. | | 13,948 | 337,806 |
| Genting Singapore, Ltd. | | 48,954 | 28,159 |
| Keppel Corp., Ltd. | | 12,128 | 46,123 |
| Mapletree Commercial Trust | | 19,300 | 28,867 |
| Mapletree Logistics Trust | | 22,400 | 31,591 |
| Oversea-Chinese Banking Corp., Ltd. | | 26,936 | 227,979 |
| Sea, Ltd.(1) | | 1,078 | 241,159 |
| Singapore Airlines, Ltd.(1)(2) | | 9,600 | 35,594 |
| Singapore Exchange, Ltd. | | 6,600 | 45,560 |
| Singapore Technologies Engineering, Ltd. | | 13,918 | 38,841 |
| Singapore Telecommunications, Ltd. | | 61,191 | 105,339 |
| United Overseas Bank, Ltd. | | 9,514 | 190,011 |
| UOL Group, Ltd. | | 3,470 | 18,265 |
| Venture Corp., Ltd. | | 2,000 | 27,178 |
| Wilmar International, Ltd. | | 15,000 | 46,164 |
| | | | $ 1,635,274 |
| Spain — 2.3% | |
| ACS Actividades de Construccion y Servicios S.A.(2) | | 1,835 | $ 48,923 |
| Aena SME S.A.(1)(2)(3) | | 620 | 97,640 |
| Amadeus IT Group S.A.(1) | | 3,541 | 239,599 |
| Banco Bilbao Vizcaya Argentaria S.A. | | 51,258 | 304,010 |
| Security | Shares | Value |
| Spain (continued) | |
| Banco Santander S.A. | | 134,167 | $ 445,579 |
| CaixaBank S.A. | | 35,134 | 95,973 |
| Cellnex Telecom S.A.(1)(3) | | 3,985 | 230,841 |
| EDP Renovaveis S.A. | | 2,336 | 58,090 |
| Enagas S.A.(2) | | 1,961 | 45,557 |
| Endesa S.A. | | 2,524 | 58,106 |
| Ferrovial S.A. | | 3,993 | 124,876 |
| Grifols S.A.(2) | | 2,499 | 48,087 |
| Iberdrola S.A. | | 44,814 | 530,597 |
| Industria de Diseno Textil S.A. | | 8,586 | 276,899 |
| Naturgy Energy Group S.A. | | 1,500 | 48,788 |
| Red Electrica Corp. S.A. | | 3,451 | 74,626 |
| Repsol S.A. | | 11,427 | 135,331 |
| Siemens Gamesa Renewable Energy S.A.(1)(2) | | 1,846 | 43,839 |
| Telefonica S.A.(2) | | 43,742 | 189,676 |
| | | | $ 3,097,037 |
| Sweden — 3.7% | |
| Alfa Laval AB | | 2,529 | $ 101,589 |
| Assa Abloy AB, Class B | | 7,674 | 233,911 |
| Atlas Copco AB, Class A | | 5,317 | 367,409 |
| Atlas Copco AB, Class B | | 3,161 | 185,678 |
| Boliden AB | | 2,227 | 85,873 |
| Electrolux AB, Class B | | 1,958 | 47,422 |
| Embracer Group AB(1)(2) | | 4,144 | 43,964 |
| Epiroc AB, Class A | | 5,226 | 132,144 |
| Epiroc AB, Class B | | 2,821 | 59,656 |
| EQT AB | | 2,347 | 127,231 |
| Essity AB, Class B | | 4,621 | 150,759 |
| Evolution AB(3) | | 1,329 | 187,842 |
| Fastighets AB Balder, Class B(1) | | 794 | 57,139 |
| Getinge AB, Class B | | 1,789 | 77,969 |
| H & M Hennes & Mauritz AB, Class B | | 5,966 | 117,066 |
| Hexagon AB, Class B | | 15,400 | 243,944 |
| Husqvarna AB, Class B | | 3,160 | 50,525 |
| Industrivarden AB, Class A | | 1,271 | 40,385 |
| Industrivarden AB, Class C | | 1,413 | 44,270 |
| Investment AB Latour, Class B(2) | | 1,245 | 50,582 |
| Investor AB, Class A | | 3,685 | 96,944 |
| Investor AB, Class B | | 14,546 | 365,007 |
| Kinnevik AB, Class B(1) | | 1,801 | 64,032 |
| L E Lundbergforetagen AB, Class B | | 593 | 33,223 |
| Lifco AB, Class B | | 1,823 | 54,451 |
| Lundin Energy AB | | 1,471 | 52,636 |
| Nibe Industrier AB, Class B | | 11,258 | 170,108 |
| Sagax AB, Class B | | 1,260 | 42,383 |
| Sandvik AB | | 8,759 | 244,144 |
14
See Notes to Financial Statements.
Calvert
VP EAFE International Index Portfolio
December 31, 2021
Schedule of Investments — continued
| Security | Shares | Value |
| Sweden (continued) | |
| Securitas AB, Class B | | 2,477 | $ 34,075 |
| Sinch AB(1)(3) | | 3,670 | 46,309 |
| Skandinaviska Enskilda Banken AB, Class A(2) | | 13,097 | 181,833 |
| Skanska AB, Class B | | 2,734 | 70,650 |
| SKF AB, Class B | | 3,034 | 71,753 |
| Svenska Cellulosa AB SCA, Class B | | 4,539 | 80,541 |
| Svenska Handelsbanken AB, Class A | | 11,718 | 126,647 |
| Swedbank AB, Class A | | 7,146 | 143,605 |
| Swedish Match AB | | 12,100 | 96,058 |
| Tele2 AB, Class B | | 3,517 | 50,172 |
| Telefonaktiebolaget LM Ericsson, Class B | | 22,511 | 247,689 |
| Telia Co. AB | | 21,130 | 82,639 |
| Volvo AB, Class A | | 1,646 | 38,611 |
| Volvo AB, Class B | | 10,891 | 251,871 |
| | | | $ 5,050,739 |
| Switzerland — 10.8% | |
| ABB, Ltd. | | 12,847 | $ 489,635 |
| Adecco Group AG | | 1,241 | 63,238 |
| Alcon, Inc. | | 3,839 | 338,620 |
| Bachem Holding AG, Class B | | 48 | 37,586 |
| Baloise Holding AG | | 374 | 61,042 |
| Barry Callebaut AG | | 29 | 70,402 |
| Chocoladefabriken Lindt & Sprungli AG | | 1 | 134,055 |
| Chocoladefabriken Lindt & Sprungli AG PC | | 7 | 96,939 |
| Cie Financiere Richemont S.A. | | 4,048 | 604,912 |
| Clariant AG(1)(2) | | 1,727 | 35,875 |
| Coca-Cola HBC AG | | 1,588 | 54,985 |
| Credit Suisse Group AG | | 21,157 | 205,130 |
| EMS-Chemie Holding AG | | 50 | 55,879 |
| Geberit AG | | 277 | 225,792 |
| Givaudan S.A. | | 72 | 377,755 |
| Glencore PLC | | 77,086 | 392,775 |
| Holcim Ltd. | | 4,011 | 203,996 |
| Julius Baer Group, Ltd. | | 1,776 | 118,765 |
| Kuehne & Nagel International AG | | 428 | 137,840 |
| Logitech International S.A. | | 1,318 | 110,564 |
| Lonza Group AG | | 581 | 483,734 |
| Nestle S.A. | | 21,923 | 3,060,830 |
| Novartis AG | | 17,137 | 1,505,862 |
| Partners Group Holding AG | | 177 | 292,193 |
| Roche Holding AG | | 248 | 111,000 |
| Roche Holding AG PC | | 5,470 | 2,269,290 |
| Schindler Holding AG | | 160 | 42,758 |
| Schindler Holding AG PC | | 334 | 89,656 |
| SGS S.A. | | 46 | 153,350 |
| Sika AG(2) | | 1,112 | 462,166 |
| Security | Shares | Value |
| Switzerland (continued) | |
| Sonova Holding AG | | 442 | $ 172,732 |
| Straumann Holding AG | | 83 | 175,511 |
| Swatch Group AG (The) | | 228 | 69,434 |
| Swatch Group AG (The), Bearer Shares | | 325 | 19,002 |
| Swiss Life Holding AG | | 238 | 145,412 |
| Swiss Prime Site AG | | 549 | 53,894 |
| Swiss Re AG | | 2,386 | 235,530 |
| Swisscom AG | | 199 | 112,261 |
| Temenos AG | | 527 | 72,642 |
| UBS Group AG | | 27,511 | 493,803 |
| VAT Group AG(3) | | 211 | 104,555 |
| Vifor Pharma AG | | 424 | 75,323 |
| Zurich Insurance Group AG | | 1,171 | 512,991 |
| | | | $ 14,529,714 |
| United Kingdom — 13.0% | |
| 3i Group PLC | | 7,801 | $ 152,925 |
| Abrdn PLC | | 16,252 | 52,949 |
| Admiral Group PLC | | 1,608 | 68,829 |
| Anglo American PLC | | 10,080 | 414,613 |
| Antofagasta PLC | | 3,041 | 55,307 |
| Ashtead Group PLC | | 3,470 | 279,732 |
| Associated British Foods PLC | | 2,895 | 79,248 |
| AstraZeneca PLC | | 12,044 | 1,406,370 |
| Auto Trader Group PLC(3) | | 7,242 | 72,528 |
| AVEVA Group PLC | | 905 | 41,759 |
| Aviva PLC | | 31,430 | 175,196 |
| BAE Systems PLC | | 24,901 | 185,691 |
| Barclays PLC | | 130,266 | 331,821 |
| Barratt Developments PLC | | 8,311 | 84,394 |
| Berkeley Group Holdings PLC | | 842 | 54,524 |
| BHP Group PLC | | 16,704 | 497,023 |
| BP PLC | | 156,726 | 702,230 |
| British American Tobacco PLC | | 16,876 | 626,635 |
| British Land Co. PLC (The) | | 7,010 | 50,621 |
| BT Group PLC | | 67,314 | 154,856 |
| Bunzl PLC | | 2,545 | 99,421 |
| Burberry Group PLC | | 3,124 | 77,107 |
| Coca-Cola Europacific Partners PLC | | 1,647 | 92,117 |
| Compass Group PLC(1) | | 13,713 | 308,730 |
| Croda International PLC | | 1,134 | 155,326 |
| Diageo PLC | | 18,119 | 990,675 |
| Entain PLC(1) | | 4,677 | 106,901 |
| Evraz PLC | | 3,425 | 28,002 |
| Ferguson PLC | | 1,726 | 306,584 |
| GlaxoSmithKline PLC | | 39,034 | 849,877 |
| Halma PLC | | 3,070 | 133,112 |
15
See Notes to Financial Statements.
Calvert
VP EAFE International Index Portfolio
December 31, 2021
Schedule of Investments — continued
| Security | Shares | Value |
| United Kingdom (continued) | |
| Hargreaves Lansdown PLC | | 2,659 | $ 48,862 |
| Hikma Pharmaceuticals PLC | | 1,223 | 36,728 |
| HSBC Holdings PLC | | 158,542 | 957,476 |
| Imperial Brands PLC | | 7,551 | 165,479 |
| Informa PLC(1) | | 12,081 | 84,586 |
| InterContinental Hotels Group PLC(1) | | 1,394 | 90,121 |
| Intertek Group PLC | | 1,299 | 99,097 |
| J Sainsbury PLC | | 11,679 | 43,656 |
| JD Sports Fashion PLC | | 18,070 | 53,279 |
| Johnson Matthey PLC | | 1,407 | 39,098 |
| Kingfisher PLC | | 15,641 | 71,945 |
| Land Securities Group PLC | | 5,555 | 58,627 |
| Legal & General Group PLC | | 45,856 | 185,180 |
| Lloyds Banking Group PLC | | 548,655 | 356,292 |
| London Stock Exchange Group PLC | | 2,560 | 240,819 |
| M&G PLC | | 18,709 | 50,614 |
| Melrose Industries PLC | | 33,152 | 72,098 |
| Mondi PLC | | 3,917 | 97,157 |
| National Grid PLC | | 27,897 | 402,255 |
| Natwest Group PLC | | 44,868 | 137,400 |
| Next PLC | | 1,079 | 119,341 |
| Ocado Group PLC(1) | | 3,893 | 88,571 |
| Pearson PLC | | 6,159 | 51,093 |
| Persimmon PLC | | 2,595 | 100,580 |
| Phoenix Group Holdings PLC | | 5,705 | 50,501 |
| Prudential PLC | | 20,207 | 349,436 |
| Reckitt Benckiser Group PLC | | 5,509 | 474,235 |
| RELX PLC | | 15,048 | 491,271 |
| Rentokil Initial PLC | | 13,829 | 109,467 |
| Rio Tinto PLC | | 8,715 | 574,721 |
| Rolls-Royce Holdings PLC(1) | | 67,400 | 112,500 |
| Sage Group PLC (The) | | 8,820 | 102,056 |
| Schroders PLC | | 934 | 45,082 |
| Segro PLC | | 9,491 | 184,711 |
| Severn Trent PLC | | 1,999 | 79,824 |
| Smith & Nephew PLC | | 6,612 | 115,395 |
| Smiths Group PLC | | 3,286 | 70,338 |
| Spirax-Sarco Engineering PLC | | 587 | 127,749 |
| SSE PLC | | 7,941 | 177,522 |
| St. James's Place PLC | | 4,377 | 100,024 |
| Standard Chartered PLC | | 20,555 | 124,990 |
| Taylor Wimpey PLC | | 27,593 | 65,785 |
| Tesco PLC | | 59,463 | 234,110 |
| Unilever PLC | | 20,298 | 1,088,916 |
| United Utilities Group PLC | | 5,449 | 80,402 |
| Vodafone Group PLC | | 216,739 | 326,460 |
| Whitbread PLC(1) | | 1,488 | 60,528 |
| Security | Shares | Value |
| United Kingdom (continued) | |
| WPP PLC | | 9,194 | $ 140,004 |
| | | | $ 17,571,484 |
Total Common Stocks
(identified cost $81,805,373) | | | $134,862,294 |
| Short-Term Investments — 1.7% |
| Affiliated Fund — 0.3% |
| Description | Units | Value |
| Calvert Cash Reserves Fund, LLC, 0.06%(6) | | 340,788 | $ 340,788 |
Total Affiliated Fund
(identified cost $340,788) | | | $ 340,788 |
| Securities Lending Collateral — 1.4% |
| Security | Shares | Value |
| State Street Navigator Securities Lending Government Money Market Portfolio, 0.03%(7) | | 1,896,948 | $ 1,896,948 |
Total Securities Lending Collateral
(identified cost $1,896,948) | | | $ 1,896,948 |
Total Short-Term Investments
(identified cost $2,237,736) | | | $ 2,237,736 |
Total Investments — 101.5%
(identified cost $84,043,109) | | $ 137,100,030 |
| Other Assets, Less Liabilities — (1.5)% | | $ (2,016,014) |
| Net Assets — 100.0% | | $ 135,084,016 |
| The percentage shown for each investment category in the Schedule of Investments is based on net assets. |
| (1) | Non-income producing security. |
| (2) | All or a portion of this security was on loan at December 31, 2021. The aggregate market value of securities on loan at December 31, 2021 was $3,768,378. |
| (3) | Security exempt from registration under Rule 144A of the Securities Act of 1933, as amended. These securities may be sold in certain transactions in reliance on an exemption from registration (normally to qualified institutional buyers). At December 31, 2021, the aggregate value of these securities is $2,587,600 or 1.9% of the Fund's net assets. |
| (4) | Represents an investment in an issuer that may be deemed to be an affiliate effective March 1, 2021 (see Note 8). |
| (5) | Amount is less than 0.05%. |
16
See Notes to Financial Statements.
Calvert
VP EAFE International Index Portfolio
December 31, 2021
Schedule of Investments — continued
| (6) | Affiliated investment company, available to Calvert portfolios and funds, which invests in high quality, U.S. dollar denominated money market instruments. The rate shown is the annualized seven-day yield as of December 31, 2021. |
| (7) | Represents investment of cash collateral received in connection with securities lending. |
At December 31, 2021, the concentration of the Fund’s investments in the various sectors, determined as a percentage of net assets, was as follows:
| Economic Sectors | % of Net Assets |
| Financials | 16.9% |
| Industrials | 16.2 |
| Health Care | 12.7 |
| Consumer Discretionary | 12.5 |
| Consumer Staples | 10.3 |
| Information Technology | 9.7 |
| Materials | 7.5 |
| Communication Services | 4.5 |
| Utilities | 3.4 |
| Energy | 3.4 |
| Real Estate | 2.7 |
| Total | 99.8% |
| Abbreviations: |
| ADR | – American Depositary Receipt |
| CDI | – CHESS Depositary Interest |
| PC | – Participation Certificate |
| PFC Shares | – Preference Shares |
17
See Notes to Financial Statements.
Calvert
VP EAFE International Index Portfolio
December 31, 2021
Statement of Assets and Liabilities
| | December 31, 2021 |
| Assets | |
Investments in securities of unaffiliated issuers, at value (identified cost $83,252,118) - including
$3,768,378 of securities on loan | $ 136,241,812 |
| Investments in securities of affiliated issuers, at value (identified cost $790,991) | 858,218 |
| Cash denominated in foreign currency, at value (cost $193,385) | 197,286 |
| Receivable for capital shares sold | 41,905 |
| Dividends receivable | 112,768 |
| Dividends receivable - affiliated | 13 |
| Securities lending income receivable | 832 |
| Tax reclaims receivable | 297,107 |
| Receivable from affiliate | 23,409 |
| Directors' deferred compensation plan | 30,228 |
| Total assets | $137,803,578 |
| Liabilities | |
| Payable for capital shares redeemed | $ 640,749 |
| Deposits for securities loaned | 1,896,948 |
| Payable to affiliates: | |
| Investment advisory fee | 33,820 |
| Administrative fee | 13,528 |
| Distribution and service fees | 4,958 |
| Sub-transfer agency fee | 154 |
| Directors' deferred compensation plan | 30,228 |
| Accrued expenses | 99,177 |
| Total liabilities | $ 2,719,562 |
| Net Assets | $135,084,016 |
| Sources of Net Assets | |
| Paid-in capital | $ 85,598,991 |
| Distributable earnings | 49,485,025 |
| Net Assets | $135,084,016 |
| Class I Shares | |
| Net Assets | $ 105,720,869 |
| Shares Outstanding | 1,035,252 |
Net Asset Value, Offering Price and Redemption Price Per Share
(net assets ÷ shares of beneficial interest outstanding) | $ 102.12 |
| Class F Shares | |
| Net Assets | $ 29,363,147 |
| Shares Outstanding | 288,634 |
Net Asset Value, Offering Price and Redemption Price Per Share
(net assets ÷ shares of beneficial interest outstanding) | $ 101.73 |
18
See Notes to Financial Statements.
Calvert
VP EAFE International Index Portfolio
December 31, 2021
| | Year Ended |
| | December 31, 2021 |
| Investment Income | |
| Dividend income (net of foreign taxes withheld of $342,345) | $ 3,783,337 |
| Dividend income - affiliated issuers (net of foreign taxes withheld of $2,226) | 20,212 |
| Securities lending income, net | 28,800 |
| Other income | 120,103 |
| Total investment income | $ 3,952,452 |
| Expenses | |
| Investment advisory fee | $ 396,172 |
| Administrative fee | 158,469 |
| Distribution and service fees: | |
| Class F | 51,907 |
| Directors' fees and expenses | 5,184 |
| Custodian fees | 38,345 |
| Transfer agency fees and expenses | 99,744 |
| Accounting fees | 47,709 |
| Professional fees | 31,818 |
| Reports to shareholders | 4 |
| Licensing fees | 62,936 |
| Miscellaneous | 9,751 |
| Total expenses | $ 902,039 |
| Waiver and/or reimbursement of expenses by affiliate | $ (214,774) |
| Net expenses | $ 687,265 |
| Net investment income | $ 3,265,187 |
| Realized and Unrealized Gain (Loss) | |
| Net realized gain (loss): | |
| Investment securities | $ 172,788 |
| Investment securities - affiliated issuers | (32) |
| Foreign currency transactions | (32,952) |
| Net realized gain | $ 139,804 |
| Change in unrealized appreciation (depreciation): | |
| Investment securities | $ 9,898,076 |
| Investment securities - affiliated issuers | 17,359 |
| Foreign currency | (10,829) |
| Net change in unrealized appreciation (depreciation) | $ 9,904,606 |
| Net realized and unrealized gain | $10,044,410 |
| Net increase in net assets from operations | $13,309,597 |
19
See Notes to Financial Statements.
Calvert
VP EAFE International Index Portfolio
December 31, 2021
Statements of Changes in Net Assets
| | Year Ended December 31, |
| | 2021 | 2020 |
| Increase (Decrease) in Net Assets | | |
| From operations: | | |
| Net investment income | $ 3,265,187 | $ 2,282,805 |
| Net realized gain (loss) | 139,804 | (858,505) |
| Net change in unrealized appreciation (depreciation) | 9,904,606 | 6,711,172 |
| Net increase in net assets from operations | $ 13,309,597 | $ 8,135,472 |
| Distributions to shareholders: | | |
| Class I | $ (1,852,955) | $ (3,275,864) |
| Class F | (493,065) | (508,619) |
| Total distributions to shareholders | $ (2,346,020) | $ (3,784,483) |
| Capital share transactions: | | |
| Class I | $ (8,536,026) | $ (13,942,734) |
| Class F | 8,540,310 | 4,867,446 |
| Net increase (decrease) in net assets from capital share transactions | $ 4,284 | $ (9,075,288) |
| Net increase (decrease) in net assets | $ 10,967,861 | $ (4,724,299) |
| Net Assets | | |
| At beginning of year | $ 124,116,155 | $ 128,840,454 |
| At end of year | $135,084,016 | $124,116,155 |
20
See Notes to Financial Statements.
Calvert
VP EAFE International Index Portfolio
December 31, 2021
| | Class I |
| | Year Ended December 31, |
| | 2021 | 2020 | 2019 | 2018 | 2017 |
| Net asset value — Beginning of year | $ 93.77 | $ 90.02 | $ 76.31 | $ 91.21 | $ 74.93 |
| Income (Loss) From Operations | | | | | |
| Net investment income(1) | $ 2.53 | $ 1.69 | $ 2.43 | $ 2.36 | $ 2.11 |
| Net realized and unrealized gain (loss) | 7.63 | 4.89 | 13.55 | (14.36) | 16.39 |
| Total income (loss) from operations | $ 10.16 | $ 6.58 | $ 15.98 | $ (12.00) | $ 18.50 |
| Less Distributions | | | | | |
| From net investment income | $ (1.81) | $ (2.83) | $ (2.27) | $ (2.90) | $ (2.22) |
| Total distributions | $ (1.81) | $ (2.83) | $ (2.27) | $ (2.90) | $ (2.22) |
| Net asset value — End of year | $ 102.12 | $ 93.77 | $ 90.02 | $ 76.31 | $ 91.21 |
| Total Return(2) | 10.88% | 7.78% | 21.26% | (13.58)% | 24.76% |
| Ratios/Supplemental Data | | | | | |
| Net assets, end of year (000’s omitted) | $105,721 | $105,165 | $115,803 | $103,168 | $141,082 |
| Ratios (as a percentage of average daily net assets):(3) | | | | | |
| Total expenses | 0.64% | 0.74% | 0.68% | 0.69% (4) | 0.68% |
| Net expenses | 0.48% | 0.48% | 0.48% | 0.49% (4) | 0.48% |
| Net investment income | 2.51% | 2.05% | 2.87% | 2.67% | 2.49% |
| Portfolio Turnover | 8% | 9% | 7% | 6% | 3% |
| (1) | Computed using average shares outstanding. |
| (2) | Returns are historical and are calculated by determining the percentage change in net asset value with all distributions reinvested and do not reflect fees and expenses imposed by variable annuity contracts or variable life insurance policies. If included, total return would be lower. |
| (3) | Total expenses do not reflect amounts reimbursed and/or waived by the adviser and certain of its affiliates, if applicable. Net expenses are net of all reductions and represent the net expenses paid by the Fund. |
| (4) | Includes interest expense of 0.01%. |
21
See Notes to Financial Statements.
Calvert
VP EAFE International Index Portfolio
December 31, 2021
Financial Highlights — continued
| | Class F |
| | Year Ended December 31, |
| | 2021 | 2020 | 2019 | 2018 | 2017 |
| Net asset value — Beginning of year | $ 93.60 | $ 90.04 | $ 76.49 | $ 91.65 | $ 75.47 |
| Income (Loss) From Operations | | | | | |
| Net investment income(1) | $ 2.32 | $ 1.49 | $ 2.14 | $ 2.09 | $ 1.87 |
| Net realized and unrealized gain (loss) | 7.62 | 4.90 | 13.68 | (14.35) | 16.53 |
| Total income (loss) from operations | $ 9.94 | $ 6.39 | $ 15.82 | $(12.26) | $18.40 |
| Less Distributions | | | | | |
| From net investment income | $ (1.81) | $ (2.83) | $ (2.27) | $ (2.90) | $ (2.22) |
| Total distributions | $ (1.81) | $ (2.83) | $ (2.27) | $ (2.90) | $ (2.22) |
| Net asset value — End of year | $101.73 | $ 93.60 | $ 90.04 | $ 76.49 | $91.65 |
| Total Return(2) | 10.66% | 7.56% | 21.00% | (13.80)% | 24.44% |
| Ratios/Supplemental Data | | | | | |
| Net assets, end of year (000’s omitted) | $ 29,363 | $18,951 | $13,038 | $ 7,645 | $ 7,226 |
| Ratios (as a percentage of average daily net assets):(3) | | | | | |
| Total expenses | 0.84% | 0.94% | 0.88% | 0.89% (4) | 0.91% |
| Net expenses | 0.68% | 0.68% | 0.69% | 0.74% (4) | 0.73% |
| Net investment income | 2.31% | 1.80% | 2.52% | 2.37% | 2.18% |
| Portfolio Turnover | 8% | 9% | 7% | 6% | 3% |
| (1) | Computed using average shares outstanding. |
| (2) | Returns are historical and are calculated by determining the percentage change in net asset value with all distributions reinvested and do not reflect fees and expenses imposed by variable annuity contracts or variable life insurance policies. If included, total return would be lower. |
| (3) | Total expenses do not reflect amounts reimbursed and/or waived by the adviser and certain of its affiliates, if applicable. Net expenses are net of all reductions and represent the net expenses paid by the Fund. |
| (4) | Includes interest expense of 0.01%. |
22
See Notes to Financial Statements.
Calvert
VP EAFE International Index Portfolio
December 31, 2021
Notes to Financial Statements
1 Significant Accounting Policies
Calvert VP EAFE International Index Portfolio (the Fund) is a diversified series of Calvert Variable Products, Inc. (the Corporation). The Corporation is a Maryland corporation registered under the Investment Company Act of 1940, as amended (the 1940 Act), as an open-end management investment company. The investment objective of the Fund is to seek investment results that correspond to the total return performance of common stocks as represented by the MSCI EAFE Index.
Shares of the Fund are sold without sales charge to insurance companies for allocation to certain of their variable separate accounts and to qualified pension and retirement plans and other eligible investors. The Fund offers Class I and Class F shares. Among other things, each class has different: (a) dividend rates due to differences in Distribution Plan expenses and other class-specific expenses; (b) exchange privileges; and (c) class-specific voting rights.
The Fund applies the accounting and reporting guidance in the Financial Accounting Standards Board (FASB) Accounting Standards Codification Topic 946, Financial Services – Investment Companies (ASC 946). Subsequent events, if any, through the date that the financial statements were issued have been evaluated in the preparation of the financial statements.
A Investment Valuation— Net asset value per share is determined every business day as of the close of the regular session of the New York Stock Exchange (generally 4:00 p.m. Eastern time). The Fund uses independent pricing services approved by the Board of Directors (the Board) to value its investments wherever possible. Investments for which market quotations are not available or deemed not reliable are fair valued in good faith under the direction of the Board.
U.S. generally accepted accounting principles (U.S. GAAP) establishes a disclosure hierarchy that categorizes the inputs to valuation techniques used to value assets and liabilities at measurement date. These inputs are summarized in the three broad levels listed below:
Level 1 - quoted prices in active markets for identical securities
Level 2 - other significant observable inputs (including quoted prices for similar securities, interest rates, prepayment speeds, credit risk, etc.)
Level 3 - significant unobservable inputs (including the Fund’s own assumptions in determining the fair value of investments)
The inputs or methodologies used for valuing securities are not necessarily an indication of the risk associated with investing in those securities.
Valuation techniques used to value the Fund’s investments by major category are as follows:
Equity Securities. Equity securities (including warrants and rights) listed on a U.S. securities exchange generally are valued at the last sale or closing price as reported by an independent pricing service on the primary market or exchange on which they are traded and are categorized as Level 1 in the hierarchy. Equity securities listed on the NASDAQ National Market System are valued at the NASDAQ official closing price and are categorized as Level 1 in the hierarchy. Unlisted or listed securities for which closing sales prices or closing quotations are not available are valued at the mean between the latest available bid and ask prices and are categorized as Level 2 in the hierarchy. The daily valuation of exchange-traded foreign securities generally is determined as of the close of trading on the principal exchange on which such securities trade. Events occurring after the close of trading on foreign exchanges may result in adjustments to the valuation of foreign securities to more accurately reflect their fair value as of the close of regular trading on the New York Stock Exchange. When valuing foreign equity securities that meet certain criteria, the Fund's Board has approved the use of a fair value service that values such securities to reflect market trading that occurs after the close of the applicable foreign markets of comparable securities or other instruments that have a strong correlation to the fair-valued securities. Such securities are categorized as Level 2 in the hierarchy.
Affiliated Fund. The Fund may invest in Calvert Cash Reserves Fund, LLC (Cash Reserves Fund), an affiliated investment company managed by Calvert Research and Management (CRM). While Cash Reserves Fund is not a registered money market mutual fund, it conducts all of its investment activities in accordance with the requirements of Rule 2a-7 under the 1940 Act. Investments in Cash Reserves Fund are valued at the closing net asset value per unit on the valuation day and are categorized as Level 2 in the hierarchy. Cash Reserves Fund generally values its investment securities based on available market quotations provided by a third party pricing service.
Other Securities. Investments in registered investment companies (including money market funds) that do not trade on an exchange are valued at the net asset value per share on the valuation day and are categorized as Level 1 in the hierarchy.
Fair Valuation. If a market value cannot be determined for a security using the methodologies described above, or if, in the good faith opinion of the Fund's adviser, the market value does not constitute a readily available market quotation, or if a significant event has occurred that would materially affect the value of the security, the security will be fair valued as determined in good faith by or at the direction of the Board in a manner that most fairly reflects the security’s “fair value”, which is the amount that the Fund might reasonably expect to receive for the security upon its current sale in the ordinary course. Each such determination is based on a consideration of relevant factors, which are likely to vary from one pricing context to another. These factors may include, but are not limited to, the type of security, the existence of any contractual restrictions on the security’s disposition, the price and extent of public
Calvert
VP EAFE International Index Portfolio
December 31, 2021
Notes to Financial Statements — continued
trading in similar securities of the issuer or of comparable companies or entities, quotations or relevant information obtained from broker/dealers or other market participants, information obtained from the issuer, analysts, and/or the appropriate stock exchange (for exchange-traded securities), an analysis of the company’s or entity’s financial statements, and an evaluation of the forces that influence the issuer and the market(s) in which the security is purchased and sold.
The values assigned to fair value investments are based on available information and do not necessarily represent amounts that might ultimately be realized. Further, due to the inherent uncertainty of valuations of such investments, the fair values may differ significantly from the values that would have been used had an active market existed, and the differences could be material.
The following table summarizes the market value of the Fund's holdings as of December 31, 2021, based on the inputs used to value them:
| Asset Description | Level 1 | Level 2 | Level 3 | Total |
| Common Stocks: | | | | |
| Australia | $ — | $ 9,005,219 | $ — | $ 9,005,219 |
| Austria | — | 313,799 | — | 313,799 |
| Belgium | — | 1,097,102 | — | 1,097,102 |
| Denmark | — | 3,645,986 | — | 3,645,986 |
| Finland | — | 1,684,719 | — | 1,684,719 |
| France | — | 14,834,560 | — | 14,834,560 |
| Germany | 121,830 | 11,688,689 | — | 11,810,519 |
| Hong Kong | 32,555 | 3,687,239 | — | 3,719,794 |
| Ireland | — | 1,479,179 | — | 1,479,179 |
| Israel | 402,198 | 597,950 | — | 1,000,148 |
| Italy | — | 2,809,701 | — | 2,809,701 |
| Japan | — | 30,592,699 | — | 30,592,699 |
| Netherlands | — | 9,493,730 | — | 9,493,730 |
| New Zealand | — | 369,450 | — | 369,450 |
| Norway | — | 894,945 | — | 894,945 |
| Poland | — | 20,223 | — | 20,223 |
| Portugal | — | 206,273 | — | 206,273 |
| Singapore | 241,159 | 1,394,115 | — | 1,635,274 |
| Spain | — | 3,097,037 | — | 3,097,037 |
| Sweden | — | 5,050,739 | — | 5,050,739 |
| Switzerland | — | 14,529,714 | — | 14,529,714 |
| United Kingdom | 92,117 | 17,479,367 | — | 17,571,484 |
| Total Common Stocks | $ 889,859 | $133,972,435 (1) | $ — | $134,862,294 |
| Short-Term Investments: | | | | |
| Affiliated Fund | $ — | $ 340,788 | $ — | $ 340,788 |
| Securities Lending Collateral | 1,896,948 | — | — | 1,896,948 |
| Total Investments | $2,786,807 | $134,313,223 | $ — | $137,100,030 |
| (1) | Includes foreign equity securities whose values were adjusted to reflect market trading of comparable securities or other correlated instruments that occurred after the close of trading in their applicable foreign markets. |
Level 3 investments at the beginning and/or end of the period were valued at $0 and accordingly, a reconciliation of Level 3 assets for the year ended December 31, 2021 is not presented.
B Investment Transactions and Income— Investment transactions for financial statement purposes are accounted for on trade date. Realized gains and losses are recorded on an identified cost basis and may include proceeds from litigation. Dividend income is recorded on the ex-dividend date for dividends received in cash and/or securities or, in the case of dividends on certain foreign securities, as soon as the Fund is informed of the ex-dividend date. Non-cash dividends are recorded at the fair value of the securities received. Withholding taxes on foreign dividends, if any, have been provided for in accordance
Calvert
VP EAFE International Index Portfolio
December 31, 2021
Notes to Financial Statements — continued
with the Fund's understanding of the applicable country’s tax rules and rates. In consideration of recent decisions rendered by European courts, the Fund has filed additional tax reclaims for previously withheld taxes on dividends earned in certain European Union countries. These filings are subject to various administrative and judicial proceedings within these countries. During the year ended December 31, 2021, the Fund received approximately $120,000 from Sweden for previously withheld foreign taxes and interest thereon. Such amount is included in other income on the Statement of Operations. No other amounts for additional tax reclaims are reflected in the financial statements due to the uncertainty as to the ultimate resolution of proceedings, the likelihood of receipt of these reclaims, and the potential timing of payment. Distributions received that represent a return of capital are recorded as a reduction of cost of investments. Distributions received that represent a capital gain are recorded as a realized gain.
C Share Class Accounting— Realized and unrealized gains and losses and net investment income and losses, other than class-specific expenses, are allocated daily to each class of shares based upon the relative net assets of each class to the total net assets of the Fund. Expenses arising in connection with a specific class are charged directly to that class.
D Foreign Currency Transactions— The Fund’s accounting records are maintained in U.S. dollars. For valuation of assets and liabilities on each date of net asset value determination, foreign denominations are converted into U.S. dollars using the current exchange rate. Security transactions, income and expenses are translated at the prevailing rate of exchange on the date of the event. Recognized gains or losses on investment transactions attributable to changes in foreign currency exchange rates are recorded for financial statement purposes as net realized gains and losses on investments. That portion of unrealized gains and losses on investments that results from fluctuations in foreign currency exchange rates is not separately disclosed.
E Distributions to Shareholders— Distributions to shareholders are recorded by the Fund on ex-dividend date. The Fund distributes any net investment income and net realized capital gains at least annually. Both types of distributions are made in shares of the Fund unless an election is made on behalf of a separate account to receive some or all of the distributions in cash. Distributions are declared separately for each class of shares. Distributions are determined in accordance with income tax regulations, which may differ from U.S. GAAP; accordingly, periodic reclassifications are made within the Fund's capital accounts to reflect income and gains available for distribution under income tax regulations.
F Estimates— The preparation of financial statements in conformity with U.S. GAAP requires management to make estimates and assumptions that affect the reported amounts of assets and liabilities and disclosure of contingent assets and liabilities at the date of the financial statements and the reported amounts of increases and decreases in net assets from operations during the reporting period. Actual results could differ from those estimates.
G Indemnifications— The Corporation’s By-Laws provide for indemnification for Directors or officers of the Corporation and certain other parties, to the fullest extent permitted by Maryland law and the 1940 Act, provided certain conditions are met. Additionally, in the normal course of business, the Fund enters into agreements with service providers that may contain indemnification clauses. The Fund’s maximum exposure under these arrangements is unknown as this would involve future claims that may be made against the Fund that have not yet occurred.
H Federal Income Taxes— No provision for federal income or excise tax is required since the Fund intends to continue to qualify as a regulated investment company under the Internal Revenue Code and to distribute substantially all of its taxable earnings.
Management has analyzed the Fund's tax positions taken for all open federal income tax years and has concluded that no provision for federal income tax is required in the Fund's financial statements. A Fund's federal tax return is subject to examination by the Internal Revenue Service for a period of three years from the date of filing.
2 Related Party Transactions
The investment advisory fee is earned by CRM as compensation for investment advisory services rendered to the Fund. On March 1, 2021, Morgan Stanley acquired Eaton Vance Corp. (the “Transaction”) and CRM became an indirect, wholly-owned subsidiary of Morgan Stanley. In connection with the Transaction, the Fund entered into a new investment advisory agreement (the “New Agreement”) with CRM, which took effect on March 1, 2021. Pursuant to the New Agreement (and the Fund’s investment advisory agreement with CRM in effect prior to March 1, 2021), the fee is computed at the annual rate of 0.30% of the Fund’s average daily net assets and is payable monthly. For the year ended December 31, 2021, the investment advisory fee amounted to $396,172. The Fund may invest its cash in Cash Reserves Fund. CRM does not currently receive a fee for advisory services provided to Cash Reserves Fund.
CRM has agreed to reimburse the Fund's operating expenses to the extent that total annual operating expenses (relating to ordinary operating expenses only and excluding expenses such as brokerage commissions, acquired fund fees and expenses of unaffiliated funds, borrowing costs, taxes or litigation expenses) exceed 0.48% for Class I and 0.68% for Class F of such class's average daily net assets. The expense reimbursement agreement with CRM may be changed or terminated after April 30, 2022. For the year ended December 31, 2021, CRM waived or reimbursed expenses of $214,774.
The administrative fee is earned by CRM as compensation for administrative services rendered to the Fund. The fee is computed at an annual rate of 0.12% of the Fund's average daily net assets attributable to Class I and Class F and is payable monthly. For the year ended December 31, 2021, CRM was paid administrative fees of $158,469.
Calvert
VP EAFE International Index Portfolio
December 31, 2021
Notes to Financial Statements — continued
The Fund has in effect a distribution plan for Class F shares (Class F Plan) pursuant to Rule 12b-1 under the 1940 Act. Pursuant to the Class F Plan, the Fund pays Eaton Vance Distributors, Inc. (EVD), an affiliate of CRM and the Fund’s principal underwriter, a distribution and service fee of 0.20% per annum of its average daily net assets attributable to Class F shares for distribution services and facilities provided to the Fund, as well as for personal and/or account maintenance services provided to the class shareholders. Distribution and service fees paid or accrued for the year ended December 31, 2021 amounted to $51,907 for Class F shares.
Eaton Vance Management (EVM), an affiliate of CRM, provides sub-transfer agency and related services to the Fund pursuant to a Sub-Transfer Agency Support Services Agreement. For the year ended December 31, 2021, sub-transfer agency fees and expenses incurred to EVM amounted to $605 and are included in transfer agency fees and expenses on the Statement of Operations.
Each Director of the Fund who is not an employee of CRM or its affiliates receives an annual fee of $154,000 ($214,000 effective January 1, 2022), plus an annual Committee fee ranging from $8,500 to $16,500 depending on the Committee. The Board chair receives an additional $30,000 annual fee, Committee chairs receive an additional $6,000 annual fee and the special equities liaison receives an additional $2,500 annual fee. Eligible Directors may participate in a Deferred Compensation Plan (the Plan). Amounts deferred under the Plan are treated as though equal dollar amounts had been invested in shares of the Fund or other Calvert funds selected by the Directors. The Fund purchases shares of the funds selected equal to the dollar amounts deferred under the Plan, resulting in an asset equal to the deferred compensation liability. Obligations of the Plan are paid solely from the Fund's assets. Directors’ fees are allocated to each of the Calvert funds served. Salaries and fees of officers and Directors of the Fund who are employees of CRM or its affiliates are paid by CRM.
3 Shareholder Servicing Plan
The Corporation, on behalf of the Fund, has adopted a Shareholder Servicing Plan (Servicing Plan), which permits the Fund to enter into shareholder servicing agreements with intermediaries that maintain accounts in the Fund for the benefit of shareholders. These services may include, but are not limited to, processing purchase and redemption requests, processing dividend payments, and providing account information to shareholders. Under the Servicing Plan, the Fund may make payments at an annual rate of up to 0.11% of its average daily net assets. For the year ended December 31, 2021, expenses incurred under the Servicing Plan amounted to $98,429 and are included in transfer agency fees and expenses on the Statement of Operations.
4 Investment Activity
During the year ended December 31, 2021, the cost of purchases and proceeds from sales of investments, other than short-term securities, were $12,283,642 and $10,890,169, respectively.
5 Distributions to Shareholders and Income Tax Information
The tax character of distributions declared for the years ended December 31, 2021 and December 31, 2020 was as follows:
| | Year Ended December 31, |
| | 2021 | 2020 |
| Ordinary income | $2,346,020 | $3,784,483 |
As of December 31, 2021, the components of distributable earnings (accumulated loss) on a tax basis were as follows:
| Undistributed ordinary income | $ 4,101,221 |
| Deferred capital losses | (3,744,359) |
| Net unrealized appreciation | 49,128,163 |
| Distributable earnings | $49,485,025 |
At December 31, 2021, the Fund, for federal income tax purposes, had deferred capital losses of $3,744,359 which would reduce the Fund’s taxable income arising from future net realized gains on investment transactions, if any, to the extent permitted by the Internal Revenue Code, and thus would reduce the amount of distributions to shareholders, which would otherwise be necessary to relieve the Fund of any liability for federal income or excise tax. The deferred capital losses are treated as arising on the first day of the Fund’s next taxable year, can be carried forward for an unlimited period, and retain the same short-term or long-term character as when originally deferred. Of the deferred capital losses at December 31, 2021, $3,744,359 are long-term.
Calvert
VP EAFE International Index Portfolio
December 31, 2021
Notes to Financial Statements — continued
The cost and unrealized appreciation (depreciation) of investments of the Fund at December 31, 2021, as determined on a federal income tax basis, were as follows:
| Aggregate cost | $87,983,123 |
| Gross unrealized appreciation | $ 55,922,917 |
| Gross unrealized depreciation | (6,806,010) |
| Net unrealized appreciation | $49,116,907 |
6 Securities Lending
To generate additional income, the Fund may lend its securities pursuant to a securities lending agency agreement with State Street Bank and Trust Company (SSBT), the securities lending agent. Security loans are subject to termination by the Fund at any time and, therefore, are not considered illiquid investments. The Fund requires that the loan be continuously collateralized by either cash or securities in an amount at least equal to the market value of the securities on loan. The market value of securities loaned is determined daily and any additional required collateral is delivered to the Fund on the next business day. Cash collateral is generally invested in a money market fund registered under the 1940 Act that is managed by an affiliate of SSBT. Any gain or loss in the market price of the loaned securities that might occur and any interest earned or dividends declared during the term of the loan would accrue to the account of the Fund. Income earned on the investment of collateral, net of broker rebates and other expenses incurred by the securities lending agent, is split between the Fund and the securities lending agent based on agreed upon contractual terms. Non-cash collateral, if any, is held by the lending agent on behalf of the Fund and cannot be sold or re-pledged by the Fund; accordingly, such collateral is not reflected in the Statement of Assets and Liabilities.
The risks associated with lending portfolio securities include, but are not limited to, possible delays in receiving additional collateral or in the recovery of the loaned securities, possible loss of rights to the collateral should the borrower fail financially, as well as risk of loss in the value of the collateral or the value of the investments made with the collateral. The securities lending agent shall indemnify the Fund in the case of default of any securities borrower.
At December 31, 2021, the total value of securities on loan was $3,768,378 and the total value of collateral received was $3,970,983, comprised of cash of $1,896,948 and U.S. government and/or agencies securities of $2,074,035.
The following table provides a breakdown of securities lending transactions accounted for as secured borrowings, the obligations by class of collateral pledged, and the remaining contractual maturity of those transactions as of December 31, 2021.
| | Remaining Contractual Maturity of the Transactions |
| | Overnight and
Continuous | <30 days | 30 to 90 days | >90 days | Total |
| Common Stocks | $1,896,948 | $ — | $ — | $ — | $1,896,948 |
The carrying amount of the liability for deposits for securities loaned at December 31, 2021 approximated its fair value. If measured at fair value, such liability would have been considered as Level 2 in the fair value hierarchy (see Note 1A) at December 31, 2021.
7 Line of Credit
The Fund participates with other portfolios and funds managed by EVM and its affiliates, including CRM, in an $800 million unsecured line of credit with a group of banks, which is in effect through October 25, 2022. Borrowings are made by the Fund solely for temporary purposes related to redemptions and other short-term cash needs. Interest is charged to the Fund based on its borrowings at an amount above either the Secured Overnight Financing Rate (SOFR) or Federal Funds rate. In addition, a fee computed at an annual rate of 0.15% on the daily unused portion of the line of credit is allocated among the participating portfolios and funds at the end of each quarter. In connection with the renewal of the agreement in October 2021, an arrangement fee of $150,000 was incurred that was allocated to the participating portfolios and funds. Because the line of credit is not available exclusively to the Fund, it may be unable to borrow some or all of its requested amounts at any particular time.
The Fund had no borrowings outstanding pursuant to its line of credit at December 31, 2021. The Fund did not have any significant borrowings or allocated fees during the year ended December 31, 2021.
Calvert
VP EAFE International Index Portfolio
December 31, 2021
Notes to Financial Statements — continued
8 Affiliated Issuers and Funds
The Fund invested in issuers that may be deemed to be affiliated with Morgan Stanley. At December 31, 2021, the value of the Fund’s investment in affiliated issuers and funds was $858,218, which represents 0.6% of the Fund’s net assets. Transactions in affiliated issuers and funds by the Fund for the year ended December 31, 2021 were as follows:
| Name | Value,
beginning
of period | Purchases | Sales
proceeds | Net
realized
gain
(loss) | Change in
unrealized
appreciation
(depreciation) | Value,
end of
period | Dividend
income | Shares/Units,
end of period |
| Common Stocks | | | | | | |
| Mitsubishi UFJ Financial Group, Inc.(1) | $ — | $ — | $ — | $ — | $ 17,359 | $ 517,430 | $ 20,037 | 95,076 |
| Short-Term Investments | | | | | | |
| Calvert Cash Reserves Fund, LLC | 439,993 | 13,030,472 | (13,129,645) | (32) | — | 340,788 | 175 | 340,788 |
| Totals | | | | $ (32) | $17,359 | $858,218 | $20,212 | |
| (1) | May be deemed to be an affiliated issuer as of March 1, 2021 (see Note 2). |
9 Capital Shares
The Corporation may issue its shares in one or more series (such as the Fund). The authorized shares of the Fund consist of 20,000,000 common shares, $0.10 par value, for each Class.
Transactions in capital shares for the years ended December 31, 2021 and December 31, 2020 were as follows:
| | Year Ended
December 31, 2021 | | Year Ended
December 31, 2020 |
| | Shares | Amount | | Shares | Amount |
| Class I | | | | | |
| Shares sold | 55,778 | $ 5,594,467 | | 117,201 | $ 8,890,337 |
| Reinvestment of distributions | 18,572 | 1,852,955 | | 40,086 | 3,275,864 |
| Shares redeemed | (160,654) | (15,983,448) | | (322,145) | (26,108,935) |
| Net decrease | (86,304) | $ (8,536,026) | | (164,858) | $(13,942,734) |
| Class F | | | | | |
| Shares sold | 128,284 | $ 12,782,333 | | 76,301 | $ 6,372,191 |
| Reinvestment of distributions | 4,959 | 493,065 | | 6,232 | 508,619 |
| Shares redeemed | (47,081) | (4,735,088) | | (24,856) | (2,013,364) |
| Net increase | 86,162 | $ 8,540,310 | | 57,677 | $ 4,867,446 |
At December 31, 2021, separate accounts of an insurance company owned 70.1% of the value of the outstanding shares of the Fund.
Calvert
VP EAFE International Index Portfolio
December 31, 2021
Notes to Financial Statements — continued
10 Risks and Uncertainties
Risks Associated with Foreign Investments
Foreign investments can be adversely affected by political, economic and market developments abroad, including the imposition of economic and other sanctions by the United States or another country. There may be less publicly available information about foreign issuers because they may not be subject to reporting practices, requirements or regulations comparable to those to which United States companies are subject. Foreign markets may be smaller, less liquid and more volatile than the major markets in the United States. Trading in foreign markets typically involves higher expense than trading in the United States. The Fund may have difficulties enforcing its legal or contractual rights in a foreign country. Securities that trade or are denominated in currencies other than the U.S. dollar may be adversely affected by fluctuations in currency exchange rates.
Pandemic Risk
An outbreak of respiratory disease caused by a novel coronavirus was first detected in China in late 2019 and subsequently spread internationally. This coronavirus has resulted in closing borders, enhanced health screenings, changes to healthcare service preparation and delivery, quarantines, cancellations, disruptions to supply chains and customer activity, as well as general concern and uncertainty. Health crises caused by outbreaks, such as the coronavirus outbreak, may exacerbate other pre-existing political, social and economic risks and disrupt normal market conditions and operations. The impact of this outbreak has negatively affected the worldwide economy, the economies of individual countries, individual companies, and the market in general, and may continue to do so in significant and unforeseen ways, as may other epidemics and pandemics that may arise in the future. Any such impact could adversely affect the Fund's performance, or the performance of the securities in which the Fund invests.
11 Change in Independent Registered Public Accounting Firm
On July 30, 2021, KPMG LLP (“KPMG”) informed the Audit Committee and Board of the Corporation that it was resigning as the independent registered public accounting firm to the Corporation, as upon Morgan Stanley’s acquisition of Eaton Vance Corp., the parent company of CRM (the investment adviser to each series of the Corporation), KPMG would no longer be independent of the Corporation. The Audit Committee of the Board and the Board approved the selection of Deloitte & Touche LLP (“Deloitte”) as the independent registered public accounting firm for the funds that are series of the Corporation (the “Funds”) for the fiscal year ending December 31, 2021 to be effective upon KPMG’s resignation and Deloitte’s acceptance of the engagement which became effective July 30, 2021.
KPMG’s reports on the financial statements for the Funds for the fiscal periods ended December 31, 2019 and December 31, 2020 contained no adverse opinion or disclaimer of opinion nor were they qualified or modified as to uncertainty, audit scope or accounting principles. During the fiscal periods ended December 31, 2019 and December 31, 2020, and during the subsequent interim period through July 30, 2021: (i) there were no disagreements with KPMG on any matter of accounting principles or practices, financial statement disclosure or auditing scope or procedure, which disagreements, if not resolved to the satisfaction of KPMG, would have caused KPMG to make reference to the subject matter of the disagreements in connection with its reports on the Funds’ financial statements for such periods; and (ii) there were no “reportable events” of the kind described in Item 304(a)(1)(v) of Regulation S-K under the Securities Exchange Act of 1934, as amended.
During the fiscal periods ended December 31, 2019 and December 31, 2020, and during the subsequent interim period through July 30, 2021: neither the Funds, nor anyone on their behalf, consulted with Deloitte on items which: (i) concerned the application of accounting principles to a specified transaction, either completed or proposed, or the type of audit opinion that might be rendered on the Funds’ financial statements; or (ii) concerned the subject of a disagreement (as defined in paragraph (a)(1)(iv) of Item 304 of Regulation S-K) or reportable events (as described in paragraph (a)(1)(v) of Item 304).
Calvert
VP EAFE International Index Portfolio
December 31, 2021
Report of Independent Registered Public Accounting Firm
To the Board of Directors of Calvert Variable Products, Inc. and Shareholders of Calvert VP EAFE International Index Portfolio:
Opinion on the Financial Statements and Financial Highlights
We have audited the accompanying statement of assets and liabilities of Calvert VP EAFE International Index Portfolio (the "Fund") (one of the funds constituting Calvert Variable Products, Inc.), including the schedule of investments, as of December 31, 2021, the related statements of operations, changes in net assets, and the financial highlights for the year then ended, and the related notes. In our opinion, the financial statements and financial highlights present fairly, in all material respects, the financial position of the Fund as of December 31, 2021, and the results of its operations, changes in its net assets, and the financial highlights for the year then ended in conformity with accounting principles generally accepted in the United States of America. The statement of changes in net assets for the year ended December 31, 2020, and the financial highlights for the years ended December 31, 2020, 2019, 2018, and 2017 were audited by other auditors whose report, dated February 18, 2021, expressed an unqualified opinion on that financial statement and those financial highlights.
Basis for Opinion
These financial statements and financial highlights are the responsibility of the Fund's management. Our responsibility is to express an opinion on the Fund's financial statements and financial highlights based on our audit. We are a public accounting firm registered with the Public Company Accounting Oversight Board (United States) (PCAOB) and are required to be independent with respect to the Fund in accordance with the U.S. federal securities laws and the applicable rules and regulations of the Securities and Exchange Commission and the PCAOB.
We conducted our audit in accordance with the standards of the PCAOB. Those standards require that we plan and perform the audit to obtain reasonable assurance about whether the financial statements and financial highlights are free of material misstatement, whether due to error or fraud. The Fund is not required to have, nor were we engaged to perform, an audit of its internal control over financial reporting. As part of our audit, we are required to obtain an understanding of internal control over financial reporting but not for the purpose of expressing an opinion on the effectiveness of the Fund’s internal control over financial reporting. Accordingly, we express no such opinion.
Our audit included performing procedures to assess the risks of material misstatement of the financial statements and financial highlights, whether due to error or fraud, and performing procedures that respond to those risks. Such procedures included examining, on a test basis, evidence regarding the amounts and disclosures in the financial statements and financial highlights. Our audit also included evaluating the accounting principles used and significant estimates made by management, as well as evaluating the overall presentation of the financial statements and financial highlights. Our procedures included confirmation of securities owned as of December 31, 2021, by correspondence with the custodian and brokers; when replies were not received from brokers, we performed other auditing procedures. We believe that our audit provides a reasonable basis for our opinion.
/s/ Deloitte & Touche LLP
Boston, Massachusetts
February 18, 2022
We have served as the auditor of one or more Calvert investment companies since 2021.
Calvert
VP EAFE International Index Portfolio
December 31, 2021
Federal Tax Information (Unaudited)
As required by the Internal Revenue Code and/or regulations, shareholders must be notified regarding the status of 163(j) interest dividends and the foreign tax credit.
163(j) Interest Dividends. For the fiscal year ended December 31, 2021, the Fund designates 3.69% of distributions from net investment income as a 163(j) interest dividend.
Foreign Tax Credit. For the fiscal year ended December 31, 2021, the Fund paid foreign taxes of $254,309 and recognized foreign source income of $3,757,979.
Calvert
VP EAFE International Index Portfolio
December 31, 2021
Management and Organization
Fund Management. The Directors of Calvert Variable Products, Inc. (the Corporation) are responsible for the overall management and supervision of the affairs of the Corporation. The Board members and officers of the Corporation are listed below. Except as indicated, each individual has held the office shown or other offices in the same company for the last five years. Board members hold indefinite terms of office. Each Board member holds office until his or her successor is elected and qualified, or until his or her earlier death, resignation, retirement, removal or disqualification. Under the terms of the Fund’s current Board member retirement policy, an Independent Board member must retire at the end of the calendar year in which he or she turns 75. However, if such retirement would cause the Fund to be out of compliance with Section 16 of the 1940 Act or any other regulations or guidance of the SEC, then such retirement will not become effective until such time as action has been taken for the Fund to be in compliance therewith. The “noninterested Directors” consist of those Directors who are not “interested persons” of the Corporation, as that term is defined under the 1940 Act. The business address of each Board member and the Chief Compliance Officer is 1825 Connecticut Avenue, NW, Suite 400, Washington, DC 20009 and the business address of the Secretary, Vice President and Chief Legal Officer and the Treasurer is Two International Place, Boston, Massachusetts 02110. As used below, “CRM” refers to Calvert Research and Management and “Eaton Vance” refers to Eaton Vance Management. Each Director oversees 39 funds in the Calvert fund complex. Effective March 1, 2021, each of Eaton Vance and CRM are indirect, wholly-owned subsidiaries of Morgan Stanley. Each officer affiliated with CRM may hold a position with other CRM affiliates that is comparable to his or her position with CRM listed below.
| Name and Year of Birth | Corporation
Position(s) | Length of
Service | Principal Occupation(s) and Other Directorships
During Past Five Years and Other Relevant Experience |
| Interested Director |
John H. Streur(1)
1960 | Director and
President | Since 2015 | President and Chief Executive Officer of CRM (since December 31, 2016). President and Chief Executive Officer of Calvert Investments, Inc.
(January 2015 - December 2016); Chief Executive Officer of Calvert
Investment Distributors, Inc. (August 2015 - December 2016); Chief
Compliance Officer of Calvert Investment Management, Inc. (August 2015 -
April 2016); President and Director, Portfolio 21 Investments, Inc.
(through October 2014); President, Chief Executive Officer and
Director, Managers Investment Group LLC (through January 2012);
President and Director, The Managers Funds and Managers AMG
Funds (through January 2012).
Other Directorships. Portfolio 21 Investments, Inc. (asset management)
(through October 2014); Managers Investment Group LLC (asset management)
(through January 2012); The Managers Funds (asset management)
(through January 2012); Managers AMG Funds (asset management)
(through January 2012); Calvert Impact Capital, Inc. |
| Noninterested Directors |
Richard L. Baird, Jr.
1948 | Director | Since 2016 | Regional Disaster Recovery Lead, American Red Cross of Greater
Pennsylvania (since 2017). Volunteer, American Red Cross (since 2015).
Former President and CEO of Adagio Health Inc. (retired in 2014) in
Pittsburgh, PA.
Other Directorships. None. |
Alice Gresham Bullock
1950 | Chair and
Director | Since 2016 (Chair);
Since 2008 (Director) | Professor Emerita at Howard University School of Law. Dean Emerita of
Howard University School of Law and Deputy Director of the Association
of American Law Schools (1992-1994).
Other Directorships. None. |
Cari M. Dominguez
1949 | Director | Since 2016 | Former Chair of the U.S. Equal Employment Opportunity Commission.
Other Directorships. ManpowerGroup Inc. (workforce solutions company);
Triple S Management Corporation (managed care); National Association of Corporate Directors. |
John G. Guffey, Jr.
1948 | Director | Since 2016 | President of Aurora Press Inc., a privately held publisher of trade
paperbacks (since January 1997).
Other Directorships. Calvert Impact Capital, Inc. (through
December 31, 2018); Calvert Ventures, LLC. |
Miles D. Harper, III
1962 | Director | Since 2016 | Partner, Carr Riggs & Ingram (public accounting firm) since October 2014.
Partner, Gainer Donnelly & Desroches (public accounting firm) (now Carr
Riggs & Ingram) (November 1999 - September 2014).
Other Directorships. Bridgeway Funds (9) (asset management). |
Joy V. Jones
1950 | Director | Since 2016 | Attorney.
Other Directorships. Palm Management Corporation. |
Calvert
VP EAFE International Index Portfolio
December 31, 2021
Management and Organization — continued
| Name and Year of Birth | Corporation
Position(s) | Length of
Service | Principal Occupation(s) and Other Directorships
During Past Five Years and Other Relevant Experience |
| Noninterested Directors (continued) |
Anthony A. Williams
1951 | Director | Since 2016 | CEO and Executive Director of the Federal City Council (July 2012 to
present); Senior Adviser and Independent Consultant for King and
Spalding LLP (September 2015 to present); Executive Director of Global
Government Practice at the Corporate Executive Board (January 2010 to
January 2012).
Other Directorships. Freddie Mac; Evoq Properties/Meruelo Maddux
Properties, Inc. (real estate management); Weston Solutions, Inc.
(environmental services); Bipartisan Policy Center’s Debt Reduction Task Force;
Chesapeake Bay Foundation; Catholic University of America; Urban Institute (research organization); The Howard Hughes Corporation (real estate development). |
| Name and Year of Birth | Corporation
Position(s) | Length of
Service | Principal Occupation(s)
During Past Five Years |
| Principal Officers who are not Directors |
Hope L. Brown
1973 | Chief
Compliance
Officer | Since 2014 | Chief Compliance Officer of 39 registered investment companies advised
by CRM (since 2014). Vice President and Chief Compliance Officer,
Wilmington Funds (2012-2014). |
Deidre E. Walsh
1971 | Secretary,
Vice President
and Chief
Legal Officer | Since 2021 | Vice President of CRM and officer of 39 registered investment companies
advised by CRM (since 2021). Also Vice President of Eaton Vance and
certain of its affiliates and officer of 138 registered investment companies
advised or administered by Eaton Vance. |
James F. Kirchner
1967 | Treasurer | Since 2016 | Vice President of CRM and officer of 39 registered investment companies
advised by CRM (since 2016). Also Vice President of Eaton Vance and
certain of its affiliates and officer of 138 registered investment companies
advised or administered by Eaton Vance. |
| | | | |
| (1) Mr. Streur is an interested person of the Fund because of his positions with the Fund’s adviser and certain affiliates. |
The SAI for the Fund includes additional information about the Directors and officers of the Fund and can be obtained without charge on Calvert’s website at www.calvert.com or by calling 1-800-368-2745.
| FACTS | WHAT DOES EATON VANCE DO WITH YOUR
PERSONAL INFORMATION? |
| Why? | Financial companies choose how they share your personal information. Federal law gives consumers the right to limit some but not all sharing. Federal law also requires us to tell you how we collect, share, and protect your personal information. Please read this notice carefully to understand what we do. |
| |
| What? | The types of personal information we collect and share depend on the product or service you have with us. This information can include:■ Social Security number and income
■
investment experience and risk tolerance
■
checking account number and wire transfer instructions |
| |
| How? | All financial companies need to share customers’ personal information to run their everyday business. In the section below, we list the reasons financial companies can share their customers’ personal information; the reasons Eaton Vance chooses to share; and whether you can limit this sharing. |
Reasons we can share your
personal information | Does Eaton Vance
share? | Can you limit
this sharing? |
| For our everyday business purposes — such as to process your transactions, maintain your account(s), respond to court orders and legal investigations, or report to credit bureaus | Yes | No |
| For our marketing purposes — to offer our products and services to you | Yes | No |
| For joint marketing with other financial companies | No | We don’t share |
| For our investment management affiliates’ everyday business purposes — information about your transactions, experiences, and creditworthiness | Yes | Yes |
| For our affiliates’ everyday business purposes — information about your transactions and experiences | Yes | No |
| For our affiliates’ everyday business purposes — information about your creditworthiness | No | We don’t share |
| For our investment management affiliates to market to you | Yes | Yes |
| For our affiliates to market to you | No | We don’t share |
| For nonaffiliates to market to you | No | We don’t share |
To limit our
sharing | Call toll-free 1-800-368-2745 or email: CRMPrivacy@calvert.comPlease note:If you are a new customer, we can begin sharing your information 30 days from the date we sent this notice. When you are no longer our customer, we continue to share your information as described in this notice. However, you can contact us at any time to limit our sharing. |
| Questions? | Call toll-free 1-800-368-2745 or email: CRMPrivacy@calvert.com |
| Privacy Notice — continued | April 2021 |
| Who we are |
| Who is providing this notice? | Eaton Vance Management, Eaton Vance Distributors, Inc., Eaton Vance Trust Company, Eaton Vance Management (International) Limited, Eaton Vance Advisers International Ltd., Eaton Vance Global Advisors Limited, Eaton Vance Management’s Real Estate Investment Group, Boston Management and Research, Calvert Research and Management, Eaton Vance and Calvert Fund Families and our investment advisory affiliates (“Eaton Vance”) (see Investment Management Affiliates definition below) |
| What we do |
How does Eaton Vance
protect my personal
information? | To protect your personal information from unauthorized access and use, we use security measures that comply with federal law. These measures include computer safeguards and secured files and buildings. We have policies governing the proper handling of customer information by personnel and requiring third parties that provide support to adhere to appropriate security standards with respect to such information. |
How does Eaton Vance
collect my personal
information? | We collect your personal information, for example, when you■ open an account or make deposits or withdrawals from your account
■
buy securities from us or make a wire transfer
■
give us your contact informationWe also collect your personal information from others, such as credit bureaus, affiliates, or other companies. |
| Why can’t I limit all sharing? | Federal law gives you the right to limit only■ sharing for affiliates’ everyday business purposes — information about your creditworthiness
■
affiliates from using your information to market to you
■
sharing for nonaffiliates to market to youState laws and individual companies may give you additional rights to limit sharing. See below for more on your rights under state law. |
| Definitions |
Investment Management
Affiliates | Eaton Vance Investment Management Affiliates include registered investment advisers, registered broker- dealers, and registered and unregistered funds. Investment Management Affiliates does not include entities associated with Morgan Stanley Wealth Management, such as Morgan Stanley Smith Barney LLC and Morgan Stanley & Co. |
| Affiliates | Companies related by common ownership or control. They can be financial and nonfinancial companies.■ Our affiliates include companies with a Morgan Stanley name and financial companies such as Morgan Stanley Smith Barney LLC and Morgan Stanley & Co. |
| Nonaffiliates | Companies not related by common ownership or control. They can be financial and nonfinancial companies.■ Eaton Vance does not share with nonaffiliates so they can market to you. |
| Joint marketing | A formal agreement between nonaffiliated financial companies that together market financial products or services to you.■ Eaton Vance doesn’t jointly market. |
| Other important information |
| Vermont: Except as permitted by law, we will not share personal information we collect about Vermont residents with Nonaffiliates unless you provide us with your written consent to share such information.California: Except as permitted by law, we will not share personal information we collect about California residents with Nonaffiliates and we will limit sharing such personal information with our Affiliates to comply with California privacy laws that apply to us. |
Delivery of Shareholder Documents. The Securities and Exchange Commission (SEC) permits funds to deliver only one copy of shareholder documents, including prospectuses, proxy statements and shareholder reports, to fund investors with multiple accounts at the same residential or post office box address. This practice is often called “householding” and it helps eliminate duplicate mailings to shareholders. Calvert funds, or your financial intermediary, may household the mailing of your documents indefinitely unless you instruct Calvert funds, or your financial intermediary, otherwise. If you would prefer that your Calvert fund documents not be householded, please contact Calvert funds at 1-800-368-2745, or contact your financial intermediary. Your instructions that householding not apply to delivery of your Calvert fund documents will typically be effective within 30 days of receipt by Calvert funds or your financial intermediary. Separate statements will be generated for each separate account and will be householded as described above.
Portfolio Holdings. Each Calvert fund files a schedule of portfolio holdings on Part F to Form N-PORT with the SEC. Certain information filed on Form N-PORT may be viewed on the Calvert website at www.calvert.com, by calling Calvert at 1-800-368-2745 or in the EDGAR database on the SEC’s website at www.sec.gov.
Proxy Voting. The Proxy Voting Guidelines that each Calvert fund uses to determine how to vote proxies relating to portfolio securities is provided as an Appendix to the fund’s Statement of Additional Information. The Statement of Additional Information can be obtained free of charge by calling the Calvert funds at 1-800-368-2745, by visiting the Calvert funds’ website at www.calvert.com or visiting the SEC’s website at www.sec.gov. Information regarding how a Calvert fund voted proxies relating to portfolio securities during the most recent 12-month period ended June 30 is available by calling Calvert funds, by visiting the Calvert funds’ website at www.calvert.com or by visiting the SEC’s website at www.sec.gov.
Investment Adviser and Administrator
Calvert Research and Management
1825 Connecticut Avenue NW, Suite 400
Washington, DC 20009
Principal Underwriter*
Eaton Vance Distributors, Inc.
Two International Place
Boston, MA 02110
(617) 482-8260
Custodian
State Street Bank and Trust Company
State Street Financial Center, One Lincoln Street
Boston, MA 02111
Transfer Agent
DST Asset Manager Solutions, Inc.
2000 Crown Colony Drive
Quincy, MA 02169
Independent Registered Public Accounting Firm
Deloitte & Touche LLP
200 Berkeley Street
Boston, MA 02116-5022
Fund Offices
1825 Connecticut Avenue NW, Suite 400
Washington, DC 20009
* FINRA BrokerCheck. Investors may check the background of their Investment Professional by contacting the Financial Industry Regulatory Authority (FINRA). FINRA BrokerCheck is a free tool to help investors check the professional background of current and former FINRA-registered securities firms and brokers. FINRA BrokerCheck is available by calling 1-800-289-9999 and at www.FINRA.org. The FINRA BrokerCheck brochure describing this program is available to investors at www.FINRA.org.
Printed on recycled paper.
24227 12.31.21
Calvert
VP Investment Grade Bond Index Portfolio
Annual Report
December 31, 2021
Commodity Futures Trading Commission Registration. The Commodity Futures Trading Commission (“CFTC”) has adopted regulations that subject registered investment companies and advisers to regulation by the CFTC if a fund invests more than a prescribed level of its assets in certain CFTC-regulated instruments (including futures, certain options and swap agreements) or markets itself as providing investment exposure to such instruments. The adviser has claimed an exclusion from the definition of “commodity pool operator” under the Commodity Exchange Act with respect to its management of the Fund and the other funds it manages. Accordingly, neither the Fund nor the adviser is subject to CFTC regulation.
Fund shares are not insured by the FDIC and are not deposits or other obligations of, or guaranteed by, any depository institution. Shares are subject to investment risks, including possible loss of principal invested.
This report must be preceded or accompanied by a current summary prospectus or prospectus. Before investing, investors should consider carefully the investment objective, risks, and charges and expenses of a mutual fund. This and other important information is contained in the summary prospectus and prospectus, which can be obtained from a financial intermediary. Prospective investors should read the prospectus carefully before investing. For further information, please call 1-800-368-2745.
Annual Report December 31, 2021
Calvert
VP Investment Grade Bond Index Portfolio
Calvert
VP Investment Grade Bond Index Portfolio
December 31, 2021
Management's Discussion of Fund Performance†
Economic and Market Conditions
During the 12-month period ended December 31, 2021, the U.S. fixed-income market was influenced by several key events: a change in U.S. federal government leadership, the introduction of COVID-19 vaccines, and the reopening of the U.S. economy. Against that background, fixed-income returns were generally weak, while equity markets posted strong returns as optimism about the economic reopening returned to the market.
The period began with multiple drugmakers announcing successful clinical trials in the development of COVID-19 vaccines. During the first quarter of the period, the U.S. Federal Reserve (the Fed) maintained accommodative monetary policies and Congress passed $900 billion in additional fiscal stimulus. Stocks performed well, credit spreads tightened, and long-term U.S. Treasury yields rose as the U.S. dollar weakened during the first quarter. Bond markets suffered in the first quarter as the Bloomberg U.S. Aggregate Bond Index posted its worst quarterly return in 40 years.
During the second quarter of 2021, global equity markets grew in value, while fixed-income markets staged a bounce back as the U.S. Treasury yield curve flattened. The tighter monetary stance taken by the Fed in June raised expectations of potential interest rate hikes to help manage inflation. At the same time, the Fed announced plans to taper its monthly bond purchases.
As 2021 progressed, inflation became a growing concern among investors. Strong demand for goods and services, ongoing supply-side constraints, and rising commodity prices contributed to inflationary fears. As a result, many central banks worldwide began to take less accommodative postures.
In the fall, the Fed accelerated the tapering of its bond-buying policy and in December indicated it might raise interest rates as much as three times in 2022. Although this caused a further flattening of the U.S. Treasury yield curve, it was not accompanied by the significant yield spread widening that typically comes with a flattening curve. Investment-grade corporate credit spreads widened modestly during the fourth quarter, while high yield bond spreads tightened. The Bloomberg U.S. Aggregate Bond Index was essentially flat during the final quarter of the period, capping a year of weak returns.
The Bloomberg U.S. Aggregate Bond Index returned (1.54)% in 2021, which was its first calendar-year loss since 2013. The ICE BofA U.S. High Yield and S&P/LSTA Leveraged Loan indexes gained 5.36% and 5.20%, respectively, during the period. The S& P 500® Index returned 28.71% and the Nasdaq Composite Index returned 22.18% during the period.
Investment Strategy
Calvert VP Investment Grade Bond Index Portfolio (the Fund) employs a passive management approach in an effort to track as closely as possible the performance of the Bloomberg U.S. Aggregate Bond Index (the Index). With more than 12,000 securities within the Index, however, full replication is not feasible. The Fund, therefore, uses a representative sampling method to create a portfolio of securities with similar economic characteristics as the Index, including duration, sector allocation, and quality.
Fund Performance
For the 12-month period ended December 31, 2021, the Fund returned (1.82)% for Class I shares at net asset value (NAV). By comparison, its benchmark, the Index, returned (1.54)% during the period.
The Index is unmanaged and returns do not reflect any fees or operating expenses.
Shorter duration securities outperformed during the period as the intermediate part of the U.S. Treasury curve steepened early in the year. The corporate and structured sectors experienced modest spread tightening over the course of the year, contributing to their outperformance relative to the Index and the Fund during the period.
See Endnotes and Additional Disclosures in this report.
Past performance is no guarantee of future results. Returns are historical and are calculated by determining the percentage change in net asset value (NAV) or offering price (as applicable) with all distributions reinvested. Investment return and principal value will fluctuate so that shares, when redeemed, may be worth more or less than their original cost. Performance for periods less than or equal to one year is cumulative. Performance is for the stated time period only; due to market volatility, current Fund performance may be lower or higher than the quoted return.
Calvert
VP Investment Grade Bond Index Portfolio
December 31, 2021
Performance
Portfolio Manager(s) Tina J. Udell, CFA of Ameritas Investment Partners, Inc.
| % Average Annual Total Returns1,2 | Class
Inception Date | Performance
Inception Date | One Year | Five Years | Ten Years |
| Class I at NAV | 03/31/2003 | 03/31/2003 | (1.82)% | 3.33% | 2.60% |
| Class F at NAV | 10/30/2015 | 03/31/2003 | (2.08) | 3.07 | 2.44 |
|
| Bloomberg U.S. Aggregate Bond Index | — | — | (1.54)% | 3.57% | 2.90% |
| % Total Annual Operating Expense Ratios3 | Class I | Class F |
| Gross | 0.47% | 0.72% |
| Net | 0.32 | 0.57 |
Growth of $10,000
This graph shows the change in value of a hypothetical investment of $10,000 in Class I of the Fund for the period indicated. For comparison, the same investment is shown in the indicated index.
| Growth of Investment2 | Amount Invested | Period Beginning | At NAV | With Maximum Sales Charge |
| Class F | $10,000 | 12/31/2011 | $12,730 | N.A. |
See Endnotes and Additional Disclosures in this report.
Past performance is no guarantee of future results. Returns are historical and are calculated by determining the percentage change in net asset value (NAV) or offering price (as applicable) with all distributions reinvested. Investment return and principal value will fluctuate so that shares, when redeemed, may be worth more or less than their original cost. Performance for periods less than or equal to one year is cumulative. Performance is for the stated time period only; due to market volatility, current Fund performance may be lower or higher than the quoted return.
Calvert
VP Investment Grade Bond Index Portfolio
December 31, 2021
Asset Allocation (% of total investments)
Calvert
VP Investment Grade Bond Index Portfolio
December 31, 2021
Endnotes and Additional Disclosures
| † | The views expressed in this report are those of the portfolio manager(s) and are current only through the date stated at the top of this page. These views are subject to change at any time based upon market or other conditions, and Calvert and the Fund(s) disclaim any responsibility to update such views. These views may not be relied upon as investment advice and, because investment decisions are based on many factors, may not be relied upon as an indication of trading intent on behalf of any Calvert fund. This commentary may contain statements that are not historical facts, referred to as “forward-looking statements.” The Fund’s actual future results may differ significantly from those stated in any forward-looking statement, depending on factors such as changes in securities or financial markets or general economic conditions, the volume of sales and purchases of Fund shares, the continuation of investment advisory, administrative and service contracts, and other risks discussed from time to time in the Fund’s filings with the Securities and Exchange Commission. |
| | |
| 1 | Bloomberg U.S. Aggregate Bond Index is an unmanaged index of domestic investment-grade bonds, including corporate, government and mortgage-backed securities. Unless otherwise stated, index returns do not reflect the effect of any applicable sales charges, commissions, expenses, taxes or leverage, as applicable. It is not possible to invest directly in an index. |
| 2 | There is no sales charge. Insurance-related charges are not included in the calculation of returns. If such charges were reflected, the returns would be lower. Please refer to the report for your insurance contract for performance data reflecting insurance-related charges.Performance prior to the inception date of a class may be linked to the performance of an older class of the Fund. This linked performance is adjusted for any applicable sales charge, but is not adjusted for class expense differences. If adjusted for such differences, the performance would be different. The performance of Class F is linked to Class I. Performance presented in the Financial Highlights included in the financial statements is not linked.Calvert Research and Management became the investment adviser to the Fund on December 31, 2016. Performance reflected prior to such date is that of the Fund’s former investment adviser. |
| 3 | Source: Fund prospectus. Net expense ratios reflect a contractual expense reimbursement that continues through 4/30/22. The expense ratios for the current reporting period can be found in the Financial Highlights section of this report. Performance reflects expenses waived and/or reimbursed, if applicable. Without such waivers and/or reimbursements, performance would have been lower. |
| | Additional Information |
| | ICE BofA U.S. High Yield Index is an unmanaged index of below-investment grade U.S. corporate bonds. ICE® BofA® indices are not for redistribution or other uses; provided “as is”, without warranties, and with no liability. Eaton Vance has prepared this report and ICE Data Indices, LLC does not endorse it, or guarantee, review, or endorse Eaton Vance’s products. BofA® is a licensed registered trademark of Bank of America Corporation in the United States and other countries. S&P/LSTA Leveraged Loan Index is an unmanaged index of the institutional leveraged loan market. S&P 500® Index is an unmanaged index of large-cap stocks commonly used as a measure of U.S. stock market performance. S&P/LSTA Leveraged Loan indices and S&P Dow Jones Indices are products of S&P Dow Jones Indices LLC (“S&P DJI”) and have been licensed for use. S&P® and S&P 500® are registered trademarks of S&P DJI; Dow Jones® is a registered trademark of Dow Jones Trademark Holdings LLC (“Dow Jones”); LSTA is a trademark of Loan Syndications and Trading Association, Inc. S&P DJI, Dow Jones, their respective affiliates and their third party licensors do not sponsor, endorse, sell or promote the Fund, will not have any liability with respect thereto and do not have any liability for any errors, omissions, or interruptions of the S&P Dow Jones Indices. Nasdaq Composite Index is a market capitalization-weighted index of all domestic and international securities listed on Nasdaq. Source: Nasdaq, Inc. The information is provided by Nasdaq (with its affiliates, are referred to as the “Corporations”) and Nasdaq’s third party licensors on an “as is” basis and the Corporations make no guarantees and bear no liability of any kind with respect to the information or the Fund. |
| | Credit spread is the difference in yield between a U.S. Treasury bond and another debt security of the same maturity but different credit quality. |
| | Yield curve is a graphical representation of the yields offered by bonds of various maturities. The yield curve flattens when long-term interest rates fall and/or short-term interest rates increase, and the yield curve steepens when long-term interest rates increase and/or short-term interest rates fall. |
| | Duration is a measure of the expected change in price of a bond — in percentage terms — given a one percent change in interest rates, all else being constant. Securities with lower durations tend to be less sensitive to interest rate changes. |
Calvert
VP Investment Grade Bond Index Portfolio
December 31, 2021
Example
As a Fund shareholder, you incur ongoing costs, including management fees; distribution and/or service fees; and other Fund expenses. This Example is intended to help you understand your ongoing costs (in dollars) of Fund investing and to compare these costs with the ongoing costs of investing in other mutual funds. The Example is based on an investment of $1,000 invested at the beginning of the period and held for the entire period (July 1, 2021 to December 31, 2021).
Actual Expenses
The first section of the table below provides information about actual account values and actual expenses. You may use the information in this section, together with the amount you invested, to estimate the expenses that you paid over the period. Simply divide your account value by $1,000 (for example, an $8,600 account value divided by $1,000 = 8.6), then multiply the result by the number in the first section under the heading entitled “Expenses Paid During Period” to estimate the expenses you paid on your account during this period.
Hypothetical Example for Comparison Purposes
The second section of the table below provides information about hypothetical account values and hypothetical expenses based on the actual Fund expense ratio and an assumed rate of return of 5% per year (before expenses), which is not the actual Fund return. The hypothetical account values and expenses may not be used to estimate the actual ending account balance or expenses you paid for the period. You may use this information to compare the ongoing costs of investing in the Fund and other funds. To do so, compare this 5% hypothetical example with the 5% hypothetical examples that appear in the shareholder reports of the other funds.
Please note that the expenses shown in the table are meant to highlight your ongoing costs only and do not reflect expenses and charges which are, or may be imposed under the variable annuity contract or variable life insurance policy (variable contracts) (if applicable) or qualified pension or retirement plans (Qualified Plans) through which your investment in the Fund is made. Therefore, the second section of the table is useful in comparing ongoing costs associated with an investment in vehicles which fund benefits under variable contracts and Qualified Plans, and will not help you determine the relative total costs of investing in the Fund through variable contracts or Qualified Plans. In addition, if these expenses and charges imposed under the variable contracts or Qualified Plans were included, your costs would have been higher.
| | Beginning
Account Value
(7/1/21) | Ending
Account Value
(12/31/21) | Expenses Paid
During Period*
(7/1/21 – 12/31/21) | Annualized
Expense
Ratio |
| Actual | | | | |
| Class I | $1,000.00 | $ 998.10 | $1.61 ** | 0.32% |
| Class F | $1,000.00 | $ 996.80 | $2.87 ** | 0.57% |
| Hypothetical | | | | |
| (5% return per year before expenses) | | | | |
| Class I | $1,000.00 | $1,023.59 | $1.63 ** | 0.32% |
| Class F | $1,000.00 | $1,022.33 | $2.91 ** | 0.57% |
| * | Expenses are equal to the Fund's annualized expense ratio for the indicated Class, multiplied by the average account value over the period, multiplied by 184/365 (to reflect the one-half year period). The Example assumes that the $1,000 was invested at the net asset value per share determined at the close of business on June 30, 2021. Expenses shown do not include insurance-related charges or direct expenses of Qualified Plans. |
| ** | Absent a waiver and/or reimbursement of expenses by an affiliate, expenses would be higher. |
Calvert
VP Investment Grade Bond Index Portfolio
December 31, 2021
| Asset-Backed Securities — 0.3% |
| Security | Principal
Amount
(000's omitted) | Value |
| American Express Credit Account Master Trust: | | | |
| Series 2019-1, Class A, 2.87%, 10/15/24 | $ | 300 | $ 301,975 |
| Series 2021-1, Class A, 0.90%, 11/15/26 | | 50 | 49,610 |
| Avis Budget Rental Car Funding AESOP, LLC, Series 2019-1A, Class A, 3.45%, 3/20/23(1) | | 150 | 150,598 |
Total Asset-Backed Securities
(identified cost $502,374) | | | $ 502,183 |
| Commercial Mortgage-Backed Securities — 2.1% |
| Security | Principal
Amount
(000's omitted) | Value |
| Citigroup Commercial Mortgage Trust: | | | |
| Series 2013-GC17, Class A4, 4.131%, 11/10/46 | $ | 422 | $ 441,986 |
| Series 2014-GC21, Class A5, 3.855%, 5/10/47 | | 645 | 678,031 |
| UBS-Barclays Commercial Mortgage Trust, Series 2012-C4, Class A5, 2.85%, 12/10/45 | | 625 | 629,716 |
| Wells Fargo Commercial Mortgage Trust, Series 2015-C26, Class A4, 3.166%, 2/15/48 | | 1,275 | 1,332,191 |
Total Commercial Mortgage-Backed Securities
(identified cost $3,010,433) | | | $ 3,081,924 |
| Security | Principal
Amount
(000's omitted) | Value |
| Basic Materials — 0.4% | |
| Barrick North America Finance, LLC, 5.75%, 5/1/43 | $ | 100 | $ 136,164 |
| Dow Chemical Co. (The), 4.375%, 11/15/42 | | 100 | 118,366 |
| LYB International Finance BV, 5.25%, 7/15/43 | | 100 | 129,205 |
| Reliance Steel & Aluminum Co., 4.50%, 4/15/23 | | 200 | 207,076 |
| | | | $ 590,811 |
| Communications — 3.3% | |
| AT&T, Inc.: | | | |
| 4.90%, 6/15/42 | $ | 200 | $ 241,452 |
| 5.375%, 10/15/41 | | 100 | 123,294 |
| 5.45%, 3/1/47 | | 1,000 | 1,309,788 |
| Charter Communications Operating, LLC / Charter Communications Operating Capital, 4.908%, 7/23/25 | | 500 | 551,000 |
| Comcast Corp.: | | | |
| 2.937%, 11/1/56(1) | | 98 | 93,604 |
| 4.00%, 3/1/48 | | 50 | 57,736 |
| 4.15%, 10/15/28 | | 100 | 113,595 |
| Discovery Communications, LLC, 4.125%, 5/15/29 | | 200 | 221,325 |
| Security | Principal
Amount
(000's omitted) | Value |
| Communications (continued) | |
| Motorola Solutions, Inc., 2.30%, 11/15/30 | $ | 250 | $ 241,823 |
| NBCUniversal Media, LLC, 4.45%, 1/15/43 | | 123 | 149,483 |
| T-Mobile USA, Inc., 3.50%, 4/15/25 | | 250 | 265,051 |
| Verizon Communications, Inc.: | | | |
| 1.68%, 10/30/30 | | 340 | 323,383 |
| 2.875%, 11/20/50 | | 150 | 142,754 |
| Walt Disney Co. (The), 5.40%, 10/1/43 | | 100 | 139,056 |
| WPP Finance 2010, 3.75%, 9/19/24 | | 1,000 | 1,057,863 |
| | | | $ 5,031,207 |
| Consumer, Cyclical — 1.8% | |
| Choice Hotels International, Inc., 3.70%, 1/15/31 | $ | 250 | $ 265,391 |
| Cintas Corp. No. 2, 3.25%, 6/1/22 | | 350 | 351,494 |
| General Motors Co., 5.00%, 4/1/35 | | 1,000 | 1,182,094 |
| Lowe's Cos., Inc., 3.875%, 9/15/23 | | 100 | 104,368 |
| McDonald's Corp., 3.60%, 7/1/30 | | 300 | 331,808 |
| Starbucks Corp., 3.75%, 12/1/47 | | 250 | 275,963 |
| VF Corp., 2.95%, 4/23/30 | | 225 | 233,644 |
| | | | $ 2,744,762 |
| Consumer, Non-cyclical — 5.3% | |
| AbbVie, Inc.: | | | |
| 2.90%, 11/6/22 | $ | 200 | $ 203,723 |
| 3.20%, 11/21/29 | | 300 | 321,090 |
| Alcon Finance Corp., 3.00%, 9/23/29(1) | | 350 | 365,771 |
| Anheuser-Busch InBev Finance, Inc.: | | | |
| 4.00%, 1/17/43 | | 100 | 111,523 |
| 4.625%, 2/1/44 | | 1,000 | 1,201,524 |
| Block Financial, LLC, 3.875%, 8/15/30 | | 150 | 160,668 |
| Bunge, Ltd. Finance Corp., 1.63%, 8/17/25 | | 250 | 249,317 |
| CVS Health Corp., 4.30%, 3/25/28(2) | | 110 | 123,541 |
| CVS Pass-Through Trust, 6.036%, 12/10/28 | | 60 | 68,687 |
| DENTSPLY SIRONA, Inc., 3.25%, 6/1/30 | | 400 | 422,948 |
| Equifax, Inc., 3.30%, 12/15/22 | | 450 | 458,038 |
| Gilead Sciences, Inc., 3.70%, 4/1/24 | | 100 | 105,170 |
| Global Payments, Inc., 2.15%, 1/15/27 | | 200 | 200,910 |
| Kroger Co. (The): | | | |
| 3.85%, 8/1/23 | | 100 | 103,920 |
| 3.875%, 10/15/46 | | 250 | 278,968 |
| Laboratory Corp. of America Holdings: | | | |
| 2.95%, 12/1/29 | | 100 | 104,152 |
| 4.00%, 11/1/23 | | 100 | 104,889 |
| Molson Coors Brewing Co., 5.00%, 5/1/42 | | 100 | 121,067 |
| Perrigo Finance Unlimited Co., 3.90%, 6/15/30 | | 250 | 253,671 |
| Pfizer, Inc., 4.40%, 5/15/44 | | 1,000 | 1,245,884 |
| Quanta Services, Inc., 2.90%, 10/1/30 | | 200 | 203,626 |
| STERIS Irish FinCo Unlimited Co., 3.75%, 3/15/51 | | 100 | 109,690 |
| Sysco Corp., 5.95%, 4/1/30 | | 250 | 312,364 |
| Takeda Pharmaceutical Co., Ltd., 3.175%, 7/9/50 | | 400 | 404,348 |
7
See Notes to Financial Statements.
Calvert
VP Investment Grade Bond Index Portfolio
December 31, 2021
Schedule of Investments — continued
| Security | Principal
Amount
(000's omitted) | Value |
| Consumer, Non-cyclical (continued) | |
| Triton Container International, Ltd., 2.05%, 4/15/26(1) | $ | 300 | $ 297,937 |
| Tyson Foods, Inc., 3.95%, 8/15/24 | | 100 | 106,365 |
| Viatris, Inc., 2.30%, 6/22/27 | | 250 | 251,623 |
| Zoetis, Inc., 4.70%, 2/1/43 | | 100 | 127,742 |
| | | | $ 8,019,156 |
| Energy — 3.2% | |
| BP Capital Markets America, Inc., 3.633%, 4/6/30 | $ | 200 | $ 220,888 |
| Colonial Pipeline Co., 6.58%, 8/28/32(1) | | 100 | 132,132 |
| HollyFrontier Corp., 5.875%, 4/1/26 | | 1,000 | 1,122,555 |
| Shell International Finance BV: | | | |
| 4.125%, 5/11/35 | | 1,350 | 1,577,891 |
| 4.55%, 8/12/43 | | 100 | 124,972 |
| Texas Eastern Transmission, L.P., 2.80%, 10/15/22(1) | | 400 | 404,396 |
| TransCanada PipeLines, Ltd., 4.875%, 1/15/26 | | 1,000 | 1,114,577 |
| TransContinental Gas Pipe Line Co., LLC, 4.45%, 8/1/42 | | 100 | 117,411 |
| | | | $ 4,814,822 |
| Financial — 6.2% | |
| AerCap Ireland Capital DAC/AerCap Global Aviation Trust, 3.00%, 10/29/28 | $ | 200 | $ 202,984 |
| Bank of America Corp.: | | | |
| 2.592% to 4/29/30, 4/29/31(3) | | 500 | 505,628 |
| 4.125%, 1/22/24 | | 300 | 318,896 |
| 4.244% to 4/24/37, 4/24/38(3) | | 250 | 293,846 |
| Berkshire Hathaway Finance Corp., 4.30%, 5/15/43 | | 1,000 | 1,199,803 |
| Capital One Bank, 3.375%, 2/15/23 | | 200 | 205,592 |
| Citigroup, Inc.: | | | |
| 4.075% to 4/23/28, 4/23/29(3) | | 500 | 551,843 |
| 5.50%, 9/13/25 | | 80 | 90,555 |
| Discover Financial Services, 3.85%, 11/21/22 | | 200 | 205,316 |
| Excalibur One 77B, LLC, 1.492%, 1/1/25 | | 12 | 11,945 |
| Goldman Sachs Group, Inc. (The), 4.00%, 3/3/24 | | 500 | 530,415 |
| HSBC Holdings PLC, 2.848% to 6/4/30, 6/4/31(3) | | 400 | 405,053 |
| JPMorgan Chase & Co.: | | | |
| 3.109% to 4/22/50, 4/22/51(3) | | 300 | 310,797 |
| 3.375%, 5/1/23 | | 700 | 721,901 |
| MetLife, Inc., 4.875%, 11/13/43 | | 100 | 129,980 |
| Morgan Stanley: | | | |
| 4.10%, 5/22/23(4) | | 500 | 520,950 |
| 5.00%, 11/24/25(4) | | 150 | 168,074 |
| Piedmont Operating Partnership LP, 3.15%, 8/15/30 | | 150 | 153,812 |
| PNC Bank N.A., 2.70%, 10/22/29 | | 250 | 258,535 |
| Prudential Financial, Inc., 5.10%, 8/15/43 | | 1,000 | 1,210,488 |
| Simon Property Group, L.P., 2.65%, 7/15/30(2) | | 150 | 152,975 |
| US Bancorp, 3.10%, 4/27/26 | | 250 | 264,449 |
| Wells Fargo & Co.: | | | |
| 2.625%, 7/22/22 | | 400 | 405,000 |
| 3.196% to 6/17/26, 6/17/27(3) | | 250 | 263,708 |
| Security | Principal
Amount
(000's omitted) | Value |
| Financial (continued) | |
| Westpac Banking Corp., 3.35%, 3/8/27 | $ | 200 | $ 216,074 |
| | | | $ 9,298,619 |
| Industrial — 3.1% | |
| BNSF Funding Trust I, 6.613% to 1/15/26, 12/15/55(3) | $ | 540 | $ 601,425 |
| Boeing Co. (The): | | | |
| 2.196%, 2/4/26 | | 300 | 300,173 |
| 3.20%, 3/1/29 | | 150 | 154,527 |
| 4.875%, 5/1/25 | | 100 | 109,492 |
| 5.15%, 5/1/30 | | 100 | 116,605 |
| Carrier Global Corp., 3.577%, 4/5/50 | | 375 | 399,805 |
| Cummins, Inc., 4.875%, 10/1/43 | | 100 | 133,146 |
| Deere & Co., 6.55%, 10/1/28 | | 250 | 320,106 |
| Flex, Ltd.: | | | |
| 4.75%, 6/15/25 | | 250 | 272,319 |
| 4.875%, 5/12/30 | | 250 | 285,391 |
| GATX Corp., 3.25%, 9/15/26 | | 400 | 419,230 |
| Kansas City Southern, 4.70%, 5/1/48 | | 200 | 250,155 |
| Lennox International, Inc., 1.70%, 8/1/27 | | 300 | 295,028 |
| Parker-Hannifin Corp., 3.25%, 3/1/27 | | 200 | 214,393 |
| Raytheon Technologies Corp., 4.50%, 6/1/42 | | 100 | 123,900 |
| Roper Technologies, Inc., 2.95%, 9/15/29 | | 250 | 258,844 |
| United Parcel Service, Inc., 6.20%, 1/15/38 | | 250 | 361,371 |
| | | | $ 4,615,910 |
| Technology — 2.4% | |
| Apple, Inc., 3.85%, 5/4/43 | $ | 1,100 | $ 1,298,286 |
| Broadcom, Inc.: | | | |
| 3.137%, 11/15/35(1) | | 500 | 503,517 |
| 3.419%, 4/15/33(1) | | 200 | 209,885 |
| Dell International, LLC / EMC Corp., 5.30%, 10/1/29 | | 250 | 293,337 |
| International Business Machines Corp., 3.625%, 2/12/24 | | 100 | 105,463 |
| Kyndryl Holdings, Inc., 2.70%, 10/15/28(1) | | 350 | 339,001 |
| NetApp, Inc., 3.25%, 12/15/22 | | 100 | 101,523 |
| Oracle Corp.: | | | |
| 2.65%, 7/15/26 | | 150 | 154,314 |
| 3.60%, 4/1/50 | | 400 | 392,411 |
| VMware, Inc., 2.20%, 8/15/31 | | 200 | 196,656 |
| | | | $ 3,594,393 |
| Utilities — 1.4% | |
| DTE Electric Co., 2.25%, 3/1/30 | $ | 300 | $ 301,110 |
| Duke Energy Corp., 3.15%, 8/15/27 | | 500 | 526,338 |
| PacifiCorp, 4.10%, 2/1/42 | | 100 | 114,810 |
| Public Service Electric & Gas Co., 3.95%, 5/1/42 | | 1,000 | 1,154,402 |
| | | | $ 2,096,660 |
Total Corporate Bonds
(identified cost $37,575,884) | | | $ 40,806,340 |
8
See Notes to Financial Statements.
Calvert
VP Investment Grade Bond Index Portfolio
December 31, 2021
Schedule of Investments — continued
| Sovereign Government Bonds — 0.7% |
| Security | Principal
Amount
(000's omitted) | Value |
| Mexico Government International Bond, 5.55%, 1/21/45 | $ | 500 | $ 600,005 |
| Province of Ontario Canada, 2.45%, 6/29/22 | | 400 | 404,215 |
| Province of Quebec Canada, 2.625%, 2/13/23 | | 75 | 76,768 |
Total Sovereign Government Bonds
(identified cost $972,557) | | | $ 1,080,988 |
| Taxable Municipal Obligations — 0.7% |
| Security | Principal
Amount
(000's omitted) | Value |
| General Obligations — 0.7% | |
| New York, NY, 3.60%, 8/1/28 | $ | 1,000 | $ 1,068,510 |
Total Taxable Municipal Obligations
(identified cost $993,256) | | | $ 1,068,510 |
| U.S. Government Agencies and Instrumentalities — 3.9% |
| Security | Principal
Amount
(000's omitted) | Value |
| Federal Home Loan Mortgage Corp.: | | | |
| 0.25%, 8/24/23 | $ | 1,000 | $ 993,670 |
| 6.75%, 3/15/31 | | 1,300 | 1,869,062 |
| Federal National Mortgage Association: | | | |
| 0.50%, 4/14/25 | | 1,000 | 982,840 |
| 0.75%, 10/8/27 | | 350 | 337,846 |
| 0.875%, 8/5/30 | | 1,500 | 1,414,671 |
| 2.125%, 4/24/26 | | 300 | 311,224 |
Total U.S. Government Agencies and Instrumentalities
(identified cost $5,738,746) | | | $ 5,909,313 |
| U.S. Government Agency Mortgage-Backed Securities — 26.0% |
| Security | Principal
Amount
(000's omitted) | Value |
| Federal Home Loan Mortgage Corp.: | | | |
| 2.00%, with various maturities to 2051 | $ | 6,080 | $ 6,100,922 |
| 2.50%, with various maturities to 2051 | | 2,973 | 3,058,087 |
| 3.00%, 1/1/43 | | 410 | 432,760 |
| 3.50%, with various maturities to 2048 | | 594 | 631,592 |
| 4.00%, with various maturities to 2048 | | 411 | 440,187 |
| 4.50%, with various maturities to 2044 | | 702 | 770,532 |
| 5.00%, with various maturities to 2040 | | 555 | 621,675 |
| Security | Principal
Amount
(000's omitted) | Value |
| Federal Home Loan Mortgage Corp.: (continued) | | | |
| 6.00%, with various maturities to 2040 | $ | 38 | $ 44,195 |
| 6.50%, 10/1/37 | | 13 | 15,236 |
| Federal National Mortgage Association: | | | |
| 1.50%, 9/1/35 | | 650 | 654,022 |
| 1.973%, (12 mo. USD LIBOR + 1.589%), 9/1/38(5) | | 80 | 83,170 |
| 2.00%, with various maturities to 2051 | | 5,441 | 5,488,928 |
| 2.50%, with various maturities to 2051 | | 4,156 | 4,271,840 |
| 3.00%, with various maturities to 2051 | | 4,545 | 4,779,544 |
| 3.50%, with various maturities to 2049 | | 3,046 | 3,260,606 |
| 4.00%, with various maturities to 2047 | | 1,560 | 1,686,082 |
| 4.50%, with various maturities to 2044 | | 1,183 | 1,296,624 |
| 5.00%, with various maturities to 2034 | | 67 | 74,072 |
| 5.50%, with various maturities to 2038 | | 245 | 276,298 |
| 6.00%, with various maturities to 2038 | | 250 | 288,788 |
| 6.50%, with various maturities to 2036 | | 43 | 48,050 |
| Government National Mortgage Association: | | | |
| 2.50%, with various maturities to 2051 | | 3,017 | 3,095,513 |
| 3.00%, 3/20/51 | | 471 | 487,410 |
| 4.00%, with various maturities to 2042 | | 696 | 750,452 |
| 4.50%, 7/20/33 | | 62 | 66,772 |
| 5.00%, with various maturities to 2039 | | 263 | 295,243 |
| 5.50%, 7/20/34 | | 35 | 38,553 |
| 6.00%, with various maturities to 2038 | | 174 | 200,709 |
Total U.S. Government Agency Mortgage-Backed Securities
(identified cost $38,882,923) | | $ 39,257,862 |
| U.S. Treasury Obligations — 37.7% |
| Security | Principal
Amount
(000's omitted) | Value |
| U.S. Treasury Bonds: | | | |
| 1.125%, 8/15/40 | $ | 500 | $ 436,719 |
| 1.375%, 8/15/50 | | 1,000 | 876,367 |
| 1.875%, 2/15/51 | | 1,150 | 1,138,230 |
| 2.00%, 8/15/51 | | 350 | 356,891 |
| 2.25%, 8/15/49 | | 650 | 695,932 |
| 2.50%, 2/15/45 | | 1,000 | 1,100,117 |
| 3.00%, 5/15/47 | | 1,000 | 1,214,141 |
| 3.125%, 11/15/41 | | 1,000 | 1,201,992 |
| 3.125%, 8/15/44 | | 1,600 | 1,943,562 |
| 3.125%, 5/15/48 | | 750 | 937,617 |
| 3.75%, 11/15/43 | | 1,045 | 1,382,380 |
| 3.875%, 8/15/40 | | 500 | 659,160 |
| 4.375%, 5/15/41 | | 700 | 986,316 |
| 6.25%, 8/15/23 | | 1,000 | 1,091,035 |
9
See Notes to Financial Statements.
Calvert
VP Investment Grade Bond Index Portfolio
December 31, 2021
Schedule of Investments — continued
| Security | Principal
Amount
(000's omitted) | Value |
| U.S. Treasury Notes: | | | |
| 0.125%, 2/28/23 | $ | 950 | $ 946,252 |
| 0.125%, 8/15/23 | | 1,500 | 1,487,930 |
| 0.375%, 4/30/25 | | 800 | 782,375 |
| 0.375%, 11/30/25 | | 2,000 | 1,939,766 |
| 0.375%, 1/31/26 | | 1,500 | 1,451,543 |
| 0.375%, 7/31/27 | | 300 | 285,012 |
| 0.50%, 8/31/27 | | 750 | 715,811 |
| 0.625%, 5/15/30 | | 300 | 280,570 |
| 0.625%, 8/15/30 | | 1,000 | 932,813 |
| 0.875%, 11/15/30 | | 250 | 237,744 |
| 1.125%, 2/29/28 | | 500 | 492,852 |
| 1.125%, 2/15/31 | | 1,100 | 1,067,816 |
| 1.25%, 4/30/28 | | 1,000 | 991,133 |
| 1.25%, 8/15/31 | | 1,300 | 1,271,359 |
| 1.50%, 2/15/30 | | 1,400 | 1,407,547 |
| 1.625%, 11/15/22 | | 2,500 | 2,526,867 |
| 1.625%, 9/30/26 | | 800 | 813,688 |
| 1.75%, 5/15/22 | | 1,600 | 1,609,404 |
| 1.875%, 7/31/22 | | 1,250 | 1,261,755 |
| 1.875%, 7/31/26 | | 1,500 | 1,542,715 |
| 2.00%, 2/15/22 | | 1,750 | 1,753,976 |
| 2.00%, 2/15/25 | | 1,500 | 1,545,234 |
| 2.125%, 9/30/24 | | 2,750 | 2,840,127 |
| 2.25%, 11/15/24 | | 2,000 | 2,073,672 |
| 2.25%, 3/31/26 | | 1,000 | 1,042,930 |
| 2.25%, 2/15/27 | | 2,100 | 2,200,324 |
| 2.25%, 11/15/27 | | 1,750 | 1,837,705 |
| 2.625%, 6/30/23 | | 600 | 618,234 |
| 2.625%, 2/15/29 | | 1,000 | 1,081,289 |
| 2.75%, 11/15/23 | | 1,300 | 1,349,258 |
| 2.75%, 2/15/24 | | 3,000 | 3,124,922 |
| 3.125%, 11/15/28 | | 1,150 | 1,278,521 |
Total U.S. Treasury Obligations
(identified cost $54,158,646) | | | $ 56,811,603 |
| Short-Term Investments — 1.2% | | | |
| Affiliated Fund — 1.0% |
| Description | Units | Value |
| Calvert Cash Reserves Fund, LLC, 0.06%(6) | | 1,429,356 | $ 1,429,356 |
Total Affiliated Fund
(identified cost $1,429,356) | | | $ 1,429,356 |
| Securities Lending Collateral — 0.2% |
| Security | Shares | Value |
| State Street Navigator Securities Lending Government Money Market Portfolio, 0.03%(7) | | 280,780 | $ 280,780 |
Total Securities Lending Collateral
(identified cost $280,780) | | | $ 280,780 |
Total Short-Term Investments
(identified cost $1,710,136) | | | $ 1,710,136 |
Total Investments — 99.7%
(identified cost $143,544,955) | | | $150,228,859 |
| Other Assets, Less Liabilities — 0.3% | | | $ 507,897 |
| Net Assets — 100.0% | | | $150,736,756 |
| The percentage shown for each investment category in the Schedule of Investments is based on net assets. |
| (1) | Security exempt from registration under Rule 144A of the Securities Act of 1933, as amended. These securities may be sold in certain transactions in reliance on an exemption from registration (normally to qualified institutional buyers). At December 31, 2021, the aggregate value of these securities is $2,496,841 or 1.7% of the Fund's net assets. |
| (2) | All or a portion of this security was on loan at December 31, 2021. The aggregate market value of securities on loan at December 31, 2021 was $272,230. |
| (3) | Security converts to variable rate after the indicated fixed-rate coupon period. |
| (4) | Represents an investment in an issuer that is deemed to be an affiliate effective March 1, 2021 (see Note 8). |
| (5) | Adjustable rate mortgage security whose interest rate generally adjusts monthly based on a weighted average of interest rates on the underlying mortgages. The coupon rate may not reflect the applicable index value as interest rates on the underlying mortgages may adjust on various dates and at various intervals and may be subject to lifetime ceilings and lifetime floors and lookback periods. Rate shown is the coupon rate at December 31, 2021. |
| (6) | Affiliated investment company, available to Calvert portfolios and funds, which invests in high quality, U.S. dollar denominated money market instruments. The rate shown is the annualized seven-day yield as of December 31, 2021. |
| (7) | Represents investment of cash collateral received in connection with securities lending. |
10
See Notes to Financial Statements.
Calvert
VP Investment Grade Bond Index Portfolio
December 31, 2021
Schedule of Investments — continued
| Abbreviations: |
| LIBOR | – London Interbank Offered Rate |
| Currency Abbreviations: |
| USD | – United States Dollar |
11
See Notes to Financial Statements.
Calvert
VP Investment Grade Bond Index Portfolio
December 31, 2021
Statement of Assets and Liabilities
| | December 31, 2021 |
| Assets | |
Investments in securities of unaffiliated issuers, at value (identified cost $141,463,698) - including
$272,230 of securities on loan | $ 148,110,479 |
| Investments in securities of affiliated issuers, at value (identified cost $2,081,257) | 2,118,380 |
| Receivable for capital shares sold | 71,894 |
| Interest receivable | 820,966 |
| Dividends and interest receivable - affiliated | 3,067 |
| Securities lending income receivable | 106 |
| Directors' deferred compensation plan | 34,936 |
| Total assets | $151,159,828 |
| Liabilities | |
| Payable for capital shares redeemed | $ 7,855 |
| Deposits for securities loaned | 280,780 |
| Payable to affiliates: | |
| Investment advisory fee | 25,638 |
| Administrative fee | 15,383 |
| Distribution and service fees | 1,142 |
| Sub-transfer agency fee | 91 |
| Directors' deferred compensation plan | 34,936 |
| Other | 5,139 |
| Accrued expenses | 52,108 |
| Total liabilities | $ 423,072 |
| Net Assets | $150,736,756 |
| Sources of Net Assets | |
| Paid-in capital | $ 142,380,632 |
| Distributable earnings | 8,356,124 |
| Net Assets | $150,736,756 |
| Class I Shares | |
| Net Assets | $ 145,323,479 |
| Shares Outstanding | 2,611,909 |
Net Asset Value, Offering Price and Redemption Price Per Share
(net assets ÷ shares of beneficial interest outstanding) | $ 55.64 |
| Class F Shares | |
| Net Assets | $ 5,413,277 |
| Shares Outstanding | 99,120 |
Net Asset Value, Offering Price and Redemption Price Per Share
(net assets ÷ shares of beneficial interest outstanding) | $ 54.61 |
12
See Notes to Financial Statements.
Calvert
VP Investment Grade Bond Index Portfolio
December 31, 2021
| | Year Ended |
| | December 31, 2021 |
| Investment Income | |
| Dividend income - affiliated issuers | $ 1,075 |
| Interest income | 3,454,788 |
| Interest income - affiliated issuers | 22,985 |
| Securities lending income, net | 1,743 |
| Total investment income | $ 3,480,591 |
| Expenses | |
| Investment advisory fee | $ 299,547 |
| Administrative fee | 179,728 |
| Distribution and service fees: | |
| Class F | 11,618 |
| Directors' fees and expenses | 6,041 |
| Custodian fees | 7,402 |
| Transfer agency fees and expenses | 118,625 |
| Accounting fees | 33,771 |
| Professional fees | 31,252 |
| Reports to shareholders | 38 |
| Miscellaneous | 14,132 |
| Total expenses | $ 702,154 |
| Waiver and/or reimbursement of expenses by affiliate | $ (210,919) |
| Net expenses | $ 491,235 |
| Net investment income | $ 2,989,356 |
| Realized and Unrealized Gain (Loss) | |
| Net realized gain (loss): | |
| Investment securities | $ 392,698 |
| Investment securities - affiliated issuers | (99) |
| Net realized gain | $ 392,599 |
| Change in unrealized appreciation (depreciation): | |
| Investment securities | $ (6,040,434) |
| Investment securities - affiliated issuers | (24,162) |
| Net change in unrealized appreciation (depreciation) | $(6,064,596) |
| Net realized and unrealized loss | $(5,671,997) |
| Net decrease in net assets from operations | $(2,682,641) |
13
See Notes to Financial Statements.
Calvert
VP Investment Grade Bond Index Portfolio
December 31, 2021
Statements of Changes in Net Assets
| | Year Ended December 31, |
| | 2021 | 2020 |
| Increase (Decrease) in Net Assets | | |
| From operations: | | |
| Net investment income | $ 2,989,356 | $ 3,255,782 |
| Net realized gain | 392,599 | 824,160 |
| Net change in unrealized appreciation (depreciation) | (6,064,596) | 5,885,476 |
| Net increase (decrease) in net assets from operations | $ (2,682,641) | $ 9,965,418 |
| Distributions to shareholders: | | |
| Class I | $ (3,494,727) | $ (3,948,859) |
| Class F | (125,002) | (83,363) |
| Total distributions to shareholders | $ (3,619,729) | $ (4,032,222) |
| Capital share transactions: | | |
| Class I | $ 7,347,013 | $ (1,964,583) |
| Class F | 1,653,286 | 2,636,560 |
| Net increase in net assets from capital share transactions | $ 9,000,299 | $ 671,977 |
| Net increase in net assets | $ 2,697,929 | $ 6,605,173 |
| Net Assets | | |
| At beginning of year | $ 148,038,827 | $ 141,433,654 |
| At end of year | $150,736,756 | $148,038,827 |
14
See Notes to Financial Statements.
Calvert
VP Investment Grade Bond Index Portfolio
December 31, 2021
| | Class I |
| | Year Ended December 31, |
| | 2021 | 2020 | 2019 | 2018 | 2017 |
| Net asset value — Beginning of year | $ 58.07 | $ 55.68 | $ 53.01 | $ 54.93 | $ 54.60 |
| Income (Loss) From Operations | | | | | |
| Net investment income(1) | $ 1.14 | $ 1.34 | $ 1.50 | $ 1.50 | $ 1.44 |
| Net realized and unrealized gain (loss) | (2.20) | 2.74 | 2.96 | (1.73) | 0.46 |
| Total income (loss) from operations | $ (1.06) | $ 4.08 | $ 4.46 | $ (0.23) | $ 1.90 |
| Less Distributions | | | | | |
| From net investment income | $ (1.37) | $ (1.69) | $ (1.79) | $ (1.69) | $ (1.57) |
| Total distributions | $ (1.37) | $ (1.69) | $ (1.79) | $ (1.69) | $ (1.57) |
| Net asset value — End of year | $ 55.64 | $ 58.07 | $ 55.68 | $ 53.01 | $ 54.93 |
| Total Return(2) | (1.82)% | 7.34% | 8.41% | (0.37)% | 3.49% |
| Ratios/Supplemental Data | | | | | |
| Net assets, end of year (000’s omitted) | $145,323 | $144,073 | $140,169 | $139,729 | $166,650 |
| Ratios (as a percentage of average daily net assets):(3) | | | | | |
| Total expenses | 0.46% | 0.47% | 0.43% | 0.44% | 0.45% |
| Net expenses | 0.32% | 0.32% | 0.32% | 0.32% | 0.32% |
| Net investment income | 2.00% | 2.30% | 2.71% | 2.81% | 2.60% |
| Portfolio Turnover | 15% | 23% | 10% | 7% | 14% |
| (1) | Computed using average shares outstanding. |
| (2) | Returns are historical and are calculated by determining the percentage change in net asset value with all distributions reinvested and do not reflect fees and expenses imposed by variable annuity contracts or variable life insurance policies. If included, total return would be lower. |
| (3) | Total expenses do not reflect amounts reimbursed and/or waived by the adviser and certain of its affiliates, if applicable. Net expenses are net of all reductions and represent the net expenses paid by the Fund. |
15
See Notes to Financial Statements.
Calvert
VP Investment Grade Bond Index Portfolio
December 31, 2021
Financial Highlights — continued
| | Class F |
| | Year Ended December 31, |
| | 2021 | 2020 | 2019 | 2018 | 2017 |
| Net asset value — Beginning of year | $ 57.17 | $ 54.97 | $ 52.48 | $ 54.53 | $ 54.36 |
| Income (Loss) From Operations | | | | | |
| Net investment income(1) | $ 0.98 | $ 1.15 | $ 1.33 | $ 1.36 | $ 1.30 |
| Net realized and unrealized gain (loss) | (2.17) | 2.74 | 2.95 | (1.72) | 0.44 |
| Total income (loss) from operations | $ (1.19) | $ 3.89 | $ 4.28 | $ (0.36) | $ 1.74 |
| Less Distributions | | | | | |
| From net investment income | $ (1.37) | $ (1.69) | $ (1.79) | $ (1.69) | $ (1.57) |
| Total distributions | $ (1.37) | $ (1.69) | $ (1.79) | $ (1.69) | $ (1.57) |
| Net asset value — End of year | $54.61 | $57.17 | $54.97 | $52.48 | $54.53 |
| Total Return(2) | (2.08)% | 7.09% | 8.15% | (0.61)% | 3.21% |
| Ratios/Supplemental Data | | | | | |
| Net assets, end of year (000’s omitted) | $ 5,413 | $ 3,966 | $ 1,265 | $ 461 | $ 495 |
| Ratios (as a percentage of average daily net assets):(3) | | | | | |
| Total expenses | 0.71% | 0.72% | 0.68% | 0.69% | 1.21% |
| Net expenses | 0.57% | 0.57% | 0.57% | 0.57% | 0.57% |
| Net investment income | 1.75% | 2.00% | 2.42% | 2.57% | 2.37% |
| Portfolio Turnover | 15% | 23% | 10% | 7% | 14% |
| (1) | Computed using average shares outstanding. |
| (2) | Returns are historical and are calculated by determining the percentage change in net asset value with all distributions reinvested and do not reflect fees and expenses imposed by variable annuity contracts or variable life insurance policies. If included, total return would be lower. |
| (3) | Total expenses do not reflect amounts reimbursed and/or waived by the adviser and certain of its affiliates, if applicable. Net expenses are net of all reductions and represent the net expenses paid by the Fund. |
16
See Notes to Financial Statements.
Calvert
VP Investment Grade Bond Index Portfolio
December 31, 2021
Notes to Financial Statements
1 Significant Accounting Policies
Calvert VP Investment Grade Bond Index Portfolio (the Fund) is a diversified series of Calvert Variable Products, Inc. (the Corporation). The Corporation is a Maryland corporation registered under the Investment Company Act of 1940, as amended (the 1940 Act), as an open-end management investment company. The investment objective of the Fund is to seek investment results that correspond to the total return performance of the bond market, as represented by the Bloomberg Barclays U.S. Aggregate Bond Index.
Shares of the Fund are sold without sales charge to insurance companies for allocation to certain of their variable separate accounts and to qualified pension and retirement plans and other eligible investors. The Fund offers Class I and Class F shares. Among other things, each class has different: (a) dividend rates due to differences in Distribution Plan expenses and other class-specific expenses; (b) exchange privileges; and (c) class-specific voting rights.
The Fund applies the accounting and reporting guidance in the Financial Accounting Standards Board (FASB) Accounting Standards Codification Topic 946, Financial Services – Investment Companies (ASC 946). Subsequent events, if any, through the date that the financial statements were issued have been evaluated in the preparation of the financial statements.
A Investment Valuation— Net asset value per share is determined every business day as of the close of the regular session of the New York Stock Exchange (generally 4:00 p.m. Eastern time). The Fund uses independent pricing services approved by the Board of Directors (the Board) to value its investments wherever possible. Investments for which market quotations are not available or deemed not reliable are fair valued in good faith under the direction of the Board.
U.S. generally accepted accounting principles (U.S. GAAP) establishes a disclosure hierarchy that categorizes the inputs to valuation techniques used to value assets and liabilities at measurement date. These inputs are summarized in the three broad levels listed below:
Level 1 - quoted prices in active markets for identical securities
Level 2 - other significant observable inputs (including quoted prices for similar securities, interest rates, prepayment speeds, credit risk, etc.)
Level 3 - significant unobservable inputs (including the Fund’s own assumptions in determining the fair value of investments)
The inputs or methodologies used for valuing securities are not necessarily an indication of the risk associated with investing in those securities.
Valuation techniques used to value the Fund’s investments by major category are as follows:
Debt Securities. Debt securities are generally valued based on valuations provided by third party pricing services, as derived from such services’ pricing models. Inputs to the models may include, but are not limited to, reported trades, executable bid and ask prices, broker/dealer quotations, prices or yields of securities with similar characteristics, interest rates, anticipated prepayments, benchmark curves or information pertaining to the issuer, as well as industry and economic events. Accordingly, debt securities are generally categorized as Level 2 in the hierarchy. Short-term debt securities with a remaining maturity at time of purchase of more than sixty days are valued based on valuations provided by a third party pricing service. Such securities are generally categorized as Level 2 in the hierarchy. Short-term debt securities of sufficient credit quality purchased with remaining maturities of sixty days or less for which a valuation from a third party pricing service is not readily available may be valued at amortized cost, which approximates fair value, and are categorized as Level 2 in the hierarchy.
Affiliated Fund. The Fund may invest in Calvert Cash Reserves Fund, LLC (Cash Reserves Fund), an affiliated investment company managed by Calvert Research and Management (CRM). While Cash Reserves Fund is not a registered money market mutual fund, it conducts all of its investment activities in accordance with the requirements of Rule 2a-7 under the 1940 Act. Investments in Cash Reserves Fund are valued at the closing net asset value per unit on the valuation day and are categorized as Level 2 in the hierarchy. Cash Reserves Fund generally values its investment securities based on available market quotations provided by a third party pricing service.
Other Securities. Investments in registered investment companies (including money market funds) that do not trade on an exchange are valued at the net asset value per share on the valuation day and are categorized as Level 1 in the hierarchy.
Fair Valuation. If a market value cannot be determined for a security using the methodologies described above, or if, in the good faith opinion of the Fund's adviser, the market value does not constitute a readily available market quotation, or if a significant event has occurred that would materially affect the value of the security, the security will be fair valued as determined in good faith by or at the direction of the Board in a manner that most fairly reflects the security’s “fair value”, which is the amount that the Fund might reasonably expect to receive for the security upon its current sale in the ordinary course. Each such determination is based on a consideration of relevant factors, which are likely to vary from one pricing context to another. These factors may include, but are not limited to, the type of security, the existence of any contractual restrictions on the security’s disposition, the price and extent of public trading in similar securities of the issuer or of comparable companies or entities, quotations or relevant information obtained from broker/dealers or other market participants, information obtained from the issuer, analysts, and/or the appropriate stock exchange (for exchange-traded securities), an analysis of the company’s or entity’s financial statements, and an evaluation of the forces that influence the issuer and the market(s) in which the security is purchased and sold.
Calvert
VP Investment Grade Bond Index Portfolio
December 31, 2021
Notes to Financial Statements — continued
The values assigned to fair value investments are based on available information and do not necessarily represent amounts that might ultimately be realized. Further, due to the inherent uncertainty of valuations of such investments, the fair values may differ significantly from the values that would have been used had an active market existed, and the differences could be material.
The following table summarizes the market value of the Fund's holdings as of December 31, 2021, based on the inputs used to value them:
| Asset Description | Level 1 | Level 2 | Level 3 | Total |
| Asset-Backed Securities | $ — | $ 502,183 | $ — | $ 502,183 |
| Commercial Mortgage-Backed Securities | — | 3,081,924 | — | 3,081,924 |
| Corporate Bonds | — | 40,806,340 | — | 40,806,340 |
| Sovereign Government Bonds | — | 1,080,988 | — | 1,080,988 |
| Taxable Municipal Obligations | — | 1,068,510 | — | 1,068,510 |
| U.S. Government Agencies and Instrumentalities | — | 5,909,313 | — | 5,909,313 |
| U.S. Government Agency Mortgage-Backed Securities | — | 39,257,862 | — | 39,257,862 |
| U.S. Treasury Obligations | — | 56,811,603 | — | 56,811,603 |
| Short-Term Investments: | | | | |
| Affiliated Fund | — | 1,429,356 | — | 1,429,356 |
| Securities Lending Collateral | 280,780 | — | — | 280,780 |
| Total Investments | $280,780 | $149,948,079 | $ — | $150,228,859 |
B Investment Transactions and Income— Investment transactions for financial statement purposes are accounted for on trade date. Realized gains and losses are recorded on an identified cost basis and may include proceeds from litigation. Dividend income is recorded on the ex-dividend date for dividends received in cash and/or securities. Interest income, which includes amortization of premium and accretion of discount on debt securities, is accrued as earned.
C Share Class Accounting— Realized and unrealized gains and losses and net investment income and losses, other than class-specific expenses, are allocated daily to each class of shares based upon the relative net assets of each class to the total net assets of the Fund. Expenses arising in connection with a specific class are charged directly to that class.
D Distributions to Shareholders— Distributions to shareholders are recorded by the Fund on ex-dividend date. The Fund distributes any net investment income and net realized capital gains at least annually. Both types of distributions are made in shares of the Fund unless an election is made on behalf of a separate account to receive some or all of the distributions in cash. Distributions are declared separately for each class of shares. Distributions are determined in accordance with income tax regulations, which may differ from U.S. GAAP; accordingly, periodic reclassifications are made within the Fund's capital accounts to reflect income and gains available for distribution under income tax regulations.
E Estimates— The preparation of financial statements in conformity with U.S. GAAP requires management to make estimates and assumptions that affect the reported amounts of assets and liabilities and disclosure of contingent assets and liabilities at the date of the financial statements and the reported amounts of increases and decreases in net assets from operations during the reporting period. Actual results could differ from those estimates.
F Indemnifications— The Corporation’s By-Laws provide for indemnification for Directors or officers of the Corporation and certain other parties, to the fullest extent permitted by Maryland law and the 1940 Act, provided certain conditions are met. Additionally, in the normal course of business, the Fund enters into agreements with service providers that may contain indemnification clauses. The Fund’s maximum exposure under these arrangements is unknown as this would involve future claims that may be made against the Fund that have not yet occurred.
G Federal Income Taxes— No provision for federal income or excise tax is required since the Fund intends to continue to qualify as a regulated investment company under the Internal Revenue Code and to distribute substantially all of its taxable earnings.
Management has analyzed the Fund's tax positions taken for all open federal income tax years and has concluded that no provision for federal income tax is required in the Fund's financial statements. A Fund's federal tax return is subject to examination by the Internal Revenue Service for a period of three years from the date of filing.
Calvert
VP Investment Grade Bond Index Portfolio
December 31, 2021
Notes to Financial Statements — continued
2 Related Party Transactions
The investment advisory fee is earned by CRM as compensation for investment advisory services rendered to the Fund. On March 1, 2021, Morgan Stanley acquired Eaton Vance Corp. (the “Transaction”) and CRM became an indirect, wholly-owned subsidiary of Morgan Stanley. In connection with the Transaction, the Fund entered into a new investment advisory agreement (the “New Agreement”) with CRM, which took effect on March 1, 2021. Pursuant to the New Agreement (and the Fund’s investment advisory agreement with CRM in effect prior to March 1, 2021), the fee is computed at the annual rate of 0.20% of the Fund’s average daily net assets and is payable monthly. For the year ended December 31, 2021, the investment advisory fee amounted to $299,547. The Fund may invest its cash in Cash Reserves Fund. CRM does not currently receive a fee for advisory services provided to Cash Reserves Fund.
Pursuant to an investment sub-advisory agreement, CRM has delegated the investment management of the Fund to Ameritas Investment Partners, Inc. (AIP). In connection with the Transaction, CRM entered into a new sub-advisory agreement with AIP, which took effect on March 1, 2021. CRM pays AIP a portion of its investment advisory fee for sub-advisory services provided to the Fund.
CRM has agreed to reimburse the Fund’s operating expenses to the extent that total annual operating expenses (relating to ordinary operating expenses only and excluding expenses such as brokerage commissions, acquired fund fees and expenses of unaffiliated funds, borrowing costs, taxes or litigation expenses) exceed 0.32% for Class I and 0.57% for Class F of such class’s average daily net assets. The expense reimbursement agreement with CRM may be changed or terminated after April 30, 2022. For the year ended December 31, 2021, CRM waived or reimbursed expenses of $210,919.
The administrative fee is earned by CRM as compensation for administrative services rendered to the Fund. The fee is computed at an annual rate of 0.12% of the Fund’s average daily net assets attributable to Class I and Class F and is payable monthly. For the year ended December 31, 2021, CRM was paid administrative fees of $179,728.
The Fund has in effect a distribution plan for Class F shares (Class F Plan) pursuant to Rule 12b-1 under the 1940 Act. Pursuant to the Class F Plan, the Fund pays Eaton Vance Distributors, Inc. (EVD), an affiliate of CRM and the Fund’s principal underwriter, a distribution and service fee of 0.25% per annum of its average daily net assets attributable to Class F shares for distribution services and facilities provided to the Fund, as well as for personal and/or account maintenance services provided to the class shareholders. Distribution and service fees paid or accrued for the year ended December 31, 2021 amounted to $11,618 for Class F shares.
Eaton Vance Management (EVM), an affiliate of CRM, provides sub-transfer agency and related services to the Fund pursuant to a Sub-Transfer Agency Support Services Agreement. For the year ended December 31, 2021, sub-transfer agency fees and expenses incurred to EVM amounted to $405 and are included in transfer agency fees and expenses on the Statement of Operations.
Each Director of the Fund who is not an employee of CRM or its affiliates receives an annual fee of $154,000 ($214,000 effective January 1, 2022), plus an annual Committee fee ranging from $8,500 to $16,500 depending on the Committee. The Board chair receives an additional $30,000 annual fee, Committee chairs receive an additional $6,000 annual fee and the special equities liaison receives an additional $2,500 annual fee. Eligible Directors may participate in a Deferred Compensation Plan (the Plan). Amounts deferred under the Plan are treated as though equal dollar amounts had been invested in shares of the Fund or other Calvert funds selected by the Directors. The Fund purchases shares of the funds selected equal to the dollar amounts deferred under the Plan, resulting in an asset equal to the deferred compensation liability. Obligations of the Plan are paid solely from the Fund's assets. Directors’ fees are allocated to each of the Calvert funds served. Salaries and fees of officers and Directors of the Fund who are employees of CRM or its affiliates are paid by CRM.
3 Shareholder Servicing Plan
The Corporation, on behalf of the Fund, has adopted a Shareholder Servicing Plan (Servicing Plan), which permits the Fund to enter into shareholder servicing agreements with intermediaries that maintain accounts in the Fund for the benefit of shareholders. These services may include, but are not limited to, processing purchase and redemption requests, processing dividend payments, and providing account information to shareholders. Under the Servicing Plan, the Fund may make payments at an annual rate of up to 0.11% of its average daily net assets. For the year ended December 31, 2021, expenses incurred under the Servicing Plan amounted to $117,815, of which $92,488 were payable to an affiliate of AIP, and are included in transfer agency fees and expenses on the Statement of Operations. Included in accrued expenses at December 31, 2021 are amounts payable to an affiliate of AIP under the Servicing Plan of $7,575.
4 Investment Activity
During the year ended December 31, 2021, the cost of purchases and proceeds from sales of investments, other than U.S. government and agency securities and short-term securities and including maturities and paydowns, were $5,045,922 and $5,515,185, respectively. Purchases and sales of U.S. government and agency securities, including paydowns, were $26,059,632 and $16,825,383, respectively.
Calvert
VP Investment Grade Bond Index Portfolio
December 31, 2021
Notes to Financial Statements — continued
5 Distributions to Shareholders and Income Tax Information
The tax character of distributions declared for the years ended December 31, 2021 and December 31, 2020 was as follows:
| | Year Ended December 31, |
| | 2021 | 2020 |
| Ordinary income | $3,619,729 | $4,032,222 |
As of December 31, 2021, the components of distributable earnings (accumulated loss) on a tax basis were as follows:
| Undistributed ordinary income | $ 3,352,804 |
| Deferred capital losses | (1,376,645) |
| Net unrealized appreciation | 6,379,965 |
| Distributable earnings | $ 8,356,124 |
At December 31, 2021, the Fund, for federal income tax purposes, had deferred capital losses of $1,376,645 which would reduce the Fund’s taxable income arising from future net realized gains on investment transactions, if any, to the extent permitted by the Internal Revenue Code, and thus would reduce the amount of distributions to shareholders, which would otherwise be necessary to relieve the Fund of any liability for federal income or excise tax. The deferred capital losses are treated as arising on the first day of the Fund's next taxable year, can be carried forward for an unlimited period, and retain the same short-term or long-term character as when originally deferred. Of the deferred capital losses at December 31, 2021, $725,474 are short-term and $651,171 are long-term.
The cost and unrealized appreciation (depreciation) of investments of the Fund at December 31, 2021, as determined on a federal income tax basis, were as follows:
| Aggregate cost | $143,848,894 |
| Gross unrealized appreciation | $ 7,373,121 |
| Gross unrealized depreciation | (993,156) |
| Net unrealized appreciation | $ 6,379,965 |
6 Securities Lending
To generate additional income, the Fund may lend its securities pursuant to a securities lending agency agreement with State Street Bank and Trust Company (SSBT), the securities lending agent. Security loans are subject to termination by the Fund at any time and, therefore, are not considered illiquid investments. The Fund requires that the loan be continuously collateralized by either cash or securities in an amount at least equal to the market value of the securities on loan. The market value of securities loaned is determined daily and any additional required collateral is delivered to the Fund on the next business day. Cash collateral is generally invested in a money market fund registered under the 1940 Act that is managed by an affiliate of SSBT. Any gain or loss in the market price of the loaned securities that might occur and any interest earned or dividends declared during the term of the loan would accrue to the account of the Fund. Income earned on the investment of collateral, net of broker rebates and other expenses incurred by the securities lending agent, is split between the Fund and the securities lending agent based on agreed upon contractual terms. Non-cash collateral, if any, is held by the lending agent on behalf of the Fund and cannot be sold or re-pledged by the Fund; accordingly, such collateral is not reflected in the Statement of Assets and Liabilities.
The risks associated with lending portfolio securities include, but are not limited to, possible delays in receiving additional collateral or in the recovery of the loaned securities, possible loss of rights to the collateral should the borrower fail financially, as well as risk of loss in the value of the collateral or the value of the investments made with the collateral. The securities lending agent shall indemnify the Fund in the case of default of any securities borrower.
At December 31, 2021, the total value of securities on loan, including accrued interest, was $275,241 and the total value of collateral received was $280,780, comprised of cash.
The following table provides a breakdown of securities lending transactions accounted for as secured borrowings, the obligations by class of collateral pledged, and the remaining contractual maturity of those transactions as of December 31, 2021.
Calvert
VP Investment Grade Bond Index Portfolio
December 31, 2021
Notes to Financial Statements — continued
| | Remaining Contractual Maturity of the Transactions |
| | Overnight and
Continuous | <30 days | 30 to 90 days | >90 days | Total |
| Corporate Bonds | $280,780 | $ — | $ — | $ — | $280,780 |
The carrying amount of the liability for deposits for securities loaned at December 31, 2021 approximated its fair value. If measured at fair value, such liability would have been considered as Level 2 in the fair value hierarchy (see Note 1A) at December 31, 2021.
7 Line of Credit
The Fund participates with other portfolios and funds managed by EVM and its affiliates, including CRM, in an $800 million unsecured line of credit with a group of banks, which is in effect through October 25, 2022. Borrowings are made by the Fund solely for temporary purposes related to redemptions and other short-term cash needs. Interest is charged to the Fund based on its borrowings at an amount above either the Secured Overnight Financing Rate (SOFR) or Federal Funds rate. In addition, a fee computed at an annual rate of 0.15% on the daily unused portion of the line of credit is allocated among the participating portfolios and funds at the end of each quarter. In connection with the renewal of the agreement in October 2021, an arrangement fee of $150,000 was incurred that was allocated to the participating portfolios and funds. Because the line of credit is not available exclusively to the Fund, it may be unable to borrow some or all of its requested amounts at any particular time.
The Fund had no borrowings pursuant to its line of credit during the year ended December 31, 2021.
8 Affiliated Issuers and Funds
At December 31, 2021, the value of the Fund’s investment in affiliated issuers and funds was $2,118,380, which represents 1.4% of the Fund’s net assets. Transactions in affiliated issuers and funds by the Fund for the year ended December 31, 2021 were as follows:
| Name | Value,
beginning
of period | Purchases | Sales
proceeds | Net
realized
gain
(loss) | Change in
unrealized
appreciation
(depreciation) | Value,
end of
period | Interest/
Dividend
income | Principal
amount/Units,
end of period |
| Corporate Bonds | | | | | | | | |
| Morgan Stanley: | | | | | | | | |
| 4.10%, 5/22/23(1) | $ — | $ — | $ — | $ — | $ (17,320) | $ 520,950 | $ 17,110 | $ 500,000 |
| 5.00%, 11/24/25(1) | — | — | — | — | (6,842) | 168,074 | 5,875 | 150,000 |
| Short-Term Investments | | | | | | |
| Calvert Cash Reserves Fund, LLC | 1,886,432 | 31,446,297 | (31,903,274) | (99) | — | 1,429,356 | 1,075 | 1,429,356 |
| Totals | | | | $ (99) | $(24,162) | $2,118,380 | $24,060 | |
| (1) | Affiliated issuer as of March 1, 2021 (see Note 2). |
9 Capital Shares
The Corporation may issue its shares in one or more series (such as the Fund). The authorized shares of the Fund consist of 20,000,000 common shares, $0.10 par value, for each Class.
Calvert
VP Investment Grade Bond Index Portfolio
December 31, 2021
Notes to Financial Statements — continued
Transactions in capital shares for the years ended December 31, 2021 and December 31, 2020 were as follows:
| | Year Ended
December 31, 2021 | | Year Ended
December 31, 2020 |
| | Shares | Amount | | Shares | Amount |
| Class I | | | | | |
| Shares sold | 315,318 | $ 17,883,244 | | 408,172 | $ 23,805,010 |
| Reinvestment of distributions | 62,765 | 3,494,727 | | 68,450 | 3,948,859 |
| Shares redeemed | (246,990) | (14,030,958) | | (513,240) | (29,718,452) |
| Net increase (decrease) | 131,093 | $ 7,347,013 | | (36,618) | $ (1,964,583) |
| Class F | | | | | |
| Shares sold | 35,869 | $ 2,000,582 | | 51,993 | $ 2,958,722 |
| Reinvestment of distributions | 2,286 | 125,002 | | 1,467 | 83,363 |
| Shares redeemed | (8,397) | (472,298) | | (7,104) | (405,525) |
| Net increase | 29,758 | $ 1,653,286 | | 46,356 | $ 2,636,560 |
At December 31, 2021, separate accounts of an insurance company that is an affiliate of AIP owned 83.5% of the value of the outstanding shares of the Fund.
10 Risks and Uncertainties
Pandemic Risk
An outbreak of respiratory disease caused by a novel coronavirus was first detected in China in late 2019 and subsequently spread internationally. This coronavirus has resulted in closing borders, enhanced health screenings, changes to healthcare service preparation and delivery, quarantines, cancellations, disruptions to supply chains and customer activity, as well as general concern and uncertainty. Health crises caused by outbreaks, such as the coronavirus outbreak, may exacerbate other pre-existing political, social and economic risks and disrupt normal market conditions and operations. The impact of this outbreak has negatively affected the worldwide economy, the economies of individual countries, individual companies, and the market in general, and may continue to do so in significant and unforeseen ways, as may other epidemics and pandemics that may arise in the future. Any such impact could adversely affect the Fund's performance, or the performance of the securities in which the Fund invests.
11 Change in Independent Registered Public Accounting Firm
On July 30, 2021, KPMG LLP (“KPMG”) informed the Audit Committee and Board of the Corporation that it was resigning as the independent registered public accounting firm to the Corporation, as upon Morgan Stanley’s acquisition of Eaton Vance Corp., the parent company of CRM (the investment adviser to each series of the Corporation), KPMG would no longer be independent of the Corporation. The Audit Committee of the Board and the Board approved the selection of Deloitte & Touche LLP (“Deloitte”) as the independent registered public accounting firm for the funds that are series of the Corporation (the “Funds”) for the fiscal year ending December 31, 2021 to be effective upon KPMG’s resignation and Deloitte’s acceptance of the engagement which became effective July 30, 2021.
KPMG’s reports on the financial statements for the Funds for the fiscal periods ended December 31, 2019 and December 31, 2020 contained no adverse opinion or disclaimer of opinion nor were they qualified or modified as to uncertainty, audit scope or accounting principles. During the fiscal periods ended December 31, 2019 and December 31, 2020, and during the subsequent interim period through July 30, 2021: (i) there were no disagreements with KPMG on any matter of accounting principles or practices, financial statement disclosure or auditing scope or procedure, which disagreements, if not resolved to the satisfaction of KPMG, would have caused KPMG to make reference to the subject matter of the disagreements in connection with its reports on the Funds’ financial statements for such periods; and (ii) there were no “reportable events” of the kind described in Item 304(a)(1)(v) of Regulation S-K under the Securities Exchange Act of 1934, as amended.
During the fiscal periods ended December 31, 2019 and December 31, 2020, and during the subsequent interim period through July 30, 2021: neither the Funds, nor anyone on their behalf, consulted with Deloitte on items which: (i) concerned the application of accounting principles to a specified transaction, either completed or proposed, or the type of audit opinion that might be rendered on the Funds’ financial statements; or (ii) concerned the subject of a disagreement (as defined in paragraph (a)(1)(iv) of Item 304 of Regulation S-K) or reportable events (as described in paragraph (a)(1)(v) of Item 304).
Calvert
VP Investment Grade Bond Index Portfolio
December 31, 2021
Report of Independent Registered Public Accounting Firm
To the Board of Directors of Calvert Variable Products, Inc. and Shareholders of Calvert VP Investment Grade Bond Index Portfolio:
Opinion on the Financial Statements and Financial Highlights
We have audited the accompanying statement of assets and liabilities of Calvert VP Investment Grade Bond Index Portfolio (the "Fund") (one of the funds constituting Calvert Variable Products, Inc.), including the schedule of investments, as of December 31, 2021, the related statements of operations, changes in net assets, and the financial highlights for the year then ended, and the related notes. In our opinion, the financial statements and financial highlights present fairly, in all material respects, the financial position of the Fund as of December 31, 2021, and the results of its operations, changes in its net assets, and the financial highlights for the year then ended in conformity with accounting principles generally accepted in the United States of America. The statement of changes in net assets for the year ended December 31, 2020, and the financial highlights for the years ended December 31, 2020, 2019, 2018, and 2017 were audited by other auditors whose report, dated February 18, 2021, expressed an unqualified opinion on that financial statement and those financial highlights.
Basis for Opinion
These financial statements and financial highlights are the responsibility of the Fund's management. Our responsibility is to express an opinion on the Fund's financial statements and financial highlights based on our audit. We are a public accounting firm registered with the Public Company Accounting Oversight Board (United States) (PCAOB) and are required to be independent with respect to the Fund in accordance with the U.S. federal securities laws and the applicable rules and regulations of the Securities and Exchange Commission and the PCAOB.
We conducted our audit in accordance with the standards of the PCAOB. Those standards require that we plan and perform the audit to obtain reasonable assurance about whether the financial statements and financial highlights are free of material misstatement, whether due to error or fraud. The Fund is not required to have, nor were we engaged to perform, an audit of its internal control over financial reporting. As part of our audit, we are required to obtain an understanding of internal control over financial reporting but not for the purpose of expressing an opinion on the effectiveness of the Fund’s internal control over financial reporting. Accordingly, we express no such opinion.
Our audit included performing procedures to assess the risks of material misstatement of the financial statements and financial highlights, whether due to error or fraud, and performing procedures that respond to those risks. Such procedures included examining, on a test basis, evidence regarding the amounts and disclosures in the financial statements and financial highlights. Our audit also included evaluating the accounting principles used and significant estimates made by management, as well as evaluating the overall presentation of the financial statements and financial highlights. Our procedures included confirmation of securities owned as of December 31, 2021, by correspondence with the custodian and brokers; when replies were not received from brokers, we performed other auditing procedures. We believe that our audit provides a reasonable basis for our opinion.
/s/ Deloitte & Touche LLP
Boston, Massachusetts
February 18, 2022
We have served as the auditor of one or more Calvert investment companies since 2021.
Calvert
VP Investment Grade Bond Index Portfolio
December 31, 2021
Federal Tax Information (Unaudited)
As required by the Internal Revenue Code and/or regulations, shareholders must be notified regarding the status of 163(j) interest dividends.
163(j) Interest Dividends. For the fiscal year ended December 31, 2021, the Fund designates 92.59% of distributions from net investment income as a 163(j) interest dividend.
Calvert
VP Investment Grade Bond Index Portfolio
December 31, 2021
Management and Organization
Fund Management. The Directors of Calvert Variable Products, Inc. (the Corporation) are responsible for the overall management and supervision of the affairs of the Corporation. The Board members and officers of the Corporation are listed below. Except as indicated, each individual has held the office shown or other offices in the same company for the last five years. Board members hold indefinite terms of office. Each Board member holds office until his or her successor is elected and qualified, or until his or her earlier death, resignation, retirement, removal or disqualification. Under the terms of the Fund’s current Board member retirement policy, an Independent Board member must retire at the end of the calendar year in which he or she turns 75. However, if such retirement would cause the Fund to be out of compliance with Section 16 of the 1940 Act or any other regulations or guidance of the SEC, then such retirement will not become effective until such time as action has been taken for the Fund to be in compliance therewith. The “noninterested Directors” consist of those Directors who are not “interested persons” of the Corporation, as that term is defined under the 1940 Act. The business address of each Board member and the Chief Compliance Officer is 1825 Connecticut Avenue, NW, Suite 400, Washington, DC 20009 and the business address of the Secretary, Vice President and Chief Legal Officer and the Treasurer is Two International Place, Boston, Massachusetts 02110. As used below, “CRM” refers to Calvert Research and Management and “Eaton Vance” refers to Eaton Vance Management. Each Director oversees 39 funds in the Calvert fund complex. Effective March 1, 2021, each of Eaton Vance and CRM are indirect, wholly-owned subsidiaries of Morgan Stanley. Each officer affiliated with CRM may hold a position with other CRM affiliates that is comparable to his or her position with CRM listed below.
| Name and Year of Birth | Corporation
Position(s) | Length of
Service | Principal Occupation(s) and Other Directorships
During Past Five Years and Other Relevant Experience |
| Interested Director |
John H. Streur(1)
1960 | Director and
President | Since 2015 | President and Chief Executive Officer of CRM (since December 31, 2016). President and Chief Executive Officer of Calvert Investments, Inc.
(January 2015 - December 2016); Chief Executive Officer of Calvert
Investment Distributors, Inc. (August 2015 - December 2016); Chief
Compliance Officer of Calvert Investment Management, Inc. (August 2015 -
April 2016); President and Director, Portfolio 21 Investments, Inc.
(through October 2014); President, Chief Executive Officer and
Director, Managers Investment Group LLC (through January 2012);
President and Director, The Managers Funds and Managers AMG
Funds (through January 2012).
Other Directorships. Portfolio 21 Investments, Inc. (asset management)
(through October 2014); Managers Investment Group LLC (asset management)
(through January 2012); The Managers Funds (asset management)
(through January 2012); Managers AMG Funds (asset management)
(through January 2012); Calvert Impact Capital, Inc. |
| Noninterested Directors |
Richard L. Baird, Jr.
1948 | Director | Since 2016 | Regional Disaster Recovery Lead, American Red Cross of Greater
Pennsylvania (since 2017). Volunteer, American Red Cross (since 2015).
Former President and CEO of Adagio Health Inc. (retired in 2014) in
Pittsburgh, PA.
Other Directorships. None. |
Alice Gresham Bullock
1950 | Chair and
Director | Since 2016 (Chair);
Since 2008 (Director) | Professor Emerita at Howard University School of Law. Dean Emerita of
Howard University School of Law and Deputy Director of the Association
of American Law Schools (1992-1994).
Other Directorships. None. |
Cari M. Dominguez
1949 | Director | Since 2016 | Former Chair of the U.S. Equal Employment Opportunity Commission.
Other Directorships. ManpowerGroup Inc. (workforce solutions company);
Triple S Management Corporation (managed care); National Association of Corporate Directors. |
John G. Guffey, Jr.
1948 | Director | Since 2016 | President of Aurora Press Inc., a privately held publisher of trade
paperbacks (since January 1997).
Other Directorships. Calvert Impact Capital, Inc. (through
December 31, 2018); Calvert Ventures, LLC. |
Miles D. Harper, III
1962 | Director | Since 2016 | Partner, Carr Riggs & Ingram (public accounting firm) since October 2014.
Partner, Gainer Donnelly & Desroches (public accounting firm) (now Carr
Riggs & Ingram) (November 1999 - September 2014).
Other Directorships. Bridgeway Funds (9) (asset management). |
Joy V. Jones
1950 | Director | Since 2016 | Attorney.
Other Directorships. Palm Management Corporation. |
Calvert
VP Investment Grade Bond Index Portfolio
December 31, 2021
Management and Organization — continued
| Name and Year of Birth | Corporation
Position(s) | Length of
Service | Principal Occupation(s) and Other Directorships
During Past Five Years and Other Relevant Experience |
| Noninterested Directors (continued) |
Anthony A. Williams
1951 | Director | Since 2016 | CEO and Executive Director of the Federal City Council (July 2012 to
present); Senior Adviser and Independent Consultant for King and
Spalding LLP (September 2015 to present); Executive Director of Global
Government Practice at the Corporate Executive Board (January 2010 to
January 2012).
Other Directorships. Freddie Mac; Evoq Properties/Meruelo Maddux
Properties, Inc. (real estate management); Weston Solutions, Inc.
(environmental services); Bipartisan Policy Center’s Debt Reduction Task Force;
Chesapeake Bay Foundation; Catholic University of America; Urban Institute (research organization); The Howard Hughes Corporation (real estate development). |
| Name and Year of Birth | Corporation
Position(s) | Length of
Service | Principal Occupation(s)
During Past Five Years |
| Principal Officers who are not Directors |
Hope L. Brown
1973 | Chief
Compliance
Officer | Since 2014 | Chief Compliance Officer of 39 registered investment companies advised
by CRM (since 2014). Vice President and Chief Compliance Officer,
Wilmington Funds (2012-2014). |
Deidre E. Walsh
1971 | Secretary,
Vice President
and Chief
Legal Officer | Since 2021 | Vice President of CRM and officer of 39 registered investment companies
advised by CRM (since 2021). Also Vice President of Eaton Vance and
certain of its affiliates and officer of 138 registered investment companies
advised or administered by Eaton Vance. |
James F. Kirchner
1967 | Treasurer | Since 2016 | Vice President of CRM and officer of 39 registered investment companies
advised by CRM (since 2016). Also Vice President of Eaton Vance and
certain of its affiliates and officer of 138 registered investment companies
advised or administered by Eaton Vance. |
| | | | |
| (1) Mr. Streur is an interested person of the Fund because of his positions with the Fund’s adviser and certain affiliates. |
The SAI for the Fund includes additional information about the Directors and officers of the Fund and can be obtained without charge on Calvert’s website at www.calvert.com or by calling 1-800-368-2745.
| FACTS | WHAT DOES EATON VANCE DO WITH YOUR
PERSONAL INFORMATION? |
| Why? | Financial companies choose how they share your personal information. Federal law gives consumers the right to limit some but not all sharing. Federal law also requires us to tell you how we collect, share, and protect your personal information. Please read this notice carefully to understand what we do. |
| |
| What? | The types of personal information we collect and share depend on the product or service you have with us. This information can include:■ Social Security number and income
■
investment experience and risk tolerance
■
checking account number and wire transfer instructions |
| |
| How? | All financial companies need to share customers’ personal information to run their everyday business. In the section below, we list the reasons financial companies can share their customers’ personal information; the reasons Eaton Vance chooses to share; and whether you can limit this sharing. |
Reasons we can share your
personal information | Does Eaton Vance
share? | Can you limit
this sharing? |
| For our everyday business purposes — such as to process your transactions, maintain your account(s), respond to court orders and legal investigations, or report to credit bureaus | Yes | No |
| For our marketing purposes — to offer our products and services to you | Yes | No |
| For joint marketing with other financial companies | No | We don’t share |
| For our investment management affiliates’ everyday business purposes — information about your transactions, experiences, and creditworthiness | Yes | Yes |
| For our affiliates’ everyday business purposes — information about your transactions and experiences | Yes | No |
| For our affiliates’ everyday business purposes — information about your creditworthiness | No | We don’t share |
| For our investment management affiliates to market to you | Yes | Yes |
| For our affiliates to market to you | No | We don’t share |
| For nonaffiliates to market to you | No | We don’t share |
To limit our
sharing | Call toll-free 1-800-368-2745 or email: CRMPrivacy@calvert.comPlease note:If you are a new customer, we can begin sharing your information 30 days from the date we sent this notice. When you are no longer our customer, we continue to share your information as described in this notice. However, you can contact us at any time to limit our sharing. |
| Questions? | Call toll-free 1-800-368-2745 or email: CRMPrivacy@calvert.com |
| Privacy Notice — continued | April 2021 |
| Who we are |
| Who is providing this notice? | Eaton Vance Management, Eaton Vance Distributors, Inc., Eaton Vance Trust Company, Eaton Vance Management (International) Limited, Eaton Vance Advisers International Ltd., Eaton Vance Global Advisors Limited, Eaton Vance Management’s Real Estate Investment Group, Boston Management and Research, Calvert Research and Management, Eaton Vance and Calvert Fund Families and our investment advisory affiliates (“Eaton Vance”) (see Investment Management Affiliates definition below) |
| What we do |
How does Eaton Vance
protect my personal
information? | To protect your personal information from unauthorized access and use, we use security measures that comply with federal law. These measures include computer safeguards and secured files and buildings. We have policies governing the proper handling of customer information by personnel and requiring third parties that provide support to adhere to appropriate security standards with respect to such information. |
How does Eaton Vance
collect my personal
information? | We collect your personal information, for example, when you■ open an account or make deposits or withdrawals from your account
■
buy securities from us or make a wire transfer
■
give us your contact informationWe also collect your personal information from others, such as credit bureaus, affiliates, or other companies. |
| Why can’t I limit all sharing? | Federal law gives you the right to limit only■ sharing for affiliates’ everyday business purposes — information about your creditworthiness
■
affiliates from using your information to market to you
■
sharing for nonaffiliates to market to youState laws and individual companies may give you additional rights to limit sharing. See below for more on your rights under state law. |
| Definitions |
Investment Management
Affiliates | Eaton Vance Investment Management Affiliates include registered investment advisers, registered broker- dealers, and registered and unregistered funds. Investment Management Affiliates does not include entities associated with Morgan Stanley Wealth Management, such as Morgan Stanley Smith Barney LLC and Morgan Stanley & Co. |
| Affiliates | Companies related by common ownership or control. They can be financial and nonfinancial companies.■ Our affiliates include companies with a Morgan Stanley name and financial companies such as Morgan Stanley Smith Barney LLC and Morgan Stanley & Co. |
| Nonaffiliates | Companies not related by common ownership or control. They can be financial and nonfinancial companies.■ Eaton Vance does not share with nonaffiliates so they can market to you. |
| Joint marketing | A formal agreement between nonaffiliated financial companies that together market financial products or services to you.■ Eaton Vance doesn’t jointly market. |
| Other important information |
| Vermont: Except as permitted by law, we will not share personal information we collect about Vermont residents with Nonaffiliates unless you provide us with your written consent to share such information.California: Except as permitted by law, we will not share personal information we collect about California residents with Nonaffiliates and we will limit sharing such personal information with our Affiliates to comply with California privacy laws that apply to us. |
Delivery of Shareholder Documents. The Securities and Exchange Commission (SEC) permits funds to deliver only one copy of shareholder documents, including prospectuses, proxy statements and shareholder reports, to fund investors with multiple accounts at the same residential or post office box address. This practice is often called “householding” and it helps eliminate duplicate mailings to shareholders. Calvert funds, or your financial intermediary, may household the mailing of your documents indefinitely unless you instruct Calvert funds, or your financial intermediary, otherwise. If you would prefer that your Calvert fund documents not be householded, please contact Calvert funds at 1-800-368-2745, or contact your financial intermediary. Your instructions that householding not apply to delivery of your Calvert fund documents will typically be effective within 30 days of receipt by Calvert funds or your financial intermediary. Separate statements will be generated for each separate account and will be householded as described above.
Portfolio Holdings. Each Calvert fund files a schedule of portfolio holdings on Part F to Form N-PORT with the SEC. Certain information filed on Form N-PORT may be viewed on the Calvert website at www.calvert.com, by calling Calvert at 1-800-368-2745 or in the EDGAR database on the SEC’s website at www.sec.gov.
Proxy Voting. The Proxy Voting Guidelines that each Calvert fund uses to determine how to vote proxies relating to portfolio securities is provided as an Appendix to the fund’s Statement of Additional Information. The Statement of Additional Information can be obtained free of charge by calling the Calvert funds at 1-800-368-2745, by visiting the Calvert funds’ website at www.calvert.com or visiting the SEC’s website at www.sec.gov. Information regarding how a Calvert fund voted proxies relating to portfolio securities during the most recent 12-month period ended June 30 is available by calling Calvert funds, by visiting the Calvert funds’ website at www.calvert.com or by visiting the SEC’s website at www.sec.gov.
This Page Intentionally Left Blank
This Page Intentionally Left Blank
This Page Intentionally Left Blank
Investment Adviser and Administrator
Calvert Research and Management
1825 Connecticut Avenue NW, Suite 400
Washington, DC 20009
Investment Sub-Adviser
Ameritas Investment Partners, Inc.
5945 R Street
Lincoln, NE 68505
Principal Underwriter*
Eaton Vance Distributors, Inc.
Two International Place
Boston, MA 02110
(617) 482-8260
Custodian
State Street Bank and Trust Company
State Street Financial Center, One Lincoln Street
Boston, MA 02111
Transfer Agent
DST Asset Manager Solutions, Inc.
2000 Crown Colony Drive
Quincy, MA 02169
Independent Registered Public Accounting Firm
Deloitte & Touche LLP
200 Berkeley Street
Boston, MA 02116-5022
Fund Offices
1825 Connecticut Avenue NW, Suite 400
Washington, DC 20009
* FINRA BrokerCheck. Investors may check the background of their Investment Professional by contacting the Financial Industry Regulatory Authority (FINRA). FINRA BrokerCheck is a free tool to help investors check the professional background of current and former FINRA-registered securities firms and brokers. FINRA BrokerCheck is available by calling 1-800-289-9999 and at www.FINRA.org. The FINRA BrokerCheck brochure describing this program is available to investors at www.FINRA.org.
Printed on recycled paper.
24231 12.31.21
Calvert
VP Nasdaq 100 Index Portfolio
Annual Report
December 31, 2021
Commodity Futures Trading Commission Registration. The Commodity Futures Trading Commission (“CFTC”) has adopted regulations that subject registered investment companies and advisers to regulation by the CFTC if a fund invests more than a prescribed level of its assets in certain CFTC-regulated instruments (including futures, certain options and swap agreements) or markets itself as providing investment exposure to such instruments. The adviser has claimed an exclusion from the definition of “commodity pool operator” under the Commodity Exchange Act with respect to its management of the Fund and the other funds it manages. Accordingly, neither the Fund nor the adviser is subject to CFTC regulation.
Fund shares are not insured by the FDIC and are not deposits or other obligations of, or guaranteed by, any depository institution. Shares are subject to investment risks, including possible loss of principal invested.
This report must be preceded or accompanied by a current summary prospectus or prospectus. Before investing, investors should consider carefully the investment objective, risks, and charges and expenses of a mutual fund. This and other important information is contained in the summary prospectus and prospectus, which can be obtained from a financial intermediary. Prospective investors should read the prospectus carefully before investing. For further information, please call 1-800-368-2745.
Annual Report December 31, 2021
Calvert
VP Nasdaq 100 Index Portfolio
Calvert
VP Nasdaq 100 Index Portfolio
December 31, 2021
Management's Discussion of Fund Performance†
Economic and Market Conditions
The 12-month period starting January 1, 2021, was notable for a U.S. equity rally that lasted for most of the period and resulted in U.S. stocks outperforming most other stock markets in developed economies. Except for temporary retreats in September and November, broad-market indexes generally posted strong returns during the period. Investors cheered the reopening of businesses that had been affected by the pandemic and the rollout of several highly effective COVID-19 vaccines.
COVID-19, however, continued to have a firm grip on the U.S. economy. Disease rates advanced and declined with second, third, and fourth waves of infections. Worker shortages led to global supply-chain disruptions. From computer chips to shipping containers, scarcities of key items led to temporary factory shutdowns and empty store shelves. Those shortages — combined with high demand from consumers eager to spend money saved earlier in the pandemic — led to higher year-over-year inflation than the U.S. had seen in decades.
Still, investor optimism about a recovering economy drove stock prices up during most of the period. A significant pullback, however, occurred in September 2021 when virtually every major U.S. stock index reported negative returns. Unexpectedly weak job creation in August and the U.S. Federal Reserve’s (the Fed’s) announcement that it might soon begin tapering its monthly bond purchases — which had stimulated the economy earlier — combined to drive stocks into negative territory. Rising COVID-19 infections also weighed on equity performance in September.
In the final quarter of 2021, however, stock prices came roaring back. Even the late-November news of a new and more transmissible COVID-19 variant — Omicron — caused only a temporary market retreat. The Fed’s actions to tamp down inflation were applauded by investors, with stocks gaining ground after the central bank announced that tapering would be accelerated and that three possible interest rate hikes were forecast for 2022. Just two trading days before year-end, the S&P 500® Index closed at its 70th new all-time high for the period, and the Dow Jones Industrial Average® (DJIA) closed at an all-time high as well.
For the period as a whole, the broad-market S&P 500® Index returned 28.71%; the blue-chip DJIA was up 20.95%; and the technology-laden Nasdaq Composite Index rose 22.18%. Large-cap U.S. stocks, as measured by the Russell 1000® Index, outperformed their small-cap counterparts, as measured by the Russell 2000® Index. In the large-cap space, growth stocks modestly outperformed value stocks, but in the small-cap space, value stocks strongly outperformed growth stocks during the period.
Investment Strategy
As an index fund, Calvert VP Nasdaq 100 Index Portfolio (the Fund) seeks to replicate as closely as possible the holdings and match the performance of the NASDAQ-100® Index (the Index). The Fund seeks to accomplish this by employing a passive management approach and holding each constituent of the Index in approximately the same proportion as the Index. The Fund may also invest in exchange-traded funds (ETFs) that provide the same exposure to the Index. Cash holdings may gain exposure to the Index via futures contracts, allowing the Fund’s assets to be fully invested.
Fund Performance
For the 12-month period ended December 31, 2021, the Fund returned 26.87% for Class I shares at net asset value (NAV). By comparison, its benchmark, the Index, returned 27.51% during the period.
The Index is unmanaged and returns do not reflect any fees and operating expenses.
Each market sector within the Index generated double-digit returns led by information technology (IT), consumer staples, and communication services. Industrials and consumer discretionary were the worst-performing sectors, but still returned more than 10% each. At period-end, IT, communication services, and consumer discretionary had the largest weights within the Index, while utilities and industrials had the smallest weights.
The Index had no exposure to the energy, financials, or real estate sectors.
Futures contracts, which are regularly used to manage uninvested cash holdings in the Fund, had a meaningful positive impact on performance during the period.
See Endnotes and Additional Disclosures in this report.
Past performance is no guarantee of future results. Returns are historical and are calculated by determining the percentage change in net asset value (NAV) or offering price (as applicable) with all distributions reinvested. Investment return and principal value will fluctuate so that shares, when redeemed, may be worth more or less than their original cost. Performance for periods less than or equal to one year is cumulative. Performance is for the stated time period only; due to market volatility, current Fund performance may be lower or higher than the quoted return.
Calvert
VP Nasdaq 100 Index Portfolio
December 31, 2021
Performance
Portfolio Manager(s) Kevin L. Keene, CFA of Ameritas Investment Partners, Inc.
| % Average Annual Total Returns1,2 | Class
Inception Date | Performance
Inception Date | One Year | Five Years | Ten Years |
| Class I at NAV | 04/27/2000 | 04/27/2000 | 26.87% | 28.00% | 22.45% |
| Class F at NAV | 10/30/2015 | 04/27/2000 | 26.55 | 27.68 | 22.26 |
|
| NASDAQ-100 ® Index | — | — | 27.51% | 28.62% | 23.13% |
| % Total Annual Operating Expense Ratios3 | Class I | Class F |
| Gross | 0.60% | 0.85% |
| Net | 0.48 | 0.73 |
Growth of $10,000
This graph shows the change in value of a hypothetical investment of $10,000 in Class I of the Fund for the period indicated. For comparison, the same investment is shown in the indicated index.
| Growth of Investment2 | Amount Invested | Period Beginning | At NAV | With Maximum Sales Charge |
| Class F | $10,000 | 12/31/2011 | $74,711 | N.A. |
See Endnotes and Additional Disclosures in this report.
Past performance is no guarantee of future results. Returns are historical and are calculated by determining the percentage change in net asset value (NAV) or offering price (as applicable) with all distributions reinvested. Investment return and principal value will fluctuate so that shares, when redeemed, may be worth more or less than their original cost. Performance for periods less than or equal to one year is cumulative. Performance is for the stated time period only; due to market volatility, current Fund performance may be lower or higher than the quoted return.
Calvert
VP Nasdaq 100 Index Portfolio
December 31, 2021
Sector Allocation (% of net assets)*
* Excludes cash and cash equivalents.
| Top 10 Holdings (% of net assets)* | |
| Apple, Inc. | 11.3% |
| Microsoft Corp. | 9.8 |
| Amazon.com, Inc. | 6.5 |
| Meta Platforms, Inc., Class A | 4.6 |
| Tesla, Inc. | 4.1 |
| NVIDIA Corp. | 4.0 |
| Alphabet, Inc., Class C | 3.6 |
| Alphabet, Inc., Class A | 3.4 |
| Broadcom, Inc. | 1.8 |
| Adobe, Inc. | 1.7 |
| Total | 50.8% |
| * | Excludes cash and cash equivalents. |
Calvert
VP Nasdaq 100 Index Portfolio
December 31, 2021
Endnotes and Additional Disclosures
| † | The views expressed in this report are those of the portfolio manager(s) and are current only through the date stated at the top of this page. These views are subject to change at any time based upon market or other conditions, and Calvert and the Fund(s) disclaim any responsibility to update such views. These views may not be relied upon as investment advice and, because investment decisions are based on many factors, may not be relied upon as an indication of trading intent on behalf of any Calvert fund. This commentary may contain statements that are not historical facts, referred to as “forward-looking statements.” The Fund’s actual future results may differ significantly from those stated in any forward-looking statement, depending on factors such as changes in securities or financial markets or general economic conditions, the volume of sales and purchases of Fund shares, the continuation of investment advisory, administrative and service contracts, and other risks discussed from time to time in the Fund’s filings with the Securities and Exchange Commission. |
| | |
| 1 | NASDAQ–100® Index includes 100 of the largest domestic and international securities (by market cap), excluding financials, listed on Nasdaq. Source: Nasdaq, Inc. The information is provided by Nasdaq (with its affiliates, are referred to as the “Corporations”) and Nasdaq’s third party licensors on an “as is” basis and the Corporations make no guarantees and bear no liability of any kind with respect to the information or the Fund. Unless otherwise stated, index returns do not reflect the effect of any applicable sales charges, commissions, expenses, taxes or leverage, as applicable. It is not possible to invest directly in an index. |
| 2 | There is no sales charge. Insurance-related charges are not included in the calculation of returns. If such charges were reflected, the returns would be lower. Please refer to the report for your insurance contract for performance data reflecting insurance-related charges.Performance prior to the inception date of a class may be linked to the performance of an older class of the Fund. This linked performance is adjusted for any applicable sales charge, but is not adjusted for class expense differences. If adjusted for such differences, the performance would be different. The performance of Class F is linked to Class I. Performance presented in the Financial Highlights included in the financial statements is not linked.Calvert Research and Management became the investment adviser to the Fund on December 31, 2016. Performance reflected prior to such date is that of the Fund’s former investment adviser. |
| 3 | Source: Fund prospectus. Net expense ratios reflect a contractual expense reimbursement that continues through 4/30/22. The expense ratios for the current reporting period can be found in the Financial Highlights section of this report. Performance reflects expenses waived and/or reimbursed, if applicable. Without such waivers and/or reimbursements, performance would have been lower. |
| | Additional Information |
| | S&P 500® Index is an unmanaged index of large-cap stocks commonly used as a measure of U.S. stock market performance. Dow Jones Industrial Average® is a price-weighted average of 30 blue-chip stocks that are generally the leaders in their industry. S&P Dow Jones Indices are a product of S&P Dow Jones Indices LLC (“S&P DJI”) and have been licensed for use. S&P® and S&P 500® are registered trademarks of S&P DJI; Dow Jones® is a registered trademark of Dow Jones Trademark Holdings LLC (“Dow Jones”); S&P DJI, Dow Jones and their respective affiliates do not sponsor, endorse, sell or promote the Fund, will not have any liability with respect thereto and do not have any liability for any errors, omissions, or interruptions of the S&P Dow Jones Indices. Nasdaq Composite Index is a market capitalization-weighted index of all domestic and international securities listed on Nasdaq. Russell 1000® Index is an unmanaged index of 1,000 U.S. large- cap stocks. Russell 2000® Index is an unmanaged index of 2,000 U.S. small-cap stocks. |
Calvert
VP Nasdaq 100 Index Portfolio
December 31, 2021
Example
As a Fund shareholder, you incur ongoing costs, including management fees; distribution and/or service fees; and other Fund expenses. This Example is intended to help you understand your ongoing costs (in dollars) of Fund investing and to compare these costs with the ongoing costs of investing in other mutual funds. The Example is based on an investment of $1,000 invested at the beginning of the period and held for the entire period (July 1, 2021 to December 31, 2021).
Actual Expenses
The first section of the table below provides information about actual account values and actual expenses. You may use the information in this section, together with the amount you invested, to estimate the expenses that you paid over the period. Simply divide your account value by $1,000 (for example, an $8,600 account value divided by $1,000 = 8.6), then multiply the result by the number in the first section under the heading entitled “Expenses Paid During Period” to estimate the expenses you paid on your account during this period.
Hypothetical Example for Comparison Purposes
The second section of the table below provides information about hypothetical account values and hypothetical expenses based on the actual Fund expense ratio and an assumed rate of return of 5% per year (before expenses), which is not the actual Fund return. The hypothetical account values and expenses may not be used to estimate the actual ending account balance or expenses you paid for the period. You may use this information to compare the ongoing costs of investing in the Fund and other funds. To do so, compare this 5% hypothetical example with the 5% hypothetical examples that appear in the shareholder reports of the other funds.
Please note that the expenses shown in the table are meant to highlight your ongoing costs only and do not reflect expenses and charges which are, or may be imposed under the variable annuity contract or variable life insurance policy (variable contracts) (if applicable) or qualified pension or retirement plans (Qualified Plans) through which your investment in the Fund is made. Therefore, the second section of the table is useful in comparing ongoing costs associated with an investment in vehicles which fund benefits under variable contracts and Qualified Plans, and will not help you determine the relative total costs of investing in the Fund through variable contracts or Qualified Plans. In addition, if these expenses and charges imposed under the variable contracts or Qualified Plans were included, your costs would have been higher.
| | Beginning
Account Value
(7/1/21) | Ending
Account Value
(12/31/21) | Expenses Paid
During Period*
(7/1/21 – 12/31/21) | Annualized
Expense
Ratio |
| Actual | | | | |
| Class I | $1,000.00 | $1,122.30 | $2.57 ** | 0.48% |
| Class F | $1,000.00 | $1,120.90 | $3.90 ** | 0.73% |
| Hypothetical | | | | |
| (5% return per year before expenses) | | | | |
| Class I | $1,000.00 | $1,022.79 | $2.45 ** | 0.48% |
| Class F | $1,000.00 | $1,021.53 | $3.72 ** | 0.73% |
| * | Expenses are equal to the Fund's annualized expense ratio for the indicated Class, multiplied by the average account value over the period, multiplied by 184/365 (to reflect the one-half year period). The Example assumes that the $1,000 was invested at the net asset value per share determined at the close of business on June 30, 2021. Expenses shown do not include insurance-related charges or direct expenses of Qualified Plans. |
| ** | Absent a waiver and/or reimbursement of expenses by an affiliate, expenses would be higher. |
Calvert
VP Nasdaq 100 Index Portfolio
December 31, 2021
| Security | Shares | Value |
| Automobiles — 4.5% | |
| Lucid Group, Inc.(1)(2) | | 35,968 | $ 1,368,582 |
| Tesla, Inc.(1) | | 13,224 | 13,974,859 |
| | | | $ 15,343,441 |
| Beverages — 2.2% | |
| Keurig Dr Pepper, Inc. | | 30,978 | $ 1,141,849 |
| Monster Beverage Corp.(1) | | 11,560 | 1,110,223 |
| PepsiCo, Inc. | | 30,207 | 5,247,258 |
| | | | $ 7,499,330 |
| Biotechnology — 3.3% | |
| Amgen, Inc. | | 12,306 | $ 2,768,481 |
| Biogen, Inc.(1) | | 3,209 | 769,903 |
| Gilead Sciences, Inc. | | 27,405 | 1,989,877 |
| Moderna, Inc.(1) | | 8,858 | 2,249,755 |
| Regeneron Pharmaceuticals, Inc.(1) | | 2,310 | 1,458,811 |
| Seagen, Inc.(1) | | 3,995 | 617,627 |
| Vertex Pharmaceuticals, Inc.(1) | | 5,555 | 1,219,878 |
| | | | $ 11,074,332 |
| Commercial Services & Supplies — 0.5% | |
| Cintas Corp. | | 2,259 | $ 1,001,121 |
| Copart, Inc.(1) | | 5,182 | 785,695 |
| | | | $ 1,786,816 |
| Communications Equipment — 1.7% | |
| Cisco Systems, Inc. | | 92,143 | $ 5,839,102 |
| | | | $ 5,839,102 |
| Electric Utilities — 0.9% | |
| American Electric Power Co., Inc. | | 11,003 | $ 978,937 |
| Exelon Corp. | | 21,373 | 1,234,505 |
| Xcel Energy, Inc. | | 11,769 | 796,761 |
| | | | $ 3,010,203 |
| Entertainment — 2.5% | |
| Activision Blizzard, Inc. | | 17,016 | $ 1,132,075 |
| Electronic Arts, Inc. | | 6,179 | 815,010 |
| NetEase, Inc. ADR | | 6,190 | 630,018 |
| Netflix, Inc.(1) | | 9,677 | 5,829,812 |
| | | | $ 8,406,915 |
| Food & Staples Retailing — 1.9% | |
| Costco Wholesale Corp. | | 9,653 | $ 5,480,008 |
| Security | Shares | Value |
| Food & Staples Retailing (continued) | |
| Walgreens Boots Alliance, Inc. | | 18,911 | $ 986,398 |
| | | | $ 6,466,406 |
| Food Products — 0.9% | |
| Kraft Heinz Co. (The) | | 26,742 | $ 960,038 |
| Mondelez International, Inc., Class A | | 30,476 | 2,020,863 |
| | | | $ 2,980,901 |
| Health Care Equipment & Supplies — 1.9% | |
| Align Technology, Inc.(1) | | 1,723 | $ 1,132,321 |
| DexCom, Inc.(1) | | 2,117 | 1,136,723 |
| IDEXX Laboratories, Inc.(1) | | 1,852 | 1,219,468 |
| Intuitive Surgical, Inc.(1) | | 7,805 | 2,804,337 |
| | | | $ 6,292,849 |
| Hotels, Restaurants & Leisure — 2.2% | |
| Airbnb, Inc.(1) | | 7,577 | $ 1,261,495 |
| Booking Holdings, Inc.(1) | | 897 | 2,152,109 |
| Marriott International, Inc., Class A(1) | | 7,115 | 1,175,683 |
| Starbucks Corp. | | 25,631 | 2,998,058 |
| | | | $ 7,587,345 |
| Industrial Conglomerates — 0.9% | |
| Honeywell International, Inc. | | 15,040 | $ 3,135,990 |
| | | | $ 3,135,990 |
| Interactive Media & Services — 12.0% | |
| Alphabet, Inc., Class A(1) | | 3,961 | $ 11,475,175 |
| Alphabet, Inc., Class C(1) | | 4,184 | 12,106,781 |
| Baidu, Inc. ADR(1) | | 5,303 | 789,033 |
| Match Group, Inc.(1) | | 6,185 | 817,966 |
| Meta Platforms, Inc., Class A(1) | | 46,659 | 15,693,755 |
| | | | $ 40,882,710 |
| Internet & Direct Marketing Retail — 7.7% | |
| Amazon.com, Inc.(1) | | 6,678 | $ 22,266,722 |
| eBay, Inc. | | 13,676 | 909,454 |
| JD.com, Inc. ADR(1) | | 16,201 | 1,135,204 |
| MercadoLibre, Inc.(1) | | 1,102 | 1,485,937 |
| Pinduoduo, Inc. ADR(1) | | 9,083 | 529,539 |
| | | | $ 26,326,856 |
| IT Services — 3.5% | |
| Automatic Data Processing, Inc. | | 9,206 | $ 2,270,016 |
| Cognizant Technology Solutions Corp., Class A | | 11,475 | 1,018,062 |
| Fiserv, Inc.(1) | | 14,424 | 1,497,067 |
7
See Notes to Financial Statements.
Calvert
VP Nasdaq 100 Index Portfolio
December 31, 2021
Schedule of Investments — continued
| Security | Shares | Value |
| IT Services (continued) | |
| Okta, Inc.(1) | | 3,225 | $ 722,948 |
| Paychex, Inc. | | 7,878 | 1,075,347 |
| PayPal Holdings, Inc.(1) | | 25,669 | 4,840,660 |
| VeriSign, Inc.(1) | | 2,427 | 616,021 |
| | | | $ 12,040,121 |
| Leisure Products — 0.1% | |
| Peloton Interactive, Inc., Class A(1) | | 6,579 | $ 235,265 |
| | | | $ 235,265 |
| Life Sciences Tools & Services — 0.4% | |
| Illumina, Inc.(1) | | 3,415 | $ 1,299,203 |
| | | | $ 1,299,203 |
| Machinery — 0.2% | |
| PACCAR, Inc. | | 7,585 | $ 669,452 |
| | | | $ 669,452 |
| Media — 2.4% | |
| Charter Communications, Inc., Class A(1) | | 3,917 | $ 2,553,766 |
| Comcast Corp., Class A | | 99,612 | 5,013,472 |
| Sirius XM Holdings, Inc.(2) | | 86,748 | 550,850 |
| | | | $ 8,118,088 |
| Multiline Retail — 0.2% | |
| Dollar Tree, Inc.(1) | | 4,915 | $ 690,656 |
| | | | $ 690,656 |
| Professional Services — 0.2% | |
| Verisk Analytics, Inc. | | 3,521 | $ 805,358 |
| | | | $ 805,358 |
| Road & Rail — 0.5% | |
| CSX Corp. | | 48,457 | $ 1,821,983 |
| | | | $ 1,821,983 |
| Semiconductors & Semiconductor Equipment — 16.0% | |
| Advanced Micro Devices, Inc.(1) | | 26,383 | $ 3,796,514 |
| Analog Devices, Inc. | | 11,741 | 2,063,716 |
| Applied Materials, Inc. | | 19,726 | 3,104,083 |
| ASML Holding NV-NY Shares | | 1,771 | 1,409,964 |
| Broadcom, Inc. | | 8,993 | 5,984,032 |
| Intel Corp. | | 88,852 | 4,575,878 |
| KLA Corp. | | 3,313 | 1,424,954 |
| Lam Research Corp. | | 3,076 | 2,212,105 |
| Marvell Technology, Inc. | | 17,994 | 1,574,295 |
| Security | Shares | Value |
| Semiconductors & Semiconductor Equipment (continued) | |
| Microchip Technology, Inc. | | 12,122 | $ 1,055,341 |
| Micron Technology, Inc. | | 24,439 | 2,276,493 |
| NVIDIA Corp. | | 46,330 | 13,626,116 |
| NXP Semiconductors NV | | 5,810 | 1,323,402 |
| QUALCOMM, Inc. | | 24,469 | 4,474,646 |
| Skyworks Solutions, Inc. | | 3,613 | 560,521 |
| Texas Instruments, Inc. | | 20,176 | 3,802,571 |
| Xilinx, Inc. | | 5,415 | 1,148,143 |
| | | | $ 54,412,774 |
| Software — 16.8% | |
| Adobe, Inc.(1) | | 10,395 | $ 5,894,589 |
| ANSYS, Inc.(1) | | 1,906 | 764,535 |
| Atlassian Corp. PLC, Class A(1) | | 3,068 | 1,169,798 |
| Autodesk, Inc.(1) | | 4,803 | 1,350,555 |
| Cadence Design Systems, Inc.(1) | | 6,055 | 1,128,349 |
| CrowdStrike Holdings, Inc., Class A(1) | | 4,497 | 920,761 |
| Datadog, Inc.(1) | | 5,619 | 1,000,800 |
| DocuSign, Inc.(1) | | 4,298 | 654,628 |
| Fortinet, Inc.(1) | | 3,572 | 1,283,777 |
| Intuit, Inc. | | 6,186 | 3,978,959 |
| Microsoft Corp. | | 98,867 | 33,250,949 |
| Palo Alto Networks, Inc.(1) | | 2,156 | 1,200,374 |
| Splunk, Inc.(1) | | 3,496 | 404,557 |
| Synopsys, Inc.(1) | | 3,332 | 1,227,842 |
| Workday, Inc., Class A(1) | | 4,216 | 1,151,727 |
| Zoom Video Communications, Inc., Class A(1) | | 5,292 | 973,252 |
| Zscaler, Inc.(1) | | 3,060 | 983,270 |
| | | | $ 57,338,722 |
| Specialty Retail — 0.6% | |
| O'Reilly Automotive, Inc.(1) | | 1,472 | $ 1,039,571 |
| Ross Stores, Inc. | | 7,764 | 887,270 |
| | | | $ 1,926,841 |
| Technology Hardware, Storage & Peripherals — 11.3% | |
| Apple, Inc. | | 216,044 | $ 38,362,933 |
| | | | $ 38,362,933 |
| Textiles, Apparel & Luxury Goods — 0.3% | |
| lululemon Athletica, Inc.(1) | | 2,722 | $ 1,065,527 |
| | | | $ 1,065,527 |
| Trading Companies & Distributors — 0.2% | |
| Fastenal Co. | | 12,566 | $ 804,978 |
| | | | $ 804,978 |
8
See Notes to Financial Statements.
Calvert
VP Nasdaq 100 Index Portfolio
December 31, 2021
Schedule of Investments — continued
| Security | Shares | Value |
| Wireless Telecommunication Services — 0.9% | |
| T-Mobile US, Inc.(1) | | 27,288 | $ 3,164,861 |
| | | | $ 3,164,861 |
Total Common Stocks
(identified cost $88,924,408) | | | $329,389,958 |
| Exchange-Traded Funds — 1.2% |
| Security | Shares | Value |
| Equity Funds — 1.2% | |
| Invesco QQQ TM Trust, Series 1(2) | | 10,500 | $ 4,177,425 |
Total Exchange-Traded Funds
(identified cost $3,021,320) | | | $ 4,177,425 |
| Short-Term Investments — 2.2% | | | |
| Affiliated Fund — 2.0% |
| Description | Units | Value |
| Calvert Cash Reserves Fund, LLC, 0.06%(3) | | 6,793,210 | $ 6,793,210 |
Total Affiliated Fund
(identified cost $6,793,127) | | | $ 6,793,210 |
| Securities Lending Collateral — 0.0%(4) |
| Security | Shares | Value |
| State Street Navigator Securities Lending Government Money Market Portfolio, 0.03%(5) | | 149,891 | $ 149,891 |
Total Securities Lending Collateral
(identified cost $149,891) | | | $ 149,891 |
| U.S. Treasury Obligations — 0.2% |
| Security | Principal
Amount
(000's omitted) | Value |
| U.S. Treasury Bill, 0.00%, 2/24/22(6) | $ | 500 | $ 499,984 |
Total U.S. Treasury Obligations
(identified cost $499,949) | | | $ 499,984 |
Total Short-Term Investments
(identified cost $7,442,967) | | | $ 7,443,085 |
Total Investments — 100.1%
(identified cost $99,388,695) | | | $341,010,468 |
| Other Assets, Less Liabilities — (0.1)% | | | $ (326,259) |
| Net Assets — 100.0% | | | $ 340,684,209 |
| The percentage shown for each investment category in the Schedule of Investments is based on net assets. |
| (1) | Non-income producing security. |
| (2) | All or a portion of this security was on loan at December 31, 2021. The aggregate market value of securities on loan at December 31, 2021 was $4,187,348. |
| (3) | Affiliated investment company, available to Calvert portfolios and funds, which invests in high quality, U.S. dollar denominated money market instruments. The rate shown is the annualized seven-day yield as of December 31, 2021. |
| (4) | Amount is less than 0.05%. |
| (5) | Represents investment of cash collateral received in connection with securities lending. |
| (6) | Security (or a portion thereof) has been pledged to cover margin requirements on open futures contracts. |
Futures Contracts
| Description | Number of
Contracts | Position | Expiration
Date | Notional
Amount | Value/
Unrealized
Appreciation
(Depreciation) |
| Equity Futures | | | | | |
| E-mini NASDAQ-100® Index | 22 | Long | 3/18/22 | $7,181,130 | $ 88,560 |
| | | | | | $88,560 |
| Abbreviations: |
| ADR | – American Depositary Receipt |
9
See Notes to Financial Statements.
Calvert
VP Nasdaq 100 Index Portfolio
December 31, 2021
Statement of Assets and Liabilities
| | December 31, 2021 |
| Assets | |
Investments in securities of unaffiliated issuers, at value (identified cost $92,595,568) - including
$4,187,348 of securities on loan | $ 334,217,258 |
| Investments in securities of affiliated issuers, at value (identified cost $6,793,127) | 6,793,210 |
| Receivable for capital shares sold | 57,578 |
| Dividends receivable | 77,715 |
| Dividends receivable - affiliated | 334 |
| Securities lending income receivable | 1,468 |
| Receivable from affiliate | 29,700 |
| Directors' deferred compensation plan | 37,352 |
| Total assets | $341,214,615 |
| Liabilities | |
| Payable for variation margin on open futures contracts | $ 48,142 |
| Payable for capital shares redeemed | 41,266 |
| Deposits for securities loaned | 149,891 |
| Payable to affiliates: | |
| Investment advisory fee | 85,516 |
| Administrative fee | 34,207 |
| Distribution and service fees | 10,692 |
| Sub-transfer agency fee | 64 |
| Directors' deferred compensation plan | 37,352 |
| Accrued expenses | 123,276 |
| Total liabilities | $ 530,406 |
| Net Assets | $340,684,209 |
| Sources of Net Assets | |
| Paid-in capital | $ 85,675,152 |
| Distributable earnings | 255,009,057 |
| Net Assets | $340,684,209 |
| Class I Shares | |
| Net Assets | $ 287,931,487 |
| Shares Outstanding | 1,962,737 |
Net Asset Value, Offering Price and Redemption Price Per Share
(net assets ÷ shares of beneficial interest outstanding) | $ 146.70 |
| Class F Shares | |
| Net Assets | $ 52,752,722 |
| Shares Outstanding | 366,308 |
Net Asset Value, Offering Price and Redemption Price Per Share
(net assets ÷ shares of beneficial interest outstanding) | $ 144.01 |
10
See Notes to Financial Statements.
Calvert
VP Nasdaq 100 Index Portfolio
December 31, 2021
| | Year Ended |
| | December 31, 2021 |
| Investment Income | |
| Dividend income (net of foreign taxes withheld of $2,950) | $ 2,013,378 |
| Dividend income - affiliated issuers | 4,257 |
| Interest income | 416 |
| Securities lending income, net | 8,073 |
| Total investment income | $ 2,026,124 |
| Expenses | |
| Investment advisory fee | $ 895,395 |
| Administrative fee | 358,158 |
| Distribution and service fees: | |
| Class F | 93,854 |
| Directors' fees and expenses | 10,754 |
| Custodian fees | 9,747 |
| Transfer agency fees and expenses | 277,212 |
| Accounting fees | 67,298 |
| Professional fees | 29,487 |
| Reports to shareholders | 10,390 |
| Miscellaneous | 102,020 |
| Total expenses | $ 1,854,315 |
| Waiver and/or reimbursement of expenses by affiliate | $ (327,666) |
| Net expenses | $ 1,526,649 |
| Net investment income | $ 499,475 |
| Realized and Unrealized Gain (Loss) | |
| Net realized gain (loss): | |
| Investment securities | $ 11,639,658 |
| Investment securities - affiliated issuers | (754) |
| Futures contracts | 1,265,485 |
| Net realized gain | $12,904,389 |
| Change in unrealized appreciation (depreciation): | |
| Investment securities | $ 58,148,031 |
| Investment securities - affiliated issuers | 83 |
| Futures contracts | 5,855 |
| Net change in unrealized appreciation (depreciation) | $58,153,969 |
| Net realized and unrealized gain | $71,058,358 |
| Net increase in net assets from operations | $71,557,833 |
11
See Notes to Financial Statements.
Calvert
VP Nasdaq 100 Index Portfolio
December 31, 2021
Statements of Changes in Net Assets
| | Year Ended December 31, |
| | 2021 | 2020 |
| Increase (Decrease) in Net Assets | | |
| From operations: | | |
| Net investment income | $ 499,475 | $ 850,237 |
| Net realized gain | 12,904,389 | 16,703,660 |
| Net change in unrealized appreciation (depreciation) | 58,153,969 | 66,966,820 |
| Net increase in net assets from operations | $ 71,557,833 | $ 84,520,717 |
| Distributions to shareholders: | | |
| Class I | $ (15,076,297) | $ (8,059,877) |
| Class F | (2,504,367) | (560,943) |
| Total distributions to shareholders | $ (17,580,664) | $ (8,620,820) |
| Capital share transactions: | | |
| Class I | $ 2,803,161 | $ (9,761,792) |
| Class F | 23,094,605 | 12,791,990 |
| Net increase in net assets from capital share transactions | $ 25,897,766 | $ 3,030,198 |
| Net increase in net assets | $ 79,874,935 | $ 78,930,095 |
| Net Assets | | |
| At beginning of year | $ 260,809,274 | $ 181,879,179 |
| At end of year | $340,684,209 | $260,809,274 |
12
See Notes to Financial Statements.
Calvert
VP Nasdaq 100 Index Portfolio
December 31, 2021
| | Class I |
| | Year Ended December 31, |
| | 2021 | 2020 | 2019 | 2018 | 2017 |
| Net asset value — Beginning of year | $ 122.67 | $ 86.05 | $ 63.98 | $ 65.60 | $ 50.26 |
| Income (Loss) From Operations | | | | | |
| Net investment income(1) | $ 0.27 | $ 0.42 | $ 0.44 | $ 0.41 | $ 0.40 |
| Net realized and unrealized gain (loss) | 31.85 | 40.48 | 24.00 | (0.46) | 15.82 |
| Total income (loss) from operations | $ 32.12 | $ 40.90 | $ 24.44 | $ (0.05) | $ 16.22 |
| Less Distributions | | | | | |
| From net investment income | $ (0.39) | $ (0.49) | $ (0.41) | $ (0.40) | $ (0.30) |
| From net realized gain | (7.70) | (3.79) | (1.96) | (1.17) | (0.58) |
| Total distributions | $ (8.09) | $ (4.28) | $ (2.37) | $ (1.57) | $ (0.88) |
| Net asset value — End of year | $ 146.70 | $ 122.67 | $ 86.05 | $ 63.98 | $ 65.60 |
| Total Return(2) | 26.87% | 48.22% | 38.77% | (0.47)% | 32.35% |
| Ratios/Supplemental Data | | | | | |
| Net assets, end of year (000’s omitted) | $287,931 | $237,710 | $176,210 | $130,777 | $133,473 |
| Ratios (as a percentage of average daily net assets):(3) | | | | | |
| Total expenses | 0.59% | 0.60% | 0.59% | 0.60% | 0.60% |
| Net expenses | 0.48% | 0.48% | 0.48% | 0.48% | 0.48% |
| Net investment income | 0.20% | 0.42% | 0.58% | 0.58% | 0.67% |
| Portfolio Turnover | 8% | 12% | 8% | 7% | 3% |
| (1) | Computed using average shares outstanding. |
| (2) | Returns are historical and are calculated by determining the percentage change in net asset value with all distributions reinvested and do not reflect fees and expenses imposed by variable annuity contracts or variable life insurance policies. If included, total return would be lower. |
| (3) | Total expenses do not reflect amounts reimbursed and/or waived by the adviser and certain of its affiliates, if applicable. Net expenses are net of all reductions and represent the net expenses paid by the Fund. |
13
See Notes to Financial Statements.
Calvert
VP Nasdaq 100 Index Portfolio
December 31, 2021
Financial Highlights — continued
| | Class F |
| | Year Ended December 31, |
| | 2021 | 2020 | 2019 | 2018 | 2017 |
| Net asset value — Beginning of year | $ 120.85 | $ 85.03 | $ 63.40 | $ 65.18 | $ 50.07 |
| Income (Loss) From Operations | | | | | |
| Net investment income (loss)(1) | $ (0.07) | $ 0.16 | $ 0.25 | $ 0.23 | $ 0.23 |
| Net realized and unrealized gain (loss) | 31.32 | 39.94 | 23.75 | (0.44) | 15.76 |
| Total income (loss) from operations | $ 31.25 | $ 40.10 | $24.00 | $ (0.21) | $15.99 |
| Less Distributions | | | | | |
| From net investment income | $ (0.39) | $ (0.49) | $ (0.41) | $ (0.40) | $ (0.30) |
| From net realized gain | (7.70) | (3.79) | (1.96) | (1.17) | (0.58) |
| Total distributions | $ (8.09) | $ (4.28) | $ (2.37) | $ (1.57) | $ (0.88) |
| Net asset value — End of year | $144.01 | $120.85 | $85.03 | $63.40 | $65.18 |
| Total Return(2) | 26.55% | 47.86% | 38.44% | (0.72)% | 32.01% |
| Ratios/Supplemental Data | | | | | |
| Net assets, end of year (000’s omitted) | $ 52,753 | $ 23,099 | $ 5,669 | $ 1,770 | $ 1,942 |
| Ratios (as a percentage of average daily net assets):(3) | | | | | |
| Total expenses | 0.84% | 0.85% | 0.84% | 0.84% | 1.01% |
| Net expenses | 0.73% | 0.73% | 0.73% | 0.73% | 0.73% |
| Net investment income (loss) | (0.05)% | 0.16% | 0.32% | 0.33% | 0.39% |
| Portfolio Turnover | 8% | 12% | 8% | 7% | 3% |
| (1) | Computed using average shares outstanding. |
| (2) | Returns are historical and are calculated by determining the percentage change in net asset value with all distributions reinvested and do not reflect fees and expenses imposed by variable annuity contracts or variable life insurance policies. If included, total return would be lower. |
| (3) | Total expenses do not reflect amounts reimbursed and/or waived by the adviser and certain of its affiliates, if applicable. Net expenses are net of all reductions and represent the net expenses paid by the Fund. |
14
See Notes to Financial Statements.
Calvert
VP Nasdaq 100 Index Portfolio
December 31, 2021
Notes to Financial Statements
1 Significant Accounting Policies
Calvert VP Nasdaq 100 Index Portfolio (the Fund) is a non-diversified series of Calvert Variable Products, Inc. (the Corporation). The Corporation is a Maryland corporation registered under the Investment Company Act of 1940, as amended (the 1940 Act), as an open-end management investment company. The investment objective of the Fund is to seek investment results that correspond to the investment performance of U.S. common stocks, as represented by the NASDAQ-100® Index.
Shares of the Fund are sold without sales charge to insurance companies for allocation to certain of their variable separate accounts and to qualified pension and retirement plans and other eligible investors. The Fund offers Class I and Class F shares. Among other things, each class has different: (a) dividend rates due to differences in Distribution Plan expenses and other class-specific expenses; (b) exchange privileges; and (c) class-specific voting rights.
The Fund applies the accounting and reporting guidance in the Financial Accounting Standards Board (FASB) Accounting Standards Codification Topic 946, Financial Services – Investment Companies (ASC 946). Subsequent events, if any, through the date that the financial statements were issued have been evaluated in the preparation of the financial statements.
A Investment Valuation— Net asset value per share is determined every business day as of the close of the regular session of the New York Stock Exchange (generally 4:00 p.m. Eastern time). The Fund uses independent pricing services approved by the Board of Directors (the Board) to value its investments wherever possible. Investments for which market quotations are not available or deemed not reliable are fair valued in good faith under the direction of the Board.
U.S. generally accepted accounting principles (U.S. GAAP) establishes a disclosure hierarchy that categorizes the inputs to valuation techniques used to value assets and liabilities at measurement date. These inputs are summarized in the three broad levels listed below:
Level 1 - quoted prices in active markets for identical securities
Level 2 - other significant observable inputs (including quoted prices for similar securities, interest rates, prepayment speeds, credit risk, etc.)
Level 3 - significant unobservable inputs (including the Fund’s own assumptions in determining the fair value of investments)
The inputs or methodologies used for valuing securities are not necessarily an indication of the risk associated with investing in those securities.
Valuation techniques used to value the Fund’s investments by major category are as follows:
Equity Securities. Equity securities (including warrants and rights) listed on a U.S. securities exchange generally are valued at the last sale or closing price as reported by an independent pricing service on the primary market or exchange on which they are traded and are categorized as Level 1 in the hierarchy. Equity securities listed on the NASDAQ National Market System are valued at the NASDAQ official closing price and are categorized as Level 1 in the hierarchy. Unlisted or listed securities for which closing sales prices or closing quotations are not available are valued at the mean between the latest available bid and ask prices and are categorized as Level 2 in the hierarchy.
Short-Term Debt Securities. Short-term debt securities with a remaining maturity at time of purchase of more than sixty days are valued based on valuations provided by a third party pricing service. Such securities are generally categorized as Level 2 in the hierarchy. Short-term debt securities of sufficient credit quality purchased with remaining maturities of sixty days or less for which a valuation from a third party pricing service is not readily available may be valued at amortized cost, which approximates fair value, and are categorized as Level 2 in the hierarchy.
Affiliated Fund. The Fund may invest in Calvert Cash Reserves Fund, LLC (Cash Reserves Fund), an affiliated investment company managed by Calvert Research and Management (CRM). While Cash Reserves Fund is not a registered money market mutual fund, it conducts all of its investment activities in accordance with the requirements of Rule 2a-7 under the 1940 Act. Investments in Cash Reserves Fund are valued at the closing net asset value per unit on the valuation day and are categorized as Level 2 in the hierarchy. Cash Reserves Fund generally values its investment securities based on available market quotations provided by a third party pricing service.
Other Securities. Exchange-traded funds are valued at the official closing price as reported by an independent pricing service on the primary market or exchange on which they are traded and are categorized as Level 1 in the hierarchy. Investments in registered investment companies (including money market funds) that do not trade on an exchange are valued at the net asset value per share on the valuation day and are categorized as Level 1 in the hierarchy.
Derivatives. Futures contracts are valued at unrealized appreciation (depreciation) based on the settlement price established each day by the board of trade or exchange on which they are traded and are categorized as Level 1 in the hierarchy.
Fair Valuation. If a market value cannot be determined for a security using the methodologies described above, or if, in the good faith opinion of the Fund's adviser, the market value does not constitute a readily available market quotation, or if a significant event has occurred that would materially affect the value of the security, the security will be fair valued as determined in good faith by or at the direction of the Board in a manner that most fairly reflects the security’s “fair value”, which is the amount that the Fund might reasonably expect to receive for the security upon its current sale in the ordinary course. Each such determination is based on a consideration of relevant factors, which are likely to vary from one pricing context to another. These factors may
Calvert
VP Nasdaq 100 Index Portfolio
December 31, 2021
Notes to Financial Statements — continued
include, but are not limited to, the type of security, the existence of any contractual restrictions on the security’s disposition, the price and extent of public trading in similar securities of the issuer or of comparable companies or entities, quotations or relevant information obtained from broker/dealers or other market participants, information obtained from the issuer, analysts, and/or the appropriate stock exchange (for exchange-traded securities), an analysis of the company’s or entity’s financial statements, and an evaluation of the forces that influence the issuer and the market(s) in which the security is purchased and sold.
The values assigned to fair value investments are based on available information and do not necessarily represent amounts that might ultimately be realized. Further, due to the inherent uncertainty of valuations of such investments, the fair values may differ significantly from the values that would have been used had an active market existed, and the differences could be material.
The following table summarizes the market value of the Fund's holdings as of December 31, 2021, based on the inputs used to value them:
| Asset Description | Level 1 | Level 2 | Level 3 | Total |
| Common Stocks | $ 329,389,958(1) | $ — | $ — | $ 329,389,958 |
| Exchange-Traded Funds | 4,177,425 | — | — | 4,177,425 |
| Short-Term Investments: | | | | |
| Affiliated Fund | — | 6,793,210 | — | 6,793,210 |
| Securities Lending Collateral | 149,891 | — | — | 149,891 |
| U.S. Treasury Obligations | — | 499,984 | — | 499,984 |
| Total Investments | $333,717,274 | $7,293,194 | $ — | $341,010,468 |
| Futures Contracts | $ 88,560 | $ — | $ — | $ 88,560 |
| Total | $333,805,834 | $7,293,194 | $ — | $341,099,028 |
| (1) | The level classification by major category of investments is the same as the category presentation in the Schedule of Investments. |
B Investment Transactions and Income— Investment transactions for financial statement purposes are accounted for on trade date. Realized gains and losses are recorded on an identified cost basis and may include proceeds from litigation. Dividend income is recorded on the ex-dividend date for dividends received in cash and/or securities. Non-cash dividends are recorded at the fair value of the securities received. Withholding taxes on foreign dividends, if any, have been provided for in accordance with the Fund's understanding of the applicable country’s tax rules and rates. Distributions received that represent a return of capital are recorded as a reduction of cost of investments. Distributions received that represent a capital gain are recorded as a realized gain. Interest income, which includes amortization of premium and accretion of discount on debt securities, is accrued as earned.
C Share Class Accounting— Realized and unrealized gains and losses and net investment income and losses, other than class-specific expenses, are allocated daily to each class of shares based upon the relative net assets of each class to the total net assets of the Fund. Expenses arising in connection with a specific class are charged directly to that class.
D Futures Contracts— The Fund may enter into futures contracts to buy or sell a financial instrument for a set price at a future date. Initial margin deposits of either cash or securities as required by the broker are made upon entering into the contract. While the contract is open, daily variation margin payments are made to or received from the broker reflecting the daily change in market value of the contract and are recorded for financial reporting purposes as unrealized gains or losses by the Fund. When a futures contract is closed, a realized gain or loss is recorded equal to the difference between the opening and closing value of the contract. The risks associated with entering into futures contracts may include the possible illiquidity of the secondary market which would limit the Fund’s ability to close out a futures contract prior to the settlement date, an imperfect correlation between the value of the contracts and the underlying financial instruments, or that the counterparty will fail to perform its obligations under the contracts’ terms. Futures contracts are designed by boards of trade, which are designated “contracts markets” by the Commodities Futures Trading Commission. Futures contracts trade on the contracts markets in a manner that is similar to the way a stock trades on a stock exchange, and the boards of trade, through their clearing corporations, guarantee the futures contracts against default. As a result, there is minimal counterparty credit risk to the Fund.
E Distributions to Shareholders— Distributions to shareholders are recorded by the Fund on ex-dividend date. The Fund distributes any net investment income and net realized capital gains at least annually. Both types of distributions are made in shares of the Fund unless an election is made on behalf of a separate account to receive some or all of the distributions in cash. Distributions are declared separately for each class of shares. Distributions are determined in accordance with income tax regulations, which may differ from U.S. GAAP; accordingly, periodic reclassifications are made within the Fund's capital accounts to reflect income and gains available for distribution under income tax regulations.
F Estimates— The preparation of financial statements in conformity with U.S. GAAP requires management to make estimates and assumptions that affect the reported amounts of assets and liabilities and disclosure of contingent assets and liabilities at the date of the financial statements and the reported amounts of increases and decreases in net assets from operations during the reporting period. Actual results could differ from those estimates.
Calvert
VP Nasdaq 100 Index Portfolio
December 31, 2021
Notes to Financial Statements — continued
G Indemnifications— The Corporation’s By-Laws provide for indemnification for Directors or officers of the Corporation and certain other parties, to the fullest extent permitted by Maryland law and the 1940 Act, provided certain conditions are met. Additionally, in the normal course of business, the Fund enters into agreements with service providers that may contain indemnification clauses. The Fund’s maximum exposure under these arrangements is unknown as this would involve future claims that may be made against the Fund that have not yet occurred.
H Federal Income Taxes— No provision for federal income or excise tax is required since the Fund intends to continue to qualify as a regulated investment company under the Internal Revenue Code and to distribute substantially all of its taxable earnings.
Management has analyzed the Fund's tax positions taken for all open federal income tax years and has concluded that no provision for federal income tax is required in the Fund's financial statements. A Fund's federal tax return is subject to examination by the Internal Revenue Service for a period of three years from the date of filing.
2 Related Party Transactions
The investment advisory fee is earned by CRM as compensation for investment advisory services rendered to the Fund. On March 1, 2021, Morgan Stanley acquired Eaton Vance Corp. (the “Transaction”) and CRM became an indirect, wholly-owned subsidiary of Morgan Stanley. In connection with the Transaction, the Fund entered into a new investment advisory agreement (the “New Agreement”) with CRM, which took effect on March 1, 2021. Pursuant to the New Agreement (and the Fund’s investment advisory agreement with CRM in effect prior to March 1, 2021), the fee is computed at the annual rate of 0.30% of the Fund’s average daily net assets and is payable monthly. For the year ended December 31, 2021, the investment advisory fee amounted to $895,395. The Fund may invest its cash in Cash Reserves Fund. CRM does not currently receive a fee for advisory services provided to Cash Reserves Fund.
Pursuant to an investment sub-advisory agreement, CRM has delegated the investment management of the Fund to Ameritas Investment Partners, Inc. (AIP). In connection with the Transaction, CRM entered into a new investment sub-advisory agreement with AIP, which took effect on March 1, 2021. CRM pays AIP a portion of its investment advisory fee for sub-advisory services provided to the Fund.
CRM has agreed to reimburse the Fund’s operating expenses to the extent that total annual operating expenses (relating to ordinary operating expenses only and excluding expenses such as brokerage commissions, acquired fund fees and expenses of unaffiliated funds, borrowing costs, taxes or litigation expenses) exceed 0.48% for Class I and 0.73% for Class F of such class’s average daily net assets. The expense reimbursement agreement with CRM may be changed or terminated after April 30, 2022. For the year ended December 31, 2021, CRM waived or reimbursed expenses of $327,666.
The administrative fee is earned by CRM as compensation for administrative services rendered to the Fund. The fee is computed at an annual rate of 0.12% of the Fund’s average daily net assets attributable to Class I and Class F and is payable monthly. For the year ended December 31, 2021, CRM was paid administrative fees of $358,158.
The Fund has in effect a distribution plan for Class F shares (Class F Plan) pursuant to Rule 12b-1 under the 1940 Act. Pursuant to the Class F Plan, the Fund pays Eaton Vance Distributors, Inc. (EVD), an affiliate of CRM and the Fund’s principal underwriter, a distribution and service fee of 0.25% per annum of its average daily net assets attributable to Class F shares for distribution services and facilities provided to the Fund, as well as for personal and/or account maintenance services provided to the class shareholders. Distribution and service fees paid or accrued for the year ended December 31, 2021 amounted to $93,854 for Class F shares.
Eaton Vance Management (EVM), an affiliate of CRM, provides sub-transfer agency and related services to the Fund pursuant to a Sub-Transfer Agency Support Services Agreement. For the year ended December 31, 2021, sub-transfer agency fees and expenses incurred to EVM amounted to $543 and are included in transfer agency fees and expenses on the Statement of Operations.
Each Director of the Fund who is not an employee of CRM or its affiliates receives an annual fee of $154,000 ($214,000 effective January 1, 2022), plus an annual Committee fee ranging from $8,500 to $16,500 depending on the Committee. The Board chair receives an additional $30,000 annual fee, Committee chairs receive an additional $6,000 annual fee and the special equities liaison receives an additional $2,500 annual fee. Eligible Directors may participate in a Deferred Compensation Plan (the Plan). Amounts deferred under the Plan are treated as though equal dollar amounts had been invested in shares of the Fund or other Calvert funds selected by the Directors. The Fund purchases shares of the funds selected equal to the dollar amounts deferred under the Plan, resulting in an asset equal to the deferred compensation liability. Obligations of the Plan are paid solely from the Fund's assets. Directors’ fees are allocated to each of the Calvert funds served. Salaries and fees of officers and Directors of the Fund who are employees of CRM or its affiliates are paid by CRM.
Calvert
VP Nasdaq 100 Index Portfolio
December 31, 2021
Notes to Financial Statements — continued
3 Shareholder Servicing Plan
The Corporation, on behalf of the Fund, has adopted a Shareholder Servicing Plan (Servicing Plan), which permits the Fund to enter into shareholder servicing agreements with intermediaries that maintain accounts in the Fund for the benefit of shareholders. These services may include, but are not limited to, processing purchase and redemption requests, processing dividend payments, and providing account information to shareholders. Under the Servicing Plan, the Fund may make payments at an annual rate of up to 0.11% of its average daily net assets. For the year ended December 31, 2021, expenses incurred under the Servicing Plan amounted to $276,669, of which $73,443 were payable to an affiliate of AIP, and are included in transfer agency fees and expenses on the Statement of Operations. Included in accrued expenses at December 31, 2021 are amounts payable to an affiliate of AIP under the Servicing Plan of $6,390.
4 Investment Activity
During the year ended December 31, 2021, the cost of purchases and proceeds from sales of investments, other than short-term securities, were $34,304,292 and $24,550,206, respectively.
5 Distributions to Shareholders and Income Tax Information
The tax character of distributions declared for the years ended December 31, 2021 and December 31, 2020 was as follows:
| | Year Ended December 31, |
| | 2021 | 2020 |
| Ordinary income | $ 1,590,871 | $1,787,445 |
| Long-term capital gains | $15,989,793 | $6,833,375 |
As of December 31, 2021, the components of distributable earnings (accumulated loss) on a tax basis were as follows:
| Undistributed ordinary income | $ 2,001,395 |
| Undistributed long-term capital gains | 11,409,017 |
| Net unrealized appreciation | 241,598,645 |
| Distributable earnings | $255,009,057 |
The cost and unrealized appreciation (depreciation) of investments, including open derivative contracts, of the Fund at December 31, 2021, as determined on a federal income tax basis, were as follows:
| Aggregate cost | $ 99,411,823 |
| Gross unrealized appreciation | $ 245,060,399 |
| Gross unrealized depreciation | (3,461,754) |
| Net unrealized appreciation | $241,598,645 |
6 Financial Instruments
A summary of futures contracts outstanding at December 31, 2021 is included in the Schedule of Investments. During the year ended December 31, 2021, the Fund used futures contracts to provide equity market exposure for uncommitted cash balances.
Calvert
VP Nasdaq 100 Index Portfolio
December 31, 2021
Notes to Financial Statements — continued
At December 31, 2021, the fair value of open derivative instruments (not considered to be hedging instruments for accounting disclosure purposes) and whose primary underlying risk exposure is equity price risk was as follows:
| Derivative | Statement of Assets and Liabilities Caption | Assets | Liabilities |
| Futures contracts | Distributable earnings | | $88,560 (1) | $ — |
| (1) | Only the current day's variation margin is reported within the Statement of Assets and Liabilities as Receivable or Payable for variation margin on open futures contracts, as applicable. |
The effect of derivative instruments (not considered to be hedging instruments for accounting disclosure purposes) on the Statement of Operations and whose primary underlying risk exposure is equity price risk for the year ended December 31, 2021 was as follows:
| | Statement of Operations Caption | |
| Derivative | Net realized gain (loss): Futures
contracts | Change in unrealized appreciation
(depreciation): Futures contracts |
| Futures contracts | $ 1,265,485 | $ 5,855 |
The average notional cost of futures contracts (long) outstanding during the year ended December 31, 2021 was approximately $5,497,000.
7 Securities Lending
To generate additional income, the Fund may lend its securities pursuant to a securities lending agency agreement with State Street Bank and Trust Company (SSBT), the securities lending agent. Security loans are subject to termination by the Fund at any time and, therefore, are not considered illiquid investments. The Fund requires that the loan be continuously collateralized by either cash or securities in an amount at least equal to the market value of the securities on loan. The market value of securities loaned is determined daily and any additional required collateral is delivered to the Fund on the next business day. Cash collateral is generally invested in a money market fund registered under the 1940 Act that is managed by an affiliate of SSBT. Any gain or loss in the market price of the loaned securities that might occur and any interest earned or dividends declared during the term of the loan would accrue to the account of the Fund. Income earned on the investment of collateral, net of broker rebates and other expenses incurred by the securities lending agent, is split between the Fund and the securities lending agent based on agreed upon contractual terms. Non-cash collateral, if any, is held by the lending agent on behalf of the Fund and cannot be sold or re-pledged by the Fund; accordingly, such collateral is not reflected in the Statement of Assets and Liabilities.
The risks associated with lending portfolio securities include, but are not limited to, possible delays in receiving additional collateral or in the recovery of the loaned securities, possible loss of rights to the collateral should the borrower fail financially, as well as risk of loss in the value of the collateral or the value of the investments made with the collateral. The securities lending agent shall indemnify the Fund in the case of default of any securities borrower.
At December 31, 2021, the total value of securities on loan was $4,187,348 and the total value of collateral received was $4,367,809, comprised of cash of $149,891 and U.S. government and/or agencies securities of $4,217,918.
The following table provides a breakdown of securities lending transactions accounted for as secured borrowings, the obligations by class of collateral pledged, and the remaining contractual maturity of those transactions as of December 31, 2021.
| | Remaining Contractual Maturity of the Transactions |
| | Overnight and
Continuous | <30 days | 30 to 90 days | >90 days | Total |
| Common Stocks | $149,891 | $ — | $ — | $ — | $149,891 |
The carrying amount of the liability for deposits for securities loaned at December 31, 2021 approximated its fair value. If measured at fair value, such liability would have been considered as Level 2 in the fair value hierarchy (see Note 1A) at December 31, 2021.
Calvert
VP Nasdaq 100 Index Portfolio
December 31, 2021
Notes to Financial Statements — continued
8 Line of Credit
The Fund participates with other portfolios and funds managed by EVM and its affiliates, including CRM, in an $800 million unsecured line of credit with a group of banks, which is in effect through October 25, 2022. Borrowings are made by the Fund solely for temporary purposes related to redemptions and other short-term cash needs. Interest is charged to the Fund based on its borrowings at an amount above either the Secured Overnight Financing Rate (SOFR) or Federal Funds rate. In addition, a fee computed at an annual rate of 0.15% on the daily unused portion of the line of credit is allocated among the participating portfolios and funds at the end of each quarter. In connection with the renewal of the agreement in October 2021, an arrangement fee of $150,000 was incurred that was allocated to the participating portfolios and funds. Because the line of credit is not available exclusively to the Fund, it may be unable to borrow some or all of its requested amounts at any particular time.
The Fund had no borrowings pursuant to its line of credit during the year ended December 31, 2021.
9 Affiliated Funds
At December 31, 2021, the value of the Fund’s investment in affiliated funds was $6,793,210, which represents 2.0% of the Fund’s net assets. Transactions in affiliated funds by the Fund for the year ended December 31, 2021 were as follows:
| Name | Value,
beginning
of period | Purchases | Sales
proceeds | Net
realized
gain
(loss) | Change in
unrealized
appreciation
(depreciation) | Value,
end of
period | Dividend
income | Units,
end of
period |
| Short-Term Investments | | | | | | |
| Calvert Cash Reserves Fund, LLC | $6,815,779 | $28,505,035 | $(28,526,933) | $(754) | $83 | $6,793,210 | $4,257 | 6,793,210 |
10 Capital Shares
The Corporation may issue its shares in one or more series (such as the Fund). The authorized shares of the Fund consist of 10,000,000 common shares, $0.10 par value, for each Class.
Transactions in capital shares for the years ended December 31, 2021 and December 31, 2020 were as follows:
| | Year Ended
December 31, 2021 | | Year Ended
December 31, 2020 |
| | Shares | Amount | | Shares | Amount |
| Class I | | | | | |
| Shares sold | 151,653 | $ 20,354,884 | | 216,656 | $ 21,431,435 |
| Reinvestment of distributions | 113,552 | 15,076,297 | | 75,024 | 8,059,877 |
| Shares redeemed | (240,249) | (32,628,020) | | (401,664) | (39,253,104) |
| Net increase (decrease) | 24,956 | $ 2,803,161 | | (109,984) | $ (9,761,792) |
| Class F | | | | | |
| Shares sold | 168,919 | $ 22,240,160 | | 132,617 | $ 13,596,528 |
| Reinvestment of distributions | 19,204 | 2,504,367 | | 5,297 | 560,943 |
| Shares redeemed | (12,953) | (1,649,922) | | (13,448) | (1,365,481) |
| Net increase | 175,170 | $ 23,094,605 | | 124,466 | $ 12,791,990 |
At December 31, 2021, separate accounts of an insurance company that is an affiliate of AIP owned 30.8% of the value of the outstanding shares of the Fund and separate accounts of three other insurance companies each owned more than 10% of the value of the outstanding shares of the Fund, aggregating 56.3%.
Calvert
VP Nasdaq 100 Index Portfolio
December 31, 2021
Notes to Financial Statements — continued
11 Risks and Uncertainties
Pandemic Risk
An outbreak of respiratory disease caused by a novel coronavirus was first detected in China in late 2019 and subsequently spread internationally. This coronavirus has resulted in closing borders, enhanced health screenings, changes to healthcare service preparation and delivery, quarantines, cancellations, disruptions to supply chains and customer activity, as well as general concern and uncertainty. Health crises caused by outbreaks, such as the coronavirus outbreak, may exacerbate other pre-existing political, social and economic risks and disrupt normal market conditions and operations. The impact of this outbreak has negatively affected the worldwide economy, the economies of individual countries, individual companies, and the market in general, and may continue to do so in significant and unforeseen ways, as may other epidemics and pandemics that may arise in the future. Any such impact could adversely affect the Fund's performance, or the performance of the securities in which the Fund invests.
12 Change in Independent Registered Public Accounting Firm
On July 30, 2021, KPMG LLP (“KPMG”) informed the Audit Committee and Board of the Corporation that it was resigning as the independent registered public accounting firm to the Corporation, as upon Morgan Stanley’s acquisition of Eaton Vance Corp., the parent company of CRM (the investment adviser to each series of the Corporation), KPMG would no longer be independent of the Corporation. The Audit Committee of the Board and the Board approved the selection of Deloitte & Touche LLP (“Deloitte”) as the independent registered public accounting firm for the funds that are series of the Corporation (the “Funds”) for the fiscal year ending December 31, 2021 to be effective upon KPMG’s resignation and Deloitte’s acceptance of the engagement which became effective July 30, 2021.
KPMG’s reports on the financial statements for the Funds for the fiscal periods ended December 31, 2019 and December 31, 2020 contained no adverse opinion or disclaimer of opinion nor were they qualified or modified as to uncertainty, audit scope or accounting principles. During the fiscal periods ended December 31, 2019 and December 31, 2020, and during the subsequent interim period through July 30, 2021: (i) there were no disagreements with KPMG on any matter of accounting principles or practices, financial statement disclosure or auditing scope or procedure, which disagreements, if not resolved to the satisfaction of KPMG, would have caused KPMG to make reference to the subject matter of the disagreements in connection with its reports on the Funds’ financial statements for such periods; and (ii) there were no “reportable events” of the kind described in Item 304(a)(1)(v) of Regulation S-K under the Securities Exchange Act of 1934, as amended.
During the fiscal periods ended December 31, 2019 and December 31, 2020, and during the subsequent interim period through July 30, 2021: neither the Funds, nor anyone on their behalf, consulted with Deloitte on items which: (i) concerned the application of accounting principles to a specified transaction, either completed or proposed, or the type of audit opinion that might be rendered on the Funds’ financial statements; or (ii) concerned the subject of a disagreement (as defined in paragraph (a)(1)(iv) of Item 304 of Regulation S-K) or reportable events (as described in paragraph (a)(1)(v) of Item 304).
Calvert
VP Nasdaq 100 Index Portfolio
December 31, 2021
Report of Independent Registered Public Accounting Firm
To the Board of Directors of Calvert Variable Products, Inc. and Shareholders of Calvert VP Nasdaq 100 Index Portfolio:
Opinion on the Financial Statements and Financial Highlights
We have audited the accompanying statement of assets and liabilities of Calvert VP Nasdaq 100 Index Portfolio (the "Fund") (one of the funds constituting Calvert Variable Products, Inc.), including the schedule of investments, as of December 31, 2021, the related statements of operations, changes in net assets, and the financial highlights for the year then ended, and the related notes. In our opinion, the financial statements and financial highlights present fairly, in all material respects, the financial position of the Fund as of December 31, 2021, and the results of its operations, changes in its net assets, and the financial highlights for the year then ended in conformity with accounting principles generally accepted in the United States of America. The statement of changes in net assets for the year ended December 31, 2020, and the financial highlights for the years ended December 31, 2020, 2019, 2018, and 2017 were audited by other auditors whose report, dated February 18, 2021, expressed an unqualified opinion on that financial statement and those financial highlights.
Basis for Opinion
These financial statements and financial highlights are the responsibility of the Fund's management. Our responsibility is to express an opinion on the Fund's financial statements and financial highlights based on our audit. We are a public accounting firm registered with the Public Company Accounting Oversight Board (United States) (PCAOB) and are required to be independent with respect to the Fund in accordance with the U.S. federal securities laws and the applicable rules and regulations of the Securities and Exchange Commission and the PCAOB.
We conducted our audit in accordance with the standards of the PCAOB. Those standards require that we plan and perform the audit to obtain reasonable assurance about whether the financial statements and financial highlights are free of material misstatement, whether due to error or fraud. The Fund is not required to have, nor were we engaged to perform, an audit of its internal control over financial reporting. As part of our audit, we are required to obtain an understanding of internal control over financial reporting but not for the purpose of expressing an opinion on the effectiveness of the Fund’s internal control over financial reporting. Accordingly, we express no such opinion.
Our audit included performing procedures to assess the risks of material misstatement of the financial statements and financial highlights, whether due to error or fraud, and performing procedures that respond to those risks. Such procedures included examining, on a test basis, evidence regarding the amounts and disclosures in the financial statements and financial highlights. Our audit also included evaluating the accounting principles used and significant estimates made by management, as well as evaluating the overall presentation of the financial statements and financial highlights. Our procedures included confirmation of securities owned as of December 31, 2021, by correspondence with the custodian and brokers; when replies were not received from brokers, we performed other auditing procedures. We believe that our audit provides a reasonable basis for our opinion.
/s/ Deloitte & Touche LLP
Boston, Massachusetts
February 18, 2022
We have served as the auditor of one or more Calvert investment companies since 2021.
Calvert
VP Nasdaq 100 Index Portfolio
December 31, 2021
Federal Tax Information (Unaudited)
As required by the Internal Revenue Code and/or regulations, shareholders must be notified regarding the status of the dividends received deduction for corporations and capital gains dividends.
Dividends Received Deduction. Corporate shareholders are generally entitled to take the dividends received deduction on the portion of the Fund's dividend distribution that qualifies under tax law. For the Fund's fiscal 2021 ordinary income dividends, 100% qualifies for the corporate dividends received deduction.
Capital Gains Dividends. The Fund hereby designates as a capital gain dividend with respect to the taxable year ended December 31, 2021, $11,409,228 or, if subsequently determined to be different, the net capital gain of such year.
Calvert
VP Nasdaq 100 Index Portfolio
December 31, 2021
Management and Organization
Fund Management. The Directors of Calvert Variable Products, Inc. (the Corporation) are responsible for the overall management and supervision of the affairs of the Corporation. The Board members and officers of the Corporation are listed below. Except as indicated, each individual has held the office shown or other offices in the same company for the last five years. Board members hold indefinite terms of office. Each Board member holds office until his or her successor is elected and qualified, or until his or her earlier death, resignation, retirement, removal or disqualification. Under the terms of the Fund’s current Board member retirement policy, an Independent Board member must retire at the end of the calendar year in which he or she turns 75. However, if such retirement would cause the Fund to be out of compliance with Section 16 of the 1940 Act or any other regulations or guidance of the SEC, then such retirement will not become effective until such time as action has been taken for the Fund to be in compliance therewith. The “noninterested Directors” consist of those Directors who are not “interested persons” of the Corporation, as that term is defined under the 1940 Act. The business address of each Board member and the Chief Compliance Officer is 1825 Connecticut Avenue, NW, Suite 400, Washington, DC 20009 and the business address of the Secretary, Vice President and Chief Legal Officer and the Treasurer is Two International Place, Boston, Massachusetts 02110. As used below, “CRM” refers to Calvert Research and Management and “Eaton Vance” refers to Eaton Vance Management. Each Director oversees 39 funds in the Calvert fund complex. Effective March 1, 2021, each of Eaton Vance and CRM are indirect, wholly-owned subsidiaries of Morgan Stanley. Each officer affiliated with CRM may hold a position with other CRM affiliates that is comparable to his or her position with CRM listed below.
| Name and Year of Birth | Corporation
Position(s) | Length of
Service | Principal Occupation(s) and Other Directorships
During Past Five Years and Other Relevant Experience |
| Interested Director |
John H. Streur(1)
1960 | Director and
President | Since 2015 | President and Chief Executive Officer of CRM (since December 31, 2016). President and Chief Executive Officer of Calvert Investments, Inc.
(January 2015 - December 2016); Chief Executive Officer of Calvert
Investment Distributors, Inc. (August 2015 - December 2016); Chief
Compliance Officer of Calvert Investment Management, Inc. (August 2015 -
April 2016); President and Director, Portfolio 21 Investments, Inc.
(through October 2014); President, Chief Executive Officer and
Director, Managers Investment Group LLC (through January 2012);
President and Director, The Managers Funds and Managers AMG
Funds (through January 2012).
Other Directorships. Portfolio 21 Investments, Inc. (asset management)
(through October 2014); Managers Investment Group LLC (asset management)
(through January 2012); The Managers Funds (asset management)
(through January 2012); Managers AMG Funds (asset management)
(through January 2012); Calvert Impact Capital, Inc. |
| Noninterested Directors |
Richard L. Baird, Jr.
1948 | Director | Since 2016 | Regional Disaster Recovery Lead, American Red Cross of Greater
Pennsylvania (since 2017). Volunteer, American Red Cross (since 2015).
Former President and CEO of Adagio Health Inc. (retired in 2014) in
Pittsburgh, PA.
Other Directorships. None. |
Alice Gresham Bullock
1950 | Chair and
Director | Since 2016 (Chair);
Since 2008 (Director) | Professor Emerita at Howard University School of Law. Dean Emerita of
Howard University School of Law and Deputy Director of the Association
of American Law Schools (1992-1994).
Other Directorships. None. |
Cari M. Dominguez
1949 | Director | Since 2016 | Former Chair of the U.S. Equal Employment Opportunity Commission.
Other Directorships. ManpowerGroup Inc. (workforce solutions company);
Triple S Management Corporation (managed care); National Association of Corporate Directors. |
John G. Guffey, Jr.
1948 | Director | Since 2016 | President of Aurora Press Inc., a privately held publisher of trade
paperbacks (since January 1997).
Other Directorships. Calvert Impact Capital, Inc. (through
December 31, 2018); Calvert Ventures, LLC. |
Miles D. Harper, III
1962 | Director | Since 2016 | Partner, Carr Riggs & Ingram (public accounting firm) since October 2014.
Partner, Gainer Donnelly & Desroches (public accounting firm) (now Carr
Riggs & Ingram) (November 1999 - September 2014).
Other Directorships. Bridgeway Funds (9) (asset management). |
Joy V. Jones
1950 | Director | Since 2016 | Attorney.
Other Directorships. Palm Management Corporation. |
Calvert
VP Nasdaq 100 Index Portfolio
December 31, 2021
Management and Organization — continued
| Name and Year of Birth | Corporation
Position(s) | Length of
Service | Principal Occupation(s) and Other Directorships
During Past Five Years and Other Relevant Experience |
| Noninterested Directors (continued) |
Anthony A. Williams
1951 | Director | Since 2016 | CEO and Executive Director of the Federal City Council (July 2012 to
present); Senior Adviser and Independent Consultant for King and
Spalding LLP (September 2015 to present); Executive Director of Global
Government Practice at the Corporate Executive Board (January 2010 to
January 2012).
Other Directorships. Freddie Mac; Evoq Properties/Meruelo Maddux
Properties, Inc. (real estate management); Weston Solutions, Inc.
(environmental services); Bipartisan Policy Center’s Debt Reduction Task Force;
Chesapeake Bay Foundation; Catholic University of America; Urban Institute (research organization); The Howard Hughes Corporation (real estate development). |
| Name and Year of Birth | Corporation
Position(s) | Length of
Service | Principal Occupation(s)
During Past Five Years |
| Principal Officers who are not Directors |
Hope L. Brown
1973 | Chief
Compliance
Officer | Since 2014 | Chief Compliance Officer of 39 registered investment companies advised
by CRM (since 2014). Vice President and Chief Compliance Officer,
Wilmington Funds (2012-2014). |
Deidre E. Walsh
1971 | Secretary,
Vice President
and Chief
Legal Officer | Since 2021 | Vice President of CRM and officer of 39 registered investment companies
advised by CRM (since 2021). Also Vice President of Eaton Vance and
certain of its affiliates and officer of 138 registered investment companies
advised or administered by Eaton Vance. |
James F. Kirchner
1967 | Treasurer | Since 2016 | Vice President of CRM and officer of 39 registered investment companies
advised by CRM (since 2016). Also Vice President of Eaton Vance and
certain of its affiliates and officer of 138 registered investment companies
advised or administered by Eaton Vance. |
| | | | |
| (1) Mr. Streur is an interested person of the Fund because of his positions with the Fund’s adviser and certain affiliates. |
The SAI for the Fund includes additional information about the Directors and officers of the Fund and can be obtained without charge on Calvert’s website at www.calvert.com or by calling 1-800-368-2745.
| FACTS | WHAT DOES EATON VANCE DO WITH YOUR
PERSONAL INFORMATION? |
| Why? | Financial companies choose how they share your personal information. Federal law gives consumers the right to limit some but not all sharing. Federal law also requires us to tell you how we collect, share, and protect your personal information. Please read this notice carefully to understand what we do. |
| |
| What? | The types of personal information we collect and share depend on the product or service you have with us. This information can include:■ Social Security number and income
■
investment experience and risk tolerance
■
checking account number and wire transfer instructions |
| |
| How? | All financial companies need to share customers’ personal information to run their everyday business. In the section below, we list the reasons financial companies can share their customers’ personal information; the reasons Eaton Vance chooses to share; and whether you can limit this sharing. |
Reasons we can share your
personal information | Does Eaton Vance
share? | Can you limit
this sharing? |
| For our everyday business purposes — such as to process your transactions, maintain your account(s), respond to court orders and legal investigations, or report to credit bureaus | Yes | No |
| For our marketing purposes — to offer our products and services to you | Yes | No |
| For joint marketing with other financial companies | No | We don’t share |
| For our investment management affiliates’ everyday business purposes — information about your transactions, experiences, and creditworthiness | Yes | Yes |
| For our affiliates’ everyday business purposes — information about your transactions and experiences | Yes | No |
| For our affiliates’ everyday business purposes — information about your creditworthiness | No | We don’t share |
| For our investment management affiliates to market to you | Yes | Yes |
| For our affiliates to market to you | No | We don’t share |
| For nonaffiliates to market to you | No | We don’t share |
To limit our
sharing | Call toll-free 1-800-368-2745 or email: CRMPrivacy@calvert.comPlease note:If you are a new customer, we can begin sharing your information 30 days from the date we sent this notice. When you are no longer our customer, we continue to share your information as described in this notice. However, you can contact us at any time to limit our sharing. |
| Questions? | Call toll-free 1-800-368-2745 or email: CRMPrivacy@calvert.com |
| Privacy Notice — continued | April 2021 |
| Who we are |
| Who is providing this notice? | Eaton Vance Management, Eaton Vance Distributors, Inc., Eaton Vance Trust Company, Eaton Vance Management (International) Limited, Eaton Vance Advisers International Ltd., Eaton Vance Global Advisors Limited, Eaton Vance Management’s Real Estate Investment Group, Boston Management and Research, Calvert Research and Management, Eaton Vance and Calvert Fund Families and our investment advisory affiliates (“Eaton Vance”) (see Investment Management Affiliates definition below) |
| What we do |
How does Eaton Vance
protect my personal
information? | To protect your personal information from unauthorized access and use, we use security measures that comply with federal law. These measures include computer safeguards and secured files and buildings. We have policies governing the proper handling of customer information by personnel and requiring third parties that provide support to adhere to appropriate security standards with respect to such information. |
How does Eaton Vance
collect my personal
information? | We collect your personal information, for example, when you■ open an account or make deposits or withdrawals from your account
■
buy securities from us or make a wire transfer
■
give us your contact informationWe also collect your personal information from others, such as credit bureaus, affiliates, or other companies. |
| Why can’t I limit all sharing? | Federal law gives you the right to limit only■ sharing for affiliates’ everyday business purposes — information about your creditworthiness
■
affiliates from using your information to market to you
■
sharing for nonaffiliates to market to youState laws and individual companies may give you additional rights to limit sharing. See below for more on your rights under state law. |
| Definitions |
Investment Management
Affiliates | Eaton Vance Investment Management Affiliates include registered investment advisers, registered broker- dealers, and registered and unregistered funds. Investment Management Affiliates does not include entities associated with Morgan Stanley Wealth Management, such as Morgan Stanley Smith Barney LLC and Morgan Stanley & Co. |
| Affiliates | Companies related by common ownership or control. They can be financial and nonfinancial companies.■ Our affiliates include companies with a Morgan Stanley name and financial companies such as Morgan Stanley Smith Barney LLC and Morgan Stanley & Co. |
| Nonaffiliates | Companies not related by common ownership or control. They can be financial and nonfinancial companies.■ Eaton Vance does not share with nonaffiliates so they can market to you. |
| Joint marketing | A formal agreement between nonaffiliated financial companies that together market financial products or services to you.■ Eaton Vance doesn’t jointly market. |
| Other important information |
| Vermont: Except as permitted by law, we will not share personal information we collect about Vermont residents with Nonaffiliates unless you provide us with your written consent to share such information.California: Except as permitted by law, we will not share personal information we collect about California residents with Nonaffiliates and we will limit sharing such personal information with our Affiliates to comply with California privacy laws that apply to us. |
Delivery of Shareholder Documents. The Securities and Exchange Commission (SEC) permits funds to deliver only one copy of shareholder documents, including prospectuses, proxy statements and shareholder reports, to fund investors with multiple accounts at the same residential or post office box address. This practice is often called “householding” and it helps eliminate duplicate mailings to shareholders. Calvert funds, or your financial intermediary, may household the mailing of your documents indefinitely unless you instruct Calvert funds, or your financial intermediary, otherwise. If you would prefer that your Calvert fund documents not be householded, please contact Calvert funds at 1-800-368-2745, or contact your financial intermediary. Your instructions that householding not apply to delivery of your Calvert fund documents will typically be effective within 30 days of receipt by Calvert funds or your financial intermediary. Separate statements will be generated for each separate account and will be householded as described above.
Portfolio Holdings. Each Calvert fund files a schedule of portfolio holdings on Part F to Form N-PORT with the SEC. Certain information filed on Form N-PORT may be viewed on the Calvert website at www.calvert.com, by calling Calvert at 1-800-368-2745 or in the EDGAR database on the SEC’s website at www.sec.gov.
Proxy Voting. The Proxy Voting Guidelines that each Calvert fund uses to determine how to vote proxies relating to portfolio securities is provided as an Appendix to the fund’s Statement of Additional Information. The Statement of Additional Information can be obtained free of charge by calling the Calvert funds at 1-800-368-2745, by visiting the Calvert funds’ website at www.calvert.com or visiting the SEC’s website at www.sec.gov. Information regarding how a Calvert fund voted proxies relating to portfolio securities during the most recent 12-month period ended June 30 is available by calling Calvert funds, by visiting the Calvert funds’ website at www.calvert.com or by visiting the SEC’s website at www.sec.gov.
Investment Adviser and Administrator
Calvert Research and Management
1825 Connecticut Avenue NW, Suite 400
Washington, DC 20009
Investment Sub-Adviser
Ameritas Investment Partners, Inc.
5945 R Street
Lincoln, NE 68505
Principal Underwriter*
Eaton Vance Distributors, Inc.
Two International Place
Boston, MA 02110
(617) 482-8260
Custodian
State Street Bank and Trust Company
State Street Financial Center, One Lincoln Street
Boston, MA 02111
Transfer Agent
DST Asset Manager Solutions, Inc.
2000 Crown Colony Drive
Quincy, MA 02169
Independent Registered Public Accounting Firm
Deloitte & Touche LLP
200 Berkeley Street
Boston, MA 02116-5022
Fund Offices
1825 Connecticut Avenue NW, Suite 400
Washington, DC 20009
* FINRA BrokerCheck. Investors may check the background of their Investment Professional by contacting the Financial Industry Regulatory Authority (FINRA). FINRA BrokerCheck is a free tool to help investors check the professional background of current and former FINRA-registered securities firms and brokers. FINRA BrokerCheck is available by calling 1-800-289-9999 and at www.FINRA.org. The FINRA BrokerCheck brochure describing this program is available to investors at www.FINRA.org.
Printed on recycled paper.
24229 12.31.21
Calvert
VP S&P 500® Index Portfolio
Annual Report
December 31, 2021
Commodity Futures Trading Commission Registration. The Commodity Futures Trading Commission (“CFTC”) has adopted regulations that subject registered investment companies and advisers to regulation by the CFTC if a fund invests more than a prescribed level of its assets in certain CFTC-regulated instruments (including futures, certain options and swap agreements) or markets itself as providing investment exposure to such instruments. The adviser has claimed an exclusion from the definition of “commodity pool operator” under the Commodity Exchange Act with respect to its management of the Fund and the other funds it manages. Accordingly, neither the Fund nor the adviser is subject to CFTC regulation.
Fund shares are not insured by the FDIC and are not deposits or other obligations of, or guaranteed by, any depository institution. Shares are subject to investment risks, including possible loss of principal invested.
This report must be preceded or accompanied by a current summary prospectus or prospectus. Before investing, investors should consider carefully the investment objective, risks, and charges and expenses of a mutual fund. This and other important information is contained in the summary prospectus and prospectus, which can be obtained from a financial intermediary. Prospective investors should read the prospectus carefully before investing. For further information, please call 1-800-368-2745.
Annual Report December 31, 2021
Calvert
VP S&P 500® Index Portfolio
Calvert
VP S&P 500® Index Portfolio
December 31, 2021
Management's Discussion of Fund Performance†
Economic and Market Conditions
The 12-month period starting January 1, 2021, was notable for a U.S. equity rally that lasted for most of the period and resulted in U.S. stocks outperforming most other stock markets in developed economies. Except for temporary retreats in September and November, broad-market indexes generally posted strong returns during the period. Investors cheered the reopening of businesses that had been affected by the pandemic and the rollout of several highly effective COVID-19 vaccines.
COVID-19, however, continued to have a firm grip on the U.S. economy. Disease rates advanced and declined with second, third, and fourth waves of infections. Worker shortages led to global supply-chain disruptions. From computer chips to shipping containers, scarcities of key items led to temporary factory shutdowns and empty store shelves. Those shortages — combined with high demand from consumers eager to spend money saved earlier in the pandemic — led to higher year-over-year inflation than the U.S. had seen in decades.
Still, investor optimism about a recovering economy drove stock prices up during most of the period. A significant pullback, however, occurred in September 2021 when virtually every major U.S. stock index reported negative returns. Unexpectedly weak job creation in August and the U.S. Federal Reserve’s (the Fed’s) announcement that it might soon begin tapering its monthly bond purchases — which had stimulated the economy earlier — combined to drive stocks into negative territory. Rising COVID-19 infections also weighed on equity performance in September.
In the final quarter of 2021, however, stock prices came roaring back. Even the late-November news of a new and more transmissible COVID-19 variant — Omicron — caused only a temporary market retreat. The Fed’s actions to tamp down inflation were applauded by investors, with stocks gaining ground after the central bank announced that tapering would be accelerated and that three possible interest rate hikes were forecast for 2022. Just two trading days before year-end, the S&P 500® Index closed at its 70th new all-time high for the period, and the Dow Jones Industrial Average® (DJIA) closed at an all-time high as well.
For the period as a whole, the broad-market S&P 500® Index returned 28.71%; the blue-chip DJIA was up 20.95%; and the technology-laden Nasdaq Composite Index rose 22.18%. Large-cap U.S. stocks, as measured by the Russell 1000® Index, outperformed their small-cap counterparts, as measured by the Russell 2000® Index. In the large-cap space, growth stocks modestly outperformed value stocks, but in the small-cap space, value stocks strongly outperformed growth stocks during the period.
Investment Strategy
As an index fund, Calvert VP S&P 500® Index Portfolio (the Fund) seeks to replicate as closely as possible the holdings and match the performance of the S&P 500® Index (the Index). The Fund seeks to accomplish this by employing a passive management approach and holding each constituent of the Index in approximately the same proportion as the Index. The Fund may also invest in exchange-traded funds (ETFs) that provide the same exposure to the Index. Cash holdings may gain exposure to the Index via futures contracts, allowing the Fund’s assets to be fully invested.
Fund Performance
For the 12-month period ended December 31, 2021, the Fund returned 28.42% for Class I shares at net asset value (NAV). By comparison, its benchmark, Index, returned 28.71% during the period.
The Index is unmanaged and returns do not reflect any fees and operating expenses.
Large-cap stocks outperformed mid-cap stocks and small-cap stocks during the period, while large-cap growth stocks outperformed large-cap value stocks. All market sectors had positive, double-digit returns within the Index. Sector performance was led by energy, which returned more than 50%, followed by real estate, financials, and information technology (IT). Utilities was the weakest-performing sector, but still returned more than 17% during the period.
The IT and health care sectors had the largest weights within the Index at period-end. The utilities, materials, energy, and real estate sectors had the smallest weights within the Index at period-end.
Futures contracts, which are regularly used to manage uninvested cash holdings in the Fund, had a meaningful positive impact on performance during the period.
See Endnotes and Additional Disclosures in this report.
Past performance is no guarantee of future results. Returns are historical and are calculated by determining the percentage change in net asset value (NAV) or offering price (as applicable) with all distributions reinvested. Investment return and principal value will fluctuate so that shares, when redeemed, may be worth more or less than their original cost. Performance for periods less than or equal to one year is cumulative. Performance is for the stated time period only; due to market volatility, current Fund performance may be lower or higher than the quoted return.
Calvert
VP S&P 500® Index Portfolio
December 31, 2021
Performance
Portfolio Manager(s) Kevin L. Keene, CFA of Ameritas Investment Partners, Inc.
| % Average Annual Total Returns1,2 | Inception Date | Performance
Inception Date | One Year | Five Years | Ten Years |
| Fund at NAV | 12/29/1995 | 12/29/1995 | 28.42% | 18.13% | 16.15% |
|
| S&P 500® Index | — | — | 28.71% | 18.46% | 16.54% |
| % Total Annual Operating Expense Ratios3 | |
| Gross | 0.43% |
| Net | 0.28 |
Growth of $10,000
This graph shows the change in value of a hypothetical investment of $10,000 in the Fund for the period indicated. For comparison, the same investment is shown in the indicated index.
See Endnotes and Additional Disclosures in this report.
Past performance is no guarantee of future results. Returns are historical and are calculated by determining the percentage change in net asset value (NAV) or offering price (as applicable) with all distributions reinvested. Investment return and principal value will fluctuate so that shares, when redeemed, may be worth more or less than their original cost. Performance for periods less than or equal to one year is cumulative. Performance is for the stated time period only; due to market volatility, current Fund performance may be lower or higher than the quoted return.
Calvert
VP S&P 500® Index Portfolio
December 31, 2021
Sector Allocation (% of net assets)*
* Excludes cash and cash equivalents.
| Top 10 Holdings (% of net assets)* | |
| Apple, Inc. | 6.7% |
| Microsoft Corp. | 6.1 |
| Amazon.com, Inc. | 3.5 |
| Alphabet, Inc., Class A | 2.1 |
| Tesla, Inc. | 2.1 |
| Alphabet, Inc., Class C | 1.9 |
| Meta Platforms, Inc., Class A | 1.9 |
| NVIDIA Corp. | 1.8 |
| Berkshire Hathaway, Inc., Class B | 1.3 |
| UnitedHealth Group, Inc. | 1.1 |
| Total | 28.5% |
| * | Excludes cash and cash equivalents. |
Calvert
VP S&P 500® Index Portfolio
December 31, 2021
Endnotes and Additional Disclosures
| † | The views expressed in this report are those of the portfolio manager(s) and are current only through the date stated at the top of this page. These views are subject to change at any time based upon market or other conditions, and Calvert and the Fund(s) disclaim any responsibility to update such views. These views may not be relied upon as investment advice and, because investment decisions are based on many factors, may not be relied upon as an indication of trading intent on behalf of any Calvert fund. This commentary may contain statements that are not historical facts, referred to as “forward-looking statements.” The Fund’s actual future results may differ significantly from those stated in any forward-looking statement, depending on factors such as changes in securities or financial markets or general economic conditions, the volume of sales and purchases of Fund shares, the continuation of investment advisory, administrative and service contracts, and other risks discussed from time to time in the Fund’s filings with the Securities and Exchange Commission. |
| | |
| 1 | S&P 500® Index is an unmanaged index of large-cap stocks commonly used as a measure of U.S. stock market performance. S&P Dow Jones Indices are a product of S&P Dow Jones Indices LLC (“S&P DJI”) and have been licensed for use. S&P® and S&P 500® are registered trademarks of S&P DJI; Dow Jones® is a registered trademark of Dow Jones Trademark Holdings LLC (“Dow Jones”); S&P DJI, Dow Jones and their respective affiliates do not sponsor, endorse, sell or promote the Fund, will not have any liability with respect thereto and do not have any liability for any errors, omissions, or interruptions of the S&P Dow Jones Indices. Unless otherwise stated, index returns do not reflect the effect of any applicable sales charges, commissions, expenses, taxes or leverage, as applicable. It is not possible to invest directly in an index. |
| 2 | There is no sales charge. Insurance-related charges are not included in the calculation of returns. If such charges were reflected, the returns would be lower. Please refer to the report for your insurance contract for performance data reflecting insurance-related charges.Calvert Research and Management became the investment adviser to the Fund on December 31, 2016. Performance reflected prior to such date is that of the Fund’s former investment adviser. |
| 3 | Source: Fund prospectus. Net expense ratio reflects a contractual expense reimbursement that continues through 4/30/22. The expense ratios for the current reporting period can be found in the Financial Highlights section of this report. Performance reflects expenses waived and/or reimbursed, if applicable. Without such waivers and/or reimbursements, performance would have been lower. |
Additional Information
Dow Jones Industrial Average® is a price-weighted average of 30 blue-chip stocks that are generally the leaders in their industry. Nasdaq Composite Index is a market capitalization-weighted index of all domestic and international securities listed on Nasdaq. Source: Nasdaq, Inc. The information is provided by Nasdaq (with its affiliates, are referred to as the “Corporations”) and Nasdaq’s third party licensors on an “as is” basis and the Corporations make no guarantees and bear no liability of any kind with respect to the information or the Fund. Russell 1000® Index is an unmanaged index of 1,000 U.S. large- cap stocks. Russell 2000® Index is an unmanaged index of 2,000 U.S. small-cap stocks.
Calvert
VP S&P 500® Index Portfolio
December 31, 2021
Example
As a Fund shareholder, you incur ongoing costs, including management fees and other Fund expenses. This Example is intended to help you understand your ongoing costs (in dollars) of Fund investing and to compare these costs with the ongoing costs of investing in other mutual funds. The Example is based on an investment of $1,000 invested at the beginning of the period and held for the entire period (July 1, 2021 to December 31, 2021).
Actual Expenses
The first line of the table below provides information about actual account values and actual expenses. You may use the information in this line, together with the amount you invested, to estimate the expenses that you paid over the period. Simply divide your account value by $1,000 (for example, an $8,600 account value divided by $1,000 = 8.6), then multiply the result by the number in the first line under the heading entitled “Expenses Paid During Period” to estimate the expenses you paid on your account during this period.
Hypothetical Example for Comparison Purposes
The second line of the table below provides information about hypothetical account values and hypothetical expenses based on the actual Fund expense ratio and an assumed rate of return of 5% per year (before expenses), which is not the actual Fund return. The hypothetical account values and expenses may not be used to estimate the actual ending account balance or expenses you paid for the period. You may use this information to compare the ongoing costs of investing in the Fund and other funds. To do so, compare this 5% hypothetical example with the 5% hypothetical examples that appear in the shareholder reports of the other funds.
Please note that the expenses shown in the table are meant to highlight your ongoing costs only and do not reflect expenses and charges which are, or may be imposed under the variable annuity contract or variable life insurance policy (variable contracts) (if applicable) or qualified pension or retirement plans (Qualified Plans) through which your investment in the Fund is made. Therefore, the second line of the table is useful in comparing ongoing costs associated with an investment in vehicles which fund benefits under variable contracts and Qualified Plans, and will not help you determine the relative total costs of investing in the Fund through variable contracts or Qualified Plans. In addition, if these expenses and charges imposed under the variable contracts or Qualified Plans were included, your costs would have been higher.
| | Beginning
Account Value
(7/1/21) | Ending
Account Value
(12/31/21) | Expenses Paid
During Period*
(7/1/21 – 12/31/21) | Annualized
Expense
Ratio |
| Actual | | | | |
| | $1,000.00 | $1,115.20 | $1.49 ** | 0.28% |
| Hypothetical | | | | |
| (5% return per year before expenses) | | | | |
| | $1,000.00 | $1,023.79 | $1.43 ** | 0.28% |
| * | Expenses are equal to the Fund's annualized expense ratio, multiplied by the average account value over the period, multiplied by 184/365 (to reflect the one-half year period). The Example assumes that the $1,000 was invested at the net asset value per share determined at the close of business on June 30, 2021. Expenses shown do not include insurance-related charges or direct expenses of Qualified Plans. |
| ** | Absent a waiver and/or reimbursement of expenses by an affiliate, expenses would be higher. |
Calvert
VP S&P 500® Index Portfolio
December 31, 2021
| Security | Shares | Value |
| Aerospace & Defense — 1.3% | |
| Boeing Co. (The)(1) | | 7,242 | $ 1,457,960 |
| General Dynamics Corp. | | 3,038 | 633,332 |
| Howmet Aerospace, Inc. | | 5,401 | 171,914 |
| Huntington Ingalls Industries, Inc. | | 562 | 104,948 |
| L3Harris Technologies, Inc. | | 2,572 | 548,453 |
| Lockheed Martin Corp. | | 3,218 | 1,143,709 |
| Northrop Grumman Corp. | | 1,954 | 756,335 |
| Raytheon Technologies Corp. | | 19,622 | 1,688,669 |
| Textron, Inc. | | 2,890 | 223,108 |
| TransDigm Group, Inc.(1) | | 705 | 448,577 |
| | | | $ 7,177,005 |
| Air Freight & Logistics — 0.6% | |
| C.H. Robinson Worldwide, Inc. | | 1,852 | $ 199,331 |
| Expeditors International of Washington, Inc. | | 2,344 | 314,776 |
| FedEx Corp. | | 3,204 | 828,682 |
| United Parcel Service, Inc., Class B | | 9,559 | 2,048,876 |
| | | | $ 3,391,665 |
| Airlines — 0.2% | |
| Alaska Air Group, Inc.(1) | | 1,813 | $ 94,457 |
| American Airlines Group, Inc.(1)(2) | | 8,946 | 160,670 |
| Delta Air Lines, Inc.(1) | | 8,832 | 345,155 |
| Southwest Airlines Co.(1) | | 8,175 | 350,217 |
| United Airlines Holdings, Inc.(1) | | 4,451 | 194,865 |
| | | | $ 1,145,364 |
| Auto Components — 0.1% | |
| Aptiv PLC(1) | | 3,546 | $ 584,913 |
| BorgWarner, Inc. | | 3,308 | 149,091 |
| | | | $ 734,004 |
| Automobiles — 2.5% | |
| Ford Motor Co. | | 51,460 | $ 1,068,824 |
| General Motors Co.(1) | | 19,033 | 1,115,905 |
| Tesla, Inc.(1) | | 10,730 | 11,339,249 |
| | | | $ 13,523,978 |
| Banks — 3.8% | |
| Bank of America Corp. | | 95,183 | $ 4,234,692 |
| Citigroup, Inc. | | 26,013 | 1,570,925 |
| Citizens Financial Group, Inc. | | 5,818 | 274,900 |
| Comerica, Inc. | | 1,907 | 165,909 |
| Fifth Third Bancorp | | 8,964 | 390,382 |
| Security | Shares | Value |
| Banks (continued) | |
| First Republic Bank | | 2,404 | $ 496,450 |
| Huntington Bancshares, Inc. | | 18,963 | 292,409 |
| JPMorgan Chase & Co. | | 38,979 | 6,172,325 |
| KeyCorp | | 12,206 | 282,325 |
| M&T Bank Corp. | | 1,687 | 259,089 |
| People's United Financial, Inc. | | 6,514 | 116,079 |
| PNC Financial Services Group, Inc. (The) | | 5,541 | 1,111,081 |
| Regions Financial Corp. | | 13,132 | 286,278 |
| Signature Bank | | 795 | 257,159 |
| SVB Financial Group(1) | | 769 | 521,567 |
| Truist Financial Corp. | | 17,500 | 1,024,625 |
| U.S. Bancorp | | 17,689 | 993,591 |
| Wells Fargo & Co. | | 52,271 | 2,507,963 |
| Zions Bancorp NA | | 2,238 | 141,352 |
| | | | $ 21,099,101 |
| Beverages — 1.4% | |
| Brown-Forman Corp., Class B | | 2,396 | $ 174,573 |
| Coca-Cola Co. (The) | | 51,268 | 3,035,578 |
| Constellation Brands, Inc., Class A | | 2,153 | 540,338 |
| Molson Coors Beverage Co., Class B | | 2,573 | 119,259 |
| Monster Beverage Corp.(1) | | 4,925 | 472,997 |
| PepsiCo, Inc. | | 18,246 | 3,169,513 |
| | | | $ 7,512,258 |
| Biotechnology — 1.7% | |
| AbbVie, Inc. | | 23,326 | $ 3,158,340 |
| Amgen, Inc. | | 7,384 | 1,661,179 |
| Biogen, Inc.(1) | | 1,926 | 462,086 |
| Gilead Sciences, Inc. | | 16,445 | 1,194,071 |
| Incyte Corp.(1) | | 2,461 | 180,637 |
| Moderna, Inc.(1) | | 4,624 | 1,174,404 |
| Regeneron Pharmaceuticals, Inc.(1) | | 1,386 | 875,287 |
| Vertex Pharmaceuticals, Inc.(1) | | 3,333 | 731,927 |
| | | | $ 9,437,931 |
| Building Products — 0.5% | |
| A.O. Smith Corp. | | 1,837 | $ 157,706 |
| Allegion PLC | | 1,256 | 166,345 |
| Carrier Global Corp. | | 11,361 | 616,221 |
| Fortune Brands Home & Security, Inc. | | 1,933 | 206,638 |
| Johnson Controls International PLC | | 9,291 | 755,451 |
| Masco Corp. | | 3,200 | 224,704 |
| Trane Technologies PLC | | 3,114 | 629,121 |
| | | | $ 2,756,186 |
7
See Notes to Financial Statements.
Calvert
VP S&P 500® Index Portfolio
December 31, 2021
Schedule of Investments — continued
| Security | Shares | Value |
| Capital Markets — 2.9% | |
| Ameriprise Financial, Inc. | | 1,467 | $ 442,535 |
| Bank of New York Mellon Corp. (The) | | 9,960 | 578,477 |
| BlackRock, Inc. | | 1,872 | 1,713,928 |
| Cboe Global Markets, Inc. | | 1,484 | 193,514 |
| Charles Schwab Corp. (The) | | 19,709 | 1,657,527 |
| CME Group, Inc. | | 4,712 | 1,076,504 |
| FactSet Research Systems, Inc. | | 493 | 239,603 |
| Franklin Resources, Inc. | | 3,777 | 126,492 |
| Goldman Sachs Group, Inc. (The) | | 4,450 | 1,702,347 |
| Intercontinental Exchange, Inc. | | 7,386 | 1,010,183 |
| Invesco, Ltd. | | 4,598 | 105,846 |
| MarketAxess Holdings, Inc. | | 519 | 213,449 |
| Moody's Corp. | | 2,120 | 828,030 |
| Morgan Stanley(3) | | 18,819 | 1,847,273 |
| MSCI, Inc. | | 1,081 | 662,318 |
| Nasdaq, Inc. | | 1,596 | 335,176 |
| Northern Trust Corp. | | 2,843 | 340,051 |
| Raymond James Financial, Inc. | | 2,544 | 255,418 |
| S&P Global, Inc. | | 3,159 | 1,490,827 |
| State Street Corp. | | 4,956 | 460,908 |
| T. Rowe Price Group, Inc. | | 2,946 | 579,301 |
| | | | $ 15,859,707 |
| Chemicals — 1.7% | |
| Air Products & Chemicals, Inc. | | 2,902 | $ 882,963 |
| Albemarle Corp. | | 1,594 | 372,630 |
| Celanese Corp. | | 1,427 | 239,822 |
| CF Industries Holdings, Inc. | | 2,962 | 209,650 |
| Corteva, Inc. | | 9,887 | 467,457 |
| Dow, Inc. | | 9,696 | 549,957 |
| DuPont de Nemours, Inc. | | 6,792 | 548,658 |
| Eastman Chemical Co. | | 1,880 | 227,311 |
| Ecolab, Inc. | | 3,268 | 766,640 |
| FMC Corp. | | 1,790 | 196,703 |
| International Flavors & Fragrances, Inc. | | 3,442 | 518,537 |
| Linde PLC | | 6,719 | 2,327,663 |
| LyondellBasell Industries NV, Class A | | 3,561 | 328,431 |
| Mosaic Co. (The) | | 4,721 | 185,488 |
| PPG Industries, Inc. | | 3,112 | 536,633 |
| Sherwin-Williams Co. (The) | | 3,162 | 1,113,530 |
| | | | $ 9,472,073 |
| Commercial Services & Supplies — 0.4% | |
| Cintas Corp. | | 1,152 | $ 510,532 |
| Copart, Inc.(1) | | 2,844 | 431,207 |
| Republic Services, Inc. | | 2,744 | 382,651 |
| Security | Shares | Value |
| Commercial Services & Supplies (continued) | |
| Rollins, Inc. | | 3,334 | $ 114,056 |
| Waste Management, Inc. | | 5,045 | 842,011 |
| | | | $ 2,280,457 |
| Communications Equipment — 0.9% | |
| Arista Networks, Inc.(1) | | 3,004 | $ 431,825 |
| Cisco Systems, Inc. | | 55,652 | 3,526,667 |
| F5, Inc.(1) | | 853 | 208,738 |
| Juniper Networks, Inc. | | 4,542 | 162,195 |
| Motorola Solutions, Inc. | | 2,214 | 601,544 |
| | | | $ 4,930,969 |
| Construction & Engineering — 0.0%(4) | |
| Quanta Services, Inc. | | 1,915 | $ 219,574 |
| | | | $ 219,574 |
| Construction Materials — 0.1% | |
| Martin Marietta Materials, Inc. | | 852 | $ 375,323 |
| Vulcan Materials Co. | | 1,812 | 376,135 |
| | | | $ 751,458 |
| Consumer Finance — 0.5% | |
| American Express Co. | | 8,225 | $ 1,345,610 |
| Capital One Financial Corp. | | 5,580 | 809,602 |
| Discover Financial Services | | 3,842 | 443,982 |
| Synchrony Financial | | 7,174 | 332,802 |
| | | | $ 2,931,996 |
| Containers & Packaging — 0.3% | |
| Amcor PLC | | 21,062 | $ 252,955 |
| Avery Dennison Corp. | | 1,149 | 248,839 |
| Ball Corp. | | 4,246 | 408,762 |
| International Paper Co. | | 5,351 | 251,390 |
| Packaging Corp. of America | | 1,312 | 178,629 |
| Sealed Air Corp. | | 2,076 | 140,068 |
| WestRock Co. | | 3,635 | 161,248 |
| | | | $ 1,641,891 |
| Distributors — 0.1% | |
| Genuine Parts Co. | | 1,867 | $ 261,753 |
| LKQ Corp. | | 3,516 | 211,066 |
| Pool Corp. | | 526 | 297,716 |
| | | | $ 770,535 |
8
See Notes to Financial Statements.
Calvert
VP S&P 500® Index Portfolio
December 31, 2021
Schedule of Investments — continued
| Security | Shares | Value |
| Diversified Financial Services — 1.3% | |
| Berkshire Hathaway, Inc., Class B(1) | | 24,158 | $ 7,223,242 |
| | | | $ 7,223,242 |
| Diversified Telecommunication Services — 1.0% | |
| AT&T, Inc. | | 93,616 | $ 2,302,954 |
| Lumen Technologies, Inc. | | 12,081 | 151,616 |
| Verizon Communications, Inc. | | 54,626 | 2,838,367 |
| | | | $ 5,292,937 |
| Electric Utilities — 1.6% | |
| Alliant Energy Corp. | | 3,417 | $ 210,043 |
| American Electric Power Co., Inc. | | 6,603 | 587,469 |
| Duke Energy Corp. | | 10,084 | 1,057,812 |
| Edison International | | 5,183 | 353,740 |
| Entergy Corp. | | 2,775 | 312,604 |
| Evergy, Inc. | | 3,141 | 215,504 |
| Eversource Energy | | 4,507 | 410,047 |
| Exelon Corp. | | 12,825 | 740,772 |
| FirstEnergy Corp. | | 7,518 | 312,674 |
| NextEra Energy, Inc. | | 25,913 | 2,419,238 |
| NRG Energy, Inc. | | 3,343 | 144,016 |
| Pinnacle West Capital Corp. | | 1,540 | 108,709 |
| PPL Corp. | | 9,842 | 295,850 |
| Southern Co. (The) | | 13,894 | 952,850 |
| Xcel Energy, Inc. | | 7,062 | 478,097 |
| | | | $ 8,599,425 |
| Electrical Equipment — 0.5% | |
| AMETEK, Inc. | | 3,033 | $ 445,972 |
| Eaton Corp. PLC | | 5,225 | 902,985 |
| Emerson Electric Co. | | 7,837 | 728,606 |
| Generac Holdings, Inc.(1) | | 870 | 306,170 |
| Rockwell Automation, Inc. | | 1,520 | 530,252 |
| | | | $ 2,913,985 |
| Electronic Equipment, Instruments & Components — 0.7% | |
| Amphenol Corp., Class A | | 7,840 | $ 685,686 |
| CDW Corp. | | 1,779 | 364,304 |
| Corning, Inc. | | 10,069 | 374,869 |
| IPG Photonics Corp.(1) | | 547 | 94,161 |
| Keysight Technologies, Inc.(1) | | 2,415 | 498,722 |
| TE Connectivity, Ltd. | | 4,278 | 690,212 |
| Teledyne Technologies, Inc.(1) | | 634 | 276,988 |
| Trimble, Inc.(1) | | 3,428 | 298,887 |
| Zebra Technologies Corp., Class A(1) | | 701 | 417,235 |
| | | | $ 3,701,064 |
| Security | Shares | Value |
| Energy Equipment & Services — 0.2% | |
| Baker Hughes Co. | | 11,157 | $ 268,437 |
| Halliburton Co. | | 12,154 | 277,962 |
| Schlumberger NV | | 18,388 | 550,721 |
| | | | $ 1,097,120 |
| Entertainment — 1.6% | |
| Activision Blizzard, Inc. | | 10,473 | $ 696,769 |
| Electronic Arts, Inc. | | 3,832 | 505,441 |
| Live Nation Entertainment, Inc.(1) | | 1,774 | 212,330 |
| Netflix, Inc.(1) | | 5,842 | 3,519,454 |
| Take-Two Interactive Software, Inc.(1) | | 1,512 | 268,713 |
| Walt Disney Co. (The)(1) | | 23,967 | 3,712,248 |
| | | | $ 8,914,955 |
| Equity Real Estate Investment Trusts (REITs) — 2.6% | |
| Alexandria Real Estate Equities, Inc. | | 1,874 | $ 417,827 |
| American Tower Corp. | | 5,970 | 1,746,225 |
| AvalonBay Communities, Inc. | | 1,832 | 462,745 |
| Boston Properties, Inc.(2) | | 1,962 | 225,983 |
| Crown Castle International Corp. | | 5,666 | 1,182,721 |
| Digital Realty Trust, Inc. | | 3,720 | 657,956 |
| Duke Realty Corp. | | 5,122 | 336,208 |
| Equinix, Inc. | | 1,180 | 998,091 |
| Equity Residential | | 4,589 | 415,305 |
| Essex Property Trust, Inc. | | 899 | 316,655 |
| Extra Space Storage, Inc. | | 1,755 | 397,911 |
| Federal Realty Investment Trust | | 971 | 132,367 |
| Healthpeak Properties, Inc. | | 7,455 | 269,051 |
| Host Hotels & Resorts, Inc.(1) | | 10,149 | 176,491 |
| Iron Mountain, Inc. | | 3,944 | 206,390 |
| Kimco Realty Corp. | | 8,523 | 210,092 |
| Mid-America Apartment Communities, Inc. | | 1,564 | 358,844 |
| Prologis, Inc. | | 9,692 | 1,631,745 |
| Public Storage | | 2,000 | 749,120 |
| Realty Income Corp. | | 7,407 | 530,267 |
| Regency Centers Corp. | | 2,158 | 162,605 |
| SBA Communications Corp. | | 1,426 | 554,743 |
| Simon Property Group, Inc. | | 4,308 | 688,289 |
| UDR, Inc. | | 3,758 | 225,442 |
| Ventas, Inc. | | 5,125 | 261,990 |
| Vornado Realty Trust | | 2,404 | 100,631 |
| Welltower, Inc. | | 5,776 | 495,408 |
| Weyerhaeuser Co. | | 10,235 | 421,477 |
| | | | $ 14,332,579 |
9
See Notes to Financial Statements.
Calvert
VP S&P 500® Index Portfolio
December 31, 2021
Schedule of Investments — continued
| Security | Shares | Value |
| Food & Staples Retailing — 1.4% | |
| Costco Wholesale Corp. | | 5,830 | $ 3,309,691 |
| Kroger Co. (The) | | 9,157 | 414,446 |
| Sysco Corp. | | 6,721 | 527,935 |
| Walgreens Boots Alliance, Inc. | | 9,419 | 491,295 |
| Walmart, Inc. | | 18,779 | 2,717,133 |
| | | | $ 7,460,500 |
| Food Products — 0.9% | |
| Archer-Daniels-Midland Co. | | 7,334 | $ 495,705 |
| Campbell Soup Co. | | 2,841 | 123,470 |
| Conagra Brands, Inc. | | 6,762 | 230,922 |
| General Mills, Inc. | | 8,165 | 550,158 |
| Hershey Co. (The) | | 1,906 | 368,754 |
| Hormel Foods Corp.(2) | | 3,699 | 180,548 |
| JM Smucker Co. (The) | | 1,517 | 206,039 |
| Kellogg Co. | | 3,442 | 221,734 |
| Kraft Heinz Co. (The) | | 9,636 | 345,933 |
| Lamb Weston Holdings, Inc. | | 2,129 | 134,936 |
| McCormick & Co., Inc. | | 3,402 | 328,667 |
| Mondelez International, Inc., Class A | | 18,288 | 1,212,677 |
| Tyson Foods, Inc., Class A | | 3,865 | 336,873 |
| | | | $ 4,736,416 |
| Gas Utilities — 0.0%(4) | |
| Atmos Energy Corp. | | 1,785 | $ 187,014 |
| | | | $ 187,014 |
| Health Care Equipment & Supplies — 2.9% | |
| Abbott Laboratories | | 23,332 | $ 3,283,746 |
| ABIOMED, Inc.(1) | | 596 | 214,065 |
| Align Technology, Inc.(1) | | 961 | 631,550 |
| Baxter International, Inc. | | 6,732 | 577,875 |
| Becton, Dickinson and Co. | | 3,765 | 946,822 |
| Boston Scientific Corp.(1) | | 18,681 | 793,569 |
| Cooper Cos., Inc. (The) | | 663 | 277,757 |
| DENTSPLY SIRONA, Inc. | | 3,032 | 169,155 |
| DexCom, Inc.(1) | | 1,271 | 682,464 |
| Edwards Lifesciences Corp.(1) | | 8,185 | 1,060,367 |
| Hologic, Inc.(1) | | 3,500 | 267,960 |
| IDEXX Laboratories, Inc.(1) | | 1,112 | 732,208 |
| Intuitive Surgical, Inc.(1) | | 4,680 | 1,681,524 |
| Medtronic PLC | | 17,643 | 1,825,168 |
| ResMed, Inc. | | 1,910 | 497,517 |
| STERIS PLC | | 1,356 | 330,064 |
| Stryker Corp. | | 4,401 | 1,176,915 |
| Teleflex, Inc. | | 638 | 209,570 |
| Security | Shares | Value |
| Health Care Equipment & Supplies (continued) | |
| Zimmer Biomet Holdings, Inc. | | 2,877 | $ 365,494 |
| | | | $ 15,723,790 |
| Health Care Providers & Services — 2.7% | |
| AmerisourceBergen Corp. | | 2,040 | $ 271,096 |
| Anthem, Inc. | | 3,182 | 1,474,984 |
| Cardinal Health, Inc. | | 3,964 | 204,106 |
| Centene Corp.(1) | | 7,650 | 630,360 |
| Cigna Corp. | | 4,345 | 997,742 |
| CVS Health Corp. | | 17,305 | 1,785,184 |
| DaVita, Inc.(1) | | 957 | 108,868 |
| HCA Healthcare, Inc. | | 3,140 | 806,729 |
| Henry Schein, Inc.(1) | | 1,922 | 149,013 |
| Humana, Inc. | | 1,685 | 781,604 |
| Laboratory Corp. of America Holdings(1) | | 1,255 | 394,334 |
| McKesson Corp. | | 2,002 | 497,637 |
| Quest Diagnostics, Inc. | | 1,645 | 284,601 |
| UnitedHealth Group, Inc. | | 12,441 | 6,247,124 |
| Universal Health Services, Inc., Class B | | 1,065 | 138,088 |
| | | | $ 14,771,470 |
| Health Care Technology — 0.1% | |
| Cerner Corp. | | 3,857 | $ 358,200 |
| | | | $ 358,200 |
| Hotels, Restaurants & Leisure — 1.9% | |
| Booking Holdings, Inc.(1) | | 538 | $ 1,290,786 |
| Caesars Entertainment, Inc.(1) | | 2,882 | 269,553 |
| Carnival Corp.(1)(2) | | 10,821 | 217,718 |
| Chipotle Mexican Grill, Inc.(1) | | 378 | 660,838 |
| Darden Restaurants, Inc. | | 1,787 | 269,194 |
| Domino's Pizza, Inc. | | 496 | 279,908 |
| Expedia Group, Inc.(1) | | 1,930 | 348,790 |
| Hilton Worldwide Holdings, Inc.(1) | | 3,654 | 569,987 |
| Las Vegas Sands Corp.(1) | | 4,722 | 177,736 |
| Marriott International, Inc., Class A(1) | | 3,682 | 608,414 |
| McDonald's Corp. | | 9,796 | 2,626,014 |
| MGM Resorts International | | 5,103 | 229,023 |
| Norwegian Cruise Line Holdings, Ltd.(1) | | 5,240 | 108,678 |
| Penn National Gaming, Inc.(1) | | 2,057 | 106,655 |
| Royal Caribbean Cruises, Ltd.(1) | | 3,030 | 233,007 |
| Starbucks Corp. | | 15,469 | 1,809,409 |
| Wynn Resorts, Ltd.(1)(2) | | 1,413 | 120,161 |
| Yum! Brands, Inc. | | 3,843 | 533,639 |
| | | | $ 10,459,510 |
10
See Notes to Financial Statements.
Calvert
VP S&P 500® Index Portfolio
December 31, 2021
Schedule of Investments — continued
| Security | Shares | Value |
| Household Durables — 0.4% | |
| D.R. Horton, Inc. | | 4,389 | $ 475,987 |
| Garmin, Ltd. | | 2,068 | 281,600 |
| Lennar Corp., Class A | | 3,564 | 413,994 |
| Mohawk Industries, Inc.(1) | | 816 | 148,659 |
| Newell Brands, Inc. | | 5,171 | 112,935 |
| NVR, Inc.(1) | | 45 | 265,899 |
| PulteGroup, Inc. | | 3,613 | 206,519 |
| Whirlpool Corp. | | 796 | 186,789 |
| | | | $ 2,092,382 |
| Household Products — 1.3% | |
| Church & Dwight Co., Inc. | | 3,201 | $ 328,102 |
| Clorox Co. (The) | | 1,699 | 296,238 |
| Colgate-Palmolive Co. | | 11,049 | 942,922 |
| Kimberly-Clark Corp. | | 4,414 | 630,849 |
| Procter & Gamble Co. (The) | | 31,935 | 5,223,927 |
| | | | $ 7,422,038 |
| Independent Power and Renewable Electricity Producers — 0.0%(4) | |
| AES Corp. (The) | | 9,101 | $ 221,154 |
| | | | $ 221,154 |
| Industrial Conglomerates — 1.0% | |
| 3M Co. | | 7,554 | $ 1,341,817 |
| General Electric Co. | | 14,396 | 1,359,990 |
| Honeywell International, Inc. | | 9,025 | 1,881,803 |
| Roper Technologies, Inc. | | 1,383 | 680,242 |
| | | | $ 5,263,852 |
| Insurance — 1.8% | |
| Aflac, Inc. | | 7,979 | $ 465,894 |
| Allstate Corp. (The) | | 3,758 | 442,129 |
| American International Group, Inc. | | 10,885 | 618,921 |
| Aon PLC, Class A | | 2,888 | 868,017 |
| Arthur J. Gallagher & Co. | | 2,798 | 474,737 |
| Assurant, Inc. | | 747 | 116,427 |
| Brown & Brown, Inc. | | 3,148 | 221,241 |
| Chubb, Ltd. | | 5,647 | 1,091,622 |
| Cincinnati Financial Corp. | | 2,075 | 236,405 |
| Everest Re Group, Ltd. | | 548 | 150,108 |
| Globe Life, Inc. | | 1,401 | 131,302 |
| Hartford Financial Services Group, Inc. (The) | | 4,675 | 322,762 |
| Lincoln National Corp. | | 2,227 | 152,015 |
| Loews Corp. | | 2,737 | 158,089 |
| Marsh & McLennan Cos., Inc. | | 6,619 | 1,150,515 |
| MetLife, Inc. | | 9,373 | 585,719 |
| Security | Shares | Value |
| Insurance (continued) | |
| Principal Financial Group, Inc. | | 3,232 | $ 233,770 |
| Progressive Corp. (The) | | 7,670 | 787,325 |
| Prudential Financial, Inc. | | 4,955 | 536,329 |
| Travelers Cos., Inc. (The) | | 3,225 | 504,487 |
| Willis Towers Watson PLC | | 1,634 | 388,059 |
| WR Berkley Corp. | | 1,914 | 157,694 |
| | | | $ 9,793,567 |
| Interactive Media & Services — 6.1% | |
| Alphabet, Inc., Class A(1) | | 3,971 | $ 11,504,146 |
| Alphabet, Inc., Class C(1) | | 3,693 | 10,686,028 |
| Match Group, Inc.(1) | | 3,728 | 493,028 |
| Meta Platforms, Inc., Class A(1) | | 31,249 | 10,510,601 |
| Twitter, Inc.(1) | | 10,746 | 464,442 |
| | | | $ 33,658,245 |
| Internet & Direct Marketing Retail — 3.7% | |
| Amazon.com, Inc.(1) | | 5,760 | $ 19,205,798 |
| eBay, Inc. | | 8,207 | 545,766 |
| Etsy, Inc.(1) | | 1,736 | 380,080 |
| | | | $ 20,131,644 |
| IT Services — 4.4% | |
| Accenture PLC, Class A | | 8,331 | $ 3,453,616 |
| Akamai Technologies, Inc.(1) | | 2,259 | 264,393 |
| Automatic Data Processing, Inc. | | 5,524 | 1,362,108 |
| Broadridge Financial Solutions, Inc. | | 1,586 | 289,953 |
| Cognizant Technology Solutions Corp., Class A | | 7,078 | 627,960 |
| DXC Technology Co.(1) | | 3,481 | 112,053 |
| EPAM Systems, Inc.(1) | | 770 | 514,707 |
| Fidelity National Information Services, Inc. | | 7,983 | 871,344 |
| Fiserv, Inc.(1) | | 7,790 | 808,524 |
| FleetCor Technologies, Inc.(1) | | 1,139 | 254,954 |
| Gartner, Inc.(1) | | 1,126 | 376,444 |
| Global Payments, Inc. | | 3,804 | 514,225 |
| International Business Machines Corp. | | 11,757 | 1,571,441 |
| Jack Henry & Associates, Inc. | | 1,053 | 175,840 |
| Mastercard, Inc., Class A | | 11,442 | 4,111,339 |
| Paychex, Inc. | | 4,207 | 574,256 |
| PayPal Holdings, Inc.(1) | | 15,503 | 2,923,556 |
| VeriSign, Inc.(1) | | 1,267 | 321,590 |
| Visa, Inc., Class A | | 22,107 | 4,790,808 |
| | | | $ 23,919,111 |
11
See Notes to Financial Statements.
Calvert
VP S&P 500® Index Portfolio
December 31, 2021
Schedule of Investments — continued
| Security | Shares | Value |
| Leisure Products — 0.0%(4) | |
| Hasbro, Inc. | | 1,748 | $ 177,911 |
| | | | $ 177,911 |
| Life Sciences Tools & Services — 2.0% | |
| Agilent Technologies, Inc. | | 3,969 | $ 633,651 |
| Bio-Rad Laboratories, Inc., Class A(1) | | 289 | 218,360 |
| Bio-Techne Corp. | | 530 | 274,190 |
| Charles River Laboratories International, Inc.(1) | | 700 | 263,746 |
| Danaher Corp. | | 8,397 | 2,762,697 |
| Illumina, Inc.(1) | | 2,049 | 779,521 |
| IQVIA Holdings, Inc.(1) | | 2,504 | 706,479 |
| Mettler-Toledo International, Inc.(1) | | 311 | 527,832 |
| PerkinElmer, Inc. | | 1,654 | 332,553 |
| Thermo Fisher Scientific, Inc. | | 5,196 | 3,466,979 |
| Waters Corp.(1) | | 826 | 307,768 |
| West Pharmaceutical Services, Inc. | | 1,008 | 472,762 |
| | | | $ 10,746,538 |
| Machinery — 1.5% | |
| Caterpillar, Inc. | | 7,092 | $ 1,466,200 |
| Cummins, Inc. | | 1,934 | 421,883 |
| Deere & Co. | | 3,699 | 1,268,350 |
| Dover Corp. | | 1,888 | 342,861 |
| Fortive Corp. | | 4,864 | 371,075 |
| IDEX Corp. | | 1,050 | 248,136 |
| Illinois Tool Works, Inc. | | 3,745 | 924,266 |
| Ingersoll Rand, Inc. | | 5,456 | 337,563 |
| Otis Worldwide Corp. | | 5,642 | 491,249 |
| PACCAR, Inc. | | 4,551 | 401,671 |
| Parker-Hannifin Corp. | | 1,692 | 538,259 |
| Pentair PLC | | 2,169 | 158,402 |
| Snap-on, Inc. | | 750 | 161,535 |
| Stanley Black & Decker, Inc. | | 2,137 | 403,081 |
| Westinghouse Air Brake Technologies Corp. | | 2,457 | 226,314 |
| Xylem, Inc. | | 2,496 | 299,320 |
| | | | $ 8,060,165 |
| Media — 1.0% | |
| Charter Communications, Inc., Class A(1) | | 1,622 | $ 1,057,495 |
| Comcast Corp., Class A | | 60,163 | 3,028,004 |
| Discovery, Inc., Class A(1) | | 2,457 | 57,838 |
| Discovery, Inc., Class C(1) | | 4,009 | 91,806 |
| DISH Network Corp., Class A(1) | | 3,394 | 110,101 |
| Fox Corp., Class A | | 4,627 | 170,736 |
| Fox Corp., Class B | | 2,402 | 82,317 |
| Interpublic Group of Cos., Inc. (The) | | 5,374 | 201,256 |
| Security | Shares | Value |
| Media (continued) | |
| News Corp., Class A | | 5,344 | $ 119,225 |
| News Corp., Class B | | 2,023 | 45,518 |
| Omnicom Group, Inc. | | 2,787 | 204,203 |
| ViacomCBS, Inc., Class B | | 8,174 | 246,691 |
| | | | $ 5,415,190 |
| Metals & Mining — 0.3% | |
| Freeport-McMoRan, Inc. | | 19,251 | $ 803,344 |
| Newmont Corp. | | 10,454 | 648,357 |
| Nucor Corp. | | 3,747 | 427,720 |
| | | | $ 1,879,421 |
| Multiline Retail — 0.5% | |
| Dollar General Corp. | | 3,059 | $ 721,404 |
| Dollar Tree, Inc.(1) | | 2,949 | 414,394 |
| Target Corp. | | 6,398 | 1,480,753 |
| | | | $ 2,616,551 |
| Multi-Utilities — 0.7% | |
| Ameren Corp. | | 3,377 | $ 300,587 |
| CenterPoint Energy, Inc. | | 8,244 | 230,090 |
| CMS Energy Corp. | | 3,798 | 247,060 |
| Consolidated Edison, Inc. | | 4,683 | 399,554 |
| Dominion Energy, Inc. | | 10,618 | 834,150 |
| DTE Energy Co. | | 2,646 | 316,303 |
| NiSource, Inc. | | 5,358 | 147,934 |
| Public Service Enterprise Group, Inc. | | 6,629 | 442,353 |
| Sempra Energy | | 4,186 | 553,724 |
| WEC Energy Group, Inc. | | 4,135 | 401,384 |
| | | | $ 3,873,139 |
| Oil, Gas & Consumable Fuels — 2.4% | |
| APA Corp. | | 5,270 | $ 141,710 |
| Chevron Corp. | | 25,436 | 2,984,915 |
| ConocoPhillips | | 17,291 | 1,248,064 |
| Coterra Energy, Inc. | | 11,020 | 209,380 |
| Devon Energy Corp. | | 8,547 | 376,495 |
| Diamondback Energy, Inc. | | 2,233 | 240,829 |
| EOG Resources, Inc. | | 7,670 | 681,326 |
| Exxon Mobil Corp. | | 55,831 | 3,416,299 |
| Hess Corp. | | 3,781 | 279,908 |
| Kinder Morgan, Inc. | | 25,564 | 405,445 |
| Marathon Oil Corp. | | 10,767 | 176,794 |
| Marathon Petroleum Corp. | | 8,070 | 516,399 |
| Occidental Petroleum Corp. | | 11,898 | 344,923 |
| ONEOK, Inc. | | 5,846 | 343,511 |
12
See Notes to Financial Statements.
Calvert
VP S&P 500® Index Portfolio
December 31, 2021
Schedule of Investments — continued
| Security | Shares | Value |
| Oil, Gas & Consumable Fuels (continued) | |
| Phillips 66 | | 5,744 | $ 416,210 |
| Pioneer Natural Resources Co. | | 3,055 | 555,644 |
| Valero Energy Corp. | | 5,360 | 402,590 |
| Williams Cos., Inc. (The) | | 15,929 | 414,791 |
| | | | $ 13,155,233 |
| Personal Products — 0.2% | |
| Estee Lauder Cos., Inc. (The), Class A | | 3,038 | $ 1,124,668 |
| | | | $ 1,124,668 |
| Pharmaceuticals — 3.6% | |
| Bristol-Myers Squibb Co. | | 29,099 | $ 1,814,323 |
| Catalent, Inc.(1) | | 2,327 | 297,926 |
| Eli Lilly & Co. | | 10,484 | 2,895,890 |
| Johnson & Johnson | | 34,771 | 5,948,275 |
| Merck & Co., Inc. | | 33,354 | 2,556,250 |
| Organon & Co. | | 3,526 | 107,367 |
| Pfizer, Inc. | | 74,083 | 4,374,601 |
| Viatris, Inc. | | 16,511 | 223,394 |
| Zoetis, Inc. | | 6,203 | 1,513,718 |
| | | | $ 19,731,744 |
| Professional Services — 0.4% | |
| Equifax, Inc. | | 1,599 | $ 468,171 |
| IHS Markit, Ltd. | | 5,229 | 695,039 |
| Jacobs Engineering Group, Inc. | | 1,800 | 250,614 |
| Leidos Holdings, Inc. | | 1,946 | 172,999 |
| Nielsen Holdings PLC | | 4,897 | 100,437 |
| Robert Half International, Inc. | | 1,459 | 162,708 |
| Verisk Analytics, Inc. | | 2,113 | 483,307 |
| | | | $ 2,333,275 |
| Real Estate Management & Development — 0.1% | |
| CBRE Group, Inc., Class A(1) | | 4,387 | $ 476,033 |
| | | | $ 476,033 |
| Road & Rail — 0.9% | |
| CSX Corp. | | 29,077 | $ 1,093,295 |
| J.B. Hunt Transport Services, Inc. | | 1,101 | 225,045 |
| Norfolk Southern Corp. | | 3,190 | 949,695 |
| Old Dominion Freight Line, Inc. | | 1,221 | 437,582 |
| Union Pacific Corp. | | 8,428 | 2,123,266 |
| | | | $ 4,828,883 |
| Semiconductors & Semiconductor Equipment — 6.2% | |
| Advanced Micro Devices, Inc.(1) | | 15,951 | $ 2,295,349 |
| Security | Shares | Value |
| Semiconductors & Semiconductor Equipment (continued) | |
| Analog Devices, Inc. | | 7,045 | $ 1,238,300 |
| Applied Materials, Inc. | | 11,837 | 1,862,670 |
| Broadcom, Inc. | | 5,429 | 3,612,511 |
| Enphase Energy, Inc.(1) | | 1,769 | 323,621 |
| Intel Corp. | | 53,707 | 2,765,910 |
| KLA Corp. | | 1,988 | 855,059 |
| Lam Research Corp. | | 1,846 | 1,327,551 |
| Microchip Technology, Inc. | | 7,392 | 643,547 |
| Micron Technology, Inc. | | 14,665 | 1,366,045 |
| Monolithic Power Systems, Inc. | | 581 | 286,625 |
| NVIDIA Corp. | | 32,977 | 9,698,865 |
| NXP Semiconductors NV | | 3,486 | 794,041 |
| Qorvo, Inc.(1) | | 1,538 | 240,528 |
| QUALCOMM, Inc. | | 14,788 | 2,704,282 |
| Skyworks Solutions, Inc. | | 2,165 | 335,878 |
| SolarEdge Technologies, Inc.(1) | | 689 | 193,313 |
| Teradyne, Inc. | | 2,237 | 365,817 |
| Texas Instruments, Inc. | | 12,207 | 2,300,653 |
| Xilinx, Inc. | | 3,250 | 689,097 |
| | | | $ 33,899,662 |
| Software — 9.2% | |
| Adobe, Inc.(1) | | 6,275 | $ 3,558,301 |
| ANSYS, Inc.(1) | | 1,144 | 458,881 |
| Autodesk, Inc.(1) | | 2,882 | 810,390 |
| Cadence Design Systems, Inc.(1) | | 3,727 | 694,526 |
| Ceridian HCM Holding, Inc.(1) | | 1,816 | 189,699 |
| Citrix Systems, Inc. | | 1,702 | 160,992 |
| Fortinet, Inc.(1) | | 1,779 | 639,373 |
| Intuit, Inc. | | 3,712 | 2,387,633 |
| Microsoft Corp. | | 99,126 | 33,338,056 |
| NortonLifeLock, Inc. | | 7,922 | 205,814 |
| Oracle Corp. | | 21,144 | 1,843,968 |
| Paycom Software, Inc.(1) | | 671 | 278,592 |
| PTC, Inc.(1) | | 1,470 | 178,091 |
| salesforce.com, inc.(1) | | 12,911 | 3,281,072 |
| ServiceNow, Inc.(1) | | 2,609 | 1,693,528 |
| Synopsys, Inc.(1) | | 1,999 | 736,632 |
| Tyler Technologies, Inc.(1) | | 550 | 295,873 |
| | | | $ 50,751,421 |
| Specialty Retail — 2.3% | |
| Advance Auto Parts, Inc. | | 894 | $ 214,453 |
| AutoZone, Inc.(1) | | 275 | 576,507 |
| Bath & Body Works, Inc. | | 3,633 | 253,547 |
| Best Buy Co., Inc. | | 3,045 | 309,372 |
13
See Notes to Financial Statements.
Calvert
VP S&P 500® Index Portfolio
December 31, 2021
Schedule of Investments — continued
| Security | Shares | Value |
| Specialty Retail (continued) | |
| CarMax, Inc.(1) | | 2,125 | $ 276,739 |
| Gap, Inc. (The) | | 3,143 | 55,474 |
| Home Depot, Inc. (The) | | 13,909 | 5,772,374 |
| Lowe's Cos., Inc. | | 9,078 | 2,346,481 |
| O'Reilly Automotive, Inc.(1) | | 883 | 623,601 |
| Ross Stores, Inc. | | 4,659 | 532,431 |
| TJX Cos., Inc. (The) | | 15,765 | 1,196,879 |
| Tractor Supply Co. | | 1,492 | 355,991 |
| Ulta Beauty, Inc.(1) | | 748 | 308,430 |
| | | | $ 12,822,279 |
| Technology Hardware, Storage & Peripherals — 7.0% | |
| Apple, Inc. | | 205,735 | $ 36,532,364 |
| Hewlett Packard Enterprise Co. | | 17,148 | 270,424 |
| HP, Inc. | | 15,109 | 569,156 |
| NetApp, Inc. | | 2,932 | 269,715 |
| Seagate Technology Holdings PLC | | 2,780 | 314,084 |
| Western Digital Corp.(1) | | 4,186 | 272,969 |
| | | | $ 38,228,712 |
| Textiles, Apparel & Luxury Goods — 0.6% | |
| NIKE, Inc., Class B | | 16,752 | $ 2,792,056 |
| PVH Corp. | | 1,085 | 115,715 |
| Ralph Lauren Corp. | | 671 | 79,755 |
| Tapestry, Inc. | | 3,845 | 156,107 |
| Under Armour, Inc., Class A(1) | | 2,891 | 61,260 |
| Under Armour, Inc., Class C(1) | | 2,684 | 48,419 |
| VF Corp. | | 4,393 | 321,656 |
| | | | $ 3,574,968 |
| Tobacco — 0.6% | |
| Altria Group, Inc. | | 24,082 | $ 1,141,246 |
| Philip Morris International, Inc. | | 20,409 | 1,938,855 |
| | | | $ 3,080,101 |
| Trading Companies & Distributors — 0.2% | |
| Fastenal Co. | | 7,540 | $ 483,013 |
| United Rentals, Inc.(1) | | 949 | 315,343 |
| W.W. Grainger, Inc. | | 567 | 293,842 |
| | | | $ 1,092,198 |
| Water Utilities — 0.1% | |
| American Water Works Co., Inc. | | 2,380 | $ 449,487 |
| | | | $ 449,487 |
| Security | Shares | Value |
| Wireless Telecommunication Services — 0.2% | |
| T-Mobile US, Inc.(1) | | 7,696 | $ 892,582 |
| | | | $ 892,582 |
Total Common Stocks
(identified cost $157,266,568) | | | $533,120,513 |
| Exchange-Traded Funds — 0.8% |
| Security | Shares | Value |
| Equity Funds — 0.8% | |
| SPDR S&P 500 ETF Trust | | 9,000 | $ 4,274,640 |
Total Exchange-Traded Funds
(identified cost $4,138,920) | | | $ 4,274,640 |
| Short-Term Investments — 2.1% | | | |
| Affiliated Fund — 1.9% |
| Description | Units | Value |
| Calvert Cash Reserves Fund, LLC, 0.06%(5) | | 10,524,218 | $ 10,524,218 |
Total Affiliated Fund
(identified cost $10,524,218) | | | $ 10,524,218 |
| Securities Lending Collateral — 0.0%(4) |
| Security | Shares | Value |
| State Street Navigator Securities Lending Government Money Market Portfolio, 0.03%(6) | | 79,865 | $ 79,865 |
Total Securities Lending Collateral
(identified cost $79,865) | | | $ 79,865 |
| U.S. Treasury Obligations — 0.2% |
| Security | Principal
Amount
(000's omitted) | Value |
| U.S. Treasury Bill, 0.00%, 2/24/22(7) | $ | 1,000 | $ 999,968 |
Total U.S. Treasury Obligations
(identified cost $999,899) | | | $ 999,968 |
Total Short-Term Investments
(identified cost $11,603,982) | | | $ 11,604,051 |
Total Investments — 100.0%
(identified cost $173,009,470) | | | $548,999,204 |
| Other Assets, Less Liabilities — (0.0)%(4) | | | $ (268,686) |
| Net Assets — 100.0% | | | $ 548,730,518 |
14
See Notes to Financial Statements.
Calvert
VP S&P 500® Index Portfolio
December 31, 2021
Schedule of Investments — continued
| The percentage shown for each investment category in the Schedule of Investments is based on net assets. |
| (1) | Non-income producing security. |
| (2) | All or a portion of this security was on loan at December 31, 2021. The aggregate market value of securities on loan at December 31, 2021 was $678,684. |
| (3) | Represents an investment in an issuer that is deemed to be an affiliate effective March 1, 2021 (see Note 9). |
| (4) | Amount is less than 0.05% or (0.05)%, as applicable. |
| (5) | Affiliated investment company, available to Calvert portfolios and funds, which invests in high quality, U.S. dollar denominated money market instruments. The rate shown is the annualized seven-day yield as of December 31, 2021. |
| (6) | Represents investment of cash collateral received in connection with securities lending. |
| (7) | Security (or a portion thereof) has been pledged to cover margin requirements on open futures contracts. |
Futures Contracts
| Description | Number of
Contracts | Position | Expiration
Date | Notional
Amount | Value/
Unrealized
Appreciation
(Depreciation) |
| Equity Futures | | | | | |
| E-mini S&P 500 Index | 49 | Long | 3/18/22 | $11,658,325 | $ 356,230 |
| | | | | | $356,230 |
15
See Notes to Financial Statements.
Calvert
VP S&P 500® Index Portfolio
December 31, 2021
Statement of Assets and Liabilities
| | December 31, 2021 |
| Assets | |
Investments in securities of unaffiliated issuers, at value (identified cost $162,065,913) - including
$678,684 of securities on loan | $ 536,627,713 |
| Investments in securities of affiliated issuers, at value (identified cost $10,943,557) | 12,371,491 |
| Receivable for capital shares sold | 33,539 |
| Dividends receivable | 324,909 |
| Dividends receivable - affiliated | 286 |
| Securities lending income receivable | 64 |
| Receivable from affiliate | 15,424 |
| Directors' deferred compensation plan | 109,131 |
| Total assets | $549,482,557 |
| Liabilities | |
| Payable for variation margin on open futures contracts | $ 33,193 |
| Payable for capital shares redeemed | 244,522 |
| Deposits for securities loaned | 79,865 |
| Payable to affiliates: | |
| Investment advisory fee | 82,671 |
| Administrative fee | 55,114 |
| Sub-transfer agency fee | 118 |
| Directors' deferred compensation plan | 109,131 |
| Accrued expenses | 147,425 |
| Total liabilities | $ 752,039 |
| Net Assets | $548,730,518 |
| Sources of Net Assets | |
| Paid-in capital | $ 135,644,133 |
| Distributable earnings | 413,086,385 |
| Net Assets | $548,730,518 |
| | |
| Net Assets | $ 548,730,518 |
| Shares Outstanding | 2,741,901 |
Net Asset Value, Offering Price and Redemption Price Per Share
(net assets ÷ shares of beneficial interest outstanding) | $ 200.13 |
16
See Notes to Financial Statements.
Calvert
VP S&P 500® Index Portfolio
December 31, 2021
| | Year Ended |
| | December 31, 2021 |
| Investment Income | |
| Dividend income (net of foreign taxes withheld of $948) | $ 7,126,833 |
| Dividend income - affiliated issuers | 40,064 |
| Interest income | 833 |
| Securities lending income, net | 11,844 |
| Total investment income | $ 7,179,574 |
| Expenses | |
| Investment advisory fee | $ 926,490 |
| Administrative fee | 617,660 |
| Directors' fees and expenses | 19,835 |
| Custodian fees | 16,899 |
| Transfer agency fees and expenses | 394,823 |
| Accounting fees | 116,163 |
| Professional fees | 37,397 |
| Reports to shareholders | 46 |
| Miscellaneous | 68,425 |
| Total expenses | $ 2,197,738 |
| Waiver and/or reimbursement of expenses by affiliate | $ (756,231) |
| Net expenses | $ 1,441,507 |
| Net investment income | $ 5,738,067 |
| Realized and Unrealized Gain (Loss) | |
| Net realized gain (loss): | |
| Investment securities | $ 31,877,641 |
| Investment securities - affiliated issuers | 108,936 |
| Futures contracts | 2,416,280 |
| Net realized gain | $ 34,402,857 |
| Change in unrealized appreciation (depreciation): | |
| Investment securities | $ 87,584,744 |
| Investment securities - affiliated issuers | 332,051 |
| Futures contracts | 188,050 |
| Net change in unrealized appreciation (depreciation) | $ 88,104,845 |
| Net realized and unrealized gain | $122,507,702 |
| Net increase in net assets from operations | $128,245,769 |
17
See Notes to Financial Statements.
Calvert
VP S&P 500® Index Portfolio
December 31, 2021
Statements of Changes in Net Assets
| | Year Ended December 31, |
| | 2021 | 2020 |
| Increase (Decrease) in Net Assets | | |
| From operations: | | |
| Net investment income | $ 5,738,067 | $ 6,836,974 |
| Net realized gain | 34,402,857 | 25,229,331 |
| Net change in unrealized appreciation (depreciation) | 88,104,845 | 42,267,475 |
| Net increase in net assets from operations | $128,245,769 | $ 74,333,780 |
| Distributions to shareholders | $ (31,368,176) | $ (21,497,256) |
| Net decrease in net assets from capital share transactions | $ (28,198,932) | $ (31,986,452) |
| Net increase in net assets | $ 68,678,661 | $ 20,850,072 |
| Net Assets | | |
| At beginning of year | $ 480,051,857 | $ 459,201,785 |
| At end of year | $548,730,518 | $480,051,857 |
18
See Notes to Financial Statements.
Calvert
VP S&P 500® Index Portfolio
December 31, 2021
| | Year Ended December 31, |
| | 2021 | 2020 | 2019 | 2018 | 2017 |
| Net asset value — Beginning of year | $ 165.98 | $ 147.79 | $ 123.19 | $ 141.18 | $ 122.44 |
| Income (Loss) From Operations | | | | | |
| Net investment income(1) | $ 2.08 | $ 2.31 | $ 2.43 | $ 2.39 | $ 2.30 |
| Net realized and unrealized gain (loss) | 43.96 | 23.51 | 34.42 | (7.33) | 23.60 |
| Total income (loss) from operations | $ 46.04 | $ 25.82 | $ 36.85 | $ (4.94) | $ 25.90 |
| Less Distributions | | | | | |
| From net investment income | $ (2.56) | $ (2.57) | $ (2.63) | $ (2.84) | $ (1.99) |
| From net realized gain | (9.33) | (5.06) | (9.62) | (10.21) | (5.17) |
| Total distributions | $ (11.89) | $ (7.63) | $ (12.25) | $ (13.05) | $ (7.16) |
| Net asset value — End of year | $ 200.13 | $ 165.98 | $ 147.79 | $ 123.19 | $ 141.18 |
| Total Return(2) | 28.42% | 18.11% | 31.16% | (4.74)% | 21.46% |
| Ratios/Supplemental Data | | | | | |
| Net assets, end of year (000’s omitted) | $548,731 | $480,052 | $459,202 | $391,342 | $515,105 |
| Ratios (as a percentage of average daily net assets):(3) | | | | | |
| Total expenses | 0.43% | 0.43% | 0.38% | 0.39% | 0.40% |
| Net expenses | 0.28% | 0.28% | 0.28% | 0.28% | 0.28% |
| Net investment income | 1.11% | 1.58% | 1.72% | 1.68% | 1.72% |
| Portfolio Turnover | 6% | 10% | 6% | 7% | 5% |
| (1) | Computed using average shares outstanding. |
| (2) | Returns are historical and are calculated by determining the percentage change in net asset value with all distributions reinvested and do not reflect fees and expenses imposed by variable annuity contracts or variable life insurance policies. If included, total return would be lower. |
| (3) | Total expenses do not reflect amounts reimbursed and/or waived by the adviser and certain of its affiliates, if applicable. Net expenses are net of all reductions and represent the net expenses paid by the Fund. |
19
See Notes to Financial Statements.
Calvert
VP S&P 500® Index Portfolio
December 31, 2021
Notes to Financial Statements
1 Significant Accounting Policies
Calvert VP S&P 500® Index Portfolio (the Fund) is a diversified series of Calvert Variable Products, Inc. (the Corporation). The Corporation is a Maryland corporation registered under the Investment Company Act of 1940, as amended (the 1940 Act), as an open-end management investment company. The investment objective of the Fund is to seek investment results that correspond to the total return performance of U.S. common stocks, as represented by the S&P 500® Index.
Shares of the Fund are sold without sales charge to insurance companies for allocation to certain of their variable separate accounts and to qualified pension and retirement plans and other eligible investors.
The Fund applies the accounting and reporting guidance in the Financial Accounting Standards Board (FASB) Accounting Standards Codification Topic 946, Financial Services – Investment Companies (ASC 946). Subsequent events, if any, through the date that the financial statements were issued have been evaluated in the preparation of the financial statements.
A Investment Valuation— Net asset value per share is determined every business day as of the close of the regular session of the New York Stock Exchange (generally 4:00 p.m. Eastern time). The Fund uses independent pricing services approved by the Board of Directors (the Board) to value its investments wherever possible. Investments for which market quotations are not available or deemed not reliable are fair valued in good faith under the direction of the Board.
U.S. generally accepted accounting principles (U.S. GAAP) establishes a disclosure hierarchy that categorizes the inputs to valuation techniques used to value assets and liabilities at measurement date. These inputs are summarized in the three broad levels listed below:
Level 1 - quoted prices in active markets for identical securities
Level 2 - other significant observable inputs (including quoted prices for similar securities, interest rates, prepayment speeds, credit risk, etc.)
Level 3 - significant unobservable inputs (including the Fund’s own assumptions in determining the fair value of investments)
The inputs or methodologies used for valuing securities are not necessarily an indication of the risk associated with investing in those securities.
Valuation techniques used to value the Fund’s investments by major category are as follows:
Equity Securities. Equity securities (including warrants and rights) listed on a U.S. securities exchange generally are valued at the last sale or closing price as reported by an independent pricing service on the primary market or exchange on which they are traded and are categorized as Level 1 in the hierarchy. Equity securities listed on the NASDAQ National Market System are valued at the NASDAQ official closing price and are categorized as Level 1 in the hierarchy. Unlisted or listed securities for which closing sales prices or closing quotations are not available are valued at the mean between the latest available bid and ask prices and are categorized as Level 2 in the hierarchy.
Short-Term Debt Securities. Short-term debt securities with a remaining maturity at time of purchase of more than sixty days are valued based on valuations provided by a third party pricing service. Such securities are generally categorized as Level 2 in the hierarchy. Short-term debt securities of sufficient credit quality purchased with remaining maturities of sixty days or less for which a valuation from a third party pricing service is not readily available may be valued at amortized cost, which approximates fair value, and are categorized as Level 2 in the hierarchy.
Affiliated Fund. The Fund may invest in Calvert Cash Reserves Fund, LLC (Cash Reserves Fund), an affiliated investment company managed by Calvert Research and Management (CRM). While Cash Reserves Fund is not a registered money market mutual fund, it conducts all of its investment activities in accordance with the requirements of Rule 2a-7 under the 1940 Act. Investments in Cash Reserves Fund are valued at the closing net asset value per unit on the valuation day and are categorized as Level 2 in the hierarchy. Cash Reserves Fund generally values its investment securities based on available market quotations provided by a third party pricing service.
Other Securities. Exchange-traded funds are valued at the official closing price as reported by an independent pricing service on the primary market or exchange on which they are traded and are categorized as Level 1 in the hierarchy. Investments in registered investment companies (including money market funds) that do not trade on an exchange are valued at the net asset value per share on the valuation day and are categorized as Level 1 in the hierarchy.
Derivatives. Futures contracts are valued at unrealized appreciation (depreciation) based on the settlement price established each day by the board of trade or exchange on which they are traded and are categorized as Level 1 in the hierarchy.
Fair Valuation. If a market value cannot be determined for a security using the methodologies described above, or if, in the good faith opinion of the Fund's adviser, the market value does not constitute a readily available market quotation, or if a significant event has occurred that would materially affect the value of the security, the security will be fair valued as determined in good faith by or at the direction of the Board in a manner that most fairly reflects the security’s “fair value”, which is the amount that the Fund might reasonably expect to receive for the security upon its current sale in the ordinary course. Each such determination is based on a consideration of relevant factors, which are likely to vary from one pricing context to another. These factors may include, but are not limited to, the type of security, the existence of any contractual restrictions on the security’s disposition, the price and extent of public
Calvert
VP S&P 500® Index Portfolio
December 31, 2021
Notes to Financial Statements — continued
trading in similar securities of the issuer or of comparable companies or entities, quotations or relevant information obtained from broker/dealers or other market participants, information obtained from the issuer, analysts, and/or the appropriate stock exchange (for exchange-traded securities), an analysis of the company’s or entity’s financial statements, and an evaluation of the forces that influence the issuer and the market(s) in which the security is purchased and sold.
The values assigned to fair value investments are based on available information and do not necessarily represent amounts that might ultimately be realized. Further, due to the inherent uncertainty of valuations of such investments, the fair values may differ significantly from the values that would have been used had an active market existed, and the differences could be material.
The following table summarizes the market value of the Fund's holdings as of December 31, 2021, based on the inputs used to value them:
| Asset Description | Level 1 | Level 2 | Level 3 | Total |
| Common Stocks | $ 533,120,513(1) | $ — | $ — | $ 533,120,513 |
| Exchange-Traded Funds | 4,274,640 | — | — | 4,274,640 |
| Short-Term Investments: | | | | |
| Affiliated Fund | — | 10,524,218 | — | 10,524,218 |
| Securities Lending Collateral | 79,865 | — | — | 79,865 |
| U.S. Treasury Obligations | — | 999,968 | — | 999,968 |
| Total Investments | $537,475,018 | $11,524,186 | $ — | $548,999,204 |
| Futures Contracts | $ 356,230 | $ — | $ — | $ 356,230 |
| Total | $537,831,248 | $11,524,186 | $ — | $549,355,434 |
| (1) | The level classification by major category of investments is the same as the category presentation in the Schedule of Investments. |
B Investment Transactions and Income— Investment transactions for financial statement purposes are accounted for on trade date. Realized gains and losses are recorded on an identified cost basis and may include proceeds from litigation. Dividend income is recorded on the ex-dividend date for dividends received in cash and/or securities or, in the case of dividends on certain foreign securities, as soon as the Fund is informed of the ex-dividend date. Non-cash dividends are recorded at the fair value of the securities received. Withholding taxes on foreign dividends, if any, have been provided for in accordance with the Fund’s understanding of the applicable country’s tax rules and rates. Distributions received that represent a return of capital are recorded as a reduction of cost of investments. Distributions received that represent a capital gain are recorded as a realized gain. Interest income, which includes amortization of premium and accretion of discount on debt securities, is accrued as earned.
C Futures Contracts— The Fund may enter into futures contracts to buy or sell a financial instrument for a set price at a future date. Initial margin deposits of either cash or securities as required by the broker are made upon entering into the contract. While the contract is open, daily variation margin payments are made to or received from the broker reflecting the daily change in market value of the contract and are recorded for financial reporting purposes as unrealized gains or losses by the Fund. When a futures contract is closed, a realized gain or loss is recorded equal to the difference between the opening and closing value of the contract. The risks associated with entering into futures contracts may include the possible illiquidity of the secondary market which would limit the Fund’s ability to close out a futures contract prior to the settlement date, an imperfect correlation between the value of the contracts and the underlying financial instruments, or that the counterparty will fail to perform its obligations under the contracts’ terms. Futures contracts are designed by boards of trade, which are designated “contracts markets” by the Commodities Futures Trading Commission. Futures contracts trade on the contracts markets in a manner that is similar to the way a stock trades on a stock exchange, and the boards of trade, through their clearing corporations, guarantee the futures contracts against default. As a result, there is minimal counterparty credit risk to the Fund.
D Distributions to Shareholders— Distributions to shareholders are recorded by the Fund on ex-dividend date. The Fund distributes any net investment income and net realized capital gains at least annually. Both types of distributions are made in shares of the Fund unless an election is made on behalf of a separate account to receive some or all of the distributions in cash. Distributions are determined in accordance with income tax regulations, which may differ from U.S. GAAP; accordingly, periodic reclassifications are made within the Fund's capital accounts to reflect income and gains available for distribution under income tax regulations.
E Estimates— The preparation of financial statements in conformity with U.S. GAAP requires management to make estimates and assumptions that affect the reported amounts of assets and liabilities and disclosure of contingent assets and liabilities at the date of the financial statements and the reported amounts of increases and decreases in net assets from operations during the reporting period. Actual results could differ from those estimates.
F Indemnifications— The Corporation’s By-Laws provide for indemnification for Directors or officers of the Corporation and certain other parties, to the fullest extent permitted by Maryland law and the 1940 Act, provided certain conditions are met. Additionally, in the normal course of business, the Fund
Calvert
VP S&P 500® Index Portfolio
December 31, 2021
Notes to Financial Statements — continued
enters into agreements with service providers that may contain indemnification clauses. The Fund’s maximum exposure under these arrangements is unknown as this would involve future claims that may be made against the Fund that have not yet occurred.
G Federal Income Taxes— No provision for federal income or excise tax is required since the Fund intends to continue to qualify as a regulated investment company under the Internal Revenue Code and to distribute substantially all of its taxable earnings.
Management has analyzed the Fund's tax positions taken for all open federal income tax years and has concluded that no provision for federal income tax is required in the Fund's financial statements. A Fund's federal tax return is subject to examination by the Internal Revenue Service for a period of three years from the date of filing.
2 Related Party Transactions
The investment advisory fee is earned by CRM as compensation for investment advisory services rendered to the Fund. On March 1, 2021, Morgan Stanley acquired Eaton Vance Corp. (the “Transaction”) and CRM became an indirect, wholly-owned subsidiary of Morgan Stanley. In connection with the Transaction, the Fund entered into a new investment advisory agreement (the “New Agreement”) with CRM, which took effect on March 1, 2021. Pursuant to the New Agreement (and the Fund’s investment advisory agreement with CRM in effect prior to March 1, 2021), the fee is computed at the annual rate of 0.18% of the Fund’s average daily net assets and is payable monthly. For the year ended December 31, 2021, the investment advisory fee amounted to $926,490. The Fund may invest its cash in Cash Reserves Fund. CRM does not currently receive a fee for advisory services provided to Cash Reserves Fund.
Pursuant to an investment sub-advisory agreement, CRM has delegated the investment management of the Fund to Ameritas Investment Partners, Inc. (AIP). In connection with the Transaction, CRM entered into a new investment sub-advisory agreement with AIP, which took effect on March 1, 2021. CRM pays AIP a portion of its investment advisory fee for sub-advisory services provided to the Fund.
CRM has agreed to reimburse the Fund’s operating expenses to the extent that total annual operating expenses (relating to ordinary operating expenses only and excluding expenses such as brokerage commissions, acquired fund fees and expenses of unaffiliated funds, borrowing costs, taxes or litigation expenses) exceed 0.28% of the Fund's average daily net assets. The expense reimbursement agreement with CRM may be changed or terminated after April 30, 2022. For the year ended December 31, 2021, CRM waived or reimbursed expenses of $756,231.
The administrative fee is earned by CRM as compensation for administrative services rendered to the Fund. The fee is computed at an annual rate of 0.12% of the Fund’s average daily net assets and is payable monthly. For the year ended December 31, 2021, CRM was paid administrative fees of $617,660.
Eaton Vance Management (EVM), an affiliate of CRM, provides sub-transfer agency and related services to the Fund pursuant to a Sub-Transfer Agency Support Services Agreement. For the year ended December 31, 2021, sub-transfer agency fees and expenses incurred to EVM amounted to $485 and are included in transfer agency fees and expenses on the Statement of Operations.
Each Director of the Fund who is not an employee of CRM or its affiliates receives an annual fee of $154,000 ($214,000 effective January 1, 2022), plus an annual Committee fee ranging from $8,500 to $16,500 depending on the Committee. The Board chair receives an additional $30,000 annual fee, Committee chairs receive an additional $6,000 annual fee and the special equities liaison receives an additional $2,500 annual fee. Eligible Directors may participate in a Deferred Compensation Plan (the Plan). Amounts deferred under the Plan are treated as though equal dollar amounts had been invested in shares of the Fund or other Calvert funds selected by the Directors. The Fund purchases shares of the funds selected equal to the dollar amounts deferred under the Plan, resulting in an asset equal to the deferred compensation liability. Obligations of the Plan are paid solely from the Fund's assets. Directors’ fees are allocated to each of the Calvert funds served. Salaries and fees of officers and Directors of the Fund who are employees of CRM or its affiliates are paid by CRM.
3 Shareholder Servicing Plan
The Corporation, on behalf of the Fund, has adopted a Shareholder Servicing Plan (Servicing Plan), which permits the Fund to enter into shareholder servicing agreements with intermediaries that maintain accounts in the Fund for the benefit of shareholders. These services may include, but are not limited to, processing purchase and redemption requests, processing dividend payments, and providing account information to shareholders. Under the Servicing Plan, the Fund may make payments at an annual rate of up to 0.11% of its average daily net assets. For the year ended December 31, 2021, expenses incurred under the Servicing Plan amounted to $393,773, of which $345,989 were payable to an affiliate of AIP, and are included in transfer agency fees and expenses on the Statement of Operations. Included in accrued expenses at December 31, 2021 are amounts payable to an affiliate of AIP under the Servicing Plan of $29,931.
4 Investment Activity
During the year ended December 31, 2021, the cost of purchases and proceeds from sales of investments, other than short-term securities, were $31,329,426 and $81,095,883, respectively.
Calvert
VP S&P 500® Index Portfolio
December 31, 2021
Notes to Financial Statements — continued
5 Distributions to Shareholders and Income Tax Information
The tax character of distributions declared for the years ended December 31, 2021 and December 31, 2020 was as follows:
| | Year Ended December 31, |
| | 2021 | 2020 |
| Ordinary income | $ 8,656,984 | $ 8,689,350 |
| Long-term capital gains | $22,711,192 | $12,807,906 |
As of December 31, 2021, the components of distributable earnings (accumulated loss) on a tax basis were as follows:
| Undistributed ordinary income | $ 8,590,776 |
| Undistributed long-term capital gains | 31,270,986 |
| Net unrealized appreciation | 373,224,623 |
| Distributable earnings | $413,086,385 |
The cost and unrealized appreciation (depreciation) of investments, including open derivative contracts, of the Fund at December 31, 2021, as determined on a federal income tax basis, were as follows:
| Aggregate cost | $175,774,581 |
| Gross unrealized appreciation | $ 377,633,050 |
| Gross unrealized depreciation | (4,408,427) |
| Net unrealized appreciation | $373,224,623 |
6 Financial Instruments
A summary of futures contracts outstanding at December 31, 2021 is included in the Schedule of Investments. During the year ended December 31, 2021, the Fund used futures contracts to provide equity market exposure for uncommitted cash balances.
At December 31, 2021, the fair value of open derivative instruments (not considered to be hedging instruments for accounting disclosure purposes) and whose primary underlying risk exposure is equity price risk was as follows:
| Derivative | Statement of Assets and Liabilities Caption | Assets | Liabilities |
| Futures contracts | Distributable earnings | | $356,230 (1) | $ — |
| (1) | Only the current day's variation margin is reported within the Statement of Assets and Liabilities as Receivable or Payable for variation margin on open futures contracts, as applicable. |
The effect of derivative instruments (not considered to be hedging instruments for accounting disclosure purposes) on the Statement of Operations and whose primary underlying risk exposure is equity price risk for the year ended December 31, 2021 was as follows:
| | Statement of Operations Caption | |
| Derivative | Net realized gain (loss): Futures
contracts | Change in unrealized appreciation
(depreciation): Futures contracts |
| Futures contracts | $ 2,416,280 | $ 188,050 |
The average notional cost of futures contracts (long) outstanding during the year ended December 31, 2021 was approximately $8,657,000.
Calvert
VP S&P 500® Index Portfolio
December 31, 2021
Notes to Financial Statements — continued
7 Securities Lending
To generate additional income, the Fund may lend its securities pursuant to a securities lending agency agreement with State Street Bank and Trust Company (SSBT), the securities lending agent. Security loans are subject to termination by the Fund at any time and, therefore, are not considered illiquid investments. The Fund requires that the loan be continuously collateralized by either cash or securities in an amount at least equal to the market value of the securities on loan. The market value of securities loaned is determined daily and any additional required collateral is delivered to the Fund on the next business day. Cash collateral is generally invested in a money market fund registered under the 1940 Act that is managed by an affiliate of SSBT. Any gain or loss in the market price of the loaned securities that might occur and any interest earned or dividends declared during the term of the loan would accrue to the account of the Fund. Income earned on the investment of collateral, net of broker rebates and other expenses incurred by the securities lending agent, is split between the Fund and the securities lending agent based on agreed upon contractual terms. Non-cash collateral, if any, is held by the lending agent on behalf of the Fund and cannot be sold or re-pledged by the Fund; accordingly, such collateral is not reflected in the Statement of Assets and Liabilities.
The risks associated with lending portfolio securities include, but are not limited to, possible delays in receiving additional collateral or in the recovery of the loaned securities, possible loss of rights to the collateral should the borrower fail financially, as well as risk of loss in the value of the collateral or the value of the investments made with the collateral. The securities lending agent shall indemnify the Fund in the case of default of any securities borrower.
At December 31, 2021, the total value of securities on loan was $678,684 and the total value of collateral received was $708,660, comprised of cash of $79,865 and U.S. government and/or agencies securities of $628,795.
The following table provides a breakdown of securities lending transactions accounted for as secured borrowings, the obligations by class of collateral pledged, and the remaining contractual maturity of those transactions as of December 31, 2021.
| | Remaining Contractual Maturity of the Transactions |
| | Overnight and
Continuous | <30 days | 30 to 90 days | >90 days | Total |
| Common Stocks | $79,865 | $ — | $ — | $ — | $79,865 |
The carrying amount of the liability for deposits for securities loaned at December 31, 2021 approximated its fair value. If measured at fair value, such liability would have been considered as Level 2 in the fair value hierarchy (see Note 1A) at December 31, 2021.
8 Line of Credit
The Fund participates with other portfolios and funds managed by EVM and its affiliates, including CRM, in an $800 million unsecured line of credit with a group of banks, which is in effect through October 25, 2022. Borrowings are made by the Fund solely for temporary purposes related to redemptions and other short-term cash needs. Interest is charged to the Fund based on its borrowings at an amount above either the Secured Overnight Financing Rate (SOFR) or Federal Funds rate. In addition, a fee computed at an annual rate of 0.15% on the daily unused portion of the line of credit is allocated among the participating portfolios and funds at the end of each quarter. In connection with the renewal of the agreement in October 2021, an arrangement fee of $150,000 was incurred that was allocated to the participating portfolios and funds. Because the line of credit is not available exclusively to the Fund, it may be unable to borrow some or all of its requested amounts at any particular time.
The Fund had no borrowings pursuant to its line of credit during the year ended December 31, 2021.
Calvert
VP S&P 500® Index Portfolio
December 31, 2021
Notes to Financial Statements — continued
9 Affiliated Issuers and Funds
At December 31, 2021, the value of the Fund’s investment in affiliated issuers and funds was $12,371,491, which represents 2.3% of the Fund’s net assets. Transactions in affiliated issuers and funds by the Fund for the year ended December 31, 2021 were as follows:
| Name | Value,
beginning
of period | Purchases | Sales
proceeds | Net
realized
gain
(loss) | Change in
unrealized
appreciation
(depreciation) | Value,
end of
period | Dividend
income | Shares/Units,
end of period |
| Common Stocks | | | | | | |
| Morgan Stanley(1) | $ — | $ 19,755 | $ (259,038) | $ 110,256 | $ 332,051 | $ 1,847,273 | $ 35,261 | 18,819 |
| Short-Term Investments | | | | | | |
| Calvert Cash Reserves Fund, LLC | 11,649,985 | 62,501,567 | (63,626,014) | (1,320) | — | 10,524,218 | 4,803 | 10,524,218 |
| Totals | | | | $108,936 | $332,051 | $12,371,491 | $40,064 | |
| (1) | Affiliated issuer as of March 1, 2021 (see Note 2). |
10 Capital Shares
The Corporation may issue its shares in one or more series (such as the Fund). The authorized shares of the Fund consist of 30,000,000 common shares, $0.10 par value.
Transactions in capital shares for the years ended December 31, 2021 and December 31, 2020 were as follows:
| | Year Ended
December 31, 2021 | | Year Ended
December 31, 2020 |
| | Shares | Amount | | Shares | Amount |
| Shares sold | 99,582 | $ 18,668,371 | | 146,187 | $ 20,566,726 |
| Reinvestment of distributions | 171,608 | 31,368,176 | | 145,242 | 21,497,256 |
| Shares redeemed | (421,537) | (78,235,479) | | (506,311) | (74,050,434) |
| Net decrease | (150,347) | $(28,198,932) | | (214,882) | $(31,986,452) |
At December 31, 2021, separate accounts of an insurance company that is an affiliate of AIP owned 92.0% of the value of the outstanding shares of the Fund.
11 Risks and Uncertainties
Pandemic Risk
An outbreak of respiratory disease caused by a novel coronavirus was first detected in China in late 2019 and subsequently spread internationally. This coronavirus has resulted in closing borders, enhanced health screenings, changes to healthcare service preparation and delivery, quarantines, cancellations, disruptions to supply chains and customer activity, as well as general concern and uncertainty. Health crises caused by outbreaks, such as the coronavirus outbreak, may exacerbate other pre-existing political, social and economic risks and disrupt normal market conditions and operations. The impact of this outbreak has negatively affected the worldwide economy, the economies of individual countries, individual companies, and the market in general, and may continue to do so in significant and unforeseen ways, as may other epidemics and pandemics that may arise in the future. Any such impact could adversely affect the Fund's performance, or the performance of the securities in which the Fund invests.
12 Change in Independent Registered Public Accounting Firm
On July 30, 2021, KPMG LLP (“KPMG”) informed the Audit Committee and Board of the Corporation that it was resigning as the independent registered public accounting firm to the Corporation, as upon Morgan Stanley’s acquisition of Eaton Vance Corp., the parent company of CRM (the investment adviser to each series of the Corporation), KPMG would no longer be independent of the Corporation. The Audit Committee of the Board and the Board approved the selection of Deloitte & Touche LLP (“Deloitte”) as the independent registered public accounting firm for the funds that are series of the Corporation (the “Funds”) for the fiscal year ending December 31, 2021 to be effective upon KPMG’s resignation and Deloitte’s acceptance of the engagement which became effective July 30, 2021.
Calvert
VP S&P 500® Index Portfolio
December 31, 2021
Notes to Financial Statements — continued
KPMG’s reports on the financial statements for the Funds for the fiscal periods ended December 31, 2019 and December 31, 2020 contained no adverse opinion or disclaimer of opinion nor were they qualified or modified as to uncertainty, audit scope or accounting principles. During the fiscal periods ended December 31, 2019 and December 31, 2020, and during the subsequent interim period through July 30, 2021: (i) there were no disagreements with KPMG on any matter of accounting principles or practices, financial statement disclosure or auditing scope or procedure, which disagreements, if not resolved to the satisfaction of KPMG, would have caused KPMG to make reference to the subject matter of the disagreements in connection with its reports on the Funds’ financial statements for such periods; and (ii) there were no “reportable events” of the kind described in Item 304(a)(1)(v) of Regulation S-K under the Securities Exchange Act of 1934, as amended.
During the fiscal periods ended December 31, 2019 and December 31, 2020, and during the subsequent interim period through July 30, 2021: neither the Funds, nor anyone on their behalf, consulted with Deloitte on items which: (i) concerned the application of accounting principles to a specified transaction, either completed or proposed, or the type of audit opinion that might be rendered on the Funds’ financial statements; or (ii) concerned the subject of a disagreement (as defined in paragraph (a)(1)(iv) of Item 304 of Regulation S-K) or reportable events (as described in paragraph (a)(1)(v) of Item 304).
Calvert
VP S&P 500® Index Portfolio
December 31, 2021
Report of Independent Registered Public Accounting Firm
To the Board of Directors of Calvert Variable Products, Inc. and Shareholders of Calvert VP S&P 500® Index Portfolio:
Opinion on the Financial Statements and Financial Highlights
We have audited the accompanying statement of assets and liabilities of Calvert VP S&P 500® Index Portfolio (the "Fund") (one of the funds constituting Calvert Variable Products, Inc.), including the schedule of investments, as of December 31, 2021, the related statements of operations, changes in net assets, and the financial highlights for the year then ended, and the related notes. In our opinion, the financial statements and financial highlights present fairly, in all material respects, the financial position of the Fund as of December 31, 2021, and the results of its operations, changes in its net assets, and the financial highlights for the year then ended in conformity with accounting principles generally accepted in the United States of America. The statement of changes in net assets for the year ended December 31, 2020, and the financial highlights for the years ended December 31, 2020, 2019, 2018, and 2017 were audited by other auditors whose report, dated February 18, 2021, expressed an unqualified opinion on that financial statement and those financial highlights.
Basis for Opinion
These financial statements and financial highlights are the responsibility of the Fund's management. Our responsibility is to express an opinion on the Fund's financial statements and financial highlights based on our audit. We are a public accounting firm registered with the Public Company Accounting Oversight Board (United States) (PCAOB) and are required to be independent with respect to the Fund in accordance with the U.S. federal securities laws and the applicable rules and regulations of the Securities and Exchange Commission and the PCAOB.
We conducted our audit in accordance with the standards of the PCAOB. Those standards require that we plan and perform the audit to obtain reasonable assurance about whether the financial statements and financial highlights are free of material misstatement, whether due to error or fraud. The Fund is not required to have, nor were we engaged to perform, an audit of its internal control over financial reporting. As part of our audit, we are required to obtain an understanding of internal control over financial reporting but not for the purpose of expressing an opinion on the effectiveness of the Fund’s internal control over financial reporting. Accordingly, we express no such opinion.
Our audit included performing procedures to assess the risks of material misstatement of the financial statements and financial highlights, whether due to error or fraud, and performing procedures that respond to those risks. Such procedures included examining, on a test basis, evidence regarding the amounts and disclosures in the financial statements and financial highlights. Our audit also included evaluating the accounting principles used and significant estimates made by management, as well as evaluating the overall presentation of the financial statements and financial highlights. Our procedures included confirmation of securities owned as of December 31, 2021, by correspondence with the custodian and brokers; when replies were not received from brokers, we performed other auditing procedures. We believe that our audit provides a reasonable basis for our opinion.
/s/ Deloitte & Touche LLP
Boston, Massachusetts
February 18, 2022
We have served as the auditor of one or more Calvert investment companies since 2021.
Calvert
VP S&P 500® Index Portfolio
December 31, 2021
Federal Tax Information (Unaudited)
As required by the Internal Revenue Code and/or regulations, shareholders must be notified regarding the status of the dividends received deduction for corporations and capital gains dividends.
Dividends Received Deduction. Corporate shareholders are generally entitled to take the dividends received deduction on the portion of the Fund's dividend distribution that qualifies under tax law. For the Fund's fiscal 2021 ordinary income dividends, 82.76% qualifies for the corporate dividends received deduction.
Capital Gains Dividends. The Fund hereby designates as a capital gain dividend with respect to the taxable year ended December 31, 2021, $31,271,118 or, if subsequently determined to be different, the net capital gain of such year.
Calvert
VP S&P 500® Index Portfolio
December 31, 2021
Management and Organization
Fund Management. The Directors of Calvert Variable Products, Inc. (the Corporation) are responsible for the overall management and supervision of the affairs of the Corporation. The Board members and officers of the Corporation are listed below. Except as indicated, each individual has held the office shown or other offices in the same company for the last five years. Board members hold indefinite terms of office. Each Director holds office until his or her successor is elected and qualified, or until his or her earlier death, resignation, retirement, removal or disqualification. Under the terms of the Fund’s current Board member retirement policy, an Independent Board member must retire at the end of the calendar year in which he or she turns 75. However, if such retirement would cause the Fund to be out of compliance with Section 16 of the 1940 Act or any other regulations or guidance of the SEC, then such retirement will not become effective until such time as action has been taken for the Fund to be in compliance therewith. The “noninterested Directors” consist of those Directors who are not “interested persons” of the Corporation, as that term is defined under the 1940 Act. The business address of each Board member and the Chief Compliance Officer is 1825 Connecticut Avenue, NW, Suite 400, Washington, DC 20009 and the business address of the Secretary, Vice President and Chief Legal Officer and the Treasurer is Two International Place, Boston, Massachusetts 02110. As used below, “CRM” refers to Calvert Research and Management and “Eaton Vance” refers to Eaton Vance Management. Each Director oversees 39 funds in the Calvert fund complex. Effective March 1, 2021, each of Eaton Vance and CRM are indirect, wholly-owned subsidiaries of Morgan Stanley. Each officer affiliated with CRM may hold a position with other CRM affiliates that is comparable to his or her position with CRM listed below.
| Name and Year of Birth | Corporation
Position(s) | Length of
Service | Principal Occupation(s) and Other Directorships
During Past Five Years and Other Relevant Experience |
| Interested Director |
John H. Streur(1)
1960 | Director and
President | Since 2015 | President and Chief Executive Officer of CRM (since December 31, 2016). President and Chief Executive Officer of Calvert Investments, Inc.
(January 2015 - December 2016); Chief Executive Officer of Calvert
Investment Distributors, Inc. (August 2015 - December 2016); Chief
Compliance Officer of Calvert Investment Management, Inc. (August 2015 -
April 2016); President and Director, Portfolio 21 Investments, Inc.
(through October 2014); President, Chief Executive Officer and
Director, Managers Investment Group LLC (through January 2012);
President and Director, The Managers Funds and Managers AMG
Funds (through January 2012).
Other Directorships. Portfolio 21 Investments, Inc. (asset management)
(through October 2014); Managers Investment Group LLC (asset management)
(through January 2012); The Managers Funds (asset management)
(through January 2012); Managers AMG Funds (asset management)
(through January 2012); Calvert Impact Capital, Inc. |
| Noninterested Directors |
Richard L. Baird, Jr.
1948 | Director | Since 2016 | Regional Disaster Recovery Lead, American Red Cross of Greater
Pennsylvania (since 2017). Volunteer, American Red Cross (since 2015).
Former President and CEO of Adagio Health Inc. (retired in 2014) in
Pittsburgh, PA.
Other Directorships. None. |
Alice Gresham Bullock
1950 | Chair and
Director | Since 2016 (Chair);
Since 2008 (Director) | Professor Emerita at Howard University School of Law. Dean Emerita of
Howard University School of Law and Deputy Director of the Association
of American Law Schools (1992-1994).
Other Directorships. None. |
Cari M. Dominguez
1949 | Director | Since 2016 | Former Chair of the U.S. Equal Employment Opportunity Commission.
Other Directorships. ManpowerGroup Inc. (workforce solutions company);
Triple S Management Corporation (managed care); National Association of Corporate Directors. |
John G. Guffey, Jr.
1948 | Director | Since 2016 | President of Aurora Press Inc., a privately held publisher of trade
paperbacks (since January 1997).
Other Directorships. Calvert Impact Capital, Inc. (through December 31, 2018);
Calvert Ventures, LLC. |
Miles D. Harper, III
1962 | Director | Since 2016 | Partner, Carr Riggs & Ingram (public accounting firm) since October 2014.
Partner, Gainer Donnelly & Desroches (public accounting firm) (now Carr
Riggs & Ingram) (November 1999 - September 2014).
Other Directorships. Bridgeway Funds (9) (asset management). |
Joy V. Jones
1950 | Director | Since 2016 | Attorney.
Other Directorships. Palm Management Corporation. |
Calvert
VP S&P 500® Index Portfolio
December 31, 2021
Management and Organization — continued
| Name and Year of Birth | Corporation
Position(s) | Length of
Service | Principal Occupation(s) and Other Directorships
During Past Five Years and Other Relevant Experience |
| Noninterested Directors (continued) |
Anthony A. Williams
1951 | Director | Since 2016 | CEO and Executive Director of the Federal City Council (July 2012 to
present); Senior Adviser and Independent Consultant for King and
Spalding LLP (September 2015 to present); Executive Director of Global
Government Practice at the Corporate Executive Board (January 2010 to
January 2012).
Other Directorships. Freddie Mac; Evoq Properties/Meruelo Maddux
Properties, Inc. (real estate management); Weston Solutions, Inc.
(environmental services); Bipartisan Policy Center’s Debt Reduction Task Force;
Chesapeake Bay Foundation; Catholic University of America; Urban Institute (research organization); The Howard Hughes Corporation (real estate development). |
| Name and Year of Birth | Corporation
Position(s) | Length of
Service | Principal Occupation(s)
During Past Five Years |
| Principal Officers who are not Directors |
Hope L. Brown
1973 | Chief
Compliance
Officer | Since 2014 | Chief Compliance Officer of 39 registered investment companies advised
by CRM (since 2014). Vice President and Chief Compliance Officer,
Wilmington Funds (2012-2014). |
Deidre E. Walsh
1971 | Secretary,
Vice President
and Chief
Legal Officer | Since 2021 | Vice President of CRM and officer of 39 registered investment companies
advised by CRM (since 2021). Also Vice President of Eaton Vance and
certain of its affiliates and officer of 138 registered investment companies
advised or administered by Eaton Vance. |
James F. Kirchner
1967 | Treasurer | Since 2016 | Vice President of CRM and officer of 39 registered investment companies
advised by CRM (since 2016). Also Vice President of Eaton Vance and
certain of its affiliates and officer of 138 registered investment companies
advised or administered by Eaton Vance. |
| | | | |
| (1) Mr. Streur is an interested person of the Fund because of his positions with the Fund’s adviser and certain affiliates. |
The SAI for the Fund includes additional information about the Directors and officers of the Fund and can be obtained without charge on Calvert’s website at www.calvert.com or by calling 1-800-368-2745.
| FACTS | WHAT DOES EATON VANCE DO WITH YOUR
PERSONAL INFORMATION? |
| Why? | Financial companies choose how they share your personal information. Federal law gives consumers the right to limit some but not all sharing. Federal law also requires us to tell you how we collect, share, and protect your personal information. Please read this notice carefully to understand what we do. |
| |
| What? | The types of personal information we collect and share depend on the product or service you have with us. This information can include:■ Social Security number and income
■
investment experience and risk tolerance
■
checking account number and wire transfer instructions |
| |
| How? | All financial companies need to share customers’ personal information to run their everyday business. In the section below, we list the reasons financial companies can share their customers’ personal information; the reasons Eaton Vance chooses to share; and whether you can limit this sharing. |
Reasons we can share your
personal information | Does Eaton Vance
share? | Can you limit
this sharing? |
| For our everyday business purposes — such as to process your transactions, maintain your account(s), respond to court orders and legal investigations, or report to credit bureaus | Yes | No |
| For our marketing purposes — to offer our products and services to you | Yes | No |
| For joint marketing with other financial companies | No | We don’t share |
| For our investment management affiliates’ everyday business purposes — information about your transactions, experiences, and creditworthiness | Yes | Yes |
| For our affiliates’ everyday business purposes — information about your transactions and experiences | Yes | No |
| For our affiliates’ everyday business purposes — information about your creditworthiness | No | We don’t share |
| For our investment management affiliates to market to you | Yes | Yes |
| For our affiliates to market to you | No | We don’t share |
| For nonaffiliates to market to you | No | We don’t share |
To limit our
sharing | Call toll-free 1-800-368-2745 or email: CRMPrivacy@calvert.comPlease note:If you are a new customer, we can begin sharing your information 30 days from the date we sent this notice. When you are no longer our customer, we continue to share your information as described in this notice. However, you can contact us at any time to limit our sharing. |
| Questions? | Call toll-free 1-800-368-2745 or email: CRMPrivacy@calvert.com |
| Privacy Notice — continued | April 2021 |
| Who we are |
| Who is providing this notice? | Eaton Vance Management, Eaton Vance Distributors, Inc., Eaton Vance Trust Company, Eaton Vance Management (International) Limited, Eaton Vance Advisers International Ltd., Eaton Vance Global Advisors Limited, Eaton Vance Management’s Real Estate Investment Group, Boston Management and Research, Calvert Research and Management, Eaton Vance and Calvert Fund Families and our investment advisory affiliates (“Eaton Vance”) (see Investment Management Affiliates definition below) |
| What we do |
How does Eaton Vance
protect my personal
information? | To protect your personal information from unauthorized access and use, we use security measures that comply with federal law. These measures include computer safeguards and secured files and buildings. We have policies governing the proper handling of customer information by personnel and requiring third parties that provide support to adhere to appropriate security standards with respect to such information. |
How does Eaton Vance
collect my personal
information? | We collect your personal information, for example, when you■ open an account or make deposits or withdrawals from your account
■
buy securities from us or make a wire transfer
■
give us your contact informationWe also collect your personal information from others, such as credit bureaus, affiliates, or other companies. |
| Why can’t I limit all sharing? | Federal law gives you the right to limit only■ sharing for affiliates’ everyday business purposes — information about your creditworthiness
■
affiliates from using your information to market to you
■
sharing for nonaffiliates to market to youState laws and individual companies may give you additional rights to limit sharing. See below for more on your rights under state law. |
| Definitions |
Investment Management
Affiliates | Eaton Vance Investment Management Affiliates include registered investment advisers, registered broker- dealers, and registered and unregistered funds. Investment Management Affiliates does not include entities associated with Morgan Stanley Wealth Management, such as Morgan Stanley Smith Barney LLC and Morgan Stanley & Co. |
| Affiliates | Companies related by common ownership or control. They can be financial and nonfinancial companies.■ Our affiliates include companies with a Morgan Stanley name and financial companies such as Morgan Stanley Smith Barney LLC and Morgan Stanley & Co. |
| Nonaffiliates | Companies not related by common ownership or control. They can be financial and nonfinancial companies.■ Eaton Vance does not share with nonaffiliates so they can market to you. |
| Joint marketing | A formal agreement between nonaffiliated financial companies that together market financial products or services to you.■ Eaton Vance doesn’t jointly market. |
| Other important information |
| Vermont: Except as permitted by law, we will not share personal information we collect about Vermont residents with Nonaffiliates unless you provide us with your written consent to share such information.California: Except as permitted by law, we will not share personal information we collect about California residents with Nonaffiliates and we will limit sharing such personal information with our Affiliates to comply with California privacy laws that apply to us. |
Delivery of Shareholder Documents. The Securities and Exchange Commission (SEC) permits funds to deliver only one copy of shareholder documents, including prospectuses, proxy statements and shareholder reports, to fund investors with multiple accounts at the same residential or post office box address. This practice is often called “householding” and it helps eliminate duplicate mailings to shareholders. Calvert funds, or your financial intermediary, may household the mailing of your documents indefinitely unless you instruct Calvert funds, or your financial intermediary, otherwise. If you would prefer that your Calvert fund documents not be householded, please contact Calvert funds at 1-800-368-2745, or contact your financial intermediary. Your instructions that householding not apply to delivery of your Calvert fund documents will typically be effective within 30 days of receipt by Calvert funds or your financial intermediary. Separate statements will be generated for each separate account and will be householded as described above.
Portfolio Holdings. Each Calvert fund files a schedule of portfolio holdings on Part F to Form N-PORT with the SEC. Certain information filed on Form N-PORT may be viewed on the Calvert website at www.calvert.com, by calling Calvert at 1-800-368-2745 or in the EDGAR database on the SEC’s website at www.sec.gov.
Proxy Voting. The Proxy Voting Guidelines that each Calvert fund uses to determine how to vote proxies relating to portfolio securities is provided as an Appendix to the fund’s Statement of Additional Information. The Statement of Additional Information can be obtained free of charge by calling the Calvert funds at 1-800-368-2745, by visiting the Calvert funds’ website at www.calvert.com or visiting the SEC’s website at www.sec.gov. Information regarding how a Calvert fund voted proxies relating to portfolio securities during the most recent 12-month period ended June 30 is available by calling Calvert funds, by visiting the Calvert funds’ website at www.calvert.com or by visiting the SEC’s website at www.sec.gov.
This Page Intentionally Left Blank
This Page Intentionally Left Blank
This Page Intentionally Left Blank
Investment Adviser and Administrator
Calvert Research and Management
1825 Connecticut Avenue NW, Suite 400
Washington, DC 20009
Investment Sub-Adviser
Ameritas Investment Partners, Inc.
5945 R Street
Lincoln, NE 68505
Principal Underwriter*
Eaton Vance Distributors, Inc.
Two International Place
Boston, MA 02110
(617) 482-8260
Custodian
State Street Bank and Trust Company
State Street Financial Center, One Lincoln Street
Boston, MA 02111
Transfer Agent
DST Asset Manager Solutions, Inc.
2000 Crown Colony Drive
Quincy, MA 02169
Independent Registered Public Accounting Firm
Deloitte & Touche LLP
200 Berkeley Street
Boston, MA 02116-5022
Fund Offices
1825 Connecticut Avenue NW, Suite 400
Washington, DC 20009
* FINRA BrokerCheck. Investors may check the background of their Investment Professional by contacting the Financial Industry Regulatory Authority (FINRA). FINRA BrokerCheck is a free tool to help investors check the professional background of current and former FINRA-registered securities firms and brokers. FINRA BrokerCheck is available by calling 1-800-289-9999 and at www.FINRA.org. The FINRA BrokerCheck brochure describing this program is available to investors at www.FINRA.org.
Printed on recycled paper.
24221 12.31.21
Calvert
VP Volatility Managed Moderate Portfolio
Annual Report
December 31, 2021
Commodity Futures Trading Commission Registration. The Commodity Futures Trading Commission (“CFTC”) has adopted regulations that subject registered investment companies and advisers to regulation by the CFTC if a fund invests more than a prescribed level of its assets in certain CFTC-regulated instruments (including futures, certain options and swap agreements) or markets itself as providing investment exposure to such instruments. The adviser has claimed an exclusion from the definition of “commodity pool operator” under the Commodity Exchange Act with respect to its management of the Fund and the other funds it manages. Accordingly, neither the Fund nor the adviser is subject to CFTC regulation.
Fund shares are not insured by the FDIC and are not deposits or other obligations of, or guaranteed by, any depository institution. Shares are subject to investment risks, including possible loss of principal invested.
This report must be preceded or accompanied by a current summary prospectus or prospectus. Before investing, investors should consider carefully the investment objective, risks, and charges and expenses of a mutual fund. This and other important information is contained in the summary prospectus and prospectus, which can be obtained from a financial intermediary. Prospective investors should read the prospectus carefully before investing. For further information, please call 1-800-368-2745.
Annual Report December 31, 2021
Calvert
VP Volatility Managed Moderate Portfolio
Calvert
VP Volatility Managed Moderate Portfolio
December 31, 2021
Management's Discussion of Fund Performance†
Economic and Market Conditions
The 12-month period starting January 1, 2021, was notable for a global equity rally that lasted for most of the period. Investors cheered the reopening of businesses that had been affected by the pandemic and the rollout of highly effective COVID-19 vaccines. In contrast, fixed-income returns were generally weak during the period.
COVID-19 continued to have a grip on the global economy. Disease rates advanced and declined with new waves of infections worldwide. Worker shortages led to global supply-chain disruptions. Scarcities of key items led to temporary factory shutdowns and empty store shelves. In the U.S., those shortages — combined with high demand from consumers eager to spend money saved earlier in the pandemic — led to higher year-over-year inflation than had been seen in decades.
Early in the period while stock prices climbed, credit spreads tightened, and long-term U.S. Treasury yields rose as the U.S. dollar weakened. In the first quarter, the Bloomberg U.S. Aggregate Bond Index posted its worst quarterly return in 40 years. In the second quarter, fixed-income markets revived as the U.S. Treasury yield curve flattened.
In September, equity indexes worldwide reported negative returns. In the U.S., weak job creation and the U.S. Federal Reserve’s (the Fed’s) announcement that it might soon begin tapering its monthly bond purchases and possibly raise interest rates in 2022 weighed on U.S. stocks. However, in the final quarter of 2021, stock prices came roaring back as the central bank’s actions to tamp down inflation were applauded by investors. Even the emergence of a new COVID-19 variant caused only a temporary market retreat.
Meanwhile, the Fed’s tightening monetary policy caused a further flattening of the Treasury curve. During the fourth quarter, investment-grade corporate credit spreads widened modestly and high yield bond spreads tightened, leaving the Bloomberg U.S. Aggregate Bond Index essentially flat for the quarter.
For the period as a whole, the MSCI World Index returned 21.82%; the S&P 500® Index returned 28.71%; and the Nasdaq Composite Index returned 22.18%. In fixed-income, the Bloomberg U.S. Corporate Bond Index returned (1.04)%, while the ICE BofA U.S. High Yield Index gained 5.36%.
Investment Strategy
Calvert VP Volatility Managed Moderate Portfolio (the Fund) invests in exchange-traded funds (ETFs) representing a broad range of asset classes. The Fund uses a macro strategy that entails setting an asset-allocation target weight, along with a typical allocation range. Market capitalizations, investment styles, and business sectors are among the variables considered when securities are selected for the Fund. Target asset weights may change periodically based on economic conditions and other factors. The Fund implements a volatility-management and capital-protection strategy that uses equity index futures contracts to try to keep the portfolio’s volatility range close to 8% to pursue growth in up markets, and to serve as a hedge against potential declines in the value of the Fund’s ETF investments. The Fund continuously monitors market volatility and may adjust its futures contracts to pursue its financial goals.
Fund Performance
For the 12-month period ended December 31, 2021, Calvert VP Volatility Managed Moderate Portfolio (the Fund) returned 10.06% for Class F shares at net asset value (NAV), outperforming its primary benchmark, the S&P Global LargeMidCap Managed Risk Index – Conservative (the Index), which returned 8.36%.
Outperformance relative to the Index during the period was the result of a combination of the asset allocation and volatility management strategies. The Index is used to capture the impact of the Fund’s volatility-management strategy. Fund performance is also measured against a blended benchmark (the Secondary Blended Index) based on a mix of market indexes that more closely reflects the impact of the Fund’s asset allocations than the single asset-class Index. During the period, the Fund outperformed the Secondary Blended Index, which returned 9.87%.
Through most of 2021, the volatility range of the Fund’s underlying assets was generally below its 8% target, and averaged 6.2% for the full year. The Fund held a long equity futures position during most of the period. As a result, the strategy helped raise the Fund’s annualized volatility rate to 7.0%, a 0.8% improvement.
The volatility-management strategy produced a performance gain for the year. As a result of its long equity futures position, the Fund benefited from a general rise in asset prices in 2021. Derivative positions added 0.64% to Fund performance during the period.
Asset allocation had a modest positive effect on relative performance to the Secondary Blended Index. The Fund outperformed in the first quarter because of overweight exposures to small-cap and mid-cap stocks as well as an exposure to the financials sector. In the fourth quarter, the Fund had modestly overweight exposure to large-cap growth stocks, which outperformed the broad market during the period.
See Endnotes and Additional Disclosures in this report.
Past performance is no guarantee of future results. Returns are historical and are calculated by determining the percentage change in net asset value (NAV) or offering price (as applicable) with all distributions reinvested. Investment return and principal value will fluctuate so that shares, when redeemed, may be worth more or less than their original cost. Performance for periods less than or equal to one year is cumulative. Performance is for the stated time period only; due to market volatility, current Fund performance may be lower or higher than the quoted return.
Calvert
VP Volatility Managed Moderate Portfolio
December 31, 2021
Performance
Portfolio Manager(s) Kevin L. Keene, CFA of Ameritas Investment Partners, Inc.; Thomas B. Lee, CFA and Christopher Haskamp, CFA, each of Parametric Portfolio Associates LLC
| % Average Annual Total Returns1,2 | Class
Inception Date | Performance
Inception Date | One Year | Five Years | Since
Inception |
| Class F at NAV | 04/30/2013 | 04/30/2013 | 10.06% | 7.47% | 5.95% |
|
| S&P Global LargeMidCap Managed Risk Index - Conservative | — | — | 8.36% | 7.95% | 5.92% |
| Moderate Portfolio Blended Benchmark | — | — | 9.87 | 9.57 | 7.79 |
| % Total Annual Operating Expense Ratios3 | Class F |
| Gross | 0.98% |
| Net | 0.88 |
Growth of $10,000
This graph shows the change in value of a hypothetical investment of $10,000 in Class F of the Fund for the period indicated. For comparison, the same investment is shown in the indicated index.
See Endnotes and Additional Disclosures in this report.
Past performance is no guarantee of future results. Returns are historical and are calculated by determining the percentage change in net asset value (NAV) or offering price (as applicable) with all distributions reinvested. Investment return and principal value will fluctuate so that shares, when redeemed, may be worth more or less than their original cost. Performance for periods less than or equal to one year is cumulative. Performance is for the stated time period only; due to market volatility, current Fund performance may be lower or higher than the quoted return.
Calvert
VP Volatility Managed Moderate Portfolio
December 31, 2021
Asset Allocation (% of total investments)
| Top 10 Holdings (% of net assets)* | |
| iShares Core U.S. Aggregate Bond ETF | 22.6% |
| Vanguard Total Bond Market ETF | 22.6 |
| Vanguard S&P 500 ETF | 20.5 |
| Vanguard FTSE Developed Markets ETF | 8.9 |
| iShares S&P 500 Growth ETF | 7.0 |
| iShares S&P 500 Value ETF | 5.0 |
| Vanguard REIT ETF | 2.1 |
| iShares Russell 2000 ETF | 2.0 |
| Vanguard FTSE Emerging Markets ETF | 1.7 |
| iShares Core S&P Mid-Cap ETF | 1.0 |
| Total | 93.4% |
| * | Excludes cash and cash equivalents. |
Calvert
VP Volatility Managed Moderate Portfolio
December 31, 2021
Endnotes and Additional Disclosures
| † | The views expressed in this report are those of the portfolio manager(s) and are current only through the date stated at the top of this page. These views are subject to change at any time based upon market or other conditions, and Calvert and the Fund(s) disclaim any responsibility to update such views. These views may not be relied upon as investment advice and, because investment decisions are based on many factors, may not be relied upon as an indication of trading intent on behalf of any Calvert fund. This commentary may contain statements that are not historical facts, referred to as “forward-looking statements.” The Fund’s actual future results may differ significantly from those stated in any forward-looking statement, depending on factors such as changes in securities or financial markets or general economic conditions, the volume of sales and purchases of Fund shares, the continuation of investment advisory, administrative and service contracts, and other risks discussed from time to time in the Fund’s filings with the Securities and Exchange Commission. |
| | |
| 1 | S&P Global LargeMidCap Managed Risk Index - Conservative is an unmanaged index designed to simulate a dynamic protective portfolio that allocates between the underlying equity index and cash, based on realized volatilities of the underlying equity and bond indices, while maintaining a fixed 50% allocation to the underlying bond index. The index has a risk management overlay that seeks to limit the index volatility to 8%, and includes a synthetic put position to reduce downside risk. S&P Dow Jones Indices are a product of S&P Dow Jones Indices LLC (“S&P DJI”) and have been licensed for use. S&P® and S&P 500® are registered trademarks of S&P DJI; Dow Jones® is a registered trademark of Dow Jones Trademark Holdings LLC (“Dow Jones”); S&P DJI, Dow Jones and their respective affiliates do not sponsor, endorse, sell or promote the Fund, will not have any liability with respect thereto and do not have any liability for any errors, omissions, or interruptions of the S&P Dow Jones Indices. Bloomberg U.S. Aggregate Bond Index is an unmanaged index of domestic investment-grade bonds, including corporate, government and mortgage-backed securities. Russell 3000® Index is an unmanaged index of the 3,000 largest U.S. stocks. MSCI EAFE Index is an unmanaged index of equities in the developed markets, excluding the U.S. and Canada. MSCI USA IMI/Equity REITs Index is an unmanaged index of U.S. equity REITs. MSCI indexes are net of foreign withholding taxes. Source: MSCI. MSCI data may not be reproduced or used for any other purpose. MSCI provides no warranties, has not prepared or approved this report, and has no liability hereunder. ICE BofA 3-Month U.S. Treasury Bill Index is an unmanaged index of U.S. Treasury securities maturing in 90 days. ICE® BofA® indices are not for redistribution or other uses; provided “as is”, without warranties, and with no liability. Eaton Vance has prepared this report and ICE Data Indices, LLC does not endorse it, or guarantee, review, or endorse |
| | Eaton Vance’s products. BofA® is a licensed registered trademark of Bank of America Corporation in the United States and other countries. Moderate Portfolio Blended Benchmark is an internally constructed benchmark which is comprised of a blend of 48% Bloomberg U.S. Aggregate Bond Index, 36% Russell 3000® Index, 10% MSCI EAFE Index, 4% ICE BofA 3-Month U.S. Treasury Bill Index, and 2% MSCI USA IMI/Equity REITs Index, which is rebalanced monthly. Unless otherwise stated, index returns do not reflect the effect of any applicable sales charges, commissions, expenses, taxes or leverage, as applicable. It is not possible to invest directly in an index. |
| 2 | There is no sales charge. Insurance-related charges are not included in the calculation of returns. If such charges were reflected, the returns would be lower. Please refer to the report for your insurance contract for performance data reflecting insurance-related charges. Performance since inception for an index, if presented, is the performance since the Fund’s or oldest share class’ inception, as applicable.Calvert Research and Management became the investment adviser to the Fund on December 31, 2016. Performance reflected prior to such date is that of the Fund’s former investment adviser. |
| 3 | Source: Fund prospectus. Net expense ratio reflects a contractual expense reimbursement that continues through 4/30/22. The expense ratios for the current reporting period can be found in the Financial Highlights section of this report. Performance reflects expenses waived and/or reimbursed, if applicable. Without such waivers and/or reimbursements, performance would have been lower. |
| | Fund profile subject to change due to active management |
| | Additional Information |
| | Yield curve is a graphical representation of the yields offered by bonds of various maturities. The yield curve flattens when long-term interest rates fall and/or short-term interest rates increase, and the yield curve steepens when long-term interest rates increase and/or short-term interest rates fall. |
| | MSCI World Index is an unmanaged index of equity securities in the developed markets. S&P 500® Index is an unmanaged index of large-cap stocks commonly used as a measure of U.S. stock market performance. Nasdaq Composite Index is a market capitalization-weighted index of all domestic and international securities listed on Nasdaq. Source: Nasdaq, Inc. The information is provided by Nasdaq (with its affiliates, are referred to as the “Corporations”) and Nasdaq’s third party licensors on an “as is” basis and the Corporations make no guarantees and bear no liability of any kind with respect to the information or the Fund. Bloomberg U.S. Corporate Bond Index measures the performance of investment-grade U.S. corporate |
Calvert
VP Volatility Managed Moderate Portfolio
December 31, 2021
Endnotes and Additional Disclosures — continued
securities with a maturity of one year or more. ICE BofA U.S. High Yield Index is an unmanaged index of below-investment grade U.S. corporate bonds.
Calvert
VP Volatility Managed Moderate Portfolio
December 31, 2021
Example
As a Fund shareholder, you incur ongoing costs, including management fees; distribution and/or service fees; and other Fund expenses. This Example is intended to help you understand your ongoing costs (in dollars) of Fund investing and to compare these costs with the ongoing costs of investing in other mutual funds. The Example is based on an investment of $1,000 invested at the beginning of the period and held for the entire period (July 1, 2021 to December 31, 2021).
Actual Expenses
The first line of the table below provides information about actual account values and actual expenses. You may use the information in this line, together with the amount you invested, to estimate the expenses that you paid over the period. Simply divide your account value by $1,000 (for example, an $8,600 account value divided by $1,000 = 8.6), then multiply the result by the number in the first line under the heading entitled “Expenses Paid During Period” to estimate the expenses you paid on your account during this period.
Hypothetical Example for Comparison Purposes
The second line of the table below provides information about hypothetical account values and hypothetical expenses based on the actual Fund expense ratio and an assumed rate of return of 5% per year (before expenses), which is not the actual Fund return. The hypothetical account values and expenses may not be used to estimate the actual ending account balance or expenses you paid for the period. You may use this information to compare the ongoing costs of investing in the Fund and other funds. To do so, compare this 5% hypothetical example with the 5% hypothetical examples that appear in the shareholder reports of the other funds.
Please note that the expenses shown in the table are meant to highlight your ongoing costs only and do not reflect expenses and charges which are, or may be imposed under the variable annuity contract or variable life insurance policy (variable contracts) (if applicable) or qualified pension or retirement plans (Qualified Plans) through which your investment in the Fund is made. Therefore, the second line of the table is useful in comparing ongoing costs associated with an investment in vehicles which fund benefits under variable contracts and Qualified Plans, and will not help you determine the relative total costs of investing in the Fund through variable contracts or Qualified Plans. In addition, if these expenses and charges imposed under the variable contracts or Qualified Plans were included, your costs would have been higher.
| | Beginning
Account Value
(7/1/21) | Ending
Account Value
(12/31/21) | Expenses Paid
During Period*
(7/1/21 – 12/31/21) | Annualized
Expense
Ratio |
| Actual | | | | |
| Class F | $1,000.00 | $1,041.70 | $4.17 ** | 0.81% |
| Hypothetical | | | | |
| (5% return per year before expenses) | | | | |
| Class F | $1,000.00 | $1,021.12 | $4.13 ** | 0.81% |
| * | Expenses are equal to the Fund's annualized expense ratio, multiplied by the average account value over the period, multiplied by 184/365 (to reflect the one-half year period). The Example assumes that the $1,000 was invested at the net asset value per share determined at the close of business on June 30, 2021. Expenses shown do not include insurance-related charges or direct expenses of Qualified Plans. Expenses do not include fees and expenses incurred indirectly from investment in underlying affiliated and/or unaffiliated funds. |
| ** | Absent a waiver and/or reimbursement of expenses by an affiliate, expenses would be higher. |
Calvert
VP Volatility Managed Moderate Portfolio
December 31, 2021
| Exchange-Traded Funds — 93.9% |
| Security | Shares | Value |
| Equity Funds — 48.7% | |
| iShares Core S&P Mid-Cap ETF | | 4,000 | $ 1,132,320 |
| iShares Russell 2000 ETF(1) | | 10,000 | 2,224,500 |
| iShares S&P 500 Growth ETF(1) | | 92,000 | 7,697,640 |
| iShares S&P 500 Value ETF | | 35,000 | 5,482,050 |
| Technology Select Sector SPDR Fund | | 3,000 | 521,610 |
| Vanguard FTSE Developed Markets ETF(1) | | 193,000 | 9,854,580 |
| Vanguard FTSE Emerging Markets ETF(1) | | 39,000 | 1,928,940 |
| Vanguard REIT ETF(1) | | 20,000 | 2,320,200 |
| Vanguard S&P 500 ETF | | 52,000 | 22,701,640 |
| | | | $ 53,863,480 |
| Fixed-Income Funds — 45.2% | |
| iShares Core U.S. Aggregate Bond ETF | | 219,000 | $ 24,983,520 |
| Vanguard Total Bond Market ETF | | 294,000 | 24,916,500 |
| | | | $ 49,900,020 |
Total Exchange-Traded Funds
(identified cost $76,623,974) | | | $103,763,500 |
| Short-Term Investments — 8.0% | | | |
| Affiliated Fund — 6.0% |
| Description | Units | Value |
| Calvert Cash Reserves Fund, LLC, 0.06%(2) | | 6,641,920 | $ 6,641,920 |
Total Affiliated Fund
(identified cost $6,641,874) | | | $ 6,641,920 |
| Securities Lending Collateral — 2.0% |
| Security | Shares | Value |
| State Street Navigator Securities Lending Government Money Market Portfolio, 0.03%(3) | | 2,205,750 | $ 2,205,750 |
Total Securities Lending Collateral
(identified cost $2,205,750) | | | $ 2,205,750 |
Total Short-Term Investments
(identified cost $8,847,624) | | | $ 8,847,670 |
Total Investments — 101.9%
(identified cost $85,471,598) | | | $112,611,170 |
| Other Assets, Less Liabilities — (1.9)% | | | $ (2,077,338) |
| Net Assets — 100.0% | | | $ 110,533,832 |
| The percentage shown for each investment category in the Schedule of Investments is based on net assets. |
| (1) | All or a portion of this security was on loan at December 31, 2021. The aggregate market value of securities on loan at December 31, 2021 was $17,296,826. |
| (2) | Affiliated investment company, available to Calvert portfolios and funds, which invests in high quality, U.S. dollar denominated money market instruments. The rate shown is the annualized seven-day yield as of December 31, 2021. |
| (3) | Represents investment of cash collateral received in connection with securities lending. |
8
See Notes to Financial Statements.
Calvert
VP Volatility Managed Moderate Portfolio
December 31, 2021
Schedule of Investments — continued
Futures Contracts
| Description | Number of
Contracts | Position | Expiration
Date | Notional
Amount | Value/
Unrealized
Appreciation
(Depreciation) |
| Equity Futures | | | | | |
| E-mini S&P 500 Index | 13 | Long | 3/18/22 | $3,093,025 | $ 63,992 |
| E-mini S&P MidCap 400 Index | 2 | Long | 3/18/22 | 567,540 | 12,627 |
| MSCI EAFE Index | 10 | Long | 3/18/22 | 1,160,900 | 16,198 |
| | | | | | $92,817 |
9
See Notes to Financial Statements.
Calvert
VP Volatility Managed Moderate Portfolio
December 31, 2021
Statement of Assets and Liabilities
| | December 31, 2021 |
| Assets | |
Investments in securities of unaffiliated issuers, at value (identified cost $78,829,724) - including
$17,296,826 of securities on loan | $ 105,969,250 |
| Investments in securities of affiliated issuers, at value (identified cost $6,641,874) | 6,641,920 |
| Deposits at broker for futures contracts | 249,000 |
| Receivable for capital shares sold | 346 |
| Dividends receivable - affiliated | 328 |
| Securities lending income receivable | 2,617 |
| Directors' deferred compensation plan | 26,852 |
| Total assets | $112,890,313 |
| Liabilities | |
| Payable for variation margin on open futures contracts | $ 9,405 |
| Payable for capital shares redeemed | 3,459 |
| Deposits for securities loaned | 2,205,750 |
| Payable to affiliates: | |
| Investment advisory fee | 37,272 |
| Administrative fee | 11,181 |
| Distribution and service fees | 23,295 |
| Sub-transfer agency fee | 35 |
| Directors' deferred compensation plan | 26,852 |
| Other | 7,424 |
| Accrued expenses | 31,808 |
| Total liabilities | $ 2,356,481 |
| Net Assets | $110,533,832 |
| Sources of Net Assets | |
| Paid-in capital | $ 80,191,567 |
| Distributable earnings | 30,342,265 |
| Net Assets | $110,533,832 |
| Class F Shares | |
| Net Assets | $ 110,533,832 |
| Shares Outstanding | 5,314,511 |
Net Asset Value, Offering Price and Redemption Price Per Share
(net assets ÷ shares of beneficial interest outstanding) | $ 20.80 |
10
See Notes to Financial Statements.
Calvert
VP Volatility Managed Moderate Portfolio
December 31, 2021
| | Year Ended |
| | December 31, 2021 |
| Investment Income | |
| Dividend income | $ 1,826,542 |
| Dividend income - affiliated issuers | 4,966 |
| Securities lending income, net | 15,773 |
| Total investment income | $ 1,847,281 |
| Expenses | |
| Investment advisory fee | $ 443,004 |
| Administrative fee | 132,901 |
| Distribution and service fees | 276,878 |
| Directors' fees and expenses | 4,406 |
| Custodian fees | 4,768 |
| Transfer agency fees and expenses | 81,810 |
| Accounting fees | 24,962 |
| Professional fees | 26,996 |
| Reports to shareholders | 900 |
| Miscellaneous | 7,855 |
| Total expenses | $ 1,004,480 |
| Waiver and/or reimbursement of expenses by affiliate | $ (107,102) |
| Net expenses | $ 897,378 |
| Net investment income | $ 949,903 |
| Realized and Unrealized Gain (Loss) | |
| Net realized gain (loss): | |
| Investment securities | $ 3,982,785 |
| Investment securities - affiliated issuers | (749) |
| Futures contracts | 510,923 |
| Capital gains distributions received | 54,293 |
| Net realized gain | $ 4,547,252 |
| Change in unrealized appreciation (depreciation): | |
| Investment securities | $ 5,073,449 |
| Investment securities - affiliated issuers | 138 |
| Futures contracts | 82,428 |
| Net change in unrealized appreciation (depreciation) | $ 5,156,015 |
| Net realized and unrealized gain | $ 9,703,267 |
| Net increase in net assets from operations | $10,653,170 |
11
See Notes to Financial Statements.
Calvert
VP Volatility Managed Moderate Portfolio
December 31, 2021
Statements of Changes in Net Assets
| | Year Ended December 31, |
| | 2021 | 2020 |
| Increase (Decrease) in Net Assets | | |
| From operations: | | |
| Net investment income | $ 949,903 | $ 1,144,171 |
| Net realized gain (loss) | 4,547,252 | (1,859,323) |
| Net change in unrealized appreciation (depreciation) | 5,156,015 | 5,887,684 |
| Net increase in net assets from operations | $ 10,653,170 | $ 5,172,532 |
| Distributions to shareholders | $ (1,151,612) | $ (4,029,212) |
| Net decrease in net assets from capital share transactions | $ (8,173,688) | $ (2,068,280) |
| Net increase (decrease) in net assets | $ 1,327,870 | $ (924,960) |
| Net Assets | | |
| At beginning of year | $ 109,205,962 | $ 110,130,922 |
| At end of year | $110,533,832 | $109,205,962 |
12
See Notes to Financial Statements.
Calvert
VP Volatility Managed Moderate Portfolio
December 31, 2021
| | Class F |
| | Year Ended December 31, |
| | 2021 | 2020 | 2019 | 2018 | 2017 |
| Net asset value — Beginning of year | $ 19.10 | $ 18.86 | $ 16.49 | $ 18.18 | $ 16.52 |
| Income (Loss) From Operations | | | | | |
| Net investment income(1) | $ 0.17 | $ 0.20 | $ 0.29 | $ 0.27 | $ 0.23 |
| Net realized and unrealized gain (loss) | 1.74 | 0.77 | 2.49 | (1.26) | 1.77 |
| Total income (loss) from operations | $ 1.91 | $ 0.97 | $ 2.78 | $ (0.99) | $ 2.00 |
| Less Distributions | | | | | |
| From net investment income | $ (0.21) | $ (0.32) | $ (0.28) | $ (0.25) | $ (0.23) |
| From net realized gain | — | (0.41) | (0.13) | (0.45) | (0.11) |
| Total distributions | $ (0.21) | $ (0.73) | $ (0.41) | $ (0.70) | $ (0.34) |
| Net asset value — End of year | $ 20.80 | $ 19.10 | $ 18.86 | $ 16.49 | $ 18.18 |
| Total Return(2) | 10.06% | 5.28% | 17.02% | (5.73)% | 12.16% |
| Ratios/Supplemental Data | | | | | |
| Net assets, end of year (000’s omitted) | $110,534 | $109,206 | $110,131 | $103,205 | $118,478 |
| Ratios (as a percentage of average daily net assets):(3)(4) | | | | | |
| Total expenses | 0.91% | 0.93% | 0.90% | 0.89% | 0.89% |
| Net expenses | 0.81% | 0.83% | 0.83% | 0.83% | 0.83% |
| Net investment income | 0.86% | 1.10% | 1.63% | 1.51% | 1.33% |
| Portfolio Turnover | 7% | 15% | 6% | 11% | 9% |
| (1) | Computed using average shares outstanding. |
| (2) | Returns are historical and are calculated by determining the percentage change in net asset value with all distributions reinvested and do not reflect fees and expenses imposed by variable annuity contracts or variable life insurance policies. If included, total return would be lower. |
| (3) | Total expenses do not reflect amounts reimbursed and/or waived by the adviser and certain of its affiliates, if applicable. Net expenses are net of all reductions and represent the net expenses paid by the Fund. |
| (4) | Amounts do not include the expenses of the Underlying Funds. |
13
See Notes to Financial Statements.
Calvert
VP Volatility Managed Moderate Portfolio
December 31, 2021
Notes to Financial Statements
1 Significant Accounting Policies
Calvert VP Volatility Managed Moderate Portfolio (the Fund) is a diversified series of Calvert Variable Products, Inc. (the Corporation). The Corporation is a Maryland corporation registered under the Investment Company Act of 1940, as amended (the 1940 Act), as an open-end management investment company. The investment objective of the Fund is to pursue current income and modest growth potential consistent with preservation of capital, while seeking to manage overall portfolio volatility. The Fund invests primarily in exchange-traded funds representing a broad range of asset classes (the Underlying Funds).
Shares of the Fund are sold without sales charge to insurance companies for allocation to certain of their variable separate accounts and to qualified pension and retirement plans and other eligible investors. The Fund offers Class F shares.
The Fund applies the accounting and reporting guidance in the Financial Accounting Standards Board (FASB) Accounting Standards Codification Topic 946, Financial Services – Investment Companies (ASC 946). Subsequent events, if any, through the date that the financial statements were issued have been evaluated in the preparation of the financial statements.
A Investment Valuation— Net asset value per share is determined every business day as of the close of the regular session of the New York Stock Exchange (generally 4:00 p.m. Eastern time). The Fund uses independent pricing services approved by the Board of Directors (the Board) to value its investments wherever possible. Investments for which market quotations are not available or deemed not reliable are fair valued in good faith under the direction of the Board.
U.S. generally accepted accounting principles (U.S. GAAP) establishes a disclosure hierarchy that categorizes the inputs to valuation techniques used to value assets and liabilities at measurement date. These inputs are summarized in the three broad levels listed below:
Level 1 - quoted prices in active markets for identical securities
Level 2 - other significant observable inputs (including quoted prices for similar securities, interest rates, prepayment speeds, credit risk, etc.)
Level 3 - significant unobservable inputs (including the Fund’s own assumptions in determining the fair value of investments)
The inputs or methodologies used for valuing securities are not necessarily an indication of the risk associated with investing in those securities.
Valuation techniques used to value the Fund’s investments by major category are as follows:
Securities. Exchange-traded funds are valued at the official closing price as reported by an independent pricing service on the primary market or exchange on which they are traded and are categorized as Level 1 in the hierarchy. Investments in registered investment companies (including money market funds) that do not trade on an exchange are valued at the net asset value per share on the valuation day and are categorized as Level 1 in the hierarchy.
Affiliated Fund. The Fund may invest in Calvert Cash Reserves Fund, LLC (Cash Reserves Fund), an affiliated investment company managed by Calvert Research and Management (CRM). While Cash Reserves Fund is not a registered money market mutual fund, it conducts all of its investment activities in accordance with the requirements of Rule 2a-7 under the 1940 Act. Investments in Cash Reserves Fund are valued at the closing net asset value per unit on the valuation day and are categorized as Level 2 in the hierarchy. Cash Reserves Fund generally values its investment securities based on available market quotations provided by a third party pricing service.
Derivatives. Futures contracts are valued at unrealized appreciation (depreciation) based on the settlement price established each day by the board of trade or exchange on which they are traded and are categorized as Level 1 in the hierarchy.
Fair Valuation. If a market value cannot be determined for a security using the methodologies described above, or if, in the good faith opinion of the Fund's adviser, the market value does not constitute a readily available market quotation, or if a significant event has occurred that would materially affect the value of the security, the security will be fair valued as determined in good faith by or at the direction of the Board in a manner that most fairly reflects the security’s “fair value”, which is the amount that the Fund might reasonably expect to receive for the security upon its current sale in the ordinary course. Each such determination is based on a consideration of relevant factors, which are likely to vary from one pricing context to another. These factors may include, but are not limited to, the type of security, the existence of any contractual restrictions on the security’s disposition, the price and extent of public trading in similar securities of the issuer or of comparable companies or entities, quotations or relevant information obtained from broker/dealers or other market participants, information obtained from the issuer, analysts, and/or the appropriate stock exchange (for exchange-traded securities), an analysis of the company’s or entity’s financial statements, and an evaluation of the forces that influence the issuer and the market(s) in which the security is purchased and sold.
The values assigned to fair value investments are based on available information and do not necessarily represent amounts that might ultimately be realized. Further, due to the inherent uncertainty of valuations of such investments, the fair values may differ significantly from the values that would have been used had an active market existed, and the differences could be material.
Calvert
VP Volatility Managed Moderate Portfolio
December 31, 2021
Notes to Financial Statements — continued
The following table summarizes the market value of the Fund's holdings as of December 31, 2021, based on the inputs used to value them:
| Asset Description | Level 1 | Level 2 | Level 3 | Total |
| Exchange-Traded Funds | $ 103,763,500 | $ — | $ — | $ 103,763,500 |
| Short-Term Investments: | | | | |
| Affiliated Fund | — | 6,641,920 | — | 6,641,920 |
| Securities Lending Collateral | 2,205,750 | — | — | 2,205,750 |
| Total Investments | $105,969,250 | $6,641,920 | $ — | $112,611,170 |
| Futures Contracts | $ 92,817 | $ — | $ — | $ 92,817 |
| Total | $106,062,067 | $6,641,920 | $ — | $112,703,987 |
B Investment Transactions and Income— Investment transactions for financial statement purposes are accounted for on trade date. Realized gains and losses are recorded on an identified cost basis and may include proceeds from litigation. Distributions from the Underlying Funds and Cash Reserves Fund are recorded on ex-dividend date. Distributions received that represent a return of capital are recorded as a reduction of cost of investments. Distributions received that represent a capital gain are recorded as a realized gain. Expenses included in the accompanying financial statements reflect the expenses of the Fund and do not include any expenses associated with the Underlying Funds.
C Futures Contracts— The Fund may enter into futures contracts to buy or sell a financial instrument for a set price at a future date. Initial margin deposits of either cash or securities as required by the broker are made upon entering into the contract. While the contract is open, daily variation margin payments are made to or received from the broker reflecting the daily change in market value of the contract and are recorded for financial reporting purposes as unrealized gains or losses by the Fund. When a futures contract is closed, a realized gain or loss is recorded equal to the difference between the opening and closing value of the contract. The risks associated with entering into futures contracts may include the possible illiquidity of the secondary market which would limit the Fund’s ability to close out a futures contract prior to the settlement date, an imperfect correlation between the value of the contracts and the underlying financial instruments, or that the counterparty will fail to perform its obligations under the contracts’ terms. Futures contracts are designed by boards of trade, which are designated “contracts markets” by the Commodities Futures Trading Commission. Futures contracts trade on the contracts markets in a manner that is similar to the way a stock trades on a stock exchange, and the boards of trade, through their clearing corporations, guarantee the futures contracts against default. As a result, there is minimal counterparty credit risk to the Fund.
D Distributions to Shareholders— Distributions to shareholders are recorded by the Fund on ex-dividend date. The Fund distributes any net investment income and net realized capital gains at least annually. Both types of distributions are made in shares of the Fund unless an election is made on behalf of a separate account to receive some or all of the distributions in cash. Distributions are determined in accordance with income tax regulations, which may differ from U.S. GAAP; accordingly, periodic reclassifications are made within the Fund's capital accounts to reflect income and gains available for distribution under income tax regulations.
E Estimates— The preparation of financial statements in conformity with U.S. GAAP requires management to make estimates and assumptions that affect the reported amounts of assets and liabilities and disclosure of contingent assets and liabilities at the date of the financial statements and the reported amounts of increases and decreases in net assets from operations during the reporting period. Actual results could differ from those estimates.
F Indemnifications— The Corporation’s By-Laws provide for indemnification for Directors or officers of the Corporation and certain other parties, to the fullest extent permitted by Maryland law and the 1940 Act, provided certain conditions are met. Additionally, in the normal course of business, the Fund enters into agreements with service providers that may contain indemnification clauses. The Fund’s maximum exposure under these arrangements is unknown as this would involve future claims that may be made against the Fund that have not yet occurred.
G Federal Income Taxes— No provision for federal income or excise tax is required since the Fund intends to continue to qualify as a regulated investment company under the Internal Revenue Code and to distribute substantially all of its taxable earnings.
Management has analyzed the Fund's tax positions taken for all open federal income tax years and has concluded that no provision for federal income tax is required in the Fund's financial statements. A Fund's federal tax return is subject to examination by the Internal Revenue Service for a period of three years from the date of filing.
Calvert
VP Volatility Managed Moderate Portfolio
December 31, 2021
Notes to Financial Statements — continued
2 Related Party Transactions
The investment advisory fee is earned by CRM as compensation for investment advisory services rendered to the Fund. On March 1, 2021, Morgan Stanley acquired Eaton Vance Corp. (the “Transaction”) and CRM became an indirect, wholly-owned subsidiary of Morgan Stanley. In connection with the Transaction, the Fund entered into a new investment advisory agreement (the “New Agreement”) with CRM, which took effect on March 1, 2021. Pursuant to the New Agreement (and the Fund’s investment advisory agreement with CRM in effect prior to March 1, 2021), the fee is computed at the annual rate of 0.40% of the Fund’s average daily net assets and is payable monthly. For the year ended December 31, 2021, the investment advisory fee amounted to $443,004. The Fund may invest its cash in Cash Reserves Fund. CRM does not currently receive a fee for advisory services provided to Cash Reserves Fund.
Pursuant to an investment sub-advisory agreement, CRM has delegated a portion of the investment management of the Fund to Ameritas Investment Partners, Inc. (AIP). In connection with the Transaction, CRM entered into a new sub-advisory agreement with AIP, which took effect on March 1, 2021. CRM pays AIP a portion of its investment advisory fee for sub-advisory services provided to the Fund.
CRM has agreed to reimburse the Fund's operating expenses to the extent that total annual operating expenses (relating to ordinary operating expenses only and excluding expenses such as brokerage commissions, acquired fund fees and expenses of unaffiliated funds, borrowing costs, taxes or litigation expenses) exceed 0.81% of the Fund's average daily net assets. The expense reimbursement agreement with CRM may be changed or terminated after April 30, 2022. For the year ended December 31, 2021, CRM waived or reimbursed expenses of $107,102.
The administrative fee is earned by CRM as compensation for administrative services rendered to the Fund. The fee is computed at an annual rate of 0.12% of the Fund's average daily net assets and is payable monthly. For the year ended December 31, 2021, CRM was paid administrative fees of $132,901.
The Fund has in effect a distribution plan for Class F shares (Class F Plan) pursuant to Rule 12b-1 under the 1940 Act. Pursuant to the Class F Plan, the Fund pays Eaton Vance Distributors, Inc. (EVD), an affiliate of CRM and the Fund’s principal underwriter, a distribution and service fee of 0.25% per annum of its average daily net assets attributable to Class F shares for distribution services and facilities provided to the Fund, as well as for personal and/or account maintenance services provided to the class shareholders. Distribution and service fees paid or accrued for the year ended December 31, 2021 amounted to $276,878 for Class F shares.
Eaton Vance Management (EVM), an affiliate of CRM, provides sub-transfer agency and related services to the Fund pursuant to a Sub-Transfer Agency Support Services Agreement. For the year ended December 31, 2021, sub-transfer agency fees and expenses incurred to EVM amounted to $134 and are included in transfer agency fees and expenses on the Statement of Operations.
Each Director of the Fund who is not an employee of CRM or its affiliates receives an annual fee of $154,000 ($214,000 effective January 1, 2022), plus an annual Committee fee ranging from $8,500 to $16,500 depending on the Committee. The Board chair receives an additional $30,000 annual fee, Committee chairs receive an additional $6,000 annual fee and the special equities liaison receives an additional $2,500 annual fee. Eligible Directors may participate in a Deferred Compensation Plan (the Plan). Amounts deferred under the Plan are treated as though equal dollar amounts had been invested in shares of the Fund or other Calvert funds selected by the Directors. The Fund purchases shares of the funds selected equal to the dollar amounts deferred under the Plan, resulting in an asset equal to the deferred compensation liability. Obligations of the Plan are paid solely from the Fund's assets. Directors’ fees are allocated to each of the Calvert funds served. Salaries and fees of officers and Directors of the Fund who are employees of CRM or its affiliates are paid by CRM.
3 Shareholder Servicing Plan
The Corporation, on behalf of the Fund, has adopted a Shareholder Servicing Plan (Servicing Plan), which permits the Fund to enter into shareholder servicing agreements with intermediaries that maintain accounts in the Fund for the benefit of shareholders. These services may include, but are not limited to, processing purchase and redemption requests, processing dividend payments, and providing account information to shareholders. Under the Servicing Plan, the Fund may make payments at an annual rate of up to 0.11% of its average daily net assets. For the year ended December 31, 2021, expenses incurred under the Servicing Plan amounted to $81,556, all of which were payable to an affiliate of AIP, and are included in transfer agency fees and expenses on the Statement of Operations. Included in accrued expenses at December 31, 2021 are amounts payable to an affiliate of AIP under the Servicing Plan of $8,023.
4 Investment Activity
During the year ended December 31, 2021, the cost of purchases and proceeds from sales of investments, other than short-term securities, were $7,293,459 and $14,006,086, respectively.
Calvert
VP Volatility Managed Moderate Portfolio
December 31, 2021
Notes to Financial Statements — continued
5 Distributions to Shareholders and Income Tax Information
The tax character of distributions declared for the years ended December 31, 2021 and December 31, 2020 was as follows:
| | Year Ended December 31, |
| | 2021 | 2020 |
| Ordinary income | $1,151,612 | $1,950,096 |
| Long-term capital gains | $ — | $2,079,116 |
As of December 31, 2021, the components of distributable earnings (accumulated loss) on a tax basis were as follows:
| Undistributed ordinary income | $ 967,150 |
| Undistributed long-term capital gains | 2,770,419 |
| Net unrealized appreciation | 26,604,696 |
| Distributable earnings | $30,342,265 |
The cost and unrealized appreciation (depreciation) of investments, including open derivative contracts, of the Fund at December 31, 2021, as determined on a federal income tax basis, were as follows:
| Aggregate cost | $86,006,474 |
| Gross unrealized appreciation | $ 26,604,696 |
| Gross unrealized depreciation | — |
| Net unrealized appreciation | $26,604,696 |
6 Financial Instruments
A summary of futures contracts outstanding at December 31, 2021 is included in the Schedule of Investments. During the year ended December 31, 2021, the Fund used futures contracts to hedge against changes in market volatility and declines in the value of the Fund’s investments and to adjust the Fund’s overall equity exposure in an effort to stabilize portfolio volatility around a target level.
At December 31, 2021, the fair value of open derivative instruments (not considered to be hedging instruments for accounting disclosure purposes) and whose primary underlying risk exposure is equity price risk was as follows:
| Derivative | Statement of Assets and Liabilities Caption | Assets | Liabilities |
| Futures contracts | Distributable earnings | | $92,817 (1) | $ — |
| (1) | Only the current day's variation margin is reported within the Statement of Assets and Liabilities as Receivable or Payable for variation margin on open futures contracts, as applicable. |
The effect of derivative instruments (not considered to be hedging instruments for accounting disclosure purposes) on the Statement of Operations and whose primary underlying risk exposure is equity price risk for the year ended December 31, 2021 was as follows:
| | Statement of Operations Caption | |
| Derivative | Net realized gain (loss): Futures
contracts | Change in unrealized appreciation
(depreciation): Futures contracts |
| Futures contracts | $ 510,923 | $ 82,428 |
Calvert
VP Volatility Managed Moderate Portfolio
December 31, 2021
Notes to Financial Statements — continued
The average notional cost of futures contracts (long) and futures contracts (short) outstanding during the year ended December 31, 2021 was approximately $7,709,000 and $146,000, respectively.
7 Securities Lending
To generate additional income, the Fund may lend its securities pursuant to a securities lending agency agreement with State Street Bank and Trust Company (SSBT), the securities lending agent. Security loans are subject to termination by the Fund at any time and, therefore, are not considered illiquid investments. The Fund requires that the loan be continuously collateralized by either cash or securities in an amount at least equal to the market value of the securities on loan. The market value of securities loaned is determined daily and any additional required collateral is delivered to the Fund on the next business day. Cash collateral is generally invested in a money market fund registered under the 1940 Act that is managed by an affiliate of SSBT. Any gain or loss in the market price of the loaned securities that might occur and any interest earned or dividends declared during the term of the loan would accrue to the account of the Fund. Income earned on the investment of collateral, net of broker rebates and other expenses incurred by the securities lending agent, is split between the Fund and the securities lending agent based on agreed upon contractual terms. Non-cash collateral, if any, is held by the lending agent on behalf of the Fund and cannot be sold or re-pledged by the Fund; accordingly, such collateral is not reflected in the Statement of Assets and Liabilities.
The risks associated with lending portfolio securities include, but are not limited to, possible delays in receiving additional collateral or in the recovery of the loaned securities, possible loss of rights to the collateral should the borrower fail financially, as well as risk of loss in the value of the collateral or the value of the investments made with the collateral. The securities lending agent shall indemnify the Fund in the case of default of any securities borrower.
At December 31, 2021, the total value of securities on loan was $17,296,826 and the total value of collateral received was $17,826,111, comprised of cash of $2,205,750 and U.S. government and/or agencies securities of $15,620,361.
The following table provides a breakdown of securities lending transactions accounted for as secured borrowings, the obligations by class of collateral pledged, and the remaining contractual maturity of those transactions as of December 31, 2021.
| | Remaining Contractual Maturity of the Transactions |
| | Overnight and
Continuous | <30 days | 30 to 90 days | >90 days | Total |
| Exchange-Traded Funds | $2,205,750 | $ — | $ — | $ — | $2,205,750 |
The carrying amount of the liability for deposits for securities loaned at December 31, 2021 approximated its fair value. If measured at fair value, such liability would have been considered as Level 2 in the fair value hierarchy (see Note 1A) at December 31, 2021.
8 Line of Credit
The Fund participates with other portfolios and funds managed by EVM and its affiliates, including CRM, in an $800 million unsecured line of credit with a group of banks, which is in effect through October 25, 2022. Borrowings are made by the Fund solely for temporary purposes related to redemptions and other short-term cash needs. Interest is charged to the Fund based on its borrowings at an amount above either the Secured Overnight Financing Rate (SOFR) or Federal Funds rate. In addition, a fee computed at an annual rate of 0.15% on the daily unused portion of the line of credit is allocated among the participating portfolios and funds at the end of each quarter. In connection with the renewal of the agreement in October 2021, an arrangement fee of $150,000 was incurred that was allocated to the participating portfolios and funds. Because the line of credit is not available exclusively to the Fund, it may be unable to borrow some or all of its requested amounts at any particular time.
The Fund had no borrowings pursuant to its line of credit during the year ended December 31, 2021.
Calvert
VP Volatility Managed Moderate Portfolio
December 31, 2021
Notes to Financial Statements — continued
9 Affiliated Funds
At December 31, 2021, the value of the Fund’s investment in affiliated funds was $6,641,920, which represents 6.0% of the Fund’s net assets. Transactions in affiliated funds by the Fund for the year ended December 31, 2021 were as follows:
| Name | Value,
beginning
of period | Purchases | Sales
proceeds | Net
realized
gain
(loss) | Change in
unrealized
appreciation
(depreciation) | Value,
end of
period | Dividend
income | Units,
end of
period |
| Short-Term Investments | | | | | | |
| Calvert Cash Reserves Fund, LLC | $7,832,540 | $15,519,033 | $(16,709,042) | $(749) | $138 | $6,641,920 | $4,966 | 6,641,920 |
10 Capital Shares
The Corporation may issue its shares in one or more series (such as the Fund). The authorized shares of the Fund consist of 100,000,000 common shares, $0.10 par value.
Transactions in capital shares for the years ended December 31, 2021 and December 31, 2020 were as follows:
| | Year Ended
December 31, 2021 | | Year Ended
December 31, 2020 |
| | Shares | Amount | | Shares | Amount |
| Class F | | | | | |
| Shares sold | 100,167 | $ 1,981,937 | | 296,537 | $ 5,492,757 |
| Reinvestment of distributions | 57,494 | 1,151,612 | | 222,855 | 4,029,212 |
| Shares redeemed | (562,233) | (11,307,237) | | (638,983) | (11,590,249) |
| Net decrease | (404,572) | $ (8,173,688) | | (119,591) | $ (2,068,280) |
At December 31, 2021, separate accounts of an insurance company that is an affiliate of AIP owned 100% of the value of the outstanding shares of the Fund.
11 Risks and Uncertainties
Pandemic Risk
An outbreak of respiratory disease caused by a novel coronavirus was first detected in China in late 2019 and subsequently spread internationally. This coronavirus has resulted in closing borders, enhanced health screenings, changes to healthcare service preparation and delivery, quarantines, cancellations, disruptions to supply chains and customer activity, as well as general concern and uncertainty. Health crises caused by outbreaks, such as the coronavirus outbreak, may exacerbate other pre-existing political, social and economic risks and disrupt normal market conditions and operations. The impact of this outbreak has negatively affected the worldwide economy, the economies of individual countries, individual companies, and the market in general, and may continue to do so in significant and unforeseen ways, as may other epidemics and pandemics that may arise in the future. Any such impact could adversely affect the Fund's performance, or the performance of the securities in which the Fund invests.
12 Change in Independent Registered Public Accounting Firm
On July 30, 2021, KPMG LLP (“KPMG”) informed the Audit Committee and Board of the Corporation that it was resigning as the independent registered public accounting firm to the Corporation, as upon Morgan Stanley’s acquisition of Eaton Vance Corp., the parent company of CRM (the investment adviser to each series of the Corporation), KPMG would no longer be independent of the Corporation. The Audit Committee of the Board and the Board approved the selection of Deloitte & Touche LLP (“Deloitte”) as the independent registered public accounting firm for the funds that are series of the Corporation (the “Funds”) for the fiscal year ending December 31, 2021 to be effective upon KPMG’s resignation and Deloitte’s acceptance of the engagement which became effective July 30, 2021.
Calvert
VP Volatility Managed Moderate Portfolio
December 31, 2021
Notes to Financial Statements — continued
KPMG’s reports on the financial statements for the Funds for the fiscal periods ended December 31, 2019 and December 31, 2020 contained no adverse opinion or disclaimer of opinion nor were they qualified or modified as to uncertainty, audit scope or accounting principles. During the fiscal periods ended December 31, 2019 and December 31, 2020, and during the subsequent interim period through July 30, 2021: (i) there were no disagreements with KPMG on any matter of accounting principles or practices, financial statement disclosure or auditing scope or procedure, which disagreements, if not resolved to the satisfaction of KPMG, would have caused KPMG to make reference to the subject matter of the disagreements in connection with its reports on the Funds’ financial statements for such periods; and (ii) there were no “reportable events” of the kind described in Item 304(a)(1)(v) of Regulation S-K under the Securities Exchange Act of 1934, as amended.
During the fiscal periods ended December 31, 2019 and December 31, 2020, and during the subsequent interim period through July 30, 2021: neither the Funds, nor anyone on their behalf, consulted with Deloitte on items which: (i) concerned the application of accounting principles to a specified transaction, either completed or proposed, or the type of audit opinion that might be rendered on the Funds’ financial statements; or (ii) concerned the subject of a disagreement (as defined in paragraph (a)(1)(iv) of Item 304 of Regulation S-K) or reportable events (as described in paragraph (a)(1)(v) of Item 304).
13 Subsequent Event
Effective January 1, 2022, CRM entered into an investment sub-advisory agreement with Parametric Portfolio Associates LLC (Parametric), an affiliate of CRM and an indirect, wholly-owned subsidiary of Morgan Stanley, to provide sub-advisory services to the Fund. Parametric is responsible for executing the Fund’s volatility management strategy.
Calvert
VP Volatility Managed Moderate Portfolio
December 31, 2021
Report of Independent Registered Public Accounting Firm
To the Board of Directors of Calvert Variable Products, Inc. and Shareholders of Calvert VP Volatility Managed Moderate Portfolio:
Opinion on the Financial Statements and Financial Highlights
We have audited the accompanying statement of assets and liabilities of Calvert VP Volatility Managed Moderate Portfolio (the "Fund") (one of the funds constituting Calvert Variable Products, Inc.), including the schedule of investments, as of December 31, 2021, the related statements of operations, changes in net assets, and the financial highlights for the year then ended, and the related notes. In our opinion, the financial statements and financial highlights present fairly, in all material respects, the financial position of the Fund as of December 31, 2021, and the results of its operations, changes in its net assets, and the financial highlights for the year then ended in conformity with accounting principles generally accepted in the United States of America. The statement of changes in net assets for the year ended December 31, 2020, and the financial highlights for the years ended December 31, 2020, 2019, 2018, and 2017 were audited by other auditors whose report, dated February 18, 2021, expressed an unqualified opinion on that financial statement and those financial highlights.
Basis for Opinion
These financial statements and financial highlights are the responsibility of the Fund's management. Our responsibility is to express an opinion on the Fund's financial statements and financial highlights based on our audit. We are a public accounting firm registered with the Public Company Accounting Oversight Board (United States) (PCAOB) and are required to be independent with respect to the Fund in accordance with the U.S. federal securities laws and the applicable rules and regulations of the Securities and Exchange Commission and the PCAOB.
We conducted our audit in accordance with the standards of the PCAOB. Those standards require that we plan and perform the audit to obtain reasonable assurance about whether the financial statements and financial highlights are free of material misstatement, whether due to error or fraud. The Fund is not required to have, nor were we engaged to perform, an audit of its internal control over financial reporting. As part of our audit, we are required to obtain an understanding of internal control over financial reporting but not for the purpose of expressing an opinion on the effectiveness of the Fund’s internal control over financial reporting. Accordingly, we express no such opinion.
Our audit included performing procedures to assess the risks of material misstatement of the financial statements and financial highlights, whether due to error or fraud, and performing procedures that respond to those risks. Such procedures included examining, on a test basis, evidence regarding the amounts and disclosures in the financial statements and financial highlights. Our audit also included evaluating the accounting principles used and significant estimates made by management, as well as evaluating the overall presentation of the financial statements and financial highlights. Our procedures included confirmation of securities owned as of December 31, 2021, by correspondence with the custodian and brokers; when replies were not received from brokers, we performed other auditing procedures. We believe that our audit provides a reasonable basis for our opinion.
/s/ Deloitte & Touche LLP
Boston, Massachusetts
February 18, 2022
We have served as the auditor of one or more Calvert investment companies since 2021.
Calvert
VP Volatility Managed Moderate Portfolio
December 31, 2021
Federal Tax Information (Unaudited)
As required by the Internal Revenue Code and/or regulations, shareholders must be notified regarding the status of capital gains dividends.
Capital Gains Dividends. The Fund hereby designates as a capital gain dividend with respect to the taxable year ended December 31, 2021, $2,770,419 or, if subsequently determined to be different, the net capital gain of such year.
Calvert
VP Volatility Managed Moderate Portfolio
December 31, 2021
Management and Organization
Fund Management. The Directors of Calvert Variable Products, Inc. (the Corporation) are responsible for the overall management and supervision of the affairs of the Corporation. The Board members and officers of the Corporation are listed below. Except as indicated, each individual has held the office shown or other offices in the same company for the last five years. Board members hold indefinite terms of office. Each Board member holds office until his or her successor is elected and qualified, or until his or her earlier death, resignation, retirement, removal or disqualification. Under the terms of the Fund’s current Board member retirement policy, an Independent Board member must retire at the end of the calendar year in which he or she turns 75. However, if such retirement would cause the Fund to be out of compliance with Section 16 of the 1940 Act or any other regulations or guidance of the SEC, then such retirement will not become effective until such time as action has been taken for the Fund to be in compliance therewith. The “noninterested Directors” consist of those Directors who are not “interested persons” of the Corporation, as that term is defined under the 1940 Act. The business address of each Board member and the Chief Compliance Officer is 1825 Connecticut Avenue, NW, Suite 400, Washington, DC 20009 and the business address of the Secretary, Vice President and Chief Legal Officer and the Treasurer is Two International Place, Boston, Massachusetts 02110. As used below, “CRM” refers to Calvert Research and Management and “Eaton Vance” refers to Eaton Vance Management. Each Director oversees 39 funds in the Calvert fund complex. Effective March 1, 2021, each of Eaton Vance and CRM are indirect, wholly-owned subsidiaries of Morgan Stanley. Each officer affiliated with CRM may hold a position with other CRM affiliates that is comparable to his or her position with CRM listed below.
| Name and Year of Birth | Corporation
Position(s) | Length of
Service | Principal Occupation(s) and Other Directorships
During Past Five Years and Other Relevant Experience |
| Interested Director |
John H. Streur(1)
1960 | Director and
President | Since 2015 | President and Chief Executive Officer of CRM (since December 31, 2016). President and Chief Executive Officer of Calvert Investments, Inc.
(January 2015 - December 2016); Chief Executive Officer of Calvert
Investment Distributors, Inc. (August 2015 - December 2016); Chief
Compliance Officer of Calvert Investment Management, Inc. (August 2015 -
April 2016); President and Director, Portfolio 21 Investments, Inc.
(through October 2014); President, Chief Executive Officer and
Director, Managers Investment Group LLC (through January 2012);
President and Director, The Managers Funds and Managers AMG
Funds (through January 2012).
Other Directorships. Portfolio 21 Investments, Inc. (asset management)
(through October 2014); Managers Investment Group LLC (asset management)
(through January 2012); The Managers Funds (asset management)
(through January 2012); Managers AMG Funds (asset management)
(through January 2012); Calvert Impact Capital, Inc. |
| Noninterested Directors |
Richard L. Baird, Jr.
1948 | Director | Since 2016 | Regional Disaster Recovery Lead, American Red Cross of Greater
Pennsylvania (since 2017). Volunteer, American Red Cross (since 2015).
Former President and CEO of Adagio Health Inc. (retired in 2014) in
Pittsburgh, PA.
Other Directorships. None. |
Alice Gresham Bullock
1950 | Chair and
Director | Since 2016 (Chair);
Since 2008 (Director) | Professor Emerita at Howard University School of Law. Dean Emerita of
Howard University School of Law and Deputy Director of the Association
of American Law Schools (1992-1994).
Other Directorships. None. |
Cari M. Dominguez
1949 | Director | Since 2016 | Former Chair of the U.S. Equal Employment Opportunity Commission.
Other Directorships. ManpowerGroup Inc. (workforce solutions company);
Triple S Management Corporation (managed care); National Association of Corporate Directors. |
John G. Guffey, Jr.
1948 | Director | Since 2016 | President of Aurora Press Inc., a privately held publisher of trade
paperbacks (since January 1997).
Other Directorships. Calvert Impact Capital, Inc. (through
December 31, 2018); Calvert Ventures, LLC. |
Miles D. Harper, III
1962 | Director | Since 2016 | Partner, Carr Riggs & Ingram (public accounting firm) since October 2014.
Partner, Gainer Donnelly & Desroches (public accounting firm) (now Carr
Riggs & Ingram) (November 1999 - September 2014).
Other Directorships. Bridgeway Funds (9) (asset management). |
Joy V. Jones
1950 | Director | Since 2016 | Attorney.
Other Directorships. Palm Management Corporation. |
Calvert
VP Volatility Managed Moderate Portfolio
December 31, 2021
Management and Organization — continued
| Name and Year of Birth | Corporation
Position(s) | Length of
Service | Principal Occupation(s) and Other Directorships
During Past Five Years and Other Relevant Experience |
| Noninterested Directors (continued) |
Anthony A. Williams
1951 | Director | Since 2016 | CEO and Executive Director of the Federal City Council (July 2012 to
present); Senior Adviser and Independent Consultant for King and
Spalding LLP (September 2015 to present); Executive Director of Global
Government Practice at the Corporate Executive Board (January 2010 to
January 2012).
Other Directorships. Freddie Mac; Evoq Properties/Meruelo Maddux
Properties, Inc. (real estate management); Weston Solutions, Inc.
(environmental services); Bipartisan Policy Center’s Debt Reduction Task Force;
Chesapeake Bay Foundation; Catholic University of America; Urban Institute (research organization); The Howard Hughes Corporation (real estate development). |
| Name and Year of Birth | Corporation
Position(s) | Length of
Service | Principal Occupation(s)
During Past Five Years |
| Principal Officers who are not Directors |
Hope L. Brown
1973 | Chief
Compliance
Officer | Since 2014 | Chief Compliance Officer of 39 registered investment companies advised
by CRM (since 2014). Vice President and Chief Compliance Officer,
Wilmington Funds (2012-2014). |
Deidre E. Walsh
1971 | Secretary,
Vice President
and Chief
Legal Officer | Since 2021 | Vice President of CRM and officer of 39 registered investment companies
advised by CRM (since 2021). Also Vice President of Eaton Vance and
certain of its affiliates and officer of 138 registered investment companies
advised or administered by Eaton Vance. |
James F. Kirchner
1967 | Treasurer | Since 2016 | Vice President of CRM and officer of 39 registered investment companies
advised by CRM (since 2016). Also Vice President of Eaton Vance and
certain of its affiliates and officer of 138 registered investment companies
advised or administered by Eaton Vance. |
| | | | |
| (1) Mr. Streur is an interested person of the Fund because of his positions with the Fund’s adviser and certain affiliates. |
The SAI for the Fund includes additional information about the Directors and officers of the Fund and can be obtained without charge on Calvert’s website at www.calvert.com or by calling 1-800-368-2745.
| FACTS | WHAT DOES EATON VANCE DO WITH YOUR
PERSONAL INFORMATION? |
| Why? | Financial companies choose how they share your personal information. Federal law gives consumers the right to limit some but not all sharing. Federal law also requires us to tell you how we collect, share, and protect your personal information. Please read this notice carefully to understand what we do. |
| |
| What? | The types of personal information we collect and share depend on the product or service you have with us. This information can include:■ Social Security number and income
■
investment experience and risk tolerance
■
checking account number and wire transfer instructions |
| |
| How? | All financial companies need to share customers’ personal information to run their everyday business. In the section below, we list the reasons financial companies can share their customers’ personal information; the reasons Eaton Vance chooses to share; and whether you can limit this sharing. |
Reasons we can share your
personal information | Does Eaton Vance
share? | Can you limit
this sharing? |
| For our everyday business purposes — such as to process your transactions, maintain your account(s), respond to court orders and legal investigations, or report to credit bureaus | Yes | No |
| For our marketing purposes — to offer our products and services to you | Yes | No |
| For joint marketing with other financial companies | No | We don’t share |
| For our investment management affiliates’ everyday business purposes — information about your transactions, experiences, and creditworthiness | Yes | Yes |
| For our affiliates’ everyday business purposes — information about your transactions and experiences | Yes | No |
| For our affiliates’ everyday business purposes — information about your creditworthiness | No | We don’t share |
| For our investment management affiliates to market to you | Yes | Yes |
| For our affiliates to market to you | No | We don’t share |
| For nonaffiliates to market to you | No | We don’t share |
To limit our
sharing | Call toll-free 1-800-368-2745 or email: CRMPrivacy@calvert.comPlease note:If you are a new customer, we can begin sharing your information 30 days from the date we sent this notice. When you are no longer our customer, we continue to share your information as described in this notice. However, you can contact us at any time to limit our sharing. |
| Questions? | Call toll-free 1-800-368-2745 or email: CRMPrivacy@calvert.com |
| Privacy Notice — continued | April 2021 |
| Who we are |
| Who is providing this notice? | Eaton Vance Management, Eaton Vance Distributors, Inc., Eaton Vance Trust Company, Eaton Vance Management (International) Limited, Eaton Vance Advisers International Ltd., Eaton Vance Global Advisors Limited, Eaton Vance Management’s Real Estate Investment Group, Boston Management and Research, Calvert Research and Management, Eaton Vance and Calvert Fund Families and our investment advisory affiliates (“Eaton Vance”) (see Investment Management Affiliates definition below) |
| What we do |
How does Eaton Vance
protect my personal
information? | To protect your personal information from unauthorized access and use, we use security measures that comply with federal law. These measures include computer safeguards and secured files and buildings. We have policies governing the proper handling of customer information by personnel and requiring third parties that provide support to adhere to appropriate security standards with respect to such information. |
How does Eaton Vance
collect my personal
information? | We collect your personal information, for example, when you■ open an account or make deposits or withdrawals from your account
■
buy securities from us or make a wire transfer
■
give us your contact informationWe also collect your personal information from others, such as credit bureaus, affiliates, or other companies. |
| Why can’t I limit all sharing? | Federal law gives you the right to limit only■ sharing for affiliates’ everyday business purposes — information about your creditworthiness
■
affiliates from using your information to market to you
■
sharing for nonaffiliates to market to youState laws and individual companies may give you additional rights to limit sharing. See below for more on your rights under state law. |
| Definitions |
Investment Management
Affiliates | Eaton Vance Investment Management Affiliates include registered investment advisers, registered broker- dealers, and registered and unregistered funds. Investment Management Affiliates does not include entities associated with Morgan Stanley Wealth Management, such as Morgan Stanley Smith Barney LLC and Morgan Stanley & Co. |
| Affiliates | Companies related by common ownership or control. They can be financial and nonfinancial companies.■ Our affiliates include companies with a Morgan Stanley name and financial companies such as Morgan Stanley Smith Barney LLC and Morgan Stanley & Co. |
| Nonaffiliates | Companies not related by common ownership or control. They can be financial and nonfinancial companies.■ Eaton Vance does not share with nonaffiliates so they can market to you. |
| Joint marketing | A formal agreement between nonaffiliated financial companies that together market financial products or services to you.■ Eaton Vance doesn’t jointly market. |
| Other important information |
| Vermont: Except as permitted by law, we will not share personal information we collect about Vermont residents with Nonaffiliates unless you provide us with your written consent to share such information.California: Except as permitted by law, we will not share personal information we collect about California residents with Nonaffiliates and we will limit sharing such personal information with our Affiliates to comply with California privacy laws that apply to us. |
Delivery of Shareholder Documents. The Securities and Exchange Commission (SEC) permits funds to deliver only one copy of shareholder documents, including prospectuses, proxy statements and shareholder reports, to fund investors with multiple accounts at the same residential or post office box address. This practice is often called “householding” and it helps eliminate duplicate mailings to shareholders. Calvert funds, or your financial intermediary, may household the mailing of your documents indefinitely unless you instruct Calvert funds, or your financial intermediary, otherwise. If you would prefer that your Calvert fund documents not be householded, please contact Calvert funds at 1-800-368-2745, or contact your financial intermediary. Your instructions that householding not apply to delivery of your Calvert fund documents will typically be effective within 30 days of receipt by Calvert funds or your financial intermediary. Separate statements will be generated for each separate account and will be householded as described above.
Portfolio Holdings. Each Calvert fund files a schedule of portfolio holdings on Part F to Form N-PORT with the SEC. Certain information filed on Form N-PORT may be viewed on the Calvert website at www.calvert.com, by calling Calvert at 1-800-368-2745 or in the EDGAR database on the SEC’s website at www.sec.gov.
Proxy Voting. The Proxy Voting Guidelines that each Calvert fund uses to determine how to vote proxies relating to portfolio securities is provided as an Appendix to the fund’s Statement of Additional Information. The Statement of Additional Information can be obtained free of charge by calling the Calvert funds at 1-800-368-2745, by visiting the Calvert funds’ website at www.calvert.com or visiting the SEC’s website at www.sec.gov. Information regarding how a Calvert fund voted proxies relating to portfolio securities during the most recent 12-month period ended June 30 is available by calling Calvert funds, by visiting the Calvert funds’ website at www.calvert.com or by visiting the SEC’s website at www.sec.gov.
This Page Intentionally Left Blank
Investment Adviser and Administrator
Calvert Research and Management
1825 Connecticut Avenue NW, Suite 400
Washington, DC 20009
Investment Sub-Adviser
Ameritas Investment Partners, Inc.
5945 R Street
Lincoln, NE 68505
Investment Sub-Adviser
Parametric Portfolio Associates LLC
800 Fifth Avenue, Suite 2800
Seattle, WA 98104
Principal Underwriter*
Eaton Vance Distributors, Inc.
Two International Place
Boston, MA 02110
(617) 482-8260
Custodian
State Street Bank and Trust Company
State Street Financial Center, One Lincoln Street
Boston, MA 02111
Transfer Agent
DST Asset Manager Solutions, Inc.
2000 Crown Colony Drive
Quincy, MA 02169
Independent Registered Public Accounting Firm
Deloitte & Touche LLP
200 Berkeley Street
Boston, MA 02116-5022
Fund Offices
1825 Connecticut Avenue NW, Suite 400
Washington, DC 20009
* FINRA BrokerCheck. Investors may check the background of their Investment Professional by contacting the Financial Industry Regulatory Authority (FINRA). FINRA BrokerCheck is a free tool to help investors check the professional background of current and former FINRA-registered securities firms and brokers. FINRA BrokerCheck is available by calling 1-800-289-9999 and at www.FINRA.org. The FINRA BrokerCheck brochure describing this program is available to investors at www.FINRA.org.
Printed on recycled paper.
24233 12.31.21
Calvert
VP Volatility Managed Moderate Growth Portfolio
Annual Report
December 31, 2021
Commodity Futures Trading Commission Registration. The Commodity Futures Trading Commission (“CFTC”) has adopted regulations that subject registered investment companies and advisers to regulation by the CFTC if a fund invests more than a prescribed level of its assets in certain CFTC-regulated instruments (including futures, certain options and swap agreements) or markets itself as providing investment exposure to such instruments. The adviser has claimed an exclusion from the definition of “commodity pool operator” under the Commodity Exchange Act with respect to its management of the Fund and the other funds it manages. Accordingly, neither the Fund nor the adviser is subject to CFTC regulation.
Fund shares are not insured by the FDIC and are not deposits or other obligations of, or guaranteed by, any depository institution. Shares are subject to investment risks, including possible loss of principal invested.
This report must be preceded or accompanied by a current summary prospectus or prospectus. Before investing, investors should consider carefully the investment objective, risks, and charges and expenses of a mutual fund. This and other important information is contained in the summary prospectus and prospectus, which can be obtained from a financial intermediary. Prospective investors should read the prospectus carefully before investing. For further information, please call 1-800-368-2745.
Annual Report December 31, 2021
Calvert
VP Volatility Managed Moderate Growth Portfolio
Calvert
VP Volatility Managed Moderate Growth Portfolio
December 31, 2021
Management's Discussion of Fund Performance†
Economic and Market Conditions
The 12-month period starting January 1, 2021, was notable for a global equity rally that lasted for most of the period. Investors cheered the reopening of businesses that had been affected by the pandemic and the rollout of highly effective COVID-19 vaccines. In contrast, fixed-income returns were generally weak during the period.
COVID-19 continued to have a grip on the global economy. Disease rates advanced and declined with new waves of infections worldwide. Worker shortages led to global supply-chain disruptions. Scarcities of key items led to temporary factory shutdowns and empty store shelves. In the U.S., those shortages — combined with high demand from consumers eager to spend money saved earlier in the pandemic — led to higher year-over-year inflation than had been seen in decades.
Early in the period while stock prices climbed, credit spreads tightened, and long-term U.S. Treasury yields rose as the U.S. dollar weakened. In the first quarter, the Bloomberg U.S. Aggregate Bond Index posted its worst quarterly return in 40 years. In the second quarter, fixed-income markets revived as the U.S. Treasury yield curve flattened.
In September, equity indexes worldwide reported negative returns. In the U.S., weak job creation and the U.S. Federal Reserve’s (the Fed’s) announcement that it might soon begin tapering its monthly bond purchases and possibly raise interest rates in 2022 weighed on U.S. stocks. However, in the final quarter of 2021, stock prices came roaring back as the central bank’s actions to tamp down inflation were applauded by investors. Even the emergence of a new COVID-19 variant caused only a temporary market retreat.
Meanwhile, the Fed’s tightening monetary policy caused a further flattening of the Treasury curve. During the fourth quarter, investment-grade corporate credit spreads widened modestly and high yield bond spreads tightened, leaving the Bloomberg U.S. Aggregate Bond Index essentially flat for the quarter.
For the period as a whole, the MSCI World Index returned 21.82%; the S&P 500® Index returned 28.71%; and the Nasdaq Composite Index returned 22.18%. In fixed-income, the Bloomberg U.S. Corporate Bond Index returned (1.04)%, while the ICE BofA U.S. High Yield Index gained 5.36%.
Investment Strategy
Calvert VP Volatility Managed Moderate Growth Portfolio (the Fund) invests in exchange-traded funds (ETFs) representing a broad range of asset classes. The Fund uses a macro strategy that entails setting an asset-allocation target weight, along with a typical allocation range. Market capitalizations, investment styles, and business sectors are among the variables considered when securities are selected for the Fund. Target asset weights may change periodically based on economic conditions and other factors. The Fund implements a volatility-management and capital-protection strategy that uses equity index futures contracts to try to keep the portfolio’s volatility range close to 10% to pursue growth in up markets, and to serve as a hedge against potential declines in the value of the Fund’s ETF investments. The Fund continuously monitors market volatility and may adjust its futures contracts to pursue its financial goals.
Fund Performance
For the 12-month period ended December 31, 2021, Calvert VP Volatility Managed Moderate Growth Portfolio (the Fund) returned 13.64% for Class F shares at net asset value (NAV), outperforming its primary benchmark, the S&P Global LargeMidCap Managed Risk Index – Moderate Conservative (the Index), which returned 10.38%.
Outperformance relative to the Index during the period was the result of asset allocation strategies. The Index is used to capture the impact of the Fund’s volatility-management strategy. Fund performance is also measured against a blended benchmark (the Secondary Blended Index) based on a mix of market indexes that more closely reflects the impact of the Fund’s asset allocations than the single asset-class Index. During the period, the Fund underperformed the Secondary Blended Index, which returned 13.67%.
Through most of 2021, the volatility range of the Fund’s underlying assets was below its 10% target, and averaged 7.9% for the full year. The Fund held a long equity futures position for most of 2021. As a result, the strategy helped raise the Fund’s annualized volatility rate to 8.6%, a 0.7% improvement.
The volatility-management strategy produced a slight net performance loss during the year. While the strategy generally benefited from a rise in asset prices in 2021, the September market sell-off erased many of those gains. Derivative positions detracted 0.06% from Fund performance during the period.
The Fund's overall underperformance to the Secondary Blended Index was due to volatility management. In contrast, asset allocation had a modest positive effect on relative performance during the period. The Fund outperformed in the first quarter because of overweight exposures to small-cap and mid-cap stocks as well as an exposure to the financials sector. In the fourth quarter, the Fund had a modestly overweight exposure to large-cap growth stocks, which outperformed the broad market during the period.
See Endnotes and Additional Disclosures in this report.
Past performance is no guarantee of future results. Returns are historical and are calculated by determining the percentage change in net asset value (NAV) or offering price (as applicable) with all distributions reinvested. Investment return and principal value will fluctuate so that shares, when redeemed, may be worth more or less than their original cost. Performance for periods less than or equal to one year is cumulative. Performance is for the stated time period only; due to market volatility, current Fund performance may be lower or higher than the quoted return.
Calvert
VP Volatility Managed Moderate Growth Portfolio
December 31, 2021
Performance
Portfolio Manager(s) Kevin L. Keene, CFA of Ameritas Investment Partners, Inc.; Thomas B. Lee, CFA and Christopher Haskamp, CFA, each of Parametric Portfolio Associates LLC
| % Average Annual Total Returns1,2 | Class
Inception Date | Performance
Inception Date | One Year | Five Years | Since
Inception |
| Class F at NAV | 04/30/2013 | 04/30/2013 | 13.64% | 8.37% | 6.55% |
|
| S&P Global LargeMidCap Managed Risk Index - Moderate Conservative | — | — | 10.38% | 8.89% | 6.51% |
| Moderate Growth Portfolio Blended Benchmark | — | — | 13.67 | 11.41 | 9.32 |
| % Total Annual Operating Expense Ratios3 | Class F |
| Gross | 1.01% |
| Net | 0.89 |
Growth of $10,000
This graph shows the change in value of a hypothetical investment of $10,000 in Class F of the Fund for the period indicated. For comparison, the same investment is shown in the indicated index.
See Endnotes and Additional Disclosures in this report.
Past performance is no guarantee of future results. Returns are historical and are calculated by determining the percentage change in net asset value (NAV) or offering price (as applicable) with all distributions reinvested. Investment return and principal value will fluctuate so that shares, when redeemed, may be worth more or less than their original cost. Performance for periods less than or equal to one year is cumulative. Performance is for the stated time period only; due to market volatility, current Fund performance may be lower or higher than the quoted return.
Calvert
VP Volatility Managed Moderate Growth Portfolio
December 31, 2021
Asset Allocation (% of total investments)
| Top 10 Holdings (% of net assets)* | |
| Vanguard S&P 500 ETF | 21.2% |
| iShares Core U.S. Aggregate Bond ETF | 16.8 |
| Vanguard Total Bond Market ETF | 12.7 |
| Vanguard FTSE Developed Markets ETF | 11.7 |
| iShares S&P 500 Growth ETF | 11.4 |
| iShares S&P 500 Value ETF | 9.3 |
| Vanguard REIT ETF | 3.2 |
| iShares Russell 2000 ETF | 2.5 |
| Vanguard FTSE Emerging Markets ETF | 2.0 |
| iShares Core S&P Mid-Cap ETF | 1.6 |
| Total | 92.4% |
| * | Excludes cash and cash equivalents. |
Calvert
VP Volatility Managed Moderate Growth Portfolio
December 31, 2021
Endnotes and Additional Disclosures
| † | The views expressed in this report are those of the portfolio manager(s) and are current only through the date stated at the top of this page. These views are subject to change at any time based upon market or other conditions, and Calvert and the Fund(s) disclaim any responsibility to update such views. These views may not be relied upon as investment advice and, because investment decisions are based on many factors, may not be relied upon as an indication of trading intent on behalf of any Calvert fund. This commentary may contain statements that are not historical facts, referred to as “forward-looking statements.” The Fund’s actual future results may differ significantly from those stated in any forward-looking statement, depending on factors such as changes in securities or financial markets or general economic conditions, the volume of sales and purchases of Fund shares, the continuation of investment advisory, administrative and service contracts, and other risks discussed from time to time in the Fund’s filings with the Securities and Exchange Commission. |
| | |
| 1 | S&P Global LargeMidCap Managed Risk Index - Moderate Conservative is an unmanaged index designed to simulate a dynamic protective portfolio that allocates between the underlying equity index and cash, based on realized volatilities of the underlying equity and bond indices, while maintaining a fixed 40% allocation to the underlying bond index. The index has a risk management overlay that seeks to limit the index volatility to 10%, and includes a synthetic put position to reduce downside risk. S&P Dow Jones Indices are a product of S&P Dow Jones Indices LLC (“S&P DJI”) and have been licensed for use. S&P® and S&P 500® are registered trademarks of S&P DJI; Dow Jones® is a registered trademark of Dow Jones Trademark Holdings LLC (“Dow Jones”); S&P DJI, Dow Jones and their respective affiliates do not sponsor, endorse, sell or promote the Fund, will not have any liability with respect thereto and do not have any liability for any errors, omissions, or interruptions of the S&P Dow Jones Indices. Russell 3000® Index is an unmanaged index of the 3,000 largest U.S. stocks. Bloomberg U.S. Aggregate Bond Index is an unmanaged index of domestic investment-grade bonds, including corporate, government and mortgage-backed securities. MSCI EAFE Index is an unmanaged index of equities in the developed markets, excluding the U.S. and Canada. MSCI USA IMI/Equity REITs Index is an unmanaged index of U.S. equity REITs. MSCI indexes are net of foreign withholding taxes. Source: MSCI. MSCI data may not be reproduced or used for any other purpose. MSCI provides no warranties, has not prepared or approved this report, and has no liability hereunder. ICE BofA 3-Month U.S. Treasury Bill Index is an unmanaged index of U.S. Treasury securities maturing in 90 days. ICE® BofA® indices are not for redistribution or other uses; provided “as is”, without warranties, and with no liability. Eaton Vance has prepared this report and ICE Data Indices, LLC does not endorse it, or guarantee, review, or endorse Eaton Vance’s products. BofA® is a |
| | licensed registered trademark of Bank of America Corporation in the United States and other countries. Moderate Growth Portfolio Blended Benchmark is an internally constructed benchmark which is comprised of a blend of 47% Russell 3000® Index, 33% Bloombeg U.S. Aggregate Bond Index, 13% MSCI EAFE Index, 4% ICE BofA 3-Month U.S. Treasury Bill Index, and 3% MSCI USA IMI/Equity REITs Index, which is rebalanced monthly. Unless otherwise stated, index returns do not reflect the effect of any applicable sales charges, commissions, expenses, taxes or leverage, as applicable. It is not possible to invest directly in an index. |
| 2 | There is no sales charge. Insurance-related charges are not included in the calculation of returns. If such charges were reflected, the returns would be lower. Please refer to the report for your insurance contract for performance data reflecting insurance-related charges. Performance since inception for an index, if presented, is the performance since the Fund’s or oldest share class’ inception, as applicable.Calvert Research and Management became the investment adviser to the Fund on December 31, 2016. Performance reflected prior to such date is that of the Fund’s former investment adviser. |
| 3 | Source: Fund prospectus. Net expense ratio reflects a contractual expense reimbursement that continues through 4/30/22. The expense ratios for the current reporting period can be found in the Financial Highlights section of this report. Performance reflects expenses waived and/or reimbursed, if applicable. Without such waivers and/or reimbursements, performance would have been lower. |
| | Fund profile subject to change due to active management. |
| | Additional Information |
| | Yield curve is a graphical representation of the yields offered by bonds of various maturities. The yield curve flattens when long-term interest rates fall and/or short-term interest rates increase, and the yield curve steepens when long-term interest rates increase and/or short-term interest rates fall. |
| | MSCI World Index is an unmanaged index of equity securities in the developed markets. S&P 500® Index is an unmanaged index of large-cap stocks commonly used as a measure of U.S. stock market performance. Nasdaq Composite Index is a market capitalization-weighted index of all domestic and international securities listed on Nasdaq. Source: Nasdaq, Inc. The information is provided by Nasdaq (with its affiliates, are referred to as the “Corporations”) and Nasdaq’s third party licensors on an “as is” basis and the Corporations make no guarantees and bear no liability of any kind with respect to the information or the Fund. Bloomberg U.S. Corporate Bond Index measures the performance of investment-grade U.S. corporate securities with a maturity of one year |
Calvert
VP Volatility Managed Moderate Growth Portfolio
December 31, 2021
Endnotes and Additional Disclosures — continued
or more. ICE BofA U.S. High Yield Index is an unmanaged index of below-investment grade U.S. corporate bonds.
Calvert
VP Volatility Managed Moderate Growth Portfolio
December 31, 2021
Example
As a Fund shareholder, you incur ongoing costs, including management fees; distribution and/or service fees; and other Fund expenses. This Example is intended to help you understand your ongoing costs (in dollars) of Fund investing and to compare these costs with the ongoing costs of investing in other mutual funds. The Example is based on an investment of $1,000 invested at the beginning of the period and held for the entire period (July 1, 2021 to December 31, 2021).
Actual Expenses
The first line of the table below provides information about actual account values and actual expenses. You may use the information in this line, together with the amount you invested, to estimate the expenses that you paid over the period. Simply divide your account value by $1,000 (for example, an $8,600 account value divided by $1,000 = 8.6), then multiply the result by the number in the first line under the heading entitled “Expenses Paid During Period” to estimate the expenses you paid on your account during this period.
Hypothetical Example for Comparison Purposes
The second line of the table below provides information about hypothetical account values and hypothetical expenses based on the actual Fund expense ratio and an assumed rate of return of 5% per year (before expenses), which is not the actual Fund return. The hypothetical account values and expenses may not be used to estimate the actual ending account balance or expenses you paid for the period. You may use this information to compare the ongoing costs of investing in the Fund and other funds. To do so, compare this 5% hypothetical example with the 5% hypothetical examples that appear in the shareholder reports of the other funds.
Please note that the expenses shown in the table are meant to highlight your ongoing costs only and do not reflect expenses and charges which are, or may be imposed under the variable annuity contract or variable life insurance policy (variable contracts) (if applicable) or qualified pension or retirement plans (Qualified Plans) through which your investment in the Fund is made. Therefore, the second line of the table is useful in comparing ongoing costs associated with an investment in vehicles which fund benefits under variable contracts and Qualified Plans, and will not help you determine the relative total costs of investing in the Fund through variable contracts or Qualified Plans. In addition, if these expenses and charges imposed under the variable contracts or Qualified Plans were included, your costs would have been higher.
| | Beginning
Account Value
(7/1/21) | Ending
Account Value
(12/31/21) | Expenses Paid
During Period*
(7/1/21 – 12/31/21) | Annualized
Expense
Ratio |
| Actual | | | | |
| Class F | $1,000.00 | $1,052.20 | $4.19 ** | 0.81% |
| Hypothetical | | | | |
| (5% return per year before expenses) | | | | |
| Class F | $1,000.00 | $1,021.12 | $4.13 ** | 0.81% |
| * | Expenses are equal to the Fund's annualized expense ratio, multiplied by the average account value over the period, multiplied by 184/365 (to reflect the one-half year period). The Example assumes that the $1,000 was invested at the net asset value per share determined at the close of business on June 30, 2021. Expenses shown do not include insurance-related charges or direct expenses of Qualified Plans. Expenses do not include fees and expenses incurred indirectly from investment in underlying affiliated and/or unaffiliated funds. |
| ** | Absent a waiver and/or reimbursement of expenses by an affiliate, expenses would be higher. |
Calvert
VP Volatility Managed Moderate Growth Portfolio
December 31, 2021
| Exchange-Traded Funds — 93.0% |
| Security | Shares | Value |
| Equity Funds — 63.5% | |
| iShares Core S&P Mid-Cap ETF | | 5,000 | $ 1,415,400 |
| iShares Russell 2000 ETF(1) | | 10,000 | 2,224,500 |
| iShares S&P 500 Growth ETF(1) | | 123,000 | 10,291,410 |
| iShares S&P 500 Value ETF | | 54,000 | 8,458,020 |
| Technology Select Sector SPDR Fund | | 3,000 | 521,610 |
| Vanguard FTSE Developed Markets ETF(1) | | 207,000 | 10,569,420 |
| Vanguard FTSE Emerging Markets ETF(1) | | 37,000 | 1,830,020 |
| Vanguard REIT ETF | | 25,000 | 2,900,250 |
| Vanguard S&P 500 ETF | | 44,000 | 19,209,080 |
| | | | $57,419,710 |
| Fixed-Income Funds — 29.5% | |
| iShares Core U.S. Aggregate Bond ETF | | 133,000 | $ 15,172,640 |
| Vanguard Total Bond Market ETF | | 135,000 | 11,441,250 |
| | | | $26,613,890 |
Total Exchange-Traded Funds
(identified cost $57,227,699) | | | $84,033,600 |
| Short-Term Investments — 9.5% | | | |
| Affiliated Fund — 7.0% |
| Description | Units | Value |
| Calvert Cash Reserves Fund, LLC, 0.06%(2) | | 6,346,788 | $ 6,346,788 |
Total Affiliated Fund
(identified cost $6,346,729) | | | $ 6,346,788 |
| Securities Lending Collateral — 2.5% |
| Security | Shares | Value |
| State Street Navigator Securities Lending Government Money Market Portfolio, 0.03%(3) | | 2,244,575 | $ 2,244,575 |
Total Securities Lending Collateral
(identified cost $2,244,575) | | | $ 2,244,575 |
Total Short-Term Investments
(identified cost $8,591,304) | | | $ 8,591,363 |
Total Investments — 102.5%
(identified cost $65,819,003) | | | $92,624,963 |
| Other Assets, Less Liabilities — (2.5)% | | | $ (2,266,523) |
| Net Assets — 100.0% | | | $ 90,358,440 |
| The percentage shown for each investment category in the Schedule of Investments is based on net assets. |
| (1) | All or a portion of this security was on loan at December 31, 2021. The aggregate market value of securities on loan at December 31, 2021 was $15,138,093. |
| (2) | Affiliated investment company, available to Calvert portfolios and funds, which invests in high quality, U.S. dollar denominated money market instruments. The rate shown is the annualized seven-day yield as of December 31, 2021. |
| (3) | Represents investment of cash collateral received in connection with securities lending. |
8
See Notes to Financial Statements.
Calvert
VP Volatility Managed Moderate Growth Portfolio
December 31, 2021
Schedule of Investments — continued
Futures Contracts
| Description | Number of
Contracts | Position | Expiration
Date | Notional
Amount | Value/
Unrealized
Appreciation
(Depreciation) |
| Equity Futures | | | | | |
| E-mini S&P 500 Index | 4 | Long | 3/18/22 | $951,700 | $ 19,690 |
| E-mini S&P MidCap 400 Index | 1 | Long | 3/18/22 | 283,770 | 6,314 |
| MSCI EAFE Index | 3 | Long | 3/18/22 | 348,270 | 4,859 |
| | | | | | $30,863 |
9
See Notes to Financial Statements.
Calvert
VP Volatility Managed Moderate Growth Portfolio
December 31, 2021
Statement of Assets and Liabilities
| | December 31, 2021 |
| Assets | |
Investments in securities of unaffiliated issuers, at value (identified cost $59,472,274) - including
$15,138,093 of securities on loan | $ 86,278,175 |
| Investments in securities of affiliated issuers, at value (identified cost $6,346,729) | 6,346,788 |
| Deposits at broker for futures contracts | 82,000 |
| Receivable for capital shares sold | 66 |
| Dividends receivable - affiliated | 317 |
| Securities lending income receivable | 2,875 |
| Directors' deferred compensation plan | 21,744 |
| Total assets | $92,731,965 |
| Liabilities | |
| Payable for variation margin on open futures contracts | $ 2,872 |
| Payable for capital shares redeemed | 4,009 |
| Deposits for securities loaned | 2,244,575 |
| Payable to affiliates: | |
| Investment advisory fee | 30,354 |
| Administrative fee | 9,106 |
| Distribution and service fees | 18,971 |
| Sub-transfer agency fee | 26 |
| Directors' deferred compensation plan | 21,744 |
| Other | 11,889 |
| Accrued expenses | 29,979 |
| Total liabilities | $ 2,373,525 |
| Net Assets | $90,358,440 |
| Sources of Net Assets | |
| Paid-in capital | $ 60,991,389 |
| Distributable earnings | 29,367,051 |
| Net Assets | $90,358,440 |
| Class F Shares | |
| Net Assets | $ 90,358,440 |
| Shares Outstanding | 4,018,398 |
Net Asset Value, Offering Price and Redemption Price Per Share
(net assets ÷ shares of beneficial interest outstanding) | $ 22.49 |
10
See Notes to Financial Statements.
Calvert
VP Volatility Managed Moderate Growth Portfolio
December 31, 2021
| | Year Ended |
| | December 31, 2021 |
| Investment Income | |
| Dividend income | $ 1,437,005 |
| Dividend income - affiliated issuers | 4,217 |
| Securities lending income, net | 16,486 |
| Total investment income | $ 1,457,708 |
| Expenses | |
| Investment advisory fee | $ 356,293 |
| Administrative fee | 106,888 |
| Distribution and service fees | 222,683 |
| Directors' fees and expenses | 3,529 |
| Custodian fees | 6,662 |
| Transfer agency fees and expenses | 65,922 |
| Accounting fees | 20,090 |
| Professional fees | 26,366 |
| Reports to shareholders | 785 |
| Miscellaneous | 7,179 |
| Total expenses | $ 816,397 |
| Waiver and/or reimbursement of expenses by affiliate | $ (94,770) |
| Net expenses | $ 721,627 |
| Net investment income | $ 736,081 |
| Realized and Unrealized Gain (Loss) | |
| Net realized gain (loss): | |
| Investment securities | $ 4,800,934 |
| Investment securities - affiliated issuers | (611) |
| Futures contracts | (23,670) |
| Capital gains distributions received | 24,172 |
| Net realized gain | $ 4,800,825 |
| Change in unrealized appreciation (depreciation): | |
| Investment securities | $ 5,768,317 |
| Investment securities - affiliated issuers | 59 |
| Futures contracts | 29,709 |
| Net change in unrealized appreciation (depreciation) | $ 5,798,085 |
| Net realized and unrealized gain | $10,598,910 |
| Net increase in net assets from operations | $11,334,991 |
11
See Notes to Financial Statements.
Calvert
VP Volatility Managed Moderate Growth Portfolio
December 31, 2021
Statements of Changes in Net Assets
| | Year Ended December 31, |
| | 2021 | 2020 |
| Increase (Decrease) in Net Assets | | |
| From operations: | | |
| Net investment income | $ 736,081 | $ 875,070 |
| Net realized gain (loss) | 4,800,825 | (2,790,191) |
| Net change in unrealized appreciation (depreciation) | 5,798,085 | 4,833,581 |
| Net increase in net assets from operations | $11,334,991 | $ 2,918,460 |
| Distributions to shareholders | $ (877,245) | $ (2,255,372) |
| Net decrease in net assets from capital share transactions | $ (6,455,211) | $ (3,487,916) |
| Net increase (decrease) in net assets | $ 4,002,535 | $ (2,824,828) |
| Net Assets | | |
| At beginning of year | $ 86,355,905 | $ 89,180,733 |
| At end of year | $90,358,440 | $86,355,905 |
12
See Notes to Financial Statements.
Calvert
VP Volatility Managed Moderate Growth Portfolio
December 31, 2021
| | Class F |
| | Year Ended December 31, |
| | 2021 | 2020 | 2019 | 2018 | 2017 |
| Net asset value — Beginning of year | $ 19.99 | $ 19.81 | $ 17.18 | $ 18.90 | $ 16.69 |
| Income (Loss) From Operations | | | | | |
| Net investment income(1) | $ 0.18 | $ 0.20 | $ 0.29 | $ 0.26 | $ 0.23 |
| Net realized and unrealized gain (loss) | 2.54 | 0.51 | 2.86 | (1.49) | 2.19 |
| Total income (loss) from operations | $ 2.72 | $ 0.71 | $ 3.15 | $ (1.23) | $ 2.42 |
| Less Distributions | | | | | |
| From net investment income | $ (0.22) | $ (0.31) | $ (0.28) | $ (0.23) | $ (0.21) |
| From net realized gain | — | (0.22) | (0.24) | (0.26) | — |
| Total distributions | $ (0.22) | $ (0.53) | $ (0.52) | $ (0.49) | $ (0.21) |
| Net asset value — End of year | $ 22.49 | $ 19.99 | $ 19.81 | $ 17.18 | $ 18.90 |
| Total Return(2) | 13.64% | 3.82% | 18.56% | (6.69)% | 14.55% |
| Ratios/Supplemental Data | | | | | |
| Net assets, end of year (000’s omitted) | $90,358 | $86,356 | $89,181 | $83,345 | $94,689 |
| Ratios (as a percentage of average daily net assets):(3)(4) | | | | | |
| Total expenses | 0.92% | 0.95% | 0.91% | 0.89% | 0.91% |
| Net expenses | 0.81% | 0.83% | 0.83% | 0.83% | 0.83% |
| Net investment income | 0.83% | 1.06% | 1.56% | 1.40% | 1.29% |
| Portfolio Turnover | 10% | 16% | 7% | 14% | 8% |
| (1) | Computed using average shares outstanding. |
| (2) | Returns are historical and are calculated by determining the percentage change in net asset value with all distributions reinvested and do not reflect fees and expenses imposed by variable annuity contracts or variable life insurance policies. If included, total return would be lower. |
| (3) | Total expenses do not reflect amounts reimbursed and/or waived by the adviser and certain of its affiliates, if applicable. Net expenses are net of all reductions and represent the net expenses paid by the Fund. |
| (4) | Amounts do not include the expenses of the Underlying Funds. |
13
See Notes to Financial Statements.
Calvert
VP Volatility Managed Moderate Growth Portfolio
December 31, 2021
Notes to Financial Statements
1 Significant Accounting Policies
Calvert VP Volatility Managed Moderate Growth Portfolio (the Fund) is a diversified series of Calvert Variable Products, Inc. (the Corporation). The Corporation is a Maryland corporation registered under the Investment Company Act of 1940, as amended (the 1940 Act), as an open-end management investment company. The investment objective of the Fund is to pursue a balance of current income and growth potential, while seeking to manage overall portfolio volatility. The Fund invests primarily in exchange-traded funds representing a broad range of asset classes (the Underlying Funds).
Shares of the Fund are sold without sales charge to insurance companies for allocation to certain of their variable separate accounts and to qualified pension and retirement plans and other eligible investors. The Fund offers Class F shares.
The Fund applies the accounting and reporting guidance in the Financial Accounting Standards Board (FASB) Accounting Standards Codification Topic 946, Financial Services – Investment Companies (ASC 946). Subsequent events, if any, through the date that the financial statements were issued have been evaluated in the preparation of the financial statements.
A Investment Valuation— Net asset value per share is determined every business day as of the close of the regular session of the New York Stock Exchange (generally 4:00 p.m. Eastern time). The Fund uses independent pricing services approved by the Board of Directors (the Board) to value its investments wherever possible. Investments for which market quotations are not available or deemed not reliable are fair valued in good faith under the direction of the Board.
U.S. generally accepted accounting principles (U.S. GAAP) establishes a disclosure hierarchy that categorizes the inputs to valuation techniques used to value assets and liabilities at measurement date. These inputs are summarized in the three broad levels listed below:
Level 1 - quoted prices in active markets for identical securities
Level 2 - other significant observable inputs (including quoted prices for similar securities, interest rates, prepayment speeds, credit risk, etc.)
Level 3 - significant unobservable inputs (including the Fund’s own assumptions in determining the fair value of investments)
The inputs or methodologies used for valuing securities are not necessarily an indication of the risk associated with investing in those securities.
Valuation techniques used to value the Fund’s investments by major category are as follows:
Securities. Exchange-traded funds are valued at the official closing price as reported by an independent pricing service on the primary market or exchange on which they are traded and are categorized as Level 1 in the hierarchy. Investments in registered investment companies (including money market funds) that do not trade on an exchange are valued at the net asset value per share on the valuation day and are categorized as Level 1 in the hierarchy.
Affiliated Fund. The Fund may invest in Calvert Cash Reserves Fund, LLC (Cash Reserves Fund), an affiliated investment company managed by Calvert Research and Management (CRM). While Cash Reserves Fund is not a registered money market mutual fund, it conducts all of its investment activities in accordance with the requirements of Rule 2a-7 under the 1940 Act. Investments in Cash Reserves Fund are valued at the closing net asset value per unit on the valuation day and are categorized as Level 2 in the hierarchy. Cash Reserves Fund generally values its investment securities based on available market quotations provided by a third party pricing service.
Derivatives. Futures contracts are valued at unrealized appreciation (depreciation) based on the settlement price established each day by the board of trade or exchange on which they are traded and are categorized as Level 1 in the hierarchy.
Fair Valuation. If a market value cannot be determined for a security using the methodologies described above, or if, in the good faith opinion of the Fund's adviser, the market value does not constitute a readily available market quotation, or if a significant event has occurred that would materially affect the value of the security, the security will be fair valued as determined in good faith by or at the direction of the Board in a manner that most fairly reflects the security’s “fair value”, which is the amount that the Fund might reasonably expect to receive for the security upon its current sale in the ordinary course. Each such determination is based on a consideration of relevant factors, which are likely to vary from one pricing context to another. These factors may include, but are not limited to, the type of security, the existence of any contractual restrictions on the security’s disposition, the price and extent of public trading in similar securities of the issuer or of comparable companies or entities, quotations or relevant information obtained from broker/dealers or other market participants, information obtained from the issuer, analysts, and/or the appropriate stock exchange (for exchange-traded securities), an analysis of the company’s or entity’s financial statements, and an evaluation of the forces that influence the issuer and the market(s) in which the security is purchased and sold.
The values assigned to fair value investments are based on available information and do not necessarily represent amounts that might ultimately be realized. Further, due to the inherent uncertainty of valuations of such investments, the fair values may differ significantly from the values that would have been used had an active market existed, and the differences could be material.
Calvert
VP Volatility Managed Moderate Growth Portfolio
December 31, 2021
Notes to Financial Statements — continued
The following table summarizes the market value of the Fund's holdings as of December 31, 2021, based on the inputs used to value them:
| Asset Description | Level 1 | Level 2 | Level 3 | Total |
| Exchange-Traded Funds | $ 84,033,600 | $ — | $ — | $ 84,033,600 |
| Short-Term Investments: | | | | |
| Affiliated Fund | — | 6,346,788 | — | 6,346,788 |
| Securities Lending Collateral | 2,244,575 | — | — | 2,244,575 |
| Total Investments | $86,278,175 | $6,346,788 | $ — | $92,624,963 |
| Futures Contracts | $ 30,863 | $ — | $ — | $ 30,863 |
| Total | $86,309,038 | $6,346,788 | $ — | $92,655,826 |
B Investment Transactions and Income— Investment transactions for financial statement purposes are accounted for on trade date. Realized gains and losses are recorded on an identified cost basis and may include proceeds from litigation. Distributions from the Underlying Funds and Cash Reserves Fund are recorded on ex-dividend date. Distributions received that represent a return of capital are recorded as a reduction of cost of investments. Distributions received that represent a capital gain are recorded as a realized gain. Expenses included in the accompanying financial statements reflect the expenses of the Fund and do not include any expenses associated with the Underlying Funds.
C Futures Contracts— The Fund may enter into futures contracts to buy or sell a financial instrument for a set price at a future date. Initial margin deposits of either cash or securities as required by the broker are made upon entering into the contract. While the contract is open, daily variation margin payments are made to or received from the broker reflecting the daily change in market value of the contract and are recorded for financial reporting purposes as unrealized gains or losses by the Fund. When a futures contract is closed, a realized gain or loss is recorded equal to the difference between the opening and closing value of the contract. The risks associated with entering into futures contracts may include the possible illiquidity of the secondary market which would limit the Fund’s ability to close out a futures contract prior to the settlement date, an imperfect correlation between the value of the contracts and the underlying financial instruments, or that the counterparty will fail to perform its obligations under the contracts’ terms. Futures contracts are designed by boards of trade, which are designated “contracts markets” by the Commodities Futures Trading Commission. Futures contracts trade on the contracts markets in a manner that is similar to the way a stock trades on a stock exchange, and the boards of trade, through their clearing corporations, guarantee the futures contracts against default. As a result, there is minimal counterparty credit risk to the Fund.
D Distributions to Shareholders— Distributions to shareholders are recorded by the Fund on ex-dividend date. The Fund distributes any net investment income and net realized capital gains at least annually. Both types of distributions are made in shares of the Fund unless an election is made on behalf of a separate account to receive some or all of the distributions in cash. Distributions are determined in accordance with income tax regulations, which may differ from U.S. GAAP; accordingly, periodic reclassifications are made within the Fund's capital accounts to reflect income and gains available for distribution under income tax regulations.
E Estimates— The preparation of financial statements in conformity with U.S. GAAP requires management to make estimates and assumptions that affect the reported amounts of assets and liabilities and disclosure of contingent assets and liabilities at the date of the financial statements and the reported amounts of increases and decreases in net assets from operations during the reporting period. Actual results could differ from those estimates.
F Indemnifications— The Corporation’s By-Laws provide for indemnification for Directors or officers of the Corporation and certain other parties, to the fullest extent permitted by Maryland law and the 1940 Act, provided certain conditions are met. Additionally, in the normal course of business, the Fund enters into agreements with service providers that may contain indemnification clauses. The Fund’s maximum exposure under these arrangements is unknown as this would involve future claims that may be made against the Fund that have not yet occurred.
G Federal Income Taxes— No provision for federal income or excise tax is required since the Fund intends to continue to qualify as a regulated investment company under the Internal Revenue Code and to distribute substantially all of its taxable earnings.
Management has analyzed the Fund's tax positions taken for all open federal income tax years and has concluded that no provision for federal income tax is required in the Fund's financial statements. A Fund's federal tax return is subject to examination by the Internal Revenue Service for a period of three years from the date of filing.
Calvert
VP Volatility Managed Moderate Growth Portfolio
December 31, 2021
Notes to Financial Statements — continued
2 Related Party Transactions
The investment advisory fee is earned by CRM as compensation for investment advisory services rendered to the Fund. On March 1, 2021, Morgan Stanley acquired Eaton Vance Corp. (the “Transaction”) and CRM became an indirect, wholly-owned subsidiary of Morgan Stanley. In connection with the Transaction, the Fund entered into a new investment advisory agreement (the “New Agreement”) with CRM, which took effect on March 1, 2021. Pursuant to the New Agreement (and the Fund’s investment advisory agreement with CRM in effect prior to March 1, 2021), the fee is computed at the annual rate of 0.40% of the Fund’s average daily net assets and is payable monthly. For the year ended December 31, 2021, the investment advisory fee amounted to $356,293. The Fund may invest its cash in Cash Reserves Fund. CRM does not currently receive a fee for advisory services provided to Cash Reserves Fund.
Pursuant to an investment sub-advisory agreement, CRM has delegated a portion of the investment management of the Fund to Ameritas Investment Partners, Inc. (AIP). In connection with the Transaction, CRM entered into a new sub-advisory agreement with AIP, which took effect on March 1, 2021. CRM pays AIP a portion of its investment advisory fee for sub-advisory services provided to the Fund.
CRM has agreed to reimburse the Fund’s operating expenses to the extent that total annual operating expenses (relating to ordinary operating expenses only and excluding expenses such as brokerage commissions, acquired fund fees and expenses of unaffiliated funds, borrowing costs, taxes or litigation expenses) exceed 0.81% of the Fund's average daily net assets. The expense reimbursement agreement with CRM may be changed or terminated after April 30, 2022. For the year ended December 31, 2021, CRM waived or reimbursed expenses of $94,770.
The administrative fee is earned by CRM as compensation for administrative services rendered to the Fund. The fee is computed at an annual rate of 0.12% of the Fund's average daily net assets and is payable monthly. For the year ended December 31, 2021, CRM was paid administrative fees of $106,888.
The Fund has in effect a distribution plan for Class F shares (Class F Plan) pursuant to Rule 12b-1 under the 1940 Act. Pursuant to the Class F Plan, the Fund pays Eaton Vance Distributors, Inc. (EVD), an affiliate of CRM and the Fund’s principal underwriter, a distribution and service fee of 0.25% per annum of its average daily net assets attributable to Class F shares for distribution services and facilities provided to the Fund, as well as for personal and/or account maintenance services provided to the class shareholders. Distribution and service fees paid or accrued for the year ended December 31, 2021 amounted to $222,683 for Class F shares.
Eaton Vance Management (EVM), an affiliate of CRM, provides sub-transfer agency and related services to the Fund pursuant to a Sub-Transfer Agency Support Services Agreement. For the year ended December 31, 2021, sub-transfer agency fees and expenses incurred to EVM amounted to $124 and are included in transfer agency fees and expenses on the Statement of Operations.
Each Director of the Fund who is not an employee of CRM or its affiliates receives an annual fee of $154,000 ($214,000 effective January 1, 2022), plus an annual Committee fee ranging from $8,500 to $16,500 depending on the Committee. The Board chair receives an additional $30,000 annual fee, Committee chairs receive an additional $6,000 annual fee and the special equities liaison receives an additional $2,500 annual fee. Eligible Directors may participate in a Deferred Compensation Plan (the Plan). Amounts deferred under the Plan are treated as though equal dollar amounts had been invested in shares of the Fund or other Calvert funds selected by the Directors. The Fund purchases shares of the funds selected equal to the dollar amounts deferred under the Plan, resulting in an asset equal to the deferred compensation liability. Obligations of the Plan are paid solely from the Fund's assets. Directors’ fees are allocated to each of the Calvert funds served. Salaries and fees of officers and Directors of the Fund who are employees of CRM or its affiliates are paid by CRM.
3 Shareholder Servicing Plan
The Corporation, on behalf of the Fund, has adopted a Shareholder Servicing Plan (Servicing Plan), which permits the Fund to enter into shareholder servicing agreements with intermediaries that maintain accounts in the Fund for the benefit of shareholders. These services may include, but are not limited to, processing purchase and redemption requests, processing dividend payments, and providing account information to shareholders. Under the Servicing Plan, the Fund may make payments at an annual rate of up to 0.11% of its average daily net assets. For the year ended December 31, 2021, expenses incurred under the Servicing Plan amounted to $65,689, all of which were payable to an affiliate of AIP, and are included in transfer agency fees and expenses on the Statement of Operations. Included in accrued expenses at December 31, 2021 are amounts payable to an affiliate of AIP under the Servicing Plan of $6,607.
4 Investment Activity
During the year ended December 31, 2021, the cost of purchases and proceeds from sales of investments, other than short-term securities, were $8,172,697 and $15,515,244, respectively.
Calvert
VP Volatility Managed Moderate Growth Portfolio
December 31, 2021
Notes to Financial Statements — continued
5 Distributions to Shareholders and Income Tax Information
The tax character of distributions declared for the years ended December 31, 2021 and December 31, 2020 was as follows:
| | Year Ended December 31, |
| | 2021 | 2020 |
| Ordinary income | $877,245 | $1,334,094 |
| Long-term capital gains | $ — | $ 921,278 |
As of December 31, 2021, the components of distributable earnings (accumulated loss) on a tax basis were as follows:
| Undistributed ordinary income | $ 758,292 |
| Undistributed long-term capital gains | 2,341,828 |
| Net unrealized appreciation | 26,266,931 |
| Distributable earnings | $29,367,051 |
The cost and unrealized appreciation (depreciation) of investments, including open derivative contracts, of the Fund at December 31, 2021, as determined on a federal income tax basis, were as follows:
| Aggregate cost | $66,358,032 |
| Gross unrealized appreciation | $ 26,266,931 |
| Gross unrealized depreciation | — |
| Net unrealized appreciation | $26,266,931 |
6 Financial Instruments
A summary of futures contracts outstanding at December 31, 2021 is included in the Schedule of Investments. During the year ended December 31, 2021, the Fund used futures contracts to hedge against changes in market volatility and declines in the value of the Fund’s investments and to adjust the Fund’s overall equity exposure in an effort to stabilize portfolio volatility around a target level.
At December 31, 2021, the fair value of open derivative instruments (not considered to be hedging instruments for accounting disclosure purposes) and whose primary underlying risk exposure is equity price risk was as follows:
| Derivative | Statement of Assets and Liabilities Caption | Assets | Liabilities |
| Futures contracts | Distributable earnings | | $30,863 (1) | $ — |
| (1) | Only the current day's variation margin is reported within the Statement of Assets and Liabilities as Receivable or Payable for variation margin on open futures contracts, as applicable. |
The effect of derivative instruments (not considered to be hedging instruments for accounting disclosure purposes) on the Statement of Operations and whose primary underlying risk exposure is equity price risk for the year ended December 31, 2021 was as follows:
| | Statement of Operations Caption | |
| Derivative | Net realized gain (loss): Futures
contracts | Change in unrealized appreciation
(depreciation): Futures contracts |
| Futures contracts | $ (23,670) | $ 29,709 |
Calvert
VP Volatility Managed Moderate Growth Portfolio
December 31, 2021
Notes to Financial Statements — continued
The average notional cost of futures contracts (long) and futures contracts (short) outstanding during the year ended December 31, 2021 was approximately $5,464,000 and $407,000, respectively.
7 Securities Lending
To generate additional income, the Fund may lend its securities pursuant to a securities lending agency agreement with State Street Bank and Trust Company (SSBT), the securities lending agent. Security loans are subject to termination by the Fund at any time and, therefore, are not considered illiquid investments. The Fund requires that the loan be continuously collateralized by either cash or securities in an amount at least equal to the market value of the securities on loan. The market value of securities loaned is determined daily and any additional required collateral is delivered to the Fund on the next business day. Cash collateral is generally invested in a money market fund registered under the 1940 Act that is managed by an affiliate of SSBT. Any gain or loss in the market price of the loaned securities that might occur and any interest earned or dividends declared during the term of the loan would accrue to the account of the Fund. Income earned on the investment of collateral, net of broker rebates and other expenses incurred by the securities lending agent, is split between the Fund and the securities lending agent based on agreed upon contractual terms. Non-cash collateral, if any, is held by the lending agent on behalf of the Fund and cannot be sold or re-pledged by the Fund; accordingly, such collateral is not reflected in the Statement of Assets and Liabilities.
The risks associated with lending portfolio securities include, but are not limited to, possible delays in receiving additional collateral or in the recovery of the loaned securities, possible loss of rights to the collateral should the borrower fail financially, as well as risk of loss in the value of the collateral or the value of the investments made with the collateral. The securities lending agent shall indemnify the Fund in the case of default of any securities borrower.
At December 31, 2021, the total value of securities on loan was $15,138,093 and the total value of collateral received was $15,584,828, comprised of cash of $2,244,575 and U.S. government and/or agencies securities of $13,340,253.
The following table provides a breakdown of securities lending transactions accounted for as secured borrowings, the obligations by class of collateral pledged, and the remaining contractual maturity of those transactions as of December 31, 2021.
| | Remaining Contractual Maturity of the Transactions |
| | Overnight and
Continuous | <30 days | 30 to 90 days | >90 days | Total |
| Exchange-Traded Funds | $2,244,575 | $ — | $ — | $ — | $2,244,575 |
The carrying amount of the liability for deposits for securities loaned at December 31, 2021 approximated its fair value. If measured at fair value, such liability would have been considered as Level 2 in the fair value hierarchy (see Note 1A) at December 31, 2021.
8 Line of Credit
The Fund participates with other portfolios and funds managed by EVM and its affiliates, including CRM, in an $800 million unsecured line of credit with a group of banks, which is in effect through October 25, 2022. Borrowings are made by the Fund solely for temporary purposes related to redemptions and other short-term cash needs. Interest is charged to the Fund based on its borrowings at an amount above either the Secured Overnight Financing Rate (SOFR) or Federal Funds rate. In addition, a fee computed at an annual rate of 0.15% on the daily unused portion of the line of credit is allocated among the participating portfolios and funds at the end of each quarter. In connection with the renewal of the agreement in October 2021, an arrangement fee of $150,000 was incurred that was allocated to the participating portfolios and funds. Because the line of credit is not available exclusively to the Fund, it may be unable to borrow some or all of its requested amounts at any particular time.
The Fund had no borrowings pursuant to its line of credit during the year ended December 31, 2021.
Calvert
VP Volatility Managed Moderate Growth Portfolio
December 31, 2021
Notes to Financial Statements — continued
9 Affiliated Funds
At December 31, 2021, the value of the Fund’s investment in affiliated funds was $6,346,788, which represents 7.0% of the Fund’s net assets. Transactions in affiliated funds by the Fund for the year ended December 31, 2021 were as follows:
| Name | Value,
beginning
of period | Purchases | Sales
proceeds | Net
realized
gain
(loss) | Change in
unrealized
appreciation
(depreciation) | Value,
end of
period | Dividend
income | Units,
end of
period |
| Short-Term Investments | | | | | | |
| Calvert Cash Reserves Fund, LLC | $5,288,618 | $17,672,536 | $(16,613,814) | $(611) | $59 | $6,346,788 | $4,217 | 6,346,788 |
10 Capital Shares
The Corporation may issue its shares in one or more series (such as the Fund). The authorized shares of the Fund consist of 100,000,000 common shares, $0.10 par value.
Transactions in capital shares for the years ended December 31, 2021 and December 31, 2020 were as follows:
| | Year Ended
December 31, 2021 | | Year Ended
December 31, 2020 |
| | Shares | Amount | | Shares | Amount |
| Class F | | | | | |
| Shares sold | 46,236 | $ 971,314 | | 149,020 | $ 2,811,886 |
| Reinvestment of distributions | 40,897 | 877,245 | | 119,967 | 2,255,372 |
| Shares redeemed | (387,918) | (8,303,770) | | (451,290) | (8,555,174) |
| Net decrease | (300,785) | $(6,455,211) | | (182,303) | $(3,487,916) |
At December 31, 2021, separate accounts of an insurance company that is an affiliate of AIP owned 100% of the value of the outstanding shares of the Fund.
11 Risks and Uncertainties
Pandemic Risk
An outbreak of respiratory disease caused by a novel coronavirus was first detected in China in late 2019 and subsequently spread internationally. This coronavirus has resulted in closing borders, enhanced health screenings, changes to healthcare service preparation and delivery, quarantines, cancellations, disruptions to supply chains and customer activity, as well as general concern and uncertainty. Health crises caused by outbreaks, such as the coronavirus outbreak, may exacerbate other pre-existing political, social and economic risks and disrupt normal market conditions and operations. The impact of this outbreak has negatively affected the worldwide economy, the economies of individual countries, individual companies, and the market in general, and may continue to do so in significant and unforeseen ways, as may other epidemics and pandemics that may arise in the future. Any such impact could adversely affect the Fund's performance, or the performance of the securities in which the Fund invests.
12 Change in Independent Registered Public Accounting Firm
On July 30, 2021, KPMG LLP (“KPMG”) informed the Audit Committee and Board of the Corporation that it was resigning as the independent registered public accounting firm to the Corporation, as upon Morgan Stanley’s acquisition of Eaton Vance Corp., the parent company of CRM (the investment adviser to each series of the Corporation), KPMG would no longer be independent of the Corporation. The Audit Committee of the Board and the Board approved the selection of Deloitte & Touche LLP (“Deloitte”) as the independent registered public accounting firm for the funds that are series of the Corporation (the “Funds”) for the fiscal year ending December 31, 2021 to be effective upon KPMG’s resignation and Deloitte’s acceptance of the engagement which became effective July 30, 2021.
Calvert
VP Volatility Managed Moderate Growth Portfolio
December 31, 2021
Notes to Financial Statements — continued
KPMG’s reports on the financial statements for the Funds for the fiscal periods ended December 31, 2019 and December 31, 2020 contained no adverse opinion or disclaimer of opinion nor were they qualified or modified as to uncertainty, audit scope or accounting principles. During the fiscal periods ended December 31, 2019 and December 31, 2020, and during the subsequent interim period through July 30, 2021: (i) there were no disagreements with KPMG on any matter of accounting principles or practices, financial statement disclosure or auditing scope or procedure, which disagreements, if not resolved to the satisfaction of KPMG, would have caused KPMG to make reference to the subject matter of the disagreements in connection with its reports on the Funds’ financial statements for such periods; and (ii) there were no “reportable events” of the kind described in Item 304(a)(1)(v) of Regulation S-K under the Securities Exchange Act of 1934, as amended.
During the fiscal periods ended December 31, 2019 and December 31, 2020, and during the subsequent interim period through July 30, 2021: neither the Funds, nor anyone on their behalf, consulted with Deloitte on items which: (i) concerned the application of accounting principles to a specified transaction, either completed or proposed, or the type of audit opinion that might be rendered on the Funds’ financial statements; or (ii) concerned the subject of a disagreement (as defined in paragraph (a)(1)(iv) of Item 304 of Regulation S-K) or reportable events (as described in paragraph (a)(1)(v) of Item 304).
13 Subsequent Event
Effective January 1, 2022, CRM entered into an investment sub-advisory agreement with Parametric Portfolio Associates LLC (Parametric), an affiliate of CRM and an indirect, wholly-owned subsidiary of Morgan Stanley, to provide sub-advisory services to the Fund. Parametric is responsible for executing the Fund’s volatility management strategy.
Calvert
VP Volatility Managed Moderate Growth Portfolio
December 31, 2021
Report of Independent Registered Public Accounting Firm
To the Board of Directors of Calvert Variable Products, Inc. and Shareholders of Calvert VP Volatility Managed Moderate Growth Portfolio:
Opinion on the Financial Statements and Financial Highlights
We have audited the accompanying statement of assets and liabilities of Calvert VP Volatility Managed Moderate Growth Portfolio (the "Fund") (one of the funds constituting Calvert Variable Products, Inc.), including the schedule of investments, as of December 31, 2021, the related statements of operations, changes in net assets, and the financial highlights for the year then ended, and the related notes. In our opinion, the financial statements and financial highlights present fairly, in all material respects, the financial position of the Fund as of December 31, 2021, and the results of its operations, changes in its net assets, and the financial highlights for the year then ended in conformity with accounting principles generally accepted in the United States of America. The statement of changes in net assets for the year ended December 31, 2020, and the financial highlights for the years ended December 31, 2020, 2019, 2018, and 2017 were audited by other auditors whose report, dated February 18, 2021, expressed an unqualified opinion on that financial statement and those financial highlights.
Basis for Opinion
These financial statements and financial highlights are the responsibility of the Fund's management. Our responsibility is to express an opinion on the Fund's financial statements and financial highlights based on our audit. We are a public accounting firm registered with the Public Company Accounting Oversight Board (United States) (PCAOB) and are required to be independent with respect to the Fund in accordance with the U.S. federal securities laws and the applicable rules and regulations of the Securities and Exchange Commission and the PCAOB.
We conducted our audit in accordance with the standards of the PCAOB. Those standards require that we plan and perform the audit to obtain reasonable assurance about whether the financial statements and financial highlights are free of material misstatement, whether due to error or fraud. The Fund is not required to have, nor were we engaged to perform, an audit of its internal control over financial reporting. As part of our audit, we are required to obtain an understanding of internal control over financial reporting but not for the purpose of expressing an opinion on the effectiveness of the Fund’s internal control over financial reporting. Accordingly, we express no such opinion.
Our audit included performing procedures to assess the risks of material misstatement of the financial statements and financial highlights, whether due to error or fraud, and performing procedures that respond to those risks. Such procedures included examining, on a test basis, evidence regarding the amounts and disclosures in the financial statements and financial highlights. Our audit also included evaluating the accounting principles used and significant estimates made by management, as well as evaluating the overall presentation of the financial statements and financial highlights. Our procedures included confirmation of securities owned as of December 31, 2021, by correspondence with the custodian and brokers; when replies were not received from brokers, we performed other auditing procedures. We believe that our audit provides a reasonable basis for our opinion.
/s/ Deloitte & Touche LLP
Boston, Massachusetts
February 18, 2022
We have served as the auditor of one or more Calvert investment companies since 2021.
Calvert
VP Volatility Managed Moderate Growth Portfolio
December 31, 2021
Federal Tax Information (Unaudited)
As required by the Internal Revenue Code and/or regulations, shareholders must be notified regarding the status of capital gains dividends.
Capital Gains Dividends. The Fund hereby designates as a capital gain dividend with respect to the taxable year ended December 31, 2021, $2,341,828 or, if subsequently determined to be different, the net capital gain of such year.
Calvert
VP Volatility Managed Moderate Growth Portfolio
December 31, 2021
Management and Organization
Fund Management. The Directors of Calvert Variable Products, Inc. (the Corporation) are responsible for the overall management and supervision of the affairs of the Corporation. The Board members and officers of the Corporation are listed below. Except as indicated, each individual has held the office shown or other offices in the same company for the last five years. Board members hold indefinite terms of office. Each Board member holds office until his or her successor is elected and qualified, or until his or her earlier death, resignation, retirement, removal or disqualification. Under the terms of the Fund’s current Board member retirement policy, an Independent Board member must retire at the end of the calendar year in which he or she turns 75. However, if such retirement would cause the Fund to be out of compliance with Section 16 of the 1940 Act or any other regulations or guidance of the SEC, then such retirement will not become effective until such time as action has been taken for the Fund to be in compliance therewith. The “noninterested Directors” consist of those Directors who are not “interested persons” of the Corporation, as that term is defined under the 1940 Act. The business address of each Board member and the Chief Compliance Officer is 1825 Connecticut Avenue, NW, Suite 400, Washington, DC 20009 and the business address of the Secretary, Vice President and Chief Legal Officer and the Treasurer is Two International Place, Boston, Massachusetts 02110. As used below, “CRM” refers to Calvert Research and Management and “Eaton Vance” refers to Eaton Vance Management. Each Director oversees 39 funds in the Calvert fund complex. Effective March 1, 2021, each of Eaton Vance and CRM are indirect, wholly-owned subsidiaries of Morgan Stanley. Each officer affiliated with CRM may hold a position with other CRM affiliates that is comparable to his or her position with CRM listed below.
| Name and Year of Birth | Corporation
Position(s) | Length of
Service | Principal Occupation(s) and Other Directorships
During Past Five Years and Other Relevant Experience |
| Interested Director |
John H. Streur(1)
1960 | Director and
President | Since 2015 | President and Chief Executive Officer of CRM (since December 31, 2016). President and Chief Executive Officer of Calvert Investments, Inc.
(January 2015 - December 2016); Chief Executive Officer of Calvert
Investment Distributors, Inc. (August 2015 - December 2016); Chief
Compliance Officer of Calvert Investment Management, Inc. (August 2015 -
April 2016); President and Director, Portfolio 21 Investments, Inc.
(through October 2014); President, Chief Executive Officer and
Director, Managers Investment Group LLC (through January 2012);
President and Director, The Managers Funds and Managers AMG
Funds (through January 2012).
Other Directorships. Portfolio 21 Investments, Inc. (asset management)
(through October 2014); Managers Investment Group LLC (asset management)
(through January 2012); The Managers Funds (asset management)
(through January 2012); Managers AMG Funds (asset management)
(through January 2012); Calvert Impact Capital, Inc. |
| Noninterested Directors |
Richard L. Baird, Jr.
1948 | Director | Since 2016 | Regional Disaster Recovery Lead, American Red Cross of Greater
Pennsylvania (since 2017). Volunteer, American Red Cross (since 2015).
Former President and CEO of Adagio Health Inc. (retired in 2014) in
Pittsburgh, PA.
Other Directorships. None. |
Alice Gresham Bullock
1950 | Chair and
Director | Since 2016 (Chair);
Since 2008 (Director) | Professor Emerita at Howard University School of Law. Dean Emerita of
Howard University School of Law and Deputy Director of the Association
of American Law Schools (1992-1994).
Other Directorships. None. |
Cari M. Dominguez
1949 | Director | Since 2016 | Former Chair of the U.S. Equal Employment Opportunity Commission.
Other Directorships. ManpowerGroup Inc. (workforce solutions company);
Triple S Management Corporation (managed care); National Association of Corporate Directors. |
John G. Guffey, Jr.
1948 | Director | Since 2016 | President of Aurora Press Inc., a privately held publisher of trade
paperbacks (since January 1997).
Other Directorships. Calvert Impact Capital, Inc. (through
December 31, 2018); Calvert Ventures, LLC. |
Miles D. Harper, III
1962 | Director | Since 2016 | Partner, Carr Riggs & Ingram (public accounting firm) since October 2014.
Partner, Gainer Donnelly & Desroches (public accounting firm) (now Carr
Riggs & Ingram) (November 1999 - September 2014).
Other Directorships. Bridgeway Funds (9) (asset management). |
Joy V. Jones
1950 | Director | Since 2016 | Attorney.
Other Directorships. Palm Management Corporation. |
Calvert
VP Volatility Managed Moderate Growth Portfolio
December 31, 2021
Management and Organization — continued
| Name and Year of Birth | Corporation
Position(s) | Length of
Service | Principal Occupation(s) and Other Directorships
During Past Five Years and Other Relevant Experience |
| Noninterested Directors (continued) |
Anthony A. Williams
1951 | Director | Since 2016 | CEO and Executive Director of the Federal City Council (July 2012 to
present); Senior Adviser and Independent Consultant for King and
Spalding LLP (September 2015 to present); Executive Director of Global
Government Practice at the Corporate Executive Board (January 2010 to
January 2012).
Other Directorships. Freddie Mac; Evoq Properties/Meruelo Maddux
Properties, Inc. (real estate management); Weston Solutions, Inc.
(environmental services); Bipartisan Policy Center’s Debt Reduction Task Force;
Chesapeake Bay Foundation; Catholic University of America; Urban Institute (research organization); The Howard Hughes Corporation (real estate development). |
| Name and Year of Birth | Corporation
Position(s) | Length of
Service | Principal Occupation(s)
During Past Five Years |
| Principal Officers who are not Directors |
Hope L. Brown
1973 | Chief
Compliance
Officer | Since 2014 | Chief Compliance Officer of 39 registered investment companies advised
by CRM (since 2014). Vice President and Chief Compliance Officer,
Wilmington Funds (2012-2014). |
Deidre E. Walsh
1971 | Secretary,
Vice President
and Chief
Legal Officer | Since 2021 | Vice President of CRM and officer of 39 registered investment companies
advised by CRM (since 2021). Also Vice President of Eaton Vance and
certain of its affiliates and officer of 138 registered investment companies
advised or administered by Eaton Vance. |
James F. Kirchner
1967 | Treasurer | Since 2016 | Vice President of CRM and officer of 39 registered investment companies
advised by CRM (since 2016). Also Vice President of Eaton Vance and
certain of its affiliates and officer of 138 registered investment companies
advised or administered by Eaton Vance. |
| | | | |
| (1) Mr. Streur is an interested person of the Fund because of his positions with the Fund’s adviser and certain affiliates. |
The SAI for the Fund includes additional information about the Directors and officers of the Fund and can be obtained without charge on Calvert’s website at www.calvert.com or by calling 1-800-368-2745.
| FACTS | WHAT DOES EATON VANCE DO WITH YOUR
PERSONAL INFORMATION? |
| Why? | Financial companies choose how they share your personal information. Federal law gives consumers the right to limit some but not all sharing. Federal law also requires us to tell you how we collect, share, and protect your personal information. Please read this notice carefully to understand what we do. |
| |
| What? | The types of personal information we collect and share depend on the product or service you have with us. This information can include:■ Social Security number and income
■
investment experience and risk tolerance
■
checking account number and wire transfer instructions |
| |
| How? | All financial companies need to share customers’ personal information to run their everyday business. In the section below, we list the reasons financial companies can share their customers’ personal information; the reasons Eaton Vance chooses to share; and whether you can limit this sharing. |
Reasons we can share your
personal information | Does Eaton Vance
share? | Can you limit
this sharing? |
| For our everyday business purposes — such as to process your transactions, maintain your account(s), respond to court orders and legal investigations, or report to credit bureaus | Yes | No |
| For our marketing purposes — to offer our products and services to you | Yes | No |
| For joint marketing with other financial companies | No | We don’t share |
| For our investment management affiliates’ everyday business purposes — information about your transactions, experiences, and creditworthiness | Yes | Yes |
| For our affiliates’ everyday business purposes — information about your transactions and experiences | Yes | No |
| For our affiliates’ everyday business purposes — information about your creditworthiness | No | We don’t share |
| For our investment management affiliates to market to you | Yes | Yes |
| For our affiliates to market to you | No | We don’t share |
| For nonaffiliates to market to you | No | We don’t share |
To limit our
sharing | Call toll-free 1-800-368-2745 or email: CRMPrivacy@calvert.comPlease note:If you are a new customer, we can begin sharing your information 30 days from the date we sent this notice. When you are no longer our customer, we continue to share your information as described in this notice. However, you can contact us at any time to limit our sharing. |
| Questions? | Call toll-free 1-800-368-2745 or email: CRMPrivacy@calvert.com |
| Privacy Notice — continued | April 2021 |
| Who we are |
| Who is providing this notice? | Eaton Vance Management, Eaton Vance Distributors, Inc., Eaton Vance Trust Company, Eaton Vance Management (International) Limited, Eaton Vance Advisers International Ltd., Eaton Vance Global Advisors Limited, Eaton Vance Management’s Real Estate Investment Group, Boston Management and Research, Calvert Research and Management, Eaton Vance and Calvert Fund Families and our investment advisory affiliates (“Eaton Vance”) (see Investment Management Affiliates definition below) |
| What we do |
How does Eaton Vance
protect my personal
information? | To protect your personal information from unauthorized access and use, we use security measures that comply with federal law. These measures include computer safeguards and secured files and buildings. We have policies governing the proper handling of customer information by personnel and requiring third parties that provide support to adhere to appropriate security standards with respect to such information. |
How does Eaton Vance
collect my personal
information? | We collect your personal information, for example, when you■ open an account or make deposits or withdrawals from your account
■
buy securities from us or make a wire transfer
■
give us your contact informationWe also collect your personal information from others, such as credit bureaus, affiliates, or other companies. |
| Why can’t I limit all sharing? | Federal law gives you the right to limit only■ sharing for affiliates’ everyday business purposes — information about your creditworthiness
■
affiliates from using your information to market to you
■
sharing for nonaffiliates to market to youState laws and individual companies may give you additional rights to limit sharing. See below for more on your rights under state law. |
| Definitions |
Investment Management
Affiliates | Eaton Vance Investment Management Affiliates include registered investment advisers, registered broker- dealers, and registered and unregistered funds. Investment Management Affiliates does not include entities associated with Morgan Stanley Wealth Management, such as Morgan Stanley Smith Barney LLC and Morgan Stanley & Co. |
| Affiliates | Companies related by common ownership or control. They can be financial and nonfinancial companies.■ Our affiliates include companies with a Morgan Stanley name and financial companies such as Morgan Stanley Smith Barney LLC and Morgan Stanley & Co. |
| Nonaffiliates | Companies not related by common ownership or control. They can be financial and nonfinancial companies.■ Eaton Vance does not share with nonaffiliates so they can market to you. |
| Joint marketing | A formal agreement between nonaffiliated financial companies that together market financial products or services to you.■ Eaton Vance doesn’t jointly market. |
| Other important information |
| Vermont: Except as permitted by law, we will not share personal information we collect about Vermont residents with Nonaffiliates unless you provide us with your written consent to share such information.California: Except as permitted by law, we will not share personal information we collect about California residents with Nonaffiliates and we will limit sharing such personal information with our Affiliates to comply with California privacy laws that apply to us. |
Delivery of Shareholder Documents. The Securities and Exchange Commission (SEC) permits funds to deliver only one copy of shareholder documents, including prospectuses, proxy statements and shareholder reports, to fund investors with multiple accounts at the same residential or post office box address. This practice is often called “householding” and it helps eliminate duplicate mailings to shareholders. Calvert funds, or your financial intermediary, may household the mailing of your documents indefinitely unless you instruct Calvert funds, or your financial intermediary, otherwise. If you would prefer that your Calvert fund documents not be householded, please contact Calvert funds at 1-800-368-2745, or contact your financial intermediary. Your instructions that householding not apply to delivery of your Calvert fund documents will typically be effective within 30 days of receipt by Calvert funds or your financial intermediary. Separate statements will be generated for each separate account and will be householded as described above.
Portfolio Holdings. Each Calvert fund files a schedule of portfolio holdings on Part F to Form N-PORT with the SEC. Certain information filed on Form N-PORT may be viewed on the Calvert website at www.calvert.com, by calling Calvert at 1-800-368-2745 or in the EDGAR database on the SEC’s website at www.sec.gov.
Proxy Voting. The Proxy Voting Guidelines that each Calvert fund uses to determine how to vote proxies relating to portfolio securities is provided as an Appendix to the fund’s Statement of Additional Information. The Statement of Additional Information can be obtained free of charge by calling the Calvert funds at 1-800-368-2745, by visiting the Calvert funds’ website at www.calvert.com or visiting the SEC’s website at www.sec.gov. Information regarding how a Calvert fund voted proxies relating to portfolio securities during the most recent 12-month period ended June 30 is available by calling Calvert funds, by visiting the Calvert funds’ website at www.calvert.com or by visiting the SEC’s website at www.sec.gov.
This Page Intentionally Left Blank
Investment Adviser and Administrator
Calvert Research and Management
1825 Connecticut Avenue NW, Suite 400
Washington, DC 20009
Investment Sub-Adviser
Ameritas Investment Partners, Inc.
5945 R Street
Lincoln, NE 68505
Investment Sub-Adviser
Parametric Portfolio Associates LLC
800 Fifth Avenue, Suite 2800
Seattle, WA 98104
Principal Underwriter*
Eaton Vance Distributors, Inc.
Two International Place
Boston, MA 02110
(617) 482-8260
Custodian
State Street Bank and Trust Company
State Street Financial Center, One Lincoln Street
Boston, MA 02111
Transfer Agent
DST Asset Manager Solutions, Inc.
2000 Crown Colony Drive
Quincy, MA 02169
Independent Registered Public Accounting Firm
Deloitte & Touche LLP
200 Berkeley Street
Boston, MA 02116-5022
Fund Offices
1825 Connecticut Avenue NW, Suite 400
Washington, DC 20009
* FINRA BrokerCheck. Investors may check the background of their Investment Professional by contacting the Financial Industry Regulatory Authority (FINRA). FINRA BrokerCheck is a free tool to help investors check the professional background of current and former FINRA-registered securities firms and brokers. FINRA BrokerCheck is available by calling 1-800-289-9999 and at www.FINRA.org. The FINRA BrokerCheck brochure describing this program is available to investors at www.FINRA.org.
Printed on recycled paper.
24235 12.31.21
Calvert
VP Volatility Managed Growth Portfolio
Annual Report
December 31, 2021
Commodity Futures Trading Commission Registration. The Commodity Futures Trading Commission (“CFTC”) has adopted regulations that subject registered investment companies and advisers to regulation by the CFTC if a fund invests more than a prescribed level of its assets in certain CFTC-regulated instruments (including futures, certain options and swap agreements) or markets itself as providing investment exposure to such instruments. The adviser has claimed an exclusion from the definition of “commodity pool operator” under the Commodity Exchange Act with respect to its management of the Fund and the other funds it manages. Accordingly, neither the Fund nor the adviser is subject to CFTC regulation.
Fund shares are not insured by the FDIC and are not deposits or other obligations of, or guaranteed by, any depository institution. Shares are subject to investment risks, including possible loss of principal invested.
This report must be preceded or accompanied by a current summary prospectus or prospectus. Before investing, investors should consider carefully the investment objective, risks, and charges and expenses of a mutual fund. This and other important information is contained in the summary prospectus and prospectus, which can be obtained from a financial intermediary. Prospective investors should read the prospectus carefully before investing. For further information, please call 1-800-368-2745.
Annual Report December 31, 2021
Calvert
VP Volatility Managed Growth Portfolio
Calvert
VP Volatility Managed Growth Portfolio
December 31, 2021
Management's Discussion of Fund Performance†
Economic and Market Conditions
The 12-month period starting January 1, 2021, was notable for a global equity rally that lasted for most of the period. Investors cheered the reopening of businesses that had been affected by the pandemic and the rollout of highly effective COVID-19 vaccines. In contrast, fixed-income returns were generally weak during the period.
COVID-19 continued to have a grip on the global economy. Disease rates advanced and declined with new waves of infections worldwide. Worker shortages led to global supply-chain disruptions. Scarcities of key items led to temporary factory shutdowns and empty store shelves. In the U.S., those shortages — combined with high demand from consumers eager to spend money saved earlier in the pandemic — led to higher year-over-year inflation than had been seen in decades.
Early in the period while stock prices climbed, credit spreads tightened, and long-term U.S. Treasury yields rose as the U.S. dollar weakened. In the first quarter, the Bloomberg U.S. Aggregate Bond Index posted its worst quarterly return in 40 years. In the second quarter, fixed-income markets revived as the U.S. Treasury yield curve flattened.
In September, equity indexes worldwide reported negative returns. In the U.S., weak job creation and the U.S. Federal Reserve’s (the Fed’s) announcement that it might soon begin tapering its monthly bond purchases and possibly raise interest rates in 2022 weighed on U.S. stocks. However, in the final quarter of 2021, stock prices came roaring back as the central bank’s actions to tamp down inflation were applauded by investors. Even the emergence of a new COVID-19 variant caused only a temporary market retreat.
Meanwhile, the Fed’s tightening monetary policy caused a further flattening of the Treasury curve. During the fourth quarter, investment-grade corporate credit spreads widened modestly and high yield bond spreads tightened, leaving the Bloomberg U.S. Aggregate Bond Index essentially flat for the quarter.
For the period as a whole, the MSCI World Index returned 21.82%; the S&P 500® Index returned 28.71%; and the Nasdaq Composite Index returned 22.18%. In fixed-income, the Bloomberg U.S. Corporate Bond Index returned (1.04)%, while the ICE BofA U.S. High Yield Index gained 5.36%.
Investment Strategy
Calvert VP Volatility Managed Growth Portfolio (the Fund) invests in exchange-traded funds (ETFs) representing a broad range of asset classes. The Fund uses a macro strategy that entails setting an asset-allocation target weight, along with a typical allocation range. Market capitalizations, investment styles, and business sectors are among the variables considered when securities are selected for the Fund. Target asset weights may change periodically based on economic conditions and other factors. The Fund implements a volatility-management and capital-protection strategy that uses equity index futures contracts to try to keep the portfolio’s volatility range close to 12% to pursue growth in up markets, and to serve as a hedge against potential declines in the value of the Fund’s ETF investments. The Fund continuously monitors market volatility and may adjust its futures contracts to pursue its financial goals.
Fund Performance
For the 12-month period ended December 31, 2021, Calvert VP Volatility Managed Growth Portfolio (the Fund) returned 15.87% for Class F shares at net asset value (NAV), outperforming its primary benchmark, the S&P Global LargeMidCap Managed Risk Index – Moderate Aggressive (the Index), which returned 14.49%.
Outperformance relative to the Index during the period was the result of asset allocation strategies. The Index is used to capture the impact of the Fund’s volatility-management strategy. Fund performance is also measured against a blended benchmark (the Secondary Blended Index) based on a mix of market indexes that more closely reflects the impact of the Fund’s asset allocations than the single asset-class Index. During the period, the Fund underperformed the Secondary Blended Index, which returned 17.57%.
Through most of 2021, the volatility range of the Fund’s underlying assets was generally below its 12% target and averaged 9.8% for the full year. The Fund held a short equity position through the beginning of June and flipped to a mostly long position for the remainder of the year. As a result, the strategy helped raise the Fund’s annualized volatility rate to 10.1%, a 0.3% improvement.
The strategy had a choppy impact on returns and produced a slight net performance loss during the period. Through the first five months, forward volatility estimates tended to be above target and the strategy took net short positions in equity futures. During this time, however, equities rallied and the strategy detracted 1.4% from the performance of the Fund. In September, positioning was flipped, but the net performance result was similar. The strategy had the largest long average monthly position for the period in September and — combined with the equity sell-off — resulted in a 0.6% loss at the Fund level. Cumulatively, the strategy detracted 1.37% from the Fund in 2021.
See Endnotes and Additional Disclosures in this report.
Past performance is no guarantee of future results. Returns are historical and are calculated by determining the percentage change in net asset value (NAV) or offering price (as applicable) with all distributions reinvested. Investment return and principal value will fluctuate so that shares, when redeemed, may be worth more or less than their original cost. Performance for periods less than or equal to one year is cumulative. Performance is for the stated time period only; due to market volatility, current Fund performance may be lower or higher than the quoted return.
Calvert
VP Volatility Managed Growth Portfolio
December 31, 2021
Management's Discussion of Fund Performance† — continued
The Fund's overall underperformance to the Secondary Blended Index was due to volatility management. In contrast, asset allocation had a modest positive effect on relative performance. The Fund outperformed in the first quarter because of overweight exposures to small-cap and mid-cap stocks as well as an exposure to the financials sector. In the fourth quarter, the Fund had a modestly overweight exposure to large-cap growth stocks, which outperformed the broad market during the period.
See Endnotes and Additional Disclosures in this report.
Past performance is no guarantee of future results. Returns are historical and are calculated by determining the percentage change in net asset value (NAV) or offering price (as applicable) with all distributions reinvested. Investment return and principal value will fluctuate so that shares, when redeemed, may be worth more or less than their original cost. Performance for periods less than or equal to one year is cumulative. Performance is for the stated time period only; due to market volatility, current Fund performance may be lower or higher than the quoted return.
Calvert
VP Volatility Managed Growth Portfolio
December 31, 2021
Performance
Portfolio Manager(s) Kevin L. Keene, CFA of Ameritas Investment Partners, Inc.; Thomas B. Lee, CFA and Christopher Haskamp, CFA, each of Parametric Portfolio Associates LLC
| % Average Annual Total Returns1,2 | Class
Inception Date | Performance
Inception Date | One Year | Five Years | Since
Inception |
| Class F at NAV | 04/30/2013 | 04/30/2013 | 15.87% | 8.82% | 6.66% |
|
| S&P Global LargeMidCap Managed Risk Index - Moderate Aggressive | — | — | 14.49% | 10.69% | 7.61% |
| Growth Portfolio Blended Benchmark | — | — | 17.57 | 13.21 | 10.84 |
| % Total Annual Operating Expense Ratios3 | Class F |
| Gross | 1.00% |
| Net | 0.90 |
Growth of $10,0001
This graph shows the change in value of a hypothetical investment of $10,000 in Class F of the Fund for the period indicated. For comparison, the same investment is shown in the indicated index.
See Endnotes and Additional Disclosures in this report.
Past performance is no guarantee of future results. Returns are historical and are calculated by determining the percentage change in net asset value (NAV) or offering price (as applicable) with all distributions reinvested. Investment return and principal value will fluctuate so that shares, when redeemed, may be worth more or less than their original cost. Performance for periods less than or equal to one year is cumulative. Performance is for the stated time period only; due to market volatility, current Fund performance may be lower or higher than the quoted return.
Calvert
VP Volatility Managed Growth Portfolio
December 31, 2021
Asset Allocation (% of total investments)
| Top 10 Holdings (% of net assets)* | |
| Vanguard S&P 500 ETF | 22.1% |
| iShares S&P 500 Growth ETF | 16.3 |
| Vanguard FTSE Developed Markets ETF | 14.5 |
| iShares Core U.S. Aggregate Bond ETF | 13.7 |
| iShares S&P 500 Value ETF | 13.6 |
| Vanguard REIT ETF | 4.2 |
| iShares Russell 2000 ETF | 3.0 |
| Vanguard FTSE Emerging Markets ETF | 2.3 |
| iShares Core S&P Mid-Cap ETF | 2.0 |
| Technology Select Sector SPDR Fund | 0.7 |
| Total | 92.4% |
| * | Excludes cash and cash equivalents. |
Calvert
VP Volatility Managed Growth Portfolio
December 31, 2021
Endnotes and Additional Disclosures
| † | The views expressed in this report are those of the portfolio manager(s) and are current only through the date stated at the top of this page. These views are subject to change at any time based upon market or other conditions, and Calvert and the Fund(s) disclaim any responsibility to update such views. These views may not be relied upon as investment advice and, because investment decisions are based on many factors, may not be relied upon as an indication of trading intent on behalf of any Calvert fund. This commentary may contain statements that are not historical facts, referred to as “forward-looking statements.” The Fund’s actual future results may differ significantly from those stated in any forward-looking statement, depending on factors such as changes in securities or financial markets or general economic conditions, the volume of sales and purchases of Fund shares, the continuation of investment advisory, administrative and service contracts, and other risks discussed from time to time in the Fund’s filings with the Securities and Exchange Commission. |
| | |
| 1 | S&P Global LargeMidCap Managed Risk Index - Moderate Aggressive is an unmanaged index designed to simulate a dynamic protective portfolio that allocates between the underlying equity index and cash, based on realized volatilities of the underlying equity and bond indices, while maintaining a fixed 20% allocation to the underlying bond index. The index has a risk management overlay that seeks to limit the index volatility to 14%, and includes a synthetic put position to reduce downside risk. The launch date of the S&P Global LargeMidCap Managed Risk Index - Moderate Aggressive was September 6, 2016; information presented prior to the index launch date is back-tested. Back-tested performance is not actual performance, but is hypothetical. The back-test calculations are based on the same methodology that was in effect when the index was officially launched. S&P Dow Jones Indices are a product of S&P Dow Jones Indices LLC (“S&P DJI”) and have been licensed for use. S&P® and S&P 500® are registered trademarks of S&P DJI; Dow Jones® is a registered trademark of Dow Jones Trademark Holdings LLC (“Dow Jones”); S&P DJI, Dow Jones and their respective affiliates do not sponsor, endorse, sell or promote the Fund, will not have any liability with respect thereto and do not have any liability for any errors, omissions, or interruptions of the S&P Dow Jones Indices. Russell 3000® Index is an unmanaged index of the 3,000 largest U.S. stocks. Bloomberg U.S. Aggregate Bond Index is an unmanaged index of domestic investment-grade bonds, including corporate, government and mortgage-backed securities. MSCI EAFE Index is an unmanaged index of equities in the developed markets, excluding the U.S. and Canada. MSCI USA IMI/Equity REITs Index is an unmanaged index of U.S. equity REITs. MSCI indexes are net of foreign withholding taxes. Source: MSCI. MSCI data may not be reproduced or used for any other purpose. MSCI provides no warranties, has not prepared or approved this report, and has no |
| | liability hereunder. ICE BofA 3-Month U.S. Treasury Bill Index is an unmanaged index of U.S. Treasury securities maturing in 90 days. ICE® BofA® indices are not for redistribution or other uses; provided “as is”, without warranties, and with no liability. Eaton Vance has prepared this report and ICE Data Indices, LLC does not endorse it, or guarantee, review, or endorse Eaton Vance’s products. BofA® is a licensed registered trademark of Bank of America Corporation in the United States and other countries. Growth Portfolio Blended Benchmark is an internally constructed benchmark which is comprised of a blend of 58% Russell 3000® Index, 18% Bloomberg U.S. Aggregate Bond Index, 16% MSCI EAFE Index, 4% ICE BofA 3-Month U.S. Treasury Bill Index, and 4% MSCI USA IMI/Equity REITs Index, which is rebalanced monthly. Unless otherwise stated, index returns do not reflect the effect of any applicable sales charges, commissions, expenses, taxes or leverage, as applicable. It is not possible to invest directly in an index. |
| 2 | There is no sales charge. Insurance-related charges are not included in the calculation of returns. If such charges were reflected, the returns would be lower. Please refer to the report for your insurance contract for performance data reflecting insurance-related charges. Performance since inception for an index, if presented, is the performance since the Fund’s or oldest share class’ inception, as applicable.Calvert Research and Management became the investment adviser to the Fund on December 31, 2016. Performance reflected prior to such date is that of the Fund’s former investment adviser. |
| 3 | Source: Fund prospectus. Net expense ratio reflects a contractual expense reimbursement that continues through 4/30/22. The expense ratios for the current reporting period can be found in the Financial Highlights section of this report. Performance reflects expenses waived and/or reimbursed, if applicable. Without such waivers and/or reimbursements, performance would have been lower. |
| Fund profile subject to change due to active management. |
| | Additional Information |
| | Yield curve is a graphical representation of the yields offered by bonds of various maturities. The yield curve flattens when long-term interest rates fall and/or short-term interest rates increase, and the yield curve steepens when long-term interest rates increase and/or short-term interest rates fall. |
| | MSCI World Index is an unmanaged index of equity securities in the developed markets. S&P 500® Index is an unmanaged index of large-cap stocks commonly used as a measure of U.S. stock market performance. Nasdaq Composite Index is a market capitalization-weighted index of all domestic and international securities listed on Nasdaq. Source: Nasdaq, Inc. The information is provided by Nasdaq |
Calvert
VP Volatility Managed Growth Portfolio
December 31, 2021
Endnotes and Additional Disclosures — continued
(with its affiliates, are referred to as the “Corporations”) and Nasdaq’s third party licensors on an “as is” basis and the Corporations make no guarantees and bear no liability of any kind with respect to the information or the Fund. Bloomberg U.S. Corporate Bond Index measures the performance of investment-grade U.S. corporate securities with a maturity of one year or more. ICE BofA U.S. High Yield Index is an unmanaged index of below-investment grade U.S. corporate bonds.
Calvert
VP Volatility Managed Growth Portfolio
December 31, 2021
Example
As a Fund shareholder, you incur ongoing costs, including management fees; distribution and/or service fees; and other Fund expenses. This Example is intended to help you understand your ongoing costs (in dollars) of Fund investing and to compare these costs with the ongoing costs of investing in other mutual funds. The Example is based on an investment of $1,000 invested at the beginning of the period and held for the entire period (July 1, 2021 to December 31, 2021).
Actual Expenses
The first line of the table below provides information about actual account values and actual expenses. You may use the information in this line, together with the amount you invested, to estimate the expenses that you paid over the period. Simply divide your account value by $1,000 (for example, an $8,600 account value divided by $1,000 = 8.6), then multiply the result by the number in the first line under the heading entitled “Expenses Paid During Period” to estimate the expenses you paid on your account during this period.
Hypothetical Example for Comparison Purposes
The second line of the table below provides information about hypothetical account values and hypothetical expenses based on the actual Fund expense ratio and an assumed rate of return of 5% per year (before expenses), which is not the actual Fund return. The hypothetical account values and expenses may not be used to estimate the actual ending account balance or expenses you paid for the period. You may use this information to compare the ongoing costs of investing in the Fund and other funds. To do so, compare this 5% hypothetical example with the 5% hypothetical examples that appear in the shareholder reports of the other funds.
Please note that the expenses shown in the table are meant to highlight your ongoing costs only and do not reflect expenses and charges which are, or may be imposed under the variable annuity contract or variable life insurance policy (variable contracts) (if applicable) or qualified pension or retirement plans (Qualified Plans) through which your investment in the Fund is made. Therefore, the second line of the table is useful in comparing ongoing costs associated with an investment in vehicles which fund benefits under variable contracts and Qualified Plans, and will not help you determine the relative total costs of investing in the Fund through variable contracts or Qualified Plans. In addition, if these expenses and charges imposed under the variable contracts or Qualified Plans were included, your costs would have been higher.
| | Beginning
Account Value
(7/1/21) | Ending
Account Value
(12/31/21) | Expenses Paid
During Period*
(7/1/21 – 12/31/21) | Annualized
Expense
Ratio |
| Actual | | | | |
| Class F | $1,000.00 | $1,059.60 | $4.20 ** | 0.81% |
| Hypothetical | | | | |
| (5% return per year before expenses) | | | | |
| Class F | $1,000.00 | $1,021.12 | $4.13 ** | 0.81% |
| * | Expenses are equal to the Fund's annualized expense ratio, multiplied by the average account value over the period, multiplied by 184/365 (to reflect the one-half year period). The Example assumes that the $1,000 was invested at the net asset value per share determined at the close of business on June 30, 2021. Expenses shown do not include insurance-related charges or direct expenses of Qualified Plans. Expenses do not include fees and expenses incurred indirectly from investment in underlying affiliated and/or unaffiliated funds. |
| ** | Absent a waiver and/or reimbursement of expenses by an affiliate, expenses would be higher. |
Calvert
VP Volatility Managed Growth Portfolio
December 31, 2021
| Exchange-Traded Funds — 92.4% |
| Security | Shares | Value |
| Equity Funds — 78.7% | |
| iShares Core S&P Mid-Cap ETF | | 10,000 | $ 2,830,800 |
| iShares Russell 2000 ETF(1) | | 19,000 | 4,226,550 |
| iShares S&P 500 Growth ETF | | 277,000 | 23,176,590 |
| iShares S&P 500 Value ETF | | 123,000 | 19,265,490 |
| Technology Select Sector SPDR Fund | | 6,000 | 1,043,220 |
| Vanguard FTSE Developed Markets ETF(1) | | 402,000 | 20,526,120 |
| Vanguard FTSE Emerging Markets ETF(1) | | 67,000 | 3,313,820 |
| Vanguard REIT ETF | | 51,000 | 5,916,510 |
| Vanguard S&P 500 ETF | | 72,000 | 31,433,040 |
| | | | $111,732,140 |
| Fixed-Income Funds — 13.7% | |
| iShares Core U.S. Aggregate Bond ETF | | 170,000 | $ 19,393,600 |
| | | | $ 19,393,600 |
Total Exchange-Traded Funds
(identified cost $77,521,230) | | | $131,125,740 |
| Short-Term Investments — 9.9% | | | |
| Affiliated Fund — 7.6% |
| Description | Units | Value |
| Calvert Cash Reserves Fund, LLC, 0.06%(2) | | 10,804,372 | $ 10,804,372 |
Total Affiliated Fund
(identified cost $10,804,338) | | | $ 10,804,372 |
| Securities Lending Collateral — 2.3% |
| Security | Shares | Value |
| State Street Navigator Securities Lending Government Money Market Portfolio, 0.03%(3) | | 3,265,763 | $ 3,265,763 |
Total Securities Lending Collateral
(identified cost $3,265,763) | | | $ 3,265,763 |
Total Short-Term Investments
(identified cost $14,070,101) | | | $ 14,070,135 |
Total Investments — 102.3%
(identified cost $91,591,331) | | | $145,195,875 |
| Other Assets, Less Liabilities — (2.3)% | | | $ (3,262,449) |
| Net Assets — 100.0% | | | $ 141,933,426 |
| The percentage shown for each investment category in the Schedule of Investments is based on net assets. |
| (1) | All or a portion of this security was on loan at December 31, 2021. The aggregate market value of securities on loan at December 31, 2021 was $27,687,894. |
| (2) | Affiliated investment company, available to Calvert portfolios and funds, which invests in high quality, U.S. dollar denominated money market instruments. The rate shown is the annualized seven-day yield as of December 31, 2021. |
| (3) | Represents investment of cash collateral received in connection with securities lending. |
9
See Notes to Financial Statements.
Calvert
VP Volatility Managed Growth Portfolio
December 31, 2021
Schedule of Investments — continued
Futures Contracts
| Description | Number of
Contracts | Position | Expiration
Date | Notional
Amount | Value/
Unrealized
Appreciation
(Depreciation) |
| Equity Futures | | | | | |
| E-mini S&P 500 Index | (19) | Short | 3/18/22 | $(4,520,575) | $ (115,863) |
| E-mini S&P MidCap 400 Index | (5) | Short | 3/18/22 | (1,418,850) | (47,404) |
| MSCI EAFE Index | (15) | Short | 3/18/22 | (1,741,350) | (35,481) |
| | | | | | $(198,748) |
10
See Notes to Financial Statements.
Calvert
VP Volatility Managed Growth Portfolio
December 31, 2021
Statement of Assets and Liabilities
| | December 31, 2021 |
| Assets | |
Investments in securities of unaffiliated issuers, at value (identified cost $80,786,993) - including
$27,687,894 of securities on loan | $ 134,391,503 |
| Investments in securities of affiliated issuers, at value (identified cost $10,804,338) | 10,804,372 |
| Receivable for variation margin on open futures contracts | 13,453 |
| Deposits at broker for futures contracts | 396,000 |
| Dividends receivable - affiliated | 577 |
| Securities lending income receivable | 4,205 |
| Directors' deferred compensation plan | 38,165 |
| Total assets | $145,648,275 |
| Liabilities | |
| Payable for capital shares redeemed | $ 276,632 |
| Deposits for securities loaned | 3,265,763 |
| Payable to affiliates: | |
| Investment advisory fee | 47,699 |
| Administrative fee | 14,310 |
| Distribution and service fees | 29,812 |
| Sub-transfer agency fee | 14 |
| Directors' deferred compensation plan | 38,165 |
| Other | 7,903 |
| Accrued expenses | 34,551 |
| Total liabilities | $ 3,714,849 |
| Net Assets | $141,933,426 |
| Sources of Net Assets | |
| Paid-in capital | $ 87,108,662 |
| Distributable earnings | 54,824,764 |
| Net Assets | $141,933,426 |
| Class F Shares | |
| Net Assets | $ 141,933,426 |
| Shares Outstanding | 5,931,724 |
Net Asset Value, Offering Price and Redemption Price Per Share
(net assets ÷ shares of beneficial interest outstanding) | $ 23.93 |
11
See Notes to Financial Statements.
Calvert
VP Volatility Managed Growth Portfolio
December 31, 2021
| | Year Ended |
| | December 31, 2021 |
| Investment Income | |
| Dividend income | $ 2,202,677 |
| Dividend income - affiliated issuers | 6,697 |
| Securities lending income, net | 31,290 |
| Total investment income | $ 2,240,664 |
| Expenses | |
| Investment advisory fee | $ 559,518 |
| Administrative fee | 167,855 |
| Distribution and service fees | 349,699 |
| Directors' fees and expenses | 5,669 |
| Custodian fees | 8,773 |
| Transfer agency fees and expenses | 103,016 |
| Accounting fees | 31,512 |
| Professional fees | 28,092 |
| Reports to shareholders | 2,775 |
| Miscellaneous | 8,569 |
| Total expenses | $ 1,265,478 |
| Waiver and/or reimbursement of expenses by affiliate | $ (132,078) |
| Net expenses | $ 1,133,400 |
| Net investment income | $ 1,107,264 |
| Realized and Unrealized Gain (Loss) | |
| Net realized gain (loss): | |
| Investment securities | $ 8,251,575 |
| Investment securities - affiliated issuers | (826) |
| Futures contracts | (2,275,119) |
| Net realized gain | $ 5,975,630 |
| Change in unrealized appreciation (depreciation): | |
| Investment securities | $ 13,470,867 |
| Investment securities - affiliated issuers | 34 |
| Futures contracts | (11,754) |
| Net change in unrealized appreciation (depreciation) | $13,459,147 |
| Net realized and unrealized gain | $19,434,777 |
| Net increase in net assets from operations | $20,542,041 |
12
See Notes to Financial Statements.
Calvert
VP Volatility Managed Growth Portfolio
December 31, 2021
Statements of Changes in Net Assets
| | Year Ended December 31, |
| | 2021 | 2020 |
| Increase (Decrease) in Net Assets | | |
| From operations: | | |
| Net investment income | $ 1,107,264 | $ 1,359,323 |
| Net realized gain (loss) | 5,975,630 | (4,196,743) |
| Net change in unrealized appreciation (depreciation) | 13,459,147 | 4,917,754 |
| Net increase in net assets from operations | $ 20,542,041 | $ 2,080,334 |
| Distributions to shareholders | $ (1,356,418) | $ (2,223,798) |
| Net decrease in net assets from capital share transactions | $ (13,456,309) | $ (15,035,226) |
| Net increase (decrease) in net assets | $ 5,729,314 | $ (15,178,690) |
| Net Assets | | |
| At beginning of year | $ 136,204,112 | $ 151,382,802 |
| At end of year | $141,933,426 | $136,204,112 |
13
See Notes to Financial Statements.
Calvert
VP Volatility Managed Growth Portfolio
December 31, 2021
| | Class F |
| | Year Ended December 31, |
| | 2021 | 2020 | 2019 | 2018 | 2017 |
| Net asset value — Beginning of year | $ 20.86 | $ 20.77 | $ 17.67 | $ 19.31 | $ 16.70 |
| Income (Loss) From Operations | | | | | |
| Net investment income(1) | $ 0.18 | $ 0.20 | $ 0.29 | $ 0.25 | $ 0.23 |
| Net realized and unrealized gain (loss) | 3.12 | 0.22 | 3.08 | (1.68) | 2.59 |
| Total income (loss) from operations | $ 3.30 | $ 0.42 | $ 3.37 | $ (1.43) | $ 2.82 |
| Less Distributions | | | | | |
| From net investment income | $ (0.23) | $ (0.33) | $ (0.27) | $ (0.21) | $ (0.21) |
| Total distributions | $ (0.23) | $ (0.33) | $ (0.27) | $ (0.21) | $ (0.21) |
| Net asset value — End of year | $ 23.93 | $ 20.86 | $ 20.77 | $ 17.67 | $ 19.31 |
| Total Return(2) | 15.87% | 2.15% | 19.22% | (7.50)% | 16.92% |
| Ratios/Supplemental Data | | | | | |
| Net assets, end of year (000’s omitted) | $141,933 | $136,204 | $151,383 | $150,047 | $156,279 |
| Ratios (as a percentage of average daily net assets):(3)(4) | | | | | |
| Total expenses | 0.90% | 0.93% | 0.89% | 0.87% | 0.87% |
| Net expenses | 0.81% | 0.83% | 0.83% | 0.83% | 0.83% |
| Net investment income | 0.79% | 1.00% | 1.48% | 1.32% | 1.25% |
| Portfolio Turnover | 7% | 13% | 7% | 13% | 7% |
| (1) | Computed using average shares outstanding. |
| (2) | Returns are historical and are calculated by determining the percentage change in net asset value with all distributions reinvested and do not reflect fees and expenses imposed by variable annuity contracts or variable life insurance policies. If included, total return would be lower. |
| (3) | Total expenses do not reflect amounts reimbursed and/or waived by the adviser and certain of its affiliates, if applicable. Net expenses are net of all reductions and represent the net expenses paid by the Fund. |
| (4) | Amounts do not include the expenses of the Underlying Funds. |
14
See Notes to Financial Statements.
Calvert
VP Volatility Managed Growth Portfolio
December 31, 2021
Notes to Financial Statements
1 Significant Accounting Policies
Calvert VP Volatility Managed Growth Portfolio (the Fund) is a diversified series of Calvert Variable Products, Inc. (the Corporation). The Corporation is a Maryland corporation registered under the Investment Company Act of 1940, as amended (the 1940 Act), as an open-end management investment company. The investment objective of the Fund is to pursue growth potential and some current income, while seeking to manage overall portfolio volatility. The Fund invests primarily in exchange-traded funds representing a broad range of asset classes (the Underlying Funds).
Shares of the Fund are sold without sales charge to insurance companies for allocation to certain of their variable separate accounts and to qualified pension and retirement plans and other eligible investors. The Fund offers Class F shares.
The Fund applies the accounting and reporting guidance in the Financial Accounting Standards Board (FASB) Accounting Standards Codification Topic 946, Financial Services – Investment Companies (ASC 946). Subsequent events, if any, through the date that the financial statements were issued have been evaluated in the preparation of the financial statements.
A Investment Valuation— Net asset value per share is determined every business day as of the close of the regular session of the New York Stock Exchange (generally 4:00 p.m. Eastern time). The Fund uses independent pricing services approved by the Board of Directors (the Board) to value its investments wherever possible. Investments for which market quotations are not available or deemed not reliable are fair valued in good faith under the direction of the Board.
U.S. generally accepted accounting principles (U.S. GAAP) establishes a disclosure hierarchy that categorizes the inputs to valuation techniques used to value assets and liabilities at measurement date. These inputs are summarized in the three broad levels listed below:
Level 1 - quoted prices in active markets for identical securities
Level 2 - other significant observable inputs (including quoted prices for similar securities, interest rates, prepayment speeds, credit risk, etc.)
Level 3 - significant unobservable inputs (including the Fund’s own assumptions in determining the fair value of investments)
The inputs or methodologies used for valuing securities are not necessarily an indication of the risk associated with investing in those securities.
Valuation techniques used to value the Fund’s investments by major category are as follows:
Securities. Exchange-traded funds are valued at the official closing price as reported by an independent pricing service on the primary market or exchange on which they are traded and are categorized as Level 1 in the hierarchy. Investments in registered investment companies (including money market funds) that do not trade on an exchange are valued at the net asset value per share on the valuation day and are categorized as Level 1 in the hierarchy.
Affiliated Fund. The Fund may invest in Calvert Cash Reserves Fund, LLC (Cash Reserves Fund), an affiliated investment company managed by Calvert Research and Management (CRM). While Cash Reserves Fund is not a registered money market mutual fund, it conducts all of its investment activities in accordance with the requirements of Rule 2a-7 under the 1940 Act. Investments in Cash Reserves Fund are valued at the closing net asset value per unit on the valuation day and are categorized as Level 2 in the hierarchy. Cash Reserves Fund generally values its investment securities based on available market quotations provided by a third party pricing service.
Derivatives. Futures contracts are valued at unrealized appreciation (depreciation) based on the settlement price established each day by the board of trade or exchange on which they are traded and are categorized as Level 1 in the hierarchy.
Fair Valuation. If a market value cannot be determined for a security using the methodologies described above, or if, in the good faith opinion of the Fund's adviser, the market value does not constitute a readily available market quotation, or if a significant event has occurred that would materially affect the value of the security, the security will be fair valued as determined in good faith by or at the direction of the Board in a manner that most fairly reflects the security’s “fair value”, which is the amount that the Fund might reasonably expect to receive for the security upon its current sale in the ordinary course. Each such determination is based on a consideration of relevant factors, which are likely to vary from one pricing context to another. These factors may include, but are not limited to, the type of security, the existence of any contractual restrictions on the security’s disposition, the price and extent of public trading in similar securities of the issuer or of comparable companies or entities, quotations or relevant information obtained from broker/dealers or other market participants, information obtained from the issuer, analysts, and/or the appropriate stock exchange (for exchange-traded securities), an analysis of the company’s or entity’s financial statements, and an evaluation of the forces that influence the issuer and the market(s) in which the security is purchased and sold.
The values assigned to fair value investments are based on available information and do not necessarily represent amounts that might ultimately be realized. Further, due to the inherent uncertainty of valuations of such investments, the fair values may differ significantly from the values that would have been used had an active market existed, and the differences could be material.
Calvert
VP Volatility Managed Growth Portfolio
December 31, 2021
Notes to Financial Statements — continued
The following table summarizes the market value of the Fund's holdings as of December 31, 2021, based on the inputs used to value them:
| Asset Description | Level 1 | Level 2 | Level 3 | Total |
| Exchange-Traded Funds | $ 131,125,740 | $ — | $ — | $ 131,125,740 |
| Short-Term Investments: | | | | |
| Affiliated Fund | — | 10,804,372 | — | 10,804,372 |
| Securities Lending Collateral | 3,265,763 | — | — | 3,265,763 |
| Total Investments | $134,391,503 | $10,804,372 | $ — | $145,195,875 |
| Liability Description | | | | |
| Futures Contracts | $ (198,748) | $ — | $ — | $ (198,748) |
| Total | $ (198,748) | $ — | $ — | $ (198,748) |
B Investment Transactions and Income— Investment transactions for financial statement purposes are accounted for on trade date. Realized gains and losses are recorded on an identified cost basis and may include proceeds from litigation. Distributions from the Underlying Funds and Cash Reserves Fund are recorded on ex-dividend date. Distributions received that represent a return of capital are recorded as a reduction of cost of investments. Distributions received that represent a capital gain are recorded as a realized gain. Expenses included in the accompanying financial statements reflect the expenses of the Fund and do not include any expenses associated with the Underlying Funds.
C Futures Contracts— The Fund may enter into futures contracts to buy or sell a financial instrument for a set price at a future date. Initial margin deposits of either cash or securities as required by the broker are made upon entering into the contract. While the contract is open, daily variation margin payments are made to or received from the broker reflecting the daily change in market value of the contract and are recorded for financial reporting purposes as unrealized gains or losses by the Fund. When a futures contract is closed, a realized gain or loss is recorded equal to the difference between the opening and closing value of the contract. The risks associated with entering into futures contracts may include the possible illiquidity of the secondary market which would limit the Fund’s ability to close out a futures contract prior to the settlement date, an imperfect correlation between the value of the contracts and the underlying financial instruments, or that the counterparty will fail to perform its obligations under the contracts’ terms. Futures contracts are designed by boards of trade, which are designated “contracts markets” by the Commodities Futures Trading Commission. Futures contracts trade on the contracts markets in a manner that is similar to the way a stock trades on a stock exchange, and the boards of trade, through their clearing corporations, guarantee the futures contracts against default. As a result, there is minimal counterparty credit risk to the Fund.
D Distributions to Shareholders— Distributions to shareholders are recorded by the Fund on ex-dividend date. The Fund distributes any net investment income and net realized capital gains at least annually. Both types of distributions are made in shares of the Fund unless an election is made on behalf of a separate account to receive some or all of the distributions in cash. Distributions are determined in accordance with income tax regulations, which may differ from U.S. GAAP; accordingly, periodic reclassifications are made within the Fund's capital accounts to reflect income and gains available for distribution under income tax regulations.
E Estimates— The preparation of financial statements in conformity with U.S. GAAP requires management to make estimates and assumptions that affect the reported amounts of assets and liabilities and disclosure of contingent assets and liabilities at the date of the financial statements and the reported amounts of increases and decreases in net assets from operations during the reporting period. Actual results could differ from those estimates.
F Indemnifications— The Corporation’s By-Laws provide for indemnification for Directors or officers of the Corporation and certain other parties, to the fullest extent permitted by Maryland law and the 1940 Act, provided certain conditions are met. Additionally, in the normal course of business, the Fund enters into agreements with service providers that may contain indemnification clauses. The Fund’s maximum exposure under these arrangements is unknown as this would involve future claims that may be made against the Fund that have not yet occurred.
G Federal Income Taxes— No provision for federal income or excise tax is required since the Fund intends to continue to qualify as a regulated investment company under the Internal Revenue Code and to distribute substantially all of its taxable earnings.
Management has analyzed the Fund's tax positions taken for all open federal income tax years and has concluded that no provision for federal income tax is required in the Fund's financial statements. A Fund's federal tax return is subject to examination by the Internal Revenue Service for a period of three years from the date of filing.
Calvert
VP Volatility Managed Growth Portfolio
December 31, 2021
Notes to Financial Statements — continued
2 Related Party Transactions
The investment advisory fee is earned by CRM as compensation for investment advisory services rendered to the Fund. On March 1, 2021, Morgan Stanley acquired Eaton Vance Corp. (the “Transaction”) and CRM became an indirect, wholly-owned subsidiary of Morgan Stanley. In connection with the Transaction, the Fund entered into a new investment advisory agreement (the “New Agreement”) with CRM, which took effect on March 1, 2021. Pursuant to the New Agreement (and the Fund’s investment advisory agreement with CRM in effect prior to March 1, 2021), the fee is computed at the annual rate of 0.40% of the Fund’s average daily net assets and is payable monthly. For the year ended December 31, 2021, the investment advisory fee amounted to $559,518. The Fund may invest its cash in Cash Reserves Fund. CRM does not currently receive a fee for advisory services provided to Cash Reserves Fund.
Pursuant to an investment sub-advisory agreement, CRM has delegated a portion of the investment management of the Fund to Ameritas Investment Partners, Inc. (AIP). In connection with the Transaction, CRM entered into a new sub-advisory agreement with AIP, which took effect on March 1, 2021. CRM pays AIP a portion of its investment advisory fee for sub-advisory services provided to the Fund.
CRM has agreed to reimburse the Fund’s operating expenses to the extent that total annual operating expenses (relating to ordinary operating expenses only and excluding expenses such as brokerage commissions, acquired fund fees and expenses of unaffiliated funds, borrowing costs, taxes or litigation expenses) exceed 0.81% of the Fund’s average daily net assets. The expense reimbursement agreement with CRM may be changed or terminated after April 30, 2022. For the year ended December 31, 2021, CRM waived or reimbursed expenses of $132,078.
The administrative fee is earned by CRM as compensation for administrative services rendered to the Fund. The fee is computed at an annual rate of 0.12% of the Fund’s average daily net assets and is payable monthly. For the year ended December 31, 2021, CRM was paid administrative fees of $167,855.
The Fund has in effect a distribution plan for Class F shares (Class F Plan) pursuant to Rule 12b-1 under the 1940 Act. Pursuant to the Class F Plan, the Fund pays Eaton Vance Distributors, Inc. (EVD), an affiliate of CRM and the Fund’s principal underwriter, a distribution and service fee of 0.25% per annum of its average daily net assets attributable to Class F shares for distribution services and facilities provided to the Fund, as well as for personal and/or account maintenance services provided to the class shareholders. Distribution and service fees paid or accrued for the year ended December 31, 2021 amounted to $349,699 for Class F shares.
Eaton Vance Management (EVM), an affiliate of CRM, provides sub-transfer agency and related services to the Fund pursuant to a Sub-Transfer Agency Support Services Agreement. For the year ended December 31, 2021, sub-transfer agency fees and expenses incurred to EVM amounted to $53 and are included in transfer agency fees and expenses on the Statement of Operations.
Each Director of the Fund who is not an employee of CRM or its affiliates receives an annual fee of $154,000 ($214,000 effective January 1, 2022), plus an annual Committee fee ranging from $8,500 to $16,500 depending on the Committee. The Board chair receives an additional $30,000 annual fee, Committee chairs receive an additional $6,000 annual fee and the special equities liaison receives an additional $2,500 annual fee. Eligible Directors may participate in a Deferred Compensation Plan (the Plan). Amounts deferred under the Plan are treated as though equal dollar amounts had been invested in shares of the Fund or other Calvert funds selected by the Directors. The Fund purchases shares of the funds selected equal to the dollar amounts deferred under the Plan, resulting in an asset equal to the deferred compensation liability. Obligations of the Plan are paid solely from the Fund's assets. Directors’ fees are allocated to each of the Calvert funds served. Salaries and fees of officers and Directors of the Fund who are employees of CRM or its affiliates are paid by CRM.
3 Shareholder Servicing Plan
The Corporation, on behalf of the Fund, has adopted a Shareholder Servicing Plan (Servicing Plan), which permits the Fund to enter into shareholder servicing agreements with intermediaries that maintain accounts in the Fund for the benefit of shareholders. These services may include, but are not limited to, processing purchase and redemption requests, processing dividend payments, and providing account information to shareholders. Under the Servicing Plan, the Fund may make payments at an annual rate of up to 0.11% of its average daily net assets. For the year ended December 31, 2021, expenses incurred under the Servicing Plan amounted to $102,905, all of which were payable to an affiliate of AIP, and are included in transfer agency fees and expenses on the Statement of Operations. Included in accrued expenses at December 31, 2021 are amounts payable to an affiliate of AIP under the Servicing Plan of $10,144.
4 Investment Activity
During the year ended December 31, 2021, the cost of purchases and proceeds from sales of investments, other than short-term securities, were $8,976,191 and $26,378,462, respectively.
Calvert
VP Volatility Managed Growth Portfolio
December 31, 2021
Notes to Financial Statements — continued
5 Distributions to Shareholders and Income Tax Information
The tax character of distributions declared for the years ended December 31, 2021 and December 31, 2020 was as follows:
| | Year Ended December 31, |
| | 2021 | 2020 |
| Ordinary income | $1,356,418 | $2,223,798 |
As of December 31, 2021, the components of distributable earnings (accumulated loss) on a tax basis were as follows:
| Undistributed ordinary income | $ 1,153,556 |
| Undistributed long-term capital gains | 2,488,491 |
| Net unrealized appreciation | 51,182,717 |
| Distributable earnings | $54,824,764 |
The cost and unrealized appreciation (depreciation) of investments, including open derivative contracts, of the Fund at December 31, 2021, as determined on a federal income tax basis, were as follows:
| Aggregate cost | $94,013,158 |
| Gross unrealized appreciation | $ 51,182,717 |
| Gross unrealized depreciation | — |
| Net unrealized appreciation | $51,182,717 |
6 Financial Instruments
A summary of futures contracts outstanding at December 31, 2021 is included in the Schedule of Investments. During the year ended December 31, 2021, the Fund used futures contracts to hedge against changes in market volatility and declines in the value of the Fund’s investments and to adjust the Fund’s overall equity exposure in an effort to stabilize portfolio volatility around a target level.
At December 31, 2021, the fair value of open derivative instruments (not considered to be hedging instruments for accounting disclosure purposes) and whose primary underlying risk exposure is equity price risk was as follows:
| Derivative | Statement of Assets and Liabilities Caption | Assets | Liabilities |
| Futures contracts | Distributable earnings | | $ — | $(198,748) (1) |
| (1) | Only the current day's variation margin is reported within the Statement of Assets and Liabilities as Receivable or Payable for variation margin on open futures contracts, as applicable. |
The effect of derivative instruments (not considered to be hedging instruments for accounting disclosure purposes) on the Statement of Operations and whose primary underlying risk exposure is equity price risk for the year ended December 31, 2021 was as follows:
| | Statement of Operations Caption | |
| Derivative | Net realized gain (loss): Futures
contracts | Change in unrealized appreciation
(depreciation): Futures contracts |
| Futures contracts | $ (2,275,119) | $ (11,754) |
The average notional cost of futures contracts (long) and futures contracts (short) outstanding during the year ended December 31, 2021 was approximately $6,010,000 and $2,979,000, respectively.
Calvert
VP Volatility Managed Growth Portfolio
December 31, 2021
Notes to Financial Statements — continued
7 Securities Lending
To generate additional income, the Fund may lend its securities pursuant to a securities lending agency agreement with State Street Bank and Trust Company (SSBT), the securities lending agent. Security loans are subject to termination by the Fund at any time and, therefore, are not considered illiquid investments. The Fund requires that the loan be continuously collateralized by either cash or securities in an amount at least equal to the market value of the securities on loan. The market value of securities loaned is determined daily and any additional required collateral is delivered to the Fund on the next business day. Cash collateral is generally invested in a money market fund registered under the 1940 Act that is managed by an affiliate of SSBT. Any gain or loss in the market price of the loaned securities that might occur and any interest earned or dividends declared during the term of the loan would accrue to the account of the Fund. Income earned on the investment of collateral, net of broker rebates and other expenses incurred by the securities lending agent, is split between the Fund and the securities lending agent based on agreed upon contractual terms. Non-cash collateral, if any, is held by the lending agent on behalf of the Fund and cannot be sold or re-pledged by the Fund; accordingly, such collateral is not reflected in the Statement of Assets and Liabilities.
The risks associated with lending portfolio securities include, but are not limited to, possible delays in receiving additional collateral or in the recovery of the loaned securities, possible loss of rights to the collateral should the borrower fail financially, as well as risk of loss in the value of the collateral or the value of the investments made with the collateral. The securities lending agent shall indemnify the Fund in the case of default of any securities borrower.
At December 31, 2021, the total value of securities on loan was $27,687,894 and the total value of collateral received was $28,554,462, comprised of cash of $3,265,763 and U.S. government and/or agencies securities of $25,288,699.
The following table provides a breakdown of securities lending transactions accounted for as secured borrowings, the obligations by class of collateral pledged, and the remaining contractual maturity of those transactions as of December 31, 2021.
| | Remaining Contractual Maturity of the Transactions |
| | Overnight and
Continuous | <30 days | 30 to 90 days | >90 days | Total |
| Exchange-Traded Funds | $3,265,763 | $ — | $ — | $ — | $3,265,763 |
The carrying amount of the liability for deposits for securities loaned at December 31, 2021 approximated its fair value. If measured at fair value, such liability would have been considered as Level 2 in the fair value hierarchy (see Note 1A) at December 31, 2021.
8 Line of Credit
The Fund participates with other portfolios and funds managed by EVM and its affiliates, including CRM, in an $800 million unsecured line of credit with a group of banks, which is in effect through October 25, 2022. Borrowings are made by the Fund solely for temporary purposes related to redemptions and other short-term cash needs. Interest is charged to the Fund based on its borrowings at an amount above either the Secured Overnight Financing Rate (SOFR) or Federal Funds rate. In addition, a fee computed at an annual rate of 0.15% on the daily unused portion of the line of credit is allocated among the participating portfolios and funds at the end of each quarter. In connection with the renewal of the agreement in October 2021, an arrangement fee of $150,000 was incurred that was allocated to the participating portfolios and funds. Because the line of credit is not available exclusively to the Fund, it may be unable to borrow some or all of its requested amounts at any particular time.
The Fund had no borrowings pursuant to its line of credit during the year ended December 31, 2021.
9 Affiliated Funds
At December 31, 2021, the value of the Fund’s investment in affiliated funds was $10,804,372, which represents 7.6% of the Fund’s net assets. Transactions in affiliated funds by the Fund for the year ended December 31, 2021 were as follows:
| Name | Value,
beginning
of period | Purchases | Sales
proceeds | Net
realized
gain
(loss) | Change in
unrealized
appreciation
(depreciation) | Value,
end of
period | Dividend
income | Units,
end of
period |
| Short-Term Investments | | | | | | |
| Calvert Cash Reserves Fund, LLC | $8,936,923 | $27,684,165 | $(25,815,924) | $(826) | $34 | $10,804,372 | $6,697 | 10,804,372 |
Calvert
VP Volatility Managed Growth Portfolio
December 31, 2021
Notes to Financial Statements — continued
10 Capital Shares
The Corporation may issue its shares in one or more series (such as the Fund). The authorized shares of the Fund consist of 100,000,000 common shares, $0.10 par value.
Transactions in capital shares for the years ended December 31, 2021 and December 31, 2020 were as follows:
| | Year Ended
December 31, 2021 | | Year Ended
December 31, 2020 |
| | Shares | Amount | | Shares | Amount |
| Class F | | | | | |
| Shares sold | 73,295 | $ 1,669,451 | | 109,375 | $ 2,143,779 |
| Reinvestment of distributions | 59,754 | 1,356,418 | | 113,866 | 2,223,798 |
| Shares redeemed | (730,022) | (16,482,178) | | (981,640) | (19,402,803) |
| Net decrease | (596,973) | $(13,456,309) | | (758,399) | $(15,035,226) |
At December 31, 2021, separate accounts of an insurance company that is an affiliate of AIP owned 100% of the value of the outstanding shares of the Fund.
11 Risks and Uncertainties
Pandemic Risk
An outbreak of respiratory disease caused by a novel coronavirus was first detected in China in late 2019 and subsequently spread internationally. This coronavirus has resulted in closing borders, enhanced health screenings, changes to healthcare service preparation and delivery, quarantines, cancellations, disruptions to supply chains and customer activity, as well as general concern and uncertainty. Health crises caused by outbreaks, such as the coronavirus outbreak, may exacerbate other pre-existing political, social and economic risks and disrupt normal market conditions and operations. The impact of this outbreak has negatively affected the worldwide economy, the economies of individual countries, individual companies, and the market in general, and may continue to do so in significant and unforeseen ways, as may other epidemics and pandemics that may arise in the future. Any such impact could adversely affect the Fund's performance, or the performance of the securities in which the Fund invests.
12 Change in Independent Registered Public Accounting Firm
On July 30, 2021, KPMG LLP (“KPMG”) informed the Audit Committee and Board of the Corporation that it was resigning as the independent registered public accounting firm to the Corporation, as upon Morgan Stanley’s acquisition of Eaton Vance Corp., the parent company of CRM (the investment adviser to each series of the Corporation), KPMG would no longer be independent of the Corporation. The Audit Committee of the Board and the Board approved the selection of Deloitte & Touche LLP (“Deloitte”) as the independent registered public accounting firm for the funds that are series of the Corporation (the “Funds”) for the fiscal year ending December 31, 2021 to be effective upon KPMG’s resignation and Deloitte’s acceptance of the engagement which became effective July 30, 2021.
KPMG’s reports on the financial statements for the Funds for the fiscal periods ended December 31, 2019 and December 31, 2020 contained no adverse opinion or disclaimer of opinion nor were they qualified or modified as to uncertainty, audit scope or accounting principles. During the fiscal periods ended December 31, 2019 and December 31, 2020, and during the subsequent interim period through July 30, 2021: (i) there were no disagreements with KPMG on any matter of accounting principles or practices, financial statement disclosure or auditing scope or procedure, which disagreements, if not resolved to the satisfaction of KPMG, would have caused KPMG to make reference to the subject matter of the disagreements in connection with its reports on the Funds’ financial statements for such periods; and (ii) there were no “reportable events” of the kind described in Item 304(a)(1)(v) of Regulation S-K under the Securities Exchange Act of 1934, as amended.
During the fiscal periods ended December 31, 2019 and December 31, 2020, and during the subsequent interim period through July 30, 2021: neither the Funds, nor anyone on their behalf, consulted with Deloitte on items which: (i) concerned the application of accounting principles to a specified transaction, either completed or proposed, or the type of audit opinion that might be rendered on the Funds’ financial statements; or (ii) concerned the subject of a disagreement (as defined in paragraph (a)(1)(iv) of Item 304 of Regulation S-K) or reportable events (as described in paragraph (a)(1)(v) of Item 304).
Calvert
VP Volatility Managed Growth Portfolio
December 31, 2021
Notes to Financial Statements — continued
13 Subsequent Event
Effective January 1, 2022, CRM entered into an investment sub-advisory agreement with Parametric Portfolio Associates LLC (Parametric), an affiliate of CRM and an indirect, wholly-owned subsidiary of Morgan Stanley, to provide sub-advisory services to the Fund. Parametric is responsible for executing the Fund’s volatility management strategy.
Calvert
VP Volatility Managed Growth Portfolio
December 31, 2021
Report of Independent Registered Public Accounting Firm
To the Board of Directors of Calvert Variable Products, Inc. and Shareholders of Calvert VP Volatility Managed Growth Portfolio:
Opinion on the Financial Statements and Financial Highlights
We have audited the accompanying statement of assets and liabilities of Calvert VP Volatility Managed Growth Portfolio (the "Fund") (one of the funds constituting Calvert Variable Products, Inc.), including the schedule of investments, as of December 31, 2021, the related statements of operations, changes in net assets, and the financial highlights for the year then ended, and the related notes. In our opinion, the financial statements and financial highlights present fairly, in all material respects, the financial position of the Fund as of December 31, 2021, and the results of its operations, changes in its net assets, and the financial highlights for the year then ended in conformity with accounting principles generally accepted in the United States of America. The statement of changes in net assets for the year ended December 31, 2020, and the financial highlights for the years ended December 31, 2020, 2019, 2018, and 2017 were audited by other auditors whose report, dated February 18, 2021, expressed an unqualified opinion on that financial statement and those financial highlights.
Basis for Opinion
These financial statements and financial highlights are the responsibility of the Fund's management. Our responsibility is to express an opinion on the Fund's financial statements and financial highlights based on our audit. We are a public accounting firm registered with the Public Company Accounting Oversight Board (United States) (PCAOB) and are required to be independent with respect to the Fund in accordance with the U.S. federal securities laws and the applicable rules and regulations of the Securities and Exchange Commission and the PCAOB.
We conducted our audit in accordance with the standards of the PCAOB. Those standards require that we plan and perform the audit to obtain reasonable assurance about whether the financial statements and financial highlights are free of material misstatement, whether due to error or fraud. The Fund is not required to have, nor were we engaged to perform, an audit of its internal control over financial reporting. As part of our audit, we are required to obtain an understanding of internal control over financial reporting but not for the purpose of expressing an opinion on the effectiveness of the Fund’s internal control over financial reporting. Accordingly, we express no such opinion.
Our audit included performing procedures to assess the risks of material misstatement of the financial statements and financial highlights, whether due to error or fraud, and performing procedures that respond to those risks. Such procedures included examining, on a test basis, evidence regarding the amounts and disclosures in the financial statements and financial highlights. Our audit also included evaluating the accounting principles used and significant estimates made by management, as well as evaluating the overall presentation of the financial statements and financial highlights. Our procedures included confirmation of securities owned as of December 31, 2021, by correspondence with the custodian and brokers; when replies were not received from brokers, we performed other auditing procedures. We believe that our audit provides a reasonable basis for our opinion.
/s/ Deloitte & Touche LLP
Boston, Massachusetts
February 18, 2022
We have served as the auditor of one or more Calvert investment companies since 2021.
Calvert
VP Volatility Managed Growth Portfolio
December 31, 2021
Federal Tax Information (Unaudited)
As required by the Internal Revenue Code and/or regulations, shareholders must be notified regarding the status of capital gains dividends.
Capital Gains Dividends. The Fund hereby designates as a capital gain dividend with respect to the taxable year ended December 31, 2021, $2,488,491 or, if subsequently determined to be different, the net capital gain of such year.
Calvert
VP Volatility Managed Growth Portfolio
December 31, 2021
Management and Organization
Fund Management. The Directors of Calvert Variable Products, Inc. (the Corporation) are responsible for the overall management and supervision of the affairs of the Corporation. The Board members and officers of the Corporation are listed below. Except as indicated, each individual has held the office shown or other offices in the same company for the last five years. Board members hold indefinite terms of office. Each Board member holds office until his or her successor is elected and qualified, or until his or her earlier death, resignation, retirement, removal or disqualification. Under the terms of the Fund’s current Board member retirement policy, an Independent Board member must retire at the end of the calendar year in which he or she turns 75. However, if such retirement would cause the Fund to be out of compliance with Section 16 of the 1940 Act or any other regulations or guidance of the SEC, then such retirement will not become effective until such time as action has been taken for the Fund to be in compliance therewith. The “noninterested Directors” consist of those Directors who are not “interested persons” of the Corporation, as that term is defined under the 1940 Act. The business address of each Board member and the Chief Compliance Officer is 1825 Connecticut Avenue, NW, Suite 400, Washington, DC 20009 and the business address of the Secretary, Vice President and Chief Legal Officer and the Treasurer is Two International Place, Boston, Massachusetts 02110. As used below, “CRM” refers to Calvert Research and Management and “Eaton Vance” refers to Eaton Vance Management. Each Director oversees 39 funds in the Calvert fund complex. Effective March 1, 2021, each of Eaton Vance and CRM are indirect, wholly-owned subsidiaries of Morgan Stanley. Each officer affiliated with CRM may hold a position with other CRM affiliates that is comparable to his or her position with CRM listed below.
| Name and Year of Birth | Corporation
Position(s) | Length of
Service | Principal Occupation(s) and Other Directorships
During Past Five Years and Other Relevant Experience |
| Interested Director |
John H. Streur(1)
1960 | Director and
President | Since 2015 | President and Chief Executive Officer of CRM (since December 31, 2016). President and Chief Executive Officer of Calvert Investments, Inc.
(January 2015 - December 2016); Chief Executive Officer of Calvert
Investment Distributors, Inc. (August 2015 - December 2016); Chief
Compliance Officer of Calvert Investment Management, Inc. (August 2015 -
April 2016); President and Director, Portfolio 21 Investments, Inc.
(through October 2014); President, Chief Executive Officer and
Director, Managers Investment Group LLC (through January 2012);
President and Director, The Managers Funds and Managers AMG
Funds (through January 2012).
Other Directorships. Portfolio 21 Investments, Inc. (asset management)
(through October 2014); Managers Investment Group LLC (asset management)
(through January 2012); The Managers Funds (asset management)
(through January 2012); Managers AMG Funds (asset management)
(through January 2012); Calvert Impact Capital, Inc. |
| Noninterested Directors |
Richard L. Baird, Jr.
1948 | Director | Since 2016 | Regional Disaster Recovery Lead, American Red Cross of Greater
Pennsylvania (since 2017). Volunteer, American Red Cross (since 2015).
Former President and CEO of Adagio Health Inc. (retired in 2014) in
Pittsburgh, PA.
Other Directorships. None. |
Alice Gresham Bullock
1950 | Chair and
Director | Since 2016 (Chair);
Since 2008 (Director) | Professor Emerita at Howard University School of Law. Dean Emerita of
Howard University School of Law and Deputy Director of the Association
of American Law Schools (1992-1994).
Other Directorships. None. |
Cari M. Dominguez
1949 | Director | Since 2016 | Former Chair of the U.S. Equal Employment Opportunity Commission.
Other Directorships. ManpowerGroup Inc. (workforce solutions company);
Triple S Management Corporation (managed care); National Association of Corporate Directors. |
John G. Guffey, Jr.
1948 | Director | Since 2016 | President of Aurora Press Inc., a privately held publisher of trade
paperbacks (since January 1997).
Other Directorships. Calvert Impact Capital, Inc. (through
December 31, 2018); Calvert Ventures, LLC. |
Miles D. Harper, III
1962 | Director | Since 2016 | Partner, Carr Riggs & Ingram (public accounting firm) since October 2014.
Partner, Gainer Donnelly & Desroches (public accounting firm) (now Carr
Riggs & Ingram) (November 1999 - September 2014).
Other Directorships. Bridgeway Funds (9) (asset management). |
Joy V. Jones
1950 | Director | Since 2016 | Attorney.
Other Directorships. Palm Management Corporation. |
Calvert
VP Volatility Managed Growth Portfolio
December 31, 2021
Management and Organization — continued
| Name and Year of Birth | Corporation
Position(s) | Length of
Service | Principal Occupation(s) and Other Directorships
During Past Five Years and Other Relevant Experience |
| Noninterested Directors (continued) |
Anthony A. Williams
1951 | Director | Since 2016 | CEO and Executive Director of the Federal City Council (July 2012 to
present); Senior Adviser and Independent Consultant for King and
Spalding LLP (September 2015 to present); Executive Director of Global
Government Practice at the Corporate Executive Board (January 2010 to
January 2012).
Other Directorships. Freddie Mac; Evoq Properties/Meruelo Maddux
Properties, Inc. (real estate management); Weston Solutions, Inc.
(environmental services); Bipartisan Policy Center’s Debt Reduction Task Force;
Chesapeake Bay Foundation; Catholic University of America; Urban Institute (research organization); The Howard Hughes Corporation (real estate development). |
| Name and Year of Birth | Corporation
Position(s) | Length of
Service | Principal Occupation(s)
During Past Five Years |
| Principal Officers who are not Directors |
Hope L. Brown
1973 | Chief
Compliance
Officer | Since 2014 | Chief Compliance Officer of 39 registered investment companies advised
by CRM (since 2014). Vice President and Chief Compliance Officer,
Wilmington Funds (2012-2014). |
Deidre E. Walsh
1971 | Secretary,
Vice President
and Chief
Legal Officer | Since 2021 | Vice President of CRM and officer of 39 registered investment companies
advised by CRM (since 2021). Also Vice President of Eaton Vance and
certain of its affiliates and officer of 138 registered investment companies
advised or administered by Eaton Vance. |
James F. Kirchner
1967 | Treasurer | Since 2016 | Vice President of CRM and officer of 39 registered investment companies
advised by CRM (since 2016). Also Vice President of Eaton Vance and
certain of its affiliates and officer of 138 registered investment companies
advised or administered by Eaton Vance. |
| | | | |
| (1) Mr. Streur is an interested person of the Fund because of his positions with the Fund’s adviser and certain affiliates. |
The SAI for the Fund includes additional information about the Directors and officers of the Fund and can be obtained without charge on Calvert’s website at www.calvert.com or by calling 1-800-368-2745.
| FACTS | WHAT DOES EATON VANCE DO WITH YOUR
PERSONAL INFORMATION? |
| Why? | Financial companies choose how they share your personal information. Federal law gives consumers the right to limit some but not all sharing. Federal law also requires us to tell you how we collect, share, and protect your personal information. Please read this notice carefully to understand what we do. |
| |
| What? | The types of personal information we collect and share depend on the product or service you have with us. This information can include:■ Social Security number and income
■
investment experience and risk tolerance
■
checking account number and wire transfer instructions |
| |
| How? | All financial companies need to share customers’ personal information to run their everyday business. In the section below, we list the reasons financial companies can share their customers’ personal information; the reasons Eaton Vance chooses to share; and whether you can limit this sharing. |
Reasons we can share your
personal information | Does Eaton Vance
share? | Can you limit
this sharing? |
| For our everyday business purposes — such as to process your transactions, maintain your account(s), respond to court orders and legal investigations, or report to credit bureaus | Yes | No |
| For our marketing purposes — to offer our products and services to you | Yes | No |
| For joint marketing with other financial companies | No | We don’t share |
| For our investment management affiliates’ everyday business purposes — information about your transactions, experiences, and creditworthiness | Yes | Yes |
| For our affiliates’ everyday business purposes — information about your transactions and experiences | Yes | No |
| For our affiliates’ everyday business purposes — information about your creditworthiness | No | We don’t share |
| For our investment management affiliates to market to you | Yes | Yes |
| For our affiliates to market to you | No | We don’t share |
| For nonaffiliates to market to you | No | We don’t share |
To limit our
sharing | Call toll-free 1-800-368-2745 or email: CRMPrivacy@calvert.comPlease note:If you are a new customer, we can begin sharing your information 30 days from the date we sent this notice. When you are no longer our customer, we continue to share your information as described in this notice. However, you can contact us at any time to limit our sharing. |
| Questions? | Call toll-free 1-800-368-2745 or email: CRMPrivacy@calvert.com |
| Privacy Notice — continued | April 2021 |
| Who we are |
| Who is providing this notice? | Eaton Vance Management, Eaton Vance Distributors, Inc., Eaton Vance Trust Company, Eaton Vance Management (International) Limited, Eaton Vance Advisers International Ltd., Eaton Vance Global Advisors Limited, Eaton Vance Management’s Real Estate Investment Group, Boston Management and Research, Calvert Research and Management, Eaton Vance and Calvert Fund Families and our investment advisory affiliates (“Eaton Vance”) (see Investment Management Affiliates definition below) |
| What we do |
How does Eaton Vance
protect my personal
information? | To protect your personal information from unauthorized access and use, we use security measures that comply with federal law. These measures include computer safeguards and secured files and buildings. We have policies governing the proper handling of customer information by personnel and requiring third parties that provide support to adhere to appropriate security standards with respect to such information. |
How does Eaton Vance
collect my personal
information? | We collect your personal information, for example, when you■ open an account or make deposits or withdrawals from your account
■
buy securities from us or make a wire transfer
■
give us your contact informationWe also collect your personal information from others, such as credit bureaus, affiliates, or other companies. |
| Why can’t I limit all sharing? | Federal law gives you the right to limit only■ sharing for affiliates’ everyday business purposes — information about your creditworthiness
■
affiliates from using your information to market to you
■
sharing for nonaffiliates to market to youState laws and individual companies may give you additional rights to limit sharing. See below for more on your rights under state law. |
| Definitions |
Investment Management
Affiliates | Eaton Vance Investment Management Affiliates include registered investment advisers, registered broker- dealers, and registered and unregistered funds. Investment Management Affiliates does not include entities associated with Morgan Stanley Wealth Management, such as Morgan Stanley Smith Barney LLC and Morgan Stanley & Co. |
| Affiliates | Companies related by common ownership or control. They can be financial and nonfinancial companies.■ Our affiliates include companies with a Morgan Stanley name and financial companies such as Morgan Stanley Smith Barney LLC and Morgan Stanley & Co. |
| Nonaffiliates | Companies not related by common ownership or control. They can be financial and nonfinancial companies.■ Eaton Vance does not share with nonaffiliates so they can market to you. |
| Joint marketing | A formal agreement between nonaffiliated financial companies that together market financial products or services to you.■ Eaton Vance doesn’t jointly market. |
| Other important information |
| Vermont: Except as permitted by law, we will not share personal information we collect about Vermont residents with Nonaffiliates unless you provide us with your written consent to share such information.California: Except as permitted by law, we will not share personal information we collect about California residents with Nonaffiliates and we will limit sharing such personal information with our Affiliates to comply with California privacy laws that apply to us. |
Delivery of Shareholder Documents. The Securities and Exchange Commission (SEC) permits funds to deliver only one copy of shareholder documents, including prospectuses, proxy statements and shareholder reports, to fund investors with multiple accounts at the same residential or post office box address. This practice is often called “householding” and it helps eliminate duplicate mailings to shareholders. Calvert funds, or your financial intermediary, may household the mailing of your documents indefinitely unless you instruct Calvert funds, or your financial intermediary, otherwise. If you would prefer that your Calvert fund documents not be householded, please contact Calvert funds at 1-800-368-2745, or contact your financial intermediary. Your instructions that householding not apply to delivery of your Calvert fund documents will typically be effective within 30 days of receipt by Calvert funds or your financial intermediary. Separate statements will be generated for each separate account and will be householded as described above.
Portfolio Holdings. Each Calvert fund files a schedule of portfolio holdings on Part F to Form N-PORT with the SEC. Certain information filed on Form N-PORT may be viewed on the Calvert website at www.calvert.com, by calling Calvert at 1-800-368-2745 or in the EDGAR database on the SEC’s website at www.sec.gov.
Proxy Voting. The Proxy Voting Guidelines that each Calvert fund uses to determine how to vote proxies relating to portfolio securities is provided as an Appendix to the fund’s Statement of Additional Information. The Statement of Additional Information can be obtained free of charge by calling the Calvert funds at 1-800-368-2745, by visiting the Calvert funds’ website at www.calvert.com or visiting the SEC’s website at www.sec.gov. Information regarding how a Calvert fund voted proxies relating to portfolio securities during the most recent 12-month period ended June 30 is available by calling Calvert funds, by visiting the Calvert funds’ website at www.calvert.com or by visiting the SEC’s website at www.sec.gov.
Investment Adviser and Administrator
Calvert Research and Management
1825 Connecticut Avenue NW, Suite 400
Washington, DC 20009
Investment Sub-Adviser
Ameritas Investment Partners, Inc.
5945 R Street
Lincoln, NE 68505
Investment Sub-Adviser
Parametric Portfolio Associates LLC
800 Fifth Avenue, Suite 2800
Seattle, WA 98104
Principal Underwriter*
Eaton Vance Distributors, Inc.
Two International Place
Boston, MA 02110
(617) 482-8260
Custodian
State Street Bank and Trust Company
State Street Financial Center, One Lincoln Street
Boston, MA 02111
Transfer Agent
DST Asset Manager Solutions, Inc.
2000 Crown Colony Drive
Quincy, MA 02169
Independent Registered Public Accounting Firm
Deloitte & Touche LLP
200 Berkeley Street
Boston, MA 02116-5022
Fund Offices
1825 Connecticut Avenue NW, Suite 400
Washington, DC 20009
* FINRA BrokerCheck. Investors may check the background of their Investment Professional by contacting the Financial Industry Regulatory Authority (FINRA). FINRA BrokerCheck is a free tool to help investors check the professional background of current and former FINRA-registered securities firms and brokers. FINRA BrokerCheck is available by calling 1-800-289-9999 and at www.FINRA.org. The FINRA BrokerCheck brochure describing this program is available to investors at www.FINRA.org.
Printed on recycled paper.
24237 12.31.21
Item 2. Code of Ethics
The registrant has adopted a code of ethics applicable to its Principal Executive Officer, Principal Financial Officer and Principal Accounting Officer. The registrant undertakes to provide a copy of such code of ethics to any person upon request, without charge, by calling 1-800-368-2745. The registrant has not amended the code of ethics as described in Form N-CSR during the period covered by this report. The registrant has not granted any waiver, including an implicit waiver, from a provision of the code of ethics as described in Form N-CSR during the period covered by this report.
Item 3. Audit Committee Financial Expert
The registrant’s Board of Directors has determined that Miles D. Harper III, an “independent” Director serving on the registrant’s audit committee, is an “audit committee financial expert,” as defined in Item 3 of Form N-CSR. Under applicable securities laws, a person who is determined to be an audit committee financial expert will not be deemed an “expert” for any purpose, including without limitation for the purposes of Section 11 of the Securities Act of 1933, as a result of being designated or identified as an audit committee financial expert. The designation or identification of a person as an audit committee financial expert does not impose on such person any duties, obligations, or liabilities that are greater than the duties, obligations, and liabilities imposed on such person as a member of the audit committee and Board of Directors in the absence of such designation or identification.
Item 4. Principal Accountant Fees and Services
(a) –(d)
The following table presents the aggregate fees billed to the registrant for the registrant’s fiscal years ended December 31, 2020 and December 31, 2021 for professional services rendered for the audit of the registrant’s annual financial statements and fees billed for other services rendered by its principal accountant during such periods.
| | | | | | | | | | | | | | | | |
Fiscal Years Ended | | 12/31/20 | | | %* | | | 12/31/21 | | | %* | |
Audit Fees | | $ | 197,740 | | | �� | 0 | % | | $ | 196,575 | | | | 0 | % |
Audit-Related Fees(1) | | $ | 0 | | | | 0 | % | | $ | 0 | | | | 0 | % |
Tax Fees(2) | | $ | 35,300 | | | | 0 | % | | $ | 35,300 | | | | 0 | % |
All Other Fees(3) | | $ | 0 | | | | 0 | % | | $ | 0 | | | | 0 | % |
| | | | | | | | | | | | | | | | |
Total | | $ | 233,040 | | | | 0 | % | | $ | 231,875 | | | | 0 | % |
| | | | | | | | | | | | | | | | |
| * | Percentage of fees approved by the Audit Committee pursuant to (c)(7)(i)(C) of Rule 2-01 of Reg. S-X (statutory de minimus waiver of Committee’s requirement to pre-approve). |
| (1) | Audit-related fees consist of the aggregate fees billed for assurance and related services that are reasonably related to the performance of the audit of the registrant’s financial statements and are not reported under the category of audit fees. |
| (2) | Tax fees consist of the aggregate fees billed for professional services rendered by the principal accountant relating to tax compliance, tax advice, and tax planning and specifically include fees for tax return preparation and other related tax compliance/planning matters. |
| (3) | All other fees consist of the aggregate fees billed for products and services provided by the principal accountant other than audit, audit-related, and tax services. |
(e) The Audit Committee is required to pre-approve all audit and non-audit services provided to the registrant by the auditors, and to the registrant’s investment adviser, and any entity controlling, controlled by, or under common control with the adviser that provides ongoing services to the registrant. In determining whether to pre-approve non-audit services, the Audit Committee considers whether the services are consistent with maintaining the independence of the auditors. The Committee may delegate its authority to pre-approve certain matters to one or more of its members. In this regard, the Committee has delegated authority jointly to the Audit Committee Chair together with another Committee member with respect to non-audit services not exceeding $25,000 in each instance. In addition, the Committee has pre-approved the retention of the auditors to provide tax-related services related to the tax treatment and tax accounting of newly acquired securities, upon request by the investment adviser in each instance.
(f) Not applicable.
(g) Aggregate non-audit fees billed by the registrant’s principal accountant for services rendered to the registrant, and rendered to the registrant’s investment adviser, and any entity controlling, controlled by, or under common control with the adviser that provides ongoing services to the registrant for each of the last two fiscal years of the registrant:
| | | | | | |
Fiscal Year ended 12/31/20 | | Fiscal Year ended 12/31/21 |
$ | | %* | | $ | | %* |
$35,300 | | 0% | | $35,300 | | 0% |
| * | Percentage of fees approved by the Audit Committee pursuant to (c)(7)(i)(C) of Rule 2-01 of Reg. S-X (statutory de minimus waiver of Committee’s requirement to pre-approve). |
(h) The registrant’s audit committee has considered whether the provision by the registrant’s principal accountant of non-audit services to the registrant’s investment adviser and any entity controlling, controlled by, or under common control with the adviser that provides ongoing services to the registrant that were not pre-approved pursuant to Rule 2-01(c)(7)(ii) of Regulation S-X is compatible with maintaining the principal accountant’s independence.
Item 5. Audit Committee of Listed Registrants
Not applicable.
Item 6. Schedule of Investments
Please see schedule of investments contained in the Report to Stockholders included under Item 1 of this Form N-CSR.
Item 7. Disclosure of Proxy Voting Policies and Procedures for Closed-End Management Investment Companies
Not applicable.
Item 8. Portfolio Managers of Closed-End Management Investment Companies
Not applicable.
Item 9. Purchases of Equity Securities by Closed-End Management Investment Company and Affiliated Purchasers
Not applicable.
Item 10. Submission of Matters to a Vote of Security Holders
No material changes.
Item 11. Controls and Procedures
(a) The registrant’s principal executive and principal financial officers have concluded that the registrant’s disclosure controls and procedures (as defined in Rule 30a-3(c) under the Investment Company Act of 1940 Act, as amended (the “1940 Act”) are effective, based on the evaluation of these controls and procedures required by Rule 30a-3(b) under the 1940 Act and Rules 13a-15(b) or 15d-15(b) under the Securities Exchange Act of 1934 (“Exchange Act”), as of a date within 90 days of the filing date of this report.
(b) There was no change in the registrant’s internal control over financial reporting (as defined in Rule 30a-3(d) under the 1940 Act) that occurred during the period covered by this report that has materially affected, or is reasonably likely to materially affect, the registrant’s internal control over financial reporting.
Item 12. Disclosure of Securities Lending Activities for Closed-End Management Investment Companies.
Not applicable.
Item 13. Exhibits
Signatures
Pursuant to the requirements of the Securities Exchange Act of 1934 and the Investment Company Act of 1940, the registrant has duly caused this report to be signed on its behalf by the undersigned, thereunto duly authorized.
CALVERT VARIABLE PRODUCTS, INC.
| | |
| By: | | /s/ John H. Streur |
| | John H. Streur |
| | President |
| |
| Date: | | February 23, 2022 |
Pursuant to the requirements of the Securities Exchange Act of 1934 and the Investment Company Act of 1940, this report has been signed below by the following persons on behalf of the registrant and in the capacities and on the dates indicated.
| | |
| By: | | /s/ James F. Kirchner |
| | James F. Kirchner |
| | Treasurer |
| |
| Date: | | February 23, 2022 |
| |
| By: | | /s/ John H. Streur |
| | John H. Streur |
| | President |
| |
| Date: | | February 23, 2022 |