UNITED STATES
SECURITIES AND EXCHANGE COMMISSION
Washington, D.C. 20549
Form N-CSR
CERTIFIED SHAREHOLDER REPORT OF REGISTERED
MANAGEMENT INVESTMENT COMPANIES
Investment Company Act File Number: 811-04000
CALVERT VARIABLE PRODUCTS, INC.
(Exact Name of Registrant as Specified in Charter)
2050 M Street NW, Washington, DC 20036
(Address of Principal Executive Offices)
Deidre E. Walsh
Two International Place, Boston, Massachusetts 02110
(Name and Address of Agent for Services)
(202) 238-2200
(Registrant’s Telephone Number)
December 31
Date of Fiscal Year End
December 31, 2023
Date of Reporting Period
Item 1. Reports to Stockholders


| % Average Annual Total Returns1,2 | Class Inception Date | Performance Inception Date | One Year | Five Years | Ten Years |
| Class I at NAV | 05/03/1999 | 05/03/1999 | 16.12% | 12.28% | 8.90% |
| Class F at NAV | 10/01/2007 | 05/03/1999 | 15.89 | 12.06 | 8.66 |
| S&P MidCap 400® Index | — | — | 16.44% | 12.61% | 9.27% |
| % Total Annual Operating Expense Ratios3 | Class I | Class F |
| Gross | 0.44% | 0.64% |
| Net | 0.33 | 0.53 |

| Growth of Investment | Amount Invested | Period Beginning | At NAV | With Maximum Sales Charge |
| Class F | $10,000 | 12/31/2013 | $22,945 | N.A. |
| Top 10 Holdings (% of net assets)1 | |
| SPDR S&P MidCap 400 ETF Trust | 1.6% |
| Deckers Outdoor Corp. | 0.7 |
| Reliance Steel & Aluminum Co. | 0.6 |
| Carlisle Cos., Inc. | 0.6 |
| GoDaddy, Inc., Class A | 0.6 |
| Graco, Inc. | 0.6 |
| Watsco, Inc. | 0.6 |
| RPM International, Inc. | 0.5 |
| Lennox International, Inc. | 0.5 |
| W.P. Carey, Inc. | 0.5 |
| Total | 6.8% |
| 1 | Excludes cash and cash equivalents. |
| † | The views expressed in this report are those of the portfolio manager(s) and are current only through the date stated at the top of this page. These views are subject to change at any time based upon market or other conditions, and Calvert and the Fund(s) disclaim any responsibility to update such views. These views may not be relied upon as investment advice and, because investment decisions are based on many factors, may not be relied upon as an indication of trading intent on behalf of any Calvert fund. This commentary may contain statements that are not historical facts, referred to as “forward-looking statements.” The Fund’s actual future results may differ significantly from those stated in any forward-looking statement, depending on factors such as changes in securities or financial markets or general economic conditions, the volume of sales and purchases of Fund shares, the continuation of investment advisory, administrative and service contracts, and other risks discussed from time to time in the Fund’s filings with the Securities and Exchange Commission. |
| 1 | S&P MidCap 400® Index is an unmanaged index of 400 U.S. mid-cap stocks. S&P Dow Jones Indices are a product of S&P Dow Jones Indices LLC (“S&P DJI”) and have been licensed for use. S&P® and S&P 500® are registered trademarks of S&P DJI; Dow Jones® is a registered trademark of Dow Jones Trademark Holdings LLC (“Dow Jones”); S&P DJI, Dow Jones and their respective affiliates do not sponsor, endorse, sell or promote the Fund, will not have any liability with respect thereto and do not have any liability for any errors, omissions, or interruptions of the S&P Dow Jones Indices. Unless otherwise stated, index returns do not reflect the effect of any applicable sales charges, commissions, expenses, taxes or leverage, as applicable. It is not possible to invest directly in an index. |
| 2 | There is no sales charge. Insurance-related charges are not included in the calculation of returns. If such charges were reflected, the returns would be lower. Please refer to the report for your insurance contract for performance data reflecting insurance-related charges.Calvert Research and Management became the investment adviser to the Fund on December 31, 2016. Performance reflected prior to such date is that of the Fund’s former investment adviser. |
| 3 | Source: Fund prospectus. Net expense ratios reflect a contractual expense reimbursement that continues through 4/30/24. The expense ratios for the current reporting period can be found in the Financial Highlights section of this report. Performance reflects expenses waived and/or reimbursed, if applicable. Without such waivers and/or reimbursements, performance would have been lower. |
| Additional Information | |
| S&P 500® Index is an unmanaged index of large-cap stocks commonly used as a measure of U.S. stock market performance. Dow Jones Industrial Average® is a price-weighted average of 30 blue-chip stocks that are generally the leaders in their industry. Nasdaq Composite Index is a market capitalization-weighted index of all domestic and international securities listed on Nasdaq. Source: Nasdaq, Inc. The information is provided by Nasdaq (with its affiliates, are referred to as the “Corporations”) and Nasdaq’s third party licensors on an “as is” basis and the Corporations make no guarantees and bear no liability of any kind with respect to the information or the Fund. Russell 2000® Index is an unmanaged index of 2,000 U.S. small-cap stocks. |
| Beginning Account Value (7/1/23) | Ending Account Value (12/31/23) | Expenses Paid During Period* (7/1/23 – 12/31/23) | Annualized Expense Ratio | |
| Actual | ||||
| Class I | $1,000.00 | $1,068.10 | $1.72 ** | 0.33% |
| Class F | $1,000.00 | $1,067.10 | $2.76 ** | 0.53% |
| Hypothetical | ||||
| (5% return per year before expenses) | ||||
| Class I | $1,000.00 | $1,023.54 | $1.68 ** | 0.33% |
| Class F | $1,000.00 | $1,022.53 | $2.70 ** | 0.53% |
| * | Expenses are equal to the Fund's annualized expense ratio for the indicated Class, multiplied by the average account value over the period, multiplied by 184/365 (to reflect the one-half year period). The Example assumes that the $1,000 was invested at the net asset value per share determined at the close of business on June 30, 2023. Expenses shown do not include insurance-related charges or direct expenses of Qualified Plans. |
| ** | Absent a waiver and/or reimbursement of expenses by affiliate(s), expenses would be higher. |
| Common Stocks — 96.3% |
| Security | Shares | Value | |
| Aerospace & Defense — 1.1% | |||
| BWX Technologies, Inc. | 20,196 | $ 1,549,639 | |
| Curtiss-Wright Corp. | 8,444 | 1,881,239 | |
| Hexcel Corp. | 18,572 | 1,369,685 | |
| Woodward, Inc. | 13,340 | 1,815,974 | |
| $ 6,616,537 | |||
| Air Freight & Logistics — 0.3% | |||
| GXO Logistics, Inc.(1) | 26,265 | $ 1,606,367 | |
| $ 1,606,367 | |||
| Automobile Components — 1.5% | |||
| Adient PLC(1) | 21,005 | $ 763,742 | |
| Autoliv, Inc. | 16,536 | 1,822,102 | |
| Fox Factory Holding Corp.(1) | 9,502 | 641,195 | |
| Gentex Corp. | 51,502 | 1,682,055 | |
| Goodyear Tire & Rubber Co. (The)(1) | 62,607 | 896,532 | |
| Lear Corp. | 12,864 | 1,816,525 | |
| Visteon Corp.(1) | 6,141 | 767,011 | |
| $ 8,389,162 | |||
| Automobiles — 0.4% | |||
| Harley-Davidson, Inc. | 27,983 | $ 1,030,894 | |
| Thor Industries, Inc. | 11,764 | 1,391,093 | |
| $ 2,421,987 | |||
| Banks — 5.5% | |||
| Associated Banc-Corp. | 32,873 | $ 703,153 | |
| Bank OZK | 23,232 | 1,157,651 | |
| Cadence Bank | 40,332 | 1,193,424 | |
| Columbia Banking System, Inc. | 46,053 | 1,228,694 | |
| Commerce Bancshares, Inc. | 26,222 | 1,400,490 | |
| Cullen/Frost Bankers, Inc. | 14,142 | 1,534,266 | |
| East West Bancorp, Inc. | 31,117 | 2,238,868 | |
| F.N.B. Corp. | 79,229 | 1,090,983 | |
| First Financial Bankshares, Inc. | 28,812 | 873,004 | |
| First Horizon Corp. | 123,376 | 1,747,004 | |
| Glacier Bancorp, Inc. | 24,482 | 1,011,596 | |
| Hancock Whitney Corp. | 19,051 | 925,688 | |
| Home BancShares, Inc. | 41,432 | 1,049,473 | |
| International Bancshares Corp. | 11,968 | 650,102 | |
| New York Community Bancorp, Inc. | 159,525 | 1,631,941 | |
| Old National Bancorp | 64,611 | 1,091,280 | |
| Pinnacle Financial Partners, Inc. | 16,952 | 1,478,553 | |
| Prosperity Bancshares, Inc. | 20,692 | 1,401,469 | |
| SouthState Corp. | 16,795 | 1,418,338 | |
| Synovus Financial Corp. | 32,290 | 1,215,718 | |
| Texas Capital Bancshares, Inc.(1) | 10,765 | 695,742 | |
| UMB Financial Corp. | 9,793 | 818,205 | |
| Security | Shares | Value | |
| Banks (continued) | |||
| United Bankshares, Inc. | 29,793 | $ 1,118,727 | |
| Valley National Bancorp | 94,161 | 1,022,588 | |
| Webster Financial Corp. | 37,985 | 1,928,119 | |
| Wintrust Financial Corp. | 13,521 | 1,254,073 | |
| $ 31,879,149 | |||
| Beverages — 0.6% | |||
| Boston Beer Co., Inc. (The), Class A(1) | 2,080 | $ 718,827 | |
| Celsius Holdings, Inc.(1) | 32,738 | 1,784,876 | |
| Coca-Cola Consolidated, Inc. | 1,037 | 962,751 | |
| $ 3,466,454 | |||
| Biotechnology — 1.5% | |||
| Arrowhead Pharmaceuticals, Inc.(1) | 24,041 | $ 735,655 | |
| Exelixis, Inc.(1) | 68,663 | 1,647,225 | |
| Halozyme Therapeutics, Inc.(1) | 29,167 | 1,078,012 | |
| Neurocrine Biosciences, Inc.(1) | 21,694 | 2,858,402 | |
| United Therapeutics Corp.(1) | 10,363 | 2,278,720 | |
| $ 8,598,014 | |||
| Broadline Retail — 0.5% | |||
| Macy's, Inc. | 61,121 | $ 1,229,755 | |
| Nordstrom, Inc.(2) | 21,731 | 400,937 | |
| Ollie's Bargain Outlet Holdings, Inc.(1) | 13,624 | 1,033,925 | |
| $ 2,664,617 | |||
| Building Products — 3.3% | |||
| Advanced Drainage Systems, Inc. | 15,138 | $ 2,129,008 | |
| Carlisle Cos., Inc. | 10,749 | 3,358,310 | |
| Fortune Brands Innovations, Inc. | 27,842 | 2,119,890 | |
| Lennox International, Inc. | 7,062 | 3,160,386 | |
| Owens Corning | 19,624 | 2,908,866 | |
| Simpson Manufacturing Co., Inc. | 9,422 | 1,865,368 | |
| Trex Co., Inc.(1) | 23,978 | 1,985,139 | |
| UFP Industries, Inc. | 13,648 | 1,713,506 | |
| $ 19,240,473 | |||
| Capital Markets — 2.7% | |||
| Affiliated Managers Group, Inc. | 7,465 | $ 1,130,350 | |
| Carlyle Group, Inc. (The) | 48,084 | 1,956,538 | |
| Evercore, Inc., Class A | 7,653 | 1,309,046 | |
| Federated Hermes, Inc. | 19,043 | 644,796 | |
| Houlihan Lokey, Inc. | 11,396 | 1,366,494 | |
| Interactive Brokers Group, Inc., Class A | 23,629 | 1,958,844 | |
| Janus Henderson Group PLC | 29,722 | 896,118 | |
| Jefferies Financial Group, Inc. | 37,170 | 1,502,040 | |
| Morningstar, Inc. | 5,751 | 1,646,166 | |
| SEI Investments Co. | 22,081 | 1,403,248 | |
| Stifel Financial Corp. | 22,521 | 1,557,327 | |
| $ 15,370,967 | |||
| Security | Shares | Value | |
| Chemicals — 2.3% | |||
| Ashland, Inc. | 11,314 | $ 953,883 | |
| Avient Corp. | 20,300 | 843,871 | |
| Axalta Coating Systems, Ltd.(1) | 48,594 | 1,650,738 | |
| Cabot Corp. | 12,198 | 1,018,533 | |
| Chemours Co. (The) | 33,210 | 1,047,444 | |
| Livent Corp.(1) | 39,500 | 710,210 | |
| NewMarket Corp. | 1,549 | 845,491 | |
| Olin Corp. | 27,059 | 1,459,833 | |
| RPM International, Inc. | 28,445 | 3,175,315 | |
| Scotts Miracle-Gro Co. (The)(2) | 9,320 | 594,150 | |
| Westlake Corp. | 7,159 | 1,001,974 | |
| $ 13,301,442 | |||
| Commercial Services & Supplies — 1.2% | |||
| Brink's Co. (The) | 9,947 | $ 874,839 | |
| Clean Harbors, Inc.(1) | 11,120 | 1,940,551 | |
| MSA Safety, Inc. | 8,159 | 1,377,484 | |
| Stericycle, Inc.(1) | 20,429 | 1,012,461 | |
| Tetra Tech, Inc. | 11,757 | 1,962,596 | |
| $ 7,167,931 | |||
| Communications Equipment — 0.5% | |||
| Calix, Inc.(1) | 13,238 | $ 578,368 | |
| Ciena Corp.(1) | 32,643 | 1,469,261 | |
| Lumentum Holdings, Inc.(1) | 14,794 | 775,502 | |
| $ 2,823,131 | |||
| Construction & Engineering — 1.9% | |||
| AECOM | 30,631 | $ 2,831,223 | |
| Comfort Systems USA, Inc. | 7,886 | 1,621,914 | |
| EMCOR Group, Inc. | 10,387 | 2,237,671 | |
| Fluor Corp.(1) | 37,619 | 1,473,536 | |
| MasTec, Inc.(1) | 13,346 | 1,010,559 | |
| MDU Resources Group, Inc. | 45,671 | 904,286 | |
| Valmont Industries, Inc. | 4,613 | 1,077,182 | |
| $ 11,156,371 | |||
| Construction Materials — 0.4% | |||
| Eagle Materials, Inc. | 7,703 | $ 1,562,476 | |
| Knife River Corp.(1) | 12,683 | 839,361 | |
| $ 2,401,837 | |||
| Consumer Finance — 0.7% | |||
| Ally Financial, Inc. | 59,940 | $ 2,093,105 | |
| FirstCash Holdings, Inc. | 8,296 | 899,203 | |
| SLM Corp. | 50,034 | 956,650 | |
| $ 3,948,958 | |||
| Consumer Staples Distribution & Retail — 1.8% | |||
| BJ's Wholesale Club Holdings, Inc.(1) | 29,528 | $ 1,968,336 | |
| Security | Shares | Value | |
| Consumer Staples Distribution & Retail (continued) | |||
| Casey's General Stores, Inc. | 8,229 | $ 2,260,835 | |
| Grocery Outlet Holding Corp.(1) | 22,153 | 597,245 | |
| Performance Food Group Co.(1) | 34,357 | 2,375,787 | |
| Sprouts Farmers Market, Inc.(1) | 22,425 | 1,078,867 | |
| US Foods Holding Corp.(1) | 49,941 | 2,267,821 | |
| $ 10,548,891 | |||
| Containers & Packaging — 1.7% | |||
| AptarGroup, Inc. | 14,524 | $ 1,795,457 | |
| Berry Global Group, Inc. | 26,076 | 1,757,262 | |
| Crown Holdings, Inc. | 26,639 | 2,453,185 | |
| Graphic Packaging Holding Co. | 67,576 | 1,665,748 | |
| Greif, Inc., Class A | 5,713 | 374,716 | |
| Silgan Holdings, Inc. | 17,871 | 808,663 | |
| Sonoco Products Co. | 21,629 | 1,208,412 | |
| $ 10,063,443 | |||
| Diversified Consumer Services — 0.9% | |||
| Graham Holdings Co., Class B | 790 | $ 550,251 | |
| Grand Canyon Education, Inc.(1) | 6,526 | 861,693 | |
| H&R Block, Inc. | 31,780 | 1,537,198 | |
| Service Corp. International | 32,622 | 2,232,976 | |
| $ 5,182,118 | |||
| Diversified REITs — 0.5% | |||
| W.P. Carey, Inc. | 48,283 | $ 3,129,221 | |
| $ 3,129,221 | |||
| Diversified Telecommunication Services — 0.4% | |||
| Frontier Communications Parent, Inc.(1) | 48,837 | $ 1,237,530 | |
| Iridium Communications, Inc. | 27,346 | 1,125,561 | |
| $ 2,363,091 | |||
| Electric Utilities — 0.9% | |||
| ALLETE, Inc. | 12,873 | $ 787,313 | |
| IDACORP, Inc. | 11,176 | 1,098,824 | |
| OGE Energy Corp. | 44,223 | 1,544,709 | |
| PNM Resources, Inc. | 19,251 | 800,842 | |
| Portland General Electric Co. | 22,328 | 967,696 | |
| $ 5,199,384 | |||
| Electrical Equipment — 1.5% | |||
| Acuity Brands, Inc. | 6,833 | $ 1,399,604 | |
| EnerSys | 8,920 | 900,563 | |
| nVent Electric PLC | 36,633 | 2,164,644 | |
| Regal Rexnord Corp. | 14,650 | 2,168,493 | |
| Sensata Technologies Holding PLC | 33,419 | 1,255,552 | |
| Sunrun, Inc.(1) | 48,024 | 942,711 | |
| $ 8,831,567 | |||
| Security | Shares | Value | |
| Electronic Equipment, Instruments & Components — 2.3% | |||
| Arrow Electronics, Inc.(1) | 11,958 | $ 1,461,865 | |
| Avnet, Inc. | 19,979 | 1,006,942 | |
| Belden, Inc. | 9,203 | 710,932 | |
| Cognex Corp. | 38,009 | 1,586,496 | |
| Coherent Corp.(1) | 29,185 | 1,270,423 | |
| Crane NXT Co. | 10,827 | 615,731 | |
| IPG Photonics Corp.(1) | 6,527 | 708,441 | |
| Littelfuse, Inc. | 5,496 | 1,470,510 | |
| Novanta, Inc.(1) | 7,907 | 1,331,618 | |
| TD SYNNEX Corp. | 11,325 | 1,218,683 | |
| Vishay Intertechnology, Inc. | 27,873 | 668,116 | |
| Vontier Corp. | 34,075 | 1,177,291 | |
| $ 13,227,048 | |||
| Energy Equipment & Services — 1.0% | |||
| ChampionX Corp. | 43,012 | $ 1,256,380 | |
| NOV, Inc. | 86,979 | 1,763,934 | |
| Valaris, Ltd.(1) | 13,842 | 949,146 | |
| Weatherford International PLC(1) | 15,924 | 1,557,845 | |
| $ 5,527,305 | |||
| Entertainment — 0.2% | |||
| TKO Group Holdings, Inc. | 13,404 | $ 1,093,498 | |
| $ 1,093,498 | |||
| Financial Services — 1.8% | |||
| Equitable Holdings, Inc. | 70,253 | $ 2,339,425 | |
| Essent Group, Ltd. | 23,573 | 1,243,240 | |
| Euronet Worldwide, Inc.(1) | 9,674 | 981,814 | |
| MGIC Investment Corp. | 61,230 | 1,181,127 | |
| Voya Financial, Inc. | 23,066 | 1,682,895 | |
| Western Union Co. (The) | 80,450 | 958,964 | |
| WEX, Inc.(1) | 9,436 | 1,835,774 | |
| $ 10,223,239 | |||
| Food Products — 1.1% | |||
| Darling Ingredients, Inc.(1) | 35,225 | $ 1,755,614 | |
| Flowers Foods, Inc. | 42,420 | 954,874 | |
| Ingredion, Inc. | 14,394 | 1,562,181 | |
| Lancaster Colony Corp. | 4,568 | 760,070 | |
| Pilgrim's Pride Corp.(1) | 9,028 | 249,714 | |
| Post Holdings, Inc.(1) | 11,219 | 987,945 | |
| $ 6,270,398 | |||
| Gas Utilities — 1.0% | |||
| National Fuel Gas Co. | 20,274 | $ 1,017,147 | |
| New Jersey Resources Corp. | 21,542 | 960,342 | |
| ONE Gas, Inc. | 12,436 | 792,422 | |
| Southwest Gas Holdings, Inc. | 13,466 | 853,071 | |
| Spire, Inc. | 11,798 | 735,487 | |
| Security | Shares | Value | |
| Gas Utilities (continued) | |||
| UGI Corp. | 46,253 | $ 1,137,824 | |
| $ 5,496,293 | |||
| Ground Transportation — 1.9% | |||
| Avis Budget Group, Inc. | 4,079 | $ 723,043 | |
| Hertz Global Holdings, Inc.(1) | 30,017 | 311,877 | |
| Knight-Swift Transportation Holdings, Inc. | 35,614 | 2,053,147 | |
| Landstar System, Inc. | 7,937 | 1,537,000 | |
| Ryder System, Inc. | 9,786 | 1,125,977 | |
| Saia, Inc.(1) | 5,862 | 2,568,846 | |
| Werner Enterprises, Inc. | 13,976 | 592,163 | |
| XPO, Inc.(1) | 25,607 | 2,242,917 | |
| $ 11,154,970 | |||
| Health Care Equipment & Supplies — 2.3% | |||
| Enovis Corp.(1) | 11,132 | $ 623,615 | |
| Envista Holdings Corp.(1) | 37,845 | 910,551 | |
| Globus Medical, Inc., Class A(1) | 25,472 | 1,357,403 | |
| Haemonetics Corp.(1) | 11,204 | 958,054 | |
| Inari Medical, Inc.(1) | 11,448 | 743,204 | |
| Integra LifeSciences Holdings Corp.(1) | 15,017 | 653,990 | |
| Lantheus Holdings, Inc.(1) | 15,122 | 937,564 | |
| LivaNova PLC(1) | 12,085 | 625,278 | |
| Masimo Corp.(1) | 9,800 | 1,148,658 | |
| Neogen Corp.(1) | 44,134 | 887,535 | |
| Penumbra, Inc.(1) | 8,522 | 2,143,624 | |
| QuidelOrtho Corp.(1) | 11,085 | 816,964 | |
| Shockwave Medical, Inc.(1) | 8,147 | 1,552,492 | |
| $ 13,358,932 | |||
| Health Care Providers & Services — 2.0% | |||
| Acadia Healthcare Co., Inc.(1) | 20,361 | $ 1,583,272 | |
| Amedisys, Inc.(1) | 7,319 | 695,744 | |
| Chemed Corp. | 3,326 | 1,944,879 | |
| Encompass Health Corp. | 22,131 | 1,476,580 | |
| HealthEquity, Inc.(1) | 18,907 | 1,253,534 | |
| Option Care Health, Inc.(1) | 39,110 | 1,317,616 | |
| Patterson Cos., Inc. | 19,085 | 542,968 | |
| Progyny, Inc.(1) | 18,615 | 692,106 | |
| R1 RCM, Inc.(1) | 44,162 | 466,792 | |
| Tenet Healthcare Corp.(1) | 22,423 | 1,694,506 | |
| $ 11,667,997 | |||
| Health Care REITs — 0.9% | |||
| Healthcare Realty Trust, Inc. | 84,097 | $ 1,448,991 | |
| Medical Properties Trust, Inc.(2) | 134,206 | 658,951 | |
| Omega Healthcare Investors, Inc. | 54,094 | 1,658,522 | |
| Physicians Realty Trust | 53,479 | 711,806 | |
| Sabra Health Care REIT, Inc. | 51,856 | 739,985 | |
| $ 5,218,255 | |||
| Security | Shares | Value | |
| Health Care Technology — 0.1% | |||
| Doximity, Inc., Class A(1) | 26,090 | $ 731,564 | |
| $ 731,564 | |||
| Hotel & Resort REITs — 0.1% | |||
| Park Hotels & Resorts, Inc. | 46,364 | $ 709,369 | |
| $ 709,369 | |||
| Hotels, Restaurants & Leisure — 3.4% | |||
| Aramark | 57,640 | $ 1,619,684 | |
| Boyd Gaming Corp. | 15,342 | 960,563 | |
| Choice Hotels International, Inc. | 5,498 | 622,923 | |
| Churchill Downs, Inc. | 14,988 | 2,022,331 | |
| Hilton Grand Vacations, Inc.(1) | 15,736 | 632,272 | |
| Hyatt Hotels Corp., Class A | 9,764 | 1,273,323 | |
| Light & Wonder, Inc., Class A(1) | 19,882 | 1,632,511 | |
| Marriott Vacations Worldwide Corp. | 7,293 | 619,103 | |
| Penn Entertainment, Inc.(1) | 33,874 | 881,401 | |
| Planet Fitness, Inc., Class A(1) | 18,965 | 1,384,445 | |
| Texas Roadhouse, Inc. | 14,746 | 1,802,404 | |
| Travel + Leisure Co. | 15,990 | 625,049 | |
| Vail Resorts, Inc. | 8,410 | 1,795,283 | |
| Wendy's Co. (The) | 36,889 | 718,598 | |
| Wingstop, Inc. | 6,495 | 1,666,487 | |
| Wyndham Hotels & Resorts, Inc. | 18,318 | 1,472,950 | |
| $ 19,729,327 | |||
| Household Durables — 1.9% | |||
| Helen of Troy, Ltd.(1) | 5,242 | $ 633,286 | |
| KB Home | 16,905 | 1,055,886 | |
| Leggett & Platt, Inc. | 29,872 | 781,750 | |
| Taylor Morrison Home Corp.(1) | 23,725 | 1,265,729 | |
| Tempur Sealy International, Inc. | 38,038 | 1,938,797 | |
| Toll Brothers, Inc. | 23,731 | 2,439,310 | |
| TopBuild Corp.(1) | 7,016 | 2,625,808 | |
| $ 10,740,566 | |||
| Independent Power and Renewable Electricity Producers — 0.7% | |||
| Ormat Technologies, Inc. | 12,028 | $ 911,602 | |
| Vistra Corp. | 74,210 | 2,858,569 | |
| $ 3,770,171 | |||
| Industrial REITs — 1.3% | |||
| EastGroup Properties, Inc. | 10,182 | $ 1,868,804 | |
| First Industrial Realty Trust, Inc. | 29,206 | 1,538,280 | |
| Rexford Industrial Realty, Inc. | 46,610 | 2,614,821 | |
| STAG Industrial, Inc. | 40,294 | 1,581,943 | |
| $ 7,603,848 | |||
| Insurance — 4.3% | |||
| American Financial Group, Inc. | 14,429 | $ 1,715,464 | |
| Security | Shares | Value | |
| Insurance (continued) | |||
| Brighthouse Financial, Inc.(1) | 14,176 | $ 750,194 | |
| CNO Financial Group, Inc. | 24,767 | 690,999 | |
| Erie Indemnity Co., Class A | 5,507 | 1,844,404 | |
| Fidelity National Financial, Inc. | 57,088 | 2,912,630 | |
| First American Financial Corp. | 22,782 | 1,468,072 | |
| Hanover Insurance Group, Inc. (The) | 7,896 | 958,732 | |
| Kemper Corp. | 13,504 | 657,240 | |
| Kinsale Capital Group, Inc. | 4,861 | 1,627,997 | |
| Old Republic International Corp. | 57,574 | 1,692,676 | |
| Primerica, Inc. | 7,735 | 1,591,554 | |
| Reinsurance Group of America, Inc. | 14,552 | 2,354,223 | |
| RenaissanceRe Holdings, Ltd. | 11,604 | 2,274,384 | |
| RLI Corp. | 8,865 | 1,180,109 | |
| Selective Insurance Group, Inc. | 13,378 | 1,330,843 | |
| Unum Group | 40,482 | 1,830,596 | |
| $ 24,880,117 | |||
| Interactive Media & Services — 0.3% | |||
| Ziff Davis, Inc.(1) | 10,153 | $ 682,180 | |
| ZoomInfo Technologies, Inc.(1) | 65,408 | 1,209,394 | |
| $ 1,891,574 | |||
| IT Services — 0.8% | |||
| GoDaddy, Inc., Class A(1) | 31,094 | $ 3,300,939 | |
| Kyndryl Holdings, Inc.(1) | 51,335 | 1,066,741 | |
| $ 4,367,680 | |||
| Leisure Products — 0.9% | |||
| Brunswick Corp. | 15,194 | $ 1,470,020 | |
| Mattel, Inc.(1) | 77,994 | 1,472,527 | |
| Polaris, Inc. | 11,721 | 1,110,799 | |
| YETI Holdings, Inc.(1) | 19,208 | 994,590 | |
| $ 5,047,936 | |||
| Life Sciences Tools & Services — 1.1% | |||
| Azenta, Inc.(1) | 13,491 | $ 878,804 | |
| Bruker Corp. | 20,476 | 1,504,577 | |
| Medpace Holdings, Inc.(1) | 5,149 | 1,578,323 | |
| Repligen Corp.(1) | 11,465 | 2,061,407 | |
| Sotera Health Co.(1)(2) | 22,184 | 373,800 | |
| $ 6,396,911 | |||
| Machinery — 4.7% | |||
| AGCO Corp. | 13,723 | $ 1,666,109 | |
| Chart Industries, Inc.(1)(2) | 9,271 | 1,263,915 | |
| Crane Co. | 10,785 | 1,274,140 | |
| Donaldson Co., Inc. | 26,647 | 1,741,381 | |
| ESAB Corp. | 12,509 | 1,083,529 | |
| Flowserve Corp. | 28,971 | 1,194,185 | |
| Graco, Inc. | 37,268 | 3,233,372 | |
| Security | Shares | Value | |
| Machinery (continued) | |||
| ITT, Inc. | 18,128 | $ 2,163,033 | |
| Lincoln Electric Holdings, Inc. | 12,630 | 2,746,520 | |
| Middleby Corp. (The)(1) | 11,835 | 1,741,757 | |
| Oshkosh Corp. | 14,443 | 1,565,766 | |
| RBC Bearings, Inc.(1) | 6,422 | 1,829,563 | |
| Terex Corp. | 14,860 | 853,856 | |
| Timken Co. (The) | 14,331 | 1,148,630 | |
| Toro Co. (The) | 22,929 | 2,200,955 | |
| Watts Water Technologies, Inc., Class A | 6,043 | 1,258,999 | |
| $ 26,965,710 | |||
| Marine Transportation — 0.2% | |||
| Kirby Corp.(1) | 13,049 | $ 1,024,086 | |
| $ 1,024,086 | |||
| Media — 0.7% | |||
| Cable One, Inc. | 1,021 | $ 568,278 | |
| New York Times Co. (The), Class A | 36,128 | 1,769,911 | |
| Nexstar Media Group, Inc. | 7,117 | 1,115,590 | |
| TEGNA, Inc. | 43,490 | 665,397 | |
| $ 4,119,176 | |||
| Metals & Mining — 2.3% | |||
| Alcoa Corp. | 39,406 | $ 1,339,804 | |
| Cleveland-Cliffs, Inc.(1) | 111,473 | 2,276,279 | |
| Commercial Metals Co. | 25,813 | 1,291,682 | |
| MP Materials Corp.(1)(2) | 32,272 | 640,599 | |
| Reliance Steel & Aluminum Co. | 12,690 | 3,549,139 | |
| Royal Gold, Inc. | 14,505 | 1,754,525 | |
| United States Steel Corp. | 49,247 | 2,395,867 | |
| $ 13,247,895 | |||
| Mortgage Real Estate Investment Trusts (REITs) — 0.6% | |||
| Annaly Capital Management, Inc. | 110,771 | $ 2,145,634 | |
| Starwood Property Trust, Inc.(2) | 65,702 | 1,381,056 | |
| $ 3,526,690 | |||
| Multi-Utilities — 0.3% | |||
| Black Hills Corp. | 15,051 | $ 812,001 | |
| Northwestern Energy Group, Inc. | 13,466 | 685,285 | |
| $ 1,497,286 | |||
| Office REITs — 0.6% | |||
| COPT Defense Properties | 25,239 | $ 646,875 | |
| Cousins Properties, Inc. | 34,039 | 828,850 | |
| Kilroy Realty Corp. | 23,557 | 938,511 | |
| Vornado Realty Trust | 35,299 | 997,197 | |
| $ 3,411,433 | |||
| Security | Shares | Value | |
| Oil, Gas & Consumable Fuels — 3.9% | |||
| Antero Midstream Corp. | 75,203 | $ 942,294 | |
| Antero Resources Corp.(1) | 62,378 | 1,414,733 | |
| Chesapeake Energy Corp.(2) | 24,599 | 1,892,647 | |
| Chord Energy Corp. | 9,114 | 1,515,020 | |
| Civitas Resources, Inc. | 18,842 | 1,288,416 | |
| CNX Resources Corp.(1) | 35,075 | 701,500 | |
| DT Midstream, Inc. | 21,396 | 1,172,501 | |
| Equitrans Midstream Corp. | 95,664 | 973,860 | |
| HF Sinclair Corp. | 34,567 | 1,920,888 | |
| Matador Resources Co. | 24,464 | 1,391,023 | |
| Murphy Oil Corp. | 32,402 | 1,382,269 | |
| Ovintiv, Inc. | 56,039 | 2,461,233 | |
| PBF Energy, Inc., Class A | 24,014 | 1,055,656 | |
| Permian Resources Corp. | 91,912 | 1,250,003 | |
| Range Resources Corp. | 53,280 | 1,621,843 | |
| Southwestern Energy Co.(1) | 243,202 | 1,592,973 | |
| $ 22,576,859 | |||
| Paper & Forest Products — 0.2% | |||
| Louisiana-Pacific Corp. | 14,170 | $ 1,003,661 | |
| $ 1,003,661 | |||
| Personal Care Products — 0.5% | |||
| BellRing Brands, Inc.(1) | 29,023 | $ 1,608,745 | |
| Coty, Inc., Class A(1) | 82,690 | 1,027,010 | |
| $ 2,635,755 | |||
| Pharmaceuticals — 0.5% | |||
| Jazz Pharmaceuticals PLC(1) | 13,901 | $ 1,709,823 | |
| Perrigo Co. PLC | 30,366 | 977,178 | |
| $ 2,687,001 | |||
| Professional Services — 2.8% | |||
| ASGN, Inc.(1) | 10,422 | $ 1,002,284 | |
| CACI International, Inc., Class A(1) | 4,919 | 1,593,067 | |
| Concentrix Corp. | 10,456 | 1,026,884 | |
| ExlService Holdings, Inc.(1) | 36,415 | 1,123,403 | |
| Exponent, Inc. | 11,177 | 984,023 | |
| FTI Consulting, Inc.(1) | 7,841 | 1,561,535 | |
| Genpact, Ltd. | 36,851 | 1,279,098 | |
| Insperity, Inc. | 7,820 | 916,661 | |
| KBR, Inc. | 29,809 | 1,651,717 | |
| ManpowerGroup, Inc. | 10,777 | 856,448 | |
| Maximus, Inc. | 13,421 | 1,125,485 | |
| Paylocity Holding Corp.(1) | 9,551 | 1,574,482 | |
| Science Applications International Corp. | 11,688 | 1,453,052 | |
| $ 16,148,139 | |||
| Security | Shares | Value | |
| Real Estate Management & Development — 0.3% | |||
| Jones Lang LaSalle, Inc.(1) | 10,504 | $ 1,983,890 | |
| $ 1,983,890 | |||
| Residential REITs — 0.8% | |||
| Apartment Income REIT Corp. | 32,456 | $ 1,127,197 | |
| Equity LifeStyle Properties, Inc. | 41,155 | 2,903,074 | |
| Independence Realty Trust, Inc. | 50,331 | 770,064 | |
| $ 4,800,335 | |||
| Retail REITs — 1.2% | |||
| Agree Realty Corp. | 22,195 | $ 1,397,175 | |
| Brixmor Property Group, Inc. | 66,371 | 1,544,453 | |
| Kite Realty Group Trust | 48,440 | 1,107,339 | |
| NNN REIT, Inc. | 40,283 | 1,736,197 | |
| Spirit Realty Capital, Inc. | 31,206 | 1,363,390 | |
| $ 7,148,554 | |||
| Semiconductors & Semiconductor Equipment — 2.8% | |||
| Allegro MicroSystems, Inc.(1) | 15,964 | $ 483,230 | |
| Amkor Technology, Inc. | 23,147 | 770,101 | |
| Cirrus Logic, Inc.(1) | 11,901 | 990,044 | |
| Lattice Semiconductor Corp.(1) | 30,476 | 2,102,539 | |
| MACOM Technology Solutions Holdings, Inc.(1) | 12,100 | 1,124,695 | |
| MKS Instruments, Inc. | 13,881 | 1,427,939 | |
| Onto Innovation, Inc.(1) | 10,837 | 1,656,977 | |
| Power Integrations, Inc. | 12,554 | 1,030,809 | |
| Rambus, Inc.(1) | 23,738 | 1,620,119 | |
| Silicon Laboratories, Inc.(1) | 7,017 | 928,139 | |
| Synaptics, Inc.(1) | 8,655 | 987,362 | |
| Universal Display Corp. | 9,620 | 1,839,921 | |
| Wolfspeed, Inc.(1)(2) | 27,916 | 1,214,625 | |
| $ 16,176,500 | |||
| Software — 2.5% | |||
| Aspen Technology, Inc.(1) | 6,188 | $ 1,362,288 | |
| Blackbaud, Inc.(1) | 9,663 | 837,782 | |
| Commvault Systems, Inc.(1) | 9,840 | 785,724 | |
| Dolby Laboratories, Inc., Class A | 13,150 | 1,133,267 | |
| Dropbox, Inc., Class A(1) | 56,565 | 1,667,536 | |
| Dynatrace, Inc.(1) | 52,652 | 2,879,538 | |
| Manhattan Associates, Inc.(1) | 13,593 | 2,926,845 | |
| Qualys, Inc.(1) | 8,122 | 1,594,186 | |
| Teradata Corp.(1) | 21,594 | 939,555 | |
| $ 14,126,721 | |||
| Specialized REITs — 1.8% | |||
| CubeSmart | 49,649 | $ 2,301,231 | |
| EPR Properties | 16,893 | 818,466 | |
| Gaming and Leisure Properties, Inc. | 58,903 | 2,906,863 | |
| Lamar Advertising Co., Class A | 19,337 | 2,055,136 | |
| Security | Shares | Value | |
| Specialized REITs (continued) | |||
| National Storage Affiliates Trust | 17,060 | $ 707,478 | |
| PotlatchDeltic Corp. | 17,524 | 860,429 | |
| Rayonier, Inc. | 30,124 | 1,006,443 | |
| $ 10,656,046 | |||
| Specialty Retail — 3.8% | |||
| AutoNation, Inc.(1) | 5,727 | $ 860,081 | |
| Burlington Stores, Inc.(1) | 14,326 | 2,786,121 | |
| Dick's Sporting Goods, Inc. | 13,569 | 1,993,965 | |
| Five Below, Inc.(1) | 12,295 | 2,620,802 | |
| Floor & Decor Holdings, Inc., Class A(1) | 23,531 | 2,625,118 | |
| GameStop Corp., Class A(1)(2) | 59,972 | 1,051,309 | |
| Gap, Inc. (The) | 47,877 | 1,001,108 | |
| Lithia Motors, Inc. | 6,076 | 2,000,705 | |
| Murphy USA, Inc. | 4,275 | 1,524,294 | |
| Penske Automotive Group, Inc. | 4,377 | 702,552 | |
| RH (1) | 3,413 | 994,821 | |
| Valvoline, Inc.(1) | 30,617 | 1,150,587 | |
| Williams-Sonoma, Inc. | 14,163 | 2,857,810 | |
| $ 22,169,273 | |||
| Technology Hardware, Storage & Peripherals — 0.5% | |||
| Super Micro Computer, Inc.(1) | 10,241 | $ 2,911,107 | |
| $ 2,911,107 | |||
| Textiles, Apparel & Luxury Goods — 2.0% | |||
| Capri Holdings, Ltd.(1) | 25,661 | $ 1,289,209 | |
| Carter's, Inc. | 8,131 | 608,931 | |
| Columbia Sportswear Co. | 7,615 | 605,697 | |
| Crocs, Inc.(1) | 13,373 | 1,249,172 | |
| Deckers Outdoor Corp.(1) | 5,681 | 3,797,351 | |
| PVH Corp. | 13,342 | 1,629,325 | |
| Skechers USA, Inc., Class A(1) | 29,498 | 1,838,905 | |
| Under Armour, Inc., Class A(1) | 42,322 | 372,010 | |
| Under Armour, Inc., Class C(1) | 42,708 | 356,612 | |
| $ 11,747,212 | |||
| Trading Companies & Distributors — 1.4% | |||
| Core & Main, Inc., Class A(1) | 30,200 | $ 1,220,382 | |
| GATX Corp. | 7,939 | 954,426 | |
| MSC Industrial Direct Co., Inc., Class A | 10,237 | 1,036,599 | |
| Watsco, Inc. | 7,478 | 3,204,099 | |
| WESCO International, Inc. | 9,699 | 1,686,462 | |
| $ 8,101,968 | |||
| Security | Shares | Value | |
| Water Utilities — 0.4% | |||
| Essential Utilities, Inc. | 55,490 | $ 2,072,552 | |
| $ 2,072,552 | |||
| Total Common Stocks (identified cost $388,903,610) | $556,215,959 | ||
| Exchange-Traded Funds — 1.6% |
| Security | Shares | Value | |
| Equity Funds — 1.6% | |||
| SPDR S&P MidCap 400 ETF Trust(2) | 18,000 | $ 9,132,840 | |
| Total Exchange-Traded Funds (identified cost $8,317,249) | $ 9,132,840 | ||
| Short-Term Investments — 2.9% | |||
| Affiliated Fund — 1.8% | |||
| Security | Shares | Value | |
| Morgan Stanley Institutional Liquidity Funds - Government Portfolio, Institutional Class, 5.27%(3) | 10,638,718 | $ 10,638,718 | |
| Total Affiliated Fund (identified cost $10,638,718) | $ 10,638,718 | ||
| Securities Lending Collateral — 0.8% | |||
| Security | Shares | Value | |
| State Street Navigator Securities Lending Government Money Market Portfolio, 5.36%(4) | 4,497,977 | $ 4,497,977 | |
| Total Securities Lending Collateral (identified cost $4,497,977) | $ 4,497,977 | ||
| U.S. Treasury Obligations — 0.3% | |||
| Security | Principal Amount (000's omitted) | Value | |
| U.S. Treasury Bills, 0.00%, 10/3/24(5) | $ | 2,000 | $ 1,928,137 |
| Total U.S. Treasury Obligations (identified cost $1,922,260) | $ 1,928,137 | ||
| Total Short-Term Investments (identified cost $17,058,955) | $ 17,064,832 | ||
| Total Investments — 100.8% (identified cost $414,279,814) | $582,413,631 | ||
| Other Assets, Less Liabilities — (0.8)% | $ (4,905,437) | ||
| Net Assets — 100.0% | $ 577,508,194 |
| The percentage shown for each investment category in the Schedule of Investments is based on net assets. | |
| (1) | Non-income producing security. |
| (2) | All or a portion of this security was on loan at December 31, 2023. The aggregate market value of securities on loan at December 31, 2023 was $9,765,812. |
| (3) | May be deemed to be an affiliated investment company. The rate shown is the annualized seven-day yield as of December 31, 2023. |
| (4) | Represents investment of cash collateral received in connection with securities lending. |
| (5) | Security (or a portion thereof) has been pledged to cover margin requirements on open futures contracts. |
| Abbreviations: | |
| REITs | – Real Estate Investment Trusts |
| Description | Number of Contracts | Position | Expiration Date | Notional Amount | Value/ Unrealized Appreciation (Depreciation) |
| Equity Futures | |||||
| E-mini S&P MidCap 400 Index | 46 | Long | 3/15/24 | $12,923,700 | $ 330,480 |
| $330,480 |
| December 31, 2023 | |
| Assets | |
| Investments in securities of unaffiliated issuers, at value (identified cost $403,641,096) - including $9,765,812 of securities on loan | $ 571,774,913 |
| Investments in securities of affiliated issuers, at value (identified cost $10,638,718) | 10,638,718 |
| Receivable for investments sold | 507,361 |
| Receivable for capital shares sold | 104,234 |
| Dividends receivable | 751,792 |
| Dividends receivable - affiliated | 27,481 |
| Securities lending income receivable | 6,484 |
| Receivable from affiliates | 52,997 |
| Directors' deferred compensation plan | 112,989 |
| Total assets | $583,976,969 |
| Liabilities | |
| Payable for variation margin on open futures contracts | $ 120,520 |
| Payable for investments purchased | 710,605 |
| Payable for capital shares redeemed | 564,236 |
| Deposits for securities loaned | 4,497,977 |
| Payable to affiliates: | |
| Investment advisory fee | 94,770 |
| Administrative fee | 57,374 |
| Distribution fees | 61,039 |
| Sub-transfer agency fee | 235 |
| Directors' deferred compensation plan | 112,989 |
| Accrued expenses | 249,030 |
| Total liabilities | $ 6,468,775 |
| Net Assets | $577,508,194 |
| Sources of Net Assets | |
| Paid-in capital | $ 375,845,137 |
| Distributable earnings | 201,663,057 |
| Net Assets | $577,508,194 |
| Class I Shares | |
| Net Assets | $ 208,057,386 |
| Shares Outstanding | 1,739,600 |
| Net Asset Value, Offering Price and Redemption Price Per Share (net assets ÷ shares of beneficial interest outstanding) | $ 119.60 |
| Class F Shares | |
| Net Assets | $ 369,450,808 |
| Shares Outstanding | 3,096,052 |
| Net Asset Value, Offering Price and Redemption Price Per Share (net assets ÷ shares of beneficial interest outstanding) | $ 119.33 |
| Year Ended | |
| December 31, 2023 | |
| Investment Income | |
| Dividend income | $ 9,508,647 |
| Dividend income - affiliated issuers | 371,308 |
| Interest income | 96,264 |
| Securities lending income, net | 63,575 |
| Total investment income | $10,039,794 |
| Expenses | |
| Investment advisory fee | $ 1,110,878 |
| Administrative fee | 666,526 |
| Distribution fees: | |
| Class F | 679,424 |
| Directors' fees and expenses | 38,260 |
| Custodian fees | 15,791 |
| Transfer agency fees and expenses | 366,546 |
| Accounting fees | 128,210 |
| Professional fees | 55,100 |
| Reports to shareholders | 17,529 |
| Miscellaneous | 88,692 |
| Total expenses | $ 3,166,956 |
| Waiver and/or reimbursement of expenses by affiliates | $ (666,352) |
| Net expenses | $ 2,500,604 |
| Net investment income | $ 7,539,190 |
| Realized and Unrealized Gain (Loss) | |
| Net realized gain (loss): | |
| Investment securities | $ 24,162,465 |
| Futures contracts | 601,610 |
| Net realized gain | $24,764,075 |
| Change in unrealized appreciation (depreciation): | |
| Investment securities | $ 51,724,865 |
| Futures contracts | 670,810 |
| Net change in unrealized appreciation (depreciation) | $52,395,675 |
| Net realized and unrealized gain | $77,159,750 |
| Net increase in net assets from operations | $84,698,940 |
| Year Ended December 31, | ||
| 2023 | 2022 | |
| Increase (Decrease) in Net Assets | ||
| From operations: | ||
| Net investment income | $ 7,539,190 | $ 7,566,839 |
| Net realized gain | 24,764,075 | 22,445,594 |
| Net change in unrealized appreciation (depreciation) | 52,395,675 | (120,522,702) |
| Net increase (decrease) in net assets from operations | $ 84,698,940 | $ (90,510,269) |
| Distributions to shareholders: | ||
| Class I | $ (10,617,174) | $ (27,571,639) |
| Class F | (18,518,584) | (39,005,528) |
| Total distributions to shareholders | $ (29,135,758) | $ (66,577,167) |
| Capital share transactions: | ||
| Class I | $ (42,888,616) | $ 478,396 |
| Class F | 10,994,909 | 29,130,474 |
| Net increase (decrease) in net assets from capital share transactions | $ (31,893,707) | $ 29,608,870 |
| Net increase (decrease) in net assets | $ 23,669,475 | $(127,478,566) |
| Net Assets | ||
| At beginning of year | $ 553,838,719 | $ 681,317,285 |
| At end of year | $577,508,194 | $ 553,838,719 |
| Class I | |||||
| Year Ended December 31, | |||||
| 2023 | 2022 | 2021 | 2020 | 2019 | |
| Net asset value — Beginning of year | $ 109.06 | $ 144.47 | $ 120.57 | $ 111.74 | $ 97.01 |
| Income (Loss) From Operations | |||||
| Net investment income(1) | $ 1.68 | $ 1.75 | $ 1.47 | $ 1.42 | $ 1.63 |
| Net realized and unrealized gain (loss) | 15.17 | (22.25) | 27.67 | 12.48 | 22.45 |
| Total income (loss) from operations | $ 16.85 | $ (20.50) | $ 29.14 | $ 13.90 | $ 24.08 |
| Less Distributions | |||||
| From net investment income | $ (1.44) | $ (1.21) | $ (1.19) | $ (1.29) | $ (1.34) |
| From net realized gain | (4.87) | (13.70) | (4.05) | (3.78) | (8.01) |
| Total distributions | $ (6.31) | $ (14.91) | $ (5.24) | $ (5.07) | $ (9.35) |
| Net asset value — End of year | $ 119.60 | $ 109.06 | $ 144.47 | $ 120.57 | $ 111.74 |
| Total Return(2) | 16.12% | (13.33)% | 24.41% | 13.31% | 25.82% |
| Ratios/Supplemental Data | |||||
| Net assets, end of year (000’s omitted) | $208,057 | $227,923 | $293,422 | $259,042 | $233,933 |
| Ratios (as a percentage of average daily net assets):(3) | |||||
| Total expenses | 0.45% | 0.44% | 0.43% | 0.45% | 0.43% |
| Net expenses | 0.33% (4) | 0.33% (4) | 0.33% | 0.33% | 0.32% |
| Net investment income | 1.47% | 1.41% | 1.06% | 1.40% | 1.48% |
| Portfolio Turnover | 20% | 12% | 15% | 20% | 15% |
| (1) | Computed using average shares outstanding. |
| (2) | Returns are historical and are calculated by determining the percentage change in net asset value with all distributions reinvested and do not reflect fees and expenses imposed by variable annuity contracts or variable life insurance policies. If included, total return would be lower. |
| (3) | Total expenses do not reflect amounts reimbursed and/or waived by the adviser and certain of its affiliates, if applicable. Net expenses are net of all reductions and represent the net expenses paid by the Fund. |
| (4) | Includes a reduction by the investment adviser of a portion of its advisory fee due to the Fund’s investment in the Liquidity Fund (equal to less than 0.005% of average daily net assets for the years ended December 31, 2023 and 2022). |
| Class F | |||||
| Year Ended December 31, | |||||
| 2023 | 2022 | 2021 | 2020 | 2019 | |
| Net asset value — Beginning of year | $ 109.04 | $ 144.73 | $ 121.01 | $ 112.35 | $ 97.71 |
| Income (Loss) From Operations | |||||
| Net investment income(1) | $ 1.46 | $ 1.51 | $ 1.20 | $ 1.22 | $ 1.40 |
| Net realized and unrealized gain (loss) | 15.14 | (22.29) | 27.76 | 12.51 | 22.59 |
| Total income (loss) from operations | $ 16.60 | $ (20.78) | $ 28.96 | $ 13.73 | $ 23.99 |
| Less Distributions | |||||
| From net investment income | $ (1.44) | $ (1.21) | $ (1.19) | $ (1.29) | $ (1.34) |
| From net realized gain | (4.87) | (13.70) | (4.05) | (3.78) | (8.01) |
| Total distributions | $ (6.31) | $ (14.91) | $ (5.24) | $ (5.07) | $ (9.35) |
| Net asset value — End of year | $ 119.33 | $ 109.04 | $ 144.73 | $ 121.01 | $ 112.35 |
| Total Return(2) | 15.89% | (13.51)% | 24.17% | 13.10% | 25.55% |
| Ratios/Supplemental Data | |||||
| Net assets, end of year (000’s omitted) | $369,451 | $325,916 | $387,895 | $324,976 | $297,113 |
| Ratios (as a percentage of average daily net assets):(3) | |||||
| Total expenses | 0.65% | 0.64% | 0.63% | 0.65% | 0.63% |
| Net expenses | 0.53% (4) | 0.53% (4) | 0.53% | 0.53% | 0.54% |
| Net investment income | 1.28% | 1.22% | 0.86% | 1.20% | 1.26% |
| Portfolio Turnover | 20% | 12% | 15% | 20% | 15% |
| (1) | Computed using average shares outstanding. |
| (2) | Returns are historical and are calculated by determining the percentage change in net asset value with all distributions reinvested and do not reflect fees and expenses imposed by variable annuity contracts or variable life insurance policies. If included, total return would be lower. |
| (3) | Total expenses do not reflect amounts reimbursed and/or waived by the adviser and certain of its affiliates, if applicable. Net expenses are net of all reductions and represent the net expenses paid by the Fund. |
| (4) | Includes a reduction by the investment adviser of a portion of its advisory fee due to the Fund’s investment in the Liquidity Fund (equal to less than 0.005% of average daily net assets for the years ended December 31, 2023 and 2022). |
| Asset Description | Level 1 | Level 2 | Level 3 | Total |
| Common Stocks | $ 556,215,959(1) | $ — | $ — | $ 556,215,959 |
| Exchange-Traded Funds | 9,132,840 | — | — | 9,132,840 |
| Short-Term Investments: | ||||
| Affiliated Fund | 10,638,718 | — | — | 10,638,718 |
| Securities Lending Collateral | 4,497,977 | — | — | 4,497,977 |
| U.S. Treasury Obligations | — | 1,928,137 | — | 1,928,137 |
| Total Investments | $580,485,494 | $1,928,137 | $ — | $582,413,631 |
| Futures Contracts | $ 330,480 | $ — | $ — | $ 330,480 |
| Total | $580,815,974 | $1,928,137 | $ — | $582,744,111 |
| (1) | The level classification by major category of investments is the same as the category presentation in the Schedule of Investments. |
| Year Ended December 31, | ||
| 2023 | 2022 | |
| Ordinary income | $ 6,660,708 | $15,904,290 |
| Long-term capital gains | $22,475,050 | $50,672,877 |
| Undistributed ordinary income | $ 8,844,184 |
| Undistributed long-term capital gains | 24,508,950 |
| Net unrealized appreciation | 168,309,923 |
| Distributable earnings | $201,663,057 |
| Aggregate cost | $414,103,708 |
| Gross unrealized appreciation | $ 193,645,987 |
| Gross unrealized depreciation | (25,336,064) |
| Net unrealized appreciation | $168,309,923 |
| Derivative | Statement of Assets and Liabilities Caption | Assets | Liabilities | |
| Futures contracts | Distributable earnings | $330,480 (1) | $ — | |
| (1) | Only the current day's variation margin is reported within the Statement of Assets and Liabilities as Receivable or Payable for variation margin on open futures contracts, as applicable. |
| Statement of Operations Caption | |||
| Derivative | Net realized gain (loss): Futures contracts | Change in unrealized appreciation (depreciation): Futures contracts | |
| Futures contracts | $ 601,610 | $ 670,810 | |
| Remaining Contractual Maturity of the Transactions | |||||
| Overnight and Continuous | <30 days | 30 to 90 days | >90 days | Total | |
| Common Stocks | $ 2,741,014 | $ — | $ — | $ — | $ 2,741,014 |
| Exchange-Traded Funds | 1,756,963 | — | — | — | 1,756,963 |
| Total | $4,497,977 | $ — | $ — | $ — | $4,497,977 |
| Name | Value, beginning of period | Purchases | Sales proceeds | Net realized gain (loss) | Change in unrealized appreciation (depreciation) | Value, end of period | Dividend income | Shares, end of period |
| Short-Term Investments | ||||||||
| Liquidity Fund | $16,834,337 | $52,262,581 | $(58,458,200) | $ — | $ — | $10,638,718 | $371,308 | 10,638,718 |
| Year Ended December 31, 2023 | Year Ended December 31, 2022 | ||||
| Shares | Amount | Shares | Amount | ||
| Class I | |||||
| Shares sold | 89,851 | $ 10,315,554 | 147,564 | $ 17,917,339 | |
| Reinvestment of distributions | 98,912 | 10,617,174 | 273,773 | 27,571,639 | |
| Shares redeemed | (539,062) | (63,821,344) | (362,461) | (45,010,582) | |
| Net increase (decrease) | (350,299) | $(42,888,616) | 58,876 | $ 478,396 | |
| Class F | |||||
| Shares sold | 166,683 | $ 19,117,420 | 110,394 | $ 13,655,016 | |
| Reinvestment of distributions | 172,829 | 18,518,584 | 387,190 | 39,005,528 | |
| Shares redeemed | (232,414) | (26,641,095) | (188,809) | (23,530,070) | |
| Net increase | 107,098 | $ 10,994,909 | 308,775 | $ 29,130,474 | |
Boston, Massachusetts
February 16, 2024
| Name and Year of Birth | Corporation Position(s) | Length of Service | Principal Occupation(s) and Other Directorships During Past Five Years and Other Relevant Experience |
| Interested Director | |||
| Von M. Hughes(1) 1969 | Director and President | Since 2023 | President and Chief Executive Officer and Managing Director of Calvert Research and Management. Managing Director of Morgan Stanley Investment Management (MSIM) (since 2022). Formerly, Managing Director of PAAMCO Prisma (investment management firm) (2003-2022). Mr. Hughes is an interested person because of his positions with CRM and certain affiliates. Other Directorships. Tradeweb Markets Inc. (financial services) (2021-2022); National Association of Investment Companies (2018-2021). |
| Noninterested Directors | |||
| Alice Gresham Bullock 1950 | Chair and Director | Since 2016 (Chair); Since 2008 (Director) | Professor Emerita at Howard University School of Law. Dean Emerita of Howard University School of Law and Deputy Director of the Association of American Law Schools (1992-1994). Other Directorships. None. |
| Cari M. Dominguez 1949 | Director | Since 2016 | Former Chair of the U.S. Equal Employment Opportunity Commission. Other Directorships. ManpowerGroup Inc. (workforce solutions company); Triple S Management Corporation (managed care); National Association of Corporate Directors. |
| Karen Fang(2) 1958 | Director | Since 2023 | Formerly, Managing Director, Wealth Management at GAMCO Asset Management (asset management firm) (2020-2023). Formerly, Managing Director, Senior Portfolio Manager of Fiduciary Trust Company International (wealth management firm) (1993-2019). Other Directorships. None. |
| Miles D. Harper, III 1962 | Director | Since 2016 | Private investor (2022-present). Formerly, Partner, Carr Riggs & Ingram (public accounting firm) (2014-2022). Partner, Gainer Donnelly & Desroches (public accounting firm) (now Carr Riggs & Ingram) (1999-2014). Other Directorships. Bridgeway Funds (9) (asset management). |
| Joy V. Jones 1950 | Director | Since 2016 | Attorney. Other Directorships. Palm Management Corporation. |
| Eddie Ramos(2) 1967 | Director | Since 2023 | Private investor (2022-present). Formerly, Head of External Advisors/Diversity Portfolio Management at the New Jersey Division of Investment (2020-2022). Formerly, Chief Investment Officer and Lead Portfolio Manager – Global Fundamental Equities at Cornerstone Capital Management (asset management firm) (2011-2017). Other Directorships. Macquarie Optimum Funds (6) (asset management) (2022-2023). |
| Name and Year of Birth | Corporation Position(s) | Length of Service | Principal Occupation(s) and Other Directorships During Past Five Years and Other Relevant Experience |
| Noninterested Directors (continued) | |||
| Anthony A. Williams 1951 | Director | Since 2016 | CEO and Executive Director of the Federal City Council (July 2012 to present); Senior Adviser and Independent Consultant for King and Spalding LLP (September 2015 to present); Executive Director of Global Government Practice at the Corporate Executive Board (January 2010 to January 2012). Other Directorships. Freddie Mac; Evoq Properties/Meruelo Maddux Properties, Inc. (real estate management); Weston Solutions, Inc. (environmental services); Bipartisan Policy Center’s Debt Reduction Task Force; Chesapeake Bay Foundation; Catholic University of America; Urban Institute (research organization); The Howard Hughes Corporation (real estate development); Old Dominion National Bank. |
| Name and Year of Birth | Corporation Position(s) | Length of Service | Principal Occupation(s) During Past Five Years |
| Principal Officers who are not Directors | |||
| Hope L. Brown 1973 | Chief Compliance Officer | Since 2014 | Chief Compliance Officer of 46 registered investment companies advised by CRM (since 2014). Vice President and Chief Compliance Officer, Wilmington Funds (2012-2014). |
| Deidre E. Walsh 1971 | Secretary, Vice President and Chief Legal Officer | Since 2021 | Vice President of CRM and officer of 46 registered investment companies advised by CRM (since 2021). Also Vice President of Eaton Vance and certain of its affiliates and officer of 127 registered investment companies advised or administered by Eaton Vance. |
| James F. Kirchner 1967 | Treasurer | Since 2016 | Vice President of CRM and officer of 46 registered investment companies advised by CRM (since 2016). Also Vice President of Eaton Vance and certain of its affiliates and officer of 127 registered investment companies advised or administered by Eaton Vance. |
| (1) Mr. Hughes is an interested person of the Fund because of his positions with the Fund’s adviser and certain affiliates. | |||
| (2) Ms. Fang and Mr. Ramos began serving as Directors effective October 30, 2023. | |||
| Privacy Notice | April 2021 |
| FACTS | WHAT DOES EATON VANCE DO WITH YOUR PERSONAL INFORMATION? |
| Why? | Financial companies choose how they share your personal information. Federal law gives consumers the right to limit some but not all sharing. Federal law also requires us to tell you how we collect, share, and protect your personal information. Please read this notice carefully to understand what we do. |
| What? | The types of personal information we collect and share depend on the product or service you have with us. This information can include:■ Social Security number and income ■ investment experience and risk tolerance ■ checking account number and wire transfer instructions |
| How? | All financial companies need to share customers’ personal information to run their everyday business. In the section below, we list the reasons financial companies can share their customers’ personal information; the reasons Eaton Vance chooses to share; and whether you can limit this sharing. |
| Reasons we can share your personal information | Does Eaton Vance share? | Can you limit this sharing? |
| For our everyday business purposes — such as to process your transactions, maintain your account(s), respond to court orders and legal investigations, or report to credit bureaus | Yes | No |
| For our marketing purposes — to offer our products and services to you | Yes | No |
| For joint marketing with other financial companies | No | We don’t share |
| For our investment management affiliates’ everyday business purposes — information about your transactions, experiences, and creditworthiness | Yes | Yes |
| For our affiliates’ everyday business purposes — information about your transactions and experiences | Yes | No |
| For our affiliates’ everyday business purposes — information about your creditworthiness | No | We don’t share |
| For our investment management affiliates to market to you | Yes | Yes |
| For our affiliates to market to you | No | We don’t share |
| For nonaffiliates to market to you | No | We don’t share |
| To limit our sharing | Call toll-free 1-800-368-2745 or email: CRMPrivacy@calvert.comPlease note:If you are a new customer, we can begin sharing your information 30 days from the date we sent this notice. When you are no longer our customer, we continue to share your information as described in this notice. However, you can contact us at any time to limit our sharing. |
| Questions? | Call toll-free 1-800-368-2745 or email: CRMPrivacy@calvert.com |
| Privacy Notice — continued | April 2021 |
| Who we are | |
| Who is providing this notice? | Eaton Vance Management, Eaton Vance Distributors, Inc., Eaton Vance Trust Company, Eaton Vance Management (International) Limited, Eaton Vance Advisers International Ltd., Eaton Vance Global Advisors Limited, Eaton Vance Management’s Real Estate Investment Group, Boston Management and Research, Calvert Research and Management, Eaton Vance and Calvert Fund Families and our investment advisory affiliates (“Eaton Vance”) (see Investment Management Affiliates definition below) |
| What we do | |
| How does Eaton Vance protect my personal information? | To protect your personal information from unauthorized access and use, we use security measures that comply with federal law. These measures include computer safeguards and secured files and buildings. We have policies governing the proper handling of customer information by personnel and requiring third parties that provide support to adhere to appropriate security standards with respect to such information. |
| How does Eaton Vance collect my personal information? | We collect your personal information, for example, when you■ open an account or make deposits or withdrawals from your account ■ buy securities from us or make a wire transfer ■ give us your contact informationWe also collect your personal information from others, such as credit bureaus, affiliates, or other companies. |
| Why can’t I limit all sharing? | Federal law gives you the right to limit only■ sharing for affiliates’ everyday business purposes — information about your creditworthiness ■ affiliates from using your information to market to you ■ sharing for nonaffiliates to market to youState laws and individual companies may give you additional rights to limit sharing. See below for more on your rights under state law. |
| Definitions | |
| Investment Management Affiliates | Eaton Vance Investment Management Affiliates include registered investment advisers, registered broker- dealers, and registered and unregistered funds. Investment Management Affiliates does not include entities associated with Morgan Stanley Wealth Management, such as Morgan Stanley Smith Barney LLC and Morgan Stanley & Co. |
| Affiliates | Companies related by common ownership or control. They can be financial and nonfinancial companies.■ Our affiliates include companies with a Morgan Stanley name and financial companies such as Morgan Stanley Smith Barney LLC and Morgan Stanley & Co. |
| Nonaffiliates | Companies not related by common ownership or control. They can be financial and nonfinancial companies.■ Eaton Vance does not share with nonaffiliates so they can market to you. |
| Joint marketing | A formal agreement between nonaffiliated financial companies that together market financial products or services to you.■ Eaton Vance doesn’t jointly market. |
| Other important information | |
| Vermont: Except as permitted by law, we will not share personal information we collect about Vermont residents with Nonaffiliates unless you provide us with your written consent to share such information.California: Except as permitted by law, we will not share personal information we collect about California residents with Nonaffiliates and we will limit sharing such personal information with our Affiliates to comply with California privacy laws that apply to us. | |


| % Average Annual Total Returns1,2 | Class Inception Date | Performance Inception Date | One Year | Five Years | Ten Years |
| Class I at NAV | 04/27/2000 | 04/27/2000 | 16.60% | 9.69% | 6.77% |
| Class F at NAV | 10/04/2005 | 04/27/2000 | 16.36 | 9.47 | 6.53 |
| Russell 2000® Index | — | — | 16.93% | 9.97% | 7.15% |
| % Total Annual Operating Expense Ratios3 | Class I | Class F |
| Gross | 0.58% | 0.78% |
| Net | 0.40 | 0.60 |
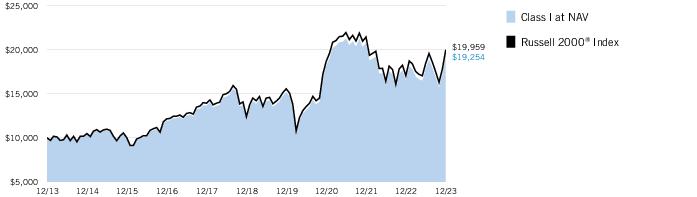
| Growth of Investment | Amount Invested | Period Beginning | At NAV | With Maximum Sales Charge |
| Class F | $10,000 | 12/31/2013 | $18,839 | N.A. |
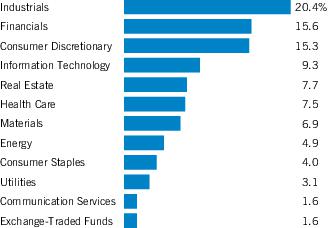
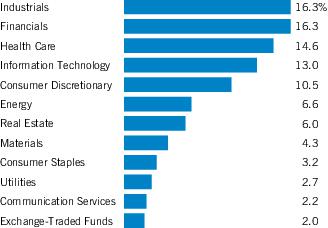
| Sector Allocation (% of net assets)1 |
| Top 10 Holdings (% of net assets)1 | |
| iShares Russell 2000 ETF | 2.0% |
| Super Micro Computer, Inc. | 0.5 |
| Simpson Manufacturing Co., Inc. | 0.3 |
| e.l.f. Beauty, Inc. | 0.3 |
| Cytokinetics, Inc. | 0.3 |
| MicroStrategy, Inc., Class A | 0.3 |
| UFP Industries, Inc. | 0.3 |
| Light & Wonder, Inc., Class A | 0.3 |
| Onto Innovation, Inc. | 0.3 |
| Rambus, Inc. | 0.3 |
| Total | 4.9% |
| 1 | Excludes cash and cash equivalents. |
| † | The views expressed in this report are those of the portfolio manager(s) and are current only through the date stated at the top of this page. These views are subject to change at any time based upon market or other conditions, and Calvert and the Fund(s) disclaim any responsibility to update such views. These views may not be relied upon as investment advice and, because investment decisions are based on many factors, may not be relied upon as an indication of trading intent on behalf of any Calvert fund. This commentary may contain statements that are not historical facts, referred to as “forward-looking statements.” The Fund’s actual future results may differ significantly from those stated in any forward-looking statement, depending on factors such as changes in securities or financial markets or general economic conditions, the volume of sales and purchases of Fund shares, the continuation of investment advisory, administrative and service contracts, and other risks discussed from time to time in the Fund’s filings with the Securities and Exchange Commission. |
| 1 | Russell 2000® Index is an unmanaged index of 2,000 U.S. small-cap stocks. Unless otherwise stated, index returns do not reflect the effect of any applicable sales charges, commissions, expenses, taxes or leverage, as applicable. It is not possible to invest directly in an index. |
| 2 | There is no sales charge. Insurance-related charges are not included in the calculation of returns. If such charges were reflected, the returns would be lower. Please refer to the report for your insurance contract for performance data reflecting insurance-related charges.Calvert Research and Management became the investment adviser to the Fund on December 31, 2016. Performance reflected prior to such date is that of the Fund’s former investment adviser. |
| 3 | Source: Fund prospectus. Net expense ratios reflect a contractual expense reimbursement that continues through 4/30/24. The expense ratios for the current reporting period can be found in the Financial Highlights section of this report. Performance reflects expenses waived and/or reimbursed, if applicable. Without such waivers and/or reimbursements, performance would have been lower. |
| Additional Information | |
| S&P 500® Index is an unmanaged index of large-cap stocks commonly used as a measure of U.S. stock market performance. Dow Jones Industrial Average® is a price-weighted average of 30 blue-chip stocks that are generally the leaders in their industry. S&P Dow Jones Indices are a product of S&P Dow Jones Indices LLC (“S&P DJI”) and have been licensed for use. S&P® and S&P 500® are registered trademarks of S&P DJI; Dow Jones® is a registered trademark of Dow Jones Trademark Holdings LLC (“Dow Jones”); S&P DJI, Dow Jones and their respective affiliates do not sponsor, endorse, sell or promote the Fund, will not have any liability with respect thereto and do not have any liability for any errors, omissions, or interruptions of the S&P Dow Jones Indices. Nasdaq Composite Index is a market capitalization-weighted index of all domestic and international securities listed on Nasdaq. Source: Nasdaq, Inc. The information is provided by Nasdaq (with its affiliates, are referred to as the “Corporations”) and Nasdaq’s third party licensors on an “as is” basis and the Corporations make no guarantees and bear no liability of any kind with respect to the information or the Fund. |
| Beginning Account Value (7/1/23) | Ending Account Value (12/31/23) | Expenses Paid During Period* (7/1/23 – 12/31/23) | Annualized Expense Ratio | |
| Actual | ||||
| Class I | $1,000.00 | $1,080.20 | $1.99 ** | 0.38% |
| Class F | $1,000.00 | $1,079.10 | $3.04 ** | 0.58% |
| Hypothetical | ||||
| (5% return per year before expenses) | ||||
| Class I | $1,000.00 | $1,023.29 | $1.94 ** | 0.38% |
| Class F | $1,000.00 | $1,022.28 | $2.96 ** | 0.58% |
| * | Expenses are equal to the Fund's annualized expense ratio for the indicated Class, multiplied by the average account value over the period, multiplied by 184/365 (to reflect the one-half year period). The Example assumes that the $1,000 was invested at the net asset value per share determined at the close of business on June 30, 2023. Expenses shown do not include insurance-related charges or direct expenses of Qualified Plans. |
| ** | Absent a waiver and/or reimbursement of expenses by affiliate(s), expenses would be higher. |
| Common Stocks — 95.7% |
| Security | Shares | Value | |
| Aerospace & Defense — 0.9% | |||
| AAR Corp.(1) | 3,429 | $ 213,970 | |
| AeroVironment, Inc.(1) | 2,695 | 339,678 | |
| AerSale Corp.(1) | 2,566 | 32,575 | |
| Archer Aviation, Inc., Class A(1)(2) | 15,049 | 92,401 | |
| Astronics Corp.(1) | 2,722 | 47,417 | |
| Cadre Holdings, Inc. | 1,931 | 63,511 | |
| Ducommun, Inc.(1) | 1,312 | 68,303 | |
| Eve Holding, Inc.(1)(2) | 1,495 | 10,943 | |
| Kaman Corp. | 2,777 | 66,509 | |
| Kratos Defense & Security Solutions, Inc.(1) | 13,206 | 267,950 | |
| Leonardo DRS, Inc.(1) | 6,761 | 135,490 | |
| Moog, Inc., Class A | 2,940 | 425,653 | |
| National Presto Industries, Inc. | 534 | 42,870 | |
| Park Aerospace Corp. | 1,804 | 26,519 | |
| Parsons Corp.(1) | 4,275 | 268,085 | |
| Redwire Corp.(1)(2) | 1,451 | 4,135 | |
| Rocket Lab USA, Inc.(1)(2) | 27,711 | 153,242 | |
| Terran Orbital Corp.(1)(2) | 8,404 | 9,581 | |
| Triumph Group, Inc.(1) | 6,405 | 106,195 | |
| V2X, Inc.(1) | 1,194 | 55,449 | |
| Virgin Galactic Holdings, Inc.(1) | 33,989 | 83,273 | |
| $ 2,513,749 | |||
| Air Freight & Logistics — 0.2% | |||
| Air Transport Services Group, Inc.(1) | 5,602 | $ 98,651 | |
| Forward Air Corp. | 2,600 | 163,462 | |
| Hub Group, Inc., Class A(1) | 3,256 | 299,357 | |
| Radiant Logistics, Inc.(1) | 3,434 | 22,802 | |
| $ 584,272 | |||
| Automobile Components — 1.3% | |||
| Adient PLC(1) | 9,500 | $ 345,420 | |
| American Axle & Manufacturing Holdings, Inc.(1) | 11,349 | 99,985 | |
| Atmus Filtration Technologies, Inc.(1) | 1,646 | 38,665 | |
| Cooper-Standard Holdings, Inc.(1) | 1,396 | 27,278 | |
| Dana, Inc. | 12,963 | 189,389 | |
| Dorman Products, Inc.(1) | 2,618 | 218,367 | |
| Fox Factory Holding Corp.(1) | 4,419 | 298,194 | |
| Gentherm, Inc.(1) | 3,292 | 172,369 | |
| Goodyear Tire & Rubber Co. (The)(1) | 29,166 | 417,657 | |
| Holley, Inc.(1)(2) | 5,177 | 25,212 | |
| LCI Industries | 2,560 | 321,818 | |
| Luminar Technologies, Inc.(1)(2) | 27,070 | 91,226 | |
| Modine Manufacturing Co.(1) | 5,330 | 318,201 | |
| Patrick Industries, Inc. | 2,123 | 213,043 | |
| Solid Power, Inc.(1)(2) | 15,286 | 22,165 | |
| Standard Motor Products, Inc. | 2,104 | 83,760 | |
| Stoneridge, Inc.(1) | 2,594 | 50,765 | |
| Visteon Corp.(1) | 2,796 | 349,220 | |
| Security | Shares | Value | |
| Automobile Components (continued) | |||
| XPEL, Inc.(1) | 2,248 | $ 121,055 | |
| $ 3,403,789 | |||
| Automobiles — 0.1% | |||
| Fisker, Inc.(1)(2) | 19,496 | $ 34,118 | |
| Livewire Group, Inc.(1) | 1,992 | 22,530 | |
| Winnebago Industries, Inc. | 2,950 | 214,996 | |
| Workhorse Group, Inc.(1)(2) | 11,961 | 4,306 | |
| $ 275,950 | |||
| Banks — 9.0% | |||
| 1st Source Corp. | 1,657 | $ 91,052 | |
| ACNB Corp. | 862 | 38,583 | |
| Amalgamated Financial Corp. | 1,744 | 46,983 | |
| Amerant Bancorp, Inc. | 2,588 | 63,587 | |
| American National Bankshares, Inc. | 942 | 45,923 | |
| Ameris Bancorp | 6,857 | 363,764 | |
| Ames National Corp. | 711 | 15,173 | |
| Arrow Financial Corp. | 1,264 | 35,316 | |
| Associated Banc-Corp. | 15,682 | 335,438 | |
| Atlantic Union Bankshares Corp. | 7,781 | 284,318 | |
| Axos Financial, Inc.(1) | 5,653 | 308,654 | |
| Banc of California, Inc. | 13,215 | 177,477 | |
| BancFirst Corp. | 2,191 | 213,250 | |
| Bancorp, Inc. (The)(1) | 5,316 | 204,985 | |
| Bank First Corp.(2) | 921 | 79,814 | |
| Bank of Hawaii Corp. | 4,063 | 294,405 | |
| Bank of Marin Bancorp | 1,552 | 34,175 | |
| Bank of NT Butterfield & Son, Ltd. (The) | 4,983 | 159,506 | |
| Bank7 Corp. | 308 | 8,424 | |
| BankUnited, Inc. | 7,706 | 249,906 | |
| Bankwell Financial Group, Inc. | 423 | 12,766 | |
| Banner Corp. | 3,404 | 182,318 | |
| Bar Harbor Bankshares | 1,466 | 43,042 | |
| Baycom Corp. | 964 | 22,741 | |
| BCB Bancorp, Inc. | 1,078 | 13,852 | |
| Berkshire Hills Bancorp, Inc. | 4,382 | 108,805 | |
| Blue Foundry Bancorp(1) | 2,149 | 20,781 | |
| Blue Ridge Bankshares, Inc.(2) | 1,360 | 4,121 | |
| Bridgewater Bancshares, Inc.(1) | 1,907 | 25,783 | |
| Brookline Bancorp, Inc. | 8,680 | 94,699 | |
| Burke & Herbert Financial Services Corp.(2) | 531 | 33,400 | |
| Business First Bancshares, Inc. | 2,368 | 58,371 | |
| Byline Bancorp, Inc. | 2,443 | 57,557 | |
| C&F Financial Corp. | 271 | 18,479 | |
| Cadence Bank | 18,459 | 546,202 | |
| Cambridge Bancorp | 750 | 52,050 | |
| Camden National Corp. | 1,409 | 53,021 | |
| Capital Bancorp, Inc. | 945 | 22,869 | |
| Capital City Bank Group, Inc. | 1,232 | 36,258 | |
| Capitol Federal Financial, Inc. | 12,693 | 81,870 | |
| Security | Shares | Value | |
| Banks (continued) | |||
| Capstar Financial Holdings, Inc. | 1,934 | $ 36,243 | |
| Carter Bankshares, Inc.(1) | 1,998 | 29,910 | |
| Cathay General Bancorp | 7,202 | 320,993 | |
| Central Pacific Financial Corp. | 2,337 | 45,992 | |
| Central Valley Community Bancorp | 825 | 18,439 | |
| Chemung Financial Corp. | 289 | 14,392 | |
| ChoiceOne Financial Services, Inc.(2) | 577 | 16,906 | |
| Citizens & Northern Corp. | 1,548 | 34,722 | |
| Citizens Financial Services, Inc. | 358 | 23,170 | |
| City Holding Co. | 1,513 | 166,823 | |
| Civista Bancshares, Inc. | 1,318 | 24,304 | |
| CNB Financial Corp. | 2,047 | 46,242 | |
| Coastal Financial Corp.(1) | 1,076 | 47,785 | |
| Codorus Valley Bancorp, Inc. | 792 | 20,354 | |
| Colony Bankcorp, Inc. | 1,228 | 16,332 | |
| Columbia Financial, Inc.(1) | 3,075 | 59,286 | |
| Community Bank System, Inc. | 5,517 | 287,491 | |
| Community Trust Bancorp, Inc. | 1,609 | 70,571 | |
| ConnectOne Bancorp, Inc. | 3,685 | 84,423 | |
| CrossFirst Bankshares, Inc.(1) | 4,396 | 59,698 | |
| Customers Bancorp, Inc.(1) | 2,844 | 163,871 | |
| CVB Financial Corp. | 13,784 | 278,299 | |
| Dime Community Bancshares, Inc. | 3,477 | 93,636 | |
| Eagle Bancorp, Inc. | 3,047 | 91,837 | |
| Eastern Bankshares, Inc. | 16,055 | 227,981 | |
| Enterprise Bancorp, Inc. | 790 | 25,485 | |
| Enterprise Financial Services Corp. | 3,608 | 161,097 | |
| Equity Bancshares, Inc., Class A | 1,296 | 43,934 | |
| Esquire Financial Holdings, Inc. | 711 | 35,522 | |
| ESSA Bancorp, Inc. | 718 | 14,374 | |
| Evans Bancorp, Inc. | 433 | 13,652 | |
| Farmers & Merchants Bancorp, Inc. | 1,340 | 33,232 | |
| Farmers National Banc Corp. | 3,664 | 52,945 | |
| FB Financial Corp. | 3,528 | 140,591 | |
| Fidelity D&D Bancorp, Inc. | 385 | 22,342 | |
| Financial Institutions, Inc. | 1,360 | 28,968 | |
| First Bancorp, Inc. (The) | 691 | 19,500 | |
| First Bancorp. | 3,957 | 146,449 | |
| First BanCorp. / Puerto Rico | 17,631 | 290,030 | |
| First Bancshares, Inc. (The) | 3,016 | 88,459 | |
| First Bank / Hamilton | 2,134 | 31,370 | |
| First Busey Corp. | 5,163 | 128,146 | |
| First Business Financial Services, Inc. | 601 | 24,100 | |
| First Commonwealth Financial Corp. | 10,176 | 157,117 | |
| First Community Bankshares, Inc. | 1,752 | 64,999 | |
| First Community Corp. | 609 | 13,112 | |
| First Financial Bancorp | 9,759 | 231,776 | |
| First Financial Bankshares, Inc. | 13,504 | 409,171 | |
| First Financial Corp. / IN | 1,159 | 49,872 | |
| First Foundation, Inc. | 4,983 | 48,235 | |
| First Interstate BancSystem, Inc., Class A | 8,559 | 263,189 | |
| Security | Shares | Value | |
| Banks (continued) | |||
| First Merchants Corp. | 6,125 | $ 227,115 | |
| First Mid Bancshares, Inc. | 2,306 | 79,926 | |
| First of Long Island Corp. (The) | 2,051 | 27,155 | |
| First Western Financial, Inc.(1) | 592 | 11,739 | |
| Five Star Bancorp | 1,323 | 34,636 | |
| Flushing Financial Corp. | 2,869 | 47,281 | |
| FS Bancorp, Inc. | 547 | 20,217 | |
| Fulton Financial Corp. | 16,178 | 266,290 | |
| FVCBankcorp, Inc.(1) | 1,120 | 15,904 | |
| German American Bancorp, Inc. | 2,788 | 90,359 | |
| Glacier Bancorp, Inc. | 11,274 | 465,842 | |
| Great Southern Bancorp, Inc. | 796 | 47,243 | |
| Greene County Bancorp, Inc. | 508 | 14,326 | |
| Guaranty Bancshares, Inc. | 732 | 24,610 | |
| Hancock Whitney Corp. | 8,990 | 436,824 | |
| Hanmi Financial Corp. | 3,003 | 58,258 | |
| HarborOne Bancorp, Inc. | 3,960 | 47,441 | |
| HBT Financial, Inc. | 1,324 | 27,950 | |
| Heartland Financial USA, Inc. | 4,203 | 158,075 | |
| Heritage Commerce Corp. | 5,845 | 57,982 | |
| Heritage Financial Corp. | 3,423 | 73,218 | |
| Hilltop Holdings, Inc. | 4,643 | 163,480 | |
| Hingham Institution for Savings (The) | 147 | 28,577 | |
| Home Bancorp, Inc. | 638 | 26,802 | |
| Home BancShares, Inc. | 19,281 | 488,388 | |
| HomeStreet, Inc. | 1,583 | 16,305 | |
| HomeTrust Bancshares, Inc. | 1,190 | 32,035 | |
| Hope Bancorp, Inc. | 11,475 | 138,618 | |
| Horizon Bancorp | 4,256 | 60,903 | |
| Independent Bank Corp. | 4,578 | 301,278 | |
| Independent Bank Corp. / MI | 1,993 | 51,858 | |
| Independent Bank Group, Inc. | 3,597 | 183,015 | |
| International Bancshares Corp. | 5,565 | 302,291 | |
| John Marshall Bancorp, Inc. | 1,260 | 28,426 | |
| Kearny Financial Corp. | 5,244 | 47,039 | |
| Lakeland Bancorp, Inc. | 6,201 | 91,713 | |
| Lakeland Financial Corp. | 2,469 | 160,880 | |
| LCNB Corp. | 873 | 13,767 | |
| Live Oak Bancshares, Inc. | 3,345 | 152,197 | |
| Luther Burbank Corp.(1) | 1,113 | 11,920 | |
| Macatawa Bank Corp. | 2,061 | 23,248 | |
| MainStreet Bancshares, Inc. | 575 | 14,266 | |
| Mercantile Bank Corp. | 1,548 | 62,508 | |
| Metrocity Bankshares, Inc. | 1,802 | 43,284 | |
| Metropolitan Bank Holding Corp.(1) | 1,034 | 57,263 | |
| Mid Penn Bancorp, Inc. | 1,112 | 26,999 | |
| Middlefield Banc Corp. | 649 | 21,008 | |
| Midland States Bancorp, Inc. | 2,135 | 58,841 | |
| MidWestOne Financial Group, Inc. | 1,404 | 37,782 | |
| MVB Financial Corp. | 1,120 | 25,267 | |
| National Bank Holdings Corp., Class A | 3,662 | 136,190 | |
| Security | Shares | Value | |
| Banks (continued) | |||
| National Bankshares, Inc. | 477 | $ 15,431 | |
| NBT Bancorp, Inc. | 4,746 | 198,905 | |
| Nicolet Bankshares, Inc. | 1,270 | 102,210 | |
| Northeast Bank | 765 | 42,220 | |
| Northeast Community Bancorp, Inc.(2) | 1,105 | 19,603 | |
| Northfield Bancorp, Inc. | 3,620 | 45,540 | |
| Northrim BanCorp, Inc. | 455 | 26,031 | |
| Northwest Bancshares, Inc. | 12,670 | 158,122 | |
| Norwood Financial Corp. | 609 | 20,042 | |
| Oak Valley Bancorp | 556 | 16,652 | |
| OceanFirst Financial Corp. | 5,792 | 100,549 | |
| OFG Bancorp | 4,635 | 173,720 | |
| Old National Bancorp | 29,615 | 500,197 | |
| Old Second Bancorp, Inc. | 4,314 | 66,608 | |
| Orange County Bancorp, Inc. | 422 | 25,421 | |
| Origin Bancorp, Inc. | 2,901 | 103,189 | |
| Orrstown Financial Services, Inc. | 900 | 26,550 | |
| Pacific Premier Bancorp, Inc. | 9,830 | 286,151 | |
| Park National Corp. | 1,425 | 189,325 | |
| Parke Bancorp, Inc. | 758 | 15,350 | |
| Pathward Financial, Inc. | 2,730 | 144,499 | |
| PCB Bancorp | 873 | 16,089 | |
| Peapack-Gladstone Financial Corp. | 1,683 | 50,187 | |
| Penns Woods Bancorp, Inc. | 566 | 12,741 | |
| Peoples Bancorp, Inc. | 3,365 | 113,602 | |
| Peoples Financial Services Corp. | 676 | 32,921 | |
| Pioneer Bancorp, Inc.(1) | 918 | 9,189 | |
| Plumas Bancorp | 452 | 18,690 | |
| Ponce Financial Group, Inc.(1) | 1,689 | 16,485 | |
| Preferred Bank / Los Angeles | 1,331 | 97,230 | |
| Premier Financial Corp. | 3,489 | 84,085 | |
| Primis Financial Corp. | 1,573 | 19,914 | |
| Princeton Bancorp, Inc. | 420 | 15,078 | |
| Provident Financial Services, Inc. | 7,300 | 131,619 | |
| QCR Holdings, Inc. | 1,639 | 95,701 | |
| RBB Bancorp | 1,736 | 33,053 | |
| Red River Bancshares, Inc. | 422 | 23,678 | |
| Renasant Corp. | 5,488 | 184,836 | |
| Republic Bancorp, Inc., Class A | 737 | 40,653 | |
| S&T Bancorp, Inc. | 3,866 | 129,202 | |
| Sandy Spring Bancorp, Inc. | 4,359 | 118,739 | |
| Seacoast Banking Corp. of Florida | 8,726 | 248,342 | |
| ServisFirst Bancshares, Inc. | 5,278 | 351,673 | |
| Shore Bancshares, Inc. | 3,085 | 43,961 | |
| Sierra Bancorp | 1,243 | 28,030 | |
| Simmons First National Corp., Class A | 12,555 | 249,091 | |
| SmartFinancial, Inc. | 1,564 | 38,302 | |
| South Plains Financial, Inc. | 1,206 | 34,926 | |
| Southern First Bancshares, Inc.(1) | 613 | 22,742 | |
| Southern Missouri Bancorp, Inc. | 983 | 52,482 | |
| Southern States Bancshares, Inc. | 620 | 18,154 | |
| Security | Shares | Value | |
| Banks (continued) | |||
| Southside Bancshares, Inc. | 2,903 | $ 90,922 | |
| SouthState Corp. | 7,713 | 651,363 | |
| Stellar Bancorp, Inc. | 4,840 | 134,746 | |
| Sterling Bancorp, Inc.(1) | 1,284 | 7,409 | |
| Stock Yards Bancorp, Inc. | 2,698 | 138,920 | |
| Summit Financial Group, Inc. | 955 | 29,309 | |
| Texas Capital Bancshares, Inc.(1) | 4,962 | 320,694 | |
| Third Coast Bancshares, Inc.(1) | 958 | 19,035 | |
| Timberland Bancorp, Inc. | 623 | 19,600 | |
| Tompkins Financial Corp. | 1,378 | 82,997 | |
| TowneBank | 6,978 | 207,665 | |
| TriCo Bancshares | 3,089 | 132,734 | |
| Triumph Financial, Inc.(1) | 2,209 | 177,118 | |
| TrustCo Bank Corp. | 1,927 | 59,833 | |
| Trustmark Corp. | 6,050 | 168,674 | |
| UMB Financial Corp. | 4,588 | 383,327 | |
| United Bankshares, Inc. | 13,227 | 496,674 | |
| United Community Banks, Inc. | 11,976 | 350,418 | |
| Unity Bancorp, Inc. | 528 | 15,624 | |
| Univest Financial Corp. | 2,862 | 63,050 | |
| USCB Financial Holdings, Inc.(1) | 808 | 9,898 | |
| Valley National Bancorp | 43,633 | 473,854 | |
| Veritex Holdings, Inc. | 5,216 | 121,376 | |
| Virginia National Bankshares Corp. | 390 | 13,408 | |
| WaFd, Inc. | 6,514 | 214,701 | |
| Washington Trust Bancorp, Inc. | 1,669 | 54,042 | |
| WesBanco, Inc. | 5,737 | 179,970 | |
| West BanCorp, Inc. | 1,387 | 29,404 | |
| Westamerica BanCorp. | 2,600 | 146,666 | |
| WSFS Financial Corp. | 6,343 | 291,334 | |
| $ 24,088,099 | |||
| Beverages — 0.4% | |||
| Coca-Cola Consolidated, Inc. | 495 | $ 459,558 | |
| Duckhorn Portfolio, Inc. (The)(1) | 4,331 | 42,660 | |
| MGP Ingredients, Inc. | 1,577 | 155,366 | |
| National Beverage Corp.(1) | 2,357 | 117,190 | |
| Primo Water Corp. | 16,211 | 243,975 | |
| Vita Coco Co., Inc. (The)(1) | 2,841 | 72,872 | |
| Zevia PBC, Class A(1) | 2,059 | 4,139 | |
| $ 1,095,760 | |||
| Biotechnology — 7.1% | |||
| 2seventy bio, Inc.(1)(2) | 4,148 | $ 17,712 | |
| 4D Molecular Therapeutics, Inc.(1) | 3,929 | 79,602 | |
| 89bio, Inc.(1) | 6,142 | 68,606 | |
| Aadi Bioscience, Inc.(1) | 1,086 | 2,194 | |
| ACADIA Pharmaceuticals, Inc.(1) | 12,544 | 392,753 | |
| ACELYRIN, Inc.(1)(2) | 3,322 | 24,782 | |
| Acrivon Therapeutics, Inc.(1) | 695 | 3,419 | |
| Actinium Pharmaceuticals, Inc.(1)(2) | 2,148 | 10,912 | |
| Security | Shares | Value | |
| Biotechnology (continued) | |||
| Adicet Bio, Inc.(1)(2) | 2,145 | $ 4,054 | |
| ADMA Biologics, Inc.(1) | 20,929 | 94,599 | |
| Aerovate Therapeutics, Inc.(1) | 772 | 17,470 | |
| Agenus, Inc.(1) | 34,082 | 28,216 | |
| Agios Pharmaceuticals, Inc.(1) | 5,519 | 122,908 | |
| Akero Therapeutics, Inc.(1) | 5,145 | 120,136 | |
| Aldeyra Therapeutics, Inc.(1) | 3,846 | 13,499 | |
| Alector, Inc.(1) | 6,260 | 49,955 | |
| Alkermes PLC(1) | 16,721 | 463,841 | |
| Allakos, Inc.(1) | 5,490 | 14,988 | |
| Allogene Therapeutics, Inc.(1)(2) | 8,104 | 26,014 | |
| Allovir, Inc.(1)(2) | 2,408 | 1,637 | |
| Alpine Immune Sciences, Inc.(1) | 3,371 | 64,251 | |
| Altimmune, Inc.(1)(2) | 5,470 | 61,537 | |
| ALX Oncology Holdings, Inc.(1) | 2,790 | 41,543 | |
| Amicus Therapeutics, Inc.(1) | 29,416 | 417,413 | |
| AnaptysBio, Inc.(1) | 1,512 | 32,387 | |
| Anavex Life Sciences Corp.(1)(2) | 6,976 | 64,947 | |
| Anika Therapeutics, Inc.(1) | 1,202 | 27,237 | |
| Annexon, Inc.(1)(2) | 3,769 | 17,111 | |
| Apogee Therapeutics, Inc.(1) | 1,954 | 54,595 | |
| Arbutus Biopharma Corp.(1)(2) | 9,124 | 22,810 | |
| Arcellx, Inc.(1) | 3,970 | 220,335 | |
| Arcturus Therapeutics Holdings, Inc.(1) | 2,317 | 73,055 | |
| Arcus Biosciences, Inc.(1) | 5,242 | 100,122 | |
| Arcutis Biotherapeutics, Inc.(1)(2) | 5,071 | 16,379 | |
| Ardelyx, Inc.(1) | 23,865 | 147,963 | |
| Arrowhead Pharmaceuticals, Inc.(1) | 10,186 | 311,692 | |
| ARS Pharmaceuticals, Inc.(1) | 2,002 | 10,971 | |
| Astria Therapeutics, Inc.(1) | 2,110 | 16,205 | |
| Atara Biotherapeutics, Inc.(1) | 6,782 | 3,478 | |
| Aura Biosciences, Inc.(1) | 2,268 | 20,094 | |
| Aurinia Pharmaceuticals, Inc.(1)(2) | 13,454 | 120,951 | |
| Avid Bioservices, Inc.(1) | 6,166 | 40,079 | |
| Avidity Biosciences, Inc.(1) | 7,024 | 63,567 | |
| Avita Medical, Inc.(1) | 2,076 | 28,483 | |
| Beam Therapeutics, Inc.(1)(2) | 7,503 | 204,232 | |
| BioAtla, Inc.(1) | 3,653 | 8,986 | |
| BioCryst Pharmaceuticals, Inc.(1) | 18,832 | 112,804 | |
| Biohaven, Ltd.(1) | 7,082 | 303,110 | |
| Biomea Fusion, Inc.(1)(2) | 1,641 | 23,827 | |
| BioVie, Inc.(1) | 274 | 345 | |
| Bioxcel Therapeutics, Inc.(1)(2) | 1,350 | 3,983 | |
| Bluebird Bio, Inc.(1) | 8,694 | 11,998 | |
| Blueprint Medicines Corp.(1) | 6,142 | 566,538 | |
| Bridgebio Pharma, Inc.(1) | 11,540 | 465,870 | |
| Cabaletta Bio, Inc.(1) | 3,452 | 78,360 | |
| CareDx, Inc.(1) | 5,133 | 61,596 | |
| Caribou Biosciences, Inc.(1) | 7,487 | 42,901 | |
| Carisma Therapeutics, Inc. | 2,202 | 6,452 | |
| Cartesian Therapeutics, Inc.(1) | 9,591 | 6,612 | |
| Security | Shares | Value | |
| Biotechnology (continued) | |||
| Catalyst Pharmaceuticals, Inc.(1) | 10,396 | $ 174,757 | |
| Celcuity, Inc.(1) | 1,423 | 20,733 | |
| Celldex Therapeutics, Inc.(1) | 4,616 | 183,071 | |
| Century Therapeutics, Inc.(1) | 905 | 3,005 | |
| Cerevel Therapeutics Holdings, Inc.(1) | 7,236 | 306,806 | |
| Cogent Biosciences, Inc.(1) | 8,129 | 47,799 | |
| Coherus Biosciences, Inc.(1)(2) | 9,819 | 32,697 | |
| Compass Therapeutics, Inc.(1) | 7,536 | 11,756 | |
| Crinetics Pharmaceuticals, Inc.(1) | 6,759 | 240,485 | |
| Cue Biopharma, Inc.(1) | 2,854 | 7,535 | |
| Cullinan Oncology, Inc.(1) | 1,984 | 20,217 | |
| Cytokinetics, Inc.(1) | 9,381 | 783,220 | |
| Day One Biopharmaceuticals, Inc.(1) | 6,279 | 91,673 | |
| Deciphera Pharmaceuticals, Inc.(1) | 5,166 | 83,328 | |
| Denali Therapeutics, Inc.(1) | 12,230 | 262,456 | |
| Design Therapeutics, Inc.(1) | 2,570 | 6,810 | |
| Disc Medicine, Inc.(1) | 885 | 51,118 | |
| Dynavax Technologies Corp.(1) | 12,878 | 180,034 | |
| Dyne Therapeutics, Inc.(1) | 4,605 | 61,246 | |
| Eagle Pharmaceuticals, Inc.(1) | 867 | 4,534 | |
| Editas Medicine, Inc.(1) | 8,245 | 83,522 | |
| Emergent BioSolutions, Inc.(1)(2) | 3,841 | 9,218 | |
| Enanta Pharmaceuticals, Inc.(1) | 1,973 | 18,566 | |
| Entrada Therapeutics, Inc.(1) | 1,767 | 26,664 | |
| Erasca, Inc.(1) | 4,957 | 10,558 | |
| Fate Therapeutics, Inc.(1) | 8,358 | 31,259 | |
| Fennec Pharmaceuticals, Inc.(1) | 1,499 | 16,819 | |
| FibroGen, Inc.(1)(2) | 7,057 | 6,255 | |
| Foghorn Therapeutics, Inc.(1) | 1,534 | 9,894 | |
| Genelux Corp.(1) | 1,860 | 26,059 | |
| Generation Bio Co.(1) | 3,277 | 5,407 | |
| Geron Corp.(1)(2) | 49,479 | 104,401 | |
| Graphite Bio, Inc.(1) | 2,314 | 6,063 | |
| Gritstone bio, Inc.(1) | 7,248 | 14,786 | |
| Halozyme Therapeutics, Inc.(1) | 13,115 | 484,730 | |
| Heron Therapeutics, Inc.(1)(2) | 7,128 | 12,118 | |
| HilleVax, Inc.(1) | 2,714 | 43,560 | |
| Humacyte, Inc.(1)(2) | 4,704 | 13,359 | |
| Icosavax, Inc.(1) | 2,705 | 42,631 | |
| Ideaya Biosciences, Inc.(1) | 6,230 | 221,663 | |
| IGM Biosciences, Inc.(1) | 627 | 5,210 | |
| Immuneering Corp., Class A(1) | 1,675 | 12,311 | |
| ImmunityBio, Inc.(1)(2) | 13,724 | 68,894 | |
| ImmunoGen, Inc.(1) | 24,261 | 719,339 | |
| Immunovant, Inc.(1) | 5,585 | 235,296 | |
| Inhibrx, Inc.(1)(2) | 3,412 | 129,656 | |
| Inozyme Pharma, Inc.(1) | 4,805 | 20,469 | |
| Insmed, Inc.(1) | 14,309 | 443,436 | |
| Intellia Therapeutics, Inc.(1) | 9,133 | 278,465 | |
| Iovance Biotherapeutics, Inc.(1) | 22,989 | 186,901 | |
| Ironwood Pharmaceuticals, Inc.(1) | 13,773 | 157,563 | |
| Security | Shares | Value | |
| Biotechnology (continued) | |||
| iTeos Therapeutics, Inc.(1) | 2,444 | $ 26,762 | |
| Janux Therapeutics, Inc.(1)(2) | 1,706 | 18,305 | |
| KalVista Pharmaceuticals, Inc.(1) | 2,468 | 30,233 | |
| Karyopharm Therapeutics, Inc.(1) | 6,194 | 5,358 | |
| Keros Therapeutics, Inc.(1) | 2,236 | 88,903 | |
| Kezar Life Sciences, Inc.(1) | 4,127 | 3,910 | |
| Kiniksa Pharmaceuticals, Ltd., Class A(1) | 3,094 | 54,269 | |
| Kodiak Sciences, Inc.(1) | 2,568 | 7,807 | |
| Krystal Biotech, Inc.(1) | 2,237 | 277,522 | |
| Kura Oncology, Inc.(1) | 7,304 | 105,032 | |
| Kymera Therapeutics, Inc.(1)(2) | 3,775 | 96,111 | |
| Larimar Therapeutics, Inc.(1) | 2,118 | 9,637 | |
| Lexicon Pharmaceuticals, Inc.(1)(2) | 5,367 | 8,212 | |
| Lineage Cell Therapeutics, Inc.(1) | 10,656 | 11,615 | |
| Lyell Immunopharma, Inc.(1)(2) | 17,114 | 33,201 | |
| MacroGenics, Inc.(1) | 6,300 | 60,606 | |
| Madrigal Pharmaceuticals, Inc.(1) | 1,532 | 354,474 | |
| MannKind Corp.(1)(2) | 25,517 | 92,882 | |
| MeiraGTx Holdings PLC(1) | 2,356 | 16,539 | |
| Merrimack Pharmaceuticals, Inc.(1) | 865 | 11,600 | |
| Mersana Therapeutics, Inc.(1) | 9,896 | 22,959 | |
| MiMedx Group, Inc.(1) | 11,316 | 99,241 | |
| Mineralys Therapeutics, Inc.(1)(2) | 972 | 8,359 | |
| Mirum Pharmaceuticals, Inc.(1) | 2,637 | 77,844 | |
| Monte Rosa Therapeutics, Inc.(1) | 2,241 | 12,662 | |
| Morphic Holding, Inc.(1) | 3,804 | 109,860 | |
| Mural Oncology PLC(1) | 1,648 | 9,756 | |
| Myriad Genetics, Inc.(1) | 8,027 | 153,637 | |
| Nkarta, Inc.(1)(2) | 2,431 | 16,045 | |
| Novavax, Inc.(1)(2) | 8,587 | 41,218 | |
| Nurix Therapeutics, Inc.(1) | 4,621 | 47,689 | |
| Nuvalent, Inc., Class A(1) | 2,751 | 202,446 | |
| Nuvectis Pharma, Inc.(1) | 566 | 4,720 | |
| Ocean Biomedical, Inc.(1) | 717 | 473 | |
| Olema Pharmaceuticals, Inc.(1) | 2,217 | 31,105 | |
| Omega Therapeutics, Inc.(1)(2) | 2,013 | 6,059 | |
| Organogenesis Holdings, Inc.(1) | 5,386 | 22,029 | |
| ORIC Pharmaceuticals, Inc.(1) | 3,223 | 29,652 | |
| Outlook Therapeutics, Inc.(1) | 12,147 | 4,786 | |
| Ovid Therapeutics, Inc.(1) | 4,924 | 15,855 | |
| PDS Biotechnology Corp.(1) | 2,309 | 11,476 | |
| PepGen, Inc.(1) | 1,175 | 7,990 | |
| PMV Pharmaceuticals, Inc.(1) | 3,772 | 11,693 | |
| Poseida Therapeutics, Inc.(1) | 5,612 | 18,856 | |
| Precigen, Inc.(1)(2) | 13,542 | 18,146 | |
| Prelude Therapeutics, Inc.(1) | 819 | 3,497 | |
| Prime Medicine, Inc.(1) | 3,901 | 34,563 | |
| ProKidney Corp.(1) | 4,510 | 8,028 | |
| Protagonist Therapeutics, Inc.(1) | 5,912 | 135,562 | |
| Protalix BioTherapeutics, Inc.(1)(2) | 4,638 | 8,256 | |
| Prothena Corp. PLC(1) | 4,368 | 158,733 | |
| Security | Shares | Value | |
| Biotechnology (continued) | |||
| PTC Therapeutics, Inc.(1) | 7,459 | $ 205,570 | |
| Rallybio Corp.(1)(2) | 2,525 | 6,035 | |
| Rapt Therapeutics, Inc.(1) | 2,913 | 72,388 | |
| RayzeBio, Inc.(1) | 2,080 | 129,314 | |
| Recursion Pharmaceuticals, Inc., Class A(1)(2) | 13,560 | 133,702 | |
| REGENXBIO, Inc.(1) | 4,037 | 72,464 | |
| Relay Therapeutics, Inc.(1) | 8,970 | 98,760 | |
| Reneo Pharmaceuticals, Inc.(1) | 799 | 1,278 | |
| Replimune Group, Inc.(1) | 4,017 | 33,863 | |
| REVOLUTION Medicines, Inc.(1) | 14,889 | 427,017 | |
| Rhythm Pharmaceuticals, Inc.(1) | 5,318 | 244,468 | |
| Rigel Pharmaceuticals, Inc.(1) | 14,810 | 21,474 | |
| Rocket Pharmaceuticals, Inc.(1) | 6,494 | 194,625 | |
| Sage Therapeutics, Inc.(1) | 5,253 | 113,833 | |
| Sagimet Biosciences, Inc., Class A(1)(2) | 525 | 2,846 | |
| Sana Biotechnology, Inc.(1)(2) | 9,266 | 37,805 | |
| Sangamo Therapeutics, Inc.(1) | 9,803 | 5,326 | |
| Savara, Inc.(1) | 9,054 | 42,554 | |
| Scholar Rock Holding Corp.(1)(2) | 5,742 | 107,950 | |
| Seres Therapeutics, Inc.(1) | 8,033 | 11,246 | |
| SpringWorks Therapeutics, Inc.(1) | 6,947 | 253,565 | |
| Stoke Therapeutics, Inc.(1)(2) | 2,278 | 11,982 | |
| Summit Therapeutics, Inc.(1) | 9,569 | 24,975 | |
| Sutro Biopharma, Inc.(1) | 4,967 | 21,308 | |
| Syndax Pharmaceuticals, Inc.(1) | 6,546 | 141,459 | |
| Tango Therapeutics, Inc.(1) | 4,378 | 43,342 | |
| Tenaya Therapeutics, Inc.(1) | 3,317 | 10,747 | |
| TG Therapeutics, Inc.(1)(2) | 14,355 | 245,183 | |
| Travere Therapeutics, Inc.(1) | 7,238 | 65,070 | |
| Turnstone Biologics Corp.(1) | 630 | 1,603 | |
| Twist Bioscience Corp.(1) | 5,655 | 208,443 | |
| Tyra Biosciences, Inc.(1) | 940 | 13,019 | |
| UroGen Pharma, Ltd.(1) | 2,816 | 42,240 | |
| Vanda Pharmaceuticals, Inc.(1) | 4,281 | 18,066 | |
| Vaxcyte, Inc.(1) | 9,495 | 596,286 | |
| Vaxxinity, Inc., Class A(1) | 3,519 | 2,991 | |
| Vera Therapeutics, Inc.(1) | 3,312 | 50,939 | |
| Veracyte, Inc.(1) | 7,233 | 198,980 | |
| Vericel Corp.(1) | 4,732 | 168,507 | |
| Verve Therapeutics, Inc.(1) | 5,040 | 70,258 | |
| Vigil Neuroscience, Inc.(1) | 1,327 | 4,485 | |
| Viking Therapeutics, Inc.(1) | 9,553 | 177,781 | |
| Vir Biotechnology, Inc.(1) | 8,321 | 83,709 | |
| Viridian Therapeutics, Inc.(1)(2) | 4,162 | 90,648 | |
| Vor BioPharma, Inc.(1) | 3,111 | 7,000 | |
| Voyager Therapeutics, Inc.(1) | 2,623 | 22,138 | |
| X4 Pharmaceuticals, Inc.(1) | 10,167 | 8,525 | |
| Xencor, Inc.(1) | 5,763 | 122,348 | |
| XOMA Corp.(1) | 604 | 11,174 | |
| Y-mAbs Therapeutics, Inc.(1) | 2,645 | 18,039 | |
| Zentalis Pharmaceuticals, Inc.(1) | 5,837 | 88,431 | |
| Security | Shares | Value | |
| Biotechnology (continued) | |||
| Zura Bio, Ltd.(1) | 626 | $ 2,923 | |
| Zymeworks, Inc.(1) | 5,616 | 58,350 | |
| $ 18,943,673 | |||
| Broadline Retail — 0.1% | |||
| Big Lots, Inc. | 2,101 | $ 16,367 | |
| ContextLogic, Inc., Class A(1)(2) | 1,423 | 8,467 | |
| Dillard's, Inc., Class A(2) | 360 | 145,314 | |
| Qurate Retail, Inc., Class B(1) | 110 | 719 | |
| Savers Value Village, Inc.(1) | 2,598 | 45,153 | |
| $ 216,020 | |||
| Building Products — 1.9% | |||
| AAON, Inc. | 6,847 | $ 505,788 | |
| American Woodmark Corp.(1) | 1,656 | 153,760 | |
| Apogee Enterprises, Inc. | 2,197 | 117,342 | |
| AZZ, Inc. | 2,467 | 143,308 | |
| CSW Industrials, Inc. | 1,597 | 331,234 | |
| Gibraltar Industries, Inc.(1) | 3,081 | 243,337 | |
| Griffon Corp. | 4,362 | 265,864 | |
| Insteel Industries, Inc. | 1,863 | 71,334 | |
| Janus International Group, Inc.(1) | 8,442 | 110,168 | |
| JELD-WEN Holding, Inc.(1) | 8,463 | 159,781 | |
| Masonite International Corp.(1) | 2,302 | 194,887 | |
| MasterBrand, Inc.(1) | 12,895 | 191,491 | |
| PGT Innovations, Inc.(1) | 5,781 | 235,287 | |
| Quanex Building Products Corp. | 3,282 | 100,331 | |
| Resideo Technologies, Inc.(1) | 15,172 | 285,537 | |
| Simpson Manufacturing Co., Inc. | 4,348 | 860,817 | |
| UFP Industries, Inc. | 6,084 | 763,846 | |
| Zurn Elkay Water Solutions Corp., Class C | 15,329 | 450,826 | |
| $ 5,184,938 | |||
| Capital Markets — 1.3% | |||
| AlTi Global, Inc.(1)(2) | 1,737 | $ 15,216 | |
| Artisan Partners Asset Management, Inc., Class A | 6,364 | 281,162 | |
| Assetmark Financial Holdings, Inc.(1) | 2,169 | 64,962 | |
| B. Riley Financial, Inc. | 1,858 | 38,999 | |
| Bakkt Holdings, Inc.(1)(2) | 4,263 | 9,506 | |
| BGC Group, Inc., Class A | 37,090 | 267,790 | |
| Brightsphere Investment Group, Inc. | 3,238 | 62,040 | |
| Cohen & Steers, Inc. | 2,585 | 195,762 | |
| Diamond Hill Investment Group, Inc. | 250 | 41,398 | |
| Donnelley Financial Solutions, Inc.(1) | 2,459 | 153,368 | |
| Forge Global Holdings, Inc.(1) | 9,074 | 31,124 | |
| GCM Grosvenor, Inc., Class A | 3,365 | 30,150 | |
| Hamilton Lane, Inc., Class A | 3,785 | 429,370 | |
| MarketWise, Inc. | 1,277 | 3,486 | |
| Moelis & Co., Class A | 6,920 | 388,420 | |
| Open Lending Corp., Class A(1) | 9,892 | 84,181 | |
| P10, Inc., Class A | 4,525 | 46,245 | |
| Security | Shares | Value | |
| Capital Markets (continued) | |||
| Patria Investments, Ltd., Class A | 5,365 | $ 83,211 | |
| Perella Weinberg Partners | 4,355 | 53,262 | |
| Piper Sandler Cos. | 1,797 | 314,241 | |
| PJT Partners, Inc., Class A(2) | 2,418 | 246,322 | |
| Silvercrest Asset Management Group, Inc., Class A | 744 | 12,648 | |
| StepStone Group, Inc., Class A | 5,363 | 170,704 | |
| StoneX Group, Inc.(1) | 2,776 | 204,952 | |
| Value Line, Inc. | 91 | 4,436 | |
| Victory Capital Holdings, Inc., Class A | 2,755 | 94,882 | |
| Virtus Investment Partners, Inc. | 689 | 166,573 | |
| WisdomTree, Inc. | 13,617 | 94,366 | |
| $ 3,588,776 | |||
| Chemicals — 1.8% | |||
| AdvanSix, Inc. | 2,633 | $ 78,885 | |
| American Vanguard Corp. | 2,506 | 27,491 | |
| Aspen Aerogels, Inc.(1) | 5,021 | 79,231 | |
| Avient Corp. | 9,368 | 389,428 | |
| Balchem Corp. | 3,229 | 480,314 | |
| Cabot Corp. | 5,588 | 466,598 | |
| Core Molding Technologies, Inc.(1) | 640 | 11,859 | |
| Danimer Scientific, Inc.(1)(2) | 7,000 | 7,140 | |
| Ecovyst, Inc.(1) | 9,465 | 92,473 | |
| FutureFuel Corp. | 1,874 | 11,394 | |
| Hawkins, Inc. | 1,924 | 135,488 | |
| HB Fuller Co. | 5,605 | 456,303 | |
| Ingevity Corp.(1) | 3,718 | 175,564 | |
| Innospec, Inc. | 2,584 | 318,452 | |
| Intrepid Potash, Inc.(1) | 831 | 19,853 | |
| Koppers Holdings, Inc. | 2,005 | 102,696 | |
| Kronos Worldwide, Inc. | 1,877 | 18,657 | |
| Livent Corp.(1)(2) | 18,699 | 336,208 | |
| LSB Industries, Inc.(1) | 5,423 | 50,488 | |
| Mativ Holdings, Inc. | 5,420 | 82,980 | |
| Minerals Technologies, Inc. | 3,236 | 230,759 | |
| Origin Materials, Inc.(1)(2) | 10,461 | 8,748 | |
| Orion S.A. | 5,576 | 154,623 | |
| Perimeter Solutions S.A.(1) | 15,459 | 71,111 | |
| PureCycle Technologies, Inc.(1)(2) | 11,545 | 46,757 | |
| Quaker Chemical Corp. | 1,439 | 307,111 | |
| Rayonier Advanced Materials, Inc.(1) | 5,330 | 21,587 | |
| Sensient Technologies Corp. | 4,360 | 287,760 | |
| Stepan Co. | 2,118 | 200,257 | |
| Trinseo PLC | 3,452 | 28,893 | |
| Tronox Holdings PLC, Class A | 11,640 | 164,822 | |
| Valhi, Inc. | 189 | 2,871 | |
| $ 4,866,801 | |||
| Commercial Services & Supplies — 1.5% | |||
| ABM Industries, Inc. | 6,861 | $ 307,579 | |
| ACCO Brands Corp. | 9,262 | 56,313 | |
| Security | Shares | Value | |
| Commercial Services & Supplies (continued) | |||
| ACV Auctions, Inc., Class A(1) | 12,632 | $ 191,375 | |
| Aris Water Solutions, Inc., Class A | 2,469 | 20,715 | |
| BrightView Holdings, Inc.(1) | 3,485 | 29,344 | |
| Brink's Co. (The) | 4,781 | 420,489 | |
| Casella Waste Systems, Inc., Class A(1) | 5,707 | 487,720 | |
| CECO Environmental Corp.(1) | 3,074 | 62,341 | |
| Cimpress PLC(1) | 1,772 | 141,848 | |
| CompX International, Inc. | 124 | 3,135 | |
| CoreCivic, Inc.(1) | 11,304 | 164,247 | |
| Deluxe Corp. | 4,327 | 92,814 | |
| Ennis, Inc. | 2,271 | 49,758 | |
| Enviri Corp.(1) | 7,844 | 70,596 | |
| GEO Group, Inc. (The)(1) | 11,837 | 128,195 | |
| Healthcare Services Group, Inc.(1) | 7,399 | 76,728 | |
| HNI Corp. | 4,591 | 192,041 | |
| Interface, Inc. | 5,657 | 71,391 | |
| LanzaTech Global, Inc.(1) | 1,704 | 8,571 | |
| Li-Cycle Holdings Corp.(1) | 13,610 | 7,959 | |
| Liquidity Services, Inc.(1) | 2,122 | 36,520 | |
| Matthews International Corp., Class A | 2,954 | 108,264 | |
| MillerKnoll, Inc. | 7,551 | 201,461 | |
| Montrose Environmental Group, Inc.(1) | 2,773 | 89,096 | |
| NL Industries, Inc. | 532 | 2,984 | |
| OPENLANE, Inc.(1) | 10,732 | 158,941 | |
| Performant Financial Corp.(1) | 5,558 | 17,369 | |
| Pitney Bowes, Inc. | 17,315 | 76,186 | |
| Quad / Graphics, Inc.(1) | 2,612 | 14,157 | |
| SP Plus Corp.(1) | 1,931 | 98,964 | |
| Steelcase, Inc., Class A | 9,597 | 129,751 | |
| UniFirst Corp. | 1,554 | 284,242 | |
| Viad Corp.(1) | 2,008 | 72,689 | |
| VSE Corp. | 1,283 | 82,895 | |
| $ 3,956,678 | |||
| Communications Equipment — 0.6% | |||
| ADTRAN Holdings, Inc. | 7,756 | $ 56,929 | |
| Aviat Networks, Inc.(1) | 1,092 | 35,665 | |
| Calix, Inc.(1) | 6,108 | 266,858 | |
| Cambium Networks Corp.(1) | 659 | 3,954 | |
| Clearfield, Inc.(1) | 1,291 | 37,542 | |
| CommScope Holding Co., Inc.(1) | 20,601 | 58,095 | |
| Comtech Telecommunications Corp. | 2,055 | 17,324 | |
| Digi International, Inc.(1) | 3,494 | 90,844 | |
| DZS, Inc.(1) | 1,018 | 2,005 | |
| Extreme Networks, Inc.(1) | 13,070 | 230,555 | |
| Harmonic, Inc.(1) | 10,947 | 142,749 | |
| Infinera Corp.(1) | 19,826 | 94,173 | |
| KVH Industries, Inc.(1) | 1,549 | 8,148 | |
| NETGEAR, Inc.(1) | 2,438 | 35,546 | |
| NetScout Systems, Inc.(1) | 7,183 | 157,667 | |
| Ribbon Communications, Inc.(1) | 8,663 | 25,123 | |
| Security | Shares | Value | |
| Communications Equipment (continued) | |||
| Viavi Solutions, Inc.(1) | 22,226 | $ 223,816 | |
| $ 1,486,993 | |||
| Construction & Engineering — 1.6% | |||
| Ameresco, Inc., Class A(1) | 3,197 | $ 101,249 | |
| API Group Corp.(1) | 21,189 | 733,139 | |
| Arcosa, Inc. | 5,026 | 415,349 | |
| Argan, Inc. | 1,271 | 59,470 | |
| Bowman Consulting Group, Ltd.(1) | 1,118 | 39,711 | |
| Comfort Systems USA, Inc. | 3,586 | 737,533 | |
| Concrete Pumping Holdings, Inc.(1) | 2,145 | 17,589 | |
| Construction Partners, Inc., Class A(1) | 3,994 | 173,819 | |
| Dycom Industries, Inc.(1) | 2,969 | 341,702 | |
| Fluor Corp.(1) | 14,446 | 565,850 | |
| Granite Construction, Inc. | 4,569 | 232,379 | |
| Great Lakes Dredge & Dock Corp.(1) | 6,469 | 49,682 | |
| IES Holdings, Inc.(1) | 808 | 64,010 | |
| INNOVATE Corp.(1)(2) | 3,792 | 4,664 | |
| Limbach Holdings, Inc.(1) | 760 | 34,557 | |
| MYR Group, Inc.(1) | 1,703 | 246,305 | |
| Northwest Pipe Co.(1) | 837 | 25,328 | |
| Primoris Services Corp. | 5,279 | 175,315 | |
| Southland Holdings, Inc.(1) | 310 | 1,600 | |
| Sterling Infrastructure, Inc.(1) | 3,102 | 272,759 | |
| Tutor Perini Corp.(1) | 4,396 | 40,004 | |
| $ 4,332,014 | |||
| Construction Materials — 0.3% | |||
| Knife River Corp.(1) | 5,862 | $ 387,947 | |
| Summit Materials, Inc., Class A(1) | 12,050 | 463,443 | |
| United States Lime & Minerals, Inc. | 203 | 46,761 | |
| $ 898,151 | |||
| Consumer Finance — 0.8% | |||
| Atlanticus Holdings Corp.(1) | 446 | $ 17,247 | |
| Bread Financial Holdings, Inc. | 5,018 | 165,293 | |
| Consumer Portfolio Services, Inc.(1) | 1,073 | 10,054 | |
| Encore Capital Group, Inc.(1) | 2,310 | 117,232 | |
| Enova International, Inc.(1) | 3,024 | 167,409 | |
| FirstCash Holdings, Inc. | 3,903 | 423,046 | |
| Green Dot Corp., Class A(1) | 4,617 | 45,708 | |
| LendingClub Corp.(1) | 10,579 | 92,460 | |
| LendingTree, Inc.(1) | 911 | 27,622 | |
| Navient Corp. | 9,200 | 171,304 | |
| Nelnet, Inc., Class A | 1,336 | 117,862 | |
| NerdWallet, Inc., Class A(1) | 3,499 | 51,505 | |
| OppFi, Inc.(1) | 1,009 | 5,166 | |
| PRA Group, Inc.(1) | 3,840 | 100,608 | |
| PROG Holdings, Inc.(1) | 4,604 | 142,310 | |
| Regional Management Corp. | 671 | 16,829 | |
| Upstart Holdings, Inc.(1)(2) | 7,582 | 309,800 | |
| Security | Shares | Value | |
| Consumer Finance (continued) | |||
| World Acceptance Corp.(1) | 369 | $ 48,166 | |
| $ 2,029,621 | |||
| Consumer Staples Distribution & Retail — 0.5% | |||
| Andersons, Inc. (The) | 3,200 | $ 184,128 | |
| Chefs' Warehouse, Inc. (The)(1) | 3,500 | 103,005 | |
| HF Foods Group, Inc.(1) | 3,141 | 16,773 | |
| Ingles Markets, Inc., Class A | 1,398 | 120,745 | |
| Natural Grocers by Vitamin Cottage, Inc., Class C | 875 | 14,000 | |
| PriceSmart, Inc. | 2,572 | 194,906 | |
| SpartanNash Co. | 3,443 | 79,017 | |
| Sprouts Farmers Market, Inc.(1) | 10,298 | 495,437 | |
| United Natural Foods, Inc.(1) | 5,890 | 95,595 | |
| Village Super Market, Inc., Class A | 640 | 16,787 | |
| Weis Markets, Inc. | 1,638 | 104,766 | |
| $ 1,425,159 | |||
| Containers & Packaging — 0.3% | |||
| Greif, Inc., Class A | 2,462 | $ 161,483 | |
| Greif, Inc., Class B | 446 | 29,440 | |
| Myers Industries, Inc. | 3,634 | 71,045 | |
| O-I Glass, Inc.(1) | 16,093 | 263,603 | |
| Pactiv Evergreen, Inc. | 4,146 | 56,842 | |
| Ranpak Holdings Corp.(1) | 4,233 | 24,636 | |
| TriMas Corp. | 4,125 | 104,486 | |
| $ 711,535 | |||
| Distributors — 0.0%(3) | |||
| Weyco Group, Inc. | 443 | $ 13,892 | |
| $ 13,892 | |||
| Diversified Consumer Services — 1.2% | |||
| 2U, Inc.(1)(2) | 7,725 | $ 9,502 | |
| Adtalem Global Education, Inc.(1) | 4,118 | 242,756 | |
| Carriage Services, Inc. | 1,188 | 29,712 | |
| Chegg, Inc.(1) | 11,742 | 133,389 | |
| Coursera, Inc.(1) | 13,485 | 261,204 | |
| Duolingo, Inc.(1) | 2,962 | 671,930 | |
| European Wax Center, Inc., Class A(1) | 3,368 | 45,771 | |
| frontdoor, Inc.(1) | 8,182 | 288,170 | |
| Graham Holdings Co., Class B | 371 | 258,409 | |
| Laureate Education, Inc., Class A | 13,026 | 178,586 | |
| Lincoln Educational Services Corp.(1) | 1,956 | 19,638 | |
| Nerdy, Inc.(1) | 4,065 | 13,943 | |
| OneSpaWorld Holdings, Ltd.(1) | 8,366 | 117,961 | |
| Perdoceo Education Corp. | 6,679 | 117,283 | |
| Rover Group, Inc.(1) | 9,162 | 99,683 | |
| Strategic Education, Inc. | 2,250 | 207,833 | |
| Stride, Inc.(1) | 4,393 | 260,812 | |
| Udemy, Inc.(1)(2) | 9,103 | 134,087 | |
| Security | Shares | Value | |
| Diversified Consumer Services (continued) | |||
| Universal Technical Institute, Inc.(1) | 3,395 | $ 42,505 | |
| WW International, Inc.(1) | 5,378 | 47,058 | |
| $ 3,180,232 | |||
| Diversified REITs — 0.6% | |||
| Alexander & Baldwin, Inc. | 7,211 | $ 137,153 | |
| Alpine Income Property Trust, Inc. | 1,076 | 18,195 | |
| American Assets Trust, Inc. | 4,853 | 109,241 | |
| Armada Hoffler Properties, Inc. | 6,697 | 82,842 | |
| Broadstone Net Lease, Inc. | 19,475 | 335,360 | |
| CTO Realty Growth, Inc. | 2,168 | 37,571 | |
| Empire State Realty Trust, Inc., Class A | 13,132 | 127,249 | |
| Essential Properties Realty Trust, Inc. | 16,158 | 412,999 | |
| Gladstone Commercial Corp. | 3,969 | 52,550 | |
| Global Net Lease, Inc. | 19,351 | 192,542 | |
| NexPoint Diversified Real Estate Trust(2) | 2,564 | 20,384 | |
| One Liberty Properties, Inc. | 1,306 | 28,615 | |
| Star Holdings(1) | 1,028 | 15,399 | |
| $ 1,570,100 | |||
| Diversified Telecommunication Services — 0.5% | |||
| Anterix, Inc.(1) | 1,290 | $ 42,983 | |
| AST SpaceMobile, Inc.(1)(2) | 8,057 | 48,584 | |
| ATN International, Inc. | 967 | 37,684 | |
| Bandwidth, Inc., Class A(1) | 1,790 | 25,901 | |
| Charge Enterprises, Inc.(1) | 8,110 | 925 | |
| Cogent Communications Holdings, Inc. | 4,535 | 344,932 | |
| Consolidated Communications Holdings, Inc.(1) | 7,940 | 34,539 | |
| EchoStar Corp., Class A(1) | 11,800 | 195,526 | |
| Globalstar, Inc.(1)(2) | 68,614 | 133,111 | |
| IDT Corp., Class B(1) | 1,536 | 52,362 | |
| Liberty Latin America, Ltd., Class A(1) | 3,362 | 24,576 | |
| Liberty Latin America, Ltd., Class C(1) | 14,300 | 104,962 | |
| Lumen Technologies, Inc.(1)(2) | 100,196 | 183,359 | |
| Ooma, Inc.(1) | 2,353 | 25,248 | |
| $ 1,254,692 | |||
| Electric Utilities — 0.7% | |||
| ALLETE, Inc. | 5,988 | $ 366,226 | |
| Genie Energy, Ltd., Class B | 2,047 | 57,582 | |
| MGE Energy, Inc. | 3,780 | 273,332 | |
| Otter Tail Corp. | 4,277 | 363,417 | |
| PNM Resources, Inc. | 8,882 | 369,491 | |
| Portland General Electric Co. | 10,532 | 456,457 | |
| $ 1,886,505 | |||
| Electrical Equipment — 1.3% | |||
| Allient, Inc. | 1,377 | $ 41,599 | |
| Amprius Technologies, Inc.(1) | 444 | 2,349 | |
| Array Technologies, Inc.(1) | 15,690 | 263,592 | |
| Security | Shares | Value | |
| Electrical Equipment (continued) | |||
| Atkore, Inc.(1) | 3,838 | $ 614,080 | |
| Babcock & Wilcox Enterprises, Inc.(1) | 4,352 | 6,354 | |
| Blink Charging Co.(1)(2) | 4,552 | 15,431 | |
| Bloom Energy Corp., Class A(1)(2) | 19,954 | 295,319 | |
| Dragonfly Energy Holdings Corp.(1) | 1,257 | 681 | |
| Encore Wire Corp. | 1,558 | 332,789 | |
| Energy Vault Holdings, Inc.(1) | 7,973 | 18,577 | |
| EnerSys | 4,274 | 431,503 | |
| Enovix Corp.(1)(2) | 14,355 | 179,725 | |
| Eos Energy Enterprises, Inc.(1)(2) | 8,888 | 9,688 | |
| ESS Tech, Inc.(1)(2) | 6,050 | 6,897 | |
| Fluence Energy, Inc.(1) | 5,682 | 135,516 | |
| FTC Solar, Inc.(1)(2) | 6,274 | 4,347 | |
| FuelCell Energy, Inc.(1) | 47,099 | 75,358 | |
| GrafTech International, Ltd. | 19,266 | 42,192 | |
| LSI Industries, Inc. | 2,901 | 40,846 | |
| NEXTracker, Inc., Class A(1) | 4,976 | 233,126 | |
| NuScale Power Corp.(1)(2) | 4,426 | 14,562 | |
| Powell Industries, Inc. | 949 | 83,892 | |
| Preformed Line Products Co. | 222 | 29,717 | |
| SES AI Corp.(1) | 10,311 | 18,869 | |
| Shoals Technologies Group, Inc., Class A(1) | 17,762 | 276,021 | |
| SKYX Platforms Corp.(1) | 4,695 | 7,512 | |
| Stem, Inc.(1)(2) | 14,154 | 54,917 | |
| SunPower Corp.(1)(2) | 8,679 | 41,920 | |
| Thermon Group Holdings, Inc.(1) | 3,323 | 108,230 | |
| TPI Composites, Inc.(1)(2) | 4,132 | 17,106 | |
| Vicor Corp.(1) | 2,205 | 99,093 | |
| $ 3,501,808 | |||
| Electronic Equipment, Instruments & Components — 2.6% | |||
| 908 Devices, Inc.(1)(2) | 1,442 | $ 16,179 | |
| Advanced Energy Industries, Inc. | 3,897 | 424,461 | |
| Aeva Technologies, Inc.(1) | 8,168 | 6,189 | |
| Akoustis Technologies, Inc.(1)(2) | 4,010 | 3,344 | |
| Arlo Technologies, Inc.(1) | 8,587 | 81,748 | |
| Badger Meter, Inc. | 2,967 | 458,016 | |
| Bel Fuse, Inc., Class B | 1,032 | 68,907 | |
| Belden, Inc. | 4,404 | 340,209 | |
| Benchmark Electronics, Inc. | 3,516 | 97,182 | |
| Climb Global Solutions, Inc. | 343 | 18,807 | |
| CTS Corp. | 3,118 | 136,381 | |
| Daktronics, Inc.(1) | 3,227 | 27,365 | |
| ePlus, Inc.(1) | 2,642 | 210,937 | |
| Evolv Technologies Holdings, Inc.(1) | 11,113 | 52,453 | |
| Fabrinet (1) | 3,729 | 709,740 | |
| FARO Technologies, Inc.(1) | 1,964 | 44,249 | |
| Insight Enterprises, Inc.(1) | 2,902 | 514,205 | |
| Iteris, Inc.(1) | 3,528 | 18,346 | |
| Itron, Inc.(1) | 4,719 | 356,332 | |
| Kimball Electronics, Inc.(1) | 2,480 | 66,836 | |
| Security | Shares | Value | |
| Electronic Equipment, Instruments & Components (continued) | |||
| Knowles Corp.(1) | 8,936 | $ 160,044 | |
| Lightwave Logic, Inc.(1)(2) | 11,312 | 56,334 | |
| Luna Innovations, Inc.(1) | 2,653 | 17,642 | |
| Methode Electronics, Inc. | 3,514 | 79,873 | |
| MicroVision, Inc.(1)(2) | 17,448 | 46,412 | |
| Mirion Technologies, Inc.(1) | 20,751 | 212,698 | |
| Napco Security Technologies, Inc. | 3,439 | 117,786 | |
| nLight, Inc.(1) | 4,350 | 58,725 | |
| Novanta, Inc.(1) | 3,627 | 610,823 | |
| OSI Systems, Inc.(1) | 1,668 | 215,255 | |
| PAR Technology Corp.(1)(2) | 2,648 | 115,294 | |
| PC Connection, Inc. | 1,129 | 75,880 | |
| Plexus Corp.(1) | 2,843 | 307,414 | |
| Presto Automation, Inc.(1) | 263 | 140 | |
| Richardson Electronics, Ltd. | 988 | 13,190 | |
| Rogers Corp.(1) | 1,794 | 236,934 | |
| Sanmina Corp.(1) | 5,732 | 294,453 | |
| ScanSource, Inc.(1) | 2,484 | 98,391 | |
| SmartRent, Inc.(1)(2) | 18,178 | 57,988 | |
| TTM Technologies, Inc.(1) | 10,170 | 160,788 | |
| Vishay Intertechnology, Inc. | 13,360 | 320,239 | |
| Vishay Precision Group, Inc.(1) | 1,011 | 34,445 | |
| Vuzix Corp.(1)(2) | 4,601 | 9,593 | |
| $ 6,952,227 | |||
| Energy Equipment & Services — 2.3% | |||
| Archrock, Inc. | 13,823 | $ 212,874 | |
| Atlas Energy Solutions, Inc. | 1,344 | 23,144 | |
| Borr Drilling, Ltd.(1)(2) | 22,746 | 167,411 | |
| Bristow Group, Inc.(1) | 2,348 | 66,378 | |
| Cactus, Inc., Class A | 6,696 | 303,998 | |
| ChampionX Corp. | 19,833 | 579,322 | |
| Core Laboratories, Inc. | 4,661 | 82,313 | |
| Diamond Offshore Drilling, Inc.(1) | 10,114 | 131,482 | |
| DMC Global, Inc.(1) | 1,926 | 36,247 | |
| Dril-Quip, Inc.(1) | 3,383 | 78,722 | |
| Expro Group Holdings NV(1) | 8,768 | 139,587 | |
| Forum Energy Technologies, Inc.(1) | 810 | 17,958 | |
| Helix Energy Solutions Group, Inc.(1) | 14,305 | 147,055 | |
| Helmerich & Payne, Inc. | 10,087 | 365,351 | |
| KLX Energy Services Holdings, Inc.(1) | 1,046 | 11,778 | |
| Kodiak Gas Services, Inc. | 1,541 | 30,943 | |
| Liberty Energy, Inc., Class A | 17,019 | 308,725 | |
| Mammoth Energy Services, Inc.(1) | 1,924 | 8,581 | |
| Nabors Industries, Ltd.(1) | 911 | 74,365 | |
| Newpark Resources, Inc.(1) | 7,671 | 50,935 | |
| Noble Corp. PLC | 11,382 | 548,157 | |
| Oceaneering International, Inc.(1) | 9,991 | 212,609 | |
| Oil States International, Inc.(1) | 6,222 | 42,247 | |
| Patterson-UTI Energy, Inc. | 36,629 | 395,593 | |
| ProFrac Holding Corp., Class A(1)(2) | 1,873 | 15,883 | |
| Security | Shares | Value | |
| Energy Equipment & Services (continued) | |||
| ProPetro Holding Corp.(1) | 9,803 | $ 82,149 | |
| Ranger Energy Services, Inc. | 1,283 | 13,125 | |
| RPC, Inc. | 8,391 | 61,087 | |
| SEACOR Marine Holdings, Inc.(1) | 1,989 | 25,042 | |
| Seadrill, Ltd.(1) | 5,234 | 247,464 | |
| Select Water Solutions, Inc., Class A | 8,402 | 63,771 | |
| Solaris Oilfield Infrastructure, Inc., Class A | 2,541 | 20,226 | |
| TETRA Technologies, Inc.(1) | 12,362 | 55,876 | |
| Tidewater, Inc.(1) | 4,724 | 340,648 | |
| US Silica Holdings, Inc.(1) | 7,493 | 84,746 | |
| Valaris, Ltd.(1) | 6,258 | 429,111 | |
| Weatherford International PLC(1) | 7,212 | 705,550 | |
| $ 6,180,453 | |||
| Entertainment — 0.4% | |||
| Atlanta Braves Holdings, Inc., Class A(1) | 991 | $ 42,395 | |
| Atlanta Braves Holdings, Inc., Class C(1) | 4,717 | 186,699 | |
| Cinemark Holdings, Inc.(1)(2) | 10,928 | 153,975 | |
| IMAX Corp.(1) | 4,433 | 66,584 | |
| Lions Gate Entertainment Corp., Class A(1) | 5,843 | 63,689 | |
| Lions Gate Entertainment Corp., Class B(1) | 12,478 | 127,151 | |
| Loop Media, Inc.(1) | 3,011 | 3,011 | |
| Madison Square Garden Entertainment Corp.(1) | 4,297 | 136,602 | |
| Marcus Corp. (The)(2) | 2,510 | 36,596 | |
| Playstudios, Inc.(1) | 8,439 | 22,870 | |
| Reservoir Media, Inc.(1) | 1,534 | 10,937 | |
| Sphere Entertainment Co.(1) | 2,593 | 88,058 | |
| Vivid Seats, Inc., Class A(1) | 1,855 | 11,723 | |
| $ 950,290 | |||
| Financial Services — 2.3% | |||
| Acacia Research Corp.(1)(2) | 3,139 | $ 12,305 | |
| Alerus Financial Corp. | 1,781 | 39,877 | |
| A-Mark Precious Metals, Inc.(2) | 1,891 | 57,203 | |
| AvidXchange Holdings, Inc.(1) | 14,850 | 183,991 | |
| Banco Latinoamericano de Comercio Exterior S.A. | 2,713 | 67,120 | |
| Cannae Holdings, Inc.(1) | 7,115 | 138,814 | |
| Cantaloupe, Inc.(1) | 5,937 | 43,993 | |
| Cass Information Systems, Inc. | 1,350 | 60,817 | |
| Compass Diversified Holdings(2) | 6,280 | 140,986 | |
| Enact Holdings, Inc. | 2,983 | 86,179 | |
| Essent Group, Ltd. | 10,591 | 558,569 | |
| EVERTEC, Inc. | 6,769 | 277,123 | |
| Federal Agricultural Mortgage Corp., Class C | 907 | 173,436 | |
| Finance of America Cos., Inc., Class A(1) | 2,618 | 2,880 | |
| Flywire Corp.(1) | 11,007 | 254,812 | |
| I3 Verticals, Inc., Class A(1) | 2,239 | 47,400 | |
| International Money Express, Inc.(1) | 3,046 | 67,286 | |
| Jackson Financial, Inc., Class A | 8,581 | 439,347 | |
| Marqeta, Inc., Class A(1) | 48,722 | 340,080 | |
| Merchants Bancorp | 1,566 | 66,680 | |
| Security | Shares | Value | |
| Financial Services (continued) | |||
| Mr. Cooper Group, Inc.(1) | 6,682 | $ 435,132 | |
| NewtekOne, Inc.(2) | 1,925 | 26,565 | |
| NMI Holdings, Inc., Class A(1) | 8,160 | 242,189 | |
| Ocwen Financial Corp.(1) | 531 | 16,334 | |
| Pagseguro Digital, Ltd., Class A(1) | 20,567 | 256,470 | |
| Payoneer Global, Inc.(1) | 26,342 | 137,242 | |
| Paysafe, Ltd.(1) | 3,202 | 40,954 | |
| Paysign, Inc.(1) | 2,696 | 7,549 | |
| PennyMac Financial Services, Inc. | 2,643 | 233,562 | |
| Priority Technology Holdings, Inc.(1) | 578 | 2,058 | |
| Radian Group, Inc. | 15,862 | 452,860 | |
| Remitly Global, Inc.(1) | 13,787 | 267,743 | |
| Repay Holdings Corp.(1) | 8,014 | 68,440 | |
| Security National Financial Corp., Class A(1) | 1,031 | 9,279 | |
| StoneCo, Ltd., Class A(1) | 29,415 | 530,352 | |
| SWK Holdings Corp.(1) | 267 | 4,680 | |
| Velocity Financial, Inc.(1) | 672 | 11,572 | |
| Walker & Dunlop, Inc. | 3,295 | 365,778 | |
| Waterstone Financial, Inc. | 1,822 | 25,872 | |
| $ 6,193,529 | |||
| Food Products — 0.9% | |||
| Alico, Inc. | 470 | $ 13,668 | |
| B&G Foods, Inc. | 7,068 | 74,214 | |
| Benson Hill, Inc.(1)(2) | 12,841 | 2,232 | |
| Beyond Meat, Inc.(1)(2) | 5,892 | 52,439 | |
| BRC, Inc., Class A(1)(2) | 1,925 | 6,988 | |
| Calavo Growers, Inc. | 1,707 | 50,203 | |
| Cal-Maine Foods, Inc. | 4,252 | 244,022 | |
| Dole PLC(2) | 7,110 | 87,382 | |
| Forafric Global PLC(1) | 431 | 4,564 | |
| Fresh Del Monte Produce, Inc. | 3,359 | 88,174 | |
| Hain Celestial Group, Inc. (The)(1) | 8,890 | 97,345 | |
| J&J Snack Foods Corp. | 1,560 | 260,738 | |
| John B. Sanfilippo & Son, Inc. | 891 | 91,809 | |
| Lancaster Colony Corp. | 2,024 | 336,773 | |
| Limoneira Co. | 1,446 | 29,831 | |
| Mission Produce, Inc.(1) | 4,781 | 48,240 | |
| Seneca Foods Corp., Class A(1) | 439 | 23,021 | |
| Simply Good Foods Co. (The)(1) | 9,404 | 372,398 | |
| Sovos Brands, Inc.(1)(2) | 5,724 | 126,100 | |
| SunOpta, Inc.(1) | 8,959 | 49,006 | |
| TreeHouse Foods, Inc.(1) | 5,335 | 221,136 | |
| Utz Brands, Inc. | 7,158 | 116,246 | |
| Vital Farms, Inc.(1) | 3,012 | 47,258 | |
| Westrock Coffee Co.(1)(2) | 2,346 | 23,953 | |
| $ 2,467,740 | |||
| Gas Utilities — 0.9% | |||
| Brookfield Infrastructure Corp., Class A | 12,418 | $ 438,107 | |
| Chesapeake Utilities Corp. | 2,204 | 232,808 | |
| Security | Shares | Value | |
| Gas Utilities (continued) | |||
| New Jersey Resources Corp. | 10,070 | $ 448,920 | |
| Northwest Natural Holding Co. | 3,571 | 139,055 | |
| ONE Gas, Inc. | 5,718 | 364,351 | |
| RGC Resources, Inc. | 661 | 13,445 | |
| Southwest Gas Holdings, Inc. | 6,400 | 405,440 | |
| Spire, Inc. | 5,340 | 332,896 | |
| $ 2,375,022 | |||
| Ground Transportation — 0.4% | |||
| ArcBest Corp. | 2,399 | $ 288,384 | |
| Covenant Logistics Group, Inc. | 703 | 32,366 | |
| Daseke, Inc.(1) | 3,140 | 25,434 | |
| FTAI Infrastructure, Inc. | 8,174 | 31,797 | |
| Heartland Express, Inc. | 4,623 | 65,924 | |
| Marten Transport, Ltd. | 5,775 | 121,159 | |
| PAM Transportation Services, Inc.(1) | 502 | 10,432 | |
| RXO, Inc.(1) | 12,038 | 280,004 | |
| TuSimple Holdings, Inc., Class A(1) | 16,290 | 14,299 | |
| Universal Logistics Holdings, Inc. | 475 | 13,309 | |
| Werner Enterprises, Inc. | 6,559 | 277,905 | |
| $ 1,161,013 | |||
| Health Care Equipment & Supplies — 2.7% | |||
| Accuray, Inc.(1) | 7,702 | $ 21,797 | |
| Alphatec Holdings, Inc.(1) | 9,548 | 144,270 | |
| AngioDynamics, Inc.(1) | 2,837 | 22,242 | |
| Artivion, Inc.(1) | 3,885 | 69,464 | |
| AtriCure, Inc.(1) | 4,629 | 165,209 | |
| Atrion Corp. | 137 | 51,894 | |
| Avanos Medical, Inc.(1) | 4,598 | 103,133 | |
| AxoGen, Inc.(1) | 3,047 | 20,811 | |
| Axonics, Inc.(1) | 5,150 | 320,485 | |
| Beyond Air, Inc.(1) | 2,117 | 4,149 | |
| Butterfly Network, Inc.(1)(2) | 13,763 | 14,864 | |
| Cerus Corp.(1) | 17,500 | 37,800 | |
| ClearPoint Neuro, Inc.(1) | 1,893 | 12,853 | |
| CONMED Corp. | 3,175 | 347,694 | |
| Cutera, Inc.(1)(2) | 1,245 | 4,389 | |
| CVRx, Inc.(1) | 918 | 28,862 | |
| Embecta Corp. | 5,742 | 108,696 | |
| Glaukos Corp.(1) | 4,912 | 390,455 | |
| Haemonetics Corp.(1) | 5,193 | 444,053 | |
| Inari Medical, Inc.(1) | 5,539 | 359,592 | |
| Inmode, Ltd.(1) | 7,698 | 171,204 | |
| Inogen, Inc.(1) | 1,598 | 8,773 | |
| Integer Holdings Corp.(1) | 3,439 | 340,736 | |
| iRadimed Corp. | 721 | 34,226 | |
| iRhythm Technologies, Inc.(1) | 3,177 | 340,066 | |
| KORU Medical Systems, Inc.(1) | 2,887 | 7,088 | |
| Lantheus Holdings, Inc.(1) | 7,045 | 436,790 | |
| LeMaitre Vascular, Inc. | 1,962 | 111,363 | |
| Security | Shares | Value | |
| Health Care Equipment & Supplies (continued) | |||
| LivaNova PLC(1) | 5,617 | $ 290,624 | |
| Merit Medical Systems, Inc.(1) | 5,888 | 447,252 | |
| Nano-X Imaging, Ltd.(1)(2) | 4,525 | 28,824 | |
| Neogen Corp.(1) | 22,565 | 453,782 | |
| Nevro Corp.(1) | 3,529 | 75,944 | |
| Omnicell, Inc.(1) | 4,467 | 168,093 | |
| OraSure Technologies, Inc.(1) | 7,452 | 61,106 | |
| Orchestra BioMed Holdings, Inc.(1)(2) | 1,396 | 12,745 | |
| Orthofix Medical, Inc.(1) | 3,494 | 47,099 | |
| OrthoPediatrics Corp.(1) | 1,565 | 50,878 | |
| Outset Medical, Inc.(1) | 4,911 | 26,569 | |
| Paragon 28, Inc.(1) | 3,915 | 48,663 | |
| PROCEPT BioRobotics Corp.(1) | 4,178 | 175,100 | |
| Pulmonx Corp.(1) | 3,617 | 46,117 | |
| Pulse Biosciences, Inc.(1)(2) | 1,334 | 16,328 | |
| RxSight, Inc.(1) | 2,943 | 118,662 | |
| Sanara Medtech, Inc.(1) | 313 | 12,864 | |
| Semler Scientific, Inc.(1) | 413 | 18,292 | |
| SI-BONE, Inc.(1) | 4,118 | 86,437 | |
| Sight Sciences, Inc.(1) | 1,732 | 8,937 | |
| Silk Road Medical, Inc.(1) | 3,818 | 46,847 | |
| STAAR Surgical Co.(1) | 4,831 | 150,776 | |
| SurModics, Inc.(1) | 1,426 | 51,835 | |
| Tactile Systems Technology, Inc.(1) | 2,295 | 32,819 | |
| Tela Bio, Inc.(1) | 1,311 | 8,679 | |
| TransMedics Group, Inc.(1) | 3,284 | 259,206 | |
| Treace Medical Concepts, Inc.(1) | 4,493 | 57,286 | |
| UFP Technologies, Inc.(1) | 705 | 121,288 | |
| Utah Medical Products, Inc. | 296 | 24,929 | |
| Varex Imaging Corp.(1) | 3,855 | 79,028 | |
| Vicarious Surgical, Inc.(1)(2) | 4,091 | 1,500 | |
| Zimvie, Inc.(1) | 2,549 | 45,245 | |
| Zynex, Inc.(1)(2) | 1,511 | 16,455 | |
| $ 7,213,167 | |||
| Health Care Providers & Services — 2.4% | |||
| 23andMe Holding Co., Class A(1) | 25,630 | $ 23,413 | |
| Accolade, Inc.(1) | 6,560 | 78,786 | |
| AdaptHealth Corp.(1) | 9,594 | 69,940 | |
| Addus HomeCare Corp.(1) | 1,555 | 144,382 | |
| Agiliti, Inc.(1) | 2,448 | 19,388 | |
| AirSculpt Technologies, Inc.(1)(2) | 508 | 3,805 | |
| Alignment Healthcare, Inc.(1) | 7,871 | 67,769 | |
| AMN Healthcare Services, Inc.(1) | 3,919 | 293,455 | |
| Apollo Medical Holdings, Inc.(1) | 4,257 | 163,043 | |
| Aveanna Healthcare Holdings, Inc.(1) | 3,026 | 8,110 | |
| Brookdale Senior Living, Inc.(1) | 18,689 | 108,770 | |
| Cano Health, Inc.(1) | 196 | 1,151 | |
| CareMax, Inc.(1) | 4,473 | 2,228 | |
| Castle Biosciences, Inc.(1) | 2,450 | 52,871 | |
| Community Health Systems, Inc.(1) | 12,400 | 38,812 | |
| Security | Shares | Value | |
| Health Care Providers & Services (continued) | |||
| CorVel Corp.(1) | 867 | $ 214,331 | |
| Cross Country Healthcare, Inc.(1) | 3,421 | 77,451 | |
| DocGo, Inc.(1) | 7,671 | 42,881 | |
| Enhabit, Inc.(1) | 4,967 | 51,409 | |
| Ensign Group, Inc. (The) | 5,523 | 619,736 | |
| Fulgent Genetics, Inc.(1) | 2,034 | 58,803 | |
| Guardant Health, Inc.(1) | 11,693 | 316,296 | |
| HealthEquity, Inc.(1) | 8,493 | 563,086 | |
| Hims & Hers Health, Inc.(1) | 12,146 | 108,099 | |
| InfuSystem Holdings, Inc.(1) | 1,500 | 15,810 | |
| Innovage Holding Corp.(1) | 1,437 | 8,622 | |
| Invitae Corp.(1)(2) | 25,918 | 16,245 | |
| Joint Corp. (The)(1)(2) | 1,060 | 10,187 | |
| LifeStance Health Group, Inc.(1)(2) | 10,545 | 82,567 | |
| ModivCare, Inc.(1) | 1,257 | 55,295 | |
| National HealthCare Corp. | 1,241 | 114,693 | |
| National Research Corp. | 1,412 | 55,859 | |
| NeoGenomics, Inc.(1) | 13,191 | 213,430 | |
| OPKO Health, Inc.(1)(2) | 39,779 | 60,066 | |
| Option Care Health, Inc.(1) | 16,937 | 570,608 | |
| Owens & Minor, Inc.(1) | 7,381 | 142,232 | |
| P3 Health Partners, Inc.(1) | 1,908 | 2,690 | |
| Patterson Cos., Inc. | 8,896 | 253,091 | |
| Pediatrix Medical Group, Inc.(1) | 8,364 | 77,785 | |
| Pennant Group, Inc. (The)(1) | 2,839 | 39,519 | |
| PetIQ, Inc.(1) | 2,696 | 53,246 | |
| Privia Health Group, Inc.(1) | 11,659 | 268,507 | |
| Progyny, Inc.(1) | 8,228 | 305,917 | |
| Quipt Home Medical Corp.(1) | 3,332 | 16,960 | |
| RadNet, Inc.(1) | 6,237 | 216,861 | |
| Select Medical Holdings Corp. | 10,765 | 252,978 | |
| Surgery Partners, Inc.(1)(2) | 7,666 | 245,235 | |
| US Physical Therapy, Inc. | 1,466 | 136,543 | |
| Viemed Healthcare, Inc.(1) | 2,819 | 22,129 | |
| $ 6,365,090 | |||
| Health Care REITs — 0.6% | |||
| CareTrust REIT, Inc. | 10,376 | $ 232,215 | |
| Community Healthcare Trust, Inc. | 2,538 | 67,612 | |
| Diversified Healthcare Trust | 23,576 | 88,174 | |
| Global Medical REIT, Inc. | 6,063 | 67,299 | |
| LTC Properties, Inc. | 4,077 | 130,953 | |
| National Health Investors, Inc. | 4,325 | 241,551 | |
| Physicians Realty Trust | 24,656 | 328,172 | |
| Sabra Health Care REIT, Inc. | 23,980 | 342,195 | |
| Universal Health Realty Income Trust | 1,333 | 57,652 | |
| $ 1,555,823 | |||
| Health Care Technology — 0.5% | |||
| American Well Corp., Class A(1) | 24,368 | $ 36,308 | |
| Computer Programs and Systems, Inc.(1) | 1,409 | 15,781 | |
| Security | Shares | Value | |
| Health Care Technology (continued) | |||
| Definitive Healthcare Corp.(1) | 4,806 | $ 47,772 | |
| Evolent Health, Inc., Class A(1) | 11,404 | 376,674 | |
| Health Catalyst, Inc.(1) | 5,546 | 51,356 | |
| HealthStream, Inc. | 2,408 | 65,088 | |
| Multiplan Corp.(1)(2) | 37,631 | 54,188 | |
| OptimizeRx Corp.(1) | 1,258 | 18,002 | |
| Phreesia, Inc.(1) | 5,486 | 127,001 | |
| Schrodinger, Inc.(1) | 5,415 | 193,857 | |
| Sharecare, Inc.(1)(2) | 30,413 | 32,846 | |
| Simulations Plus, Inc. | 1,576 | 70,526 | |
| Veradigm, Inc.(1) | 10,724 | 112,495 | |
| $ 1,201,894 | |||
| Hotel & Resort REITs — 0.8% | |||
| Apple Hospitality REIT, Inc. | 22,338 | $ 371,034 | |
| Braemar Hotels & Resorts, Inc. | 5,189 | 12,973 | |
| Chatham Lodging Trust | 4,756 | 50,984 | |
| DiamondRock Hospitality Co. | 20,908 | 196,326 | |
| Pebblebrook Hotel Trust | 12,078 | 193,006 | |
| RLJ Lodging Trust | 15,814 | 185,340 | |
| Ryman Hospitality Properties, Inc. | 5,912 | 650,675 | |
| Service Properties Trust | 16,396 | 140,022 | |
| Summit Hotel Properties, Inc. | 10,419 | 70,016 | |
| Sunstone Hotel Investors, Inc. | 21,582 | 231,575 | |
| Xenia Hotels & Resorts, Inc. | 11,095 | 151,114 | |
| $ 2,253,065 | |||
| Hotels, Restaurants & Leisure — 2.1% | |||
| Accel Entertainment, Inc.(1) | 5,320 | $ 54,636 | |
| Bally's Corp.(1)(2) | 2,436 | 33,958 | |
| Biglari Holdings, Inc., Class B(1) | 80 | 13,194 | |
| BJ's Restaurants, Inc.(1) | 2,245 | 80,842 | |
| Bloomin' Brands, Inc. | 9,079 | 255,574 | |
| Bluegreen Vacations Holding Corp. | 1,064 | 79,928 | |
| Bowlero Corp.(1)(2) | 2,312 | 32,738 | |
| Brinker International, Inc.(1) | 4,361 | 188,308 | |
| Carrols Restaurant Group, Inc. | 3,035 | 23,916 | |
| Century Casinos, Inc.(1) | 1,662 | 8,111 | |
| Cheesecake Factory, Inc. (The) | 4,823 | 168,853 | |
| Chuy's Holdings, Inc.(1) | 1,795 | 68,623 | |
| Cracker Barrel Old Country Store, Inc. | 2,194 | 169,114 | |
| Dave & Buster's Entertainment, Inc.(1) | 3,625 | 195,206 | |
| Denny's Corp.(1) | 4,997 | 54,367 | |
| Dine Brands Global, Inc. | 1,555 | 77,206 | |
| El Pollo Loco Holdings, Inc.(1) | 2,823 | 24,899 | |
| Everi Holdings, Inc.(1) | 8,390 | 94,555 | |
| First Watch Restaurant Group, Inc.(1) | 2,227 | 44,763 | |
| Full House Resorts, Inc.(1) | 2,565 | 13,774 | |
| Global Business Travel Group, Inc.(1)(2) | 2,665 | 17,189 | |
| Golden Entertainment, Inc. | 2,012 | 80,339 | |
| Hilton Grand Vacations, Inc.(1) | 8,327 | 334,579 | |
| Security | Shares | Value | |
| Hotels, Restaurants & Leisure (continued) | |||
| Inspired Entertainment, Inc.(1) | 1,661 | $ 16,411 | |
| International Game Technology PLC | 11,248 | 308,308 | |
| Jack in the Box, Inc. | 2,064 | 168,484 | |
| Krispy Kreme, Inc.(2) | 8,703 | 131,328 | |
| Kura Sushi USA, Inc., Class A(1) | 575 | 43,700 | |
| Life Time Group Holdings, Inc.(1) | 4,439 | 66,940 | |
| Light & Wonder, Inc., Class A(1) | 9,251 | 759,600 | |
| Lindblad Expeditions Holdings, Inc.(1) | 3,449 | 38,870 | |
| Monarch Casino & Resort, Inc. | 1,339 | 92,592 | |
| Mondee Holdings, Inc.(1)(2) | 3,749 | 10,347 | |
| Nathan's Famous, Inc. | 233 | 18,176 | |
| Noodles & Co.(1) | 3,189 | 10,045 | |
| ONE Group Hospitality, Inc. (The)(1) | 1,532 | 9,376 | |
| Papa John's International, Inc. | 3,297 | 251,330 | |
| PlayAGS, Inc.(1) | 3,050 | 25,712 | |
| Portillo's, Inc., Class A(1) | 4,222 | 67,257 | |
| Potbelly Corp.(1) | 2,155 | 22,455 | |
| RCI Hospitality Holdings, Inc. | 845 | 55,990 | |
| Red Robin Gourmet Burgers, Inc.(1)(2) | 1,311 | 16,348 | |
| Red Rock Resorts, Inc., Class A | 4,931 | 262,970 | |
| Rush Street Interactive, Inc.(1) | 6,153 | 27,627 | |
| Sabre Corp.(1) | 32,581 | 143,356 | |
| SeaWorld Entertainment, Inc.(1) | 3,648 | 192,724 | |
| Shake Shack, Inc., Class A(1) | 3,912 | 289,957 | |
| Six Flags Entertainment Corp.(1) | 7,182 | 180,125 | |
| Super Group SGHC, Ltd.(1) | 13,369 | 42,380 | |
| Sweetgreen, Inc., Class A(1) | 9,603 | 108,514 | |
| Target Hospitality Corp.(1)(2) | 3,084 | 30,007 | |
| Xponential Fitness, Inc., Class A(1)(2) | 2,041 | 26,309 | |
| $ 5,531,910 | |||
| Household Durables — 2.3% | |||
| Beazer Homes USA, Inc.(1) | 2,929 | $ 98,971 | |
| Cavco Industries, Inc.(1) | 906 | 314,038 | |
| Century Communities, Inc. | 2,947 | 268,590 | |
| Cricut, Inc., Class A | 4,718 | 31,092 | |
| Dream Finders Homes, Inc., Class A(1) | 2,390 | 84,917 | |
| Ethan Allen Interiors, Inc. | 2,254 | 71,948 | |
| GoPro, Inc., Class A(1) | 12,764 | 44,291 | |
| Green Brick Partners, Inc.(1) | 2,623 | 136,239 | |
| Helen of Troy, Ltd.(1) | 2,394 | 289,219 | |
| Hooker Furnishings Corp. | 908 | 23,681 | |
| Hovnanian Enterprises, Inc., Class A(1) | 483 | 75,164 | |
| Installed Building Products, Inc. | 2,455 | 448,823 | |
| iRobot Corp.(1) | 2,726 | 105,496 | |
| KB Home | 7,382 | 461,080 | |
| Landsea Homes Corp.(1) | 2,092 | 27,489 | |
| La-Z-Boy, Inc. | 4,316 | 159,347 | |
| Legacy Housing Corp.(1) | 819 | 20,655 | |
| LGI Homes, Inc.(1) | 2,156 | 287,093 | |
| Lovesac Co. (The)(1) | 1,384 | 35,361 | |
| Security | Shares | Value | |
| Household Durables (continued) | |||
| M / I Homes, Inc.(1) | 2,791 | $ 384,432 | |
| MDC Holdings, Inc. | 6,213 | 343,268 | |
| Meritage Homes Corp. | 3,690 | 642,798 | |
| Purple Innovation, Inc.(2) | 4,415 | 4,547 | |
| Skyline Champion Corp.(1) | 5,551 | 412,217 | |
| Snap One Holdings Corp.(1)(2) | 1,018 | 9,070 | |
| Sonos, Inc.(1) | 13,158 | 225,528 | |
| Taylor Morrison Home Corp.(1) | 10,472 | 558,681 | |
| Traeger, Inc.(1) | 3,429 | 9,361 | |
| TRI Pointe Homes, Inc.(1) | 9,863 | 349,150 | |
| United Homes Group, Inc.(1)(2) | 508 | 4,282 | |
| Vizio Holding Corp., Class A(1) | 7,537 | 58,035 | |
| VOXX International Corp.(1) | 1,148 | 12,261 | |
| $ 5,997,124 | |||
| Household Products — 0.3% | |||
| Central Garden & Pet Co.(1) | 964 | $ 48,306 | |
| Central Garden & Pet Co., Class A(1) | 3,914 | 172,373 | |
| Energizer Holdings, Inc. | 7,422 | 235,129 | |
| Oil-Dri Corp. of America | 405 | 27,167 | |
| WD-40 Co. | 1,407 | 336,371 | |
| $ 819,346 | |||
| Independent Power and Renewable Electricity Producers — 0.3% | |||
| Altus Power, Inc.(1) | 5,278 | $ 36,049 | |
| Montauk Renewables, Inc.(1) | 6,625 | 59,029 | |
| Ormat Technologies, Inc. | 5,540 | 419,876 | |
| Sunnova Energy International, Inc.(1)(2) | 11,009 | 167,887 | |
| $ 682,841 | |||
| Industrial Conglomerates — 0.0%(3) | |||
| Brookfield Business Corp., Class A(2) | 2,564 | $ 59,690 | |
| $ 59,690 | |||
| Industrial REITs — 0.5% | |||
| Innovative Industrial Properties, Inc. | 2,893 | $ 291,672 | |
| LXP Industrial Trust | 30,017 | 297,769 | |
| Plymouth Industrial REIT, Inc. | 4,269 | 102,755 | |
| Terreno Realty Corp. | 8,378 | 525,049 | |
| $ 1,217,245 | |||
| Insurance — 1.7% | |||
| Ambac Financial Group, Inc.(1) | 4,583 | $ 75,528 | |
| American Coastal Insurance Corp.(1) | 1,620 | 15,325 | |
| American Equity Investment Life Holding Co.(1) | 8,144 | 454,435 | |
| AMERISAFE, Inc. | 1,896 | 88,695 | |
| BRP Group, Inc., Class A(1) | 5,876 | 141,142 | |
| CNO Financial Group, Inc. | 11,315 | 315,688 | |
| Crawford & Co., Class A | 1,459 | 19,230 | |
| Donegal Group, Inc., Class A | 1,516 | 21,209 | |
| Security | Shares | Value | |
| Insurance (continued) | |||
| eHealth, Inc.(1) | 1,915 | $ 16,699 | |
| Employers Holdings, Inc. | 2,664 | 104,962 | |
| Enstar Group, Ltd.(1) | 1,236 | 363,817 | |
| F&G Annuities & Life, Inc.(2) | 1,837 | 84,502 | |
| Fidelis Insurance Holdings, Ltd.(1) | 1,520 | 19,258 | |
| Genworth Financial, Inc., Class A(1) | 46,917 | 313,406 | |
| GoHealth, Inc., Class A(1) | 324 | 4,322 | |
| Goosehead Insurance, Inc., Class A(1)(2) | 2,142 | 162,364 | |
| Greenlight Capital Re, Ltd., Class A(1) | 2,647 | 30,229 | |
| HCI Group, Inc. | �� | 635 | 55,499 |
| Hippo Holdings, Inc.(1)(2) | 1,244 | 11,345 | |
| Horace Mann Educators Corp. | 4,086 | 133,612 | |
| Investors Title Co. | 111 | 17,998 | |
| James River Group Holdings, Ltd. | 3,680 | 34,003 | |
| Kingsway Financial Services, Inc.(1) | 879 | 7,384 | |
| Lemonade, Inc.(1)(2) | 5,040 | 81,295 | |
| Maiden Holdings, Ltd.(1) | 7,497 | 17,168 | |
| MBIA, Inc.(1) | 4,850 | 29,682 | |
| Mercury General Corp. | 2,665 | 99,431 | |
| National Western Life Group, Inc., Class A | 224 | 108,196 | |
| NI Holdings, Inc.(1) | 903 | 11,730 | |
| Oscar Health, Inc., Class A(1) | 15,370 | 140,635 | |
| Palomar Holdings, Inc.(1) | 2,424 | 134,532 | |
| ProAssurance Corp. | 5,370 | 74,052 | |
| Safety Insurance Group, Inc. | 1,428 | 108,514 | |
| Selective Insurance Group, Inc. | 6,099 | 606,728 | |
| Selectquote, Inc.(1) | 10,628 | 14,560 | |
| SiriusPoint, Ltd.(1) | 7,237 | 83,949 | |
| Skyward Specialty Insurance Group, Inc.(1) | 2,393 | 81,075 | |
| Stewart Information Services Corp. | 2,661 | 156,334 | |
| Tiptree, Inc. | 2,311 | 43,817 | |
| Trupanion, Inc.(1)(2) | 3,934 | 120,026 | |
| United Fire Group, Inc. | 2,075 | 41,749 | |
| Universal Insurance Holdings, Inc. | 2,020 | 32,280 | |
| $ 4,476,405 | |||
| Interactive Media & Services — 0.7% | |||
| Bumble, Inc., Class A(1) | 10,060 | $ 148,284 | |
| CarGurus, Inc.(1) | 10,131 | 244,765 | |
| Cars.com, Inc.(1) | 6,614 | 125,468 | |
| DHI Group, Inc.(1) | 3,207 | 8,306 | |
| Eventbrite, Inc., Class A(1) | 7,686 | 64,255 | |
| EverQuote, Inc., Class A(1) | 2,223 | 27,210 | |
| fuboTV, Inc.(1)(2) | 28,397 | 90,302 | |
| Grindr, Inc.(1) | 3,387 | 29,738 | |
| MediaAlpha, Inc., Class A(1) | 2,341 | 26,102 | |
| Nextdoor Holdings, Inc.(1) | 12,020 | 22,718 | |
| Outbrain, Inc.(1) | 4,048 | 17,730 | |
| QuinStreet, Inc.(1) | 5,125 | 65,702 | |
| Shutterstock, Inc. | 2,452 | 118,383 | |
| System1, Inc.(1) | 2,046 | 4,542 | |
| Security | Shares | Value | |
| Interactive Media & Services (continued) | |||
| TrueCar, Inc.(1) | 7,838 | $ 27,119 | |
| Vimeo, Inc.(1) | 15,130 | 59,310 | |
| Yelp, Inc.(1) | 6,896 | 326,457 | |
| Ziff Davis, Inc.(1) | 4,680 | 314,449 | |
| ZipRecruiter, Inc., Class A(1) | 6,932 | 96,355 | |
| $ 1,817,195 | |||
| IT Services — 0.5% | |||
| BigBear.ai Holdings, Inc.(1) | 2,218 | $ 4,747 | |
| BigCommerce Holdings, Inc., Series 1(1) | 6,679 | 64,987 | |
| Brightcove, Inc.(1) | 3,175 | 8,223 | |
| CS Disco, Inc.(1) | 1,668 | 12,660 | |
| CXApp, Inc.(1) | 161 | 208 | |
| DigitalOcean Holdings, Inc.(1) | 6,567 | 240,943 | |
| Fastly, Inc., Class A(1) | 12,512 | 222,714 | |
| Grid Dynamics Holdings, Inc.(1) | 5,471 | 72,928 | |
| Hackett Group, Inc. (The) | 2,467 | 56,174 | |
| Information Services Group, Inc. | 2,665 | 12,552 | |
| Perficient, Inc.(1) | 3,555 | 233,990 | |
| Rackspace Technology, Inc.(1)(2) | 7,773 | 15,546 | |
| Squarespace, Inc., Class A(1) | 5,229 | 172,609 | |
| Thoughtworks Holding, Inc.(1) | 9,131 | 43,920 | |
| Tucows, Inc., Class A(1)(2) | 790 | 21,330 | |
| Unisys Corp.(1) | 6,557 | 36,850 | |
| $ 1,220,381 | |||
| Leisure Products — 0.4% | |||
| Acushnet Holdings Corp.(2) | 3,104 | $ 196,080 | |
| AMMO, Inc.(1) | 6,601 | 13,862 | |
| Clarus Corp. | 2,191 | 15,107 | |
| Escalade, Inc. | 822 | 16,514 | |
| Funko, Inc., Class A(1) | 3,416 | 26,406 | |
| JAKKS Pacific, Inc.(1) | 597 | 21,223 | |
| Johnson Outdoors, Inc., Class A | 405 | 21,635 | |
| Latham Group, Inc.(1) | 3,322 | 8,737 | |
| Malibu Boats, Inc., Class A(1) | 2,021 | 110,791 | |
| Marine Products Corp. | 813 | 9,268 | |
| MasterCraft Boat Holdings, Inc.(1) | 1,615 | 36,563 | |
| Smith + Wesson Brands, Inc. | 4,512 | 61,183 | |
| Solo Brands, Inc., Class A(1) | 906 | 5,581 | |
| Sturm Ruger & Co., Inc. | 1,738 | 78,992 | |
| Topgolf Callaway Brands Corp.(1) | 14,308 | 205,177 | |
| Vista Outdoor, Inc.(1) | 5,984 | 176,947 | |
| $ 1,004,066 | |||
| Life Sciences Tools & Services — 0.3% | |||
| Adaptive Biotechnologies Corp.(1) | 11,286 | $ 55,301 | |
| Akoya Biosciences, Inc.(1) | 1,199 | 5,851 | |
| BioLife Solutions, Inc.(1) | 3,432 | 55,770 | |
| Codexis, Inc.(1) | 4,645 | 14,167 | |
| CryoPort, Inc.(1) | 4,259 | 65,972 | |
| Security | Shares | Value | |
| Life Sciences Tools & Services (continued) | |||
| Cytek Biosciences, Inc.(1)(2) | 12,042 | $ 109,823 | |
| Harvard Bioscience, Inc.(1) | 3,230 | 17,281 | |
| MaxCyte, Inc.(1) | 7,417 | 34,860 | |
| Mesa Laboratories, Inc. | 509 | 53,328 | |
| NanoString Technologies, Inc.(1)(2) | 3,557 | 2,662 | |
| Nautilus Biotechnology, Inc.(1) | 3,575 | 10,689 | |
| OmniAb, Inc.(1) | 9,652 | 59,553 | |
| OmniAb, Inc. (earnout shares)(1)(4)(5) | 462 | 0 | |
| OmniAb, Inc. (earnout shares)(1)(4)(5) | 462 | 0 | |
| Pacific Biosciences of California, Inc.(1) | 26,094 | 255,982 | |
| Quanterix Corp.(1) | 3,475 | 95,007 | |
| Quantum-Si, Inc.(1)(2) | 9,906 | 19,911 | |
| Seer, Inc.(1) | 5,782 | 11,217 | |
| SomaLogic, Inc.(1) | 15,149 | 38,327 | |
| $ 905,701 | |||
| Machinery — 3.4% | |||
| 374Water, Inc.(1)(2) | 4,891 | $ 6,945 | |
| 3D Systems Corp.(1) | 12,675 | 80,486 | |
| Alamo Group, Inc. | 1,003 | 210,821 | |
| Albany International Corp., Class A | 3,241 | 318,331 | |
| Astec Industries, Inc. | 2,260 | 84,072 | |
| Barnes Group, Inc. | 4,870 | 158,908 | |
| Blue Bird Corp.(1) | 2,622 | 70,689 | |
| Chart Industries, Inc.(1)(2) | 4,354 | 593,581 | |
| Columbus McKinnon Corp. | 2,805 | 109,451 | |
| Commercial Vehicle Group, Inc.(1) | 2,653 | 18,598 | |
| Desktop Metal, Inc., Class A(1)(2) | 27,666 | 20,777 | |
| Douglas Dynamics, Inc. | 2,242 | 66,543 | |
| Energy Recovery, Inc.(1) | 5,537 | 104,317 | |
| Enerpac Tool Group Corp. | 5,712 | 177,586 | |
| Enpro, Inc. | 2,171 | 340,283 | |
| ESCO Technologies, Inc. | 2,653 | 310,481 | |
| Federal Signal Corp. | 6,048 | 464,124 | |
| Franklin Electric Co., Inc. | 4,785 | 462,470 | |
| Gencor Industries, Inc.(1) | 870 | 14,042 | |
| Gorman-Rupp Co. (The) | 2,259 | 80,262 | |
| Greenbrier Cos., Inc. (The) | 3,137 | 138,593 | |
| Helios Technologies, Inc. | 3,258 | 147,750 | |
| Hillenbrand, Inc. | 7,260 | 347,391 | |
| Hillman Solutions Corp.(1) | 19,582 | 180,350 | |
| Hyliion Holdings Corp.(1)(2) | 14,559 | 11,847 | |
| Hyster-Yale Materials Handling, Inc. | 1,071 | 66,605 | |
| John Bean Technologies Corp. | 3,299 | 328,086 | |
| Kadant, Inc. | 1,211 | 339,455 | |
| Kennametal, Inc. | 8,355 | 215,475 | |
| Lindsay Corp. | 1,099 | 141,947 | |
| Luxfer Holdings PLC | 2,400 | 21,456 | |
| Manitowoc Co., Inc. (The)(1) | 3,438 | 57,380 | |
| Mayville Engineering Co., Inc.(1) | 912 | 13,151 | |
| Microvast Holdings, Inc.(1) | 22,256 | 31,158 | |
| Security | Shares | Value | |
| Machinery (continued) | |||
| Miller Industries, Inc. | 1,050 | $ 44,405 | |
| Mueller Industries, Inc. | 11,330 | 534,210 | |
| Mueller Water Products, Inc., Class A | 16,077 | 231,509 | |
| Nikola Corp.(1)(2) | 58,995 | 51,609 | |
| Omega Flex, Inc. | 248 | 17,486 | |
| Park-Ohio Holdings Corp. | 693 | 18,683 | |
| Proto Labs, Inc.(1) | 2,621 | 102,114 | |
| REV Group, Inc. | 3,174 | 57,672 | |
| Shyft Group, Inc. (The) | 3,397 | 41,511 | |
| SPX Technologies, Inc.(1) | 4,448 | 449,292 | |
| Standex International Corp. | 1,173 | 185,780 | |
| Tennant Co. | 1,841 | 170,642 | |
| Terex Corp. | 6,889 | 395,842 | |
| Titan International, Inc.(1) | 5,211 | 77,540 | |
| Trinity Industries, Inc. | 8,411 | 223,648 | |
| Velo3D, Inc.(1)(2) | 8,778 | 3,490 | |
| Wabash National Corp. | 4,717 | 120,850 | |
| Watts Water Technologies, Inc., Class A | 2,771 | 577,310 | |
| $ 9,037,004 | |||
| Marine Transportation — 0.3% | |||
| Costamare, Inc. | 4,298 | $ 44,742 | |
| Eagle Bulk Shipping, Inc. | 928 | 51,411 | |
| Genco Shipping & Trading, Ltd. | 4,153 | 68,898 | |
| Golden Ocean Group, Ltd. | 12,236 | 119,424 | |
| Himalaya Shipping, Ltd.(1) | 2,261 | 15,284 | |
| Matson, Inc. | 3,543 | 388,313 | |
| Pangaea Logistics Solutions, Ltd. | 3,008 | 24,786 | |
| Safe Bulkers, Inc.(2) | 6,968 | 27,384 | |
| $ 740,242 | |||
| Media — 0.6% | |||
| Advantage Solutions, Inc.(1)(2) | 8,993 | $ 32,555 | |
| AMC Networks, Inc., Class A(1) | 3,026 | 56,859 | |
| Boston Omaha Corp., Class A(1) | 2,278 | 35,833 | |
| Cardlytics, Inc.(1) | 3,307 | 30,457 | |
| Clear Channel Outdoor Holdings, Inc.(1) | 36,584 | 66,583 | |
| Daily Journal Corp.(1) | 134 | 45,670 | |
| Emerald Holding, Inc.(1) | 1,289 | 7,708 | |
| Entravision Communications Corp., Class A | 5,618 | 23,427 | |
| EW Scripps Co. (The), Class A(1) | 5,870 | 46,901 | |
| Gambling.com Group, Ltd.(1) | 651 | 6,347 | |
| Gannett Co., Inc.(1) | 14,229 | 32,727 | |
| Gray Television, Inc. | 8,170 | 73,203 | |
| iHeartMedia, Inc., Class A(1) | 8,782 | 23,448 | |
| Integral Ad Science Holding Corp.(1) | 4,800 | 69,072 | |
| John Wiley & Sons, Inc., Class A | 3,775 | 119,818 | |
| Magnite, Inc.(1) | 13,310 | 124,315 | |
| PubMatic, Inc., Class A(1) | 4,266 | 69,578 | |
| Scholastic Corp. | 2,844 | 107,219 | |
| Sinclair, Inc. | 3,125 | 40,719 | |
| Security | Shares | Value | |
| Media (continued) | |||
| Stagwell, Inc.(1) | 7,777 | $ 51,562 | |
| TechTarget, Inc.(1) | 2,573 | 89,695 | |
| TEGNA, Inc. | 20,917 | 320,030 | |
| Thryv Holdings, Inc.(1) | 3,058 | 62,230 | |
| Townsquare Media, Inc., Class A | 965 | 10,190 | |
| Urban One, Inc., Class A(1) | 621 | 2,503 | |
| Urban One, Inc., Class D(1) | 900 | 3,177 | |
| WideOpenWest, Inc.(1) | 4,110 | 16,646 | |
| $ 1,568,472 | |||
| Metals & Mining — 1.8% | |||
| 5E Advanced Materials, Inc.(1)(2) | 2,423 | $ 3,416 | |
| Alpha Metallurgical Resources, Inc. | 1,196 | 405,348 | |
| Arch Resources, Inc. | 1,819 | 301,845 | |
| ATI, Inc.(1) | 13,035 | 592,702 | |
| Caledonia Mining Corp. PLC | 1,356 | 16,543 | |
| Carpenter Technology Corp. | 5,068 | 358,814 | |
| Century Aluminum Co.(1) | 5,191 | 63,019 | |
| Coeur Mining, Inc.(1) | 31,766 | 103,557 | |
| Commercial Metals Co. | 11,867 | 593,825 | |
| Compass Minerals International, Inc. | 3,406 | 86,240 | |
| Constellium SE(1) | 13,346 | 266,386 | |
| Contango ORE, Inc.(1) | 308 | 5,578 | |
| Dakota Gold, Corp.(1) | 3,810 | 9,982 | |
| Haynes International, Inc. | 1,254 | 71,541 | |
| Hecla Mining Co. | 63,298 | 304,463 | |
| i-80 Gold Corp.(1) | 15,953 | 28,077 | |
| Ivanhoe Electric, Inc. / US(1) | 6,542 | 65,943 | |
| Kaiser Aluminum Corp. | 1,586 | 112,907 | |
| Materion Corp. | 2,127 | 276,787 | |
| NioCorp Developments, Ltd.(1) | 161 | 514 | |
| Novagold Resources, Inc.(1) | 24,037 | 89,898 | |
| Olympic Steel, Inc. | 1,021 | 68,101 | |
| Perpetua Resources Corp.(1) | 3,119 | 9,887 | |
| Piedmont Lithium, Inc.(1) | 1,783 | 50,334 | |
| Ramaco Resources, Inc., Class A | 2,216 | 38,071 | |
| Ramaco Resources, Inc., Class B | 336 | 4,472 | |
| Ryerson Holding Corp. | 2,913 | 101,023 | |
| Schnitzer Steel Industries, Inc., Class A | 2,572 | 77,572 | |
| SunCoke Energy, Inc. | 8,308 | 89,228 | |
| TimkenSteel Corp.(1) | 4,290 | 100,601 | |
| Tredegar Corp. | 2,145 | 11,605 | |
| Warrior Met Coal, Inc. | 5,359 | 326,738 | |
| Worthington Enterprises, Inc. | 3,062 | 176,218 | |
| Worthington Steel, Inc.(1) | 3,062 | 86,042 | |
| $ 4,897,277 | |||
| Mortgage Real Estate Investment Trusts (REITs) — 1.1% | |||
| AFC Gamma, Inc. | 1,617 | $ 19,453 | |
| Angel Oak Mortgage, Inc. | 557 | 5,904 | |
| Apollo Commercial Real Estate Finance, Inc. | 14,116 | 165,722 | |
| Security | Shares | Value | |
| Mortgage Real Estate Investment Trusts (REITs) (continued) | |||
| Arbor Realty Trust, Inc. | 19,069 | $ 289,467 | |
| Ares Commercial Real Estate Corp.(2) | 5,128 | 53,126 | |
| ARMOUR Residential REIT, Inc. | 5,092 | 98,377 | |
| Blackstone Mortgage Trust, Inc., Class A | 17,851 | 379,691 | |
| BrightSpire Capital, Inc. | 12,807 | 95,284 | |
| Chicago Atlantic Real Estate Finance, Inc.(2) | 1,352 | 21,875 | |
| Chimera Investment Corp. | 23,148 | 115,509 | |
| Claros Mortgage Trust, Inc. | 9,023 | 122,983 | |
| Dynex Capital, Inc.(2) | 5,330 | 66,732 | |
| Ellington Financial, Inc.(2) | 7,413 | 94,219 | |
| Franklin BSP Realty Trust, Inc.(2) | 8,265 | 111,660 | |
| Granite Point Mortgage Trust, Inc. | 4,738 | 28,144 | |
| Hannon Armstrong Sustainable Infrastructure Capital, Inc.(2) | 10,964 | 302,387 | |
| Invesco Mortgage Capital, Inc. | 4,656 | 41,252 | |
| KKR Real Estate Finance Trust, Inc. | 5,856 | 77,475 | |
| Ladder Capital Corp. | 11,260 | 129,603 | |
| MFA Financial, Inc. | 10,171 | 114,627 | |
| New York Mortgage Trust, Inc. | 9,047 | 77,171 | |
| Nexpoint Real Estate Finance, Inc. | 588 | 9,261 | |
| Orchid Island Capital, Inc.(2) | 5,450 | 45,944 | |
| PennyMac Mortgage Investment Trust | 8,786 | 131,351 | |
| Ready Capital Corp. | 15,925 | 163,231 | |
| Redwood Trust, Inc. | 11,324 | 83,911 | |
| TPG RE Finance Trust, Inc. | 6,816 | 44,304 | |
| Two Harbors Investment Corp. | 9,668 | 134,675 | |
| $ 3,023,338 | |||
| Multi-Utilities — 0.4% | |||
| Avista Corp. | 7,945 | $ 283,954 | |
| Black Hills Corp. | 6,991 | 377,164 | |
| Northwestern Energy Group, Inc. | 6,386 | 324,984 | |
| Unitil Corp. | 1,586 | 83,376 | |
| $ 1,069,478 | |||
| Office REITs — 0.7% | |||
| Brandywine Realty Trust | 16,919 | $ 91,363 | |
| City Office REIT, Inc. | 3,686 | 22,521 | |
| COPT Defense Properties | 11,682 | 299,410 | |
| Douglas Emmett, Inc. | 16,157 | 234,276 | |
| Easterly Government Properties, Inc. | 9,929 | 133,446 | |
| Equity Commonwealth | 10,434 | 200,333 | |
| Hudson Pacific Properties, Inc. | 13,630 | 126,895 | |
| JBG SMITH Properties | 10,508 | 178,741 | |
| Office Properties Income Trust | 3,755 | 27,487 | |
| Orion Office REIT, Inc. | 5,639 | 32,255 | |
| Paramount Group, Inc. | 18,393 | 95,092 | |
| Peakstone Realty Trust | 3,628 | 72,306 | |
| Piedmont Office Realty Trust, Inc., Class A | 12,278 | 87,296 | |
| Postal Realty Trust, Inc., Class A | 1,548 | 22,539 | |
| Security | Shares | Value | |
| Office REITs (continued) | |||
| SL Green Realty Corp.(2) | 6,548 | $ 295,773 | |
| $ 1,919,733 | |||
| Oil, Gas & Consumable Fuels — 4.3% | |||
| Amplify Energy Corp.(1) | 2,675 | $ 15,863 | |
| Ardmore Shipping Corp. | 4,052 | 57,093 | |
| Berry Corp. | 7,582 | 53,301 | |
| California Resources Corp. | 7,141 | 390,470 | |
| Callon Petroleum Co.(1) | 6,091 | 197,348 | |
| Centrus Energy Corp., Class A(1) | 1,204 | 65,510 | |
| Chord Energy Corp. | 4,239 | 704,649 | |
| Civitas Resources, Inc. | 8,190 | 560,032 | |
| Clean Energy Fuels Corp.(1) | 16,735 | 64,095 | |
| CNX Resources Corp.(1) | 16,227 | 324,540 | |
| Comstock Resources, Inc.(2) | 9,139 | 80,880 | |
| CONSOL Energy, Inc. | 3,165 | 318,177 | |
| Crescent Energy Co., Class A | 7,983 | 105,455 | |
| CVR Energy, Inc. | 2,947 | 89,294 | |
| Delek US Holdings, Inc. | 6,612 | 170,590 | |
| DHT Holdings, Inc. | 13,636 | 133,769 | |
| Dorian LPG, Ltd. | 3,571 | 156,660 | |
| Empire Petroleum Corp.(1)(2) | 508 | 5,583 | |
| Encore Energy Corp.(1) | 15,193 | 59,709 | |
| Energy Fuels, Inc.(1)(2) | 15,617 | 112,286 | |
| Enviva, Inc.(2) | 2,586 | 2,575 | |
| Equitrans Midstream Corp. | 45,250 | 460,645 | |
| Evolution Petroleum Corp. | 2,605 | 15,135 | |
| Excelerate Energy, Inc., Class A | 1,391 | 21,505 | |
| Flex LNG, Ltd. | 2,961 | 86,047 | |
| Gevo, Inc.(1) | 23,062 | 26,752 | |
| Golar LNG, Ltd. | 10,073 | 231,578 | |
| Granite Ridge Resources, Inc. | 2,146 | 12,919 | |
| Green Plains, Inc.(1) | 5,782 | 145,822 | |
| Gulfport Energy Corp.(1) | 1,098 | 146,254 | |
| Hallador Energy Co.(1) | 1,886 | 16,672 | |
| HighPeak Energy, Inc.(2) | 1,050 | 14,952 | |
| International Seaways, Inc. | 4,039 | 183,694 | |
| Kinetik Holdings, Inc., Class A | 1,707 | 57,014 | |
| Kosmos Energy, Ltd.(1) | 47,288 | 317,302 | |
| Magnolia Oil & Gas Corp., Class A | 18,230 | 388,117 | |
| Matador Resources Co. | 11,478 | 652,639 | |
| Murphy Oil Corp. | 15,054 | 642,204 | |
| NACCO Industries, Inc., Class A | 304 | 11,096 | |
| NextDecade Corp.(1) | 8,086 | 38,570 | |
| Nordic American Tankers, Ltd. | 20,402 | 85,688 | |
| Northern Oil and Gas, Inc. | 9,118 | 338,004 | |
| Overseas Shipholding Group, Inc., Class A | 4,767 | 25,122 | |
| Par Pacific Holdings, Inc.(1) | 5,494 | 199,817 | |
| PBF Energy, Inc., Class A | 11,278 | 495,781 | |
| Peabody Energy Corp. | 11,846 | 288,095 | |
| Permian Resources Corp. | 39,386 | 535,650 | |
| Security | Shares | Value | |
| Oil, Gas & Consumable Fuels (continued) | |||
| PrimeEnergy Resources Corp.(1) | 61 | $ 6,487 | |
| REX American Resources Corp.(1) | 1,555 | 73,552 | |
| Riley Exploration Permian, Inc. | 821 | 22,364 | |
| Ring Energy, Inc.(1)(2) | 11,829 | 17,270 | |
| SandRidge Energy, Inc. | 3,148 | 43,033 | |
| Scorpio Tankers, Inc. | 4,953 | 301,142 | |
| SFL Corp., Ltd. | 11,446 | 129,111 | |
| SilverBow Resources, Inc.(1) | 2,184 | 63,511 | |
| Sitio Royalties Corp., Class A(2) | 8,515 | 200,188 | |
| SM Energy Co. | 11,926 | 461,775 | |
| Talos Energy, Inc.(1) | 11,117 | 158,195 | |
| Teekay Corp.(1) | 6,546 | 46,804 | |
| Teekay Tankers, Ltd., Class A | 2,377 | 118,779 | |
| Tellurian, Inc.(1)(2) | 52,990 | 40,039 | |
| Uranium Energy Corp.(1)(2) | 39,163 | 250,643 | |
| VAALCO Energy, Inc. | 10,631 | 47,733 | |
| Verde Clean Fuels, Inc.(1) | 355 | 838 | |
| Vertex Energy, Inc.(1)(2) | 5,577 | 18,906 | |
| Vital Energy, Inc.(1) | 2,419 | 110,040 | |
| Vitesse Energy, Inc. | 2,473 | 54,134 | |
| W&T Offshore, Inc. | 9,698 | 31,615 | |
| World Kinect Corp. | 6,132 | 139,687 | |
| $ 11,440,799 | |||
| Paper & Forest Products — 0.1% | |||
| Clearwater Paper Corp.(1) | 1,653 | $ 59,706 | |
| Glatfelter Corp.(1) | 3,755 | 7,285 | |
| Sylvamo Corp. | 3,619 | 177,729 | |
| $ 244,720 | |||
| Passenger Airlines — 0.4% | |||
| Allegiant Travel Co. | 1,571 | $ 129,780 | |
| Blade Air Mobility, Inc.(1) | 4,209 | 14,858 | |
| Frontier Group Holdings, Inc.(1)(2) | 3,758 | 20,519 | |
| Hawaiian Holdings, Inc.(1) | 5,027 | 71,383 | |
| JetBlue Airways Corp.(1) | 34,814 | 193,218 | |
| Joby Aviation, Inc.(1) | 27,707 | 184,251 | |
| SkyWest, Inc.(1) | 4,196 | 219,031 | |
| Spirit Airlines, Inc. | 10,907 | 178,766 | |
| Sun Country Airlines Holdings, Inc.(1) | 3,720 | 58,516 | |
| $ 1,070,322 | |||
| Personal Care Products — 0.9% | |||
| Beauty Health Co. (The)(1) | 7,481 | $ 23,266 | |
| BellRing Brands, Inc.(1) | 13,363 | 740,711 | |
| e.l.f. Beauty, Inc.(1) | 5,466 | 788,962 | |
| Edgewell Personal Care Co. | 5,093 | 186,557 | |
| Herbalife, Ltd.(1) | 9,825 | 149,929 | |
| Inter Parfums, Inc. | 1,901 | 273,763 | |
| Medifast, Inc. | 1,067 | 71,724 | |
| Nature's Sunshine Products, Inc.(1) | 1,018 | 17,601 | |
| Security | Shares | Value | |
| Personal Care Products (continued) | |||
| Nu Skin Enterprises, Inc., Class A | 4,956 | $ 96,246 | |
| USANA Health Sciences, Inc.(1) | 1,121 | 60,086 | |
| Waldencast PLC, Class A(1) | 3,615 | 39,548 | |
| $ 2,448,393 | |||
| Pharmaceuticals — 1.7% | |||
| Aclaris Therapeutics, Inc.(1) | 6,900 | $ 7,245 | |
| Amneal Pharmaceuticals, Inc.(1) | 12,022 | 72,974 | |
| Amphastar Pharmaceuticals, Inc.(1) | 3,987 | 246,596 | |
| Amylyx Pharmaceuticals, Inc.(1) | 5,046 | 74,277 | |
| ANI Pharmaceuticals, Inc.(1) | 1,456 | 80,284 | |
| Arvinas, Inc.(1) | 4,879 | 200,820 | |
| Assertio Holdings, Inc.(1)(2) | 8,159 | 8,730 | |
| Atea Pharmaceuticals, Inc.(1) | 7,514 | 22,918 | |
| Axsome Therapeutics, Inc.(1)(2) | 3,690 | 293,687 | |
| Biote Corp., Class A(1) | 1,156 | 5,711 | |
| Bright Green Corp.(1) | 4,982 | 1,645 | |
| Cara Therapeutics, Inc.(1) | 3,311 | 2,460 | |
| Cassava Sciences, Inc.(1)(2) | 3,951 | 88,937 | |
| Citius Pharmaceuticals, Inc.(1) | 10,148 | 7,677 | |
| Collegium Pharmaceutical, Inc.(1) | 3,419 | 105,237 | |
| Corcept Therapeutics, Inc.(1) | 8,308 | 269,844 | |
| CorMedix, Inc.(1)(2) | 3,685 | 13,856 | |
| Cymabay Therapeutics, Inc.(1) | 11,718 | 276,779 | |
| Edgewise Therapeutics, Inc.(1) | 4,190 | 45,839 | |
| Enliven Therapeutics, Inc.(1)(2) | 1,928 | 26,684 | |
| Evolus, Inc.(1) | 4,084 | 43,005 | |
| Eyenovia, Inc.(1)(2) | 2,297 | 4,778 | |
| EyePoint Pharmaceuticals, Inc.(1)(2) | 2,583 | 59,693 | |
| Harmony Biosciences Holdings, Inc.(1) | 3,278 | 105,879 | |
| Harrow, Inc.(1)(2) | 2,564 | 28,717 | |
| Ikena Oncology, Inc.(1) | 1,755 | 3,457 | |
| Innoviva, Inc.(1) | 6,163 | 98,855 | |
| Intra-Cellular Therapies, Inc.(1) | 9,484 | 679,244 | |
| Ligand Pharmaceuticals, Inc.(1) | 1,656 | 118,272 | |
| Liquidia Corp.(1)(2) | 4,913 | 59,103 | |
| Longboard Pharmaceuticals, Inc.(1) | 1,286 | 7,755 | |
| Marinus Pharmaceuticals, Inc.(1)(2) | 5,249 | 57,057 | |
| Neumora Therapeutics, Inc.(1) | 1,540 | 26,257 | |
| NGM Biopharmaceuticals, Inc.(1) | 3,117 | 2,678 | |
| Nuvation Bio, Inc.(1) | 14,367 | 21,694 | |
| Ocular Therapeutix, Inc.(1) | 8,274 | 36,902 | |
| Omeros Corp.(1)(2) | 5,027 | 16,438 | |
| Optinose, Inc.(1) | 6,021 | 7,767 | |
| Pacira BioSciences, Inc.(1) | 4,526 | 152,707 | |
| Phathom Pharmaceuticals, Inc.(1) | 3,095 | 28,257 | |
| Phibro Animal Health Corp., Class A | 1,619 | 18,748 | |
| Pliant Therapeutics, Inc.(1) | 5,614 | 101,670 | |
| Prestige Consumer Healthcare, Inc.(1) | 5,160 | 315,895 | |
| Rain Oncology, Inc.(1) | 1,403 | 1,684 | |
| Revance Therapeutics, Inc.(1)(2) | 8,289 | 72,860 | |
| Security | Shares | Value | |
| Pharmaceuticals (continued) | |||
| Scilex Holding Co.(1)(2) | 5,205 | $ 10,618 | |
| scPharmaceuticals, Inc.(1)(2) | 2,385 | 14,954 | |
| SIGA Technologies, Inc. | 3,774 | 21,134 | |
| Supernus Pharmaceuticals, Inc.(1) | 4,884 | 141,343 | |
| Taro Pharmaceutical Industries Ltd.(1) | 675 | 28,201 | |
| Tarsus Pharmaceuticals, Inc.(1) | 2,970 | 60,142 | |
| Terns Pharmaceuticals, Inc.(1)(2) | 3,539 | 22,968 | |
| Theravance Biopharma, Inc.(1)(2) | 6,083 | 68,373 | |
| Theseus Pharmaceuticals, Inc.(1) | 889 | 3,600 | |
| Third Harmonic Bio, Inc.(1) | 2,017 | 22,126 | |
| Trevi Therapeutics, Inc.(1) | 3,438 | 4,607 | |
| Ventyx Biosciences, Inc.(1) | 4,650 | 11,485 | |
| Verrica Pharmaceuticals, Inc.(1)(2) | 1,724 | 12,620 | |
| WaVe Life Sciences, Ltd.(1) | 4,883 | 24,659 | |
| Xeris Biopharma Holdings, Inc.(1) | 9,930 | 23,335 | |
| Zevra Therapeutics, Inc.(1) | 2,864 | 18,759 | |
| $ 4,410,496 | |||
| Professional Services — 2.3% | |||
| Alight, Inc., Class A(1) | 42,918 | $ 366,091 | |
| ASGN, Inc.(1) | 4,768 | 458,539 | |
| Asure Software, Inc.(1) | 1,563 | 14,880 | |
| Barrett Business Services, Inc. | 685 | 79,323 | |
| Blacksky Technology, Inc.(1) | 9,762 | 13,667 | |
| CBIZ, Inc.(1) | 4,965 | 310,759 | |
| Conduent, Inc.(1) | 16,976 | 61,962 | |
| CRA International, Inc. | 671 | 66,328 | |
| CSG Systems International, Inc. | 3,275 | 174,263 | |
| ExlService Holdings, Inc.(1) | 16,341 | 504,120 | |
| Exponent, Inc. | 5,106 | 449,532 | |
| First Advantage Corp. | 5,435 | 90,058 | |
| FiscalNote Holdings, Inc.(1)(2) | 5,142 | 5,862 | |
| Forrester Research, Inc.(1) | 966 | 25,899 | |
| Franklin Covey Co.(1) | 1,203 | 52,367 | |
| Heidrick & Struggles International, Inc. | 1,956 | 57,761 | |
| HireQuest, Inc. | 443 | 6,800 | |
| HireRight Holdings Corp.(1) | 1,733 | 23,309 | |
| Huron Consulting Group, Inc.(1) | 1,893 | 194,600 | |
| IBEX Holdings, Ltd.(1) | 718 | 13,649 | |
| ICF International, Inc. | 1,940 | 260,135 | |
| Innodata, Inc.(1)(2) | 2,083 | 16,956 | |
| Insperity, Inc. | 3,624 | 424,805 | |
| Kelly Services, Inc., Class A | 3,255 | 70,373 | |
| Kforce, Inc. | 1,926 | 130,121 | |
| Korn Ferry | 5,404 | 320,727 | |
| Legalzoom.com, Inc.(1) | 12,271 | 138,662 | |
| Maximus, Inc. | 6,148 | 515,571 | |
| Mistras Group, Inc.(1) | 1,720 | 12,590 | |
| NV5 Global, Inc.(1) | 1,440 | 160,013 | |
| Planet Labs PBC(1)(2) | 18,824 | 46,495 | |
| Resources Connection, Inc. | 3,200 | 45,344 | |
| Security | Shares | Value | |
| Professional Services (continued) | |||
| Skillsoft Corp.(1) | 304 | $ 5,344 | |
| Sterling Check Corp.(1)(2) | 3,146 | 43,792 | |
| TriNet Group, Inc.(1) | 3,316 | 394,372 | |
| TrueBlue, Inc.(1) | 3,148 | 48,290 | |
| TTEC Holdings, Inc. | 1,918 | 41,563 | |
| Upwork, Inc.(1) | 12,952 | 192,596 | |
| Verra Mobility Corp.(1) | 14,460 | 333,014 | |
| Willdan Group, Inc.(1) | 898 | 19,307 | |
| $ 6,189,839 | |||
| Real Estate Management & Development — 0.7% | |||
| American Realty Investors, Inc.(1) | 112 | $ 1,950 | |
| Anywhere Real Estate, Inc.(1) | 10,639 | 86,282 | |
| Compass, Inc., Class A(1) | 29,686 | 111,619 | |
| Cushman & Wakefield PLC(1) | 16,512 | 178,330 | |
| DigitalBridge Group, Inc. | 16,760 | 293,970 | |
| Douglas Elliman, Inc. | 5,913 | 17,443 | |
| eXp World Holdings, Inc.(2) | 6,880 | 106,778 | |
| Forestar Group, Inc.(1) | 1,808 | 59,791 | |
| FRP Holdings, Inc.(1) | 588 | 36,973 | |
| Kennedy-Wilson Holdings, Inc. | 11,899 | 147,310 | |
| Marcus & Millichap, Inc. | 2,400 | 104,832 | |
| Maui Land & Pineapple Co., Inc.(1) | 623 | 9,899 | |
| Newmark Group, Inc., Class A | 13,379 | 146,634 | |
| Opendoor Technologies, Inc.(1) | 57,551 | 257,829 | |
| RE / MAX Holdings, Inc., Class A | 1,564 | 20,848 | |
| Redfin Corp.(1) | 10,568 | 109,062 | |
| RMR Group, Inc. (The), Class A | 1,361 | 38,421 | |
| St. Joe Co. (The) | 3,424 | 206,056 | |
| Stratus Properties, Inc.(1) | 442 | 12,756 | |
| Tejon Ranch Co.(1) | 2,066 | 35,535 | |
| Transcontinental Realty Investors, Inc.(1) | 94 | 3,249 | |
| $ 1,985,567 | |||
| Residential REITs — 0.4% | |||
| Apartment Investment and Management Co., Class A(1) | 14,746 | $ 115,461 | |
| BRT Apartments Corp. | 1,176 | 21,862 | |
| Centerspace | 1,503 | 87,475 | |
| Clipper Realty, Inc. | 1,313 | 7,090 | |
| Elme Communities | 8,738 | 127,575 | |
| Independence Realty Trust, Inc. | 23,375 | 357,637 | |
| NexPoint Residential Trust, Inc. | 2,244 | 77,261 | |
| UMH Properties, Inc. | 6,199 | 94,969 | |
| Veris Residential, Inc. | 7,866 | 123,732 | |
| $ 1,013,062 | |||
| Retail REITs — 1.2% | |||
| Acadia Realty Trust | 9,291 | $ 157,854 | |
| Alexander's, Inc. | 184 | 39,297 | |
| CBL & Associates Properties, Inc. | 2,675 | 65,324 | |
| Getty Realty Corp. | 4,944 | 144,464 | |
| Security | Shares | Value | |
| Retail REITs (continued) | |||
| InvenTrust Properties Corp. | 6,760 | $ 171,298 | |
| Kite Realty Group Trust | 22,005 | 503,034 | |
| Macerich Co. (The) | 22,389 | 345,462 | |
| NETSTREIT Corp. | 6,764 | 120,737 | |
| Phillips Edison & Co., Inc. | 12,222 | 445,859 | |
| Retail Opportunity Investments Corp. | 12,239 | 171,713 | |
| RPT Realty | 8,544 | 109,620 | |
| Saul Centers, Inc. | 1,207 | 47,399 | |
| SITE Centers Corp. | 19,746 | 269,138 | |
| Tanger, Inc. | 10,586 | 293,444 | |
| Urban Edge Properties | 11,424 | 209,059 | |
| Whitestone REIT | 4,835 | 59,422 | |
| $ 3,153,124 | |||
| Semiconductors & Semiconductor Equipment — 3.0% | |||
| ACM Research, Inc., Class A(1) | 4,782 | $ 93,440 | |
| Aehr Test Systems(1)(2) | 2,571 | 68,209 | |
| Alpha & Omega Semiconductor, Ltd.(1) | 2,305 | 60,068 | |
| Ambarella, Inc.(1) | 3,803 | 233,086 | |
| Amkor Technology, Inc. | 11,659 | 387,895 | |
| Atomera, Inc.(1)(2) | 1,466 | 10,277 | |
| Axcelis Technologies, Inc.(1) | 3,376 | 437,833 | |
| CEVA, Inc.(1) | 2,293 | 52,074 | |
| Cohu, Inc.(1) | 4,642 | 164,280 | |
| Credo Technology Group Holding, Ltd.(1) | 11,880 | 231,304 | |
| Diodes, Inc.(1) | 4,678 | 376,673 | |
| FormFactor, Inc.(1) | 7,992 | 333,346 | |
| Ichor Holdings, Ltd.(1) | 2,835 | 95,341 | |
| Impinj, Inc.(1) | 2,416 | 217,513 | |
| indie Semiconductor, Inc., Class A(1)(2) | 15,597 | 126,492 | |
| inTEST Corp.(1) | 886 | 12,050 | |
| Kulicke & Soffa Industries, Inc. | 5,749 | 314,585 | |
| MACOM Technology Solutions Holdings, Inc.(1) | 5,495 | 510,760 | |
| Maxeon Solar Technologies, Ltd.(1)(2) | 2,489 | 17,846 | |
| MaxLinear, Inc.(1) | 7,878 | 187,260 | |
| Navitas Semiconductor Corp.(1) | 11,326 | 91,401 | |
| NVE Corp. | 394 | 30,901 | |
| Onto Innovation, Inc.(1) | 4,961 | 758,537 | |
| PDF Solutions, Inc.(1) | 3,045 | 97,866 | |
| Photronics, Inc.(1) | 6,070 | 190,416 | |
| Power Integrations, Inc. | 5,742 | 471,476 | |
| Rambus, Inc.(1) | 11,045 | 753,821 | |
| Semtech Corp.(1) | 6,357 | 139,282 | |
| Silicon Laboratories, Inc.(1) | 3,290 | 435,168 | |
| SiTime Corp.(1) | 1,800 | 219,744 | |
| SkyWater Technology, Inc.(1)(2) | 1,736 | 16,700 | |
| SMART Global Holdings, Inc.(1) | 4,804 | 90,940 | |
| Synaptics, Inc.(1) | 3,989 | 455,065 | |
| Transphorm, Inc.(1) | 1,608 | 5,869 | |
| Ultra Clean Holdings, Inc.(1) | 4,422 | 150,967 | |
| Security | Shares | Value | |
| Semiconductors & Semiconductor Equipment (continued) | |||
| Veeco Instruments, Inc.(1) | 5,055 | $ 156,857 | |
| $ 7,995,342 | |||
| Software — 5.7% | |||
| 8x8, Inc.(1) | 11,167 | $ 42,211 | |
| A10 Networks, Inc. | 7,021 | 92,467 | |
| ACI Worldwide, Inc.(1) | 11,237 | 343,852 | |
| Adeia, Inc. | 10,636 | 131,780 | |
| Agilysys, Inc.(1) | 1,992 | 168,961 | |
| Alarm.com Holdings, Inc.(1) | 4,963 | 320,709 | |
| Alkami Technology, Inc.(1) | 3,927 | 95,230 | |
| Altair Engineering, Inc., Class A(1) | 5,477 | 460,890 | |
| American Software, Inc., Class A | 2,770 | 31,301 | |
| Amplitude, Inc., Class A(1) | 6,680 | 84,970 | |
| AppFolio, Inc., Class A(1) | 1,989 | 344,574 | |
| Appian Corp., Class A(1) | 4,079 | 153,615 | |
| Applied Digital Corp.(1)(2) | 8,490 | 57,223 | |
| Asana, Inc., Class A(1)(2) | 8,418 | 160,026 | |
| Aurora Innovation, Inc.(1)(2) | 33,385 | 145,893 | |
| AvePoint, Inc.(1) | 15,239 | 125,112 | |
| Bit Digital, Inc.(1) | 9,122 | 38,586 | |
| Blackbaud, Inc.(1) | 4,511 | 391,104 | |
| Blackline, Inc.(1) | 5,898 | 368,271 | |
| Box, Inc., Class A(1) | 14,603 | 373,983 | |
| Braze, Inc., Class A(1) | 5,427 | 288,337 | |
| C3.ai, Inc., Class A(1)(2) | 8,427 | 241,939 | |
| Cerence, Inc.(1) | 4,008 | 78,797 | |
| Cipher Mining, Inc.(1)(2) | 2,930 | 12,101 | |
| Cleanspark, Inc.(1) | 15,506 | 171,031 | |
| Clear Secure, Inc., Class A | 8,287 | 171,127 | |
| Commvault Systems, Inc.(1) | 4,565 | 364,515 | |
| Consensus Cloud Solutions, Inc.(1) | 1,958 | 51,319 | |
| CoreCard Corp.(1) | 598 | 8,270 | |
| Couchbase, Inc.(1) | 3,354 | 75,532 | |
| Digimarc Corp.(1)(2) | 1,402 | 50,640 | |
| Digital Turbine, Inc.(1) | 9,410 | 64,553 | |
| Domo, Inc., Class B(1) | 3,023 | 31,107 | |
| E2open Parent Holdings, Inc.(1) | 17,033 | 74,775 | |
| eGain Corp.(1) | 1,491 | 12,420 | |
| Enfusion, Inc., Class A(1) | 3,783 | 36,695 | |
| EngageSmart, Inc.(1) | 4,794 | 109,783 | |
| Envestnet, Inc.(1) | 5,190 | 257,009 | |
| Everbridge, Inc.(1) | 4,044 | 98,310 | |
| EverCommerce, Inc.(1) | 2,327 | 25,667 | |
| Expensify, Inc., Class A(1) | 4,561 | 11,266 | |
| Freshworks, Inc., Class A(1) | 16,782 | 394,209 | |
| Instructure Holdings, Inc.(1) | 1,938 | 52,345 | |
| Intapp, Inc.(1) | 2,869 | 109,079 | |
| InterDigital, Inc.(2) | 2,694 | 292,407 | |
| Jamf Holding Corp.(1) | 6,945 | 125,427 | |
| Kaltura, Inc.(1) | 6,855 | 13,367 | |
| Security | Shares | Value | |
| Software (continued) | |||
| LivePerson, Inc.(1) | 7,222 | $ 27,371 | |
| LiveRamp Holdings, Inc.(1) | 6,815 | 258,152 | |
| Marathon Digital Holdings, Inc.(1)(2) | 21,478 | 504,518 | |
| Matterport, Inc.(1) | 24,746 | 66,567 | |
| MeridianLink, Inc.(1) | 2,591 | 64,179 | |
| MicroStrategy, Inc., Class A(1)(2) | 1,237 | 781,314 | |
| Mitek Systems, Inc.(1) | 4,210 | 54,898 | |
| Model N, Inc.(1) | 3,710 | 99,910 | |
| N-able, Inc.(1) | 6,953 | 92,127 | |
| NextNav, Inc.(1) | 5,492 | 24,439 | |
| Olo, Inc., Class A(1) | 10,204 | 58,367 | |
| ON24, Inc. | 3,120 | 24,586 | |
| OneSpan, Inc.(1) | 3,953 | 42,376 | |
| PagerDuty, Inc.(1) | 9,387 | 217,309 | |
| PowerSchool Holdings, Inc., Class A(1) | 5,572 | 131,276 | |
| Progress Software Corp. | 4,508 | 244,784 | |
| PROS Holdings, Inc.(1) | 4,443 | 172,344 | |
| Q2 Holdings, Inc.(1) | 5,896 | 255,945 | |
| Qualys, Inc.(1) | 3,768 | 739,583 | |
| Rapid7, Inc.(1) | 6,281 | 358,645 | |
| Red Violet, Inc.(1) | 1,096 | 21,887 | |
| Rimini Street, Inc.(1) | 3,438 | 11,242 | |
| Riot Platforms Inc.(1) | 19,701 | 304,775 | |
| Sapiens International Corp. NV | 3,055 | 88,412 | |
| SEMrush Holdings, Inc., Class A(1) | 2,588 | 35,352 | |
| SolarWinds Corp.(1) | 5,026 | 62,775 | |
| SoundHound AI, Inc., Class A(1) | 11,561 | 24,509 | |
| SoundThinking, Inc.(1) | 986 | 25,182 | |
| Sprinklr, Inc., Class A(1) | 10,340 | 124,494 | |
| Sprout Social, Inc., Class A(1) | 4,948 | 304,005 | |
| SPS Commerce, Inc.(1) | 3,718 | 720,697 | |
| Tenable Holdings, Inc.(1) | 11,539 | 531,486 | |
| Terawulf, Inc.(1)(2) | 13,583 | 32,599 | |
| Varonis Systems, Inc.(1) | 10,986 | 497,446 | |
| Verint Systems, Inc.(1) | 6,288 | 169,965 | |
| Veritone, Inc.(1)(2) | 2,028 | 3,671 | |
| Viant Technology, Inc., Class A(1) | 874 | 6,022 | |
| Weave Communications, Inc.(1) | 3,215 | 36,876 | |
| Workiva, Inc.(1) | 5,024 | 510,087 | |
| Xperi, Inc.(1) | 4,164 | 45,887 | |
| Yext, Inc.(1) | 10,639 | 62,664 | |
| Zeta Global Holdings Corp., Class A(1) | 14,391 | 126,929 | |
| Zuora, Inc., Class A(1) | 13,777 | 129,504 | |
| $ 15,247,941 | |||
| Specialized REITs — 0.5% | |||
| Farmland Partners, Inc.(2) | 4,989 | $ 62,263 | |
| Four Corners Property Trust, Inc. | 9,372 | 237,112 | |
| Gladstone Land Corp. | 3,332 | 48,147 | |
| Outfront Media, Inc. | 14,672 | 204,821 | |
| PotlatchDeltic Corp. | 8,197 | 402,473 | |
| Security | Shares | Value | |
| Specialized REITs (continued) | |||
| Safehold, Inc. | 5,040 | $ 117,936 | |
| Uniti Group, Inc. | 23,685 | 136,899 | |
| $ 1,209,651 | |||
| Specialty Retail — 2.5% | |||
| 1-800-Flowers.com, Inc., Class A(1) | 2,081 | $ 22,433 | |
| Aaron's Co., Inc. (The) | 2,660 | 28,941 | |
| Abercrombie & Fitch Co., Class A(1) | 4,922 | 434,219 | |
| Academy Sports & Outdoors, Inc. | 7,424 | 489,984 | |
| American Eagle Outfitters, Inc. | 18,928 | 400,516 | |
| America's Car-Mart, Inc.(1) | 578 | 43,795 | |
| Arko Corp. | 8,129 | 67,064 | |
| Asbury Automotive Group, Inc.(1) | 2,145 | 482,561 | |
| BARK, Inc.(1)(2) | 9,359 | 7,539 | |
| Beyond, Inc.(1)(2) | 4,484 | 124,162 | |
| Big 5 Sporting Goods Corp. | 1,632 | 10,347 | |
| Boot Barn Holdings, Inc.(1) | 3,082 | 236,574 | |
| Buckle, Inc. (The) | 3,037 | 144,318 | |
| Build-A-Bear Workshop, Inc. | 1,064 | 24,461 | |
| Caleres, Inc. | 3,449 | 105,988 | |
| Camping World Holdings, Inc., Class A | 4,156 | 109,137 | |
| CarParts.com, Inc.(1) | 3,715 | 11,739 | |
| Carvana Co.(1)(2) | 9,696 | 513,306 | |
| Cato Corp. (The), Class A | 1,550 | 11,067 | |
| Chico's FAS, Inc.(1) | 12,116 | 91,839 | |
| Children's Place, Inc. (The)(1) | 1,078 | 25,031 | |
| Designer Brands, Inc., Class A | 4,336 | 38,374 | |
| Destination XL Group, Inc.(1) | 4,482 | 19,721 | |
| Duluth Holdings, Inc., Class B(1) | 634 | 3,411 | |
| Envela Corp.(1) | 626 | 3,042 | |
| EVgo, Inc.(1)(2) | 10,242 | 36,666 | |
| Foot Locker, Inc. | 8,506 | 264,962 | |
| Genesco, Inc.(1) | 983 | 34,611 | |
| Group 1 Automotive, Inc. | 1,385 | 422,065 | |
| GrowGeneration Corp.(1) | 4,242 | 10,647 | |
| Guess?, Inc. | 2,554 | 58,895 | |
| Haverty Furniture Cos., Inc. | 1,371 | 48,671 | |
| Hibbett, Inc. | 1,261 | 90,817 | |
| J Jill, Inc.(1) | 376 | 9,693 | |
| Lands' End, Inc.(1) | 1,134 | 10,841 | |
| Lazydays Holdings, Inc.(1)(2) | 1,046 | 7,374 | |
| Leslie's, Inc.(1) | 17,657 | 122,010 | |
| MarineMax, Inc.(1) | 2,124 | 82,624 | |
| Monro, Inc. | 3,098 | 90,895 | |
| National Vision Holdings, Inc.(1) | 7,721 | 161,601 | |
| ODP Corp. (The)(1) | 3,242 | 182,525 | |
| OneWater Marine, Inc., Class A(1) | 953 | 32,202 | |
| PetMed Express, Inc. | 1,778 | 13,442 | |
| Rent the Runway, Inc., Class A(1)(2) | 3,536 | 1,865 | |
| Revolve Group, Inc.(1)(2) | 4,079 | 67,630 | |
| Sally Beauty Holdings, Inc.(1) | 10,669 | 141,684 | |
| Security | Shares | Value | |
| Specialty Retail (continued) | |||
| Shoe Carnival, Inc. | 1,826 | $ 55,163 | |
| Signet Jewelers, Ltd. | 4,493 | 481,919 | |
| Sleep Number Corp.(1) | 2,108 | 31,262 | |
| Sonic Automotive, Inc., Class A | 1,548 | 87,013 | |
| Sportsman's Warehouse Holdings, Inc.(1)(2) | 3,542 | 15,089 | |
| Stitch Fix, Inc., Class A(1) | 8,194 | 29,253 | |
| ThredUp, Inc., Class A(1)(2) | 7,003 | 15,757 | |
| Tile Shop Holdings, Inc.(1) | 2,729 | 20,085 | |
| Tilly's, Inc., Class A(1) | 1,890 | 14,251 | |
| Torrid Holdings, Inc.(1) | 979 | 5,649 | |
| Upbound Group, Inc. | 5,479 | 186,122 | |
| Urban Outfitters, Inc.(1) | 6,611 | 235,947 | |
| Warby Parker, Inc., Class A(1) | 8,425 | 118,792 | |
| Winmark Corp. | 284 | 118,584 | |
| Zumiez, Inc.(1) | 1,649 | 33,541 | |
| $ 6,789,716 | |||
| Technology Hardware, Storage & Peripherals — 0.7% | |||
| CompoSecure, Inc.(1)(2) | 583 | $ 3,148 | |
| Corsair Gaming, Inc.(1) | 3,645 | 51,394 | |
| CPI Card Group, Inc.(1) | 351 | 6,736 | |
| Eastman Kodak Co.(1) | 5,624 | 21,934 | |
| Immersion Corp. | 2,586 | 18,257 | |
| Intevac, Inc.(1) | 2,108 | 9,107 | |
| IonQ, Inc.(1)(2) | 16,648 | 206,269 | |
| Super Micro Computer, Inc.(1) | 4,698 | 1,335,453 | |
| Turtle Beach Corp.(1) | 1,190 | 13,030 | |
| Xerox Holdings Corp. | 12,117 | 222,105 | |
| $ 1,887,433 | |||
| Textiles, Apparel & Luxury Goods — 0.5% | |||
| Allbirds, Inc., Class A(1) | 7,078 | $ 8,670 | |
| Figs, Inc., Class A(1)(2) | 12,705 | 88,300 | |
| Fossil Group, Inc.(1) | 3,623 | 5,290 | |
| G-III Apparel Group, Ltd.(1) | 4,157 | 141,255 | |
| Hanesbrands, Inc.(1) | 34,991 | 156,060 | |
| Kontoor Brands, Inc. | 5,822 | 363,409 | |
| Movado Group, Inc. | 1,587 | 47,848 | |
| Oxford Industries, Inc. | 1,489 | 148,900 | |
| Rocky Brands, Inc. | 588 | 17,746 | |
| Steven Madden, Ltd. | 7,798 | 327,516 | |
| Vera Bradley, Inc.(1) | 2,166 | 16,678 | |
| Wolverine World Wide, Inc. | 7,724 | 68,666 | |
| $ 1,390,338 | |||
| Tobacco — 0.1% | |||
| Ispire Technology, Inc.(1)(2) | 1,837 | $ 22,283 | |
| Turning Point Brands, Inc. | 1,415 | 37,243 | |
| Universal Corp. | 2,397 | 161,366 | |
| Security | Shares | Value | |
| Tobacco (continued) | |||
| Vector Group, Ltd. | 14,452 | $ 163,018 | |
| $ 383,910 | |||
| Trading Companies & Distributors — 2.0% | |||
| Alta Equipment Group, Inc. | 2,313 | $ 28,612 | |
| Applied Industrial Technologies, Inc. | 3,909 | 675,045 | |
| Beacon Roofing Supply, Inc.(1) | 5,859 | 509,850 | |
| BlueLinx Holdings, Inc.(1) | 869 | 98,466 | |
| Boise Cascade Co. | 4,015 | 519,381 | |
| Custom Truck One Source, Inc.(1) | 4,543 | 28,076 | |
| Distribution Solutions Group, Inc.(1) | 894 | 28,215 | |
| DXP Enterprises, Inc.(1) | 1,272 | 42,866 | |
| EVI Industries, Inc. | 392 | 9,302 | |
| FTAI Aviation, Ltd. | 10,042 | 465,949 | |
| GATX Corp. | 3,679 | 442,289 | |
| Global Industrial Co. | 1,285 | 49,909 | |
| GMS, Inc.(1) | 4,250 | 350,328 | |
| H&E Equipment Services, Inc. | 3,197 | 167,267 | |
| Herc Holdings, Inc. | 2,928 | 435,950 | |
| Hudson Technologies, Inc.(1) | 4,324 | 58,331 | |
| Karat Packaging, Inc. | 359 | 8,921 | |
| McGrath RentCorp | 2,558 | 305,988 | |
| MRC Global, Inc.(1) | 8,341 | 91,835 | |
| NOW, Inc.(1) | 10,910 | 123,501 | |
| Rush Enterprises, Inc., Class A | 6,190 | 311,357 | |
| Rush Enterprises, Inc., Class B | 846 | 44,821 | |
| Textainer Group Holdings, Ltd. | 4,292 | 211,166 | |
| Titan Machinery, Inc.(1) | 2,046 | 59,089 | |
| Transcat, Inc.(1) | 849 | 92,821 | |
| Willis Lease Finance Corp.(1) | 234 | 11,438 | |
| Xometry, Inc., Class A(1)(2) | 3,374 | 121,160 | |
| $ 5,291,933 | |||
| Water Utilities — 0.4% | |||
| American States Water Co. | 3,839 | $ 308,732 | |
| Artesian Resources Corp., Class A | 917 | 38,010 | |
| Cadiz, Inc.(1) | 3,349 | 9,377 | |
| California Water Service Group | 5,987 | 310,546 | |
| Consolidated Water Co., Ltd. | 1,557 | 55,429 | |
| Global Water Resources, Inc. | 641 | 8,384 | |
| Middlesex Water Co. | 1,742 | 114,310 | |
| Pure Cycle Corp.(1) | 1,502 | 15,726 | |
| SJW Group | 3,307 | 216,113 | |
| York Water Co. (The) | 1,406 | 54,300 | |
| $ 1,130,927 | |||
| Wireless Telecommunication Services — 0.1% | |||
| Gogo, Inc.(1) | 6,590 | $ 66,756 | |
| Shenandoah Telecommunications Co. | 4,830 | 104,424 | |
| Spok Holdings, Inc. | 1,468 | 22,725 | |
| Telephone & Data Systems, Inc. | 9,837 | 180,509 | |
| Security | Shares | Value | |
| Wireless Telecommunication Services (continued) | |||
| Tingo Group, Inc.(1)(2)(4) | 10,085 | $ 0 | |
| $ 374,414 | |||
| Total Common Stocks (identified cost $206,061,193) | $255,523,895 | ||
| Exchange-Traded Funds — 2.0% |
| Security | Shares | Value | |
| Equity Funds — 2.0% | |||
| iShares Russell 2000 ETF(2) | 27,000 | $ 5,419,170 | |
| Total Exchange-Traded Funds (identified cost $4,306,181) | $ 5,419,170 | ||
| Miscellaneous — 0.0% |
| Security | Shares | Value | |
| Miscellaneous — 0.0% | |||
| Empire Resorts, Inc., Escrow Certificates(1)(2)(4) | 270 | $ 0 | |
| Total Miscellaneous (identified cost $0) | $ 0 | ||
| Rights — 0.0%(3) |
| Security | Shares | Value | |
| Biotechnology — 0.0%(3) | |||
| Aduro Biotech, Inc. CVR(1)(4)(5) | 1,109 | $ 0 | |
| Cartesian Therapeutics, Inc. CVR(1)(2)(4) | 9,591 | 1,726 | |
| GTx, Inc. CVR(1)(4)(5) | 57 | 0 | |
| Prevail Therapeutics, Inc. CVR(1)(2)(4)(5) | 1,221 | 611 | |
| Radius Health, Inc. CVR(1)(4)(5) | 3,845 | 308 | |
| Tobira Therapeutics, Inc. CVR(1)(4)(5) | 690 | 41 | |
| $ 2,686 | |||
| Health Care Equipment & Supplies — 0.0%(3) | |||
| Flexion Therapeutics, Inc. CVR(1)(4)(5) | 3,730 | $ 2,313 | |
| $ 2,313 | |||
| Paper & Forest Products — 0.0%(3) | |||
| Resolute Forest Products, Inc. CVR(1)(4)(5) | 3,447 | $ 3,792 | |
| $ 3,792 | |||
| Pharmaceuticals — 0.0%(3) | |||
| Chinook Therapeutics, Inc. CVR(1)(4)(5) | 5,764 | $ 2,248 | |
| Security | Shares | Value | |
| Pharmaceuticals (continued) | |||
| Jounce Therapeutics, Inc. CVR(1)(2)(4)(5) | 2,585 | $ 77 | |
| $ 2,325 | |||
| Total Rights (identified cost $12,077) | $ 11,116 | ||
| Warrants — 0.0% |
| Security | Shares | Value | |
| Pharmaceuticals — 0.0% | |||
| Cassava Sciences, Inc., Expires 11/15/24(1) | 1,580 | $ 0 | |
| Total Warrants (identified cost $0) | $ 0 | ||
| Short-Term Investments — 5.3% | |||
| Affiliated Fund — 2.0% | |||
| Security | Shares | Value | |
| Morgan Stanley Institutional Liquidity Funds - Government Portfolio, Institutional Class, 5.27%(6) | 5,273,713 | $ 5,273,713 | |
| Total Affiliated Fund (identified cost $5,273,713) | $ 5,273,713 | ||
| Securities Lending Collateral — 3.0% | |||
| Security | Shares | Value | |
| State Street Navigator Securities Lending Government Money Market Portfolio, 5.36%(7) | 7,993,752 | $ 7,993,752 | |
| Total Securities Lending Collateral (identified cost $7,993,752) | $ 7,993,752 | ||
| U.S. Treasury Obligations — 0.3% | |||
| Security | Principal Amount (000's omitted) | Value | |
| U.S. Treasury Bills, 0.00%, 10/3/24(8) | $ | 1,000 | $ 964,068 |
| Total U.S. Treasury Obligations (identified cost $961,130) | $ 964,068 | ||
| Total Short-Term Investments (identified cost $14,228,595) | $ 14,231,533 | ||
| Total Investments — 103.0% (identified cost $224,608,046) | $275,185,714 | ||
| Other Assets, Less Liabilities — (3.0)% | $ (8,101,921) | ||
| Net Assets — 100.0% | $ 267,083,793 | ||
| The percentage shown for each investment category in the Schedule of Investments is based on net assets. | |
| (1) | Non-income producing security. |
| (2) | All or a portion of this security was on loan at December 31, 2023. The aggregate market value of securities on loan at December 31, 2023 was $18,889,221. |
| (3) | Amount is less than 0.05%. |
| (4) | For fair value measurement disclosure purposes, security is categorized as Level 3 (see Note 1A). |
| (5) | Restricted security. Total market value of restricted securities amounts to $9,390, which represents less than 0.05% of the net assets of the Fund as of December 31, 2023. |
| (6) | May be deemed to be an affiliated investment company. The rate shown is the annualized seven-day yield as of December 31, 2023. |
| (7) | Represents investment of cash collateral received in connection with securities lending. |
| (8) | Security (or a portion thereof) has been pledged to cover margin requirements on open futures contracts. |
| Description | Number of Contracts | Position | Expiration Date | Notional Amount | Value/ Unrealized Appreciation (Depreciation) |
| Equity Futures | |||||
| E-mini Russell 2000 Index | 61 | Long | 3/15/24 | $6,245,485 | $ 353,230 |
| $353,230 |
| Description | Acquisition Dates | Cost |
| Aduro Biotech, Inc. CVR | 10/2/20 | $ 0 |
| Chinook Therapeutics, Inc. CVR | 8/14/23 | 2,248 |
| Flexion Therapeutics, Inc. CVR | 7/20/22 | 2,313 |
| GTx, Inc. CVR | 6/10/19 | 117 |
| Jounce Therapeutics, Inc. CVR | 5/5/23 | 23 |
| OmniAb, Inc. (earnout shares) | 12/5/22 | 0 |
| OmniAb, Inc. (earnout shares) | 12/5/22 | 0 |
| Prevail Therapeutics, Inc. CVR | 1/25/21 | 611 |
| Radius Health, Inc. CVR | 8/16/22 | 308 |
| Resolute Forest Products, Inc. CVR | 3/1/23 | 4,895 |
| Tobira Therapeutics, Inc. CVR | 11/2/16 | 41 |
| Abbreviations: | |
| CVR | – Contingent Value Rights |
| REITs | – Real Estate Investment Trusts |
| December 31, 2023 | |
| Assets | |
| Investments in securities of unaffiliated issuers, at value (identified cost $219,334,333) - including $18,889,221 of securities on loan | $ 269,912,001 |
| Investments in securities of affiliated issuers, at value (identified cost $5,273,713) | 5,273,713 |
| Cash | 6,165 |
| Receivable for investments sold | 21,835 |
| Receivable for capital shares sold | 106,163 |
| Dividends receivable | 277,574 |
| Dividends receivable - affiliated | 33,902 |
| Securities lending income receivable | 23,162 |
| Receivable from affiliate | 59,987 |
| Directors' deferred compensation plan | 40,970 |
| Total assets | $275,755,472 |
| Liabilities | |
| Payable for variation margin on open futures contracts | $ 96,360 |
| Payable for investments purchased | 140,930 |
| Payable for capital shares redeemed | 145,391 |
| Deposits for securities loaned | 7,993,752 |
| Payable to affiliates: | |
| Investment advisory fee | 53,670 |
| Administrative fee | 26,267 |
| Distribution fees | 11,367 |
| Sub-transfer agency fee | 241 |
| Directors' deferred compensation plan | 40,970 |
| Accrued expenses | 162,731 |
| Total liabilities | $ 8,671,679 |
| Net Assets | $267,083,793 |
| Sources of Net Assets | |
| Paid-in capital | $ 207,791,081 |
| Distributable earnings | 59,292,712 |
| Net Assets | $267,083,793 |
| Class I Shares | |
| Net Assets | $ 197,463,722 |
| Shares Outstanding | 2,475,728 |
| Net Asset Value, Offering Price and Redemption Price Per Share (net assets ÷ shares of beneficial interest outstanding) | $ 79.76 |
| Class F Shares | |
| Net Assets | $ 69,620,071 |
| Shares Outstanding | 882,864 |
| Net Asset Value, Offering Price and Redemption Price Per Share (net assets ÷ shares of beneficial interest outstanding) | $ 78.86 |
| Year Ended | |
| December 31, 2023 | |
| Investment Income | |
| Dividend income (net of foreign taxes withheld of $4,513) | $ 3,526,434 |
| Dividend income - affiliated issuers | 361,073 |
| Interest income | 49,318 |
| Securities lending income, net | 239,440 |
| Total investment income | $ 4,176,265 |
| Expenses | |
| Investment advisory fee | $ 548,495 |
| Administrative fee | 263,277 |
| Distribution fees: | |
| Class F | 120,641 |
| Directors' fees and expenses | 14,991 |
| Custodian fees | 12,748 |
| Transfer agency fees and expenses | 185,734 |
| Accounting fees | 52,479 |
| Professional fees | 46,734 |
| Reports to shareholders | 11,641 |
| Licensing fees | 111,640 |
| Miscellaneous | 22,675 |
| Total expenses | $ 1,391,055 |
| Waiver and/or reimbursement of expenses by affiliates | $ (425,724) |
| Net expenses | $ 965,331 |
| Net investment income | $ 3,210,934 |
| Realized and Unrealized Gain (Loss) | |
| Net realized gain (loss): | |
| Investment securities | $ 4,285,823 |
| Futures contracts | 128,740 |
| Net realized gain | $ 4,414,563 |
| Change in unrealized appreciation (depreciation): | |
| Investment securities | $ 25,067,764 |
| Futures contracts | 663,270 |
| Net change in unrealized appreciation (depreciation) | $25,731,034 |
| Net realized and unrealized gain | $30,145,597 |
| Net increase in net assets from operations | $33,356,531 |
| Year Ended December 31, | ||
| 2023 | 2022 | |
| Increase (Decrease) in Net Assets | ||
| From operations: | ||
| Net investment income | $ 3,210,934 | $ 2,380,173 |
| Net realized gain | 4,414,563 | 614,144 |
| Net change in unrealized appreciation (depreciation) | 25,731,034 | (53,738,130) |
| Net increase (decrease) in net assets from operations | $ 33,356,531 | $ (50,743,813) |
| Distributions to shareholders: | ||
| Class I | $ (1,692,385) | $ (16,814,597) |
| Class F | (606,190) | (6,372,934) |
| Total distributions to shareholders | $ (2,298,575) | $ (23,187,531) |
| Capital share transactions: | ||
| Class I | $ 35,867,215 | $ 9,942,451 |
| Class F | 6,353,830 | 10,151,251 |
| Net increase in net assets from capital share transactions | $ 42,221,045 | $ 20,093,702 |
| Net increase (decrease) in net assets | $ 73,279,001 | $ (53,837,642) |
| Net Assets | ||
| At beginning of year | $ 193,804,792 | $ 247,642,434 |
| At end of year | $267,083,793 | $193,804,792 |
| Class I | |||||
| Year Ended December 31, | |||||
| 2023 | 2022 | 2021 | 2020 | 2019 | |
| Net asset value — Beginning of year | $ 69.08 | $ 99.34 | $ 89.92 | $ 80.81 | $ 71.03 |
| Income (Loss) From Operations | |||||
| Net investment income(1) | $ 1.10 | $ 0.97 | $ 0.82 | $ 0.79 | $ 0.90 |
| Net realized and unrealized gain (loss) | 10.27 | (21.79) | 12.22 | 13.71 | 15.99 |
| Total income (loss) from operations | $ 11.37 | $ (20.82) | $ 13.04 | $ 14.50 | $ 16.89 |
| Less Distributions | |||||
| From net investment income | $ (0.65) | $ (0.70) | $ (0.77) | $ (0.82) | $ (0.77) |
| From net realized gain | (0.04) | (8.74) | (2.85) | (4.57) | (6.34) |
| Total distributions | $ (0.69) | $ (9.44) | $ (3.62) | $ (5.39) | $ (7.11) |
| Net asset value — End of year | $ 79.76 | $ 69.08 | $ 99.34 | $ 89.92 | $ 80.81 |
| Total Return(2) | 16.60% | (20.52)% | 14.53% | 19.64% | 25.08% |
| Ratios/Supplemental Data | |||||
| Net assets, end of year (000’s omitted) | $197,464 | $139,281 | $183,595 | $168,541 | $154,335 |
| Ratios (as a percentage of average daily net assets):(3) | |||||
| Total expenses | 0.58% | 0.57% | 0.57% | 0.59% | 0.58% |
| Net expenses | 0.38% (4) | 0.39% (4) | 0.39% | 0.39% | 0.39% |
| Net investment income | 1.52% | 1.19% | 0.81% | 1.08% | 1.13% |
| Portfolio Turnover | 15% | 15% | 19% | 16% | 15% |
| (1) | Computed using average shares outstanding. |
| (2) | Returns are historical and are calculated by determining the percentage change in net asset value with all distributions reinvested and do not reflect fees and expenses imposed by variable annuity contracts or variable life insurance policies. If included, total return would be lower. |
| (3) | Total expenses do not reflect amounts reimbursed and/or waived by the adviser and certain of its affiliates, if applicable. Net expenses are net of all reductions and represent the net expenses paid by the Fund. |
| (4) | Includes a reduction by the adviser of a portion of its investment advisory fee due to the Fund’s investment in the Liquidity Fund (equal to less than 0.01% of average daily net assets for the years ended December 31, 2023 and 2022). |
| Class F | |||||
| Year Ended December 31, | |||||
| 2023 | 2022 | 2021 | 2020 | 2019 | |
| Net asset value — Beginning of year | $ 68.45 | $ 98.73 | $ 89.56 | $ 80.67 | $ 71.07 |
| Income (Loss) From Operations | |||||
| Net investment income(1) | $ 0.94 | $ 0.82 | $ 0.62 | $ 0.64 | $ 0.73 |
| Net realized and unrealized gain (loss) | 10.16 | (21.66) | 12.17 | 13.64 | 15.98 |
| Total income (loss) from operations | $ 11.10 | $ (20.84) | $ 12.79 | $ 14.28 | $ 16.71 |
| Less Distributions | |||||
| From net investment income | $ (0.65) | $ (0.70) | $ (0.77) | $ (0.82) | $ (0.77) |
| From net realized gain | (0.04) | (8.74) | (2.85) | (4.57) | (6.34) |
| Total distributions | $ (0.69) | $ (9.44) | $ (3.62) | $ (5.39) | $ (7.11) |
| Net asset value — End of year | $ 78.86 | $ 68.45 | $ 98.73 | $ 89.56 | $ 80.67 |
| Total Return(2) | 16.36% | (20.67)% | 14.30% | 19.40% | 24.82% |
| Ratios/Supplemental Data | |||||
| Net assets, end of year (000’s omitted) | $69,620 | $54,524 | $64,047 | $49,261 | $43,233 |
| Ratios (as a percentage of average daily net assets):(3) | |||||
| Total expenses | 0.78% | 0.77% | 0.77% | 0.79% | 0.78% |
| Net expenses | 0.58% (4) | 0.59% (4) | 0.59% | 0.59% | 0.60% |
| Net investment income | 1.31% | 1.01% | 0.62% | 0.88% | 0.92% |
| Portfolio Turnover | 15% | 15% | 19% | 16% | 15% |
| (1) | Computed using average shares outstanding. |
| (2) | Returns are historical and are calculated by determining the percentage change in net asset value with all distributions reinvested and do not reflect fees and expenses imposed by variable annuity contracts or variable life insurance policies. If included, total return would be lower. |
| (3) | Total expenses do not reflect amounts reimbursed and/or waived by the adviser and certain of its affiliates, if applicable. Net expenses are net of all reductions and represent the net expenses paid by the Fund. |
| (4) | Includes a reduction by the adviser of a portion of its investment advisory fee due to the Fund’s investment in the Liquidity Fund (equal to less than 0.01% of average daily net assets for the years ended December 31, 2023 and 2022). |
| Asset Description | Level 1 | Level 2 | Level 3(1) | Total |
| Common Stocks | $ 255,523,895(2) | $ — | $ 0 | $ 255,523,895 |
| Exchange-Traded Funds | 5,419,170 | — | — | 5,419,170 |
| Miscellaneous | — | — | 0 | 0 |
| Rights | — | — | 11,116 | 11,116 |
| Warrants | 0 | — | — | 0 |
| Short-Term Investments: | ||||
| Affiliated Fund | 5,273,713 | — | — | 5,273,713 |
| Securities Lending Collateral | 7,993,752 | — | — | 7,993,752 |
| U.S. Treasury Obligations | — | 964,068 | — | 964,068 |
| Total Investments | $274,210,530 | $964,068 | $11,116 | $275,185,714 |
| Futures Contracts | $ 353,230 | $ — | $ — | $ 353,230 |
| Total | $274,563,760 | $964,068 | $11,116 | $275,538,944 |
| (1) | None of the unobservable inputs for Level 3 assets, individually or collectively, had a material impact on the Fund. |
| (2) | The level classification by major category of investments is the same as the category presentation in the Schedule of Investments. |
| Year Ended December 31, | ||
| 2023 | 2022 | |
| Ordinary income | $2,160,902 | $ 4,076,096 |
| Long-term capital gains | $ 137,673 | $19,111,435 |
| Undistributed ordinary income | $ 3,572,284 |
| Undistributed long-term capital gains | 5,418,510 |
| Net unrealized appreciation | 50,301,918 |
| Distributable earnings | $59,292,712 |
| Aggregate cost | $224,883,796 |
| Gross unrealized appreciation | $ 84,853,002 |
| Gross unrealized depreciation | (34,551,084) |
| Net unrealized appreciation | $ 50,301,918 |
| Derivative | Statement of Assets and Liabilities Caption | Assets | Liabilities | |
| Futures contracts | Distributable earnings | $353,230 (1) | $ — | |
| (1) | Only the current day's variation margin is reported within the Statement of Assets and Liabilities as Receivable or Payable for variation margin on open futures contracts, as applicable. |
| Statement of Operations Caption | |||
| Derivative | Net realized gain (loss): Futures contracts | Change in unrealized appreciation (depreciation): Futures contracts | |
| Futures contracts | $ 128,740 | $ 663,270 | |
| Remaining Contractual Maturity of the Transactions | |||||
| Overnight and Continuous | <30 days | 30 to 90 days | >90 days | Total | |
| Common Stocks | $ 7,965,364 | $ — | $ — | $ — | $ 7,965,364 |
| Rights | 28,388 | — | — | — | 28,388 |
| Total | $7,993,752 | $ — | $ — | $ — | $7,993,752 |
| Name | Value, beginning of period | Purchases | Sales proceeds | Net realized gain (loss) | Change in unrealized appreciation (depreciation) | Value, end of period | Dividend income | Shares, end of period |
| Short-Term Investments | ||||||||
| Liquidity Fund | $7,303,821 | $77,861,841 | $(79,891,949) | $ — | $ — | $5,273,713 | $361,073 | 5,273,713 |
| Year Ended December 31, 2023 | Year Ended December 31, 2022 | ||||
| Shares | Amount | Shares | Amount | ||
| Class I | |||||
| Shares sold | 719,250 | $ 54,924,183 | 153,428 | $ 12,605,440 | |
| Reinvestment of distributions | 24,337 | 1,692,385 | 254,960 | 16,814,597 | |
| Shares redeemed | (283,956) | (20,749,353) | (240,367) | (19,477,586) | |
| Net increase | 459,631 | $ 35,867,215 | 168,021 | $ 9,942,451 | |
| Class F | |||||
| Shares sold | 262,340 | $ 19,079,096 | 189,192 | $ 15,123,430 | |
| Reinvestment of distributions | 8,813 | 606,190 | 97,490 | 6,372,934 | |
| Shares redeemed | (184,892) | (13,331,456) | (138,775) | (11,345,113) | |
| Net increase | 86,261 | $ 6,353,830 | 147,907 | $ 10,151,251 | |
Boston, Massachusetts
February 16, 2024
| Name and Year of Birth | Corporation Position(s) | Length of Service | Principal Occupation(s) and Other Directorships During Past Five Years and Other Relevant Experience |
| Interested Director | |||
| Von M. Hughes(1) 1969 | Director and President | Since 2023 | President and Chief Executive Officer and Managing Director of Calvert Research and Management. Managing Director of Morgan Stanley Investment Management (MSIM) (since 2022). Formerly, Managing Director of PAAMCO Prisma (investment management firm) (2003-2022). Mr. Hughes is an interested person because of his positions with CRM and certain affiliates. Other Directorships. Tradeweb Markets Inc. (financial services) (2021-2022); National Association of Investment Companies (2018-2021). |
| Noninterested Directors | |||
| Alice Gresham Bullock 1950 | Chair and Director | Since 2016 (Chair); Since 2008 (Director) | Professor Emerita at Howard University School of Law. Dean Emerita of Howard University School of Law and Deputy Director of the Association of American Law Schools (1992-1994). Other Directorships. None. |
| Cari M. Dominguez 1949 | Director | Since 2016 | Former Chair of the U.S. Equal Employment Opportunity Commission. Other Directorships. ManpowerGroup Inc. (workforce solutions company); Triple S Management Corporation (managed care); National Association of Corporate Directors. |
| Karen Fang(2) 1958 | Director | Since 2023 | Formerly, Managing Director, Wealth Management at GAMCO Asset Management (asset management firm) (2020-2023). Formerly, Managing Director, Senior Portfolio Manager of Fiduciary Trust Company International (wealth management firm) (1993-2019). Other Directorships. None. |
| Miles D. Harper, III 1962 | Director | Since 2016 | Private investor (2022-present). Formerly, Partner, Carr Riggs & Ingram (public accounting firm) (2014-2022). Partner, Gainer Donnelly & Desroches (public accounting firm) (now Carr Riggs & Ingram) (1999-2014). Other Directorships. Bridgeway Funds (9) (asset management). |
| Joy V. Jones 1950 | Director | Since 2016 | Attorney. Other Directorships. Palm Management Corporation. |
| Eddie Ramos(2) 1967 | Director | Since 2023 | Private investor (2022-present). Formerly, Head of External Advisors/Diversity Portfolio Management at the New Jersey Division of Investment (2020-2022). Formerly, Chief Investment Officer and Lead Portfolio Manager – Global Fundamental Equities at Cornerstone Capital Management (asset management firm) (2011-2017). Other Directorships. Macquarie Optimum Funds (6) (asset management) (2022-2023). |
| Name and Year of Birth | Corporation Position(s) | Length of Service | Principal Occupation(s) and Other Directorships During Past Five Years and Other Relevant Experience |
| Noninterested Directors (continued) | |||
| Anthony A. Williams 1951 | Director | Since 2016 | CEO and Executive Director of the Federal City Council (July 2012 to present); Senior Adviser and Independent Consultant for King and Spalding LLP (September 2015 to present); Executive Director of Global Government Practice at the Corporate Executive Board (January 2010 to January 2012). Other Directorships. Freddie Mac; Evoq Properties/Meruelo Maddux Properties, Inc. (real estate management); Weston Solutions, Inc. (environmental services); Bipartisan Policy Center’s Debt Reduction Task Force; Chesapeake Bay Foundation; Catholic University of America; Urban Institute (research organization); The Howard Hughes Corporation (real estate development); Old Dominion National Bank. |
| Name and Year of Birth | Corporation Position(s) | Length of Service | Principal Occupation(s) During Past Five Years |
| Principal Officers who are not Directors | |||
| Hope L. Brown 1973 | Chief Compliance Officer | Since 2014 | Chief Compliance Officer of 46 registered investment companies advised by CRM (since 2014). Vice President and Chief Compliance Officer, Wilmington Funds (2012-2014). |
| Deidre E. Walsh 1971 | Secretary, Vice President and Chief Legal Officer | Since 2021 | Vice President of CRM and officer of 46 registered investment companies advised by CRM (since 2021). Also Vice President of Eaton Vance and certain of its affiliates and officer of 127 registered investment companies advised or administered by Eaton Vance. |
| James F. Kirchner 1967 | Treasurer | Since 2016 | Vice President of CRM and officer of 46 registered investment companies advised by CRM (since 2016). Also Vice President of Eaton Vance and certain of its affiliates and officer of 127 registered investment companies advised or administered by Eaton Vance. |
| (1) Mr. Hughes is an interested person of the Fund because of his positions with the Fund’s adviser and certain affiliates. | |||
| (2) Ms. Fang and Mr. Ramos began serving as Directors effective October 30, 2023. | |||
| Privacy Notice | April 2021 |
| FACTS | WHAT DOES EATON VANCE DO WITH YOUR PERSONAL INFORMATION? |
| Why? | Financial companies choose how they share your personal information. Federal law gives consumers the right to limit some but not all sharing. Federal law also requires us to tell you how we collect, share, and protect your personal information. Please read this notice carefully to understand what we do. |
| What? | The types of personal information we collect and share depend on the product or service you have with us. This information can include:■ Social Security number and income ■ investment experience and risk tolerance ■ checking account number and wire transfer instructions |
| How? | All financial companies need to share customers’ personal information to run their everyday business. In the section below, we list the reasons financial companies can share their customers’ personal information; the reasons Eaton Vance chooses to share; and whether you can limit this sharing. |
| Reasons we can share your personal information | Does Eaton Vance share? | Can you limit this sharing? |
| For our everyday business purposes — such as to process your transactions, maintain your account(s), respond to court orders and legal investigations, or report to credit bureaus | Yes | No |
| For our marketing purposes — to offer our products and services to you | Yes | No |
| For joint marketing with other financial companies | No | We don’t share |
| For our investment management affiliates’ everyday business purposes — information about your transactions, experiences, and creditworthiness | Yes | Yes |
| For our affiliates’ everyday business purposes — information about your transactions and experiences | Yes | No |
| For our affiliates’ everyday business purposes — information about your creditworthiness | No | We don’t share |
| For our investment management affiliates to market to you | Yes | Yes |
| For our affiliates to market to you | No | We don’t share |
| For nonaffiliates to market to you | No | We don’t share |
| To limit our sharing | Call toll-free 1-800-368-2745 or email: CRMPrivacy@calvert.comPlease note:If you are a new customer, we can begin sharing your information 30 days from the date we sent this notice. When you are no longer our customer, we continue to share your information as described in this notice. However, you can contact us at any time to limit our sharing. |
| Questions? | Call toll-free 1-800-368-2745 or email: CRMPrivacy@calvert.com |
| Privacy Notice — continued | April 2021 |
| Who we are | |
| Who is providing this notice? | Eaton Vance Management, Eaton Vance Distributors, Inc., Eaton Vance Trust Company, Eaton Vance Management (International) Limited, Eaton Vance Advisers International Ltd., Eaton Vance Global Advisors Limited, Eaton Vance Management’s Real Estate Investment Group, Boston Management and Research, Calvert Research and Management, Eaton Vance and Calvert Fund Families and our investment advisory affiliates (“Eaton Vance”) (see Investment Management Affiliates definition below) |
| What we do | |
| How does Eaton Vance protect my personal information? | To protect your personal information from unauthorized access and use, we use security measures that comply with federal law. These measures include computer safeguards and secured files and buildings. We have policies governing the proper handling of customer information by personnel and requiring third parties that provide support to adhere to appropriate security standards with respect to such information. |
| How does Eaton Vance collect my personal information? | We collect your personal information, for example, when you■ open an account or make deposits or withdrawals from your account ■ buy securities from us or make a wire transfer ■ give us your contact informationWe also collect your personal information from others, such as credit bureaus, affiliates, or other companies. |
| Why can’t I limit all sharing? | Federal law gives you the right to limit only■ sharing for affiliates’ everyday business purposes — information about your creditworthiness ■ affiliates from using your information to market to you ■ sharing for nonaffiliates to market to youState laws and individual companies may give you additional rights to limit sharing. See below for more on your rights under state law. |
| Definitions | |
| Investment Management Affiliates | Eaton Vance Investment Management Affiliates include registered investment advisers, registered broker- dealers, and registered and unregistered funds. Investment Management Affiliates does not include entities associated with Morgan Stanley Wealth Management, such as Morgan Stanley Smith Barney LLC and Morgan Stanley & Co. |
| Affiliates | Companies related by common ownership or control. They can be financial and nonfinancial companies.■ Our affiliates include companies with a Morgan Stanley name and financial companies such as Morgan Stanley Smith Barney LLC and Morgan Stanley & Co. |
| Nonaffiliates | Companies not related by common ownership or control. They can be financial and nonfinancial companies.■ Eaton Vance does not share with nonaffiliates so they can market to you. |
| Joint marketing | A formal agreement between nonaffiliated financial companies that together market financial products or services to you.■ Eaton Vance doesn’t jointly market. |
| Other important information | |
| Vermont: Except as permitted by law, we will not share personal information we collect about Vermont residents with Nonaffiliates unless you provide us with your written consent to share such information.California: Except as permitted by law, we will not share personal information we collect about California residents with Nonaffiliates and we will limit sharing such personal information with our Affiliates to comply with California privacy laws that apply to us. | |


| % Average Annual Total Returns1,2 | Class Inception Date | Performance Inception Date | One Year | Five Years | Ten Years |
| Class I at NAV | 11/12/2002 | 11/12/2002 | 17.77% | 7.82% | 3.81% |
| Class F at NAV | 12/17/2007 | 11/12/2002 | 17.53 | 7.61 | 3.58 |
| MSCI EAFE Index | — | — | 18.24% | 8.16% | 4.28% |
| % Total Annual Operating Expense Ratios3 | Class I | Class F |
| Gross | 0.72% | 0.92% |
| Net | 0.48 | 0.68 |
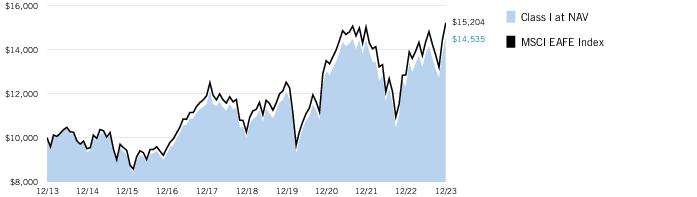
| Growth of Investment | Amount Invested | Period Beginning | At NAV | With Maximum Sales Charge |
| Class F | $10,000 | 12/31/2013 | $14,222 | N.A. |
| Sector Allocation (% of net assets)1 |
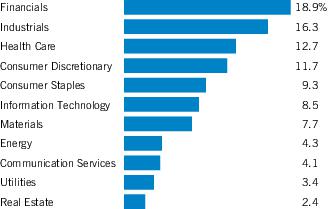
| Top 10 Holdings (% of net assets)1 | |
| Novo Nordisk A/S, Class B | 2.1% |
| Nestle S.A. | 1.9 |
| ASML Holding NV | 1.9 |
| LVMH Moet Hennessy Louis Vuitton SE | 1.4 |
| Shell PLC | 1.3 |
| AstraZeneca PLC | 1.3 |
| Novartis AG | 1.3 |
| Roche Holding AG PC | 1.3 |
| Toyota Motor Corp. | 1.2 |
| BHP Group, Ltd. | 1.1 |
| Total | 14.8% |
| 1 | Excludes cash and cash equivalents. |
| † | The views expressed in this report are those of the portfolio manager(s) and are current only through the date stated at the top of this page. These views are subject to change at any time based upon market or other conditions, and Calvert and the Fund(s) disclaim any responsibility to update such views. These views may not be relied upon as investment advice and, because investment decisions are based on many factors, may not be relied upon as an indication of trading intent on behalf of any Calvert fund. This commentary may contain statements that are not historical facts, referred to as “forward-looking statements.” The Fund’s actual future results may differ significantly from those stated in any forward-looking statement, depending on factors such as changes in securities or financial markets or general economic conditions, the volume of sales and purchases of Fund shares, the continuation of investment advisory, administrative and service contracts, and other risks discussed from time to time in the Fund’s filings with the Securities and Exchange Commission. |
| 1 | MSCI EAFE Index is an unmanaged index of equities in the developed markets, excluding the U.S. and Canada. MSCI indexes are net of foreign withholding taxes. Source: MSCI. MSCI data may not be reproduced or used for any other purpose. MSCI provides no warranties, has not prepared or approved this report, and has no liability hereunder. Unless otherwise stated, index returns do not reflect the effect of any applicable sales charges, commissions, expenses, taxes or leverage, as applicable. It is not possible to invest directly in an index. |
| 2 | There is no sales charge. Insurance-related charges are not included in the calculation of returns. If such charges were reflected, the returns would be lower. Please refer to the report for your insurance contract for performance data reflecting insurance-related charges.Calvert Research and Management became the investment adviser to the Fund on December 31, 2016. Performance reflected prior to such date is that of the Fund’s former investment adviser. |
| 3 | Source: Fund prospectus. Net expense ratios reflect a contractual expense reimbursement that continues through 4/30/24. The expense ratios for the current reporting period can be found in the Financial Highlights section of this report. Performance reflects expenses waived and/or reimbursed, if applicable. Without such waivers and/or reimbursements, performance would have been lower. |
| Additional Information | |
| S&P 500® Index is an unmanaged index of large-cap stocks commonly used as a measure of U.S. stock market performance. S&P Dow Jones Indices are a product of S&P Dow Jones Indices LLC (“S&P DJI”) and have been licensed for use. S&P® and S&P 500® are registered trademarks of S&P DJI; Dow Jones® is a registered trademark of Dow Jones Trademark Holdings LLC (“Dow Jones”); S&P DJI, Dow Jones and their respective affiliates do not sponsor, endorse, sell or promote the Fund, will not have any liability with respect thereto and do not have any liability for any errors, omissions, or interruptions of the S&P Dow Jones Indices. MSCI Golden Dragon Index is an unmanaged index of common stocks traded in China, Hong Kong and Taiwan. MSCI ACWI Index is an unmanaged free-float-adjusted, market-capitalization-weighted index designed to measure the equity market performance of developed and emerging markets. |
| Beginning Account Value (7/1/23) | Ending Account Value (12/31/23) | Expenses Paid During Period* (7/1/23 – 12/31/23) | Annualized Expense Ratio | |
| Actual | ||||
| Class I | $1,000.00 | $1,052.80 | $2.48 ** | 0.48% |
| Class F | $1,000.00 | $1,051.70 | $3.52 ** | 0.68% |
| Hypothetical | ||||
| (5% return per year before expenses) | ||||
| Class I | $1,000.00 | $1,022.79 | $2.45 ** | 0.48% |
| Class F | $1,000.00 | $1,021.78 | $3.47 ** | 0.68% |
| * | Expenses are equal to the Fund's annualized expense ratio for the indicated Class, multiplied by the average account value over the period, multiplied by 184/365 (to reflect the one-half year period). The Example assumes that the $1,000 was invested at the net asset value per share determined at the close of business on June 30, 2023. Expenses shown do not include insurance-related charges or direct expenses of Qualified Plans. |
| ** | Absent a waiver and/or reimbursement of expenses by affiliate(s), expenses would be higher. |
| Common Stocks — 99.3% |
| Security | Shares | Value | |
| Australia — 7.4% | |||
| Ampol, Ltd. | 1,867 | $ 46,012 | |
| ANZ Group Holdings, Ltd. | 25,722 | 454,457 | |
| APA Group(1) | 11,621 | 67,629 | |
| Aristocrat Leisure, Ltd. | 5,213 | 144,836 | |
| ASX, Ltd. | 1,628 | 69,944 | |
| Aurizon Holdings, Ltd. | 13,234 | 34,262 | |
| BHP Group, Ltd. | 43,553 | 1,487,971 | |
| BlueScope Steel, Ltd. | 3,687 | 58,780 | |
| Brambles, Ltd. | 11,380 | 105,480 | |
| CAR Group, Ltd. | 3,345 | 70,885 | |
| Cochlear, Ltd.(1) | 569 | 115,761 | |
| Coles Group, Ltd. | 11,225 | 123,307 | |
| Commonwealth Bank of Australia | 14,422 | 1,099,201 | |
| Computershare, Ltd. | 5,081 | 84,626 | |
| CSL, Ltd. | 4,185 | 815,862 | |
| Dexus (1) | 9,086 | 47,485 | |
| EBOS Group, Ltd. | 1,272 | 28,527 | |
| Endeavour Group, Ltd. | 12,926 | 45,904 | |
| Fortescue, Ltd. | 14,757 | 290,969 | |
| Goodman Group(1) | 14,379 | 247,561 | |
| GPT Group (The) | 14,328 | 45,219 | |
| IDP Education, Ltd.(1) | 2,385 | 32,534 | |
| IGO, Ltd.(1) | 5,034 | 31,025 | |
| Insurance Australia Group, Ltd. | 21,559 | 83,333 | |
| Lottery Corp., Ltd. (The) | 19,080 | 62,956 | |
| Macquarie Group, Ltd. | 3,176 | 397,577 | |
| Medibank Private, Ltd. | 21,199 | 51,466 | |
| Mineral Resources, Ltd.(1) | 1,488 | 70,879 | |
| Mirvac Group(1) | 32,152 | 45,740 | |
| National Australia Bank, Ltd. | 26,820 | 560,562 | |
| Northern Star Resources, Ltd. | 9,479 | 87,947 | |
| Orica, Ltd. | 3,401 | 36,970 | |
| Origin Energy, Ltd. | 14,121 | 81,488 | |
| Pilbara Minerals, Ltd.(1) | 22,929 | 61,544 | |
| Qantas Airways, Ltd.(2) | 7,283 | 26,678 | |
| QBE Insurance Group, Ltd. | 12,719 | 128,876 | |
| Ramsay Health Care, Ltd.(1) | 1,442 | 51,728 | |
| REA Group, Ltd.(1) | 489 | 60,298 | |
| Reece, Ltd. | 2,319 | 35,372 | |
| Rio Tinto, Ltd. | 3,157 | 292,331 | |
| Santos, Ltd. | 27,288 | 141,884 | |
| Scentre Group | 41,355 | 84,216 | |
| SEEK, Ltd. | 3,291 | 59,873 | |
| Sonic Healthcare, Ltd. | 3,588 | 78,400 | |
| South32, Ltd. | 38,956 | 88,104 | |
| Stockland | 19,317 | 58,581 | |
| Suncorp Group, Ltd. | 11,287 | 106,881 | |
| Telstra Group, Ltd. | 33,004 | 89,186 | |
| Transurban Group | 25,847 | 241,524 | |
| Security | Shares | Value | |
| Australia (continued) | |||
| Treasury Wine Estates, Ltd. | 6,545 | $ 48,155 | |
| Vicinity, Ltd. | 36,142 | 50,205 | |
| Washington H. Soul Pattinson & Co., Ltd.(1) | 1,836 | 41,016 | |
| Wesfarmers, Ltd. | 9,808 | 381,423 | |
| Westpac Banking Corp. | 30,061 | 469,026 | |
| WiseTech Global, Ltd.(1) | 1,460 | 74,832 | |
| Woodside Energy Group, Ltd. | 16,497 | 348,361 | |
| Woolworths Group, Ltd. | 10,460 | 265,370 | |
| $ 10,311,019 | |||
| Austria — 0.2% | |||
| Erste Group Bank AG | 3,038 | $ 123,054 | |
| OMV AG | 1,381 | 60,588 | |
| Verbund AG | 639 | 59,217 | |
| voestalpine AG | 996 | 31,360 | |
| $ 274,219 | |||
| Belgium — 0.8% | |||
| Ageas S.A./NV | 1,339 | $ 58,207 | |
| Anheuser-Busch InBev S.A./NV | 7,394 | 477,269 | |
| D'Ieteren Group | 195 | 38,144 | |
| Elia Group S.A./NV | 260 | 32,546 | |
| Groupe Bruxelles Lambert NV | 804 | 63,317 | |
| KBC Group NV | 2,053 | 133,238 | |
| Lotus Bakeries NV(1) | 4 | 36,356 | |
| Sofina S.A.(1) | 155 | 38,646 | |
| Syensqo S.A.(2) | 606 | 63,059 | |
| UCB S.A. | 1,015 | 88,479 | |
| Umicore S.A. | 1,766 | 48,577 | |
| Warehouses De Pauw CVA | 1,614 | 50,806 | |
| $ 1,128,644 | |||
| Denmark — 3.3% | |||
| AP Moller - Maersk A/S, Class A | 29 | $ 51,512 | |
| AP Moller - Maersk A/S, Class B | 48 | 86,401 | |
| Carlsberg A/S, Class B | 892 | 111,932 | |
| Chr. Hansen Holding A/S | 842 | 70,616 | |
| Coloplast A/S, Class B | 1,192 | 136,205 | |
| Danske Bank A/S | 5,815 | 155,442 | |
| Demant A/S(2) | 798 | 35,000 | |
| DSV A/S | 1,569 | 275,684 | |
| Genmab A/S(2) | 566 | 180,471 | |
| Novo Nordisk A/S, Class B | 28,131 | 2,915,248 | |
| Novozymes A/S, Class B | 1,837 | 100,986 | |
| Orsted A/S(3) | 1,603 | 88,865 | |
| Pandora A/S | 768 | 106,180 | |
| ROCKWOOL International A/S, Class B | 61 | 17,847 | |
| Tryg A/S | 2,723 | 59,259 | |
| Vestas Wind Systems A/S(2) | 8,776 | 277,688 | |
| $ 4,669,336 | |||
| Security | Shares | Value | |
| Finland — 1.1% | |||
| Elisa Oyj | 1,214 | $ 56,122 | |
| Fortum Oyj | 4,229 | 61,084 | |
| Kesko Oyj, Class B | 2,174 | 43,097 | |
| Kone Oyj, Class B | 2,878 | 143,961 | |
| Metso Oyj | 5,202 | 52,810 | |
| Neste Oyj | 3,509 | 124,744 | |
| Nokia Oyj | 46,427 | 158,127 | |
| Nordea Bank Abp | 28,002 | 347,641 | |
| Orion Oyj, Class B | 819 | 35,489 | |
| Sampo Oyj, Class A | 3,834 | 167,976 | |
| Stora Enso Oyj, Class R | 5,297 | 73,393 | |
| UPM-Kymmene Oyj | 4,456 | 168,083 | |
| Wartsila Oyj Abp(1) | 3,830 | 55,663 | |
| $ 1,488,190 | |||
| France — 11.2% | |||
| Accor S.A. | 1,612 | $ 61,701 | |
| Aeroports de Paris S.A. | 337 | 43,727 | |
| Air Liquide S.A. | 4,484 | 873,014 | |
| Alstom S.A. | 2,516 | 33,929 | |
| Amundi S.A.(3) | 448 | 30,558 | |
| ArcelorMittal S.A. | 4,584 | 130,094 | |
| Arkema S.A. | 475 | 54,111 | |
| AXA S.A. | 15,597 | 509,343 | |
| BioMerieux | 321 | 35,714 | |
| BNP Paribas S.A. | 9,119 | 633,275 | |
| Bollore SE | 5,422 | 33,930 | |
| Bouygues S.A. | 1,786 | 67,384 | |
| Bureau Veritas S.A. | 2,318 | 58,645 | |
| Capgemini SE | 1,383 | 289,035 | |
| Carrefour S.A. | 4,895 | 89,650 | |
| Cie de Saint-Gobain S.A. | 3,850 | 283,927 | |
| Cie Generale des Etablissements Michelin SCA | 5,994 | 215,344 | |
| Covivio S.A. | 345 | 18,564 | |
| Credit Agricole S.A. | 9,146 | 130,026 | |
| Danone S.A. | 5,563 | 360,919 | |
| Dassault Aviation S.A. | 152 | 30,116 | |
| Dassault Systemes SE | 5,821 | 284,922 | |
| Edenred SE | 2,168 | 129,743 | |
| Eiffage S.A. | 595 | 63,874 | |
| Engie S.A. | 15,450 | 272,172 | |
| EssilorLuxottica S.A. | 2,508 | 503,603 | |
| Eurazeo SE | 445 | 35,384 | |
| Eurofins Scientific SE | 1,066 | 69,538 | |
| Gecina S.A. | 366 | 44,557 | |
| Getlink SE | 3,312 | 60,659 | |
| Hermes International SCA | 271 | 576,015 | |
| Ipsen S.A. | 305 | 36,383 | |
| Kering S.A. | 646 | 286,112 | |
| Klepierre S.A. | 1,988 | 54,274 | |
| La Francaise des Jeux SAEM(3) | 1,007 | 36,579 | |
| Security | Shares | Value | |
| France (continued) | |||
| Legrand S.A. | 2,329 | $ 242,533 | |
| L'Oreal S.A. | 2,075 | 1,034,389 | |
| LVMH Moet Hennessy Louis Vuitton SE | 2,370 | 1,925,712 | |
| Orange S.A. | 16,080 | 183,274 | |
| Pernod Ricard S.A. | 1,753 | 309,793 | |
| Publicis Groupe S.A. | 2,018 | 187,496 | |
| Remy Cointreau S.A. | 202 | 25,766 | |
| Renault S.A. | 1,531 | 62,618 | |
| Safran S.A. | 2,961 | 522,055 | |
| Sanofi | 9,816 | 975,443 | |
| Sartorius Stedim Biotech | 241 | 63,909 | |
| Schneider Electric SE | 4,710 | 948,152 | |
| SEB S.A. | 192 | 24,043 | |
| Societe Generale S.A. | 6,319 | 168,119 | |
| Sodexo S.A. | 722 | 79,484 | |
| Teleperformance SE | 483 | 70,715 | |
| Thales S.A. | 912 | 135,042 | |
| TotalEnergies SE | 19,689 | 1,338,832 | |
| Unibail-Rodamco-Westfield (2) | 996 | 73,668 | |
| Veolia Environnement S.A. | 5,657 | 178,799 | |
| Vinci S.A. | 4,346 | 546,923 | |
| Vivendi SE | 5,507 | 58,952 | |
| Worldline S.A.(2)(3) | 1,885 | 32,780 | |
| $ 15,625,318 | |||
| Germany — 8.5% | |||
| adidas AG | 1,392 | $ 282,864 | |
| Allianz SE | 3,453 | 922,784 | |
| BASF SE | 7,649 | 411,876 | |
| Bayer AG | 8,318 | 308,630 | |
| Bayerische Motoren Werke AG | 2,699 | 300,322 | |
| Bayerische Motoren Werke AG, PFC Shares | 632 | 62,886 | |
| Bechtle AG | 660 | 33,058 | |
| Beiersdorf AG | 856 | 128,190 | |
| Brenntag SE | 1,250 | 114,884 | |
| Carl Zeiss Meditec AG | 333 | 36,248 | |
| Commerzbank AG | 9,225 | 109,646 | |
| Continental AG | 934 | 79,326 | |
| Covestro AG(2)(3) | 1,673 | 97,489 | |
| Daimler Truck Holding AG | 4,735 | 177,866 | |
| Delivery Hero SE(2)(3) | 1,553 | 42,743 | |
| Deutsche Bank AG | 16,278 | 222,213 | |
| Deutsche Boerse AG | 1,653 | 340,410 | |
| Deutsche Lufthansa AG(2) | 4,675 | 41,562 | |
| Deutsche Post AG | 8,594 | 425,369 | |
| Deutsche Telekom AG | 28,018 | 673,645 | |
| Dr. Ing. h.c. F. Porsche AG, PFC Shares(3) | 960 | 84,554 | |
| E.ON SE | 19,421 | 260,922 | |
| Evonik Industries AG | 1,690 | 34,525 | |
| Fresenius Medical Care AG | 1,614 | 67,479 | |
| Fresenius SE & Co. KGaA | 3,627 | 112,421 | |
| Security | Shares | Value | |
| Germany (continued) | |||
| GEA Group AG | 1,538 | $ 63,941 | |
| Hannover Rueck SE | 494 | 118,117 | |
| Heidelberg Materials AG | 1,195 | 106,819 | |
| HelloFresh SE(2) | 1,318 | 20,780 | |
| Henkel AG & Co. KGaA | 927 | 66,511 | |
| Henkel AG & Co. KGaA, PFC Shares | 1,416 | 113,906 | |
| Infineon Technologies AG | 11,233 | 469,119 | |
| Knorr-Bremse AG | 597 | 38,557 | |
| LEG Immobilien SE(2) | 696 | 60,907 | |
| Mercedes-Benz Group AG | 6,858 | 473,187 | |
| Merck KGaA | 1,124 | 178,957 | |
| MTU Aero Engines AG | 453 | 97,597 | |
| Muenchener Rueckversicherungs-Gesellschaft AG | 1,187 | 492,384 | |
| Nemetschek SE | 486 | 41,959 | |
| Porsche Automobil Holding SE, PFC Shares | 1,286 | 65,717 | |
| Puma SE | 797 | 44,337 | |
| Rational AG | 41 | 31,638 | |
| Rheinmetall AG | 378 | 119,878 | |
| RWE AG | 5,447 | 247,909 | |
| SAP SE | 9,020 | 1,388,372 | |
| Sartorius AG, PFC Shares | 237 | 87,031 | |
| Scout24 SE(3) | 615 | 43,487 | |
| Siemens AG | 6,569 | 1,232,405 | |
| Siemens Energy AG(2) | 4,007 | 52,958 | |
| Siemens Healthineers AG(3) | 2,441 | 141,721 | |
| Symrise AG | 1,177 | 129,347 | |
| Talanx AG | 538 | 38,448 | |
| Volkswagen AG | 305 | 39,911 | |
| Volkswagen AG, PFC Shares | 1,842 | 227,038 | |
| Vonovia SE | 6,303 | 198,051 | |
| Wacker Chemie AG | 155 | 19,542 | |
| Zalando SE(2)(3) | 1,718 | 40,673 | |
| $ 11,863,116 | |||
| Hong Kong — 2.1% | |||
| AIA Group, Ltd. | 98,566 | $ 857,808 | |
| BOC Hong Kong Holdings, Ltd. | 32,956 | 89,526 | |
| Budweiser Brewing Co. APAC, Ltd.(3) | 15,900 | 29,808 | |
| CK Asset Holdings, Ltd. | 16,209 | 81,354 | |
| CK Hutchison Holdings, Ltd. | 22,847 | 122,748 | |
| CK Infrastructure Holdings, Ltd. | 5,604 | 31,014 | |
| CLP Holdings, Ltd. | 14,122 | 116,678 | |
| ESR Group, Ltd.(3) | 17,000 | 23,510 | |
| Futu Holdings, Ltd. ADR(2) | 406 | 22,180 | |
| Galaxy Entertainment Group, Ltd. | 18,913 | 105,929 | |
| Hang Lung Properties, Ltd. | 14,000 | 19,464 | |
| Hang Seng Bank, Ltd. | 6,040 | 70,520 | |
| Henderson Land Development Co., Ltd. | 11,806 | 36,356 | |
| HKT Trust & HKT, Ltd. | 32,020 | 38,230 | |
| Hong Kong & China Gas Co., Ltd. | 96,675 | 74,129 | |
| Hong Kong Exchanges & Clearing, Ltd. | 10,306 | 353,498 | |
| Security | Shares | Value | |
| Hong Kong (continued) | |||
| Hongkong Land Holdings, Ltd. | 9,294 | $ 32,325 | |
| Jardine Matheson Holdings, Ltd. | 1,219 | 50,177 | |
| Link REIT | 21,989 | 123,469 | |
| MTR Corp., Ltd. | 12,481 | 48,443 | |
| New World Development Co., Ltd.(1) | 12,107 | 18,772 | |
| Power Assets Holdings, Ltd. | 11,042 | 64,018 | |
| Sands China, Ltd.(2) | 19,483 | 57,026 | |
| Sino Land Co., Ltd. | 29,433 | 32,008 | |
| SITC International Holdings Co., Ltd. | 10,000 | 17,260 | |
| Sun Hung Kai Properties, Ltd. | 12,152 | 131,501 | |
| Swire Pacific, Ltd., Class A | 3,037 | 25,722 | |
| Swire Properties, Ltd. | 8,529 | 17,265 | |
| Techtronic Industries Co., Ltd. | 11,525 | 137,321 | |
| WH Group, Ltd.(3) | 64,733 | 41,805 | |
| Wharf Holdings, Ltd. (The)(1) | 11,000 | 35,436 | |
| Wharf Real Estate Investment Co., Ltd. | 13,118 | 44,345 | |
| Xinyi Glass Holdings, Ltd. | 14,000 | 15,725 | |
| $ 2,965,370 | |||
| Ireland — 1.2% | |||
| AIB Group PLC | 13,041 | $ 55,851 | |
| Bank of Ireland Group PLC | 9,205 | 83,567 | |
| CRH PLC | 6,224 | 428,331 | |
| DCC PLC | 788 | 57,982 | |
| Experian PLC | 7,838 | 319,754 | |
| Flutter Entertainment PLC(2) | 1,492 | 263,325 | |
| James Hardie Industries PLC CDI(2) | 3,821 | 147,322 | |
| Kerry Group PLC, Class A | 1,337 | 116,051 | |
| Kingspan Group PLC | 1,330 | 114,946 | |
| Smurfit Kappa Group PLC | 2,162 | 85,703 | |
| $ 1,672,832 | |||
| Israel — 0.7% | |||
| Azrieli Group, Ltd. | 315 | $ 20,374 | |
| Bank Hapoalim B.M. | 11,570 | 103,940 | |
| Bank Leumi Le-Israel B.M. | 13,607 | 109,507 | |
| Check Point Software Technologies, Ltd.(2) | 835 | 127,580 | |
| CyberArk Software, Ltd.(2) | 385 | 84,334 | |
| Elbit Systems, Ltd. | 215 | 45,599 | |
| Global-e Online, Ltd.(2) | 871 | 34,518 | |
| ICL Group, Ltd. | 5,687 | 28,592 | |
| Israel Discount Bank, Ltd., Class A | 9,975 | 49,944 | |
| Mizrahi Tefahot Bank, Ltd. | 1,288 | 49,861 | |
| Monday.com, Ltd.(2) | 255 | 47,891 | |
| Nice, Ltd.(2) | 538 | 106,997 | |
| Teva Pharmaceutical Industries, Ltd. ADR(2) | 9,925 | 103,617 | |
| Wix.com, Ltd.(2) | 433 | 53,268 | |
| $ 966,022 | |||
| Italy — 2.3% | |||
| Amplifon SpA(1) | 989 | $ 34,270 | |
| Security | Shares | Value | |
| Italy (continued) | |||
| Assicurazioni Generali SpA | 8,763 | $ 185,140 | |
| Banco BPM SpA | 11,286 | 59,804 | |
| Davide Campari-Milano NV(1) | 4,861 | 54,894 | |
| DiaSorin SpA(1) | 212 | 21,850 | |
| Enel SpA | 69,984 | 520,667 | |
| Eni SpA | 20,289 | 344,130 | |
| Ferrari NV | 1,084 | 365,965 | |
| FinecoBank Banca Fineco SpA | 5,458 | 82,111 | |
| Infrastrutture Wireless Italiane SpA(1)(3) | 2,913 | 36,881 | |
| Intesa Sanpaolo SpA | 133,590 | 390,937 | |
| Leonardo SpA | 3,789 | 62,606 | |
| Mediobanca Banca di Credito Finanziario SpA | 4,446 | 55,094 | |
| Moncler SpA | 1,831 | 112,734 | |
| Nexi SpA(1)(2)(3) | 5,767 | 47,249 | |
| Poste Italiane SpA(3) | 4,086 | 46,444 | |
| Prysmian SpA | 2,303 | 104,982 | |
| Recordati Industria Chimica e Farmaceutica SpA(1) | 1,001 | 53,977 | |
| Snam SpA(1) | 18,440 | 94,872 | |
| Telecom Italia SpA(2) | 67,396 | 21,928 | |
| Tenaris S.A. | 4,321 | 75,156 | |
| Terna - Rete Elettrica Nazionale | 12,584 | 104,984 | |
| UniCredit SpA | 13,749 | 374,381 | |
| $ 3,251,056 | |||
| Japan — 22.1% | |||
| Advantest Corp. | 6,400 | $ 215,652 | |
| Aeon Co., Ltd. | 5,748 | 128,264 | |
| AGC, Inc. | 1,556 | 57,672 | |
| Aisin Corp. | 1,252 | 43,646 | |
| Ajinomoto Co., Inc. | 3,699 | 142,389 | |
| ANA Holdings, Inc.(2) | 1,383 | 29,963 | |
| Asahi Group Holdings, Ltd. | 4,115 | 153,228 | |
| Asahi Intecc Co., Ltd.(1) | 1,600 | 32,446 | |
| Asahi Kasei Corp. | 10,370 | 76,534 | |
| Astellas Pharma, Inc. | 15,101 | 179,600 | |
| Azbil Corp. | 1,000 | 32,982 | |
| Bandai Namco Holdings, Inc. | 5,111 | 102,211 | |
| BayCurrent Consulting, Inc. | 1,000 | 35,006 | |
| Bridgestone Corp. | 4,784 | 197,586 | |
| Brother Industries, Ltd. | 1,905 | 30,337 | |
| Canon, Inc. | 8,500 | 218,057 | |
| Capcom Co., Ltd. | 1,400 | 45,179 | |
| Central Japan Railway Co. | 6,295 | 159,769 | |
| Chiba Bank, Ltd. (The) | 4,141 | 29,834 | |
| Chubu Electric Power Co., Inc. | 5,269 | 68,030 | |
| Chugai Pharmaceutical Co., Ltd. | 5,846 | 220,852 | |
| Concordia Financial Group, Ltd. | 8,031 | 36,607 | |
| Dai Nippon Printing Co., Ltd. | 1,905 | 56,257 | |
| Daifuku Co., Ltd. | 2,400 | 48,394 | |
| Dai-ichi Life Insurance Co., Ltd. | 8,313 | 176,343 | |
| Daiichi Sankyo Co., Ltd. | 15,700 | 429,814 | |
| Security | Shares | Value | |
| Japan (continued) | |||
| Daikin Industries, Ltd. | 2,258 | $ 366,293 | |
| Daito Trust Construction Co., Ltd. | 516 | 59,725 | |
| Daiwa House Industry Co., Ltd. | 5,132 | 155,142 | |
| Daiwa House REIT Investment Corp. | 23 | 41,014 | |
| Daiwa Securities Group, Inc. | 12,025 | 80,714 | |
| Denso Corp. | 14,936 | 224,224 | |
| Dentsu Group, Inc. | 1,805 | 46,214 | |
| Disco Corp. | 800 | 197,573 | |
| East Japan Railway Co. | 2,550 | 146,785 | |
| Eisai Co., Ltd. | 2,051 | 102,122 | |
| ENEOS Holdings, Inc. | 24,238 | 96,134 | |
| FANUC Corp. | 8,210 | 240,956 | |
| Fast Retailing Co., Ltd. | 1,500 | 370,918 | |
| Fuji Electric Co., Ltd. | 1,041 | 44,619 | |
| FUJIFILM Holdings Corp. | 3,127 | 187,400 | |
| Fujitsu, Ltd. | 1,552 | 233,566 | |
| GLP J-REIT | 42 | 41,808 | |
| Hamamatsu Photonics K.K. | 1,151 | 47,223 | |
| Hankyu Hanshin Holdings, Inc. | 1,862 | 59,174 | |
| Hikari Tsushin, Inc. | 219 | 36,194 | |
| Hirose Electric Co., Ltd. | 242 | 27,331 | |
| Hitachi Construction Machinery Co., Ltd. | 796 | 20,954 | |
| Hitachi, Ltd. | 7,984 | 574,286 | |
| Honda Motor Co., Ltd. | 39,503 | 407,482 | |
| Hoshizaki Corp. | 1,032 | 37,699 | |
| HOYA Corp. | 3,023 | 376,482 | |
| Hulic Co., Ltd. | 3,540 | 36,979 | |
| Ibiden Co., Ltd. | 1,000 | 55,166 | |
| Idemitsu Kosan Co., Ltd. | 8,420 | 45,724 | |
| Iida Group Holdings Co., Ltd. | 1,100 | 16,430 | |
| INPEX Corp. | 8,091 | 108,272 | |
| Isuzu Motors, Ltd. | 5,255 | 67,367 | |
| ITOCHU Corp. | 10,148 | 413,428 | |
| Japan Airlines Co., Ltd. | 1,320 | 25,931 | |
| Japan Exchange Group, Inc. | 4,118 | 86,912 | |
| Japan Metropolitan Fund Investment Corp. | 59 | 42,586 | |
| Japan Post Bank Co., Ltd. | 12,600 | 128,229 | |
| Japan Post Holdings Co., Ltd. | 18,700 | 166,944 | |
| Japan Post Insurance Co., Ltd. | 1,800 | 31,951 | |
| Japan Real Estate Investment Corp. | 10 | 41,370 | |
| Japan Tobacco, Inc. | 10,234 | 264,295 | |
| JFE Holdings, Inc. | 5,225 | 80,837 | |
| JSR Corp. | 1,459 | 41,515 | |
| Kajima Corp. | 3,581 | 59,710 | |
| Kansai Electric Power Co., Inc. (The) | 6,178 | 81,995 | |
| Kao Corp. | 4,101 | 168,574 | |
| Kawasaki Kisen Kaisha, Ltd.(1) | 1,200 | 51,356 | |
| KDDI Corp. | 12,767 | 404,950 | |
| KDX Realty Investment Corp. | 40 | 45,561 | |
| Keisei Electric Railway Co., Ltd. | 1,005 | 47,427 | |
| Keyence Corp. | 1,660 | 729,331 | |
| Security | Shares | Value | |
| Japan (continued) | |||
| Kikkoman Corp. | 1,201 | $ 73,389 | |
| Kintetsu Group Holdings Co., Ltd. | 1,346 | 42,647 | |
| Kirin Holdings Co., Ltd. | 6,326 | 92,613 | |
| Kobe Bussan Co., Ltd. | 1,400 | 41,357 | |
| Koei Tecmo Holdings Co., Ltd. | 1,040 | 11,848 | |
| Koito Manufacturing Co., Ltd. | 1,494 | 23,215 | |
| Komatsu, Ltd. | 8,146 | 211,986 | |
| Konami Group Corp. | 751 | 39,231 | |
| Kose Corp. | 308 | 23,022 | |
| Kubota Corp. | 8,711 | 130,735 | |
| Kyocera Corp. | 10,992 | 160,044 | |
| Kyowa Kirin Co., Ltd. | 2,344 | 39,330 | |
| Lasertec Corp. | 700 | 183,769 | |
| LY Corp. | 24,517 | 86,699 | |
| M3, Inc. | 3,458 | 57,065 | |
| Makita Corp. | 1,748 | 48,079 | |
| Marubeni Corp. | 12,033 | 189,454 | |
| MatsukiyoCocokara & Co. | 2,700 | 47,720 | |
| Mazda Motor Corp. | 4,510 | 48,208 | |
| McDonald's Holdings Co. (Japan), Ltd. | 877 | 37,989 | |
| MEIJI Holdings Co., Ltd. | 2,234 | 53,066 | |
| MINEBEA MITSUMI, Inc. | 2,859 | 58,518 | |
| MISUMI Group, Inc. | 2,280 | 38,495 | |
| Mitsubishi Chemical Group Corp. | 10,822 | 66,156 | |
| Mitsubishi Corp. | 29,370 | 467,842 | |
| Mitsubishi Electric Corp. | 16,960 | 239,883 | |
| Mitsubishi Estate Co., Ltd. | 10,068 | 138,013 | |
| Mitsubishi HC Capital, Inc. | 6,166 | 41,311 | |
| Mitsubishi Heavy Industries, Ltd. | 2,744 | 159,767 | |
| Mitsubishi UFJ Financial Group, Inc.(4) | 98,876 | 848,567 | |
| Mitsui & Co., Ltd. | 11,275 | 422,406 | |
| Mitsui Chemicals, Inc. | 1,475 | 43,619 | |
| Mitsui Fudosan Co., Ltd. | 7,631 | 186,576 | |
| Mitsui OSK Lines, Ltd. | 3,100 | 99,108 | |
| Mizuho Financial Group, Inc. | 20,600 | 351,391 | |
| MonotaRO Co., Ltd. | 1,800 | 19,586 | |
| MS&AD Insurance Group Holdings, Inc. | 3,628 | 142,649 | |
| Murata Manufacturing Co., Ltd. | 14,742 | 311,528 | |
| NEC Corp. | 2,055 | 121,422 | |
| Nexon Co., Ltd. | 3,150 | 57,296 | |
| Nidec Corp. | 3,528 | 142,203 | |
| Nintendo Co., Ltd. | 9,010 | 468,825 | |
| Nippon Building Fund, Inc.(1) | 12 | 51,947 | |
| NIPPON EXPRESS HOLDINGS, Inc. | 576 | 32,682 | |
| Nippon Paint Holdings Co., Ltd. | 8,390 | 67,677 | |
| Nippon Prologis REIT, Inc.(1) | 22 | 42,301 | |
| Nippon Sanso Holdings Corp. | 1,324 | 35,354 | |
| Nippon Steel Corp.(1) | 7,275 | 166,188 | |
| Nippon Telegraph & Telephone Corp. | 255,400 | 311,865 | |
| Nippon Yusen KK | 4,000 | 123,534 | |
| Nissan Chemical Corp. | 1,047 | 40,769 | |
| Security | Shares | Value | |
| Japan (continued) | |||
| Nissan Motor Co., Ltd. | 20,543 | $ 80,322 | |
| Nissin Foods Holdings Co., Ltd. | 1,794 | 62,646 | |
| Nitori Holdings Co., Ltd. | 716 | 96,142 | |
| Nitto Denko Corp. | 1,270 | 94,774 | |
| Nomura Holdings, Inc. | 24,957 | 112,396 | |
| Nomura Real Estate Holdings, Inc. | 870 | 22,829 | |
| Nomura Real Estate Master Fund, Inc. | 40 | 46,781 | |
| Nomura Research Institute, Ltd. | 3,400 | 98,745 | |
| NTT Data Group Corp. | 5,030 | 71,102 | |
| Obayashi Corp. | 5,320 | 45,956 | |
| Obic Co., Ltd. | 560 | 96,351 | |
| Odakyu Electric Railway Co., Ltd. | 2,305 | 35,100 | |
| Oji Holdings Corp. | 6,573 | 25,266 | |
| Olympus Corp. | 10,876 | 156,987 | |
| Omron Corp. | 1,463 | 68,078 | |
| Ono Pharmaceutical Co., Ltd. | 3,505 | 62,352 | |
| Open House Group Co., Ltd. | 600 | 17,747 | |
| Oracle Corp. Japan | 289 | 22,247 | |
| Oriental Land Co., Ltd. | 9,520 | 353,842 | |
| ORIX Corp. | 10,002 | 187,849 | |
| Osaka Gas Co., Ltd. | 3,023 | 63,104 | |
| Otsuka Corp. | 864 | 35,558 | |
| Otsuka Holdings Co., Ltd. | 3,452 | 129,094 | |
| Pan Pacific International Holdings Corp. | 3,436 | 81,792 | |
| Panasonic Corp. | 18,347 | 180,673 | |
| Rakuten Group, Inc. | 13,100 | 58,404 | |
| Recruit Holdings Co., Ltd. | 12,457 | 520,841 | |
| Renesas Electronics Corp.(2) | 12,900 | 230,664 | |
| Resona Holdings, Inc. | 18,911 | 95,866 | |
| Ricoh Co., Ltd. | 4,735 | 36,263 | |
| Rohm Co., Ltd. | 2,828 | 53,989 | |
| SBI Holdings, Inc. | 1,875 | 42,081 | |
| SCSK Corp. | 1,200 | 23,758 | |
| Secom Co., Ltd. | 1,848 | 132,946 | |
| Seiko Epson Corp. | 2,252 | 33,624 | |
| Sekisui Chemical Co., Ltd. | 2,964 | 42,631 | |
| Sekisui House, Ltd. | 4,950 | 109,723 | |
| Seven & i Holdings Co., Ltd. | 6,526 | 258,100 | |
| SG Holdings Co., Ltd. | 2,600 | 37,273 | |
| Sharp Corp.(2) | 1,524 | 10,847 | |
| Shimadzu Corp. | 1,814 | 50,580 | |
| Shimano, Inc. | 650 | 100,129 | |
| Shimizu Corp. | 4,127 | 27,376 | |
| Shin-Etsu Chemical Co., Ltd. | 15,625 | 653,487 | |
| Shionogi & Co., Ltd. | 2,221 | 106,892 | |
| Shiseido Co., Ltd. | 3,274 | 98,686 | |
| Shizuoka Financial Group, Inc. | 3,925 | 33,190 | |
| SMC Corp. | 479 | 256,234 | |
| SoftBank Corp. | 25,000 | 311,543 | |
| SoftBank Group Corp. | 8,784 | 387,712 | |
| Sompo Holdings, Inc. | 2,499 | 122,272 | |
| Security | Shares | Value | |
| Japan (continued) | |||
| Sony Group Corp. | 10,880 | $ 1,029,605 | |
| Square Enix Holdings Co., Ltd. | 700 | 25,095 | |
| Subaru Corp. | 5,328 | 97,180 | |
| Sumco Corp. | 2,700 | 40,390 | |
| Sumitomo Chemical Co., Ltd. | 9,834 | 23,904 | |
| Sumitomo Corp. | 9,225 | 200,751 | |
| Sumitomo Electric Industries, Ltd. | 5,990 | 76,005 | |
| Sumitomo Metal Mining Co., Ltd. | 1,920 | 57,020 | |
| Sumitomo Mitsui Financial Group, Inc. | 10,797 | 525,380 | |
| Sumitomo Mitsui Trust Holdings, Inc. | 5,564 | 106,561 | |
| Sumitomo Realty & Development Co., Ltd. | 2,568 | 76,100 | |
| Suntory Beverage & Food, Ltd. | 1,117 | 36,727 | |
| Suzuki Motor Corp. | 3,078 | 131,174 | |
| Sysmex Corp. | 1,493 | 82,997 | |
| T&D Holdings, Inc. | 4,306 | 68,360 | |
| Taisei Corp. | 1,549 | 52,895 | |
| Takeda Pharmaceutical Co., Ltd. | 13,724 | 393,577 | |
| TDK Corp. | 3,465 | 164,325 | |
| Terumo Corp. | 5,818 | 190,254 | |
| TIS, Inc. | 1,900 | 41,761 | |
| Tobu Railway Co., Ltd. | 1,573 | 42,203 | |
| Toho Co., Ltd. | 856 | 28,899 | |
| Tokio Marine Holdings, Inc. | 15,700 | 390,945 | |
| Tokyo Electric Power Co. Holdings, Inc.(2) | 14,200 | 74,310 | |
| Tokyo Electron, Ltd. | 4,037 | 717,536 | |
| Tokyo Gas Co., Ltd. | 3,462 | 79,414 | |
| Tokyu Corp. | 4,384 | 53,454 | |
| TOPPAN Holdings, Inc. | 2,074 | 57,760 | |
| Toray Industries, Inc. | 12,262 | 63,517 | |
| Tosoh Corp. | 2,400 | 30,595 | |
| TOTO, Ltd. | 1,143 | 30,026 | |
| Toyota Industries Corp. | 1,261 | 102,507 | |
| Toyota Motor Corp. | 91,050 | 1,668,374 | |
| Toyota Tsusho Corp. | 1,765 | 103,574 | |
| Trend Micro, Inc. | 1,144 | 61,055 | |
| Unicharm Corp. | 3,514 | 127,092 | |
| USS Co., Ltd. | 1,635 | 32,825 | |
| West Japan Railway Co. | 1,778 | 74,086 | |
| Yakult Honsha Co., Ltd. | 1,992 | 44,716 | |
| Yamaha Corp. | 1,109 | 25,545 | |
| Yamaha Motor Co., Ltd. | 7,062 | 62,840 | |
| Yamato Holdings Co., Ltd. | 2,364 | 43,624 | |
| Yaskawa Electric Corp.(1) | 2,183 | 90,861 | |
| Yokogawa Electric Corp. | 2,228 | 42,350 | |
| Zensho Holdings Co., Ltd. | 900 | 47,092 | |
| ZOZO, Inc.(1) | 1,007 | 22,727 | |
| $ 30,971,300 | |||
| Netherlands — 6.0% | |||
| ABN AMRO Bank NV GDR(3) | 4,445 | $ 66,846 | |
| Adyen NV(1)(2)(3) | 190 | 245,279 | |
| Security | Shares | Value | |
| Netherlands (continued) | |||
| Aegon, Ltd.(1) | 14,912 | $ 86,699 | |
| AerCap Holdings NV(2) | 1,790 | 133,033 | |
| Airbus SE | 5,136 | 793,452 | |
| Akzo Nobel NV | 1,395 | 115,515 | |
| Argenx SE(2)(5) | 357 | 135,791 | |
| Argenx SE(2)(5) | 160 | 60,859 | |
| ASM International NV | 415 | 215,997 | |
| ASML Holding NV | 3,476 | 2,623,989 | |
| ASR Nederland NV | 1,436 | 67,837 | |
| BE Semiconductor Industries NV | 684 | 103,268 | |
| DSM BV(2) | 1,407 | 145,105 | |
| Euronext NV(3) | 670 | 58,227 | |
| EXOR NV | 907 | 90,788 | |
| Ferrovial SE | 4,354 | 158,925 | |
| Heineken Holding NV | 1,138 | 96,359 | |
| Heineken NV | 2,446 | 248,512 | |
| IMCD NV | 521 | 90,739 | |
| ING Groep NV | 31,511 | 472,493 | |
| JDE Peet's NV(1) | 904 | 24,311 | |
| Koninklijke Ahold Delhaize NV | 8,330 | 239,666 | |
| Koninklijke KPN NV | 27,657 | 95,282 | |
| Koninklijke Philips NV | 6,757 | 158,129 | |
| NN Group NV | 2,209 | 87,302 | |
| OCI NV | 827 | 23,968 | |
| Prosus NV | 12,521 | 372,679 | |
| QIAGEN NV(2) | 1,832 | 79,649 | |
| Randstad NV | 975 | 61,191 | |
| Stellantis NV | 18,914 | 443,167 | |
| STMicroelectronics NV | 5,961 | 298,998 | |
| Universal Music Group NV | 7,126 | 203,427 | |
| Wolters Kluwer NV(1) | 2,176 | 309,578 | |
| $ 8,407,060 | |||
| New Zealand — 0.2% | |||
| Auckland International Airport, Ltd. | 10,509 | $ 58,462 | |
| Fisher & Paykel Healthcare Corp., Ltd. | 5,027 | 74,970 | |
| Mercury NZ, Ltd. | 4,492 | 18,737 | |
| Meridian Energy, Ltd. | 9,757 | 34,166 | |
| Spark New Zealand, Ltd. | 17,151 | 56,148 | |
| Xero, Ltd.(2) | 1,172 | 89,410 | |
| $ 331,893 | |||
| Norway — 0.7% | |||
| Adevinta ASA(2) | 3,477 | $ 38,413 | |
| Aker BP ASA | 2,840 | 82,495 | |
| DNB Bank ASA | 8,051 | 171,174 | |
| Equinor ASA | 7,866 | 249,289 | |
| Gjensidige Forsikring ASA | 1,602 | 29,563 | |
| Kongsberg Gruppen ASA | 706 | 32,321 | |
| Mowi ASA | 4,265 | 76,377 | |
| Norsk Hydro ASA | 11,660 | 78,374 | |
| Security | Shares | Value | |
| Norway (continued) | |||
| Orkla ASA | 6,067 | $ 47,115 | |
| Salmar ASA | 718 | 40,212 | |
| Telenor ASA | 6,162 | 70,719 | |
| Yara International ASA | 1,402 | 49,808 | |
| $ 965,860 | |||
| Portugal — 0.2% | |||
| EDP - Energias de Portugal S.A. | 27,140 | $ 136,596 | |
| Galp Energia SGPS S.A. | 4,476 | 65,858 | |
| Jeronimo Martins SGPS S.A. | 2,358 | 60,012 | |
| $ 262,466 | |||
| Singapore — 1.4% | |||
| CapitaLand Ascendas REIT | 33,831 | $ 77,560 | |
| CapitaLand Integrated Commercial Trust | 44,866 | 69,937 | |
| CapitaLand Investment, Ltd. | 21,648 | 51,758 | |
| City Developments, Ltd. | 3,871 | 19,490 | |
| DBS Group Holdings, Ltd. | 15,348 | 388,133 | |
| Genting Singapore, Ltd. | 48,954 | 37,081 | |
| Grab Holdings, Ltd., Class A(2) | 15,368 | 51,790 | |
| Jardine Cycle & Carriage, Ltd. | 1,000 | 22,537 | |
| Keppel Corp., Ltd. | 11,828 | 63,289 | |
| Mapletree Logistics Trust | 33,000 | 43,451 | |
| Mapletree Pan Asia Commercial Trust | 19,300 | 22,929 | |
| Oversea-Chinese Banking Corp., Ltd. | 29,336 | 288,649 | |
| SEA, Ltd. ADR(2) | 3,203 | 129,721 | |
| Seatrium, Ltd.(2) | 390,637 | 34,880 | |
| Sembcorp Industries, Ltd. | 8,600 | 34,568 | |
| Singapore Airlines, Ltd. | 13,300 | 66,039 | |
| Singapore Exchange, Ltd. | 6,600 | 49,100 | |
| Singapore Technologies Engineering, Ltd. | 13,218 | 38,923 | |
| Singapore Telecommunications, Ltd. | 72,791 | 136,265 | |
| United Overseas Bank, Ltd. | 10,814 | 233,401 | |
| UOL Group, Ltd.(1) | 3,470 | 16,484 | |
| Wilmar International, Ltd. | 15,000 | 40,521 | |
| $ 1,916,506 | |||
| Spain — 2.6% | |||
| Acciona S.A. | 193 | $ 28,418 | |
| ACS Actividades de Construccion y Servicios S.A. | 2,013 | 89,407 | |
| Aena SME S.A.(3) | 627 | 113,807 | |
| Amadeus IT Group S.A. | 3,914 | 281,110 | |
| Banco Bilbao Vizcaya Argentaria S.A. | 51,187 | 466,532 | |
| Banco Santander S.A. | 138,547 | 579,498 | |
| CaixaBank S.A. | 34,761 | 143,157 | |
| Cellnex Telecom S.A.(2)(3) | 4,887 | 192,416 | |
| Corp. ACCIONA Energias Renovables S.A.(1) | 642 | 19,925 | |
| EDP Renovaveis S.A.(1) | 2,808 | 57,483 | |
| Enagas S.A.(1) | 1,961 | 33,081 | |
| Endesa S.A.(1) | 2,524 | 51,492 | |
| Grifols S.A.(1)(2) | 2,499 | 42,751 | |
| Security | Shares | Value | |
| Spain (continued) | |||
| Iberdrola S.A. | 51,635 | $ 677,285 | |
| Industria de Diseno Textil S.A. | 9,515 | 415,178 | |
| Naturgy Energy Group S.A.(1) | 1,110 | 33,108 | |
| Redeia Corp. S.A. | 3,451 | 56,868 | |
| Repsol S.A. | 11,027 | 163,574 | |
| Telefonica S.A. | 43,943 | 171,812 | |
| $ 3,616,902 | |||
| Sweden — 3.2% | |||
| Alfa Laval AB | 2,523 | $ 101,006 | |
| Assa Abloy AB, Class B | 8,665 | 249,718 | |
| Atlas Copco AB, Class A | 22,955 | 395,540 | |
| Atlas Copco AB, Class B | 14,338 | 212,720 | |
| Beijer Ref AB(1) | 3,714 | 49,838 | |
| Boliden AB | 2,485 | 77,779 | |
| Epiroc AB, Class A | 6,271 | 126,228 | |
| Epiroc AB, Class B | 3,326 | 58,331 | |
| EQT AB(1) | 3,014 | 85,337 | |
| Essity AB, Class B | 5,088 | 126,092 | |
| Evolution AB(3) | 1,522 | 181,286 | |
| Fastighets AB Balder, Class B(1)(2) | 4,764 | 33,786 | |
| Getinge AB, Class B | 1,789 | 39,837 | |
| H & M Hennes & Mauritz AB, Class B | 5,635 | 98,838 | |
| Hexagon AB, Class B | 18,160 | 218,125 | |
| Holmen AB, Class B | 733 | 30,960 | |
| Husqvarna AB, Class B(1) | 3,160 | 26,065 | |
| Industrivarden AB, Class A | 1,318 | 43,090 | |
| Industrivarden AB, Class C(1) | 1,343 | 43,822 | |
| Indutrade AB | 2,126 | 55,409 | |
| Investment AB Latour, Class B(1) | 1,245 | 32,477 | |
| Investor AB, Class B | 14,616 | 338,941 | |
| L E Lundbergforetagen AB, Class B | 593 | 32,293 | |
| Lifco AB, Class B | 1,823 | 44,756 | |
| Nibe Industrier AB, Class B(1) | 12,254 | 86,053 | |
| Saab AB, Class B | 670 | 40,377 | |
| Sagax AB, Class B | 1,940 | 53,398 | |
| Sandvik AB | 8,884 | 193,008 | |
| Securitas AB, Class B(1) | 3,793 | 37,187 | |
| Skandinaviska Enskilda Banken AB, Class A | 14,068 | 194,148 | |
| Skanska AB, Class B | 2,734 | 49,533 | |
| SKF AB, Class B | 3,034 | 60,803 | |
| Svenska Cellulosa AB SCA, Class B | 5,434 | 81,632 | |
| Svenska Handelsbanken AB, Class A | 12,835 | 139,483 | |
| Swedbank AB, Class A | 7,220 | 145,971 | |
| Swedish Orphan Biovitrum AB(2) | 1,899 | 50,410 | |
| Tele2 AB, Class B | 4,405 | 37,864 | |
| Telefonaktiebolaget LM Ericsson, Class B | 25,126 | 158,122 | |
| Telia Co. AB | 21,130 | 53,912 | |
| Volvo AB, Class A | 1,836 | 48,713 | |
| Volvo AB, Class B | 13,382 | 348,200 | |
| Security | Shares | Value | |
| Sweden (continued) | |||
| Volvo Car AB, Class B(1)(2) | 4,658 | $ 15,107 | |
| $ 4,496,195 | |||
| Switzerland — 10.4% | |||
| ABB, Ltd. | 13,842 | $ 614,559 | |
| Adecco Group AG | 1,241 | 60,950 | |
| Alcon, Inc. | 4,324 | 338,292 | |
| Avolta AG(2) | 817 | 32,166 | |
| Bachem Holding AG(1) | 223 | 17,269 | |
| Baloise Holding AG | 374 | 58,639 | |
| Banque Cantonale Vaudoise(1) | 289 | 37,272 | |
| Barry Callebaut AG | 29 | 48,957 | |
| BKW AG | 204 | 36,285 | |
| Chocoladefabriken Lindt & Spruengli AG | 1 | 121,319 | |
| Chocoladefabriken Lindt & Spruengli AG PC | 8 | 96,029 | |
| Cie Financiere Richemont S.A., Class A | 4,467 | 617,000 | |
| Clariant AG | 1,727 | 25,516 | |
| Coca-Cola HBC AG | 1,983 | 58,227 | |
| EMS-Chemie Holding AG | 68 | 55,136 | |
| Geberit AG | 295 | 189,366 | |
| Givaudan S.A. | 80 | 331,737 | |
| Glencore PLC | 89,060 | 535,344 | |
| Helvetia Holding AG(1) | 307 | 42,331 | |
| Holcim AG | 4,512 | 354,379 | |
| Julius Baer Group, Ltd. | 1,806 | 101,313 | |
| Kuehne + Nagel International AG | 467 | 161,160 | |
| Logitech International S.A. | 1,464 | 139,209 | |
| Lonza Group AG | 638 | 268,972 | |
| Nestle S.A. | 23,020 | 2,668,475 | |
| Novartis AG | 17,630 | 1,780,815 | |
| Partners Group Holding AG | 198 | 286,298 | |
| Roche Holding AG | 297 | 92,285 | |
| Roche Holding AG PC | 6,044 | 1,756,952 | |
| Sandoz Group AG(2) | 3,467 | 111,547 | |
| Schindler Holding AG | 214 | 50,821 | |
| Schindler Holding AG PC | 410 | 102,645 | |
| SGS S.A. | 1,250 | 107,913 | |
| SIG Group AG | 2,537 | 58,430 | |
| Sika AG | 1,324 | 431,725 | |
| Sonova Holding AG | 446 | 145,863 | |
| Straumann Holding AG | 937 | 151,422 | |
| Swatch Group AG (The) | 266 | 72,376 | |
| Swatch Group AG (The), Bearer Shares | 458 | 24,013 | |
| Swiss Life Holding AG | 257 | 178,603 | |
| Swiss Prime Site AG | 664 | 70,944 | |
| Swiss Re AG | 2,597 | 292,242 | |
| Swisscom AG | 217 | 130,606 | |
| Temenos AG | 527 | 49,110 | |
| UBS Group AG | 28,345 | 880,440 | |
| VAT Group AG(3) | 243 | 122,049 | |
| Security | Shares | Value | |
| Switzerland (continued) | |||
| Zurich Insurance Group AG | 1,253 | $ 655,102 | |
| $ 14,562,103 | |||
| United Kingdom — 13.7% | |||
| 3i Group PLC | 8,278 | $ 254,793 | |
| abrdn PLC(1) | 16,252 | 36,950 | |
| Admiral Group PLC | 2,376 | 81,232 | |
| Anglo American PLC | 11,023 | 275,869 | |
| Antofagasta PLC | 3,642 | 77,873 | |
| Ashtead Group PLC | 3,674 | 255,369 | |
| Associated British Foods PLC | 2,930 | 88,307 | |
| AstraZeneca PLC | 13,308 | 1,795,114 | |
| Auto Trader Group PLC(3) | 7,242 | 66,530 | |
| Aviva PLC | 24,466 | 135,381 | |
| BAE Systems PLC | 26,408 | 373,784 | |
| Barclays PLC | 129,352 | 253,280 | |
| Barratt Developments PLC | 8,311 | 59,536 | |
| Berkeley Group Holdings PLC | 842 | 50,268 | |
| BP PLC | 147,959 | 877,111 | |
| British American Tobacco PLC | 18,071 | 528,743 | |
| BT Group PLC | 51,425 | 81,024 | |
| Bunzl PLC | 2,874 | 116,786 | |
| Burberry Group PLC | 3,124 | 56,347 | |
| Centrica PLC | 46,635 | 83,603 | |
| Coca-Cola Europacific Partners PLC | 1,816 | 121,200 | |
| Compass Group PLC | 14,720 | 402,788 | |
| Croda International PLC | 1,153 | 74,165 | |
| Diageo PLC | 19,262 | 699,117 | |
| Endeavour Mining PLC | 1,535 | 34,347 | |
| Entain PLC | 5,560 | 70,118 | |
| GSK PLC | 35,336 | 652,627 | |
| Haleon PLC | 47,292 | 193,626 | |
| Halma PLC | 3,122 | 90,775 | |
| Hargreaves Lansdown PLC | 2,659 | 24,851 | |
| Hikma Pharmaceuticals PLC | 1,223 | 27,869 | |
| HSBC Holdings PLC | 167,987 | 1,359,008 | |
| Imperial Brands PLC | 7,378 | 169,899 | |
| Informa PLC | 11,924 | 118,601 | |
| InterContinental Hotels Group PLC | 1,394 | 125,705 | |
| Intertek Group PLC | 1,359 | 73,572 | |
| J Sainsbury PLC | 12,875 | 49,639 | |
| JD Sports Fashion PLC | 24,647 | 52,013 | |
| Kingfisher PLC | 15,641 | 48,462 | |
| Land Securities Group PLC | 5,555 | 49,853 | |
| Legal & General Group PLC | 49,900 | 159,465 | |
| Lloyds Banking Group PLC | 549,195 | 333,106 | |
| London Stock Exchange Group PLC | 3,602 | 425,798 | |
| M&G PLC | 18,709 | 52,949 | |
| Melrose Industries PLC | 11,981 | 86,603 | |
| Mondi PLC | 4,019 | 78,631 | |
| National Grid PLC | 31,367 | 422,555 | |
| Security | Shares | Value | |
| United Kingdom (continued) | |||
| NatWest Group PLC | 50,702 | $ 141,226 | |
| Next PLC | 1,061 | 109,681 | |
| Ocado Group PLC(1)(2) | 5,284 | 51,043 | |
| Pearson PLC | 5,942 | 72,985 | |
| Persimmon PLC | 3,000 | 53,029 | |
| Phoenix Group Holdings PLC | 5,688 | 38,730 | |
| Prudential PLC | 23,607 | 266,350 | |
| Reckitt Benckiser Group PLC | 6,216 | 428,925 | |
| RELX PLC | 16,397 | 650,531 | |
| Rentokil Initial PLC | 20,702 | 116,682 | |
| Rio Tinto PLC | 9,763 | 726,182 | |
| Rolls-Royce Holdings PLC(2) | 72,810 | 277,724 | |
| Sage Group PLC (The) | 8,809 | 131,508 | |
| Schroders PLC | 7,870 | 43,031 | |
| Segro PLC | 9,587 | 108,115 | |
| Severn Trent PLC | 2,446 | 80,435 | |
| Shell PLC | 57,102 | 1,869,181 | |
| Smith & Nephew PLC | 7,432 | 102,094 | |
| Smiths Group PLC | 2,687 | 60,311 | |
| Spirax-Sarco Engineering PLC | 595 | 79,608 | |
| SSE PLC | 9,487 | 223,950 | |
| St. James's Place PLC | 4,594 | 39,969 | |
| Standard Chartered PLC | 20,383 | 172,973 | |
| Taylor Wimpey PLC | 27,593 | 51,652 | |
| Tesco PLC | 59,499 | 220,427 | |
| Unilever PLC | 21,501 | 1,040,885 | |
| United Utilities Group PLC | 5,449 | 73,607 | |
| Vodafone Group PLC | 198,463 | 173,326 | |
| Whitbread PLC | 1,787 | 83,198 | |
| Wise PLC, Class A(2) | 5,095 | 56,664 | |
| WPP PLC | 9,670 | 92,367 | |
| $ 19,181,631 | |||
| Total Common Stocks (identified cost $89,402,924) | $138,927,038 | ||
| Short-Term Investments — 1.2% |
| Affiliated Fund — 0.4% | |||
| Security | Shares | Value | |
| Morgan Stanley Institutional Liquidity Funds - Government Portfolio, Institutional Class, 5.27%(6) | 544,207 | $ 544,207 | |
| Total Affiliated Fund (identified cost $544,207) | $ 544,207 | ||
| Securities Lending Collateral — 0.8% | |||
| Security | Shares | Value | |
| State Street Navigator Securities Lending Government Money Market Portfolio, 5.36%(7) | 1,131,014 | $ 1,131,014 | |
| Total Securities Lending Collateral (identified cost $1,131,014) | $ 1,131,014 | ||
| Total Short-Term Investments (identified cost $1,675,221) | $ 1,675,221 | ||
| Total Investments — 100.5% (identified cost $91,078,145) | $ 140,602,259 | |
| Other Assets, Less Liabilities — (0.5)% | $ (713,218) | |
| Net Assets — 100.0% | $ 139,889,041 |
| The percentage shown for each investment category in the Schedule of Investments is based on net assets. | |
| (1) | All or a portion of this security was on loan at December 31, 2023. The aggregate market value of securities on loan at December 31, 2023 was $2,802,352. |
| (2) | Non-income producing security. |
| (3) | Security exempt from registration under Rule 144A of the Securities Act of 1933, as amended. These securities may be sold in certain transactions in reliance on an exemption from registration (normally to qualified institutional buyers). At December 31, 2023, the aggregate value of these securities is $1,911,586 or 1.4% of the Fund's net assets. |
| (4) | Represents an investment in an issuer that may be deemed to be an affiliate (see Note 8). |
| (5) | Securities are traded on separate exchanges for the same entity. |
| (6) | May be deemed to be an affiliated investment company. The rate shown is the annualized seven-day yield as of December 31, 2023. |
| (7) | Represents investment of cash collateral received in connection with securities lending. |
| Economic Sectors | % of Net Assets |
| Financials | 18.9% |
| Industrials | 16.3 |
| Health Care | 12.7 |
| Consumer Discretionary | 11.7 |
| Consumer Staples | 9.3 |
| Information Technology | 8.5 |
| Materials | 7.7 |
| Energy | 4.3 |
| Communication Services | 4.1 |
| Utilities | 3.4 |
| Real Estate | 2.4 |
| Total | 99.3% |
| Abbreviations: | |
| ADR | – American Depositary Receipt |
| CDI | – CHESS Depositary Interest |
| GDR | – Global Depositary Receipt |
| PC | – Participation Certificate |
| PFC Shares | – Preference Shares |
| December 31, 2023 | |
| Assets | |
| Investments in securities of unaffiliated issuers, at value (identified cost $90,045,036) - including $2,802,352 of securities on loan | $ 139,209,485 |
| Investments in securities of affiliated issuers, at value (identified cost $1,033,109) | 1,392,774 |
| Cash | 149 |
| Cash denominated in foreign currency, at value (cost $101,445) | 102,477 |
| Receivable for capital shares sold | 66,741 |
| Dividends receivable | 105,974 |
| Dividends receivable - affiliated | 2,262 |
| Securities lending income receivable | 649 |
| Tax reclaims receivable | 360,958 |
| Receivable from affiliate | 26,117 |
| Directors' deferred compensation plan | 26,107 |
| Total assets | $141,293,693 |
| Liabilities | |
| Payable for capital shares redeemed | $ 53,764 |
| Deposits for securities loaned | 1,131,014 |
| Payable to affiliates: | |
| Investment advisory fee | 34,516 |
| Administrative fee | 13,833 |
| Distribution fees | 8,213 |
| Sub-transfer agency fee | 150 |
| Directors' deferred compensation plan | 26,107 |
| Accrued expenses | 137,055 |
| Total liabilities | $ 1,404,652 |
| Net Assets | $139,889,041 |
| Sources of Net Assets | |
| Paid-in capital | $ 96,483,909 |
| Distributable earnings | 43,405,132 |
| Net Assets | $139,889,041 |
| Class I Shares | |
| Net Assets | $ 89,330,661 |
| Shares Outstanding | 936,502 |
| Net Asset Value, Offering Price and Redemption Price Per Share (net assets ÷ shares of beneficial interest outstanding) | $ 95.39 |
| Class F Shares | |
| Net Assets | $ 50,558,380 |
| Shares Outstanding | 534,438 |
| Net Asset Value, Offering Price and Redemption Price Per Share (net assets ÷ shares of beneficial interest outstanding) | $ 94.60 |
| Year Ended | |
| December 31, 2023 | |
| Investment Income | |
| Dividend income (net of foreign taxes withheld of $382,323) | $ 3,760,596 |
| Dividend income - affiliated issuers (net of foreign taxes withheld of $2,480) | 40,137 |
| Securities lending income, net | 22,222 |
| Total investment income | $ 3,822,955 |
| Expenses | |
| Investment advisory fee | $ 376,894 |
| Administrative fee | 150,757 |
| Distribution fees: | |
| Class F | 82,278 |
| Directors' fees and expenses | 5,285 |
| Custodian fees | 43,642 |
| Transfer agency fees and expenses | 110,194 |
| Accounting fees | 49,427 |
| Professional fees | 62,194 |
| Reports to shareholders | 15,034 |
| Licensing fees | 61,200 |
| Miscellaneous | 12,362 |
| Total expenses | $ 969,267 |
| Waiver and/or reimbursement of expenses by affiliates | $ (281,601) |
| Net expenses | $ 687,666 |
| Net investment income | $ 3,135,289 |
| Realized and Unrealized Gain (Loss) | |
| Net realized gain (loss): | |
| Investment securities | $ (1,006,430) |
| Investment securities - affiliated issuers | 4,921 |
| Foreign currency transactions | (8,235) |
| Net realized loss | $ (1,009,744) |
| Change in unrealized appreciation (depreciation): | |
| Investment securities | $ 18,178,568 |
| Investment securities - affiliated issuers | 173,571 |
| Foreign currency | 22,191 |
| Net change in unrealized appreciation (depreciation) | $18,374,330 |
| Net realized and unrealized gain | $17,364,586 |
| Net increase in net assets from operations | $20,499,875 |
| Year Ended December 31, | ||
| 2023 | 2022 | |
| Increase (Decrease) in Net Assets | ||
| From operations: | ||
| Net investment income | $ 3,135,289 | $ 3,033,039 |
| Net realized gain (loss) | (1,009,744) | 254,627 |
| Net change in unrealized appreciation (depreciation) | 18,374,330 | (21,903,019) |
| Net increase (decrease) in net assets from operations | $ 20,499,875 | $ (18,615,353) |
| Distributions to shareholders: | ||
| Class I | $ (2,519,792) | $ (3,039,467) |
| Class F | (1,343,635) | (1,061,521) |
| Total distributions to shareholders | $ (3,863,427) | $ (4,100,988) |
| Capital share transactions: | ||
| Class I | $ (4,124,981) | $ (6,048,571) |
| Class F | 13,514,254 | 7,544,216 |
| Net increase in net assets from capital share transactions | $ 9,389,273 | $ 1,495,645 |
| Net increase (decrease) in net assets | $ 26,025,721 | $ (21,220,696) |
| Net Assets | ||
| At beginning of year | $ 113,863,320 | $ 135,084,016 |
| At end of year | $139,889,041 | $113,863,320 |
| Class I | |||||
| Year Ended December 31, | |||||
| 2023 | 2022 | 2021 | 2020 | 2019 | |
| Net asset value — Beginning of year | $ 83.54 | $102.12 | $ 93.77 | $ 90.02 | $ 76.31 |
| Income (Loss) From Operations | |||||
| Net investment income(1) | $ 2.32 | $ 2.38 | $ 2.53 | $ 1.69 | $ 2.43 |
| Net realized and unrealized gain (loss) | 12.27 | (17.84) | 7.63 | 4.89 | 13.55 |
| Total income (loss) from operations | $ 14.59 | $ (15.46) | $ 10.16 | $ 6.58 | $ 15.98 |
| Less Distributions | |||||
| From net investment income | $ (2.74) | $ (3.12) | $ (1.81) | $ (2.83) | $ (2.27) |
| Total distributions | $ (2.74) | $ (3.12) | $ (1.81) | $ (2.83) | $ (2.27) |
| Net asset value — End of year | $ 95.39 | $ 83.54 | $ 102.12 | $ 93.77 | $ 90.02 |
| Total Return(2) | 17.77% | (14.58)% | 10.88% | 7.78% | 21.26% |
| Ratios/Supplemental Data | |||||
| Net assets, end of year (000’s omitted) | $89,331 | $82,015 | $105,721 | $105,165 | $115,803 |
| Ratios (as a percentage of average daily net assets):(3) | |||||
| Total expenses | 0.71% | 0.72% | 0.64% | 0.74% | 0.68% |
| Net expenses | 0.48% (4) | 0.48% (4) | 0.48% | 0.48% | 0.48% |
| Net investment income | 2.56% | 2.74% | 2.51% | 2.05% | 2.87% |
| Portfolio Turnover | 7% | 11% | 8% | 9% | 7% |
| (1) | Computed using average shares outstanding. |
| (2) | Returns are historical and are calculated by determining the percentage change in net asset value with all distributions reinvested and do not reflect fees and expenses imposed by variable annuity contracts or variable life insurance policies. If included, total return would be lower. |
| (3) | Total expenses do not reflect amounts reimbursed and/or waived by the adviser and certain of its affiliates, if applicable. Net expenses are net of all reductions and represent the net expenses paid by the Fund. |
| (4) | Includes a reduction by the investment adviser of a portion of its advisory fee due to the Fund’s investment in the Liquidity Fund (equal to less than 0.005% of average daily net assets for the years ended December 31, 2023 and 2022). |
| Class F | |||||
| Year Ended December 31, | |||||
| 2023 | 2022 | 2021 | 2020 | 2019 | |
| Net asset value — Beginning of year | $ 83.04 | $101.73 | $ 93.60 | $ 90.04 | $ 76.49 |
| Income (Loss) From Operations | |||||
| Net investment income(1) | $ 2.11 | $ 2.13 | $ 2.32 | $ 1.49 | $ 2.14 |
| Net realized and unrealized gain (loss) | 12.19 | (17.70) | 7.62 | 4.90 | 13.68 |
| Total income (loss) from operations | $ 14.30 | $ (15.57) | $ 9.94 | $ 6.39 | $ 15.82 |
| Less Distributions | |||||
| From net investment income | $ (2.74) | $ (3.12) | $ (1.81) | $ (2.83) | $ (2.27) |
| Total distributions | $ (2.74) | $ (3.12) | $ (1.81) | $ (2.83) | $ (2.27) |
| Net asset value — End of year | $ 94.60 | $ 83.04 | $101.73 | $ 93.60 | $ 90.04 |
| Total Return(2) | 17.53% | (14.75)% | 10.66% | 7.56% | 21.00% |
| Ratios/Supplemental Data | |||||
| Net assets, end of year (000’s omitted) | $50,558 | $31,849 | $ 29,363 | $18,951 | $13,038 |
| Ratios (as a percentage of average daily net assets):(3) | |||||
| Total expenses | 0.91% | 0.92% | 0.84% | 0.94% | 0.88% |
| Net expenses | 0.68% (4) | 0.68% (4) | 0.68% | 0.68% | 0.69% |
| Net investment income | 2.35% | 2.48% | 2.31% | 1.80% | 2.52% |
| Portfolio Turnover | 7% | 11% | 8% | 9% | 7% |
| (1) | Computed using average shares outstanding. |
| (2) | Returns are historical and are calculated by determining the percentage change in net asset value with all distributions reinvested and do not reflect fees and expenses imposed by variable annuity contracts or variable life insurance policies. If included, total return would be lower. |
| (3) | Total expenses do not reflect amounts reimbursed and/or waived by the adviser and certain of its affiliates, if applicable. Net expenses are net of all reductions and represent the net expenses paid by the Fund. |
| (4) | Includes a reduction by the investment adviser of a portion of its advisory fee due to the Fund’s investment in the Liquidity Fund (equal to less than 0.005% of average daily net assets for the years ended December 31, 2023 and 2022). |
| Asset Description | Level 1 | Level 2 | Level 3 | Total |
| Common Stocks: | ||||
| Australia | $ — | $ 10,311,019 | $ — | $ 10,311,019 |
| Austria | — | 274,219 | — | 274,219 |
| Belgium | 63,059 | 1,065,585 | — | 1,128,644 |
| Denmark | — | 4,669,336 | — | 4,669,336 |
| Finland | — | 1,488,190 | — | 1,488,190 |
| France | — | 15,625,318 | — | 15,625,318 |
| Germany | — | 11,863,116 | — | 11,863,116 |
| Hong Kong | 22,180 | 2,943,190 | — | 2,965,370 |
| Ireland | — | 1,672,832 | — | 1,672,832 |
| Israel | 451,208 | 514,814 | — | 966,022 |
| Italy | — | 3,251,056 | — | 3,251,056 |
| Japan | — | 30,971,300 | — | 30,971,300 |
| Netherlands | 133,033 | 8,274,027 | — | 8,407,060 |
| New Zealand | — | 331,893 | — | 331,893 |
| Norway | — | 965,860 | — | 965,860 |
| Portugal | — | 262,466 | — | 262,466 |
| Singapore | 181,511 | 1,734,995 | — | 1,916,506 |
| Spain | — | 3,616,902 | — | 3,616,902 |
| Sweden | — | 4,496,195 | — | 4,496,195 |
| Switzerland | 111,547 | 14,450,556 | — | 14,562,103 |
| United Kingdom | 121,200 | 19,060,431 | — | 19,181,631 |
| Total Common Stocks | $1,083,738 | $137,843,300 (1) | $ — | $138,927,038 |
| Short-Term Investments: | ||||
| Affiliated Fund | $ 544,207 | $ — | $ — | $ 544,207 |
| Securities Lending Collateral | 1,131,014 | — | — | 1,131,014 |
| Total Investments | $2,758,959 | $137,843,300 | $ — | $140,602,259 |
| (1) | Includes foreign equity securities whose values were adjusted to reflect market trading of comparable securities or other correlated instruments that occurred after the close of trading in their applicable foreign markets. |
| Year Ended December 31, | ||
| 2023 | 2022 | |
| Ordinary income | $3,863,427 | $4,100,988 |
| Undistributed ordinary income | $ 4,202,727 |
| Deferred capital losses | (4,777,188) |
| Net unrealized appreciation | 43,979,593 |
| Distributable earnings | $43,405,132 |
| Aggregate cost | $96,638,040 |
| Gross unrealized appreciation | $ 50,177,491 |
| Gross unrealized depreciation | (6,213,272) |
| Net unrealized appreciation | $43,964,219 |
| Remaining Contractual Maturity of the Transactions | |||||
| Overnight and Continuous | <30 days | 30 to 90 days | >90 days | Total | |
| Common Stocks | $1,131,014 | $ — | $ — | $ — | $1,131,014 |
| Name | Value, beginning of period | Purchases | Sales proceeds | Net realized gain (loss) | Change in unrealized appreciation (depreciation) | Value, end of period | Dividend income | Shares, end of period |
| Common Stocks | ||||||||
| Mitsubishi UFJ Financial Group, Inc. | $643,655 | $ 85,580 | $ (59,160) | $ 4,921 | $ 173,571 | $ 848,567 | $ 22,322 | 98,876 |
| Short-Term Investments | ||||||||
| Liquidity Fund | 2,307 | 14,904,137 | (14,362,237) | — | — | 544,207 | 17,815 | 544,207 |
| Total | $4,921 | $173,571 | $1,392,774 | $40,137 | ||||
| Year Ended December 31, 2023 | Year Ended December 31, 2022 | ||||
| Shares | Amount | Shares | Amount | ||
| Class I | |||||
| Shares sold | 75,329 | $ 6,805,453 | 86,079 | $ 7,342,175 | |
| Reinvestment of distributions | 28,913 | 2,519,792 | 43,089 | 3,039,467 | |
| Shares redeemed | (149,435) | (13,450,226) | (182,725) | (16,430,213) | |
| Net decrease | (45,193) | $ (4,124,981) | (53,557) | $ (6,048,571) | |
| Class F | |||||
| Shares sold | 196,157 | $ 17,629,462 | 119,266 | $ 10,114,346 | |
| Reinvestment of distributions | 15,539 | 1,343,635 | 15,134 | 1,061,521 | |
| Shares redeemed | (60,793) | (5,458,843) | (39,499) | (3,631,651) | |
| Net increase | 150,903 | $ 13,514,254 | 94,901 | $ 7,544,216 | |
Boston, Massachusetts
February 16, 2024
| Name and Year of Birth | Corporation Position(s) | Length of Service | Principal Occupation(s) and Other Directorships During Past Five Years and Other Relevant Experience |
| Interested Director | |||
| Von M. Hughes(1) 1969 | Director and President | Since 2023 | President and Chief Executive Officer and Managing Director of Calvert Research and Management. Managing Director of Morgan Stanley Investment Management (MSIM) (since 2022). Formerly, Managing Director of PAAMCO Prisma (investment management firm) (2003-2022). Mr. Hughes is an interested person because of his positions with CRM and certain affiliates. Other Directorships. Tradeweb Markets Inc. (financial services) (2021-2022); National Association of Investment Companies (2018-2021). |
| Noninterested Directors | |||
| Alice Gresham Bullock 1950 | Chair and Director | Since 2016 (Chair); Since 2008 (Director) | Professor Emerita at Howard University School of Law. Dean Emerita of Howard University School of Law and Deputy Director of the Association of American Law Schools (1992-1994). Other Directorships. None. |
| Cari M. Dominguez 1949 | Director | Since 2016 | Former Chair of the U.S. Equal Employment Opportunity Commission. Other Directorships. ManpowerGroup Inc. (workforce solutions company); Triple S Management Corporation (managed care); National Association of Corporate Directors. |
| Karen Fang(2) 1958 | Director | Since 2023 | Formerly, Managing Director, Wealth Management at GAMCO Asset Management (asset management firm) (2020-2023). Formerly, Managing Director, Senior Portfolio Manager of Fiduciary Trust Company International (wealth management firm) (1993-2019). Other Directorships. None. |
| Miles D. Harper, III 1962 | Director | Since 2016 | Private investor (2022-present). Formerly, Partner, Carr Riggs & Ingram (public accounting firm) (2014-2022). Partner, Gainer Donnelly & Desroches (public accounting firm) (now Carr Riggs & Ingram) (1999-2014). Other Directorships. Bridgeway Funds (9) (asset management). |
| Joy V. Jones 1950 | Director | Since 2016 | Attorney. Other Directorships. Palm Management Corporation. |
| Eddie Ramos(2) 1967 | Director | Since 2023 | Private investor (2022-present). Formerly, Head of External Advisors/Diversity Portfolio Management at the New Jersey Division of Investment (2020-2022). Formerly, Chief Investment Officer and Lead Portfolio Manager – Global Fundamental Equities at Cornerstone Capital Management (asset management firm) (2011-2017). Other Directorships. Macquarie Optimum Funds (6) (asset management) (2022-2023). |
| Name and Year of Birth | Corporation Position(s) | Length of Service | Principal Occupation(s) and Other Directorships During Past Five Years and Other Relevant Experience |
| Noninterested Directors (continued) | |||
| Anthony A. Williams 1951 | Director | Since 2016 | CEO and Executive Director of the Federal City Council (July 2012 to present); Senior Adviser and Independent Consultant for King and Spalding LLP (September 2015 to present); Executive Director of Global Government Practice at the Corporate Executive Board (January 2010 to January 2012). Other Directorships. Freddie Mac; Evoq Properties/Meruelo Maddux Properties, Inc. (real estate management); Weston Solutions, Inc. (environmental services); Bipartisan Policy Center’s Debt Reduction Task Force; Chesapeake Bay Foundation; Catholic University of America; Urban Institute (research organization); The Howard Hughes Corporation (real estate development); Old Dominion National Bank. |
| Name and Year of Birth | Corporation Position(s) | Length of Service | Principal Occupation(s) During Past Five Years |
| Principal Officers who are not Directors | |||
| Hope L. Brown 1973 | Chief Compliance Officer | Since 2014 | Chief Compliance Officer of 46 registered investment companies advised by CRM (since 2014). Vice President and Chief Compliance Officer, Wilmington Funds (2012-2014). |
| Deidre E. Walsh 1971 | Secretary, Vice President and Chief Legal Officer | Since 2021 | Vice President of CRM and officer of 46 registered investment companies advised by CRM (since 2021). Also Vice President of Eaton Vance and certain of its affiliates and officer of 127 registered investment companies advised or administered by Eaton Vance. |
| James F. Kirchner 1967 | Treasurer | Since 2016 | Vice President of CRM and officer of 46 registered investment companies advised by CRM (since 2016). Also Vice President of Eaton Vance and certain of its affiliates and officer of 127 registered investment companies advised or administered by Eaton Vance. |
| (1) Mr. Hughes is an interested person of the Fund because of his positions with the Fund’s adviser and certain affiliates. | |||
| (2) Ms. Fang and Mr. Ramos began serving as Directors effective October 30, 2023. | |||
| Privacy Notice | April 2021 |
| FACTS | WHAT DOES EATON VANCE DO WITH YOUR PERSONAL INFORMATION? |
| Why? | Financial companies choose how they share your personal information. Federal law gives consumers the right to limit some but not all sharing. Federal law also requires us to tell you how we collect, share, and protect your personal information. Please read this notice carefully to understand what we do. |
| What? | The types of personal information we collect and share depend on the product or service you have with us. This information can include:■ Social Security number and income ■ investment experience and risk tolerance ■ checking account number and wire transfer instructions |
| How? | All financial companies need to share customers’ personal information to run their everyday business. In the section below, we list the reasons financial companies can share their customers’ personal information; the reasons Eaton Vance chooses to share; and whether you can limit this sharing. |
| Reasons we can share your personal information | Does Eaton Vance share? | Can you limit this sharing? |
| For our everyday business purposes — such as to process your transactions, maintain your account(s), respond to court orders and legal investigations, or report to credit bureaus | Yes | No |
| For our marketing purposes — to offer our products and services to you | Yes | No |
| For joint marketing with other financial companies | No | We don’t share |
| For our investment management affiliates’ everyday business purposes — information about your transactions, experiences, and creditworthiness | Yes | Yes |
| For our affiliates’ everyday business purposes — information about your transactions and experiences | Yes | No |
| For our affiliates’ everyday business purposes — information about your creditworthiness | No | We don’t share |
| For our investment management affiliates to market to you | Yes | Yes |
| For our affiliates to market to you | No | We don’t share |
| For nonaffiliates to market to you | No | We don’t share |
| To limit our sharing | Call toll-free 1-800-368-2745 or email: CRMPrivacy@calvert.comPlease note:If you are a new customer, we can begin sharing your information 30 days from the date we sent this notice. When you are no longer our customer, we continue to share your information as described in this notice. However, you can contact us at any time to limit our sharing. |
| Questions? | Call toll-free 1-800-368-2745 or email: CRMPrivacy@calvert.com |
| Privacy Notice — continued | April 2021 |
| Who we are | |
| Who is providing this notice? | Eaton Vance Management, Eaton Vance Distributors, Inc., Eaton Vance Trust Company, Eaton Vance Management (International) Limited, Eaton Vance Advisers International Ltd., Eaton Vance Global Advisors Limited, Eaton Vance Management’s Real Estate Investment Group, Boston Management and Research, Calvert Research and Management, Eaton Vance and Calvert Fund Families and our investment advisory affiliates (“Eaton Vance”) (see Investment Management Affiliates definition below) |
| What we do | |
| How does Eaton Vance protect my personal information? | To protect your personal information from unauthorized access and use, we use security measures that comply with federal law. These measures include computer safeguards and secured files and buildings. We have policies governing the proper handling of customer information by personnel and requiring third parties that provide support to adhere to appropriate security standards with respect to such information. |
| How does Eaton Vance collect my personal information? | We collect your personal information, for example, when you■ open an account or make deposits or withdrawals from your account ■ buy securities from us or make a wire transfer ■ give us your contact informationWe also collect your personal information from others, such as credit bureaus, affiliates, or other companies. |
| Why can’t I limit all sharing? | Federal law gives you the right to limit only■ sharing for affiliates’ everyday business purposes — information about your creditworthiness ■ affiliates from using your information to market to you ■ sharing for nonaffiliates to market to youState laws and individual companies may give you additional rights to limit sharing. See below for more on your rights under state law. |
| Definitions | |
| Investment Management Affiliates | Eaton Vance Investment Management Affiliates include registered investment advisers, registered broker- dealers, and registered and unregistered funds. Investment Management Affiliates does not include entities associated with Morgan Stanley Wealth Management, such as Morgan Stanley Smith Barney LLC and Morgan Stanley & Co. |
| Affiliates | Companies related by common ownership or control. They can be financial and nonfinancial companies.■ Our affiliates include companies with a Morgan Stanley name and financial companies such as Morgan Stanley Smith Barney LLC and Morgan Stanley & Co. |
| Nonaffiliates | Companies not related by common ownership or control. They can be financial and nonfinancial companies.■ Eaton Vance does not share with nonaffiliates so they can market to you. |
| Joint marketing | A formal agreement between nonaffiliated financial companies that together market financial products or services to you.■ Eaton Vance doesn’t jointly market. |
| Other important information | |
| Vermont: Except as permitted by law, we will not share personal information we collect about Vermont residents with Nonaffiliates unless you provide us with your written consent to share such information.California: Except as permitted by law, we will not share personal information we collect about California residents with Nonaffiliates and we will limit sharing such personal information with our Affiliates to comply with California privacy laws that apply to us. | |


| % Average Annual Total Returns1,2 | Class Inception Date | Performance Inception Date | One Year | Five Years | Ten Years |
| Class I at NAV | 03/31/2003 | 03/31/2003 | 5.47% | 1.06% | 1.68% |
| Class F at NAV | 10/30/2015 | 03/31/2003 | 5.22 | 0.81 | 1.48 |
| Bloomberg U.S. Aggregate Bond Index | — | — | 5.53% | 1.10% | 1.81% |
| % Total Annual Operating Expense Ratios3 | Class I | Class F |
| Gross | 0.48% | 0.73% |
| Net | 0.32 | 0.57 |
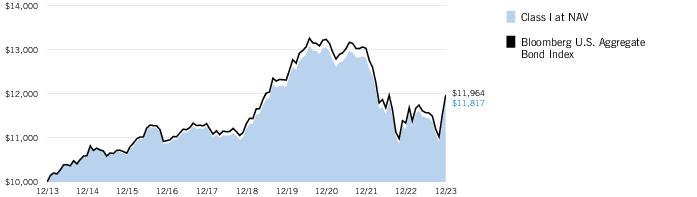
| Growth of Investment2 | Amount Invested | Period Beginning | At NAV | With Maximum Sales Charge |
| Class F | $10,000 | 12/31/2013 | $11,581 | N.A. |

| † | The views expressed in this report are those of the portfolio manager(s) and are current only through the date stated at the top of this page. These views are subject to change at any time based upon market or other conditions, and Calvert and the Fund(s) disclaim any responsibility to update such views. These views may not be relied upon as investment advice and, because investment decisions are based on many factors, may not be relied upon as an indication of trading intent on behalf of any Calvert fund. This commentary may contain statements that are not historical facts, referred to as “forward-looking statements.” The Fund’s actual future results may differ significantly from those stated in any forward-looking statement, depending on factors such as changes in securities or financial markets or general economic conditions, the volume of sales and purchases of Fund shares, the continuation of investment advisory, administrative and service contracts, and other risks discussed from time to time in the Fund’s filings with the Securities and Exchange Commission. |
| 1 | Bloomberg U.S. Aggregate Bond Index is an unmanaged index of domestic investment-grade bonds, including corporate, government and mortgage-backed securities. Unless otherwise stated, index returns do not reflect the effect of any applicable sales charges, commissions, expenses, taxes or leverage, as applicable. It is not possible to invest directly in an index. |
| 2 | There is no sales charge. Insurance-related charges are not included in the calculation of returns. If such charges were reflected, the returns would be lower. Please refer to the report for your insurance contract for performance data reflecting insurance-related charges.Performance prior to the inception date of a class may be linked to the performance of an older class of the Fund. This linked performance is adjusted for any applicable sales charge, but is not adjusted for class expense differences. If adjusted for such differences, the performance would be different. The performance of Class F is linked to Class I. Performance presented in the Financial Highlights included in the financial statements is not linked.Calvert Research and Management became the investment adviser to the Fund on December 31, 2016. Performance reflected prior to such date is that of the Fund’s former investment adviser. |
| 3 | Source: Fund prospectus. Net expense ratios reflect a contractual expense reimbursement that continues through 4/30/24. The expense ratios for the current reporting period can be found in the Financial Highlights section of this report. Performance reflects expenses waived and/or reimbursed, if applicable. Without such waivers and/or reimbursements, performance would have been lower. |
| Beginning Account Value (7/1/23) | Ending Account Value (12/31/23) | Expenses Paid During Period* (7/1/23 – 12/31/23) | Annualized Expense Ratio | |
| Actual | ||||
| Class I | $1,000.00 | $1,031.10 | $1.64 ** | 0.32% |
| Class F | $1,000.00 | $1,029.90 | $2.92 ** | 0.57% |
| Hypothetical | ||||
| (5% return per year before expenses) | ||||
| Class I | $1,000.00 | $1,023.59 | $1.63 ** | 0.32% |
| Class F | $1,000.00 | $1,022.33 | $2.91 ** | 0.57% |
| * | Expenses are equal to the Fund's annualized expense ratio for the indicated Class, multiplied by the average account value over the period, multiplied by 184/365 (to reflect the one-half year period). The Example assumes that the $1,000 was invested at the net asset value per share determined at the close of business on June 30, 2023. Expenses shown do not include insurance-related charges or direct expenses of Qualified Plans. |
| ** | Absent a waiver and/or reimbursement of expenses by affiliate(s), expenses would be higher. |
| Asset-Backed Securities — 0.1% |
| Security | Principal Amount (000's omitted) | Value | |
| American Express Credit Account Master Trust, Series 2021-1, Class A, 0.90%, 11/15/26 | $ | 50 | $ 48,211 |
| Total Asset-Backed Securities (identified cost $49,996) | $ 48,211 | ||
| Commercial Mortgage-Backed Securities — 1.6% |
| Security | Principal Amount (000's omitted) | Value | |
| Citigroup Commercial Mortgage Trust, Series 2014-GC21, Class A5, 3.855%, 5/10/47 | $ | 645 | $ 641,652 |
| Wells Fargo Commercial Mortgage Trust, Series 2015-C26, Class A4, 3.166%, 2/15/48 | 1,275 | 1,237,331 | |
| Total Commercial Mortgage-Backed Securities (identified cost $1,952,133) | $ 1,878,983 | ||
| Corporate Bonds — 26.2% |
| Security | Principal Amount (000’s omitted) | Value | |
| Basic Materials — 0.4% | |||
| ArcelorMittal S.A., 6.55%, 11/29/27 | $ | 150 | $ 157,621 |
| Barrick North America Finance, LLC, 5.75%, 5/1/43 | 100 | 107,276 | |
| Dow Chemical Co. (The), 4.375%, 11/15/42 | 100 | 88,517 | |
| LYB International Finance BV, 5.25%, 7/15/43 | 100 | 95,568 | |
| $ 448,982 | |||
| Communications — 3.5% | |||
| AT&T, Inc.: | |||
| 4.90%, 6/15/42 | $ | 200 | $ 182,439 |
| 5.45%, 3/1/47 | 1,000 | 1,001,031 | |
| Charter Communications Operating, LLC / Charter Communications Operating Capital, 4.908%, 7/23/25 | 500 | 495,530 | |
| Comcast Corp.: | |||
| 2.937%, 11/1/56 | 98 | 64,514 | |
| 4.00%, 3/1/48 | 50 | 42,032 | |
| 4.15%, 10/15/28 | 100 | 98,694 | |
| Discovery Communications, LLC, 4.125%, 5/15/29 | 200 | 189,635 | |
| Motorola Solutions, Inc., 2.30%, 11/15/30 | 250 | 211,233 | |
| NBCUniversal Media, LLC, 4.45%, 1/15/43 | 123 | 112,587 | |
| T-Mobile USA, Inc., 3.50%, 4/15/25 | 250 | 244,862 | |
| Verizon Communications, Inc.: | |||
| 1.68%, 10/30/30 | 340 | 280,242 | |
| 2.875%, 11/20/50 | 150 | 102,107 | |
| Walt Disney Co. (The), 5.40%, 10/1/43 | 100 | 104,852 | |
| WPP Finance 2010, 3.75%, 9/19/24 | 1,000 | 983,629 | |
| $ 4,113,387 | |||
| Security | Principal Amount (000’s omitted) | Value | |
| Consumer, Cyclical — 1.6% | |||
| Choice Hotels International, Inc., 3.70%, 1/15/31 | $ | 250 | $ 215,681 |
| General Motors Co., 5.00%, 4/1/35 | 1,000 | 955,452 | |
| Lowe's Cos., Inc., 5.625%, 4/15/53(1) | 150 | 157,395 | |
| Starbucks Corp., 3.75%, 12/1/47 | 250 | 201,170 | |
| VF Corp., 2.95%, 4/23/30 | 225 | 187,832 | |
| WarnerMedia Holdings, Inc.: | |||
| 4.279%, 3/15/32 | 75 | 68,664 | |
| 5.141%, 3/15/52 | 200 | 171,789 | |
| $ 1,957,983 | |||
| Consumer, Non-cyclical — 4.4% | |||
| AbbVie, Inc., 3.20%, 11/21/29 | $ | 300 | $ 280,577 |
| Alcon Finance Corp., 3.00%, 9/23/29(2) | 350 | 318,740 | |
| Anheuser-Busch InBev Finance, Inc., 4.625%, 2/1/44 | 1,000 | 954,653 | |
| Block Financial, LLC, 3.875%, 8/15/30 | 150 | 137,265 | |
| Bunge, Ltd. Finance Corp., 1.63%, 8/17/25 | 250 | 236,465 | |
| CVS Health Corp., 4.30%, 3/25/28 | 110 | 108,204 | |
| CVS Pass-Through Trust, 6.036%, 12/10/28 | 45 | 45,665 | |
| DENTSPLY SIRONA, Inc., 3.25%, 6/1/30 | 400 | 353,772 | |
| Gilead Sciences, Inc., 3.70%, 4/1/24 | 100 | 99,535 | |
| Global Payments, Inc., 2.15%, 1/15/27 | 200 | 184,233 | |
| HCA, Inc., 5.90%, 6/1/53 | 200 | 205,306 | |
| Kroger Co. (The), 3.875%, 10/15/46 | 250 | 196,803 | |
| Laboratory Corp. of America Holdings, 2.95%, 12/1/29 | 100 | 89,999 | |
| Molson Coors Brewing Co., 5.00%, 5/1/42 | 100 | 96,425 | |
| Pfizer, Inc., 4.40%, 5/15/44 | 500 | 474,553 | |
| Quanta Services, Inc., 2.90%, 10/1/30 | 200 | 175,607 | |
| STERIS Irish FinCo Unlimited Co., 3.75%, 3/15/51 | 100 | 77,669 | |
| Sysco Corp., 5.95%, 4/1/30 | 250 | 265,933 | |
| Takeda Pharmaceutical Co., Ltd., 3.175%, 7/9/50 | 400 | 286,372 | |
| Triton Container International, Ltd., 2.05%, 4/15/26(2) | 300 | 274,547 | |
| Tyson Foods, Inc., 3.95%, 8/15/24 | 100 | 98,896 | |
| Viatris, Inc., 2.30%, 6/22/27 | 250 | 226,849 | |
| Zoetis, Inc., 4.70%, 2/1/43 | 100 | 95,770 | |
| $ 5,283,838 | |||
| Energy — 3.2% | |||
| BP Capital Markets America, Inc., 3.633%, 4/6/30 | $ | 200 | $ 191,586 |
| Colonial Pipeline Co., 6.58%, 8/28/32(2) | 100 | 108,157 | |
| HF Sinclair Corp., 5.875%, 4/1/26(1) | 1,000 | 1,010,376 | |
| Shell International Finance BV: | |||
| 4.125%, 5/11/35 | 1,350 | 1,286,837 | |
| 4.55%, 8/12/43 | 100 | 94,614 | |
| TransCanada PipeLines, Ltd., 4.875%, 1/15/26 | 1,000 | 997,717 | |
| TransContinental Gas Pipe Line Co., LLC, 4.45%, 8/1/42 | 100 | 88,435 | |
| $ 3,777,722 | |||
| Financial — 6.0% | |||
| AerCap Ireland Capital DAC/AerCap Global Aviation Trust, 3.00%, 10/29/28 | $ | 200 | $ 182,696 |
| Security | Principal Amount (000’s omitted) | Value | |
| Financial (continued) | |||
| Bank of America Corp.: | |||
| 2.592% to 4/29/30, 4/29/31(3) | $ | 500 | $ 431,174 |
| 4.125%, 1/22/24 | 300 | 299,767 | |
| 4.244% to 4/24/37, 4/24/38(3) | 250 | 225,929 | |
| Berkshire Hathaway Finance Corp., 4.30%, 5/15/43 | 1,000 | 937,628 | |
| Citigroup, Inc.: | |||
| 4.075% to 4/23/28, 4/23/29(3) | 500 | 481,653 | |
| 5.50%, 9/13/25 | 80 | 80,408 | |
| Goldman Sachs Group, Inc. (The): | |||
| 4.00%, 3/3/24 | 500 | 498,602 | |
| 6.75%, 10/1/37 | 100 | 110,171 | |
| HSBC Holdings PLC, 2.848% to 6/4/30, 6/4/31(3) | 400 | 344,285 | |
| JPMorgan Chase & Co.: | |||
| 3.109% to 4/22/50, 4/22/51(3) | 300 | 215,778 | |
| 5.717% to 9/14/32, 9/14/33(1)(3) | 500 | 517,631 | |
| Kimco Realty OP, LLC, 4.45%, 9/1/47 | 200 | 165,919 | |
| MetLife, Inc., 4.875%, 11/13/43 | 100 | 97,708 | |
| Morgan Stanley, 5.00%, 11/24/25(4) | 150 | 149,878 | |
| NNN REIT, Inc., 5.60%, 10/15/33 | 100 | 103,311 | |
| Piedmont Operating Partnership L.P., 3.15%, 8/15/30 | 150 | 113,694 | |
| PNC Bank N.A., 2.70%, 10/22/29 | 250 | 219,363 | |
| Prudential Financial, Inc., 5.10%, 8/15/43 | 1,000 | 947,794 | |
| Simon Property Group, L.P., 2.65%, 7/15/30 | 150 | 132,834 | |
| US Bancorp, 3.10%, 4/27/26(1) | 250 | 239,685 | |
| Wells Fargo & Co.: | |||
| 3.196% to 6/17/26, 6/17/27(3) | 250 | 239,093 | |
| 5.389% to 4/24/33, 4/24/34(3) | 250 | 251,232 | |
| Westpac Banking Corp., 3.35%, 3/8/27 | 200 | 193,044 | |
| $ 7,179,277 | |||
| Industrial — 3.3% | |||
| BNSF Funding Trust I, 6.613% to 1/15/26, 12/15/55(3) | $ | 540 | $ 528,532 |
| Boeing Co. (The): | |||
| 2.196%, 2/4/26 | 300 | 283,518 | |
| 3.20%, 3/1/29 | 150 | 140,371 | |
| 4.875%, 5/1/25 | 100 | 99,583 | |
| 5.15%, 5/1/30 | 100 | 101,857 | |
| Canadian Pacific Railway Co., 4.70%, 5/1/48 | 200 | 182,214 | |
| Carrier Global Corp., 3.577%, 4/5/50 | 375 | 293,695 | |
| Cummins, Inc., 4.875%, 10/1/43 | 100 | 98,429 | |
| Deere & Co., 6.55%, 10/1/28 | 250 | 273,059 | |
| Flex, Ltd.: | |||
| 4.75%, 6/15/25 | 250 | 247,111 | |
| 4.875%, 5/12/30 | 250 | 245,586 | |
| GATX Corp., 3.25%, 9/15/26 | 400 | 381,778 | |
| Lennox International, Inc., 1.70%, 8/1/27 | 300 | 269,885 | |
| Parker-Hannifin Corp., 3.25%, 3/1/27 | 200 | 192,015 | |
| Roper Technologies, Inc., 2.95%, 9/15/29 | 250 | 229,253 | |
| RTX Corp., 4.50%, 6/1/42 | 100 | 90,936 | |
| Security | Principal Amount (000’s omitted) | Value | |
| Industrial (continued) | |||
| United Parcel Service, Inc., 6.20%, 1/15/38 | $ | 250 | $ 286,279 |
| $ 3,944,101 | |||
| Technology — 2.4% | |||
| Apple, Inc., 3.85%, 5/4/43 | $ | 500 | $ 445,720 |
| Broadcom, Inc.: | |||
| 3.137%, 11/15/35(2) | 500 | 410,756 | |
| 3.419%, 4/15/33(2) | 200 | 175,752 | |
| Dell International, LLC / EMC Corp., 5.30%, 10/1/29 | 250 | 257,640 | |
| Intel Corp., 4.875%, 2/10/28 | 200 | 203,453 | |
| International Business Machines Corp., 3.625%, 2/12/24 | 100 | 99,763 | |
| Kyndryl Holdings, Inc., 2.70%, 10/15/28 | 350 | 308,799 | |
| Oracle Corp.: | |||
| 2.65%, 7/15/26 | 150 | 142,292 | |
| 3.60%, 4/1/50 | 400 | 296,631 | |
| TSMC Arizona Corp., 4.25%, 4/22/32 | 300 | 295,819 | |
| Vmware, LLC, 2.20%, 8/15/31 | 200 | 165,834 | |
| $ 2,802,459 | |||
| Utilities — 1.4% | |||
| DTE Electric Co., 2.25%, 3/1/30 | $ | 300 | $ 263,392 |
| Duke Energy Corp., 3.15%, 8/15/27 | 500 | 472,863 | |
| PacifiCorp, 4.10%, 2/1/42 | 100 | 83,063 | |
| Public Service Electric & Gas Co., 3.95%, 5/1/42 | 1,000 | 860,238 | |
| $ 1,679,556 | |||
| Total Corporate Bonds (identified cost $33,833,105) | $ 31,187,305 | ||
| Sovereign Government Bonds — 0.4% |
| Security | Principal Amount (000’s omitted) | Value | |
| Mexico Government International Bond, 5.55%, 1/21/45(1) | $ | 500 | $ 478,423 |
| Total Sovereign Government Bonds (identified cost $497,786) | $ 478,423 | ||
| Taxable Municipal Obligations — 0.8% |
| Security | Principal Amount (000's omitted) | Value | |
| General Obligations — 0.8% | |||
| New York City, NY, 3.60%, 8/1/28 | $ | 1,000 | $ 966,500 |
| Total Taxable Municipal Obligations (identified cost $995,135) | $ 966,500 | ||
| U.S. Government Agencies and Instrumentalities — 3.4% |
| Security | Principal Amount (000's omitted) | Value | |
| Federal Home Loan Mortgage Corp.: | |||
| 0.50%, 4/14/25 | $ | 1,000 | $ 949,922 |
| 6.25%, 7/15/32(1) | 850 | 986,129 | |
| 6.75%, 3/15/31 | 1,000 | 1,164,486 | |
| Federal National Mortgage Association, 0.875%, 8/5/30(1) | 1,200 | 978,523 | |
| Total U.S. Government Agencies and Instrumentalities (identified cost $4,352,201) | $ 4,079,060 | ||
| U.S. Government Agency Mortgage-Backed Securities — 26.8% |
| Security | Principal Amount (000's omitted) | Value | |
| Federal Home Loan Mortgage Corp.: | |||
| 2.00%, with various maturities to 2052 | $ | 6,751 | $ 5,611,698 |
| 2.50%, with various maturities to 2051 | 2,283 | 2,025,634 | |
| 3.00%, with various maturities to 2052 | 1,283 | 1,149,513 | |
| 3.50%, with various maturities to 2048 | 381 | 361,619 | |
| 4.00%, with various maturities to 2052 | 726 | 695,182 | |
| 4.50%, with various maturities to 2044 | 506 | 505,924 | |
| 5.00%, with various maturities to 2040 | 381 | 388,497 | |
| 6.00%, with various maturities to 2040 | 29 | 30,129 | |
| 6.50%, 10/1/37 | 12 | 13,072 | |
| Federal National Mortgage Association: | |||
| 1.50%, 9/1/35 | 501 | 439,590 | |
| 2.00%, with various maturities to 2051 | 4,677 | 3,956,034 | |
| 2.50%, with various maturities to 2052 | 4,473 | 3,913,245 | |
| 3.00%, with various maturities to 2052 | 4,849 | 4,385,029 | |
| 3.50%, with various maturities to 2052 | 3,114 | 2,907,542 | |
| 4.00%, with various maturities to 2047 | 1,122 | 1,082,319 | |
| 4.50%, with various maturities to 2044 | 819 | 816,711 | |
| 5.00%, with various maturities to 2034 | 39 | 39,857 | |
| 5.50%, with various maturities to 2038 | 174 | 178,540 | |
| 5.706%, (1 yr. RFUCCT + 1.46%), 9/1/38(5) | 42 | 42,702 | |
| 6.00%, with various maturities to 2038 | 148 | 153,843 | |
| 6.50%, with various maturities to 2036 | 22 | 23,941 | |
| Government National Mortgage Association: | |||
| 2.50%, with various maturities to 2051 | 2,256 | 1,981,225 | |
| 3.00%, 3/20/51 | 321 | 292,413 | |
| 4.00%, with various maturities to 2042 | 497 | 483,300 | |
| 4.50%, 7/20/33 | 45 | 44,693 | |
| 5.00%, with various maturities to 2039 | 199 | 202,236 | |
| 5.50%, 7/20/34 | 24 | 24,080 | |
| 6.00%, with various maturities to 2038 | 134 | 140,112 | |
| Total U.S. Government Agency Mortgage-Backed Securities (identified cost $35,937,578) | $ 31,888,680 | ||
| U.S. Treasury Obligations — 39.0% |
| Security | Principal Amount (000's omitted) | Value | |
| U.S. Treasury Bonds: | |||
| 1.125%, 8/15/40 | $ | 500 | $ 319,414 |
| 1.375%, 8/15/50 | 1,000 | 557,500 | |
| 1.625%, 11/15/50 | 800 | 476,875 | |
| 1.875%, 2/15/51 | 1,600 | 1,015,187 | |
| 2.00%, 8/15/51 | 800 | 522,688 | |
| 2.25%, 8/15/49 | 650 | 454,162 | |
| 2.375%, 5/15/51 | 875 | 624,668 | |
| 2.50%, 2/15/45 | 1,000 | 757,617 | |
| 3.00%, 5/15/47 | 1,000 | 817,187 | |
| 3.125%, 11/15/41 | 1,000 | 869,961 | |
| 3.125%, 8/15/44 | 1,600 | 1,355,437 | |
| 3.125%, 5/15/48 | 750 | 625,137 | |
| 3.75%, 11/15/43 | 1,400 | 1,308,945 | |
| 3.875%, 8/15/40 | 500 | 487,578 | |
| 4.375%, 5/15/41 | 700 | 721,930 | |
| U.S. Treasury Notes: | |||
| 0.375%, 4/30/25 | 800 | 757,172 | |
| 0.375%, 11/30/25 | 2,000 | 1,857,539 | |
| 0.375%, 1/31/26 | 1,500 | 1,386,064 | |
| 0.375%, 7/31/27 | 300 | 264,656 | |
| 0.50%, 8/31/27 | 750 | 662,769 | |
| 0.625%, 5/15/30 | 300 | 245,227 | |
| 0.625%, 8/15/30 | 1,000 | 811,328 | |
| 0.875%, 11/15/30 | 250 | 205,430 | |
| 1.125%, 2/29/28 | 500 | 447,051 | |
| 1.125%, 8/31/28 | 200 | 176,605 | |
| 1.125%, 2/15/31 | 1,100 | 918,414 | |
| 1.25%, 4/30/28 | 1,725 | 1,544,549 | |
| 1.25%, 9/30/28 | 150 | 132,958 | |
| 1.25%, 8/15/31 | 1,300 | 1,076,131 | |
| 1.50%, 8/15/26 | 200 | 187,219 | |
| 1.50%, 2/15/30 | 1,400 | 1,219,969 | |
| 1.625%, 9/30/26 | 800 | 750,188 | |
| 1.75%, 1/31/29 | 350 | 315,738 | |
| 1.875%, 7/31/26 | 1,500 | 1,419,199 | |
| 2.00%, 2/15/25 | 1,500 | 1,456,113 | |
| 2.125%, 9/30/24 | 2,750 | 2,693,701 | |
| 2.25%, 11/15/24 | 2,000 | 1,955,317 | |
| 2.25%, 3/31/26 | 1,000 | 959,453 | |
| 2.25%, 2/15/27 | 2,400 | 2,278,734 | |
| 2.25%, 11/15/27 | 2,850 | 2,680,225 | |
| 2.625%, 2/15/29 | 1,000 | 941,641 | |
| 2.75%, 2/15/24 | 2,200 | 2,193,076 | |
| 2.75%, 8/15/32 | 825 | 755,761 | |
| 2.875%, 5/15/28 | 425 | 407,643 | |
| Security | Principal Amount (000's omitted) | Value | |
| U.S. Treasury Notes: (continued) | |||
| 2.875%, 5/15/32 | $ | 1,075 | $ 996,538 |
| 3.00%, 7/15/25 | 600 | 586,980 | |
| 3.125%, 11/15/28 | 1,150 | 1,111,143 | |
| 3.75%, 5/31/30(1) | 650 | 644,389 | |
| 3.875%, 3/31/25 | 300 | 297,422 | |
| 4.125%, 11/15/32 | 1,175 | 1,194,805 | |
| Total U.S. Treasury Obligations (identified cost $50,648,475) | $ 46,445,433 | ||
| Short-Term Investments — 2.2% | |||
| Affiliated Fund — 1.1% | |||
| Security | Shares | Value | |
| Morgan Stanley Institutional Liquidity Funds - Government Portfolio, Institutional Class, 5.27%(6) | 1,338,640 | $ 1,338,640 | |
| Total Affiliated Fund (identified cost $1,338,640) | $ 1,338,640 | ||
| Securities Lending Collateral — 1.1% | |||
| Security | Shares | Value | |
| State Street Navigator Securities Lending Government Money Market Portfolio, 5.36%(7) | 1,273,840 | $ 1,273,840 | |
| Total Securities Lending Collateral (identified cost $1,273,840) | $ 1,273,840 | ||
| Total Short-Term Investments (identified cost $2,612,480) | $ 2,612,480 | ||
| Total Investments — 100.5% (identified cost $130,878,889) | $119,585,075 | ||
| Other Assets, Less Liabilities — (0.5)% | $ (555,816) | ||
| Net Assets — 100.0% | $ 119,029,259 | ||
| The percentage shown for each investment category in the Schedule of Investments is based on net assets. | |
| (1) | All or a portion of this security was on loan at December 31, 2023. The aggregate market value of securities on loan at December 31, 2023 was $2,761,959. |
| (2) | Security exempt from registration under Rule 144A of the Securities Act of 1933, as amended. These securities may be sold in certain transactions in reliance on an exemption from registration (normally to qualified institutional buyers). At December 31, 2023, the aggregate value of these securities is $1,287,952 or 1.1% of the Fund's net assets. |
| (3) | Security converts to variable rate after the indicated fixed-rate coupon period. |
| (4) | Represents an investment in an issuer that is deemed to be an affiliate (see Note 8). |
| (5) | Adjustable rate mortgage security whose interest rate generally adjusts monthly based on a weighted average of interest rates on the underlying mortgages. The coupon rate may not reflect the applicable index value as interest rates on the underlying mortgages may adjust on various dates and at various intervals and may be subject to lifetime ceilings and lifetime floors and lookback periods. Rate shown is the coupon rate at December 31, 2023. |
| (6) | May be deemed to be an affiliated investment company. The rate shown is the annualized seven-day yield as of December 31, 2023. |
| (7) | Represents investment of cash collateral received in connection with securities lending. |
| Abbreviations: | |
| RFUCCT | – FTSE USD IBOR Consumer Cash Fallbacks Term |
| December 31, 2023 | |
| Assets | |
| Investments in securities of unaffiliated issuers, at value (identified cost $129,389,258) - including $2,761,959 of securities on loan | $ 118,096,557 |
| Investments in securities of affiliated issuers, at value (identified cost $1,489,631) | 1,488,518 |
| Receivable for capital shares sold | 73,941 |
| Interest receivable | 809,422 |
| Dividends and interest receivable - affiliated | 5,210 |
| Securities lending income receivable | 673 |
| Receivable from affiliates | 17,754 |
| Directors' deferred compensation plan | 30,035 |
| Total assets | $120,522,110 |
| Liabilities | |
| Payable for capital shares redeemed | $ 74,565 |
| Deposits for securities loaned | 1,273,840 |
| Payable to affiliates: | |
| Investment advisory fee | 19,906 |
| Administrative fee | 12,021 |
| Distribution fees | 1,206 |
| Sub-transfer agency fee | 164 |
| Directors' deferred compensation plan | 30,035 |
| Accrued expenses | 81,114 |
| Total liabilities | $ 1,492,851 |
| Net Assets | $119,029,259 |
| Sources of Net Assets | |
| Paid-in capital | $ 129,192,339 |
| Accumulated loss | (10,163,080) |
| Net Assets | $119,029,259 |
| Class I Shares | |
| Net Assets | $ 113,389,258 |
| Shares Outstanding | 2,340,666 |
| Net Asset Value, Offering Price and Redemption Price Per Share (net assets ÷ shares of beneficial interest outstanding) | $ 48.44 |
| Class F Shares | |
| Net Assets | $ 5,640,001 |
| Shares Outstanding | 119,362 |
| Net Asset Value, Offering Price and Redemption Price Per Share (net assets ÷ shares of beneficial interest outstanding) | $ 47.25 |
| Year Ended | |
| December 31, 2023 | |
| Investment Income | |
| Dividend income - affiliated issuers | $ 59,739 |
| Interest income | 3,525,932 |
| Interest income - affiliated issuers | 7,011 |
| Securities lending income, net | 7,126 |
| Total investment income | $3,599,808 |
| Expenses | |
| Investment advisory fee | $ 233,932 |
| Administrative fee | 140,359 |
| Distribution fees: | |
| Class F | 13,167 |
| Directors' fees and expenses | 8,109 |
| Custodian fees | 5,155 |
| Transfer agency fees and expenses | 95,800 |
| Accounting fees | 29,100 |
| Professional fees | 42,439 |
| Reports to shareholders | 8,205 |
| Miscellaneous | 14,988 |
| Total expenses | $ 591,254 |
| Waiver and/or reimbursement of expenses by affiliates | $ (205,578) |
| Net expenses | $ 385,676 |
| Net investment income | $3,214,132 |
| Realized and Unrealized Gain (Loss) | |
| Net realized gain (loss): | |
| Investment securities | $ (215,022) |
| Net realized loss | $ (215,022) |
| Change in unrealized appreciation (depreciation): | |
| Investment securities | $ 3,195,854 |
| Investment securities - affiliated issuers | 653 |
| Net change in unrealized appreciation (depreciation) | $3,196,507 |
| Net realized and unrealized gain | $2,981,485 |
| Net increase in net assets from operations | $6,195,617 |
| Year Ended December 31, | ||
| 2023 | 2022 | |
| Increase (Decrease) in Net Assets | ||
| From operations: | ||
| Net investment income | $ 3,214,132 | $ 3,008,782 |
| Net realized loss | (215,022) | (2,480) |
| Net change in unrealized appreciation (depreciation) | 3,196,507 | (21,174,225) |
| Net increase (decrease) in net assets from operations | $ 6,195,617 | $ (18,167,923) |
| Distributions to shareholders: | ||
| Class I | $ (3,038,084) | $ (3,214,829) |
| Class F | (155,896) | (138,089) |
| Total distributions to shareholders | $ (3,193,980) | $ (3,352,918) |
| Capital share transactions: | ||
| Class I | $ (466,336) | $ (13,634,472) |
| Class F | 544,102 | 368,413 |
| Net increase (decrease) in net assets from capital share transactions | $ 77,766 | $ (13,266,059) |
| Net increase (decrease) in net assets | $ 3,079,403 | $ (34,786,900) |
| Net Assets | ||
| At beginning of year | $ 115,949,856 | $ 150,736,756 |
| At end of year | $119,029,259 | $115,949,856 |
| Class I | |||||
| Year Ended December 31, | |||||
| 2023 | 2022 | 2021 | 2020 | 2019 | |
| Net asset value — Beginning of year | $ 47.25 | $ 55.64 | $ 58.07 | $ 55.68 | $ 53.01 |
| Income (Loss) From Operations | |||||
| Net investment income(1) | $ 1.32 | $ 1.19 | $ 1.14 | $ 1.34 | $ 1.50 |
| Net realized and unrealized gain (loss) | 1.18 | (8.19) | (2.20) | 2.74 | 2.96 |
| Total income (loss) from operations | $ 2.50 | $ (7.00) | $ (1.06) | $ 4.08 | $ 4.46 |
| Less Distributions | |||||
| From net investment income | $ (1.31) | $ (1.39) | $ (1.37) | $ (1.69) | $ (1.79) |
| Total distributions | $ (1.31) | $ (1.39) | $ (1.37) | $ (1.69) | $ (1.79) |
| Net asset value — End of year | $ 48.44 | $ 47.25 | $ 55.64 | $ 58.07 | $ 55.68 |
| Total Return(2) | 5.47% | (12.53)% | (1.82)% | 7.34% | 8.41% |
| Ratios/Supplemental Data | |||||
| Net assets, end of year (000’s omitted) | $113,389 | $110,980 | $145,323 | $144,073 | $140,169 |
| Ratios (as a percentage of average daily net assets):(3) | |||||
| Total expenses | 0.49% | 0.48% | 0.46% | 0.47% | 0.43% |
| Net expenses | 0.32% (4) | 0.32% (4) | 0.32% | 0.32% | 0.32% |
| Net investment income | 2.76% | 2.35% | 2.00% | 2.30% | 2.71% |
| Portfolio Turnover | 11% | 6% | 15% | 23% | 10% |
| (1) | Computed using average shares outstanding. |
| (2) | Returns are historical and are calculated by determining the percentage change in net asset value with all distributions reinvested and do not reflect fees and expenses imposed by variable annuity contracts or variable life insurance policies. If included, total return would be lower. |
| (3) | Total expenses do not reflect amounts reimbursed and/or waived by the adviser and certain of its affiliates, if applicable. Net expenses are net of all reductions and represent the net expenses paid by the Fund. |
| (4) | Includes a reduction by the investment adviser of a portion of its advisory fee due to the Fund’s investment in the Liquidity Fund (equal to less than 0.005% of average daily net assets for the years ended December 31, 2023 and 2022). |
| Class F | |||||
| Year Ended December 31, | |||||
| 2023 | 2022 | 2021 | 2020 | 2019 | |
| Net asset value — Beginning of year | $ 46.23 | $ 54.61 | $ 57.17 | $ 54.97 | $ 52.48 |
| Income (Loss) From Operations | |||||
| Net investment income(1) | $ 1.17 | $ 1.04 | $ 0.98 | $ 1.15 | $ 1.33 |
| Net realized and unrealized gain (loss) | 1.16 | (8.03) | (2.17) | 2.74 | 2.95 |
| Total income (loss) from operations | $ 2.33 | $ (6.99) | $ (1.19) | $ 3.89 | $ 4.28 |
| Less Distributions | |||||
| From net investment income | $ (1.31) | $ (1.39) | $ (1.37) | $ (1.69) | $ (1.79) |
| Total distributions | $ (1.31) | $ (1.39) | $ (1.37) | $ (1.69) | $ (1.79) |
| Net asset value — End of year | $47.25 | $ 46.23 | $54.61 | $57.17 | $54.97 |
| Total Return(2) | 5.22% | (12.75)% | (2.08)% | 7.09% | 8.15% |
| Ratios/Supplemental Data | |||||
| Net assets, end of year (000’s omitted) | $ 5,640 | $ 4,970 | $ 5,413 | $ 3,966 | $ 1,265 |
| Ratios (as a percentage of average daily net assets):(3) | |||||
| Total expenses | 0.74% | 0.73% | 0.71% | 0.72% | 0.68% |
| Net expenses | 0.57% (4) | 0.57% (4) | 0.57% | 0.57% | 0.57% |
| Net investment income | 2.51% | 2.11% | 1.75% | 2.00% | 2.42% |
| Portfolio Turnover | 11% | 6% | 15% | 23% | 10% |
| (1) | Computed using average shares outstanding. |
| (2) | Returns are historical and are calculated by determining the percentage change in net asset value with all distributions reinvested and do not reflect fees and expenses imposed by variable annuity contracts or variable life insurance policies. If included, total return would be lower. |
| (3) | Total expenses do not reflect amounts reimbursed and/or waived by the adviser and certain of its affiliates, if applicable. Net expenses are net of all reductions and represent the net expenses paid by the Fund. |
| (4) | Includes a reduction by the investment adviser of a portion of its advisory fee due to the Fund’s investment in the Liquidity Fund (equal to less than 0.005% of average daily net assets for the years ended December 31, 2023 and 2022). |
| Asset Description | Level 1 | Level 2 | Level 3 | Total |
| Asset-Backed Securities | $ — | $ 48,211 | $ — | $ 48,211 |
| Commercial Mortgage-Backed Securities | — | 1,878,983 | — | 1,878,983 |
| Corporate Bonds | — | 31,187,305 | — | 31,187,305 |
| Sovereign Government Bonds | — | 478,423 | — | 478,423 |
| Taxable Municipal Obligations | — | 966,500 | — | 966,500 |
| U.S. Government Agencies and Instrumentalities | — | 4,079,060 | — | 4,079,060 |
| U.S. Government Agency Mortgage-Backed Securities | — | 31,888,680 | — | 31,888,680 |
| U.S. Treasury Obligations | — | 46,445,433 | — | 46,445,433 |
| Short-Term Investments: | ||||
| Affiliated Fund | 1,338,640 | — | — | 1,338,640 |
| Securities Lending Collateral | 1,273,840 | — | — | 1,273,840 |
| Total Investments | $2,612,480 | $116,972,595 | $ — | $119,585,075 |
| Year Ended December 31, | ||
| 2023 | 2022 | |
| Ordinary income | $3,193,980 | $3,352,918 |
| Undistributed ordinary income | $ 3,221,200 |
| Deferred capital losses | (1,826,432) |
| Net unrealized depreciation | (11,557,848) |
| Accumulated loss | $(10,163,080) |
| Aggregate cost | $131,142,923 |
| Gross unrealized appreciation | $ 351,523 |
| Gross unrealized depreciation | (11,909,371) |
| Net unrealized depreciation | $ (11,557,848) |
| Remaining Contractual Maturity of the Transactions | |||||
| Overnight and Continuous | <30 days | 30 to 90 days | >90 days | Total | |
| Corporate Bonds | $ 341,577 | $ — | $ — | $ — | $ 341,577 |
| U.S. Government Agencies and Instrumentalities | 621,290 | — | — | — | 621,290 |
| U.S. Treasury Obligations | 310,973 | — | — | — | 310,973 |
| Total | $1,273,840 | $ — | $ — | $ — | $1,273,840 |
| Name | Value, beginning of period | Purchases | Sales proceeds | Net realized gain (loss) | Change in unrealized appreciation (depreciation) | Value, end of period | Interest/ Dividend income | Principal amount/ Shares, end of period |
| Corporate Bonds | ||||||||
| Morgan Stanley, 5.00%, 11/24/25 | $ 149,714 | $ — | $ — | $ — | $ 653 | $ 149,878 | $ 7,011 | $ 150,000 |
| Short-Term Investments | ||||||||
| Liquidity Fund | 1,043,631 | 16,360,078 | (16,065,069) | — | — | 1,338,640 | 59,739 | 1,338,640 |
| Total | $ — | $ 653 | $1,488,518 | $66,750 | ||||
| Year Ended December 31, 2023 | Year Ended December 31, 2022 | ||||
| Shares | Amount | Shares | Amount | ||
| Class I | |||||
| Shares sold | 181,473 | $ 8,684,323 | 101,069 | $ 5,077,553 | |
| Reinvestment of distributions | 66,786 | 3,038,084 | 69,600 | 3,214,829 | |
| Shares redeemed | (256,338) | (12,188,743) | (433,833) | (21,926,854) | |
| Net decrease | (8,079) | $ (466,336) | (263,164) | $(13,634,472) | |
| Class F | |||||
| Shares sold | 25,406 | $ 1,186,892 | 22,264 | $ 1,090,171 | |
| Reinvestment of distributions | 3,511 | 155,896 | 3,054 | 138,089 | |
| Shares redeemed | (17,056) | (798,686) | (16,937) | (859,847) | |
| Net increase | 11,861 | $ 544,102 | 8,381 | $ 368,413 | |
Boston, Massachusetts
February 16, 2024
| Name and Year of Birth | Corporation Position(s) | Length of Service | Principal Occupation(s) and Other Directorships During Past Five Years and Other Relevant Experience |
| Interested Director | |||
| Von M. Hughes(1) 1969 | Director and President | Since 2023 | President and Chief Executive Officer and Managing Director of Calvert Research and Management. Managing Director of Morgan Stanley Investment Management (MSIM) (since 2022). Formerly, Managing Director of PAAMCO Prisma (investment management firm) (2003-2022). Mr. Hughes is an interested person because of his positions with CRM and certain affiliates. Other Directorships. Tradeweb Markets Inc. (financial services) (2021-2022); National Association of Investment Companies (2018-2021). |
| Noninterested Directors | |||
| Alice Gresham Bullock 1950 | Chair and Director | Since 2016 (Chair); Since 2008 (Director) | Professor Emerita at Howard University School of Law. Dean Emerita of Howard University School of Law and Deputy Director of the Association of American Law Schools (1992-1994). Other Directorships. None. |
| Cari M. Dominguez 1949 | Director | Since 2016 | Former Chair of the U.S. Equal Employment Opportunity Commission. Other Directorships. ManpowerGroup Inc. (workforce solutions company); Triple S Management Corporation (managed care); National Association of Corporate Directors. |
| Karen Fang(2) 1958 | Director | Since 2023 | Formerly, Managing Director, Wealth Management at GAMCO Asset Management (asset management firm) (2020-2023). Formerly, Managing Director, Senior Portfolio Manager of Fiduciary Trust Company International (wealth management firm) (1993-2019). Other Directorships. None. |
| Miles D. Harper, III 1962 | Director | Since 2016 | Private investor (2022-present). Formerly, Partner, Carr Riggs & Ingram (public accounting firm) (2014-2022). Partner, Gainer Donnelly & Desroches (public accounting firm) (now Carr Riggs & Ingram) (1999-2014). Other Directorships. Bridgeway Funds (9) (asset management). |
| Joy V. Jones 1950 | Director | Since 2016 | Attorney. Other Directorships. Palm Management Corporation. |
| Eddie Ramos(2) 1967 | Director | Since 2023 | Private investor (2022-present). Formerly, Head of External Advisors/Diversity Portfolio Management at the New Jersey Division of Investment (2020-2022). Formerly, Chief Investment Officer and Lead Portfolio Manager – Global Fundamental Equities at Cornerstone Capital Management (asset management firm) (2011-2017). Other Directorships. Macquarie Optimum Funds (6) (asset management) (2022-2023). |
| Name and Year of Birth | Corporation Position(s) | Length of Service | Principal Occupation(s) and Other Directorships During Past Five Years and Other Relevant Experience |
| Noninterested Directors (continued) | |||
| Anthony A. Williams 1951 | Director | Since 2016 | CEO and Executive Director of the Federal City Council (July 2012 to present); Senior Adviser and Independent Consultant for King and Spalding LLP (September 2015 to present); Executive Director of Global Government Practice at the Corporate Executive Board (January 2010 to January 2012). Other Directorships. Freddie Mac; Evoq Properties/Meruelo Maddux Properties, Inc. (real estate management); Weston Solutions, Inc. (environmental services); Bipartisan Policy Center’s Debt Reduction Task Force; Chesapeake Bay Foundation; Catholic University of America; Urban Institute (research organization); The Howard Hughes Corporation (real estate development); Old Dominion National Bank. |
| Name and Year of Birth | Corporation Position(s) | Length of Service | Principal Occupation(s) During Past Five Years |
| Principal Officers who are not Directors | |||
| Hope L. Brown 1973 | Chief Compliance Officer | Since 2014 | Chief Compliance Officer of 46 registered investment companies advised by CRM (since 2014). Vice President and Chief Compliance Officer, Wilmington Funds (2012-2014). |
| Deidre E. Walsh 1971 | Secretary, Vice President and Chief Legal Officer | Since 2021 | Vice President of CRM and officer of 46 registered investment companies advised by CRM (since 2021). Also Vice President of Eaton Vance and certain of its affiliates and officer of 127 registered investment companies advised or administered by Eaton Vance. |
| James F. Kirchner 1967 | Treasurer | Since 2016 | Vice President of CRM and officer of 46 registered investment companies advised by CRM (since 2016). Also Vice President of Eaton Vance and certain of its affiliates and officer of 127 registered investment companies advised or administered by Eaton Vance. |
| (1) Mr. Hughes is an interested person of the Fund because of his positions with the Fund’s adviser and certain affiliates. | |||
| (2) Ms. Fang and Mr. Ramos began serving as Directors effective October 30, 2023. | |||
| Privacy Notice | April 2021 |
| FACTS | WHAT DOES EATON VANCE DO WITH YOUR PERSONAL INFORMATION? |
| Why? | Financial companies choose how they share your personal information. Federal law gives consumers the right to limit some but not all sharing. Federal law also requires us to tell you how we collect, share, and protect your personal information. Please read this notice carefully to understand what we do. |
| What? | The types of personal information we collect and share depend on the product or service you have with us. This information can include:■ Social Security number and income ■ investment experience and risk tolerance ■ checking account number and wire transfer instructions |
| How? | All financial companies need to share customers’ personal information to run their everyday business. In the section below, we list the reasons financial companies can share their customers’ personal information; the reasons Eaton Vance chooses to share; and whether you can limit this sharing. |
| Reasons we can share your personal information | Does Eaton Vance share? | Can you limit this sharing? |
| For our everyday business purposes — such as to process your transactions, maintain your account(s), respond to court orders and legal investigations, or report to credit bureaus | Yes | No |
| For our marketing purposes — to offer our products and services to you | Yes | No |
| For joint marketing with other financial companies | No | We don’t share |
| For our investment management affiliates’ everyday business purposes — information about your transactions, experiences, and creditworthiness | Yes | Yes |
| For our affiliates’ everyday business purposes — information about your transactions and experiences | Yes | No |
| For our affiliates’ everyday business purposes — information about your creditworthiness | No | We don’t share |
| For our investment management affiliates to market to you | Yes | Yes |
| For our affiliates to market to you | No | We don’t share |
| For nonaffiliates to market to you | No | We don’t share |
| To limit our sharing | Call toll-free 1-800-368-2745 or email: CRMPrivacy@calvert.comPlease note:If you are a new customer, we can begin sharing your information 30 days from the date we sent this notice. When you are no longer our customer, we continue to share your information as described in this notice. However, you can contact us at any time to limit our sharing. |
| Questions? | Call toll-free 1-800-368-2745 or email: CRMPrivacy@calvert.com |
| Privacy Notice — continued | April 2021 |
| Who we are | |
| Who is providing this notice? | Eaton Vance Management, Eaton Vance Distributors, Inc., Eaton Vance Trust Company, Eaton Vance Management (International) Limited, Eaton Vance Advisers International Ltd., Eaton Vance Global Advisors Limited, Eaton Vance Management’s Real Estate Investment Group, Boston Management and Research, Calvert Research and Management, Eaton Vance and Calvert Fund Families and our investment advisory affiliates (“Eaton Vance”) (see Investment Management Affiliates definition below) |
| What we do | |
| How does Eaton Vance protect my personal information? | To protect your personal information from unauthorized access and use, we use security measures that comply with federal law. These measures include computer safeguards and secured files and buildings. We have policies governing the proper handling of customer information by personnel and requiring third parties that provide support to adhere to appropriate security standards with respect to such information. |
| How does Eaton Vance collect my personal information? | We collect your personal information, for example, when you■ open an account or make deposits or withdrawals from your account ■ buy securities from us or make a wire transfer ■ give us your contact informationWe also collect your personal information from others, such as credit bureaus, affiliates, or other companies. |
| Why can’t I limit all sharing? | Federal law gives you the right to limit only■ sharing for affiliates’ everyday business purposes — information about your creditworthiness ■ affiliates from using your information to market to you ■ sharing for nonaffiliates to market to youState laws and individual companies may give you additional rights to limit sharing. See below for more on your rights under state law. |
| Definitions | |
| Investment Management Affiliates | Eaton Vance Investment Management Affiliates include registered investment advisers, registered broker- dealers, and registered and unregistered funds. Investment Management Affiliates does not include entities associated with Morgan Stanley Wealth Management, such as Morgan Stanley Smith Barney LLC and Morgan Stanley & Co. |
| Affiliates | Companies related by common ownership or control. They can be financial and nonfinancial companies.■ Our affiliates include companies with a Morgan Stanley name and financial companies such as Morgan Stanley Smith Barney LLC and Morgan Stanley & Co. |
| Nonaffiliates | Companies not related by common ownership or control. They can be financial and nonfinancial companies.■ Eaton Vance does not share with nonaffiliates so they can market to you. |
| Joint marketing | A formal agreement between nonaffiliated financial companies that together market financial products or services to you.■ Eaton Vance doesn’t jointly market. |
| Other important information | |
| Vermont: Except as permitted by law, we will not share personal information we collect about Vermont residents with Nonaffiliates unless you provide us with your written consent to share such information.California: Except as permitted by law, we will not share personal information we collect about California residents with Nonaffiliates and we will limit sharing such personal information with our Affiliates to comply with California privacy laws that apply to us. | |


| % Average Annual Total Returns1,2 | Class Inception Date | Performance Inception Date | One Year | Five Years | Ten Years |
| Class I at NAV | 04/27/2000 | 04/27/2000 | 54.40% | 22.09% | 17.29% |
| Class F at NAV | 10/30/2015 | 04/27/2000 | 54.02 | 21.79 | 17.05 |
| NASDAQ-100 ® Index | — | — | 55.13% | 22.65% | 17.90% |
| % Total Annual Operating Expense Ratios3 | Class I | Class F |
| Gross | 0.60% | 0.85% |
| Net | 0.48 | 0.73 |

| Growth of Investment | Amount Invested | Period Beginning | At NAV | With Maximum Sales Charge |
| Class F | $10,000 | 12/31/2013 | $48,315 | N.A. |
| Sector Allocation (% of net assets)1 |

| Top 10 Holdings (% of net assets)1 | |
| Apple, Inc. | 8.9% |
| Microsoft Corp. | 8.3 |
| Amazon.com, Inc. | 4.7 |
| Broadcom, Inc. | 4.0 |
| Meta Platforms, Inc., Class A | 3.7 |
| NVIDIA Corp. | 3.6 |
| Tesla, Inc. | 3.6 |
| Alphabet, Inc., Class A | 2.5 |
| Alphabet, Inc., Class C | 2.4 |
| Costco Wholesale Corp. | 2.3 |
| Total | 44.0% |
| 1 | Excludes cash and cash equivalents. |
| † | The views expressed in this report are those of the portfolio manager(s) and are current only through the date stated at the top of this page. These views are subject to change at any time based upon market or other conditions, and Calvert and the Fund(s) disclaim any responsibility to update such views. These views may not be relied upon as investment advice and, because investment decisions are based on many factors, may not be relied upon as an indication of trading intent on behalf of any Calvert fund. This commentary may contain statements that are not historical facts, referred to as “forward-looking statements.” The Fund’s actual future results may differ significantly from those stated in any forward-looking statement, depending on factors such as changes in securities or financial markets or general economic conditions, the volume of sales and purchases of Fund shares, the continuation of investment advisory, administrative and service contracts, and other risks discussed from time to time in the Fund’s filings with the Securities and Exchange Commission. |
| 1 | NASDAQ–100® Index includes 100 of the largest domestic and international securities (by market cap), excluding financials, listed on Nasdaq. Source: Nasdaq, Inc. The information is provided by Nasdaq (with its affiliates, are referred to as the “Corporations”) and Nasdaq’s third party licensors on an “as is” basis and the Corporations make no guarantees and bear no liability of any kind with respect to the information or the Fund. Unless otherwise stated, index returns do not reflect the effect of any applicable sales charges, commissions, expenses, taxes or leverage, as applicable. It is not possible to invest directly in an index. |
| 2 | There is no sales charge. Insurance-related charges are not included in the calculation of returns. If such charges were reflected, the returns would be lower. Please refer to the report for your insurance contract for performance data reflecting insurance-related charges.Performance prior to the inception date of a class may be linked to the performance of an older class of the Fund. This linked performance is adjusted for any applicable sales charge, but is not adjusted for class expense differences. If adjusted for such differences, the performance would be different. The performance of Class F is linked to Class I. Performance presented in the Financial Highlights included in the financial statements is not linked.Calvert Research and Management became the investment adviser to the Fund on December 31, 2016. Performance reflected prior to such date is that of the Fund’s former investment adviser. |
| 3 | Source: Fund prospectus. Net expense ratios reflect a contractual expense reimbursement that continues through 4/30/24. The expense ratios for the current reporting period can be found in the Financial Highlights section of this report. Performance reflects expenses waived and/or reimbursed, if applicable. Without such waivers and/or reimbursements, performance would have been lower. |
| Additional Information | |
| S&P 500® Index is an unmanaged index of large-cap stocks commonly used as a measure of U.S. stock market performance. Dow Jones Industrial Average® is a price-weighted average of 30 blue-chip stocks that are generally the leaders in their industry. S&P Dow Jones Indices are a product of S&P Dow Jones Indices LLC (“S&P DJI”) and have been licensed for use. S&P® and S&P 500® are registered trademarks of S&P DJI; Dow Jones® is a registered trademark of Dow Jones Trademark Holdings LLC (“Dow Jones”); S&P DJI, Dow Jones and their respective affiliates do not sponsor, endorse, sell or promote the Fund, will not have any liability with respect thereto and do not have any liability for any errors, omissions, or interruptions of the S&P Dow Jones Indices. Nasdaq Composite Index is a market capitalization-weighted index of all domestic and international securities listed on Nasdaq. Source: Nasdaq, Inc. The information is provided by Nasdaq (with its affiliates, are referred to as the “Corporations”) and Nasdaq’s third party licensors on an “as is” basis and the Corporations make no guarantees and bear no liability of any kind with respect to the information or the Fund. Russell 2000® Index is an unmanaged index of 2,000 U.S. small-cap stocks. |
| Beginning Account Value (7/1/23) | Ending Account Value (12/31/23) | Expenses Paid During Period* (7/1/23 – 12/31/23) | Annualized Expense Ratio | |
| Actual | ||||
| Class I | $1,000.00 | $1,110.30 | $2.55 ** | 0.48% |
| Class F | $1,000.00 | $1,109.00 | $3.88 ** | 0.73% |
| Hypothetical | ||||
| (5% return per year before expenses) | ||||
| Class I | $1,000.00 | $1,022.79 | $2.45 ** | 0.48% |
| Class F | $1,000.00 | $1,021.53 | $3.72 ** | 0.73% |
| * | Expenses are equal to the Fund's annualized expense ratio for the indicated Class, multiplied by the average account value over the period, multiplied by 184/365 (to reflect the one-half year period). The Example assumes that the $1,000 was invested at the net asset value per share determined at the close of business on June 30, 2023. Expenses shown do not include insurance-related charges or direct expenses of Qualified Plans. |
| ** | Absent a waiver and/or reimbursement of expenses by affiliate(s), expenses would be higher. |
| Common Stocks — 96.5% |
| Security | Shares | Value | |
| Automobiles — 3.6% | |||
| Tesla, Inc.(1) | 54,046 | $ 13,429,350 | |
| $ 13,429,350 | |||
| Beverages — 2.8% | |||
| Coca-Cola Europacific Partners PLC | 13,249 | $ 884,238 | |
| Keurig Dr Pepper, Inc. | 40,557 | 1,351,359 | |
| Monster Beverage Corp.(1) | 30,177 | 1,738,497 | |
| PepsiCo, Inc. | 39,877 | 6,772,710 | |
| $ 10,746,804 | |||
| Biotechnology — 4.1% | |||
| Amgen, Inc. | 15,522 | $ 4,470,647 | |
| Biogen, Inc.(1) | 4,203 | 1,087,610 | |
| Gilead Sciences, Inc. | 36,140 | 2,927,701 | |
| Moderna, Inc.(1) | 11,059 | 1,099,818 | |
| Regeneron Pharmaceuticals, Inc.(1) | 3,107 | 2,728,847 | |
| Vertex Pharmaceuticals, Inc.(1) | 7,474 | 3,041,096 | |
| $ 15,355,719 | |||
| Broadline Retail — 6.0% | |||
| Amazon.com, Inc.(1) | 116,072 | $ 17,635,980 | |
| MercadoLibre, Inc.(1) | 1,466 | 2,303,878 | |
| PDD Holdings, Inc. ADR(1) | 19,373 | 2,834,463 | |
| $ 22,774,321 | |||
| Commercial Services & Supplies — 0.8% | |||
| Cintas Corp. | 2,954 | $ 1,780,258 | |
| Copart, Inc.(1) | 27,851 | 1,364,699 | |
| $ 3,144,957 | |||
| Communications Equipment — 1.6% | |||
| Cisco Systems, Inc. | 117,857 | $ 5,954,136 | |
| $ 5,954,136 | |||
| Consumer Staples Distribution & Retail — 2.7% | |||
| Costco Wholesale Corp. | 12,841 | $ 8,476,088 | |
| Dollar Tree, Inc.(1) | 6,319 | 897,614 | |
| Walgreens Boots Alliance, Inc. | 25,057 | 654,238 | |
| $ 10,027,940 | |||
| Electric Utilities — 1.1% | |||
| American Electric Power Co., Inc. | 15,253 | $ 1,238,849 | |
| Constellation Energy Corp. | 9,263 | 1,082,752 | |
| Exelon Corp. | 28,872 | 1,036,505 | |
| Xcel Energy, Inc. | 16,005 | 990,869 | |
| $ 4,348,975 | |||
| Security | Shares | Value | |
| Electronic Equipment, Instruments & Components — 0.2% | |||
| CDW Corp. | 3,885 | $ 883,138 | |
| $ 883,138 | |||
| Energy Equipment & Services — 0.3% | |||
| Baker Hughes Co. | 29,185 | $ 997,543 | |
| $ 997,543 | |||
| Entertainment — 2.3% | |||
| Electronic Arts, Inc. | 7,806 | $ 1,067,939 | |
| Netflix, Inc.(1) | 12,694 | 6,180,455 | |
| Take-Two Interactive Software, Inc.(1) | 4,938 | 794,771 | |
| Warner Bros. Discovery, Inc.(1) | 70,728 | 804,884 | |
| $ 8,848,049 | |||
| Financial Services — 0.5% | |||
| PayPal Holdings, Inc.(1) | 31,270 | $ 1,920,291 | |
| $ 1,920,291 | |||
| Food Products — 1.1% | |||
| Kraft Heinz Co. (The) | 35,575 | $ 1,315,564 | |
| Mondelez International, Inc., Class A | 39,472 | 2,858,957 | |
| $ 4,174,521 | |||
| Ground Transportation — 0.9% | |||
| CSX Corp. | 57,316 | $ 1,987,146 | |
| Old Dominion Freight Line, Inc. | 3,165 | 1,282,869 | |
| $ 3,270,015 | |||
| Health Care Equipment & Supplies — 1.9% | |||
| DexCom, Inc.(1) | 11,206 | $ 1,390,553 | |
| GE HealthCare Technologies, Inc. | 13,204 | 1,020,933 | |
| IDEXX Laboratories, Inc.(1) | 2,409 | 1,337,116 | |
| Intuitive Surgical, Inc.(1) | 10,212 | 3,445,120 | |
| $ 7,193,722 | |||
| Hotels, Restaurants & Leisure — 3.0% | |||
| Airbnb, Inc., Class A(1) | 12,609 | $ 1,716,589 | |
| Booking Holdings, Inc.(1) | 1,012 | 3,589,787 | |
| DoorDash, Inc., Class A(1) | 10,753 | 1,063,364 | |
| Marriott International, Inc., Class A | 8,518 | 1,920,894 | |
| Starbucks Corp. | 32,969 | 3,165,354 | |
| $ 11,455,988 | |||
| Industrial Conglomerates — 1.1% | |||
| Honeywell International, Inc. | 19,121 | $ 4,009,865 | |
| $ 4,009,865 | |||
| Interactive Media & Services — 8.6% | |||
| Alphabet, Inc., Class A(1) | 66,505 | $ 9,290,083 | |
| Security | Shares | Value | |
| Interactive Media & Services (continued) | |||
| Alphabet, Inc., Class C(1) | 64,333 | $ 9,066,450 | |
| Meta Platforms, Inc., Class A(1) | 39,662 | 14,038,762 | |
| $ 32,395,295 | |||
| IT Services — 0.5% | |||
| Cognizant Technology Solutions Corp., Class A | 14,543 | $ 1,098,433 | |
| MongoDB, Inc.(1) | 2,069 | 845,910 | |
| $ 1,944,343 | |||
| Life Sciences Tools & Services — 0.2% | |||
| Illumina, Inc.(1) | 4,606 | $ 641,339 | |
| $ 641,339 | |||
| Machinery — 0.4% | |||
| PACCAR, Inc. | 15,171 | $ 1,481,448 | |
| $ 1,481,448 | |||
| Media — 2.2% | |||
| Charter Communications, Inc., Class A(1) | 4,290 | $ 1,667,437 | |
| Comcast Corp., Class A | 116,470 | 5,107,210 | |
| Sirius XM Holdings, Inc.(2) | 111,345 | 609,057 | |
| Trade Desk, Inc. (The), Class A(1) | 12,943 | 931,378 | |
| $ 8,315,082 | |||
| Oil, Gas & Consumable Fuels — 0.2% | |||
| Diamondback Energy, Inc. | 5,191 | $ 805,020 | |
| $ 805,020 | |||
| Pharmaceuticals — 0.3% | |||
| AstraZeneca PLC | 16,889 | $ 1,137,474 | |
| $ 1,137,474 | |||
| Professional Services — 1.3% | |||
| Automatic Data Processing, Inc. | 11,930 | $ 2,779,332 | |
| Paychex, Inc. | 10,477 | 1,247,916 | |
| Verisk Analytics, Inc. | 4,205 | 1,004,406 | |
| $ 5,031,654 | |||
| Real Estate Management & Development — 0.3% | |||
| CoStar Group, Inc.(1) | 11,844 | $ 1,035,047 | |
| $ 1,035,047 | |||
| Semiconductors & Semiconductor Equipment — 19.7% | |||
| Advanced Micro Devices, Inc.(1) | 46,856 | $ 6,907,043 | |
| Analog Devices, Inc. | 14,394 | 2,858,073 | |
| Applied Materials, Inc. | 24,263 | 3,932,304 | |
| ASML Holding NV-NY Shares(3) | 2,546 | 1,927,118 | |
| Broadcom, Inc. | 13,548 | 15,122,955 | |
| GlobalFoundries, Inc.(1)(2) | 15,887 | 962,752 | |
| Security | Shares | Value | |
| Semiconductors & Semiconductor Equipment (continued) | |||
| Intel Corp. | 122,281 | $ 6,144,620 | |
| KLA Corp. | 3,943 | 2,292,066 | |
| Lam Research Corp. | 3,823 | 2,994,403 | |
| Marvell Technology, Inc. | 25,025 | 1,509,258 | |
| Microchip Technology, Inc. | 15,693 | 1,415,195 | |
| Micron Technology, Inc. | 32,013 | 2,731,989 | |
| NVIDIA Corp. | 27,743 | 13,738,889 | |
| NXP Semiconductors NV | 7,476 | 1,717,088 | |
| ON Semiconductor Corp.(1) | 12,492 | 1,043,457 | |
| QUALCOMM, Inc. | 32,282 | 4,668,946 | |
| Texas Instruments, Inc. | 26,342 | 4,490,257 | |
| $ 74,456,413 | |||
| Software — 16.9% | |||
| Adobe, Inc.(1) | 13,206 | $ 7,878,699 | |
| ANSYS, Inc.(1) | 2,520 | 914,458 | |
| Atlassian Corp., Class A(1) | 4,496 | 1,069,418 | |
| Autodesk, Inc.(1) | 6,200 | 1,509,576 | |
| Cadence Design Systems, Inc.(1) | 7,891 | 2,149,272 | |
| CrowdStrike Holdings, Inc., Class A(1) | 6,602 | 1,685,623 | |
| Datadog, Inc., Class A(1) | 8,764 | 1,063,774 | |
| Fortinet, Inc.(1) | 22,273 | 1,303,639 | |
| Intuit, Inc. | 8,119 | 5,074,618 | |
| Microsoft Corp. | 83,473 | 31,389,187 | |
| Palo Alto Networks, Inc.(1) | 9,145 | 2,696,678 | |
| Roper Technologies, Inc. | 3,098 | 1,688,937 | |
| Splunk, Inc.(1) | 4,887 | 744,534 | |
| Synopsys, Inc.(1) | 4,411 | 2,271,268 | |
| Workday, Inc., Class A(1) | 6,062 | 1,673,476 | |
| Zscaler, Inc.(1) | 4,302 | 953,151 | |
| $ 64,066,308 | |||
| Specialty Retail — 0.8% | |||
| O'Reilly Automotive, Inc.(1) | 1,716 | $ 1,630,337 | |
| Ross Stores, Inc. | 9,822 | 1,359,267 | |
| $ 2,989,604 | |||
| Technology Hardware, Storage & Peripherals — 8.9% | |||
| Apple, Inc. | 174,719 | $ 33,638,649 | |
| $ 33,638,649 | |||
| Textiles, Apparel & Luxury Goods — 0.5% | |||
| lululemon Athletica, Inc.(1) | 3,522 | $ 1,800,763 | |
| $ 1,800,763 | |||
| Trading Companies & Distributors — 0.3% | |||
| Fastenal Co. | 16,573 | $ 1,073,433 | |
| $ 1,073,433 | |||
| Security | Shares | Value | |
| Wireless Telecommunication Services — 1.4% | |||
| T-Mobile US, Inc. | 33,542 | $ 5,377,789 | |
| $ 5,377,789 | |||
| Total Common Stocks (identified cost $138,797,380) | $364,724,995 | ||
| Exchange-Traded Funds — 0.5% |
| Security | Shares | Value | |
| Equity Funds — 0.5% | |||
| Invesco QQQ TM Trust, Series 1(2) | 5,000 | $ 2,047,600 | |
| Total Exchange-Traded Funds (identified cost $1,278,845) | $ 2,047,600 | ||
| Short-Term Investments — 3.6% | |||
| Affiliated Fund — 2.7% | |||
| Security | Shares | Value | |
| Morgan Stanley Institutional Liquidity Funds - Government Portfolio, Institutional Class, 5.27%(4) | 10,247,792 | $ 10,247,792 | |
| Total Affiliated Fund (identified cost $10,247,792) | $ 10,247,792 | ||
| Securities Lending Collateral — 0.6% | |||
| Security | Shares | Value | |
| State Street Navigator Securities Lending Government Money Market Portfolio, 5.36%(5) | 2,389,135 | $ 2,389,135 | |
| Total Securities Lending Collateral (identified cost $2,389,135) | $ 2,389,135 | ||
| U.S. Treasury Obligations — 0.3% | |||
| Security | Principal Amount (000's omitted) | Value | |
| U.S. Treasury Bills, 0.00%, 10/3/24(6) | $ | 1,000 | $ 964,069 |
| Total U.S. Treasury Obligations (identified cost $961,130) | $ 964,069 | ||
| Total Short-Term Investments (identified cost $13,598,057) | $ 13,600,996 | ||
| Total Investments — 100.6% (identified cost $153,674,282) | $380,373,591 | ||
| Other Assets, Less Liabilities — (0.6)% | $ (2,229,244) | ||
| Net Assets — 100.0% | $ 378,144,347 | ||
| The percentage shown for each investment category in the Schedule of Investments is based on net assets. | |
| (1) | Non-income producing security. |
| (2) | All or a portion of this security was on loan at December 31, 2023. The aggregate market value of securities on loan at December 31, 2023 was $2,555,718. |
| (3) | Security exempt from registration under Regulation S of the Securities Act of 1933, as amended, which exempts from registration securities offered and sold outside the United States. Security may not be offered or sold in the United States except pursuant to an exemption from, or in a transaction not subject to, the registration requirements of the Securities Act of 1933, as amended. At December 31, 2023, the aggregate value of these securities is $1,927,118 or 0.5% of the Fund's net assets. |
| (4) | May be deemed to be an affiliated investment company. The rate shown is the annualized seven-day yield as of December 31, 2023. |
| (5) | Represents investment of cash collateral received in connection with securities lending. |
| (6) | Security (or a portion thereof) has been pledged to cover margin requirements on open futures contracts. |
| Description | Number of Contracts | Position | Expiration Date | Notional Amount | Value/ Unrealized Appreciation (Depreciation) |
| Equity Futures | |||||
| E-mini NASDAQ-100® Index | 33 | Long | 3/15/24 | $11,235,510 | $ 332,095 |
| $332,095 |
| Abbreviations: | |
| ADR | – American Depositary Receipt |
| December 31, 2023 | |
| Assets | |
| Investments in securities of unaffiliated issuers, at value (identified cost $143,426,490) - including $2,555,718 of securities on loan | $ 370,125,799 |
| Investments in securities of affiliated issuers, at value (identified cost $10,247,792) | 10,247,792 |
| Receivable for capital shares sold | 98,854 |
| Dividends receivable | 350,508 |
| Dividends receivable - affiliated | 42,289 |
| Securities lending income receivable | 21,722 |
| Receivable from affiliate | 71,114 |
| Directors' deferred compensation plan | 34,018 |
| Total assets | $380,992,096 |
| Liabilities | |
| Payable for variation margin on open futures contracts | $ 44,210 |
| Due to custodian | 3,905 |
| Payable for capital shares redeemed | 71,532 |
| Deposits for securities loaned | 2,389,135 |
| Payable to affiliates: | |
| Investment advisory fee | 92,695 |
| Administrative fee | 37,590 |
| Distribution fees | 22,429 |
| Sub-transfer agency fee | 74 |
| Directors' deferred compensation plan | 34,018 |
| Accrued expenses | 152,161 |
| Total liabilities | $ 2,847,749 |
| Net Assets | $378,144,347 |
| Sources of Net Assets | |
| Paid-in capital | $ 119,237,239 |
| Distributable earnings | 258,907,108 |
| Net Assets | $378,144,347 |
| Class I Shares | |
| Net Assets | $ 268,239,132 |
| Shares Outstanding | 1,873,567 |
| Net Asset Value, Offering Price and Redemption Price Per Share (net assets ÷ shares of beneficial interest outstanding) | $ 143.17 |
| Class F Shares | |
| Net Assets | $ 109,905,215 |
| Shares Outstanding | 786,958 |
| Net Asset Value, Offering Price and Redemption Price Per Share (net assets ÷ shares of beneficial interest outstanding) | $ 139.66 |
| Year Ended | |
| December 31, 2023 | |
| Investment Income | |
| Dividend income (net of foreign taxes withheld of $5,913) | $ 2,854,738 |
| Dividend income - affiliated issuers | 246,266 |
| Interest income | 47,084 |
| Securities lending income, net | 100,306 |
| Total investment income | $ 3,248,394 |
| Expenses | |
| Investment advisory fee | $ 935,154 |
| Administrative fee | 374,061 |
| Distribution fees: | |
| Class F | 199,140 |
| Directors' fees and expenses | 21,836 |
| Custodian fees | 8,668 |
| Transfer agency fees and expenses | 289,080 |
| Accounting fees | 72,944 |
| Professional fees | 45,544 |
| Reports to shareholders | 17,493 |
| Miscellaneous | 93,053 |
| Total expenses | $ 2,056,973 |
| Waiver and/or reimbursement of expenses by affiliates | $ (368,705) |
| Net expenses | $ 1,688,268 |
| Net investment income | $ 1,560,126 |
| Realized and Unrealized Gain (Loss) | |
| Net realized gain (loss): | |
| Investment securities | $ 33,347,233 |
| Futures contracts | 1,847,375 |
| Net realized gain | $ 35,194,608 |
| Change in unrealized appreciation (depreciation): | |
| Investment securities | $ 93,036,163 |
| Futures contracts | 464,315 |
| Net change in unrealized appreciation (depreciation) | $ 93,500,478 |
| Net realized and unrealized gain | $128,695,086 |
| Net increase in net assets from operations | $130,255,212 |
| Year Ended December 31, | ||
| 2023 | 2022 | |
| Increase (Decrease) in Net Assets | ||
| From operations: | ||
| Net investment income | $ 1,560,126 | $ 1,070,203 |
| Net realized gain (loss) | 35,194,608 | (4,766,933) |
| Net change in unrealized appreciation (depreciation) | 93,500,478 | (108,179,407) |
| Net increase (decrease) in net assets from operations | $130,255,212 | $(111,876,137) |
| Distributions to shareholders: | ||
| Class I | $ (771,064) | $ (10,636,246) |
| Class F | (299,278) | (2,774,436) |
| Total distributions to shareholders | $ (1,070,342) | $ (13,410,682) |
| Capital share transactions: | ||
| Class I | $ (13,610,300) | $ (160,050) |
| Class F | 26,575,298 | 20,757,139 |
| Net increase in net assets from capital share transactions | $ 12,964,998 | $ 20,597,089 |
| Net increase (decrease) in net assets | $142,149,868 | $(104,689,730) |
| Net Assets | ||
| At beginning of year | $ 235,994,479 | $ 340,684,209 |
| At end of year | $378,144,347 | $ 235,994,479 |
| Class I | |||||
| Year Ended December 31, | |||||
| 2023 | 2022 | 2021 | 2020 | 2019 | |
| Net asset value — Beginning of year | $ 93.02 | $ 146.70 | $ 122.67 | $ 86.05 | $ 63.98 |
| Income (Loss) From Operations | |||||
| Net investment income(1) | $ 0.68 | $ 0.50 | $ 0.27 | $ 0.42 | $ 0.44 |
| Net realized and unrealized gain (loss) | 49.88 | (48.48) | 31.85 | 40.48 | 24.00 |
| Total income (loss) from operations | $ 50.56 | $ (47.98) | $ 32.12 | $ 40.90 | $ 24.44 |
| Less Distributions | |||||
| From net investment income | $ (0.41) | $ (0.21) | $ (0.39) | $ (0.49) | $ (0.41) |
| From net realized gain | — | (5.49) | (7.70) | (3.79) | (1.96) |
| Total distributions | $ (0.41) | $ (5.70) | $ (8.09) | $ (4.28) | $ (2.37) |
| Net asset value — End of year | $ 143.17 | $ 93.02 | $ 146.70 | $ 122.67 | $ 86.05 |
| Total Return(2) | 54.40% | (32.64)% | 26.87% | 48.22% | 38.77% |
| Ratios/Supplemental Data | |||||
| Net assets, end of year (000’s omitted) | $268,239 | $184,733 | $287,931 | $237,710 | $176,210 |
| Ratios (as a percentage of average daily net assets):(3) | |||||
| Total expenses | 0.60% | 0.60% | 0.59% | 0.60% | 0.59% |
| Net expenses | 0.48% (4) | 0.48% (4) | 0.48% | 0.48% | 0.48% |
| Net investment income | 0.56% | 0.44% | 0.20% | 0.42% | 0.58% |
| Portfolio Turnover | 21% | 7% | 8% | 12% | 8% |
| (1) | Computed using average shares outstanding. |
| (2) | Returns are historical and are calculated by determining the percentage change in net asset value with all distributions reinvested and do not reflect fees and expenses imposed by variable annuity contracts or variable life insurance policies. If included, total return would be lower. |
| (3) | Total expenses do not reflect amounts reimbursed and/or waived by the adviser and certain of its affiliates, if applicable. Net expenses are net of all reductions and represent the net expenses paid by the Fund. |
| (4) | Includes a reduction by the investment adviser of a portion of its advisory fee due to the Fund’s investment in the Liquidity Fund (equal to less than 0.005% of average daily net assets for the years ended December 31, 2023 and 2022). |
| Class F | |||||
| Year Ended December 31, | |||||
| 2023 | 2022 | 2021 | 2020 | 2019 | |
| Net asset value — Beginning of year | $ 90.97 | $144.01 | $ 120.85 | $ 85.03 | $ 63.40 |
| Income (Loss) From Operations | |||||
| Net investment income (loss)(1) | $ 0.39 | $ 0.23 | $ (0.07) | $ 0.16 | $ 0.25 |
| Net realized and unrealized gain (loss) | 48.71 | (47.57) | 31.32 | 39.94 | 23.75 |
| Total income (loss) from operations | $ 49.10 | $ (47.34) | $ 31.25 | $ 40.10 | $24.00 |
| Less Distributions | |||||
| From net investment income | $ (0.41) | $ (0.21) | $ (0.39) | $ (0.49) | $ (0.41) |
| From net realized gain | — | (5.49) | (7.70) | (3.79) | (1.96) |
| Total distributions | $ (0.41) | $ (5.70) | $ (8.09) | $ (4.28) | $ (2.37) |
| Net asset value — End of year | $ 139.66 | $ 90.97 | $144.01 | $120.85 | $85.03 |
| Total Return(2) | 54.02% | (32.81)% | 26.55% | 47.86% | 38.44% |
| Ratios/Supplemental Data | |||||
| Net assets, end of year (000’s omitted) | $109,905 | $51,262 | $ 52,753 | $ 23,099 | $ 5,669 |
| Ratios (as a percentage of average daily net assets):(3) | |||||
| Total expenses | 0.85% | 0.85% | 0.84% | 0.85% | 0.84% |
| Net expenses | 0.73% (4) | 0.73% (4) | 0.73% | 0.73% | 0.73% |
| Net investment income (loss) | 0.32% | 0.21% | (0.05)% | 0.16% | 0.32% |
| Portfolio Turnover | 21% | 7% | 8% | 12% | 8% |
| (1) | Computed using average shares outstanding. |
| (2) | Returns are historical and are calculated by determining the percentage change in net asset value with all distributions reinvested and do not reflect fees and expenses imposed by variable annuity contracts or variable life insurance policies. If included, total return would be lower. |
| (3) | Total expenses do not reflect amounts reimbursed and/or waived by the adviser and certain of its affiliates, if applicable. Net expenses are net of all reductions and represent the net expenses paid by the Fund. |
| (4) | Includes a reduction by the investment adviser of a portion of its advisory fee due to the Fund’s investment in the Liquidity Fund (equal to less than 0.005% of average daily net assets for the years ended December 31, 2023 and 2022). |
| Asset Description | Level 1 | Level 2 | Level 3 | Total |
| Common Stocks | $ 364,724,995(1) | $ — | $ — | $ 364,724,995 |
| Exchange-Traded Funds | 2,047,600 | — | — | 2,047,600 |
| Short-Term Investments: | ||||
| Affiliated Fund | 10,247,792 | — | — | 10,247,792 |
| Securities Lending Collateral | 2,389,135 | — | — | 2,389,135 |
| U.S. Treasury Obligations | — | 964,069 | — | 964,069 |
| Total Investments | $379,409,522 | $964,069 | $ — | $380,373,591 |
| Futures Contracts | $ 332,095 | $ — | $ — | $ 332,095 |
| Total | $379,741,617 | $964,069 | $ — | $380,705,686 |
| (1) | The level classification by major category of investments is the same as the category presentation in the Schedule of Investments. |
| Year Ended December 31, | ||
| 2023 | 2022 | |
| Ordinary income | $1,070,342 | $ 2,001,665 |
| Long-term capital gains | $ — | $11,409,017 |
| Undistributed ordinary income | $ 5,554,051 |
| Undistributed long-term capital gains | 26,677,234 |
| Net unrealized appreciation | 226,675,823 |
| Distributable earnings | $258,907,108 |
| Aggregate cost | $153,697,768 |
| Gross unrealized appreciation | $ 229,964,684 |
| Gross unrealized depreciation | (3,288,861) |
| Net unrealized appreciation | $226,675,823 |
| Derivative | Statement of Assets and Liabilities Caption | Assets | Liabilities | |
| Futures contracts | Distributable earnings | $332,095 (1) | $ — | |
| (1) | Only the current day’s variation margin is reported within the Statement of Assets and Liabilities as Receivable or Payable for variation margin on open futures contracts, as applicable. |
| Statement of Operations Caption | |||
| Derivative | Net realized gain (loss): Futures contracts | Change in unrealized appreciation (depreciation): Futures contracts | |
| Futures contracts | $ 1,847,375 | $ 464,315 | |
| Remaining Contractual Maturity of the Transactions | |||||
| Overnight and Continuous | <30 days | 30 to 90 days | >90 days | Total | |
| Common Stocks | $ 1,364,525 | $ — | $ — | $ — | $ 1,364,525 |
| Exchange-Traded Funds | 1,024,610 | — | — | — | 1,024,610 |
| Total | $2,389,135 | $ — | $ — | $ — | $2,389,135 |
| Name | Value, beginning of period | Purchases | Sales proceeds | Net realized gain (loss) | Change in unrealized appreciation (depreciation) | Value, end of period | Dividend income | Shares, end of period |
| Short-Term Investments | ||||||||
| Liquidity Fund | $2,444,037 | $31,831,730 | $(24,027,975) | $ — | $ — | $10,247,792 | $246,266 | 10,247,792 |
| Year Ended December 31, 2023 | Year Ended December 31, 2022 | ||||
| Shares | Amount | Shares | Amount | ||
| Class I | |||||
| Shares sold | 142,178 | $ 17,236,272 | 131,475 | $ 14,786,625 | |
| Reinvestment of distributions | 5,950 | 771,064 | 116,116 | 10,636,246 | |
| Shares redeemed | (260,459) | (31,617,636) | (224,430) | (25,582,921) | |
| Net increase (decrease) | (112,331) | $(13,610,300) | 23,161 | $ (160,050) | |
| Class F | |||||
| Shares sold | 259,406 | $ 30,494,914 | 177,717 | $ 19,243,996 | |
| Reinvestment of distributions | 2,366 | 299,278 | 30,954 | 2,774,436 | |
| Shares redeemed | (38,289) | (4,218,894) | (11,504) | (1,261,293) | |
| Net increase | 223,483 | $ 26,575,298 | 197,167 | $ 20,757,139 | |
Boston, Massachusetts
February 16, 2024
| Name and Year of Birth | Corporation Position(s) | Length of Service | Principal Occupation(s) and Other Directorships During Past Five Years and Other Relevant Experience |
| Interested Director | |||
| Von M. Hughes(1) 1969 | Director and President | Since 2023 | President and Chief Executive Officer and Managing Director of Calvert Research and Management. Managing Director of Morgan Stanley Investment Management (MSIM) (since 2022). Formerly, Managing Director of PAAMCO Prisma (investment management firm) (2003-2022). Mr. Hughes is an interested person because of his positions with CRM and certain affiliates. Other Directorships. Tradeweb Markets Inc. (financial services) (2021-2022); National Association of Investment Companies (2018-2021). |
| Noninterested Directors | |||
| Alice Gresham Bullock 1950 | Chair and Director | Since 2016 (Chair); Since 2008 (Director) | Professor Emerita at Howard University School of Law. Dean Emerita of Howard University School of Law and Deputy Director of the Association of American Law Schools (1992-1994). Other Directorships. None. |
| Cari M. Dominguez 1949 | Director | Since 2016 | Former Chair of the U.S. Equal Employment Opportunity Commission. Other Directorships. ManpowerGroup Inc. (workforce solutions company); Triple S Management Corporation (managed care); National Association of Corporate Directors. |
| Karen Fang(2) 1958 | Director | Since 2023 | Formerly, Managing Director, Wealth Management at GAMCO Asset Management (asset management firm) (2020-2023). Formerly, Managing Director, Senior Portfolio Manager of Fiduciary Trust Company International (wealth management firm) (1993-2019). Other Directorships. None. |
| Miles D. Harper, III 1962 | Director | Since 2016 | Private investor (2022-present). Formerly, Partner, Carr Riggs & Ingram (public accounting firm) (2014-2022). Partner, Gainer Donnelly & Desroches (public accounting firm) (now Carr Riggs & Ingram) (1999-2014). Other Directorships. Bridgeway Funds (9) (asset management). |
| Joy V. Jones 1950 | Director | Since 2016 | Attorney. Other Directorships. Palm Management Corporation. |
| Eddie Ramos(2) 1967 | Director | Since 2023 | Private investor (2022-present). Formerly, Head of External Advisors/Diversity Portfolio Management at the New Jersey Division of Investment (2020-2022). Formerly, Chief Investment Officer and Lead Portfolio Manager – Global Fundamental Equities at Cornerstone Capital Management (asset management firm) (2011-2017). Other Directorships. Macquarie Optimum Funds (6) (asset management) (2022-2023). |
| Name and Year of Birth | Corporation Position(s) | Length of Service | Principal Occupation(s) and Other Directorships During Past Five Years and Other Relevant Experience |
| Noninterested Directors (continued) | |||
| Anthony A. Williams 1951 | Director | Since 2016 | CEO and Executive Director of the Federal City Council (July 2012 to present); Senior Adviser and Independent Consultant for King and Spalding LLP (September 2015 to present); Executive Director of Global Government Practice at the Corporate Executive Board (January 2010 to January 2012). Other Directorships. Freddie Mac; Evoq Properties/Meruelo Maddux Properties, Inc. (real estate management); Weston Solutions, Inc. (environmental services); Bipartisan Policy Center’s Debt Reduction Task Force; Chesapeake Bay Foundation; Catholic University of America; Urban Institute (research organization); The Howard Hughes Corporation (real estate development); Old Dominion National Bank. |
| Name and Year of Birth | Corporation Position(s) | Length of Service | Principal Occupation(s) During Past Five Years |
| Principal Officers who are not Directors | |||
| Hope L. Brown 1973 | Chief Compliance Officer | Since 2014 | Chief Compliance Officer of 46 registered investment companies advised by CRM (since 2014). Vice President and Chief Compliance Officer, Wilmington Funds (2012-2014). |
| Deidre E. Walsh 1971 | Secretary, Vice President and Chief Legal Officer | Since 2021 | Vice President of CRM and officer of 46 registered investment companies advised by CRM (since 2021). Also Vice President of Eaton Vance and certain of its affiliates and officer of 127 registered investment companies advised or administered by Eaton Vance. |
| James F. Kirchner 1967 | Treasurer | Since 2016 | Vice President of CRM and officer of 46 registered investment companies advised by CRM (since 2016). Also Vice President of Eaton Vance and certain of its affiliates and officer of 127 registered investment companies advised or administered by Eaton Vance. |
| (1) Mr. Hughes is an interested person of the Fund because of his positions with the Fund’s adviser and certain affiliates. | |||
| (2) Ms. Fang and Mr. Ramos began serving as Directors effective October 30, 2023. | |||
| Privacy Notice | April 2021 |
| FACTS | WHAT DOES EATON VANCE DO WITH YOUR PERSONAL INFORMATION? |
| Why? | Financial companies choose how they share your personal information. Federal law gives consumers the right to limit some but not all sharing. Federal law also requires us to tell you how we collect, share, and protect your personal information. Please read this notice carefully to understand what we do. |
| What? | The types of personal information we collect and share depend on the product or service you have with us. This information can include:■ Social Security number and income ■ investment experience and risk tolerance ■ checking account number and wire transfer instructions |
| How? | All financial companies need to share customers’ personal information to run their everyday business. In the section below, we list the reasons financial companies can share their customers’ personal information; the reasons Eaton Vance chooses to share; and whether you can limit this sharing. |
| Reasons we can share your personal information | Does Eaton Vance share? | Can you limit this sharing? |
| For our everyday business purposes — such as to process your transactions, maintain your account(s), respond to court orders and legal investigations, or report to credit bureaus | Yes | No |
| For our marketing purposes — to offer our products and services to you | Yes | No |
| For joint marketing with other financial companies | No | We don’t share |
| For our investment management affiliates’ everyday business purposes — information about your transactions, experiences, and creditworthiness | Yes | Yes |
| For our affiliates’ everyday business purposes — information about your transactions and experiences | Yes | No |
| For our affiliates’ everyday business purposes — information about your creditworthiness | No | We don’t share |
| For our investment management affiliates to market to you | Yes | Yes |
| For our affiliates to market to you | No | We don’t share |
| For nonaffiliates to market to you | No | We don’t share |
| To limit our sharing | Call toll-free 1-800-368-2745 or email: CRMPrivacy@calvert.comPlease note:If you are a new customer, we can begin sharing your information 30 days from the date we sent this notice. When you are no longer our customer, we continue to share your information as described in this notice. However, you can contact us at any time to limit our sharing. |
| Questions? | Call toll-free 1-800-368-2745 or email: CRMPrivacy@calvert.com |
| Privacy Notice — continued | April 2021 |
| Who we are | |
| Who is providing this notice? | Eaton Vance Management, Eaton Vance Distributors, Inc., Eaton Vance Trust Company, Eaton Vance Management (International) Limited, Eaton Vance Advisers International Ltd., Eaton Vance Global Advisors Limited, Eaton Vance Management’s Real Estate Investment Group, Boston Management and Research, Calvert Research and Management, Eaton Vance and Calvert Fund Families and our investment advisory affiliates (“Eaton Vance”) (see Investment Management Affiliates definition below) |
| What we do | |
| How does Eaton Vance protect my personal information? | To protect your personal information from unauthorized access and use, we use security measures that comply with federal law. These measures include computer safeguards and secured files and buildings. We have policies governing the proper handling of customer information by personnel and requiring third parties that provide support to adhere to appropriate security standards with respect to such information. |
| How does Eaton Vance collect my personal information? | We collect your personal information, for example, when you■ open an account or make deposits or withdrawals from your account ■ buy securities from us or make a wire transfer ■ give us your contact informationWe also collect your personal information from others, such as credit bureaus, affiliates, or other companies. |
| Why can’t I limit all sharing? | Federal law gives you the right to limit only■ sharing for affiliates’ everyday business purposes — information about your creditworthiness ■ affiliates from using your information to market to you ■ sharing for nonaffiliates to market to youState laws and individual companies may give you additional rights to limit sharing. See below for more on your rights under state law. |
| Definitions | |
| Investment Management Affiliates | Eaton Vance Investment Management Affiliates include registered investment advisers, registered broker- dealers, and registered and unregistered funds. Investment Management Affiliates does not include entities associated with Morgan Stanley Wealth Management, such as Morgan Stanley Smith Barney LLC and Morgan Stanley & Co. |
| Affiliates | Companies related by common ownership or control. They can be financial and nonfinancial companies.■ Our affiliates include companies with a Morgan Stanley name and financial companies such as Morgan Stanley Smith Barney LLC and Morgan Stanley & Co. |
| Nonaffiliates | Companies not related by common ownership or control. They can be financial and nonfinancial companies.■ Eaton Vance does not share with nonaffiliates so they can market to you. |
| Joint marketing | A formal agreement between nonaffiliated financial companies that together market financial products or services to you.■ Eaton Vance doesn’t jointly market. |
| Other important information | |
| Vermont: Except as permitted by law, we will not share personal information we collect about Vermont residents with Nonaffiliates unless you provide us with your written consent to share such information.California: Except as permitted by law, we will not share personal information we collect about California residents with Nonaffiliates and we will limit sharing such personal information with our Affiliates to comply with California privacy laws that apply to us. | |


| % Average Annual Total Returns1,2 | Inception Date | Performance Inception Date | One Year | Five Years | Ten Years |
| Fund at NAV | 12/29/1995 | 12/29/1995 | 25.92% | 15.38% | 11.68% |
| S&P 500® Index | — | — | 26.29% | 15.68% | 12.03% |
| % Total Annual Operating Expense Ratios3 | |
| Gross | 0.43% |
| Net | 0.28 |

| Sector Allocation (% of net assets)1 |

| Top 10 Holdings (% of net assets)1 | |
| Apple, Inc. | 6.8% |
| Microsoft Corp. | 6.7 |
| Amazon.com, Inc. | 3.3 |
| NVIDIA Corp. | 2.9 |
| Alphabet, Inc., Class A | 2.0 |
| Meta Platforms, Inc., Class A | 1.9 |
| Alphabet, Inc., Class C | 1.7 |
| Tesla, Inc. | 1.7 |
| Berkshire Hathaway, Inc., Class B | 1.6 |
| SPDR S&P 500 ETF Trust | 1.2 |
| Total | 29.8% |
| 1 | Excludes cash and cash equivalents. |
| † | The views expressed in this report are those of the portfolio manager(s) and are current only through the date stated at the top of this page. These views are subject to change at any time based upon market or other conditions, and Calvert and the Fund(s) disclaim any responsibility to update such views. These views may not be relied upon as investment advice and, because investment decisions are based on many factors, may not be relied upon as an indication of trading intent on behalf of any Calvert fund. This commentary may contain statements that are not historical facts, referred to as “forward-looking statements.” The Fund’s actual future results may differ significantly from those stated in any forward-looking statement, depending on factors such as changes in securities or financial markets or general economic conditions, the volume of sales and purchases of Fund shares, the continuation of investment advisory, administrative and service contracts, and other risks discussed from time to time in the Fund’s filings with the Securities and Exchange Commission. |
| 1 | S&P 500® Index is an unmanaged index of large-cap stocks commonly used as a measure of U.S. stock market performance. S&P Dow Jones Indices are a product of S&P Dow Jones Indices LLC (“S&P DJI”) and have been licensed for use. S&P® and S&P 500® are registered trademarks of S&P DJI; Dow Jones® is a registered trademark of Dow Jones Trademark Holdings LLC (“Dow Jones”); S&P DJI, Dow Jones and their respective affiliates do not sponsor, endorse, sell or promote the Fund, will not have any liability with respect thereto and do not have any liability for any errors, omissions, or interruptions of the S&P Dow Jones Indices. Unless otherwise stated, index returns do not reflect the effect of any applicable sales charges, commissions, expenses, taxes or leverage, as applicable. It is not possible to invest directly in an index. |
| 2 | There is no sales charge. Insurance-related charges are not included in the calculation of returns. If such charges were reflected, the returns would be lower. Please refer to the report for your insurance contract for performance data reflecting insurance-related charges.Calvert Research and Management became the investment adviser to the Fund on December 31, 2016. Performance reflected prior to such date is that of the Fund’s former investment adviser. |
| 3 | Source: Fund prospectus. Net expense ratio reflects a contractual expense reimbursement that continues through 4/30/24. The expense ratios for the current reporting period can be found in the Financial Highlights section of this report. Performance reflects expenses waived and/or reimbursed, if applicable. Without such waivers and/or reimbursements, performance would have been lower. |
| Additional Information | |
| Dow Jones Industrial Average® is a price-weighted average of 30 blue-chip stocks that are generally the leaders in their industry. Nasdaq Composite Index is a market capitalization-weighted index of all domestic and international securities listed on Nasdaq. Source: Nasdaq, Inc. The information is provided by Nasdaq (with its affiliates, are referred to as the “Corporations”) and Nasdaq’s third party licensors on an “as is” basis and the Corporations make no guarantees and bear no liability of any kind with respect to the information or the Fund. Russell 2000® Index is an unmanaged index of 2,000 U.S. small-cap stocks. |
| Beginning Account Value (7/1/23) | Ending Account Value (12/31/23) | Expenses Paid During Period* (7/1/23 – 12/31/23) | Annualized Expense Ratio | |
| Actual | ||||
| $1,000.00 | $1,078.80 | $1.47 ** | 0.28% | |
| Hypothetical | ||||
| (5% return per year before expenses) | ||||
| $1,000.00 | $1,023.79 | $1.43 ** | 0.28% |
| * | Expenses are equal to the Fund's annualized expense ratio, multiplied by the average account value over the period, multiplied by 184/365 (to reflect the one-half year period). The Example assumes that the $1,000 was invested at the net asset value per share determined at the close of business on June 30, 2023. Expenses shown do not include insurance-related charges or direct expenses of Qualified Plans. |
| ** | Absent a waiver and/or reimbursement of expenses by affiliate(s), expenses would be higher. |
| Common Stocks — 96.1% |
| Security | Shares | Value | |
| Aerospace & Defense — 1.6% | |||
| Axon Enterprise, Inc.(1) | 830 | $ 214,414 | |
| Boeing Co. (The)(1) | 6,319 | 1,647,111 | |
| General Dynamics Corp. | 2,517 | 653,589 | |
| Howmet Aerospace, Inc. | 4,444 | 240,509 | |
| Huntington Ingalls Industries, Inc. | 492 | 127,743 | |
| L3Harris Technologies, Inc. | 2,106 | 443,566 | |
| Lockheed Martin Corp. | 2,454 | 1,112,251 | |
| Northrop Grumman Corp. | 1,575 | 737,320 | |
| RTX Corp. | 15,978 | 1,344,389 | |
| Textron, Inc. | 2,178 | 175,155 | |
| TransDigm Group, Inc. | 615 | 622,134 | |
| $ 7,318,181 | |||
| Air Freight & Logistics — 0.5% | |||
| C.H. Robinson Worldwide, Inc. | 1,421 | $ 122,760 | |
| Expeditors International of Washington, Inc. | 1,616 | 205,555 | |
| FedEx Corp. | 2,570 | 650,133 | |
| United Parcel Service, Inc., Class B | 8,037 | 1,263,658 | |
| $ 2,242,106 | |||
| Automobile Components — 0.1% | |||
| Aptiv PLC(1) | 3,143 | $ 281,990 | |
| BorgWarner, Inc. | 2,948 | 105,686 | |
| $ 387,676 | |||
| Automobiles — 1.9% | |||
| Ford Motor Co. | 43,695 | $ 532,642 | |
| General Motors Co. | 15,218 | 546,630 | |
| Tesla, Inc.(1) | 30,843 | 7,663,869 | |
| $ 8,743,141 | |||
| Banks — 3.1% | |||
| Bank of America Corp. | 76,507 | $ 2,575,991 | |
| Citigroup, Inc. | 21,268 | 1,094,026 | |
| Citizens Financial Group, Inc. | 5,451 | 180,646 | |
| Comerica, Inc. | 1,465 | 81,762 | |
| Fifth Third Bancorp | 7,858 | 271,022 | |
| Huntington Bancshares, Inc. | 16,091 | 204,677 | |
| JPMorgan Chase & Co. | 32,258 | 5,487,086 | |
| KeyCorp | 11,262 | 162,173 | |
| M&T Bank Corp. | 1,915 | 262,508 | |
| PNC Financial Services Group, Inc. (The) | 4,426 | 685,366 | |
| Regions Financial Corp. | 10,335 | 200,292 | |
| Truist Financial Corp. | 14,820 | 547,154 | |
| U.S. Bancorp | 17,302 | 748,831 | |
| Wells Fargo & Co. | 40,356 | 1,986,322 | |
| Zions Bancorp N.A. | 1,934 | 84,845 | |
| $ 14,572,701 | |||
| Security | Shares | Value | |
| Beverages — 1.4% | |||
| Brown-Forman Corp., Class B | 2,191 | $ 125,106 | |
| Coca-Cola Co. (The) | 43,239 | 2,548,074 | |
| Constellation Brands, Inc., Class A | 1,796 | 434,183 | |
| Keurig Dr Pepper, Inc. | 11,188 | 372,784 | |
| Molson Coors Beverage Co., Class B | 2,058 | 125,970 | |
| Monster Beverage Corp.(1) | 8,209 | 472,921 | |
| PepsiCo, Inc. | 15,278 | 2,594,816 | |
| $ 6,673,854 | |||
| Biotechnology — 1.9% | |||
| AbbVie, Inc. | 19,705 | $ 3,053,684 | |
| Amgen, Inc. | 5,947 | 1,712,855 | |
| Biogen, Inc.(1) | 1,610 | 416,620 | |
| Gilead Sciences, Inc. | 13,846 | 1,121,664 | |
| Incyte Corp.(1) | 2,229 | 139,959 | |
| Moderna, Inc.(1) | 3,821 | 379,998 | |
| Regeneron Pharmaceuticals, Inc.(1) | 1,190 | 1,045,165 | |
| Vertex Pharmaceuticals, Inc.(1) | 2,863 | 1,164,926 | |
| $ 9,034,871 | |||
| Broadline Retail — 3.4% | |||
| Amazon.com, Inc.(1) | 101,415 | $ 15,408,995 | |
| eBay, Inc. | 5,767 | 251,556 | |
| Etsy, Inc.(1) | 1,432 | 116,064 | |
| $ 15,776,615 | |||
| Building Products — 0.5% | |||
| A.O. Smith Corp. | 1,365 | $ 112,531 | |
| Allegion PLC | 981 | 124,283 | |
| Builders FirstSource, Inc.(1) | 1,371 | 228,875 | |
| Carrier Global Corp. | 9,324 | 535,664 | |
| Johnson Controls International PLC | 7,560 | 435,758 | |
| Masco Corp. | 2,495 | 167,115 | |
| Trane Technologies PLC | 2,538 | 619,018 | |
| $ 2,223,244 | |||
| Capital Markets — 2.9% | |||
| Ameriprise Financial, Inc. | 1,125 | $ 427,309 | |
| Bank of New York Mellon Corp. (The) | 8,546 | 444,819 | |
| BlackRock, Inc. | 1,554 | 1,261,537 | |
| Blackstone, Inc. | 7,896 | 1,033,744 | |
| Cboe Global Markets, Inc. | 1,218 | 217,486 | |
| Charles Schwab Corp. (The) | 16,537 | 1,137,746 | |
| CME Group, Inc. | 4,000 | 842,400 | |
| FactSet Research Systems, Inc. | 422 | 201,315 | |
| Franklin Resources, Inc. | 3,133 | 93,332 | |
| Goldman Sachs Group, Inc. (The) | 3,624 | 1,398,031 | |
| Intercontinental Exchange, Inc. | 6,360 | 816,815 | |
| Invesco, Ltd. | 5,598 | 99,868 | |
| MarketAxess Holdings, Inc. | 454 | 132,954 | |
| Security | Shares | Value | |
| Capital Markets (continued) | |||
| Moody's Corp. | 1,749 | $ 683,090 | |
| Morgan Stanley(2) | 14,044 | 1,309,603 | |
| MSCI, Inc. | 879 | 497,206 | |
| Nasdaq, Inc. | 3,799 | 220,874 | |
| Northern Trust Corp. | 2,389 | 201,584 | |
| Raymond James Financial, Inc. | 2,169 | 241,844 | |
| S&P Global, Inc. | 3,600 | 1,585,872 | |
| State Street Corp. | 3,429 | 265,610 | |
| T. Rowe Price Group, Inc. | 2,589 | 278,809 | |
| $ 13,391,848 | |||
| Chemicals — 1.5% | |||
| Air Products & Chemicals, Inc. | 2,469 | $ 676,012 | |
| Albemarle Corp. | 1,304 | 188,402 | |
| Celanese Corp. | 1,113 | 172,927 | |
| CF Industries Holdings, Inc. | 2,227 | 177,047 | |
| Corteva, Inc. | 7,831 | 375,262 | |
| Dow, Inc. | 7,794 | 427,423 | |
| DuPont de Nemours, Inc. | 4,779 | 367,648 | |
| Eastman Chemical Co. | 1,448 | 130,059 | |
| Ecolab, Inc. | 2,820 | 559,347 | |
| FMC Corp. | 1,386 | 87,387 | |
| International Flavors & Fragrances, Inc. | 2,837 | 229,712 | |
| Linde PLC | 5,388 | 2,212,906 | |
| LyondellBasell Industries NV, Class A | 2,956 | 281,056 | |
| Mosaic Co. (The) | 3,835 | 137,025 | |
| PPG Industries, Inc. | 2,620 | 391,821 | |
| Sherwin-Williams Co. (The) | 2,617 | 816,242 | |
| $ 7,230,276 | |||
| Commercial Services & Supplies — 0.5% | |||
| Cintas Corp. | 962 | $ 579,759 | |
| Copart, Inc.(1) | 9,710 | 475,790 | |
| Republic Services, Inc. | 2,273 | 374,840 | |
| Rollins, Inc. | 3,270 | 142,801 | |
| Veralto Corp. | 2,546 | 209,434 | |
| Waste Management, Inc. | 4,073 | 729,474 | |
| $ 2,512,098 | |||
| Communications Equipment — 0.8% | |||
| Arista Networks, Inc.(1) | 2,800 | $ 659,428 | |
| Cisco Systems, Inc. | 45,011 | 2,273,956 | |
| F5, Inc.(1) | 733 | 131,192 | |
| Juniper Networks, Inc. | 3,970 | 117,036 | |
| Motorola Solutions, Inc. | 1,844 | 577,338 | |
| $ 3,758,950 | |||
| Construction & Engineering — 0.1% | |||
| Quanta Services, Inc. | 1,614 | $ 348,301 | |
| $ 348,301 | |||
| Security | Shares | Value | |
| Construction Materials — 0.1% | |||
| Martin Marietta Materials, Inc. | 713 | $ 355,723 | |
| Vulcan Materials Co. | 1,533 | 348,006 | |
| $ 703,729 | |||
| Consumer Finance — 0.5% | |||
| American Express Co. | 6,397 | $ 1,198,414 | |
| Capital One Financial Corp. | 4,232 | 554,900 | |
| Discover Financial Services | 2,779 | 312,359 | |
| Synchrony Financial | 4,826 | 184,305 | |
| $ 2,249,978 | |||
| Consumer Staples Distribution & Retail — 1.7% | |||
| Costco Wholesale Corp. | 4,942 | $ 3,262,115 | |
| Dollar General Corp. | 2,439 | 331,582 | |
| Dollar Tree, Inc.(1) | 2,323 | 329,982 | |
| Kroger Co. (The) | 7,354 | 336,151 | |
| Sysco Corp. | 5,603 | 409,748 | |
| Target Corp. | 5,129 | 730,472 | |
| Walgreens Boots Alliance, Inc. | 7,968 | 208,045 | |
| Walmart, Inc. | 15,852 | 2,499,068 | |
| $ 8,107,163 | |||
| Containers & Packaging — 0.2% | |||
| Amcor PLC | 16,061 | $ 154,828 | |
| Avery Dennison Corp. | 958 | 193,669 | |
| Ball Corp. | 3,636 | 209,143 | |
| International Paper Co. | 3,993 | 144,347 | |
| Packaging Corp. of America | 996 | 162,258 | |
| WestRock Co. | 2,849 | 118,291 | |
| $ 982,536 | |||
| Distributors — 0.1% | |||
| Genuine Parts Co. | 1,621 | $ 224,509 | |
| LKQ Corp. | 3,246 | 155,126 | |
| Pool Corp. | 430 | 171,445 | |
| $ 551,080 | |||
| Diversified Telecommunication Services — 0.7% | |||
| AT&T, Inc. | 79,453 | $ 1,333,221 | |
| Verizon Communications, Inc. | 46,717 | 1,761,231 | |
| $ 3,094,452 | |||
| Electric Utilities — 1.5% | |||
| Alliant Energy Corp. | 2,836 | $ 145,487 | |
| American Electric Power Co., Inc. | 5,946 | 482,934 | |
| Constellation Energy Corp. | 3,549 | 414,843 | |
| Duke Energy Corp. | 8,564 | 831,051 | |
| Edison International | 4,259 | 304,476 | |
| Entergy Corp. | 2,350 | 237,796 | |
| Evergy, Inc. | 2,553 | 133,267 | |
| Security | Shares | Value | |
| Electric Utilities (continued) | |||
| Eversource Energy | 4,029 | $ 248,670 | |
| Exelon Corp. | 11,062 | 397,126 | |
| FirstEnergy Corp. | 5,955 | 218,310 | |
| NextEra Energy, Inc. | 22,799 | 1,384,811 | |
| NRG Energy, Inc. | 2,509 | 129,715 | |
| PG&E Corp. | 24,135 | 435,154 | |
| Pinnacle West Capital Corp. | 1,343 | 96,481 | |
| PPL Corp. | 8,507 | 230,540 | |
| Southern Co. (The) | 12,119 | 849,784 | |
| Xcel Energy, Inc. | 6,132 | 379,632 | |
| $ 6,920,077 | |||
| Electrical Equipment — 0.6% | |||
| AMETEK, Inc. | 2,565 | $ 422,943 | |
| Eaton Corp. PLC | 4,437 | 1,068,518 | |
| Emerson Electric Co. | 6,335 | 616,586 | |
| Generac Holdings, Inc.(1) | 683 | 88,271 | |
| Hubbell, Inc. | 623 | 204,923 | |
| Rockwell Automation, Inc. | 1,274 | 395,552 | |
| $ 2,796,793 | |||
| Electronic Equipment, Instruments & Components — 0.6% | |||
| Amphenol Corp., Class A | 6,649 | $ 659,115 | |
| CDW Corp. | 1,547 | 351,664 | |
| Corning, Inc. | 8,533 | 259,830 | |
| Jabil, Inc. | 1,422 | 181,163 | |
| Keysight Technologies, Inc.(1) | 1,973 | 313,885 | |
| TE Connectivity, Ltd. | 3,453 | 485,147 | |
| Teledyne Technologies, Inc.(1) | 524 | 233,856 | |
| Trimble, Inc.(1) | 2,866 | 152,471 | |
| Zebra Technologies Corp., Class A(1) | 571 | 156,071 | |
| $ 2,793,202 | |||
| Energy Equipment & Services — 0.3% | |||
| Baker Hughes Co. | 11,182 | $ 382,201 | |
| Halliburton Co. | 9,946 | 359,548 | |
| Schlumberger, Ltd. | 15,873 | 826,031 | |
| $ 1,567,780 | |||
| Entertainment — 1.1% | |||
| Electronic Arts, Inc. | 2,720 | $ 372,123 | |
| Live Nation Entertainment, Inc.(1) | 1,577 | 147,607 | |
| Netflix, Inc.(1) | 4,864 | 2,368,185 | |
| Take-Two Interactive Software, Inc.(1) | 1,758 | 282,950 | |
| Walt Disney Co. (The) | 20,333 | 1,835,867 | |
| Warner Bros. Discovery, Inc.(1) | 25,598 | 291,305 | |
| $ 5,298,037 | |||
| Financial Services — 4.0% | |||
| Berkshire Hathaway, Inc., Class B(1) | 20,296 | $ 7,238,771 | |
| Security | Shares | Value | |
| Financial Services (continued) | |||
| Fidelity National Information Services, Inc. | 6,584 | $ 395,501 | |
| Fiserv, Inc.(1) | 6,669 | 885,910 | |
| FleetCor Technologies, Inc.(1) | 802 | 226,653 | |
| Global Payments, Inc. | 2,894 | 367,538 | |
| Jack Henry & Associates, Inc. | 841 | 137,428 | |
| Mastercard, Inc., Class A | 9,240 | 3,940,952 | |
| PayPal Holdings, Inc.(1) | 11,981 | 735,753 | |
| Visa, Inc., Class A | 17,790 | 4,631,627 | |
| $ 18,560,133 | |||
| Food Products — 0.9% | |||
| Archer-Daniels-Midland Co. | 5,927 | $ 428,048 | |
| Bunge Global S.A. | 1,614 | 162,933 | |
| Campbell Soup Co. | 2,478 | 107,124 | |
| Conagra Brands, Inc. | 5,657 | 162,130 | |
| General Mills, Inc. | 6,459 | 420,739 | |
| Hershey Co. (The) | 1,666 | 310,609 | |
| Hormel Foods Corp. | 3,341 | 107,280 | |
| JM Smucker Co. (The) | 1,265 | 159,871 | |
| Kellanova | 2,931 | 163,872 | |
| Kraft Heinz Co. (The) | 9,214 | 340,734 | |
| Lamb Weston Holdings, Inc. | 1,610 | 174,025 | |
| McCormick & Co., Inc. | 2,975 | 203,549 | |
| Mondelez International, Inc., Class A | 15,117 | 1,094,924 | |
| Tyson Foods, Inc., Class A | 3,296 | 177,160 | |
| $ 4,012,998 | |||
| Gas Utilities — 0.0%(3) | |||
| Atmos Energy Corp. | 1,650 | $ 191,235 | |
| $ 191,235 | |||
| Ground Transportation — 1.1% | |||
| CSX Corp. | 21,959 | $ 761,318 | |
| J.B. Hunt Transport Services, Inc. | 905 | 180,765 | |
| Norfolk Southern Corp. | 2,513 | 594,023 | |
| Old Dominion Freight Line, Inc. | 994 | 402,898 | |
| Uber Technologies, Inc.(1) | 22,867 | 1,407,921 | |
| Union Pacific Corp. | 6,774 | 1,663,830 | |
| $ 5,010,755 | |||
| Health Care Equipment & Supplies — 2.5% | |||
| Abbott Laboratories | 19,284 | $ 2,122,590 | |
| Align Technology, Inc.(1) | 792 | 217,008 | |
| Baxter International, Inc. | 5,638 | 217,965 | |
| Becton Dickinson and Co. | 3,224 | 786,108 | |
| Boston Scientific Corp.(1) | 16,271 | 940,627 | |
| Cooper Cos., Inc. (The) | 550 | 208,142 | |
| DENTSPLY SIRONA, Inc. | 2,627 | 93,495 | |
| DexCom, Inc.(1) | 4,293 | 532,718 | |
| Edwards Lifesciences Corp.(1) | 6,740 | 513,925 | |
| Security | Shares | Value | |
| Health Care Equipment & Supplies (continued) | |||
| GE HealthCare Technologies, Inc. | 4,351 | $ 336,419 | |
| Hologic, Inc.(1) | 2,722 | 194,487 | |
| IDEXX Laboratories, Inc.(1) | 923 | 512,311 | |
| Insulet Corp.(1) | 776 | 168,377 | |
| Intuitive Surgical, Inc.(1) | 3,912 | 1,319,752 | |
| Medtronic PLC | 14,785 | 1,217,988 | |
| ResMed, Inc. | 1,635 | 281,253 | |
| STERIS PLC | 1,098 | 241,395 | |
| Stryker Corp. | 3,757 | 1,125,071 | |
| Teleflex, Inc. | 566 | 141,127 | |
| Zimmer Biomet Holdings, Inc. | 2,412 | 293,540 | |
| $ 11,464,298 | |||
| Health Care Providers & Services — 2.7% | |||
| Cardinal Health, Inc. | 2,739 | $ 276,091 | |
| Cencora, Inc. | 1,853 | 380,569 | |
| Centene Corp.(1) | 5,936 | 440,511 | |
| Cigna Group | 3,252 | 973,811 | |
| CVS Health Corp. | 14,273 | 1,126,996 | |
| DaVita, Inc.(1) | 621 | 65,056 | |
| Elevance Health, Inc. | 2,611 | 1,231,243 | |
| HCA Healthcare, Inc. | 2,201 | 595,767 | |
| Henry Schein, Inc.(1) | 1,451 | 109,855 | |
| Humana, Inc. | 1,368 | 626,284 | |
| Laboratory Corp. of America Holdings | 943 | 214,335 | |
| McKesson Corp. | 1,479 | 684,747 | |
| Molina Healthcare, Inc.(1) | 648 | 234,129 | |
| Quest Diagnostics, Inc. | 1,249 | 172,212 | |
| UnitedHealth Group, Inc. | 10,315 | 5,430,538 | |
| Universal Health Services, Inc., Class B | 722 | 110,062 | |
| $ 12,672,206 | |||
| Health Care REITs — 0.2% | |||
| Healthpeak Properties, Inc. | 6,079 | $ 120,364 | |
| Ventas, Inc. | 4,471 | 222,835 | |
| Welltower, Inc. | 6,150 | 554,545 | |
| $ 897,744 | |||
| Hotel & Resort REITs — 0.0%(3) | |||
| Host Hotels & Resorts, Inc. | 8,213 | $ 159,907 | |
| $ 159,907 | |||
| Hotels, Restaurants & Leisure — 2.1% | |||
| Airbnb, Inc., Class A(1) | 4,831 | $ 657,692 | |
| Booking Holdings, Inc.(1) | 388 | 1,376,321 | |
| Caesars Entertainment, Inc.(1) | 2,622 | 122,919 | |
| Carnival Corp.(1) | 11,196 | 207,574 | |
| Chipotle Mexican Grill, Inc.(1) | 305 | 697,523 | |
| Darden Restaurants, Inc. | 1,337 | 219,669 | |
| Domino's Pizza, Inc. | 405 | 166,953 | |
| Security | Shares | Value | |
| Hotels, Restaurants & Leisure (continued) | |||
| Expedia Group, Inc.(1) | 1,482 | $ 224,953 | |
| Hilton Worldwide Holdings, Inc. | 2,850 | 518,957 | |
| Las Vegas Sands Corp. | 4,044 | 199,005 | |
| Marriott International, Inc., Class A | 2,741 | 618,123 | |
| McDonald's Corp. | 8,060 | 2,389,871 | |
| MGM Resorts International(1) | 3,240 | 144,763 | |
| Norwegian Cruise Line Holdings, Ltd.(1)(4) | 5,240 | 105,010 | |
| Royal Caribbean Cruises, Ltd.(1) | 2,700 | 349,623 | |
| Starbucks Corp. | 12,697 | 1,219,039 | |
| Wynn Resorts, Ltd. | 1,118 | 101,861 | |
| Yum! Brands, Inc. | 3,115 | 407,006 | |
| $ 9,726,862 | |||
| Household Durables — 0.4% | |||
| D.R. Horton, Inc. | 3,349 | $ 508,981 | |
| Garmin, Ltd. | 1,701 | 218,647 | |
| Lennar Corp., Class A | 2,780 | 414,331 | |
| Mohawk Industries, Inc.(1) | 700 | 72,450 | |
| NVR, Inc.(1) | 36 | 252,016 | |
| PulteGroup, Inc. | 2,396 | 247,315 | |
| Whirlpool Corp. | 671 | 81,708 | |
| $ 1,795,448 | |||
| Household Products — 1.2% | |||
| Church & Dwight Co., Inc. | 2,840 | $ 268,550 | |
| Clorox Co. (The) | 1,466 | 209,037 | |
| Colgate-Palmolive Co. | 9,150 | 729,347 | |
| Kimberly-Clark Corp. | 3,755 | 456,270 | |
| Procter & Gamble Co. (The) | 26,305 | 3,854,735 | |
| $ 5,517,939 | |||
| Independent Power and Renewable Electricity Producers — 0.0%(3) | |||
| AES Corp. (The) | 7,441 | $ 143,239 | |
| $ 143,239 | |||
| Industrial Conglomerates — 0.8% | |||
| 3M Co. | 6,138 | $ 671,006 | |
| General Electric Co. | 12,094 | 1,543,557 | |
| Honeywell International, Inc. | 7,326 | 1,536,336 | |
| $ 3,750,899 | |||
| Industrial REITs — 0.3% | |||
| Prologis, Inc. | 10,267 | $ 1,368,591 | |
| $ 1,368,591 | |||
| Insurance — 2.0% | |||
| Aflac, Inc. | 5,909 | $ 487,492 | |
| Allstate Corp. (The) | 2,908 | 407,062 | |
| American International Group, Inc. | 7,801 | 528,518 | |
| Aon PLC, Class A | 2,225 | 647,519 | |
| Security | Shares | Value | |
| Insurance (continued) | |||
| Arch Capital Group, Ltd.(1) | 4,304 | $ 319,658 | |
| Arthur J. Gallagher & Co. | 2,399 | 539,487 | |
| Assurant, Inc. | 630 | 106,149 | |
| Brown & Brown, Inc. | 2,625 | 186,664 | |
| Chubb, Ltd. | 4,534 | 1,024,684 | |
| Cincinnati Financial Corp. | 1,744 | 180,434 | |
| Everest Group, Ltd. | 482 | 170,426 | |
| Globe Life, Inc. | 952 | 115,877 | |
| Hartford Financial Services Group, Inc. (The) | 3,342 | 268,630 | |
| Loews Corp. | 2,134 | 148,505 | |
| Marsh & McLennan Cos., Inc. | 5,479 | 1,038,106 | |
| MetLife, Inc. | 6,909 | 456,892 | |
| Principal Financial Group, Inc. | 2,566 | 201,867 | |
| Progressive Corp. (The) | 6,501 | 1,035,479 | |
| Prudential Financial, Inc. | 4,012 | 416,085 | |
| Travelers Cos., Inc. (The) | 2,538 | 483,464 | |
| W.R. Berkley Corp. | 2,348 | 166,051 | |
| Willis Towers Watson PLC | 1,147 | 276,656 | |
| $ 9,205,705 | |||
| Interactive Media & Services — 5.6% | |||
| Alphabet, Inc., Class A(1) | 66,017 | $ 9,221,915 | |
| Alphabet, Inc., Class C(1) | 55,610 | 7,837,117 | |
| Match Group, Inc.(1) | 3,020 | 110,230 | |
| Meta Platforms, Inc., Class A(1) | 24,759 | 8,763,696 | |
| $ 25,932,958 | |||
| IT Services — 1.2% | |||
| Accenture PLC, Class A | 6,974 | $ 2,447,246 | |
| Akamai Technologies, Inc.(1) | 1,754 | 207,586 | |
| Cognizant Technology Solutions Corp., Class A | 5,572 | 420,853 | |
| EPAM Systems, Inc.(1) | 641 | 190,595 | |
| Gartner, Inc.(1) | 866 | 390,661 | |
| International Business Machines Corp. | 10,147 | 1,659,542 | |
| VeriSign, Inc.(1) | 987 | 203,283 | |
| $ 5,519,766 | |||
| Leisure Products — 0.0%(3) | |||
| Hasbro, Inc. | 1,505 | $ 76,845 | |
| $ 76,845 | |||
| Life Sciences Tools & Services — 1.4% | |||
| Agilent Technologies, Inc. | 3,251 | $ 451,987 | |
| Bio-Rad Laboratories, Inc., Class A(1) | 241 | 77,817 | |
| Bio-Techne Corp. | 1,757 | 135,570 | |
| Charles River Laboratories International, Inc.(1) | 570 | 134,748 | |
| Danaher Corp. | 7,308 | 1,690,633 | |
| Illumina, Inc.(1) | 1,765 | 245,759 | |
| IQVIA Holdings, Inc.(1) | 2,035 | 470,858 | |
| Mettler-Toledo International, Inc.(1) | 241 | 292,323 | |
| Security | Shares | Value | |
| Life Sciences Tools & Services (continued) | |||
| Revvity, Inc. | 1,371 | $ 149,864 | |
| Thermo Fisher Scientific, Inc. | 4,293 | 2,278,681 | |
| Waters Corp.(1) | 682 | 224,535 | |
| West Pharmaceutical Services, Inc. | 852 | 300,006 | |
| $ 6,452,781 | |||
| Machinery — 1.7% | |||
| Caterpillar, Inc. | 5,669 | $ 1,676,153 | |
| Cummins, Inc. | 1,575 | 377,323 | |
| Deere & Co. | 2,976 | 1,190,013 | |
| Dover Corp. | 1,554 | 239,021 | |
| Fortive Corp. | 4,063 | 299,159 | |
| IDEX Corp. | 896 | 194,531 | |
| Illinois Tool Works, Inc. | 3,043 | 797,083 | |
| Ingersoll Rand, Inc. | 4,498 | 347,875 | |
| Nordson Corp. | 625 | 165,100 | |
| Otis Worldwide Corp. | 4,548 | 406,910 | |
| PACCAR, Inc. | 5,813 | 567,640 | |
| Parker-Hannifin Corp. | 1,428 | 657,880 | |
| Pentair PLC | 1,906 | 138,585 | |
| Snap-on, Inc. | 611 | 176,481 | |
| Stanley Black & Decker, Inc. | 1,704 | 167,162 | |
| Westinghouse Air Brake Technologies Corp. | 2,067 | 262,302 | |
| Xylem, Inc. | 2,779 | 317,806 | |
| $ 7,981,024 | |||
| Media — 0.7% | |||
| Charter Communications, Inc., Class A(1) | 1,118 | $ 434,544 | |
| Comcast Corp., Class A | 44,623 | 1,956,719 | |
| Fox Corp., Class A | 2,747 | 81,503 | |
| Fox Corp., Class B | 1,466 | 40,535 | |
| Interpublic Group of Cos., Inc. (The) | 4,256 | 138,916 | |
| News Corp., Class A | 4,518 | 110,917 | |
| News Corp., Class B | 1,333 | 34,285 | |
| Omnicom Group, Inc. | 2,280 | 197,243 | |
| Paramount Global, Class B | 5,361 | 79,289 | |
| $ 3,073,951 | |||
| Metals & Mining — 0.4% | |||
| Freeport-McMoRan, Inc. | 15,935 | $ 678,353 | |
| Newmont Corp. | 12,807 | 530,082 | |
| Nucor Corp. | 2,732 | 475,477 | |
| Steel Dynamics, Inc. | 1,797 | 212,226 | |
| $ 1,896,138 | |||
| Multi-Utilities — 0.6% | |||
| Ameren Corp. | 2,922 | $ 211,377 | |
| CenterPoint Energy, Inc. | 7,014 | 200,390 | |
| CMS Energy Corp. | 3,242 | 188,263 | |
| Consolidated Edison, Inc. | 3,836 | 348,961 | |
| Security | Shares | Value | |
| Multi-Utilities (continued) | |||
| Dominion Energy, Inc. | 9,299 | $ 437,053 | |
| DTE Energy Co. | 2,291 | 252,606 | |
| NiSource, Inc. | 4,769 | 126,617 | |
| Public Service Enterprise Group, Inc. | 5,537 | 338,587 | |
| Sempra | 6,993 | 522,587 | |
| WEC Energy Group, Inc. | 3,505 | 295,016 | |
| $ 2,921,457 | |||
| Office REITs — 0.1% | |||
| Alexandria Real Estate Equities, Inc. | 1,738 | $ 220,326 | |
| Boston Properties, Inc. | 1,604 | 112,553 | |
| $ 332,879 | |||
| Oil, Gas & Consumable Fuels — 3.4% | |||
| APA Corp. | 3,546 | $ 127,231 | |
| Chevron Corp. | 19,509 | 2,909,962 | |
| ConocoPhillips | 13,195 | 1,531,544 | |
| Coterra Energy, Inc. | 8,359 | 213,322 | |
| Devon Energy Corp. | 7,120 | 322,536 | |
| Diamondback Energy, Inc. | 2,064 | 320,085 | |
| EOG Resources, Inc. | 6,480 | 783,756 | |
| EQT Corp. | 4,571 | 176,715 | |
| Exxon Mobil Corp. | 44,715 | 4,470,606 | |
| Hess Corp. | 3,072 | 442,860 | |
| Kinder Morgan, Inc. | 21,489 | 379,066 | |
| Marathon Oil Corp. | 6,990 | 168,878 | |
| Marathon Petroleum Corp. | 4,219 | 625,931 | |
| Occidental Petroleum Corp. | 7,337 | 438,092 | |
| ONEOK, Inc. | 6,473 | 454,534 | |
| Phillips 66 | 4,889 | 650,921 | |
| Pioneer Natural Resources Co. | 2,593 | 583,114 | |
| Targa Resources Corp. | 2,582 | 224,298 | |
| Valero Energy Corp. | 3,783 | 491,790 | |
| Williams Cos., Inc. (The) | 13,518 | 470,832 | |
| $ 15,786,073 | |||
| Passenger Airlines — 0.2% | |||
| American Airlines Group, Inc.(1) | 7,946 | $ 109,178 | |
| Delta Air Lines, Inc. | 7,150 | 287,644 | |
| Southwest Airlines Co. | 7,058 | 203,835 | |
| United Airlines Holdings, Inc.(1) | 3,645 | 150,393 | |
| $ 751,050 | |||
| Personal Care Products — 0.2% | |||
| Estee Lauder Cos., Inc. (The), Class A | 2,581 | $ 377,471 | |
| Kenvue, Inc. | 19,152 | 412,343 | |
| $ 789,814 | |||
| Pharmaceuticals — 3.6% | |||
| Bristol-Myers Squibb Co. | 22,611 | $ 1,160,170 | |
| Security | Shares | Value | |
| Pharmaceuticals (continued) | |||
| Catalent, Inc.(1) | 2,003 | $ 89,995 | |
| Eli Lilly & Co. | 8,893 | 5,183,908 | |
| Johnson & Johnson | 26,849 | 4,208,312 | |
| Merck & Co., Inc. | 28,159 | 3,069,894 | |
| Pfizer, Inc. | 62,745 | 1,806,428 | |
| Viatris, Inc. | 13,331 | 144,375 | |
| Zoetis, Inc. | 5,102 | 1,006,982 | |
| $ 16,670,064 | |||
| Professional Services — 0.7% | |||
| Automatic Data Processing, Inc. | 4,571 | $ 1,064,906 | |
| Broadridge Financial Solutions, Inc. | 1,363 | 280,437 | |
| Ceridian HCM Holding, Inc.(1) | 1,816 | 121,890 | |
| Equifax, Inc. | 1,416 | 350,163 | |
| Jacobs Solutions, Inc. | 1,399 | 181,590 | |
| Leidos Holdings, Inc. | 1,645 | 178,055 | |
| Paychex, Inc. | 3,573 | 425,580 | |
| Paycom Software, Inc. | 545 | 112,662 | |
| Robert Half, Inc. | 1,294 | 113,769 | |
| Verisk Analytics, Inc. | 1,612 | 385,042 | |
| $ 3,214,094 | |||
| Real Estate Management & Development — 0.1% | |||
| CBRE Group, Inc., Class A(1) | 3,387 | $ 315,296 | |
| CoStar Group, Inc.(1) | 4,538 | 396,576 | |
| $ 711,872 | |||
| Residential REITs — 0.3% | |||
| AvalonBay Communities, Inc. | 1,639 | $ 306,854 | |
| Camden Property Trust | 1,285 | 127,588 | |
| Equity Residential | 3,840 | 234,854 | |
| Essex Property Trust, Inc. | 761 | 188,682 | |
| Invitation Homes, Inc. | 6,639 | 226,456 | |
| Mid-America Apartment Communities, Inc. | 1,347 | 181,118 | |
| UDR, Inc. | 3,363 | 128,769 | |
| $ 1,394,321 | |||
| Retail REITs — 0.3% | |||
| Federal Realty Investment Trust | 816 | $ 84,089 | |
| Kimco Realty Corp. | 6,888 | 146,783 | |
| Realty Income Corp. | 8,235 | 472,854 | |
| Regency Centers Corp. | 1,918 | 128,506 | |
| Simon Property Group, Inc. | 3,625 | 517,070 | |
| $ 1,349,302 | |||
| Semiconductors & Semiconductor Equipment — 7.8% | |||
| Advanced Micro Devices, Inc.(1) | 17,954 | $ 2,646,599 | |
| Analog Devices, Inc. | 5,537 | 1,099,427 | |
| Applied Materials, Inc. | 9,296 | 1,506,603 | |
| Broadcom, Inc. | �� | 4,896 | 5,465,160 |
| Security | Shares | Value | |
| Semiconductors & Semiconductor Equipment (continued) | |||
| Enphase Energy, Inc.(1) | 1,517 | $ 200,456 | |
| First Solar, Inc.(1) | 1,197 | 206,219 | |
| Intel Corp. | 46,849 | 2,354,162 | |
| KLA Corp. | 1,511 | 878,344 | |
| Lam Research Corp. | 1,465 | 1,147,476 | |
| Microchip Technology, Inc. | 6,012 | 542,162 | |
| Micron Technology, Inc. | 12,202 | 1,041,319 | |
| Monolithic Power Systems, Inc. | 538 | 339,360 | |
| NVIDIA Corp. | 27,547 | 13,641,825 | |
| NXP Semiconductors NV | 2,864 | 657,804 | |
| ON Semiconductor Corp.(1) | 4,786 | 399,775 | |
| Qorvo, Inc.(1) | 1,082 | 121,844 | |
| QUALCOMM, Inc. | 12,368 | 1,788,784 | |
| Skyworks Solutions, Inc. | 1,840 | 206,853 | |
| Teradyne, Inc. | 1,699 | 184,375 | |
| Texas Instruments, Inc. | 10,092 | 1,720,282 | |
| $ 36,148,829 | |||
| Software — 10.3% | |||
| Adobe, Inc.(1) | 5,059 | $ 3,018,199 | |
| ANSYS, Inc.(1) | 1,002 | 363,606 | |
| Autodesk, Inc.(1) | 2,375 | 578,265 | |
| Cadence Design Systems, Inc.(1) | 3,023 | 823,375 | |
| Fair Isaac Corp.(1) | 275 | 320,103 | |
| Fortinet, Inc.(1) | 7,083 | 414,568 | |
| Gen Digital, Inc. | 6,265 | 142,967 | |
| Intuit, Inc. | 3,114 | 1,946,343 | |
| Microsoft Corp. | 82,949 | 31,192,142 | |
| Oracle Corp. | 17,656 | 1,861,472 | |
| Palo Alto Networks, Inc.(1) | 3,454 | 1,018,516 | |
| PTC, Inc.(1) | 1,317 | 230,422 | |
| Roper Technologies, Inc. | 1,187 | 647,117 | |
| Salesforce, Inc.(1) | 10,812 | 2,845,070 | |
| ServiceNow, Inc.(1) | 2,278 | 1,609,384 | |
| Synopsys, Inc.(1) | 1,690 | 870,198 | |
| Tyler Technologies, Inc.(1) | 468 | 195,680 | |
| $ 48,077,427 | |||
| Specialized REITs — 1.1% | |||
| American Tower Corp. | 5,180 | $ 1,118,258 | |
| Crown Castle, Inc. | 4,823 | 555,561 | |
| Digital Realty Trust, Inc. | 3,365 | 452,862 | |
| Equinix, Inc. | 1,043 | 840,022 | |
| Extra Space Storage, Inc. | 2,348 | 376,455 | |
| Iron Mountain, Inc. | 3,245 | 227,085 | |
| Public Storage | 1,759 | 536,495 | |
| SBA Communications Corp. | 1,251 | 317,366 | |
| VICI Properties, Inc. | 11,496 | 366,493 | |
| Weyerhaeuser Co. | 8,434 | 293,250 | |
| $ 5,083,847 | |||
| Security | Shares | Value | |
| Specialty Retail — 2.0% | |||
| AutoZone, Inc.(1) | 196 | $ 506,780 | |
| Bath & Body Works, Inc. | 2,810 | 121,280 | |
| Best Buy Co., Inc. | 2,308 | 180,670 | |
| CarMax, Inc.(1) | 1,930 | 148,108 | |
| Home Depot, Inc. (The) | 11,159 | 3,867,151 | |
| Lowe's Cos., Inc. | 6,413 | 1,427,213 | |
| O'Reilly Automotive, Inc.(1) | 657 | 624,203 | |
| Ross Stores, Inc. | 3,763 | 520,762 | |
| TJX Cos., Inc. (The) | 12,713 | 1,192,606 | |
| Tractor Supply Co. | 1,201 | 258,251 | |
| Ulta Beauty, Inc.(1) | 547 | 268,024 | |
| $ 9,115,048 | |||
| Technology Hardware, Storage & Peripherals — 7.0% | |||
| Apple, Inc. | 163,130 | $ 31,407,419 | |
| Hewlett Packard Enterprise Co. | 14,905 | 253,087 | |
| HP, Inc. | 10,013 | 301,291 | |
| NetApp, Inc. | 2,433 | 214,493 | |
| Seagate Technology Holdings PLC | 2,162 | 184,570 | |
| Western Digital Corp.(1) | 3,795 | 198,744 | |
| $ 32,559,604 | |||
| Textiles, Apparel & Luxury Goods — 0.5% | |||
| lululemon Athletica, Inc.(1) | 1,280 | $ 654,451 | |
| NIKE, Inc., Class B | 13,602 | 1,476,769 | |
| Ralph Lauren Corp. | 442 | 63,736 | |
| Tapestry, Inc. | 2,547 | 93,755 | |
| VF Corp. | 4,118 | 77,419 | |
| $ 2,366,130 | |||
| Tobacco — 0.5% | |||
| Altria Group, Inc. | 19,654 | $ 792,842 | |
| Philip Morris International, Inc. | 17,251 | 1,622,974 | |
| $ 2,415,816 | |||
| Trading Companies & Distributors — 0.3% | |||
| Fastenal Co. | 6,350 | $ 411,289 | |
| United Rentals, Inc. | 753 | 431,785 | |
| W.W. Grainger, Inc. | 491 | 406,887 | |
| $ 1,249,961 | |||
| Water Utilities — 0.1% | |||
| American Water Works Co., Inc. | 2,247 | $ 296,581 | |
| $ 296,581 | |||
| Security | Shares | Value | |
| Wireless Telecommunication Services — 0.2% | |||
| T-Mobile US, Inc. | 5,654 | $ 906,506 | |
| $ 906,506 | |||
| Total Common Stocks (identified cost $129,399,562) | $446,830,786 | ||
| Exchange-Traded Funds — 1.2% |
| Security | Shares | Value | |
| Equity Funds — 1.2% | |||
| SPDR S&P 500 ETF Trust | 12,000 | $ 5,703,720 | |
| Total Exchange-Traded Funds (identified cost $5,632,080) | $ 5,703,720 | ||
| Rights — 0.0%(3) |
| Security | Shares | Value | |
| Health Care Equipment & Supplies — 0.0%(3) | |||
| Abiomed, Inc., CVR(1)(5)(6) | 544 | $ 555 | |
| Total Rights (identified cost $555) | $ 555 | ||
| Short-Term Investments — 2.7% | |||
| Affiliated Fund — 2.5% | |||
| Security | Shares | Value | |
| Morgan Stanley Institutional Liquidity Funds - Government Portfolio, Institutional Class, 5.27%(7) | 11,633,640 | $ 11,633,640 | |
| Total Affiliated Fund (identified cost $11,633,640) | $ 11,633,640 | ||
| U.S. Treasury Obligations — 0.2% | |||
| Security | Principal Amount (000's omitted) | Value | |
| U.S. Treasury Bills, 0.00%, 10/3/24(8) | $ | 1,000 | $ 964,069 |
| Total U.S. Treasury Obligations (identified cost $961,130) | $ 964,069 | ||
| Total Short-Term Investments (identified cost $12,594,770) | $ 12,597,709 | ||
| Total Investments — 100.0% (identified cost $147,626,967) | $465,132,770 | ||
| Other Assets, Less Liabilities — 0.0%(3) | $ 7,117 | ||
| Net Assets — 100.0% | $465,139,887 | ||
| The percentage shown for each investment category in the Schedule of Investments is based on net assets. | |
| (1) | Non-income producing security. |
| (2) | Represents an investment in an issuer that is deemed to be an affiliate (See Note 9). |
| (3) | Amount is less than 0.05%. |
| (4) | All or a portion of this security was on loan at December 31, 2023. The aggregate market value of securities on loan at December 31, 2023 was $103,947. |
| (5) | For fair value measurement disclosure purposes, security is categorized as Level 3 (see Note 1A). |
| (6) | Restricted security. Total market value of restricted securities amounts to $555, which represents less than 0.05% of the net assets of the Fund as of December 31, 2023. |
| (7) | May be deemed to be an affiliated investment company. The rate shown is the annualized seven-day yield as of December 31, 2023. |
| (8) | Security (or a portion thereof) has been pledged to cover margin requirements on open futures contracts. |
| Abbreviations: | |
| CVR | – Contingent Value Rights |
| REITs | – Real Estate Investment Trusts |
| Description | Number of Contracts | Position | Expiration Date | Notional Amount | Value/ Unrealized Appreciation (Depreciation) |
| Equity Futures | |||||
| E-mini S&P 500 Index | 54 | Long | 3/15/24 | $13,014,000 | $ 150,290 |
| $150,290 |
| Description | Acquisition Date | Cost |
| Abiomed, Inc., CVR | 12/28/22 | $555 |
| December 31, 2023 | |
| Assets | |
| Investments in securities of unaffiliated issuers, at value (identified cost $135,707,579) - including $103,947 of securities on loan | $ 452,189,527 |
| Investments in securities of affiliated issuers, at value (identified cost $11,919,388) | 12,943,243 |
| Receivable for capital shares sold | 108,883 |
| Dividends receivable | 422,970 |
| Dividends receivable - affiliated | 32,901 |
| Securities lending income receivable | 18 |
| Receivable from affiliate | 68,428 |
| Directors' deferred compensation plan | 94,566 |
| Total assets | $465,860,536 |
| Liabilities | |
| Payable for variation margin on open futures contracts | $ 36,500 |
| Payable for capital shares redeemed | 245,435 |
| Payable to affiliates: | |
| Investment advisory fee | 69,448 |
| Administrative fee | 46,952 |
| Sub-transfer agency fee | 163 |
| Directors' deferred compensation plan | 94,566 |
| Accrued expenses | 227,585 |
| Total liabilities | $ 720,649 |
| Net Assets | $465,139,887 |
| Sources of Net Assets | |
| Paid-in capital | $ 116,477,545 |
| Distributable earnings | 348,662,342 |
| Net Assets | $465,139,887 |
| Net Assets | $ 465,139,887 |
| Shares Outstanding | 2,688,764 |
| Net Asset Value, Offering Price and Redemption Price Per Share (net assets ÷ shares of beneficial interest outstanding) | $ 172.99 |
| Year Ended | |
| December 31, 2023 | |
| Investment Income | |
| Dividend income (net of foreign taxes withheld of $1,880) | $ 7,115,716 |
| Dividend income - affiliated issuers | 260,553 |
| Interest income | 47,486 |
| Securities lending income, net | 5,568 |
| Total investment income | $ 7,429,323 |
| Expenses | |
| Investment advisory fee | $ 793,416 |
| Administrative fee | 528,944 |
| Directors' fees and expenses | 30,428 |
| Custodian fees | 9,661 |
| Transfer agency fees and expenses | 349,650 |
| Accounting fees | 103,149 |
| Professional fees | 50,677 |
| Reports to shareholders | 4,600 |
| Miscellaneous | 74,791 |
| Total expenses | $ 1,945,316 |
| Waiver and/or reimbursement of expenses by affiliates | $ (717,384) |
| Net expenses | $ 1,227,932 |
| Net investment income | $ 6,201,391 |
| Realized and Unrealized Gain (Loss) | |
| Net realized gain (loss): | |
| Investment securities | $ 27,036,380 |
| Investment securities - affiliated issuers | 116,218 |
| Futures contracts | 524,356 |
| Net realized gain | $ 27,676,954 |
| Change in unrealized appreciation (depreciation): | |
| Investment securities | $ 67,435,114 |
| Investment securities - affiliated issuers | 8,262 |
| Futures contracts | 338,708 |
| Net change in unrealized appreciation (depreciation) | $ 67,782,084 |
| Net realized and unrealized gain | $ 95,459,038 |
| Net increase in net assets from operations | $101,660,429 |
| Year Ended December 31, | ||
| 2023 | 2022 | |
| Increase (Decrease) in Net Assets | ||
| From operations: | ||
| Net investment income | $ 6,201,391 | $ 6,145,397 |
| Net realized gain | 27,676,954 | 22,114,701 |
| Net change in unrealized appreciation (depreciation) | 67,782,084 | (126,471,955) |
| Net increase (decrease) in net assets from operations | $101,660,429 | $ (98,211,857) |
| Distributions to shareholders | $ (28,008,875) | $ (39,863,740) |
| Net increase (decrease) in net assets from capital share transactions | $ (21,961,282) | $ 2,794,694 |
| Net increase (decrease) in net assets | $ 51,690,272 | $(135,280,903) |
| Net Assets | ||
| At beginning of year | $ 413,449,615 | $ 548,730,518 |
| At end of year | $465,139,887 | $ 413,449,615 |
| Year Ended December 31, | |||||
| 2023 | 2022 | 2021 | 2020 | 2019 | |
| Net asset value — Beginning of year | $ 146.75 | $ 200.13 | $ 165.98 | $ 147.79 | $ 123.19 |
| Income (Loss) From Operations | |||||
| Net investment income(1) | $ 2.28 | $ 2.28 | $ 2.08 | $ 2.31 | $ 2.43 |
| Net realized and unrealized gain (loss) | 34.75 | (40.18) | 43.96 | 23.51 | 34.42 |
| Total income (loss) from operations | $ 37.03 | $ (37.90) | $ 46.04 | $ 25.82 | $ 36.85 |
| Less Distributions | |||||
| From net investment income | $ (2.30) | $ (2.16) | $ (2.56) | $ (2.57) | $ (2.63) |
| From net realized gain | (8.49) | (13.32) | (9.33) | (5.06) | (9.62) |
| Total distributions | $ (10.79) | $ (15.48) | $ (11.89) | $ (7.63) | $ (12.25) |
| Net asset value — End of year | $ 172.99 | $ 146.75 | $ 200.13 | $ 165.98 | $ 147.79 |
| Total Return(2) | 25.92% | (18.34)% | 28.42% | 18.11% | 31.16% |
| Ratios/Supplemental Data | |||||
| Net assets, end of year (000’s omitted) | $465,140 | $413,450 | $548,731 | $480,052 | $459,202 |
| Ratios (as a percentage of average daily net assets):(3) | |||||
| Total expenses | 0.44% | 0.43% | 0.43% | 0.43% | 0.38% |
| Net expenses | 0.28% (4) | 0.28% (4) | 0.28% | 0.28% | 0.28% |
| Net investment income | 1.41% | 1.35% | 1.11% | 1.58% | 1.72% |
| Portfolio Turnover | 6% | 6% | 6% | 10% | 6% |
| (1) | Computed using average shares outstanding. |
| (2) | Returns are historical and are calculated by determining the percentage change in net asset value with all distributions reinvested and do not reflect fees and expenses imposed by variable annuity contracts or variable life insurance policies. If included, total return would be lower. |
| (3) | Total expenses do not reflect amounts reimbursed and/or waived by the adviser and certain of its affiliates, if applicable. Net expenses are net of all reductions and represent the net expenses paid by the Fund. |
| (4) | Includes a reduction by the investment adviser of a portion of its advisory fee due to the Fund’s investment in the Liquidity Fund (equal to less than 0.005% of average daily net assets for the years ended December 31, 2023 and 2022). |
| Asset Description | Level 1 | Level 2 | Level 3(1) | Total |
| Common Stocks | $ 446,830,786(2) | $ — | $ — | $ 446,830,786 |
| Exchange-Traded Funds | 5,703,720 | — | — | 5,703,720 |
| Rights | — | — | 555 | 555 |
| Short-Term Investments: | ||||
| Affiliated Fund | 11,633,640 | — | — | 11,633,640 |
| U.S. Treasury Obligations | — | 964,069 | — | 964,069 |
| Total Investments | $464,168,146 | $964,069 | $ 555 | $465,132,770 |
| Futures Contracts | $ 150,290 | $ — | $ — | $ 150,290 |
| Total | $464,318,436 | $964,069 | $ 555 | $465,283,060 |
| (1) | None of the unobservable inputs for Level 3 assets, individually or collectively, had a material impact on the Fund. |
| (2) | The level classification by major category of investments is the same as the category presentation in the Schedule of Investments. |
| Year Ended December 31, | ||
| 2023 | 2022 | |
| Ordinary income | $ 5,968,981 | $ 8,592,429 |
| Long-term capital gains | $22,039,894 | $31,271,311 |
| Undistributed ordinary income | $ 7,568,128 |
| Undistributed long-term capital gains | 26,021,311 |
| Net unrealized appreciation | 315,072,903 |
| Distributable earnings | $348,662,342 |
| Aggregate cost | $150,059,867 |
| Gross unrealized appreciation | $ 320,315,226 |
| Gross unrealized depreciation | (5,242,323) |
| Net unrealized appreciation | $315,072,903 |
| Derivative | Statement of Assets and Liabilities Caption | Assets | Liabilities | |
| Futures contracts | Distributable earnings | $150,290 (1) | $ — | |
| (1) | Only the current day's variation margin is reported within the Statement of Assets and Liabilities as Receivable or Payable for variation margin on open futures contracts, as applicable. |
| Statement of Operations Caption | |||
| Derivative | Net realized gain (loss): Futures contracts | Change in unrealized appreciation (depreciation): Futures contracts | |
| Futures contracts | $ 524,356 | $ 338,708 | |
| Name | Value, beginning of period | Purchases | Sales proceeds | Net realized gain (loss) | Change in unrealized appreciation (depreciation) | Value, end of period | Dividend income | Shares, end of period |
| Common Stocks | ||||||||
| Morgan Stanley | $1,368,227 | $ 14,283 | $ (197,387) | $ 116,218 | $ 8,262 | $ 1,309,603 | $ 50,595 | 14,044 |
| Short-Term Investments | ||||||||
| Liquidity Fund | 8,012,505 | 48,131,559 | (44,510,424) | — | — | 11,633,640 | 209,958 | 11,633,640 |
| Total | $116,218 | $8,262 | $12,943,243 | $260,553 | ||||
| Year Ended December 31, 2023 | Year Ended December 31, 2022 | ||||
| Shares | Amount | Shares | Amount | ||
| Shares sold | 72,967 | $ 11,866,023 | 95,608 | $ 16,343,612 | |
| Reinvestment of distributions | 176,991 | 28,008,875 | 292,535 | 39,863,740 | |
| Shares redeemed | (378,556) | (61,836,180) | (312,682) | (53,412,658) | |
| Net increase (decrease) | (128,598) | $(21,961,282) | 75,461 | $ 2,794,694 | |
Boston, Massachusetts
February 16, 2024
| Name and Year of Birth | Corporation Position(s) | Length of Service | Principal Occupation(s) and Other Directorships During Past Five Years and Other Relevant Experience |
| Interested Director | |||
| Von M. Hughes(1) 1969 | Director and President | Since 2023 | President and Chief Executive Officer and Managing Director of Calvert Research and Management. Managing Director of Morgan Stanley Investment Management (MSIM) (since 2022). Formerly, Managing Director of PAAMCO Prisma (investment management firm) (2003-2022). Mr. Hughes is an interested person because of his positions with CRM and certain affiliates. Other Directorships. Tradeweb Markets Inc. (financial services) (2021-2022); National Association of Investment Companies (2018-2021). |
| Noninterested Directors | |||
| Alice Gresham Bullock 1950 | Chair and Director | Since 2016 (Chair); Since 2008 (Director) | Professor Emerita at Howard University School of Law. Dean Emerita of Howard University School of Law and Deputy Director of the Association of American Law Schools (1992-1994). Other Directorships. None. |
| Cari M. Dominguez 1949 | Director | Since 2016 | Former Chair of the U.S. Equal Employment Opportunity Commission. Other Directorships. ManpowerGroup Inc. (workforce solutions company); Triple S Management Corporation (managed care); National Association of Corporate Directors. |
| Karen Fang(2) 1958 | Director | Since 2023 | Formerly, Managing Director, Wealth Management at GAMCO Asset Management (asset management firm) (2020-2023). Formerly, Managing Director, Senior Portfolio Manager of Fiduciary Trust Company International (wealth management firm) (1993-2019). Other Directorships. None. |
| Miles D. Harper, III 1962 | Director | Since 2016 | Private investor (2022-present). Formerly, Partner, Carr Riggs & Ingram (public accounting firm) (2014-2022). Partner, Gainer Donnelly & Desroches (public accounting firm) (now Carr Riggs & Ingram) (1999-2014). Other Directorships. Bridgeway Funds (9) (asset management). |
| Joy V. Jones 1950 | Director | Since 2016 | Attorney. Other Directorships. Palm Management Corporation. |
| Eddie Ramos(2) 1967 | Director | Since 2023 | Private investor (2022-present). Formerly, Head of External Advisors/Diversity Portfolio Management at the New Jersey Division of Investment (2020-2022). Formerly, Chief Investment Officer and Lead Portfolio Manager – Global Fundamental Equities at Cornerstone Capital Management (asset management firm) (2011-2017). Other Directorships. Macquarie Optimum Funds (6) (asset management) (2022-2023). |
| Name and Year of Birth | Corporation Position(s) | Length of Service | Principal Occupation(s) and Other Directorships During Past Five Years and Other Relevant Experience |
| Noninterested Directors (continued) | |||
| Anthony A. Williams 1951 | Director | Since 2016 | CEO and Executive Director of the Federal City Council (July 2012 to present); Senior Adviser and Independent Consultant for King and Spalding LLP (September 2015 to present); Executive Director of Global Government Practice at the Corporate Executive Board (January 2010 to January 2012). Other Directorships. Freddie Mac; Evoq Properties/Meruelo Maddux Properties, Inc. (real estate management); Weston Solutions, Inc. (environmental services); Bipartisan Policy Center’s Debt Reduction Task Force; Chesapeake Bay Foundation; Catholic University of America; Urban Institute (research organization); The Howard Hughes Corporation (real estate development); Old Dominion National Bank. |
| Name and Year of Birth | Corporation Position(s) | Length of Service | Principal Occupation(s) During Past Five Years |
| Principal Officers who are not Directors | |||
| Hope L. Brown 1973 | Chief Compliance Officer | Since 2014 | Chief Compliance Officer of 46 registered investment companies advised by CRM (since 2014). Vice President and Chief Compliance Officer, Wilmington Funds (2012-2014). |
| Deidre E. Walsh 1971 | Secretary, Vice President and Chief Legal Officer | Since 2021 | Vice President of CRM and officer of 46 registered investment companies advised by CRM (since 2021). Also Vice President of Eaton Vance and certain of its affiliates and officer of 127 registered investment companies advised or administered by Eaton Vance. |
| James F. Kirchner 1967 | Treasurer | Since 2016 | Vice President of CRM and officer of 46 registered investment companies advised by CRM (since 2016). Also Vice President of Eaton Vance and certain of its affiliates and officer of 127 registered investment companies advised or administered by Eaton Vance. |
| (1) Mr. Hughes is an interested person of the Fund because of his positions with the Fund’s adviser and certain affiliates. | |||
| (2) Ms. Fang and Mr. Ramos began serving as Directors effective October 30, 2023. | |||
| Privacy Notice | April 2021 |
| FACTS | WHAT DOES EATON VANCE DO WITH YOUR PERSONAL INFORMATION? |
| Why? | Financial companies choose how they share your personal information. Federal law gives consumers the right to limit some but not all sharing. Federal law also requires us to tell you how we collect, share, and protect your personal information. Please read this notice carefully to understand what we do. |
| What? | The types of personal information we collect and share depend on the product or service you have with us. This information can include:■ Social Security number and income ■ investment experience and risk tolerance ■ checking account number and wire transfer instructions |
| How? | All financial companies need to share customers’ personal information to run their everyday business. In the section below, we list the reasons financial companies can share their customers’ personal information; the reasons Eaton Vance chooses to share; and whether you can limit this sharing. |
| Reasons we can share your personal information | Does Eaton Vance share? | Can you limit this sharing? |
| For our everyday business purposes — such as to process your transactions, maintain your account(s), respond to court orders and legal investigations, or report to credit bureaus | Yes | No |
| For our marketing purposes — to offer our products and services to you | Yes | No |
| For joint marketing with other financial companies | No | We don’t share |
| For our investment management affiliates’ everyday business purposes — information about your transactions, experiences, and creditworthiness | Yes | Yes |
| For our affiliates’ everyday business purposes — information about your transactions and experiences | Yes | No |
| For our affiliates’ everyday business purposes — information about your creditworthiness | No | We don’t share |
| For our investment management affiliates to market to you | Yes | Yes |
| For our affiliates to market to you | No | We don’t share |
| For nonaffiliates to market to you | No | We don’t share |
| To limit our sharing | Call toll-free 1-800-368-2745 or email: CRMPrivacy@calvert.comPlease note:If you are a new customer, we can begin sharing your information 30 days from the date we sent this notice. When you are no longer our customer, we continue to share your information as described in this notice. However, you can contact us at any time to limit our sharing. |
| Questions? | Call toll-free 1-800-368-2745 or email: CRMPrivacy@calvert.com |
| Privacy Notice — continued | April 2021 |
| Who we are | |
| Who is providing this notice? | Eaton Vance Management, Eaton Vance Distributors, Inc., Eaton Vance Trust Company, Eaton Vance Management (International) Limited, Eaton Vance Advisers International Ltd., Eaton Vance Global Advisors Limited, Eaton Vance Management’s Real Estate Investment Group, Boston Management and Research, Calvert Research and Management, Eaton Vance and Calvert Fund Families and our investment advisory affiliates (“Eaton Vance”) (see Investment Management Affiliates definition below) |
| What we do | |
| How does Eaton Vance protect my personal information? | To protect your personal information from unauthorized access and use, we use security measures that comply with federal law. These measures include computer safeguards and secured files and buildings. We have policies governing the proper handling of customer information by personnel and requiring third parties that provide support to adhere to appropriate security standards with respect to such information. |
| How does Eaton Vance collect my personal information? | We collect your personal information, for example, when you■ open an account or make deposits or withdrawals from your account ■ buy securities from us or make a wire transfer ■ give us your contact informationWe also collect your personal information from others, such as credit bureaus, affiliates, or other companies. |
| Why can’t I limit all sharing? | Federal law gives you the right to limit only■ sharing for affiliates’ everyday business purposes — information about your creditworthiness ■ affiliates from using your information to market to you ■ sharing for nonaffiliates to market to youState laws and individual companies may give you additional rights to limit sharing. See below for more on your rights under state law. |
| Definitions | |
| Investment Management Affiliates | Eaton Vance Investment Management Affiliates include registered investment advisers, registered broker- dealers, and registered and unregistered funds. Investment Management Affiliates does not include entities associated with Morgan Stanley Wealth Management, such as Morgan Stanley Smith Barney LLC and Morgan Stanley & Co. |
| Affiliates | Companies related by common ownership or control. They can be financial and nonfinancial companies.■ Our affiliates include companies with a Morgan Stanley name and financial companies such as Morgan Stanley Smith Barney LLC and Morgan Stanley & Co. |
| Nonaffiliates | Companies not related by common ownership or control. They can be financial and nonfinancial companies.■ Eaton Vance does not share with nonaffiliates so they can market to you. |
| Joint marketing | A formal agreement between nonaffiliated financial companies that together market financial products or services to you.■ Eaton Vance doesn’t jointly market. |
| Other important information | |
| Vermont: Except as permitted by law, we will not share personal information we collect about Vermont residents with Nonaffiliates unless you provide us with your written consent to share such information.California: Except as permitted by law, we will not share personal information we collect about California residents with Nonaffiliates and we will limit sharing such personal information with our Affiliates to comply with California privacy laws that apply to us. | |


| % Average Annual Total Returns1,2 | Class Inception Date | Performance Inception Date | One Year | Five Years | Ten Years |
| Class F at NAV | 04/30/2013 | 04/30/2013 | 11.92% | 5.43% | 4.51% |
| S&P Global LargeMidCap Managed Risk Index - Conservative | — | — | 12.49% | 5.55% | 4.36% |
| Moderate Portfolio Blended Benchmark | — | — | 14.02 | 7.23 | 5.82 |
| % Total Annual Operating Expense Ratios3 | Class F |
| Gross | 1.01% |
| Net | 0.88 |
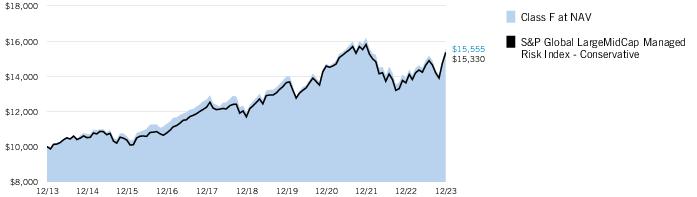
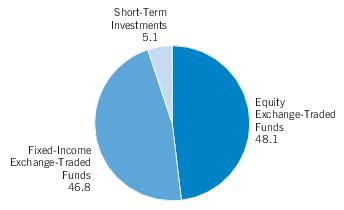
| Top 10 Holdings (% of net assets)1 | |
| Vanguard Total Bond Market ETF | 21.9% |
| iShares Core U.S. Aggregate Bond ETF | 21.6 |
| Vanguard S&P 500 ETF | 14.9 |
| Vanguard FTSE Developed Markets ETF | 10.2 |
| iShares S&P 500 Growth ETF | 6.1 |
| iShares S&P 500 Value ETF | 5.1 |
| iShares Russell 2000 ETF | 4.6 |
| iShares Core S&P Mid-Cap ETF | 2.4 |
| iShares iBoxx $ Investment Grade Corporate Bond ETF | 2.1 |
| Vanguard FTSE Emerging Markets ETF | 2.1 |
| Total | 91.0% |
| 1 | Excludes cash and cash equivalents. |
| † | The views expressed in this report are those of the portfolio manager(s) and are current only through the date stated at the top of this page. These views are subject to change at any time based upon market or other conditions, and Calvert and the Fund(s) disclaim any responsibility to update such views. These views may not be relied upon as investment advice and, because investment decisions are based on many factors, may not be relied upon as an indication of trading intent on behalf of any Calvert fund. This commentary may contain statements that are not historical facts, referred to as “forward-looking statements.” The Fund’s actual future results may differ significantly from those stated in any forward-looking statement, depending on factors such as changes in securities or financial markets or general economic conditions, the volume of sales and purchases of Fund shares, the continuation of investment advisory, administrative and service contracts, and other risks discussed from time to time in the Fund’s filings with the Securities and Exchange Commission. |
| 1 | S&P Global LargeMidCap Managed Risk Index - Conservative is an unmanaged index designed to simulate a dynamic protective portfolio that allocates between the underlying equity index and cash, based on realized volatilities of the underlying equity and bond indices, while maintaining a fixed 50% allocation to the underlying bond index. The index has a risk management overlay that seeks to limit the index volatility to 8%, and includes a synthetic put position to reduce downside risk. S&P Dow Jones Indices are a product of S&P Dow Jones Indices LLC (“S&P DJI”) and have been licensed for use. S&P® and S&P 500® are registered trademarks of S&P DJI; Dow Jones® is a registered trademark of Dow Jones Trademark Holdings LLC (“Dow Jones”); S&P DJI, Dow Jones and their respective affiliates do not sponsor, endorse, sell or promote the Fund, will not have any liability with respect thereto and do not have any liability for any errors, omissions, or interruptions of the S&P Dow Jones Indices. Moderate Portfolio Blended Benchmark is an internally constructed benchmark which is comprised of a blend of 48% Bloomberg U.S. Aggregate Bond Index, 36% Russell 3000® Index, 10% MSCI EAFE Index, 4% ICE BofA 3-Month U.S. Treasury Bill Index, and 2% MSCI USA IMI/Equity REITs Index, which is rebalanced monthly. Bloomberg U.S. Aggregate Bond Index is an unmanaged index of domestic investment-grade bonds, including corporate, government and mortgage-backed securities. Russell 3000® Index is an unmanaged index of the 3,000 largest U.S. stocks. MSCI EAFE Index is an unmanaged index of equities in the developed markets, excluding the U.S. and Canada. MSCI USA IMI/Equity REITs Index is an unmanaged index of U.S. equity REITs. MSCI indexes are net of foreign withholding taxes. Source: MSCI. MSCI data may not be reproduced or used for any other purpose. MSCI provides no warranties, has not prepared or approved this report, and has no liability hereunder. ICE BofA 3-Month |
| U.S. Treasury Bill Index is an unmanaged index of U.S. Treasury securities maturing in 90 days. ICE® BofA® indices are not for redistribution or other uses; provided “as is”, without warranties, and with no liability. Eaton Vance has prepared this report and ICE Data Indices, LLC does not endorse it, or guarantee, review, or endorse Eaton Vance’s products. BofA® is a licensed registered trademark of Bank of America Corporation in the United States and other countries. Unless otherwise stated, index returns do not reflect the effect of any applicable sales charges, commissions, expenses, taxes or leverage, as applicable. It is not possible to invest directly in an index. | |
| 2 | There is no sales charge. Insurance-related charges are not included in the calculation of returns. If such charges were reflected, the returns would be lower. Please refer to the report for your insurance contract for performance data reflecting insurance-related charges. Calvert Research and Management became the investment adviser to the Fund on December 31, 2016. Performance reflected prior to such date is that of the Fund’s former investment adviser. |
| 3 | Source: Fund prospectus. Net expense ratio reflects a contractual expense reimbursement that continues through 4/30/24. The expense ratios for the current reporting period can be found in the Financial Highlights section of this report. Performance reflects expenses waived and/or reimbursed, if applicable. Without such waivers and/or reimbursements, performance would have been lower. |
| Fund profile subject to change due to active management. | |
| Additional Information | |
| MSCI ACWI Index is an unmanaged free-float-adjusted, market-capitalization-weighted index designed to measure the equity market performance of developed and emerging markets. S&P 500® Index is an unmanaged index of large-cap stocks commonly used as a measure of U.S. stock market performance. MSCI Golden Dragon Index is an unmanaged index of common stocks traded in China, Hong Kong and Taiwan. Bloomberg U.S. Treasury Index measures the performance of U.S. Treasuries with a maturity of one year or more. Bloomberg U.S. Corporate Bond Index measures the performance of investment-grade U.S. corporate securities with a maturity of one year or more. Bloomberg U.S. Corporate High Yield Index measures USD-denominated, non-investment grade corporate securities. |
| Beginning Account Value (7/1/23) | Ending Account Value (12/31/23) | Expenses Paid During Period* (7/1/23 – 12/31/23) | Annualized Expense Ratio | |
| Actual | ||||
| Class F | $1,000.00 | $1,043.80 | $4.12 ** | 0.80% |
| Hypothetical | ||||
| (5% return per year before expenses) | ||||
| Class F | $1,000.00 | $1,021.17 | $4.08 ** | 0.80% |
| * | Expenses are equal to the Fund's annualized expense ratio, multiplied by the average account value over the period, multiplied by 184/365 (to reflect the one-half year period). The Example assumes that the $1,000 was invested at the net asset value per share determined at the close of business on June 30, 2023. Expenses shown do not include insurance-related charges or direct expenses of Qualified Plans. Expenses do not include fees and expenses incurred indirectly from investment in exchange-traded funds (the Underlying Funds). |
| ** | Absent a waiver and/or reimbursement of expenses by affiliate(s), expenses would be higher. |
| Exchange-Traded Funds — 95.2% |
| Security | Shares | Value | |
| Equity Funds — 48.3% | |||
| Financial Select Sector SPDR Fund | 23,000 | $ 864,800 | |
| iShares Core S&P Mid-Cap ETF | 7,000 | 1,940,050 | |
| iShares Russell 2000 ETF(1) | 18,000 | 3,612,780 | |
| iShares S&P 500 Growth ETF(1) | 64,000 | 4,806,400 | |
| iShares S&P 500 Value ETF | 23,000 | 3,999,470 | |
| Vanguard FTSE Developed Markets ETF | 168,000 | 8,047,200 | |
| Vanguard FTSE Emerging Markets ETF | 40,000 | 1,644,000 | |
| Vanguard Real Estate ETF | 16,000 | 1,413,760 | |
| Vanguard S&P 500 ETF | 27,000 | 11,793,600 | |
| $38,122,060 | |||
| Fixed-Income Funds — 46.9% | |||
| iShares 1-3 Year Treasury Bond ETF | 13,000 | $ 1,066,520 | |
| iShares Core U.S. Aggregate Bond ETF | 172,000 | 17,071,000 | |
| iShares iBoxx $ Investment Grade Corporate Bond ETF | 15,000 | 1,659,900 | |
| Vanguard Total Bond Market ETF | 235,000 | 17,284,250 | |
| $37,081,670 | |||
| Total Exchange-Traded Funds (identified cost $62,951,267) | $75,203,730 | ||
| Short-Term Investments — 5.1% | |||
| Affiliated Fund — 4.8% | |||
| Security | Shares | Value | |
| Morgan Stanley Institutional Liquidity Funds - Government Portfolio, Institutional Class, 5.27%(2) | 3,826,099 | $ 3,826,099 | |
| Total Affiliated Fund (identified cost $3,826,099) | $ 3,826,099 | ||
| Securities Lending Collateral — 0.3% | |||
| Security | Shares | Value | |
| State Street Navigator Securities Lending Government Money Market Portfolio, 5.36%(3) | 242,781 | $ 242,781 | |
| Total Securities Lending Collateral (identified cost $242,781) | $ 242,781 | ||
| Total Short-Term Investments (identified cost $4,068,880) | $ 4,068,880 | ||
| Total Investments — 100.3% (identified cost $67,020,147) | $79,272,610 | ||
| Other Assets, Less Liabilities — (0.3)% | $ (273,968) | ||
| Net Assets — 100.0% | $ 78,998,642 | ||
| The percentage shown for each investment category in the Schedule of Investments is based on net assets. | |
| (1) | All or a portion of this security was on loan at December 31, 2023. The aggregate market value of securities on loan at December 31, 2023 was $3,941,112. |
| (2) | May be deemed to be an affiliated investment company. The rate shown is the annualized seven-day yield as of December 31, 2023. |
| (3) | Represents investment of cash collateral received in connection with securities lending. |
| Description | Number of Contracts | Position | Expiration Date | Notional Amount | Value/ Unrealized Appreciation (Depreciation) |
| Equity Futures | |||||
| E-mini S&P 500 Index | (4) | Short | 3/15/24 | $(964,000) | $ (32,007) |
| E-mini S&P MidCap 400 Index | (2) | Short | 3/15/24 | (561,900) | (29,717) |
| MSCI EAFE Index | (4) | Short | 3/15/24 | (450,480) | (18,006) |
| $(79,730) |
| December 31, 2023 | |
| Assets | |
| Investments in securities of unaffiliated issuers, at value (identified cost $63,194,048) - including $3,941,112 of securities on loan | $ 75,446,511 |
| Investments in securities of affiliated issuers, at value (identified cost $3,826,099) | 3,826,099 |
| Receivable for variation margin on open futures contracts | 7,418 |
| Deposits at broker for futures contracts | 92,000 |
| Receivable for capital shares sold | 135 |
| Dividends receivable - affiliated | 15,800 |
| Securities lending income receivable | 2,554 |
| Receivable from affiliates | 8,489 |
| Directors' deferred compensation plan | 22,980 |
| Total assets | $79,421,986 |
| Liabilities | |
| Payable for capital shares redeemed | $ 46,907 |
| Deposits for securities loaned | 242,781 |
| Payable to affiliates: | |
| Investment advisory fee | 26,277 |
| Administrative fee | 8,031 |
| Distribution fees | 16,732 |
| Sub-transfer agency fee | 43 |
| Directors' deferred compensation plan | 22,980 |
| Accrued expenses | 59,593 |
| Total liabilities | $ 423,344 |
| Net Assets | $78,998,642 |
| Sources of Net Assets | |
| Paid-in capital | $ 63,863,821 |
| Distributable earnings | 15,134,821 |
| Net Assets | $78,998,642 |
| Class F Shares | |
| Net Assets | $ 78,998,642 |
| Shares Outstanding | 4,455,357 |
| Net Asset Value, Offering Price and Redemption Price Per Share (net assets ÷ shares of beneficial interest outstanding) | $ 17.73 |
| Year Ended | |
| December 31, 2023 | |
| Investment Income | |
| Dividend income | $ 1,990,641 |
| Dividend income - affiliated issuers | 197,038 |
| Securities lending income, net | 16,536 |
| Total investment income | $2,204,215 |
| Expenses | |
| Investment advisory fee | $ 322,295 |
| Administrative fee | 96,689 |
| Distribution fees | 201,435 |
| Directors' fees and expenses | 5,585 |
| Custodian fees | 2,970 |
| Transfer agency fees and expenses | 58,643 |
| Accounting fees | 20,896 |
| Professional fees | 40,195 |
| Reports to shareholders | 2,755 |
| Miscellaneous | 6,541 |
| Total expenses | $ 758,004 |
| Waiver and/or reimbursement of expenses by affiliates | $ (111,343) |
| Net expenses | $ 646,661 |
| Net investment income | $1,557,554 |
| Realized and Unrealized Gain (Loss) | |
| Net realized gain (loss): | |
| Investment securities | $ 4,152,151 |
| Futures contracts | (480,836) |
| Net realized gain | $3,671,315 |
| Change in unrealized appreciation (depreciation): | |
| Investment securities | $ 4,310,647 |
| Futures contracts | (543,627) |
| Net change in unrealized appreciation (depreciation) | $3,767,020 |
| Net realized and unrealized gain | $7,438,335 |
| Net increase in net assets from operations | $8,995,889 |
| Year Ended December 31, | ||
| 2023 | 2022 | |
| Increase (Decrease) in Net Assets | ||
| From operations: | ||
| Net investment income | $ 1,557,554 | $ 1,154,295 |
| Net realized gain | 3,671,315 | 2,610,799 |
| Net change in unrealized appreciation (depreciation) | 3,767,020 | (18,826,676) |
| Net increase (decrease) in net assets from operations | $ 8,995,889 | $ (15,061,582) |
| Distributions to shareholders | $ (5,403,679) | $ (3,738,072) |
| Net decrease in net assets from capital share transactions | $ (5,905,701) | $ (10,422,045) |
| Net decrease in net assets | $ (2,313,491) | $ (29,221,699) |
| Net Assets | ||
| At beginning of year | $ 81,312,133 | $110,533,832 |
| At end of year | $78,998,642 | $ 81,312,133 |
| Class F | |||||
| Year Ended December 31, | |||||
| 2023 | 2022 | 2021 | 2020 | 2019 | |
| Net asset value — Beginning of year | $ 17.03 | $ 20.80 | $ 19.10 | $ 18.86 | $ 16.49 |
| Income (Loss) From Operations | |||||
| Net investment income(1) | $ 0.34 | $ 0.23 | $ 0.17 | $ 0.20 | $ 0.29 |
| Net realized and unrealized gain (loss) | 1.60 | (3.20) | 1.74 | 0.77 | 2.49 |
| Total income (loss) from operations | $ 1.94 | $ (2.97) | $ 1.91 | $ 0.97 | $ 2.78 |
| Less Distributions | |||||
| From net investment income | $ (0.26) | $ (0.21) | $ (0.21) | $ (0.32) | $ (0.28) |
| From net realized gain | (0.98) | (0.59) | — | (0.41) | (0.13) |
| Total distributions | $ (1.24) | $ (0.80) | $ (0.21) | $ (0.73) | $ (0.41) |
| Net asset value — End of year | $ 17.73 | $ 17.03 | $ 20.80 | $ 19.10 | $ 18.86 |
| Total Return(2) | 11.92% | (14.17)% | 10.06% | 5.28% | 17.02% |
| Ratios/Supplemental Data | |||||
| Net assets, end of year (000’s omitted) | $78,999 | $81,312 | $110,534 | $109,206 | $110,131 |
| Ratios (as a percentage of average daily net assets):(3)(4) | |||||
| Total expenses | 0.94% | 0.94% | 0.91% | 0.93% | 0.90% |
| Net expenses | 0.80% (5) | 0.81% (5) | 0.81% | 0.83% | 0.83% |
| Net investment income | 1.93% | 1.26% | 0.86% | 1.10% | 1.63% |
| Portfolio Turnover | 9% | 17% | 7% | 15% | 6% |
| (1) | Computed using average shares outstanding. |
| (2) | Returns are historical and are calculated by determining the percentage change in net asset value with all distributions reinvested and do not reflect fees and expenses imposed by variable annuity contracts or variable life insurance policies. If included, total return would be lower. |
| (3) | Total expenses do not reflect amounts reimbursed and/or waived by the adviser and certain of its affiliates, if applicable. Net expenses are net of all reductions and represent the net expenses paid by the Fund. |
| (4) | Amounts do not include the expenses of the Underlying Funds. |
| (5) | Includes a reduction by the investment adviser of a portion of its advisory fee due to the Fund’s investment in the Liquidity Fund (equal to 0.01% and less than 0.005% of average daily net assets for the years ended December 31, 2023 and 2022, respectively). |
| Asset Description | Level 1 | Level 2 | Level 3 | Total |
| Exchange-Traded Funds | $ 75,203,730 | $ — | $ — | $ 75,203,730 |
| Short-Term Investments: | ||||
| Affiliated Fund | 3,826,099 | — | — | 3,826,099 |
| Asset Description (continued) | Level 1 | Level 2 | Level 3 | Total |
| Securities Lending Collateral | $ 242,781 | $ — | $ — | $ 242,781 |
| Total Investments | $79,272,610 | $ — | $ — | $79,272,610 |
| Liability Description | ||||
| Futures Contracts | $ (79,730) | $ — | $ — | $ (79,730) |
| Total | $ (79,730) | $ — | $ — | $ (79,730) |
| Year Ended December 31, | ||
| 2023 | 2022 | |
| Ordinary income | $2,583,288 | $ 967,324 |
| Long-term capital gains | $2,820,391 | $2,770,748 |
| Undistributed ordinary income | $ 1,879,381 |
| Undistributed long-term capital gains | 3,683,566 |
| Net unrealized appreciation | 9,571,874 |
| Distributable earnings | $15,134,821 |
| Aggregate cost | $69,700,736 |
| Gross unrealized appreciation | $ 13,338,048 |
| Gross unrealized depreciation | (3,766,174) |
| Net unrealized appreciation | $ 9,571,874 |
| Derivative | Statement of Assets and Liabilities Caption | Assets | Liabilities | |
| Futures contracts | Distributable earnings | $ — | $(79,730) (1) | |
| (1) | Only the current day's variation margin is reported within the Statement of Assets and Liabilities as Receivable or Payable for variation margin on open futures contracts, as applicable. |
| Statement of Operations Caption | |||
| Derivative | Net realized gain (loss): Futures contracts | Change in unrealized appreciation (depreciation): Futures contracts | |
| Futures contracts | $ (480,836) | $ (543,627) | |
| Remaining Contractual Maturity of the Transactions | |||||
| Overnight and Continuous | <30 days | 30 to 90 days | >90 days | Total | |
| Exchange-Traded Funds | $242,781 | $ — | $ — | $ — | $242,781 |
| Name | Value, beginning of period | Purchases | Sales proceeds | Net realized gain (loss) | Change in unrealized appreciation (depreciation) | Value, end of period | Dividend income | Shares, end of period |
| Short-Term Investments | ||||||||
| Liquidity Fund | $3,460,088 | $17,940,780 | $(17,574,769) | $ — | $ — | $3,826,099 | $197,038 | 3,826,099 |
| Year Ended December 31, 2023 | Year Ended December 31, 2022 | ||||
| Shares | Amount | Shares | Amount | ||
| Class F | |||||
| Shares sold | 35,972 | $ 638,126 | 31,007 | $ 588,578 | |
| Reinvestment of distributions | 327,297 | 5,403,679 | 226,139 | 3,738,072 | |
| Shares redeemed | (681,263) | (11,947,506) | (798,306) | (14,748,695) | |
| Net decrease | (317,994) | $ (5,905,701) | (541,160) | $(10,422,045) | |
Boston, Massachusetts
February 16, 2024
| Name and Year of Birth | Corporation Position(s) | Length of Service | Principal Occupation(s) and Other Directorships During Past Five Years and Other Relevant Experience |
| Interested Director | |||
| Von M. Hughes(1) 1969 | Director and President | Since 2023 | President and Chief Executive Officer and Managing Director of Calvert Research and Management. Managing Director of Morgan Stanley Investment Management (MSIM) (since 2022). Formerly, Managing Director of PAAMCO Prisma (investment management firm) (2003-2022). Mr. Hughes is an interested person because of his positions with CRM and certain affiliates. Other Directorships. Tradeweb Markets Inc. (financial services) (2021-2022); National Association of Investment Companies (2018-2021). |
| Noninterested Directors | |||
| Alice Gresham Bullock 1950 | Chair and Director | Since 2016 (Chair); Since 2008 (Director) | Professor Emerita at Howard University School of Law. Dean Emerita of Howard University School of Law and Deputy Director of the Association of American Law Schools (1992-1994). Other Directorships. None. |
| Cari M. Dominguez 1949 | Director | Since 2016 | Former Chair of the U.S. Equal Employment Opportunity Commission. Other Directorships. ManpowerGroup Inc. (workforce solutions company); Triple S Management Corporation (managed care); National Association of Corporate Directors. |
| Karen Fang(2) 1958 | Director | Since 2023 | Formerly, Managing Director, Wealth Management at GAMCO Asset Management (asset management firm) (2020-2023). Formerly, Managing Director, Senior Portfolio Manager of Fiduciary Trust Company International (wealth management firm) (1993-2019). Other Directorships. None. |
| Miles D. Harper, III 1962 | Director | Since 2016 | Private investor (2022-present). Formerly, Partner, Carr Riggs & Ingram (public accounting firm) (2014-2022). Partner, Gainer Donnelly & Desroches (public accounting firm) (now Carr Riggs & Ingram) (1999-2014). Other Directorships. Bridgeway Funds (9) (asset management). |
| Joy V. Jones 1950 | Director | Since 2016 | Attorney. Other Directorships. Palm Management Corporation. |
| Eddie Ramos(2) 1967 | Director | Since 2023 | Private investor (2022-present). Formerly, Head of External Advisors/Diversity Portfolio Management at the New Jersey Division of Investment (2020-2022). Formerly, Chief Investment Officer and Lead Portfolio Manager – Global Fundamental Equities at Cornerstone Capital Management (asset management firm) (2011-2017). Other Directorships. Macquarie Optimum Funds (6) (asset management) (2022-2023). |
| Name and Year of Birth | Corporation Position(s) | Length of Service | Principal Occupation(s) and Other Directorships During Past Five Years and Other Relevant Experience |
| Noninterested Directors (continued) | |||
| Anthony A. Williams 1951 | Director | Since 2016 | CEO and Executive Director of the Federal City Council (July 2012 to present); Senior Adviser and Independent Consultant for King and Spalding LLP (September 2015 to present); Executive Director of Global Government Practice at the Corporate Executive Board (January 2010 to January 2012). Other Directorships. Freddie Mac; Evoq Properties/Meruelo Maddux Properties, Inc. (real estate management); Weston Solutions, Inc. (environmental services); Bipartisan Policy Center’s Debt Reduction Task Force; Chesapeake Bay Foundation; Catholic University of America; Urban Institute (research organization); The Howard Hughes Corporation (real estate development); Old Dominion National Bank. |
| Name and Year of Birth | Corporation Position(s) | Length of Service | Principal Occupation(s) During Past Five Years |
| Principal Officers who are not Directors | |||
| Hope L. Brown 1973 | Chief Compliance Officer | Since 2014 | Chief Compliance Officer of 46 registered investment companies advised by CRM (since 2014). Vice President and Chief Compliance Officer, Wilmington Funds (2012-2014). |
| Deidre E. Walsh 1971 | Secretary, Vice President and Chief Legal Officer | Since 2021 | Vice President of CRM and officer of 46 registered investment companies advised by CRM (since 2021). Also Vice President of Eaton Vance and certain of its affiliates and officer of 127 registered investment companies advised or administered by Eaton Vance. |
| James F. Kirchner 1967 | Treasurer | Since 2016 | Vice President of CRM and officer of 46 registered investment companies advised by CRM (since 2016). Also Vice President of Eaton Vance and certain of its affiliates and officer of 127 registered investment companies advised or administered by Eaton Vance. |
| (1) Mr. Hughes is an interested person of the Fund because of his positions with the Fund’s adviser and certain affiliates. | |||
| (2) Ms. Fang and Mr. Ramos began serving as Directors effective October 30, 2023. | |||
| Privacy Notice | April 2021 |
| FACTS | WHAT DOES EATON VANCE DO WITH YOUR PERSONAL INFORMATION? |
| Why? | Financial companies choose how they share your personal information. Federal law gives consumers the right to limit some but not all sharing. Federal law also requires us to tell you how we collect, share, and protect your personal information. Please read this notice carefully to understand what we do. |
| What? | The types of personal information we collect and share depend on the product or service you have with us. This information can include:■ Social Security number and income ■ investment experience and risk tolerance ■ checking account number and wire transfer instructions |
| How? | All financial companies need to share customers’ personal information to run their everyday business. In the section below, we list the reasons financial companies can share their customers’ personal information; the reasons Eaton Vance chooses to share; and whether you can limit this sharing. |
| Reasons we can share your personal information | Does Eaton Vance share? | Can you limit this sharing? |
| For our everyday business purposes — such as to process your transactions, maintain your account(s), respond to court orders and legal investigations, or report to credit bureaus | Yes | No |
| For our marketing purposes — to offer our products and services to you | Yes | No |
| For joint marketing with other financial companies | No | We don’t share |
| For our investment management affiliates’ everyday business purposes — information about your transactions, experiences, and creditworthiness | Yes | Yes |
| For our affiliates’ everyday business purposes — information about your transactions and experiences | Yes | No |
| For our affiliates’ everyday business purposes — information about your creditworthiness | No | We don’t share |
| For our investment management affiliates to market to you | Yes | Yes |
| For our affiliates to market to you | No | We don’t share |
| For nonaffiliates to market to you | No | We don’t share |
| To limit our sharing | Call toll-free 1-800-368-2745 or email: CRMPrivacy@calvert.comPlease note:If you are a new customer, we can begin sharing your information 30 days from the date we sent this notice. When you are no longer our customer, we continue to share your information as described in this notice. However, you can contact us at any time to limit our sharing. |
| Questions? | Call toll-free 1-800-368-2745 or email: CRMPrivacy@calvert.com |
| Privacy Notice — continued | April 2021 |
| Who we are | |
| Who is providing this notice? | Eaton Vance Management, Eaton Vance Distributors, Inc., Eaton Vance Trust Company, Eaton Vance Management (International) Limited, Eaton Vance Advisers International Ltd., Eaton Vance Global Advisors Limited, Eaton Vance Management’s Real Estate Investment Group, Boston Management and Research, Calvert Research and Management, Eaton Vance and Calvert Fund Families and our investment advisory affiliates (“Eaton Vance”) (see Investment Management Affiliates definition below) |
| What we do | |
| How does Eaton Vance protect my personal information? | To protect your personal information from unauthorized access and use, we use security measures that comply with federal law. These measures include computer safeguards and secured files and buildings. We have policies governing the proper handling of customer information by personnel and requiring third parties that provide support to adhere to appropriate security standards with respect to such information. |
| How does Eaton Vance collect my personal information? | We collect your personal information, for example, when you■ open an account or make deposits or withdrawals from your account ■ buy securities from us or make a wire transfer ■ give us your contact informationWe also collect your personal information from others, such as credit bureaus, affiliates, or other companies. |
| Why can’t I limit all sharing? | Federal law gives you the right to limit only■ sharing for affiliates’ everyday business purposes — information about your creditworthiness ■ affiliates from using your information to market to you ■ sharing for nonaffiliates to market to youState laws and individual companies may give you additional rights to limit sharing. See below for more on your rights under state law. |
| Definitions | |
| Investment Management Affiliates | Eaton Vance Investment Management Affiliates include registered investment advisers, registered broker- dealers, and registered and unregistered funds. Investment Management Affiliates does not include entities associated with Morgan Stanley Wealth Management, such as Morgan Stanley Smith Barney LLC and Morgan Stanley & Co. |
| Affiliates | Companies related by common ownership or control. They can be financial and nonfinancial companies.■ Our affiliates include companies with a Morgan Stanley name and financial companies such as Morgan Stanley Smith Barney LLC and Morgan Stanley & Co. |
| Nonaffiliates | Companies not related by common ownership or control. They can be financial and nonfinancial companies.■ Eaton Vance does not share with nonaffiliates so they can market to you. |
| Joint marketing | A formal agreement between nonaffiliated financial companies that together market financial products or services to you.■ Eaton Vance doesn’t jointly market. |
| Other important information | |
| Vermont: Except as permitted by law, we will not share personal information we collect about Vermont residents with Nonaffiliates unless you provide us with your written consent to share such information.California: Except as permitted by law, we will not share personal information we collect about California residents with Nonaffiliates and we will limit sharing such personal information with our Affiliates to comply with California privacy laws that apply to us. | |


| % Average Annual Total Returns1,2 | Class Inception Date | Performance Inception Date | One Year | Five Years | Ten Years |
| Class F at NAV | 04/30/2013 | 04/30/2013 | 13.79% | 6.33% | 4.95% |
| S&P Global LargeMidCap Managed Risk Index - Moderate Conservative | — | — | 14.46% | 6.48% | 4.82% |
| Moderate Growth Portfolio Blended Benchmark | — | — | 16.71 | 9.04 | 7.00 |
| % Total Annual Operating Expense Ratios3 | Class F |
| Gross | 1.03% |
| Net | 0.89 |

| Asset Allocation (% of total investments) |

| Top 10 Holdings (% of net assets)1 | |
| Vanguard S&P 500 ETF | 15.6% |
| iShares Core U.S. Aggregate Bond ETF | 14.0 |
| Vanguard Total Bond Market ETF | 13.6 |
| Vanguard FTSE Developed Markets ETF | 13.1 |
| iShares S&P 500 Growth ETF | 10.2 |
| iShares S&P 500 Value ETF | 9.1 |
| iShares Russell 2000 ETF | 5.0 |
| iShares Core S&P Mid-Cap ETF | 3.2 |
| Vanguard Real Estate ETF | 2.9 |
| Vanguard FTSE Emerging Markets ETF | 2.4 |
| Total | 89.1% |
| 1 | Excludes cash and cash equivalents. |
| † | The views expressed in this report are those of the portfolio manager(s) and are current only through the date stated at the top of this page. These views are subject to change at any time based upon market or other conditions, and Calvert and the Fund(s) disclaim any responsibility to update such views. These views may not be relied upon as investment advice and, because investment decisions are based on many factors, may not be relied upon as an indication of trading intent on behalf of any Calvert fund. This commentary may contain statements that are not historical facts, referred to as “forward-looking statements.” The Fund’s actual future results may differ significantly from those stated in any forward-looking statement, depending on factors such as changes in securities or financial markets or general economic conditions, the volume of sales and purchases of Fund shares, the continuation of investment advisory, administrative and service contracts, and other risks discussed from time to time in the Fund’s filings with the Securities and Exchange Commission. |
| 1 | S&P Global LargeMidCap Managed Risk Index - Moderate Conservative is an unmanaged index designed to simulate a dynamic protective portfolio that allocates between the underlying equity index and cash, based on realized volatilities of the underlying equity and bond indices, while maintaining a fixed 40% allocation to the underlying bond index. The index has a risk management overlay that seeks to limit the index volatility to 10%, and includes a synthetic put position to reduce downside risk. S&P Dow Jones Indices are a product of S&P Dow Jones Indices LLC (“S&P DJI”) and have been licensed for use. S&P® and S&P 500® are registered trademarks of S&P DJI; Dow Jones® is a registered trademark of Dow Jones Trademark Holdings LLC (“Dow Jones”); S&P DJI, Dow Jones and their respective affiliates do not sponsor, endorse, sell or promote the Fund, will not have any liability with respect thereto and do not have any liability for any errors, omissions, or interruptions of the S&P Dow Jones Indices. Moderate Growth Portfolio Blended Benchmark is an internally constructed benchmark which is comprised of a blend of 47% Russell 3000® Index, 33% Bloomberg U.S. Aggregate Bond Index, 13% MSCI EAFE Index, 4% ICE BofA 3-Month U.S. Treasury Bill Index, and 3% MSCI USA IMI/Equity REITs Index, which is rebalanced monthly. Russell 3000® Index is an unmanaged index of the 3,000 largest U.S. stocks. Bloomberg U.S. Aggregate Bond Index is an unmanaged index of domestic investment-grade bonds, including corporate, government and mortgage-backed securities. MSCI EAFE Index is an unmanaged index of equities in the developed markets, excluding the U.S. and Canada. MSCI USA IMI/Equity REITs Index is an unmanaged index of U.S. equity REITs. MSCI indexes are net of foreign withholding taxes. Source: MSCI. MSCI data may not be reproduced or used for any other purpose. MSCI provides no warranties, has not prepared or approved this report, and has no liability hereunder. ICE BofA 3-Month U.S. Treasury Bill Index is an |
| unmanaged index of U.S. Treasury securities maturing in 90 days. ICE® BofA® indices are not for redistribution or other uses; provided “as is”, without warranties, and with no liability. Eaton Vance has prepared this report and ICE Data Indices, LLC does not endorse it, or guarantee, review, or endorse Eaton Vance’s products. BofA® is a licensed registered trademark of Bank of America Corporation in the United States and other countries. Unless otherwise stated, index returns do not reflect the effect of any applicable sales charges, commissions, expenses, taxes or leverage, as applicable. It is not possible to invest directly in an index. | |
| 2 | There is no sales charge. Insurance-related charges are not included in the calculation of returns. If such charges were reflected, the returns would be lower. Please refer to the report for your insurance contract for performance data reflecting insurance-related charges. Calvert Research and Management became the investment adviser to the Fund on December 31, 2016. Performance reflected prior to such date is that of the Fund’s former investment adviser. |
| 3 | Source: Fund prospectus. Net expense ratio reflects a contractual expense reimbursement that continues through 4/30/24. The expense ratios for the current reporting period can be found in the Financial Highlights section of this report. Performance reflects expenses waived and/or reimbursed, if applicable. Without such waivers and/or reimbursements, performance would have been lower. |
| Fund profile subject to change due to active management. | |
| Additional Information | |
| MSCI ACWI Index is an unmanaged free-float-adjusted, market-capitalization-weighted index designed to measure the equity market performance of developed and emerging markets. S&P 500® Index is an unmanaged index of large-cap stocks commonly used as a measure of U.S. stock market performance. MSCI Golden Dragon Index is an unmanaged index of common stocks traded in China, Hong Kong and Taiwan. Bloomberg U.S. Treasury Index measures the performance of U.S. Treasuries with a maturity of one year or more. Bloomberg U.S. Corporate Bond Index measures the performance of investment-grade U.S. corporate securities with a maturity of one year or more. Bloomberg U.S. Corporate High Yield Index measures USD-denominated, non-investment grade corporate securities. |
| Beginning Account Value (7/1/23) | Ending Account Value (12/31/23) | Expenses Paid During Period* (7/1/23 – 12/31/23) | Annualized Expense Ratio | |
| Actual | ||||
| Class F | $1,000.00 | $1,048.10 | $4.13 ** | 0.80% |
| Hypothetical | ||||
| (5% return per year before expenses) | ||||
| Class F | $1,000.00 | $1,021.17 | $4.08 ** | 0.80% |
| * | Expenses are equal to the Fund's annualized expense ratio, multiplied by the average account value over the period, multiplied by 184/365 (to reflect the one-half year period). The Example assumes that the $1,000 was invested at the net asset value per share determined at the close of business on June 30, 2023. Expenses shown do not include insurance-related charges or direct expenses of Qualified Plans. Expenses do not include fees and expenses incurred indirectly from investment in exchange-traded funds (the Underlying Funds). |
| ** | Absent a waiver and/or reimbursement of expenses by affiliate(s), expenses would be higher. |
| Exchange-Traded Funds — 93.8% |
| Security | Shares | Value | |
| Equity Funds — 63.1% | |||
| Financial Select Sector SPDR Fund | 29,000 | $ 1,090,400 | |
| iShares Core S&P Mid-Cap ETF | 8,000 | 2,217,200 | |
| iShares Russell 2000 ETF(1) | 17,000 | 3,412,070 | |
| iShares S&P 500 Growth ETF(1) | 93,000 | 6,984,300 | |
| iShares S&P 500 Value ETF | 36,000 | 6,260,040 | |
| Vanguard FTSE Developed Markets ETF | 188,000 | 9,005,200 | |
| Vanguard FTSE Emerging Markets ETF | 40,000 | 1,644,000 | |
| Vanguard Real Estate ETF | 23,000 | 2,032,280 | |
| Vanguard S&P 500 ETF | 24,500 | 10,701,600 | |
| $43,347,090 | |||
| Fixed-Income Funds — 30.7% | |||
| iShares 1-3 Year Treasury Bond ETF | 10,000 | $ 820,400 | |
| iShares Core U.S. Aggregate Bond ETF | 97,000 | 9,627,250 | |
| iShares iBoxx $ Investment Grade Corporate Bond ETF | 12,000 | 1,327,920 | |
| Vanguard Total Bond Market ETF | 127,000 | 9,340,850 | |
| $21,116,420 | |||
| Total Exchange-Traded Funds (identified cost $48,500,354) | $64,463,510 | ||
| Short-Term Investments — 6.9% | |||
| Affiliated Fund — 6.4% | |||
| Security | Shares | Value | |
| Morgan Stanley Institutional Liquidity Funds - Government Portfolio, Institutional Class, 5.27%(2) | 4,395,634 | $ 4,395,634 | |
| Total Affiliated Fund (identified cost $4,395,634) | $ 4,395,634 | ||
| Securities Lending Collateral — 0.5% | |||
| Security | Shares | Value | |
| State Street Navigator Securities Lending Government Money Market Portfolio, 5.36%(3) | 344,883 | $ 344,883 | |
| Total Securities Lending Collateral (identified cost $344,883) | $ 344,883 | ||
| Total Short-Term Investments (identified cost $4,740,517) | $ 4,740,517 | ||
| Total Investments — 100.7% (identified cost $53,240,871) | $69,204,027 | ||
| Other Assets, Less Liabilities — (0.7)% | $ (494,071) | ||
| Net Assets — 100.0% | $ 68,709,956 | ||
| The percentage shown for each investment category in the Schedule of Investments is based on net assets. | |
| (1) | All or a portion of this security was on loan at December 31, 2023. The aggregate market value of securities on loan at December 31, 2023 was $4,232,512. |
| (2) | May be deemed to be an affiliated investment company. The rate shown is the annualized seven-day yield as of December 31, 2023. |
| (3) | Represents investment of cash collateral received in connection with securities lending. |
| Description | Number of Contracts | Position | Expiration Date | Notional Amount | Value/ Unrealized Appreciation (Depreciation) |
| Equity Futures | |||||
| E-mini S&P 500 Index | 2 | Long | 3/15/24 | $482,000 | $ 15,870 |
| E-mini S&P MidCap 400 Index | 1 | Long | 3/15/24 | 280,950 | 13,944 |
| MSCI EAFE Index | 2 | Long | 3/15/24 | 225,240 | 8,595 |
| $38,409 |
| December 31, 2023 | |
| Assets | |
| Investments in securities of unaffiliated issuers, at value (identified cost $48,845,237) - including $4,232,512 of securities on loan | $ 64,808,393 |
| Investments in securities of affiliated issuers, at value (identified cost $4,395,634) | 4,395,634 |
| Deposits at broker for futures contracts | 46,000 |
| Receivable for capital shares sold | 7,126 |
| Dividends receivable - affiliated | 17,271 |
| Securities lending income receivable | 2,485 |
| Receivable from affiliates | 7,394 |
| Directors' deferred compensation plan | 18,640 |
| Total assets | $69,302,943 |
| Liabilities | |
| Payable for variation margin on open futures contracts | $ 3,760 |
| Payable for capital shares redeemed | 127,330 |
| Deposits for securities loaned | 344,883 |
| Payable to affiliates: | |
| Investment advisory fee | 22,539 |
| Administrative fee | 6,921 |
| Distribution fees | 14,419 |
| Sub-transfer agency fee | 41 |
| Directors' deferred compensation plan | 18,640 |
| Accrued expenses | 54,454 |
| Total liabilities | $ 592,987 |
| Net Assets | $68,709,956 |
| Sources of Net Assets | |
| Paid-in capital | $ 51,375,720 |
| Distributable earnings | 17,334,236 |
| Net Assets | $68,709,956 |
| Class F Shares | |
| Net Assets | $ 68,709,956 |
| Shares Outstanding | 3,562,887 |
| Net Asset Value, Offering Price and Redemption Price Per Share (net assets ÷ shares of beneficial interest outstanding) | $ 19.28 |
| Year Ended | |
| December 31, 2023 | |
| Investment Income | |
| Dividend income | $ 1,565,897 |
| Dividend income - affiliated issuers | 187,773 |
| Securities lending income, net | 17,457 |
| Total investment income | $1,771,127 |
| Expenses | |
| Investment advisory fee | $ 274,605 |
| Administrative fee | 82,382 |
| Distribution fees | 171,628 |
| Directors' fees and expenses | 4,747 |
| Custodian fees | 2,745 |
| Transfer agency fees and expenses | 50,009 |
| Accounting fees | 18,313 |
| Professional fees | 36,858 |
| Reports to shareholders | 2,915 |
| Miscellaneous | 6,163 |
| Total expenses | $ 650,365 |
| Waiver and/or reimbursement of expenses by affiliates | $ (99,944) |
| Net expenses | $ 550,421 |
| Net investment income | $1,220,706 |
| Realized and Unrealized Gain (Loss) | |
| Net realized gain (loss): | |
| Investment securities | $ 3,454,542 |
| Futures contracts | (914,998) |
| Net realized gain | $2,539,544 |
| Change in unrealized appreciation (depreciation): | |
| Investment securities | $ 5,496,111 |
| Futures contracts | (382,709) |
| Net change in unrealized appreciation (depreciation) | $5,113,402 |
| Net realized and unrealized gain | $7,652,946 |
| Net increase in net assets from operations | $8,873,652 |
| Year Ended December 31, | ||
| 2023 | 2022 | |
| Increase (Decrease) in Net Assets | ||
| From operations: | ||
| Net investment income | $ 1,220,706 | $ 914,970 |
| Net realized gain | 2,539,544 | 2,212,243 |
| Net change in unrealized appreciation (depreciation) | 5,113,402 | (15,948,660) |
| Net increase (decrease) in net assets from operations | $ 8,873,652 | $(12,821,447) |
| Distributions to shareholders | $ (4,984,501) | $ (3,100,519) |
| Net decrease in net assets from capital share transactions | $ (4,018,545) | $ (5,597,124) |
| Net decrease in net assets | $ (129,394) | $(21,519,090) |
| Net Assets | ||
| At beginning of year | $ 68,839,350 | $ 90,358,440 |
| At end of year | $68,709,956 | $ 68,839,350 |
| Class F | |||||
| Year Ended December 31, | |||||
| 2023 | 2022 | 2021 | 2020 | 2019 | |
| Net asset value — Beginning of year | $ 18.33 | $ 22.49 | $ 19.99 | $ 19.81 | $ 17.18 |
| Income (Loss) From Operations | |||||
| Net investment income(1) | $ 0.34 | $ 0.24 | $ 0.18 | $ 0.20 | $ 0.29 |
| Net realized and unrealized gain (loss) | 2.08 | (3.55) | 2.54 | 0.51 | 2.86 |
| Total income (loss) from operations | $ 2.42 | $ (3.31) | $ 2.72 | $ 0.71 | $ 3.15 |
| Less Distributions | |||||
| From net investment income | $ (0.27) | $ (0.21) | $ (0.22) | $ (0.31) | $ (0.28) |
| From net realized gain | (1.20) | (0.64) | — | (0.22) | (0.24) |
| Total distributions | $ (1.47) | $ (0.85) | $ (0.22) | $ (0.53) | $ (0.52) |
| Net asset value — End of year | $ 19.28 | $ 18.33 | $ 22.49 | $ 19.99 | $ 19.81 |
| Total Return(2) | 13.79% | (14.61)% | 13.64% | 3.82% | 18.56% |
| Ratios/Supplemental Data | |||||
| Net assets, end of year (000’s omitted) | $68,710 | $68,839 | $90,358 | $86,356 | $89,181 |
| Ratios (as a percentage of average daily net assets):(3)(4) | |||||
| Total expenses | 0.95% | 0.95% | 0.92% | 0.95% | 0.91% |
| Net expenses | 0.80% (5) | 0.81% (5) | 0.81% | 0.83% | 0.83% |
| Net investment income | 1.78% | 1.20% | 0.83% | 1.06% | 1.56% |
| Portfolio Turnover | 10% | 20% | 10% | 16% | 7% |
| (1) | Computed using average shares outstanding. |
| (2) | Returns are historical and are calculated by determining the percentage change in net asset value with all distributions reinvested and do not reflect fees and expenses imposed by variable annuity contracts or variable life insurance policies. If included, total return would be lower. |
| (3) | Total expenses do not reflect amounts reimbursed and/or waived by the adviser and certain of its affiliates, if applicable. Net expenses are net of all reductions and represent the net expenses paid by the Fund. |
| (4) | Amounts do not include the expenses of the Underlying Funds. |
| (5) | Includes a reduction by the investment adviser of a portion of its advisory fee due to the Fund’s investment in the Liquidity Fund (equal to 0.01% and less than 0.01% of average daily net assets for the years ended December 31, 2023 and 2022, respectively). |
| Asset Description | Level 1 | Level 2 | Level 3 | Total |
| Exchange-Traded Funds | $ 64,463,510 | $ — | $ — | $ 64,463,510 |
| Short-Term Investments: | ||||
| Affiliated Fund | 4,395,634 | — | — | 4,395,634 |
| Securities Lending Collateral | 344,883 | — | — | 344,883 |
| Total Investments | $69,204,027 | $ — | $ — | $69,204,027 |
| Asset Description (continued) | Level 1 | Level 2 | Level 3 | Total |
| Futures Contracts | $ 38,409 | $ — | $ — | $ 38,409 |
| Total | $69,242,436 | $ — | $ — | $69,242,436 |
| Year Ended December 31, | ||
| 2023 | 2022 | |
| Ordinary income | $2,149,032 | $ 758,551 |
| Long-term capital gains | $2,835,469 | $2,341,968 |
| Undistributed ordinary income | $ 1,792,070 |
| Undistributed long-term capital gains | 2,342,403 |
| Net unrealized appreciation | 13,199,763 |
| Distributable earnings | $17,334,236 |
| Aggregate cost | $56,004,264 |
| Gross unrealized appreciation | $ 15,263,617 |
| Gross unrealized depreciation | (2,063,854) |
| Net unrealized appreciation | $13,199,763 |
| Derivative | Statement of Assets and Liabilities Caption | Assets | Liabilities | |
| Futures contracts | Distributable earnings | $38,409 (1) | $ — | |
| (1) | Only the current day's variation margin is reported within the Statement of Assets and Liabilities as Receivable or Payable for variation margin on open futures contracts, as applicable. |
| Statement of Operations Caption | |||
| Derivative | Net realized gain (loss): Futures contracts | Change in unrealized appreciation (depreciation): Futures contracts | |
| Futures contracts | $ (914,998) | $ (382,709) | |
| Remaining Contractual Maturity of the Transactions | |||||
| Overnight and Continuous | <30 days | 30 to 90 days | >90 days | Total | |
| Exchange-Traded Funds | $344,883 | $ — | $ — | $ — | $344,883 |
| Name | Value, beginning of period | Purchases | Sales proceeds | Net realized gain (loss) | Change in unrealized appreciation (depreciation) | Value, end of period | Dividend income | Shares, end of period |
| Short-Term Investments | ||||||||
| Liquidity Fund | $2,725,784 | $16,698,798 | $(15,028,948) | $ — | $ — | $4,395,634 | $187,773 | 4,395,634 |
| Year Ended December 31, 2023 | Year Ended December 31, 2022 | ||||
| Shares | Amount | Shares | Amount | ||
| Class F | |||||
| Shares sold | 23,578 | $ 452,357 | 27,805 | $ 574,763 | |
| Reinvestment of distributions | 278,931 | 4,984,501 | 175,866 | 3,100,519 | |
| Shares redeemed | (495,113) | (9,455,403) | (466,578) | (9,272,406) | |
| Net decrease | (192,604) | $(4,018,545) | (262,907) | $(5,597,124) | |
Boston, Massachusetts
February 16, 2024
| Name and Year of Birth | Corporation Position(s) | Length of Service | Principal Occupation(s) and Other Directorships During Past Five Years and Other Relevant Experience |
| Interested Director | |||
| Von M. Hughes(1) 1969 | Director and President | Since 2023 | President and Chief Executive Officer and Managing Director of Calvert Research and Management. Managing Director of Morgan Stanley Investment Management (MSIM) (since 2022). Formerly, Managing Director of PAAMCO Prisma (investment management firm) (2003-2022). Mr. Hughes is an interested person because of his positions with CRM and certain affiliates. Other Directorships. Tradeweb Markets Inc. (financial services) (2021-2022); National Association of Investment Companies (2018-2021). |
| Noninterested Directors | |||
| Alice Gresham Bullock 1950 | Chair and Director | Since 2016 (Chair); Since 2008 (Director) | Professor Emerita at Howard University School of Law. Dean Emerita of Howard University School of Law and Deputy Director of the Association of American Law Schools (1992-1994). Other Directorships. None. |
| Cari M. Dominguez 1949 | Director | Since 2016 | Former Chair of the U.S. Equal Employment Opportunity Commission. Other Directorships. ManpowerGroup Inc. (workforce solutions company); Triple S Management Corporation (managed care); National Association of Corporate Directors. |
| Karen Fang(2) 1958 | Director | Since 2023 | Formerly, Managing Director, Wealth Management at GAMCO Asset Management (asset management firm) (2020-2023). Formerly, Managing Director, Senior Portfolio Manager of Fiduciary Trust Company International (wealth management firm) (1993-2019). Other Directorships. None. |
| Miles D. Harper, III 1962 | Director | Since 2016 | Private investor (2022-present). Formerly, Partner, Carr Riggs & Ingram (public accounting firm) (2014-2022). Partner, Gainer Donnelly & Desroches (public accounting firm) (now Carr Riggs & Ingram) (1999-2014). Other Directorships. Bridgeway Funds (9) (asset management). |
| Joy V. Jones 1950 | Director | Since 2016 | Attorney. Other Directorships. Palm Management Corporation. |
| Eddie Ramos(2) 1967 | Director | Since 2023 | Private investor (2022-present). Formerly, Head of External Advisors/Diversity Portfolio Management at the New Jersey Division of Investment (2020-2022). Formerly, Chief Investment Officer and Lead Portfolio Manager – Global Fundamental Equities at Cornerstone Capital Management (asset management firm) (2011-2017). Other Directorships. Macquarie Optimum Funds (6) (asset management) (2022-2023). |
| Name and Year of Birth | Corporation Position(s) | Length of Service | Principal Occupation(s) and Other Directorships During Past Five Years and Other Relevant Experience |
| Noninterested Directors (continued) | |||
| Anthony A. Williams 1951 | Director | Since 2016 | CEO and Executive Director of the Federal City Council (July 2012 to present); Senior Adviser and Independent Consultant for King and Spalding LLP (September 2015 to present); Executive Director of Global Government Practice at the Corporate Executive Board (January 2010 to January 2012). Other Directorships. Freddie Mac; Evoq Properties/Meruelo Maddux Properties, Inc. (real estate management); Weston Solutions, Inc. (environmental services); Bipartisan Policy Center’s Debt Reduction Task Force; Chesapeake Bay Foundation; Catholic University of America; Urban Institute (research organization); The Howard Hughes Corporation (real estate development); Old Dominion National Bank. |
| Name and Year of Birth | Corporation Position(s) | Length of Service | Principal Occupation(s) During Past Five Years |
| Principal Officers who are not Directors | |||
| Hope L. Brown 1973 | Chief Compliance Officer | Since 2014 | Chief Compliance Officer of 46 registered investment companies advised by CRM (since 2014). Vice President and Chief Compliance Officer, Wilmington Funds (2012-2014). |
| Deidre E. Walsh 1971 | Secretary, Vice President and Chief Legal Officer | Since 2021 | Vice President of CRM and officer of 46 registered investment companies advised by CRM (since 2021). Also Vice President of Eaton Vance and certain of its affiliates and officer of 127 registered investment companies advised or administered by Eaton Vance. |
| James F. Kirchner 1967 | Treasurer | Since 2016 | Vice President of CRM and officer of 46 registered investment companies advised by CRM (since 2016). Also Vice President of Eaton Vance and certain of its affiliates and officer of 127 registered investment companies advised or administered by Eaton Vance. |
| (1) Mr. Hughes is an interested person of the Fund because of his positions with the Fund’s adviser and certain affiliates. | |||
| (2) Ms. Fang and Mr. Ramos began serving as Directors effective October 30, 2023. | |||
| Privacy Notice | April 2021 |
| FACTS | WHAT DOES EATON VANCE DO WITH YOUR PERSONAL INFORMATION? |
| Why? | Financial companies choose how they share your personal information. Federal law gives consumers the right to limit some but not all sharing. Federal law also requires us to tell you how we collect, share, and protect your personal information. Please read this notice carefully to understand what we do. |
| What? | The types of personal information we collect and share depend on the product or service you have with us. This information can include:■ Social Security number and income ■ investment experience and risk tolerance ■ checking account number and wire transfer instructions |
| How? | All financial companies need to share customers’ personal information to run their everyday business. In the section below, we list the reasons financial companies can share their customers’ personal information; the reasons Eaton Vance chooses to share; and whether you can limit this sharing. |
| Reasons we can share your personal information | Does Eaton Vance share? | Can you limit this sharing? |
| For our everyday business purposes — such as to process your transactions, maintain your account(s), respond to court orders and legal investigations, or report to credit bureaus | Yes | No |
| For our marketing purposes — to offer our products and services to you | Yes | No |
| For joint marketing with other financial companies | No | We don’t share |
| For our investment management affiliates’ everyday business purposes — information about your transactions, experiences, and creditworthiness | Yes | Yes |
| For our affiliates’ everyday business purposes — information about your transactions and experiences | Yes | No |
| For our affiliates’ everyday business purposes — information about your creditworthiness | No | We don’t share |
| For our investment management affiliates to market to you | Yes | Yes |
| For our affiliates to market to you | No | We don’t share |
| For nonaffiliates to market to you | No | We don’t share |
| To limit our sharing | Call toll-free 1-800-368-2745 or email: CRMPrivacy@calvert.comPlease note:If you are a new customer, we can begin sharing your information 30 days from the date we sent this notice. When you are no longer our customer, we continue to share your information as described in this notice. However, you can contact us at any time to limit our sharing. |
| Questions? | Call toll-free 1-800-368-2745 or email: CRMPrivacy@calvert.com |
| Privacy Notice — continued | April 2021 |
| Who we are | |
| Who is providing this notice? | Eaton Vance Management, Eaton Vance Distributors, Inc., Eaton Vance Trust Company, Eaton Vance Management (International) Limited, Eaton Vance Advisers International Ltd., Eaton Vance Global Advisors Limited, Eaton Vance Management’s Real Estate Investment Group, Boston Management and Research, Calvert Research and Management, Eaton Vance and Calvert Fund Families and our investment advisory affiliates (“Eaton Vance”) (see Investment Management Affiliates definition below) |
| What we do | |
| How does Eaton Vance protect my personal information? | To protect your personal information from unauthorized access and use, we use security measures that comply with federal law. These measures include computer safeguards and secured files and buildings. We have policies governing the proper handling of customer information by personnel and requiring third parties that provide support to adhere to appropriate security standards with respect to such information. |
| How does Eaton Vance collect my personal information? | We collect your personal information, for example, when you■ open an account or make deposits or withdrawals from your account ■ buy securities from us or make a wire transfer ■ give us your contact informationWe also collect your personal information from others, such as credit bureaus, affiliates, or other companies. |
| Why can’t I limit all sharing? | Federal law gives you the right to limit only■ sharing for affiliates’ everyday business purposes — information about your creditworthiness ■ affiliates from using your information to market to you ■ sharing for nonaffiliates to market to youState laws and individual companies may give you additional rights to limit sharing. See below for more on your rights under state law. |
| Definitions | |
| Investment Management Affiliates | Eaton Vance Investment Management Affiliates include registered investment advisers, registered broker- dealers, and registered and unregistered funds. Investment Management Affiliates does not include entities associated with Morgan Stanley Wealth Management, such as Morgan Stanley Smith Barney LLC and Morgan Stanley & Co. |
| Affiliates | Companies related by common ownership or control. They can be financial and nonfinancial companies.■ Our affiliates include companies with a Morgan Stanley name and financial companies such as Morgan Stanley Smith Barney LLC and Morgan Stanley & Co. |
| Nonaffiliates | Companies not related by common ownership or control. They can be financial and nonfinancial companies.■ Eaton Vance does not share with nonaffiliates so they can market to you. |
| Joint marketing | A formal agreement between nonaffiliated financial companies that together market financial products or services to you.■ Eaton Vance doesn’t jointly market. |
| Other important information | |
| Vermont: Except as permitted by law, we will not share personal information we collect about Vermont residents with Nonaffiliates unless you provide us with your written consent to share such information.California: Except as permitted by law, we will not share personal information we collect about California residents with Nonaffiliates and we will limit sharing such personal information with our Affiliates to comply with California privacy laws that apply to us. | |


| % Average Annual Total Returns1,2 | Class Inception Date | Performance Inception Date | One Year | Five Years | Ten Years |
| Class F at NAV | 04/30/2013 | 04/30/2013 | 15.65% | 6.78% | 4.91% |
| S&P Global LargeMidCap Managed Risk Index - Moderate Aggressive | — | — | 17.89% | 8.20% | 5.64% |
| Growth Portfolio Blended Benchmark | — | — | 19.43 | 10.81 | 8.15 |
| % Total Annual Operating Expense Ratios3 | Class F |
| Gross | 1.02% |
| Net | 0.91 |
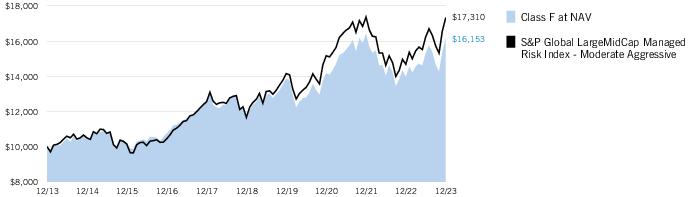
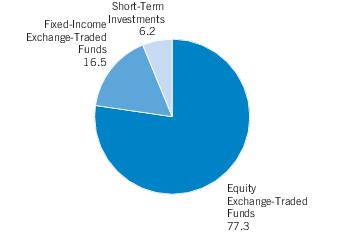
| Top 10 Holdings (% of net assets)1 | |
| Vanguard S&P 500 ETF | 17.5% |
| Vanguard FTSE Developed Markets ETF | 16.2 |
| iShares S&P 500 Growth ETF | 14.0 |
| iShares S&P 500 Value ETF | 13.4 |
| iShares Core U.S. Aggregate Bond ETF | 13.3 |
| iShares Russell 2000 ETF | 5.5 |
| Vanguard Real Estate ETF | 3.9 |
| iShares Core S&P Mid-Cap ETF | 3.3 |
| Vanguard FTSE Emerging Markets ETF | 2.7 |
| iShares iBoxx $ Investment Grade Corporate Bond ETF | 2.0 |
| Total | 91.8% |
| 1 | Excludes cash and cash equivalents. |
| † | The views expressed in this report are those of the portfolio manager(s) and are current only through the date stated at the top of this page. These views are subject to change at any time based upon market or other conditions, and Calvert and the Fund(s) disclaim any responsibility to update such views. These views may not be relied upon as investment advice and, because investment decisions are based on many factors, may not be relied upon as an indication of trading intent on behalf of any Calvert fund. This commentary may contain statements that are not historical facts, referred to as “forward-looking statements.” The Fund’s actual future results may differ significantly from those stated in any forward-looking statement, depending on factors such as changes in securities or financial markets or general economic conditions, the volume of sales and purchases of Fund shares, the continuation of investment advisory, administrative and service contracts, and other risks discussed from time to time in the Fund’s filings with the Securities and Exchange Commission. |
| 1 | S&P Global LargeMidCap Managed Risk Index - Moderate Aggressive is an unmanaged index designed to simulate a dynamic protective portfolio that allocates between the underlying equity index and cash, based on realized volatilities of the underlying equity and bond indices, while maintaining a fixed 20% allocation to the underlying bond index. The index has a risk management overlay that seeks to limit the index volatility to 14%, and includes a synthetic put position to reduce downside risk. The launch date of the S&P Global LargeMidCap Managed Risk Index - Moderate Aggressive was September 6, 2016; information presented prior to the index launch date is back-tested. Back-tested performance is not actual performance, but is hypothetical. The back-test calculations are based on the same methodology that was in effect when the index was officially launched. S&P Dow Jones Indices are a product of S&P Dow Jones Indices LLC (“S&P DJI”) and have been licensed for use. S&P® and S&P 500® are registered trademarks of S&P DJI; Dow Jones® is a registered trademark of Dow Jones Trademark Holdings LLC (“Dow Jones”); S&P DJI, Dow Jones and their respective affiliates do not sponsor, endorse, sell or promote the Fund, will not have any liability with respect thereto and do not have any liability for any errors, omissions, or interruptions of the S&P Dow Jones Indices. Growth Portfolio Blended Benchmark is an internally constructed benchmark which is comprised of a blend of 58% Russell 3000® Index, 18% Bloomberg U.S. Aggregate Bond Index, 16% MSCI EAFE Index, 4% ICE BofA 3-Month U.S. Treasury Bill Index, and 4% MSCI USA IMI/Equity REITs Index, which is rebalanced monthly. Russell 3000® Index is an unmanaged index of the 3,000 largest U.S. stocks. Bloomberg U.S. Aggregate Bond Index is an unmanaged index of domestic investment-grade bonds, including corporate, government and mortgage-backed securities. MSCI EAFE Index is an unmanaged index of equities in the developed markets, |
| excluding the U.S. and Canada. MSCI USA IMI/Equity REITs Index is an unmanaged index of U.S. equity REITs. MSCI indexes are net of foreign withholding taxes. Source: MSCI. MSCI data may not be reproduced or used for any other purpose. MSCI provides no warranties, has not prepared or approved this report, and has no liability hereunder. ICE BofA 3-Month U.S. Treasury Bill Index is an unmanaged index of U.S. Treasury securities maturing in 90 days. ICE® BofA® indices are not for redistribution or other uses; provided “as is”, without warranties, and with no liability. Eaton Vance has prepared this report and ICE Data Indices, LLC does not endorse it, or guarantee, review, or endorse Eaton Vance’s products. BofA® is a licensed registered trademark of Bank of America Corporation in the United States and other countries. Unless otherwise stated, index returns do not reflect the effect of any applicable sales charges, commissions, expenses, taxes or leverage, as applicable. It is not possible to invest directly in an index. | |
| 2 | There is no sales charge. Insurance-related charges are not included in the calculation of returns. If such charges were reflected, the returns would be lower. Please refer to the report for your insurance contract for performance data reflecting insurance-related charges. Calvert Research and Management became the investment adviser to the Fund on December 31, 2016. Performance reflected prior to such date is that of the Fund’s former investment adviser. |
| 3 | Source: Fund prospectus. Net expense ratio reflects a contractual expense reimbursement that continues through 4/30/24. The expense ratios for the current reporting period can be found in the Financial Highlights section of this report. Performance reflects expenses waived and/or reimbursed, if applicable. Without such waivers and/or reimbursements, performance would have been lower. |
| Fund profile subject to change due to active management. | |
| Additional Information | |
| MSCI ACWI Index is an unmanaged free-float-adjusted, market-capitalization-weighted index designed to measure the equity market performance of developed and emerging markets. S&P 500® Index is an unmanaged index of large-cap stocks commonly used as a measure of U.S. stock market performance. MSCI Golden Dragon Index is an unmanaged index of common stocks traded in China, Hong Kong and Taiwan. Bloomberg U.S. Treasury Index measures the performance of U.S. Treasuries with a maturity of one year or more. Bloomberg U.S. Corporate Bond Index measures the performance of investment-grade U.S. corporate securities with a maturity of one year or more. Bloomberg U.S. Corporate High Yield Index measures USD-denominated, non-investment grade corporate securities. |
| Beginning Account Value (7/1/23) | Ending Account Value (12/31/23) | Expenses Paid During Period* (7/1/23 – 12/31/23) | Annualized Expense Ratio | |
| Actual | ||||
| Class F | $1,000.00 | $1,055.20 | $4.14 ** | 0.80% |
| Hypothetical | ||||
| (5% return per year before expenses) | ||||
| Class F | $1,000.00 | $1,021.17 | $4.08 ** | 0.80% |
| * | Expenses are equal to the Fund's annualized expense ratio, multiplied by the average account value over the period, multiplied by 184/365 (to reflect the one-half year period). The Example assumes that the $1,000 was invested at the net asset value per share determined at the close of business on June 30, 2023. Expenses shown do not include insurance-related charges or direct expenses of Qualified Plans. Expenses do not include fees and expenses incurred indirectly from investment in exchange-traded funds (the Underlying Funds). |
| ** | Absent a waiver and/or reimbursement of expenses by affiliate(s), expenses would be higher. |
| Exchange-Traded Funds — 94.6% |
| Security | Shares | Value | |
| Equity Funds — 77.9% | |||
| Financial Select Sector SPDR Fund | 39,000 | $ 1,466,400 | |
| iShares Core S&P Mid-Cap ETF | 12,500 | 3,464,375 | |
| iShares Russell 2000 ETF | 29,000 | 5,820,590 | |
| iShares S&P 500 Growth ETF(1) | 195,000 | 14,644,500 | |
| iShares S&P 500 Value ETF | 81,000 | 14,085,090 | |
| Vanguard FTSE Developed Markets ETF | 355,000 | 17,004,500 | |
| Vanguard FTSE Emerging Markets ETF | 69,000 | 2,835,900 | |
| Vanguard Real Estate ETF | 46,000 | 4,064,560 | |
| Vanguard S&P 500 ETF | 42,000 | 18,345,600 | |
| $ 81,731,515 | |||
| Fixed-Income Funds — 16.7% | |||
| iShares 1-3 Year Treasury Bond ETF | 18,000 | $ 1,476,720 | |
| iShares Core U.S. Aggregate Bond ETF | 140,000 | 13,895,000 | |
| iShares iBoxx $ Investment Grade Corporate Bond ETF | 19,000 | 2,102,540 | |
| $ 17,474,260 | |||
| Total Exchange-Traded Funds (identified cost $64,991,408) | $ 99,205,775 | ||
| Short-Term Investments — 6.2% | |||
| Affiliated Fund — 5.2% | |||
| Security | Shares | Value | |
| Morgan Stanley Institutional Liquidity Funds - Government Portfolio, Institutional Class, 5.27%(2) | 5,500,900 | $ 5,500,900 | |
| Total Affiliated Fund (identified cost $5,500,900) | $ 5,500,900 | ||
| Securities Lending Collateral — 1.0% | |||
| Security | Shares | Value | |
| State Street Navigator Securities Lending Government Money Market Portfolio, 5.36%(3) | 1,031,415 | $ 1,031,415 | |
| Total Securities Lending Collateral (identified cost $1,031,415) | $ 1,031,415 | ||
| Total Short-Term Investments (identified cost $6,532,315) | $ 6,532,315 | ||
| Total Investments — 100.8% (identified cost $71,523,723) | $105,738,090 | ||
| Other Assets, Less Liabilities — (0.8)% | $ (866,148) | ||
| Net Assets — 100.0% | $ 104,871,942 | ||
| The percentage shown for each investment category in the Schedule of Investments is based on net assets. | |
| (1) | All or a portion of this security was on loan at December 31, 2023. The aggregate market value of securities on loan at December 31, 2023 was $3,289,005. |
| (2) | May be deemed to be an affiliated investment company. The rate shown is the annualized seven-day yield as of December 31, 2023. |
| (3) | Represents investment of cash collateral received in connection with securities lending. |
| Description | Number of Contracts | Position | Expiration Date | Notional Amount | Value/ Unrealized Appreciation (Depreciation) |
| Equity Futures | |||||
| E-mini S&P 500 Index | 12 | Long | 3/15/24 | $2,892,000 | $ 73,927 |
| E-mini S&P MidCap 400 Index | 5 | Long | 3/15/24 | 1,404,750 | 70,687 |
| MSCI EAFE Index | 13 | Long | 3/15/24 | 1,464,060 | 52,724 |
| $197,338 |
| December 31, 2023 | |
| Assets | |
| Investments in securities of unaffiliated issuers, at value (identified cost $66,022,823) - including $3,289,005 of securities on loan | $ 100,237,190 |
| Investments in securities of affiliated issuers, at value (identified cost $5,500,900) | 5,500,900 |
| Deposits at broker for futures contracts | 266,000 |
| Dividends receivable | 16,684 |
| Dividends receivable - affiliated | 22,099 |
| Securities lending income receivable | 4,889 |
| Receivable from affiliates | 9,425 |
| Directors' deferred compensation plan | 32,541 |
| Total assets | $106,089,728 |
| Liabilities | |
| Payable for variation margin on open futures contracts | $ 19,702 |
| Payable for capital shares redeemed | 2,704 |
| Deposits for securities loaned | 1,031,415 |
| Payable to affiliates: | |
| Investment advisory fee | 34,388 |
| Administrative fee | 10,520 |
| Distribution fees | 21,918 |
| Sub-transfer agency fee | 39 |
| Directors' deferred compensation plan | 32,541 |
| Accrued expenses | 64,559 |
| Total liabilities | $ 1,217,786 |
| Net Assets | $104,871,942 |
| Sources of Net Assets | |
| Paid-in capital | $ 68,686,579 |
| Distributable earnings | 36,185,363 |
| Net Assets | $104,871,942 |
| Class F Shares | |
| Net Assets | $ 104,871,942 |
| Shares Outstanding | 5,095,261 |
| Net Asset Value, Offering Price and Redemption Price Per Share (net assets ÷ shares of beneficial interest outstanding) | $ 20.58 |
| Year Ended | |
| December 31, 2023 | |
| Investment Income | |
| Dividend income | $ 2,210,798 |
| Dividend income - affiliated issuers | 280,922 |
| Securities lending income, net | 32,457 |
| Total investment income | $ 2,524,177 |
| Expenses | |
| Investment advisory fee | $ 422,189 |
| Administrative fee | 126,657 |
| Distribution fees | 263,868 |
| Directors' fees and expenses | 7,275 |
| Custodian fees | 4,381 |
| Transfer agency fees and expenses | 76,585 |
| Accounting fees | 26,606 |
| Professional fees | 41,545 |
| Reports to shareholders | 1,060 |
| Miscellaneous | 6,993 |
| Total expenses | $ 977,159 |
| Waiver and/or reimbursement of expenses by affiliates | $ (130,860) |
| Net expenses | $ 846,299 |
| Net investment income | $ 1,677,878 |
| Realized and Unrealized Gain (Loss) | |
| Net realized gain (loss): | |
| Investment securities | $ 8,117,338 |
| Futures contracts | (2,066,837) |
| Net realized gain | $ 6,050,501 |
| Change in unrealized appreciation (depreciation): | |
| Investment securities | $ 8,246,817 |
| Futures contracts | (623,235) |
| Net change in unrealized appreciation (depreciation) | $ 7,623,582 |
| Net realized and unrealized gain | $13,674,083 |
| Net increase in net assets from operations | $15,351,961 |
| Year Ended December 31, | ||
| 2023 | 2022 | |
| Increase (Decrease) in Net Assets | ||
| From operations: | ||
| Net investment income | $ 1,677,878 | $ 1,338,012 |
| Net realized gain | 6,050,501 | 4,520,800 |
| Net change in unrealized appreciation (depreciation) | 7,623,582 | (26,617,673) |
| Net increase (decrease) in net assets from operations | $ 15,351,961 | $ (20,758,861) |
| Distributions to shareholders | $ (9,589,892) | $ (3,642,609) |
| Net decrease in net assets from capital share transactions | $ (10,658,801) | $ (7,763,282) |
| Net decrease in net assets | $ (4,896,732) | $ (32,164,752) |
| Net Assets | ||
| At beginning of year | $ 109,768,674 | $ 141,933,426 |
| At end of year | $104,871,942 | $109,768,674 |
| Class F | |||||
| Year Ended December 31, | |||||
| 2023 | 2022 | 2021 | 2020 | 2019 | |
| Net asset value — Beginning of year | $ 19.67 | $ 23.93 | $ 20.86 | $ 20.77 | $ 17.67 |
| Income (Loss) From Operations | |||||
| Net investment income(1) | $ 0.33 | $ 0.23 | $ 0.18 | $ 0.20 | $ 0.29 |
| Net realized and unrealized gain (loss) | 2.58 | (3.83) | 3.12 | 0.22 | 3.08 |
| Total income (loss) from operations | $ 2.91 | $ (3.60) | $ 3.30 | $ 0.42 | $ 3.37 |
| Less Distributions | |||||
| From net investment income | $ (0.28) | $ (0.21) | $ (0.23) | $ (0.33) | $ (0.27) |
| From net realized gain | (1.72) | (0.45) | — | — | — |
| Total distributions | $ (2.00) | $ (0.66) | $ (0.23) | $ (0.33) | $ (0.27) |
| Net asset value — End of year | $ 20.58 | $ 19.67 | $ 23.93 | $ 20.86 | $ 20.77 |
| Total Return(2) | 15.65% | (14.94)% | 15.87% | 2.15% | 19.22% |
| Ratios/Supplemental Data | |||||
| Net assets, end of year (000’s omitted) | $104,872 | $109,769 | $141,933 | $136,204 | $151,383 |
| Ratios (as a percentage of average daily net assets):(3)(4) | |||||
| Total expenses | 0.93% | 0.92% | 0.90% | 0.93% | 0.89% |
| Net expenses | 0.80% (5) | 0.81% (5) | 0.81% | 0.83% | 0.83% |
| Net investment income | 1.59% | 1.11% | 0.79% | 1.00% | 1.48% |
| Portfolio Turnover | 10% | 16% | 7% | 13% | 7% |
| (1) | Computed using average shares outstanding. |
| (2) | Returns are historical and are calculated by determining the percentage change in net asset value with all distributions reinvested and do not reflect fees and expenses imposed by variable annuity contracts or variable life insurance policies. If included, total return would be lower. |
| (3) | Total expenses do not reflect amounts reimbursed and/or waived by the adviser and certain of its affiliates, if applicable. Net expenses are net of all reductions and represent the net expenses paid by the Fund. |
| (4) | Amounts do not include the expenses of the Underlying Funds. |
| (5) | Includes a reduction by the investment adviser of a portion of its advisory fee due to the Fund’s investment in the Liquidity Fund (equal to 0.01% and less than 0.01% of average daily net assets for the years ended December 31, 2023 and 2022, respectively). |
| Asset Description | Level 1 | Level 2 | Level 3 | Total |
| Exchange-Traded Funds | $ 99,205,775 | $ — | $ — | $ 99,205,775 |
| Short-Term Investments: | ||||
| Affiliated Fund | 5,500,900 | — | — | 5,500,900 |
| Securities Lending Collateral | 1,031,415 | — | — | 1,031,415 |
| Total Investments | $105,738,090 | $ — | $ — | $105,738,090 |
| Asset Description (continued) | Level 1 | Level 2 | Level 3 | Total |
| Futures Contracts | $ 197,338 | $ — | $ — | $ 197,338 |
| Total | $105,935,428 | $ — | $ — | $105,935,428 |
| Year Ended December 31, | ||
| 2023 | 2022 | |
| Ordinary income | $3,891,145 | $1,153,622 |
| Long-term capital gains | $5,698,747 | $2,488,987 |
| Undistributed ordinary income | $ 2,278,900 |
| Undistributed long-term capital gains | 6,392,258 |
| Net unrealized appreciation | 27,514,205 |
| Distributable earnings | $36,185,363 |
| Aggregate cost | $78,223,885 |
| Gross unrealized appreciation | $ 28,819,513 |
| Gross unrealized depreciation | (1,305,308) |
| Net unrealized appreciation | $27,514,205 |
| Derivative | Statement of Assets and Liabilities Caption | Assets | Liabilities | |
| Futures contracts | Distributable earnings | $197,338 (1) | $ — | |
| (1) | Only the current day’s variation margin is reported within the Statement of Assets and Liabilities as Receivable or Payable for variation margin on open futures contracts, as applicable. |
| Statement of Operations Caption | |||
| Derivative | Net realized gain (loss): Futures contracts | Change in unrealized appreciation (depreciation): Futures contracts | |
| Futures contracts | $ (2,066,837) | $ (623,235) | |
| Remaining Contractual Maturity of the Transactions | |||||
| Overnight and Continuous | <30 days | 30 to 90 days | >90 days | Total | |
| Exchange-Traded Funds | $1,031,415 | $ — | $ — | $ — | $1,031,415 |
| Name | Value, beginning of period | Purchases | Sales proceeds | Net realized gain (loss) | Change in unrealized appreciation (depreciation) | Value, end of period | Dividend income | Shares, end of period |
| Short-Term Investments | ||||||||
| Liquidity Fund | $7,138,410 | $27,663,721 | $(29,301,231) | $ — | $ — | $5,500,900 | $280,922 | 5,500,900 |
| Year Ended December 31, 2023 | Year Ended December 31, 2022 | ||||
| Shares | Amount | Shares | Amount | ||
| Class F | |||||
| Shares sold | 14,102 | $ 299,207 | 8,111 | $ 168,099 | |
| Reinvestment of distributions | 507,133 | 9,589,892 | 193,037 | 3,642,609 | |
| Shares redeemed | (1,005,910) | (20,547,900) | (552,936) | (11,573,990) | |
| Net decrease | (484,675) | $(10,658,801) | (351,788) | $ (7,763,282) | |
Boston, Massachusetts
February 16, 2024
| Name and Year of Birth | Corporation Position(s) | Length of Service | Principal Occupation(s) and Other Directorships During Past Five Years and Other Relevant Experience |
| Interested Director | |||
| Von M. Hughes(1) 1969 | Director and President | Since 2023 | President and Chief Executive Officer and Managing Director of Calvert Research and Management. Managing Director of Morgan Stanley Investment Management (MSIM) (since 2022). Formerly, Managing Director of PAAMCO Prisma (investment management firm) (2003-2022). Mr. Hughes is an interested person because of his positions with CRM and certain affiliates. Other Directorships. Tradeweb Markets Inc. (financial services) (2021-2022); National Association of Investment Companies (2018-2021). |
| Noninterested Directors | |||
| Alice Gresham Bullock 1950 | Chair and Director | Since 2016 (Chair); Since 2008 (Director) | Professor Emerita at Howard University School of Law. Dean Emerita of Howard University School of Law and Deputy Director of the Association of American Law Schools (1992-1994). Other Directorships. None. |
| Cari M. Dominguez 1949 | Director | Since 2016 | Former Chair of the U.S. Equal Employment Opportunity Commission. Other Directorships. ManpowerGroup Inc. (workforce solutions company); Triple S Management Corporation (managed care); National Association of Corporate Directors. |
| Karen Fang(2) 1958 | Director | Since 2023 | Formerly, Managing Director, Wealth Management at GAMCO Asset Management (asset management firm) (2020-2023). Formerly, Managing Director, Senior Portfolio Manager of Fiduciary Trust Company International (wealth management firm) (1993-2019). Other Directorships. None. |
| Miles D. Harper, III 1962 | Director | Since 2016 | Private investor (2022-present). Formerly, Partner, Carr Riggs & Ingram (public accounting firm) (2014-2022). Partner, Gainer Donnelly & Desroches (public accounting firm) (now Carr Riggs & Ingram) (1999-2014). Other Directorships. Bridgeway Funds (9) (asset management). |
| Joy V. Jones 1950 | Director | Since 2016 | Attorney. Other Directorships. Palm Management Corporation. |
| Eddie Ramos(2) 1967 | Director | Since 2023 | Private investor (2022-present). Formerly, Head of External Advisors/Diversity Portfolio Management at the New Jersey Division of Investment (2020-2022). Formerly, Chief Investment Officer and Lead Portfolio Manager – Global Fundamental Equities at Cornerstone Capital Management (asset management firm) (2011-2017). Other Directorships. Macquarie Optimum Funds (6) (asset management) (2022-2023). |
| Name and Year of Birth | Corporation Position(s) | Length of Service | Principal Occupation(s) and Other Directorships During Past Five Years and Other Relevant Experience |
| Noninterested Directors (continued) | |||
| Anthony A. Williams 1951 | Director | Since 2016 | CEO and Executive Director of the Federal City Council (July 2012 to present); Senior Adviser and Independent Consultant for King and Spalding LLP (September 2015 to present); Executive Director of Global Government Practice at the Corporate Executive Board (January 2010 to January 2012). Other Directorships. Freddie Mac; Evoq Properties/Meruelo Maddux Properties, Inc. (real estate management); Weston Solutions, Inc. (environmental services); Bipartisan Policy Center’s Debt Reduction Task Force; Chesapeake Bay Foundation; Catholic University of America; Urban Institute (research organization); The Howard Hughes Corporation (real estate development); Old Dominion National Bank. |
| Name and Year of Birth | Corporation Position(s) | Length of Service | Principal Occupation(s) During Past Five Years |
| Principal Officers who are not Directors | |||
| Hope L. Brown 1973 | Chief Compliance Officer | Since 2014 | Chief Compliance Officer of 46 registered investment companies advised by CRM (since 2014). Vice President and Chief Compliance Officer, Wilmington Funds (2012-2014). |
| Deidre E. Walsh 1971 | Secretary, Vice President and Chief Legal Officer | Since 2021 | Vice President of CRM and officer of 46 registered investment companies advised by CRM (since 2021). Also Vice President of Eaton Vance and certain of its affiliates and officer of 127 registered investment companies advised or administered by Eaton Vance. |
| James F. Kirchner 1967 | Treasurer | Since 2016 | Vice President of CRM and officer of 46 registered investment companies advised by CRM (since 2016). Also Vice President of Eaton Vance and certain of its affiliates and officer of 127 registered investment companies advised or administered by Eaton Vance. |
| (1) Mr. Hughes is an interested person of the Fund because of his positions with the Fund’s adviser and certain affiliates. | |||
| (2) Ms. Fang and Mr. Ramos began serving as Directors effective October 30, 2023. | |||
| Privacy Notice | April 2021 |
| FACTS | WHAT DOES EATON VANCE DO WITH YOUR PERSONAL INFORMATION? |
| Why? | Financial companies choose how they share your personal information. Federal law gives consumers the right to limit some but not all sharing. Federal law also requires us to tell you how we collect, share, and protect your personal information. Please read this notice carefully to understand what we do. |
| What? | The types of personal information we collect and share depend on the product or service you have with us. This information can include:■ Social Security number and income ■ investment experience and risk tolerance ■ checking account number and wire transfer instructions |
| How? | All financial companies need to share customers’ personal information to run their everyday business. In the section below, we list the reasons financial companies can share their customers’ personal information; the reasons Eaton Vance chooses to share; and whether you can limit this sharing. |
| Reasons we can share your personal information | Does Eaton Vance share? | Can you limit this sharing? |
| For our everyday business purposes — such as to process your transactions, maintain your account(s), respond to court orders and legal investigations, or report to credit bureaus | Yes | No |
| For our marketing purposes — to offer our products and services to you | Yes | No |
| For joint marketing with other financial companies | No | We don’t share |
| For our investment management affiliates’ everyday business purposes — information about your transactions, experiences, and creditworthiness | Yes | Yes |
| For our affiliates’ everyday business purposes — information about your transactions and experiences | Yes | No |
| For our affiliates’ everyday business purposes — information about your creditworthiness | No | We don’t share |
| For our investment management affiliates to market to you | Yes | Yes |
| For our affiliates to market to you | No | We don’t share |
| For nonaffiliates to market to you | No | We don’t share |
| To limit our sharing | Call toll-free 1-800-368-2745 or email: CRMPrivacy@calvert.comPlease note:If you are a new customer, we can begin sharing your information 30 days from the date we sent this notice. When you are no longer our customer, we continue to share your information as described in this notice. However, you can contact us at any time to limit our sharing. |
| Questions? | Call toll-free 1-800-368-2745 or email: CRMPrivacy@calvert.com |
| Privacy Notice — continued | April 2021 |
| Who we are | |
| Who is providing this notice? | Eaton Vance Management, Eaton Vance Distributors, Inc., Eaton Vance Trust Company, Eaton Vance Management (International) Limited, Eaton Vance Advisers International Ltd., Eaton Vance Global Advisors Limited, Eaton Vance Management’s Real Estate Investment Group, Boston Management and Research, Calvert Research and Management, Eaton Vance and Calvert Fund Families and our investment advisory affiliates (“Eaton Vance”) (see Investment Management Affiliates definition below) |
| What we do | |
| How does Eaton Vance protect my personal information? | To protect your personal information from unauthorized access and use, we use security measures that comply with federal law. These measures include computer safeguards and secured files and buildings. We have policies governing the proper handling of customer information by personnel and requiring third parties that provide support to adhere to appropriate security standards with respect to such information. |
| How does Eaton Vance collect my personal information? | We collect your personal information, for example, when you■ open an account or make deposits or withdrawals from your account ■ buy securities from us or make a wire transfer ■ give us your contact informationWe also collect your personal information from others, such as credit bureaus, affiliates, or other companies. |
| Why can’t I limit all sharing? | Federal law gives you the right to limit only■ sharing for affiliates’ everyday business purposes — information about your creditworthiness ■ affiliates from using your information to market to you ■ sharing for nonaffiliates to market to youState laws and individual companies may give you additional rights to limit sharing. See below for more on your rights under state law. |
| Definitions | |
| Investment Management Affiliates | Eaton Vance Investment Management Affiliates include registered investment advisers, registered broker- dealers, and registered and unregistered funds. Investment Management Affiliates does not include entities associated with Morgan Stanley Wealth Management, such as Morgan Stanley Smith Barney LLC and Morgan Stanley & Co. |
| Affiliates | Companies related by common ownership or control. They can be financial and nonfinancial companies.■ Our affiliates include companies with a Morgan Stanley name and financial companies such as Morgan Stanley Smith Barney LLC and Morgan Stanley & Co. |
| Nonaffiliates | Companies not related by common ownership or control. They can be financial and nonfinancial companies.■ Eaton Vance does not share with nonaffiliates so they can market to you. |
| Joint marketing | A formal agreement between nonaffiliated financial companies that together market financial products or services to you.■ Eaton Vance doesn’t jointly market. |
| Other important information | |
| Vermont: Except as permitted by law, we will not share personal information we collect about Vermont residents with Nonaffiliates unless you provide us with your written consent to share such information.California: Except as permitted by law, we will not share personal information we collect about California residents with Nonaffiliates and we will limit sharing such personal information with our Affiliates to comply with California privacy laws that apply to us. | |
Item 2. Code of Ethics
The registrant has adopted a code of ethics applicable to its Principal Executive Officer, Principal Financial Officer and Principal Accounting Officer. The registrant undertakes to provide a copy of such code of ethics to any person upon request, without charge, by calling 1-800-368-2745. The registrant has not amended the code of ethics as described in Form N-CSR during the period covered by this report. The registrant has not granted any waiver, including an implicit waiver, from a provision of the code of ethics as described in Form N-CSR during the period covered by this report.
Item 3. Audit Committee Financial Expert
The registrant’s Board of Directors has determined that Miles D. Harper III, an “independent” Director serving on the registrant’s audit committee, is an “audit committee financial expert,” as defined in Item 3 of Form N-CSR. Under applicable securities laws, a person who is determined to be an audit committee financial expert will not be deemed an “expert” for any purpose, including without limitation for the purposes of Section 11 of the Securities Act of 1933, as a result of being designated or identified as an audit committee financial expert.
The designation or identification of a person as an audit committee financial expert does not impose on such person any duties, obligations, or liabilities that are greater than the duties, obligations, and liabilities imposed on such person as a member of the audit committee and Board of Directors in the absence of such designation or identification.
Item 4. Principal Accountant Fees and Services
(a) –(d)
The following table presents the aggregate fees billed to the registrant for the registrant’s fiscal years ended December 31, 2022 and December 31, 2023 for professional services rendered for the audit of the registrant’s annual financial statements and fees billed for other services rendered by its principal accountant during such periods.
Fiscal Years Ended | 12/31/22 | %* | 12/31/23 | %* | ||||||||||||
Audit Fees | $ | 196,575 | 0 | % | $ | 216,900 | 0 | % | ||||||||
Audit-Related Fees(1) | $ | 0 | 0 | % | $ | 0 | 0 | % | ||||||||
Tax Fees(2) | $ | 0 | 0 | % | $ | 0 | 0 | % | ||||||||
All Other Fees(3) | $ | 0 | 0 | % | $ | 0 | 0 | % | ||||||||
|
|
|
|
|
|
|
| |||||||||
Total | $ | 196,575 | 0 | % | $ | 216,900 | 0 | % | ||||||||
|
|
|
|
|
|
|
| |||||||||
| * | Percentage of fees approved by the Audit Committee pursuant to (c)(7)(i)(C) of Rule 2-01 of Reg. S-X (statutory de minimus waiver of Committee’s requirement to pre-approve). |
| (1) | Audit-related fees consist of the aggregate fees billed for assurance and related services that are reasonably related to the performance of the audit of the registrant’s financial statements and are not reported under the category of audit fees. |
| (2) | Tax fees consist of the aggregate fees billed for professional services rendered by the principal accountant relating to tax compliance, tax advice, and tax planning and specifically include fees for tax return preparation and other related tax compliance/planning matters. |
| (3) | All other fees consist of the aggregate fees billed for products and services provided by the principal accountant other than audit, audit-related, and tax services. |
(e) The Audit Committee is required to pre-approve all audit and non-audit services provided to the registrant by the auditors, and to the registrant’s investment adviser, and any entity controlling, controlled by, or under common control with the adviser that provides ongoing services to the registrant. In determining whether to pre-approve non-audit services, the Audit Committee considers whether the services are consistent with maintaining the independence of the auditors. The Committee may delegate its authority to pre-approve certain matters to one or more of its members. In this regard, the Committee has delegated authority jointly to the Audit Committee Chair together with another Committee member with respect to non-audit services not exceeding $25,000 in each instance. In addition, the Committee has pre-approved the retention of the auditors to provide tax-related services related to the tax treatment and tax accounting of newly acquired securities, upon request by the investment adviser in each instance.
(f) Not applicable.
(g) Aggregate non-audit fees billed by the registrant’s principal accountant for services rendered to the registrant, and rendered to the registrant’s investment adviser, and any entity controlling, controlled by, or under common control with the adviser that provides ongoing services to the registrant for each of the last two fiscal years of the registrant:
Fiscal Year ended 12/31/22 | Fiscal Year ended 12/31/23 | |||||||||||
$ | %* | $ | %* | |||||||||
$0 | 0 | % | $ | 52,836 | 0 | % | ||||||
| * | Percentage of fees approved by the Audit Committee pursuant to (c)(7)(i)(C) of Rule 2-01 of Reg. S-X (statutory de minimus waiver of Committee’s requirement to pre-approve). |
(h) The registrant’s audit committee has considered whether the provision by the registrant’s principal accountant of non-audit services to the registrant’s investment adviser and any entity controlling, controlled by, or under common control with the adviser that provides ongoing services to the registrant that were not pre-approved pursuant to Rule 2-01(c)(7)(ii) of Regulation S-X is compatible with maintaining the principal accountant’s independence.
(i) Not applicable.
(j) Not applicable.
Item 5. Audit Committee of Listed Registrants
Not applicable.
Item 6. Schedule of Investments
Please see schedule of investments contained in the Report to Stockholders included under Item 1 of this Form N-CSR.
Item 7. Disclosure of Proxy Voting Policies and Procedures for Closed-End Management Investment Companies
Not applicable.
Item 8. Portfolio Managers of Closed-End Management Investment Companies
Not applicable.
Item 9. Purchases of Equity Securities by Closed-End Management Investment Company and Affiliated Purchasers
Not applicable.
Item 10. Submission of Matters to a Vote of Security Holders
No material changes.
Item 11. Controls and Procedures
(a) The registrant’s principal executive and principal financial officers have concluded that the registrant’s disclosure controls and procedures (as defined in Rule 30a-3(c) under the Investment Company Act of 1940 Act, as amended (the “1940 Act”) are effective, based on the evaluation of these controls and procedures required by Rule 30a-3(b) under the 1940 Act and Rules 13a-15(b) or 15d-15(b) under the Securities Exchange Act of 1934 (“Exchange Act”), as of a date within 90 days of the filing date of this report.
(b) There was no change in the registrant’s internal control over financial reporting (as defined in Rule 30a-3(d) under the 1940 Act) that occurred during the period covered by this report that has materially affected, or is reasonably likely to materially affect, the registrant’s internal control over financial reporting.
Item 12. Disclosure of Securities Lending Activities for Closed-End Management Investment Companies.
Not applicable.
Item 13. Exhibits
(a)(1) | Registrant’s Code of Ethics – Not applicable (please see Item 2). | |
(a)(2)(i) | Treasurer’s Section 302 certification. | |
(a)(2)(ii) | President’s Section 302 certification. | |
(b) | Combined Section 906 certification. | |
Signatures
Pursuant to the requirements of the Securities Exchange Act of 1934 and the Investment Company Act of 1940, the registrant has duly caused this report to be signed on its behalf by the undersigned, thereunto duly authorized.
| CALVERT VARIABLE PRODUCTS, INC. | ||
| By: | /s/ Von Hughes | |
| Von Hughes | ||
| President | ||
Date: February 23, 2024
Pursuant to the requirements of the Securities Exchange Act of 1934 and the Investment Company Act of 1940, this report has been signed below by the following persons on behalf of the registrant and in the capacities and on the dates indicated.
| By: | /s/ James F. Kirchner | |
| James F. Kirchner | ||
| Treasurer |
Date: February 23, 2024
| By: | /s/ Von Hughes | |
| Von Hughes | ||
| President |
Date: February 23, 2024