M A N A G E R O V E R V I E W
Performance Review
For the 12 months ended October 31, 2003, Class A shares of the Smith Barney Capital Preservation Fund, excluding sales charges, returned 2.34%.These shares underperformed the fund’s unmanaged benchmarks, the S&P 500 Indexi and the Lehman Brothers Aggregate Bond Index,ii which returned 20.79% and 4.90%, respectively for the same period.They also underperformed the average of the fund’s Lipper peer group of balanced target maturity funds, which returned 3.41% for the same period.1
The performance of the fund was influenced primarily by shifting allocations between stocks and bonds, to try to preserve principal.The fund liquidated its stock positions significantly during the stock market decline in the third calendar quarter of 2002, severely restricting its ability to capitalize on the subsequent equity market recovery.
A Volatile Stock and Bond Market
The year ended October 31, 2003 was characterized by considerable volatility in both the U.S. stock and bond markets. After a significant rally at the start of the period in November 2002, U.S. stocks fell as geopolitical tensions escalated in December.The new year got off to a positive start, but the stock market declined again as the war with Iraq approached.The eventual armed conflict with Iraq began in March 2003 and became a launching pad for the most current stock rally, as the market began to factor-in the growing prospects for a sustainable economic recovery.The long bear market in place until that point in March was precipitated by a host of unusual factors, ranging from the collapse of the technology stock bubble of the late 1990s, to a remarkable flight-to-quality in the equity market triggered by both corporate governance scandals and the increase in geopolitical risk surrounding Iraq and North Korea.
PERFORMANCE SNAPSHOT
AS OF OCTOBER 31, 2003
(excluding sales charges)
| | 6 Months | 12 Months |
|
|
|
|
|
| Class A Shares | 1.14 | % | 2.34 | % |
|
|
|
|
|
| S&P 500 Index | 15.62 | % | 20.79 | % |
|
|
|
|
|
| Lehman Brothers | | | | |
| Aggregate Bond Index | 0.57 | % | 4.90 | % |
|
|
|
|
|
| | | | | |
| Lipper Balanced | | | | |
| Target Maturity Funds | | | | |
| Category Average | 2.78 | % | 3.41 | % |
Class A share returns assume the reinvestment of income dividends and capital gains distributions at net asset value and the deduction of all fund expenses. Returns have not been adjusted to include sales charges that may apply when shares are purchased or the deduction of taxes that a shareholder would pay on fund distributions. All figures represent past performance and are not a guarantee of future results. Principal value and investment returns will fluctuate and investors’ shares, when redeemed may be worth more or less than their original cost. Results of other share classes will vary.
The S&P 500 Index is a market capitalization-weighted index of 500 widely held common stocks. The Lehman Brothers Aggregate Bond Index is a broad-based bond index comprised of government, corporate, mortgage and asset-backed issues, rated investment grade or higher, and having at least one year to maturity. Please note that an investor cannot invest directly in an index.
Lipper, Inc. is a major independent mutual-fund tracking organization. Returns are based on the period ended October 31, 2003, calculated among 57 funds for the six-month period and among 37 funds for the 12-month period, in the fund’s Lipper peer group including the reinvestment of dividends and capital gains and excluding sales charges.
Even as stocks rallied in the aftermath of the conflict with Iraq, bond yields plunged to historic lows in the midst of wild gyrations in the interest rate cycle.The 5-year U.S. Treasury bill yield, which we believe serves as a good proxy for durationiii risk in the fund, experienced a roller-coaster ride over the 12-month period.After ratcheting back and forth in the fourth calendar quarter of 2002,
2 Smith Barney Capital Preservation Fund | 2003 Annual Report
interest rates became even more volatile as 2003 progressed. Beginning the new year at approximately 3%, 5-year U.S. Treasury yields fell to 2.5% as geopolitical tensions escalated in the first quarter of 2003. In March, yields spiked back to just above 3% as economic prospects improved on the quick and apparently successful resolution of the Iraq conflict, then quickly reversed course and collapsed to an unprecedented low of almost 2% by mid-June on concerns of the possibility of deflation.Yields then rapidly surged back to over 3.5% by the end of August as inflation concerns replaced deflation fears and ended up at above 3.2% by the end of October.
Portfolio Update
The fund’s performance was influenced primarily by its shifting allocations between stocks and bonds.The focus on principal protection caused the fund to heavily liquidate stock positions during the stock market decline in the third quarter of 2002. After falling to the low single-digit levels, the equity allocation has since recovered to almost 12% at the end of October 2003.
Several factors contributed to the fund’s low levels of equity allocation and its slow recovery.The severe decline in stock prices and interest rates preceding the conflict in Iraq caused a reduction in the fund’s equity allocation down to levels close to zero.We were able to navigate through the turmoil in the equity markets created by the highly publicized corporate governance scandals and geopolitical tensions, and avoid defeasance, which would be an irreversible move into an all-bond portfolio.The low level of equity exposure reached during the period has limited the fund to only a modest participation in the subsequent stock market recovery that began in March.2
Compounding the impact of a weak initial stock market environment, key interest rates have declined since the inception of the fund.The asset allocation in the fund is a function of the magnitude and amplitude of equity and bond market returns. As a general rule of thumb, the fund’s equity allocation generally moves higher when stock prices rise and bond prices fall, and vice versa.
A rising bond market and declining yields offset most of the benefits of the sharp rise in the stock market seen during the second calendar quarter of 2003. In fact, the overall low levels of interest rates and their subsequent decline since the fund was launched have served as constant impediments to achieving high equity allocation in the portfolio.As close as the fund was to defeasance at the start of the period, the subsequent drop in 5-year U.S.Treasury yields to almost 2% in June made a difficult situation even worse.
Overall, we believe the performance of the fund remains in-line with that of other similar funds.The stock market as of October 31st, as measured by the S&P 500 Index, is actually in negative territory since the fund was launched in May 2002.The fund was able to significantly limit downside losses during the brunt of this decline.Through a most turbulent environment for such a strategy, the fund has managed to avoid defeasance. For those shareholders seeking greater exposure to the stock market, Smith Barney allows fund shareholders to exchange their shares of this fund for shares of any other fund in the Smith Barney family, without incurring a sales charge.3
The Fund’s Adviser and some of its affiliates have received requests for information from various government regulators regarding market timing, late trading, fees and other mutual fund issues in connection with various investigations.The Adviser and its affiliates are responding to those information requests, but are not in a position to predict the outcome of these requests and investigations.
3 Smith Barney Capital Preservation Fund | 2003 Annual Report
Thank you for your investment in the Smith Barney Capital Preservation Fund.We appreciate your confidence in our stewardship of your assets.
Sincerely,

Alan Blake
Portfolio Manager

Harry D. Cohen
Portfolio Manager

Sandip Bhagat
Portfolio Manager
November 12, 2003
| The information provided in this letter by the Investment Adviser is not intended to be a forecast of future events, a guarantee of future results or investment advice. Views expressed may differ from those of the firm as a whole. |
| Portfolio holdings and breakdowns are as of October 31, 2003 and are subject to change. Please refer to pages 7 through 10 for a list and percentage breakdown of the fund’s holdings. |
| 1 | Lipper Inc. is a major independent mutual-fund tracking organization. Returns are based on the 12-month period ended October 31, 2003, calculated among 37 funds in the balanced target maturity funds category with reinvestment of dividends and capital gains excluding sales charges. |
| 2 | Use of the fixed income component during the Guarantee Period will reduce the fund’s ability to participate as fully in upward equity market movements, and therefore represents some loss of opportunity, or opportunity cost, compared to a portfolio that is more heavily invested in equities. If the value of the stock component were to decline substantially during the Guarantee Period or upon the occurrence of certain non-market-related events, the fund may be completed and irreversibly 100% reallocated to fixed income. Please see the fund’s prospectus for more information. The terms of a Financial Guarantee Agreement executed in connection with the Guarantee impose certain limitations on the manner in which the Fund may be managed during the Guarantee Period. The Financial Guarantee Agreement could limit the manager’s ability to alter the management of the Fund during the Guarantee Period in response to changing market conditions. |
| 3 | When you hold your investment until the end of the five-year Guarantee Period, on the Guarantee Maturity Date your account will be worth no less than your initial investment (less sales charges) at the end of the Offering Period, reduced to reflect any redemptions, dividends and distributions received in cash and certain fund expenses, such as taxes and extraordinary expenses. If you choose to redeem your investment on any day other than the Guarantee Maturity Date, your shares will be redeemed at the current NAV and the amount returned could be less than that invested. The guarantee is based on the amount invested as of the first day of the Guarantee Period and does not apply to any earnings realized during the Guarantee Period. As with the sale of any securities, a taxable event may occur if the fund liquidates securities for asset allocation purposes or at the end of the Guarantee Period. Please keep in mind that the fund’s NAV will fluctuate. After the Guarantee Period ends, your investment will no longer be protected by the guarantee and will be subject to possible loss of principal. Any exchange into another fund will constitute a taxable event. Fund allocations may change at any time. |
| i | The S&P 500 Index is a market capitalization-weighted index of 500 widely held common stocks. Please note that an investor cannot invest directly in an index. |
| ii | The Lehman Brothers Aggregate Bond Index is a broad-based bond index comprised of Government, Corporate, Mortgage and Asset-backed issues, rated investment grade or higher, |
| iii | Duration is a common gauge of the price sensitivity of a fixed income asset or portfolio to a change in interest rates. |
4 Smith Barney Capital Preservation Fund | 2003 Annual Report
| Average Annual Total Returns† (unaudited) | | | | | | |
| | | | | | | | | |
| | | | Without Sales Charges(1) |
| | | |
|
| | | | Class A | Class B | Class L |
|
|
|
|
|
|
|
|
|
| Twelve Months Ended 10/31/03 | 2.34 | % | 1.52 | % | 1.60 | % |
|
|
|
|
|
|
|
| Inception through 10/31/03 | 1.42 | % | 0.65 | % | 0.70 | % |
|
|
|
|
|
|
|
| | | | | | | | | |
| | | | With Sales Charges(2) |
| | | |
|
| | | | Class A | Class B | Class L |
|
|
|
|
|
|
|
|
|
| Twelve Months Ended 10/31/03 | (2.79 | )% | (3.48 | )% | (0.37 | )% |
|
|
|
|
|
| |
| Inception through 10/31/03 | (1.82 | )% | (1.89 | )% | 0.04 | % |
|
|
|
|
|
|
|
| | | | | | | | | |
| (1) | | Assumes reinvestment of all dividends and capital gain distributions, if any, at net asset value and does not reflect deduction of all applicable sales charges with respect to Class A and L shares or the applicable contingent deferred sales charges (“CDSC”) with respect to Class B and L shares. |
| | |
| (2) | | Assumes reinvestment of all dividends and capital gain distributions, if any, at net asset value. In addition, Class A and L shares reflect the deduction of the maximum sales charge of 5.00% and 1.00%, respectively, and Class B shares reflect the deduction of a 5.00% CDSC, which applies if shares are redeemed within one year from purchase payment. Thereafter, this CDSC declines by 1.00% per year until no CDSC is incurred. Class L share salso reflect the deduction of 1.00% CDSC, which applies if shares are redeemed within one year of purchase payment. |
| | |
† | | All figures represent past performance and are not a guarantee of future results. Investment returns and principal value will fluctuate, and redemption value may be more or less than the original cost. The returns shown do not reflect the deduction of taxes that a shareholder would pay on a fund distribution or the redemption of fund shares. |
5 Smith Barney Capital Preservation Fund | 2003 Annual Report
Historical Performance (unaudited)
Value of $10,000 Invested in Class A Shares of the Smith Barney Capital Preservation Fund vs. Benchmarks
April 2002 — October 2003
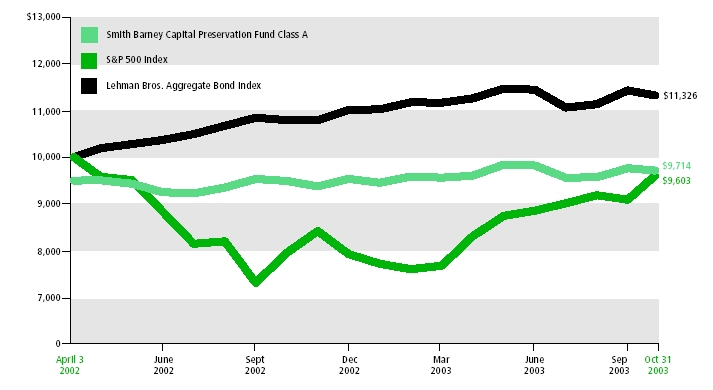
The graph includes the initial sales charge on the Fund (no comparable charge exists for the index) and assumes all dividends and distributions from the Fund are reinvested at net asset value.
Notes: All Fund performance numbers represent past performance, and are no guarantee of future results. The Fund’s share price and investment return will fluctuate so that the value of an investor’s shares, when redeemed, may be worth more or less than their original cost. The returns shown do not reflect the deduction of taxes that a shareholder would pay on fund distributions or the redemption of fund shares. Total returns include change in share price and reinvestment of dividends and distributions, if any. Total return figures “with sales charge” are provided in accordance with SEC guidelines for comparative purposes for prospective investors and reflect certain voluntary fee waivers which may be terminated at any time. If the waivers were not in place, the Fund’s returns would have been lower. Investors may not invest directly in an index.
6 Smith Barney Capital Preservation Fund | 2003 Annual Report
| Schedule of Investments | | October 31, 2003 |
| | | | | | | | |
| SHARES | | SECURITY | VALUE |
|
|
|
|
|
|
|
|
| COMMON STOCK — 9.0% | | | | |
| Air Freight & Couriers — 0.1% | | | | |
| | 10,365 | | United Parcel Services, Inc. - Class B shares | $ | 751,670 | |
|
|
|
|
|
|
|
|
| Auto Components — 0.0% | | | | |
| | 19,353 | | Delphi Corp. | | | 172,242 | |
|
|
|
|
|
|
|
|
| Banks — 0.3% | | | | |
| | 17,846 | | Bank One Corp. | | | 757,563 | |
| | 27,094 | | Wells Fargo & Co. | | | 1,525,934 | |
|
|
|
|
|
|
|
|
| | | | | | 2,283,497 | |
|
|
|
|
|
|
|
|
| Beverages — 0.1% | | | | |
| | 22,147 | | The Coca-Cola Co. | | | 1,027,621 | |
|
|
|
|
|
|
|
|
| Biotechnology — 0.4% | | | | |
| | 20,245 | | Amgen Inc. (a) | | | 1,250,331 | |
| | 22,068 | | Genentech, Inc. (a) | | | 1,808,914 | |
|
|
|
|
|
|
|
|
| | | | | | 3,059,245 | |
|
|
|
|
|
|
|
|
| Chemicals — 0.2% | | | | |
| | 12,560 | | E. I. Du Pont de Nemour & Co. | | 507,424 | |
| | 9,494 | | PPG Industries Inc. | | | 547,329 | |
|
|
|
|
|
|
|
|
| | | | | | 1,054,753 | |
|
|
|
|
|
|
|
|
| Commercial Services & Supplies — 0.2% | | | | |
| | 8,259 | | First Data Corp. | | | 294,846 | |
| | 10,282 | | H & R Block, Inc. | | | 484,179 | |
| | 11,484 | | Waste Management, Inc. | | | 297,665 | |
|
|
|
|
|
|
|
|
| | | | | | 1,076,690 | |
|
|
|
|
|
|
|
|
| Communications Equipment — 0.4% | | | | |
| | 60,654 | | CIENA Corp. (a) | | | 388,792 | |
| | 41,069 | | Cisco Systems, Inc. (a) | | | 861,628 | |
| | 42,622 | | Corning Inc. (a) | | | 467,990 | |
| | 33,548 | | Juniper Networks, Inc. (a) | | | 603,529 | |
| | 58,665 | | Motorola, Inc. | | | 793,737 | |
|
|
|
|
|
|
|
|
| | | | | | 3,115,676 | |
|
|
|
|
|
|
|
|
| Computers & Peripherals — 0.3% | | | | |
| | 44,445 | | Dell Inc. (a) | | | 1,605,353 | |
| | 29,132 | | Western Digital Corp. (a) | | | 391,825 | |
|
|
|
|
|
|
|
|
| | | | | | 1,997,178 | |
|
|
|
|
|
|
|
|
| Diversified Financials — 0.4% | | | | |
| | 29,064 | | Merrill Lynch & Co., Inc. | | | 1,720,589 | |
| | 18,736 | | Morgan Stanley | | | 1,028,044 | |
|
|
|
|
|
|
|
|
| | | | | | 2,748,633 | |
|
|
|
|
|
|
|
|
| Diversified Telecommunications Services — 0.2% | | | | |
| | 31,781 | | SBC Communications, Inc. | | | 762,108 | |
| | 19,891 | | Verizon Communications, Inc. | | | 668,338 | |
|
|
|
|
|
|
|
|
| | | | | | 1,430,446 | |
|
|
|
|
|
|
|
|
See Notes to Financial Statements.
7 Smith Barney Capital Preservation Fund | 2003 Annual Report
| Schedule of Investments (continued) | | October 31, 2003 |
| | | | |
| SHARES | | SECURITY | VALUE |
|
|
|
|
|
|
|
|
| Electric Utilities — 0.2% | | | | |
| | 8,734 | | Allegheny Energy, Inc. (a) | | $ | 92,406 | |
| | 14,289 | | Ameren Corp. | | | 638,004 | |
| | 7,635 | | American Electric Power, Inc. | | | 215,231 | |
| | 8,505 | | PPL Corp. | | | 339,520 | |
|
|
|
|
|
|
|
|
| | | | | | 1,285,161 | |
|
|
|
|
|
|
|
|
| Electrical Equipment — 0.1% | | | | |
| | 22,952 | | Molex Inc. - Class A shares | | | 608,458 | |
|
|
|
|
|
|
|
|
| Electrical Equipment & Instruments — 0.1% | | | | |
| | 7,371 | | Mettler-Toledo International, Inc. (a) | | | 282,604 | |
| | 19,543 | | Vishay Intertechnology, Inc. (a) | | | 366,431 | |
|
|
|
|
|
|
|
|
| | | | | | 649,035 | |
|
|
|
|
|
|
|
|
| Energy Equipment & Services — 0.0% | | | | |
| | 6,272 | | Schlumberger Ltd. | | | 294,596 | |
|
|
|
|
|
|
|
|
| Food & Drug Retailing — 0.1% | | | | |
| | 10,563 | | Walgreen Co. | | | 367,804 | |
|
|
|
|
|
|
|
|
| Food Products — 0.3% | | | | |
| | 9,264 | | General Mills, Inc. | | | 415,490 | |
| | 5,989 | | Hershey Foods Corp. | | | 461,752 | |
| | 13,536 | | Kraft Foods, Inc. - Class A shares | | | 393,898 | |
| | 17,280 | | Wm. Wrigley Jr. Co. | | | 974,592 | |
|
|
|
|
|
|
|
|
| | | | | | 2,245,732 | |
|
|
|
|
|
|
|
|
| Hotels, Restaurants & Leisure — 0.1% | | | | |
| | 10,606 | | Fairmont Hotels Resorts, Inc. | | | 272,998 | |
| | 15,731 | | McDonald’s Corp. | | | 393,432 | |
|
|
|
|
|
|
|
|
| | | | | | 666,430 | |
|
|
|
|
|
|
|
|
| Household Products — 0.2% | | | | |
| | 10,695 | | Kimberly-Clark Corp. | | | 564,803 | |
| | 6,748 | | Procter & Gamble Co. | | | 663,261 | |
|
|
|
|
|
|
|
|
| | | | | | 1,228,064 | |
|
|
|
|
|
|
|
|
| Industrial Conglomerates — 0.4% | | | | |
| | 14,602 | | 3M Co. | | | 1,151,660 | |
| | 21,361 | | Canadian Pacific Railway, Ltd., Class 1 | | | 597,894 | |
| | 35,987 | | General Electric Co. | | | 1,043,983 | |
|
|
|
|
|
|
|
|
| | | | | | 2,793,537 | |
|
|
|
|
|
|
|
|
| Insurance — 0.8% | | | | |
| | 24,006 | | American International Group, Inc. | | | 1,460,285 | |
| | 31 | | Berkshire Hathaway, Inc. - Class A shares (a) | | | 2,412,110 | |
| | 4,917 | | Chubb Corp. | | | 328,505 | |
| | 11,789 | | Old Republic International Corp. | | | 423,697 | |
| | 19,417 | | St Paul Cos., Inc. | | | 740,370 | |
|
|
|
|
|
|
|
|
| | | | | | 5,364,967 | |
|
|
|
|
|
|
|
|
| Internet & Catalog Retail — 0.4% | | | | |
| | 41,957 | | Amazon Com, Inc. (a) | | | 2,283,300 | |
| | 8,740 | | Interactive Corp. (a) | | | 320,845 | |
|
|
|
|
|
|
|
|
| | | | | | 2,604,145 | |
|
|
|
|
|
|
|
|
See Notes to Financial Statements.
8 Smith Barney Capital Preservation Fund | 2003 Annual Report
| Schedule of Investments (continued) | | October 31, 2003 |
| | | | | | | | |
| SHARES | | SECURITY | VALUE |
|
|
|
|
|
|
|
|
| Machinery — 0.0% | | | | |
| | 4,356 | | Dover Corp. | | $ | 169,971 | |
|
|
|
|
|
|
|
|
| Media — 0.6% | | | | |
| | 21,577 | | Comcast Corp. - Class A shares (a) | | | 703,842 | |
| | 7,161 | | Dow Jones & Co., Inc. | | | 372,157 | |
| | 7,446 | | Gannett Inc. | | | 626,283 | |
| | 22,136 | | Liberty Media Corp. - Class A shares (a) | | | 223,352 | |
| | 62,743 | | The Walt Disney Co. | | | 1,420,502 | |
| | 79,558 | | Time Warner Inc. (a) | | | 1,216,442 | |
|
|
|
|
|
|
|
|
| | | | | | 4,562,578 | |
|
|
|
|
|
|
|
|
| Metals & Mining — 0.1% | | | | |
| | 16,892 | | Alcoa Inc. | | | 533,280 | |
| | 9,051 | | Nucor Corp. | | | 496,266 | |
|
|
|
|
|
|
|
|
| | | | | | 1,029,546 | |
|
|
|
|
|
|
|
|
| Multiline Retail — 0.1% | | | | |
| | 14,724 | | Costco Wholesale Corp. (a) | | | 520,788 | |
|
|
|
|
|
|
|
|
| Oil & Gas — 0.4% | | | | |
| | 9,815 | | BP PLC - ADR | | | 415,960 | |
| | 9,246 | | ChevronTexaco Corp. | | | 686,978 | |
| | 8,277 | | ConocoPhillips | | | 473,031 | |
| | 29,336 | | Encana Corp. | | | 1,008,278 | |
| | 12,567 | | Exxon Mobil Corp. | | | 459,701 | |
|
|
|
|
|
|
|
|
| | | | | | 3,043,948 | |
|
|
|
|
|
|
|
|
| Paper & Forest Products — 0.1% | | | | |
| | 8,243 | | Weyerhaeuser Co. | | | 496,476 | |
|
|
|
|
|
|
|
|
| Personal Products — 0.2% | | | | |
| | 38,346 | | Gillette Co. | | | 1,223,237 | |
|
|
|
|
|
|
|
|
| Pharmaceuticals — 0.8% | | | | |
| | 18,291 | | Eli Lilly & Co. | | | 1,218,546 | |
| | 14,907 | | Johnson & Johnson | | | 750,269 | |
| | 2,792 | | Medco Health Solutions, Inc. (a) | | | 92,694 | |
| | 25,476 | | Merck & Co., Inc. | | | 1,127,313 | |
| | 68,696 | | Pfizer, Inc. | | | 2,170,794 | |
| | 10,974 | | Wyeth | | | 484,392 | |
|
|
|
|
|
|
|
|
| | | | | | 5,844,008 | |
|
|
|
|
|
|
|
|
| Real Estate — 0.2% | | | | |
| | 17,841 | | Forest City Enterprises, Inc. | | | 790,535 | |
| | 19,294 | | The St. Joe Co. | | | 637,474 | |
|
|
|
|
|
|
|
|
| | | | | | 1,428,009 | |
|
|
|
|
|
|
|
|
| Road & Rail — 0.1% | | | | |
| | 16,332 | | Burlington Northern Santa Fe Corp. | | | 472,648 | |
| | 18,604 | | Florida East Coast Industries, Inc. | | | 552,911 | |
|
|
|
|
|
|
|
|
| | | | | | 1,025,559 | |
|
|
|
|
|
|
|
|
See Notes to Financial Statements.
9 Smith Barney Capital Preservation Fund | 2003 Annual Report
Schedule of Investments (continued) | | October 31, 2003 |
| | | | | | |
| SHARES | SECURITY | VALUE |
|
|
|
|
|
|
|
| | | | | | | | |
| Semiconductor Equipment & Products — 0.7% | | | | |
| 62,533 | | Intel Corp. | | $ | 2,066,716 | |
| 61,398 | | Texas Instruments Inc. | | | 1,775,630 | |
| 30,556 | | Xilinx, Inc. (a) | | | 968,625 | |
|
|
|
|
|
|
|
|
| | | | | | | 4,810,971 | |
|
|
|
|
|
|
|
|
| Software — 0.3% | | | | |
| 53,874 | | Microsoft Corp. | | | 1,408,805 | |
| | 11,282 | | Sybase, Inc. (a) | | | 201,948 | |
| | 20,661 | | VERITAS Software Corp. (a) | | | 746,895 | |
|
|
|
|
|
|
|
|
| | | | | | | 2,357,648 | |
|
|
|
|
|
|
|
|
| Specialty Retail — 0.1% | | | | |
| | 15,159 | | Home Depot, Inc. | | | 561,944 | |
|
|
|
|
|
|
|
|
| | | | TOTAL COMMON STOCK | | | | |
| | | | (Cost — $57,601,587) | | | 63,900,263 | |
|
|
|
|
|
|
|
|
| | | | | | | | |
FACE | | | | | | |
AMOUNT | | SECURITY | VALUE |
|
|
|
|
|
|
| U.S. TREASURY OBLIGATIONS — 87.1% | | | | |
| | | | United States Treasury Strip Notes | | | | |
| $585,234,000 | | due 5/15/07 | | | 532,322,994 | |
| 98,578,358 | | due 8/15/07 | | | 88,734,914 | |
|
|
|
|
|
|
| | | | TOTAL U.S. TREASURY OBLIGATIONS | | | | |
| | | | (Cost — $583,998,840) | | | 621,057,908 | |
|
|
|
|
|
|
| SHORT-TERM OBLIGATIONS — 3.9% | | | | |
| 17,000,000 | | United States Treasury Bills (b) | | | | |
| | | | due 12/04/03 (Cost — $16,985,352) | | | 16,987,097 | |
| 10,927,000 | | State Street Repurchase Agreement 0.94% due 11/3/03 (b) | | | | |
| | | | Proceeds at maturity — $10,927,856; | | | | |
| | | | (Fully collateralized by US Treasury Bonds, 8.125% due 8/15/21; | | | | |
| | | | Market Value — $11,152,063) (Cost — $10,927,000) | | | 10,927,000 | |
|
|
|
|
|
|
| | | | TOTAL SHORT-TERM OBLIGATIONS | | | | |
| | | | (Cost — $27,912,352) | | | 27,914,097 | |
|
|
|
|
|
|
| | | | TOTAL INVESTMENTS — 100% | | | | |
| | | | (Cost — $669,512,779 *) | | $ | 712,872,268 | |
|
|
|
|
|
|
| (a) | Non-income producing security | | | | |
| (b) | Security is segregated as collateral for open futures contracts. | | | | |
| * | Aggregate cost for Federal income tax purposes is $672,359,821. | | | | |
See Notes to Financial Statements.
10 Smith Barney Capital Preservation Fund | 2003 Annual Report
| Statement of Assets and Liabilities | October 31, 2003 |
| | | | |
| ASSETS: | | | |
| Investments, at value (Cost — $669,512,779) | $ | 712,872,268 | |
| Cash | | | 1,985 | |
| Receivable for variation margin | | 17,250 | |
| Dividend and interest receivable | | 56,131 | |
|
|
|
|
| Total Assets | | 712,947,634 | |
|
|
|
|
| LIABILITIES: | | | | |
| Payable for shares of beneficial interest repurchased | | 670,055 | |
| Distribution fees payable (Note 2) | | 560,259 | |
| Management fee payable (Note 2) | | 461,846 | |
| Accrued expenses and other Liabilities | | 1,118,014 | |
|
|
|
|
| Total Liabilities | | 2,810,174 | |
|
|
|
|
| Total Net Assets | $ | 710,137,460 | |
|
|
|
|
| NET ASSETS: | | | | |
| Par value of shares of beneficial interest | $ | | 622 | |
| Capital paid in excess of par value | | 707,606,625 | |
| Undistributed net investment income | | 8,121,470 | |
| Accumulated net realized loss from investment transactions | | | | |
| and futures contracts | | (49,166,702 | ) |
| Net unrealized appreciation of investments and futures contracts | | 43,575,445 | |
|
|
|
|
| Total Net Assets | $ | 710,137,460 | |
|
|
|
|
| Computation of | | | | |
| Class A Shares: | | | | |
| Net Asset Value and redemption price per share ($84,831,337/7,377,881 shares outstanding) | | | $11.50 | |
| Offering Price per share ($11.50 ÷ 0.95) | | | $12.11 | * |
|
|
|
|
|
| Class B Shares: | | | | |
| Net Asset Value per share and offering price ($524,947,107/45,990,577 shares outstanding) | | | $11.41 | ** |
|
|
|
|
|
| Class L Shares: | | | | |
| Net Asset Value per share ($100,359,016/8,791,825 shares outstanding) | | | $11.42 | ** |
| Offering Price per share ($11.42 ÷ 0.99) | | | $11.54 | |
|
|
|
|
|
| * Based upon single purchases of less than $25,000. | | | | |
| ** Redemption price per share is equal to net asset value less any applicable contingent deferred sales charges. |
See Notes to Financial Statements.
11 Smith Barney Capital Preservation Fund | 2003 Annual Report
Statement of Operations | For the Year Ended October 31, 2003 |
| | | |
| INVESTMENT INCOME: | | | |
| Interest | $ | 30,915,358 | |
| Dividends | | 789,600 | |
| Less: Foreign withholding tax | | (3,727 | ) |
|
|
|
|
| Total investment income | | 31,701,231 | |
|
|
|
|
| | | | |
| EXPENSES: | | | |
| Distribution fees (Note 2) | | 7,391,140 | |
| Management fees (Note 2) | | 6,140,657 | |
| Guarantee fees (Note 8) | | 6,140,657 | |
| Transfer agent fees | | 743,578 | |
| Legal fees | | 282,090 | |
| Shareholder reports | | 168,828 | |
| Blue sky fees | | 106,400 | |
| Custody and fund accounting fees | | 77,232 | |
| Audit fees | | 45,000 | |
| Trustees fees | | 22,037 | |
| Other | | 49,877 | |
|
|
|
|
| Total Expenses | | 21,167,496 | |
|
|
|
|
| Net Investment Income | | 10,533,735 | |
|
|
|
|
| | | | |
| NET REALIZED AND UNREALIZED GAIN (LOSS) ON INVESTMENTS AND | | |
| FOREIGN CURRENCY TRANSACTIONS AND FUTURES CONTRACTS (NOTE 3): | | |
| Net realized gain from investments (excluding short-term securities) and futures contracts | 9,279,892 | |
| Net decrease in unrealized depreciation on investments and futures contracts | (6,063,671 | ) |
|
|
|
|
| Net Gain (Loss) on Investments, Foreign Currency Transactions and Futures Contracts | 3,216,221 | |
|
|
|
|
| Increase in Net Assets From Operations | $ | 13,749,956 | |
|
|
|
|
See Notes to Financial Statements.
12 Smith Barney Capital Preservation Fund | 2003 Annual Report
| Statements of Changes in Net Assets | | | | | | |
| | | | |
| | | For the Period | |
| | | April 3, 2002 | |
| | | (Commencement | |
| Year Ended | | of Operations) to | |
| October 31, 2003 | | October 31, 2002 | |
|
|
|
|
|
| OPERATIONS: | | | | |
| Net investment income | $ | 10,533,735 | | $ | 4,492,608 | |
| Net realized gain (loss) from investment transactions and futures contracts | | 9,279,892 | | | (58,446,822 | ) |
| Net increase (decrease) in net unrealized appreciation of investments and | | | | | | |
| futures contracts | | (6,063,671 | ) | | 49,639,116 | |
|
|
|
|
|
|
|
| Increase (Decrease) in Net Assets From Operations | | 13,749,956 | | | (4,315,098 | ) |
|
|
|
|
|
|
|
| DISTRIBUTIONS TO SHAREHOLDERS FROM: | | | | | | |
| Net investment income Class A | | (1,422,983 | ) | | (50,155 | ) |
| Net investment income Class B | | (5,295,810 | ) | | (146,586 | ) |
| Net investment income Class L | | (1,297,157 | ) | | (40,815 | ) |
|
|
|
|
|
|
|
| Decrease in Net Assets From Distributions to Shareholders | | (8,015,950 | ) | | (237,556 | ) |
|
|
|
|
|
|
|
| TRANSACTIONS IN SHARES OF BENEFICIAL INTEREST (NOTE 10): | | | | | | |
| Class A | | | | | | |
| Net proceeds from sale of shares | | — | | | 120,976,230 | |
| Net asset value of shares issued to shareholders from reinvestment of distributions | | 1,376,693 | | | 48,804 | |
| Cost of shares repurchased | | (34,078,203 | ) | | (4,336,477 | ) |
|
|
|
|
|
|
|
| Total Class A | | (32,701,510 | ) | | 116,688,557 | |
|
|
|
|
|
|
|
| Class B | | | | | | |
| Net proceeds from sale of shares | | — | | | 630,840,688 | |
| Net asset value of shares issued to shareholders from reinvestment of distributions | | 5,023,063 | | | 138,420 | |
| Cost of shares repurchased | | (88,813,955 | ) | | (22,501,169 | ) |
|
|
|
|
|
|
|
| Total Class B | | (83,790,892 | ) | | 608,477,939 | |
|
|
|
|
|
|
|
| Class L | | | | | | |
| Net proceeds from sale of shares | | — | | | 161,021,392 | |
| Net asset value of shares issued to shareholders from reinvestment of distributions | | 1,229,400 | | | 38,113 | |
| Cost of shares repurchased | | (52,447,128 | ) | | (9,559,763 | ) |
|
|
|
|
|
|
|
| Total Class L | | (51,217,728 | ) | | 151,499,742 | |
|
|
|
|
|
|
|
| Net Increase (Decrease) in Net Assets From Transactions in Shares | | | | | | |
| of Beneficial Interest | | (167,710,130 | ) | | 876,666,238 | |
|
|
|
|
|
|
|
| Increase (Decrease) in Net Assets | | (161,976,124 | ) | | 872,113,584 | |
| NET ASSETS: | | | | | | |
| Beginning of period | | 872,113,584 | | | — | |
|
|
|
|
|
|
|
| End of period* | $ | 710,137,460 | | $ | 872,113,584 | |
|
|
|
|
|
|
|
| * Includes undistributed net investment income of: | $ | 8,121,470 | | $ | 5,603,696 | |
|
|
|
|
|
|
|
See Notes to Financial Statements.
13 Smith Barney Capital Preservation Fund | 2003 Annual Report
Notes to Financial Statements
1. Significant Accounting Policies
The Smith Barney Capital Preservation Fund (the “Fund”), a separate investment fund of Smith Barney Trust II (the “Trust”), a Massachusetts business trust, is registered under the Investment Company Act of 1940, as amended, as a diversified, open-end management investment company.The Fund commenced operations on April 3, 2002.
The significant accounting policies consistently followed by the Fund are: (a) security transactions are accounted for on trade date; (b) investments are valued at market value or, in the absence of market value with respect to any portfolio securities, at fair value as determined by or under the direction of the Board of Trustees. Equity securities that are traded primarily on a domestic or foreign exchange are valued at the last sale price on that exchange or, if there were no sales during the day, at the current quoted bid price. Securities listed on the NASDAQ National Market System for which market quotations are available are valued at the mean of the quoted bid and asked prices. Options are generally valued at the mean of the quoted bid and asked prices. Bonds and other fixed income securities (other than short-term obligations) are valued on the basis of valuations furnished by a pricing service, use of which has been approved by the Board of Trustees. In making such valuations, the pricing service utilizes both dealer-supplied valuations and electronic data processing techniques that take into account appropriate factors such as institutional-size trading in similar groups of securities, yield, quality, coupon rate, maturity, type of issue, trading characteristics and other market data, without exclusive reliance upon quoted prices or exchange or over-the-counter prices, since such valuations are believed to reflect more accurately the fair value of such securities. Short-term obligations (maturing in 60 days or less) are valued at amortized cost, which constitutes fair value as determined by the Board of Trustees. Futures contracts are normally valued at the settlement price on the exchange on which they are traded. Securities for which there are no such valuations are valued using fair value procedures established by and under the general supervision of the Board of Trustees; (c) interest income, adjusted for amortization of premium and accretion of discount, is recorded on the accrual basis; (d) dividend income is recorded on the ex-dividend date; foreign dividend income is recorded on the ex-dividend date or as soon as practical after the Fund determines the existence of a dividend declaration after exercising reasonable due diligence; (e) dividends and distributions to shareholders are recorded on the ex-dividend date; (f) gains or losses on the sale of securities are calculated by using the specific identification method; (g) the accounting records are maintained in U.S. dollars.All assets and liabilities denominated in foreign currencies are translated into U.S. dollars based on the rate of exchange of such currencies against U.S. dollars on the date of valuation (although the Fund generally does not expect to hold investments denominated in foreign currencies). Purchases and sales of securities, and income and expenses are translated at the rate of exchange quoted on the respective date that such transactions are recorded; (h) direct expenses are charged to each class; management fees and general fund expenses are allocated on the basis of relative net assets of each class; (i) the character of income and gains distributed are determined in accordance with income tax regulations which may differ from generally accepted accounting principles; (j) the Fund intends to comply with the applicable provisions of the Internal Revenue Code of 1986, as amended, pertaining to regulated investment companies and to make distributions of taxable income sufficient to relieve it from substantially all Federal income and excise taxes; and (k) estimates and assumptions are required to be made regarding assets, liabilities and changes in net assets resulting from operations when financial statements are prepared. Changes in the economic environment, financial markets and any other parameters used in determining these estimates could cause actual results to differ.
2. Management Agreement, Distribution Agreement and Other Transactions
Smith Barney Fund Management LLC (“SBFM”), a subsidiary of Citigroup Inc.(“Citigroup”), acts as investment manager to the Fund.The Fund pays SBFM a management fee calculated at an annual rate of 0.75% of the Fund’s average daily net assets during the Guarantee Period. The management fee is calculated daily and paid monthly. The management fees amounted to $6,140,657 for the year ended October 31, 2003.
Citicorp Trust Bank, fsb. (“CTB”), another subsidiary of Citigroup, acts as the Fund’s transfer agent. PFPC Global Fund Services (“PFPC”) and Primerica Shareholder Services (PSS), another subsidiary of Citigroup, act as the Fund’s sub-transfer
14 Smith Barney Capital Preservation Fund | 2003 Annual Report
Notes to Financial Statements (continued)
agents. CTB receives account fees and asset-based fees that vary according to the size and type of account. PFPC and PSS are responsible for shareholder recordkeeping and financial processing for all shareholder accounts and are paid by CTB. For the period ended October 31, 2003, the Fund paid transfer agent fees of $694,578 to CTB and PSS.
Citigroup Global Markets Inc. (“CGM”) (formerly known as Salomon Smith Barney Inc.) and PFS Distributors, Inc. both of which are subsidiaries of Citigroup, act as the Fund’s distributors. Certain other unaffiliated broker-dealers continue to sell Fund shares to the public as members of the selling group. For the year ended October 31, 2003, CGM and its affiliates received brokerage commissions of $0 for the Fund’s portfolio agency transactions.
There are maximum initial sales charges of 5.00% and 1.00% for Class A and L shares, respectively. There is a contingent deferred sales charge (“CDSC”) of 5.00% on Class B shares, which applies if redemption occurs within one year from purchase and declines thereafter by 1.00% per year until no CDSC is incurred. Class L shares also have a 1.00% CDSC, which applies if redemption occurs within the first year of purchase. In addition, Class A shares have a 1.00% CDSC, which applies if redemption occurs within the first year of purchase.This CDSC only applies to those purchases of Class A shares which, when combined with current holdings of Class A shares, equal or exceed $1,000,000 in the aggregate.
For the year ended October 31, 2003, CGM received sales charges of approximately $0 and $0 on sales of the Fund’s Class A and L shares, respectively. In addition, for the year ended October 31, 2003, CDSCs paid to CGM were approximately:
| | Class A | Class B | Class L |
|
| CDSCs | $6,000 | $1,755,000 | $60,000 |
|
Pursuant to a Distribution Plan, the Fund pays a distribution fee with respect to Class A, B and L shares calculated at the annual rate of 0.25%, 1.00% and 1.00% of the average daily net assets of each class, respectively. For the year ended October 31, 2003, total Distribution Plan fees were:
| | Class A | Class B | Class L |
|
| Distribution Plan Fees | $265,467 | $5,786,261 | $1,339,412 |
|
All officers and one Trustee of the Trust are employees of Citigroup or its affiliates.
3. Investments
For the year ended October 31, 2003, the aggregate cost of purchases and proceeds from sales of investments (including maturities, but excluding short-term securities) were as follows:
|
|
|
| Purchases | $104,957,192 | |
|
|
|
| Sales | $304,681,521 | |
|
|
|
| At October 31, 2003, the aggregate gross unrealized appreciation and depreciation of investments for Federal income tax purposes were substantially as follows: |
|
|
|
|
|
| Gross unrealized appreciation | | | $44,697,693 | |
| Gross unrealized depreciation | | | (4,185,246 | ) |
|
|
|
|
|
| Net unrealized appreciation | | | $40,512,447 | |
|
|
|
|
|
15 Smith Barney Capital Preservation Fund | 2003 Annual Report
Notes to Financial Statements (continued)
4. Income Tax Information and Distributions to Shareholders
At October 31, 2003 the tax basis components of distributable earnings were:
|
|
|
|
| Undistributed ordinary income | $ | 8,481,653 | |
|
|
|
|
| Accumulated capital losses | $ | (46,103,704 | ) |
|
|
|
|
| Unrealized appreciation | $ | 40,512,447 | |
|
|
|
|
The difference between book basis and tax basis unrealized appreciation is attributable primarily to wash sale loss deferrals and the mark to market of derivative contracts.
The tax character of distributions paid during the year was:
|
|
|
|
| Ordinary income | $ | 8,015,950 | |
|
|
|
|
5. Futures Contracts
Initial margin deposits made upon entering into futures contracts are recognized as assets. Securities equal to the initial margin amount are segregated by the custodian in the name of the broker. Additional securities are also segregated up to the current market value of the futures contracts. During the period the futures contract is open, changes in the value of the contract are recognized as unrealized gains or losses by “marking-to-market” on a daily basis to reflect the market value of the contract at the end of the each day’s trading.Variation margin payments are received or made and recognized as assets due from or liabilities due to broker, depending upon whether unrealized gains or losses are incurred.When the contract is closed, the Fund records a realized gain or loss equal to the difference between the proceeds from (or cost of) the closing transactions and the Fund’s basis in the contract.
The Fund enters into such contracts to hedge a portion of its portfolio. The Fund bears the market risk that arises from changes in the value of the financial instruments and securities indices (futures contracts) and the credit risk should a coun-terparty fail to perform under such contracts.
Futures contracts which were open at October 31, 2003 are as follows:
| | Number of | Expiration | Book | | Market | | Unrealized | |
Contracts | Contracts | Date | Value | | Value | | Gain/(Loss) | |
|
|
|
|
|
|
|
|
|
| S & P Index Futures (Buy) | 69 | December 2003 | $17,887,919 | | $18,103,875 | | $215,956 | |
|
|
|
|
|
|
|
|
|
|
|
|
6. Option Contracts
Premiums paid when put or call options are purchased by the Fund, represent investments, which are marked-to-market daily. When a purchased option expires, the Fund will realize a loss in the amount of the premium paid.When the Fund enters into a closing sales transaction, the Fund will realize a gain or loss depending on whether the proceeds from the closing sales transaction are greater or less than the premium paid for the option.When the Fund exercises a put option, it will realize a gain or loss from the sale of the underlying security and the proceeds from such sale will be decreased by the premium originally paid.When the Fund exercises a call option, the cost of the security which the Fund purchases upon exercise will be increased by the premium originally paid.
At October 31, 2003, the Fund held no purchased call options or purchased put options.
16 Smith Barney Capital Preservation Fund | 2003 Annual Report
Notes to Financial Statements (continued)
When a Fund writes a call or put option, an amount equal to the premium received by the Fund is recorded as a liability, the value of which is marked-to-market daily.When a written option expires, the Fund realizes a gain equal to the amount of the premium received.When the Fund enters into a closing purchase transaction, the Fund realizes a gain or loss depending upon whether the cost of the closing transaction is greater or less than the premium originally received, without regard to any unrealized gain or loss on the underlying security, and the liability related to such option is eliminated.When a written call option is exercised, the proceeds of the security sold will be increased by the premium originally received.When a written put option is exercised, the amount of the premium originally received will reduce the cost of the security which the Fund purchases upon exercise.When written index options are exercised, settlement is made in cash.
The risk associated with purchasing options is limited to the premium originally paid.The Fund enters into options for hedging purposes.The risk in writing a covered call option is that the Fund gives up the opportunity to participate in any increase in the price of the underlying security beyond the exercise price.The risk in writing a put option is that the Fund is exposed to the risk of loss if the market price of the underlying security declines.
No written covered call/put option transactions occurred during the year ended October 31, 2003.
7. Repurchase Agreements
The Fund purchases (and its custodian takes possession of ) U.S. government securities from banks and securities dealers subject to agreements to resell the securities to the sellers at a future date (generally, the next business day) at an agreed-upon higher repurchase price.The Fund requires continual maintenance of the market value (plus accrued interest) of the collateral in amounts at least equal to the repurchase price.
8.The Guarantee
Provided that all dividends and distributions received from the Fund have been reinvested and no shares have been redeemed by a shareholder, the Fund guarantees that on the Guarantee Maturity Date, as described in the prospectus, each shareholder will be entitled to redeem his or her shares for an amount no less than the value of that shareholder’s account as of the close of business on May 13, 2002, less certain expenses.The Fund’s guarantee is backed by an unconditional and irrevocable financial guarantee from Ambac Assurance Corporation (the “Guarantor”) pursuant to a financial guarantee insurance policy issued by the Guarantor for the benefit of the shareholders of the Fund.The Fund pays to the Guarantor a fee equal to 0.75% of the average daily net assets of the Fund during the Guarantee Period for providing the financial guarantee insurance policy. The guarantee fees amounted to $6,140,657 for the year ended October 31, 2003. Please see the prospectus for more information relating to the guarantee arrangement.
9. Foreign Currency Translation
The accounting records of the Fund are maintained in U.S. dollars. Foreign currency amounts are translated into U.S. dollars at the current rate of exchange to determine the value of investments, assets and liabilities. Purchases and sales of securities, and income and expenses are translated at the prevailing rate of exchange on the respective dates of such transactions.The Fund does not isolate that portion of the results of operations resulting from changes in foreign exchange rates on investments from the fluctuations arising from changes in market prices of securities held. Such fluctuations are included with the net realized and unrealized gain or loss from investments. Translation of foreign currency includes net exchange gains and losses resulting from the disposition of foreign currency and the difference between the amount of investment income, expenses and foreign withholding taxes recorded and the actual amount received or paid.
17 Smith Barney Capital Preservation Fund | 2003 Annual Report
Notes to Financial Statements (continued)
10. Shares of Beneficial Interest
At October 31, 2003, the Trust had an unlimited number of shares of beneficial interest authorized with a par value of $0.00001 per share.The Fund has the ability to issue multiple classes of shares. Each share of a class represents an identical interest and has the same rights, except that each class bears certain direct expenses specifically related to the distribution of its shares.
Transactions in shares of each class were as follows:
| | | | | | | | For the Period April 3, 2002 |
| | Year Ended | | (Commencement of Operations) to |
| | October 31, 2003 | | October 31, 2002 |
| |
|
|
|
|
|
| | Shares | | Amount | | Shares | | Amount |
|
|
|
|
|
|
|
|
|
|
|
| Class A | | | | | | | | | | |
| Shares sold | — | | | | — | | | 10,613,282 | | | | $120,976,230 | |
| Shares issued on reinvestment | 123,249 | | | | $ 1,376,693 | | | 4,281 | | | | 48,804 | |
| Shares reacquired | (2,977,944 | ) | | | (34,078,203 | ) | | (384,987 | ) | | | (4,336,477 | ) |
|
|
|
|
|
|
|
|
|
|
|
|
|
|
| Net Increase (Decrease) | (2,854,695 | ) | | | $(32,701,510 | ) | | 10,232,576 | | | | $116,688,557 | |
|
|
|
|
|
|
|
|
|
|
|
|
|
|
| | | | | | | | | | | | | | |
| Class B | | | | | | | | | | | | | |
| Shares sold | — | | | | — | | | 55,334,410 | | | | $630,840,688 | |
| Shares issued on reinvestment | 450,095 | | | | 5,023,063 | | | 12,142 | | | | 138,420 | |
| Shares reacquired | (7,806,786 | ) | | | (88,813,955 | ) | | (1,999,284 | ) | | | (22,501,169 | ) |
|
|
|
|
|
|
|
|
|
|
|
|
|
|
| Net Increase (Decrease) | (7,356,691 | ) | | | $(83,790,892 | ) | | 53,347,268 | | | | $608,477,939 | |
|
|
|
|
|
|
|
|
|
|
|
|
|
|
| | | | | | | | | | | | | | |
| Class L | | | | | | | | | | | | | |
| Shares sold | — | | | | — | | | 14,124,886 | | | | $161,021,392 | |
| Shares issued on reinvestment | 110,063 | | | | 1,229,400 | | | 3,343 | | | | 38,113 | |
| Shares reacquired | (4,595,192 | ) | | | (52,447,128 | ) | | (851,275 | ) | | | (9,559,763 | ) |
|
|
|
|
|
|
|
|
|
|
|
|
|
|
| Net Increase (Decrease) | (4,485,129 | ) | | | $(51,217,728 | ) | | 13,276,954 | | | | $151,499,742 | |
|
|
|
|
|
|
|
|
|
|
|
|
|
|
11.Trustee Retirement Plan
The Trustees of the Fund have adopted a Retirement Plan for all Trustees who are not “interested persons” of the Fund, within the meaning of the 1940 Act. Under the Plan, all Trustees are required to retire from the Board as of the last day of the calendar year in which the applicable Trustee attains age 75 (certain Trustees who had already attained age 75 when the Plan was adopted are required to retire effective December 31, 2003).Trustees may retire under the Plan before attaining the mandatory retirement age.Trustees who have served as Trustee of the Trust or any of the investment companies associated with Citigroup for at least ten years when they retire are eligible to receive the maximum retirement benefit under the Plan. The maximum retirement benefit is an amount equal to five times the amount of retainer and regular meeting fees payable to a Trustee during the calendar year ending on or immediately prior to the applicable Trustee’s retirement. Amounts under the Plan may be paid in installments or in a lump sum (discounted to present value). Benefits under the Plan are unfunded. The Fund’s allocable share of the expenses of the Plan for the period ended October 31, 2003 and the related liability at October 31, 2003 was not material.
18 Smith Barney Capital Preservation Fund | 2003 Annual Report
Notes to Financial Statements (continued)
12. Capital Loss Carryforward
At October 31, 2003, the Fund had, for Federal income tax purposes, a capital loss carryforward of approximately $46,104,000 available to offset future capital gains expiring October 31, 2010. To the extent that these carryforward losses are used to offset capital gains, it is probable that any gains so offset will not be distributed.
13. Subsequent Event
The Fund has received the following information from Citigroup Asset Management (“CAM”), the Citigroup business unit which includes the Fund’s Investment Manager and other investment advisory companies, all of which are indirect, wholly-owned subsidiaries of Citigroup. CAM is reviewing its entry, through an affiliate, into the transfer agent business in the period 1997-1999. As CAM currently understands the facts, at the time CAM decided to enter the transfer agent business, CAM sub-contracted for a period of five years certain of the transfer agency services to a third party and also concluded a revenue guarantee agreement with this sub-contractor providing that the sub-contractor would guarantee certain benefits to CAM or its affiliates (the “Revenue Guarantee Agreement”). In connection with the subsequent purchase of the sub-contractor’s business by an affiliate of the current sub-transfer agent (PFPC Inc.) used by CAM on many of the funds it manages, this Revenue Guarantee Agreement was amended eliminating those benefits in exchange for arrangements that included a onetime payment from the sub-contractor.
The Boards of CAM-managed funds (the “Boards”) were not informed of the Revenue Guarantee Agreement with the subcontractor at the time the Boards considered and approved the transfer agent agreements. Nor were the Boards informed of the subsequent amendment to the Revenue Guarantee Agreement when that occurred.
CAM has begun to take corrective actions. CAM will pay to the applicable funds $16 million (plus interest) that CAM and its affiliates received from the Revenue Guarantee Agreement and its amendment. CAM also plans an independent review to verify that the transfer agency fees charged by CAM were fairly priced as compared to competitive alternatives. CAM is instituting new procedures and making changes designed to ensure no similar arrangements are entered into in the future.
CAM has briefed the SEC, the New York State Attorney General and other regulators with respect to this matter, as well as the U.S.Attorney who is investigating the matter. CAM is cooperating with governmental authorities on this matter, the ultimate outcome of which is not yet determinable.
19 Smith Barney Capital Preservation Fund | 2003 Annual Report
Financial Highlights
For a share of each class of Capital Stock:
| | | | | For the Period April 3, 2002 |
| | Year Ended | (Commencement of Operations) to |
Class A Shares | October 31, 2003 | October 31, 2002 |
|
|
|
|
|
Net Asset Value, Beginning of Year | $ | 11.38 | | $ | 11.40 | |
|
|
|
|
|
|
|
| Income (Loss) From Operations: | | | | | | |
| Net investment income(1) | | | 0.222 | | | | 0.099 | |
| Net realized and unrealized gain (loss) | | | 0.040 | | | (0.109 | ) |
|
|
|
|
|
|
|
|
| Total Income (Loss) From Operations | | | 0.262 | | | (0.010 | ) |
|
|
|
|
|
|
|
|
| Less Distributions From: | | | | | | | | |
| Net investment income | | (0.142 | ) | | (0.010 | ) |
|
|
|
|
|
|
|
| Net Asset Value, End of Year | | $ | 11.50 | | | $ | 11.38 | |
|
|
|
|
|
|
|
|
|
| Total Return | | | 2.34 | % | | | (0.09 | )%** |
|
|
|
|
|
|
|
|
|
| Net Assets, End of Year (000s) | | $ | 84,831 | | | $ | 116,466 | |
|
|
|
|
|
|
|
| Ratios to Average Net Assets: | | | | | | | | |
| Expenses | | | 1.93 | % | | | 1.82 | %* |
| Net investment income | | | 1.94 | % | | | 1.59 | %* |
|
|
|
|
|
|
|
|
|
| Portfolio Turnover Rate | | | 13 | % | | | 47 | % |
|
|
|
|
|
|
|
|
|
| | | | | | | | | |
| Note: If Agents of the Fund had not voluntarily waived a portion of their fees the investment income per share and the ratios would have been as follows: | |
| | | | | | | | |
| Net investment income per share(1) | | $ | 0.222 | | | $ | 0.090 | |
| Ratios: | | | | | | | | |
| Expenses to average net assets | | | 1.93 | % | | | 1.97 | %* |
| Net investment income to average net assets | | | 1.94 | % | | | 1.44 | %* |
|
|
|
|
|
|
|
|
|
| * Annualized | | | | | | | | |
| ** Not Annualized | | | | | | | | |
| (1) The per share amounts were computed using a monthly average number of shares outstanding during the period. |
See Notes to Financial Statements.
20 Smith Barney Capital Preservation Fund | 2003 Annual Report
Financial Highlights (continued)
For a share of each class of Capital Stock:
| | | | | For the Period April 3, 2002 |
| | Year Ended | (Commencement of Operations) to |
Class B Shares | October 31, 2003 | October 31, 2002 |
|
|
|
|
|
Net Asset Value, Beginning of Year | $ | 11.34 | | $ | 11.40 | |
|
|
|
|
|
|
|
| Income (Loss) From Operations: | | | | | | |
| Net investment income(1) | | | 0.135 | | | | 0.055 | |
| Net realized and unrealized gain (loss) | | | 0.035 | | | (0.109 | ) |
|
|
|
|
|
|
|
|
| Total Income (Loss) From Operations | | | 0.170 | | | (0.054 | ) |
|
|
|
|
|
|
|
|
| Less Distributions From: | | | | | | | | |
| Net investment income | | (0.100 | ) | | (0.006 | ) |
|
|
|
|
|
|
|
| Net Asset Value, End of Year | | $ | 11.41 | | | $ | 11.34 | |
|
|
|
|
|
|
|
|
|
| Total Return | | | 1.52 | % | | | (0.48 | )%** |
|
|
|
|
|
|
|
|
|
| Net Assets, End of Year (000s) | | $ | 524,947 | | | $ | 605,061 | |
|
|
|
|
|
|
|
| Ratios to Average Net Assets: | | | | | | | | |
| Expenses | | | 2.68 | % | | | 2.52 | %* |
| Net investment income | | | 1.19 | % | | | 0.87 | %* |
|
|
|
|
|
|
|
|
|
| Portfolio Turnover Rate | | | 13 | % | | | 47 | % |
|
|
|
|
|
|
|
|
|
| | | | | | | | | |
| Note: If Agents of the Fund had not voluntarily waived a portion of their fees the investment income per share and the ratios would have | |
| been as follows: | | | | | | | | |
| Net investment income per share(1) | | $ | 0.135 | | | $ | 0.046 | |
| Ratios: | | | | | | | | |
| Expenses to average net assets | | | 2.68 | % | | | 2.66 | %* |
| Net investment income to average net assets | | | 1.19 | % | | | 0.73 | %* |
|
|
|
|
|
|
|
|
|
| * Annualized | | | | | | | | |
| ** Not Annualized | | | | | | | | |
| (1) The per share amounts were computed using a monthly average number of shares outstanding during the period. |
See Notes to Financial Statements.
21 Smith Barney Capital Preservation Fund | 2003 Annual Report
Financial Highlights (continued)
For a share of each class of Capital Stock:
| | | | | For the Period April 3, 2002 |
| | Years Ended | (Commencement of Operations) to |
Class L Shares | October 31, 2003 | October 31, 2002 |
|
|
|
|
|
Net Asset Value, Beginning of Year | $ | 11.34 | | $ | 11.40 | |
|
|
|
|
|
|
|
| Income (Loss) From Operations: | | | | | | |
| Net investment income(1) | | | 0.135 | | | | 0.055 | |
| Net realized and unrealized gain (loss) | | | 0.044 | | | (0.109 | ) |
|
|
|
|
|
|
|
|
| Total Income (Loss) From Operations | | | 0.179 | | | (0.054 | ) |
|
|
|
|
|
|
|
|
| Less Distributions From: | | | | | | | | |
| Net investment income | | (0.099 | ) | | (0.006 | ) |
|
|
|
|
|
|
|
| Net Asset Value, End of Year | | $ | 11.42 | | | $ | 11.34 | |
|
|
|
|
|
|
|
|
|
| Total Return | | | 1.60 | % | | | (0.48 | )%** |
|
|
|
|
|
|
|
|
|
| Net Assets, End of Year (000s) | | $ | 100,359 | | | $ | 150,586 | |
|
|
|
|
|
|
|
| Ratios to Average Net Assets: | | | | | | | | |
| Expenses | | | 2.68 | % | | | 2.52 | %* |
| Net investment income | | | 1.19 | % | | | 0.87 | %* |
|
|
|
|
|
|
|
|
|
| Portfolio Turnover Rate | | | 13 | % | | | 47 | % |
|
|
|
|
|
|
|
|
|
| | | | | | | | | |
| Note: If Agents of the Fund had not voluntarily waived a portion of their fees the investment income per share and the ratios would have | |
| been as follows: | | | | | | | | |
| Net investment income per share(1) | | $ | 0.135 | | | $ | 0.046 | |
| Ratios: | | | | | | | | |
| Expenses to average net assets | | | 2.68 | % | | | 2.66 | %* |
| Net investment income to average net assets | | | 1.19 | % | | | 0.73 | %* |
|
|
|
|
|
|
|
|
|
| * Annualized | | | | | | | | |
| ** Not Annualized | | | | | | | | |
| (1) The per share amounts were computed using a monthly average number of shares outstanding during the period. |
See Notes to Financial Statements.
22 Smith Barney Capital Preservation Fund | 2003 Annual Report
Independent Auditors’ Report
To the Shareholders and Board of Trustees
of the Smith Barney Trust II:
We have audited the accompanying statement of assets and liabilities, including the schedule of investments, of Smith Barney Capital Preservation Fund of Smith Barney Trust II (the “Trust”) as of October 31, 2003, and the related statement of operations for the year then ended, the statements of changes in net assets, and financial highlights for the year ended October 31, 2003 and for the period April 3, 2002 (Commencement of Operations) through October 31, 2002.These financial statements and financial highlights are the responsibility of the Fund’s management. Our responsibility is to express an opinion on these financial statements and financial highlights based on our audits.
We conducted our audits in accordance with auditing standards generally accepted in the United States of America.Those standards require that we plan and perform the audit to obtain reasonable assurance about whether the financial statements and financial highlights are free of material misstatement. An audit includes examining, on a test basis, evidence supporting the amounts and disclosures in the financial statements. Our procedures included confirmation of securities owned as of October 31, 2003, by correspondence with the custodian.An audit also includes assessing the accounting principles used and significant estimates made by management, as well as evaluating the overall financial statement presentation.We believe that our audits provide a reasonable basis for our opinion.
In our opinion, the financial statements and financial highlights referred to above present fairly, in all material aspects, the financial position of Smith Barney Capital Preservation Fund as of October 31, 2003, and the results of its operations for the year then ended, the statements of changes in its net assets and financial highlights for the year ended October 31, 2003 and for the period April 3, 2002 through October 31, 2002, in conformity with accounting principles generally accepted in the United States of America.

New York, New York
December 10, 2003
23 Smith Barney Capital Preservation Fund | 2003 Annual Report
Tax Information (unaudited)
For Federal tax purposes the Fund hereby designates for the year ended October 31, 2003.
• A corporate dividends received deduction of 9.62%.
A total of 97.37% of the ordinary dividends paid by the Fund from net investment income are derived from Federal obligations and may be exempt from taxation at the state level.
24 Smith Barney Capital Preservation Fund | 2003 Annual Report
Additional Information (unaudited)
Information about Trustees and Officers The business and affairs of the Smith Barney Capital Preservation Fund (the “Fund”) are managed under the direction of the Fund’s Board of Trustees. Information pertaining to the Trustees and officers of the Fund is set forth below. Each Trustee and officer holds office for his or her lifetime, unless that individual resigns, retires or is otherwise removed. The Statement of Additional Information includes additional information about Fund Trustees and is available, without charge, upon request by calling 1-800-451-2010.
| | | | | | | | | Number of | | Other Board | |
| | | | | | | Principal | | Portfolios In | | Memberships | |
| | | Position(s) | | Length | | Occupation(s) | | Fund Complex | | Held by | |
| | | Held with | | of Time | | During Past | | Overseen by | | Trustee During | |
| Name, Address and Age | | Fund | | Served | | Five Years | | Trustee | | Past Five Years | |
| |
| |
| |
| |
| |
| |
| NON-INTERESTED | | | | | | | | | | | |
| TRUSTEES: | | | | | | | | | | | |
| | | | | | | | | | | | |
| Elliott J. Berv | | Trustee | | Since 2001 | | President and Chief Operations | | 36 | | Board Member, | |
| c/o R. Jay Gerken | | | | | | Officer, Landmark City (real | | | | American Identity Corp. | |
| Citigroup Asset Management | | | | | | estate development) (since | | | | (doing business as | |
| 399 Park Avenue | | | | | | 2002); Executive Vice President | | | | Morpheus Technologies) | |
| New York, NY 10022 | | | | | | and Chief Operations Officer, | | | | (biometric information | |
| Age 60 | | | | | | DigiGym Systems (on-line | | | | management) (since | |
| | | | | | | personal training systems) (since | | | | 2001; consultant since | |
| | | | | | | 2001); Chief Executive Officer, | | | | 1999); Director, Lapoint | |
| | | | | | | Rocket City Enterprises (internet | | | | Industries (industrial | |
| | | | | | | service company) (from 2000 | | | | filter company) (since | |
| | | | | | | to 2001); President, Catalyst | | | | 2002); Director, | |
| | | | | | | (consulting) (since 1984). | | | | Alzheimer’s Association | |
| | | | | | | | | | | (New England Chapter) | |
| | | | | | | | | | | (since 1998). | |
| | | | | | | | | | | | |
| Donald M. Carlton | | Trustee | | Since 2001 | | Consultant, URS Corporation | | 31 | | Director, American | |
| c/o R. Jay Gerken | | | | | | (engineering) (since 1999); | | | | Electric Power | |
| Citigroup Asset Management | | | | | | former Chief Executive Officer, | | | | (electric utility) (since | |
| 399 Park Avenue | | | | | | Radian International LLC | | | | 1999); Director,Valero | |
| New York, NY 10022 | | | | | | (engineering) (from 1969 to | | | | Energy (petroleum | |
| Age 66 | | | | | | 1998), Member of Management | | | | refining) (since 1999); | |
| | | | | | | Committee, Signature Science | | | | Director, National | |
| | | | | | | (research and development) | | | | Instruments Corp. | |
| | | | | | | (since 2000). | | | | (technology) (since | |
| | | | | | | | | | | 1994). | |
| | | | | | | | | | | | |
| A. Benton Cocanougher | | Trustee | | Since 2001 | | Dean Emeritus and Wiley | | 31 | | Former Director, | |
| c/o R. Jay Gerken | | | | | | Professor,Texas A&M | | | | Randall’s Food Markets, | |
| Citigroup Asset Management | | | | | | University (since 2001); | | | | Inc. (from 1990 to 1999); | |
| 399 Park Avenue | | | | | | former Dean and Professor of | | | | former Director, First | |
| New York, NY 10022 | | | | | | Marketing, College and | | | | American Bank and | |
| Age 65 | | | | | | Graduate School of Business | | | | First American Savings | |
| | | | | | | of Texas A & M University | | | | Bank (from 1994 to | |
| | | | | | | (from 1987 to 2001). | | | | 1999). | |
25 Smith Barney Capital Preservation Fund | 2003 Annual Report
Additional Information (unaudited) (continued)
| | | | | | | | | Number of | | Other |
| | | | | | | Principal | | Portfolios In | | Board Memberships |
| | | Position(s) | | Length | | Occupation(s) | | Fund Complex | | Held by |
| | | Held with | | of Time | | During Past | | Overseen by | | Trustee During |
| Name, Address and Age | | Fund | | Served | | Five Years | | Trustee | | Past Five Years |
| |
| |
| |
| |
| |
|
| Mark T. Finn | | Trustee | | Since 2001 | | Adjunct Professor,William & | | 36 | | Former President and |
| c/o R. Jay Gerken | | | | | | Mary College (since September | | | | Director, Delta Financial, |
| Citigroup Asset Management | | | | | | 2002); Principal/member, Belvan | | | | Inc. (investment advisory |
| 399 Park Avenue | | | | | | Partners/Balfour Vantage – Manager | | | | firm) (from 1983 to |
| New York, NY 10022 | | | | | | and General Partner to the | | | | 1999). |
| Age 60 | | | | | | Vantage Hedge Fund, LP (since | | | | |
| | | | | | | March 2002); Chairman and | | | | |
| | | | | | | Owner,Vantage Consulting Group, | | | | |
| | | | | | | Inc. (investment advisory and | | | | |
| | | | | | | consulting firm) (since 1988); | | | | |
| | | | | | | former Vice Chairman and Chief | | | | |
| | | | | | | Operating Officer, Lindner Asset | | | | |
| | | | | | | Management Company (mutual | | | | |
| | | | | | | fund company) (from March 1999 | | | | |
| | | | | | | to 2001); former General Partner | | | | |
| | | | | | | and Shareholder, Greenwich | | | | |
| | | | | | | Ventures, LLC (investment | | | | |
| | | | | | | partnership) (from 1996 to 2001); | | | | |
| | | | | | | former President, Secretary, and | | | | |
| | | | | | | Owner, Phoenix Trading Co. | | | | |
| | | | | | | (commodity trading advisory firm) | | | | |
| | | | | | | (from 1997 to 2000). | | | | |
| | | | | | | | | | | |
| Stephen Randolph Gross | | Trustee | | Since 2001 | | Partner, Capital Investment | | 31 | | Director, United Telesis, |
| c/o R. Jay Gerken | | | | | | Advisory Partners (consulting) | | | | Inc. (telecommunications) |
| Citigroup Asset Management | | | | | | (since January 2000); former | | | | (since 1997); Director, |
| 399 Park Avenue | | | | | | Managing Director, Fountainhead | | | | eBank.com, Inc. (since |
| New York, NY 10022 | | | | | | Ventures, LLC (consulting) (from | | | | 1997); Director,Andersen |
| Age 56 | | | | | | 1998 to 2002); Secretary, Carint | | | | Calhoun, Inc. (assisted |
| | | | | | | N.A. (manufacturing) (since 1988); | | | | living) (since 1987); |
| | | | | | | former Treasurer, Hank Aaron | | | | former Director, Charter |
| | | | | | | Enterprises (fast food franchise) | | | | Bank, Inc. (from 1987 to |
| | | | | | | (from 1985 to 2001); Chairman, | | | | 1997); former Director, |
| | | | | | | Gross, Collins & Cress, P.C. | | | | Yu Save, Inc. (internet |
| | | | | | | (accounting firm) (since 1980); | | | | company) (from 1998 to |
| | | | | | | Treasurer, Coventry Limited, Inc. | | | | 2000); former Director, |
| | | | | | | (since 1985). | | | | Hotpalm, Inc. (wireless |
| | | | | | | | | | | applications) (from 1998 |
| | | | | | | | | | | to 2000); former |
| | | | | | | | | | | Director, Ikon Ventures, |
| | | | | | | | | | | Inc. (from 1997 to 1998). |
| | | | | | | | | | | |
| Diana R. Harrington | | Trustee | | Since 1992 | | Professor, Babson College | | 36 | | Former Trustee,The |
| c/o R. Jay Gerken | | | | | | (since 1993). | | | | Highland Family of |
| Citigroup Asset Management | | | | | | | | | | Funds (investment |
| 399 Park Avenue | | | | | | | | | | company) (from March |
| New York, NY 10022 | | | | | | | | | | 1997 to March 1998). |
| Age 63 | | | | | | | | | | |
| | | | | | | | | | | |
| Susan B. Kerley | | Trustee | | Since 1992 | | Consultant, Strategic Management | | 36 | | Director, Eclipse Funds |
| c/o R. Jay Gerken | | | | | | Advisors, LLC/Global Research | | | | (currently supervises 17 |
| Citigroup Asset Management | | | | | | Associates, Inc. (investment | | | | investment companies |
| 399 Park Avenue | | | | | | consulting) (since 1990). | | | | in fund complex) (since |
| New York, NY 10022 | | | | | | | | | | 1990). |
| Age 52 | | | | | | | | | | |
26 Smith Barney Capital Preservation Fund | 2003 Annual Report
Additional Information (unaudited) (continued)
| | | | | | | | | Number of | | Other | |
| | | | | | | Principal | | Portfolios In | | Board Memberships | |
| | | Position(s) | | Length | | Occupation(s) | | Fund Complex | | Held by | |
| | | Held with | | of Time | | During Past | | Overseen by | | Trustee During | |
| Name, Address and Age | | Fund | | Served | | Five Years | | Trustee | | Past Five Years | |
| |
| |
| |
| |
| |
| |
| Alan G. Merten | | Trustee | | Since 2001 | | President, George Mason | | 31 | | Director, Comshare, | |
| c/o R. Jay Gerken | | | | | | University (since 1996). | | | | Inc. (information | |
| Citigroup Asset Management | | | | | | | | | | technology) (since 1985); | |
| 399 Park Avenue | | | | | | | | | | former Director, Indus | |
| New York, NY 10022 | | | | | | | | | | (information technology) | |
| Age 62 | | | | | | | | | | (from 1995 to 1999); | |
| | | | | | | | | | | Director DigitalNet | |
| | | | | | | | | | | Holding Inc. (since | |
| | | | | | | | | | | 2003). | |
| | | | | | | | | | | | |
| C. Oscar Morong, Jr. | | Trustee | | Since 1991 | | Managing Director, Morong | | 36 | | Former Director, | |
| c/o R. Jay Gerken | | | | | | Capital Management | | | | Indonesia Fund (closed- | |
| Citigroup Asset Management | | | | | | (since 1993). | | | | end fund) (from 1990 to | |
| 399 Park Avenue | | | | | | | | | | 1999);Trustee, Morgan | |
| New York, NY 10022 | | | | | | | | | | Stanley Institutional Fund | |
| Age 68 | | | | | | | | | | Fund (currently super- | |
| | | | | | | | | | | vises 75 investment | |
| | | | | | | | | | | companies) (since 1993). | |
| | | | | | | | | | | | |
| R. Richardson Pettit | | Trustee | | Since 2001 | | Professor of Finance, University | | 31 | | None | |
| c/o R. Jay Gerken | | | | | | of Houston (from 1977 to 2002); | | | | | |
| Citigroup Asset Management | | | | | | independent consultant | | | | | |
| 399 Park Avenue | | | | | | (since 1984). | | | | | |
| New York, NY 10022 | | | | | | | | | | | |
| Age 61 | | | | | | | | | | | |
| | | | | | | | | | | | |
| Walter E. Robb, III | | Trustee | | Since 2001 | | President, Benchmark Consulting | | 36 | | Director, John Boyle & | |
| c/o R. Jay Gerken | | | | | | Group, Inc. (service company) | | | | Co., Inc. (textiles) (since | |
| Citigroup Asset Management | | | | | | (since 1991); sole proprietor, Robb | | | | 1999); Director, Harbor | |
| 399 Park Avenue | | | | | | Associates (financial consulting) | | | | Sweets, Inc. (candy) | |
| New York, NY 10022 | | | | | | (since 1978); Co-owner, Kedron | | | | (since 1990); Director, | |
| Age 77 | | | | | | Design (gifts) (since 1978); | | | | W.A.Wilde Co. (direct | |
| | | | | | | former President and Treasurer, | | | | media marketing) (since | |
| | | | | | | Benchmark Advisors, Inc. | | | | 1982); Director, Alpha | |
| | | | | | | (financial consulting) (from 1989 | | | | Grainger Manufacturing, | |
| | | | | | | to 2000). | | | | Inc. (electronics) (since | |
| | | | | | | | | | | 1983); former Trustee, | |
| | | | | | | | | | | MFS Family of Funds | |
| | | | | | | | | | | (investment company) | |
| | | | | | | | | | | (from 1985 to 2001); | |
| | | | | | | | | | | Harvard Club of Boston | |
| | | | | | | | | | | (Audit Committee) | |
| | | | | | | | | | | (since 2001). | |
| | | | | | | | | | | | |
| INTERESTED | | | | | | | | | | | |
| TRUSTEE: | | | | | | | | | | | |
| R. Jay Gerken* | | Chairman, | | Since 2002 | | Managing Director of CGM; | | Chairman | | N/A | |
| Citigroup Asset Management | | President, | | | | Chairman, President, and Chief | | of the Board, | | | |
| 399 Park Avenue | | and Chief | | | | Executive Officer of Smith Barney | | Trustee or | | | |
| New York, NY 10022 | | Executive | | | | Fund Management LLC (“SBFM”), | | Director | | | |
| Age 52 | | Officer | | | | Travelers Investment Advisers, Inc. | | of 220 | | | |
| | | | | | | (“TIA”) and Citi Fund | | | | | |
| | | | | | | Management Inc. (“CFM”); | | | | | |
| | | | | | | President and Chief Executive | | | | | |
| | | | | | | Officer of certain mutual funds | | | | | |
| | | | | | | associated with Citigroup Inc.; | | | | | |
| | | | | | | formerly, Portfolio Manager of | | | | | |
| | | | | | | Smith Barney Allocation Series | | | | | |
| | | | | | | Inc. (from 1996 to 2001) and | | | | | |
| | | | | | | Smith Barney Growth and Income | | | | | |
| | | | | | | Fund (from 1996 to 2000). | | | | | |
27 Smith Barney Capital Preservation Fund | 2003 Annual Report
Additional Information (unaudited) (continued)
| | | | | | | | Number of | | Other |
| | | | | | Principal | | Portfolios In | | Board Memberships |
| | Position(s) | | Length | | Occupation(s) | | Fund Complex | | Held by |
| | Held with | | of Time | | During Past | | Overseen by | | Trustee During |
| Name, Address and Age | | Fund | | Served | | Five Years | | Trustee | | Past Five Years |
| |
| |
| |
| |
| |
|
| OFFICERS: | | | | | | | | | | |
| Andrew B. Shoup** | | Senior | | Since 2003 | | Director of Citigroup Asset | | N/A | | N/A |
| 125 Broad Street | | Vice President | | | | Management (“CAM”); Chief | | | | |
| New York, NY 10004 | | and Chief | | | | Administrative Officer of mutual | | | | |
| Age 47 | | Administrative | | | | funds associated with Citigroup | | | | |
| | Officer | | | | Inc.; Head of International Funds | | | | |
| | | | | | Administration of CAM (from | | | | |
| | | | | | 2001 to 2003); Director of Global | | | | |
| | | | | | Funds Administration of CAM | | | | |
| | | | | | (from 2000 to 2001); Head of U.S. | | | | |
| | | | | | Citibank Funds Administration | | | | |
| | | | | | of CAM (from 1998 to 2000). | | | | |
| Frances M. Guggino | | Controller | | Since 2002 | | Vice President of CGM; | | N/A | | N/A |
| 125 Broad Street | | | | | | Controller of certain mutual funds | | | | |
| New York, NY 10004 | | | | | | associated with Citigroup Inc. | | | | |
| Age 46 | | | | | | | | | | |
| Robert I. Frenkel | | Secretary and | | Since 2000 | | Managing Director and General | | N/A | | N/A |
| CAM | | Chief Legal | | Since 2003 | | Counsel, Global Mutual Funds | | | | |
| 300 First Stamford Place | | Officer | | | | for CAM (since 1994); Secretary | | | | |
| Stamford, CT 06902 | | | | | | of certain mutual funds | | | | |
| Age 49 | | | | | | associated with Citigroup Inc.; | | | | |
| | | | | | Chief Legal Officer of mutual | | | | |
| | | | | | funds associated with Citigroup Inc. | | | | |
| | | | | | | | | | | |
| * Mr. Gerken is an “interested person” of the fund as defined in the 1940 Act because he is an officer of certain affiliates of the Manager. |
| ** As of November 25, 2003. | |
28 Smith Barney Capital Preservation Fund | 2003 Annual Report
SMITH BARNEY
CAPITAL PRESERVATION FUND
| TRUSTEES | INVESTMENT MANAGER |
| Elliott J. Berv | Smith Barney Fund Management LLC |
| Donald M. Carlton | |
| A. Benton Cocanougher | |
| Mark T. Finn | DISTRIBUTOR |
| R. Jay Gerken, CFA, Chairman* | Citigroup Global Markets Inc. |
| Stephen Randolph Gross | PFS Distributors, Inc. |
| Diana R. Harrington | |
| Susan B. Kerley | |
| Alan G. Merten | CUSTODIAN |
| C. Oscar Morong, Jr. | State Street Bank |
| R. Richardson Pettit | &Trust Company |
| Walter E. Robb, III | |
| | |
| | TRANSFER AGENT |
| OFFICERS | Citicorp Trust Bank, fsb. |
| R. Jay Gerken, CFA* | 125 Broad Street, 11th Floor |
| President and | New York, New York 10004 |
| Chief Executive Officer | |
| | |
| | SUB-TRANSFER AGENT |
| Andrew B. Shoup*† | PFPC Global Fund Services |
| Senior Vice President and | P.O. Box 9699 |
| Chief Administrative Officer | Providence, Rhode Island |
| | 02940-9699 |
| | |
| Frances M. Guggino* | |
| Controller | Primerica Shareholder Services |
| | P.O. Box 9662 |
| | Providence, Rhode Island |
| Robert I. Frenkel* | 02940-9662 |
| Secretary and Chief Legal Officer | |
| | |
| * Affiliated Person of | AUDITORS |
| Investment Manager | KPMG LLP |
| | 757 Third Avenue |
| † As of November 25, 2003 | New York, New York 10017 |
Smith Barney Capital Preservation Fund
This report is submitted for the general information of shareholders of Smith Barney Capital Preservation Fund. It is not for distribution to prospective investors unless accompanied by a current Prospectus for the Fund, which contains information concerning the Fund’s investment policies and expenses as well as other pertinent information. If used as sales material after January 31, 2004, this report must be accompanied by performance information for the most recently completed calendar quarter.
SMITH BARNEY CAPITAL PRESERVATION FUND
Smith Barney Mutual Funds
125 Broad Street
10th Floor, MF-2
New York, New York 10004
For complete information on any Smith Barney Mutual Funds, including management fees and expenses, call or write your financial professional for a free prospectus. Read it carefully before you invest or send money.
www.smithbarneymutualfunds.com
©2003 Citigroup Global Markets Inc.
Member NASD, SIPC
ITEM 2.  CODE OF ETHICS.

         The registrant has adopted a code of ethics that applies to the
         registrant's principal executive officer, principal financial officer,
         principal accounting officer or controller.

ITEM 3.  AUDIT COMMITTEE FINANCIAL EXPERT.

         The Board of Trustees of the registrant has determined that Mr. Stephen
         Randolph Gross, the Chairman of the Board's Audit Committee, possesses
         the technical attributes identified in Instruction 2(b) of Item 3 to
         Form N-CSR to qualify as an "audit committee financial expert," and has
         designated Mr. Gross as the Audit Committee's financial expert. Mr.
         Gross is an "independent" Trustee pursuant to paragraph (a)(2) of Item
         3 to Form N-CSR.


ITEM 4.  PRINCIPAL ACCOUNTANT FEES AND SERVICES.

         Not applicable.

ITEM 5.  AUDIT COMMITTEE OF LISTED REGISTRANTS.

         Not applicable.

ITEM 6.  [RESERVED]

ITEM 7.  DISCLOSURE OF PROXY VOTING POLICIES AND PROCEDURES FOR CLOSED-END
         MANAGEMENT INVESTMENT COMPANIES.

         Not applicable.

ITEM 8.  [RESERVED]

ITEM 9.  CONTROLS AND PROCEDURES.

         (a)  The registrant's principal executive officer and principal
              financial officer have concluded that the registrant's disclosure
              controls and procedures (as defined in Rule 30a- 3(c) under the
              Investment Company Act of 1940, as amended (the "1940 Act")) are
              effective as of a date within 90 days of the filing date of this
              report that includes the disclosure required by this paragraph,
              based on their evaluation of the disclosure controls and
              procedures required by Rule 30a-3(b) under the 1940 Act and
              15d-15(b) under the Securities Exchange Act of 1934

         (b)  There were no changes in the registrant's internal control over
              financial reporting (as defined in Rule 30a-3(d) under the 1940
              Act) that occurred during the registrant's last fiscal half-year
              (the registrant's second fiscal half-year in the case of an annual
              report) that have materially affected, or are likely to materially
              affect the registrant's internal control over financial reporting.


ITEM 10. EXHIBITS.

         (a)(1) Code of Ethics attached hereto.

         (a)(2) Attached hereto.

                  Exhibit 99.CERT         Certifications pursuant to section 302
                                          of the Sarbanes-Oxley Act of 2002

         (b) Furnished.

                  Exhibit 99.906CERT      Certifications pursuant to Section 906
                                          of the Sarbanes-Oxley Act of 2002


SIGNATURES

     Pursuant to the requirements of the Securities Exchange Act of 1934 and the
Investment Company Act of 1940, the registrant has duly caused this Report to be
signed on its behalf by the undersigned, there unto duly authorized.

Smith Barney Capital Preservation Fund


By:      /s/ R. Jay Gerken
         R. Jay Gerken
         Chief Executive Officer of
         Smith Barney Capital Preservation Fund

Date:    December 22, 2003

     Pursuant to the requirements of the Securities Exchange Act of 1934 and the
Investment Company Act of 1940, this report has been signed below by the
following persons on behalf of the registrant and in the capacities and on the
dates indicated.

By:      /s/ R. Jay Gerken
         (R. Jay Gerken)
         Chief Executive Officer of
         Smith Barney Capital Preservation Fund

Date:    December 22, 2003

By:      /s/ Andrew B. Shoup
         Chief Administrative Officer of
         Smith Barney Capital Preservation Fund

Date:    December 22, 2003