M A N A G E R O V E R V I E W
Performance Review
For the 12 months ended December 31, 2003, Class A shares of the Smith Barney International Large Cap Fund, excluding sales charges, returned 28.55%. These shares underperformed the fund’s unmanaged benchmark, the MSCI Europe, Australasia and Far East Index (“MSCI EAFE”),i which returned 38.59% for the same period. They also underperformed the fund’s Lipper international funds category average, which was 34.74% for the same time frame.1
Market Overview ii
International markets reached their low point for 2003 in March, but then recovered strongly over the balance of the year. The market’s rise was driven by low global interest rates, a perceived reduction in geopolitical risk following early military success by coalition forces in Iraq and signs of economic recovery in the United States, Japan and elsewhere. Among the larger markets, Germany and Australia performed particularly strongly over the year. From a sector perspective, the recovery had the greatest positive impact in cyclical areas, such as the industrials, information technology and materials sectors. By contrast, more stable growth sectors, such as consumer staples and healthcare, lagged significantly.
International stock markets in 2003 were focused primarily on recovery prospects for corporate profits. Companies that operate in more depressed businesses or that suffer from weak financial positions tended to outperform, as the market anticipated that these companies would enjoy the greatest relief from economic recovery. Soundly financed companies, operating in attractive, high-return businesses — but with less leverage to improving economic conditions — tended to underperform, despite enjoying generally lower valuations than their more cyclical and lower-quality counterparts.
PERFORMANCE SNAPSHOT
AS OF DECEMBER 31, 2003
(excluding sales charges)
| | 6 Months | | 12 Months | |
| |
| Class A Shares | 22.26% | | 28.55% | |
|
| |
| MSCI Europe, Australasia | | | | |
| and Far East Index | 26.59% | | 38.59% | |
|
| |
| Lipper International | | | | |
| Funds Category Average | 23.93% | | 34.74% | |
|
|
|
| |
All figures represent past performance and are not a guarantee of future results. Principal value and investment returns will fluctuate and investors’ shares, when redeemed may be worth more or less than their original cost.
Class A share returns assume the reinvestment of income dividends and capital gains distributions at net asset value and the deduction of all fund expenses. Returns have not been adjusted to include sales charges that may apply when shares are purchased or the deduction of taxes that a shareholder would pay on fund distributions. Excluding sales charges, Class B shares returned 21.57% and Class L shares returned 21.81% over the six months ended December 31, 2003. Excluding sales charges, Class B shares returned 27.51% and Class L shares returned 27.84% over the 12 months ended December 31, 2003.
All index performance reflects no deduction for fees, expenses or taxes. The MSCI Europe, Australasia and Far East Index is an unmanaged index of common stocks of companies located in Europe, Australasia and the Far East. Please note that an investor cannot invest directly in an index.
Lipper, Inc. is a major independent mutual-fund tracking organization. Returns are based on the period ended December 31, 2003, calculated among the 854 funds for the six-month period and among the 834 funds for the 12-month period in the fund’s Lipper category including the reinvestment of dividends and capital gains, if any, and excluding sales charges.
1 Lipper, Inc. is a major independent mutual-fund tracking organization. Returns are based on the 12-month period ended December 31, 2003, calculated among the 834 funds in the fund’s Lipper category including the reinvestment of dividends and capital gains, if any, and excluding sales charges.
2 Smith Barney International Large Cap Fund | 2003 Annual Report
Fund Performance
The fund focuses on companies that our analysis suggests are most attractive within their global sectors in terms of long-term valuations based on projections of cash flows and dividends several years into the future. While we believe that this approach remains an effective long-term strategy, it has proved less successful in an environment focused primarily on short-term recovery prospects. We emphasize stock selection rather than geographic or sector allocations when constructing the fund’s portfolio.
Our strategy resulted in disappointing stock selections during the first nine months of 2003, although we saw some improvement in the fourth quarter. Over the full 12-month period, performance was most disappointing in Japan and Continental Europe. In Japan, the fund did not have exposure to domestic financial companies that performed well, but it did hold overweighted positions in exporters, companies such as Honda Motor Company, Ltd., Toyota Motor Corp. and Canon Inc. A combination of domestic cyclical recovery and the rise in the Japanese yen against the U.S. dollar made this positioning disadvantageous over the short term. As of year-end, the fund remained underweight in the Japanese financials sector and continued to hold Honda, Toyota and Canon. Within continental Europe, our stock selection strategy fell short of the benchmark in France and Switzerland, where we held overweighted positions in Sanofi-Synthelabo and Nestle SA for much of the year. Sanofi-Synthelabo and Nestle represented the largest detractors from performance in their respective markets, and we sold both during 2003.
On the other hand, the fund benefited from our stock selections in Norway, Germany and the United Kingdom. In Norway, the addition of Telenor ASA, which remains in the portfolio, contributed positively to the fund’s returns.The fund’s holdings in Germany benefited from an investment in SAP AG during the first half of the year. In the United Kingdom, Hanson Plc., Tesco Plc. and Wolseley Plc. performed well.As of the end of December, Tesco remained in the fund but we have sold Hanson and Wolseley.
Thank you for your investment in the Smith Barney International Large Cap Fund.We appreciate that you have entrusted us to manage your money and value our relationship with you.
Sincerely,
The International Large Cap Equity Team
January 19, 2004
The information provided is not intended to be a forecast of future events, a guarantee of future results or investment advice. Views expressed may differ from those of the firm as a whole.
Portfolio holdings and breakdowns are as of December 31, 2003 and are subject to change and may not be representative of the portfolio manager’s current or future investments. The fund’s top ten holdings as of this date were: BP, Plc. (4.43%); BNP Paribas, SA (3.30%); Tesco, Plc. (2.98%); Toyota Motor Corp. (2.85%); ENI, Spa. (2.72%); Unicredito Italiano, Spa. (2.39%); Australia & New Zealand Bank Group, Ltd. (2.31%); Royal Bank of Scotland (2.27%); E.ON AG. (2.17%); and Vodafone Group, Plc. (2.14%);. Please refer to pages 6 through 8 for a list and percentage breakdown of the fund’s holdings.
All index performance reflects no deduction for fees, expenses or taxes.
i The MSCI Europe, Australasia and Far East Index is an unmanaged index of common stocks of companies located in Europe, Australasia and the Far East. Please note that an investor cannot invest directly in an index.
ii Risk: Foreign stocks are subject to certain risks of overseas investing including currency fluctuations and changes in political and economic conditions, which could result in significant market fluctuations.
3 Smith Barney International Large Cap Fund | 2003 Annual Report
Average Annual Total Returns† (unaudited)
| | Without Sales Charges(1) | |
| |
|
|
| | Class A | | Class B | | Class L | | Class Y | |
|
|
|
|
|
|
|
|
|
| Twelve Months Ended 12/31/03 | 28.55 | % | 27.51 | % | 27.84 | % | — | |
|
|
|
|
|
|
|
|
|
| Five Years Ended 12/31/03 | (2.30 | )% | — | | — | | — | |
|
|
|
|
|
|
|
|
|
| Ten Years Ended | 1.67 | % | — | | — | | — | |
|
|
|
|
|
|
|
|
|
| Inception†† through 12/31/03 | 3.39 | % | (3.45 | )% | (7.10 | )% | 27.58 | %* |
|
|
|
|
|
|
|
|
|
| | | | | | | | | |
| | With Sales Charges(2) | |
| |
|
|
| | Class A | | Class B | | Class L | | Class Y | |
|
|
|
|
|
|
|
|
|
| Twelve Months Ended 12/31/03 | 22.12 | % | 22.51 | % | 25.50 | % | — | |
|
|
|
|
|
|
|
|
|
| Five Years Ended 12/31/03 | (3.30 | )% | — | | — | | — | |
|
|
|
|
|
|
|
|
|
| Ten Years Ended | 1.15 | % | — | | — | | — | |
|
|
|
|
|
|
|
|
|
| Inception†† through 12/31/03 | 2.98 | % | (3.62 | )% | (7.38 | )% | 27.58 | %* |
|
|
|
|
|
|
|
|
|
| (1) | Assumes reinvestment of all dividends and capital gain distributions, if any, at net asset value and does not reflect deduction of all applicable sales charges with respect to Class A and L shares or the applicable contingent deferred sales charges (“CDSC”) with respect to Class B and L shares. |
| (2) | Assumes reinvestment of all dividends and capital gain distributions, if any, at net asset value. In addition, Class A and L shares reflect the deduction of the maximum sales charge of 5.00% and 1.00%, respectively, and Class B shares reflect the deduction of a 5.00% CDSC, which applies if shares are redeemed within one year from purchase payment. Thereafter, this CDSC declines by 1.00% per year until no CDSC is incurred. Class L shares also reflect the deduction of 1.00% CDSC, which applies if shares are redeemed within one year of purchase payment. |
| † | All figures represent past performance and are not a guarantee of future results. Investment returns and principal value will fluctuate, and redemption value may be more or less than the original cost. The returns shown do not reflect the deduction of taxes that a shareholder would pay on a fund distribution or the redemption of fund shares. |
| †† | Inception dates for Class A, B, L, and Y shares are March 1, 1991, January 4, 1999, September 22, 2000 and May 20, 2003, respectively. |
| * | Not Annualized. |
4 Smith Barney International Large Cap Fund | 2003 Annual Report
Historical Performance (unaudited)
Value of $10,000 Invested in Class A Shares of the Smith Barney International Large Cap Fund vs. Benchmark
December 1993 — December 2003
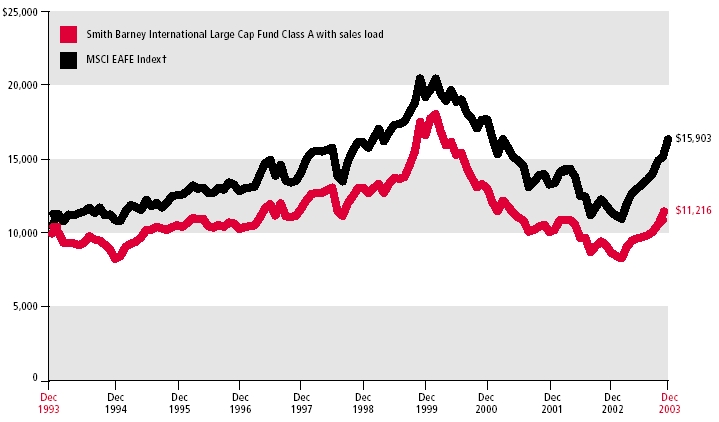
The graph includes the initial sales charge on the Fund (no comparable charge exists for the index) and assumes all dividends and distributions from the Fund are reinvested at net asset value.
Notes: All Fund performance numbers represent past performance and are no guarantee of future results. The Fund’s share price and investment return will fluctuate so that the value of an investor’s shares, when redeemed, may be worth more or less than their original cost. The returns shown do not reflect the deduction of taxes that a shareholder would pay on fund distributions or the redemption of fund shares. Total returns include change in share price and reinvestment of dividends and distributions, if any. Total return figures “with sales charge” are provided in accordance with SEC guidelines for comparative purposes for prospective investors and reflect certain voluntary fee waivers which may be terminated at any time. If the waivers were not in place, the Fund’s returns would have been lower. The returns shown do not reflect the deductions of taxes that a shareholder would pay on fund distributions or the redemption of fund shares. The maximum sales charge of 5.00% went into effect on January 4, 1999. Investors may not invest directly in an index. The performance of the Fund’s other classes may be greater or less than the performance of Class A shares performance indicated on this chart, depending on whether greater or lesser sales charges and fees were incurred by shareholders investing in other classes.
| † | The MSCI EAFE Index (Europe, Australasia and the Far East) is a free float-adjusted market capitalization index that is designed to measure developed market equity performance, excluding the US & Canada. As of December 2003 the MSCI EAFE Index consisted of the following 21 developed market country indices: Australia, Austria, Belgium, Denmark, Finland, France, Germany, Greece, Hong Kong, Ireland, Italy, Japan, the Netherlands, New Zealand, Norway, Portugal, Singapore, Spain, Sweden, Switzerland and the United Kingdom. |
5 Smith Barney International Large Cap Fund | 2003 Annual Report
| Schedule of Investments | December 31, 2003 |
| | | | | | |
| SHARES | | SECURITY | INDUSTRY | VALUE | |
|
|
| |
| COMMON STOCKS — 100% | | | |
| Australia — 4.2% | | | |
| 83,611 Australia & New Zealand Bank Group Ltd. | Banks | $ | 1,113,043 | |
| 68,080 Brambles Industries Ltd. | Commercial Services & Supplies | | 270,657 | |
| 14,763 National Australia Bank Ltd. | Banks | | 332,918 | |
| 40,224 QBE Insurance Group Ltd. | Insurance | | 321,039 | |
|
|
|
| |
| | | 2,037,657 | |
|
|
|
| |
| Denmark — 1.4% | | | | |
| 17,026 Novo Nordisk AS | Pharmaceuticals | | 692,828 | |
|
|
|
| |
| Finland — 3.0% | | | | |
| 42,795 Nokia OYJ | Communications Equipment | | 726,708 | |
| 53,193 Stora Enso OYJ | Paper & Forest Products | | 715,779 | |
|
|
|
| |
| | | 1,442,487 | |
|
|
|
| |
| France — 12.6% | | | | |
| 11,083 Accor SA | Hotels Restaurants & Leisure | | 501,309 | |
| 10,292 Alcatel SA | Communications Equipment | | 132,397 | |
| 3,751 Aventis SA | Pharmaceuticals | | 247,646 | |
| 25,336 BNP Paribas SA | Banks | | 1,593,551 | |
| 10,847 Bouygues SA | Wireless Telecommunication Services | | 378,840 | |
| 11,674 Carrefour SA | Food & Drug Retailing | | 640,121 | |
| 12,194 Credit Agricole SA | Banks | | 290,837 | |
| 14,012 France Telecom SA | Diversified Telecommunication Services | | 400,049 | |
| 4,208 Renault SA | Automobiles | | 290,012 | |
| 9,049 Schneider Electric SA | Electrical Equipment | | 591,727 | |
| 4,749 Total SA | Oil & Gas | | 881,969 | |
| 1,425 Vinci SA | Construction & Engineering | | 117,870 | |
|
|
|
| |
| | | 6,066,328 | |
|
|
|
| |
| Germany — 8.0% | | | | |
| 6,836 Altana AG | Pharmaceuticals | | 410,410 | |
| 6,656 Bayer AG | Chemicals | | 194,728 | |
| 4,380 Bayerische Motoren Werke AG | Automobiles | | 202,808 | |
| 7,145 DaimlerChrysler AG | Automobiles | | 333,087 | |
| 16,036 E.ON AG | Electric Utilities | | 1,045,384 | |
| 9,842 Metro AG | Multiline Retail | | 433,395 | |
| 6,335 RWE AG | Multi-Utilities | | 250,389 | |
| 4,406 Schering AG | Pharmaceuticals | | 222,886 | |
| 9,666 Siemens AG | Electrical Equipment | | 773,346 | |
|
|
|
| |
| | | 3,866,433 | |
|
|
|
| |
| Hong Kong — 0.5% | | | | |
| 58,000 Henderson Land Development Co. Ltd. | Real Estate | | 256,242 | |
|
|
|
| |
| Italy — 6.1% | | | | |
| 24,741 Alleanza Assicurazioni Spa | Insurance | | 270,577 | |
| 69,661 ENI Spa | Oil & Gas | | 1,313,030 | |
| 15,361 San Paolo IMI Spa | Banks | | 200,121 | |
| 213,475 Unicredito Italiano Spa | Banks | | 1,151,183 | |
|
|
|
| |
| | | 2,934,911 | |
|
|
|
| |
See Notes to Financial Statements.
6 Smith Barney International Large Cap Fund | 2003 Annual Report
| Schedule of Investments (continued) | December 31, 2003 |
| | | | |
| SHARES | | SECURITY | INDUSTRY | VALUE | |
|
|
| |
| Japan — 22.6% | | | |
| 4,500 Advantest Corp. | Semiconductor Equipment & Products | $ | 357,029 | |
| 15,000 Canon Inc. | Office Electronics | | 698,651 | |
| 14,400 Denso Corp. | Auto Components | | 283,605 | |
| 40 East Japan Railway Co. | Road & Rail | | 188,547 | |
| 4,600 Eisai Co. Ltd. | Pharmaceuticals | | 124,086 | |
| 9,000 Fuji Photo Film Co. Ltd. | Leisure Equipment & Products | | 290,661 | |
| 52,000 Hitachi Ltd. | Electronic Equipment & Instruments | | 313,548 | |
| 20,500 Honda Motor Co., Ltd. | Automobiles | | 910,813 | |
| 6,600 Hoya Corp. | Electronic Equipment & Instruments | | 606,188 | |
| 17,000 Matsushita Electric Industries Co. Ltd. | Household Durables | | 235,161 | |
| 45,000 Mitsubishi Electric Corp. | Electrical Equipment | | 186,914 | |
| 39 Mitsubishi Tokyo Financial Group Inc. | Banks | | 304,326 | |
| 124,000 Mitsui Sumitomo Insurance Co. Ltd. | Insurance | | 1,018,528 | |
| 183 Nippon Telegraph & Telephone Corp. | Diversified Telecommunication Services | | 883,101 | |
| 38,000 Ricoh Co. Ltd. | Office Electronics | | 750,175 | |
| 12,100 Sankyo Co. Ltd. | Pharmaceuticals | | 227,577 | |
| 47,000 Sumitomo Corp. | Trading Companies & Distributors | | 350,520 | |
| 60,000 Sumitomo Electrical Industries, Ltd. | Electrical Equipment | | 536,519 | |
| 26,000 Takeda Chemical Industries, Ltd. | Pharmaceuticals | | 1,031,409 | |
| 20,000 Toppan Printing Co. Ltd. | Commercial Services & Supplies | | 208,149 | |
| 40,700 Toyota Motor Corp. | Automobiles | | 1,375,218 | |
|
|
|
| |
| | | 10,880,725 | |
|
|
|
| |
| Netherlands — 6.8% | | | | |
| 13,365 Akzo Nobel NV | Chemicals | | 515,281 | |
| 23,824 Fortis | Diversified Financials | | 479,372 | |
| 10,626 Heineken NV | Beverages | | 404,191 | |
| 13,097 ING Groep NV | Diversified Financials | | 305,114 | |
| 14,289 Koninkijke (Royal) Philips Electric NV | Household Durables | | 416,779 | |
| 4,094 TPG NV | Air Freight & Couriers | | 95,788 | |
| 11,974 Unilever NV | Food Products | | 782,243 | |
| 9,359 VNU NV | Media | | 295,387 | |
|
|
|
| |
| | | 3,294,155 | |
|
|
|
| |
| Norway — 1.4% | | | | |
| 105,695 Telenor ASA | Diversified Telecommunication Services | | 689,729 | |
|
|
|
| |
| Portugal — 0.5% | | | | |
| 23,849 Portugal Telecom SGPS, SA | Diversified Telecommunication Services | | 239,788 | |
|
|
|
| |
| Singapore — 1.3% | | | | |
| 32,000 Overseas-Chinese Banking Corp. | Banks | | 227,993 | |
| 50,359 United Overseas Bank Ltd. | Banks | | 391,414 | |
|
|
|
| |
| | | 619,407 | |
|
|
|
| |
| Spain — 3.2% | | | | |
| 33,806 Banco Bilbao Vizcaya Argentaria, SA | Banks | | 466,403 | |
| 25,605 Endesa SA | Electric Utilities | | 491,981 | |
| 40,285 Telefonica SA | Diversified Telecommunication Services | | 590,813 | |
|
|
|
| |
| | | 1,549,197 | |
|
|
|
| |
See Notes to Financial Statements.
7 Smith Barney International Large Cap Fund | 2003 Annual Report
| Schedule of Investments (continued) | December 31, 2003 |
| | | | |
| SHARES | | SECURITY | INDUSTRY | VALUE | |
|
|
| |
| Sweden — 1.2% | | | |
| 7,723 Electrolux AB | Household Durables | $ | 169,647 | |
| 51,571 Nordea AB | Banks | | 387,170 | |
|
|
|
| |
| | | 556,817 | |
|
|
|
| |
| Switzerland — 3.3% | | | | |
| �� 15,779 Credit Suisse Group | Banks | | 577,063 | |
| 2,537 Roche Holding AG | Pharmaceuticals | | 255,791 | |
| 3,696 UBS AG | Banks | | 253,012 | |
| 3,650 Zurich Finance Services Group AG | Insurance | | 525,095 | |
|
|
|
| |
| | | 1,610,961 | |
|
|
|
| |
| United Kingdom — 23.9% | | | | |
| 29,987 Allied Irish Banks Plc. | Banks | | 477,944 | |
| 25,745 Barclays Plc. | Banks | | 228,976 | |
| 40,244 BHP Billiton Plc. | Metals & Mining | | 350,568 | |
| 57,750 BOC Group Plc. | Chemicals | | 879,845 | |
| 264,302 BP Plc. | Oil & Gas | | 2,137,221 | |
| 18,535 British Sky Broadcasting Group Plc.* | Media | | 232,594 | |
| 9,314 CRH Plc. | Construction Materials | | 190,697 | |
| 67,229 Diageo Plc. | Beverages | | 882,053 | |
| 6,333 Glaxosmithkline Plc. | Pharmaceuticals | | 144,701 | |
| 18,938 HBOS Plc. | Banks | | 244,581 | |
| 30,361 Intercontinental Hotels Group Plc. | Hotels Restaurants & Leisure | | 286,697 | |
| 43,750 Reed Elsevier Plc. | Media | | 364,904 | |
| 123,263 Rentokil Initial Plc. | Commercial Services & Supplies | | 418,058 | |
| 37,211 Royal Bank of Scotland Group Plc. | Banks | | 1,093,332 | |
| 59,891 Sage Group Plc. | Software | | 187,892 | |
| 26,126 Scottish & Southern Energy Plc. | Electric Utilities | | 313,862 | |
| 60,063 Smith & Nephew Plc. | Health Care Equipment & Supplies | | 503,109 | |
| 312,291 Tesco Plc. | Food & Drug Retailing | | 1,436,841 | |
| 19,895 Tomkins Plc. | Industrial Conglomerates | | 94,999 | |
| 418,338 Vodafone Group Plc. | Wireless Telecommunication Services | | 1,034,255 | |
|
|
|
| |
| | | 11,503,129 | |
|
|
|
| |
| TOTAL INVESTMENTS | | | | |
| (Cost — $39,372,272) | | $ | 48,240,794 | |
|
|
|
| |
* Non-income producing.
See Notes to Financial Statements.
8 Smith Barney International Large Cap Fund | 2003 Annual Report
| Statement of Assets and Liabilities | December 31, 2003 |
| | | | | |
| ASSETS: | | | | |
| Investments at value (Cost, $ 39,372,272) | $ 48,240,794 | |
| Cash | 1,030,787 | |
| Receivable for shares of beneficial interest sold | 178,207 | |
| Dividends receivable | 92,040 | |
|
|
|
|
| Total Assets | | 49,541,828 | |
|
|
|
|
| LIABILITIES: | | | | |
| Management fees payable (Note 2) | | 34,114 | |
| Distribution/Service fees payable (Note 3) | | 19,420 | |
| Payable for shares of beneficial interest repurchased | | 17,927 | |
| Accrued expenses and other liabilities | | 171,505 | |
|
|
|
|
| Total Liabilities | | 242,966 | |
|
|
|
|
| Total Net Assets | | $ 49,298,862 | |
|
|
|
|
| NET ASSETS CONSIST OF: | | | | |
| Paid-in capital | | $ 49,846,844 | |
| Undistributed net investment income | | 67,067 | |
| Accumulated net realized loss from investment transactions | | (9,494,930 | ) |
| Net unrealized appreciation of investments | | 8,879,881 | |
|
|
|
|
| Total Net Assets | | $ 49,298,862 | |
|
|
|
|
| Computation of | | | | |
| Class A Shares: | | | | |
| Net Asset Value per share ($32,604,679/3,451,767 shares outstanding) | | | $9.45 | |
| Offering Price per share ($9.45 ÷ 0.95) | | | $9.95 | * |
|
|
|
|
|
| Class B Shares: | | | | |
| Net Asset Value per share and offering price ($8,341,916/913,211 shares outstanding) | | | $9.13 | ** |
|
|
|
|
|
| Class L Shares: | | | | |
| Net Asset Value per share and offering price ($7,368,462/771,920 shares outstanding) | | | $9.55 | ** |
| Offering Price per share ($9.55 ÷ 0.99) | | | $9.65 | |
|
|
|
|
|
| Class Y Shares: | | | | |
| Net Asset Value per share and offering price ($983,805/104,016 shares outstanding) | | | $9.46 | |
|
|
|
|
|
| * | Based upon single purchases of less than $25,000. |
| ** | Redemption price per share is equal to net asset value less any applicable contingent deferred sales charges. |
See Notes to Financial Statements.
9 Smith Barney International Large Cap Fund | 2003 Annual Report
| Statement of Operations | For the Year Ended December 31, 2003 |
| | | | |
| INVESTMENT INCOME (NOTE 1B): | | | |
| Dividend and Interest Income | $ 890,851 | |
| Foreign Taxes Withheld | (93,951 | ) |
|
|
|
| Total Investment Income | | 796,900 | |
|
|
|
|
| | | | |
| EXPENSES: | | | |
| Management fees (Note 2) | | 295,449 | |
| Distribution/Service fees (Note 3) | | 159,838 | |
| Shareholder reports | | 82,298 | |
| Audit fees | | 74,506 | |
| Custody and fund accounting fees | | 70,389 | |
| Blue sky fees | | 56,113 | |
| Legal fees | | 44,104 | |
| Transfer agent fees | | 36,256 | |
| Trustees fees | | 2,469 | |
| Other | | 3,391 | |
|
|
|
|
| Total Expenses | | 824,813 | |
|
|
|
|
| Less: aggregate amount waived by the Manager (Note 2) | | (146,165 | ) |
|
|
|
|
| Net Expenses | | 678,648 | |
|
|
|
|
| Net Investment Income | | 118,252 | |
|
|
|
|
| | | | |
| NET REALIZED AND UNREALIZED GAIN (LOSS) FROM INVESTMENTS | | | |
| Net realized loss from investment transactions | | (1,971,596 | ) |
| Net increase in unrealized appreciation on investments | | 13,550,102 | |
|
|
|
|
| Net Realized and Unrealized Gain (Loss) from Investments | | 11,578,506 | |
|
|
|
|
| Net Increase in Net Assets from Operations | | $11,696,758 | |
|
|
|
|
See Notes to Financial Statements.
10 Smith Barney International Large Cap Fund | 2003 Annual Report
| Statements of Changes in Net Assets | For the Years Ended December 31 |
| | | | | |
| | 2003 | | 2002 | |
|
|
|
|
|
| | | | | |
| OPERATIONS: | | | | | | |
| Net investment income | $ | 118,252 | | $ | 50,164 | |
| Net realized loss from investment transactions | | (1,971,596 | ) | | (2,918,788 | ) |
| Net unrealized appreciation (depreciation) of investments | | 13,550,102 | | | (144,429 | ) |
|
|
|
|
|
|
|
| Net Increase (Decrease) in Net Assets From Operations | | 11,696,758 | | | (3,013,053 | ) |
|
|
|
|
|
|
|
| | | | | | | |
| DISTRIBUTIONS TO SHAREHOLDERS FROM: | | | | | | |
| Net investment income Class A | | (161,230 | ) | | — | |
| Net investment income Class B | | — | | | — | |
| Net investment income Class L | | — | | | — | |
| Net investment income Class Y | | (5,296 | ) | | — | |
|
|
|
|
|
|
|
| Decrease in Net Assets From Distributions to Shareholders | | (166,526 | ) | | — | |
|
|
|
|
|
|
|
| | | | | | | |
| TRANSACTIONS IN SHARES OF BENEFICIAL INTEREST (NOTE 8): | | | | | | |
| Class A | | | | | | |
| Net proceeds from sale of shares | | 13,402,534 | # | | 1,348,839 | |
| Net asset value of shares issued to shareholders from reinvestment of distributions | | 125,583 | | | — | |
| Cost of shares repurchased | | (5,064,763 | ) | | (1,903,970 | ) |
|
|
|
|
|
|
|
| Total Class A | | 8,463,354 | | | (555,131 | ) |
|
|
|
|
|
|
|
| | | | | | | |
| Class B | | | | | | |
| Net proceeds from sale of shares | | 6,888,287 | # | | 686,361 | |
| Net asset value of shares issued to shareholders from reinvestment of distributions | | — | | | — | |
| Cost of shares repurchased | | (1,557,799 | ) | | (96,963 | ) |
|
|
|
|
|
|
|
| Total Class B | | 5,330,488 | | | 589,398 | |
|
|
|
|
|
|
|
| | | | | | | |
| Class L | | | | | | |
| Net proceeds from sale of shares | | 5,604,902 | # | | 789,936 | |
| Net asset value of shares issued to shareholders from reinvestment of distributions | | — | | | — | |
| Cost of shares repurchased | | (964,835 | ) | | (172,720 | ) |
|
|
|
|
|
|
|
| Total Class L | | 4,640,067 | | | 617,216 | |
|
|
|
|
|
|
|
| | | | | | | |
| Class Y* | | | | | | |
| Net proceeds from sale of shares | | 918,444 | | | — | |
| Net asset value of shares issued to shareholders from reinvestment of distributions | | — | | | — | |
| Cost of shares repurchased | | (36,019 | ) | | — | |
|
|
|
|
|
|
|
| Total Class Y | | 882,425 | | | — | |
|
|
|
|
|
|
|
| Net Increase in Net Assets From Transactions in Shares | | | | | | |
| of Beneficial Interest | | 19,316,334 | | | 651,483 | |
|
|
|
|
|
|
|
| Net Increase (Decrease) in Net Assets | | 30,846,566 | | | (2,361,570 | ) |
|
|
|
|
|
|
|
| | | | | | | |
| NET ASSETS: | | | | | | |
| Beginning of year | | 18,452,296 | | | 20,813,866 | |
|
|
|
|
|
|
|
| End of year† | $ | 49,298,862 | | $ | 18,452,296 | |
|
|
|
|
|
|
|
| Includes accumulated net investment income of: | $ | 67,067 | | $ | 42,523 | |
|
|
|
|
|
|
|
| # | Includes shares issued in connection with reorganization (See Note 13). |
| * | Commencement of Operations May 20, 2003. |
See Notes to Financial Statements.
11 Smith Barney International Large Cap Fund | 2003 Annual Report
Notes to Financial Statements
1. Significant Accounting Policies
Smith Barney International Large Cap Fund (the “Fund”) is a separate diversified series of Smith Barney Trust II (the “Trust”), a Massachusetts business trust.The Trust is registered under the Investment Company Act of 1940, as amended, as an open-end, management investment company. The investment manager is Smith Barney Fund Management LLC (the “Manager”). Effective January 21, 2003, the Manager delegated the daily management of the investments of the Fund to its affiliate, Citigroup Asset Management Ltd., as subadviser (the “Subadviser”). The Manager continues to oversee the Fund’s operations. Subject to the oversight of the Manager, the Subadviser selects the Fund’s investments. The Subadviser’s compensation is payable by the Manager. Citigroup Global Markets Inc. (“CGM”), formerly known as Salomon Smith Barney Inc. (“SSB”), serves as the Fund’s distributor (the “Distributor”) and continues to sell Fund shares to the public as a member of the selling group.The Manager, Subadviser and Distributor are subsidiaries of Citigroup.
Citicorp Trust Bank, fsb. (“CTB”), a subsidiary of Citigroup, acts as the Fund’s transfer agent and PFPC Global Fund Services (“PFPC”) acts as the Fund’s sub-transfer agent. CTB receives fees and asset-based fees that vary according to the account size and type of account. PFPC is responsible for shareholder record keeping and financial processing for all shareholder accounts and is paid by CTB. For the year ended December 31, 2003, the Fund paid transfer agent fees of $41,472 to CTB.
The Fund offers Class A, Class B, Class L and Class Y shares. Class A shares have a front-end, or initial, sales charge.This sales charge may be reduced or eliminated in certain circumstances. Class B shares have no front-end sales charge, pay a higher ongoing distribution fee than Class A, and are subject to a deferred sales charge if sold within five years of purchase. Class B shares automatically convert into Class A shares after eight years. Class L shares have a front-end, or initial, sales charge and are subject to a deferred sales charge if sold within one year of purchase. Class Y shares have no front-end or initial charge. Expenses of the Fund are borne pro-rata by the holders of each class of shares, except that each class bears expenses unique to that class (including the Rule 12b-1 service and distribution fees applicable to such class), and votes as a class only with respect to its own Rule 12b-1 plan. Shares of each class would receive their pro-rata share of the net assets of the Fund if the Fund were to liquidate. Class A shares have lower expenses than Class B shares. For the year ended December 31, 2003, management has informed the Fund that the Distributor received $15,000 and $9,000 from sales of Class A and Class L shares, respectively, and $7,000 and $0 in deferred sales charges from redemptions of Class B and Class L shares, respectively.
The preparation of financial statements in accordance with accounting principles generally accepted in the United States of America requires management to make estimates and assumptions that affect the reported amounts and disclosures in the financial statements. Actual results could differ from those estimates.
The significant accounting policies consistently followed by the Fund are as follows:
A. Investment Security Valuations Equity securities listed on securities exchanges are valued at last sale prices. Securities listed on the NASDAQ National Market System for which quotations are available, are valued at the official closing price or, if there is no closing price on that day, at the last sales price. Unlisted securities or listed securities for which last sale prices are not available are valued at last quoted bid prices. Securities listed on a foreign exchange are valued at the last quoted sale price available. Short-term obligations maturing in sixty days or less are valued at amortized cost, which constitutes fair value as determined by the Trustees. Portfolio securities for which there are no such quotations or valuations are valued at fair value as determined in good faith by or at the direction of the Trustees.Trading in securities on most foreign exchanges and over-the-counter markets is normally completed before the close of the New York Stock Exchange and may also take place on days on which the New York Stock Exchange is closed. If events materially affecting the value of foreign securities occur between the time when the exchange on which they are traded closes and the time of fund valuation, such securities will be valued at fair value in accordance with procedures established by and under the general supervision of the Trustees.
12 Smith Barney International Large Cap Fund | 2003 Annual Report
Notes to Financial Statements (continued)
B. Foreign Currency Translation The accounting records of the Fund are maintained in U.S. dollars. Foreign currency amounts are translated into U.S. dollars at the current rate of exchange to determine the value of investments, assets and liabilities. Purchases and sales of securities, and income and expenses are translated at the prevailing rate of exchange on the respective dates of such transactions.The Fund does not isolate that portion of the results of operations resulting from changes in foreign exchange rates on investments from the fluctuations arising from changes in market prices of securities held. Such fluctuations are included with the net realized and unrealized gain or loss from investments.Translation of foreign currency includes net exchange gains and losses resulting from the disposition of foreign currency and the difference between the amount of investment income, expenses and foreign withholding taxes recorded and the actual amount received or paid.
C. Forward Foreign Currency Exchange Contracts The Fund may enter into forward foreign currency exchange contracts (“contracts”) in connection with planned purchases or sales of securities or to hedge the U.S. dollar value of portfolio securities denominated in a particular currency.The Fund could be exposed to risks if the counterparties to the contracts are unable to meet the terms of their contracts and from unanticipated movements in the value of a foreign currency relative to the U.S. dollar. Forward foreign currency exchange contracts are adjusted by the daily exchange rate of the underlying currency and any gains or losses are recorded for financial statement purposes as unrealized gains or losses until the contract settlement date.
D. Accounting for Investments Securities transactions are accounted for on the trade date. Realized gains and losses on security transactions are determined on the identified cost method. Dividend income and other distributions from portfolio securities are recorded on the ex-dividend date. Dividend income is recorded net of foreign taxes withheld where recovery of such taxes is not assured. Interest income is accrued daily.
E. Federal Taxes The Fund’s policy is to comply with the provision of the Internal Revenue Code applicable to regulated investment companies and to distribute to shareholders all of its taxable income, including any net realized gain on investment transactions. Accordingly, no provision for federal income or excise tax is necessary.
F. Expenses The Fund bears all costs of its operations other than expenses specifically assumed by the Manager. Expenses incurred by the Trust with respect to any two or more funds or series are allocated in proportion to the average net assets of each fund, except when allocations of direct expenses to each fund can otherwise be made fairly. Expenses directly attributable to a fund are charged to that fund. Class specific expenses are charged to each class; management fees and general fund expenses are allocated on the basis of relative net assets of each class or on another reasonable basis.
G. Distributions Distributions to shareholders are recorded on ex-dividend date.The amount and character of income and net realized gains to be distributed are determined in accordance with income tax rules and regulations, which may differ from generally accepted accounting principles.These differences are attributable to permanent book and tax accounting differences. Reclassifications are made to the Fund’s capital accounts to reflect income and net realized gains available for distribution (or available capital loss carryovers) under income tax rules and regulations.
2. Management Fees
The Manager is responsible for overall management of the Fund’s business affairs, and has a Management Agreement with the Fund.The Manager or an affiliate also provides certain administrative services to the Fund.These administrative services include providing general office facilities and supervising the overall administration of the Fund.
The management fees paid to the Manager are accrued daily and payable monthly.The management fee is computed at an annual rate of 0.85% of the Fund’s average daily net assets.The management fee amounted to $295,449, of which $146,165 was voluntarily waived for the year ended December 31, 2003.
Effective January 21, 2003, the Manager delegated the daily management of the investments of the Fund to its affiliate, the Subadviser, pursuant to a Subadvisory Agreement entered into between the Manager and the Subadviser.The Subadviser’s compensation is payable by the Manager. It is the responsibility of the Subadviser to make the day-to-day investment deci-
13 Smith Barney International Large Cap Fund | 2003 Annual Report
Notes to Financial Statements (continued)
sions for the Fund, and to place the purchase and sales orders for securities transactions concerning those assets, subject in all cases to the general supervision of the Manager.The Subadviser furnishes at its own expense all services, facilities and personnel necessary in connection with managing the assets of the Fund and effecting securities transactions for the Fund.
The Trust pays no compensation directly to any Trustee or any officer who is affiliated with the Manager, all of whom receive remuneration for their services to the Fund from the Manager or its affiliates. Certain officers and a Trustee of the Fund are employed by the Manager or its affiliates.
3. Distribution/Service Fees
The Fund maintains separate Service Plans for Class A, Class B and Class L shares, which have been adopted in accordance with Rule 12b-1 under the 1940 Act (Class Y does not have a 12b-1 plan). Under the Class A Service Plan, the Fund paid monthly fees at an annual rate not to exceed 0.25% of the average daily net assets represented by Class A shares of the Fund. The Service fees for Class A shares amounted to $61,900 for the year ended December 31, 2003. Under the Class B and Class L Service Plan, the Fund may pay a combined monthly distribution and service fee at an annual rate not to exceed 1.00% of the average daily net assets represented by Class B and L shares of the Fund.The Service fees for Class B and L amounted to $56,041 and $41,897, respectively, for the year ended December 31, 2003.
These fees may be used to make payments to the Distributor for distribution services and to others as compensation for the sale of shares of the applicable class of the Fund, for advertising, marketing or other promotional activity, and for preparation, printing and distribution of prospectuses, statements of additional information and reports for recipients other than regulators and existing shareholders.The Fund may also make payments to the Distributor and others for providing personal service or the maintenance of shareholder accounts.
4. Purchases and Sales of Investments
Purchases and sales of investments, other than short-term obligations, aggregated $61,845,867 and $41,140,042, respectively, for the year ended December 31, 2003.
5. Federal Income Tax Basis of Investments
The cost and unrealized appreciation (depreciation) in value of the investment securities owned at December 31, 2003 as computed on a federal income tax basis, are as follows:
|
|
|
|
| Aggregate cost | | $39,142,227 | |
|
|
|
|
| Gross unrealized appreciation | | 9,244,703 | |
| Gross unrealized depreciation | | (146,136 | ) |
|
|
|
|
| Net unrealized appreciation | | $ 9,098,567 | |
|
|
|
|
6. Income Tax Information and Distributions to Shareholders
The tax basis components of distributable earnings at December 31, were:
| | 2003 | | 2002 | |
|
|
|
|
|
| Undistributed Ordinary Income | 67,067 | | $ 46,341 | |
|
|
|
|
|
| Accumulated Capital Losses | (9,724,974) | | $ (7,561,527) | |
|
|
|
|
|
| Unrealized Appreciation/(Depreciation) | 9,109,926 | | $ (1,980,365) | |
|
|
|
|
|
14 Smith Barney International Large Cap Fund | 2003 Annual Report
Notes to Financial Statements (continued)
The difference between book basis and tax basis unrealized depreciation is primarily attributable to wash sale loss defferals and the Fund’s in-kind redemption received in exchange for the Fund’s investment in International Equity Portfolio.
The tax character of distributions paid during the year was:
| | 2003 | | 2002 | |
|
|
|
|
|
| Ordinary Income | | $166,526 | | — | |
|
|
|
|
|
|
7. Financial Instruments
The Fund may trade financial instruments with off-balance sheet risk in the normal course of its investing activities and to assist in managing exposure to market risks such as interest rates and foreign currency exchange rates.These financial instruments include forward foreign currency exchange contracts.
The notional or contractual amounts of these instruments represent the investment the Fund has in particular classes of financial instruments and does not necessarily represent the amounts potentially subject to risk. The measurement of the risks associated with these instruments is meaningful only when related and offsetting transactions are considered. No such instruments were held at December 31, 2003.
8. Shares of Beneficial Interest
The Declaration of Trust permits the Trustees to issue an unlimited number of full and fractional shares of beneficial interest (without par value).Transactions in shares of beneficial interest were as follows:
| | Year Ended December 31, | |
| |
|
|
| | 2003 | | 2002 | |
|
|
|
|
|
| | | | | |
| Class A | | | | |
| Shares sold | 1,849,090 | # | 163,688 | |
| Shares issued to shareholders from reinvestment of distributions | 14,290 | | — | |
| Shares repurchased | (640,848 | ) | (241,913 | ) |
|
|
|
|
|
| Net Increase (Decrease) | 1,222,532 | | (78,225 | ) |
|
|
|
|
|
| | | | | |
| Class B* | | | | |
| Shares sold | 995,600 | # | 87,869 | |
| Shares issued to shareholders from reinvestment of distributions | — | | — | |
| Shares repurchased | (199,259 | ) | (12,643 | ) |
|
|
|
|
|
| Net Increase | 796,341 | | 75,226 | |
|
|
|
|
|
| | | | | |
| Class L** | | | | |
| Shares sold | 739,479 | # | 95,828 | |
| Shares issued to shareholders from reinvestment of distributions | — | | — | |
| Shares repurchased | (121,091 | ) | (22,452 | ) |
|
|
|
|
|
| Net Increase | 618,388 | | 73,376 | |
|
|
|
|
|
| | | | | |
| Class Y*** | | | | |
| Shares sold | 108,204 | | — | |
| Shares issued to shareholders from reinvestment of distributions | — | | — | |
| Shares repurchased | (4,188 | ) | — | |
|
|
|
|
|
| Net Increase | 104,016 | | — | |
|
|
|
|
|
| * | January 4, 1999 (Commencement of Operations). |
| ** | September 22, 2000 (Commencement of Operations). |
| *** | May 20, 2003 (Commencement of Operations). |
| # | Includes shares issued in connection with the reorganization (See Note 13). |
15 Smith Barney International Large Cap Fund | 2003 Annual Report
Notes to Financial Statements (continued)
9. Capital Loss Carryforward
The Fund’s policy is to comply with the provisions of the Internal Revenue Code applicable to regulated investment companies and to distribute to shareholders all of its taxable income, including any net realized gain on investment transactions. Accordingly, no provision for federal income or excise tax is necessary.At December 31, 2003, the Fund, for federal income tax purposes, had a loss carryover of $9,724,974 of which $6,043,135 will expire on December 31, 2009 $1,518,391 will expire on December 31, 2010 and $2,163,448 will expire on December 31, 2011.
10.Trustee Retirement Plan
The Trustees of the Fund have adopted a Retirement Plan for all Trustees who are not “interested persons” of the Fund, within the meaning of the 1940 Act. Under the Plan, all Trustees are required to retire from the Board as of the last day of the calendar year in which the applicable Trustee attains age 75 (certain Trustees who had already attained age 75 when the Plan was adopted are required to retire effective December 31, 2003).Trustees may retire under the Plan before attaining the mandatory retirement age.Trustees who have served as Trustee of the Trust or any of the investment companies associated with Citigroup for at least ten years when they retire are eligible to receive the maximum retirement benefit under the Plan. The maximum retirement benefit is an amount equal to five times the amount of retainer and regular meeting fees payable to a Trustee during the calendar year ending on or immediately prior to the applicable Trustee’s retirement. Amounts under the Plan may be paid in installments or in a lump sum (discounted to present value). Benefits under the Plan are unfunded. The Fund’s allocable share of the expense of the Plan for the year ended December 31, 2003 and the related liability at December 31, 2003 were not material.
11. Additional Information
The Fund has received the following information from Citigroup Asset Management (“CAM”), the Citigroup business unit which includes the Fund’s Investment Manager and other investment advisory companies, all of which are indirect, wholly-owned subsidiaries of Citigroup. CAM is reviewing its entry, through an affiliate, into the transfer agent business in the period 1997-1999.As CAM currently understands the facts, at the time CAM decided to enter the transfer agent business, CAM subcontracted for a period of five years certain of the transfer agency services to a third party and also concluded a revenue guarantee agreement with this sub-contractor providing that the sub-contractor would guarantee certain benefits to CAM or its affiliates (the “Revenue Guarantee Agreement”). In connection with the subsequent purchase of the sub-contractor’s business by an affiliate of the current sub-transfer agent (PFPC Inc.) used by CAM on many of the funds it manages, this Revenue Guarantee Agreement was amended eliminating those benefits in exchange for arrangements that included a one-time payment from the sub-contractor.
The Boards of CAM-managed funds (the “Boards”) were not informed of the Revenue Guarantee Agreement with the subcontractor at the time the Boards considered and approved the transfer agent agreements. Nor were the Boards informed of the subsequent amendment to the Revenue Guarantee Agreement when that occurred.
16 Smith Barney International Large Cap Fund | 2003 Annual Report
Notes to Financial Statements (continued)
CAM has begun to take corrective actions. CAM will pay to the applicable funds approximately $17 million (plus interest) that CAM and its affiliates received from the Revenue Guarantee Agreement and its amendment. CAM also plans an independent review to verify that the transfer agency fees charged by CAM were fairly priced as compared to competitive alternatives. CAM is instituting new procedures and making changes designed to ensure no similar arrangements are entered into in the future.
CAM has briefed the SEC, the New York State Attorney General and other regulators with respect to this matter, as well as the U.S.Attorney who is investigating the matter. CAM is cooperating with governmental authorities on this matter, the ultimate outcome of which is not yet determinable.
12. Subsequent Event
Effective February 2, 2004, the initial sales charge on Smith Barney International Large Cap Fund Class L shares was suspended.
13. Acquisition of Smith Barney World European Portfolio
On April 17, 2003 the Fund acquired the assets and liabilities of the Smith Barney World European Portfolio pursuant to a plan of reorganization, approved by the shareholders of Smith Barney World European Portfolio on March 10, 2003. The acquisition was accomplished by a tax-free exchange of the net assets of Smith Barney World European Portfolio in exchange for shares of the Fund, as follows: 1,472,055 Class A shares valued at $10,418,720; 895,521 Class B shares valued at $6,135,504 and 478,979 Class L shares valued at $3,426,185.The total assets acquired by Smith Barney International Large Cap Fund were $19,980,409 which included $172,837 of accumulated realized loss on investments and $2,246,233 of unrealized depreciation.
The aggregate net assets of the Smith Barney International Large Cap Fund and the Smith Barney World European Portfolio, immediately before the acquisition were $17,606,903 and $19,980,409 respectively.
17 Smith Barney International Large Cap Fund | 2003 Annual Report
Financial Highlights
For a share of each class of Capital Stock:
| | Year Ended December 31, | |
| |
|
|
|
|
|
|
|
|
|
|
| Class A Shares | 2003 | | 2002 | | 2001 | | 2000 | | 1999 | |
|
|
|
|
|
|
|
|
|
|
|
| Net Asset Value, Beginning of Year | $ 7.39 | | $ 8.57 | | $ 10.91 | | $ 15.92 | | $ 12.60 | |
|
|
|
|
|
|
|
|
|
|
|
| Income From Operations: | | | | | | | | | | |
| Net investment income (loss) | 0.047 | † | | 0.023 | † | | (0.013 | ) | | (0.093 | ) | | (0.077 | )† |
| Net realized and unrealized gain (loss) | 2.059 | | | (1.203 | ) | | (2.291 | ) | | (3.858 | ) | | 4.452 | |
|
|
|
|
|
|
|
|
|
|
|
|
|
|
|
| Total From Operations | 2.106 | | | (1.180 | ) | | (2.304 | ) | | (3.951 | ) | | 4.375 | |
|
|
|
|
|
|
|
|
|
|
|
|
|
|
|
| Less Distributions From: | | | | | | | | | | | | | | |
| Net investment income | (0.046 | ) | | — | | | (0.015 | ) | | — | | | — | |
| In excess of net investment income | — | | | — | | | — | | | — | | | — | |
| Net realized gain | — | | | — | | | (0.021 | ) | | (1.059 | ) | | (1.055 | ) |
|
|
|
|
|
|
|
|
|
|
|
|
|
|
|
| Total Distributions | (0.046 | ) | | — | | | (0.036 | ) | | (1.059 | ) | | (1.055 | ) |
|
|
|
|
|
|
|
|
|
|
|
|
|
|
|
| Net Asset Value, End of Year | $ 9.45 | | | $ 7.39 | | | $ 8.57 | | | $ 10.91 | | | $ 15.92 | |
|
|
|
|
|
|
|
|
|
|
|
|
|
|
|
| Ratios/Supplemental Data: | | | | | | | | | | | | | | |
| Net assets, end of year (000’s omitted) | $32,605 | | | $16,469 | | | $19,767 | | | $27,365 | | | $25,058 | |
| Ratio of expenses to average net assets‡ | 1.75 | % | | 1.75 | % | | 1.75 | % | | 1.75 | % | | 1.75 | % |
| Ratio of net investment income (loss) | | | | | | | | | | | | | | |
| to average net assets | 0.59 | % | | 0.31 | % | | (0.13 | )% | | (0.91 | )% | | (0.49 | )% |
| Portfolio turnover | 120 | % | | 88 | % | | 96 | % | | — | | | — | |
|
|
|
|
|
|
|
|
|
|
|
|
|
|
|
| Total Return | 28.55 | % | | (13.77 | )% | | (21.13 | )% | | (24.82 | )% | | 35.66 | % |
|
|
|
|
|
|
|
|
|
|
|
|
|
|
|
| | | | | | | | | | | | | | | |
| Note: If Agents of the Fund for the years indicated had not voluntarily waived a portion of their fees the net investment | |
| income (loss) per share and the ratios would have been as follows: | | | | | | | | | | | | | |
| Net investment income (loss) per share | $ 0.014 | † | $ (0.066 | )† | | $ (0.113 | ) | | $ (0.109 | ) | $ (0.210 | )† |
| Ratios: | | | | | | | | | | | | | | |
| Expenses to average net assets | 2.17 | % | | 2.95 | % | | 2.76 | % | | 1.91 | % | | 1.90 | % |
| Net investment income (loss) to average net assets | 0.17 | % | | (0.89 | )% | | (1.14 | )% | | (1.07 | )% | | (0.64 | )% |
|
|
|
|
|
|
|
|
|
|
|
|
|
|
|
| † | The per share amounts were computed using a monthly average number of shares outstanding during the year. |
| ‡ | The ratio of expenses to average net assets will not exceed 1.75% as a result of a voluntary expense limitation, which may be discontinued at any time. |
See Notes to Financial Statements.
18 Smith Barney International Large Cap Fund | 2003 Annual Report
Financial Highlights (continued)
For a share of each class of Capital Stock:
| | | | | | | | January 4, 1999 |
| | Year Ended December 31, | | (Commencement |
| |
| | of Operations) to |
| Class B Shares | 2003 | | 2002 | | 2001 | | 2000 | | December 31, 1999 |
|
|
|
|
|
|
|
|
|
|
|
| Net Asset Value, Beginning of Year | $ 7.16 | | $ 8.36 | | $ 10.73 | | $ 15.81 | | $ 12.87 | |
|
|
|
|
|
|
|
|
|
|
|
| Income From Operations: | | | | | | | | | | |
| Net investment loss | (0.022 | )† | | (0.035 | )† | | (0.076 | ) | | (0.174 | ) | | (0.095 | ) |
| Net realized and unrealized gain (loss) | 1.992 | | | (1.165 | ) | | (2.258 | ) | | (3.847 | ) | | 4.090 | |
|
|
|
|
|
|
|
|
|
|
|
|
|
|
|
| Total From Operations | 1.970 | | | (1.200 | ) | | (2.334 | ) | | (4.021 | ) | | 3.995 | |
|
|
|
|
|
|
|
|
|
|
|
|
|
|
|
| Less Distributions From: | | | | | | | | | | | | | | |
| Net investment income | — | | | — | | | (0.015 | ) | | — | | | — | |
| Net realized gain | — | | | — | | | (0.021 | ) | | (1.059 | ) | | (1.055 | ) |
|
|
|
|
|
|
|
|
|
|
|
|
|
|
|
| Total Distributions | — | | | — | | | (0.036 | ) | | (1.059 | ) | | (1.055 | ) |
|
|
|
|
|
|
|
|
|
|
|
|
|
|
|
| Net Asset Value, end of Year | $ 9.13 | | | $ 7.16 | | | $ 8.36 | | | $ 10.73 | | | $ 15.81 | |
|
|
|
|
|
|
|
|
|
|
|
|
|
|
|
| Ratios/Supplemental Data: | | | | | | | | | | | | | | |
| Net assets, end of year (000’s omitted) | $ 8,342 | | | $ 836 | | | $ 348 | | | $ 434 | | | $ 323 | |
| Ratio of expenses to average net assets‡ | 2.50 | % | | 2.50 | % | | 2.50 | % | | 2.50 | % | | 2.50 | %* |
| Ratio of net investment loss | | | | | | | | | | | | | | |
| to average net assets | (0.29 | )% | | (0.50 | )% | | (0.85 | )% | | (1.60 | )% | | (1.24 | )%* |
| Portfolio turnover | 120 | % | | 88 | % | | 96 | % | | — | | | — | |
|
|
|
|
|
|
|
|
|
|
|
|
|
|
|
| Total Return | 27.51 | % | | (14.35 | )% | | (21.76 | )% | | (25.44 | )% | | 31.95 | %** |
|
|
|
|
|
|
|
|
|
|
|
|
|
|
|
| | | | | | | | | | | | | | | |
| Note: If Agents of the Fund for the years indicated had not voluntarily waived a portion of their fees the net investment loss | |
| per share and the ratios would have been as follows: | | | | | | | | | | | | | | |
| Net investment loss per share | $(0.055 | )† | $(0.119 | )† | | $(0.169 | ) | | $(0.192 | ) | | $(0.108 | ) |
| Ratios: | | | | | | | | | | | | | | |
| Expenses to average net assets | 2.92 | % | | 3.70 | % | | 3.51 | % | | 2.66 | % | | 2.70 | %* |
| Net investment loss to average net assets | (0.70 | )% | | (1.70 | )% | | (1.86 | )% | | (1.76 | )% | | (1.44 | )%* |
|
|
|
|
|
|
|
|
|
|
|
|
|
|
|
| * | Annualized |
| ** | Not Annualize |
| † | The per share amounts were computed using a monthly average number of shares outstanding during the year. |
| ‡ | The ratio of expenses to average net assets will not exceed 2.50% as a result of a voluntary expense limitation, which may be discontinued at any time. |
See Notes to Financial Statements.
19 Smith Barney International Large Cap Fund | 2003 Annual Report
Financial Highlights (continued)
For a share of each class of Capital Stock:
| | | | | | | | September 22, 2000 |
| | Year Ended December 31, | | (Commencement |
| |
| | of Operations) to |
| Class L Shares | 2003 | | 2002 | | 2001 | | December 31, 2000 |
|
|
|
|
|
|
|
|
| Net Asset Value, Beginning of Year | $ 7.47 | | $ 8.72 | | $ 11.17 | | $ 13.20 | |
|
|
|
|
|
|
|
|
|
| Income From Operations: | | | | | | | | |
| Net investment loss | | (0.022 | )† | | (0.024 | )† | | (0.333 | ) | | (0.014 | ) |
| Net realized and unrealized gain (loss) | | 2.102 | | | (1.226 | ) | | (2.080 | ) | | (1.147 | ) |
|
|
|
|
|
|
|
|
|
|
|
|
|
| Total From Operations | | 2.080 | | | (1.250 | ) | | (2.413 | ) | | (1.161 | ) |
|
|
|
|
|
|
|
|
|
|
|
|
|
| Less Distributions From: | | | | | | | | | | | | |
| Net investment income | | — | | | — | | | (0.016 | ) | | — | |
| Net realized gain | | — | | | — | | | (0.021 | ) | | (0.869 | ) |
|
|
|
|
|
|
|
|
|
|
|
|
|
| Total Distributions | | — | | | — | | | (0.037 | ) | | (0.869 | ) |
|
|
|
|
|
|
|
|
|
|
|
|
|
| Net Asset Value, end of Year | | $ 9.55 | | | $ 7.47 | | | $ 8.72 | | | $ 11.17 | |
|
|
|
|
|
|
|
|
|
|
|
|
|
| Ratios/Supplemental Data: | | | | | | | | | | | | |
| Net assets, end of year (000’s omitted) | | $7,368 | | | $1,147 | | | $ 699 | | | $ 105 | |
| Ratio of expenses to average net assets‡ | | 2.44 | % | | 2.35 | % | | 2.35 | % | | 2.35 | %* |
| Ratio of net investment loss | | | | | | | | | | | | |
| to average net assets | | (0.27 | )% | | (0.32 | )% | | (0.77 | )% | | (1.84 | )%* |
| Portfolio turnover | | 120 | % | | 88 | % | | 96 | % | | — | |
|
|
|
|
|
|
|
|
|
|
|
|
|
| Total Return | | 27.84 | % | | (14.33 | )% | | (21.61 | )% | | (8.50 | )%** |
|
|
|
|
|
|
|
|
|
|
|
|
|
| | | | | | | | | | | | | |
| Note: If Agents of the Fund for the years indicated had not voluntarily waived a portion of their fees the net investment loss | |
| per share and the ratios would have been as follows: | | | | | | | | | | | | |
| Net investment loss per share | $(0.056 | )† | $(0.113 | )† | | $(0.380 | ) | | $(0.019 | ) |
| Ratios: | | | | | | | | | | | | |
| Expenses to average net assets | | 2.86 | % | | 3.55 | % | | 3.35 | % | | 3.00 | %* |
| Net investment loss to average net assets | | (0.69 | )% | | (1.52 | )% | | (1.77 | )% | | (2.49 | )%* |
|
|
|
|
|
|
|
|
|
|
|
|
|
| * | Annualized |
| ** | Not Annualized |
| † | The per share amounts were computed using a monthly average number of shares outstanding during the year. |
| ‡ | The ratio of expenses to average net assets will not exceed 2.50% as a result of a voluntary expense limitation, which may be discontinued at any time. |
See Notes to Financial Statements.
20 Smith Barney International Large Cap Fund | 2003 Annual Report
Financial Highlights (continued)
For a share of each class of Capital Stock:
| | May 20, 2003 |
| | (Commencement |
| | of Operations) to |
| Class Y Shares | December 31, 2003 |
|
|
| Net Asset Value, Beginning of Period | $ 7.46 | |
|
|
|
| Income From Operations: | | |
| Net investment loss | (0.009 | )† |
| Net realized and unrealized gain | 2.066 | |
|
|
|
| Total From Operations | 2.057 | |
|
|
|
| Less Distributions From: | | |
| Net investment income | (0.057 | ) |
| Net realized gain | — | |
|
|
|
| Total Distributions | (0.057 | ) |
|
|
|
| Net Asset Value, end of Period | $ 9.46 | |
|
|
|
| Ratios/Supplemental Data: | | |
| Net assets, end of period | $ 984 | |
| Ratio of expenses to average net assets | 1.48 | %* |
| Ratio of net investment loss to average net assets‡ | (0.18 | )%* |
| Portfolio turnover | 120 | % |
|
|
|
| Total Return | 27.58 | %** |
|
|
|
| | | |
| Note: If Agents of the Fund for the periods indicated had not voluntarily waived a portion of their fees the net investment | |
| loss per share and the ratios would have been as follows: | | |
| Net investment loss per share | $(0.028 | )† |
| Ratios: | | |
| Expenses to average net assets | 1.90 | %* |
| Net investment loss to average net assets | (0.60 | )%* |
|
|
|
| * | Annualized |
| ** | Not Annualized |
| † | The per share amounts were computed using a monthly average number of shares outstanding during the year. |
| ‡ | The ratio of expenses to average net assets will not exceed 1.50% as a result of a voluntary expense limitation, which may be discontinued at any time. |
See Notes to Financial Statements.
21 Smith Barney International Large Cap Fund | 2003 Annual Report
Report of Independent Auditors
To the Shareholders and the Trustees of Smith Barney Trust II
Smith Barney International Large Cap Fund:
In our opinion, the accompanying statement of assets and liabilities, including the portfolio of investments, and the related statements of operations and of changes in net assets and the financial highlights present fairly, in all material respects, the financial position of Smith Barney International Large Cap Fund (the “Fund”), a series of Smith Barney Trust II at December 31, 2003, the results of its operations, the changes in its net assets and the financial highlights for each of the periods indicated, in conformity with accounting principles generally accepted in the United States of America.These financial statements and financial highlights (hereafter referred to as “financial statements”) are the responsibility of the Fund’s management; our responsibility is to express an opinion on these financial statements based on our audits.We conducted our audits of these financial statements in accordance with auditing standards generally accepted in the United States of America, which require that we plan and perform the audit to obtain reasonable assurance about whether the financial statements are free of material misstatement. An audit includes examining, on a test basis, evidence supporting the amounts and disclosures in the financial statements, assessing the accounting principles used and significant estimates made by management, and evaluating the overall financial statement presentation.We believe that our audits, which included confirmation of securities at December 31, 2003 by correspondence with the custodian and brokers, provide a reasonable basis for our opinion.
PricewaterhouseCoopers LLP
New York, New York
February 23, 2004
22 Smith Barney International Large Cap Fund | 2003 Annual Report
Tax Information (unaudited)
For Federal tax purposes, the Fund hereby designates for the fiscal year ended December 31, 2003:
For individual shareholders, the maximum amount allowable under The Jobs and Growth Tax Relief Reconciliation Act of 2003 as qualifying dividends for the reduced tax rate.
23 Smith Barney International Large Cap Fund | 2003 Annual Report
Additional Information (unaudited)
Information about Trustees and Officers The business and affairs of the Smith Barney International Large Cap Fund (the “Fund”) are managed under the direction of the Fund’s Board of Trustees. Information pertaining to the Trustees and officers of the Fund is set forth below. Each Trustee and officer holds office for his or her lifetime, unless that individual resigns, retires or is otherwise removed.The Statement of Additional Information includes additional information about Fund Trustees and is available, without charge, upon request by calling 1-800-451-2010.
| | | | | Number of | Other Board | |
| | | | Principal | Portfolios In | Memberships | |
| | Position(s) | Length | Occupation(s) | Fund Complex | Held by | |
| | Held with | of Time | During Past | Overseen by | Trustee During | |
| Name, Address and Age | Fund | Served | Five Years | Trustee | Past Five Years | |
|
|
|
|
|
| |
| NON-INTERESTED | | | | | | |
| TRUSTEES: | | | | | | |
| | | | | | | |
| Elliott J. Berv | Trustee | Since 2001 | President and Chief Operations | 36 | Board Member, | |
| c/o R. Jay Gerken | | | Officer, Landmark City (real | | American Identity Corp. | |
| Citigroup Asset Management | | | estate development) (since | | (doing business as | |
| 399 Park Avenue | | | 2002); Executive Vice President | | Morpheus Technologies) | |
| New York, NY 10022 | | | and Chief Operations Officer, | | (biometric information | |
| Age 60 | | | DigiGym Systems (on-line | | management) (since | |
| | | | personal training systems) (since | | 2001; consultant since | |
| | | | 2001); Chief Executive Officer, | | 1999); Director, Lapoint | |
| | | | Rocket City Enterprises (internet | | Industries (industrial | |
| | | | service company) (from 2000 to | | filter company) (since | |
| | | | 2001); President, Catalyst | | 2002); Director, | |
| | | | (consulting) (since 1984). | | Alzheimer’s Association | |
| | | | | | (New England Chapter) | |
| | | | | | (since 1998). | |
| | | | | | | |
| Donald M. Carlton | Trustee | Since 2001 | Consultant, URS Corporation | 31 | Director, American | |
| c/o R. Jay Gerken | | | (engineering) (since 1999); | | Electric Power | |
| Citigroup Asset Management | | | former Chief Executive Officer, | | (electric utility) (since | |
| 399 Park Avenue | | | Radian International LLC | | 1999); Director,Valero | |
| New York, NY 10022 | | | (engineering) (from 1996 to | | Energy (petroleum | |
| Age 66 | | | 1998), Member of Management | | refining) (since 1999); | |
| | | | Committee, Signature Science | | Director, National | |
| | | | (research and development) | | Instruments Corp. | |
| | | | (since 2000). | | (technology) (since | |
| | | | | | 1994). | |
| | | | | | | |
| A. Benton Cocanougher | Trustee | Since 2001 | Dean Emeritus and Wiley | 31 | Former Director, | |
| c/o R. Jay Gerken | | | Professor,Texas A&M | | Randall’s Food Markets, | |
| Citigroup Asset Management | | | University (since 2001); | | Inc. (from 1990 to 1999); | |
| 399 Park Avenue | | | former Dean and Professor of | | former Director, First | |
| New York, NY 10022 | | | Marketing, College and | | American Bank and | |
| Age 65 | | | Graduate School of Business | | First American Savings | |
| | | | of Texas A & M University | | Bank (from 1994 to | |
| | | | (from 1987 to 2001). | | 1999). | |
24 Smith Barney International Large Cap Fund | 2003 Annual Report
Additional Information (unaudited) (continued)
| | | | | Number of | Other Board |
| | | | Principal | Portfolios In | Memberships |
| | Position(s) | Length | Occupation(s) | Fund Complex | Held by |
| | Held with | of Time | During Past | Overseen by | Trustee During |
| Name, Address and Age | Fund | Served | Five Years | Trustee | Past Five Years |
|
|
|
|
|
|
| Mark T. Finn | Trustee | Since 2001 | Adjunct Professor,William & | 36 | Former President and |
| c/o R. Jay Gerken | | | Mary College (since September | | Director, Delta Financial, |
| Citigroup Asset Management | | | 2002); Principal/member, Belvan | | Inc. (investment advisory |
| 399 Park Avenue | | | Partners/Balfour Vantage – Manager | | firm) (from 1983 to |
| New York, NY 10022 | | | and General Partner to the | | 1999). |
| Age 60 | | | Vantage Hedge Fund, LP (since | | |
| | | | March 2002); Chairman and | | |
| | | | Owner,Vantage Consulting Group, | | |
| | | | Inc. (investment advisory and | | |
| | | | consulting firm) (since 1988); | | |
| | | | former Vice Chairman and Chief | | |
| | | | Operating Officer, Lindner Asset | | |
| | | | Management Company (mutual | | |
| | | | fund company) (from March 1999 | | |
| | | | to 2001); former General Partner | | |
| | | | and Shareholder, Greenwich | | |
| | | | Ventures, LLC (investment | | |
| | | | partnership) (from 1996 to 2001); | | |
| | | | former President, Secretary, and | | |
| | | | Owner, Phoenix Trading Co. | | |
| | | | (commodity trading advisory firm) | | |
| | | | (from 1997 to 2000). | | |
| | | | | | |
| Stephen Randolph Gross | Trustee | Since 2001 | Partner, Capital Investment | 31 | Director, United Telesis, |
| c/o R. Jay Gerken | | | Advisory Partners (consulting) | | Inc. (telecommunications) |
| Citigroup Asset Management | | | (since January 2000); former | | (since 1997); Director, |
| 399 Park Avenue | | | Managing Director, Fountainhead | | eBank.com, Inc. (since |
| New York, NY 10022 | | | Ventures, LLC (consulting) (from | | 1997); Director,Andersen |
| Age 56 | | | 1998 to 2002); Secretary, Carint | | Calhoun, Inc. (assisted |
| | | | N.A. (manufacturing) (since 1988); | | living) (since 1987); |
| | | | former Treasurer, Hank Aaron | | former Director, Charter |
| | | | Enterprises (fast food franchise) | | Bank, Inc. (from 1987 to |
| | | | (from 1985 to 2001); Chairman, | | 1997); former Director, |
| | | | Gross, Collins & Cress, P.C. | | Yu Save, Inc. (internet |
| | | | (accounting firm) (since 1980); | | company) (from 1998 to |
| | | | Treasurer, Coventry Limited, Inc. | | 2000); former Director, |
| | | | (since 1985). | | Hotpalm, Inc. (wireless |
| | | | | | applications) (from 1998 |
| | | | | | to 2000); former |
| | | | | | Director, Ikon Ventures, |
| | | | | | Inc. (from 1997 to 1998). |
| | | | | | |
| Diana R. Harrington | Trustee | Since 1992 | Professor, Babson College | 36 | Former Trustee,The |
| c/o R. Jay Gerken | | | (since 1993). | | Highland Family of |
| Citigroup Asset Management | | | | | Funds (investment |
| 399 Park Avenue | | | | | company) (from March |
| New York, NY 10022 | | | | | 1997 to March 1998). |
| Age 63 | | | | | |
| | | | | | |
| Susan B. Kerley | Trustee | Since 1992 | Consultant, Strategic Management | 36 | Director, Eclipse Funds |
| c/o R. Jay Gerken | | | Advisors, LLC/Global Research | | (currently supervises 17 |
| Citigroup Asset Management | | | Associates, Inc. (investment | | investment companies |
| 399 Park Avenue | | | consulting) (since 1990). | | in fund complex) (since |
| New York, NY 10022 | | | | | 1990). |
| Age 52 | | | | | |
25 Smith Barney International Large Cap Fund | 2003 Annual Report
Additional Information (unaudited) (continued)
| | | | | Number of | Other Board | |
| | | | Principal | Portfolios In | Memberships | |
| | Position(s) | Length | Occupation(s) | Fund Complex | Held by | |
| | Held with | of Time | During Past | Overseen by | Trustee During | |
| Name, Address and Age | Fund | Served | Five Years | Trustee | Past Five Years | |
|
|
|
|
|
| |
| Alan G. Merten | Trustee | Since 2001 | President, George Mason | 31 | Director, Comshare, | |
| c/o R. Jay Gerken | | | University (since 1996). | | Inc. (information | |
| Citigroup Asset Management | | | | | technology) (since 1985); | |
| 399 Park Avenue | | | | | former Director, Indus | |
| New York, NY 10022 | | | | | (information technology) | |
| Age 62 | | | | | (from 1995 to 1999); | |
| | | | | | Director, Digital Net | |
| | | | | | Holdings, Inc. (since | |
| | | | | | 2003). | |
| | | | | | | |
| C. Oscar Morong, Jr.† | Trustee | Since 1991 | Managing Director, Morong | 36 | Former Director, | |
| c/o R. Jay Gerken | | | Capital Management | | Indonesia Fund (closed- | |
| Citigroup Asset Management | | | (since 1993). | | end fund) (from 1990 to | |
| 399 Park Avenue | | | | | 1999);Trustee, Morgan | |
| New York, NY 10022 | | | | | Stanley Institutional Fund | |
| Age 68 | | | | | Fund (currently super- | |
| | | | | | vises 75 investment | |
| | | | | | companies) (since 1993). | |
| | | | | | | |
| R. Richardson Pettit | Trustee | Since 2001 | Professor of Finance, University | 31 | None | |
| c/o R. Jay Gerken | | | of Houston (from 1977 to 2002); | | | |
| Citigroup Asset Management | | | independent consultant | | | |
| 399 Park Avenue | | | (since 1984). | | | |
| New York, NY 10022 | | | | | | |
| Age 61 | | | | | | |
| | | | | | | |
| Walter E. Robb, III† | Trustee | Since 2001 | President, Benchmark Consulting | 36 | Director, John Boyle & | |
| c/o R. Jay Gerken | | | Group, Inc. (service company) | | Co., Inc. (textiles) (since | |
| Citigroup Asset Management | | | (since 1991); sole proprietor, Robb | | 1999); Director, Harbor | |
| 399 Park Avenue | | | Associates (financial consulting) | | Sweets, Inc. (candy) | |
| New York, NY 10022 | | | (since 1978); Co-owner, Kedron | | (since 1990); Director, | |
| Age 77 | | | Design (gifts) (since 1978); | | W.A.Wilde Co. (direct | |
| | | | former President and Treasurer, | | media marketing) (since | |
| | | | Benchmark Advisors, Inc. | | 1982); Director, Alpha | |
| | | | (financial consulting) | | Grainger Manufacturing, | |
| | | | (from 1989 to 2000). | | Inc. (electronics) (since | |
| | | | | | 1983); former Trustee, | |
| | | | | | MFS Family of Funds | |
| | | | | | (investment company) | |
| | | | | | (from 1985 to 2001); | |
| | | | | | Harvard Club of Boston | |
| | | | | | (Audit Committee) | |
| | | | | | (since 2001). | |
† Retiring effective December 31, 2003.
26 Smith Barney International Large Cap Fund | 2003 Annual Report
Additional Information (unaudited) (continued)
| | | | | Number of | Other Board |
| | | | Principal | Portfolios In | Memberships |
| | Position(s) | Length | Occupation(s) | Fund Complex | Held by |
| | Held with | of Time | During Past | Overseen by | Trustee During |
| Name, Address and Age | Fund | Served | Five Years | Trustee | Past Five Years |
|
|
|
|
|
|
| INTERESTED | | | | | |
| TRUSTEE: | | | | | |
| R. Jay Gerken* | Chairman, | Since 2002 | Managing Director of CGM (since | Chairman | N/A |
| Citigroup Asset Management | President, | | 1996); Chairman, President, and | of the Board, | |
| 399 Park Avenue | and Chief | | Chief Executive Officer of Smith | Trustee or | |
| New York, NY 10022 | Executive | | Barney Fund Management LLC | Director | |
| Age 52 | Officer | | (“SBFM”),Travelers Investment | of 220 | |
| | | | Advisers, Inc. (“TIA”) and Citi | | |
| | | | Fund Management Inc. (“CFM”); | | |
| | | | President and Chief Executive | | |
| | | | Officer of certain mutual funds | | |
| | | | associated with Citigroup Inc.; | | |
| | | | formerly, Portfolio Manager of | | |
| | | | Smith Barney Allocation Series | | |
| | | | Inc. (from 1996 to 2001) and | | |
| | | | Smith Barney Growth and Income | | |
| | | | Fund (from 1996 to 2000). | | |
| | | | | | |
| OFFICERS: | | | | | |
| Andrew B. Shoup** | Senior Vice | Since 2003 | Director of Citigroup Asset | N/A | N/A |
| 125 Broad Street | President and | | Management (“CAM”); Chief | | |
| New York, NY 10004 | Chief | | Administrative Officer of mutual | | |
| Age 47 | Administrative | | funds associated with Citigroup | | |
| | Officer | | Inc.; Head of International Funds | | |
| | | | Administration of CAM (from | | |
| | | | 2001 to 2003); Director of Global | | |
| | | | Funds Administration of CAM | | |
| | | | (from 2000 to 2001); Head of U.S. | | |
| | | | Citibank Funds Administration | | |
| | | | of CAM (from 1998 to 2000). | | |
| | | | | | |
| Frances M. Guggino | Controller | Since 2002 | Vice President of CAM; Controller | N/A | N/A |
| 125 Broad Street | | | of certain mutual funds associated | | |
| New York, NY 10004 | | | with Citigroup Inc. (since 1991). | | |
| Age 46 | | | | | |
| | | | | | |
| Robert I. Frenkel | Secretary | Since 2000 | Managing Director and General | N/A | N/A |
| CAM | Chief Legal | Since 2003 | Counsel, Global Mutual Funds | | |
| 300 First Stamford Place | Officer | | for CAM (since 1994); Secretary | | |
| Stamford, CT 06902 | | | of certain mutual funds associated | | |
| Age 49 | | | with Citigroup Inc.; Chief Legal | | |
| | | | Officer of mutual funds associated | | |
| | | | with Citigroup Inc. | | |
| * | Mr. Gerken is an “interested person” of the fund as defined in the 1940 Act because he is an officer of the Manager and certain of its affiliates. |
| ** | As of November 25, 2003. |
27 Smith Barney International Large Cap Fund | 2003 Annual Report
(This page intentionally left blank.)
SMITH BARNEY
INTERNATIONAL LARGE CAP FUND
| TRUSTEES |
| Elliott J. Berv |
| Donald M. Carlton |
| A. Benton Cocanougher |
| Mark T. Finn |
| R. Jay Gerken, CFA, Chairman* |
| Stephen Randolph Gross |
| Diana R. Harrington |
| Susan B. Kerley |
| Alan G. Merten |
| R. Richardson Pettit |
| |
| OFFICERS |
| R. Jay Gerken, CFA* |
| President and |
| Chief Executive Officer |
| |
| Andrew B. Shoup*† |
| Senior Vice President and |
| Chief Administrative Officer |
| |
| Frances M. Guggino* |
| Controller |
| |
| Robert I. Frenkel* |
| Secretary and Chief Legal Officer |
| |
| * Affiliated Person of |
| Investment Manager |
| |
| † As of November 25, 2003 |
INVESTMENT MANAGER
Smith Barney Fund Management LLC
SUBADVISER
Citigroup Asset Management Ltd.
DISTRIBUTOR
Citigroup Global Markets Inc. PFS Distributors, Inc.
CUSTODIAN
State Street Bank & Trust Company
TRANSFER AGENT
Citicorp Trust Bank, fsb.
125 Broad Street, 11th Floor
New York, NY 10004
SUB-TRANSFER AGENT
PFPC Global Fund Services
P.O. Box 9699
Providence, RI 02940-9699
Primerica Shareholder Services
P.O. Box 9662 Providence,
RI 02940-9662
INDEPENDENT AUDITORS
PricewaterhouseCoopers LLP
1177 Avenue of the Americas
New York, NY 10036
Smith Barney Trust II
Smith Barney International Large Cap FundThe fund is a separate investment fund of the Smith Barney Trust II, a Massachusetts business trust.
This report is submitted for general information of the shareholders of Smith Barney Trust II — Smith Barney International Large Cap Fund, but it may also be used as sales literature when preceded or accompanied by the current Prospectus, which gives details about charges, expenses, investment objectives and operating policies of the Fund. If used as sales material after March 31, 2004, this report must be accompanied by performance information for the most recently completed calendar quarter.
SMITH BARNEY INTERNATIONAL LARGE CAP FUND
Smith Barney Mutual Funds
125 Broad Street, MF-2
New York, NY 10004
For complete information on any Smith Barney Mutual Funds, including management fees and expenses, call or write your financial professional for a free prospectus. Read it carefully before you invest or send money.
www.smithbarneymutualfunds.com
©2003 Citigroup Global Markets Inc.
Member NASD, SIPC
ITEM 2.  CODE OF ETHICS.

         The registrant has adopted a code of ethics that applies to the
         registrant's principal executive officer, principal financial officer,
         principal accounting officer or controller.

ITEM 3.  AUDIT COMMITTEE FINANCIAL EXPERT.

         The Board of Trustees of the registrant has determined that Mr. Stephen
         Randolph Gross, the Chairman of the Board's Audit Committee, possesses
         the technical attributes identified in Instruction 2(b) of Item 3 to
         Form N-CSR to qualify as an "audit committee financial expert," and has
         designated Mr. Gross as the Audit Committee's financial expert. Mr.
         Gross is an "independent" Trustee pursuant to paragraph (a)(2) of Item
         3 to Form N-CSR.

ITEM 4.  PRINCIPAL ACCOUNTANT FEES AND SERVICES

   (a)   Audit Fees for Smith Barney International Large Cap Fund were $33,545
         and $54,250 for the years ended 12/31/03 and 12/31/02, respectively.
         These amounts represent aggregate fees paid to the Accountant in
         connection with the annual audit of the Smith Barney International
         Large Cap Fund's financial statements and for services normally
         provided by the Accountant in connection with the statutory and
         regulatory filings.

   (b)   Audit-Related Fees for Smith Barney International Large Cap Fund of $0
         and $0 for the years ended 12/31/03 and 12/31/02.

         In addition, there were no Audit-Related Fees billed in the years ended
         12/31/03 and 12/31/02 for assurance and related services by the
         Accountant to the Registrant's investment adviser (not including any
         sub-adviser whose role is primarily portfolio management and is
         subcontracted with or overseen by another investment adviser), and any
         entity controlling, controlled by or under common control with the
         investment adviser that provides ongoing services to the Smith Barney
         International Large Cap Fund ("service affiliates"), that required
         pre-approval by the Audit Committee for the period May 6, 2003 to
         December 31, 2003 (prior to May 6, 2003 services provided by the
         Accountant were not required to be pre-approved).

   (c)   Tax Fees for Smith Barney International Large Cap Fund of $4,000 and
         $4,000 for the years ended 12/31/03 and 12/31/02. These amounts
         represent aggregate fees paid for tax compliance, tax advice and tax
         planning services, which include (the filing and amendment of federal,
         state and local income tax returns, timely RIC qualification review and
         tax distribution and analysis planning) rendered by the Accountant to
         Smith Barney International Large Cap Fund

         There were no fees billed for tax services by the Accountants to
         service affiliates for the period May 6, 2003 through December 31, 2003
         that required pre-approval by the Audit Committee.

   (d)   There were no All Other Fees for Smith Barney International Large Cap
         Fund for the years ended 12/31/03 and 12/31/02.

         ALL OTHER FEES. The aggregate fees billed for all other non-audit
         services rendered by the Accountant to Smith Barney Asset Management
         ("SBAM"), and any entity controlling, controlled by or under common
         control with SBAM that provided ongoing services to Smith Barney
         International Large Cap Fund, requiring pre-approval by the Audit
         Committee for the period May 6, 2003 through December 31, 2003, which
         included the issuance of reports on internal control under SAS No. 70
         relating to various Citigroup Asset Management ("CAM") entities, were
         $558,750; all of which were pre-approved by the Audit Committee.

   (e)   (1) Audit Committee's pre-approval policies and procedures described in
         paragraph (c) (7) of Rule 2-01 of Regulation S-X. The Charter for the
         Audit Committee (the "Committee") of the Board of each registered
         investment company (the "Fund") advised by Smith Barney Fund Management
         LLC or Smith Barney Asset Management Inc. or one of their affiliates
         (each, an "Adviser") requires that the Committee shall approve (a) all
         audit and permissible non-audit services to be provided to the Fund and
         (b) all permissible non-audit services to be provided by the Fund's
         independent auditors to the Adviser and any Covered Service Providers
         if the engagement relates directly to the operations and financial
         reporting of the Fund. The Committee may implement policies and
         procedures by which such services are approved other than by the full
         Committee.

         The Committee shall not approve non-audit services that the Committee
         believes may impair the independence of the auditors. As of the date of
         the approval of this Audit Committee Charter, permissible non-audit
         services include any professional services (including tax services),
         that are not prohibited services as described below, provided to the
         Fund by the independent auditors, other than those provided to the Fund
         in connection with an audit or a review of the financial statements of
         the Fund. Permissible non-audit services may not include: (i)
         bookkeeping or other services related to the accounting records or
         financial statements of the Fund; (ii) financial information systems
         design and implementation; (iii) appraisal or valuation services,
         fairness opinions or contribution-in-kind reports; (iv) actuarial
         services; (v) internal audit outsourcing services; (vi) management
         functions or human resources; (vii) broker or dealer, investment
         adviser or investment banking services; (viii) legal services and
         expert services unrelated to the audit; and (ix) any other service the
         Public Company Accounting Oversight Board determines, by regulation, is
         impermissible.

         Pre-approval by the Committee of any permissible non-audit services is
         not required so long as: (i) the aggregate amount of all such
         permissible non-audit services provided to the Fund, the Adviser and
         any service providers controlling, controlled by or under common
         control with the Adviser that provide ongoing services to the Fund
         ("Covered Service Providers") constitutes not more than 5% of the total
         amount of revenues paid to the independent auditors during the fiscal
         year in which the permissible non-audit services are provided to (a)
         the Fund, (b) the Adviser and (c) any entity controlling, controlled by
         or under common control with the Adviser that provides ongoing services
         to the Fund during the fiscal year in which the services are provided
         that would have to be approved by the Committee; (ii) the permissible
         non-audit services were not recognized by the Fund at the time of the
         engagement to be non-audit services; and (iii) such services are
         promptly brought to the attention of the Committee and approved by the
         Committee (or its delegate(s)) prior to the completion of the audit.

   (f)   N/A

   (g)   Non-audit fees billed by the Accountant for services rendered to Smith
         Barney International Large Cap Fund and CAM and any entity controlling,
         controlled by, or under common control with CAM that provides ongoing
         services to Smith Barney International Large Cap Fund were $18.3
         million and $6.4 million for the years ended 12/31/2003 and 12/31/2002.

   (h)      Yes. The Smith Barney International Large Cap Fund's Audit Committee
         has considered whether the provision of non-audit services that were
         rendered to Service Affiliates which were not pre-approved (not
         requiring pre-approval) is compatible with maintaining the Auditor's
         independence. All services provided by the Accountant to the Smith
         Barney International Large Cap Fund or to Service Affiliates which were
         required to be pre-approved were pre-approved as required.

ITEM 5.  AUDIT COMMITTEE OF LISTED REGISTRANTS.

         Not applicable.

ITEM 6.  [RESERVED]

ITEM 7.  DISCLOSURE OF PROXY VOTING POLICIES AND PROCEDURES FOR
         CLOSED-END MANAGEMENT INVESTMENT COMPANIES.

         Not applicable.

ITEM 8.  [RESERVED]

ITEM 9.  CONTROLS AND PROCEDURES.

         (a)   The registrant's principal executive officer and principal
               financial officer have concluded that the registrant's disclosure
               controls and procedures (as defined in Rule 30a- 3(c) under the
               Investment Company Act of 1940, as amended (the "1940 Act")) are
               effective as of a date within 90 days of the filing date of this
               report that includes the disclosure required by this paragraph,
               based on their evaluation of the disclosure controls and
               procedures required by Rule 30a-3(b) under the 1940 Act and
               15d-15(b) under the Securities Exchange Act of 1934

         (b)   There were no changes in the registrant's internal control over
               financial reporting (as defined in Rule 30a-3(d) under the 1940
               Act) that occurred during the registrant's last fiscal half-year
               (the registrant's second fiscal half-year in the case of an
               annual report) that have materially affected, or are likely to
               materially affect the registrant's internal control over
               financial reporting.

ITEM 10. EXHIBITS.

         (a)(1) Code of Ethics attached hereto.

         Exhibit 99-CODE ETH

         (b)(2) Attached hereto.

         Exhibit 99.CERT           Certifications pursuant to section 302 of the
                                   Sarbanes-Oxley Act of 2002

         Exhibit 99.906CERT        Certifications pursuant to Section 906 of the
                                   Sarbanes-Oxley Act of 2002


SIGNATURES

     Pursuant to the requirements of the Securities Exchange Act of 1934 and the
Investment Company Act of 1940, the registrant has duly caused this Report to be
signed on its behalf by the undersigned, there unto duly authorized.

SMITH BARNEY TRUST II -
SMITH BARNEY INTERNATIONAL LARGE CAP FUND

By:      /s/ R. Jay Gerken
         R. Jay Gerken
         Chief Executive Officer of
SMITH BARNEY TRUST II -
SMITH BARNEY INTERNATIONAL LARGE CAP FUND

Date: February 18, 2004

     Pursuant to the requirements of the Securities Exchange Act of 1934 and the
Investment Company Act of 1940, this report has been signed below by the
following persons on behalf of the registrant and in the capacities and on the
dates indicated.

By:      /s/ R. Jay Gerken
         (R. Jay Gerken)
         Chief Executive Officer of
SMITH BARNEY TRUST II -
SMITH BARNEY INTERNATIONAL LARGE CAP FUND

Date: February 18, 2004

By:      /s/ ANDREW B. SHOUP
         Chief Administrative Officer of
SMITH BARNEY TRUST II -
SMITH BARNEY INTERNATIONAL LARGE CAP FUND

Date: February 18, 2004