As you may be aware several issues in the mutual fund industry have recently come under the scrutiny of federal and state regulators.The fund’s Adviser and some of its affiliates have received requests for information from various government regulators regarding market timing, late trading, fees, and other mutual fund issues in connection with various investigations. The regulators appear to be examining, among other things, the fund’s response to market timing and shareholder exchange activity, including compliance with prospectus disclosure related to these subjects.The fund has been informed that the Adviser and its affiliates are responding to those information requests, but are not in a position to predict the outcome of these requests and investigations.
In November 2003, Citigroup Asset Management (“CAM”) disclosed an investigation by the Securities and Exchange Commission (“SEC”) and the U.S.Attorney relating to CAM’s entry into the transfer agency business during 1997-1999. Citigroup has disclosed that the Staff of the SEC is considering recommending a civil injunctive action and/or an administrative proceeding against certain advisory and transfer agent entities affiliated with Citigroup, the former CEO of CAM, two former employees and a current employee of CAM, relating to the creation, operation and fees of its internal transfer agent unit that serves various CAM-managed funds. Citigroup is cooperating with the SEC and will seek to resolve this matter in discussion with the SEC Staff.Although there can be no assurance, Citigroup does not believe that this matter will have a material adverse effect on the fund.
As always, thank you for your confidence in our stewardship of your assets.We look forward to helping you continue to meet your financial goals.
M A N A G E R O V E R V I E W
Special Shareholder Notice
Effective June 28, 2004, a team of individuals employed by the manager serves as the strategist for the fund and is responsible for the fixed income component and the allocation of fund assets between the equity and fixed income components.
Market Overview
For the year, the concerns of economists and market participants were productivity, terrorism and inflation. These concerns translated into relatively modest-yet-mixed stock and mild bond market returns and virtually flat bond yields for the 12-month period ending October 31, 2004. Productivity growth has averaged approximately 4.5% since the beginning of 2001, which amounts to near-record highs for a three-year stretch. Oil prices have spiked on fears that terrorist attacks would disrupt supplies.The positive economic news reflected in the third-quarter 2003 gross domestic product (“GDP”) rate of 7.4% became muted as additional quarterly numbers suggested slowing growth of between 3.3% and 4.2% .The robust productivity and GDP numbers, coupled with inflationary fears, gave the Fed’s monetary policymaking committee reason to begin raising rates at the end of June. Consumer confidence fell in the second half of 2004, reflecting subdued expectations given the weak job growth.
While the equity market was up for the period, most of the gain occurred at the end of 2003.The S&P 500 Indexiv gained 10.2% from October to February, while it fell 2.4% from its February high by the end of the period. For the 12-month period ending October 31, 2004, the S&P 500 gained 9.41% .
The U. S.Treasury zero-coupon bond scheduled to mature on May 15, 2007 yielded 2.67% on October 31, 2003.This yield best reflects the duration until the end of the guarantee period versus other zero coupon issues. For the first four months of this year, yields on average fell reflecting the roll-down in effective duration of the fund.
PERFORMANCE SNAPSHOT AS OF OCTOBER 31, 2004 (excluding sales charges)
|
| | 6 Months | 12 Months |
|
| Class A Shares — Capital | | | | |
| Preservation Fund | 0.62 | % | 0.82 | % |
|
| Lehman Brothers | | | | |
| Aggregate Bond Index | 4.23 | % | 5.53 | % |
|
| S&P 500 Index | 2.96 | % | 9.41 | % |
|
| Lipper Balanced Target Maturity | | | | |
| Fund Category Average | 1.57 | % | 2.50 | % |
|
The performance shown represents past performance. Past performance is no guarantee of future results and current performance may be higher or lower than the performance shown above. Principal value and investment returns will fluctuate and investors’ shares, when redeemed, may be worth more or less than their original cost.
Performance figures may reflect reimbursements or fee waivers, without which the performance would have been lower.
Class A share returns assume the reinvestment of income dividends and capital gains distributions at net asset value and the deduction of all fund expenses. Returns have not been adjusted to include sales charges that may apply when shares are purchased or the deduction of taxes that a shareholder would pay on fund distributions. Excluding sales charges, Class B shares returned 0.27% and Class C shares returned 0.27% over the six months ended October 31, 2004. Excluding sales charges, Class B shares returned 0.15% and Class C shares returned 0.06% over the twelve months ended October 31, 2004.
Lipper, Inc. is a major independent mutual-fund tracking organization. Returns are based on the period ended October 31, 2004, calculated among the 79 funds for the six-month period and among the 73 funds for the 12-month period in the fund’s Lipper category including the reinvestment of dividends and capital gains, if any, and excluding sales charges.
However, from March to May, yields rose dramatically as bond prices dropped, reflecting both the anticipation of an improving economy and the possibility of a rise in inflation.The markets’ reaction to inflation fears was captured in the rising yields of Treasury Inflation Protected Securities (“TIPS”), which adjust in response to the Consumer Price Index.The yield on the 10-year
3 Smith Barney Capital Preservation Fund | 2004 Annual Report
TIPS fell to a low of 1.41% on March 19th, only to rise to 2.04% by June 30th. As the Fed raised rates the TIPS yield fell to 1.60% by October 29, 2004; the yield on the U. S.Treasury zero-coupon bond scheduled to mature on May 15, 2007, fell to 2.70% .
Performance Review
For the 12 months ended October 31, 2004, Class A shares of the Smith Barney Capital Preservation Fund, excluding sales charges, returned 0.82% .These shares underperformed the fund’s unmanaged benchmarks, the Lehman Brothers Aggregate Bond Index and the S&P 500 Index, which returned 5.53% and 9.41%, respectively, for the same period.They also underperformed the Lipper balanced target maturity funds category average1, which was 2.50% .
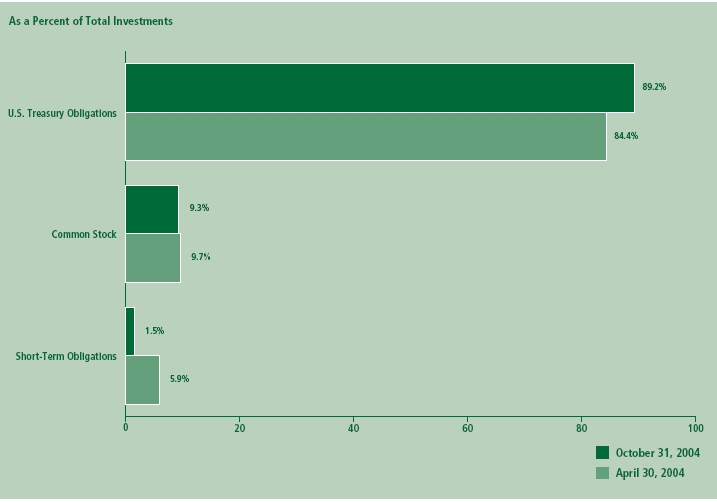
The performance of the Capital Preservation Fund was influenced primarily by its shifting allocation between stocks and bonds.The asset allocation in the fund is a function of the magnitude and amplitude of equity and bond market returns.The sideways movement in the stock market and treasury yields, along with the fund’s focus on principal protection, kept the fund’s equity allocation between 9% and 14% throughout period.The equity allocation as of October 31, 2004 was at 9.8% .
On an individual stock basis, the largest contributors to the fund’s performance were The St. Joe Co., which was up 56.0% for the time period and represented 1.5% of the equity portion of the fund at the end of the period; Gillette Co., which was up 32.2% and represented 2.4% of the equity portion of the fund at the time; and EnCana Corp., which was up 45.1% and represented 2.2% of the equity portion of the fund at the end of October of this year.
The primary detractors from performance from the equity portion were Intel Corp., which was down 32.1% for the time period and represented 2.1% of the equity portion of the fund at the end of the period; Amazon.com Inc., which was down 37.3% and represented 2.2% of the equity portion of the fund at this time; and Merck & Co. Inc., which was down 26.9% and represented 1.2% of the equity portion of the fund at the end of October of this year.
On the fixed income side, zero-coupon U.S. treasury strips, duration matched to the end of the guarantee period of the fund, were purchased.These extremely low-risk instruments are used in the fixed-income portion of the fund, so that the majority of the fund’s risk budget is allocated to the active equity portion.The primary fixed-income instruments, the Principal-Only Treasury Strip schedule to mature on May 15, 2007 and the Principal-Only Treasury Strip scheduled to mature on August 15, 2007, returned 2.68% and 2.86%, respectively, over the given time period.
Through a turbulent global environment, including the war in Iraq, rising oil prices, the Fed raising interest rates, corporate scandals, and the U.S. presidential election, the fund has managed to stick to its focus of delivering principal protection while providing exposure to the equity market.
Thank you for your investment in the Smith Barney Capital Preservation Fund. As ever, we appreciate that you have chosen us to manage your assets and we remain focused on seeking to achieve the fund’s investment goals.
Sincerely, 
Alan Blake
Portfolio Manager | 
Harry D. Cohen
Portfolio Manager |

Alex Romeo
Portfolio Manager
November 15, 2004
| 1 | Lipper, Inc. is a major independent mutual-fund tracking organization. Returns are based on the 12-month period ended October 31, 2004, calculated among the 73 funds in the fund’s Lipper category, including the reinvestment of dividends and capital gains, if any, and excluding sales charges. |
| |
4 Smith Barney Capital Preservation Fund | 2004 Annual Report
The information provided is not intended to be a forecast of future events, a guarantee of future results or investment advice. Views expressed may differ from those of the firm as a whole.
Portfolio holdings and breakdowns are as of October 31, 2004 and are subject to change and may not be representative of the portfolio manager’s current or future investments. The fund’s top ten equity holdings as of this date were: Berkshire Hathaway, Inc. (0.4%), Genentech, Inc. (0.3%), Pfizer, Inc. (0.3%), Wells Fargo &Co. (0.2%), Gillette Co. (0.2%), The Walt Disney Co. (0.2%), Merrill Lynch & Co., Inc. (0.2%), Dell Inc. (0.2%), Microsoft Corp. (0.2%), Texas Instrument Inc. (0.2%) . Please refer to pages 11 through 15 for a list and percentage breakdown of the fund’s holdings.
The mention of sector breakdowns is for informational purposes only and should not be construed as a recommendation to purchase or sell any securities. The information provided regarding such sectors is not a sufficient basis upon which to make an investment decision. Investors seeking financial advice regarding the appropriateness of investing in any securities or investment strategies discussed should consult their financial professional. Portfolio holdings are subject to change at any time and may not be representative of the portfolio manager’s current or future investments. The fund’s top five sector holdings as of October 31, 2004 were: U.S. Treasury Obligations (89.5%); Financials (1.8%); Information Technology (1.7%); Short-Term Obligations (1.5%); Consumer Discretionary (1.2%) . The fund’s portfolio composition is subject to change at any time.
RISKS: Use of the fixed income component during the Guarantee Period will reduce the fund’s ability to participate as fully in upward equity market movements, and therefore represents some loss of opportunity, or opportunity cost, compared to a portfolio that is more heavily invested in equities. If the value of the stock component were to decline substantially during the Guarantee Period or upon the occurrence of certain non-market-related events, the fund may be completely and irreversibly 100% reallocated to fixed income. Please see the fund’s prospectus for more information. The terms of a Financial Guarantee Agreement executed in connection with the Guarantee impose certain limitations on the manner in which the Fund may be managed during the Guarantee Period. The Financial Guarantee Agreement could limit the manager’s ability to alter the management of the fund during the Guarantee Period in response to changing market conditions.
When you hold your investment until the end of the five-year Guarantee Period, on the Guarantee Maturity Date your account will be worth no less than your initial investment (less sales charges) at the end of the Offering Period, reduced to reflect any redemptions, dividends and distributions received in cash and certain fund expenses, such as taxes and extraordinary expenses. If you choose to redeem your investment on any day other than the Guarantee Maturity Date, your shares will be redeemed at the current NAV and the amount returned could be less than that invested. The guarantee is based on the amount invested as of the first day of the Guarantee Period and does not apply to any earnings realized during the Guarantee Period. As with the sale of any securities, a taxable event may occur if the fund liquidates securities for asset allocation purposes or at the end of the Guarantee Period. Please keep in mind that the fund’s NAV will fluctuate. After the Guarantee Period ends, your investment will no longer be protected by the guarantee and will be subject to possible loss of principal. Any exchange into another fund will constitute a taxable event. Fund allocations may change at any time.
All index performance reflects no deduction for fees, expenses or taxes. Please note an investor cannot invest directly in an index.
| i | Source: Commerce Department (Bureau of Economic Analysis). Refers to quarterly growth of Gross Domestic Product (“GDP”). GDP is a market value of goods and services produced by labor and property in a given country. |
| |
| ii | Source: U.S. Federal Reserve Board. The Fed is responsible for the formulation of a policy designed to promote economic growth, full employment, stable prices, and a sustainable pattern of international trade and payments. |
| |
| iii | The federal funds rate is the interest rate that banks with excess reserves at a Federal Reserve district bank charge other banks that need overnight loans. |
| |
| iv | The S&P 500 Index is a market capitalization-weighted index of 500 widely held common stocks. |
| |
| v | The Lehman Brothers Aggregate Bond Index is a broad-based bond index comprised of Government, Corporate, Mortgage and Asset-backed issues, rated investment grade or higher, and having at least one year to maturity. |
| |
5 Smith Barney Capital Preservation Fund | 2004 Annual Report
Fund at a Glance (unaudited)
Investment Breakdown
6 Smith Barney Capital Preservation Fund | 2004 Annual Report
Fund Expenses (unaudited)
Example
As a shareholder of the Fund, you may incur two types of costs: (1) transaction costs, including front-end and back-end sales charges (loads) on purchase payments, reinvested dividends, or other distributions; and (2) ongoing costs, including management fees; distribution and/or service (12b-1) fees; and other Fund expenses.This example is intended to help you understand your ongoing costs (in dollars) of investing in the Fund and to compare these costs with the ongoing costs of investing in other mutual funds.
This example is based on an investment of $1,000 invested on May 1, 2004 and held for the six months ended October 31, 2004.
Actual Expenses
The table below titled “Based on Actual Total Return” provides information about actual account values and actual expenses. You may use the information provided in this table, together with the amount you invested, to estimate the expenses that you paid over the period.To estimate the expenses you paid on your account, divide your ending account value by $1,000 (for example, an $8,600 ending account value divided by $1,000 = 8.6), then multiply the result by the number under the heading entitled “Expenses Paid During the Period”.
Based on Actual Total Return(1)
| | | Actual | | | | | | | | | | | | |
| | | Total Return | | Beginning | Ending | Annualized | | | Expenses |
| | | Without | | Account | Account | Expense | | | Paid During |
| | | Sales Charges(2) | | Value | Value | Ratio | | | the Period(3) |
|
| Class A | | 0.62 | % | | $ | 1,000.00 | | $ | 1,006.20 | | 1.87 | % | | | $9.43 |
|
| Class B | | 0.27 | | | | 1,000.00 | | | 1,002.70 | | 2.63 | | | | 13.24 |
|
| Class C(4) | | 0.27 | | | | 1,000.00 | | | 1,002.70 | | 2.63 | | | | 13.24 |
|
| (1) | For the six months ended October 31, 2004. |
| |
| (2) | Assumes reinvestment of all dividends and capital gain distributions, if any, at net asset value and does not reflect the deduction of the applicable sales charges with respect to Class A shares or the applicable contingent deferred sales charges (“CDSC”) with respect to Class B and C shares. Total return is not annualized, as it may not be representative of the total return for the year. Performance figures may reflect fee waivers and/or expense reimbursements. Past performance is no guarantee of future results. In the absence of fee waivers and/or expense reimbursements, the total return would have been lower. |
| |
| (3) | Expenses (net of voluntary waiver) are equal to each class’ respective annualized expense ratio multiplied by the average account value over the period, multiplied by the number of days in the most recent fiscal half-year, then divided by 366. |
| |
| (4) | On April 29, 2004, Class L shares were renamed as Class C shares. |
| |
7 Smith Barney Capital Preservation Fund | 2004 Annual Report
Fund Expenses (unaudited) (continued)
Hypothetical Example for Comparison Purposes
The table below titled “Based on Hypothetical Total Return” provides information about hypothetical account values and hypothetical expenses based on the actual expense ratio and an assumed rate of return of 5.00% per year before expenses, which is not the Fund’s actual return.The hypothetical account values and expenses may not be used to estimate the actual ending account balance or expenses you paid for the period.You may use the information provided in this table to compare the ongoing costs of investing in the Fund and other funds.To do so, compare the 5.00% hypothetical example relating to the Fund with the 5.00% hypothetical examples that appear in the shareholder reports of the other funds.
Please note that the expenses shown in the table below are meant to highlight your ongoing costs only and do not reflect any transactional costs, such as front-end or back-end sales charges (loads).Therefore, the table is useful in comparing ongoing costs only, and will not help you determine the relative total costs of owning different funds. In addition, if these transaction costs were included, your costs would have been higher.
Based on Hypothetical Total Return(1)
| | | | | | Beginning | Ending | Annualized | | | | Expenses |
| | | Hypothetical | | Account | Account | Expense | | | | Paid During |
| | | Total Return | | Value | Value | Ratio | | | | the Period(2) |
|
| Class A | | 5.00 | % | | $ | 1,000.00 | | $ | 1,015.74 | | 1.87 | % | | | | $9.48 |
|
| Class B | | 5.00 | | | | 1,000.00 | | | 1,011.91 | | 2.63 | | | | | 13.30 |
|
| Class C(3) | | 5.00 | | | | 1,000.00 | | | 1,011.91 | | 2.63 | | | | | 13.30 |
|
| (1) | For the six months ended October 31, 2004. |
| |
| (2) | Expenses (net of voluntary waiver) are equal to each class’ respective annualized expense ratio multiplied by the average account value over the period, multiplied by the number of days in the most recent fiscal half-year, then divided by 366. |
| |
| (3) | On April 29, 2004, Class L shares were renamed as Class C shares. |
| |
8 Smith Barney Capital Preservation Fund | 2004 Annual Report
Average Annual Total Returns† (unaudited)
| | Without Sales Charges(1) |
|
|
| | Class A | Class B | Class C(2) |
|
| Twelve Months Ended 10/31/04 | 0.82 | % | 0.15 | % | 0.06 | % |
|
| Inception* through 10/31/04 | 1.19 | | 0.46 | | 0.45 | |
|
| |
| | With Sales Charges(3) |
|
|
| | Class A | Class B | Class C(2) |
|
| Twelve Months Ended 10/31/04 | (4.26 | )% | (4.79 | )% | (0.93 | )% |
|
| Inception* through 10/31/04 | (0.81 | ) | (0.70 | ) | 0.45 | |
|
Cumulative Total Returns† (unaudited)
| | Without Sales Charges(1) |
|
| Class A (Inception* through 10/31/04) | 3.08 | % |
|
| Class B (Inception* through 10/31/04) | 1.18 | |
|
| Class C(2) (Inception* through 10/31/04) | 1.17 | |
|
| † | | | All figures represent past performance and are not a guarantee of future results. Investment return and principal value of an investment will fluctuate so that an investor’s shares, when redeemed, may be worth more or less than their original cost. The returns shown do not reflect the deduction of taxes that a shareholder would pay on fund distributions or the redemption of fund shares. Performance figures may reflect fee waivers and/or expense reimbursements. In the absense of fee waivers and/or expense reimbursements, the total return would have been lower. |
| | | |
| (1 | ) | | Assumes reinvestment of all dividends and capital gain distributions, if any, at net asset value and does not reflect deduction of all applicable sales charges with respect to Class A and C shares or the applicable CDSC with respect to Class B and C shares. |
| | | |
| (2 | ) | | On April 29, 2004, Class L shares were renamed as Class C shares. |
| | | | |
| (3 | ) | | Assumes reinvestment of all dividends and capital gain distributions, if any, at net asset value. In addition, Class A shares reflect the deduction of the maximum sales charges of 5.00%; and Class B shares reflect the deduction of a 5.00% CDSC, which applies if shares are redeemed within one year from purchase payment. Thereafter, this CDSC declines by 1.00% per year until no CDSC is incurred. Class C shares also reflect the deduction of 1.00% CDSC, which applies if shares are redeemed within the one year of purchase payment. The 1.00% initial sales charge on Class C is no longer imposed effective February 2, 2004. |
| | | |
| * | | | Inception date for Class A, B and C shares is April 3, 2002. |
9 Smith Barney Capital Preservation Fund | 2004 Annual Report
Historical Performance (unaudited)
Value of $10,000 Invested in Class A Shares of the Smith Barney Capital Preservation Fund vs.
S&P 500 Index and Lehman Brothers Aggregate Bond Index†
April 2002 — October 2004
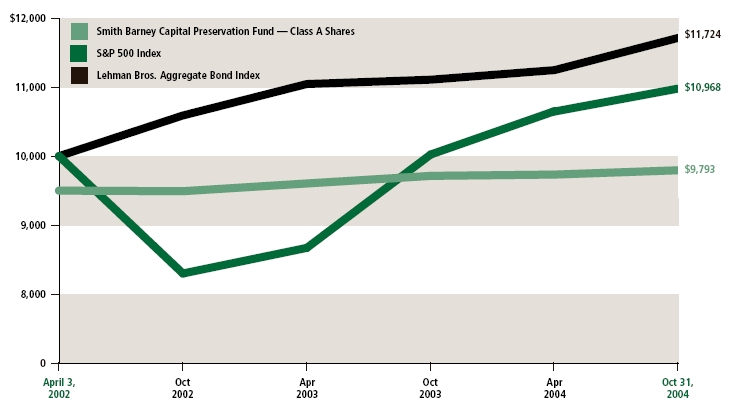
| † | Hypothetical illustration of $10,000 invested in Class A shares at inception on April 3, 2002, assuming deduction of the maximum 5.00% sales charge at the time of investment for Class A shares. It also assumes reinvestment of dividends and capital gains, if any, through October 31, 2004. The S&P 500 Index is a market cap- italization-weighted index of 500 widely held common stocks. The Lehman Brothers Aggregate Bond Index is a broad-based bond index comprised of Government, Corporate, Mortgage and Asset-backed issues, rated investment grade or higher, and having at least one year to maturity. Please note that an investor cannot invest directly in an index. |
| | |
| | All figures represent past performance and are not a guarantee of future results. Investment return and principal value of an investment will fluctuate so that an investor’s shares, when redeemed, may be worth more or less than their original cost. The returns shown do not reflect the deduction of taxes that a shareholder would pay on fund distributions or the redemption of fund shares. Performance figures may reflect fee waivers and or expense reimbursements. In the absence of fee waivers and/or expense reimbursements, the total return would have been lower. |
10 Smith Barney Capital Preservation Fund | 2004 Annual Report
|
Schedule of Investments | | October 31, 2004 |
|
| SHARES | SECURITY | VALUE |
|
| COMMON STOCK — 9.3% | | |
| CONSUMER DISCRETIONARY — 1.2% | | |
| Auto Components — 0.0% | | |
| 14,368 | | Delphi Corp. | $ | 120,835 |
|
| Hotels, Restaurants & Leisure — 0.1% | | |
| 7,874 | | Fairmont Hotels Resorts, Inc. | | 223,464 |
| 11,679 | | McDonald’s Corp. | | 340,443 |
|
| | | | | 563,907 |
|
| Internet & Catalog Retail — 0.2% | | |
| 31,132 | | Amazon Com, Inc. (a) | | 1,062,535 |
| 6,489 | | Interactive Corp. (a) | | 140,292 |
|
| | | | | 1,202,827 |
|
Media — 0.7% | | |
| 16,021 | | Comcast Corp. — Class A shares (a) | | 465,250 |
| 5,316 | | Dow Jones & Co., Inc. | | 235,233 |
| 5,528 | | Gannett Inc. | | 458,548 |
| 16,435 | | Liberty Media Corp. — Series A shares (a) | | 146,600 |
| 821 | | Liberty Media International, Inc. — Series A shares (a) | | 29,597 |
| 59,047 | | Time Warner, Inc. (a) | | 982,542 |
| 46,565 | | The Walt Disney Co. | | 1,174,369 |
|
| | | | | 3,492,139 |
|
| Multi-Line Retail — 0.1% | | |
| 10,932 | | Costco Wholesale Corp. | | 524,080 |
|
| Specialty Retail — 0.1% | | |
| 11,248 | | The Home Depot, Inc. | | 462,068 |
|
| | | TOTAL CONSUMER DISCRETIONARY | | 6,365,856 |
|
| CONSUMER STAPLES — 1.0% | | |
| Beverages — 0.1% | | |
| 16,432 | | The Coca-Cola Co. | | 668,125 |
|
| Food & Drug Retailing — 0.1% | | |
| 7,843 | | Walgreen Co. | | 281,485 |
|
| Food Products — 0.4% | | |
| 6,878 | | General Mills, Inc. | | 304,352 |
| 8,894 | | Hershey Foods Corp. | | 450,837 |
| 10,049 | | Kraft Foods, Inc. — Class A shares | | 334,732 |
| 12,821 | | William Wrigley Jr. Co. | | 838,493 |
|
| | | | | 1,928,414 |
|
| Household Products — 0.2% | | |
| 7,940 | | Kimberly-Clark Corp. | | 473,780 |
| 10,015 | | Procter & Gamble Co. | | 512,568 |
|
| | | | | 986,348 |
|
| Personal Products — 0.2% | | |
| 28,452 | | Gillette Co. | | 1,180,189 |
|
| | | TOTAL CONSUMER STAPLES | | 5,044,561 |
|
See Notes to Financial Statements.
11 Smith Barney Capital Preservation Fund | 2004 Annual Report
|
Schedule of Investments (continued) | | October 31, 2004 |
|
| SHARES | SECURITY | VALUE |
|
ENERGY — 0.7% | | |
| Energy Equipment & Services — 0.1% | | |
| 4,657 | | Schlumberger Ltd. | $ | 293,112 |
|
Oil & Gas — 0.6% | | |
| 7,287 | | BP PLC — ADR | | 424,468 |
| 13,730 | | ChevronTexaco Corp. | | 728,514 |
| 6,145 | | ConocoPhillips | | 518,085 |
| 21,781 | | Encana Corp. | | 1,075,981 |
| 9,329 | | Exxon Mobil Corp. | | 459,173 |
|
| | | | | 3,206,221 |
|
| | | TOTAL ENERGY | | 3,499,333 |
|
| FINANCIALS — 1.8% | | |
Banks — 0.2% | | |
| 20,104 | | Wells Fargo & Co. | | 1,200,611 |
|
| Diversified Financials — 0.5% | | |
| 17,479 | | JPMorgan Chase & Co. | | 674,689 |
| 21,566 | | Merrill Lynch & Co., Inc. | | 1,163,270 |
| 13,903 | | Morgan Stanley | | 710,304 |
|
| | | | | 2,548,263 |
|
Insurance — 0.8% | | |
| 17,812 | | American International Group, Inc. | | 1,081,367 |
| 23 | | Berkshire Hathaway, Inc. — Class A shares (a) | | 1,937,750 |
| 3,651 | | Chubb Corp. | | 263,347 |
| 13,129 | | Old Republic International Corp. | | 306,562 |
| 14,416 | | The St. Paul Cos., Inc. | | 489,567 |
|
| | | | | 4,078,593 |
|
Real Estate — 0.3% | | |
| 13,246 | | Forest City Enterprises, Inc. | | 727,868 |
| 14,325 | | The St. Joe Co. | | 729,143 |
|
| | | | | 1,457,011 |
|
| | | TOTAL FINANCIALS | | 9,284,478 |
|
| HEALTHCARE — 1.2% | | |
Biotechnology — 0.5% | | |
| 15,021 | | Amgen Inc. (a) | | 853,193 |
| 32,761 | | Genentech, Inc. (a) | | 1,491,608 |
|
| | | | | 2,344,801 |
|
| Pharmaceuticals — 0.7% | | |
| 13,575 | | Eli Lilly & Co. | | 745,403 |
| 11,062 | | Johnson & Johnson | | 645,799 |
| 2,072 | | Medco Health Solutions, Inc. (a) | | 70,262 |
| 18,908 | | Merck & Co., Inc. | | 592,009 |
| 50,980 | | Pfizer, Inc. | | 1,475,871 |
| 8,147 | | Wyeth | | 323,029 |
|
| | | | | 3,852,373 |
|
| | | TOTAL HEALTHCARE | | 6,197,174 |
|
See Notes to Financial Statements.
12 Smith Barney Capital Preservation Fund | 2004 Annual Report
|
Schedule of Investments (continued) | | October 31, 2004 |
|
| SHARES | SECURITY | VALUE |
|
| INDUSTRIALS — 1.0% | | |
| Air Freight & Couriers — 0.1% | | |
| 7,695 | | United Parcel Service, Inc., Class B shares | $ | 609,290 |
|
| Commercial Services & Supplies — 0.2% | | |
| 6,133 | | First Data Corp. | | 253,170 |
| 7,634 | | H & R Block, Inc. | | 362,997 |
| 8,526 | | Waste Management, Inc. | | 242,820 |
|
| | | | | 858,987 |
|
| Electrical Equipment — 0.1% | | |
| 17,041 | | Molex Inc. — Class A shares | | 438,295 |
|
| Industrial Conglomerates — 0.4% | | |
| 10,842 | | 3M Co. | | 841,014 |
| 15,860 | | Canadian Pacific Railway, Ltd., Class 1 | | 448,045 |
| 26,710 | | General Electric Co. | | 911,345 |
|
| | | | | 2,200,404 |
|
| Machinery — 0.0% | | |
| 3,234 | | Dover Corp. | | 126,999 |
|
| Road & Rail — 0.2% | | |
| 12,126 | | Burlington Northern Santa Fe Corp. | | 506,988 |
| 13,812 | | Florida East Coast Industries, Inc. | | 522,922 |
|
| | | | | 1,029,910 |
|
| | | TOTAL INDUSTRIALS | | 5,263,885 |
|
| INFORMATION TECHNOLOGY — 1.6% | | |
| Communications Equipment — 0.5% | | |
| 45,005 | | CIENA Corp. (a) | | 111,162 |
| 30,473 | | Cisco Systems, Inc. (a) | | 585,386 |
| 31,644 | | Corning Inc. (a) | | 362,324 |
| 24,893 | | Juniper Networks, Inc. (a) | | 662,403 |
| 43,529 | | Motorola, Inc. | | 751,311 |
|
| | | | | 2,472,586 |
|
| Computers & Peripherals — 0.2% | | |
| 32,978 | | Dell Inc. (a) | | 1,156,209 |
| 21,629 | | Western Digital Corp. (a) | | 180,170 |
|
| | | | | 1,336,379 |
|
| Electronic Equipment & Instruments — 0.1% | | |
| 5,473 | | Mettler-Toledo International, Inc. (a) | | 262,157 |
| 14,509 | | Vishay Intertechnology, Inc. (a) | | 187,601 |
|
| | | | | 449,758 |
|
| Semiconductor Equipment & Products — 0.5% | | |
| 46,399 | | Intel Corp. | | 1,032,842 |
| 45,562 | | Texas Instruments, Inc. | | 1,113,991 |
| 22,672 | | Xilinx, Inc. | | 693,763 |
|
| | | | | 2,840,596 |
|
See Notes to Financial Statements.
13 Smith Barney Capital Preservation Fund | 2004 Annual Report
|
Schedule of Investments (continued) | | October 31, 2004 |
|
| SHARES | SECURITY | VALUE |
|
Software — 0.3% | | |
| 39,980 | | Microsoft Corp. | $ | 1,119,040 |
| 8,377 | | Sybase, Inc. (a) | | 132,608 |
| 15,331 | | VERITAS Software Corp. (a) | | 335,442 |
|
| | | | | 1,587,090 |
|
| | | TOTAL INFORMATION TECHNOLOGY | | 8,686,409 |
|
| MATERIALS — 0.4% | | |
| Chemicals — 0.1% | | |
| 9,325 | | E. I. Du Pont de Nemour & Co. | | 399,763 |
| 7,048 | | PPG Industries, Inc. | | 449,310 |
|
| | | | | 849,073 |
|
| Metals & Mining — 0.2% | | |
| 12,542 | | Alcoa, Inc. | | 407,615 |
| 13,438 | | Nucor Corp. | | 567,487 |
|
| | | | | 975,102 |
|
| Paper & Forest Products — 0.1% | | |
| 6,121 | | Weyerhaeuser Co. | | 383,419 |
|
| | | TOTAL MATERIALS | | 2,207,594 |
|
| TELECOMMUNICATION SERVICES — 0.2% | | |
| Diversified Telecommunication Services — 0.2% | | |
| 23,596 | | SBC Communications, Inc. | | 596,035 |
| 14,768 | | Verizon Communications, Inc. | | 577,429 |
|
| | | TOTAL TELECOMMUNICATION SERVICES | | 1,173,464 |
|
| |
| UTILITIES — 0.2% | | |
| Electric Utilities — 0.2% | | |
| 6,485 | | Allegheny Energy, Inc. (a) | | 118,740 |
| 10,609 | | Ameren Corp. | | 509,232 |
| 5,669 | | American Electric Power, Inc. | | 186,680 |
| 6,315 | | PPL Corp. | | 328,380 |
|
| | | TOTAL UTILITIES | | 1,143,032 |
|
| | | TOTAL COMMON STOCK | | |
| | | (Cost — $43,816,968) | | 48,865,786 |
|
| FACE | | | |
| AMOUNT | SECURITY | | VALUE |
|
| |
| U.S. TREASURY OBLIGATIONS — 89.6% | | |
| | | United States Treasury Strip Notes: | | |
| $500,121,000 | | due 5/15/07 | | 467,083,507 |
| 4,626,358 | | due 8/15/07 (b) | | 4,282,333 |
|
| | | TOTAL U.S. TREASURY OBLIGATIONS | | |
| | | (Cost — $452,655,454) | | 471,365,840 |
|
See Notes to Financial Statements.
14 Smith Barney Capital Preservation Fund | 2004 Annual Report
|
Schedule of Investments (continued) | | October 31, 2004 |
|
| FACE | | | | |
| AMOUNT | SECURITY | VALUE |
|
| SHORT-TERM OBLIGATIONS — 1.5% | | | |
| U.S. TREASURY BILL — 0.2% | | | |
| $ | 1,000,000 | | United States Treasury Bill due 12/16/04 (b) (Cost — $997,969) | $ | 997,850 | |
|
| REPURCHASE AGREEMENT — 1.3% | | | |
| 6,938,000 | | State Street Bank & Trust Co., dated 10/29/04, 1.700% due 11/1/04 Proceeds at maturity — $6,938,983; |
| | | (Fully collateralized by U.S. Treasury Bonds, 7.500% due 11/15/16; | | | |
| | | Market value — $7,082,175) (Cost — $6,938,000) | | 6,938,000 | |
|
| | | TOTAL SHORT-TERM OBLIGATIONS | | | |
| | | (Cost — $7,935,969) | | 7,935,850 | |
|
| | | TOTAL INVESTMENTS — 100.4% (Cost — $504,408,391*) | | 528,167,476 | |
| | | Liabilities in Excess of Other Assets — (0.4)% | | (1,968,217 | ) |
|
| | | TOTAL NET ASSETS — 100.0% | $ | 526,199,259 | |
|
| (a) | | Non-income producing security. |
| | | |
| (b) | | Security is segregated and/or held as collateral for open futures contracts. |
| | | |
| * | | Aggregate cost for Federal income tax purposes is $506,831,730. |
| |
| | | Abbreviation used in schedule: |
| |
|
| | | ADR — American Depositary Receipt |
See Notes to Financial Statements.
15 Smith Barney Capital Preservation Fund | 2004 Annual Report
|
| Statement of Assets and Liabilities | | October 31, 2004 |
|
| ASSETS: | | | |
| Investments, at value (Cost — $496,472,422) | $ | 520,231,626 | |
| Short-term holdings, at amortized cost (Cost — $7,935,969) | | 7,935,850 | |
| Cash | | 1,498 | |
| Dividends and interest receivable | | 41,993 | |
| Receivable from broker — variation margin | | 7,425 | |
|
| Total Assets | | 528,218,392 | |
|
| LIABILITIES: | | | |
| Distribution fees payable (Note 4) | | 407,931 | |
| Payable for shares of beneficial interest repurchased | | 378,923 | |
| Management fee payable (Note 2) | | 336,988 | |
| Accrued expenses | | 895,291 | |
|
| Total Liabilities | | 2,019,133 | |
|
| Total Net Assets | $ | 526,199,259 | |
|
| NET ASSETS: | | | |
| Par value of shares of beneficial interest ($0.00001 par value, unlimited shares authorized) | $ | 467 | |
| Capital paid in excess of par value | | 531,629,578 | |
| Undistributed net investment income | | 5,282,781 | |
| Accumulated net realized loss from investment transactions and futures contracts | | (34,477,314 | ) |
| Net unrealized appreciation on investments and futures contracts | | 23,763,747 | |
|
| Total Net Assets | $ | 526,199,259 | |
|
| |
| Computation of | | | |
| Class A Shares: | | | |
| Net Asset Value per share ($64,546,462 ÷ 5,686,524 shares outstanding) | | $11.35 | |
| Offering Price per share ($11.35 ÷ 0.95) | | $11.95 | * |
|
| |
| Class B Shares: | | | |
| Net Asset Value per share and offering price ($403,316,088 ÷ 35,795,854 shares outstanding) | | $11.27 | ** |
|
| |
| Class C Shares†: | | | |
| Net Asset Value per share and offering price ($58,336,709 ÷ 5,177,377 shares outstanding) | | $11.27 | ** |
|
| * | | Based upon single purchases of less than $25,000. |
| | | |
| ** | | Redemption price per share is equal to net asset value less any applicable contingent deferred sales charges. |
| | | |
| † | | Effective April 29, 2004, Class L shares were renamed as Class C shares. |
See Notes to Financial Statements.
16 Smith Barney Capital Preservation Fund | 2004 Annual Report
|
Statement of Operations | | For the Year Ended October 31, 2004 |
|
| INVESTMENT INCOME: | | | |
| Interest | $ | 21,654,460 | |
| Dividends | | 849,754 | |
| Less: Foreign withholding tax | | (3,721 | ) |
|
| Total Investment Income | | 22,500,493 | |
|
| |
| EXPENSES: | | | |
| Distribution fees (Note 4) | | 5,511,894 | |
| Management fee (Note 2) | | 4,552,769 | |
| Guarantee fees (Note 6) | | 4,552,769 | |
| Transfer agency services (Note 4) | | 387,796 | |
| Legal fees | | 142,026 | |
| Shareholder communications (Note 4) | | 115,286 | |
| Custody and fund accounting fees | | 68,204 | |
| Blue sky fees | | 35,197 | |
| Audit fees | | 31,000 | |
| Trustees’ fees | | 22,127 | |
| Other | | 40,949 | |
|
| Total Expenses | | 15,460,017 | |
| Less: aggregate amount waived by the Manager (Notes 2 and 10) | | (70,986 | ) |
|
| Net Expenses | | 15,389,031 | |
|
| Net Investment Income | | 7,111,462 | |
|
| |
REALIZED AND UNREALIZED GAIN ON INVESTMENTS, FUTURES CONTRACTS | | | |
| AND FOREIGN CURRENCY TRANSACTIONS (NOTES 1 AND 3): | | | |
| Realized Gain From: | | | |
| Investment transactions | | 13,932,503 | |
| Futures contracts | | 756,885 | |
| Foreign currency transactions | | 98 | |
|
| Net Realized Gain | | 14,689,486 | |
|
| Net Decrease in Unrealized Appreciation | | (19,811,698 | ) |
|
| Net Loss on Investments, Futures Contracts and Foreign Currency Transactions | | (5,122,212 | ) |
|
| Increase in Net Assets From Operations | $ | 1,989,250 | |
|
See Notes to Financial Statements.
17 Smith Barney Capital Preservation Fund | 2004 Annual Report
|
Statements of Changes in Net Assets | | For the Years Ended October 31, |
| | 2004 | | 2003 |
|
| OPERATIONS: | | | | | | | |
| Net investment income | $ | 7,111,462 | | | $ | 10,533,735 | |
| Net realized gain | | 14,689,486 | | | | 9,279,892 | |
| Net decrease in unrealized appreciation | | (19,811,698 | ) | | | (6,063,671 | ) |
|
| Increase in Net Assets From Operations | | 1,989,250 | | | | 13,749,956 | |
|
| DIVIDENDS TO SHAREHOLDERS FROM (NOTE 5): | | | | | | | |
| Net investment income | | (9,950,249 | ) | | | (8,015,950 | ) |
|
| Decrease in Net Assets From Dividends to Shareholders | | (9,950,249 | ) | | | (8,015,950 | ) |
|
| TRANSACTIONS IN SHARES OF BENEFICIAL INTEREST (NOTE 7): | | | | | | | |
| Net proceeds from sale of shares | | 471,606 | | | | — | |
| Net asset value of shares issued for reinvestment of dividends | | 9,384,685 | | | | 7,629,156 | |
| Cost of shares repurchased | | (185,833,493 | ) | | | (175,339,286 | ) |
|
| Decrease in Net Assets From Transactions in Shares of Beneficial Interest | | (175,977,202 | ) | | | (167,710,130 | ) |
|
| Net Decrease in Net Assets | | (183,938,201 | ) | | | (161,976,124 | ) |
| NET ASSETS | | | | | | | |
| Beginning of year | | 710,137,460 | | | | 872,113,584 | |
|
| End of year* | $ | 526,199,259 | | | $ | 710,137,460 | |
|
| * Includes undistributed net investment income of: | $ | 5,282,781 | | | $ | 8,121,470 | |
|
See Notes to Financial Statements.
18 Smith Barney Capital Preservation Fund | 2004 Annual Report
Financial Highlights
For a share of each class of capital stock outstanding throughout each year or period ended October 31, unless otherwise noted:
| Class A Shares(1) | 2004 | | 2003 | | 2002 (2) |
|
| Net Asset Value, Beginning of Period | $ | 11.50 | | | $ | 11.38 | | | $ | 11.40 | |
|
| Income From Operations: | | | | | | | | | | | |
| Net investment income | | 0.21 | | | | 0.22 | | | | 0.10 | |
| Net realized and unrealized gain (loss) | | (0.12 | ) | | | 0.04 | | | | (0.11 | ) |
|
| Total Income (Loss) From Operations | | 0.09 | | | | 0.26 | | | | (0.01 | ) |
|
| Less Dividends From: | | | | | | | | | | | |
| Net investment income | | (0.24 | ) | | | (0.14 | ) | | | (0.01 | ) |
|
| Net Asset Value, End of Period | $ | 11.35 | | | $ | 11.50 | | | $ | 11.38 | |
|
| Total Return(3) | | 0.82 | % | | | 2.34 | % | | | (0.09 | )%‡ |
|
| Net Assets, End of Period (000s) | $ | 64,546 | | | $ | 84,831 | | | $ | 116,466 | |
|
| Ratios to Average Net Assets: | | | | | | | | | | | |
| Expenses | | 1.88% | (4) | | | 1.93 | % | | | 1.82% | (4) † |
| Net investment income | | 1.83 | | | | 1.94 | | | | 1.59 | † |
|
| Portfolio Turnover Rate | | 2 | % | | | 13 | % | | | 47 | % |
|
| (1 | ) | | Per share amounts have been calculated using the monthly average shares method. |
| | | | |
| (2 | ) | | For the period April 3, 2002 (inception date) to October 31, 2002. |
| | | | |
| (3 | ) | | Performance figures may reflect fee waivers and/or expense reimbursements. Past performance is no guarantee of future results. In the absence of fee waivers and/or expense reimbursements, the total return would have been lower. |
| | | |
| (4 | ) | | The Manager waived a portion of its fees for the year ended October 31, 2004 and the period ended October 31, 2002. If such fees were not waived, the actual annualized expense ratios would have been 1.89% and 1.97%, respectively. |
| | | |
| ‡ | | | Total return is not annualized, as it may not be representative of the total return for the year. |
| | | | |
| † | | | Annualized. |
See Notes to Financial Statements.
19 Smith Barney Capital Preservation Fund | 2004 Annual Report
Financial Highlights (continued)
For a share of each class of capital stock outstanding throughout each year or period ended October 31, unless otherwise noted:
| Class B Shares(1) | 2004 | | 2003 | | 2002 (2) |
|
| Net Asset Value, Beginning of Period | $ | 11.41 | | | $ | 11.34 | | | $ | 11.40 | |
|
| Income From Operations: | | | | | | | | | | | |
| Net investment income | | 0.12 | | | | 0.14 | | | | 0.06 | |
| Net realized and unrealized gain (loss) | | (0.10 | ) | | | 0.03 | | | | (0.11 | ) |
|
| Total Income (Loss) From Operations | | 0.02 | | | | 0.17 | | | | (0.05 | ) |
|
| Less Dividends From: | | | | | | | | | | | |
| Net investment income | | (0.16 | ) | | | (0.10 | ) | | | (0.01 | ) |
|
| Net Asset Value, End of Period | $ | 11.27 | | | $ | 11.41 | | | $ | 11.34 | |
|
| Total Return(3) | | 0.15 | % | | | 1.52 | % | | | (0.48 | )%‡ |
|
| Net Assets, End of Period (000s) | $ | 403,316 | | | $ | 524,947 | | | $ | 605,061 | |
|
| Ratios to Average Net Assets: | | | | | | | | | | | |
| Expenses | | 2.63% | (4) | | | 2.68 | % | | | 2.52% | (4) † |
| Net investment income | | 1.08 | | | | 1.19 | | | | 0.87 | † |
|
| Portfolio Turnover Rate | | 2 | % | | | 13 | % | | | 47 | % |
|
| (1 | ) | | Per share amounts have been calculated using the monthly average shares method. |
| | | | |
| (2 | ) | | For the period April 3, 2002 (inception date) to October 31, 2002. |
| | | | |
| (3 | ) | | Performance figures may reflect fee waivers and/or expense reimbursements. Past performance is no guarantee of future results. In the absence of fee waivers and/or expense reimbursements, the total return would have been lower. |
| | | |
| (4 | ) | | The Manager waived a portion of its fees for the year ended October 31, 2004 and the period ended October 31, 2002. If such fees were not waived, the actual annualized expense ratios would have been 2.64% and 2.66%, respectively. |
| | | |
| ‡ | | | Total return is not annualized, as it may not be representative of the total return for the year. |
| | | | |
| † | | | Annualized. |
See Notes to Financial Statements.
20 Smith Barney Capital Preservation Fund | 2004 Annual Report
Financial Highlights (continued)
For a share of each class of capital stock outstanding throughout each year or period ended October 31, unless otherwise noted:
| Class C Shares(1)(2) | 2004 | | 2003 | | 2002 (3) |
|
| Net Asset Value, Beginning of Period | $ | 11.42 | | | $ | 11.34 | | | $ | 11.40 | |
|
| Income From Operations: | | | | | | | | | | | |
| Net investment income | | 0.12 | | | | 0.14 | | | | 0.06 | |
| Net realized and unrealized gain (loss) | | (0.11 | ) | | | 0.04 | | | | (0.11 | ) |
|
| Total Income (Loss) From Operations | | 0.01 | | | | 0.18 | | | | (0.05 | ) |
|
| Less Dividends From: | | | | | | | | | | | |
| Net investment income | | (0.16 | ) | | | (0.10 | ) | | | (0.01 | ) |
|
| Net Asset Value, End of Period | $ | 11.27 | | | $ | 11.42 | | | $ | 11.34 | |
|
| Total Return(4) | | 0.06 | % | | | 1.60 | % | | | (0.48 | )%‡ |
|
| Net Assets, End of Period (000s) | $ | 58,337 | | | $ | 100,359 | | | $ | 150,586 | |
|
| Ratios to Average Net Assets: | | | | | | | | | | | |
| Expenses | | 2.63% | (5) | | | 2.68 | % | | | 2.52% | (5)† |
| Net investment income | | 1.07 | | | | 1.19 | | | | 0.87 | † |
|
| Portfolio Turnover Rate | | 2 | % | | | 13 | % | | | 47 | % |
|
| (1 | ) | | Per share amounts have been calculated using the monthly average shares method. |
| | | | |
| (2 | ) | | On April 29, 2004, Class L shares were renamed as Class C shares. |
| | | | |
| (3 | ) | | For the period April 3, 2002 (inception date) to October 31, 2002. |
| | | | |
| (4 | ) | | Performance figures may reflect fee waivers and/or expense reimbursements. Past performance is no guarantee of future results. In the absence of fee waivers and/or expense reimbursements, the total return would have been lower. |
| | | |
| (5 | ) | | The Manager waived a portion of its fees for the year ended October 31, 2004 and the period ended October 31, 2002. If such fees were not waived, the actual annualized expense ratios would have been 2.64% and 2.66%, respectively. |
| | | |
| ‡ | | | Total return is not annualized, as it may not be representative of the total return for the year. |
| | | | |
| † | | | Annualized. |
See Notes to Financial Statements.
21 Smith Barney Capital Preservation Fund | 2004 Annual Report
Notes to Financial Statements
1. Significant Accounting Policies
Smith Barney Capital Preservation Fund (“Fund”), a separate investment fund of Smith Barney Trust II (“Trust”), a Massachusetts business trust, is registered under the Investment Company Act of 1940, as amended, as a diversified, open-end management investment company.
The following are significant accounting policies consistently followed by the Fund and are in conformity with U.S. generally accepted accounting principles (“GAAP”). Estimates and assumptions are required to be made regarding assets, liabilities and changes in net assets resulting from operations when financial statements are prepared. Changes in the economic environment, financial markets and any other parameters used in determining these estimates could cause actual results to differ.
(a) Investment Valuation. Securities traded on national securities markets are valued at the closing price on such markets. Securities traded in the over-the-counter market and listed securities for which no sales prices were reported are valued at the mean between the bid and asked prices. Securities listed on the NASDAQ National Market System for which market quotations are available are valued at the official closing price or, if there is no official closing price on that day, at the last sale price. Bonds and other fixed income securities (other than short-term obligations) are valued on the basis of valuations furnished by a pricing service, of which has been approved by the Board of Trustees. In making such valuations, the pricing service utilizes both dealer-supplied valuations and electronic data processing techniques that take into account appropriate factors such as institutional-size trading in similar groups of securities, yield, quality, coupon rate, maturity, type of issue, trading characteristics and other market data, without exclusive reliance upon quoted prices of exchange or over-the-counter prices, since such valuations are believed to reflect more accurately the fair value of such securities. When market quotations or official closing prices are not readily available,or are determined not to reflect accurately fair value,such as when the value of a security has been significantly affected by events after the close of the exchange or market on which the security is principally traded (for example, a foreign exchange or market), but before the Fund calculates its net asset value, the Fund may value these investments at fair value as determined in accordance with the procedures approved by the Fund’s Board of Trustees. Fair valuing of securities may be determined with the assistance of a pricing service using calculations based on indices of domestic securities and other appropriate indicators, such as prices of relevant ADRs and futures contracts. Short-term obligations with maturities of 60 days or less are valued at amortized cost, which approximates value.
(b) Repurchase Agreements. When entering into repurchase agreements, it is the Fund’s policy that a custodian takes possession of the underlying collateral securities, the value of which at least equals the principal amount of the repurchase transaction, including accrued interest.To the extent that any repurchase transaction exceeds one business day, the value of the collateral is marked-to-market to ensure the adequacy of the collateral. If the seller defaults and the value of the collateral declines or if bankruptcy proceedings are commenced with respect to the seller of the security, realization of the collateral by the Fund may be delayed or limited.
(c) Futures Contracts. The Fund may enter into futures contracts to the extent permitted by its investment policies and objectives. Upon entering into a futures contract, the Fund is required to deposit cash or securities as initial margin. Additional securities are also segregated up to the current market value of the futures contracts. Subsequent payments, which are dependent on the daily fluctuations in the value of the underlying instrument, are made or received by the Fund each day (daily variation margin) and are recorded as unrealized gains or losses until the contracts are closed.When the contracts are closed,the Fund records a realized gain or loss equal to the difference between the proceeds from (or cost of) the closing transactions and the Fund’s basis in the contracts.The Fund enters into such contracts typically to hedge a portion of the portfolio. Risks of entering into futures contracts for hedging purposes includes the possibility that a change in the value of the contract may not correlate with the
22 Smith Barney Capital Preservation Fund | 2004 Annual Report
Notes to Financial Statements (continued)
changes in the value of the investments hedged. In addition, the purchase of a futures contract involves the risk that the Fund could lose more than the original margin deposit and subsequent payments required for a futures transaction.
(d) Investment Transactions and Investment Income. Security transactions are accounted for on trade date. Dividend income is recorded on the ex-dividend date. Foreign dividend income is recorded on the ex-dividend date or as soon as practical after the Fund determines the existence of a dividend declaration after exercising reasonable due diligence. Interest income, adjusted for amortization of premium and accretion of discount, is recorded on an accrual basis. Gains or losses on the sale of securities are calculated by using the specific identification method.
(e) Foreign Currency Translation. The books and records of the Fund are maintained in U.S. dollars. Transactions denominated in foreign currencies are recorded at the current prevailing exchange rates.All assets and liabilities denominated in foreign currencies are translated into U.S. dollar amounts at the current exchange rate at the end of the period.Translation gains or losses resulting from changes in the exchange rate during the reporting period and realized gains and losses on the settlement of foreign currency transactions are reported in the results of operations for the current period. The Fund does not isolate that portion of realized gains and losses on investments in securities, which are due to changes in the foreign exchange rate from that which is due to changes in market prices of equity securities.
(f) Dividends and Distributions to Shareholders. Dividends and distributions to shareholders are recorded on the ex-dividend date; the Fund distributes dividends and capital gains, if any at least annually.The character of income and gains to be distributed is determined in accordance with income tax regulations which may differ from GAAP.
(g) Class Accounting. Class specific expenses are charged to each class; management fees, general fund expenses, income, gains and/or losses are allocated on the basis of relative net assets of each class or on another reasonable basis.
(h) Federal and Other Taxes. It is the Fund’s policy to comply with the federal income and excise tax requirements of the Internal Revenue Code of 1986, as amended, applicable to regulated investment companies.Accordingly, the Fund intends to distribute substantially all of its taxable income and net realized gains on investments, if any, to shareholders each year. Therefore, no federal income tax provision is required. Under the applicable foreign tax law, a withholding tax may be imposed on interest, dividends and capital gain at various rates.
(i) Reclassification. U.S. generally accepted accounting principles require that certain components of net assets be adjusted to reflect permanent differences between financial and tax reporting. Accordingly, during the current year, $98 has been reclassified between accumulated net realized loss from investment transactions and futures contracts and undistributed net investment income as a result of permanent differences attributable to foreign currency transactions treated as ordinary income for tax.This reclassification has no effect on net assets or net asset values per share.
2. Management Agreement and Other Transactions
Smith Barney Fund Management LLC (“SBFM”), a subsidiary of Citigroup Inc.(“Citigroup”), acts as investment manager to the Fund.The Fund pays SBFM a management fee calculated at an annual rate of 0.75% of the Fund’s average daily net assets during the Guarantee Period.The management fee is calculated daily and paid monthly.
During the year ended October 31, 2004, SBFM waived a portion of its management fee in the amount of $70,986.
Citicorp Trust Bank, fsb. (“CTB”), another subsidiary of Citigroup, acts as the Fund’s transfer agent. PFPC Inc. (“PFPC”) and Primerica Shareholder Services (“PSS”), another subsidiary of Citigroup, act as the Fund’s sub-transfer agents. CTB receives
23 Smith Barney Capital Preservation Fund | 2004 Annual Report
Notes to Financial Statements (continued)
account fees and asset-based fees that vary according to the size and type of account. PFPC and PSS are responsible for shareholder recordkeeping and financial processing for all shareholder accounts and are paid by CTB. For the year ended October 31, 2004, the Fund paid transfer agent fees of $645,240 to CTB and PSS.
Citigroup Global Markets Inc. (“CGM”) and PFS Distributors, Inc. both of which are subsidiaries of Citigroup, act as the Fund’s distributors.
On February 2, 2004, initial sales charges on Class L shares were eliminated. Effective April 29, 2004, the Fund’s Class L shares were renamed as Class C shares.
There is a maximum initial sales charges of 5.00% for Class A.There is a contingent deferred sales charge (“CDSC”) of 5.00% on Class B shares, which applies if redemption occurs within one year from purchase and declines thereafter by 1.00% per year until no CDSC is incurred. Class C shares also have a 1.00% CDSC, which applies if redemption occurs within one year from purchase. In addition, Class A shares have a 1.00% CDSC, which applies if redemption occurs within one year from purchase payment. This CDSC only applies to those purchases of Class A shares which, when combined with current holdings of Class A shares, equal or exceed $1,000,000 in the aggregate.These purchases do not incur an initial sales charge.
For the year ended October 31, 2004, CGM and its affiliates received no sales charges on sales of the Fund’s Class A and C shares. In addition, for the year ended October 31, 2004, CDSCs paid to CGM were approximately:
All officers and one Trustee of the Trust are employees of Citigroup or its affiliates and do not receive compensation from the Trust.
3. Investments
During the year ended October 31, 2004, the aggregate cost of purchases and proceeds from sales of investments (including maturities, but excluding short-term securities) were as follows:
|
| Purchases | $ | 12,857,879 |
|
| Sales | | 193,283,586 |
|
At October 31, 2004, the aggregate gross unrealized appreciation and depreciation of investments for Federal income tax purposes were as follows:
|
| Gross unrealized appreciation | $ | 25,355,733 | |
| Gross unrealized depreciation | | (4,019,987 | ) |
|
| Net unrealized appreciation | $ | 21,335,746 | |
|
At October 31, 2004, the Fund had the following open futures contracts:
| | | Number of | | Expiration | | Basis | | Market | | Unrealized |
| Contracts to Buy | | Contracts | | Date | | Value | | Value | | Gain |
|
| S & P 500 Index | | 11 | | 12/04 | | $3,103,663 | | $3,108,325 | | $4,662 |
|
24 Smith Barney Capital Preservation Fund | 2004 Annual Report
Notes to Financial Statements (continued)
4. Class Specific Expenses
Pursuant to a Rule 12b-1 Distribution Plan, the Fund pays a service fee with respect to its Class A, B, and C shares calculated at the annual rate of 0.25% of the average daily net assets of each respective class.The Fund also pays a distribution fee with respect to its Class B and C shares calculated at the annual rate of 0.75% of the average daily net assets for each class. For the year ended October 31, 2004, total Rule 12b-1 Distribution Plan fees incurred, which are accrued daily and paid monthly, were as follows:
| | Class A | Class B | Class C |
|
| Rule 12b-1 Distribution Plan Fees | $186,155 | $4,592,393 | $733,346 |
|
For the year ended October 31, 2004, total Transfer Agency Service expenses were as follows:
| | Class A | Class B | Class C |
|
| Transfer Agency Service Expenses | $ 54,457 | $ 286,732 | $ 46,607 |
|
For the year ended October 31, 2004, total Shareholder Communication expenses were as follows:
| | Class A | Class B | Class C |
|
| Shareholder Communication Expenses | $14,142 | $87,217 | $13,927 |
|
5. Distributions Paid to Shareholders by Class
| | Year Ended | Year Ended |
| | October 31, 2004 | October 31, 2003 |
|
| Net Investment Income | | | | |
| Class A | $ | 1,734,835 | $ | 1,422,983 |
| Class B | | 6,985,507 | | 5,295,810 |
| Class C | | 1,229,907 | | 1,297,157 |
|
| Total | $ | 9,950,249 | $ | 8,015,950 |
|
6. The Guarantee
Provided that all dividends and distributions received from the Fund have been reinvested and no shares have been redeemed by a shareholder, the Fund guarantees that on the Guarantee Maturity Date, as described in the prospectus, each shareholder will be entitled to redeem his or her shares for an amount no less than the value of that shareholder’s account as of the close of business on May 13, 2002, less certain expenses.The Fund’s guarantee is backed by an unconditional and irrevocable financial guarantee from Ambac Assurance Corporation (the “Guarantor”) pursuant to a financial guarantee insurance policy issued by the Guarantor for the benefit of the shareholders of the Fund. The Guarantor has earned triple-A ratings, the highest ratings available from Moody’s Investors Service, Inc., Standard & Poor’s Rating Services, a division of The McGraw-Hill Companies, Inc., and Fitch Ratings, Inc., These ratings are an essential part of the Guarantor’s ability to provide credit enhancement. The Fund pays to the Guarantor a fee equal to 0.75% of the average daily net assets of the Fund during the Guarantee Period for providing the financial guarantee insurance policy.The guarantee fees amounted to $4,552,769 for the year ended October 31, 2004. This fee is calculated daily and paid monthly. Please see the prospectus for more information relating to the guarantee arrangement.
25 Smith Barney Capital Preservation Fund | 2004 Annual Report
Notes to Financial Statements (continued)
7. Shares of Beneficial Interest
At October 31, 2004, the Trust had an unlimited number of shares of beneficial interest authorized with a par value of $0.00001 per share.The Fund has the ability to issue multiple classes of shares. Each share of a class represents an identical interest and has the same rights, except that each class bears certain direct expenses specifically related to the distribution of its shares.
Transactions in shares of each class were as follows:
| | Year Ended | Year Ended |
| | October 31, 2004 | October 31, 2003 |
|
|
| | Shares | Amount | Shares | Amount |
|
| Class A | | | | | | | | | | |
| Shares sold | 41,319 | | $ | 471,606 | | — | | | — | |
| Shares issued on reinvestment | 148,887 | | | 1,688,377 | | 123,249 | | $ | 1,376,693 | |
| Shares repurchased | (1,881,563 | ) | | (21,429,026 | ) | (2,977,944 | ) | | (34,078,203 | ) |
|
| Net Decrease | (1,691,357 | ) | $ | (19,269,043 | ) | (2,854,695 | ) | $ | (32,701,510 | ) |
|
| Class B | | | | | | | | | | |
| Shares sold | — | | | — | | — | | | — | |
| Shares issued on reinvestment | 579,061 | | $ | 6,560,763 | | 450,095 | | $ | 5,023,063 | |
| Shares repurchased | (10,773,784 | ) | | (122,158,643 | ) | (7,806,786 | ) | | (88,813,955 | ) |
|
| Net Decrease | (10,194,723 | ) | $ | (115,597,880 | ) | (7,356,691 | ) | $ | (83,790,892 | ) |
|
| Class C* | | | | | | | | | | |
| Shares sold | — | | | — | | — | | | — | |
| Shares issued on reinvestment | 100,225 | | $ | 1,135,545 | | 110,063 | | $ | 1,229,400 | |
| Shares repurchased | (3,714,673 | ) | | (42,245,824 | ) | (4,595,192 | ) | | (52,447,128 | ) |
|
| Net Decrease | (3,614,448 | ) | $ | (41,110,279 | ) | (4,485,129 | ) | $ | (51,217,728 | ) |
|
| * | Effective April 29, 2004 Class L shares were renamed as Class C shares. |
| |
8. Income Tax Information & Distributions to Shareholders
The tax character of distributions paid during the fiscal years ended October 31, were as follows:
| | 2004 | 2003 |
|
| Ordinary income | $9,950,249 | $8,015,950 |
|
As of October 31, 2004, the components of accumulated losses on a tax basis were as follows:
|
| Undistributed ordinary income | $ | 5,537,545 | |
|
| Capital loss carryforward | | (32,049,313 | )* |
| Other book/tax temporary differences | | (259,426 | )** |
| Unrealized appreciation | | 21,340,408 | *** |
|
| Total accumulated losses | $ | (5,430,786 | ) |
|
| * | On October 31, 2004, the Fund had a net capital loss carryforward of approximately $32,049,313, all of which expires in 2010. This amount will be available to offset like amounts of any future taxable gains. |
| |
| ** | Other book/tax temporary differences are attributable primarily to the realization for tax purposes of unrealized gains (losses) on certain futures contracts and other differences on the book/tax treatment of various items. |
| |
| *** | The difference between book-basis and tax-basis unrealized appreciation is attributable primarily to the tax deferral of losses on wash sales. |
| |
26 Smith Barney Capital Preservation Fund | 2004 Annual Report
Notes to Financial Statements (continued)
9. Trustee Retirement Plan
The Trustees of the Fund have adopted a Retirement Plan for all Trustees who are not “interested persons” of the Fund, within the meaning of the 1940 Act. Under the Plan, all Trustees are required to retire from the Board as of the last day of the calendar year in which the applicable Trustee attains age 75 (certain Trustees who had already attained age 75 when the Plan was adopted were required to retire effective December 31, 2003).Trustees may retire under the Plan before attaining the mandatory retirement age.Trustees who have served as Trustee of the Trust or any of the investment companies associated with Citigroup for at least ten years when they retire are eligible to receive the maximum retirement benefit under the Plan. The maximum retirement benefit is an amount equal to five times the amount of retainer and regular meeting fees payable to a Trustee during the calendar year ending on or immediately prior to the applicable Trustee’s retirement. Amounts under the Plan may be paid in installments or in a lump sum (discounted to present value). Benefits under the Plan are unfunded. Two former Trustees are currently receiving payments under the Plan. In addition, two other former Trustees elected to receive a lump sum payment under the Plan during this period.The Fund’s allocable share of the expenses of the Plan for the period ended October 31, 2004 and the related liability at October 31, 2004 was $10,673.
10. Additional Information
In connection with an investigation previously disclosed by Citigroup, the Staff of the Securities and Exchange Commission (“SEC”) has notified Citigroup Asset Management (“CAM”), the Citigroup business unit that includes the Fund’s investment manager and other investment advisory companies; Citicorp Trust Bank (“CTB”), an affiliate of CAM;Thomas W. Jones, the former CEO of CAM; and three other individuals, one of whom is an employee and the other two of whom are former employees of CAM, that the SEC Staff is considering recommending a civil injunctive action and/or an administrative proceeding against each of them relating to the creation and operation of an internal transfer agent unit to serve various CAM-managed funds.
In 1999, CTB entered the transfer agent business. CTB hired an unaffiliated subcontractor to perform some of the transfer agent services. The subcontractor, in exchange, had signed a separate agreement with CAM in 1998 that guaranteed investment management revenue to CAM and investment banking revenue to a CAM affiliate.The subcontractor’s business was later taken over by PFPC Inc., and at that time the revenue guarantee was eliminated and a one-time payment was made by the subcontractor to a CAM affiliate.
CAM did not disclose the revenue guarantee when the boards of various CAM-managed funds hired CTB as transfer agent. Nor did CAM disclose to the boards of the various CAM-managed funds the one-time payment received by the CAM affiliate when it was made.
In addition, the SEC Staff has indicated that it is considering recommending action based on the adequacy of the disclosures made to the fund boards that approved the transfer agency arrangement, CAM’s initiation and operation of, and compensation for, the transfer agent business and CAM’s retention of, and agreements with, the subcontractor.
Citigroup is cooperating fully in the investigation and will seek to resolve the matter in discussions with the SEC Staff.
Although there can be no assurance, Citigroup does not believe that this matter will have a material adverse effect on the Fund. As previously disclosed, CAM has already agreed to pay the applicable funds, primarily through fee waivers, a total of approximately $17 million (plus interest) that is the amount of the revenue received by Citigroup relating to the revenue guarantee.
27 Smith Barney Capital Preservation Fund | 2004 Annual Report
Notes to Financial Statements (continued)
11. Legal Matters
Beginning in June, 2004, class action lawsuits alleging violations of the federal securities laws were filed against Citigroup Global Markets Inc. (the “Distributor”) and a number of its affiliates, including Smith Barney Fund Management LLC and Salomon Brothers Asset Management Inc (the “Advisers”), substantially all of the mutual funds managed by the Advisers, including the Fund, and directors or trustees of the Funds (collectively, the “Defendants”). The complaints alleged, among other things, that the Distributor created various undisclosed incentives for its brokers to sell Smith Barney and Salomon Brothers funds. In addition, according to the complaints, the Advisers caused the Funds to pay excessive brokerage commissions to the Distributor for steering clients towards proprietary funds. The complaints also alleged that the defendants breached their fiduciary duty to the Funds by improperly charging Rule 12b-1 fees and by drawing on fund assets to make undisclosed payments of soft dollars and excessive brokerage commissions.The complaints also alleged that the Funds failed to adequately disclose certain of the allegedly wrongful conduct.The complaints sought injunctive relief and compensatory and punitive damages, rescission of the Funds’ contracts with the Advisers, recovery of all fees paid to the Advisers pursuant to such contracts and an award of attorneys’ fees and litigation expenses.
On December 15, 2004, a consolidated amended complaint (the “Complaint”) was filed alleging substantially similar causes of action.While the lawsuit is in its earliest stages, to the extent that the Complaint purports to state causes of action against the Funds, Citigroup Asset Management believes the Funds have significant defenses to such allegations, which the Funds intend to vigorously assert in responding to the Complaint.
Additional lawsuits arising out of these circumstances and presenting similar allegations and requests for relief may be filed against the Defendants in the future.
As of the date of this report, Citigroup Asset Management and the Funds believe that the resolution of the pending lawsuit will not have a material effect on the financial position or results of operations of the Funds or the ability of the Advisers and their affiliates to continue to render services to the Funds under their respective contracts.
28 Smith Barney Capital Preservation Fund | 2004 Annual Report
Report of Independent Registered Public Accounting Firm
To the Shareholders and Board of Trustees
of Smith Barney Trust II:
We have audited the accompanying statement of assets and liabilities, including the schedule of investments, of Smith Barney Capital Preservation Fund of Smith Barney Trust II (the “Trust”) as of October 31, 2004, and the related statement of operations for the year then ended, the statements of changes in net assets for each of the years in the two-year period then ended, and the financial highlights for each of the years in the two-year period then ended and for the period April 3, 2002 (commencement of operations) through October 31, 2002.These financial statements and financial highlights are the responsibility of the Trust’s management. Our responsibility is to express an opinion on these financial statements and financial highlights based on our audits.
We conducted our audits in accordance with the standards of the Public Company Accounting Oversight Board (United States).Those standards require that we plan and perform the audit to obtain reasonable assurance about whether the financial statements and financial highlights are free of material misstatement. An audit includes examining, on a test basis, evidence supporting the amounts and disclosures in the financial statements. Our procedures included confirmation of securities owned as of October 31, 2004, by correspondence with the custodian and brokers. An audit also includes assessing the accounting principles used and significant estimates made by management, as well as evaluating the overall financial statement presentation.We believe that our audits provide a reasonable basis for our opinion.
In our opinion, the financial statements and financial highlights referred to above present fairly, in all material respect, the financial position of Smith Barney Capital Preservation Fund as of October 31, 2004, and the results of its operations for the year then ended, the statements of changes in its net assets for each of the years in the two-year period then ended, and financial highlights for each of the years in the two year period then ended and for the period April 3, 2002 through October 31, 2002, in conformity with U.S. generally accepted accounting principles.
/s/ KPMG LLP
New York, New York
December 17, 2004
29 Smith Barney Capital Preservation Fund | 2004 Annual Report
Additional Information (unaudited)
Information about Trustees and Officers
The business and affairs of the Smith Barney Capital Preservation Fund (“Fund”) are managed under the direction of the Fund’s Board of Trustees. Information pertaining to the Trustees and officers of the Fund is set forth below.The Statement of Additional Information includes additional information about the Trustees and is available, without charge, upon request by calling the Fund’s transfer agent (Citicorp Trust Bank, fsb. at 1-800-451-2010) or the Fund’s sub-transfer agents (PFPC at 1-800-451-2010 and Primerica Shareholder Services at 1-800-544-5445.
| | | | | Term of | | | | Number of | | | |
| | | | | Office* and | | | | Portfolios In | | | |
| | | | | Length | | | | Fund Complex | | Other Board | |
| | | Position(s) Held | | of Time | | Principal Occupation(s) | | Overseen by | | Memberships | |
| Name, Address and Age | | with Fund | | Served | | During Past Five Years | | Trustee | | Held by Trustee | |
|
| Non-Interested Trustees: | | | | | | | | | | | |
| |
| Elliott J. Berv | | Trustee | | Since | | Executive Vice President | | 36 | | Board Member, | |
| c/o R. Jay Gerken | | | | 2001 | | and Chief Operations Officer, | | | | American Identity Corp. | |
| Citigroup Asset Management | | | | | | DigiGym Systems (on-line | | | | (doing business as | |
| (“CAM”) | | | | | | personal training systems) (since | | | | Morpheus Technologies) | |
| 399 Park Avenue | | | | | | 2001); Chief Executive Officer, | | | | (biometric information | |
| New York, NY 10022 | | | | | | Rocket City Enterprises (internet | | | | management) (since | |
| DOB: 4/30/43 | | | | | | service company) (from 2000 | | | | 2001; consultant since | |
| | | | | | | to 2001); President, Catalyst | | | | 1999); Director, Lapoint | |
| | | | | | | (consulting) (since 1984). | | | | Industries (industrial | |
| | | | | | | | | | | filter company) (since | |
| | | | | | | | | | | 2002); Director, | |
| | | | | | | | | | | Alzheimer’s Association | |
| | | | | | | | | | | (New England Chapter) | |
| | | | | | | | | | | (since 1998). | |
| | | | | | | | | | | | |
| Donald M. Carlton | | Trustee | | Since | | Consultant, URS Corporation | | 31 | | Director, Temple-Island | |
| c/o R. Jay Gerken | | | | 2001 | | (engineering) (since 1999); | | | | (forest products) | |
| CAM | | | | | | former Chief Executive Officer, | | | | since 2003; | |
| 399 Park Avenue | | | | | | Radian International LLC | | | | American | |
| New York, NY 10022 | | | | | | (engineering) (from 1996 to | | | | Electric Power Co. | |
| DOB: 7/20/37 | | | | | | 1998), Member of Management | | | | (electric utility) (since | |
| | | | | | | Committee, Signature Science | | | | 1999); Director, Valero | |
| | | | | | | (research and development) | | | | Energy (petroleum | |
| | | | | | | (since 2000). | | | | refining) (since 1999); | |
| | | | | | | | | | | Director, National | |
| | | | | | | | | | | Instruments Corp. | |
| | | | | | | | | | | (technology) (since | |
| | | | | | | | | | | 1994). | |
| | | | | | | | | | | | |
| A. Benton Cocanougher | | Trustee | | Since | | Interim Chancellor, Texas A&M | | 31 | | None | |
| c/o R. Jay Gerken | | | | 2001 | | University System (since 2003); | | | | | |
| CAM | | | | | | former Special Advisor to the | | | | | |
| 399 Park Avenue | | | | | | President, Texas A&M University | | | | | |
| New York, NY 10022 | | | | | | (2002 to 2003); former Dean | | | | | |
| DOB: 7/6/38 | | | | | | Emeritus and Wiley Professor, | | | | | |
| | | | | | | Texas A&M University (since | | | | | |
| | | | | | | 2001); former Dean and | | | | | |
| | | | | | | Professor of Marketing, College | | | | | |
| | | | | | | and Graduate School of | | | | | |
| | | | | | | Business of Texas A&M | | | | | |
| | | | | | | University (from 1987 to 2001) | | | | | |
30 Smith Barney Capital Preservation Fund | 2004 Annual Report
Additional Information (unaudited) (continued)
| | | | | Term of | | | | Number of | | | |
| | | | | Office* and | | | | Portfolios In | | | |
| | | | | Length | | | | Fund Complex | | Other Board | |
| | | Position(s) Held | | of Time | | Principal Occupation(s) | | Overseen by | | Memberships | |
| Name, Address and Age | | with Fund | | Served | | During Past Five Years | | Trustee | | Held by Trustee | |
|
| Mark T. Finn | | Trustee | | Since | | Adjunct Professor, William & | | 36 | | Former President and | |
| c/o R. Jay Gerken | | | | 2001 | | Mary College (since September | | | | Director, Delta Financial, | |
| CAM | | | | | | 2002); Principal/member, Belvan | | | | Inc. (investment advisory | |
| 399 Park Avenue | | | | | | Partners/Balfour Vantage – Manager | | | | firm) (from 1983 to | |
| New York, NY 10022 | | | | | | and General Partner to the | | | | 1999). | |
| DOB: 5/16/43 | | | | | | Vantage Hedge Fund, LP (since | | | | | |
| | | | | | | March 2002); Chairman and | | | | | |
| | | | | | | Owner, Vantage Consulting Group, | | | | | |
| | | | | | | Inc. (investment advisory and | | | | | |
| | | | | | | consulting firm) (since 1988); | | | | | |
| | | | | | | former Vice Chairman and Chief | | | | | |
| | | | | | | Operating Officer, Lindner Asset | | | | | |
| | | | | | | Management Company (mutual | | | | | |
| | | | | | | fund company) (from March 1999 | | | | | |
| | | | | | | to 2001); former General Partner | | | | | |
| | | | | | | and Shareholder, Greenwich | | | | | |
| | | | | | | Ventures, LLC (investment | | | | | |
| | | | | | | partnership) (from 1996 to 2001); | | | | | |
| | | | | | | former President, Secretary, and | | | | | |
| | | | | | | Owner, Phoenix Trading Co. | | | | | |
| | | | | | | (commodity trading advisory firm) | | | | | |
| | | | | | | (from 1997 to 2000). | | | | | |
| |
| Stephen Randolph Gross | | Trustee | | Since | | Chief Executive Officer, HLB Gross | | 31 | | Director, United Telesis, | |
| c/o R. Jay Gerken | | | | 2001 | | Collins, P.C. (accounting firm) | | | | Inc. (telecommunications) | |
| CAM | | | | | | (since 1979); Partner, Capital | | | | (since 1997); Director, | |
| 399 Park Avenue | | | | | | Investment Advisory Partners | | | | eBank.com, Inc. (1997- | |
| New York, NY 10022 | | | | | | (consulting) (2000 to 2002); | | | | 2004); Director, Andersen | |
| DOB: 10/8/47 | | | | | | former Chief Operating Officer, | | | | Calhoun, Inc. (assisted | |
| | | | | | | General Media Communications, Inc. | | | | living) (since 1987); | |
| | | | | | | (from March 2003 to August 2003); | | | | former Director, Charter | |
| | | | | | | former Managing Director, | | | | Bank, Inc. (from 1987 to | |
| | | | | | | Fountainhead Ventures, LLC | | | | 1997); former Director, | |
| | | | | | | (consulting) (from 1998 to 2003); | | | | Yu Save, Inc. (internet | |
| | | | | | | former Secretary, Carint N.A. | | | | company) (from 1998 to | |
| | | | | | | (manufacturing) (1988-2002); | | | | 2000); former Director, | |
| | | | | | | former Treasurer, Hank Aaron | | | | Hotpalm, Inc. (wireless | |
| | | | | | | Enterprises (fast food franchise) | | | | applications) (from 1998 | |
| | | | | | | (from 1985 to 2001); Treasurer, | | | | to 2000). | |
| | | | | | | Coventry Limited, Inc. (since 1985). | | | | | |
| |
| Diana R. Harrington | | Trustee | | Since | | Professor, Babson College | | 36 | | None | |
| c/o R. Jay Gerken | | | | 1992 | | (since 1993). | | | | | |
| CAM | | | | | | | | | | | |
| 399 Park Avenue | | | | | | | | | | | |
| New York, NY 10022 | | | | | | | | | | | |
| DOB: 3/25/40 | | | | | | | | | | | |
| | | | | | | | | | | | |
| Susan B. Kerley | | Trustee | | Since | | Consultant, Strategic Management | | 36 | | Director, Eclipse Funds | |
| c/o R. Jay Gerken | | | | 1992 | | Advisors, LLC/Global Research | | | | (currently supervises 12 | |
| CAM | | | | | | Associates, Inc. (investment | | | | investment companies | |
| 399 Park Avenue | | | | | | consulting) (since 1990). | | | | in fund complex) (since | |
| New York, NY 10022 | | | | | | | | | | 1990). | |
| DOB: 8/12/51 | | | | | | | | | | | |
31 Smith Barney Capital Preservation Fund | 2004 Annual Report
Additional Information (unaudited) (continued)
| | | | | Term of | | | | Number of | | |
| | | | | Office* and | | | | Portfolios In | | |
| | | | | Length | | | | Fund Complex | | Other Board |
| | | Position(s) Held | | of Time | | Principal Occupation(s) | | Overseen by | | Memberships |
| Name, Address and Age | | with Fund | | Served | | During Past Five Years | | Trustee | | Held by Trustee |
|
| Alan G. Merten | | Trustee | | Since 2001 | | President, George Mason | | 31 | | Former Director, Comshare, |
| c/o R. Jay Gerken | | | | | | University (since 1996). | | | | Inc. (information |
| CAM | | | | | | | | | | technology) (since 1985 |
| 399 Park Avenue | | | | | | | | | | to 2003); Director |
| New York, NY 10022 | | | | | | | | | | DigitalNet Holding Inc. |
| DOB: 12/27/41 | | | | | | | | | | (since 2003). |
| | | | | | | | | | | |
| R. Richardson Pettit | | Trustee | | Since | | Professor of Finance, University | | 31 | | None |
| c/o R. Jay Gerken | | | | 2001 | | of Houston (from 1977 to 2002); | | | | |
| CAM | | | | | | independent consultant | | | | |
| 399 Park Avenue | | | | | | (since 1984). | | | | |
| New York, NY 10022 | | | | | | | | | | |
| DOB: 7/6/42 | | | | | | | | | | |
| | | | | | | | | | | |
| Interested Trustee: | | | | | | | | | | |
| |
| R. Jay Gerken, CFA* | | Chairman, | | Since | | Managing Director of Citigroup | | 221 | | N/A |
| CAM | | President, | | 2002 | | Global Markets (“CGM”) | | | | |
| 399 Park Avenue | | and Chief | | | | (since 1996) Chairman, President, | | | | |
| New York, NY 10022 | | Executive | | | | and Chief Executive Officer of | | | | |
| DOB: 4/5/51 | | Officer | | | | Smith Barney Fund Management | | | | |
| | | | | | | LLC (“SBFM”), Travelers Investment | | | | |
| | | | | | | Advisers, Inc. (“TIA”) and Citi Fund | | | | |
| | | | | | | Management Inc. (“CFM”); | | | | |
| | | | | | | President and Chief Executive | | | | |
| | | | | | | Officer of certain mutual funds | | | | |
| | | | | | | associated with Citigroup Inc. | | | | |
| | | | | | | (“Citigroup”); formerly, Portfolio | | | | |
| | | | | | | Manager of Smith Barney Allocation | | | | |
| | | | | | | Series Inc. (from 1996 to 2001) and | | | | |
| | | | | | | Smith Barney Growth and Income | | | | |
| | | | | | | Fund (from 1996 to 2000). | | | | |
| | | | | | | | | | | |
| Officers: | | | | | | | | | | |
| |
| Andrew B. Shoup | | Senior | | Since | | Director of CAM; Chief | | N/A | | N/A |
| CAM | | Vice President | | 2003 | | Administrative Officer of mutual | | | | |
| 125 Broad Street | | and Chief | | | | funds associated with Citigroup | | | | |
| New York, NY 10004 | | Administrative | | | | Inc.; Head of International Funds | | | | |
| DOB: 8/1/56 | | Officer | | | | Administration of CAM (from | | | | |
| | | | | | | 2001 to 2003); Director of Global | | | | |
| | | | | | | Funds Administration of CAM | | | | |
| | | | | | | (from 2000 to 2001); Head of U.S. | | | | |
| | | | | | | Citibank Funds Administration | | | | |
| | | | | | | of CAM (from 1998 to 2000). | | | | |
32 Smith Barney Capital Preservation Fund | 2004 Annual Report
Additional Information (unaudited) (continued)
| | | | | Term of | | | | Number of | | |
| | | | | Office* and | | | | Portfolios In | | |
| | | | | Length | | | | Fund Complex | | Other Board |
| | | Position(s) Held | | of Time | | Principal Occupation(s) | | Overseen by | | Memberships |
| Name, Address and Age | | with Fund | | Served | | During Past Five Years | | Trustee | | Held by Trustee |
|
| Frances M. Guggino | | Chief | | Since | | Vice President of CAM, Chief | | N/A | | N/A |
| CAM | | Financial | | 2004 | | Financial Officer and Treasurer | | | | |
| 125 Broad Street | | Officer | | | | of certain mutual funds associated | | | | |
| New York, NY 10004 | | and | | | | with Citigroup; Controller of | | | | |
| DOB: 9/8/57 | | Treasurer | | | | certain mutual funds associated | | | | |
| | | | | | | with Citigroup. | | | | |
| |
| Andrew Beagley | | Chief | | Since | | Director of CGM (since 2000); | | N/A | | N/A |
| CAM | | Anti-Money | | 2002 | | Director of Compliance North America, | | | | |
| 399 Park Avenue | | Laundering | | | | CAM (since 2000); Chief Anti-Money | | | | |
| 4th Floor | | Compliance | | | | Laundering Compliance Officer, Chief | | | | |
| New York, NY 10022 | | Officer | | | | Compliance Officer and Vice President | | | | |
| DOB: 10/9/62 | | | | | | of certain mutual funds associated | | | | |
| | | Chief | | Since | | with Citigroup; Director of Compliance, | | | | |
| | | Compliance | | 2004 | | Europe, the Middle East and Africa, | | | | |
| | | Officer | | | | Citigroup Asset Management (from | | | | |
| | | | | | | 1999 to 2000); Compliance | | | | |
| | | | | | | Officer, SBFM, CFM, TIA Salomon | | | | |
| | | | | | | Brothers Asset Management Limited, Smith | | |
| | | | | | | Barney Global Capital Management Inc., | | | | |
| | | | | | | Salomon Brothers Asset Management | | | | |
| | | | | | | Asia Pacific Limited (from 1997 to 1999) | | | | |
| |
| Wendy S. Setnicka | | Controller | | Since | | Vice President of CGM; | | N/A | | N/A |
| CAM | | | | 2004 | | Controller of certain mutual funds | | | | |
| 125 Broad Street | | | | | | associated with Citigroup. | | | | |
| New York, NY 10004 | | | | | | | | | | |
| DOB: 6/30/64 | | | | | | | | | | |
| |
| Robert I. Frenkel | | Secretary and | | Since | | Managing Director and General | | N/A | | N/A |
| CAM | | Chief Legal | | 2000 | | Counsel, Global Mutual Funds | | | | |
| 300 First Stamford Place | | Officer | | Since | | for CAM (since 1994); Secretary | | | | |
| Stamford, CT 06902 | | | | 2003 | | of certain mutual funds | | | | |
| DOB: 12/12/54 | | | | | | associated with Citigroup Inc.; | | | | |
| | | | | | | Chief Legal Officer of mutual | | | | |
| | | | | | | funds associated with Citigroup Inc. | | | | |
|
| * | Each Director and officer serves until his or her successor has been duly elected and qualifed. |
| |
| ** | Mr. Gerken is an “interested person” of the Fund as defined in the Investment Company Act of 1940, as amended, because Mr. Gerken is an officer of SBFM and certain of its affiliates. |
| |
33 Smith Barney Capital Preservation Fund | 2004 Annual Report
Important Tax Information (unaudited)
The following information is provided with respect to the ordinary income distributions paid by Smith Barney Capital Preservation Fund during the taxable year ended October 31, 2004:
| Record Date: | | 12/15/2003 |
| Payable Date: | | 12/17/2003 |
| Qualified Dividend Income for Individuals | | 8.13% |
| Dividends Qualifying for the Dividends Received Deduction for Corporations | | 8.42% |
| Interest from Federal Obligations | | 100.00% |
The law varies in each State as to whether and what percentage of dividend income attributable to Federal obligations is exempt from State income tax. We recommend that you consult with your Tax adviser to determine if any portion of the dividends you received is exempt from state income taxes.
Please retain this information for your records.
34 Smith Barney Capital Preservation Fund | 2004 Annual Report
SMITH BARNEY
CAPITAL PRESERVATION FUND
| | | | |
| | TRUSTEES | | INVESTMENT MANAGER |
| | Elliott J. Berv | | Smith Barney Fund |
| | Donald M. Carlton | | Management LLC |
| | A. Benton Cocanougher | | |
| | Mark T. Finn | | DISTRIBUTOR |
| | R. Jay Gerken, CFA* | | Citigroup Global Markets Inc. |
| | Chairman | | PFS Distributors, Inc. |
| | Stephen Randolph Gross | | |
| | Diana R. Harrington | | CUSTODIAN |
| | Susan B. Kerley | | State Street Bank |
| | Alan G. Merten | | andTrust Company |
| | R. Richardson Pettit | | |
| | | | TRANSFER AGENT |
| | OFFICERS* | | Citicorp Trust Bank, fsb. |
| | R. Jay Gerken, CFA | | 125 Broad Street, 11th Floor |
| | President and | | New York, New York 10004 |
| | Chief Executive Officer | | |
| | | | SUB-TRANSFER AGENT |
| | Andrew B. Shoup | | PFPC Inc. |
| | Senior Vice President and | | P.O. Box 9699 |
| | Chief Administrative Officer | | Providence, Rhode Island |
| | | | 02940-9699 |
| | Frances M. Guggino | | |
| | Chief Financial Officer | | Primerica Shareholder Services |
| | and Treasurer | | P.O. Box 9662 |
| | | | Providence, Rhode Island |
| | Andrew Beagley | | 02940-9662 |
| | Chief Anti-Money Laundering | | |
| | Compliance Officer and | | |
| | Chief Compliance Officer | | |
| | | | |
| | Wendy S. Setnicka | | |
| | Controller | | |
| | | | |
| | Robert I. Frenkel | | |
| | Secretary and Chief Legal Officer | | |
| |
| | |
| | * Affiliated Person of | | |
| | Investment Manager | | |
| | | | |
Smith Barney Trust II
| | | | |
Smith Barney Capital Preservation Fund
The fund is a separate investment fund of Smith Barney Trust II,
a Massachusetts business trust. | | This report is submitted for the general information of shareholders of Smith Barney Trust II — Smith Barney Capital Preservation Fund. SMITH BARNEY CAPITAL PRESERVATION FUND
Smith Barney Mutual Funds
125 Broad Street
10th Floor, MF-2
New York, New York 10004 |
| | | | |
The Fund files its complete schedule of portfolio holdings with Securities Exchange Commission for the first and third quarters of each fiscal year on Form N-Q. The Fund’s Forms N-Q are available on the Commission’s website at www.sec.gov. The Fund’s Forms N-Q may be reviewed and copied at the Commission’s Public Reference Room in Washington D.C., and information on the operation of the Public Reference Room may be obtained by calling 1-800-SEC-0330. To obtain information on Form N-Q from the Fund, shareholders can call 1-800-451-2010. Information on how the fund voted proxies relating to portfolio securities during the 12 month period ended June 30, 2004 and a description of the policies and procedures that the fund uses to determine how to vote proxies relating to portfolio securities is available (1) without charge, upon request, by calling 1-800-451-2010, (2) on the fund’s website at www.citigroupAM.com and (3) on the SEC’s website at www.sec.gov. | | ©2004 Citigroup Global Markets Inc.
Member NASD, SIPC
FD02664 12/04 | 04-7576 |
| ITEM 2. | | CODE OF ETHICS. |
| | | |
| | | The registrant has adopted a code of ethics that applies to the registrant’s principal executive officer, principal financial officer, principal accounting officer or controller. |
| | | |
| ITEM 3. | | AUDIT COMMITTEE FINANCIAL EXPERT. |
| | | |
| | | The Board of Directors of the registrant has determined that Robert A. Frankel, the Chairman of the Board’s Audit Committee, possesses the technical attributes identified in Instruction 2(b) of Item 3 to Form N-CSR to qualify as an “audit committee financial expert,” and has designated Mr. Frankel as the Audit Committee’s financial expert. Mr. Frankel is an “independent” Director pursuant to paragraph (a)(2) of Item 3 to Form N-CSR. |
| | | |
| ITEM 4. | | PRINCIPAL ACCOUNTANT FEES AND SERVICES. |
| | | | |
| | | (a)
| Audit Fees for the Smith Barney Trust II were $71,000 and $64,000 for the years ended 10/31/04 and 10/31/03, respectively.
|
| | | (b)
| Audit-Related Fees for the Smith Barney Trust II were $0 and $46,000 for the years ended 10/31/04 and 10/31/03.
|
| | | (c)
| Tax Fees for Smith Barney Trust II of $7,000 and $7,000 for the years ended 10/31/04 and 10/31/03. These amounts represent aggregate fees paid for tax compliance, tax advice and tax planning services, which include (the filing and amendment of federal, state and local income tax returns, timely RIC qualification review and tax distribution and analysis planning) rendered by the Accountant to Smith Barney Trust II.
|
| | | (d)
| All Other Fees for Smith Barney Trust II of $0 and $0 for the years ended 10/31/04 and 10/31/03.
|
| | | (e)
| (1) Audit Committee’s pre–approval policies and procedures described in paragraph (c) (7) of Rule 2-01 of Regulation S-X.
|
| | | | The Charter for the Audit Committee (the “Committee”) of the Board of each registered investment company (the “Fund”) advised by Smith Barney Fund Management LLC or Salomon Brothers Asset Management Inc. or one of their affiliates (each, an “Adviser”) requires that the Committee shall approve (a) all audit and permissible non-audit services to be provided to the Fund and (b) all permissible non-audit services to be provided by the Fund’s independent auditors to the Adviser and any Covered Service Providers if the engagement relates directly to the operations and financial reporting of the Fund. The Committee may implement policies and procedures by which such services are approved other than by the full Committee.
|
| | | | The Committee shall not approve non-audit services that the Committee believes may impair the independence of the auditors. As of the date of the approval of this Audit Committee Charter, permissible non-audit services include any professional services (including tax services), that are not prohibited services as described below, provided to the Fund by the independent auditors, other than those provided to the Fund in connection with an audit or a review of the financial statements of the Fund. Permissible non-audit services may not include: (i) bookkeeping or other services related to the accounting records or financial statements of the Fund; (ii) financial information systems design and implementation; (iii) appraisal or valuation services, fairness opinions or contribution-in-kind reports; (iv) actuarial services; (v) internal audit outsourcing services; (vi) management functions or human resources; (vii) broker or dealer, investment adviser or investme nt banking services; (viii) legal services and expert services unrelated to the audit; and (ix) any other service the Public Company Accounting Oversight Board determines, by regulation, is impermissible.
|
| | | | Pre-approval by the Committee of any permissible non-audit services is not required so long as: (i) the aggregate amount of all such permissible non-audit services provided to the Fund, the Adviser and any service providers controlling, controlled by or under common control with the Adviser that provide ongoing services to the Fund (“Covered Service Providers”) constitutes not more than 5% of the total amount of revenues paid to the independent auditors during the fiscal year in which the permissible non-audit services are provided to (a) the Fund, (b) the Adviser and (c) any entity controlling, controlled by or under common control with the Adviser that provides ongoing services to the Fund during the fiscal year in which the services are provided that would have to be approved by the Committee; (ii) the permissible non-audit services were not recognized by the Fund at the time of the engagement to be non-audit services; and (iii) such services ar e promptly brought to the attention of the Committee and approved by the Committee (or its delegate(s)) prior to the completion of the audit. |
| | | | |
| | | | (2) For the Smith Barney Trust II, the percentage of fees that were approved by the audit committee, with respect to: Audit-Related Fees were 100% and 100% for the years ended 10/31/04 and 10/31/03; Tax Fees were 100% and 100% for the years ended 10/31/04 and 10/31/03; and Other Fees were 100% and 100% for the years ended 10/31/04 and 10/31/03.
|
| | | (f)
| N/A
|
| | | (g)
| Non-audit fees billed by the Accountant for services rendered to Smith Barney Trust II and CAM and any entity controlling, controlled by, or under common control with CAM that provides ongoing services to Smith Barney Trust II were $0 and $0 for the years ended 10/31/04 and 10/31/03.
|
| | | (h)
| Yes. The Smith Barney Trust II’s Audit Committee has considered whether the provision of non-audit services that were rendered to Service Affiliates which were not pre-approved (not requiring pre-approval) is compatible with maintaining the Accountant's independence. All services provided by the Accountant to the Smith Barney Trust II or to Service Affiliates which were required to be pre-approved were pre-approved as required.
|
| ITEM 5. | AUDIT COMMITTEE OF LISTED REGISTRANTS. |
| | |
| Not applicable. |
| | |
| ITEM 6. | [RESERVED] |
| | |
| ITEM 7. | DISCLOSURE OF PROXY VOTING POLICIES AND PROCEDURES FOR CLOSED-END |
| | |
| MANAGEMENT INVESTMENT COMPANIES. |
| | |
| Not applicable. |
| | |
| ITEM 8. | [RESERVED] |
| | |
| ITEM 9. | SUBMISSION OF MATTERS TO A VOTE OF SECURITY HOLDERS. |
| | |
| Not applicable. |
|
| ITEM 10. | CONTROLS AND PROCEDURES. |
| | |
| | (a) | The registrant’s principal executive officer and principal financial officer have concluded that the registrant’s disclosure controls and procedures (as defined in Rule 30a- 3(c) under the Investment Company Act of 1940, as amended (the “1940 Act”)) are effective as of a date within 90 days of the filing date of this report that includes the disclosure required by this paragraph, based on their evaluation of the disclosure controls and procedures required by Rule 30a-3(b) under the 1940 Act and 15d-15(b) under the Securities Exchange Act of 1934. |
| |
| | (b) | There were no changes in the registrant’s internal control over financial reporting (as defined in Rule 30a-3(d) under the 1940 Act) that occurred during the registrant’s last fiscal half-year (the registrant’s second fiscal half-year in the case of an annual report) that have materially affected, or are likely to materially affect the registrant’s internal control over financial reporting. |
| |
| ITEM 11. | EXHIBITS. |
| | | |
| | (a) | Code of Ethics attached hereto. |
| | |
| | Exhibit 99.CODE ETH |
| | | |
| | (b) | Attached hereto. |
| | | |
| | Exhibit 99.CERT | Certifications pursuant to section 302 of the Sarbanes-Oxley Act of 2002 |
| | | |
| | Exhibit 99.906CERT | Certifications pursuant to Section 906 of the Sarbanes-Oxley Act of 2002 |
SIGNATURES
Pursuant to the requirements of the Securities Exchange Act of 1934 and the Investment Company Act of 1940, the registrant has duly caused this Report to be signed on its behalf by the undersigned, there unto duly authorized.
Smith Barney Trust II
| By: | | /s/ R. Jay Gerken |
| | | R. Jay Gerken |
| | | Chief Executive Officer of |
| | | Smith Barney Trust II |
| | | |
| Date: | | January 7, 2005 |
Pursuant to the requirements of the Securities Exchange Act of 1934 and the Investment Company Act of 1940, this report has been signed below by the following persons on behalf of the registrant and in the capacities and on the dates indicated.
| By: | | /s/ R. Jay Gerken |
| | | (R. Jay Gerken) |
| | | Chief Executive Officer of |
| | | Smith Barney Trust II |
| |
| Date: | | January 7, 2005 |
| |
| By: | | /s/ Frances M. Guggino |
| | | (Frances M. Guggino) |
| |
| | | Chief Financial Officer of |
| | | Smith Barney Trust II |
| | | |
| Date: | | January 7, 2005 |