UNITED STATES
SECURITIES AND EXCHANGE COMMISSION
Washington, D.C. 20549
FORM N-CSR
CERTIFIED SHAREHOLDER REPORT OF REGISTERED
MANAGEMENT INVESTMENT COMPANIES
Investment Company Act file number 811-04008
Fidelity Investment Trust
(Exact name of registrant as specified in charter)
245 Summer St., Boston, Massachusetts 02210
(Address of principal executive offices) (Zip code)
Cynthia Lo Bessette, Secretary
245 Summer St.
Boston, Massachusetts 02210
(Name and address of agent for service)
Registrant's telephone number, including area code:
617-563-7000
Date of fiscal year end: | October 31 |
Date of reporting period: | October 31, 2022 |
Item 1.
Reports to Stockholders


Contents
Board Approval of Investment Advisory Contracts and Management Fees |
| Average Annual Total Returns | |||
Periods ended October 31, 2022 | Past 1 year | Past 5 years | Past 10 years |
| Class A (incl.5.75% sales charge) | -12.40% | 4.77% | 4.28% |
| Class M (incl.3.50% sales charge) | -10.57% | 4.96% | 4.22% |
Class C (incl. contingent deferred sales charge) | -8.68% | 5.22% | 4.29% |
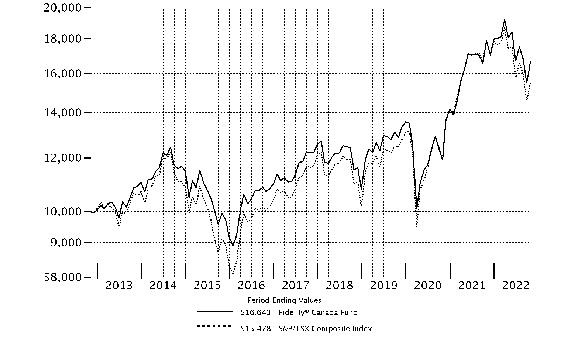
| Fidelity® Canada Fund | -6.77% | 6.35% | 5.23% |
| Class I | -6.74% | 6.40% | 5.26% |
| Class Z | -6.66% | 6.49% | 5.30% |
| $10,000 Over 10 Years |
Let's say hypothetically that $10,000 was invested in Fidelity® Canada Fund, a class of the fund, on October 31, 2012. The chart shows how the value of your investment would have changed, and also shows how the S&P/TSX Composite Index performed over the same period. |
 |
Top Holdings (% of Fund's net assets) | ||
| Royal Bank of Canada (Banks) | 8.3 | |
| The Toronto-Dominion Bank (Banks) | 8.1 | |
| Canadian Pacific Railway Ltd. (Road & Rail) | 6.8 | |
| Canadian Natural Resources Ltd. (Oil, Gas & Consumable Fuels) | 5.6 | |
| Alimentation Couche-Tard, Inc. Class A (multi-vtg.) (Food & Staples Retailing) | 5.4 | |
| Suncor Energy, Inc. (Oil, Gas & Consumable Fuels) | 4.9 | |
| Nutrien Ltd. (Chemicals) | 3.9 | |
| Brookfield Asset Management, Inc. (Canada) Class A (Capital Markets) | 3.9 | |
| Franco-Nevada Corp. (Metals & Mining) | 3.7 | |
| Constellation Software, Inc. (Software) | 3.4 | |
| 54.0 | ||
| Market Sectors (% of Fund's net assets) | ||
| Financials | 28.3 | |
| Energy | 18.1 | |
| Industrials | 14.5 | |
| Materials | 12.3 | |
| Consumer Staples | 8.7 | |
| Information Technology | 6.1 | |
| Consumer Discretionary | 6.0 | |
| Communication Services | 4.2 | |
| Health Care | 0.7 | |
| Real Estate | 0.5 | |
Asset Allocation (% of Fund's net assets) |
 |
Foreign investments - 99.4% |
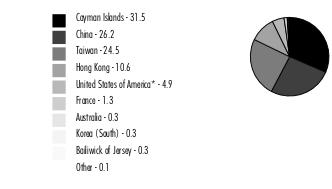
Geographic Diversification (% of Fund's net assets) |
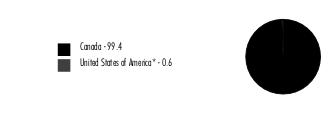 |
* Includes Short-Term investments and Net Other Assets (Liabilities). Percentages are based on country or territory of incorporation and are adjusted for the effect of futures contracts, if applicable. |
| Common Stocks - 99.0% | |||
| Shares | Value ($) | ||
| COMMUNICATION SERVICES - 3.9% | |||
| Diversified Telecommunication Services - 2.2% | |||
| TELUS Corp. | 953,000 | 19,901,530 | |
| Interactive Media & Services - 0.1% | |||
| VerticalScope Holdings, Inc. (a) | 80,400 | 427,864 | |
| Media - 0.1% | |||
| Quebecor, Inc. Class A | 57,400 | 1,086,612 | |
| Wireless Telecommunication Services - 1.5% | |||
| Rogers Communications, Inc. Class B (non-vtg.) | 324,400 | 13,503,669 | |
TOTAL COMMUNICATION SERVICES | 34,919,675 | ||
| CONSUMER DISCRETIONARY - 6.0% | |||
| Auto Components - 0.8% | |||
| Magna International, Inc. Class A (sub. vtg.) | 131,600 | 7,333,704 | |
| Hotels, Restaurants & Leisure - 2.1% | |||
| Restaurant Brands International, Inc. | 309,600 | 18,396,242 | |
| Multiline Retail - 2.8% | |||
| Dollarama, Inc. | 419,900 | 24,950,200 | |
| Specialty Retail - 0.1% | |||
| Diversified Royalty Corp. (b) | 184,600 | 406,503 | |
| Textiles, Apparel & Luxury Goods - 0.2% | |||
| Canada Goose Holdings, Inc. (a)(b) | 99,400 | 1,626,327 | |
TOTAL CONSUMER DISCRETIONARY | 52,712,976 | ||
| CONSUMER STAPLES - 8.7% | |||
| Beverages - 0.1% | |||
| GURU Organic Energy Corp. (a)(b) | 324,600 | 862,518 | |
| Food & Staples Retailing - 8.3% | |||
| Alimentation Couche-Tard, Inc. Class A (multi-vtg.) | 1,069,200 | 47,874,041 | |
| Metro, Inc. | 341,595 | 17,895,280 | |
| Neighbourly Pharmacy, Inc. (b) | 95,478 | 1,626,634 | |
| North West Co., Inc. | 251,100 | 6,533,927 | |
| 73,929,882 | |||
| Personal Products - 0.3% | |||
| Jamieson Wellness, Inc. (c) | 91,000 | 2,226,322 | |
TOTAL CONSUMER STAPLES | 77,018,722 | ||
| ENERGY - 18.1% | |||
| Energy Equipment & Services - 0.9% | |||
| Computer Modelling Group Ltd. | 531,800 | 2,107,916 | |
| Pason Systems, Inc. | 543,100 | 5,768,457 | |
| 7,876,373 | |||
| Oil, Gas & Consumable Fuels - 17.2% | |||
| Cameco Corp. | 203,100 | 4,816,795 | |
| Canadian Natural Resources Ltd. (b) | 830,698 | 49,822,978 | |
| Enbridge, Inc. | 539,900 | 21,035,631 | |
| Parkland Corp. | 514,200 | 10,394,589 | |
| PrairieSky Royalty Ltd. (b) | 1,479,018 | 22,972,086 | |
| Suncor Energy, Inc. | 1,265,000 | 43,511,506 | |
| 152,553,585 | |||
TOTAL ENERGY | 160,429,958 | ||
| FINANCIALS - 28.3% | |||
| Banks - 16.4% | |||
| Royal Bank of Canada (b) | 797,700 | 73,806,355 | |
| The Toronto-Dominion Bank | 1,124,700 | 71,980,470 | |
| 145,786,825 | |||
| Capital Markets - 5.2% | |||
| Brookfield Asset Management, Inc. (Canada) Class A | 870,106 | 34,456,798 | |
| TMX Group Ltd. | 121,100 | 11,642,880 | |
| 46,099,678 | |||
| Insurance - 6.7% | |||
| Definity Financial Corp. | 388,713 | 11,512,878 | |
| Intact Financial Corp. | 152,625 | 23,191,472 | |
| Sun Life Financial, Inc. | 575,500 | 24,441,906 | |
| 59,146,256 | |||
TOTAL FINANCIALS | 251,032,759 | ||
| HEALTH CARE - 0.7% | |||
| Health Care Providers & Services - 0.7% | |||
| Andlauer Healthcare Group, Inc. | 137,800 | 5,281,988 | |
| dentalcorp Holdings Ltd. (a) | 231,000 | 1,286,960 | |
| 6,568,948 | |||
| INDUSTRIALS - 14.5% | |||
| Commercial Services & Supplies - 2.2% | |||
| GFL Environmental, Inc. | 731,000 | 19,729,783 | |
| Professional Services - 2.4% | |||
| Thomson Reuters Corp. | 197,600 | 21,015,351 | |
| Road & Rail - 9.9% | |||
| Canadian National Railway Co. | 234,750 | 27,811,245 | |
| Canadian Pacific Railway Ltd. | 803,762 | 59,918,574 | |
| 87,729,819 | |||
TOTAL INDUSTRIALS | 128,474,953 | ||
| INFORMATION TECHNOLOGY - 6.0% | |||
| IT Services - 0.7% | |||
| Shopify, Inc. Class A (a) | 188,100 | 6,449,261 | |
| Software - 5.3% | |||
| ApplyBoard, Inc. (a)(d)(e) | 1,677 | 115,512 | |
| ApplyBoard, Inc. (non-vtg.) (a)(d)(e) | 414 | 28,516 | |
| Constellation Software, Inc. | 20,800 | 30,075,760 | |
| Dye & Durham Ltd. | 493,300 | 5,456,770 | |
| Open Text Corp. | 385,828 | 11,175,376 | |
| 46,851,934 | |||
TOTAL INFORMATION TECHNOLOGY | 53,301,195 | ||
| MATERIALS - 12.3% | |||
| Chemicals - 3.9% | |||
| Nutrien Ltd. | 413,581 | 34,944,991 | |
| Containers & Packaging - 1.4% | |||
| CCL Industries, Inc. Class B (b) | 260,100 | 12,218,886 | |
| Metals & Mining - 6.5% | |||
| Franco-Nevada Corp. | 268,900 | 33,224,896 | |
| Lundin Mining Corp. | 1,052,800 | 5,517,666 | |
| Wheaton Precious Metals Corp. | 587,000 | 19,204,015 | |
| 57,946,577 | |||
| Paper & Forest Products - 0.5% | |||
| Stella-Jones, Inc. | 98,523 | 2,967,225 | |
| Western Forest Products, Inc. | 1,487,783 | 1,343,247 | |
| 4,310,472 | |||
TOTAL MATERIALS | 109,420,926 | ||
| REAL ESTATE - 0.5% | |||
| Equity Real Estate Investment Trusts (REITs) - 0.5% | |||
| Allied Properties (REIT) | 216,000 | 4,184,123 | |
| Real Estate Management & Development - 0.0% | |||
| Information Services Corp. | 15,300 | 262,571 | |
TOTAL REAL ESTATE | 4,446,694 | ||
| TOTAL COMMON STOCKS (Cost $538,767,944) | 878,326,806 | ||
| Nonconvertible Preferred Stocks - 0.1% | |||
| Shares | Value ($) | ||
| INFORMATION TECHNOLOGY - 0.1% | |||
| Software - 0.1% | |||
| ApplyBoard, Inc.: | |||
| Series A1 (a)(d)(e) | 2,063 | 142,099 | |
| Series A2 (a)(d)(e) | 1,615 | 111,241 | |
| Series A3 (a)(d)(e) | 92 | 6,337 | |
| Series D (a)(d)(e) | 4,504 | 310,236 | |
| Series Seed (a)(d)(e) | 617 | 42,499 | |
| (Cost $770,130) | 612,412 | ||
| Convertible Bonds - 0.3% | |||
Principal Amount (f) | Value ($) | ||
| COMMUNICATION SERVICES - 0.3% | |||
| Entertainment - 0.3% | |||
Cineplex, Inc. 5.75% 9/30/25 (c) (Cost $2,310,432) | CAD | 3,203,000 | 2,415,739 |
| Money Market Funds - 3.3% | |||
| Shares | Value ($) | ||
| Fidelity Cash Central Fund 3.10% (g) | 505,437 | 505,538 | |
| Fidelity Securities Lending Cash Central Fund 3.10% (g)(h) | 29,350,248 | 29,353,183 | |
| TOTAL MONEY MARKET FUNDS (Cost $29,858,721) | 29,858,721 | ||
| TOTAL INVESTMENT IN SECURITIES - 102.7% (Cost $571,707,227) | 911,213,678 |
NET OTHER ASSETS (LIABILITIES) - (2.7)% | (24,260,855) |
| NET ASSETS - 100.0% | 886,952,823 |
| CAD | - | Canadian dollar |
| (a) | Non-income producing |
| (b) | Security or a portion of the security is on loan at period end. |
| (c) | Security exempt from registration under Rule 144A of the Securities Act of 1933. These securities may be resold in transactions exempt from registration, normally to qualified institutional buyers. At the end of the period, the value of these securities amounted to $4,642,061 or 0.5% of net assets. |
| (d) | Restricted securities (including private placements) - Investment in securities not registered under the Securities Act of 1933 (excluding 144A issues). At the end of the period, the value of restricted securities (excluding 144A issues) amounted to $756,440 or 0.1% of net assets. |
| (e) | Level 3 security |
| (f) | Amount is stated in United States dollars unless otherwise noted. |
| (g) | Affiliated fund that is generally available only to investment companies and other accounts managed by Fidelity Investments. The rate quoted is the annualized seven-day yield of the fund at period end. A complete unaudited listing of the fund's holdings as of its most recent quarter end is available upon request. In addition, each Fidelity Central Fund's financial statements, which are not covered by the Fund's Report of Independent Registered Public Accounting Firm, are available on the SEC's website or upon request. |
| (h) | Investment made with cash collateral received from securities on loan. |
| Additional information on each restricted holding is as follows: | ||
| Security | Acquisition Date | Acquisition Cost ($) |
| ApplyBoard, Inc. | 6/04/21 - 6/30/21 | 85,688 |
| ApplyBoard, Inc. (non-vtg.) | 6/30/21 | 44,290 |
| ApplyBoard, Inc. Series A1 | 6/04/21 | 133,582 |
| ApplyBoard, Inc. Series A2 | 6/04/21 | 104,573 |
| ApplyBoard, Inc. Series A3 | 6/04/21 | 5,957 |
| ApplyBoard, Inc. Series D | 6/04/21 | 486,066 |
| ApplyBoard, Inc. Series Seed | 6/04/21 | 39,952 |
| Affiliate | Value, beginning of period ($) | Purchases ($) | Sales Proceeds ($) | Dividend Income ($) | Realized Gain (loss) ($) | Change in Unrealized appreciation (depreciation) ($) | Value, end of period ($) | % ownership, end of period |
| Fidelity Cash Central Fund 3.10% | 479,852 | 141,290,261 | 141,264,575 | 14,789 | - | - | 505,538 | 0.0% |
| Fidelity Securities Lending Cash Central Fund 3.10% | 82,977,032 | 980,026,000 | 1,033,649,849 | 142,988 | - | - | 29,353,183 | 0.1% |
| Total | 83,456,884 | 1,121,316,261 | 1,174,914,424 | 157,777 | - | - | 29,858,721 | |
| Valuation Inputs at Reporting Date: | ||||
| Description | Total ($) | Level 1 ($) | Level 2 ($) | Level 3 ($) |
Investments in Securities: | ||||
| Equities: | ||||
Communication Services | 34,919,675 | 34,919,675 | - | - |
Consumer Discretionary | 52,712,976 | 52,712,976 | - | - |
Consumer Staples | 77,018,722 | 77,018,722 | - | - |
Energy | 160,429,958 | 160,429,958 | - | - |
Financials | 251,032,759 | 251,032,759 | - | - |
Health Care | 6,568,948 | 6,568,948 | - | - |
Industrials | 128,474,953 | 128,474,953 | - | - |
Information Technology | 53,913,607 | 53,157,167 | - | 756,440 |
Materials | 109,420,926 | 109,420,926 | - | - |
Real Estate | 4,446,694 | 4,446,694 | - | - |
| Corporate Bonds | 2,415,739 | - | 2,415,739 | - |
| Money Market Funds | 29,858,721 | 29,858,721 | - | - |
| Total Investments in Securities: | 911,213,678 | 908,041,499 | 2,415,739 | 756,440 |
| Statement of Assets and Liabilities | ||||
| October 31, 2022 | ||||
| Assets | ||||
| Investment in securities, at value (including securities loaned of $27,208,289) - See accompanying schedule: | ||||
Unaffiliated issuers (cost $541,848,506) | $881,354,957 | |||
Fidelity Central Funds (cost $29,858,721) | 29,858,721 | |||
| Total Investment in Securities (cost $571,707,227) | $ | 911,213,678 | ||
| Cash | 55,080 | |||
| Foreign currency held at value (cost $753,007) | 753,056 | |||
| Receivable for investments sold | 4,986,081 | |||
| Receivable for fund shares sold | 180,401 | |||
| Dividends receivable | 709,142 | |||
| Interest receivable | 11,852 | |||
| Distributions receivable from Fidelity Central Funds | 5,264 | |||
| Prepaid expenses | 1,386 | |||
Total assets | 917,915,940 | |||
| Liabilities | ||||
| Payable for fund shares redeemed | $818,691 | |||
| Accrued management fee | 561,836 | |||
| Distribution and service plan fees payable | 10,037 | |||
| Other affiliated payables | 165,142 | |||
| Other payables and accrued expenses | 57,802 | |||
| Collateral on securities loaned | 29,349,609 | |||
| Total Liabilities | 30,963,117 | |||
| Net Assets | $ | 886,952,823 | ||
| Net Assets consist of: | ||||
| Paid in capital | $ | 517,699,725 | ||
| Total accumulated earnings (loss) | 369,253,098 | |||
| Net Assets | $ | 886,952,823 | ||
| Net Asset Value and Maximum Offering Price | ||||
| Class A : | ||||
Net Asset Value and redemption price per share ($31,706,710 ÷ 533,415 shares) (a) | $ | 59.44 | ||
| Maximum offering price per share (100/94.25 of $59.44) | $ | 63.07 | ||
| Class M : | ||||
Net Asset Value and redemption price per share ($6,640,506 ÷ 112,377 shares) (a) | $ | 59.09 | ||
| Maximum offering price per share (100/96.50 of $59.09) | $ | 61.23 | ||
| Class C : | ||||
Net Asset Value and offering price per share ($1,108,665 ÷ 18,986 shares) (a) | $ | 58.39 | ||
| Canada : | ||||
Net Asset Value , offering price and redemption price per share ($825,488,142 ÷ 13,806,386 shares) | $ | 59.79 | ||
| Class I : | ||||
Net Asset Value , offering price and redemption price per share ($16,165,491 ÷ 270,157 shares) | $ | 59.84 | ||
| Class Z : | ||||
Net Asset Value , offering price and redemption price per share ($5,843,309 ÷ 98,119 shares) | $ | 59.55 | ||
(a)Redemption price per share is equal to net asset value less any applicable contingent deferred sales charge. | ||||
| Statement of Operations | ||||
Year ended October 31, 2022 | ||||
| Investment Income | ||||
| Dividends | $ | 23,043,917 | ||
| Interest | 193,875 | |||
| Income from Fidelity Central Funds (including $142,988 from security lending) | 157,777 | |||
| Income before foreign taxes withheld | 23,395,569 | |||
| Less foreign taxes withheld | (3,455,906) | |||
| Total Income | 19,939,663 | |||
| Expenses | ||||
| Management fee | ||||
| Basic fee | $ | 6,118,874 | ||
| Performance adjustment | (244,469) | |||
| Transfer agent fees | 1,544,271 | |||
| Distribution and service plan fees | 131,595 | |||
| Accounting fees | 419,684 | |||
| Custodian fees and expenses | 13,280 | |||
| Independent trustees' fees and expenses | 3,067 | |||
| Registration fees | 89,413 | |||
| Audit | 61,429 | |||
| Legal | 1,028 | |||
| Interest | 1,721 | |||
| Miscellaneous | 4,097 | |||
| Total expenses before reductions | 8,143,990 | |||
| Expense reductions | (29,446) | |||
| Total expenses after reductions | 8,114,544 | |||
| Net Investment income (loss) | 11,825,119 | |||
| Realized and Unrealized Gain (Loss) | ||||
| Net realized gain (loss) on: | ||||
| Investment Securities: | ||||
| Unaffiliated issuers | 24,954,969 | |||
| Foreign currency transactions | (434,640) | |||
| Total net realized gain (loss) | 24,520,329 | |||
| Change in net unrealized appreciation (depreciation) on: | ||||
| Investment Securities: | ||||
| Unaffiliated issuers | (104,994,098) | |||
| Assets and liabilities in foreign currencies | 5,920 | |||
| Total change in net unrealized appreciation (depreciation) | (104,988,178) | |||
| Net gain (loss) | (80,467,849) | |||
| Net increase (decrease) in net assets resulting from operations | $ | (68,642,730) | ||
| Statement of Changes in Net Assets | ||||
Year ended October 31, 2022 | Year ended October 31, 2021 | |||
| Increase (Decrease) in Net Assets | ||||
| Operations | ||||
| Net investment income (loss) | $ | 11,825,119 | $ | 10,152,770 |
| Net realized gain (loss) | 24,520,329 | 36,420,496 | ||
| Change in net unrealized appreciation (depreciation) | (104,988,178) | 271,065,320 | ||
| Net increase (decrease) in net assets resulting from operations | (68,642,730) | 317,638,586 | ||
| Distributions to shareholders | (44,124,388) | (19,441,097) | ||
| Share transactions - net increase (decrease) | 99,770,958 | (67,034,603) | ||
| Total increase (decrease) in net assets | (12,996,160) | 231,162,886 | ||
| Net Assets | ||||
| Beginning of period | 899,948,983 | 668,786,097 | ||
| End of period | $ | 886,952,823 | $ | 899,948,983 |
| Fidelity Advisor® Canada Fund Class A |
| Years ended October 31, | 2022 | 2021 | 2020 | 2019 | 2018 | |||||
Selected Per-Share Data | ||||||||||
| Net asset value, beginning of period | $ | 67.23 | $ | 46.01 | $ | 51.95 | $ | 49.75 | $ | 54.11 |
| Income from Investment Operations | ||||||||||
Net investment income (loss) A,B | .63 | .55 | .61 | .66 | .60 | |||||
| Net realized and unrealized gain (loss) | (5.30) | 21.89 | (4.38) | 4.56 | (3.88) | |||||
| Total from investment operations | (4.67) | 22.44 | (3.77) | 5.22 | (3.28) | |||||
| Distributions from net investment income | (.61) | (.63) | (.77) | (.39) | (.59) | |||||
| Distributions from net realized gain | (2.51) | (.59) | (1.40) | (2.63) | (.49) | |||||
| Total distributions | (3.12) | (1.22) | (2.17) | (3.02) | (1.08) | |||||
Redemption fees added to paid in capital A | - | - | - | - | - C | |||||
| Net asset value, end of period | $ | 59.44 | $ | 67.23 | $ | 46.01 | $ | 51.95 | $ | 49.75 |
Total Return D,E | (7.06)% | 49.45% | (7.70)% | 11.34% | (6.19)% | |||||
Ratios to Average Net Assets B,F,G | ||||||||||
| Expenses before reductions | 1.20% | 1.12% | 1.20% | 1.20% | 1.21% | |||||
| Expenses net of fee waivers, if any | 1.20% | 1.12% | 1.20% | 1.20% | 1.21% | |||||
| Expenses net of all reductions | 1.20% | 1.12% | 1.19% | 1.19% | 1.20% | |||||
| Net investment income (loss) | 1.00% | .92% | 1.27% | 1.32% | 1.13% | |||||
| Supplemental Data | ||||||||||
| Net assets, end of period (000 omitted) | $ | 31,707 | $ | 33,087 | $ | 23,395 | $ | 30,598 | $ | 29,420 |
Portfolio turnover rate H | 13% | 7% | 11% | 8% I | 29% |
| Fidelity Advisor® Canada Fund Class M |
| Years ended October 31, | 2022 | 2021 | 2020 | 2019 | 2018 | |||||
Selected Per-Share Data | ||||||||||
| Net asset value, beginning of period | $ | 66.84 | $ | 45.74 | $ | 51.67 | $ | 49.46 | $ | 53.77 |
| Income from Investment Operations | ||||||||||
Net investment income (loss) A,B | .45 | .38 | .47 | .51 | .44 | |||||
| Net realized and unrealized gain (loss) | (5.26) | 21.78 | (4.36) | 4.55 | (3.86) | |||||
| Total from investment operations | (4.81) | 22.16 | (3.89) | 5.06 | (3.42) | |||||
| Distributions from net investment income | (.42) | (.47) | (.64) | (.22) | (.40) | |||||
| Distributions from net realized gain | (2.51) | (.59) | (1.40) | (2.63) | (.49) | |||||
| Total distributions | (2.94) C | (1.06) | (2.04) | (2.85) | (.89) | |||||
Redemption fees added to paid in capital A | - | - | - | - | - D | |||||
| Net asset value, end of period | $ | 59.09 | $ | 66.84 | $ | 45.74 | $ | 51.67 | $ | 49.46 |
Total Return E,F | (7.32)% | 49.04% | (7.95)% | 11.02% | (6.47)% | |||||
Ratios to Average Net Assets B,G,H | ||||||||||
| Expenses before reductions | 1.48% | 1.40% | 1.47% | 1.49% | 1.51% | |||||
| Expenses net of fee waivers, if any | 1.48% | 1.39% | 1.47% | 1.48% | 1.51% | |||||
| Expenses net of all reductions | 1.48% | 1.39% | 1.47% | 1.48% | 1.51% | |||||
| Net investment income (loss) | .72% | .64% | .99% | 1.03% | .83% | |||||
| Supplemental Data | ||||||||||
| Net assets, end of period (000 omitted) | $ | 6,641 | $ | 7,829 | $ | 5,911 | $ | 8,589 | $ | 7,844 |
Portfolio turnover rate I | 13% | 7% | 11% | 8% J | 29% |
| Fidelity Advisor® Canada Fund Class C |
| Years ended October 31, | 2022 | 2021 | 2020 | 2019 | 2018 | |||||
Selected Per-Share Data | ||||||||||
| Net asset value, beginning of period | $ | 65.76 | $ | 44.96 | $ | 50.61 | $ | 48.48 | $ | 52.72 |
| Income from Investment Operations | ||||||||||
Net investment income (loss) A,B | .14 | .08 | .24 | .29 | .21 | |||||
| Net realized and unrealized gain (loss) | (5.19) | 21.46 | (4.31) | 4.47 | (3.78) | |||||
| Total from investment operations | (5.05) | 21.54 | (4.07) | 4.76 | (3.57) | |||||
| Distributions from net investment income | - | (.15) | (.18) | - | (.18) | |||||
| Distributions from net realized gain | (2.32) | (.59) | (1.40) | (2.63) | (.49) | |||||
| Total distributions | (2.32) | (.74) | (1.58) | (2.63) | (.67) | |||||
Redemption fees added to paid in capital A | - | - | - | - | - C | |||||
| Net asset value, end of period | $ | 58.39 | $ | 65.76 | $ | 44.96 | $ | 50.61 | $ | 48.48 |
Total Return D,E | (7.79)% | 48.31% | (8.39)% | 10.53% | (6.85)% | |||||
Ratios to Average Net Assets B,F,G | ||||||||||
| Expenses before reductions | 1.99% | 1.90% | 1.95% | 1.92% | 1.94% | |||||
| Expenses net of fee waivers, if any | 1.98% | 1.90% | 1.95% | 1.92% | 1.93% | |||||
| Expenses net of all reductions | 1.98% | 1.90% | 1.95% | 1.91% | 1.93% | |||||
| Net investment income (loss) | .22% | .14% | .51% | .60% | .40% | |||||
| Supplemental Data | ||||||||||
| Net assets, end of period (000 omitted) | $ | 1,109 | $ | 1,683 | $ | 3,151 | $ | 6,226 | $ | 11,196 |
Portfolio turnover rate H | 13% | 7% | 11% | 8% I | 29% |
| Fidelity® Canada Fund |
| Years ended October 31, | 2022 | 2021 | 2020 | 2019 | 2018 | |||||
Selected Per-Share Data | ||||||||||
| Net asset value, beginning of period | $ | 67.62 | $ | 46.26 | $ | 52.21 | $ | 50.02 | $ | 54.41 |
| Income from Investment Operations | ||||||||||
Net investment income (loss) A,B | .83 | .74 | .76 | .82 | .77 | |||||
| Net realized and unrealized gain (loss) | (5.33) | 21.99 | (4.38) | 4.58 | (3.90) | |||||
| Total from investment operations | (4.50) | 22.73 | (3.62) | 5.40 | (3.13) | |||||
| Distributions from net investment income | (.82) | (.78) | (.92) | (.58) | (.77) | |||||
| Distributions from net realized gain | (2.51) | (.59) | (1.40) | (2.63) | (.49) | |||||
| Total distributions | (3.33) | (1.37) | (2.33) C | (3.21) | (1.26) | |||||
Redemption fees added to paid in capital A | - | - | - | - | - D | |||||
| Net asset value, end of period | $ | 59.79 | $ | 67.62 | $ | 46.26 | $ | 52.21 | $ | 50.02 |
Total Return E | (6.77)% | 49.91% | (7.40)% | 11.70% | (5.89)% | |||||
Ratios to Average Net Assets B,F,G | ||||||||||
| Expenses before reductions | .89% | .80% | .88% | .88% | .89% | |||||
| Expenses net of fee waivers, if any | .88% | .80% | .88% | .88% | .89% | |||||
| Expenses net of all reductions | .88% | .80% | .88% | .87% | .88% | |||||
| Net investment income (loss) | 1.32% | 1.24% | 1.58% | 1.64% | 1.45% | |||||
| Supplemental Data | ||||||||||
| Net assets, end of period (000 omitted) | $ | 825,488 | $ | 821,617 | $ | 612,716 | $ | 803,629 | $ | 903,662 |
Portfolio turnover rate H | 13% | 7% | 11% | 8% I | 29% |
| Fidelity Advisor® Canada Fund Class I |
| Years ended October 31, | 2022 | 2021 | 2020 | 2019 | 2018 | |||||
Selected Per-Share Data | ||||||||||
| Net asset value, beginning of period | $ | 67.70 | $ | 46.24 | $ | 52.11 | $ | 49.93 | $ | 54.29 |
| Income from Investment Operations | ||||||||||
Net investment income (loss) A,B | .85 | .78 | .79 | .85 | .79 | |||||
| Net realized and unrealized gain (loss) | (5.34) | 22.00 | (4.39) | 4.55 | (3.90) | |||||
| Total from investment operations | (4.49) | 22.78 | (3.60) | 5.40 | (3.11) | |||||
| Distributions from net investment income | (.86) | (.73) | (.87) | (.59) | (.77) | |||||
| Distributions from net realized gain | (2.51) | (.59) | (1.40) | (2.63) | (.49) | |||||
| Total distributions | (3.37) | (1.32) | (2.27) | (3.22) | (1.25) C | |||||
Redemption fees added to paid in capital A | - | - | - | - | - D | |||||
| Net asset value, end of period | $ | 59.84 | $ | 67.70 | $ | 46.24 | $ | 52.11 | $ | 49.93 |
Total Return E | (6.74)% | 50.02% | (7.35)% | 11.74% | (5.86)% | |||||
Ratios to Average Net Assets B,F,G | ||||||||||
| Expenses before reductions | .86% | .74% | .81% | .84% | .86% | |||||
| Expenses net of fee waivers, if any | .86% | .74% | .81% | .84% | .85% | |||||
| Expenses net of all reductions | .86% | .74% | .81% | .83% | .85% | |||||
| Net investment income (loss) | 1.34% | 1.29% | 1.65% | 1.68% | 1.49% | |||||
| Supplemental Data | ||||||||||
| Net assets, end of period (000 omitted) | $ | 16,165 | $ | 13,724 | $ | 8,392 | $ | 14,507 | $ | 26,923 |
Portfolio turnover rate H | 13% | 7% | 11% | 8% I | 29% |
| Fidelity Advisor® Canada Fund Class Z |
| Years ended October 31, | 2022 | 2021 | 2020 | 2019 | 2018 A | |||||
Selected Per-Share Data | ||||||||||
| Net asset value, beginning of period | $ | 67.38 | $ | 46.11 | $ | 52.07 | $ | 49.94 | $ | 53.92 |
| Income from Investment Operations | ||||||||||
Net investment income (loss) B,C | .92 | .82 | .84 | .92 | .06 | |||||
| Net realized and unrealized gain (loss) | (5.33) | 21.91 | (4.37) | 4.53 | (4.04) | |||||
| Total from investment operations | (4.41) | 22.73 | (3.53) | 5.45 | (3.98) | |||||
| Distributions from net investment income | (.91) | (.87) | (1.03) | (.69) | - | |||||
| Distributions from net realized gain | (2.51) | (.59) | (1.40) | (2.63) | - | |||||
| Total distributions | (3.42) | (1.46) | (2.43) | (3.32) | - | |||||
| Net asset value, end of period | $ | 59.55 | $ | 67.38 | $ | 46.11 | $ | 52.07 | $ | 49.94 |
Total Return D,E | (6.66)% | 50.13% | (7.24)% | 11.87% | (7.38)% | |||||
Ratios to Average Net Assets C,F,G | ||||||||||
| Expenses before reductions | .75% | .66% | .72% | .72% | .80% H | |||||
| Expenses net of fee waivers, if any | .75% | .66% | .72% | .72% | .80% H | |||||
| Expenses net of all reductions | .75% | .66% | .72% | .71% | .79% H | |||||
| Net investment income (loss) | 1.45% | 1.38% | 1.74% | 1.80% | 1.48% H | |||||
| Supplemental Data | ||||||||||
| Net assets, end of period (000 omitted) | $ | 5,843 | $ | 22,010 | $ | 15,221 | $ | 20,496 | $ | 128 |
Portfolio turnover rate I | 13% | 7% | 11% | 8% J | 29% |
| Fidelity Central Fund | Investment Manager | Investment Objective | Investment Practices | Expense Ratio A |
| Fidelity Money Market Central Funds | Fidelity Management & Research Company LLC (FMR) | Each fund seeks to obtain a high level of current income consistent with the preservation of capital and liquidity. | Short-term Investments | Less than .005% |
| Gross unrealized appreciation | $376,025,914 |
| Gross unrealized depreciation | (39,216,690) |
| Net unrealized appreciation (depreciation) | $336,809,224 |
| Tax Cost | $574,404,454 |
| Undistributed ordinary income | $10,110,407 |
| Undistributed long-term capital gain | $22,334,892 |
| Net unrealized appreciation (depreciation) on securities and other investments | $336,807,799 |
| October 31, 2022 | October 31, 2021 | |
| Ordinary Income | $13,229,283 | $13,764,443 |
| Long-term Capital Gains | 30,895,105 | 5,676,654 |
| Total | $44,124,388 | $19,441,097 |
| Purchases ($) | Sales ($) | |
| Fidelity Canada Fund | 188,872,571 | 120,356,506 |
| Distribution Fee | Service Fee | Total Fees | Retained by FDC | |
| Class A | - % | .25% | $80,682 | $225 |
| Class M | .25% | .25% | 36,730 | 16 |
| Class C | .75% | .25% | 14,183 | 1,068 |
| $131,595 | $1,309 |
| Retained by FDC | |
| Class A | $18,932 |
| Class M | 545 |
Class C A | 482 |
| $19,959 |
| Amount | % of Class-Level Average Net Assets | |
| Class A | $76,143 | .24 |
| Class M | 19,801 | .27 |
| Class C | 3,841 | .27 |
| Canada | 1,409,318 | .17 |
| Class I | 25,367 | .15 |
| Class Z | 9,801 | .04 |
| $1,544,271 |
| % of Average Net Assets | |
| Fidelity Canada Fund | .05 |
| Borrower or Lender | Average Loan Balance | Weighted Average Interest Rate | Interest Expense | |
| Fidelity Canada Fund | Borrower | $ 18,693,000 | 3.32% | $ 1,721 |
| Purchases ($) | Sales ($) | Realized Gain (Loss) ($) | |
| Fidelity Canada Fund | 29,198,387 | 2,240,286 | 48,945 |
| Amount | |
| Fidelity Canada Fund | $1,558 |
| Total Security Lending Fees Paid to NFS | Security Lending Income From Securities Loaned to NFS | Value of Securities Loaned to NFS at Period End | |
| Fidelity Canada Fund | $15,454 | $ - | $- |
Year ended October 31, 2022 | Year ended October 31, 2021 | |
| Fidelity Canada Fund | ||
| Class A | $ 1,521,087 | $618,232 |
| Class M | 339,044 | 133,891 |
| Class C | 58,947 | 49,983 |
| Canada | 40,254,541 | 17,909,638 |
| Class I | 818,871 | 258,425 |
| Class Z | 1,131,898 | 470,928 |
Total | $44,124,388 | $19,441,097 |
| Shares | Shares | Dollars | Dollars | |
| Year ended October 31, 2022 | Year ended October 31, 2021 | Year ended October 31, 2022 | Year ended October 31, 2021 | |
| Fidelity Canada Fund | ||||
| Class A | ||||
| Shares sold | 91,502 | 57,546 | $ 5,737,202 | $ 3,411,614 |
| Reinvestment of distributions | 23,772 | 11,025 | 1,449,851 | 589,714 |
| Shares redeemed | (73,975) | (84,917) | (4,692,234) | (5,008,946) |
| Net increase (decrease) | 41,299 | (16,346) | $2,494,819 | $(1,007,618) |
| Class M | ||||
| Shares sold | 6,970 | 5,995 | $443,908 | $361,311 |
| Reinvestment of distributions | 5,557 | 2,501 | 337,743 | 133,344 |
| Shares redeemed | (17,269) | (20,590) | (1,094,130) | (1,194,828) |
| Net increase (decrease) | (4,742) | (12,094) | $(312,479) | $(700,173) |
| Class C | ||||
| Shares sold | 3,877 | 3,093 | $ 245,296 | $ 176,271 |
| Reinvestment of distributions | 977 | 943 | 58,947 | 49,676 |
| Shares redeemed | (11,456) | (48,530) | (711,381) | (2,827,895) |
| Net increase (decrease) | (6,602) | (44,494) | $(407,138) | $(2,601,948) |
| Canada | ||||
| Shares sold | 2,660,313 | 688,197 | $ 168,972,527 | $ 42,135,723 |
| Reinvestment of distributions | 619,960 | 312,199 | 37,922,967 | 16,749,465 |
| Shares redeemed | (1,624,197) | (2,096,008) | (101,772,732) | (123,048,904) |
| Net increase (decrease) | 1,656,076 | (1,095,612) | $105,122,762 | $(64,163,716) |
| Class I | ||||
| Shares sold | 238,697 | 125,979 | $ 15,537,489 | $ 7,822,995 |
| Reinvestment of distributions | 12,737 | 4,470 | 779,507 | 239,960 |
| Shares redeemed | (183,998) | (109,208) | (11,689,703) | (6,469,644) |
| Net increase (decrease) | 67,436 | 21,241 | $4,627,293 | $1,593,311 |
| Class Z | ||||
| Shares sold | 156,264 | 48,490 | $ 10,087,519 | $ 2,951,806 |
| Reinvestment of distributions | 18,285 | 8,746 | 1,112,618 | 466,957 |
| Shares redeemed | (403,081) | (60,703) | (22,954,436) | (3,573,222) |
| Net increase (decrease) | (228,532) | (3,467) | $(11,754,299) | $(154,459) |
| Average Annual Total Returns | |||
Periods ended October 31, 2022 | Past 1 year | Past 5 years | Past 10 years |
| Class A (incl.5.75% sales charge) | -48.35% | -4.26% | 3.72% |
| Class M (incl.3.50% sales charge) | -47.28% | -4.11% | 3.64% |
Class C (incl. contingent deferred sales charge) | -46.09% | -3.83% | 3.73% |
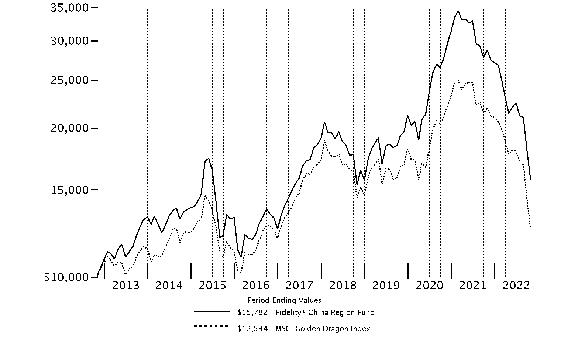
| Fidelity® China Region Fund | -45.04% | -2.82% | 4.67% |
| Class I | -45.05% | -2.84% | 4.67% |
| Class Z | -44.97% | -2.73% | 4.73% |
| $10,000 Over 10 Years |
Let's say hypothetically that $10,000 was invested in Fidelity® China Region Fund, a class of the fund, on October 31, 2012. The chart shows how the value of your investment would have changed, and also shows how the MSCI Golden Dragon Index performed over the same period. |
 |
Top Holdings (% of Fund's net assets) | ||
| Taiwan Semiconductor Manufacturing Co. Ltd. (Semiconductors & Semiconductor Equipment) | 18.3 | |
| Tencent Holdings Ltd. (Interactive Media & Services) | 7.9 | |
| AIA Group Ltd. (Insurance) | 5.7 | |
| Alibaba Group Holding Ltd. (Internet & Direct Marketing Retail) | 5.6 | |
| Meituan Class B (Internet & Direct Marketing Retail) | 4.2 | |
| China Construction Bank Corp. (H Shares) (Banks) | 2.6 | |
| Pinduoduo, Inc. ADR (Internet & Direct Marketing Retail) | 2.6 | |
| Industrial & Commercial Bank of China Ltd. (H Shares) (Banks) | 2.4 | |
| MediaTek, Inc. (Semiconductors & Semiconductor Equipment) | 2.3 | |
| Zijin Mining Group Co. Ltd. (H Shares) (Metals & Mining) | 2.1 | |
| 53.7 | ||
| Market Sectors (% of Fund's net assets) | ||
| Information Technology | 26.2 | |
| Consumer Discretionary | 22.2 | |
| Financials | 16.1 | |
| Communication Services | 9.8 | |
| Health Care | 5.0 | |
| Consumer Staples | 4.9 | |
| Materials | 4.4 | |
| Industrials | 3.5 | |
| Real Estate | 2.1 | |
| Energy | 1.7 | |
Asset Allocation (% of Fund's net assets) |
 |
Foreign investments - 95.1% |
Geographic Diversification (% of Fund's net assets) |
 |
* Includes Short-Term investments and Net Other Assets (Liabilities). Percentages are based on country or territory of incorporation and are adjusted for the effect of futures contracts, if applicable. |
| Common Stocks - 94.6% | |||
| Shares | Value ($) | ||
| COMMUNICATION SERVICES - 9.8% | |||
| Entertainment - 1.9% | |||
| Bilibili, Inc. ADR (a)(b) | 471,100 | 4,202,212 | |
| NetEase, Inc. | 937,400 | 10,400,691 | |
| 14,602,903 | |||
| Interactive Media & Services - 7.9% | |||
| Tencent Holdings Ltd. | 2,387,700 | 62,741,101 | |
TOTAL COMMUNICATION SERVICES | 77,344,004 | ||
| CONSUMER DISCRETIONARY - 22.2% | |||
| Automobiles - 2.5% | |||
| Brilliance China Automotive Holdings Ltd. (a) | 1,668,000 | 718,228 | |
| Great Wall Motor Co. Ltd. (H Shares) | 4,248,500 | 4,638,378 | |
| Guangzhou Automobile Group Co. Ltd. (H Shares) | 9,646,000 | 5,873,877 | |
| Li Auto, Inc.: | |||
| ADR (a) | 387,000 | 5,270,940 | |
| Class A (a) | 249,800 | 1,704,126 | |
| XPeng, Inc. ADR (a)(b) | 180,600 | 1,195,572 | |
| 19,401,121 | |||
| Hotels, Restaurants & Leisure - 2.3% | |||
| Galaxy Entertainment Group Ltd. | 1,684,000 | 7,690,967 | |
| Trip.com Group Ltd. (a) | 144,000 | 3,234,572 | |
| Trip.com Group Ltd. ADR (a) | 330,400 | 7,476,952 | |
| 18,402,491 | |||
| Household Durables - 0.8% | |||
| Haier Smart Home Co. Ltd. (A Shares) | 2,280,398 | 6,494,992 | |
| Internet & Direct Marketing Retail - 13.4% | |||
| Alibaba Group Holding Ltd. (a) | 5,675,200 | 44,124,151 | |
| JD.com, Inc. Class A | 445,300 | 8,109,145 | |
| Meituan Class B (a)(c) | 2,088,988 | 33,445,838 | |
| Pinduoduo, Inc. ADR (a) | 375,705 | 20,599,905 | |
| 106,279,039 | |||
| Specialty Retail - 0.7% | |||
| China Tourism Group Duty Free Corp. Ltd. (A Shares) | 239,500 | 5,259,037 | |
| Textiles, Apparel & Luxury Goods - 2.5% | |||
| Li Ning Co. Ltd. | 1,458,000 | 7,541,075 | |
| LVMH Moet Hennessy Louis Vuitton SE | 15,900 | 10,032,819 | |
| Shenzhou International Group Holdings Ltd. | 303,400 | 2,106,507 | |
| 19,680,401 | |||
TOTAL CONSUMER DISCRETIONARY | 175,517,081 | ||
| CONSUMER STAPLES - 4.9% | |||
| Beverages - 2.7% | |||
| Kweichow Moutai Co. Ltd. (A Shares) | 84,845 | 15,611,175 | |
| Wuliangye Yibin Co. Ltd. (A Shares) | 337,760 | 6,174,391 | |
| 21,785,566 | |||
| Food Products - 0.9% | |||
| Uni-President Enterprises Corp. | 3,562,000 | 7,233,552 | |
| Household Products - 0.5% | |||
| C&S Paper Co. Ltd. (A Shares) | 2,955,102 | 3,787,503 | |
| Personal Products - 0.8% | |||
| Proya Cosmetics Co. Ltd. (A Shares) | 267,260 | 6,117,092 | |
TOTAL CONSUMER STAPLES | 38,923,713 | ||
| ENERGY - 1.7% | |||
| Energy Equipment & Services - 1.7% | |||
| China Oilfield Services Ltd. (H Shares) | 12,112,000 | 13,640,109 | |
| FINANCIALS - 15.9% | |||
| Banks - 6.4% | |||
| China Construction Bank Corp. (H Shares) | 39,046,610 | 20,721,585 | |
| E.SUN Financial Holdings Co. Ltd. | 10,363,554 | 7,454,407 | |
| Hang Seng Bank Ltd. | 238,800 | 3,361,777 | |
| Industrial & Commercial Bank of China Ltd. (H Shares) | 43,988,000 | 19,098,069 | |
| 50,635,838 | |||
| Capital Markets - 1.1% | |||
| Hong Kong Exchanges and Clearing Ltd. | 326,500 | 8,666,492 | |
| Diversified Financial Services - 1.5% | |||
| Far East Horizon Ltd. | 15,430,500 | 11,912,484 | |
| Insurance - 6.9% | |||
| AIA Group Ltd. | 5,974,600 | 45,256,365 | |
| China Pacific Insurance (Group) Co. Ltd. (H Shares) | 2,169,000 | 3,498,187 | |
| Ping An Insurance Group Co. of China Ltd. (H Shares) | 1,444,500 | 5,782,898 | |
| 54,537,450 | |||
TOTAL FINANCIALS | 125,752,264 | ||
| HEALTH CARE - 4.7% | |||
| Biotechnology - 1.3% | |||
| Innovent Biologics, Inc. (a)(c) | 1,021,000 | 3,615,932 | |
| Zai Lab Ltd. (a) | 986,000 | 2,271,041 | |
| Zai Lab Ltd. ADR (a) | 182,900 | 4,075,012 | |
| 9,961,985 | |||
| Health Care Equipment & Supplies - 1.2% | |||
| MicroTech Medical (Hangzhou) Co. Ltd. (H Shares) (a)(c) | 1,091,500 | 846,819 | |
| Shenzhen Mindray Bio-Medical Electronics Co. Ltd. (A Shares) | 193,515 | 8,623,632 | |
| 9,470,451 | |||
| Life Sciences Tools & Services - 1.2% | |||
| WuXi AppTec Co. Ltd. (H Shares) (c) | 299,600 | 2,400,724 | |
| Wuxi Biologics (Cayman), Inc. (a)(c) | 1,622,500 | 7,300,670 | |
| 9,701,394 | |||
| Pharmaceuticals - 1.0% | |||
| Asymchem Laboratories Tianjin Co. Ltd. (H Shares) (c) | 453,940 | 4,857,664 | |
| Hansoh Pharmaceutical Group Co. Ltd. (c) | 2,006,000 | 3,097,300 | |
| 7,954,964 | |||
TOTAL HEALTH CARE | 37,088,794 | ||
| INDUSTRIALS - 3.5% | |||
| Aerospace & Defense - 0.1% | |||
| Space Exploration Technologies Corp. Class A (a)(d)(e) | 10,000 | 700,000 | |
| Air Freight & Logistics - 0.6% | |||
| Milkyway Chemical Supply Chain Service Co. Ltd. (A Shares) | 308,929 | 4,848,682 | |
| Construction & Engineering - 0.2% | |||
| China State Construction International Holdings Ltd. | 1,894,000 | 1,703,470 | |
| Electrical Equipment - 0.4% | |||
| Sungrow Power Supply Co. Ltd. (A Shares) | 191,634 | 3,419,433 | |
| Machinery - 1.9% | |||
| Shenzhen Inovance Technology Co. Ltd. (A Shares) | 1,038,213 | 9,482,371 | |
| Weichai Power Co. Ltd. (H Shares) | 3,298,000 | 3,159,499 | |
| Zhejiang Sanhua Intelligent Controls Co. Ltd. (A Shares) | 693,784 | 2,018,775 | |
| 14,660,645 | |||
| Professional Services - 0.3% | |||
| Centre Testing International Group Co. Ltd. (A Shares) | 923,700 | 2,369,045 | |
TOTAL INDUSTRIALS | 27,701,275 | ||
| INFORMATION TECHNOLOGY - 25.4% | |||
| Communications Equipment - 0.3% | |||
| ZTE Corp. (H Shares) | 1,608,800 | 2,869,325 | |
| Electronic Equipment & Components - 1.2% | |||
| Hon Hai Precision Industry Co. Ltd. (Foxconn) | 2,951,000 | 9,377,984 | |
| IT Services - 1.5% | |||
| TravelSky Technology Ltd. (H Shares) | 5,317,000 | 7,721,847 | |
| Vnet Group, Inc. ADR (a) | 1,041,214 | 4,362,687 | |
| 12,084,534 | |||
| Semiconductors & Semiconductor Equipment - 22.4% | |||
| eMemory Technology, Inc. | 190,481 | 6,348,579 | |
| MediaTek, Inc. | 976,000 | 17,853,290 | |
| Parade Technologies Ltd. | 214,000 | 4,040,615 | |
| Silergy Corp. | 156,000 | 1,808,892 | |
| SK Hynix, Inc. | 39,130 | 2,267,222 | |
| Taiwan Semiconductor Manufacturing Co. Ltd. | 12,056,000 | 144,798,201 | |
| 177,116,799 | |||
TOTAL INFORMATION TECHNOLOGY | 201,448,642 | ||
| MATERIALS - 4.4% | |||
| Chemicals - 0.2% | |||
| Weihai Guangwei Composites Co. Ltd. (A Shares) | 106,058 | 1,126,963 | |
| Construction Materials - 0.3% | |||
| West China Cement Ltd. | 24,942,000 | 2,256,001 | |
| Containers & Packaging - 1.5% | |||
| Shenzhen YUTO Packaging Technology Co. Ltd. (A Shares) | 2,677,971 | 11,928,740 | |
| Metals & Mining - 2.4% | |||
| Lynas Rare Earths Ltd. (a) | 486,256 | 2,590,910 | |
| Zijin Mining Group Co. Ltd. (H Shares) | 17,412,000 | 16,636,411 | |
| 19,227,321 | |||
TOTAL MATERIALS | 34,539,025 | ||
| REAL ESTATE - 2.1% | |||
| Equity Real Estate Investment Trusts (REITs) - 0.3% | |||
| Link (REIT) | 413,811 | 2,446,075 | |
| Real Estate Management & Development - 1.8% | |||
| China Overseas Land and Investment Ltd. | 2,431,000 | 4,639,236 | |
| China Resources Mixc Lifestyle Services Ltd. (c) | 1,142,000 | 3,346,136 | |
| KE Holdings, Inc. ADR (a) | 580,131 | 5,905,734 | |
| 13,891,106 | |||
TOTAL REAL ESTATE | 16,337,181 | ||
| TOTAL COMMON STOCKS (Cost $894,155,366) | 748,292,088 | ||
| Preferred Stocks - 1.3% | |||
| Shares | Value ($) | ||
| Convertible Preferred Stocks - 1.1% | |||
| HEALTH CARE - 0.3% | |||
| Health Care Providers & Services - 0.3% | |||
| dMed Biopharmaceutical Co. Ltd. Series C (a)(d)(e) | 275,211 | 2,468,643 | |
| INFORMATION TECHNOLOGY - 0.8% | |||
| IT Services - 0.8% | |||
| ByteDance Ltd. Series E1 (a)(d)(e) | 38,752 | 6,084,839 | |
| TOTAL CONVERTIBLE PREFERRED STOCKS | 8,553,482 | ||
| Nonconvertible Preferred Stocks - 0.2% | |||
| FINANCIALS - 0.2% | |||
| Diversified Financial Services - 0.2% | |||
| ZKH Group Ltd. Series F (e) | 3,131,343 | 1,772,027 | |
| TOTAL PREFERRED STOCKS (Cost $9,927,060) | 10,325,509 | ||
| Money Market Funds - 4.5% | |||
| Shares | Value ($) | ||
| Fidelity Cash Central Fund 3.10% (f) | 31,364,651 | 31,370,924 | |
| Fidelity Securities Lending Cash Central Fund 3.10% (f)(g) | 4,493,855 | 4,494,305 | |
| TOTAL MONEY MARKET FUNDS (Cost $35,865,229) | 35,865,229 | ||
| TOTAL INVESTMENT IN SECURITIES - 100.4% (Cost $939,947,655) | 794,482,826 |
NET OTHER ASSETS (LIABILITIES) - (0.4)% | (2,899,230) |
| NET ASSETS - 100.0% | 791,583,596 |
| (a) | Non-income producing |
| (b) | Security or a portion of the security is on loan at period end. |
| (c) | Security exempt from registration under Rule 144A of the Securities Act of 1933. These securities may be resold in transactions exempt from registration, normally to qualified institutional buyers. At the end of the period, the value of these securities amounted to $58,911,083 or 7.4% of net assets. |
| (d) | Restricted securities (including private placements) - Investment in securities not registered under the Securities Act of 1933 (excluding 144A issues). At the end of the period, the value of restricted securities (excluding 144A issues) amounted to $9,253,482 or 1.2% of net assets. |
| (e) | Level 3 security |
| (f) | Affiliated fund that is generally available only to investment companies and other accounts managed by Fidelity Investments. The rate quoted is the annualized seven-day yield of the fund at period end. A complete unaudited listing of the fund's holdings as of its most recent quarter end is available upon request. In addition, each Fidelity Central Fund's financial statements, which are not covered by the Fund's Report of Independent Registered Public Accounting Firm, are available on the SEC's website or upon request. |
| (g) | Investment made with cash collateral received from securities on loan. |
| Additional information on each restricted holding is as follows: | ||
| Security | Acquisition Date | Acquisition Cost ($) |
| ByteDance Ltd. Series E1 | 11/18/20 | 4,246,219 |
| dMed Biopharmaceutical Co. Ltd. Series C | 12/01/20 | 3,908,863 |
| Space Exploration Technologies Corp. Class A | 2/16/21 | 419,990 |
| Affiliate | Value, beginning of period ($) | Purchases ($) | Sales Proceeds ($) | Dividend Income ($) | Realized Gain (loss) ($) | Change in Unrealized appreciation (depreciation) ($) | Value, end of period ($) | % ownership, end of period |
| Fidelity Cash Central Fund 3.10% | - | 320,637,609 | 289,266,685 | 447,949 | - | - | 31,370,924 | 0.1% |
| Fidelity Securities Lending Cash Central Fund 3.10% | 38,808,345 | 130,999,930 | 165,313,970 | 104,027 | - | - | 4,494,305 | 0.0% |
| Total | 38,808,345 | 451,637,539 | 454,580,655 | 551,976 | - | - | 35,865,229 | |
| Valuation Inputs at Reporting Date: | ||||
| Description | Total ($) | Level 1 ($) | Level 2 ($) | Level 3 ($) |
Investments in Securities: | ||||
| Equities: | ||||
Communication Services | 77,344,004 | 4,202,212 | 73,141,792 | - |
Consumer Discretionary | 175,517,081 | 74,464,049 | 101,053,032 | - |
Consumer Staples | 38,923,713 | 38,923,713 | - | - |
Energy | 13,640,109 | 13,640,109 | - | - |
Financials | 127,524,291 | 22,865,078 | 102,887,186 | 1,772,027 |
Health Care | 39,557,437 | 29,788,124 | 7,300,670 | 2,468,643 |
Industrials | 27,701,275 | 27,001,275 | - | 700,000 |
Information Technology | 207,533,481 | 56,650,441 | 144,798,201 | 6,084,839 |
Materials | 34,539,025 | 34,539,025 | - | - |
Real Estate | 16,337,181 | 16,337,181 | - | - |
| Money Market Funds | 35,865,229 | 35,865,229 | - | - |
| Total Investments in Securities: | 794,482,826 | 354,276,436 | 429,180,881 | 11,025,509 |
| Investments in Securities: | |||
| Beginning Balance | $ | 9,043,807 | |
| Net Realized Gain (Loss) on Investment Securities | - | ||
| Net Unrealized Gain (Loss) on Investment Securities | 209,724 | ||
| Cost of Purchases | 1,771,978 | ||
| Proceeds of Sales | - | ||
| Amortization/Accretion | - | ||
| Transfers into Level 3 | - | ||
| Transfers out of Level 3 | - | ||
| Ending Balance | $ | 11,025,509 | |
| The change in unrealized gain (loss) for the period attributable to Level 3 securities held at October 31, 2022 | $ | 209,724 | |
| The information used in the above reconciliation represents fiscal year to date activity for any Investments in Securities identified as using Level 3 inputs at either the beginning or the end of the current fiscal period. Cost of purchases and proceeds of sales may include securities received and/or delivered through in-kind transactions. Transfers into Level 3 were attributable to a lack of observable market data resulting from decreases in market activity, decreases in liquidity, security restructurings or corporate actions. Transfers out of Level 3 were attributable to observable market data becoming available for those securities. Transfers in or out of Level 3 represent the beginning value of any Security or Instrument where a change in the pricing level occurred from the beginning to the end of the period. The cost of purchases and the proceeds of sales may include securities received or delivered through corporate actions or exchanges. Realized and unrealized gains (losses) disclosed in the reconciliation are included in Net Gain (Loss) on the Fund's Statement of Operations. | |||
| Statement of Assets and Liabilities | ||||
| October 31, 2022 | ||||
| Assets | ||||
| Investment in securities, at value (including securities loaned of $4,283,469) - See accompanying schedule: | ||||
Unaffiliated issuers (cost $904,082,426) | $758,617,597 | |||
Fidelity Central Funds (cost $35,865,229) | 35,865,229 | |||
| Total Investment in Securities (cost $939,947,655) | $ | 794,482,826 | ||
| Foreign currency held at value (cost $12,490) | 12,351 | |||
| Receivable for investments sold | 3,019,544 | |||
| Receivable for fund shares sold | 270,563 | |||
| Dividends receivable | 123,786 | |||
| Distributions receivable from Fidelity Central Funds | 118,575 | |||
| Prepaid expenses | 1,886 | |||
| Other receivables | 17,023 | |||
Total assets | 798,046,554 | |||
| Liabilities | ||||
| Payable for fund shares redeemed | 791,999 | |||
| Accrued management fee | 510,962 | |||
| Distribution and service plan fees payable | 13,132 | |||
| Other affiliated payables | 199,518 | |||
| Other payables and accrued expenses | 454,500 | |||
| Collateral on securities loaned | 4,492,847 | |||
| Total Liabilities | 6,462,958 | |||
| Net Assets | $ | 791,583,596 | ||
| Net Assets consist of: | ||||
| Paid in capital | $ | 1,079,377,804 | ||
| Total accumulated earnings (loss) | (287,794,208) | |||
| Net Assets | $ | 791,583,596 | ||
| Net Asset Value and Maximum Offering Price | ||||
| Class A : | ||||
Net Asset Value and redemption price per share ($19,362,277 ÷ 779,217 shares) (a) | $ | 24.85 | ||
| Maximum offering price per share (100/94.25 of $24.85) | $ | 26.37 | ||
| Class M : | ||||
Net Asset Value and redemption price per share ($5,802,706 ÷ 235,783 shares) (a) | $ | 24.61 | ||
| Maximum offering price per share (100/96.50 of $24.61) | $ | 25.50 | ||
| Class C : | ||||
Net Asset Value and offering price per share ($5,784,220 ÷ 245,235 shares) (a) | $ | 23.59 | ||
| China Region : | ||||
Net Asset Value , offering price and redemption price per share ($736,185,275 ÷ 29,124,186 shares) | $ | 25.28 | ||
| Class I : | ||||
Net Asset Value , offering price and redemption price per share ($20,509,186 ÷ 817,949 shares) | $ | 25.07 | ||
| Class Z : | ||||
Net Asset Value , offering price and redemption price per share ($3,939,932 ÷ 157,458 shares) | $ | 25.02 | ||
(a)Redemption price per share is equal to net asset value less any applicable contingent deferred sales charge. | ||||
| Statement of Operations | ||||
Year ended October 31, 2022 | ||||
| Investment Income | ||||
| Dividends | $ | 23,185,911 | ||
| Income from Fidelity Central Funds (including $104,027 from security lending) | 551,976 | |||
| Income before foreign taxes withheld | 23,737,887 | |||
| Less foreign taxes withheld | (2,705,582) | |||
| Total Income | 21,032,305 | |||
| Expenses | ||||
| Management fee | $ | 8,883,135 | ||
| Transfer agent fees | 2,266,172 | |||
| Distribution and service plan fees | 223,619 | |||
| Accounting fees | 587,932 | |||
| Custodian fees and expenses | 286,183 | |||
| Independent trustees' fees and expenses | 4,845 | |||
| Registration fees | 110,485 | |||
| Audit | 79,928 | |||
| Legal | 4,001 | |||
| Interest | 526 | |||
| Miscellaneous | 7,839 | |||
| Total expenses before reductions | 12,454,665 | |||
| Expense reductions | (43,578) | |||
| Total expenses after reductions | 12,411,087 | |||
| Net Investment income (loss) | 8,621,218 | |||
| Realized and Unrealized Gain (Loss) | ||||
| Net realized gain (loss) on: | ||||
| Investment Securities: | ||||
| Unaffiliated issuers | (142,368,595) | |||
| Foreign currency transactions | (506,234) | |||
| Total net realized gain (loss) | (142,874,829) | |||
| Change in net unrealized appreciation (depreciation) on: | ||||
| Investment Securities: | ||||
| Unaffiliated issuers | (593,561,868) | |||
| Assets and liabilities in foreign currencies | (318,927) | |||
| Total change in net unrealized appreciation (depreciation) | (593,880,795) | |||
| Net gain (loss) | (736,755,624) | |||
| Net increase (decrease) in net assets resulting from operations | $ | (728,134,406) | ||
| Statement of Changes in Net Assets | ||||
Year ended October 31, 2022 | Year ended October 31, 2021 | |||
| Increase (Decrease) in Net Assets | ||||
| Operations | ||||
| Net investment income (loss) | $ | 8,621,218 | $ | 8,623,201 |
| Net realized gain (loss) | (142,874,829) | 215,813,605 | ||
| Change in net unrealized appreciation (depreciation) | (593,880,795) | (207,138,507) | ||
| Net increase (decrease) in net assets resulting from operations | (728,134,406) | 17,298,299 | ||
| Distributions to shareholders | (163,021,571) | (94,181,422) | ||
| Share transactions - net increase (decrease) | (137,715,540) | 197,486,715 | ||
| Total increase (decrease) in net assets | (1,028,871,517) | 120,603,592 | ||
| Net Assets | ||||
| Beginning of period | 1,820,455,113 | 1,699,851,521 | ||
| End of period | $ | 791,583,596 | $ | 1,820,455,113 |
| Fidelity Advisor® China Region Fund Class A |
| Years ended October 31, | 2022 | 2021 | 2020 | 2019 | 2018 | |||||
Selected Per-Share Data | ||||||||||
| Net asset value, beginning of period | $ | 50.32 | $ | 50.90 | $ | 35.86 | $ | 28.73 | $ | 34.22 |
| Income from Investment Operations | ||||||||||
Net investment income (loss) A,B | .14 | .06 | .08 | .15 | .15 | |||||
| Net realized and unrealized gain (loss) | (20.99) | 1.95 | 15.11 | 7.10 | (5.56) | |||||
| Total from investment operations | (20.85) | 2.01 | 15.19 | 7.25 | (5.41) | |||||
| Distributions from net investment income | - | (.44) | (.15) | (.12) | (.08) | |||||
| Distributions from net realized gain | (4.62) | (2.16) | - | - | - | |||||
| Total distributions | (4.62) | (2.59) C | (.15) | (.12) | (.08) | |||||
Redemption fees added to paid in capital A | - | - | - | - | - D | |||||
| Net asset value, end of period | $ | 24.85 | $ | 50.32 | $ | 50.90 | $ | 35.86 | $ | 28.73 |
Total Return E,F | (45.20)% | 3.65% | 42.52% | 25.30% | (15.86)% | |||||
Ratios to Average Net Assets B,G,H | ||||||||||
| Expenses before reductions | 1.23% | 1.21% | 1.24% | 1.27% | 1.27% | |||||
| Expenses net of fee waivers, if any | 1.22% | 1.21% | 1.24% | 1.26% | 1.27% | |||||
| Expenses net of all reductions | 1.22% | 1.21% | 1.22% | 1.26% | 1.24% | |||||
| Net investment income (loss) | .38% | .11% | .18% | .44% | .43% | |||||
| Supplemental Data | ||||||||||
| Net assets, end of period (000 omitted) | $ | 19,362 | $ | 45,301 | $ | 39,303 | $ | 29,963 | $ | 23,424 |
Portfolio turnover rate I | 20% | 60% | 60% | 80% | 60% |
| Fidelity Advisor® China Region Fund Class M |
| Years ended October 31, | 2022 | 2021 | 2020 | 2019 | 2018 | |||||
Selected Per-Share Data | ||||||||||
| Net asset value, beginning of period | $ | 50.02 | $ | 50.64 | $ | 35.66 | $ | 28.55 | $ | 34.05 |
| Income from Investment Operations | ||||||||||
Net investment income (loss) A,B | .03 | (.10) | (.05) | .04 | .03 | |||||
| Net realized and unrealized gain (loss) | (20.82) | 1.96 | 15.04 | 7.07 | (5.53) | |||||
| Total from investment operations | (20.79) | 1.86 | 14.99 | 7.11 | (5.50) | |||||
| Distributions from net investment income | - | (.32) | (.01) | - | - | |||||
| Distributions from net realized gain | (4.62) | (2.16) | - | - | - | |||||
| Total distributions | (4.62) | (2.48) | (.01) | - | - | |||||
Redemption fees added to paid in capital A | - | - | - | - | - C | |||||
| Net asset value, end of period | $ | 24.61 | $ | 50.02 | $ | 50.64 | $ | 35.66 | $ | 28.55 |
Total Return D,E | (45.37)% | 3.36% | 42.04% | 24.90% | (16.15)% | |||||
Ratios to Average Net Assets B,F,G | ||||||||||
| Expenses before reductions | 1.53% | 1.50% | 1.56% | 1.59% | 1.62% | |||||
| Expenses net of fee waivers, if any | 1.53% | 1.50% | 1.56% | 1.59% | 1.62% | |||||
| Expenses net of all reductions | 1.53% | 1.50% | 1.53% | 1.58% | 1.58% | |||||
| Net investment income (loss) | .08% | (.18)% | (.13)% | .12% | .08% | |||||
| Supplemental Data | ||||||||||
| Net assets, end of period (000 omitted) | $ | 5,803 | $ | 12,623 | $ | 12,028 | $ | 9,251 | $ | 8,132 |
Portfolio turnover rate H | 20% | 60% | 60% | 80% | 60% |
| Fidelity Advisor® China Region Fund Class C |
| Years ended October 31, | 2022 | 2021 | 2020 | 2019 | 2018 | |||||
Selected Per-Share Data | ||||||||||
| Net asset value, beginning of period | $ | 48.34 | $ | 49.10 | $ | 34.71 | $ | 27.90 | $ | 33.41 |
| Income from Investment Operations | ||||||||||
Net investment income (loss) A,B | (.13) | (.35) | (.22) | (.09) | (.11) | |||||
| Net realized and unrealized gain (loss) | (20.00) | 1.92 | 14.61 | 6.90 | (5.40) | |||||
| Total from investment operations | (20.13) | 1.57 | 14.39 | 6.81 | (5.51) | |||||
| Distributions from net investment income | - | (.17) | - | - | - | |||||
| Distributions from net realized gain | (4.62) | (2.16) | - | - | - | |||||
| Total distributions | (4.62) | (2.33) | - | - | - | |||||
Redemption fees added to paid in capital A | - | - | - | - | - C | |||||
| Net asset value, end of period | $ | 23.59 | $ | 48.34 | $ | 49.10 | $ | 34.71 | $ | 27.90 |
Total Return D,E | (45.60)% | 2.89% | 41.46% | 24.41% | (16.49)% | |||||
Ratios to Average Net Assets B,F,G | ||||||||||
| Expenses before reductions | 1.96% | 1.96% | 1.98% | 2.00% | 2.01% | |||||
| Expenses net of fee waivers, if any | 1.96% | 1.96% | 1.98% | 2.00% | 2.01% | |||||
| Expenses net of all reductions | 1.96% | 1.96% | 1.96% | 1.99% | 1.98% | |||||
| Net investment income (loss) | (.36)% | (.65)% | (.55)% | (.29)% | (.31)% | |||||
| Supplemental Data | ||||||||||
| Net assets, end of period (000 omitted) | $ | 5,784 | $ | 13,168 | $ | 11,308 | $ | 9,437 | $ | 10,138 |
Portfolio turnover rate H | 20% | 60% | 60% | 80% | 60% |
| Fidelity® China Region Fund |
| Years ended October 31, | 2022 | 2021 | 2020 | 2019 | 2018 | |||||
Selected Per-Share Data | ||||||||||
| Net asset value, beginning of period | $ | 51.03 | $ | 51.53 | $ | 36.30 | $ | 29.11 | $ | 34.64 |
| Income from Investment Operations | ||||||||||
Net investment income (loss) A,B | .25 | .23 | .21 | .25 | .26 | |||||
| Net realized and unrealized gain (loss) | (21.32) | 1.97 | 15.28 | 7.19 | (5.65) | |||||
| Total from investment operations | (21.07) | 2.20 | 15.49 | 7.44 | (5.39) | |||||
| Distributions from net investment income | (.06) | (.54) | (.26) | (.25) | (.14) | |||||
| Distributions from net realized gain | (4.62) | (2.16) | - | - | - | |||||
| Total distributions | (4.68) | (2.70) | (.26) | (.25) | (.14) | |||||
Redemption fees added to paid in capital A | - | - | - | - | - C | |||||
| Net asset value, end of period | $ | 25.28 | $ | 51.03 | $ | 51.53 | $ | 36.30 | $ | 29.11 |
Total Return D | (45.04)% | 3.97% | 42.95% | 25.72% | (15.62)% | |||||
Ratios to Average Net Assets B,E,F | ||||||||||
| Expenses before reductions | .94% | .91% | .93% | .95% | .96% | |||||
| Expenses net of fee waivers, if any | .93% | .91% | .93% | .95% | .96% | |||||
| Expenses net of all reductions | .93% | .91% | .91% | .95% | .93% | |||||
| Net investment income (loss) | .67% | .41% | .49% | .76% | .74% | |||||
| Supplemental Data | ||||||||||
| Net assets, end of period (000 omitted) | $ | 736,185 | $ | 1,609,326 | $ | 1,518,404 | $ | 1,093,827 | $ | 969,679 |
Portfolio turnover rate G | 20% | 60% | 60% | 80% | 60% |
| Fidelity Advisor® China Region Fund Class I |
| Years ended October 31, | 2022 | 2021 | 2020 | 2019 | 2018 | |||||
Selected Per-Share Data | ||||||||||
| Net asset value, beginning of period | $ | 50.63 | $ | 51.16 | $ | 36.05 | $ | 28.90 | $ | 34.41 |
| Income from Investment Operations | ||||||||||
Net investment income (loss) A,B | .25 | .22 | .20 | .25 | .26 | |||||
| Net realized and unrealized gain (loss) | (21.15) | 1.96 | 15.17 | 7.13 | (5.61) | |||||
| Total from investment operations | (20.90) | 2.18 | 15.37 | 7.38 | (5.35) | |||||
| Distributions from net investment income | (.04) | (.55) | (.26) | (.23) | (.16) | |||||
| Distributions from net realized gain | (4.62) | (2.16) | - | - | - | |||||
| Total distributions | (4.66) | (2.71) | (.26) | (.23) | (.16) | |||||
Redemption fees added to paid in capital A | - | - | - | - | - C | |||||
| Net asset value, end of period | $ | 25.07 | $ | 50.63 | $ | 51.16 | $ | 36.05 | $ | 28.90 |
Total Return D | (45.05)% | 3.96% | 42.91% | 25.71% | (15.63)% | |||||
Ratios to Average Net Assets B,E,F | ||||||||||
| Expenses before reductions | .93% | .93% | .95% | .97% | .98% | |||||
| Expenses net of fee waivers, if any | .93% | .93% | .95% | .96% | .98% | |||||
| Expenses net of all reductions | .93% | .93% | .93% | .96% | .95% | |||||
| Net investment income (loss) | .68% | .39% | .48% | .74% | .72% | |||||
| Supplemental Data | ||||||||||
| Net assets, end of period (000 omitted) | $ | 20,509 | $ | 68,464 | $ | 47,688 | $ | 27,410 | $ | 20,854 |
Portfolio turnover rate G | 20% | 60% | 60% | 80% | 60% |
| Fidelity Advisor® China Region Fund Class Z |
| Years ended October 31, | 2022 | 2021 | 2020 | 2019 | 2018 A | |||||
Selected Per-Share Data | ||||||||||
| Net asset value, beginning of period | $ | 50.57 | $ | 51.07 | $ | 36.00 | $ | 28.91 | $ | 32.63 |
| Income from Investment Operations | ||||||||||
Net investment income (loss) B,C | .30 | .29 | .26 | .30 | .01 | |||||
| Net realized and unrealized gain (loss) | (21.10) | 1.95 | 15.14 | 7.11 | (3.73) | |||||
| Total from investment operations | (20.80) | 2.24 | 15.40 | 7.41 | (3.72) | |||||
| Distributions from net investment income | (.12) | (.59) | (.33) | (.32) | - | |||||
| Distributions from net realized gain | (4.62) | (2.16) | - | - | - | |||||
| Total distributions | (4.75) D | (2.74) D | (.33) | (.32) | - | |||||
| Net asset value, end of period | $ | 25.02 | $ | 50.57 | $ | 51.07 | $ | 36.00 | $ | 28.91 |
Total Return E,F | (44.97)% | 4.09% | 43.13% | 25.86% | (11.40)% | |||||
Ratios to Average Net Assets C,G,H | ||||||||||
| Expenses before reductions | .80% | .80% | .81% | .82% | .91% I | |||||
| Expenses net of fee waivers, if any | .80% | .80% | .81% | .82% | .90% I | |||||
| Expenses net of all reductions | .80% | .80% | .79% | .81% | .87% I | |||||
| Net investment income (loss) | .81% | .52% | .61% | .89% | .57% I | |||||
| Supplemental Data | ||||||||||
| Net assets, end of period (000 omitted) | $ | 3,940 | $ | 71,573 | $ | 71,121 | $ | 46,861 | $ | 323 |
Portfolio turnover rate J | 20% | 60% | 60% | 80% | 60% I |
| Fidelity Central Fund | Investment Manager | Investment Objective | Investment Practices | Expense Ratio A |
| Fidelity Money Market Central Funds | Fidelity Management & Research Company LLC (FMR) | Each fund seeks to obtain a high level of current income consistent with the preservation of capital and liquidity. | Short-term Investments | Less than .005% |
| Asset Type | Fair Value | Valuation Technique(s) | Unobservable Input | Amount or Range/Weighted Average | Impact to Valuation from an Increase in Input A |
| Equities | $11,025,509 | Market comparable | Enterprise value/Revenue multiple (EV/R) | 3.8 - 7.1 / 4.1 | Increase |
| Market approach | Discount rate | 49.5% | Decrease | ||
| Transaction price | $0.57 - $17.75 / $10.57 | Increase |
| Gross unrealized appreciation | $136,275,384 |
| Gross unrealized depreciation | (300,174,920) |
| Net unrealized appreciation (depreciation) | $(163,899,536) |
| Tax Cost | $958,382,362 |
| Undistributed ordinary income | $10,404,661 |
| Capital loss carryforward | $(133,977,706) |
| Net unrealized appreciation (depreciation) on securities and other investments | $(164,221,163) |
Short-term | $(99,049,173) |
Long-term | (34,928,533) |
| Total capital loss carryforward | $(133,977,706) |
| October 31, 2022 | October 31, 2021 | |
| Ordinary Income | $1,969,102 | $81,944,292 |
| Long-term Capital Gains | 161,052,469 | 12,237,130 |
| Total | $163,021,571 | $94,181,422 |
| Purchases ($) | Sales ($) | |
| Fidelity China Region Fund | 256,407,681 | 576,383,575 |
| Distribution Fee | Service Fee | Total Fees | Retained by FDC | |
| Class A | - % | .25% | $87,082 | $1,354 |
| Class M | .25% | .25% | 45,323 | 80 |
| Class C | .75% | .25% | 91,214 | 21,726 |
| $223,619 | $23,160 |
| Retained by FDC | |
| Class A | $5,553 |
| Class M | 998 |
Class C A | 70 |
| $6,621 |
| Amount | % of Class-Level Average Net Assets | |
| Class A | $75,643 | .22 |
| Class M | 24,416 | .27 |
| Class C | 18,493 | .20 |
| China Region | 2,056,995 | .18 |
| Class I | 68,913 | .17 |
| Class Z | 21,712 | .04 |
| $2,266,172 |
| % of Average Net Assets | |
| Fidelity China Region Fund | .04 |
| Amount | |
| Fidelity China Region Fund | $1,709 |
| Borrower or Lender | Average Loan Balance | Weighted Average Interest Rate | Interest Expense | |
| Fidelity China Region Fund | Borrower | $ 4,906,818 | .31% | $ 464 |
| Purchases ($) | Sales ($) | Realized Gain (Loss) ($) | |
| Fidelity China Region Fund | 9,700,900 | 1,644,183 | (2,050,646) |
| Amount ($) | |
| Fidelity China Region Fund | 3,205 |
| Amount | |
| Fidelity China Region Fund | $2,412 |
| Total Security Lending Fees Paid to NFS | Security Lending Income From Securities Loaned to NFS | Value of Securities Loaned to NFS at Period End | |
| Fidelity China Region Fund | $10,805 | $- | $- |
| Average Loan Balance | Weighted Average Interest Rate | Interest Expense | |
| Fidelity China Region Fund | $967,750 | .58% | $62 |
Year ended October 31, 2022 | Year ended October 31, 2021 | |
| Fidelity China Region Fund | ||
| Class A | $4,134,709 | $2,089,736 |
| Class M | 1,142,842 | 603,440 |
| Class C | 1,227,041 | 569,251 |
| China Region | 144,410,750 | 83,672,749 |
| Class I | 5,718,145 | 2,974,817 |
| Class Z | 6,388,084 | 4,271,429 |
Total | $163,021,571 | $94,181,422 |
| Shares | Shares | Dollars | Dollars | |
| Year ended October 31, 2022 | Year ended October 31, 2021 | Year ended October 31, 2022 | Year ended October 31, 2021 | |
| Fidelity China Region Fund | ||||
| Class A | ||||
| Shares sold | 167,076 | 412,947 | $ 6,290,832 | $ 23,655,622 |
| Reinvestment of distributions | 93,787 | 37,370 | 3,954,050 | 1,998,564 |
| Shares redeemed | (381,933) | (322,190) | (12,663,126) | (17,301,503) |
| Net increase (decrease) | (121,070) | 128,127 | $(2,418,244) | $8,352,683 |
| Class M | ||||
| Shares sold | 14,193 | 85,266 | $518,243 | $ 5,026,895 |
| Reinvestment of distributions | 27,154 | 11,219 | 1,136,944 | 597,960 |
| Shares redeemed | (57,927) | (81,626) | (2,269,682) | (4,472,103) |
| Net increase (decrease) | (16,580) | 14,859 | $(614,495) | $1,152,752 |
| Class C | ||||
| Shares sold | 52,147 | 130,300 | $ 1,830,320 | $7,093,045 |
| Reinvestment of distributions | 28,637 | 10,599 | 1,153,507 | 548,200 |
| Shares redeemed | (107,986) | (98,762) | (4,068,826) | (5,268,045) |
| Net increase (decrease) | (27,202) | 42,137 | $(1,084,999) | $2,373,200 |
| China Region | ||||
| Shares sold | 4,318,983 | 13,958,356 | $ 163,821,858 | $817,280,904 |
| Reinvestment of distributions | 3,187,084 | 1,469,668 | 136,311,566 | 79,494,358 |
| Shares redeemed | (9,920,317) | (13,356,838) | (380,571,112) | (741,842,711) |
| Net increase (decrease) | (2,414,250) | 2,071,186 | $(80,437,688) | $154,932,551 |
| Class I | ||||
| Shares sold | 518,992 | 1,514,190 | $ 19,260,467 | $ 87,084,728 |
| Reinvestment of distributions | 117,730 | 47,711 | 4,994,105 | 2,560,644 |
| Shares redeemed | (1,171,014) | (1,141,702) | (44,285,642) | (61,526,332) |
| Net increase (decrease) | (534,292) | 420,199 | $(20,031,070) | $28,119,040 |
| Class Z | ||||
| Shares sold | 625,286 | 985,463 | $23,658,178 | $56,944,564 |
| Reinvestment of distributions | 148,353 | 78,962 | 6,272,360 | 4,227,602 |
| Shares redeemed | (2,031,604) | (1,041,575) | (63,059,582) | (58,615,677) |
| Net increase (decrease) | (1,257,965) | 22,850 | $(33,129,044) | $2,556,489 |
| Average Annual Total Returns | |||
Periods ended October 31, 2022 | Past 1 year | Past 5 years | Past 10 years |
| Fidelity® Emerging Asia Fund | -46.77% | 0.05% | 5.01% |
| $10,000 Over 10 Years |
Let's say hypothetically that $10,000 was invested in Fidelity® Emerging Asia Fund on October 31, 2012. The chart shows how the value of your investment would have changed, and also shows how the MSCI AC (All Country) Asia ex Japan Index performed over the same period. |
 |
Top Holdings (% of Fund's net assets) | ||
| Taiwan Semiconductor Manufacturing Co. Ltd. (Taiwan, Semiconductors & Semiconductor Equipment) | 7.4 | |
| Samsung Electronics Co. Ltd. (Korea (South), Technology Hardware, Storage & Peripherals) | 5.8 | |
| Alibaba Group Holding Ltd. sponsored ADR (Cayman Islands, Internet & Direct Marketing Retail) | 3.8 | |
| Reliance Industries Ltd. (India, Oil, Gas & Consumable Fuels) | 3.6 | |
| Zomato Ltd. (India, Internet & Direct Marketing Retail) | 3.4 | |
| Pinduoduo, Inc. ADR (Cayman Islands, Internet & Direct Marketing Retail) | 3.3 | |
| Alibaba Group Holding Ltd. (Cayman Islands, Internet & Direct Marketing Retail) | 3.0 | |
| Money Forward, Inc. (Japan, Software) | 1.9 | |
| AIA Group Ltd. (Hong Kong, Insurance) | 1.6 | |
| Sungrow Power Supply Co. Ltd. (A Shares) (China, Electrical Equipment) | 1.6 | |
| 35.4 | ||
| Market Sectors (% of Fund's net assets) | ||
| Information Technology | 33.6 | |
| Consumer Discretionary | 23.5 | |
| Financials | 11.6 | |
| Health Care | 10.0 | |
| Industrials | 7.9 | |
| Communication Services | 5.2 | |
| Energy | 3.6 | |
| Materials | 2.0 | |
| Consumer Staples | 1.8 | |
| Real Estate | 1.4 | |
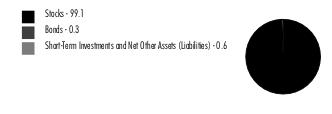
Asset Allocation (% of Fund's net assets) |
 |
Short-Term Investments and Net Other Assets (Liabilities) - (0.6)%* |
Foreign investments - 96% |
*Short-Term Investments and Net Other Assets (Liabilities) are not available in the pie chart. |
Geographic Diversification (% of Fund's net assets) |
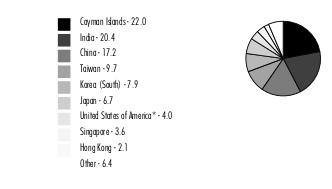 |
* Includes Short-Term investments and Net Other Assets (Liabilities). Percentages are based on country or territory of incorporation and are adjusted for the effect of futures contracts, if applicable. |
| Common Stocks - 98.5% | |||
| Shares | Value ($) | ||
| Bermuda - 0.3% | |||
| Huanxi Media Group Ltd. (a) | 20,349,015 | 2,333,112 | |
| Cayman Islands - 21.4% | |||
| Agora, Inc. ADR (a) | 470,000 | 1,311,300 | |
| Akeso, Inc. (a)(b)(c) | 1,402,636 | 5,628,663 | |
| Alibaba Group Holding Ltd. (a) | 3,177,201 | 24,702,441 | |
| Alibaba Group Holding Ltd. sponsored ADR (a) | 487,837 | 31,016,676 | |
| Antengene Corp. (a)(c) | 3,408,163 | 1,445,820 | |
| Archosaur Games, Inc. (a)(c) | 2,297,989 | 661,616 | |
| Bairong, Inc. (a)(c) | 1,914,735 | 1,948,970 | |
| BC Technology Group Ltd. (a) | 3,282,217 | 886,447 | |
| Bilibili, Inc. ADR (a)(b) | 448,494 | 4,000,566 | |
| Boqii Holding Ltd. ADR (a)(b) | 143,483 | 172,180 | |
| Frontage Holdings Corp. (a)(c) | 18,654,894 | 4,206,450 | |
| Innovent Biologics, Inc. (a)(c) | 768,779 | 2,722,676 | |
| Jacobio Pharmaceuticals Group Co. Ltd. (a)(b)(c) | 1,258,030 | 554,519 | |
| Kangji Medical Holdings Ltd. (b) | 1,511,945 | 1,223,093 | |
| KE Holdings, Inc. ADR (a) | 1,008,634 | 10,267,894 | |
| Kindstar Globalgene Technology, Inc. (a)(c) | 6,775,265 | 1,545,002 | |
| Li Auto, Inc. Class A (a) | 656,110 | 4,475,956 | |
| Medlive Technology Co. Ltd. (b)(c) | 912,600 | 788,243 | |
| Meituan Class B (a)(c) | 777,523 | 12,448,568 | |
| Microport Cardioflow Medtech Corp. (a)(b)(c) | 13,066,502 | 3,961,740 | |
| Ming Yuan Cloud Group Holdings Ltd. (b) | 5,800,622 | 2,667,666 | |
| New Horizon Health Ltd. (a)(c) | 2,021,115 | 4,505,871 | |
| Pinduoduo, Inc. ADR (a) | 498,225 | 27,317,677 | |
| RLX Technology, Inc. ADR (a)(b) | 746,592 | 933,240 | |
| Sea Ltd. ADR (a) | 225,481 | 11,201,896 | |
| Smoore International Holdings Ltd. (b)(c) | 1,555,176 | 1,654,306 | |
| Sunac China Holdings Ltd. (a)(d) | 4,892,796 | 1,246,628 | |
| Tencent Holdings Ltd. | 109,001 | 2,864,197 | |
| Wuxi Biologics (Cayman), Inc. (a)(c) | 1,420,161 | 6,390,217 | |
| Zai Lab Ltd. (a) | 493,310 | 1,136,235 | |
| Zai Lab Ltd. ADR (a) | 100,879 | 2,247,584 | |
TOTAL CAYMAN ISLANDS | 176,134,337 | ||
| China - 16.6% | |||
| Anhui Korrun Co. Ltd. (A Shares) | 1,368,261 | 2,568,686 | |
| Asymchem Laboratories Tianjin Co. Ltd. (H Shares) (c) | 36,372 | 389,221 | |
| Beijing Shiji Information Technology Co. Ltd. (A Shares) | 5,820,525 | 10,074,277 | |
| Beijing Sinohytec Co. Ltd. (A Shares) | 457,780 | 5,156,442 | |
| DBAPPSecurity Ltd. (A Shares) (a) | 74,300 | 2,100,736 | |
| Empyrean Technology Co. Ltd. (A Shares) | 251,300 | 3,915,282 | |
| Estun Automation Co. Ltd.: | |||
| (A Shares) | 3,303,300 | 8,906,322 | |
| (A Shares) | 1,096,728 | 2,956,986 | |
| Glodon Co. Ltd. (A Shares) | 658,500 | 4,458,890 | |
| Guangzhou GRG Metrology & Test Co. Ltd. (A Shares) | 1,076,590 | 2,522,348 | |
| Guangzhou Kingmed Diagnostics Group Co. Ltd. (A Shares) | 580,032 | 6,001,344 | |
| Guizhou Zhenhua E-Chem, Inc. (A Shares) | 568,200 | 3,970,374 | |
| Hangzhou Tigermed Consulting Co. Ltd. (A Shares) | 496,697 | 5,668,939 | |
| Hundsun Technologies, Inc. (A Shares) | 1,216,686 | 6,944,018 | |
| Jiangxi Copper Co. Ltd. (A Shares) | 2,282,200 | 4,812,592 | |
| Joinn Laboratories China Co. Ltd. (A Shares) | 649,586 | 5,086,996 | |
| MicroTech Medical (Hangzhou) Co. Ltd. (H Shares) (a)(c) | 1,296,269 | 1,005,685 | |
| Milkyway Chemical Supply Chain Service Co. Ltd. (A Shares) | 7,906 | 124,086 | |
| Pharmaron Beijing Co. Ltd. (A Shares) | 587,518 | 4,183,398 | |
| Shanghai Milkground Food Tech Co. Ltd. (A Shares) (a) | 907,500 | 3,459,557 | |
| Shenzhen Inovance Technology Co. Ltd. (A Shares) | 1,176,032 | 10,741,121 | |
| Shenzhen Mindray Bio-Medical Electronics Co. Ltd. (A Shares) | 206,989 | 9,224,075 | |
| Shenzhen Transsion Holdings Co. Ltd. (A Shares) | 204,800 | 1,742,352 | |
| Sungrow Power Supply Co. Ltd. (A Shares) | 758,242 | 13,529,739 | |
| Venus MedTech Hangzhou, Inc. (H Shares) (a)(c) | 2,075,543 | 2,551,577 | |
| Weihai Guangwei Composites Co. Ltd. (A Shares) | 721,160 | 7,662,985 | |
| WuXi AppTec Co. Ltd. (H Shares) (c) | 906,459 | 7,263,543 | |
TOTAL CHINA | 137,021,571 | ||
| Germany - 1.6% | |||
| Delivery Hero AG (a)(c) | 317,931 | 10,462,767 | |
| Shop Apotheke Europe NV (a)(c) | 56,360 | 2,336,521 | |
TOTAL GERMANY | 12,799,288 | ||
| Hong Kong - 2.1% | |||
| AIA Group Ltd. | 1,809,663 | 13,707,825 | |
| Hong Kong Exchanges and Clearing Ltd. | 150,788 | 4,002,459 | |
TOTAL HONG KONG | 17,710,284 | ||
| India - 20.4% | |||
| Amber Enterprises India Ltd. (a) | 79,174 | 1,975,094 | |
| Asian Paints Ltd. | 115,382 | 4,331,634 | |
| Aster DM Healthcare Ltd. (a)(c) | 690,539 | 2,062,941 | |
| Bajaj Finance Ltd. | 42,864 | 3,699,260 | |
| Computer Age Management Services Private Ltd. | 346,099 | 10,657,867 | |
| Delhivery Private Ltd. | 468,670 | 1,948,734 | |
| Devyani International Ltd. (a) | 1,731,760 | 4,049,072 | |
| Dixon Technologies India Ltd. | 145,137 | 7,918,891 | |
| HDFC Asset Management Co. Ltd. (c) | 163,379 | 4,094,541 | |
| HDFC Bank Ltd. (a) | 269,776 | 4,895,870 | |
| Hindustan Aeronautics Ltd. | 331,905 | 10,144,192 | |
| Housing Development Finance Corp. Ltd. | 310,865 | 9,274,878 | |
| Indian Energy Exchange Ltd. (c) | 2,277,898 | 3,849,697 | |
| Infosys Ltd. | 628,990 | 11,683,577 | |
| Kotak Mahindra Bank Ltd. | 220,577 | 5,067,968 | |
| Page Industries Ltd. | 5,590 | 3,360,797 | |
| Reliance Industries Ltd. | 967,228 | 29,790,342 | |
| Sapphire Foods India Ltd. | 248,354 | 4,341,695 | |
| Tata Consultancy Services Ltd. | 183,364 | 7,073,070 | |
| Tata Motors Ltd. (a) | 1,222,156 | 6,118,961 | |
| Vijaya Diagnostic Centre Pvt Ltd. | 196,617 | 1,038,189 | |
| Voltas Ltd. | 266,715 | 2,823,094 | |
| Zomato Ltd. (a) | 36,458,107 | 27,790,608 | |
TOTAL INDIA | 167,990,972 | ||
| Indonesia - 0.6% | |||
| PT Bank Central Asia Tbk | 8,503,316 | 4,797,511 | |
| Japan - 6.7% | |||
| BASE, Inc. (a)(b) | 1,270,562 | 2,392,531 | |
| Demae-Can Co. Ltd. (a)(b) | 887,268 | 2,899,978 | |
| Freee KK (a)(b) | 356,666 | 6,980,047 | |
| Hennge K.K. (a)(b) | 574,687 | 4,077,439 | |
| Lifenet Insurance Co. (a) | 431,180 | 2,882,363 | |
| Money Forward, Inc. (a) | 552,321 | 15,749,292 | |
| SHIFT, Inc. (a) | 40,115 | 6,288,582 | |
| Uzabase, Inc. (a) | 469,267 | 2,247,003 | |
| Z Holdings Corp. | 4,681,573 | 12,082,015 | |
TOTAL JAPAN | 55,599,250 | ||
| Korea (South) - 7.0% | |||
| Gabia, Inc. | 128,155 | 915,829 | |
| ILJIN Hysolus Co. Ltd. (a) | 4,000 | 85,475 | |
| Kakao Pay Corp. (a)(b) | 199,726 | 4,946,553 | |
| LG Energy Solution (a) | 3,400 | 1,257,742 | |
| Samsung Electronics Co. Ltd. | 1,143,662 | 47,595,159 | |
| SK Hynix, Inc. | 46,680 | 2,704,674 | |
TOTAL KOREA (SOUTH) | 57,505,432 | ||
| Mauritius - 1.2% | |||
| MakeMyTrip Ltd. (a) | 349,598 | 9,729,312 | |
| Netherlands - 1.3% | |||
| ASML Holding NV (Netherlands) | 8,193 | 3,843,231 | |
| NXP Semiconductors NV | 41,362 | 6,042,161 | |
| Yandex NV Series A (a)(b)(d) | 153,309 | 525,825 | |
TOTAL NETHERLANDS | 10,411,217 | ||
| Singapore - 3.6% | |||
| DBS Group Holdings Ltd. | 303,000 | 7,320,288 | |
| Oversea-Chinese Banking Corp. Ltd. | 1,253,000 | 10,736,712 | |
| United Overseas Bank Ltd. | 596,000 | 11,687,595 | |
TOTAL SINGAPORE | 29,744,595 | ||
| Taiwan - 9.7% | |||
| GlobalWafers Co. Ltd. | 269,000 | 2,989,908 | |
| MediaTek, Inc. | 167,000 | 3,054,815 | |
| Taiwan Semiconductor Manufacturing Co. Ltd. | 5,049,892 | 60,651,573 | |
| Taiwan Semiconductor Manufacturing Co. Ltd. sponsored ADR | 214,918 | 13,228,203 | |
TOTAL TAIWAN | 79,924,499 | ||
| United Kingdom - 1.0% | |||
| Yunnan Botanee Bio-Technology Group Co. Ltd. ELS (UBS AG London Branch Bank Warrant Programme) Class A warrants 3/23/23 (a)(c) | 183,325 | 3,589,734 | |
| ZWSOFT Co. Ltd. (Guangzhou) ELS (UBS AG London Branch Bank Warrant Programme) Class A warrants 10/12/23 (a)(c) | 150,920 | 4,653,517 | |
TOTAL UNITED KINGDOM | 8,243,251 | ||
| United States of America - 4.6% | |||
| Array Technologies, Inc. (a) | 333,152 | 6,030,051 | |
| ATRenew, Inc. ADR (a)(b) | 176,025 | 290,441 | |
| Li Auto, Inc. ADR (a) | 491,158 | 6,689,572 | |
| NVIDIA Corp. | 68,482 | 9,243,016 | |
| onsemi (a) | 103,144 | 6,336,136 | |
| Smart Share Global Ltd. ADR (a)(b) | 726,500 | 544,875 | |
| Snap, Inc. Class A (a) | 820,742 | 8,133,553 | |
| Space Exploration Technologies Corp. Class A (a)(d)(e) | 11,000 | 770,000 | |
TOTAL UNITED STATES OF AMERICA | 38,037,644 | ||
| Vietnam - 0.4% | |||
| Vietnam Dairy Products Corp. | 1,043,400 | 3,296,052 | |
| TOTAL COMMON STOCKS (Cost $1,123,594,412) | 811,278,327 | ||
| Preferred Stocks - 2.1% | |||
| Shares | Value ($) | ||
| Convertible Preferred Stocks - 0.6% | |||
| China - 0.6% | |||
| ByteDance Ltd. Series E1 (a)(d)(e) | 23,366 | 3,668,929 | |
| dMed Biopharmaceutical Co. Ltd. Series C (a)(d)(e) | 128,423 | 1,151,954 | |
| 4,820,883 | |||
| Nonconvertible Preferred Stocks - 1.5% | |||
| Cayman Islands - 0.6% | |||
| ZKH Group Ltd. Series F (d) | 8,603,093 | 4,868,490 | |
| Korea (South) - 0.9% | |||
| Samsung Electronics Co. Ltd. | 212,625 | 7,939,994 | |
TOTAL NONCONVERTIBLE PREFERRED STOCKS | 12,808,484 | ||
| TOTAL PREFERRED STOCKS (Cost $16,518,507) | 17,629,367 | ||
| Money Market Funds - 4.0% | |||
| Shares | Value ($) | ||
| Fidelity Cash Central Fund 3.10% (f) | 180,333 | 180,369 | |
| Fidelity Securities Lending Cash Central Fund 3.10% (f)(g) | 32,541,905 | 32,545,160 | |
| TOTAL MONEY MARKET FUNDS (Cost $32,725,529) | 32,725,529 | ||
| TOTAL INVESTMENT IN SECURITIES - 104.6% (Cost $1,172,838,448) | 861,633,223 |
NET OTHER ASSETS (LIABILITIES) - (4.6)% | (38,106,365) |
| NET ASSETS - 100.0% | 823,526,858 |
| ELS | - | EQUITY-LINKED SECURITY |
| (a) | Non-income producing |
| (b) | Security or a portion of the security is on loan at period end. |
| (c) | Security exempt from registration under Rule 144A of the Securities Act of 1933. These securities may be resold in transactions exempt from registration, normally to qualified institutional buyers. At the end of the period, the value of these securities amounted to $90,722,405 or 11.0% of net assets. |
| (d) | Level 3 security |
| (e) | Restricted securities (including private placements) - Investment in securities not registered under the Securities Act of 1933 (excluding 144A issues). At the end of the period, the value of restricted securities (excluding 144A issues) amounted to $5,590,883 or 0.7% of net assets. |
| (f) | Affiliated fund that is generally available only to investment companies and other accounts managed by Fidelity Investments. The rate quoted is the annualized seven-day yield of the fund at period end. A complete unaudited listing of the fund's holdings as of its most recent quarter end is available upon request. In addition, each Fidelity Central Fund's financial statements, which are not covered by the Fund's Report of Independent Registered Public Accounting Firm, are available on the SEC's website or upon request. |
| (g) | Investment made with cash collateral received from securities on loan. |
| Additional information on each restricted holding is as follows: | ||
| Security | Acquisition Date | Acquisition Cost ($) |
| ByteDance Ltd. Series E1 | 11/18/20 | 2,560,310 |
| dMed Biopharmaceutical Co. Ltd. Series C | 12/01/20 | 1,824,011 |
| Space Exploration Technologies Corp. Class A | 2/16/21 | 461,989 |
| Affiliate | Value, beginning of period ($) | Purchases ($) | Sales Proceeds ($) | Dividend Income ($) | Realized Gain (loss) ($) | Change in Unrealized appreciation (depreciation) ($) | Value, end of period ($) | % ownership, end of period |
| Fidelity Cash Central Fund 3.10% | 169 | 364,508,864 | 364,328,664 | 227,556 | - | - | 180,369 | 0.0% |
| Fidelity Securities Lending Cash Central Fund 3.10% | 124,530,059 | 315,269,904 | 407,254,803 | 620,956 | - | - | 32,545,160 | 0.1% |
| Total | 124,530,228 | 679,778,768 | 771,583,467 | 848,512 | - | - | 32,725,529 | |
| Valuation Inputs at Reporting Date: | ||||
| Description | Total ($) | Level 1 ($) | Level 2 ($) | Level 3 ($) |
Investments in Securities: | ||||
| Equities: | ||||
Communication Services | 41,802,780 | 26,330,743 | 14,946,212 | 525,825 |
Consumer Discretionary | 194,116,164 | 140,383,427 | 53,732,737 | - |
Consumer Staples | 15,269,410 | 11,679,676 | 3,589,734 | - |
Energy | 29,790,342 | 29,790,342 | - | - |
Financials | 95,967,877 | 68,493,233 | 22,606,154 | 4,868,490 |
Health Care | 81,983,975 | 74,441,804 | 6,390,217 | 1,151,954 |
Industrials | 65,724,789 | 64,954,789 | - | 770,000 |
Information Technology | 275,930,624 | 203,113,374 | 69,148,321 | 3,668,929 |
Materials | 16,807,211 | 16,807,211 | - | - |
Real Estate | 11,514,522 | 10,267,894 | - | 1,246,628 |
| Money Market Funds | 32,725,529 | 32,725,529 | - | - |
| Total Investments in Securities: | 861,633,223 | 678,988,022 | 170,413,375 | 12,231,826 |
| Investments in Securities: | |||
| Communication Services | |||
| Beginning Balance | $ | - | |
| Net Realized Gain (Loss) on Investment Securities | (71,115) | ||
| Net Unrealized Gain (Loss) on Investment Securities | (12,525,293) | ||
| Cost of Purchases | - | ||
| Proceeds of Sales | (1,373,359) | ||
| Amortization/Accretion | - | ||
| Transfers into Level 3 | 14,495,592 | ||
| Transfers out of Level 3 | - | ||
| Ending Balance | $ | 525,825 | |
| The change in unrealized gain (loss) for the period attributable to Level 3 securities held at October 31, 2022 | $ | (12,525,292) | |
| Other Investments in Securities | |||
| Beginning Balance | $ | 5,142,940 | |
| Net Realized Gain (Loss) on Investment Securities | (463,820) | ||
| Net Unrealized Gain (Loss) on Investment Securities | (8,472,637) | ||
| Cost of Purchases | 10,105,353 | ||
| Proceeds of Sales | (1,055,363) | ||
| Amortization/Accretion | - | ||
| Transfers into Level 3 | 6,449,529 | ||
| Transfers out of Level 3 | - | ||
| Ending Balance | $ | 11,706,001 | |
| The change in unrealized gain (loss) for the period attributable to Level 3 securities held at October 31, 2022 | $ | (8,472,638) | |
| The information used in the above reconciliation represents fiscal year to date activity for any Investments in Securities identified as using Level 3 inputs at either the beginning or the end of the current fiscal period. Cost of purchases and proceeds of sales may include securities received and/or delivered through in-kind transactions. Transfers into Level 3 were attributable to a lack of observable market data resulting from decreases in market activity, decreases in liquidity, security restructurings or corporate actions. Transfers out of Level 3 were attributable to observable market data becoming available for those securities. Transfers in or out of Level 3 represent the beginning value of any Security or Instrument where a change in the pricing level occurred from the beginning to the end of the period. The cost of purchases and the proceeds of sales may include securities received or delivered through corporate actions or exchanges. Realized and unrealized gains (losses) disclosed in the reconciliation are included in Net Gain (Loss) on the Fund's Statement of Operations. | |||
| Statement of Assets and Liabilities | ||||
| October 31, 2022 | ||||
| Assets | ||||
| Investment in securities, at value (including securities loaned of $29,090,853) - See accompanying schedule: | ||||
Unaffiliated issuers (cost $1,140,112,919) | $828,907,694 | |||
Fidelity Central Funds (cost $32,725,529) | 32,725,529 | |||
| Total Investment in Securities (cost $1,172,838,448) | $ | 861,633,223 | ||
| Receivable for investments sold | 1,657,115 | |||
| Receivable for fund shares sold | 252,167 | |||
| Dividends receivable | 458,597 | |||
| Distributions receivable from Fidelity Central Funds | 78,470 | |||
| Prepaid expenses | 1,697 | |||
| Other receivables | 361,368 | |||
Total assets | 864,442,637 | |||
| Liabilities | ||||
| Payable for investments purchased | 2,864,314 | |||
| Payable for fund shares redeemed | 632,518 | |||
| Accrued management fee | 712,911 | |||
| Other affiliated payables | 195,479 | |||
| Deferred taxes | 3,446,123 | |||
| Other payables and accrued expenses | 518,045 | |||
| Collateral on securities loaned | 32,546,389 | |||
| Total Liabilities | 40,915,779 | |||
| Net Assets | $ | 823,526,858 | ||
| Net Assets consist of: | ||||
| Paid in capital | $ | 1,282,050,187 | ||
| Total accumulated earnings (loss) | (458,523,329) | |||
| Net Assets | $ | 823,526,858 | ||
Net Asset Value , offering price and redemption price per share ($823,526,858 ÷ 27,240,931 shares) | $ | 30.23 | ||
| Statement of Operations | ||||
Year ended October 31, 2022 | ||||
| Investment Income | ||||
| Dividends | $ | 8,790,237 | ||
| Income from Fidelity Central Funds (including $620,956 from security lending) | 848,512 | |||
| Income before foreign taxes withheld | 9,638,749 | |||
| Less foreign taxes withheld | (1,346,831) | |||
| Total Income | 8,291,918 | |||
| Expenses | ||||
| Management fee | ||||
| Basic fee | $ | 8,472,008 | ||
| Performance adjustment | 2,910,141 | |||
| Transfer agent fees | 2,266,983 | |||
| Accounting fees | 563,549 | |||
| Custodian fees and expenses | 371,722 | |||
| Independent trustees' fees and expenses | 4,783 | |||
| Registration fees | 40,443 | |||
| Audit | 92,961 | |||
| Legal | 3,540 | |||
| Interest | 6,274 | |||
| Miscellaneous | 8,169 | |||
| Total expenses before reductions | 14,740,573 | |||
| Expense reductions | (41,753) | |||
| Total expenses after reductions | 14,698,820 | |||
| Net Investment income (loss) | (6,406,902) | |||
| Realized and Unrealized Gain (Loss) | ||||
| Net realized gain (loss) on: | ||||
| Investment Securities: | ||||
| Unaffiliated issuers(net of foreign taxes of $4,807,236) | (135,193,062) | |||
| Foreign currency transactions | (358,699) | |||
| Total net realized gain (loss) | (135,551,761) | |||
| Change in net unrealized appreciation (depreciation) on: | ||||
| Investment Securities: | ||||
| Unaffiliated issuers (net of decrease in deferred foreign taxes of $9,055,303) | (672,464,277) | |||
| Assets and liabilities in foreign currencies | (424,295) | |||
| Total change in net unrealized appreciation (depreciation) | (672,888,572) | |||
| Net gain (loss) | (808,440,333) | |||
| Net increase (decrease) in net assets resulting from operations | $ | (814,847,235) | ||
| Statement of Changes in Net Assets | ||||
Year ended October 31, 2022 | Year ended October 31, 2021 | |||
| Increase (Decrease) in Net Assets | ||||
| Operations | ||||
| Net investment income (loss) | $ | (6,406,902) | $ | (10,990,626) |
| Net realized gain (loss) | (135,551,761) | 292,606,086 | ||
| Change in net unrealized appreciation (depreciation) | (672,888,572) | (83,457,208) | ||
| Net increase (decrease) in net assets resulting from operations | (814,847,235) | 198,158,252 | ||
| Distributions to shareholders | (218,312,620) | (263,140,424) | ||
| Share transactions | ||||
| Proceeds from sales of shares | 116,575,535 | 1,491,669,517 | ||
| Reinvestment of distributions | 202,673,713 | 244,049,572 | ||
| Cost of shares redeemed | (462,682,896) | (1,249,398,074) | ||
Net increase (decrease) in net assets resulting from share transactions | (143,433,648) | 486,321,015 | ||
| Total increase (decrease) in net assets | (1,176,593,503) | 421,338,843 | ||
| Net Assets | ||||
| Beginning of period | 2,000,120,361 | 1,578,781,518 | ||
| End of period | $ | 823,526,858 | $ | 2,000,120,361 |
| Other Information | ||||
| Shares | ||||
| Sold | 2,698,029 | 20,776,389 | ||
| Issued in reinvestment of distributions | 3,879,665 | 3,825,228 | ||
| Redeemed | (10,270,869) | (18,489,539) | ||
| Net increase (decrease) | (3,693,175) | 6,112,078 | ||
| Fidelity® Emerging Asia Fund |
| Years ended October 31, | 2022 | 2021 | 2020 | 2019 | 2018 | |||||
Selected Per-Share Data | ||||||||||
| Net asset value, beginning of period | $ | 64.66 | $ | 63.60 | $ | 45.03 | $ | 36.69 | $ | 43.94 |
| Income from Investment Operations | ||||||||||
Net investment income (loss) A,B | (.22) | (.31) C | (.12) | .34 | .41 | |||||
| Net realized and unrealized gain (loss) | (26.97) | 11.00 | 21.49 | 9.27 | (7.27) | |||||
| Total from investment operations | (27.19) | 10.69 | 21.37 | 9.61 | (6.86) | |||||
| Distributions from net investment income | (.09) | - | (.29) D | (.39) | (.37) | |||||
| Distributions from net realized gain | (7.15) | (9.63) | (2.51) D | (.88) | (.02) | |||||
| Total distributions | (7.24) | (9.63) | (2.80) | (1.27) | (.39) | |||||
Redemption fees added to paid in capital A | - | - | - | - | - E | |||||
| Net asset value, end of period | $ | 30.23 | $ | 64.66 | $ | 63.60 | $ | 45.03 | $ | 36.69 |
Total Return F | (46.77)% | 17.02% | 50.46% | 26.95% | (15.75)% | |||||
Ratios to Average Net Assets B,G,H | ||||||||||
| Expenses before reductions | 1.18% | 1.02% | 1.13% | 1.11% | 1.02% | |||||
| Expenses net of fee waivers, if any | 1.17% | 1.02% | 1.13% | 1.11% | 1.02% | |||||
| Expenses net of all reductions | 1.17% | 1.02% | 1.10% | 1.11% | 1.00% | |||||
| Net investment income (loss) | (.51)% | (.45)% C | (.24)% | .82% | .93% | |||||
| Supplemental Data | ||||||||||
| Net assets, end of period (000 omitted) | $ | 823,527 | $ | 2,000,120 | $ | 1,578,782 | $ | 993,620 | $ | 913,940 |
Portfolio turnover rate I | 44% | 85% | 114% | 61% J | 36% |
| Fidelity Central Fund | Investment Manager | Investment Objective | Investment Practices | Expense Ratio A |
| Fidelity Money Market Central Funds | Fidelity Management & Research Company LLC (FMR) | Each fund seeks to obtain a high level of current income consistent with the preservation of capital and liquidity. | Short-term Investments | Less than .005% |
| Asset Type | Fair Value | Valuation Technique(s) | Unobservable Input | Amount or Range/Weighted Average | Impact to Valuation from an Increase in Input A |
| Equities | $12,231,826 | Market comparable | Enterprise value/Revenue multiple (EV/R) | 3.8 - 7.1 / 4.3 | Increase |
| Market approach | Discount rate | 49.5% - 50.0% / 49.6% | Decrease | ||
| Transaction price | $0.25 - $17.75 / $3.24 | Increase |
| Gross unrealized appreciation | $ 166,623,426 |
| Gross unrealized depreciation | (497,301,362) |
| Net unrealized appreciation (depreciation) | $(330,677,936) |
| Tax Cost | $1,192,311,159 |
| Capital loss carryforward | $(116,791,688) |
| Net unrealized appreciation (depreciation) on securities and other investments | $(331,341,497) |
Short-term | $(111,911,461) |
Long-term | (4,880,227) |
| Total capital loss carryforward | $(116,791,688) |
| October 31, 2022 | October 31, 2021 | |
| Ordinary Income | $ 2,682,937 | $124,687,153 |
| Long-term Capital Gains | 215,629,683 | 138,453,271 |
| Total | $ 218,312,620 | $263,140,424 |
| Purchases ($) | Sales ($) | |
| Fidelity Emerging Asia Fund | 550,092,277 | 891,776,083 |
| % of Average Net Assets | |
| Fidelity Emerging Asia Fund | .04 |
| Amount | |
| Fidelity Emerging Asia Fund | $6,340 |
| Borrower or Lender | Average Loan Balance | Weighted Average Interest Rate | Interest Expense | |
| Fidelity Emerging Asia Fund | Borrower | $15,584,114 | .33% | $6,274 |
| Purchases ($) | Sales ($) | Realized Gain (Loss) ($) | |
| Fidelity Emerging Asia Fund | 8,257,093 | 21,032,307 | 621,282 |
| Amount ($) | |
| Fidelity Emerging Asia Fund | 1,907 |
| Amount | |
| Fidelity Emerging Asia Fund | $2,358 |
| Total Security Lending Fees Paid to NFS | Security Lending Income From Securities Loaned to NFS | Value of Securities Loaned to NFS at Period End | |
| Fidelity Emerging Asia Fund | $67,150 | $94 | $- |
| Average Annual Total Returns | |||
Periods ended October 31, 2022 | Past 1 year | Past 5 years | Past 10 years |
| Class A (incl.5.75% sales charge) | -41.57% | -1.52% | 3.09% |
| Class M (incl.3.50% sales charge) | -40.36% | -1.14% | 3.28% |
Class C (incl. contingent deferred sales charge) | -39.09% | -0.58% | 3.58% |
| Fidelity® Emerging Markets Fund | -37.83% | -0.26% | 3.74% |
| Class K | -37.73% | -0.13% | 3.91% |
| Class I | -37.81% | -0.26% | 3.75% |
| Class Z | -37.74% | -0.22% | 3.77% |
| $10,000 Over 10 Years |
Let's say hypothetically that $10,000 was invested in Fidelity® Emerging Markets Fund, a class of the fund, on October 31, 2012. The chart shows how the value of your investment would have changed, and also shows how the MSCI Emerging Markets Index performed over the same period. |
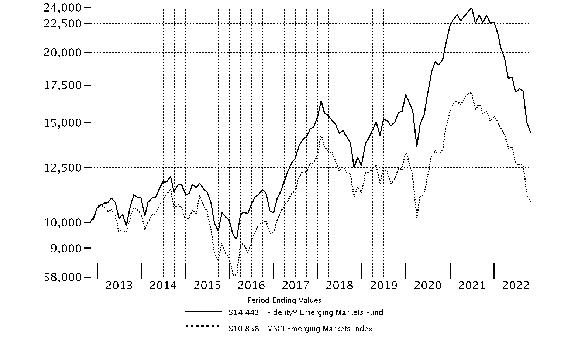 |
Top Holdings (% of Fund's net assets) | ||
| Taiwan Semiconductor Manufacturing Co. Ltd. (Taiwan, Semiconductors & Semiconductor Equipment) | 7.5 | |
| Tencent Holdings Ltd. (Cayman Islands, Interactive Media & Services) | 4.6 | |
| Samsung Electronics Co. Ltd. (Korea (South), Technology Hardware, Storage & Peripherals) | 4.6 | |
| Reliance Industries Ltd. (India, Oil, Gas & Consumable Fuels) | 3.7 | |
| Housing Development Finance Corp. Ltd. (India, Diversified Financial Services) | 2.7 | |
| Pinduoduo, Inc. ADR (Cayman Islands, Internet & Direct Marketing Retail) | 2.7 | |
| PT Bank Central Asia Tbk (Indonesia, Banks) | 2.6 | |
| Al Rajhi Bank (Saudi Arabia, Banks) | 2.2 | |
| Kweichow Moutai Co. Ltd. (A Shares) (China, Beverages) | 2.2 | |
| NVIDIA Corp. (United States of America, Semiconductors & Semiconductor Equipment) | 2.2 | |
| 35.0 | ||
| Market Sectors (% of Fund's net assets) | ||
| Information Technology | 25.6 | |
| Financials | 20.2 | |
| Consumer Discretionary | 11.4 | |
| Health Care | 8.9 | |
| Communication Services | 8.2 | |
| Industrials | 7.1 | |
| Energy | 6.6 | |
| Materials | 4.6 | |
| Consumer Staples | 4.5 | |
| Utilities | 2.0 | |
Asset Allocation (% of Fund's net assets) |
 |
Foreign investments - 94.4% |
Geographic Diversification (% of Fund's net assets) |
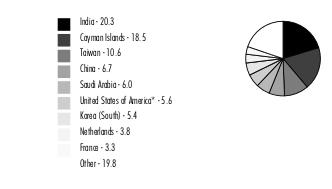 |
* Includes Short-Term investments and Net Other Assets (Liabilities). Percentages are based on country or territory of incorporation and are adjusted for the effect of futures contracts, if applicable. |
| Common Stocks - 97.5% | |||
| Shares | Value ($) | ||
| Australia - 1.0% | |||
| Lynas Rare Earths Ltd. (a) | 10,135,142 | 54,002,920 | |
| Brazil - 1.9% | |||
| Localiza Rent a Car SA | 4,890,545 | 66,785,218 | |
| Vamos Locacao de Caminhoes Maquinas e Equipamentos SA | 11,630,384 | 36,294,994 | |
TOTAL BRAZIL | 103,080,212 | ||
| Canada - 1.0% | |||
| First Quantum Minerals Ltd. | 3,211,500 | 56,646,490 | |
| Cayman Islands - 17.7% | |||
| Alibaba Group Holding Ltd. (a) | 6,928,732 | 53,870,245 | |
| Bilibili, Inc. ADR (a)(b) | 2,240,300 | 19,983,476 | |
| Chailease Holding Co. Ltd. | 7,271,812 | 33,592,732 | |
| Hansoh Pharmaceutical Group Co. Ltd. (c) | 31,964,000 | 49,352,988 | |
| JD.com, Inc. Class A | 3,524,947 | 64,191,118 | |
| Meituan Class B (a)(c) | 6,920,500 | 110,800,983 | |
| NetEase, Inc. ADR | 688,500 | 38,294,370 | |
| PagSeguro Digital Ltd. (a) | 1,068,399 | 14,615,698 | |
| Pinduoduo, Inc. ADR (a) | 2,724,800 | 149,400,784 | |
| Sea Ltd. ADR (a) | 451,200 | 22,415,616 | |
| Silergy Corp. | 3,418,000 | 39,633,286 | |
| Tencent Holdings Ltd. | 9,679,300 | 254,340,972 | |
| Wuxi Biologics (Cayman), Inc. (a)(c) | 10,523,000 | 47,349,738 | |
| XP, Inc. Class A (a)(b) | 2,633,900 | 48,279,387 | |
| Zai Lab Ltd. ADR (a) | 1,297,600 | 28,910,528 | |
TOTAL CAYMAN ISLANDS | 975,031,921 | ||
| Chile - 0.6% | |||
| Banco de Chile | 374,680,156 | 34,267,250 | |
| China - 6.5% | |||
| Kweichow Moutai Co. Ltd. (A Shares) | 664,233 | 122,216,485 | |
| Shandong Sinocera Functional Material Co. Ltd. (A Shares) | 6,044,599 | 19,103,280 | |
| Shenzhen Mindray Bio-Medical Electronics Co. Ltd. (A Shares) | 2,481,154 | 110,567,960 | |
| Sinopharm Group Co. Ltd. (H Shares) | 21,864,899 | 41,670,506 | |
| Wuliangye Yibin Co. Ltd. (A Shares) | 3,720,334 | 68,009,228 | |
TOTAL CHINA | 361,567,459 | ||
| France - 3.3% | |||
| Gaztransport et Technigaz SA | 229,041 | 26,641,368 | |
| Hermes International SCA | 41,619 | 53,900,835 | |
| LVMH Moet Hennessy Louis Vuitton SE | 72,099 | 45,494,101 | |
| Sartorius Stedim Biotech | 179,500 | 56,977,949 | |
TOTAL FRANCE | 183,014,253 | ||
| Hong Kong - 3.3% | |||
| AIA Group Ltd. | 8,933,000 | 67,665,635 | |
| Chervon Holdings Ltd. | 9,818,396 | 33,083,841 | |
| Hong Kong Exchanges and Clearing Ltd. | 1,512,274 | 40,141,225 | |
| Techtronic Industries Co. Ltd. | 4,322,500 | 40,928,753 | |
TOTAL HONG KONG | 181,819,454 | ||
| Hungary - 0.8% | |||
| Richter Gedeon PLC | 2,267,800 | 44,779,267 | |
| India - 20.3% | |||
| Adani Ports & Special Economic Zone Ltd. | 4,322,800 | 43,006,064 | |
| FSN E-Commerce Ventures Private Ltd. (a)(d) | 1,693,920 | 23,352,738 | |
| HDFC Bank Ltd. (a) | 5,700,994 | 103,461,119 | |
| HDFC Standard Life Insurance Co. Ltd. (c) | 6,469,800 | 42,239,713 | |
| Housing Development Finance Corp. Ltd. | 5,103,846 | 152,276,865 | |
| IIFL Wealth Management Ltd. | 992,114 | 21,230,137 | |
| Kotak Mahindra Bank Ltd. | 4,589,948 | 105,458,463 | |
| Larsen & Toubro Ltd. | 3,837,600 | 93,788,941 | |
| Petronet LNG Ltd. | 17,652,180 | 43,831,911 | |
| Power Grid Corp. of India Ltd. | 39,853,800 | 109,841,078 | |
| Reliance Industries Ltd. | 6,593,218 | 203,069,203 | |
| Restaurant Brands Asia Ltd. (a)(e) | 26,164,056 | 38,433,791 | |
| Tata Consultancy Services Ltd. | 1,914,400 | 73,845,933 | |
| Ultratech Cement Ltd. | 818,700 | 66,411,326 | |
TOTAL INDIA | 1,120,247,282 | ||
| Indonesia - 2.6% | |||
| PT Bank Central Asia Tbk | 257,059,870 | 145,031,374 | |
| Japan - 0.9% | |||
| Hoya Corp. | 512,400 | 47,812,973 | |
| Kazakhstan - 0.6% | |||
| Kaspi.KZ JSC GDR (Reg. S) | 519,400 | 34,020,700 | |
| Kenya - 1.2% | |||
| Safaricom Ltd. | 309,598,500 | 64,037,267 | |
| Korea (South) - 5.4% | |||
| Kakao Corp. | 1,259,900 | 44,753,055 | |
| Samsung Electronics Co. Ltd. | 6,027,047 | 250,824,336 | |
TOTAL KOREA (SOUTH) | 295,577,391 | ||
| Luxembourg - 1.4% | |||
| Globant SA (a)(b) | 400,200 | 75,509,736 | |
| Mexico - 2.6% | |||
| Banco del Bajio SA (c) | 24,918,275 | 70,278,767 | |
| Becle S.A.B. de CV | 3,091,390 | 6,539,149 | |
| Grupo Aeroportuario Norte S.A.B. de CV | 8,501,487 | 67,726,983 | |
TOTAL MEXICO | 144,544,899 | ||
| Netherlands - 3.8% | |||
| ASML Holding NV (Netherlands) | 231,000 | 108,359,135 | |
| BE Semiconductor Industries NV | 791,600 | 40,460,489 | |
| Ferrari NV (b) | 297,400 | 58,519,398 | |
| Yandex NV Series A (a)(f) | 1,084,187 | 3,718,588 | |
TOTAL NETHERLANDS | 211,057,610 | ||
| Russia - 0.0% | |||
| LUKOIL PJSC sponsored ADR (f) | 802,595 | 227,046 | |
| Sberbank of Russia (a)(f) | 25,741,060 | 237,332 | |
TOTAL RUSSIA | 464,378 | ||
| Saudi Arabia - 6.0% | |||
| Al Rajhi Bank | 5,487,920 | 124,435,013 | |
| Arabian Internet and Communications Services Co. Ltd. | 715,200 | 47,203,524 | |
| Dr Sulaiman Al Habib Medical Services Group Co. | 704,410 | 42,479,623 | |
| Sabic Agriculture-Nutrients Co. | 1,406,700 | 59,524,238 | |
| Saudi Arabian Oil Co. (c) | 6,017,000 | 55,885,697 | |
TOTAL SAUDI ARABIA | 329,528,095 | ||
| South Africa - 1.0% | |||
| Clicks Group Ltd. | 3,406,183 | 57,716,201 | |
| Sweden - 0.3% | |||
| VEF AB (a)(e) | 81,129,072 | 18,957,451 | |
| Taiwan - 10.6% | |||
| ASPEED Tech, Inc. | 661,000 | 34,429,218 | |
| E.SUN Financial Holdings Co. Ltd. | 49,099,251 | 35,316,631 | |
| eMemory Technology, Inc. | 1,814,000 | 60,459,168 | |
| Taiwan Semiconductor Manufacturing Co. Ltd. | 34,568,000 | 415,177,855 | |
| Voltronic Power Technology Corp. | 975,868 | 39,634,993 | |
TOTAL TAIWAN | 585,017,865 | ||
| United States of America - 4.7% | |||
| Adobe, Inc. (a) | 123,078 | 39,200,343 | |
| Dlocal Ltd. (a)(b) | 2,642,072 | 58,918,206 | |
| Maravai LifeSciences Holdings, Inc. (a) | 1,364,298 | 22,647,347 | |
| NVIDIA Corp. | 904,108 | 122,027,457 | |
| TaskUs, Inc. (a) | 876,570 | 17,697,948 | |
TOTAL UNITED STATES OF AMERICA | 260,491,301 | ||
| TOTAL COMMON STOCKS (Cost $5,686,301,817) | 5,384,223,749 | ||
| Preferred Stocks - 1.6% | |||
| Shares | Value ($) | ||
| Convertible Preferred Stocks - 0.6% | |||
| Cayman Islands - 0.4% | |||
| Creditas Financial Solutions Ltd. Series F (d)(f) | 64,604 | 21,033,124 | |
| China - 0.2% | |||
| ByteDance Ltd. Series E1 (a)(d)(f) | 85,253 | 13,386,426 | |
TOTAL CONVERTIBLE PREFERRED STOCKS | 34,419,550 | ||
| Nonconvertible Preferred Stocks - 1.0% | |||
| Brazil - 0.6% | |||
| Petroleo Brasileiro SA - Petrobras sponsored ADR | 2,401,900 | 30,792,358 | |
| Cayman Islands - 0.4% | |||
| ZKH Group Ltd. Series F (f) | 37,926,244 | 21,462,461 | |
TOTAL NONCONVERTIBLE PREFERRED STOCKS | 52,254,819 | ||
| TOTAL PREFERRED STOCKS (Cost $89,807,671) | 86,674,369 | ||
| Money Market Funds - 2.9% | |||
| Shares | Value ($) | ||
| Fidelity Cash Central Fund 3.10% (g) | 67,619,536 | 67,633,060 | |
| Fidelity Securities Lending Cash Central Fund 3.10% (g)(h) | 93,744,651 | 93,754,025 | |
| TOTAL MONEY MARKET FUNDS (Cost $161,387,085) | 161,387,085 | ||
| TOTAL INVESTMENT IN SECURITIES - 102.0% (Cost $5,937,496,573) | 5,632,285,203 |
NET OTHER ASSETS (LIABILITIES) - (2.0)% | (107,744,863) |
| NET ASSETS - 100.0% | 5,524,540,340 |
| (a) | Non-income producing |
| (b) | Security or a portion of the security is on loan at period end. |
| (c) | Security exempt from registration under Rule 144A of the Securities Act of 1933. These securities may be resold in transactions exempt from registration, normally to qualified institutional buyers. At the end of the period, the value of these securities amounted to $375,907,886 or 6.8% of net assets. |
| (d) | Restricted securities (including private placements) - Investment in securities not registered under the Securities Act of 1933 (excluding 144A issues). At the end of the period, the value of restricted securities (excluding 144A issues) amounted to $57,772,288 or 1.0% of net assets. |
| (e) | Affiliated company |
| (f) | Level 3 security |
| (g) | Affiliated fund that is generally available only to investment companies and other accounts managed by Fidelity Investments. The rate quoted is the annualized seven-day yield of the fund at period end. A complete unaudited listing of the fund's holdings as of its most recent quarter end is available upon request. In addition, each Fidelity Central Fund's financial statements, which are not covered by the Fund's Report of Independent Registered Public Accounting Firm, are available on the SEC's website or upon request. |
| (h) | Investment made with cash collateral received from securities on loan. |
| Additional information on each restricted holding is as follows: | ||
| Security | Acquisition Date | Acquisition Cost ($) |
| ByteDance Ltd. Series E1 | 11/18/20 | 9,341,528 |
| Creditas Financial Solutions Ltd. Series F | 1/28/22 | 20,349,123 |
| FSN E-Commerce Ventures Private Ltd. | 10/07/20 - 10/26/20 | 4,649,356 |
| Affiliate | Value, beginning of period ($) | Purchases ($) | Sales Proceeds ($) | Dividend Income ($) | Realized Gain (loss) ($) | Change in Unrealized appreciation (depreciation) ($) | Value, end of period ($) | % ownership, end of period |
| Fidelity Cash Central Fund 3.10% | 104,837,920 | 2,466,650,636 | 2,503,855,496 | 1,894,668 | - | - | 67,633,060 | 0.1% |
| Fidelity Securities Lending Cash Central Fund 3.10% | 38,984,400 | 1,047,548,313 | 992,778,688 | 306,506 | - | - | 93,754,025 | 0.3% |
| Total | 143,822,320 | 3,514,198,949 | 3,496,634,184 | 2,201,174 | - | - | 161,387,085 | |
| Affiliate | Value, beginning of period ($) | Purchases ($) | Sales Proceeds ($) | Dividend Income ($) | Realized Gain (loss) ($) | Change in Unrealized appreciation (depreciation) ($) | Value, end of period ($) |
| Restaurant Brands Asia Ltd. | 28,304,933 | 20,989,583 | - | - | - | (10,860,725) | 38,433,791 |
| VEF AB | 58,759,062 | - | - | - | - | (39,801,611) | 18,957,451 |
| Total | 87,063,995 | 20,989,583 | - | - | - | (50,662,336) | 57,391,242 |
| Valuation Inputs at Reporting Date: | ||||
| Description | Total ($) | Level 1 ($) | Level 2 ($) | Level 3 ($) |
Investments in Securities: | ||||
| Equities: | ||||
Communication Services | 447,543,344 | 189,483,784 | 254,340,972 | 3,718,588 |
Consumer Discretionary | 631,047,834 | 333,338,649 | 297,709,185 | - |
Consumer Staples | 254,481,063 | 254,481,063 | - | - |
Energy | 360,447,583 | 360,220,537 | - | 227,046 |
Financials | 1,119,385,379 | 865,384,483 | 211,267,979 | 42,732,917 |
Health Care | 492,548,879 | 445,199,141 | 47,349,738 | - |
Industrials | 388,165,946 | 347,237,193 | 40,928,753 | - |
Information Technology | 1,411,748,758 | 874,825,342 | 523,536,990 | 13,386,426 |
Materials | 255,688,254 | 255,688,254 | - | - |
Utilities | 109,841,078 | 109,841,078 | - | - |
| Money Market Funds | 161,387,085 | 161,387,085 | - | - |
| Total Investments in Securities: | 5,632,285,203 | 4,197,086,609 | 1,375,133,617 | 60,064,977 |
| Investments in Securities: | |||
| Communication Services | |||
| Beginning Balance | $ | - | |
| Net Realized Gain (Loss) on Investment Securities | (7,986,993) | ||
| Net Unrealized Gain (Loss) on Investment Securities | (81,014,869) | ||
| Cost of Purchases | 16,919,890 | ||
| Proceeds of Sales | (4,379,199) | ||
| Amortization/Accretion | - | ||
| Transfers into Level 3 | 80,179,759 | ||
| Transfers out of Level 3 | - | ||
| Ending Balance | $ | 3,718,588 | |
| The change in unrealized gain (loss) for the period attributable to Level 3 securities held at October 31, 2022 | $ | (81,014,869) | |
| Energy | |||
| Beginning Balance | $ | - | |
| Net Realized Gain (Loss) on Investment Securities | - | ||
| Net Unrealized Gain (Loss) on Investment Securities | (81,637,644) | ||
| Cost of Purchases | - | ||
| Proceeds of Sales | - | ||
| Amortization/Accretion | - | ||
| Transfers into Level 3 | 81,864,690 | ||
| Transfers out of Level 3 | - | ||
| Ending Balance | $ | 227,046 | |
| The change in unrealized gain (loss) for the period attributable to Level 3 securities held at October 31, 2022 | $ | (81,637,644) | |
| Financials | |||
| Beginning Balance | $ | - | |
| Net Realized Gain (Loss) on Investment Securities | (5,513,989) | ||
| Net Unrealized Gain (Loss) on Investment Securities | (134,674,773) | ||
| Cost of Purchases | 41,810,993 | ||
| Proceeds of Sales | (24,829,339) | ||
| Amortization/Accretion | - | ||
| Transfers into Level 3 | 165,940,025 | ||
| Transfers out of Level 3 | - | ||
| Ending Balance | $ | 42,732,917 | |
| The change in unrealized gain (loss) for the period attributable to Level 3 securities held at October 31, 2022 | $ | (134,674,773) | |
| Other Investments in Securities | |||
| Beginning Balance | $ | 10,598,653 | |
| Net Realized Gain (Loss) on Investment Securities | - | ||
| Net Unrealized Gain (Loss) on Investment Securities | 2,787,773 | ||
| Cost of Purchases | - | ||
| Proceeds of Sales | - | ||
| Amortization/Accretion | - | ||
| Transfers into Level 3 | - | ||
| Transfers out of Level 3 | - | ||
| Ending Balance | $ | 13,386,426 | |
| The change in unrealized gain (loss) for the period attributable to Level 3 securities held at October 31, 2022 | $ | 2,787,773 | |
| The information used in the above reconciliation represents fiscal year to date activity for any Investments in Securities identified as using Level 3 inputs at either the beginning or the end of the current fiscal period. Cost of purchases and proceeds of sales may include securities received and/or delivered through in-kind transactions. Transfers into Level 3 were attributable to a lack of observable market data resulting from decreases in market activity, decreases in liquidity, security restructurings or corporate actions. Transfers out of Level 3 were attributable to observable market data becoming available for those securities. Transfers in or out of Level 3 represent the beginning value of any Security or Instrument where a change in the pricing level occurred from the beginning to the end of the period. The cost of purchases and the proceeds of sales may include securities received or delivered through corporate actions or exchanges. Realized and unrealized gains (losses) disclosed in the reconciliation are included in Net Gain (Loss) on the Fund's Statement of Operations. | |||
| Statement of Assets and Liabilities | ||||
| October 31, 2022 | ||||
| Assets | ||||
| Investment in securities, at value (including securities loaned of $92,403,730) - See accompanying schedule: | ||||
Unaffiliated issuers (cost $5,697,973,952) | $5,413,506,876 | |||
Fidelity Central Funds (cost $161,387,085) | 161,387,085 | |||
Other affiliated issuers (cost $78,135,536) | 57,391,242 | |||
| Total Investment in Securities (cost $5,937,496,573) | $ | 5,632,285,203 | ||
| Cash | 234,083 | |||
| Foreign currency held at value (cost $23,644,047) | 23,514,427 | |||
| Receivable for investments sold | 6,558,590 | |||
| Receivable for fund shares sold | 35,174,706 | |||
| Dividends receivable | 2,526,046 | |||
| Distributions receivable from Fidelity Central Funds | 259,229 | |||
| Prepaid expenses | 10,185 | |||
| Other receivables | 1,376,561 | |||
Total assets | 5,701,939,030 | |||
| Liabilities | ||||
| Payable for investments purchased | 23,176,114 | |||
| Payable for fund shares redeemed | 26,659,437 | |||
| Accrued management fee | 3,216,387 | |||
| Distribution and service plan fees payable | 3,987 | |||
| Other affiliated payables | 787,389 | |||
| Deferred taxes | 29,337,045 | |||
| Other payables and accrued expenses | 464,306 | |||
| Collateral on securities loaned | 93,754,025 | |||
| Total Liabilities | 177,398,690 | |||
| Net Assets | $ | 5,524,540,340 | ||
| Net Assets consist of: | ||||
| Paid in capital | $ | 6,141,918,241 | ||
| Total accumulated earnings (loss) | (617,377,901) | |||
| Net Assets | $ | 5,524,540,340 | ||
| Net Asset Value and Maximum Offering Price | ||||
| Class A : | ||||
Net Asset Value and redemption price per share ($10,045,860 ÷ 362,327 shares) (a) | $ | 27.73 | ||
| Maximum offering price per share (100/94.25 of $27.73) | $ | 29.42 | ||
| Class M : | ||||
Net Asset Value and redemption price per share ($1,392,489 ÷ 50,247 shares) (a) | $ | 27.71 | ||
| Maximum offering price per share (100/96.50 of $27.71) | $ | 28.72 | ||
| Class C : | ||||
Net Asset Value and offering price per share ($1,377,138 ÷ 49,910 shares) (a)(b) | $ | 27.59 | ||
| Emerging Markets : | ||||
Net Asset Value , offering price and redemption price per share ($3,330,900,031 ÷ 119,502,529 shares) | $ | 27.87 | ||
| Class K : | ||||
Net Asset Value , offering price and redemption price per share ($826,467,656 ÷ 29,623,758 shares) | $ | 27.90 | ||
| Class I : | ||||
Net Asset Value , offering price and redemption price per share ($47,818,501 ÷ 1,718,357 shares) | $ | 27.83 | ||
| Class Z : | ||||
Net Asset Value , offering price and redemption price per share ($1,306,538,665 ÷ 46,884,681 shares) | $ | 27.87 | ||
(a)Redemption price per share is equal to net asset value less any applicable contingent deferred sales charge. | ||||
(b)Corresponding Net Asset Value does not calculate due to rounding of fractional net assets and/or units | ||||
| Statement of Operations | ||||
Year ended October 31, 2022 | ||||
| Investment Income | ||||
| Dividends | $ | 114,668,592 | ||
| Special dividends | 16,084,585 | |||
| Income from Fidelity Central Funds (including $306,506 from security lending) | 2,201,174 | |||
| Income before foreign taxes withheld | 132,954,351 | |||
| Less foreign taxes withheld | (15,613,381) | |||
| Total Income | 117,340,970 | |||
| Expenses | ||||
| Management fee | $ | 48,033,567 | ||
| Transfer agent fees | 8,252,227 | |||
| Distribution and service plan fees | 53,152 | |||
| Accounting fees | 1,622,816 | |||
| Custodian fees and expenses | 1,610,866 | |||
| Independent trustees' fees and expenses | 24,959 | |||
| Registration fees | 461,603 | |||
| Audit | 134,122 | |||
| Legal | 11,418 | |||
| Miscellaneous | 33,680 | |||
| Total expenses before reductions | 60,238,410 | |||
| Expense reductions | (236,005) | |||
| Total expenses after reductions | 60,002,405 | |||
| Net Investment income (loss) | 57,338,565 | |||
| Realized and Unrealized Gain (Loss) | ||||
| Net realized gain (loss) on: | ||||
| Investment Securities: | ||||
| Unaffiliated issuers(net of foreign taxes of $3,692,864) | (246,247,263) | |||
| Foreign currency transactions | (2,817,993) | |||
| Total net realized gain (loss) | (249,065,256) | |||
| Change in net unrealized appreciation (depreciation) on: | ||||
| Investment Securities: | ||||
| Unaffiliated issuers (net of decrease in deferred foreign taxes of $14,240,024) | (3,078,172,724) | |||
| Affiliated issuers | (50,662,336) | |||
| Assets and liabilities in foreign currencies | (250,475) | |||
| Total change in net unrealized appreciation (depreciation) | (3,129,085,535) | |||
| Net gain (loss) | (3,378,150,791) | |||
| Net increase (decrease) in net assets resulting from operations | $ | (3,320,812,226) | ||
| Statement of Changes in Net Assets | ||||
Year ended October 31, 2022 | Year ended October 31, 2021 | |||
| Increase (Decrease) in Net Assets | ||||
| Operations | ||||
| Net investment income (loss) | $ | 57,338,565 | $ | 20,062,728 |
| Net realized gain (loss) | (249,065,256) | 431,612,536 | ||
| Change in net unrealized appreciation (depreciation) | (3,129,085,535) | 711,143,631 | ||
| Net increase (decrease) in net assets resulting from operations | (3,320,812,226) | 1,162,818,895 | ||
| Distributions to shareholders | (481,791,574) | (94,102,390) | ||
| Share transactions - net increase (decrease) | 787,871,888 | 1,716,927,864 | ||
| Total increase (decrease) in net assets | (3,014,731,912) | 2,785,644,369 | ||
| Net Assets | ||||
| Beginning of period | 8,539,272,252 | 5,753,627,883 | ||
| End of period | $ | 5,524,540,340 | $ | 8,539,272,252 |
| Fidelity Advisor® Emerging Markets Fund Class A |
| Years ended October 31, | 2022 | 2021 A | ||
Selected Per-Share Data | ||||
| Net asset value, beginning of period | $ | 47.48 | $ | 46.83 |
| Income from Investment Operations | ||||
Net investment income (loss) B,C | .16 D | (.04) | ||
| Net realized and unrealized gain (loss) | (17.27) | .69 | ||
| Total from investment operations | (17.11) | .65 | ||
| Distributions from net investment income | (.48) | - | ||
| Distributions from net realized gain | (2.16) | - | ||
| Total distributions | (2.64) | - | ||
| Net asset value, end of period | $ | 27.73 | $ | 47.48 |
Total Return E,F,G | (38.00)% | 1.39% | ||
Ratios to Average Net Assets C,H,I | ||||
| Expenses before reductions | 1.21% | 1.25% J | ||
| Expenses net of fee waivers, if any | 1.21% | 1.25% J | ||
| Expenses net of all reductions | 1.21% | 1.25% J | ||
| Net investment income (loss) | .45% D | (.17)% J | ||
| Supplemental Data | ||||
| Net assets, end of period (000 omitted) | $ | 10,046 | $ | 6,248 |
Portfolio turnover rate K | 34% | 38% J,L |
| Fidelity Advisor® Emerging Markets Fund Class M |
| Years ended October 31, | 2022 | 2021 A | ||
Selected Per-Share Data | ||||
| Net asset value, beginning of period | $ | 47.42 | $ | 46.83 |
| Income from Investment Operations | ||||
Net investment income (loss) B,C | .05 D | (.09) | ||
| Net realized and unrealized gain (loss) | (17.29) | .68 | ||
| Total from investment operations | (17.24) | .59 | ||
| Distributions from net investment income | (.32) | - | ||
| Distributions from net realized gain | (2.16) | - | ||
| Total distributions | (2.47) E | - | ||
| Net asset value, end of period | $ | 27.71 | $ | 47.42 |
Total Return F,G,H | (38.20)% | 1.26% | ||
Ratios to Average Net Assets C,I,J | ||||
| Expenses before reductions | 1.51% | 1.52% K | ||
| Expenses net of fee waivers, if any | 1.50% | 1.51% K | ||
| Expenses net of all reductions | 1.50% | 1.51% K | ||
| Net investment income (loss) | .15% D | (.39)% K | ||
| Supplemental Data | ||||
| Net assets, end of period (000 omitted) | $ | 1,392 | $ | 2,234 |
Portfolio turnover rate L | 34% | 38% K,M |
| Fidelity Advisor® Emerging Markets Fund Class C |
| Years ended October 31, | 2022 | 2021 A | ||
Selected Per-Share Data | ||||
| Net asset value, beginning of period | $ | 47.31 | $ | 46.83 |
| Income from Investment Operations | ||||
Net investment income (loss) B,C | (.12) D | (.19) | ||
| Net realized and unrealized gain (loss) | (17.26) | .67 | ||
| Total from investment operations | (17.38) | .48 | ||
| Distributions from net investment income | (.18) | - | ||
| Distributions from net realized gain | (2.16) | - | ||
| Total distributions | (2.34) | - | ||
| Net asset value, end of period | $ | 27.59 | $ | 47.31 |
Total Return E,F,G | (38.50)% | 1.02% | ||
Ratios to Average Net Assets C,H,I | ||||
| Expenses before reductions | 2.00% | 2.01% J | ||
| Expenses net of fee waivers, if any | 2.00% | 2.01% J | ||
| Expenses net of all reductions | 2.00% | 2.01% J | ||
| Net investment income (loss) | (.34)% D | (.86)% J | ||
| Supplemental Data | ||||
| Net assets, end of period (000 omitted) | $ | 1,377 | $ | 1,587 |
Portfolio turnover rate K | 34% | 38% J,L |
| Fidelity® Emerging Markets Fund |
| Years ended October 31, | 2022 | 2021 | 2020 | 2019 | 2018 | |||||
Selected Per-Share Data | ||||||||||
| Net asset value, beginning of period | $ | 47.56 | $ | 40.26 | $ | 33.03 | $ | 26.66 | $ | 31.37 |
| Income from Investment Operations | ||||||||||
Net investment income (loss) A,B | .28 C | .12 | .15 | .61 D | .24 | |||||
| Net realized and unrealized gain (loss) | (17.35) | 7.81 | 7.68 | 5.98 | (4.76) | |||||
| Total from investment operations | (17.07) | 7.93 | 7.83 | 6.59 | (4.52) | |||||
| Distributions from net investment income | (.46) | (.09) | (.60) | (.22) | (.16) | |||||
| Distributions from net realized gain | (2.16) | (.54) | - | - E | (.03) | |||||
| Total distributions | (2.62) | (.63) | (.60) | (.22) | (.19) | |||||
Redemption fees added to paid in capital B | - | - | - | - | - E | |||||
| Net asset value, end of period | $ | 27.87 | $ | 47.56 | $ | 40.26 | $ | 33.03 | $ | 26.66 |
Total Return F | (37.83)% | 19.83% | 24.09% | 24.91% | (14.51)% | |||||
Ratios to Average Net Assets A,G,H | ||||||||||
| Expenses before reductions | .90% | .88% | .92% | .94% | .96% | |||||
| Expenses net of fee waivers, if any | .90% | .88% | .92% | .94% | .96% | |||||
| Expenses net of all reductions | .90% | .88% | .91% | .92% | .92% | |||||
| Net investment income (loss) | .76% C | .26% | .43% | 2.02% D | .75% | |||||
| Supplemental Data | ||||||||||
| Net assets, end of period (000 omitted) | $ | 3,330,900 | $ | 5,016,159 | $ | 4,526,531 | $ | 3,104,887 | $ | 3,493,583 |
Portfolio turnover rate I | 34% | 38% J | 34% | 85% K | 86% |
| Fidelity® Emerging Markets Fund Class K |
| Years ended October 31, | 2022 | 2021 | 2020 | 2019 | 2018 | |||||
Selected Per-Share Data | ||||||||||
| Net asset value, beginning of period | $ | 47.62 | $ | 40.30 | $ | 33.07 | $ | 26.70 | $ | 31.41 |
| Income from Investment Operations | ||||||||||
Net investment income (loss) A,B | .33 C | .16 | .19 | .65 D | .28 | |||||
| Net realized and unrealized gain (loss) | (17.35) | 7.83 | 7.69 | 5.99 | (4.76) | |||||
| Total from investment operations | (17.02) | 7.99 | 7.88 | 6.64 | (4.48) | |||||
| Distributions from net investment income | (.54) | (.12) | (.65) | (.26) | (.20) | |||||
| Distributions from net realized gain | (2.16) | (.54) | - | - E | (.03) | |||||
| Total distributions | (2.70) | (.67) F | (.65) | (.27) F | (.23) | |||||
Redemption fees added to paid in capital A | - | - | - | - | - E | |||||
| Net asset value, end of period | $ | 27.90 | $ | 47.62 | $ | 40.30 | $ | 33.07 | $ | 26.70 |
Total Return G | (37.73)% | 19.94% | 24.24% | 25.08% | (14.39)% | |||||
Ratios to Average Net Assets B,H,I | ||||||||||
| Expenses before reductions | .77% | .77% | .80% | .80% | .82% | |||||
| Expenses net of fee waivers, if any | .77% | .77% | .80% | .80% | .82% | |||||
| Expenses net of all reductions | .77% | .77% | .79% | .79% | .78% | |||||
| Net investment income (loss) | .88% C | .34% | .55% | 2.15% D | .89% | |||||
| Supplemental Data | ||||||||||
| Net assets, end of period (000 omitted) | $ | 826,468 | $ | 1,689,454 | $ | 1,227,097 | $ | 1,018,765 | $ | 870,859 |
Portfolio turnover rate J | 34% | 38% K | 34% | 85% L | 86% |
| Fidelity Advisor® Emerging Markets Fund Class I |
| Years ended October 31, | 2022 | 2021 A | ||
Selected Per-Share Data | ||||
| Net asset value, beginning of period | $ | 47.55 | $ | 46.83 |
| Income from Investment Operations | ||||
Net investment income (loss) B,C | .26 D | .04 | ||
| Net realized and unrealized gain (loss) | (17.29) | .68 | ||
| Total from investment operations | (17.03) | .72 | ||
| Distributions from net investment income | (.53) | - | ||
| Distributions from net realized gain | (2.16) | - | ||
| Total distributions | (2.69) | - | ||
| Net asset value, end of period | $ | 27.83 | $ | 47.55 |
Total Return E,F | (37.81)% | 1.54% | ||
Ratios to Average Net Assets C,G,H | ||||
| Expenses before reductions | .89% | .94% I | ||
| Expenses net of fee waivers, if any | .89% | .93% I | ||
| Expenses net of all reductions | .89% | .93% I | ||
| Net investment income (loss) | .76% D | .17% I | ||
| Supplemental Data | ||||
| Net assets, end of period (000 omitted) | $ | 47,819 | $ | 25,824 |
Portfolio turnover rate J | 34% | 38% I,K |
| Fidelity Advisor® Emerging Markets Fund Class Z |
| Years ended October 31, | 2022 | 2021 A | ||
Selected Per-Share Data | ||||
| Net asset value, beginning of period | $ | 47.59 | $ | 46.83 |
| Income from Investment Operations | ||||
Net investment income (loss) B,C | .32 D | (.03) | ||
| Net realized and unrealized gain (loss) | (17.33) | .79 | ||
| Total from investment operations | (17.01) | .76 | ||
| Distributions from net investment income | (.55) | - | ||
| Distributions from net realized gain | (2.16) | - | ||
| Total distributions | (2.71) | - | ||
| Net asset value, end of period | $ | 27.87 | $ | 47.59 |
Total Return E,F | (37.74)% | 1.62% | ||
Ratios to Average Net Assets C,G,H | ||||
| Expenses before reductions | .77% | .78% I | ||
| Expenses net of fee waivers, if any | .77% | .78% I | ||
| Expenses net of all reductions | .77% | .78% I | ||
| Net investment income (loss) | .88% D | (.13)% I | ||
| Supplemental Data | ||||
| Net assets, end of period (000 omitted) | $ | 1,306,539 | $ | 1,797,766 |
Portfolio turnover rate J | 34% | 38% I,K |
| Fidelity Central Fund | Investment Manager | Investment Objective | Investment Practices | Expense Ratio A |
| Fidelity Money Market Central Funds | Fidelity Management & Research Company LLC (FMR) | Each fund seeks to obtain a high level of current income consistent with the preservation of capital and liquidity. | Short-term Investments | Less than .005% |
| Asset Type | Fair Value | Valuation Technique(s) | Unobservable Input | Amount or Range/Weighted Average | Impact to Valuation from an Increase in Input A |
| Equities | $60,064,977 | Market comparable | Enterprise value/Revenue multiple (EV/R) | 3.8 - 5.9 / 5.0 | Increase |
| Market approach | Discount rate | 50.0% | Decrease | ||
| Transaction price | $0.57 | Increase |
| Gross unrealized appreciation | $1,209,114,485 |
| Gross unrealized depreciation | (1,589,521,004) |
| Net unrealized appreciation (depreciation) | $(380,406,519) |
| Tax Cost | $6,012,691,722 |
| Undistributed ordinary income | $42,840,133 |
| Capital loss carryforward | $(249,361,263) |
| Net unrealized appreciation (depreciation) on securities and other investments | $(381,519,728) |
Short-term | $(249,361,263) |
Long-term | - |
| Total capital loss carryforward | $(249,361,263) |
| October 31, 2022 | October 31, 2021 | |
| Ordinary Income | $90,092,233 | $14,214,447 |
| Long-term Capital Gains | 391,699,341 | 79,887,943 |
| Total | $481,791,574 | $ 94,102,390 |
| Purchases ($) | Sales ($) | |
| Fidelity Emerging Markets Fund | 2,722,896,111 | 2,361,537,052 |
| Distribution Fee | Service Fee | Total Fees | Retained by FDC | |
| Class A | - % | .25% | $28,317 | $614 |
| Class M | .25% | .25% | 9,186 | - |
| Class C | .75% | .25% | 15,649 | 5,798 |
| $53,152 | $6,412 |
| Retained by FDC | |
| Class A | $4,098 |
| Class M | 744 |
Class C A | 168 |
| $5,010 |
| Amount | % of Class-Level Average Net Assets | |
| Class A | $25,749 | .23 |
| Class M | 5,032 | .27 |
| Class C | 4,166 | .27 |
| Emerging Markets | 6,980,200 | .17 |
| Class K | 514,750 | .04 |
| Class I | 62,433 | .16 |
| Class Z | 659,897 | .04 |
| $8,252,227 |
| % of Average Net Assets | |
| Fidelity Emerging Markets Fund | .02 |
| Amount | |
| Fidelity Emerging Markets Fund | $12,271 |
| Purchases ($) | Sales ($) | Realized Gain (Loss) ($) | |
| Fidelity Emerging Markets Fund | 37,025,287 | 55,878,168 | (9,896,793) |
| Amount ($) | |
| Fidelity Emerging Markets Fund | 2,920 |
| Amount | |
| Fidelity Emerging Markets Fund | $12,589 |
| Total Security Lending Fees Paid to NFS | Security Lending Income From Securities Loaned to NFS | Value of Securities Loaned to NFS at Period End | |
| Fidelity Emerging Markets Fund | $32,812 | $95 | $- |
Year ended October 31, 2022 | Year ended October 31, 2021 A | |
| Fidelity Emerging Markets Fund | ||
| Class A | $625,889 | $- |
| Class M | 114,309 | - |
| Class C | 82,608 | - |
| Emerging Markets | 277,953,427 | 73,337,964 |
| Class K | 95,062,813 | 20,764,426 |
| Class I | 1,596,371 | - |
| Class Z | 106,356,157 | - |
Total | $481,791,574 | $94,102,390 |
| Shares | Shares | Dollars | Dollars | |
| Year ended October 31, 2022 | Year ended October 31, 2021 A | Year ended October 31, 2022 | Year ended October 31, 2021 A | |
| Fidelity Emerging Markets Fund | ||||
| Class A | ||||
| Shares sold | 405,334 | 33,473 | $16,326,133 | $1,591,260 |
| Issued in exchange for the shares of the Target Fund(s) | - | 108,045 | - | 4,995,991 |
| Reinvestment of distributions | 14,217 | - | 609,645 | - |
| Shares redeemed | (188,821) | (9,921) | (6,470,572) | (469,831) |
| Net increase (decrease) | 230,730 | 131,597 | $10,465,206 | $6,117,420 |
| Class M | ||||
| Shares sold | 9,094 | 5,398 | $331,845 | $256,234 |
| Issued in exchange for the shares of the Target Fund(s) | - | 47,393 | - | 2,190,992 |
| Reinvestment of distributions | 2,657 | - | 114,195 | - |
| Shares redeemed | (8,614) | (5,681) | (305,492) | (268,777) |
| Net increase (decrease) | 3,137 | 47,110 | $140,548 | $ 2,178,449 |
| Class C | ||||
| Shares sold | 27,888 | 5,656 | $ 1,033,697 | $268,640 |
| Issued in exchange for the shares of the Target Fund(s) | - | 37,074 | - | 1,713,931 |
| Reinvestment of distributions | 1,916 | - | 82,366 | - |
| Shares redeemed | (13,429) | (9,195) | (473,302) | (437,335) |
| Net increase (decrease) | 16,375 | 33,535 | $642,761 | $1,545,236 |
| Emerging Markets | ||||
| Shares sold | 90,211,588 | 51,262,366 | $3,178,493,756 | $2,407,337,547 |
| Issued in exchange for the shares of the Target Fund(s) | - | 1,053,093 | - | 48,684,329 |
| Reinvestment of distributions | 4,752,444 | 1,357,618 | 204,307,548 | 60,020,270 |
| Shares redeemed | (80,932,071) | (60,624,133) | (2,841,698,156) | (2,847,240,636) |
| Net increase (decrease) | 14,031,961 | (6,951,056) | $541,103,148 | $(331,198,490) |
| Class K | ||||
| Shares sold | 8,137,924 | 13,228,413 | $295,826,108 | $621,422,438 |
| Reinvestment of distributions | 2,211,734 | 469,461 | 95,060,337 | 20,764,260 |
| Shares redeemed | (16,201,876) | (8,670,886) | (567,669,911) | (406,215,879) |
| Net increase (decrease) | (5,852,218) | 5,026,988 | $(176,783,466) | $235,970,819 |
| Class I | ||||
| Shares sold | 2,413,035 | 187,665 | $83,439,062 | $8,912,073 |
| Issued in exchange for the shares of the Target Fund(s) | - | 456,278 | - | 21,098,248 |
| Reinvestment of distributions | 35,220 | - | 1,511,652 | - |
| Shares redeemed | (1,272,970) | (100,871) | (42,317,885) | (4,648,575) |
| Net increase (decrease) | 1,175,285 | 543,072 | $42,632,829 | $25,361,746 |
| Class Z | ||||
| Shares sold | 8,050,253 | 37,800,433 | $312,633,669 | $1,778,004,149 |
| Reinvestment of distributions | 2,468,777 | - | 105,984,590 | - |
| Shares redeemed | (1,412,722) | (22,060) | (48,947,397) | (1,051,465) |
| Net increase (decrease) | 9,106,308 | 37,778,373 | $369,670,862 | $1,776,952,684 |
| Strategic Advisers Fidelity Emerging Markets Fund | |
| Fidelity Emerging Markets Fund | 14% |
| Fund | % of shares held |
| Fidelity Emerging Markets Fund | 34% |
| Target Fund | Investments $ | Unrealized appreciation (depreciation) $ | Net Assets $ | Shares Exchanged | Shares Exchanged Ratio |
| Fidelity Emerging Europe, Middle East, Africa (EMEA) Fund | 56,236,270 | 7,237,677 | |||
Class A | 4,995,991 | 108,045 | .2212608131 | ||
Class M | 2,190,992 | 47,393 | .2206510924 | ||
Class C | 1,713,931 | 37,074 | .2226022064 | ||
| Emerging Europe, Middle East, Africa (EMEA) | 48,684,329 | 1,053,093 | .2212329656 | ||
Class I | 21,098,248 | 456,278 | .2203676471 |
| Surviving Fund | Net Assets $ | Total net assets after the acquisition $ |
| Fidelity Emerging Markets Fund | $7,934,554,249 | $8,013,237,740 |
| Net investment income (loss) | $21,004,334 |
| Total net realized gain (loss) | 450,169,192 |
| Total change in net unrealized appreciation (depreciation) | 714,676,169 |
| Net increase (decrease) in net assets resulting from operations | $1,185,849,695 |
| Average Annual Total Returns | |||
Periods ended October 31, 2022 | Past 1 year | Past 5 years | Past 10 years |
| Class A (incl.5.75% sales charge) | -34.30% | -2.54% | 3.02% |
| Class M (incl.3.50% sales charge) | -32.94% | -2.39% | 2.99% |
Class C (incl. contingent deferred sales charge) | -31.45% | -2.16% | 2.97% |
| Fidelity® Europe Fund | -30.07% | -1.07% | 3.91% |
| Class I | -30.08% | -1.05% | 3.93% |
| Class Z | -30.00% | -0.97% | 3.98% |
| $10,000 Over 10 Years |
Let's say hypothetically that $10,000 was invested in Fidelity® Europe Fund, a class of the fund, on October 31, 2012. The chart shows how the value of your investment would have changed, and also shows how the MSCI Europe Index performed over the same period. |
 |
Top Holdings (% of Fund's net assets) | ||
| Nestle SA (Reg. S) (Switzerland, Food Products) | 5.3 | |
| Roche Holding AG (participation certificate) (Switzerland, Pharmaceuticals) | 4.7 | |
| LVMH Moet Hennessy Louis Vuitton SE (France, Textiles, Apparel & Luxury Goods) | 4.2 | |
| AstraZeneca PLC (United Kingdom) (United Kingdom, Pharmaceuticals) | 4.2 | |
| TotalEnergies SE (France, Oil, Gas & Consumable Fuels) | 3.8 | |
| ASML Holding NV (Netherlands) (Netherlands, Semiconductors & Semiconductor Equipment) | 3.2 | |
| Diageo PLC (United Kingdom, Beverages) | 2.8 | |
| Sanofi SA (France, Pharmaceuticals) | 2.7 | |
| Glencore PLC (Bailiwick of Jersey, Metals & Mining) | 2.2 | |
| RELX PLC (London Stock Exchange) (United Kingdom, Professional Services) | 2.1 | |
| 35.2 | ||
| Market Sectors (% of Fund's net assets) | ||
| Health Care | 16.9 | |
| Financials | 16.0 | |
| Industrials | 13.5 | |
| Consumer Staples | 13.2 | |
| Consumer Discretionary | 12.2 | |
| Information Technology | 7.4 | |
| Energy | 7.0 | |
| Materials | 6.4 | |
| Utilities | 3.0 | |
| Communication Services | 1.6 | |
| Real Estate | 1.2 | |
Asset Allocation (% of Fund's net assets) |
 |
Foreign investments - 97.6% |
Geographic Diversification (% of Fund's net assets) |
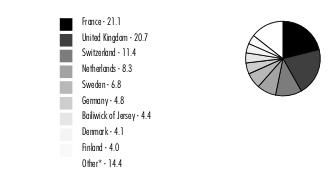 |
* Includes Short-Term investments and Net Other Assets (Liabilities). Percentages are based on country or territory of incorporation and are adjusted for the effect of futures contracts, if applicable. |
| Common Stocks - 98.2% | |||
| Shares | Value ($) | ||
| Austria - 0.6% | |||
| Verbund AG | 41,700 | 3,265,894 | |
| Bailiwick of Jersey - 4.4% | |||
| Experian PLC | 213,500 | 6,807,506 | |
| Ferguson PLC | 49,800 | 5,431,222 | |
| Glencore PLC | 2,135,900 | 12,245,272 | |
TOTAL BAILIWICK OF JERSEY | 24,484,000 | ||
| Belgium - 2.0% | |||
| Fagron NV | 204,908 | 2,551,504 | |
| KBC Group NV | 78,200 | 3,919,052 | |
| UCB SA | 59,800 | 4,510,310 | |
TOTAL BELGIUM | 10,980,866 | ||
| Bermuda - 0.6% | |||
| Hiscox Ltd. | 301,414 | 3,108,189 | |
| Denmark - 4.1% | |||
| DSV A/S | 45,800 | 6,200,443 | |
| Novo Nordisk A/S Series B | 59,800 | 6,502,129 | |
| ORSTED A/S (a) | 80,900 | 6,674,715 | |
| Tryg A/S | 160,500 | 3,473,385 | |
TOTAL DENMARK | 22,850,672 | ||
| Finland - 4.0% | |||
| Elisa Corp. (A Shares) | 130,200 | 6,293,257 | |
| Nordea Bank ABP | 989,900 | 9,460,407 | |
| Sampo Oyj (A Shares) | 136,800 | 6,256,714 | |
TOTAL FINLAND | 22,010,378 | ||
| France - 21.1% | |||
| Air Liquide SA | 88,780 | 11,613,646 | |
| AXA SA | 301,800 | 7,452,923 | |
| BNP Paribas SA | 154,200 | 7,231,043 | |
| Capgemini SA | 45,100 | 7,391,477 | |
| Dassault Aviation SA | 22,100 | 3,284,785 | |
| Dassault Systemes SA | 108,000 | 3,620,028 | |
| Edenred SA | 88,100 | 4,523,888 | |
| LVMH Moet Hennessy Louis Vuitton SE | 37,100 | 23,409,911 | |
| Pernod Ricard SA | 26,700 | 4,688,841 | |
| Sanofi SA | 175,100 | 15,068,732 | |
| Sartorius Stedim Biotech | 23,300 | 7,396,024 | |
| TotalEnergies SE (b) | 382,307 | 20,856,134 | |
TOTAL FRANCE | 116,537,432 | ||
| Germany - 4.8% | |||
| Brenntag SE | 64,900 | 3,937,895 | |
| Deutsche Borse AG | 59,800 | 9,724,662 | |
| RWE AG | 168,200 | 6,481,060 | |
| Scout24 AG (a) | 48,700 | 2,496,869 | |
| Siemens Healthineers AG (a) | 88,800 | 4,068,157 | |
TOTAL GERMANY | 26,708,643 | ||
| Ireland - 1.8% | |||
| Bank of Ireland Group PLC | 791,200 | 5,704,767 | |
| Flutter Entertainment PLC (Ireland) (c) | 32,700 | 4,327,082 | |
TOTAL IRELAND | 10,031,849 | ||
| Israel - 0.5% | |||
| NICE Ltd. (c) | 13,600 | 2,577,940 | |
| Italy - 1.1% | |||
| FinecoBank SpA | 231,600 | 3,121,905 | |
| Prada SpA | 702,200 | 3,198,060 | |
TOTAL ITALY | 6,319,965 | ||
| Netherlands - 8.3% | |||
| Airbus Group NV | 64,200 | 6,946,682 | |
| ASML Holding NV (Netherlands) | 38,000 | 17,825,312 | |
| Ferrari NV (Italy) | 22,600 | 4,455,723 | |
| Heineken NV (Bearer) | 108,800 | 9,096,327 | |
| Prosus NV | 108,512 | 4,692,243 | |
| RHI Magnesita NV | 140,542 | 2,984,934 | |
TOTAL NETHERLANDS | 46,001,221 | ||
| Norway - 3.6% | |||
| Equinor ASA | 281,700 | 10,263,380 | |
| Kongsberg Gruppen ASA | 103,700 | 3,716,628 | |
| TGS ASA | 438,583 | 5,990,562 | |
TOTAL NORWAY | 19,970,570 | ||
| Spain - 1.7% | |||
| Amadeus IT Holding SA Class A (c) | 74,700 | 3,896,001 | |
| CaixaBank SA | 1,576,000 | 5,226,087 | |
TOTAL SPAIN | 9,122,088 | ||
| Sweden - 6.7% | |||
| ASSA ABLOY AB (B Shares) | 356,000 | 7,188,381 | |
| Haypp Group (c) | 491,497 | 1,066,130 | |
| HEXPOL AB (B Shares) | 394,600 | 3,895,537 | |
| Indutrade AB | 310,500 | 5,437,378 | |
| Investor AB (B Shares) | 420,900 | 6,875,478 | |
| Kry International AB (c)(d)(e) | 406 | 71,078 | |
| Sandvik AB | 364,200 | 5,691,262 | |
| Swedish Match Co. AB | 671,600 | 6,907,335 | |
TOTAL SWEDEN | 37,132,579 | ||
| Switzerland - 11.4% | |||
| Compagnie Financiere Richemont SA Series A | 81,030 | 7,919,350 | |
| Nestle SA (Reg. S) | 267,170 | 29,083,808 | |
| Roche Holding AG (participation certificate) | 77,380 | 25,674,544 | |
TOTAL SWITZERLAND | 62,677,702 | ||
| United Kingdom - 20.7% | |||
| AstraZeneca PLC (United Kingdom) | 196,600 | 23,067,509 | |
| Beazley PLC | 503,600 | 3,606,665 | |
| Bunzl PLC | 158,600 | 5,167,281 | |
| Compass Group PLC | 524,500 | 11,046,928 | |
| Deliveroo PLC Class A (a)(c) | 2,126,500 | 2,125,545 | |
| Diageo PLC | 379,487 | 15,616,845 | |
| Grainger Trust PLC | 873,600 | 2,274,187 | |
| Harbour Energy PLC | 410,847 | 1,780,511 | |
| JD Sports Fashion PLC | 1,887,400 | 2,109,060 | |
| Lloyds Banking Group PLC | 9,773,045 | 4,693,680 | |
| Londonmetric Properity PLC | 915,528 | 1,962,315 | |
| Mondi PLC | 310,340 | 5,205,007 | |
| Next PLC | 52,100 | 2,944,993 | |
| Prudential PLC | 630,638 | 5,858,420 | |
| Reckitt Benckiser Group PLC | 112,336 | 7,455,068 | |
| RELX PLC (London Stock Exchange) | 439,676 | 11,809,915 | |
| RS GROUP PLC | 317,700 | 3,492,183 | |
| Sabre Insurance Group PLC (a) | 1,989,822 | 2,049,171 | |
| Safestore Holdings PLC | 211,600 | 2,192,459 | |
TOTAL UNITED KINGDOM | 114,457,742 | ||
| United States of America - 0.8% | |||
| ResMed, Inc. | 18,700 | 4,183,003 | |
| TOTAL COMMON STOCKS (Cost $567,106,141) | 542,420,733 | ||
| Preferred Stocks - 0.2% | |||
| Shares | Value ($) | ||
| Convertible Preferred Stocks - 0.1% | |||
| Estonia - 0.1% | |||
| Bolt Technology OU Series E (d)(e) | 3,852 | 470,589 | |
| Nonconvertible Preferred Stocks - 0.1% | |||
| Sweden - 0.1% | |||
| Kry International AB Series E (c)(d)(e) | 2,345 | 410,536 | |
| TOTAL PREFERRED STOCKS (Cost $2,072,807) | 881,125 | ||
| Money Market Funds - 0.6% | |||
| Shares | Value ($) | ||
Fidelity Securities Lending Cash Central Fund 3.10% (f)(g) (Cost $3,435,000) | 3,434,657 | 3,435,000 | |
| TOTAL INVESTMENT IN SECURITIES - 99.0% (Cost $572,613,948) | 546,736,858 |
NET OTHER ASSETS (LIABILITIES) - 1.0% | 5,747,855 |
| NET ASSETS - 100.0% | 552,484,713 |
| (a) | Security exempt from registration under Rule 144A of the Securities Act of 1933. These securities may be resold in transactions exempt from registration, normally to qualified institutional buyers. At the end of the period, the value of these securities amounted to $17,414,457 or 3.2% of net assets. |
| (b) | Security or a portion of the security is on loan at period end. |
| (c) | Non-income producing |
| (d) | Restricted securities (including private placements) - Investment in securities not registered under the Securities Act of 1933 (excluding 144A issues). At the end of the period, the value of restricted securities (excluding 144A issues) amounted to $952,203 or 0.2% of net assets. |
| (e) | Level 3 security |
| (f) | Affiliated fund that is generally available only to investment companies and other accounts managed by Fidelity Investments. The rate quoted is the annualized seven-day yield of the fund at period end. A complete unaudited listing of the fund's holdings as of its most recent quarter end is available upon request. In addition, each Fidelity Central Fund's financial statements, which are not covered by the Fund's Report of Independent Registered Public Accounting Firm, are available on the SEC's website or upon request. |
| (g) | Investment made with cash collateral received from securities on loan. |
| Additional information on each restricted holding is as follows: | ||
| Security | Acquisition Date | Acquisition Cost ($) |
| Bolt Technology OU Series E | 1/03/22 | 1,000,736 |
| Kry International AB | 5/14/21 | 176,328 |
| Kry International AB Series E | 5/14/21 | 1,072,071 |
| Affiliate | Value, beginning of period ($) | Purchases ($) | Sales Proceeds ($) | Dividend Income ($) | Realized Gain (loss) ($) | Change in Unrealized appreciation (depreciation) ($) | Value, end of period ($) | % ownership, end of period |
| Fidelity Cash Central Fund 3.10% | 8,041,251 | 180,021,323 | 188,062,574 | 36,328 | - | - | - | 0.0% |
| Fidelity Securities Lending Cash Central Fund 3.10% | 34,103,332 | 189,925,086 | 220,593,418 | 192,200 | - | - | 3,435,000 | 0.0% |
| Total | 42,144,583 | 369,946,409 | 408,655,992 | 228,528 | - | - | 3,435,000 | |
| Valuation Inputs at Reporting Date: | ||||
| Description | Total ($) | Level 1 ($) | Level 2 ($) | Level 3 ($) |
Investments in Securities: | ||||
| Equities: | ||||
Communication Services | 8,790,126 | 8,790,126 | - | - |
Consumer Discretionary | 67,295,025 | 20,226,593 | 47,068,432 | - |
Consumer Staples | 72,848,224 | 13,785,168 | 59,063,056 | - |
Energy | 38,890,587 | 7,771,073 | 31,119,514 | - |
Financials | 87,762,548 | 43,656,681 | 44,105,867 | - |
Health Care | 93,021,912 | 18,640,841 | 74,381,071 | - |
Industrials | 75,111,561 | 32,729,920 | 42,381,641 | - |
Information Technology | 40,786,849 | 7,101,828 | 32,732,818 | 952,203 |
Materials | 35,944,396 | 12,085,478 | 23,858,918 | - |
Real Estate | 6,428,961 | 6,428,961 | - | - |
Utilities | 16,421,669 | 9,746,954 | 6,674,715 | - |
| Money Market Funds | 3,435,000 | 3,435,000 | - | - |
| Total Investments in Securities: | 546,736,858 | 184,398,623 | 361,386,032 | 952,203 |
| Statement of Assets and Liabilities | ||||
| October 31, 2022 | ||||
| Assets | ||||
| Investment in securities, at value (including securities loaned of $3,267,485) - See accompanying schedule: | ||||
Unaffiliated issuers (cost $569,178,948) | $543,301,858 | |||
Fidelity Central Funds (cost $3,435,000) | 3,435,000 | |||
| Total Investment in Securities (cost $572,613,948) | $ | 546,736,858 | ||
| Receivable for investments sold | 11,476,567 | |||
| Receivable for fund shares sold | 90,358 | |||
| Dividends receivable | 94,084 | |||
| Reclaims receivable | 3,354,337 | |||
| Distributions receivable from Fidelity Central Funds | 10,168 | |||
| Prepaid expenses | 968 | |||
Total assets | 561,763,340 | |||
| Liabilities | ||||
| Payable to custodian bank | 206,197 | |||
| Payable for investments purchased | 4,814,896 | |||
| Payable for fund shares redeemed | 345,984 | |||
| Accrued management fee | 288,381 | |||
| Distribution and service plan fees payable | 7,134 | |||
| Other affiliated payables | 108,386 | |||
| Other payables and accrued expenses | 72,649 | |||
| Collateral on securities loaned | 3,435,000 | |||
| Total Liabilities | 9,278,627 | |||
| Net Assets | $ | 552,484,713 | ||
| Net Assets consist of: | ||||
| Paid in capital | $ | 679,542,714 | ||
| Total accumulated earnings (loss) | (127,058,001) | |||
| Net Assets | $ | 552,484,713 | ||
| Net Asset Value and Maximum Offering Price | ||||
| Class A : | ||||
Net Asset Value and redemption price per share ($16,494,514 ÷ 597,995 shares) (a) | $ | 27.58 | ||
| Maximum offering price per share (100/94.25 of $27.58) | $ | 29.26 | ||
| Class M : | ||||
Net Asset Value and redemption price per share ($4,066,043 ÷ 147,039 shares) (a) | $ | 27.65 | ||
| Maximum offering price per share (100/96.50 of $27.65) | $ | 28.65 | ||
| Class C : | ||||
Net Asset Value and offering price per share ($2,495,505 ÷ 91,198 shares) (a) | $ | 27.36 | ||
| Europe : | ||||
Net Asset Value , offering price and redemption price per share ($523,685,342 ÷ 18,997,445 shares) | $ | 27.57 | ||
| Class I : | ||||
Net Asset Value , offering price and redemption price per share ($4,282,772 ÷ 155,375 shares) | $ | 27.56 | ||
| Class Z : | ||||
Net Asset Value , offering price and redemption price per share ($1,460,537 ÷ 53,140 shares) | $ | 27.48 | ||
(a)Redemption price per share is equal to net asset value less any applicable contingent deferred sales charge. | ||||
| Statement of Operations | ||||
Year ended October 31, 2022 | ||||
| Investment Income | ||||
| Dividends | $ | 20,836,387 | ||
| Foreign Tax Reclaims | 1,475,492 | |||
| Income from Fidelity Central Funds (including $192,200 from security lending) | 228,528 | |||
| Income before foreign taxes withheld | 22,540,407 | |||
| Less foreign taxes withheld | (3,653,402) | |||
| Total Income | 18,887,005 | |||
| Expenses | ||||
| Management fee | ||||
| Basic fee | $ | 4,910,647 | ||
| Performance adjustment | (295,284) | |||
| Transfer agent fees | 1,182,109 | |||
| Distribution and service plan fees | 121,315 | |||
| Accounting fees | 348,123 | |||
| Custodian fees and expenses | 60,663 | |||
| Independent trustees' fees and expenses | 2,652 | |||
| Registration fees | 86,802 | |||
| Audit | 76,298 | |||
| Legal | 985 | |||
| Interest | 106 | |||
| Miscellaneous | 4,034 | |||
| Total expenses before reductions | 6,498,450 | |||
| Expense reductions | (23,547) | |||
| Total expenses after reductions | 6,474,903 | |||
| Net Investment income (loss) | 12,412,102 | |||
| Realized and Unrealized Gain (Loss) | ||||
| Net realized gain (loss) on: | ||||
| Investment Securities: | ||||
| Unaffiliated issuers | (97,287,713) | |||
| Foreign currency transactions | (255,336) | |||
| Total net realized gain (loss) | (97,543,049) | |||
| Change in net unrealized appreciation (depreciation) on: | ||||
| Investment Securities: | ||||
| Unaffiliated issuers | (183,848,302) | |||
| Assets and liabilities in foreign currencies | (467,682) | |||
| Total change in net unrealized appreciation (depreciation) | (184,315,984) | |||
| Net gain (loss) | (281,859,033) | |||
| Net increase (decrease) in net assets resulting from operations | $ | (269,446,931) | ||
| Statement of Changes in Net Assets | ||||
Year ended October 31, 2022 | Year ended October 31, 2021 | |||
| Increase (Decrease) in Net Assets | ||||
| Operations | ||||
| Net investment income (loss) | $ | 12,412,102 | $ | 12,420,980 |
| Net realized gain (loss) | (97,543,049) | 117,610,008 | ||
| Change in net unrealized appreciation (depreciation) | (184,315,984) | 130,739,875 | ||
| Net increase (decrease) in net assets resulting from operations | (269,446,931) | 260,770,863 | ||
| Distributions to shareholders | (133,487,366) | (11,168,809) | ||
| Share transactions - net increase (decrease) | (44,868,451) | (72,286,730) | ||
| Total increase (decrease) in net assets | (447,802,748) | 177,315,324 | ||
| Net Assets | ||||
| Beginning of period | 1,000,287,461 | 822,972,137 | ||
| End of period | $ | 552,484,713 | $ | 1,000,287,461 |
| Fidelity Advisor® Europe Fund Class A |
| Years ended October 31, | 2022 | 2021 | 2020 | 2019 | 2018 | |||||
Selected Per-Share Data | ||||||||||
| Net asset value, beginning of period | $ | 46.12 | $ | 35.37 | $ | 36.30 | $ | 37.61 | $ | 42.47 |
| Income from Investment Operations | ||||||||||
Net investment income (loss) A,B | .47 | .41 | .19 | 1.41 C | .34 | |||||
| Net realized and unrealized gain (loss) | (12.91) | 10.72 | 1.46 | .82 | (4.21) D | |||||
| Total from investment operations | (12.44) | 11.13 | 1.65 | 2.23 | (3.87) | |||||
| Distributions from net investment income | (.99) | (.38) | (1.50) | (.11) | (.33) | |||||
| Distributions from net realized gain | (5.12) | - | (1.08) | (3.43) | (.66) | |||||
| Total distributions | (6.10) E | (.38) | (2.58) | (3.54) | (.99) | |||||
| Net asset value, end of period | $ | 27.58 | $ | 46.12 | $ | 35.37 | $ | 36.30 | $ | 37.61 |
Total Return F,G | (30.29)% | 31.60% | 4.62% | 7.21% | (9.31)% D | |||||
Ratios to Average Net Assets B,H,I | ||||||||||
| Expenses before reductions | 1.18% | 1.36% | 1.34% | 1.09% | 1.28% | |||||
| Expenses net of fee waivers, if any | 1.18% | 1.36% | 1.34% | 1.09% | 1.28% | |||||
| Expenses net of all reductions | 1.18% | 1.36% | 1.33% | 1.07% | 1.28% | |||||
| Net investment income (loss) | 1.42% | .92% | .56% | 4.02% C | .82% | |||||
| Supplemental Data | ||||||||||
| Net assets, end of period (000 omitted) | $ | 16,495 | $ | 32,148 | $ | 23,189 | $ | 20,819 | $ | 19,531 |
Portfolio turnover rate J | 55% | 52% | 39% | 45% | 57% |
| Fidelity Advisor® Europe Fund Class M |
| Years ended October 31, | 2022 | 2021 | 2020 | 2019 | 2018 | |||||
Selected Per-Share Data | ||||||||||
| Net asset value, beginning of period | $ | 46.18 | $ | 35.42 | $ | 36.32 | $ | 37.57 | $ | 42.47 |
| Income from Investment Operations | ||||||||||
Net investment income (loss) A,B | .37 | .27 | .09 | 1.30 C | .21 | |||||
| Net realized and unrealized gain (loss) | (12.95) | 10.75 | 1.45 | .83 | (4.23) D | |||||
| Total from investment operations | (12.58) | 11.02 | 1.54 | 2.13 | (4.02) | |||||
| Distributions from net investment income | (.83) | (.26) | (1.36) | - | (.23) | |||||
| Distributions from net realized gain | (5.12) | - | (1.08) | (3.38) | (.66) | |||||
| Total distributions | (5.95) | (.26) | (2.44) | (3.38) | (.88) E | |||||
| Net asset value, end of period | $ | 27.65 | $ | 46.18 | $ | 35.42 | $ | 36.32 | $ | 37.57 |
Total Return F,G | (30.51)% | 31.20% | 4.30% | 6.88% | (9.63)% D | |||||
Ratios to Average Net Assets B,H,I | ||||||||||
| Expenses before reductions | 1.49% | 1.68% | 1.65% | 1.41% | 1.61% | |||||
| Expenses net of fee waivers, if any | 1.48% | 1.68% | 1.65% | 1.40% | 1.61% | |||||
| Expenses net of all reductions | 1.48% | 1.68% | 1.64% | 1.38% | 1.61% | |||||
| Net investment income (loss) | 1.12% | .59% | .25% | 3.70% C | .50% | |||||
| Supplemental Data | ||||||||||
| Net assets, end of period (000 omitted) | $ | 4,066 | $ | 6,937 | $ | 5,204 | $ | 5,782 | $ | 7,257 |
Portfolio turnover rate J | 55% | 52% | 39% | 45% | 57% |
| Fidelity Advisor® Europe Fund Class C |
| Years ended October 31, | 2022 | 2021 | 2020 | 2019 | 2018 | |||||
Selected Per-Share Data | ||||||||||
| Net asset value, beginning of period | $ | 45.63 | $ | 35.01 | $ | 35.87 | $ | 37.23 | $ | 42.15 |
| Income from Investment Operations | ||||||||||
Net investment income (loss) A,B | .21 | .04 | (.09) | 1.12 C | .02 | |||||
| Net realized and unrealized gain (loss) | (12.84) | 10.64 | 1.45 | .82 | (4.18) D | |||||
| Total from investment operations | (12.63) | 10.68 | 1.36 | 1.94 | (4.16) | |||||
| Distributions from net investment income | (.52) | (.06) | (1.14) | - | (.10) | |||||
| Distributions from net realized gain | (5.12) | - | (1.08) | (3.30) | (.66) | |||||
| ��Total distributions | (5.64) | (.06) | (2.22) | (3.30) | (.76) | |||||
| Net asset value, end of period | $ | 27.36 | $ | 45.63 | $ | 35.01 | $ | 35.87 | $ | 37.23 |
Total Return E,F | (30.85)% | 30.53% | 3.81% | 6.35% | (10.04)% D | |||||
Ratios to Average Net Assets B,G,H | ||||||||||
| Expenses before reductions | 1.99% | 2.19% | 2.15% | 1.90% | 2.06% | |||||
| Expenses net of fee waivers, if any | 1.98% | 2.18% | 2.15% | 1.90% | 2.06% | |||||
| Expenses net of all reductions | 1.98% | 2.18% | 2.14% | 1.87% | 2.06% | |||||
| Net investment income (loss) | .62% | .09% | (.25)% | 3.21% C | .04% | |||||
| Supplemental Data | ||||||||||
| Net assets, end of period (000 omitted) | $ | 2,496 | $ | 5,255 | $ | 5,242 | $ | 6,145 | $ | 10,060 |
Portfolio turnover rate I | 55% | 52% | 39% | 45% | 57% |
| Fidelity® Europe Fund |
| Years ended October 31, | 2022 | 2021 | 2020 | 2019 | 2018 | |||||
Selected Per-Share Data | ||||||||||
| Net asset value, beginning of period | $ | 46.11 | $ | 35.35 | $ | 36.28 | $ | 37.70 | $ | 42.53 |
| Income from Investment Operations | ||||||||||
Net investment income (loss) A,B | .57 | .54 | .30 | 1.52 C | .48 | |||||
| Net realized and unrealized gain (loss) | (12.88) | 10.71 | 1.46 | .81 | (4.24) D | |||||
| Total from investment operations | (12.31) | 11.25 | 1.76 | 2.33 | (3.76) | |||||
| Distributions from net investment income | (1.11) | (.49) | (1.61) | (.32) | (.41) | |||||
| Distributions from net realized gain | (5.12) | - | (1.08) | (3.43) | (.66) | |||||
| Total distributions | (6.23) | (.49) | (2.69) | (3.75) | (1.07) | |||||
| Net asset value, end of period | $ | 27.57 | $ | 46.11 | $ | 35.35 | $ | 36.28 | $ | 37.70 |
Total Return E | (30.07)% | 31.99% | 4.95% | 7.56% | (9.05)% D | |||||
Ratios to Average Net Assets B,F,G | ||||||||||
| Expenses before reductions | .88% | 1.06% | 1.03% | .78% | .96% | |||||
| Expenses net of fee waivers, if any | .88% | 1.06% | 1.03% | .77% | .96% | |||||
| Expenses net of all reductions | .88% | 1.06% | 1.02% | .75% | .96% | |||||
| Net investment income (loss) | 1.73% | 1.21% | .86% | 4.33% C | 1.14% | |||||
| Supplemental Data | ||||||||||
| Net assets, end of period (000 omitted) | $ | 523,685 | $ | 913,296 | $ | 755,125 | $ | 836,373 | $ | 941,670 |
Portfolio turnover rate H | 55% | 52% | 39% | 45% | 57% |
| Fidelity Advisor® Europe Fund Class I |
| Years ended October 31, | 2022 | 2021 | 2020 | 2019 | 2018 | |||||
Selected Per-Share Data | ||||||||||
| Net asset value, beginning of period | $ | 46.07 | $ | 35.34 | $ | 36.27 | $ | 37.69 | $ | 42.53 |
| Income from Investment Operations | ||||||||||
Net investment income (loss) A,B | .60 | .54 | .31 | 1.53 C | .48 | |||||
| Net realized and unrealized gain (loss) | (12.91) | 10.70 | 1.46 | .80 | (4.23) D | |||||
| Total from investment operations | (12.31) | 11.24 | 1.77 | 2.33 | (3.75) | |||||
| Distributions from net investment income | (1.08) | (.51) | (1.62) | (.32) | (.43) | |||||
| Distributions from net realized gain | (5.12) | - | (1.08) | (3.43) | (.66) | |||||
| Total distributions | (6.20) | (.51) | (2.70) | (3.75) | (1.09) | |||||
| Net asset value, end of period | $ | 27.56 | $ | 46.07 | $ | 35.34 | $ | 36.27 | $ | 37.69 |
Total Return E | (30.08)% | 31.99% | 4.99% | 7.58% | (9.02)% D | |||||
Ratios to Average Net Assets B,F,G | ||||||||||
| Expenses before reductions | .86% | 1.06% | 1.00% | .75% | .95% | |||||
| Expenses net of fee waivers, if any | .86% | 1.06% | 1.00% | .74% | .95% | |||||
| Expenses net of all reductions | .86% | 1.06% | .99% | .72% | .95% | |||||
| Net investment income (loss) | 1.74% | 1.22% | .90% | 4.36% C | 1.16% | |||||
| Supplemental Data | ||||||||||
| Net assets, end of period (000 omitted) | $ | 4,283 | $ | 14,401 | $ | 14,733 | $ | 6,686 | $ | 7,318 |
Portfolio turnover rate H | 55% | 52% | 39% | 45% | 57% |
| Fidelity Advisor® Europe Fund Class Z |
| Years ended October 31, | 2022 | 2021 | 2020 | 2019 | 2018 A | |||||
Selected Per-Share Data | ||||||||||
| Net asset value, beginning of period | $ | 46.00 | $ | 35.27 | $ | 36.21 | $ | 37.69 | $ | 41.00 |
| Income from Investment Operations | ||||||||||
Net investment income (loss) B,C | .62 | .59 | .34 | 1.53 D | .06 | |||||
| Net realized and unrealized gain (loss) | (12.86) | 10.67 | 1.47 | .82 | (3.37) E | |||||
| Total from investment operations | (12.24) | 11.26 | 1.81 | 2.35 | (3.31) | |||||
| Distributions from net investment income | (1.17) | (.53) | (1.67) | (.41) | - | |||||
| Distributions from net realized gain | (5.12) | - | (1.08) | (3.43) | - | |||||
| Total distributions | (6.28) F | (.53) | (2.75) | (3.83) F | - | |||||
| Net asset value, end of period | $ | 27.48 | $ | 46.00 | $ | 35.27 | $ | 36.21 | $ | 37.69 |
Total Return G,H | (30.00)% | 32.13% | 5.11% | 7.71% | (8.07)% E | |||||
Ratios to Average Net Assets C,I,J | ||||||||||
| Expenses before reductions | .76% | .95% | .91% | .65% | .91% K | |||||
| Expenses net of fee waivers, if any | .75% | .95% | .90% | .64% | .90% K | |||||
| Expenses net of all reductions | .75% | .95% | .90% | .62% | .90% K | |||||
| Net investment income (loss) | 1.85% | 1.33% | .99% | 4.46% D | 2.04% K | |||||
| Supplemental Data | ||||||||||
| Net assets, end of period (000 omitted) | $ | 1,461 | $ | 28,249 | $ | 19,479 | $ | 21,838 | $ | 104 |
Portfolio turnover rate L | 55% | 52% | 39% | 45% | 57% |
| Fidelity Central Fund | Investment Manager | Investment Objective | Investment Practices | Expense Ratio A |
| Fidelity Money Market Central Funds | Fidelity Management & Research Company LLC (FMR) | Each fund seeks to obtain a high level of current income consistent with the preservation of capital and liquidity. | Short-term Investments | Less than .005% |
| Gross unrealized appreciation | $40,642,080 |
| Gross unrealized depreciation | (66,519,169) |
| Net unrealized appreciation (depreciation) | $(25,877,089) |
| Tax Cost | $572,613,947 |
| Capital loss carryforward | $(98,923,671) |
| Net unrealized appreciation (depreciation) on securities and other investments | $(26,238,559) |
Short-term | $(54,492,199) |
Long-term | (44,431,472) |
| Total capital loss carryforward | $(98,923,671) |
| October 31, 2022 | October 31, 2021 | |
| Ordinary Income | $58,772,480 | $11,168,809 |
| Long-term Capital Gains | 74,714,886 | - |
| Total | $133,487,366 | $11,168,809 |
| Purchases ($) | Sales ($) | |
| Fidelity Europe Fund | 397,341,205 | 566,594,527 |
| Distribution Fee | Service Fee | Total Fees | Retained by FDC | |
| Class A | - % | .25% | $58,904 | $510 |
| Class M | .25% | .25% | 26,780 | 155 |
| Class C | .75% | .25% | 35,631 | 3,211 |
| $121,315 | $3,876 |
| Retained by FDC | |
| Class A | $905 |
| Class M | 344 |
Class C A | 57 |
| $1,306 |
| Amount | % of Class-Level Average Net Assets | |
| Class A | $50,954 | .22 |
| Class M | 14,408 | .27 |
| Class C | 9,557 | .27 |
| Europe | 1,088,056 | .16 |
| Class I | 10,837 | .15 |
| Class Z | 8,297 | .04 |
| $1,182,109 |
| % of Average Net Assets | |
| Fidelity Europe Fund | .05 |
| Amount | |
| Fidelity Europe Fund | $ 1 |
| Borrower or Lender | Average Loan Balance | Weighted Average Interest Rate | Interest Expense | |
| Fidelity Europe Fund | Borrower | $ 12,097,000 | .32% | $ 106 |
| Purchases ($) | Sales ($) | Realized Gain (Loss) ($) | |
| Fidelity Europe Fund | 5,821,367 | 69,355,856 | (20,125,831) |
| Amount ($) | |
| Fidelity Europe Fund | 33,953 |
| Amount | |
| Fidelity Europe Fund | $1,331 |
| Total Security Lending Fees Paid to NFS | Security Lending Income From Securities Loaned to NFS | Value of Securities Loaned to NFS at Period End | |
| Fidelity Europe Fund | $20,160 | $- | $- |
Year ended October 31, 2022 | Year ended October 31, 2021 | |
| Fidelity Europe Fund | ||
| Class A | $4,275,681 | $241,388 |
| Class M | 898,902 | 38,916 |
| Class C | 639,208 | 9,133 |
| Europe | 122,299,625 | 10,371,239 |
| Class I | 1,583,837 | 209,546 |
| Class Z | 3,790,113 | 298,587 |
Total | $133,487,366 | $11,168,809 |
| Shares | Shares | Dollars | Dollars | |
| Year ended October 31, 2022 | Year ended October 31, 2021 | Year ended October 31, 2022 | Year ended October 31, 2021 | |
| Fidelity Europe Fund | ||||
| Class A | ||||
| Shares sold | 89,634 | 129,162 | $3,307,956 | $5,858,048 |
| Reinvestment of distributions | 114,063 | 5,827 | 4,203,218 | 239,071 |
| Shares redeemed | (302,699) | (93,596) | (9,893,172) | (4,072,920) |
| Net increase (decrease) | (99,002) | 41,393 | $(2,381,998) | $2,024,199 |
| Class M | ||||
| Shares sold | 8,884 | 20,932 | $301,526 | $948,034 |
| Reinvestment of distributions | 23,449 | 939 | 868,563 | 38,692 |
| Shares redeemed | (35,522) | (18,538) | (1,126,542) | (834,046) |
| Net increase (decrease) | (3,189) | 3,333 | $43,547 | $152,680 |
| Class C | ||||
| Shares sold | 5,167 | 24,151 | $168,904 | $1,075,965 |
| Reinvestment of distributions | 17,238 | 222 | 634,712 | 9,092 |
| Shares redeemed | (46,375) | (58,936) | (1,573,732) | (2,674,765) |
| Net increase (decrease) | (23,970) | (34,563) | $(770,116) | $(1,589,708) |
| Europe | ||||
| Shares sold | 1,206,003 | 2,702,281 | $40,801,820 | $121,751,029 |
| Reinvestment of distributions | 3,093,089 | 237,710 | 113,578,213 | 9,724,714 |
| Shares redeemed | (5,107,735) | (4,496,170) | (176,296,705) | (202,195,601) |
| Net increase (decrease) | (808,643) | (1,556,179) | $(21,916,672) | $(70,719,858) |
| Class I | ||||
| Shares sold | 42,946 | 194,151 | $1,701,289 | $8,782,703 |
| Reinvestment of distributions | 41,688 | 4,920 | 1,530,795 | 201,081 |
| Shares redeemed | (241,861) | (303,416) | (8,753,022) | (13,867,304) |
| Net increase (decrease) | (157,227) | (104,345) | $(5,520,938) | $(4,883,520) |
| Class Z | ||||
| Shares sold | 91,178 | 176,120 | $3,170,475 | $7,943,844 |
| Reinvestment of distributions | 99,611 | 7,125 | 3,642,775 | 290,498 |
| Shares redeemed | (751,739) | (121,503) | (21,135,524) | (5,504,865) |
| Net increase (decrease) | (560,950) | 61,742 | $(14,322,274) | $2,729,477 |
| Average Annual Total Returns | |||
Periods ended October 31, 2022 | Past 1 year | Past 5 years | Past 10 years |
| Class A (incl.5.75% sales charge) | -33.44% | -0.93% | 4.92% |
| Class M (incl.3.50% sales charge) | -32.02% | -0.77% | 4.82% |
Class C (incl. contingent deferred sales charge) | -30.48% | -0.45% | 4.94% |
| Fidelity® Japan Fund | -29.16% | 0.54% | 5.85% |
| Class I | -29.15% | 0.58% | 5.89% |
| Class Z | -29.07% | 0.67% | 5.94% |
| $10,000 Over 10 Years |
Let's say hypothetically that $10,000 was invested in Fidelity® Japan Fund, a class of the fund, on October 31, 2012. The chart shows how the value of your investment would have changed, and also shows how the Tokyo Stock Price Index (TOPIX) performed over the same period. |
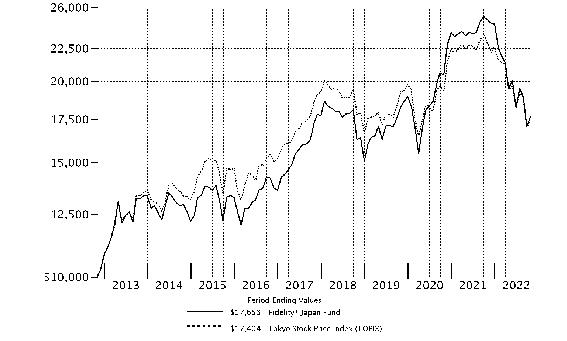 |
Top Holdings (% of Fund's net assets) | ||
| Sony Group Corp. (Household Durables) | 4.0 | |
| Hoya Corp. (Health Care Equipment & Supplies) | 4.0 | |
| Sumitomo Mitsui Financial Group, Inc. (Banks) | 3.9 | |
| Hitachi Ltd. (Industrial Conglomerates) | 3.5 | |
| ORIX Corp. (Diversified Financial Services) | 3.3 | |
| DENSO Corp. (Auto Components) | 3.1 | |
| Daiichi Sankyo Kabushiki Kaisha (Pharmaceuticals) | 2.9 | |
| SoftBank Group Corp. (Wireless Telecommunication Services) | 2.9 | |
| Olympus Corp. (Health Care Equipment & Supplies) | 2.7 | |
| Tokio Marine Holdings, Inc. (Insurance) | 2.7 | |
| 33.0 | ||
| Market Sectors (% of Fund's net assets) | ||
| Industrials | 18.7 | |
| Information Technology | 17.7 | |
| Consumer Discretionary | 15.3 | |
| Health Care | 11.5 | |
| Financials | 10.9 | |
| Communication Services | 7.6 | |
| Materials | 6.3 | |
| Consumer Staples | 5.7 | |
| Energy | 2.5 | |
| Real Estate | 1.8 | |
Asset Allocation (% of Fund's net assets) |
 |
Foreign investments - 97.8% |
Geographic Diversification (% of Fund's net assets) |
 |
* Includes Short-Term investments and Net Other Assets (Liabilities). Percentages are based on country or territory of incorporation and are adjusted for the effect of futures contracts, if applicable. |
| Common Stocks - 98.0% | |||
| Shares | Value ($) | ||
| COMMUNICATION SERVICES - 7.6% | |||
| Diversified Telecommunication Services - 0.6% | |||
| JTOWER, Inc. (a) | 84,200 | 3,425,872 | |
| Entertainment - 2.0% | |||
| Capcom Co. Ltd. | 220,000 | 6,132,688 | |
| Daiichikosho Co. Ltd. | 184,500 | 5,298,194 | |
| 11,430,882 | |||
| Interactive Media & Services - 1.8% | |||
| Hypebeast Ltd. (a) | 16,722,500 | 1,033,220 | |
| Kakaku.com, Inc. | 252,100 | 4,274,146 | |
| Z Holdings Corp. | 1,944,000 | 5,016,997 | |
| 10,324,363 | |||
| Media - 0.3% | |||
| ValueCommerce Co. Ltd. | 116,800 | 1,706,893 | |
| Wireless Telecommunication Services - 2.9% | |||
| SoftBank Group Corp. | 382,500 | 16,419,280 | |
TOTAL COMMUNICATION SERVICES | 43,307,290 | ||
| CONSUMER DISCRETIONARY - 15.3% | |||
| Auto Components - 3.7% | |||
| DENSO Corp. | 352,600 | 17,494,576 | |
| Koito Manufacturing Co. Ltd. | 256,800 | 3,650,931 | |
| 21,145,507 | |||
| Automobiles - 3.0% | |||
| Isuzu Motors Ltd. | 503,400 | 5,904,231 | |
| Suzuki Motor Corp. | 225,900 | 7,626,470 | |
| Toyota Motor Corp. | 274,800 | 3,812,743 | |
| 17,343,444 | |||
| Hotels, Restaurants & Leisure - 0.6% | |||
| Curves Holdings Co. Ltd. | 576,700 | 3,354,824 | |
| Household Durables - 5.1% | |||
| Open House Group Co. Ltd. | 172,000 | 6,130,670 | |
| Sony Group Corp. | 341,000 | 22,995,220 | |
| 29,125,890 | |||
| Internet & Direct Marketing Retail - 1.0% | |||
| ZOZO, Inc. | 271,200 | 5,772,541 | |
| Leisure Products - 0.7% | |||
| Roland Corp. | 147,700 | 4,201,695 | |
| Multiline Retail - 0.8% | |||
| Pan Pacific International Holdings Ltd. | 293,200 | 4,813,216 | |
| Specialty Retail - 0.4% | |||
| Hikari Tsushin, Inc. | 17,900 | 2,163,240 | |
| Textiles, Apparel & Luxury Goods - 0.0% | |||
| Guppy's, Inc. (a) | 1,900 | 19,116 | |
TOTAL CONSUMER DISCRETIONARY | 87,939,473 | ||
| CONSUMER STAPLES - 5.7% | |||
| Food & Staples Retailing - 4.2% | |||
| Nishimoto Co. Ltd. | 137,900 | 3,862,628 | |
| Seven & i Holdings Co. Ltd. | 327,100 | 12,210,111 | |
| Sugi Holdings Co. Ltd. | 50,700 | 2,035,569 | |
| Tsuruha Holdings, Inc. | 49,900 | 2,902,821 | |
| Welcia Holdings Co. Ltd. | 142,300 | 2,976,247 | |
| 23,987,376 | |||
| Food Products - 0.3% | |||
| S Foods, Inc. | 101,300 | 1,856,434 | |
| Personal Products - 1.2% | |||
| Kose Corp. | 30,000 | 3,000,101 | |
| Shiseido Co. Ltd. | 104,200 | 3,612,435 | |
| 6,612,536 | |||
TOTAL CONSUMER STAPLES | 32,456,346 | ||
| ENERGY - 2.5% | |||
| Oil, Gas & Consumable Fuels - 2.5% | |||
| INPEX Corp. | 1,402,500 | 14,154,587 | |
| FINANCIALS - 10.9% | |||
| Banks - 3.9% | |||
| Sumitomo Mitsui Financial Group, Inc. | 784,900 | 22,041,221 | |
| Capital Markets - 0.5% | |||
| SBI Holdings, Inc. Japan | 155,200 | 2,805,593 | |
| Diversified Financial Services - 3.3% | |||
| ORIX Corp. | 1,295,900 | 19,042,614 | |
| Insurance - 3.2% | |||
| Lifenet Insurance Co. (a) | 454,100 | 3,035,579 | |
| Tokio Marine Holdings, Inc. | 844,200 | 15,277,865 | |
| 18,313,444 | |||
TOTAL FINANCIALS | 62,202,872 | ||
| HEALTH CARE - 11.5% | |||
| Biotechnology - 0.2% | |||
| PeptiDream, Inc. (a) | 110,100 | 1,209,142 | |
| Health Care Equipment & Supplies - 6.9% | |||
| Hoya Corp. | 242,400 | 22,618,783 | |
| JEOL Ltd. | 36,900 | 1,354,948 | |
| Olympus Corp. | 736,600 | 15,554,820 | |
| 39,528,551 | |||
| Health Care Technology - 0.1% | |||
| Medlive Technology Co. Ltd. (b) | 637,500 | 550,630 | |
| Pharmaceuticals - 4.3% | |||
| Astellas Pharma, Inc. | 596,300 | 8,227,858 | |
| Daiichi Sankyo Kabushiki Kaisha | 520,100 | 16,648,800 | |
| 24,876,658 | |||
TOTAL HEALTH CARE | 66,164,981 | ||
| INDUSTRIALS - 18.7% | |||
| Aerospace & Defense - 0.2% | |||
| Space Exploration Technologies Corp. Class A (a)(c)(d) | 18,055 | 1,263,850 | |
| Building Products - 1.8% | |||
| Daikin Industries Ltd. | 50,400 | 7,549,274 | |
| Toto Ltd. | 97,800 | 2,795,319 | |
| 10,344,593 | |||
| Electrical Equipment - 1.3% | |||
| Nidec Corp. | 134,900 | 7,417,344 | |
| Industrial Conglomerates - 3.5% | |||
| Hitachi Ltd. | 433,700 | 19,716,951 | |
| Machinery - 3.1% | |||
| Minebea Mitsumi, Inc. | 372,100 | 5,515,373 | |
| Misumi Group, Inc. | 390,960 | 8,361,094 | |
| Nabtesco Corp. | 189,900 | 4,042,056 | |
| 17,918,523 | |||
| Professional Services - 7.5% | |||
| Dip Corp. | 81,700 | 2,291,193 | |
| Funai Soken Holdings, Inc. | 272,000 | 4,852,994 | |
| Outsourcing, Inc. | 424,900 | 3,329,019 | |
| Persol Holdings Co. Ltd. | 735,400 | 14,767,843 | |
| Recruit Holdings Co. Ltd. | 251,200 | 7,729,718 | |
| SMS Co., Ltd. | 241,900 | 5,563,724 | |
| TechnoPro Holdings, Inc. | 193,400 | 4,639,734 | |
| 43,174,225 | |||
| Trading Companies & Distributors - 1.3% | |||
| Itochu Corp. | 280,000 | 7,247,856 | |
TOTAL INDUSTRIALS | 107,083,342 | ||
| INFORMATION TECHNOLOGY - 17.7% | |||
| Electronic Equipment & Components - 2.6% | |||
| Dexerials Corp. | 290,200 | 6,781,970 | |
| Iriso Electronics Co. Ltd. | 106,200 | 3,085,403 | |
| TDK Corp. | 160,200 | 5,015,172 | |
| 14,882,545 | |||
| IT Services - 8.0% | |||
| Digital Hearts Holdings Co. Ltd. | 307,692 | 4,231,683 | |
| DTS Corp. | 156,600 | 3,728,195 | |
| ExaWizards, Inc. (a) | 376,400 | 1,341,619 | |
| Fujitsu Ltd. | 106,000 | 12,196,204 | |
| GMO Internet, Inc. | 270,900 | 4,683,977 | |
| Net One Systems Co. Ltd. | 188,900 | 3,887,380 | |
| Nomura Research Institute Ltd. | 174,500 | 3,878,560 | |
| NSD Co. Ltd. | 300,100 | 5,134,365 | |
| Techmatrix Corp. | 289,600 | 3,299,253 | |
| TIS, Inc. | 119,200 | 3,218,588 | |
| 45,599,824 | |||
| Semiconductors & Semiconductor Equipment - 4.9% | |||
| Furuya Metal Co. Ltd. | 5,200 | 279,418 | |
| Renesas Electronics Corp. (a) | 1,645,500 | 13,765,846 | |
| ROHM Co. Ltd. | 85,000 | 5,985,070 | |
| Socionext, Inc. (a) | 24,900 | 887,521 | |
| Sumco Corp. | 549,700 | 6,983,310 | |
| 27,901,165 | |||
| Software - 0.7% | |||
| Appier Group, Inc. (a) | 76,600 | 736,147 | |
| Money Forward, Inc. (a) | 118,800 | 3,387,552 | |
| 4,123,699 | |||
| Technology Hardware, Storage & Peripherals - 1.5% | |||
| FUJIFILM Holdings Corp. | 195,600 | 8,970,015 | |
TOTAL INFORMATION TECHNOLOGY | 101,477,248 | ||
| MATERIALS - 6.3% | |||
| Chemicals - 6.3% | |||
| JSR Corp. | 319,300 | 6,085,586 | |
| Kansai Paint Co. Ltd. | 389,500 | 5,081,745 | |
| Nippon Sanso Holdings Corp. | 238,000 | 3,796,604 | |
| Nissan Chemical Corp. | 64,500 | 2,906,285 | |
| NOF Corp. | 90,400 | 3,112,734 | |
| Shin-Etsu Chemical Co. Ltd. | 108,500 | 11,276,400 | |
| Tokyo Ohka Kogyo Co. Ltd. | 87,300 | 3,769,232 | |
| 36,028,586 | |||
| REAL ESTATE - 1.8% | |||
| Real Estate Management & Development - 1.8% | |||
| Relo Group, Inc. | 428,400 | 6,055,999 | |
| SRE Holdings Corp. (a)(e) | 161,100 | 4,106,184 | |
| 10,162,183 | |||
| TOTAL COMMON STOCKS (Cost $526,842,665) | 560,976,908 | ||
| Money Market Funds - 0.7% | |||
| Shares | Value ($) | ||
| Fidelity Cash Central Fund 3.10% (f) | 1,141,411 | 1,141,639 | |
| Fidelity Securities Lending Cash Central Fund 3.10% (f)(g) | 2,829,052 | 2,829,335 | |
| TOTAL MONEY MARKET FUNDS (Cost $3,970,974) | 3,970,974 | ||
| TOTAL INVESTMENT IN SECURITIES - 98.7% (Cost $530,813,639) | 564,947,882 |
NET OTHER ASSETS (LIABILITIES) - 1.3% | 7,285,281 |
| NET ASSETS - 100.0% | 572,233,163 |
| (a) | Non-income producing |
| (b) | Security exempt from registration under Rule 144A of the Securities Act of 1933. These securities may be resold in transactions exempt from registration, normally to qualified institutional buyers. At the end of the period, the value of these securities amounted to $550,630 or 0.1% of net assets. |
| (c) | Restricted securities (including private placements) - Investment in securities not registered under the Securities Act of 1933 (excluding 144A issues). At the end of the period, the value of restricted securities (excluding 144A issues) amounted to $1,263,850 or 0.2% of net assets. |
| (d) | Level 3 security |
| (e) | Security or a portion of the security is on loan at period end. |
| (f) | Affiliated fund that is generally available only to investment companies and other accounts managed by Fidelity Investments. The rate quoted is the annualized seven-day yield of the fund at period end. A complete unaudited listing of the fund's holdings as of its most recent quarter end is available upon request. In addition, each Fidelity Central Fund's financial statements, which are not covered by the Fund's Report of Independent Registered Public Accounting Firm, are available on the SEC's website or upon request. |
| (g) | Investment made with cash collateral received from securities on loan. |
| Additional information on each restricted holding is as follows: | ||
| Security | Acquisition Date | Acquisition Cost ($) |
| Space Exploration Technologies Corp. Class A | 2/16/21 - 5/24/22 | 1,151,846 |
| Affiliate | Value, beginning of period ($) | Purchases ($) | Sales Proceeds ($) | Dividend Income ($) | Realized Gain (loss) ($) | Change in Unrealized appreciation (depreciation) ($) | Value, end of period ($) | % ownership, end of period |
| Fidelity Cash Central Fund 3.10% | 864,828 | 33,394,378 | 33,117,567 | 7,003 | - | - | 1,141,639 | 0.0% |
| Fidelity Securities Lending Cash Central Fund 3.10% | 388,125 | 107,609,370 | 105,168,160 | 22,515 | - | - | 2,829,335 | 0.0% |
| Total | 1,252,953 | 141,003,748 | 138,285,727 | 29,518 | - | - | 3,970,974 | |
| Valuation Inputs at Reporting Date: | ||||
| Description | Total ($) | Level 1 ($) | Level 2 ($) | Level 3 ($) |
Investments in Securities: | ||||
| Equities: | ||||
Communication Services | 43,307,290 | 21,871,013 | 21,436,277 | - |
Consumer Discretionary | 87,939,473 | 43,636,934 | 44,302,539 | - |
Consumer Staples | 32,456,346 | 20,246,235 | 12,210,111 | - |
Energy | 14,154,587 | - | 14,154,587 | - |
Financials | 62,202,872 | 40,161,651 | 22,041,221 | - |
Health Care | 66,164,981 | 41,288,323 | 24,876,658 | - |
Industrials | 107,083,342 | 78,483,422 | 27,336,070 | 1,263,850 |
Information Technology | 101,477,248 | 75,515,198 | 25,962,050 | - |
Materials | 36,028,586 | 24,752,186 | 11,276,400 | - |
Real Estate | 10,162,183 | 10,162,183 | - | - |
| Money Market Funds | 3,970,974 | 3,970,974 | - | - |
| Total Investments in Securities: | 564,947,882 | 360,088,119 | 203,595,913 | 1,263,850 |
| Statement of Assets and Liabilities | ||||
| October 31, 2022 | ||||
| Assets | ||||
| Investment in securities, at value (including securities loaned of $2,619,625) - See accompanying schedule: | ||||
Unaffiliated issuers (cost $526,842,665) | $560,976,908 | |||
Fidelity Central Funds (cost $3,970,974) | 3,970,974 | |||
| Total Investment in Securities (cost $530,813,639) | $ | 564,947,882 | ||
| Foreign currency held at value (cost $6,968,256) | 6,934,605 | |||
| Receivable for fund shares sold | 74,654 | |||
| Dividends receivable | 3,760,979 | |||
| Distributions receivable from Fidelity Central Funds | 3,285 | |||
| Prepaid expenses | 950 | |||
Total assets | 575,722,355 | |||
| Liabilities | ||||
| Payable for fund shares redeemed | 100,326 | |||
| Accrued management fee | 422,249 | |||
| Distribution and service plan fees payable | 5,474 | |||
| Other affiliated payables | 66,360 | |||
| Other payables and accrued expenses | 65,448 | |||
| Collateral on securities loaned | 2,829,335 | |||
| Total Liabilities | 3,489,192 | |||
| Net Assets | $ | 572,233,163 | ||
| Net Assets consist of: | ||||
| Paid in capital | $ | 560,519,341 | ||
| Total accumulated earnings (loss) | 11,713,822 | |||
| Net Assets | $ | 572,233,163 | ||
| Net Asset Value and Maximum Offering Price | ||||
| Class A : | ||||
Net Asset Value and redemption price per share ($13,003,583 ÷ 980,444 shares) (a) | $ | 13.26 | ||
| Maximum offering price per share (100/94.25 of $13.26) | $ | 14.07 | ||
| Class M : | ||||
Net Asset Value and redemption price per share ($2,282,041 ÷ 173,064 shares) (a) | $ | 13.19 | ||
| Maximum offering price per share (100/96.50 of $13.19) | $ | 13.67 | ||
| Class C : | ||||
Net Asset Value and offering price per share ($2,178,938 ÷ 167,615 shares) (a) | $ | 13.00 | ||
| Japan : | ||||
Net Asset Value , offering price and redemption price per share ($113,014,841 ÷ 8,466,751 shares) | $ | 13.35 | ||
| Class I : | ||||
Net Asset Value , offering price and redemption price per share ($33,319,525 ÷ 2,476,460 shares) | $ | 13.45 | ||
| Class Z : | ||||
Net Asset Value , offering price and redemption price per share ($408,434,235 ÷ 30,684,669 shares) | $ | 13.31 | ||
(a)Redemption price per share is equal to net asset value less any applicable contingent deferred sales charge. | ||||
| Statement of Operations | ||||
Year ended October 31, 2022 | ||||
| Investment Income | ||||
| Dividends | $ | 12,556,636 | ||
| Income from Fidelity Central Funds (including $22,515 from security lending) | 29,518 | |||
| Income before foreign taxes withheld | 12,586,154 | |||
| Less foreign taxes withheld | (1,331,805) | |||
| Total Income | 11,254,349 | |||
| Expenses | ||||
| Management fee | ||||
| Basic fee | $ | 4,619,939 | ||
| Performance adjustment | 1,164,884 | |||
| Transfer agent fees | 591,310 | |||
| Distribution and service plan fees | 86,859 | |||
| Accounting fees | 330,234 | |||
| Custodian fees and expenses | 26,699 | |||
| Independent trustees' fees and expenses | 2,394 | |||
| Registration fees | 89,309 | |||
| Audit | 62,712 | |||
| Legal | 692 | |||
| Miscellaneous | 3,372 | |||
| Total expenses before reductions | 6,978,404 | |||
| Expense reductions | (22,453) | |||
| Total expenses after reductions | 6,955,951 | |||
| Net Investment income (loss) | 4,298,398 | |||
| Realized and Unrealized Gain (Loss) | ||||
| Net realized gain (loss) on: | ||||
| Investment Securities: | ||||
| Unaffiliated issuers | (10,277,152) | |||
| Foreign currency transactions | (998,178) | |||
| Total net realized gain (loss) | (11,275,330) | |||
| Change in net unrealized appreciation (depreciation) on: | �� | |||
| Investment Securities: | ||||
| Unaffiliated issuers | (232,678,405) | |||
| Assets and liabilities in foreign currencies | (43,412) | |||
| Total change in net unrealized appreciation (depreciation) | (232,721,817) | |||
| Net gain (loss) | (243,997,147) | |||
| Net increase (decrease) in net assets resulting from operations | $ | (239,698,749) | ||
| Statement of Changes in Net Assets | ||||
Year ended October 31, 2022 | Year ended October 31, 2021 | |||
| Increase (Decrease) in Net Assets | ||||
| Operations | ||||
| Net investment income (loss) | $ | 4,298,398 | $ | 3,430,610 |
| Net realized gain (loss) | (11,275,330) | 71,989,055 | ||
| Change in net unrealized appreciation (depreciation) | (232,721,817) | 93,205,875 | ||
| Net increase (decrease) in net assets resulting from operations | (239,698,749) | 168,625,540 | ||
| Distributions to shareholders | (85,697,627) | (16,940,687) | ||
| Share transactions - net increase (decrease) | 66,247,709 | (103,038,998) | ||
| Total increase (decrease) in net assets | (259,148,667) | 48,645,855 | ||
| Net Assets | ||||
| Beginning of period | 831,381,830 | 782,735,975 | ||
| End of period | $ | 572,233,163 | $ | 831,381,830 |
| Fidelity Advisor® Japan Fund Class A |
| Years ended October 31, | 2022 | 2021 | 2020 | 2019 | 2018 | |||||
Selected Per-Share Data | ||||||||||
| Net asset value, beginning of period | $ | 20.90 | $ | 17.50 | $ | 15.80 | $ | 14.15 | $ | 15.08 |
| Income from Investment Operations | ||||||||||
Net investment income (loss) A,B | .04 | .02 | .05 | .07 | .03 | |||||
| Net realized and unrealized gain (loss) | (5.58) | 3.71 | 1.81 | 1.58 | (.85) | |||||
| Total from investment operations | (5.54) | 3.73 | 1.86 | 1.65 | (.82) | |||||
| Distributions from net investment income | (.55) | (.07) | (.07) | - | (.08) | |||||
| Distributions from net realized gain | (1.55) | (.25) | (.09) | - | (.04) | |||||
| Total distributions | (2.10) | (.33) C | (.16) | - | (.11) C | |||||
Redemption fees added to paid in capital A | - | - | - | - | - D | |||||
| Net asset value, end of period | $ | 13.26 | $ | 20.90 | $ | 17.50 | $ | 15.80 | $ | 14.15 |
Total Return E,F | (29.38)% | 21.42% | 11.85% | 11.66% | (5.48)% | |||||
Ratios to Average Net Assets B,G,H | ||||||||||
| Expenses before reductions | 1.39% | 1.38% | 1.37% | 1.33% | 1.33% | |||||
| Expenses net of fee waivers, if any | 1.39% | 1.38% | 1.37% | 1.32% | 1.33% | |||||
| Expenses net of all reductions | 1.39% | 1.38% | 1.37% | 1.32% | 1.32% | |||||
| Net investment income (loss) | .26% | .08% | .35% | .51% | .17% | |||||
| Supplemental Data | ||||||||||
| Net assets, end of period (000 omitted) | $ | 13,004 | $ | 20,357 | $ | 16,181 | $ | 16,069 | $ | 14,587 |
Portfolio turnover rate I | 26% | 31% | 22% | 27% | 40% |
| Fidelity Advisor® Japan Fund Class M |
| Years ended October 31, | 2022 | 2021 | 2020 | 2019 | 2018 | |||||
Selected Per-Share Data | ||||||||||
| Net asset value, beginning of period | $ | 20.76 | $ | 17.40 | $ | 15.71 | $ | 14.11 | $ | 15.06 |
| Income from Investment Operations | ||||||||||
Net investment income (loss) A,B | (.01) | (.05) | .01 | .03 | (.03) | |||||
| Net realized and unrealized gain (loss) | (5.55) | 3.69 | 1.80 | 1.57 | (.84) | |||||
| Total from investment operations | (5.56) | 3.64 | 1.81 | 1.60 | (.87) | |||||
| Distributions from net investment income | (.46) | (.02) | (.03) | - | (.05) | |||||
| Distributions from net realized gain | (1.55) | (.25) | (.09) | - | (.04) | |||||
| Total distributions | (2.01) | (.28) C | (.12) | - | (.08) C | |||||
Redemption fees added to paid in capital A | - | - | - | - | - D | |||||
| Net asset value, end of period | $ | 13.19 | $ | 20.76 | $ | 17.40 | $ | 15.71 | $ | 14.11 |
Total Return E,F | (29.55)% | 21.00% | 11.55% | 11.34% | (5.81)% | |||||
Ratios to Average Net Assets B,G,H | ||||||||||
| Expenses before reductions | 1.69% | 1.70% | 1.67% | 1.64% | 1.67% | |||||
| Expenses net of fee waivers, if any | 1.69% | 1.70% | 1.67% | 1.64% | 1.67% | |||||
| Expenses net of all reductions | 1.69% | 1.70% | 1.67% | 1.63% | 1.66% | |||||
| Net investment income (loss) | (.04)% | (.23)% | .04% | .19% | (.17)% | |||||
| Supplemental Data | ||||||||||
| Net assets, end of period (000 omitted) | $ | 2,282 | $ | 3,919 | $ | 3,728 | $ | 3,945 | $ | 3,993 |
Portfolio turnover rate I | 26% | 31% | 22% | 27% | 40% |
| Fidelity Advisor® Japan Fund Class C |
| Years ended October 31, | 2022 | 2021 | 2020 | 2019 | 2018 | |||||
Selected Per-Share Data | ||||||||||
| Net asset value, beginning of period | $ | 20.43 | $ | 17.17 | $ | 15.49 | $ | 13.97 | $ | 14.92 |
| Income from Investment Operations | ||||||||||
Net investment income (loss) A,B | (.07) | (.12) | (.05) | (.02) | (.08) | |||||
| Net realized and unrealized gain (loss) | (5.49) | 3.63 | 1.77 | 1.54 | (.83) | |||||
| Total from investment operations | (5.56) | 3.51 | 1.72 | 1.52 | (.91) | |||||
| Distributions from net investment income | (.33) | (.01) | - | - | - C | |||||
| Distributions from net realized gain | (1.55) | (.25) | (.04) | - | (.04) | |||||
| Total distributions | (1.87) D | (.25) D | (.04) | - | (.04) | |||||
Redemption fees added to paid in capital A | - | - | - | - | - C | |||||
| Net asset value, end of period | $ | 13.00 | $ | 20.43 | $ | 17.17 | $ | 15.49 | $ | 13.97 |
Total Return E,F | (29.85)% | 20.54% | 11.09% | 10.88% | (6.13)% | |||||
Ratios to Average Net Assets B,G,H | ||||||||||
| Expenses before reductions | 2.11% | 2.09% | 2.06% | 2.01% | 2.04% | |||||
| Expenses net of fee waivers, if any | 2.10% | 2.09% | 2.05% | 2.00% | 2.03% | |||||
| Expenses net of all reductions | 2.10% | 2.09% | 2.05% | 2.00% | 2.03% | |||||
| Net investment income (loss) | (.46)% | (.63)% | (.34)% | (.17)% | (.53)% | |||||
| Supplemental Data | ||||||||||
| Net assets, end of period (000 omitted) | $ | 2,179 | $ | 4,778 | $ | 6,167 | $ | 8,829 | $ | 12,586 |
Portfolio turnover rate I | 26% | 31% | 22% | 27% | 40% |
| Fidelity® Japan Fund |
| Years ended October 31, | 2022 | 2021 | 2020 | 2019 | 2018 | |||||
Selected Per-Share Data | ||||||||||
| Net asset value, beginning of period | $ | 21.01 | $ | 17.58 | $ | 15.86 | $ | 14.20 | $ | 15.13 |
| Income from Investment Operations | ||||||||||
Net investment income (loss) A,B | .08 | .08 | .10 | .12 | .07 | |||||
| Net realized and unrealized gain (loss) | (5.60) | 3.72 | 1.81 | 1.59 | (.86) | |||||
| Total from investment operations | (5.52) | 3.80 | 1.91 | 1.71 | (.79) | |||||
| Distributions from net investment income | (.59) | (.11) | (.11) | (.05) | (.11) | |||||
| Distributions from net realized gain | (1.55) | (.25) | (.09) | - | (.04) | |||||
| Total distributions | (2.14) | (.37) C | (.19) C | (.05) | (.14) C | |||||
Redemption fees added to paid in capital A | - | - | - | - | - D | |||||
| Net asset value, end of period | $ | 13.35 | $ | 21.01 | $ | 17.58 | $ | 15.86 | $ | 14.20 |
Total Return E | (29.16)% | 21.75% | 12.16% | 12.10% | (5.28)% | |||||
Ratios to Average Net Assets B,F,G | ||||||||||
| Expenses before reductions | 1.13% | 1.09% | 1.06% | 1.01% | 1.05% | |||||
| Expenses net of fee waivers, if any | 1.12% | 1.09% | 1.06% | 1.01% | 1.05% | |||||
| Expenses net of all reductions | 1.12% | 1.09% | 1.06% | 1.00% | 1.04% | |||||
| Net investment income (loss) | .52% | .37% | .65% | .82% | .45% | |||||
| Supplemental Data | ||||||||||
| Net assets, end of period (000 omitted) | $ | 113,015 | $ | 167,954 | $ | 274,433 | $ | 401,344 | $ | 297,644 |
Portfolio turnover rate H | 26% | 31% | 22% | 27% | 40% |
| Fidelity Advisor® Japan Fund Class I |
| Years ended October 31, | 2022 | 2021 | 2020 | 2019 | 2018 | |||||
Selected Per-Share Data | ||||||||||
| Net asset value, beginning of period | $ | 20.97 | $ | 17.56 | $ | 15.85 | $ | 14.18 | $ | 15.12 |
| Income from Investment Operations | ||||||||||
Net investment income (loss) A,B | .09 | .09 | .11 | .13 | .08 | |||||
| Net realized and unrealized gain (loss) | (5.65) | 3.71 | 1.81 | 1.58 | (.85) | |||||
| Total from investment operations | (5.56) | 3.80 | 1.92 | 1.71 | (.77) | |||||
| Distributions from net investment income | (.41) | (.14) | (.12) | (.04) | (.14) | |||||
| Distributions from net realized gain | (1.55) | (.25) | (.09) | - | (.04) | |||||
| Total distributions | (1.96) | (.39) | (.21) | (.04) | (.17) C | |||||
Redemption fees added to paid in capital A | - | - | - | - | - D | |||||
| Net asset value, end of period | $ | 13.45 | $ | 20.97 | $ | 17.56 | $ | 15.85 | $ | 14.18 |
Total Return E | (29.15)% | 21.80% | 12.20% | 12.12% | (5.18)% | |||||
Ratios to Average Net Assets B,F,G | ||||||||||
| Expenses before reductions | 1.09% | 1.04% | 1.01% | .96% | .98% | |||||
| Expenses net of fee waivers, if any | 1.09% | 1.04% | 1.01% | .96% | .98% | |||||
| Expenses net of all reductions | 1.09% | 1.04% | 1.00% | .95% | .97% | |||||
| Net investment income (loss) | .56% | .43% | .71% | .87% | .52% | |||||
| Supplemental Data | ||||||||||
| Net assets, end of period (000 omitted) | $ | 33,320 | $ | 48,887 | $ | 473,859 | $ | 319,164 | $ | 192,555 |
Portfolio turnover rate H | 26% | 31% | 22% | 27% | 40% |
| Fidelity Advisor® Japan Fund Class Z |
| Years ended October 31, | 2022 | 2021 | 2020 | 2019 | 2018 A | |||||
Selected Per-Share Data | ||||||||||
| Net asset value, beginning of period | $ | 20.98 | $ | 17.56 | $ | 15.84 | $ | 14.19 | $ | 15.77 |
| Income from Investment Operations | ||||||||||
Net investment income (loss) B,C | .11 | .10 | .13 | .14 | (.01) | |||||
| Net realized and unrealized gain (loss) | (5.59) | 3.72 | 1.81 | 1.57 | (1.57) | |||||
| Total from investment operations | (5.48) | 3.82 | 1.94 | 1.71 | (1.58) | |||||
| Distributions from net investment income | (.64) | (.15) | (.13) | (.06) | - | |||||
| Distributions from net realized gain | (1.55) | (.25) | (.09) | - | - | |||||
| Total distributions | (2.19) | (.40) | (.22) | (.06) | - | |||||
| Net asset value, end of period | $ | 13.31 | $ | 20.98 | $ | 17.56 | $ | 15.84 | $ | 14.19 |
Total Return D,E | (29.07)% | 21.93% | 12.36% | 12.14% | (10.02)% | |||||
Ratios to Average Net Assets C,F,G | ||||||||||
| Expenses before reductions | .96% | .96% | .92% | .87% | .96% H | |||||
| Expenses net of fee waivers, if any | .96% | .96% | .92% | .87% | .96% H | |||||
| Expenses net of all reductions | .96% | .96% | .92% | .86% | .95% H | |||||
| Net investment income (loss) | .69% | .51% | .79% | .96% | (.73)% H | |||||
| Supplemental Data | ||||||||||
| Net assets, end of period (000 omitted) | $ | 408,434 | $ | 585,487 | $ | 8,368 | $ | 8,136 | $ | 90 |
Portfolio turnover rate I | 26% | 31% | 22% | 27% | 40% |
| Fidelity Central Fund | Investment Manager | Investment Objective | Investment Practices | Expense Ratio A |
| Fidelity Money Market Central Funds | Fidelity Management & Research Company LLC (FMR) | Each fund seeks to obtain a high level of current income consistent with the preservation of capital and liquidity. | Short-term Investments | Less than .005% |
| Gross unrealized appreciation | $98,033,316 |
| Gross unrealized depreciation | (69,038,778) |
| Net unrealized appreciation (depreciation) | $28,994,538 |
| Tax Cost | $535,953,344 |
| Capital loss carryforward | $(10,880,483) |
| Net unrealized appreciation (depreciation) on securities and other investments | $28,844,090 |
Short-term | $(10,880,483) |
Long-term | - |
| Total capital loss carryforward | $(10,880,483) |
| October 31, 2022 | October 31, 2021 | |
| Ordinary Income | $36,508,917 | $5,942,098 |
| Long-term Capital Gains | 49,188,710 | 10,998,589 |
| Total | $85,697,627 | $16,940,687 |
| Purchases ($) | Sales ($) | |
| Fidelity Japan Fund | 174,720,377 | 193,143,561 |
| Distribution Fee | Service Fee | Total Fees | Retained by FDC | |
| Class A | - % | .25% | $39,575 | $- |
| Class M | .25% | .25% | 14,804 | 29 |
| Class C | .75% | .25% | 32,480 | 1,926 |
| $86,859 | $1,955 |
| Retained by FDC | |
| Class A | $2,380 |
| Class M | 277 |
Class C A | 298 |
| $2,955 |
| Amount | % of Class-Level Average Net Assets | |
| Class A | $34,351 | .22 |
| Class M | 8,038 | .27 |
| Class C | 5,934 | .18 |
| Japan | 282,439 | .21 |
| Class I | 63,010 | .17 |
| Class Z | 197,538 | .04 |
| $591,310 |
| % of Average Net Assets | |
| Fidelity Japan Fund | .05 |
| Purchases ($) | Sales ($) | Realized Gain (Loss) ($) | |
| Fidelity Japan Fund | 1,484,433 | 1,862,646 | 633,704 |
| Amount | |
| Fidelity Japan Fund | $1,212 |
| Total Security Lending Fees Paid to NFS | Security Lending Income From Securities Loaned to NFS | Value of Securities Loaned to NFS at Period End | |
| Fidelity Japan Fund | $2,354 | $- | $- |
Year ended October 31, 2022 | Year ended October 31, 2021 | |
| Fidelity Japan Fund | ||
| Class A | $2,019,337 | $301,297 |
| Class M | 368,577 | 59,666 |
| Class C | 426,706 | 88,885 |
| Japan | 17,143,088 | 5,699,772 |
| Class I | 4,520,940 | 10,435,841 |
| Class Z | 61,218,979 | 355,226 |
Total | $85,697,627 | $16,940,687 |
| Shares | Shares | Dollars | Dollars | |
| Year ended October 31, 2022 | Year ended October 31, 2021 | Year ended October 31, 2022 | Year ended October 31, 2021 | |
| Fidelity Japan Fund | ||||
| Class A | ||||
| Shares sold | 117,484 | 153,664 | $1,791,821 | $3,103,256 |
| Reinvestment of distributions | 100,623 | 14,280 | 1,865,544 | 278,154 |
| Shares redeemed | (211,780) | (118,485) | (3,414,360) | (2,389,970) |
| Net increase (decrease) | 6,327 | 49,459 | $243,005 | $991,440 |
| Class M | ||||
| Shares sold | 13,826 | 10,618 | $202,895 | $211,739 |
| Reinvestment of distributions | 19,910 | 3,057 | 368,140 | 59,335 |
| Shares redeemed | (49,434) | (39,212) | (787,625) | (790,428) |
| Net increase (decrease) | (15,698) | (25,537) | $(216,590) | $(519,354) |
| Class C | ||||
| Shares sold | 8,561 | 24,156 | $138,296 | $477,051 |
| Reinvestment of distributions | 23,330 | 4,602 | 426,706 | 88,168 |
| Shares redeemed | (98,132) | (154,075) | (1,544,500) | (3,034,739) |
| Net increase (decrease) | (66,241) | (125,317) | $(979,498) | $(2,469,520) |
| Japan | ||||
| Shares sold | 1,808,139 | 2,408,580 | $29,931,437 | $49,198,476 |
| Reinvestment of distributions | 867,250 | 283,747 | 16,148,203 | 5,534,758 |
| Shares redeemed | (2,201,846) | (10,310,246) | (35,408,192) | (210,756,266) |
| Net increase (decrease) | 473,543 | (7,617,919) | $10,671,448 | $(156,023,032) |
| Class I | ||||
| Shares sold | 694,437 | 2,369,303 | $11,578,345 | $47,361,499 |
| Reinvestment of distributions | 176,445 | 525,949 | 3,310,112 | 10,230,732 |
| Shares redeemed | (725,162) | (27,546,527) | (12,524,199) | (558,674,882) |
| Net increase (decrease) | 145,720 | (24,651,275) | $2,364,258 | $(501,082,651) |
| Class Z | ||||
| Shares sold | 833,537 | 27,576,717 | $13,605,712 | $558,908,335 |
| Reinvestment of distributions | 3,263,046 | 17,033 | 60,496,866 | 348,274 |
| Shares redeemed | (1,323,692) | (158,582) | (19,937,492) | (3,192,490) |
| Net increase (decrease) | 2,772,891 | 27,435,168 | $54,165,086 | $556,064,119 |
| Strategic Advisers Fidelity International Fund | |
| Fidelity Japan Fund | 60% |
| Fund | % of shares held |
| Fidelity Japan Fund | 70% |
| Average Annual Total Returns | |||
Periods ended October 31, 2022 | Past 1 year | Past 5 years | Past 10 years |
| Fidelity® Japan Smaller Companies Fund | -21.95% | -2.25% | 7.47% |
| $10,000 Over 10 Years |
Let's say hypothetically that $10,000 was invested in Fidelity® Japan Smaller Companies Fund on October 31, 2012. The chart shows how the value of your investment would have changed, and also shows how the Russell/Nomura Mid-Small Cap™ Index performed over the same period. |
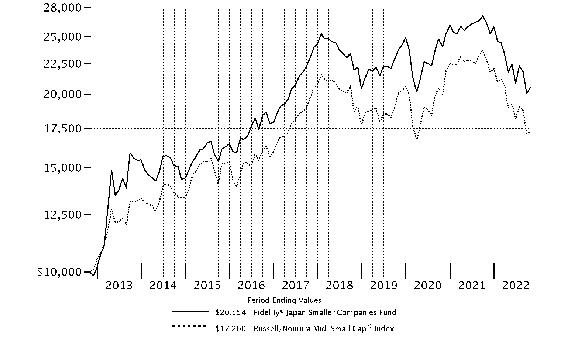 |
Top Holdings (% of Fund's net assets) | ||
| Tokio Marine Holdings, Inc. (Insurance) | 2.7 | |
| ORIX Corp. (Diversified Financial Services) | 2.3 | |
| Renesas Electronics Corp. (Semiconductors & Semiconductor Equipment) | 2.2 | |
| INPEX Corp. (Oil, Gas & Consumable Fuels) | 2.2 | |
| Amano Corp. (Electronic Equipment & Components) | 2.1 | |
| Nippon Concept Corp. (Marine) | 2.0 | |
| Isuzu Motors Ltd. (Automobiles) | 2.0 | |
| Persol Holdings Co. Ltd. (Professional Services) | 2.0 | |
| Funai Soken Holdings, Inc. (Professional Services) | 1.9 | |
| C. Uyemura & Co. Ltd. (Chemicals) | 1.8 | |
| 21.2 | ||
| Market Sectors (% of Fund's net assets) | ||
| Industrials | 22.8 | |
| Information Technology | 21.5 | |
| Consumer Discretionary | 17.1 | |
| Financials | 8.7 | |
| Materials | 7.1 | |
| Consumer Staples | 3.9 | |
| Communication Services | 3.4 | |
| Health Care | 2.9 | |
| Utilities | 2.4 | |
| Energy | 2.2 | |
| Real Estate | 1.8 | |
Asset Allocation (% of Fund's net assets) |
 |
Foreign investments - 93.8% |
Geographic Diversification (% of Fund's net assets) |
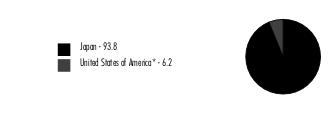 |
* Includes Short-Term investments and Net Other Assets (Liabilities). Percentages are based on country or territory of incorporation and are adjusted for the effect of futures contracts, if applicable. |
| Common Stocks - 93.8% | |||
| Shares | Value ($) | ||
| COMMUNICATION SERVICES - 3.4% | |||
| Entertainment - 2.6% | |||
| Capcom Co. Ltd. | 197,600 | 5,508,269 | |
| Daiichikosho Co. Ltd. | 135,600 | 3,893,957 | |
| 9,402,226 | |||
| Interactive Media & Services - 0.8% | |||
| Kakaku.com, Inc. | 171,600 | 2,909,335 | |
TOTAL COMMUNICATION SERVICES | 12,311,561 | ||
| CONSUMER DISCRETIONARY - 17.1% | |||
| Auto Components - 2.8% | |||
| DENSO Corp. | 119,100 | 5,909,257 | |
| Shoei Co. Ltd. | 114,200 | 4,216,403 | |
| 10,125,660 | |||
| Automobiles - 3.6% | |||
| Isuzu Motors Ltd. | 608,700 | 7,139,264 | |
| Suzuki Motor Corp. | 181,200 | 6,117,381 | |
| 13,256,645 | |||
| Distributors - 1.5% | |||
| Central Automotive Products Ltd. | 355,300 | 5,361,937 | |
| Hotels, Restaurants & Leisure - 1.9% | |||
| Curves Holdings Co. Ltd. | 529,100 | 3,077,921 | |
| Koshidaka Holdings Co. Ltd. | 525,200 | 3,948,846 | |
| 7,026,767 | |||
| Household Durables - 1.1% | |||
| Open House Group Co. Ltd. | 114,200 | 4,070,480 | |
| Leisure Products - 1.0% | |||
| Roland Corp. | 123,100 | 3,501,886 | |
| Multiline Retail - 1.1% | |||
| Pan Pacific International Holdings Ltd. | 257,700 | 4,230,443 | |
| Specialty Retail - 4.1% | |||
| ABC-MART, Inc. | 73,000 | 3,254,918 | |
| Arcland Sakamoto Co. Ltd. | 393,600 | 3,904,368 | |
| Fuji Corp. | 663,800 | 5,665,034 | |
| Workman Co. Ltd. (a) | 59,500 | 2,036,753 | |
| 14,861,073 | |||
TOTAL CONSUMER DISCRETIONARY | 62,434,891 | ||
| CONSUMER STAPLES - 3.9% | |||
| Beverages - 1.1% | |||
| Asahi Group Holdings | 139,700 | 3,912,107 | |
| Food Products - 2.1% | |||
| Kotobuki Spirits Co. Ltd. | 112,300 | 5,762,460 | |
| S Foods, Inc. | 105,000 | 1,924,241 | |
| 7,686,701 | |||
| Personal Products - 0.7% | |||
| Shiseido Co. Ltd. | 70,800 | 2,454,514 | |
TOTAL CONSUMER STAPLES | 14,053,322 | ||
| ENERGY - 2.2% | |||
| Oil, Gas & Consumable Fuels - 2.2% | |||
| INPEX Corp. | 785,900 | 7,931,615 | |
| FINANCIALS - 8.7% | |||
| Banks - 1.9% | |||
| Bank of Kyoto Ltd. | 103,800 | 3,741,673 | |
| Mitsubishi UFJ Financial Group, Inc. | 686,400 | 3,242,451 | |
| 6,984,124 | |||
| Diversified Financial Services - 2.3% | |||
| ORIX Corp. | 575,600 | 8,458,159 | |
| Insurance - 4.5% | |||
| Lifenet Insurance Co. (b) | 322,000 | 2,152,514 | |
| T&D Holdings, Inc. | 453,000 | 4,469,222 | |
| Tokio Marine Holdings, Inc. | 530,700 | 9,604,312 | |
| 16,226,048 | |||
TOTAL FINANCIALS | 31,668,331 | ||
| HEALTH CARE - 2.9% | |||
| Health Care Equipment & Supplies - 1.8% | |||
| Eiken Chemical Co. Ltd. | 232,000 | 2,867,723 | |
| JEOL Ltd. | 100,300 | 3,682,962 | |
| 6,550,685 | |||
| Health Care Providers & Services - 1.1% | |||
| As One Corp. | 93,700 | 4,007,747 | |
TOTAL HEALTH CARE | 10,558,432 | ||
| INDUSTRIALS - 22.8% | |||
| Air Freight & Logistics - 1.6% | |||
| AIT Corp. | 322,436 | 3,267,837 | |
| SG Holdings Co. Ltd. | 204,500 | 2,712,089 | |
| 5,979,926 | |||
| Commercial Services & Supplies - 0.7% | |||
| Park24 Co. Ltd. (b) | 180,300 | 2,406,910 | |
| Construction & Engineering - 0.7% | |||
| Raito Kogyo Co. Ltd. | 197,500 | 2,694,963 | |
| Machinery - 3.8% | |||
| CKD Corp. | 231,400 | 2,843,188 | |
| Minebea Mitsumi, Inc. | 331,300 | 4,910,624 | |
| Misumi Group, Inc. | 183,241 | 3,918,803 | |
| Nitto Kohki Co. Ltd. | 204,400 | 2,170,534 | |
| 13,843,149 | |||
| Marine - 2.0% | |||
| Nippon Concept Corp. | 623,500 | 7,266,724 | |
| Professional Services - 6.7% | |||
| Dip Corp. | 186,700 | 5,235,812 | |
| Funai Soken Holdings, Inc. | 384,380 | 6,858,066 | |
| Persol Holdings Co. Ltd. | 354,500 | 7,118,847 | |
| TechnoPro Holdings, Inc. | 216,700 | 5,198,710 | |
| 24,411,435 | |||
| Trading Companies & Distributors - 5.8% | |||
| Hanwa Co. Ltd. | 159,950 | 3,872,491 | |
| Inaba Denki Sangyo Co. Ltd. | 322,300 | 6,021,382 | |
| Itochu Corp. | 167,800 | 4,343,537 | |
| Mitani Shoji Co. Ltd. | 309,000 | 3,079,714 | |
| Yuasa Trading Co. Ltd. | 155,500 | 3,874,559 | |
| 21,191,683 | |||
| Transportation Infrastructure - 1.5% | |||
| Kamigumi Co. Ltd. | 276,100 | 5,251,090 | |
TOTAL INDUSTRIALS | 83,045,880 | ||
| INFORMATION TECHNOLOGY - 21.5% | |||
| Electronic Equipment & Components - 6.2% | |||
| Amano Corp. | 447,900 | 7,672,089 | |
| Azbil Corp. | 148,000 | 4,026,094 | |
| Dexerials Corp. | 204,400 | 4,776,825 | |
| Kohoku Kogyo Co. Ltd. (a) | 40,300 | 2,127,543 | |
| Maruwa Ceramic Co. Ltd. | 35,000 | 4,121,524 | |
| 22,724,075 | |||
| IT Services - 9.3% | |||
| Argo Graphics, Inc. | 216,400 | 5,639,396 | |
| GMO Internet, Inc. | 233,000 | 4,028,669 | |
| Net One Systems Co. Ltd. | 286,100 | 5,887,663 | |
| Nomura Research Institute Ltd. | 143,700 | 3,193,978 | |
| NSD Co. Ltd. | 266,900 | 4,566,351 | |
| TIS, Inc. | 211,500 | 5,710,834 | |
| TKC Corp. | 193,000 | 4,932,244 | |
| 33,959,135 | |||
| Semiconductors & Semiconductor Equipment - 3.3% | |||
| Renesas Electronics Corp. (b) | 954,600 | 7,985,947 | |
| Sumco Corp. | 326,657 | 4,149,804 | |
| 12,135,751 | |||
| Software - 1.7% | |||
| Money Forward, Inc. (b) | 210,800 | 6,010,908 | |
| Technology Hardware, Storage & Peripherals - 1.0% | |||
| FUJIFILM Holdings Corp. | 75,100 | 3,444,009 | |
TOTAL INFORMATION TECHNOLOGY | 78,273,878 | ||
| MATERIALS - 7.1% | |||
| Chemicals - 3.5% | |||
| C. Uyemura & Co. Ltd. | 140,300 | 6,434,957 | |
| Fujimi, Inc. | 55,500 | 2,321,598 | |
| MEC Co. Ltd. | 115,600 | 1,854,171 | |
| Tokyo Ohka Kogyo Co. Ltd. | 50,400 | 2,176,052 | |
| 12,786,778 | |||
| Construction Materials - 0.8% | |||
| Maeda Kosen Co. Ltd. | 146,700 | 2,984,414 | |
| Metals & Mining - 2.8% | |||
| Dowa Holdings Co. Ltd. | 166,000 | 5,286,055 | |
| Yamato Kogyo Co. Ltd. | 168,100 | 4,883,769 | |
| 10,169,824 | |||
TOTAL MATERIALS | 25,941,016 | ||
| REAL ESTATE - 1.8% | |||
| Equity Real Estate Investment Trusts (REITs) - 0.6% | |||
| Invincible Investment Corp. | 7,000 | 2,198,460 | |
| Real Estate Management & Development - 1.2% | |||
| Relo Group, Inc. | 315,500 | 4,460,009 | |
TOTAL REAL ESTATE | 6,658,469 | ||
| UTILITIES - 2.4% | |||
| Electric Utilities - 1.1% | |||
| Kansai Electric Power Co., Inc. | 539,500 | 4,089,018 | |
| Gas Utilities - 1.3% | |||
| Nippon Gas Co. Ltd. | 331,700 | 4,820,631 | |
TOTAL UTILITIES | 8,909,649 | ||
| TOTAL COMMON STOCKS (Cost $315,433,558) | 341,787,044 | ||
| Money Market Funds - 4.5% | |||
| Shares | Value ($) | ||
| Fidelity Cash Central Fund 3.10% (c) | 14,221,361 | 14,224,205 | |
| Fidelity Securities Lending Cash Central Fund 3.10% (c)(d) | 2,324,768 | 2,325,000 | |
| TOTAL MONEY MARKET FUNDS (Cost $16,549,205) | 16,549,205 | ||
| TOTAL INVESTMENT IN SECURITIES - 98.3% (Cost $331,982,763) | 358,336,249 |
NET OTHER ASSETS (LIABILITIES) - 1.7% | 6,088,379 |
| NET ASSETS - 100.0% | 364,424,628 |
| (a) | Security or a portion of the security is on loan at period end. |
| (b) | Non-income producing |
| (c) | Affiliated fund that is generally available only to investment companies and other accounts managed by Fidelity Investments. The rate quoted is the annualized seven-day yield of the fund at period end. A complete unaudited listing of the fund's holdings as of its most recent quarter end is available upon request. In addition, each Fidelity Central Fund's financial statements, which are not covered by the Fund's Report of Independent Registered Public Accounting Firm, are available on the SEC's website or upon request. |
| (d) | Investment made with cash collateral received from securities on loan. |
| Affiliate | Value, beginning of period ($) | Purchases ($) | Sales Proceeds ($) | Dividend Income ($) | Realized Gain (loss) ($) | Change in Unrealized appreciation (depreciation) ($) | Value, end of period ($) | % ownership, end of period |
| Fidelity Cash Central Fund 3.10% | 8,479,088 | 94,236,168 | 88,491,051 | 188,177 | - | - | 14,224,205 | 0.0% |
| Fidelity Securities Lending Cash Central Fund 3.10% | - | 88,079,965 | 85,754,965 | 38,923 | - | - | 2,325,000 | 0.0% |
| Total | 8,479,088 | 182,316,133 | 174,246,016 | 227,100 | - | - | 16,549,205 | |
| Valuation Inputs at Reporting Date: | ||||
| Description | Total ($) | Level 1 ($) | Level 2 ($) | Level 3 ($) |
Investments in Securities: | ||||
| Equities: | ||||
Communication Services | 12,311,561 | 12,311,561 | - | - |
Consumer Discretionary | 62,434,891 | 56,525,634 | 5,909,257 | - |
Consumer Staples | 14,053,322 | 14,053,322 | - | - |
Energy | 7,931,615 | - | 7,931,615 | - |
Financials | 31,668,331 | 28,425,880 | 3,242,451 | - |
Health Care | 10,558,432 | 10,558,432 | - | - |
Industrials | 83,045,880 | 77,847,170 | 5,198,710 | - |
Information Technology | 78,273,878 | 70,287,931 | 7,985,947 | - |
Materials | 25,941,016 | 25,941,016 | - | - |
Real Estate | 6,658,469 | 6,658,469 | - | - |
Utilities | 8,909,649 | 8,909,649 | - | - |
| Money Market Funds | 16,549,205 | 16,549,205 | - | - |
| Total Investments in Securities: | 358,336,249 | 328,068,269 | 30,267,980 | - |
| Statement of Assets and Liabilities | ||||
| October 31, 2022 | ||||
| Assets | ||||
| Investment in securities, at value (including securities loaned of $2,205,952) - See accompanying schedule: | ||||
Unaffiliated issuers (cost $315,433,558) | $341,787,044 | |||
Fidelity Central Funds (cost $16,549,205) | 16,549,205 | |||
| Total Investment in Securities (cost $331,982,763) | $ | 358,336,249 | ||
| Foreign currency held at value (cost $115,506) | 48,020 | |||
| Receivable for investments sold | 6,634,556 | |||
| Receivable for fund shares sold | 2,973 | |||
| Dividends receivable | 2,646,089 | |||
| Distributions receivable from Fidelity Central Funds | 44,809 | |||
| Prepaid expenses | 603 | |||
Total assets | 367,713,299 | |||
| Liabilities | ||||
| Payable for investments purchased | 570,386 | |||
| Payable for fund shares redeemed | 60,990 | |||
| Accrued management fee | 207,220 | |||
| Other affiliated payables | 67,883 | |||
| Other payables and accrued expenses | 57,192 | |||
| Collateral on securities loaned | 2,325,000 | |||
| Total Liabilities | 3,288,671 | |||
| Net Assets | $ | 364,424,628 | ||
| Net Assets consist of: | ||||
| Paid in capital | $ | 361,144,895 | ||
| Total accumulated earnings (loss) | 3,279,733 | |||
| Net Assets | $ | 364,424,628 | ||
Net Asset Value , offering price and redemption price per share ($364,424,628 ÷ 29,229,691 shares) | $ | 12.47 | ||
| Statement of Operations | ||||
Year ended October 31, 2022 | ||||
| Investment Income | ||||
| Dividends | $ | 10,330,711 | ||
| Income from Fidelity Central Funds (including $38,923 from security lending) | 227,100 | |||
| Income before foreign taxes withheld | 10,557,811 | |||
| Less foreign taxes withheld | (1,033,904) | |||
| Total Income | 9,523,907 | |||
| Expenses | ||||
| Management fee | $ | 2,876,915 | ||
| Transfer agent fees | 667,829 | |||
| Accounting fees | 217,318 | |||
| Custodian fees and expenses | 34,454 | |||
| Independent trustees' fees and expenses | 1,490 | |||
| Registration fees | 19,901 | |||
| Audit | 55,203 | |||
| Legal | 420 | |||
| Miscellaneous | 2,094 | |||
| Total expenses before reductions | 3,875,624 | |||
| Expense reductions | (13,991) | |||
| Total expenses after reductions | 3,861,633 | |||
| Net Investment income (loss) | 5,662,274 | |||
| Realized and Unrealized Gain (Loss) | ||||
| Net realized gain (loss) on: | ||||
| Investment Securities: | ||||
| Unaffiliated issuers | (661,220) | |||
| Foreign currency transactions | (535,943) | |||
| Futures contracts | (22,153) | |||
| Total net realized gain (loss) | (1,219,316) | |||
| Change in net unrealized appreciation (depreciation) on: | ||||
| Investment Securities: | ||||
| Unaffiliated issuers | (112,163,023) | |||
| Assets and liabilities in foreign currencies | (78,089) | |||
| Total change in net unrealized appreciation (depreciation) | (112,241,112) | |||
| Net gain (loss) | (113,460,428) | |||
| Net increase (decrease) in net assets resulting from operations | $ | (107,798,154) | ||
| Statement of Changes in Net Assets | ||||
Year ended October 31, 2022 | Year ended October 31, 2021 | |||
| Increase (Decrease) in Net Assets | ||||
| Operations | ||||
| Net investment income (loss) | $ | 5,662,274 | $ | 5,886,477 |
| Net realized gain (loss) | (1,219,316) | 47,202,531 | ||
| Change in net unrealized appreciation (depreciation) | (112,241,112) | (4,677,746) | ||
| Net increase (decrease) in net assets resulting from operations | (107,798,154) | 48,411,262 | ||
| Distributions to shareholders | (52,717,138) | (8,873,375) | ||
| Share transactions | ||||
| Proceeds from sales of shares | 11,321,055 | 21,598,620 | ||
| Reinvestment of distributions | 51,177,635 | 8,615,238 | ||
| Cost of shares redeemed | (38,772,821) | (92,311,202) | ||
Net increase (decrease) in net assets resulting from share transactions | 23,725,869 | (62,097,344) | ||
| Total increase (decrease) in net assets | (136,789,423) | (22,559,457) | ||
| Net Assets | ||||
| Beginning of period | 501,214,051 | 523,773,508 | ||
| End of period | $ | 364,424,628 | $ | 501,214,051 |
| Other Information | ||||
| Shares | ||||
| Sold | 811,228 | 1,209,402 | ||
| Issued in reinvestment of distributions | 3,289,051 | 494,277 | ||
| Redeemed | (2,841,225) | (5,203,304) | ||
| Net increase (decrease) | 1,259,054 | (3,499,625) | ||
| Fidelity® Japan Smaller Companies Fund |
| Years ended October 31, | 2022 | 2021 | 2020 | 2019 | 2018 | |||||
Selected Per-Share Data | ||||||||||
| Net asset value, beginning of period | $ | 17.92 | $ | 16.64 | $ | 17.60 | $ | 17.12 | $ | 18.84 |
| Income from Investment Operations | ||||||||||
Net investment income (loss) A,B | .19 | .20 | .16 | .22 | .18 | |||||
| Net realized and unrealized gain (loss) | (3.75) | 1.36 | .11 | 1.10 | (1.00) | |||||
| Total from investment operations | (3.56) | 1.56 | .27 | 1.32 | (.82) | |||||
| Distributions from net investment income | (.51) | (.19) | (.23) | (.11) | (.16) | |||||
| Distributions from net realized gain | (1.38) | (.10) | (1.00) | (.73) | (.74) | |||||
| Total distributions | (1.89) | (.28) C | (1.23) | (.84) | (.90) | |||||
Redemption fees added to paid in capital A | - | - | - | - | - D | |||||
| Net asset value, end of period | $ | 12.47 | $ | 17.92 | $ | 16.64 | $ | 17.60 | $ | 17.12 |
Total Return E | (21.95)% | 9.44% | 1.31% | 8.22% | (4.71)% | |||||
Ratios to Average Net Assets B,F,G | ||||||||||
| Expenses before reductions | .91% | .91% | .92% | .93% | .94% | |||||
| Expenses net of fee waivers, if any | .91% | .91% | .92% | .93% | .93% | |||||
| Expenses net of all reductions | .91% | .91% | .92% | .93% | .93% | |||||
| Net investment income (loss) | 1.33% | 1.13% | 1.02% | 1.31% | .95% | |||||
| Supplemental Data | ||||||||||
| Net assets, end of period (000 omitted) | $ | 364,425 | $ | 501,214 | $ | 523,774 | $ | 685,651 | $ | 715,402 |
Portfolio turnover rate H | 38% | 23% | 20% | 16% | 17% |
| Fidelity Central Fund | Investment Manager | Investment Objective | Investment Practices | Expense Ratio A |
| Fidelity Money Market Central Funds | Fidelity Management & Research Company LLC (FMR) | Each fund seeks to obtain a high level of current income consistent with the preservation of capital and liquidity. | Short-term Investments | Less than .005% |
| Gross unrealized appreciation | $49,419,501 |
| Gross unrealized depreciation | (33,893,699) |
| Net unrealized appreciation (depreciation) | $15,525,802 |
| Tax Cost | $342,810,447 |
| Capital loss carryforward | $(11,933,162) |
| Net unrealized appreciation (depreciation) on securities and other investments | $15,381,281 |
Short-term | $(2,461,352) |
Long-term | (9,471,810) |
| Total capital loss carryforward | $(11,933,162) |
| October 31, 2022 | October 31, 2021 | |
| Ordinary Income | $16,327,824 | $7,336,995 |
| Long-term Capital Gains | 36,389,314 | 1,536,380 |
| Total | $52,717,138 | $8,873,375 |
| Equity Risk | Equity risk relates to the fluctuations in the value of financial instruments as a result of changes in market prices (other than those arising from interest rate risk or foreign exchange risk), whether caused by factors specific to an individual investment, its issuer, or all factors affecting all instruments traded in a market or market segment. |
| Purchases ($) | Sales ($) | |
| Fidelity Japan Smaller Companies Fund | 156,385,404 | 192,199,482 |
| % of Average Net Assets | |
| Fidelity Japan Smaller Companies Fund | .05 |
| Purchases ($) | Sales ($) | Realized Gain (Loss) ($) | |
| Fidelity Japan Smaller Companies Fund | 3,314,039 | 22,746,350 | (1,435,102) |
| Amount ($) | |
| Fidelity Japan Smaller Companies Fund | 22,015 |
| Amount | |
| Fidelity Japan Smaller Companies Fund | $754 |
| Total Security Lending Fees Paid to NFS | Security Lending Income From Securities Loaned to NFS | Value of Securities Loaned to NFS at Period End | |
| Fidelity Japan Smaller Companies Fund | $4,294 | $- | $- |
| Strategic Advisers Fidelity International Fund | Strategic Advisers International Fund | |
| Fidelity Japan Smaller Companies Fund | 10% | 27% |
| Fund | % of shares held |
| Fidelity Japan Smaller Companies Fund | 62% |
| Average Annual Total Returns | |||
Periods ended October 31, 2022 | Past 1 year | Past 5 years | Past 10 years |
| Class A (incl.5.75% sales charge) | 5.72% | -2.83% | -3.88% |
| Class M (incl.3.50% sales charge) | 8.00% | -2.63% | -3.92% |
Class C (incl. contingent deferred sales charge) | 10.36% | -2.40% | -3.89% |
| Fidelity® Latin America Fund | 12.55% | -1.37% | -3.03% |
| Class I | 12.57% | -1.33% | -2.98% |
| Class Z | 12.73% | -1.21% | -2.92% |
| $10,000 Over 10 Years |
Let's say hypothetically that $10,000 was invested in Fidelity® Latin America Fund, a class of the fund, on October 31, 2012. The chart shows how the value of your investment would have changed, and also shows how the MSCI EM (Emerging Markets) Latin America Index performed over the same period. |
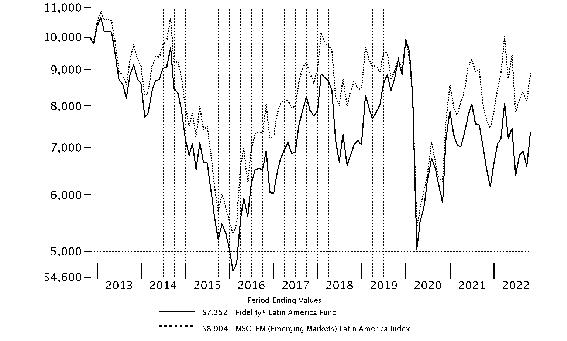 |
Top Holdings (% of Fund's net assets) | ||
| Petroleo Brasileiro SA - Petrobras (PN) (non-vtg.) (Brazil, Oil, Gas & Consumable Fuels) | 11.9 | |
| Genomma Lab Internacional SA de CV (Mexico, Pharmaceuticals) | 7.4 | |
| Suzano Papel e Celulose SA (Brazil, Paper & Forest Products) | 6.1 | |
| Hypera SA (Brazil, Pharmaceuticals) | 5.3 | |
| Vamos Locacao de Caminhoes Maquinas e Equipamentos SA (Brazil, Road & Rail) | 5.0 | |
| Itausa-Investimentos Itau SA (PN) (Brazil, Banks) | 4.9 | |
| Afya Ltd. (United States of America, Diversified Consumer Services) | 4.4 | |
| Localiza Rent a Car SA (Brazil, Road & Rail) | 4.1 | |
| Intercorp Financial Services, Inc. (Panama, Banks) | 3.9 | |
| Equatorial Energia SA (Brazil, Electric Utilities) | 3.7 | |
| 56.7 | ||
| Market Sectors (% of Fund's net assets) | ||
| Financials | 27.1 | |
| Health Care | 18.2 | |
| Energy | 11.9 | |
| Industrials | 11.8 | |
| Consumer Discretionary | 10.3 | |
| Materials | 9.5 | |
| Consumer Staples | 5.5 | |
| Utilities | 3.7 | |
| Information Technology | 1.4 | |
Asset Allocation (% of Fund's net assets) |
 |
Foreign investments - 88.9% |
Geographic Diversification (% of Fund's net assets) |
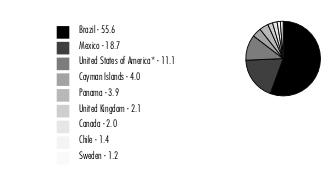 |
* Includes Short-Term investments and Net Other Assets (Liabilities). Percentages are based on country or territory of incorporation and are adjusted for the effect of futures contracts, if applicable. |
| Common Stocks - 82.6% | |||
| Shares | Value ($) | ||
| Brazil - 38.8% | |||
| Atacadao SA | 2,096,822 | 7,899,362 | |
| Banco do Brasil SA | 190,584 | 1,365,874 | |
| Blau Farmaceutica SA | 1,509,604 | 9,886,730 | |
| Boa Vista Servicos SA | 1,754,435 | 2,139,762 | |
| Caixa Seguridade Participacoes | 4,118,288 | 7,031,904 | |
| CM Hospitalar SA | 1,549,891 | 5,727,891 | |
| Equatorial Energia SA | 1,837,691 | 10,683,547 | |
| Hypera SA | 1,542,072 | 15,168,460 | |
| Localiza Rent a Car SA | 853,505 | 11,655,453 | |
| Localiza Rent a Car SA | 2,618 | 35,751 | |
| Pet Center Comercio e Participacoes SA | 4,339,488 | 7,359,194 | |
| Suzano Papel e Celulose SA | 1,682,881 | 17,332,159 | |
| Vamos Locacao de Caminhoes Maquinas e Equipamentos SA | 4,569,455 | 14,259,920 | |
TOTAL BRAZIL | 110,546,007 | ||
| Canada - 2.0% | |||
| First Quantum Minerals Ltd. | 315,354 | 5,562,415 | |
| Cayman Islands - 4.0% | |||
| PagSeguro Digital Ltd. (a) | 289,111 | 3,955,038 | |
| XP, Inc. Class A (a) | 406,431 | 7,449,880 | |
TOTAL CAYMAN ISLANDS | 11,404,918 | ||
| Chile - 1.4% | |||
| Sociedad Quimica y Minera de Chile SA (PN-B) sponsored ADR | 44,005 | 4,122,388 | |
| Mexico - 18.7% | |||
| Banco del Bajio SA (b) | 3,264,634 | 9,207,477 | |
| Becle S.A.B. de CV | 732,274 | 1,548,963 | |
| Genomma Lab Internacional SA de CV | 27,398,469 | 21,116,167 | |
| Grupo Aeroportuario Norte S.A.B. de CV | 720,572 | 5,740,427 | |
| Qualitas Controladora S.A.B. de CV | 2,247,348 | 8,830,366 | |
| Regional S.A.B. de CV | 986,612 | 6,894,781 | |
TOTAL MEXICO | 53,338,181 | ||
| Panama - 3.9% | |||
| Intercorp Financial Services, Inc. (c) | 448,354 | 11,029,508 | |
| Sweden - 1.2% | |||
| VEF AB (a) | 14,010,796 | 3,273,906 | |
| United Kingdom - 2.1% | |||
| British American Tobacco PLC (United Kingdom) | 148,528 | 5,865,887 | |
| United States of America - 10.5% | |||
| Afya Ltd. (a)(c) | 848,817 | 12,511,563 | |
| FirstCash Holdings, Inc. | 80,943 | 7,968,838 | |
| Vasta Platform Ltd. (a)(c) | 1,725,714 | 9,456,913 | |
TOTAL UNITED STATES OF AMERICA | 29,937,314 | ||
| TOTAL COMMON STOCKS (Cost $228,584,847) | 235,080,524 | ||
| Nonconvertible Preferred Stocks - 16.8% | |||
| Shares | Value ($) | ||
| Brazil - 16.8% | |||
| Itausa-Investimentos Itau SA (PN) | 6,715,152 | 13,962,004 | |
| Petroleo Brasileiro SA - Petrobras (PN) (non-vtg.) | 5,883,840 | 33,955,526 | |
| TOTAL NONCONVERTIBLE PREFERRED STOCKS (Cost $36,128,216) | 47,917,530 | ||
| Money Market Funds - 0.6% | |||
| Shares | Value ($) | ||
| Fidelity Cash Central Fund 3.10% (d) | 646,994 | 647,124 | |
| Fidelity Securities Lending Cash Central Fund 3.10% (d)(e) | 1,102,819 | 1,102,930 | |
| TOTAL MONEY MARKET FUNDS (Cost $1,750,054) | 1,750,054 | ||
| TOTAL INVESTMENT IN SECURITIES - 100.0% (Cost $266,463,117) | 284,748,108 |
NET OTHER ASSETS (LIABILITIES) - 0.0% | (33,149) |
| NET ASSETS - 100.0% | 284,714,959 |
| (a) | Non-income producing |
| (b) | Security exempt from registration under Rule 144A of the Securities Act of 1933. These securities may be resold in transactions exempt from registration, normally to qualified institutional buyers. At the end of the period, the value of these securities amounted to $9,207,477 or 3.2% of net assets. |
| (c) | Security or a portion of the security is on loan at period end. |
| (d) | Affiliated fund that is generally available only to investment companies and other accounts managed by Fidelity Investments. The rate quoted is the annualized seven-day yield of the fund at period end. A complete unaudited listing of the fund's holdings as of its most recent quarter end is available upon request. In addition, each Fidelity Central Fund's financial statements, which are not covered by the Fund's Report of Independent Registered Public Accounting Firm, are available on the SEC's website or upon request. |
| (e) | Investment made with cash collateral received from securities on loan. |
| Affiliate | Value, beginning of period ($) | Purchases ($) | Sales Proceeds ($) | Dividend Income ($) | Realized Gain (loss) ($) | Change in Unrealized appreciation (depreciation) ($) | Value, end of period ($) | % ownership, end of period |
| Fidelity Cash Central Fund 3.10% | - | 73,441,188 | 72,794,064 | 20,852 | - | - | 647,124 | 0.0% |
| Fidelity Securities Lending Cash Central Fund 3.10% | 2,950,155 | 49,357,036 | 51,204,261 | 24,031 | - | - | 1,102,930 | 0.0% |
| Total | 2,950,155 | 122,798,224 | 123,998,325 | 44,883 | - | - | 1,750,054 | |
| Valuation Inputs at Reporting Date: | ||||
| Description | Total ($) | Level 1 ($) | Level 2 ($) | Level 3 ($) |
Investments in Securities: | ||||
| Equities: | ||||
Consumer Discretionary | 29,327,670 | 29,327,670 | - | - |
Consumer Staples | 15,314,212 | 9,448,325 | 5,865,887 | - |
Energy | 33,955,526 | 33,955,526 | - | - |
Financials | 77,014,538 | 77,014,538 | - | - |
Health Care | 51,899,248 | 51,899,248 | - | - |
Industrials | 33,831,313 | 33,831,313 | - | - |
Information Technology | 3,955,038 | 3,955,038 | - | - |
Materials | 27,016,962 | 27,016,962 | - | - |
Utilities | 10,683,547 | 10,683,547 | - | - |
| Money Market Funds | 1,750,054 | 1,750,054 | - | - |
| Total Investments in Securities: | 284,748,108 | 278,882,221 | 5,865,887 | - |
| Statement of Assets and Liabilities | ||||
| October 31, 2022 | ||||
| Assets | ||||
| Investment in securities, at value (including securities loaned of $1,066,336) - See accompanying schedule: | ||||
Unaffiliated issuers (cost $264,713,063) | $282,998,054 | |||
Fidelity Central Funds (cost $1,750,054) | 1,750,054 | |||
| Total Investment in Securities (cost $266,463,117) | $ | 284,748,108 | ||
| Receivable for investments sold | 1,124,933 | |||
| Receivable for fund shares sold | 123,488 | |||
| Dividends receivable | 956,062 | |||
| Distributions receivable from Fidelity Central Funds | 15,787 | |||
| Prepaid expenses | 406 | |||
| Other receivables | 1 | |||
Total assets | 286,968,785 | |||
| Liabilities | ||||
| Payable for investments purchased | 602,401 | |||
| Payable for fund shares redeemed | 241,258 | |||
| Accrued management fee | 157,749 | |||
| Distribution and service plan fees payable | 4,605 | |||
| Other affiliated payables | 67,787 | |||
| Other payables and accrued expenses | 79,676 | |||
| Collateral on securities loaned | 1,100,350 | |||
| Total Liabilities | 2,253,826 | |||
| Net Assets | $ | 284,714,959 | ||
| Net Assets consist of: | ||||
| Paid in capital | $ | 332,492,612 | ||
| Total accumulated earnings (loss) | (47,777,653) | |||
| Net Assets | $ | 284,714,959 | ||
| Net Asset Value and Maximum Offering Price | ||||
| Class A : | ||||
Net Asset Value and redemption price per share ($13,308,810 ÷ 628,316 shares) (a) | $ | 21.18 | ||
| Maximum offering price per share (100/94.25 of $21.18) | $ | 22.47 | ||
| Class M : | ||||
Net Asset Value and redemption price per share ($3,024,230 ÷ 142,704 shares) (a) | $ | 21.19 | ||
| Maximum offering price per share (100/96.50 of $21.19) | $ | 21.96 | ||
| Class C : | ||||
Net Asset Value and offering price per share ($945,730 ÷ 44,331 shares) (a) | $ | 21.33 | ||
| Latin America : | ||||
Net Asset Value , offering price and redemption price per share ($262,360,529 ÷ 12,395,902 shares) | $ | 21.17 | ||
| Class I : | ||||
Net Asset Value , offering price and redemption price per share ($3,960,383 ÷ 187,260 shares) | $ | 21.15 | ||
| Class Z : | ||||
Net Asset Value , offering price and redemption price per share ($1,115,277 ÷ 52,749 shares) | $ | 21.14 | ||
(a)Redemption price per share is equal to net asset value less any applicable contingent deferred sales charge. | ||||
| Statement of Operations | ||||
Year ended October 31, 2022 | ||||
| Investment Income | ||||
| Dividends | $ | 28,132,655 | ||
| Income from Fidelity Central Funds (including $24,031 from security lending) | 44,883 | |||
| Income before foreign taxes withheld | 28,177,538 | |||
| Less foreign taxes withheld | (1,016,303) | |||
| Total Income | 27,161,235 | |||
| Expenses | ||||
| Management fee | $ | 1,973,678 | ||
| Transfer agent fees | 693,886 | |||
| Distribution and service plan fees | 51,866 | |||
| Accounting fees | 148,957 | |||
| Custodian fees and expenses | 83,248 | |||
| Independent trustees' fees and expenses | 1,013 | |||
| Registration fees | 84,541 | |||
| Audit | 67,079 | |||
| Legal | 267 | |||
| Interest | 1,485 | |||
| Miscellaneous | 1,393 | |||
| Total expenses before reductions | 3,107,413 | |||
| Expense reductions | (9,509) | |||
| Total expenses after reductions | 3,097,904 | |||
| Net Investment income (loss) | 24,063,331 | |||
| Realized and Unrealized Gain (Loss) | ||||
| Net realized gain (loss) on: | ||||
| Investment Securities: | ||||
| Unaffiliated issuers | (13,224,672) | |||
| Foreign currency transactions | (838,661) | |||
| Total net realized gain (loss) | (14,063,333) | |||
| Change in net unrealized appreciation (depreciation) on: | ||||
| Investment Securities: | ||||
| Unaffiliated issuers | 19,780,072 | |||
| Assets and liabilities in foreign currencies | 17,650 | |||
| Total change in net unrealized appreciation (depreciation) | 19,797,722 | |||
| Net gain (loss) | 5,734,389 | |||
| Net increase (decrease) in net assets resulting from operations | $ | 29,797,720 | ||
| Statement of Changes in Net Assets | ||||
Year ended October 31, 2022 | Year ended October 31, 2021 | |||
| Increase (Decrease) in Net Assets | ||||
| Operations | ||||
| Net investment income (loss) | $ | 24,063,331 | $ | 3,590,554 |
| Net realized gain (loss) | (14,063,333) | (25,363,457) | ||
| Change in net unrealized appreciation (depreciation) | 19,797,722 | 65,409,096 | ||
| Net increase (decrease) in net assets resulting from operations | 29,797,720 | 43,636,193 | ||
| Distributions to shareholders | (7,964,894) | (228,705) | ||
| Share transactions - net increase (decrease) | (30,282,037) | (58,067,183) | ||
| Total increase (decrease) in net assets | (8,449,211) | (14,659,695) | ||
| Net Assets | ||||
| Beginning of period | 293,164,170 | 307,823,865 | ||
| End of period | $ | 284,714,959 | $ | 293,164,170 |
| Fidelity Advisor® Latin America Fund Class A |
| Years ended October 31, | 2022 | 2021 | 2020 | 2019 | 2018 | |||||
Selected Per-Share Data | ||||||||||
| Net asset value, beginning of period | $ | 19.37 | $ | 17.40 | $ | 28.36 | $ | 21.98 | $ | 24.93 |
| Income from Investment Operations | ||||||||||
Net investment income (loss) A,B | 1.60 | .15 | .04 | .69 | .50 | |||||
| Net realized and unrealized gain (loss) | .68 | 1.82 | (10.40) | 6.11 | (3.16) | |||||
| Total from investment operations | 2.28 | 1.97 | (10.36) | 6.80 | (2.66) | |||||
| Distributions from net investment income | (.47) | - C | (.60) | (.42) | (.29) | |||||
| Total distributions | (.47) | - C | (.60) | (.42) | (.29) | |||||
Redemption fees added to paid in capital A | - | - | - | - | - C | |||||
| Net asset value, end of period | $ | 21.18 | $ | 19.37 | $ | 17.40 | $ | 28.36 | $ | 21.98 |
Total Return D,E | 12.17% | 11.34% | (37.31)% | 31.60% | (10.78)% | |||||
Ratios to Average Net Assets B,F,G | ||||||||||
| Expenses before reductions | 1.32% | 1.33% | 1.36% | 1.36% | 1.38% | |||||
| Expenses net of fee waivers, if any | 1.32% | 1.33% | 1.35% | 1.36% | 1.38% | |||||
| Expenses net of all reductions | 1.32% | 1.33% | 1.33% | 1.36% | 1.36% | |||||
| Net investment income (loss) | 7.98% | .70% | .18% | 2.81% | 2.08% | |||||
| Supplemental Data | ||||||||||
| Net assets, end of period (000 omitted) | $ | 13,309 | $ | 10,217 | $ | 9,131 | $ | 17,953 | $ | 14,157 |
Portfolio turnover rate H | 48% | 33% | 54% | 48% | 53% |
| Fidelity Advisor® Latin America Fund Class M |
| Years ended October 31, | 2022 | 2021 | 2020 | 2019 | 2018 | |||||
Selected Per-Share Data | ||||||||||
| Net asset value, beginning of period | $ | 19.35 | $ | 17.44 | $ | 28.41 | $ | 22.00 | $ | 24.96 |
| Income from Investment Operations | ||||||||||
Net investment income (loss) A,B | 1.55 | .10 | (.02) | .63 | .43 | |||||
| Net realized and unrealized gain (loss) | .69 | 1.81 | (10.42) | 6.13 | (3.16) | |||||
| Total from investment operations | 2.24 | 1.91 | (10.44) | 6.76 | (2.73) | |||||
| Distributions from net investment income | (.40) | - | (.53) | (.35) | (.23) | |||||
| Total distributions | (.40) | - | (.53) | (.35) | (.23) | |||||
Redemption fees added to paid in capital A | - | - | - | - | - C | |||||
| Net asset value, end of period | $ | 21.19 | $ | 19.35 | $ | 17.44 | $ | 28.41 | $ | 22.00 |
Total Return D,E | 11.92% | 10.95% | (37.45)% | 31.26% | (11.04)% | |||||
Ratios to Average Net Assets B,F,G | ||||||||||
| Expenses before reductions | 1.58% | 1.59% | 1.62% | 1.64% | 1.66% | |||||
| Expenses net of fee waivers, if any | 1.58% | 1.59% | 1.61% | 1.63% | 1.66% | |||||
| Expenses net of all reductions | 1.58% | 1.59% | 1.59% | 1.63% | 1.63% | |||||
| Net investment income (loss) | 7.72% | .44% | (.09)% | 2.54% | 1.80% | |||||
| Supplemental Data | ||||||||||
| Net assets, end of period (000 omitted) | $ | 3,024 | $ | 2,701 | $ | 2,912 | $ | 6,032 | $ | 5,098 |
Portfolio turnover rate H | 48% | 33% | 54% | 48% | 53% |
| Fidelity Advisor® Latin America Fund Class C |
| Years ended October 31, | 2022 | 2021 | 2020 | 2019 | 2018 | |||||
Selected Per-Share Data | ||||||||||
| Net asset value, beginning of period | $ | 19.45 | $ | 17.61 | $ | 28.67 | $ | 22.16 | $ | 25.12 |
| Income from Investment Operations | ||||||||||
Net investment income (loss) A,B | 1.46 | (.01) | (.13) | .51 | .32 | |||||
| Net realized and unrealized gain (loss) | .71 | 1.85 | (10.56) | 6.21 | (3.18) | |||||
| Total from investment operations | 2.17 | 1.84 | (10.69) | 6.72 | (2.86) | |||||
| Distributions from net investment income | (.29) | - | (.37) | (.21) | (.10) | |||||
| Total distributions | (.29) | - | (.37) | (.21) | (.10) | |||||
Redemption fees added to paid in capital A | - | - | - | - | - C | |||||
| Net asset value, end of period | $ | 21.33 | $ | 19.45 | $ | 17.61 | $ | 28.67 | $ | 22.16 |
Total Return D,E | 11.36% | 10.45% | (37.78)% | 30.62% | (11.43)% | |||||
Ratios to Average Net Assets B,F,G | ||||||||||
| Expenses before reductions | 2.08% | 2.08% | 2.11% | 2.12% | 2.13% | |||||
| Expenses net of fee waivers, if any | 2.07% | 2.08% | 2.11% | 2.12% | 2.13% | |||||
| Expenses net of all reductions | 2.07% | 2.08% | 2.09% | 2.12% | 2.11% | |||||
| Net investment income (loss) | 7.22% | (.05)% | (.58)% | 2.06% | 1.33% | |||||
| Supplemental Data | ||||||||||
| Net assets, end of period (000 omitted) | $ | 946 | $ | 656 | $ | 810 | $ | 3,438 | $ | 3,498 |
Portfolio turnover rate H | 48% | 33% | 54% | 48% | 53% |
| Fidelity® Latin America Fund |
| Years ended October 31, | 2022 | 2021 | 2020 | 2019 | 2018 | |||||
Selected Per-Share Data | ||||||||||
| Net asset value, beginning of period | $ | 19.36 | $ | 17.36 | $ | 28.30 | $ | 21.94 | $ | 24.89 |
| Income from Investment Operations | ||||||||||
Net investment income (loss) A,B | 1.65 | .22 | .10 | .77 | .57 | |||||
| Net realized and unrealized gain (loss) | .69 | 1.79 | (10.36) | 6.09 | (3.15) | |||||
| Total from investment operations | 2.34 | 2.01 | (10.26) | 6.86 | (2.58) | |||||
| Distributions from net investment income | (.53) | (.01) | (.68) | (.50) | (.37) | |||||
| Total distributions | (.53) | (.01) | (.68) | (.50) | (.37) | |||||
Redemption fees added to paid in capital A | - | - | - | - | - C | |||||
| Net asset value, end of period | $ | 21.17 | $ | 19.36 | $ | 17.36 | $ | 28.30 | $ | 21.94 |
Total Return D | 12.55% | 11.58% | (37.13)% | 32.06% | (10.50)% | |||||
Ratios to Average Net Assets B,E,F | ||||||||||
| Expenses before reductions | 1.06% | 1.04% | 1.05% | 1.05% | 1.07% | |||||
| Expenses net of fee waivers, if any | 1.05% | 1.04% | 1.05% | 1.04% | 1.07% | |||||
| Expenses net of all reductions | 1.05% | 1.04% | 1.03% | 1.04% | 1.05% | |||||
| Net investment income (loss) | 8.24% | .99% | .48% | 3.13% | 2.39% | |||||
| Supplemental Data | ||||||||||
| Net assets, end of period (000 omitted) | $ | 262,361 | $ | 262,484 | $ | 277,942 | $ | 517,901 | $ | 445,845 |
Portfolio turnover rate G | 48% | 33% | 54% | 48% | 53% |
| Fidelity Advisor® Latin America Fund Class I |
| Years ended October 31, | 2022 | 2021 | 2020 | 2019 | 2018 | |||||
Selected Per-Share Data | ||||||||||
| Net asset value, beginning of period | $ | 19.34 | $ | 17.34 | $ | 28.28 | $ | 21.92 | $ | 24.88 |
| Income from Investment Operations | ||||||||||
Net investment income (loss) A,B | 1.67 | .23 | .12 | .78 | .59 | |||||
| Net realized and unrealized gain (loss) | .67 | 1.78 | (10.34) | 6.08 | (3.15) | |||||
| Total from investment operations | 2.34 | 2.01 | (10.22) | 6.86 | (2.56) | |||||
| Distributions from net investment income | (.53) | (.01) | (.72) | (.50) | (.40) | |||||
| Total distributions | (.53) | (.01) | (.72) | (.50) | (.40) | |||||
Redemption fees added to paid in capital A | - | - | - | - | - C | |||||
| Net asset value, end of period | $ | 21.15 | $ | 19.34 | $ | 17.34 | $ | 28.28 | $ | 21.92 |
Total Return D | 12.57% | 11.60% | (37.07)% | 32.09% | (10.44)% | |||||
Ratios to Average Net Assets B,E,F | ||||||||||
| Expenses before reductions | 1.02% | 1.00% | .99% | 1.01% | 1.01% | |||||
| Expenses net of fee waivers, if any | 1.02% | 1.00% | .99% | 1.00% | 1.01% | |||||
| Expenses net of all reductions | 1.02% | 1.00% | .97% | 1.00% | .98% | |||||
| Net investment income (loss) | 8.28% | 1.04% | .54% | 3.17% | 2.45% | |||||
| Supplemental Data | ||||||||||
| Net assets, end of period (000 omitted) | $ | 3,960 | $ | 2,768 | $ | 3,508 | $ | 7,124 | $ | 4,546 |
Portfolio turnover rate G | 48% | 33% | 54% | 48% | 53% |
| Fidelity Advisor® Latin America Fund Class Z |
| Years ended October 31, | 2022 | 2021 | 2020 | 2019 | 2018 A | |||||
Selected Per-Share Data | ||||||||||
| Net asset value, beginning of period | $ | 19.35 | $ | 17.32 | $ | 28.24 | $ | 21.92 | $ | 21.51 |
| Income from Investment Operations | ||||||||||
Net investment income (loss) B,C | 1.70 | .26 | .14 | .85 | (.01) | |||||
| Net realized and unrealized gain (loss) | .66 | 1.79 | (10.32) | 6.03 | .42 | |||||
| Total from investment operations | 2.36 | 2.05 | (10.18) | 6.88 | .41 | |||||
| Distributions from net investment income | (.57) | (.02) | (.74) | (.56) | - | |||||
| Total distributions | (.57) | (.02) | (.74) | (.56) | - | |||||
| Net asset value, end of period | $ | 21.14 | $ | 19.35 | $ | 17.32 | $ | 28.24 | $ | 21.92 |
Total Return D,E | 12.73% | 11.82% | (37.00)% | 32.28% | 1.91% | |||||
Ratios to Average Net Assets C,F,G | ||||||||||
| Expenses before reductions | .85% | .85% | .86% | .86% | .95% H | |||||
| Expenses net of fee waivers, if any | .85% | .85% | .86% | .86% | .95% H | |||||
| Expenses net of all reductions | .85% | .85% | .84% | .86% | .93% H | |||||
| Net investment income (loss) | 8.45% | 1.19% | .67% | 3.31% | (.37)% H | |||||
| Supplemental Data | ||||||||||
| Net assets, end of period (000 omitted) | $ | 1,115 | $ | 14,338 | $ | 13,520 | $ | 26,605 | $ | 145 |
Portfolio turnover rate I | 48% | 33% | 54% | 48% | 53% H |
| Fidelity Central Fund | Investment Manager | Investment Objective | Investment Practices | Expense Ratio A |
| Fidelity Money Market Central Funds | Fidelity Management & Research Company LLC (FMR) | Each fund seeks to obtain a high level of current income consistent with the preservation of capital and liquidity. | Short-term Investments | Less than .005% |
| Gross unrealized appreciation | $58,191,646 |
| Gross unrealized depreciation | (40,962,872) |
| Net unrealized appreciation (depreciation) | $17,228,774 |
| Tax Cost | $267,519,334 |
| Undistributed ordinary income | $16,122,226 |
| Capital loss carryforward | $(81,126,020) |
| Net unrealized appreciation (depreciation) on securities and other investments | $17,226,142 |
Short-term | $(50,951,267) |
Long-term | (30,174,753) |
| Total capital loss carryforward | $(81,126,020) |
| October 31, 2022 | October 31, 2021 | |
| Ordinary Income | $7,964,894 | $228,705 |
| Purchases ($) | Sales ($) | |
| Fidelity Latin America Fund | 139,187,123 | 157,866,539 |
| Distribution Fee | Service Fee | Total Fees | Retained by FDC | |
| Class A | - % | .25% | $29,187 | $450 |
| Class M | .25% | .25% | 14,366 | - |
| Class C | .75% | .25% | 8,313 | 2,295 |
| $51,866 | $2,745 |
| Retained by FDC | |
| Class A | $8,487 |
| Class M | 224 |
Class C A | 26 |
| $8,737 |
| Amount | % of Class-Level Average Net Assets | |
| Class A | $30,923 | .26 |
| Class M | 7,793 | .27 |
| Class C | 2,229 | .27 |
| Latin America | 639,502 | .25 |
| Class I | 7,122 | .21 |
| Class Z | 6,317 | .04 |
| $693,886 |
| % of Average Net Assets | |
| Fidelity Latin America Fund | .05 |
| Amount | |
| Fidelity Latin America Fund | $1,612 |
| Borrower or Lender | Average Loan Balance | Weighted Average Interest Rate | Interest Expense | |
| Fidelity Latin America Fund | Borrower | $3,429,741 | .54% | $1,388 |
| Purchases ($) | Sales ($) | Realized Gain (Loss) ($) | |
| Fidelity Latin America Fund | 50,721 | 2,323,722 | (785,992) |
| Amount | |
| Fidelity Latin America Fund | $509 |
| Total Security Lending Fees Paid to NFS | Security Lending Income From Securities Loaned to NFS | Value of Securities Loaned to NFS at Period End | |
| Fidelity Latin America Fund | $2,517 | $- | $- |
| Average Loan Balance | Weighted Average Interest Rate | Interest Expense | |
| Fidelity Latin America Fund | $943,667 | 1.24% | $97 |
Year ended October 31, 2022 | Year ended October 31, 2021 | |
| Fidelity Latin America Fund | ||
| Class A | $246,821 | $1,584 |
| Class M | 55,713 | - |
| Class C | 9,520 | - |
| Latin America | 7,148,489 | 206,329 |
| Class I | 63,267 | 2,224 |
| Class Z | 441,084 | 18,568 |
Total | $7,964,894 | $228,705 |
| Shares | Shares | Dollars | Dollars | |
| Year ended October 31, 2022 | Year ended October 31, 2021 | Year ended October 31, 2022 | Year ended October 31, 2021 | |
| Fidelity Latin America Fund | ||||
| Class A | ||||
| Shares sold | 193,440 | 110,803 | $4,014,725 | $2,384,222 |
| Reinvestment of distributions | 12,985 | 65 | 236,085 | 1,514 |
| Shares redeemed | (105,710) | (107,876) | (2,130,953) | (2,368,760) |
| Net increase (decrease) | 100,715 | 2,992 | $2,119,857 | $16,976 |
| Class M | ||||
| Shares sold | 20,674 | 13,216 | $437,930 | $293,089 |
| Reinvestment of distributions | 3,036 | - | 55,381 | - |
| Shares redeemed | (20,590) | (40,671) | (412,047) | (902,364) |
| Net increase (decrease) | 3,120 | (27,455) | $81,264 | $(609,275) |
| Class C | ||||
| Shares sold | 24,221 | 11,722 | $531,782 | $266,527 |
| Reinvestment of distributions | 515 | - | 9,515 | - |
| Shares redeemed | (14,126) | (24,019) | (288,523) | (539,967) |
| Net increase (decrease) | 10,610 | (12,297) | $252,774 | $(273,440) |
| Latin America | ||||
| Shares sold | 2,584,874 | 1,866,181 | $53,328,636 | $40,971,358 |
| Reinvestment of distributions | 354,926 | 7,805 | 6,428,926 | 181,543 |
| Shares redeemed | (4,099,646) | (4,328,777) | (80,282,944) | (95,189,209) |
| Net increase (decrease) | (1,159,846) | (2,454,791) | $(20,525,382) | $(54,036,308) |
| Class I | ||||
| Shares sold | 241,168 | 44,698 | $5,278,172 | $976,766 |
| Reinvestment of distributions | 3,427 | 94 | 61,999 | 2,192 |
| Shares redeemed | (200,417) | (104,070) | (3,856,685) | (2,256,112) |
| Net increase (decrease) | 44,178 | (59,278) | $1,483,486 | $(1,277,154) |
| Class Z | ||||
| Shares sold | 554,422 | 714,550 | $11,379,289 | $14,704,788 |
| Reinvestment of distributions | 24,364 | 800 | 440,031 | 18,559 |
| Shares redeemed | (1,267,021) | (755,012) | (25,513,356) | (16,611,329) |
| Net increase (decrease) | (688,235) | (39,662) | $(13,694,036) | $(1,887,982) |
| Average Annual Total Returns | |||
Periods ended October 31, 2022 | Past 1 year | Past 5 years | Past 10 years |
| Fidelity® Nordic Fund | -29.33% | 4.17% | 9.30% |
| $10,000 Over 10 Years |
Let's say hypothetically that $10,000 was invested in Fidelity® Nordic Fund on October 31, 2012. The chart shows how the value of your investment would have changed, and also shows how the FTSE® Capped Nordic Index performed over the same period. |
 |
Top Holdings (% of Fund's net assets) | ||
| Novo Nordisk A/S Series B (Denmark, Pharmaceuticals) | 15.5 | |
| Nordea Bank ABP (Finland, Banks) | 5.4 | |
| Investor AB (B Shares) (Sweden, Diversified Financial Services) | 5.1 | |
| Equinor ASA (Norway, Oil, Gas & Consumable Fuels) | 4.7 | |
| DSV A/S (Denmark, Air Freight & Logistics) | 4.4 | |
| Atlas Copco AB (B Shares) (Sweden, Machinery) | 3.8 | |
| ASSA ABLOY AB (B Shares) (Sweden, Building Products) | 3.8 | |
| Sandvik AB (Sweden, Machinery) | 3.7 | |
| Genmab A/S (Denmark, Biotechnology) | 3.6 | |
| Swedish Match Co. AB (Sweden, Tobacco) | 3.6 | |
| 53.6 | ||
| Market Sectors (% of Fund's net assets) | ||
| Industrials | 23.4 | |
| Health Care | 21.1 | |
| Financials | 20.6 | |
| Energy | 7.9 | |
| Consumer Staples | 7.5 | |
| Materials | 6.0 | |
| Utilities | 2.9 | |
| Information Technology | 2.8 | |
| Communication Services | 2.7 | |
| Consumer Discretionary | 2.3 | |
| Real Estate | 0.4 | |
Asset Allocation (% of Fund's net assets) |
 |
Foreign investments - 97.6% |
Geographic Diversification (% of Fund's net assets) |
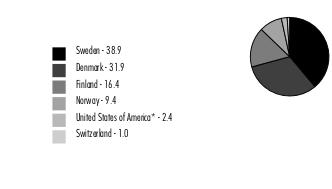 |
* Includes Short-Term investments and Net Other Assets (Liabilities). Percentages are based on country or territory of incorporation and are adjusted for the effect of futures contracts, if applicable. |
| Common Stocks - 97.6% | |||
| Shares | Value ($) | ||
| Denmark - 31.9% | |||
| Carlsberg A/S Series B | 61,400 | 7,229,586 | |
| DSV A/S | 83,200 | 11,263,687 | |
| Genmab A/S (a) | 23,900 | 9,206,465 | |
| Novo Nordisk A/S Series B | 366,700 | 39,871,755 | |
| ORSTED A/S (b) | 91,988 | 7,589,539 | |
| Royal Unibrew A/S | 47,600 | 2,718,538 | |
| Tryg A/S | 190,183 | 4,115,756 | |
TOTAL DENMARK | 81,995,326 | ||
| Finland - 16.4% | |||
| Elisa Corp. (A Shares) | 144,600 | 6,989,285 | |
| Neste OYJ | 132,000 | 5,784,109 | |
| Nordea Bank ABP | 1,445,544 | 13,814,966 | |
| Sampo Oyj (A Shares) | 196,600 | 8,991,739 | |
| UPM-Kymmene Corp. | 198,500 | 6,652,044 | |
TOTAL FINLAND | 42,232,143 | ||
| Norway - 9.4% | |||
| Equinor ASA | 336,900 | 12,274,521 | |
| Kongsberg Gruppen ASA | 80,000 | 2,867,215 | |
| Norsk Hydro ASA | 884,200 | 5,611,416 | |
| Selvaag Bolig ASA | 321,200 | 1,039,652 | |
| TGS ASA | 183,900 | 2,511,872 | |
TOTAL NORWAY | 24,304,676 | ||
| Sweden - 38.9% | |||
| Addlife AB | 86,228 | 805,957 | |
| Alfa Laval AB | 213,800 | 5,268,900 | |
| Alleima AB (a) | 121,980 | 415,615 | |
| ASSA ABLOY AB (B Shares) | 483,700 | 9,766,910 | |
| Atlas Copco AB (B Shares) | 1,010,400 | 9,771,742 | |
| Eltel AB (a)(b) | 1,727,523 | 1,157,815 | |
| EQT AB | 143,800 | 2,834,011 | |
| Evolution AB (b) | 54,400 | 5,074,579 | |
| Fortnox AB | 764,100 | 3,252,954 | |
| Haypp Group (a) | 385,600 | 836,424 | |
| HEXPOL AB (B Shares) | 273,170 | 2,696,766 | |
| Indutrade AB | 307,300 | 5,381,340 | |
| Investor AB (B Shares) | 797,500 | 13,027,307 | |
| Lagercrantz Group AB (B Shares) | 462,453 | 3,968,538 | |
| Nibe Industrier AB (B Shares) | 298,400 | 2,380,995 | |
| Nordnet AB | 260,600 | 3,233,543 | |
| Saab AB (B Shares) | 87,500 | 3,092,282 | |
| Sandvik AB | 609,900 | 9,530,754 | |
| Surgical Science Sweden AB (a) | 124,000 | 1,789,045 | |
| Swedbank AB (A Shares) | 440,699 | 6,569,962 | |
| Swedish Match Co. AB | 888,500 | 9,138,128 | |
TOTAL SWEDEN | 99,993,567 | ||
| Switzerland - 1.0% | |||
| Sonova Holding AG | 10,530 | 2,489,091 | |
| TOTAL COMMON STOCKS (Cost $244,604,983) | 251,014,803 | ||
| Money Market Funds - 0.9% | |||
| Shares | Value ($) | ||
Fidelity Cash Central Fund 3.10% (c) (Cost $2,293,839) | 2,293,380 | 2,293,839 | |
| TOTAL INVESTMENT IN SECURITIES - 98.5% (Cost $246,898,822) | 253,308,642 |
NET OTHER ASSETS (LIABILITIES) - 1.5% | 3,855,706 |
| NET ASSETS - 100.0% | 257,164,348 |
| (a) | Non-income producing |
| (b) | Security exempt from registration under Rule 144A of the Securities Act of 1933. These securities may be resold in transactions exempt from registration, normally to qualified institutional buyers. At the end of the period, the value of these securities amounted to $13,821,933 or 5.4% of net assets. |
| (c) | Affiliated fund that is generally available only to investment companies and other accounts managed by Fidelity Investments. The rate quoted is the annualized seven-day yield of the fund at period end. A complete unaudited listing of the fund's holdings as of its most recent quarter end is available upon request. In addition, each Fidelity Central Fund's financial statements, which are not covered by the Fund's Report of Independent Registered Public Accounting Firm, are available on the SEC's website or upon request. |
| Affiliate | Value, beginning of period ($) | Purchases ($) | Sales Proceeds ($) | Dividend Income ($) | Realized Gain (loss) ($) | Change in Unrealized appreciation (depreciation) ($) | Value, end of period ($) | % ownership, end of period |
| Fidelity Cash Central Fund 3.10% | 10,608,095 | 60,318,764 | 68,633,020 | 50,835 | - | - | 2,293,839 | 0.0% |
| Fidelity Securities Lending Cash Central Fund 3.10% | - | 120,929,681 | 120,929,681 | 104,408 | - | - | - | 0.0% |
| Total | 10,608,095 | 181,248,445 | 189,562,701 | 155,243 | - | - | 2,293,839 | |
| Valuation Inputs at Reporting Date: | ||||
| Description | Total ($) | Level 1 ($) | Level 2 ($) | Level 3 ($) |
Investments in Securities: | ||||
| Equities: | ||||
Communication Services | 6,989,285 | 6,989,285 | - | - |
Consumer Discretionary | 5,911,003 | 836,424 | 5,074,579 | - |
Consumer Staples | 19,086,252 | 2,718,538 | 16,367,714 | - |
Energy | 20,570,502 | 8,295,981 | 12,274,521 | - |
Financials | 52,587,284 | 46,017,322 | 6,569,962 | - |
Health Care | 54,162,313 | 5,084,093 | 49,078,220 | - |
Industrials | 60,481,640 | 31,412,234 | 29,069,406 | - |
Information Technology | 7,221,492 | 7,221,492 | - | - |
Materials | 15,375,841 | 9,764,425 | 5,611,416 | - |
Real Estate | 1,039,652 | 1,039,652 | - | - |
Utilities | 7,589,539 | - | 7,589,539 | - |
| Money Market Funds | 2,293,839 | 2,293,839 | - | - |
| Total Investments in Securities: | 253,308,642 | 121,673,285 | 131,635,357 | - |
| Statement of Assets and Liabilities | ||||
| October 31, 2022 | ||||
| Assets | ||||
| Investment in securities, at value - See accompanying schedule: | ||||
Unaffiliated issuers (cost $244,604,983) | $251,014,803 | |||
Fidelity Central Funds (cost $2,293,839) | 2,293,839 | |||
| Total Investment in Securities (cost $246,898,822) | $ | 253,308,642 | ||
| Foreign currency held at value (cost $3,349) | 3,406 | |||
| Receivable for investments sold | 2,953,340 | |||
| Receivable for fund shares sold | 61,338 | |||
| Reclaims receivable | 1,186,965 | |||
| Distributions receivable from Fidelity Central Funds | 10,813 | |||
| Prepaid expenses | 438 | |||
Total assets | 257,524,942 | |||
| Liabilities | ||||
| Payable for fund shares redeemed | 114,720 | |||
| Accrued management fee | 142,500 | |||
| Transfer agent fee payable | 39,276 | |||
| Other affiliated payables | 10,471 | |||
| Audit fee payable | 48,966 | |||
| Other payables and accrued expenses | 4,661 | |||
| Total Liabilities | 360,594 | |||
| Net Assets | $ | 257,164,348 | ||
| Net Assets consist of: | ||||
| Paid in capital | $ | 263,414,840 | ||
| Total accumulated earnings (loss) | (6,250,492) | |||
| Net Assets | $ | 257,164,348 | ||
Net Asset Value , offering price and redemption price per share ($257,164,348 ÷ 5,575,219 shares) | $ | 46.13 | ||
| Statement of Operations | ||||
Year ended October 31, 2022 | ||||
| Investment Income | ||||
| Dividends | $ | 8,407,901 | ||
| Foreign Tax Reclaims | 836,196 | |||
| Income from Fidelity Central Funds (including $104,408 from security lending) | 155,243 | |||
| Income before foreign taxes withheld | 9,399,340 | |||
| Less foreign taxes withheld | (1,801,102) | |||
| Total Income | 7,598,238 | |||
| Expenses | ||||
| Management fee | $ | 2,164,977 | ||
| Transfer agent fees | 525,126 | |||
| Accounting fees | 163,706 | |||
| Custodian fees and expenses | 29,749 | |||
| Independent trustees' fees and expenses | 1,139 | |||
| Registration fees | 24,132 | |||
| Audit | 58,267 | |||
| Legal | 332 | |||
| Interest | 209 | |||
| Miscellaneous | 1,495 | |||
| Total expenses before reductions | 2,969,132 | |||
| Expense reductions | (10,506) | |||
| Total expenses after reductions | 2,958,626 | |||
| Net Investment income (loss) | 4,639,612 | |||
| Realized and Unrealized Gain (Loss) | ||||
| Net realized gain (loss) on: | ||||
| Investment Securities: | ||||
| Unaffiliated issuers | (8,142,765) | |||
| Foreign currency transactions | (77,236) | |||
| Total net realized gain (loss) | (8,220,001) | |||
| Change in net unrealized appreciation (depreciation) on: | ||||
| Investment Securities: | ||||
| Unaffiliated issuers | (114,039,219) | |||
| Assets and liabilities in foreign currencies | (190,658) | |||
| Total change in net unrealized appreciation (depreciation) | (114,229,877) | |||
| Net gain (loss) | (122,449,878) | |||
| Net increase (decrease) in net assets resulting from operations | $ | (117,810,266) | ||
| Statement of Changes in Net Assets | ||||
Year ended October 31, 2022 | Year ended October 31, 2021 | |||
| Increase (Decrease) in Net Assets | ||||
| Operations | ||||
| Net investment income (loss) | $ | 4,639,612 | $ | 5,910,725 |
| Net realized gain (loss) | (8,220,001) | 43,115,307 | ||
| Change in net unrealized appreciation (depreciation) | (114,229,877) | 67,218,282 | ||
| Net increase (decrease) in net assets resulting from operations | (117,810,266) | 116,244,314 | ||
| Distributions to shareholders | (53,400,933) | (11,742,235) | ||
| Share transactions | ||||
| Proceeds from sales of shares | 29,607,219 | 71,976,424 | ||
| Reinvestment of distributions | 49,862,949 | 10,959,662 | ||
| Cost of shares redeemed | (73,768,106) | (66,188,320) | ||
Net increase (decrease) in net assets resulting from share transactions | 5,702,062 | 16,747,766 | ||
| Total increase (decrease) in net assets | (165,509,137) | 121,249,845 | ||
| Net Assets | ||||
| Beginning of period | 422,673,485 | 301,423,640 | ||
| End of period | $ | 257,164,348 | $ | 422,673,485 |
| Other Information | ||||
| Shares | ||||
| Sold | 545,297 | 1,040,902 | ||
| Issued in reinvestment of distributions | 819,642 | 175,805 | ||
| Redeemed | (1,383,136) | (957,162) | ||
| Net increase (decrease) | (18,197) | 259,545 | ||
| Fidelity® Nordic Fund |
| Years ended October 31, | 2022 | 2021 | 2020 | 2019 | 2018 | |||||
Selected Per-Share Data | ||||||||||
| Net asset value, beginning of period | $ | 75.57 | $ | 56.51 | $ | 46.69 | $ | 49.64 | $ | 54.34 |
| Income from Investment Operations | ||||||||||
Net investment income (loss) A,B | .78 | 1.06 | .15 | 1.50 C | .47 | |||||
| Net realized and unrealized gain (loss) | (20.65) D | 20.17 | 11.86 | .15 | (3.01) | |||||
| Total from investment operations | (19.87) | 21.23 | 12.01 | 1.65 | (2.54) | |||||
| Distributions from net investment income | (3.02) | (.96) | (1.60) | (.05) | (.50) | |||||
| Distributions from net realized gain | (6.56) | (1.21) | (.59) | (4.55) | (1.67) | |||||
| Total distributions | (9.57) E | (2.17) | (2.19) | (4.60) | (2.17) | |||||
Redemption fees added to paid in capital A | - | - | - | - | .01 | |||||
| Net asset value, end of period | $ | 46.13 | $ | 75.57 | $ | 56.51 | $ | 46.69 | $ | 49.64 |
Total Return F | (29.33)% D | 38.39% | 26.73% | 3.96% | (4.80)% | |||||
Ratios to Average Net Assets B,G,H | ||||||||||
| Expenses before reductions | .93% | .92% | .96% | .98% | .98% | |||||
| Expenses net of fee waivers, if any | .92% | .92% | .96% | .98% | .97% | |||||
| Expenses net of all reductions | .92% | .92% | .96% | .96% | .97% | |||||
| Net investment income (loss) | 1.45% | 1.51% | .31% | 3.28% C | .89% | |||||
| Supplemental Data | ||||||||||
| Net assets, end of period (000 omitted) | $ | 257,164 | $ | 422,673 | $ | 301,424 | $ | 261,896 | $ | 290,184 |
Portfolio turnover rate I | 42% | 34% | 29% | 34% | 56% |
| Fidelity Central Fund | Investment Manager | Investment Objective | Investment Practices | Expense Ratio A |
| Fidelity Money Market Central Funds | Fidelity Management & Research Company LLC (FMR) | Each fund seeks to obtain a high level of current income consistent with the preservation of capital and liquidity. | Short-term Investments | Less than .005% |
| Gross unrealized appreciation | $40,797,457 |
| Gross unrealized depreciation | (38,258,133) |
| Net unrealized appreciation (depreciation) | $2,539,324 |
| Tax Cost | $250,769,318 |
| Capital loss carryforward | $(8,607,919) |
| Net unrealized appreciation (depreciation) on securities and other investments | $2,357,428 |
Short-term | $(7,967,620) |
Long-term | (640,299) |
| Total capital loss carryforward | $(8,607,919) |
| October 31, 2022 | October 31, 2021 | |
| Ordinary Income | $17,742,045 | $9,275,879 |
| Long-term Capital Gains | 35,658,888 | 2,466,356 |
| Total | $53,400,933 | $11,742,235 |
| Purchases ($) | Sales ($) | |
| Fidelity Nordic Fund | 133,835,286 | 170,265,841 |
| % of Average Net Assets | |
| Fidelity Nordic Fund | .05 |
| Borrower or Lender | Average Loan Balance | Weighted Average Interest Rate | Interest Expense | |
| Fidelity Nordic Fund | Borrower | $3,334,143 | .32% | $204 |
| Purchases ($) | Sales ($) | Realized Gain (Loss) ($) | |
| Fidelity Nordic Fund | - | 13,105,292 | (1,557,400) |
| Amount | |
| Fidelity Nordic Fund | $572 |
| Total Security Lending Fees Paid to NFS | Security Lending Income From Securities Loaned to NFS | Value of Securities Loaned to NFS at Period End | |
| Fidelity Nordic Fund | $11,028 | $- | $- |
| Average Loan Balance | Weighted Average Interest Rate | Interest Expense | |
| Fidelity Nordic Fund | $306,000 | .58% | $5 |
| Average Annual Total Returns | |||
Periods ended October 31, 2022 | Past 1 year | Past 5 years | Past 10 years |
| Fidelity® Pacific Basin Fund | -35.11% | 0.50% | 7.15% |
| $10,000 Over 10 Years |
Let's say hypothetically that $10,000 was invested in Fidelity® Pacific Basin Fund on October 31, 2012. The chart shows how the value of your investment would have changed, and also shows how the MSCI AC (All Country) Pacific Index performed over the same period. |
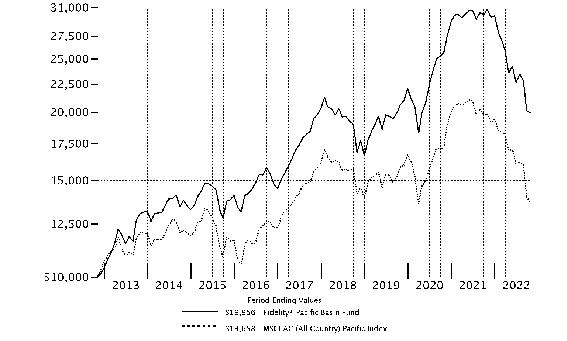 |
Top Holdings (% of Fund's net assets) | ||
| Samsung Electronics Co. Ltd. (Korea (South), Technology Hardware, Storage & Peripherals) | 4.9 | |
| Taiwan Semiconductor Manufacturing Co. Ltd. (Taiwan, Semiconductors & Semiconductor Equipment) | 4.5 | |
| United Overseas Bank Ltd. (Singapore, Banks) | 3.0 | |
| Tencent Holdings Ltd. (Cayman Islands, Interactive Media & Services) | 3.0 | |
| AIA Group Ltd. (Hong Kong, Insurance) | 2.5 | |
| DENSO Corp. (Japan, Auto Components) | 2.4 | |
| ResMed, Inc. CDI (United States of America, Health Care Equipment & Supplies) | 2.3 | |
| PT Bank Central Asia Tbk (Indonesia, Banks) | 2.2 | |
| Macquarie Group Ltd. (Australia, Capital Markets) | 2.2 | |
| Sony Group Corp. (Japan, Household Durables) | 2.1 | |
| 29.1 | ||
| Market Sectors (% of Fund's net assets) | ||
| Information Technology | 23.6 | |
| Financials | 19.5 | |
| Consumer Discretionary | 13.7 | |
| Health Care | 12.6 | |
| Industrials | 9.9 | |
| Communication Services | 9.1 | |
| Materials | 4.0 | |
| Energy | 2.1 | |
| Consumer Staples | 1.6 | |
| Utilities | 0.7 | |
| Real Estate | 0.6 | |
Asset Allocation (% of Fund's net assets) |
 |
Foreign investments - 94.7% |
Geographic Diversification (% of Fund's net assets) |
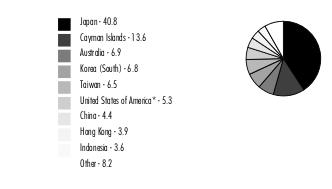 |
* Includes Short-Term investments and Net Other Assets (Liabilities). Percentages are based on country or territory of incorporation and are adjusted for the effect of futures contracts, if applicable. |
| Common Stocks - 92.4% | |||
| Shares | Value ($) | ||
| Australia - 6.9% | |||
| Aristocrat Leisure Ltd. | 391,468 | 9,282,421 | |
| HUB24 Ltd. | 247,352 | 4,009,262 | |
| Lynas Rare Earths Ltd. (a) | 1,376,019 | 7,331,821 | |
| Macquarie Group Ltd. | 130,520 | 14,151,067 | |
| National Storage REIT unit | 2,457,113 | 4,102,117 | |
| Technology One Ltd. | 889,134 | 6,853,251 | |
TOTAL AUSTRALIA | 45,729,939 | ||
| Cayman Islands - 13.6% | |||
| Alibaba Group Holding Ltd. (a) | 1,648,400 | 12,816,156 | |
| Antengene Corp. (a)(b) | 3,676,500 | 1,559,655 | |
| China High Precision Automation Group Ltd. (a)(c) | 1,875,000 | 2 | |
| China Metal Recycling (Holdings) Ltd. (a)(c) | 2,572,200 | 3 | |
| Giant Biogene Holding Co. Ltd. (a)(b) | 700,000 | 2,166,976 | |
| Hypebeast Ltd. (a) | 20,252,300 | 1,251,313 | |
| Li Ning Co. Ltd. | 697,500 | 3,607,613 | |
| Pinduoduo, Inc. ADR (a) | 166,000 | 9,101,780 | |
| Sea Ltd. ADR (a)(d) | 191,400 | 9,508,752 | |
| Shenzhou International Group Holdings Ltd. | 632,400 | 4,390,755 | |
| Tencent Holdings Ltd. | 738,900 | 19,415,923 | |
| Vnet Group, Inc. ADR (a) | 2,182,800 | 9,145,932 | |
| Weibo Corp. sponsored ADR (a) | 375,300 | 4,248,396 | |
| Wuxi Biologics (Cayman), Inc. (a)(b) | 1,454,000 | 6,542,480 | |
| Zai Lab Ltd. (a) | 2,452,600 | 5,649,043 | |
TOTAL CAYMAN ISLANDS | 89,404,779 | ||
| China - 4.3% | |||
| Centre Testing International Group Co. Ltd. (A Shares) | 1,916,909 | 4,916,363 | |
| Estun Automation Co. Ltd. (A Shares) | 2,028,514 | 5,469,258 | |
| Shenzhen Mindray Bio-Medical Electronics Co. Ltd. (A Shares) | 130,399 | 5,810,986 | |
| Shenzhen YUTO Packaging Technology Co. Ltd. (A Shares) | 708,400 | 3,155,493 | |
| Zhejiang Sanhua Intelligent Controls Co. Ltd. (A Shares) | 1,086,600 | 3,161,792 | |
| ZTE Corp. (H Shares) | 3,065,000 | 5,466,486 | |
TOTAL CHINA | 27,980,378 | ||
| Hong Kong - 3.9% | |||
| AIA Group Ltd. | 2,155,400 | 16,326,711 | |
| Chervon Holdings Ltd. | 451,973 | 1,522,958 | |
| Hang Seng Bank Ltd. | 534,000 | 7,517,541 | |
TOTAL HONG KONG | 25,367,210 | ||
| India - 3.1% | |||
| HDFC Bank Ltd. (a) | 337,032 | 6,116,426 | |
| Housing Development Finance Corp. Ltd. | 199,784 | 5,960,697 | |
| Power Grid Corp. of India Ltd. | 1,662,680 | 4,582,513 | |
| Reliance Industries Ltd. | 113,775 | 3,504,237 | |
TOTAL INDIA | 20,163,873 | ||
| Indonesia - 3.6% | |||
| PT Bank Central Asia Tbk | 26,099,000 | 14,724,873 | |
| PT Bank Rakyat Indonesia (Persero) Tbk | 30,176,775 | 8,996,442 | |
TOTAL INDONESIA | 23,721,315 | ||
| Japan - 40.8% | |||
| Astellas Pharma, Inc. | 415,800 | 5,737,286 | |
| Capcom Co. Ltd. | 201,400 | 5,614,197 | |
| Daiichikosho Co. Ltd. | 134,800 | 3,870,984 | |
| DENSO Corp. | 317,200 | 15,738,172 | |
| Digital Hearts Holdings Co. Ltd. | 193,000 | 2,654,326 | |
| FUJIFILM Holdings Corp. | 85,600 | 3,925,528 | |
| Fujitsu Ltd. | 39,200 | 4,510,294 | |
| Funai Soken Holdings, Inc. | 257,200 | 4,588,934 | |
| Hitachi Ltd. | 274,700 | 12,488,463 | |
| Hoya Corp. | 135,100 | 12,606,426 | |
| INPEX Corp. | 1,008,300 | 10,176,164 | |
| Iriso Electronics Co. Ltd. | 128,900 | 3,744,901 | |
| JEOL Ltd. | 65,700 | 2,412,468 | |
| Kakaku.com, Inc. | 161,600 | 2,739,794 | |
| Kansai Paint Co. Ltd. | 290,900 | 3,795,326 | |
| Lifenet Insurance Co. (a) | 370,100 | 2,474,054 | |
| Minebea Mitsumi, Inc. | 401,500 | 5,951,148 | |
| Misumi Group, Inc. | 262,100 | 5,605,286 | |
| Money Forward, Inc. (a) | 122,200 | 3,484,502 | |
| Net One Systems Co. Ltd. | 179,800 | 3,700,111 | |
| Nomura Research Institute Ltd. | 296,700 | 6,594,664 | |
| NSD Co. Ltd. | 228,200 | 3,904,239 | |
| Olympus Corp. | 605,600 | 12,788,487 | |
| Open House Group Co. Ltd. | 194,500 | 6,932,647 | |
| ORIX Corp. | 917,700 | 13,485,151 | |
| Outsourcing, Inc. | 357,900 | 2,804,086 | |
| Pan Pacific International Holdings Ltd. | 299,500 | 4,916,638 | |
| Recruit Holdings Co. Ltd. | 248,000 | 7,631,250 | |
| Renesas Electronics Corp. (a) | 1,398,900 | 11,702,851 | |
| Shin-Etsu Chemical Co. Ltd. | 115,300 | 11,983,124 | |
| SMS Co., Ltd. | 272,600 | 6,269,828 | |
| SoftBank Group Corp. | 221,200 | 9,495,280 | |
| Sony Group Corp. | 204,100 | 13,763,414 | |
| Sugi Holdings Co. Ltd. | 72,300 | 2,902,794 | |
| Sumco Corp. | 482,400 | 6,128,341 | |
| TechnoPro Holdings, Inc. | 167,100 | 4,008,788 | |
| Tokio Marine Holdings, Inc. | 525,000 | 9,501,160 | |
| Tsuruha Holdings, Inc. | 101,900 | 5,927,805 | |
| Z Holdings Corp. | 1,547,700 | 3,994,242 | |
| ZOZO, Inc. | 376,300 | 8,009,614 | |
TOTAL JAPAN | 268,562,767 | ||
| Korea (South) - 1.9% | |||
| Db Insurance Co. Ltd. | 76,960 | 3,035,653 | |
| Hyundai Fire & Marine Insurance Co. Ltd. | 105,363 | 2,458,165 | |
| SK Hynix, Inc. | 125,068 | 7,246,534 | |
TOTAL KOREA (SOUTH) | 12,740,352 | ||
| New Zealand - 2.1% | |||
| EBOS Group Ltd. | 416,179 | 9,073,743 | |
| Ryman Healthcare Ltd. | 928,240 | 4,522,508 | |
TOTAL NEW ZEALAND | 13,596,251 | ||
| Singapore - 3.0% | |||
| United Overseas Bank Ltd. | 1,013,100 | 19,866,951 | |
| Taiwan - 6.5% | |||
| eMemory Technology, Inc. | 134,000 | 4,466,113 | |
| MediaTek, Inc. | 492,000 | 8,999,814 | |
| Taiwan Semiconductor Manufacturing Co. Ltd. | 2,454,000 | 29,473,688 | |
TOTAL TAIWAN | 42,939,615 | ||
| United States of America - 2.7% | |||
| GI Dynamics, Inc. (a)(c) | 111,225 | 8,860 | |
| MagnaChip Semiconductor Corp. (a) | 124,437 | 1,238,148 | |
| ResMed, Inc. CDI | 679,762 | 14,805,272 | |
| Space Exploration Technologies Corp. Class A (a)(c)(e) | 22,539 | 1,577,730 | |
TOTAL UNITED STATES OF AMERICA | 17,630,010 | ||
| TOTAL COMMON STOCKS (Cost $612,257,131) | 607,703,440 | ||
| Preferred Stocks - 5.0% | |||
| Shares | Value ($) | ||
| Convertible Preferred Stocks - 0.1% | |||
| China - 0.1% | |||
| dMed Biopharmaceutical Co. Ltd. Series C (a)(c)(e) | 87,773 | 787,324 | |
| Nonconvertible Preferred Stocks - 4.9% | |||
| Korea (South) - 4.9% | |||
| Samsung Electronics Co. Ltd. | 867,100 | 32,379,863 | |
| TOTAL PREFERRED STOCKS (Cost $44,455,737) | 33,167,187 | ||
| Money Market Funds - 3.9% | |||
| Shares | Value ($) | ||
| Fidelity Cash Central Fund 3.10% (f) | 15,772,518 | 15,775,672 | |
| Fidelity Securities Lending Cash Central Fund 3.10% (f)(g) | 9,707,504 | 9,708,475 | |
| TOTAL MONEY MARKET FUNDS (Cost $25,484,147) | 25,484,147 | ||
| TOTAL INVESTMENT IN SECURITIES - 101.3% (Cost $682,197,015) | 666,354,774 |
NET OTHER ASSETS (LIABILITIES) - (1.3)% | (8,797,070) |
| NET ASSETS - 100.0% | 657,557,704 |
| (a) | Non-income producing |
| (b) | Security exempt from registration under Rule 144A of the Securities Act of 1933. These securities may be resold in transactions exempt from registration, normally to qualified institutional buyers. At the end of the period, the value of these securities amounted to $10,269,111 or 1.6% of net assets. |
| (c) | Level 3 security |
| (d) | Security or a portion of the security is on loan at period end. |
| (e) | Restricted securities (including private placements) - Investment in securities not registered under the Securities Act of 1933 (excluding 144A issues). At the end of the period, the value of restricted securities (excluding 144A issues) amounted to $2,365,054 or 0.4% of net assets. |
| (f) | Affiliated fund that is generally available only to investment companies and other accounts managed by Fidelity Investments. The rate quoted is the annualized seven-day yield of the fund at period end. A complete unaudited listing of the fund's holdings as of its most recent quarter end is available upon request. In addition, each Fidelity Central Fund's financial statements, which are not covered by the Fund's Report of Independent Registered Public Accounting Firm, are available on the SEC's website or upon request. |
| (g) | Investment made with cash collateral received from securities on loan. |
| Additional information on each restricted holding is as follows: | ||
| Security | Acquisition Date | Acquisition Cost ($) |
| dMed Biopharmaceutical Co. Ltd. Series C | 12/01/20 | 1,246,653 |
| Space Exploration Technologies Corp. Class A | 2/16/21 - 5/24/22 | 1,437,725 |
| Affiliate | Value, beginning of period ($) | Purchases ($) | Sales Proceeds ($) | Dividend Income ($) | Realized Gain (loss) ($) | Change in Unrealized appreciation (depreciation) ($) | Value, end of period ($) | % ownership, end of period |
| Fidelity Cash Central Fund 3.10% | 6,873,053 | 247,672,540 | 238,769,921 | 252,859 | - | - | 15,775,672 | 0.0% |
| Fidelity Securities Lending Cash Central Fund 3.10% | - | 99,301,048 | 89,592,573 | 27,474 | - | - | 9,708,475 | 0.0% |
| Total | 6,873,053 | 346,973,588 | 328,362,494 | 280,333 | - | - | 25,484,147 | |
| Valuation Inputs at Reporting Date: | ||||
| Description | Total ($) | Level 1 ($) | Level 2 ($) | Level 3 ($) |
Investments in Securities: | ||||
| Equities: | ||||
Communication Services | 60,138,881 | 27,233,436 | 32,905,445 | - |
Consumer Discretionary | 90,082,168 | 43,373,671 | 46,708,497 | - |
Consumer Staples | 10,997,575 | 8,830,599 | 2,166,976 | - |
Energy | 13,680,401 | 3,504,237 | 10,176,164 | - |
Financials | 128,624,153 | 98,663,475 | 29,960,678 | - |
Health Care | 82,304,538 | 69,228,588 | 12,279,766 | 796,184 |
Industrials | 64,472,926 | 51,255,158 | 11,640,038 | 1,577,730 |
Information Technology | 155,619,588 | 109,932,753 | 45,686,833 | 2 |
Materials | 26,265,767 | 14,282,640 | 11,983,124 | 3 |
Real Estate | 4,102,117 | 4,102,117 | - | - |
Utilities | 4,582,513 | 4,582,513 | - | - |
| Money Market Funds | 25,484,147 | 25,484,147 | - | - |
| Total Investments in Securities: | 666,354,774 | 460,473,334 | 203,507,521 | 2,373,919 |
| Statement of Assets and Liabilities | ||||
| October 31, 2022 | ||||
| Assets | ||||
| Investment in securities, at value (including securities loaned of $9,503,784) - See accompanying schedule: | ||||
Unaffiliated issuers (cost $656,712,868) | $640,870,627 | |||
Fidelity Central Funds (cost $25,484,147) | 25,484,147 | |||
| Total Investment in Securities (cost $682,197,015) | $ | 666,354,774 | ||
| Foreign currency held at value (cost $1,128,865) | 1,127,785 | |||
| Receivable for investments sold | 1,942,468 | |||
| Receivable for fund shares sold | 155,892 | |||
| Dividends receivable | 1,859,593 | |||
| Distributions receivable from Fidelity Central Funds | 39,491 | |||
| Prepaid expenses | 1,210 | |||
| Other receivables | 44,578 | |||
Total assets | 671,525,791 | |||
| Liabilities | ||||
| Payable for investments purchased | 2,200,040 | |||
| Payable for fund shares redeemed | 452,661 | |||
| Accrued management fee | 553,970 | |||
| Other affiliated payables | 123,599 | |||
| Deferred taxes | 810,058 | |||
| Other payables and accrued expenses | 119,284 | |||
| Collateral on securities loaned | 9,708,475 | |||
| Total Liabilities | 13,968,087 | |||
| Net Assets | $ | 657,557,704 | ||
| Net Assets consist of: | ||||
| Paid in capital | $ | 638,495,248 | ||
| Total accumulated earnings (loss) | 19,062,456 | |||
| Net Assets | $ | 657,557,704 | ||
Net Asset Value , offering price and redemption price per share ($657,557,704 ÷ 25,297,483 shares) | $ | 25.99 | ||
| Statement of Operations | ||||
Year ended October 31, 2022 | ||||
| Investment Income | ||||
| Dividends | $ | 15,660,757 | ||
| Non-Cash dividends | 1,451,252 | |||
| Income from Fidelity Central Funds (including $27,474 from security lending) | 280,333 | |||
| Income before foreign taxes withheld | 17,392,342 | |||
| Less foreign taxes withheld | (1,729,530) | |||
| Total Income | 15,662,812 | |||
| Expenses | ||||
| Management fee | ||||
| Basic fee | $ | 5,999,986 | ||
| Performance adjustment | 2,067,638 | |||
| Transfer agent fees | 1,297,070 | |||
| Accounting fees | 413,788 | |||
| Custodian fees and expenses | 73,316 | |||
| Independent trustees' fees and expenses | 3,230 | |||
| Registration fees | 32,820 | |||
| Audit | 81,152 | |||
| Legal | 1,470 | |||
| Interest | 1,155 | |||
| Miscellaneous | 4,849 | |||
| Total expenses before reductions | 9,976,474 | |||
| Expense reductions | (29,134) | |||
| Total expenses after reductions | 9,947,340 | |||
| Net Investment income (loss) | 5,715,472 | |||
| Realized and Unrealized Gain (Loss) | ||||
| Net realized gain (loss) on: | ||||
| Investment Securities: | ||||
| Unaffiliated issuers(net of foreign taxes of $1,564,636) | 72,559,969 | |||
| Foreign currency transactions | (858,889) | |||
| Total net realized gain (loss) | 71,701,080 | |||
| Change in net unrealized appreciation (depreciation) on: | ||||
| Investment Securities: | ||||
| Unaffiliated issuers (net of decrease in deferred foreign taxes of $2,319,962) | (457,704,121) | |||
| Assets and liabilities in foreign currencies | (22,465) | |||
| Total change in net unrealized appreciation (depreciation) | (457,726,586) | |||
| Net gain (loss) | (386,025,506) | |||
| Net increase (decrease) in net assets resulting from operations | $ | (380,310,034) | ||
| Statement of Changes in Net Assets | ||||
Year ended October 31, 2022 | Year ended October 31, 2021 | |||
| Increase (Decrease) in Net Assets | ||||
| Operations | ||||
| Net investment income (loss) | $ | 5,715,472 | $ | 4,191,951 |
| Net realized gain (loss) | 71,701,080 | 140,649,416 | ||
| Change in net unrealized appreciation (depreciation) | (457,726,586) | 73,462,090 | ||
| Net increase (decrease) in net assets resulting from operations | (380,310,034) | 218,303,457 | ||
| Distributions to shareholders | (153,392,663) | (53,433,366) | ||
| Share transactions | ||||
| Proceeds from sales of shares | 97,680,092 | 205,190,967 | ||
| Reinvestment of distributions | 112,623,785 | 41,320,240 | ||
| Cost of shares redeemed | (233,769,363) | (281,328,787) | ||
Net increase (decrease) in net assets resulting from share transactions | (23,465,486) | (34,817,580) | ||
| Total increase (decrease) in net assets | (557,168,183) | 130,052,511 | ||
| Net Assets | ||||
| Beginning of period | 1,214,725,887 | 1,084,673,376 | ||
| End of period | $ | 657,557,704 | $ | 1,214,725,887 |
| Other Information | ||||
| Shares | ||||
| Sold | 2,944,154 | 4,574,024 | ||
| Issued in reinvestment of distributions | 2,912,433 | 976,607 | ||
| Redeemed | (6,908,065) | (6,211,375) | ||
| Net increase (decrease) | (1,051,478) | (660,744) | ||
| Fidelity® Pacific Basin Fund |
| Years ended October 31, | 2022 | 2021 | 2020 | 2019 | 2018 | |||||
Selected Per-Share Data | ||||||||||
| Net asset value, beginning of period | $ | 46.10 | $ | 40.16 | $ | 32.65 | $ | 29.51 | $ | 35.53 |
| Income from Investment Operations | ||||||||||
Net investment income (loss) A,B | .22 | .15 | .16 | .26 | .22 | |||||
| Net realized and unrealized gain (loss) | (14.49) | 7.74 | 7.61 | 5.74 | (4.69) | |||||
| Total from investment operations | (14.27) | 7.89 | 7.77 | 6.00 | (4.47) | |||||
| Distributions from net investment income | (1.17) C | (.10) | (.26) | (.20) | (.23) | |||||
| Distributions from net realized gain | (4.67) C | (1.85) | - | (2.67) | (1.32) | |||||
| Total distributions | (5.84) | (1.95) | (.26) | (2.86) D | (1.55) | |||||
Redemption fees added to paid in capital A | - | - | - | - | - E | |||||
| Net asset value, end of period | $ | 25.99 | $ | 46.10 | $ | 40.16 | $ | 32.65 | $ | 29.51 |
Total Return F | (35.11)% | 20.08% | 23.95% | 22.37% | (13.24)% | |||||
Ratios to Average Net Assets B,G,H | ||||||||||
| Expenses before reductions | 1.12% | 1.04% | 1.11% | .97% | 1.07% | |||||
| Expenses net of fee waivers, if any | 1.12% | 1.04% | 1.11% | .97% | 1.07% | |||||
| Expenses net of all reductions | 1.12% | 1.04% | 1.10% | .97% | 1.06% | |||||
| Net investment income (loss) | .64% | .32% | .47% | .88% | .62% | |||||
| Supplemental Data | ||||||||||
| Net assets, end of period (000 omitted) | $ | 657,558 | $ | 1,214,726 | $ | 1,084,673 | $ | 891,154 | $ | 807,632 |
Portfolio turnover rate I | 29% | 40% | 27% | 32% | 37% |
| Fidelity Central Fund | Investment Manager | Investment Objective | Investment Practices | Expense Ratio A |
| Fidelity Money Market Central Funds | Fidelity Management & Research Company LLC (FMR) | Each fund seeks to obtain a high level of current income consistent with the preservation of capital and liquidity. | Short-term Investments | Less than .005% |
| Gross unrealized appreciation | $125,179,589 |
| Gross unrealized depreciation | (157,924,224) |
| Net unrealized appreciation (depreciation) | $(32,744,635) |
| Tax Cost | $699,099,409 |
| Undistributed long-term capital gain | $59,092,583 |
| Net unrealized appreciation (depreciation) on securities and other investments | $(32,827,067) |
| October 31, 2022 | October 31, 2021 | |
| Ordinary Income | $30,731,746 | $3,423,461 |
| Long-term Capital Gains | 122,660,917 | 50,009,905 |
| Total | $153,392,663 | $53,433,366 |
| Purchases ($) | Sales ($) | |
| Fidelity Pacific Basin Fund | 259,847,594 | 447,850,099 |
| % of Average Net Assets | |
| Fidelity Pacific Basin Fund | .05 |
| Amount | |
| Fidelity Pacific Basin Fund | $3,509 |
| Borrower or Lender | Average Loan Balance | Weighted Average Interest Rate | Interest Expense | |
| Fidelity Pacific Basin Fund | Borrower | $6,290,714 | .31% | $1,155 |
| Purchases ($) | Sales ($) | Realized Gain (Loss) ($) | |
| Fidelity Pacific Basin Fund | 10,752,257 | 15,206,018 | 3,663,668 |
| Amount | |
| Fidelity Pacific Basin Fund | $1,624 |
| Total Security Lending Fees Paid to NFS | Security Lending Income From Securities Loaned to NFS | Value of Securities Loaned to NFS at Period End | |
| Fidelity Pacific Basin Fund | $2,878 | $- | $- |
| Strategic Advisers Fidelity International Fund | |
| Fidelity Pacific Basin Fund | 19% |
| The Example is based on an investment of $1,000 invested at the beginning of the period and held for the entire period (May 1, 2022 to October 31, 2022). |
Annualized Expense Ratio- A | Beginning Account Value May 1, 2022 | Ending Account Value October 31, 2022 | Expenses Paid During Period- C May 1, 2022 to October 31, 2022 | |||||||
| Fidelity® Canada Fund | ||||||||||
| Class A | 1.25% | |||||||||
| Actual | $ 1,000 | $ 920.60 | $ 6.05 | |||||||
Hypothetical- B | $ 1,000 | $ 1,018.90 | $ 6.36 | |||||||
| Class M | 1.53% | |||||||||
| Actual | $ 1,000 | $ 919.30 | $ 7.40 | |||||||
Hypothetical- B | $ 1,000 | $ 1,017.49 | $ 7.78 | |||||||
| Class C | 2.03% | |||||||||
| Actual | $ 1,000 | $ 916.90 | $ 9.81 | |||||||
Hypothetical- B | $ 1,000 | $ 1,014.97 | $ 10.31 | |||||||
| Fidelity® Canada Fund | .93% | |||||||||
| Actual | $ 1,000 | $ 922.00 | $ 4.51 | |||||||
Hypothetical- B | $ 1,000 | $ 1,020.52 | $ 4.74 | |||||||
| Class I | .91% | |||||||||
| Actual | $ 1,000 | $ 922.00 | $ 4.41 | |||||||
Hypothetical- B | $ 1,000 | $ 1,020.62 | $ 4.63 | |||||||
| Class Z | .80% | |||||||||
| Actual | $ 1,000 | $ 922.50 | $ 3.88 | |||||||
Hypothetical- B | $ 1,000 | $ 1,021.17 | $ 4.08 | |||||||
| Fidelity® China Region Fund | ||||||||||
| Class A | 1.24% | |||||||||
| Actual | $ 1,000 | $ 735.90 | $ 5.43 | |||||||
Hypothetical- B | $ 1,000 | $ 1,018.95 | $ 6.31 | |||||||
| Class M | 1.52% | |||||||||
| Actual | $ 1,000 | $ 734.80 | $ 6.65 | |||||||
Hypothetical- B | $ 1,000 | $ 1,017.54 | $ 7.73 | |||||||
| Class C | 1.96% | |||||||||
| Actual | $ 1,000 | $ 733.30 | $ 8.56 | |||||||
Hypothetical- B | $ 1,000 | $ 1,015.32 | $ 9.96 | |||||||
| Fidelity® China Region Fund | .95% | |||||||||
| Actual | $ 1,000 | $ 737.00 | $ 4.16 | |||||||
Hypothetical- B | $ 1,000 | $ 1,020.42 | $ 4.84 | |||||||
| Class I | .94% | |||||||||
| Actual | $ 1,000 | $ 736.90 | $ 4.12 | |||||||
Hypothetical- B | $ 1,000 | $ 1,020.47 | $ 4.79 | |||||||
| Class Z | .80% | |||||||||
| Actual | $ 1,000 | $ 737.60 | $ 3.50 | |||||||
Hypothetical- B | $ 1,000 | $ 1,021.17 | $ 4.08 | |||||||
| Fidelity® Emerging Asia Fund | 1.22% | |||||||||
| Actual | $ 1,000 | $ 824.20 | $ 5.61 | |||||||
Hypothetical- B | $ 1,000 | $ 1,019.06 | $ 6.21 | |||||||
| Fidelity® Emerging Markets Fund | ||||||||||
| Class A | 1.22% | |||||||||
| Actual | $ 1,000 | $ 803.10 | $ 5.54 | |||||||
Hypothetical- B | $ 1,000 | $ 1,019.06 | $ 6.21 | |||||||
| Class M | 1.49% | |||||||||
| Actual | $ 1,000 | $ 801.80 | $ 6.77 | |||||||
Hypothetical- B | $ 1,000 | $ 1,017.69 | $ 7.58 | |||||||
| Class C | 1.99% | |||||||||
| Actual | $ 1,000 | $ 799.90 | $ 9.03 | |||||||
Hypothetical- B | $ 1,000 | $ 1,015.17 | $ 10.11 | |||||||
| Fidelity® Emerging Markets Fund | .90% | |||||||||
| Actual | $ 1,000 | $ 804.10 | $ 4.09 | |||||||
Hypothetical- B | $ 1,000 | $ 1,020.67 | $ 4.58 | |||||||
| Class K | .77% | |||||||||
| Actual | $ 1,000 | $ 804.70 | $ 3.50 | |||||||
Hypothetical- B | $ 1,000 | $ 1,021.32 | $ 3.92 | |||||||
| Class I | .89% | |||||||||
| Actual | $ 1,000 | $ 804.30 | $ 4.05 | |||||||
Hypothetical- B | $ 1,000 | $ 1,020.72 | $ 4.53 | |||||||
| Class Z | .77% | |||||||||
| Actual | $ 1,000 | $ 804.80 | $ 3.50 | |||||||
Hypothetical- B | $ 1,000 | $ 1,021.32 | $ 3.92 | |||||||
| Fidelity® Europe Fund | ||||||||||
| Class A | 1.15% | |||||||||
| Actual | $ 1,000 | $ 866.50 | $ 5.41 | |||||||
Hypothetical- B | $ 1,000 | $ 1,019.41 | $ 5.85 | |||||||
| Class M | 1.43% | |||||||||
| Actual | $ 1,000 | $ 865.40 | $ 6.72 | |||||||
Hypothetical- B | $ 1,000 | $ 1,018.00 | $ 7.27 | |||||||
| Class C | 1.93% | |||||||||
| Actual | $ 1,000 | $ 863.10 | $ 9.06 | |||||||
Hypothetical- B | $ 1,000 | $ 1,015.48 | $ 9.80 | |||||||
| Fidelity® Europe Fund | .85% | |||||||||
| Actual | $ 1,000 | $ 868.10 | $ 4.00 | |||||||
Hypothetical- B | $ 1,000 | $ 1,020.92 | $ 4.33 | |||||||
| Class I | .80% | |||||||||
| Actual | $ 1,000 | $ 868.00 | $ 3.77 | |||||||
Hypothetical- B | $ 1,000 | $ 1,021.17 | $ 4.08 | |||||||
| Class Z | .71% | |||||||||
| Actual | $ 1,000 | $ 868.50 | $ 3.34 | |||||||
Hypothetical- B | $ 1,000 | $ 1,021.63 | $ 3.62 | |||||||
| Fidelity® Japan Fund | ||||||||||
| Class A | 1.35% | |||||||||
| Actual | $ 1,000 | $ 904.50 | $ 6.48 | |||||||
Hypothetical- B | $ 1,000 | $ 1,018.40 | $ 6.87 | |||||||
| Class M | 1.64% | |||||||||
| Actual | $ 1,000 | $ 904.00 | $ 7.87 | |||||||
Hypothetical- B | $ 1,000 | $ 1,016.94 | $ 8.34 | |||||||
| Class C | 2.06% | |||||||||
| Actual | $ 1,000 | $ 901.50 | $ 9.87 | |||||||
Hypothetical- B | $ 1,000 | $ 1,014.82 | $ 10.46 | |||||||
| Fidelity® Japan Fund | 1.10% | |||||||||
| Actual | $ 1,000 | $ 906.30 | $ 5.29 | |||||||
Hypothetical- B | $ 1,000 | $ 1,019.66 | $ 5.60 | |||||||
| Class I | 1.05% | |||||||||
| Actual | $ 1,000 | $ 905.70 | $ 5.04 | |||||||
Hypothetical- B | $ 1,000 | $ 1,019.91 | $ 5.35 | |||||||
| Class Z | .92% | |||||||||
| Actual | $ 1,000 | $ 906.70 | $ 4.42 | |||||||
Hypothetical- B | $ 1,000 | $ 1,020.57 | $ 4.69 | |||||||
| Fidelity® Japan Smaller Companies Fund | .92% | |||||||||
| Actual | $ 1,000 | $ 942.60 | $ 4.50 | |||||||
Hypothetical- B | $ 1,000 | $ 1,020.57 | $ 4.69 | |||||||
| Fidelity® Latin America Fund | ||||||||||
| Class A | 1.32% | |||||||||
| Actual | $ 1,000 | $ 1,018.30 | $ 6.72 | |||||||
Hypothetical- B | $ 1,000 | $ 1,018.55 | $ 6.72 | |||||||
| Class M | 1.57% | |||||||||
| Actual | $ 1,000 | $ 1,017.30 | $ 7.98 | |||||||
Hypothetical- B | $ 1,000 | $ 1,017.29 | $ 7.98 | |||||||
| Class C | 2.08% | |||||||||
| Actual | $ 1,000 | $ 1,014.30 | $ 10.56 | |||||||
Hypothetical- B | $ 1,000 | $ 1,014.72 | $ 10.56 | |||||||
| Fidelity® Latin America Fund | 1.06% | |||||||||
| Actual | $ 1,000 | $ 1,020.20 | $ 5.40 | |||||||
Hypothetical- B | $ 1,000 | $ 1,019.86 | $ 5.40 | |||||||
| Class I | 1.01% | |||||||||
| Actual | $ 1,000 | $ 1,020.30 | $ 5.14 | |||||||
Hypothetical- B | $ 1,000 | $ 1,020.11 | $ 5.14 | |||||||
| Class Z | .85% | |||||||||
| Actual | $ 1,000 | $ 1,020.80 | $ 4.33 | |||||||
Hypothetical- B | $ 1,000 | $ 1,020.92 | $ 4.33 | |||||||
| Fidelity® Nordic Fund | .94% | |||||||||
| Actual | $ 1,000 | $ 895.40 | $ 4.49 | |||||||
Hypothetical- B | $ 1,000 | $ 1,020.47 | $ 4.79 | |||||||
| Fidelity® Pacific Basin Fund | 1.17% | |||||||||
| Actual | $ 1,000 | $ 847.10 | $ 5.45 | |||||||
Hypothetical- B | $ 1,000 | $ 1,019.31 | $ 5.96 | |||||||
| Fidelity Canada Fund | $25,925,491 |
| Fidelity Pacific Basin Fund | $70,746,791 |
| December 2021 | |
| Fidelity Canada Fund | 99.63% |
| Fidelity China Region Fund | - |
| Fidelity Emerging Asia Fund | - |
| Fidelity Emerging Markets Fund | - |
| Fidelity Europe Fund | 99.99% |
| Fidelity Japan Fund | 99.86% |
| Fidelity Japan Smaller Companies Fund | 100% |
| Fidelity Latin America Fund | - |
| Fidelity Nordic Fund | 99.42% |
| Fidelity Pacific Basin Fund | - |
| Class A | Class M | Class C | Retail | Class K | Class I | Class Z | |
| Fidelity Emerging Asia Fund | |||||||
| December, 2021 | - | - | - | 1% | - | - | - |
| Fidelity Emerging Markets Fund | |||||||
| December, 2021 | 6% | 9% | 13% | 6% | 6% | 6% | 5% |
| Fidelity Latin America Fund | |||||||
| December, 2021 | 1% | 1% | 1% | - | - | - | - |
| Fidelity Nordic Fund | |||||||
| December, 2021 | - | - | - | 4% | - | - | - |
| Class A | Class M | Class C | Retail | Class K | Class I | Class Z | |
| Fidelity Canada Fund | |||||||
| December, 2021 | 100% | 100% | - | 97% | - | 93% | 90% |
| Fidelity China Region Fund | |||||||
| December, 2021 | - | - | - | 100% | - | 100% | 100% |
| Fidelity Emerging Asia Fund | |||||||
| December, 2021 | - | - | - | 75% | - | - | - |
| Fidelity Emerging Markets Fund | |||||||
| December, 2021 | 66% | 93% | 100% | 68% | 59% | 61% | 58% |
| Fidelity Europe Fund | |||||||
| December, 2021 | 37% | 39% | 45% | 36% | - | 36% | 35% |
| Fidelity Japan Fund | |||||||
| December, 2021 | 36% | 40% | 48% | 34% | - | 42% | 33% |
| Fidelity Japan Smaller Companies Fund | |||||||
| December, 2021 | - | - | - | 58% | - | - | - |
| Fidelity Latin America Fund | |||||||
| December 3, 2021 | 49% | 57% | 79% | 43% | - | 43% | 40% |
| December 30, 2021 | 22% | 22% | 22% | 22% | - | 22% | 22% |
| Fidelity Nordic Fund | |||||||
| December 3, 2021 | - | - | - | 43% | - | - | - |
| December 30, 2021 | - | - | - | 94% | - | - | - |
| Fidelity Pacific Basin Fund | |||||||
| December, 2021 | - | - | - | 40% | - | - | - |
| Pay Date | Income | Taxes | |
| Fidelity Canada Fund | |||
| Class A | 12/06/21 | $0.9609 | $0.1609 |
| Class M | 12/06/21 | $0.7739 | $0.1609 |
| Class C | 12/06/21 | $0.0000 | $0.0000 |
| Canada | 12/06/21 | $1.1659 | $0.1609 |
| Class I | 12/06/21 | $1.2069 | $0.1609 |
| Class Z | 12/06/21 | $1.2549 | $0.1609 |
| Fidelity China Region Fund | |||
| Class A | 12/06/21 | $0.0000 | $0.0000 |
| Class M | 12/06/21 | $0.0000 | $0.0000 |
| Class C | 12/06/21 | $0.0000 | $0.0000 |
| China Region | 12/06/21 | $0.1609 | $0.1039 |
| Class I | 12/06/21 | $0.1389 | $0.1039 |
| Class Z | 12/06/21 | $0.2279 | $0.1039 |
| Fidelity Emerging Asia Fund | |||
| Emerging Asia | 12/06/21 | $0.4724 | $0.3999 |
| Fidelity Emerging Markets Fund | |||
| Class A | 12/06/21 | $0.5546 | $0.0746 |
| Class M | 12/06/21 | $0.3896 | $0.0746 |
| Class C | 12/06/21 | $0.2586 | $0.0746 |
| Emerging Markets | 12/06/21 | $0.5366 | $0.0746 |
| Class K | 12/06/21 | $0.6126 | $0.0746 |
| Class I | 12/06/21 | $0.6006 | $0.0746 |
| Class Z | 12/06/21 | $0.6276 | $0.0746 |
| Fidelity Europe Fund | |||
| Class A | 12/06/21 | $1.5534 | $0.1269 |
| Class M | 12/06/21 | $1.4664 | $0.1269 |
| Class C | 12/06/21 | $1.2918 | $0.1269 |
| Europe | 12/06/21 | $1.6241 | $0.1269 |
| Class I | 12/06/21 | $1.6077 | $0.1269 |
| Class Z | 12/06/21 | $1.6546 | $0.1269 |
| Fidelity Japan Fund | |||
| Class A | 12/06/21 | $0.6313 | $0.0368 |
| Class M | 12/06/21 | $0.5713 | $0.0368 |
| Class C | 12/06/21 | $0.4738 | $0.0368 |
| Japan | 12/06/21 | $0.6617 | $0.0368 |
| Class I | 12/06/21 | $0.5360 | $0.0368 |
| Class Z | 12/06/21 | $0.6956 | $0.0368 |
| Fidelity Japan Smaller Companies Fund | |||
| Japan Smaller Companies | 12/06/21 | $0.6304 | $0.0444 |
| Fidelity Latin America Fund | |||
| Class A | 12/06/21 | $0.4106 | $0.0343 |
| 12/31/21 | $0.0000 | $0.0000 | |
| Class M | 12/06/21 | $0.3516 | $0.0343 |
| 12/31/21 | $0.0000 | $0.0000 | |
| Class C | 12/06/21 | $0.2510 | $0.0343 |
| 12/31/21 | $0.0000 | $0.0000 | |
| Latin America | 12/06/21 | $0.4626 | $0.0343 |
| 12/31/21 | $0.0000 | $0.0000 | |
| Class I | 12/06/21 | $0.4635 | $0.0343 |
| 12/31/21 | $0.0000 | $0.0000 | |
| Class Z | 12/06/21 | $0.5017 | $0.0343 |
| 12/31/21 | $0.0000 | $0.0000 | |
| Fidelity Nordic Fund | |||
| Nordic | 12/06/21 | $3.1635 | $0.1305 |
| 12/31/21 | $0.1360 | $0.0000 | |
| Fidelity Pacific Basin Fund | |||
| Pacific Basin | 12/06/21 | $1.2700 | $0.0850 |
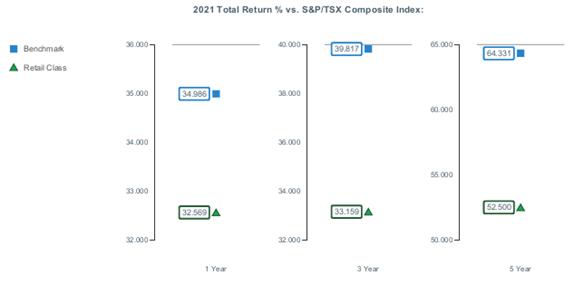
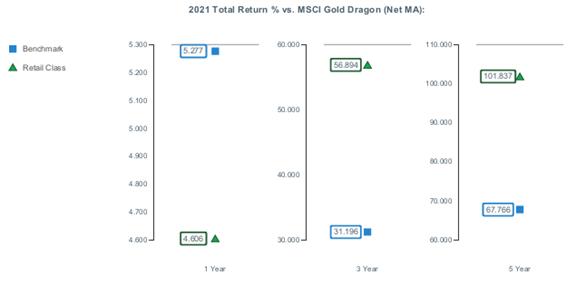


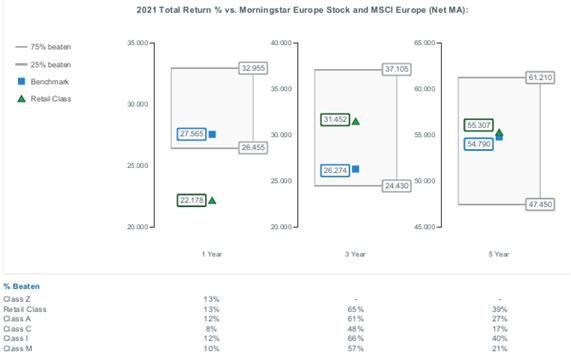
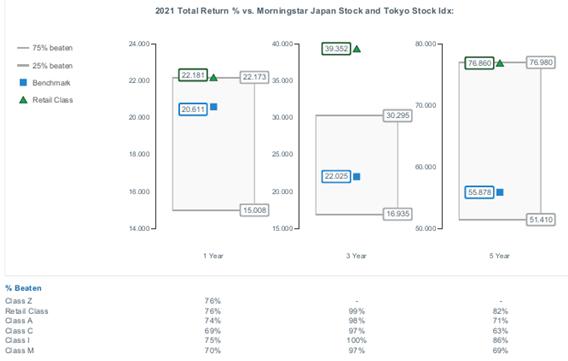
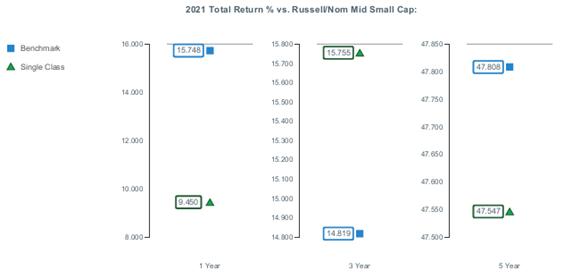
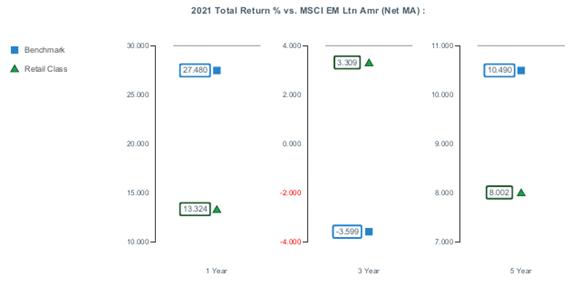
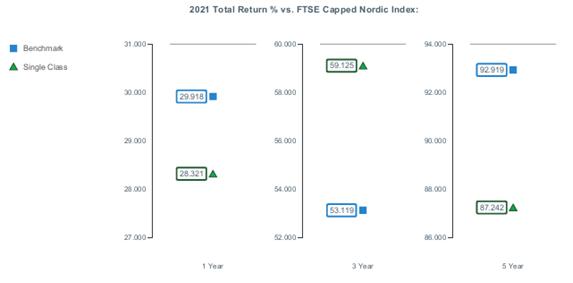
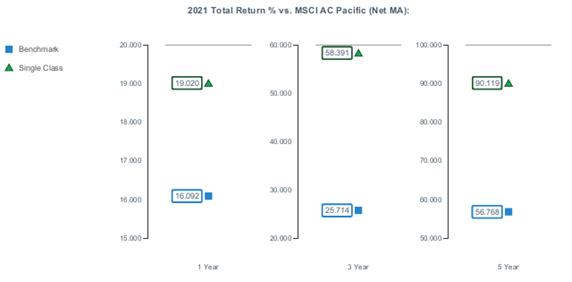

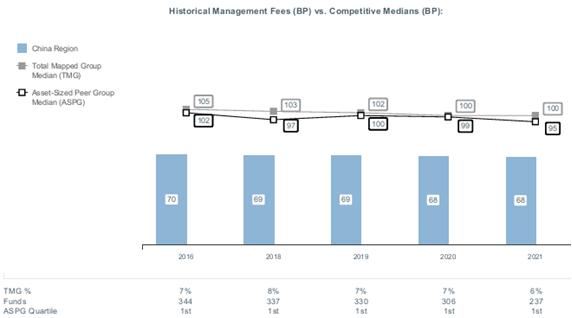


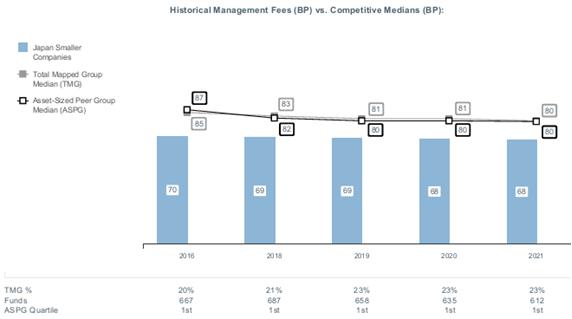


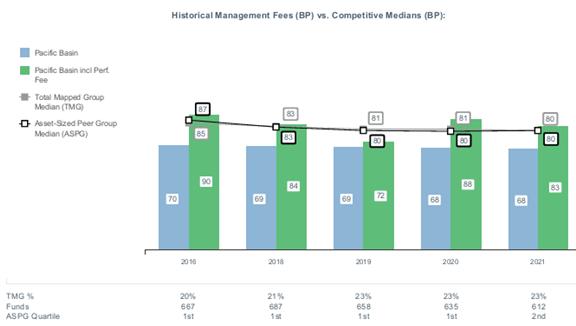
|


Contents
Board Approval of Investment Advisory Contracts and Management Fees |
| Average Annual Total Returns | |||
Periods ended October 31, 2022 | Past 1 year | Past 5 years | Past 10 years |
| Class A (incl.5.75% sales charge) | -22.18% | -2.02% | 2.26% |
| Class M (incl.3.50% sales charge) | -20.53% | -1.83% | 2.21% |
Class C (incl. contingent deferred sales charge) | -18.81% | -1.62% | 2.23% |
| Fidelity® International Value Fund | -17.20% | -0.52% | 3.22% |
| Class I | -17.23% | -0.58% | 3.15% |
| Class Z | -17.13% | -0.44% | 3.22% |
| $10,000 Over 10 Years |
Let's say hypothetically that $10,000 was invested in Fidelity® International Value Fund, a class of the fund, on October 31, 2012. The chart shows how the value of your investment would have changed, and also shows how the MSCI EAFE Value Index performed over the same period. |
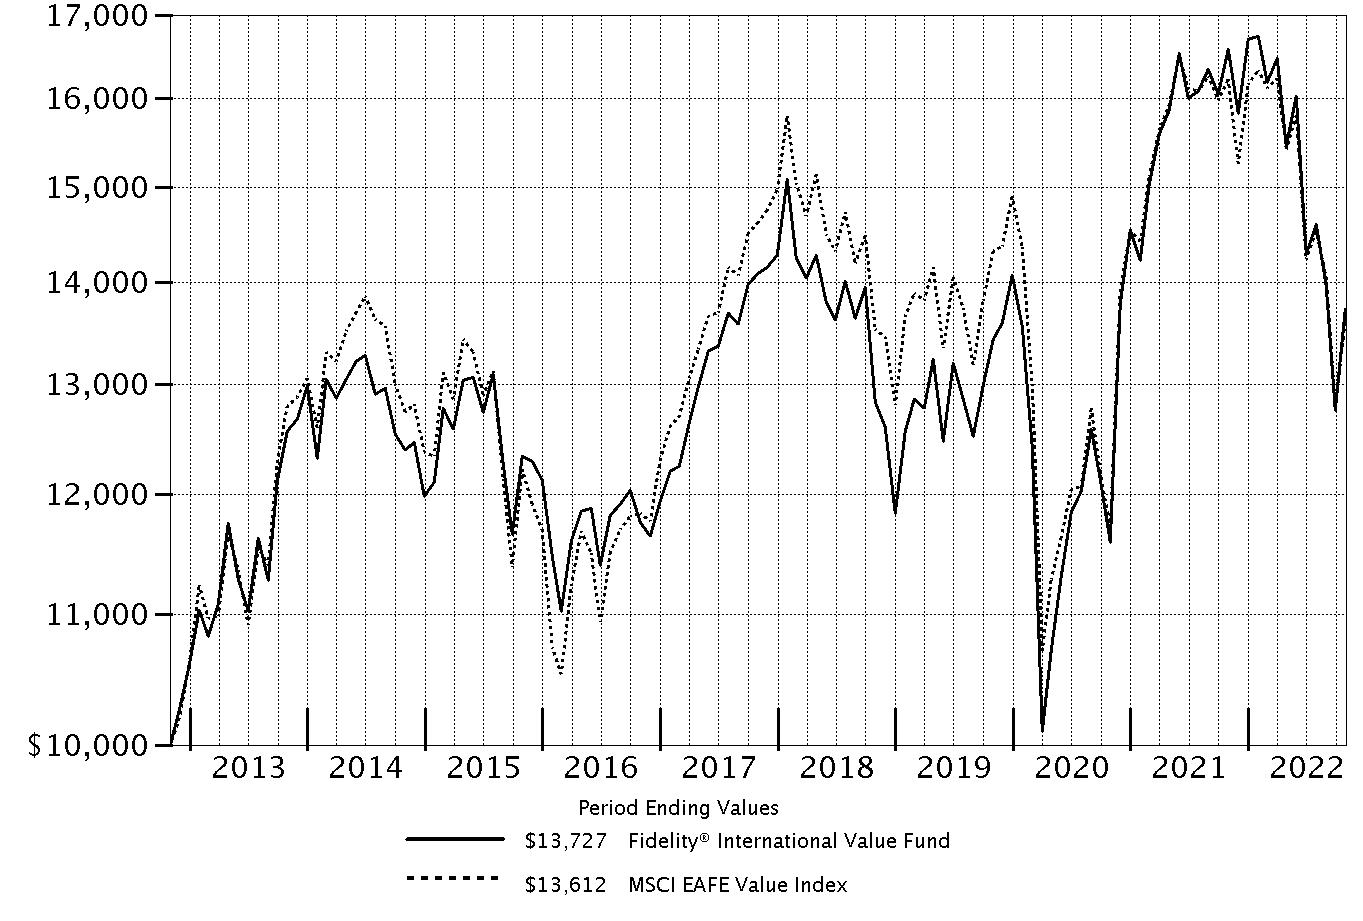 |
Top Holdings (% of Fund's net assets) | ||
| Shell PLC ADR (United Kingdom, Oil, Gas & Consumable Fuels) | 4.1 | |
| TotalEnergies SE (France, Oil, Gas & Consumable Fuels) | 3.4 | |
| BHP Group Ltd. (Australia, Metals & Mining) | 3.3 | |
| Toyota Motor Corp. (Japan, Automobiles) | 3.1 | |
| BP PLC (United Kingdom, Oil, Gas & Consumable Fuels) | 2.3 | |
| Sanofi SA (France, Pharmaceuticals) | 2.1 | |
| Hitachi Ltd. (Japan, Industrial Conglomerates) | 2.1 | |
| Glencore PLC (Bailiwick of Jersey, Metals & Mining) | 2.1 | |
| Zurich Insurance Group Ltd. (Switzerland, Insurance) | 2.0 | |
| AstraZeneca PLC (United Kingdom) (United Kingdom, Pharmaceuticals) | 2.0 | |
| 26.5 | ||
| Market Sectors (% of Fund's net assets) | ||
| Financials | 30.5 | |
| Industrials | 13.8 | |
| Energy | 13.3 | |
| Materials | 13.0 | |
| Health Care | 8.2 | |
| Consumer Discretionary | 6.2 | |
| Information Technology | 4.1 | |
| Utilities | 2.3 | |
| Communication Services | 2.0 | |
| Real Estate | 1.6 | |
| Consumer Staples | 1.1 | |
Asset Allocation (% of Fund's net assets) |
 |
Foreign investments - 96.1% |
Geographic Diversification (% of Fund's net assets) |
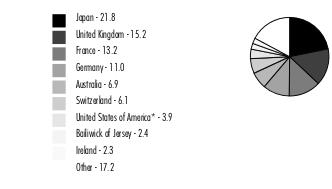 |
* Includes Short-Term investments and Net Other Assets (Liabilities). Percentages are based on country or territory of incorporation and are adjusted for the effect of futures contracts, if applicable. |
| Common Stocks - 95.2% | |||
| Shares | Value ($) | ||
| Australia - 6.9% | |||
| BHP Group Ltd. | 800,211 | 19,122,902 | |
| Macquarie Group Ltd. | 60,640 | 6,574,630 | |
| National Australia Bank Ltd. | 346,130 | 7,189,829 | |
| Woodside Energy Group Ltd. | 295,022 | 6,789,815 | |
TOTAL AUSTRALIA | 39,677,176 | ||
| Austria - 0.4% | |||
| Erste Group Bank AG | 88,807 | 2,188,644 | |
| Bailiwick of Jersey - 2.4% | |||
| Ferguson PLC | 16,816 | 1,833,964 | |
| Glencore PLC | 2,102,000 | 12,050,921 | |
TOTAL BAILIWICK OF JERSEY | 13,884,885 | ||
| Belgium - 1.1% | |||
| KBC Group NV | 92,616 | 4,641,521 | |
| UCB SA | 24,900 | 1,878,039 | |
TOTAL BELGIUM | 6,519,560 | ||
| Canada - 0.8% | |||
| Nutrien Ltd. | 56,200 | 4,748,546 | |
| Denmark - 0.9% | |||
| DSV A/S | 22,300 | 3,018,993 | |
| ORSTED A/S (a) | 24,800 | 2,046,143 | |
TOTAL DENMARK | 5,065,136 | ||
| Finland - 1.4% | |||
| Sampo Oyj (A Shares) | 172,434 | 7,886,478 | |
| France - 13.2% | |||
| Air Liquide SA | 56,470 | 7,387,053 | |
| ALTEN | 17,200 | 2,010,852 | |
| AXA SA | 423,905 | 10,468,295 | |
| BNP Paribas SA | 163,000 | 7,643,709 | |
| Capgemini SA | 25,993 | 4,260,015 | |
| Euroapi SASU (b) | 5,559 | 97,266 | |
| Sanofi SA | 143,179 | 12,321,679 | |
| Teleperformance | 10,500 | 2,815,178 | |
| TotalEnergies SE (c) | 359,505 | 19,612,208 | |
| VINCI SA | 63,900 | 5,881,166 | |
| Vivendi SA | 457,192 | 3,742,108 | |
TOTAL FRANCE | 76,239,529 | ||
| Germany - 10.1% | |||
| Bayer AG | 134,100 | 7,051,122 | |
| Deutsche Post AG | 120,700 | 4,266,724 | |
| Hannover Reuck SE | 43,200 | 7,035,708 | |
| Linde PLC | 25,814 | 7,720,809 | |
| Muenchener Rueckversicherungs-Gesellschaft AG in Muenchen | 18,600 | 4,909,955 | |
| Rheinmetall AG | 38,350 | 6,234,449 | |
| RWE AG | 175,900 | 6,777,756 | |
| Siemens AG | 98,839 | 10,794,112 | |
| Vonovia SE | 154,829 | 3,423,365 | |
TOTAL GERMANY | 58,214,000 | ||
| Hong Kong - 0.7% | |||
| AIA Group Ltd. | 526,600 | 3,988,887 | |
| India - 0.8% | |||
| Reliance Industries Ltd. sponsored GDR (a) | 80,500 | 4,914,525 | |
| Indonesia - 0.5% | |||
| PT Bank Rakyat Indonesia (Persero) Tbk | 9,956,894 | 2,968,396 | |
| Ireland - 2.3% | |||
| Bank of Ireland Group PLC | 446,000 | 3,215,781 | |
| CRH PLC | 185,302 | 6,674,181 | |
| Ryanair Holdings PLC sponsored ADR (b) | 53,800 | 3,706,282 | |
TOTAL IRELAND | 13,596,244 | ||
| Italy - 1.5% | |||
| Enel SpA | 949,100 | 4,239,961 | |
| Mediobanca SpA | 473,125 | 4,288,513 | |
TOTAL ITALY | 8,528,474 | ||
| Japan - 21.8% | |||
| DENSO Corp. | 119,100 | 5,909,257 | |
| FUJIFILM Holdings Corp. | 100,600 | 4,613,413 | |
| Fujitsu Ltd. | 25,500 | 2,933,993 | |
| Hitachi Ltd. | 265,600 | 12,074,757 | |
| Hoya Corp. | 59,300 | 5,533,391 | |
| Ibiden Co. Ltd. | 55,500 | 1,877,434 | |
| Idemitsu Kosan Co. Ltd. | 124,200 | 2,714,617 | |
| Itochu Corp. | 251,000 | 6,497,186 | |
| Minebea Mitsumi, Inc. | 221,770 | 3,287,139 | |
| Mitsubishi Estate Co. Ltd. | 214,600 | 2,698,659 | |
| Mitsubishi UFJ Financial Group, Inc. | 1,838,161 | 8,683,198 | |
| Mitsui Fudosan Co. Ltd. | 146,400 | 2,805,520 | |
| ORIX Corp. | 448,600 | 6,591,957 | |
| Recruit Holdings Co. Ltd. | 53,100 | 1,633,949 | |
| Renesas Electronics Corp. (b) | 452,288 | 3,783,729 | |
| Shin-Etsu Chemical Co. Ltd. | 65,500 | 6,807,412 | |
| Shiseido Co. Ltd. | 42,800 | 1,483,802 | |
| SoftBank Group Corp. | 107,000 | 4,593,106 | |
| Sony Group Corp. | 25,600 | 1,726,327 | |
| Sumitomo Mitsui Financial Group, Inc. | 235,000 | 6,599,168 | |
| Suzuki Motor Corp. | 148,930 | 5,027,934 | |
| TIS, Inc. | 90,101 | 2,432,869 | |
| Tokio Marine Holdings, Inc. | 436,744 | 7,903,952 | |
| Toyota Motor Corp. | 1,275,025 | 17,690,477 | |
TOTAL JAPAN | 125,903,246 | ||
| Korea (South) - 0.4% | |||
| Samsung Electronics Co. Ltd. | 55,200 | 2,297,228 | |
| Luxembourg - 0.6% | |||
| ArcelorMittal SA (Netherlands) | 142,786 | 3,196,808 | |
| Netherlands - 2.2% | |||
| Airbus Group NV | 42,700 | 4,620,301 | |
| NN Group NV | 148,568 | 6,291,337 | |
| Universal Music Group NV | 102,719 | 2,016,934 | |
TOTAL NETHERLANDS | 12,928,572 | ||
| Norway - 0.9% | |||
| Equinor ASA | 137,200 | 4,998,707 | |
| Singapore - 1.5% | |||
| United Overseas Bank Ltd. | 451,705 | 8,857,962 | |
| South Africa - 0.1% | |||
| Thungela Resources Ltd. | 36,281 | 554,206 | |
| Spain - 1.9% | |||
| Banco Santander SA (Spain) (c) | 3,300,682 | 8,552,699 | |
| Cellnex Telecom SA (a) | 47,200 | 1,544,868 | |
| Unicaja Banco SA (a) | 1,244,400 | 1,101,881 | |
TOTAL SPAIN | 11,199,448 | ||
| Sweden - 1.5% | |||
| Alleima AB (b) | 29,480 | 100,445 | |
| Investor AB (B Shares) | 390,040 | 6,371,374 | |
| Sandvik AB | 146,100 | 2,283,068 | |
TOTAL SWEDEN | 8,754,887 | ||
| Switzerland - 6.1% | |||
| Novartis AG | 67,550 | 5,464,171 | |
| Roche Holding AG (participation certificate) | 11,020 | 3,656,416 | |
| Swiss Life Holding AG | 8,673 | 4,199,868 | |
| UBS Group AG | 663,058 | 10,516,100 | |
| Zurich Insurance Group Ltd. | 26,711 | 11,383,533 | |
TOTAL SWITZERLAND | 35,220,088 | ||
| United Kingdom - 15.2% | |||
| Anglo American PLC (United Kingdom) | 252,192 | 7,554,214 | |
| AstraZeneca PLC (United Kingdom) | 96,912 | 11,370,897 | |
| BAE Systems PLC | 1,172,634 | 10,968,314 | |
| Beazley PLC | 457,000 | 3,272,927 | |
| BP PLC | 2,420,560 | 13,392,010 | |
| Imperial Brands PLC | 226,595 | 5,519,650 | |
| Lloyds Banking Group PLC | 10,146,164 | 4,872,877 | |
| Shell PLC ADR | 428,800 | 23,854,141 | |
| Standard Chartered PLC (United Kingdom) | 1,217,198 | 7,261,382 | |
TOTAL UNITED KINGDOM | 88,066,412 | ||
| TOTAL COMMON STOCKS (Cost $599,715,484) | 550,398,044 | ||
| Nonconvertible Preferred Stocks - 0.9% | |||
| Shares | Value ($) | ||
| Germany - 0.9% | |||
Porsche Automobil Holding SE (Germany) (Cost $6,860,848) | 95,800 | 5,352,566 | |
| Money Market Funds - 5.5% | |||
| Shares | Value ($) | ||
| Fidelity Cash Central Fund 3.10% (d) | 19,022,900 | 19,026,705 | |
| Fidelity Securities Lending Cash Central Fund 3.10% (d)(e) | 12,897,460 | 12,898,750 | |
| TOTAL MONEY MARKET FUNDS (Cost $31,925,455) | 31,925,455 | ||
| TOTAL INVESTMENT IN SECURITIES - 101.6% (Cost $638,501,787) | 587,676,065 |
NET OTHER ASSETS (LIABILITIES) - (1.6)% | (9,504,148) |
| NET ASSETS - 100.0% | 578,171,917 |
| (a) | Security exempt from registration under Rule 144A of the Securities Act of 1933. These securities may be resold in transactions exempt from registration, normally to qualified institutional buyers. At the end of the period, the value of these securities amounted to $9,607,417 or 1.7% of net assets. |
| (b) | Non-income producing |
| (c) | Security or a portion of the security is on loan at period end. |
| (d) | Affiliated fund that is generally available only to investment companies and other accounts managed by Fidelity Investments. The rate quoted is the annualized seven-day yield of the fund at period end. A complete unaudited listing of the fund's holdings as of its most recent quarter end is available upon request. In addition, each Fidelity Central Fund's financial statements, which are not covered by the Fund's Report of Independent Registered Public Accounting Firm, are available on the SEC's website or upon request. |
| (e) | Investment made with cash collateral received from securities on loan. |
| Affiliate | Value, beginning of period ($) | Purchases ($) | Sales Proceeds ($) | Dividend Income ($) | Realized Gain (loss) ($) | Change in Unrealized appreciation (depreciation) ($) | Value, end of period ($) | % ownership, end of period |
| Fidelity Cash Central Fund 3.10% | 6,277,780 | 304,087,313 | 291,338,388 | 215,536 | - | - | 19,026,705 | 0.0% |
| Fidelity Securities Lending Cash Central Fund 3.10% | - | 112,350,093 | 99,451,343 | 133,173 | - | - | 12,898,750 | 0.0% |
| Total | 6,277,780 | 416,437,406 | 390,789,731 | 348,709 | - | - | 31,925,455 | |
| Valuation Inputs at Reporting Date: | ||||
| Description | Total ($) | Level 1 ($) | Level 2 ($) | Level 3 ($) |
Investments in Securities: | ||||
| Equities: | ||||
Communication Services | 11,897,016 | - | 11,897,016 | - |
Consumer Discretionary | 35,706,561 | 5,027,934 | 30,678,627 | - |
Consumer Staples | 7,003,452 | 1,483,802 | 5,519,650 | - |
Energy | 76,830,229 | 38,827,304 | 38,002,925 | - |
Financials | 175,460,561 | 102,890,945 | 72,569,616 | - |
Health Care | 47,372,981 | 7,508,696 | 39,864,285 | - |
Industrials | 79,915,582 | 39,467,948 | 40,447,634 | - |
Information Technology | 24,209,533 | 13,231,796 | 10,977,737 | - |
Materials | 75,363,291 | 34,889,510 | 40,473,781 | - |
Real Estate | 8,927,544 | 2,805,520 | 6,122,024 | - |
Utilities | 13,063,860 | 6,777,756 | 6,286,104 | - |
| Money Market Funds | 31,925,455 | 31,925,455 | - | - |
| Total Investments in Securities: | 587,676,065 | 284,836,666 | 302,839,399 | - |
| Statement of Assets and Liabilities | ||||
| October 31, 2022 | ||||
| Assets | ||||
| Investment in securities, at value (including securities loaned of $11,417,417) - See accompanying schedule: | ||||
Unaffiliated issuers (cost $606,576,332) | $555,750,610 | |||
Fidelity Central Funds (cost $31,925,455) | 31,925,455 | |||
| Total Investment in Securities (cost $638,501,787) | $ | 587,676,065 | ||
| Foreign currency held at value (cost $37) | 37 | |||
| Receivable for fund shares sold | 553,794 | |||
| Dividends receivable | 1,770,616 | |||
| Reclaims receivable | 1,834,662 | |||
| Distributions receivable from Fidelity Central Funds | 33,183 | |||
| Prepaid expenses | 946 | |||
| Receivable from investment adviser for expense reductions | 14,550 | |||
Total assets | 591,883,853 | |||
| Liabilities | ||||
| Payable for fund shares redeemed | $244,787 | |||
| Accrued management fee | 386,328 | |||
| Distribution and service plan fees payable | 5,638 | |||
| Other affiliated payables | 102,770 | |||
| Other payables and accrued expenses | 73,663 | |||
| Collateral on securities loaned | 12,898,750 | |||
| Total Liabilities | 13,711,936 | |||
| Net Assets | $ | 578,171,917 | ||
| Net Assets consist of: | ||||
| Paid in capital | $ | 697,136,367 | ||
| Total accumulated earnings (loss) | (118,964,450) | |||
| Net Assets | $ | 578,171,917 | ||
| Net Asset Value and Maximum Offering Price | ||||
| Class A : | ||||
Net Asset Value and redemption price per share ($12,080,104 ÷ 1,580,987 shares) (a) | $ | 7.64 | ||
| Maximum offering price per share (100/94.25 of $7.64) | $ | 8.11 | ||
| Class M : | ||||
Net Asset Value and redemption price per share ($3,497,832 ÷ 458,215 shares) (a) | $ | 7.63 | ||
| Maximum offering price per share (100/96.50 of $7.63) | $ | 7.91 | ||
| Class C : | ||||
Net Asset Value and offering price per share ($2,189,510 ÷ 286,545 shares) (a) | $ | 7.64 | ||
| International Value : | ||||
Net Asset Value , offering price and redemption price per share ($367,477,684 ÷ 48,046,433 shares) | $ | 7.65 | ||
| Class I : | ||||
Net Asset Value , offering price and redemption price per share ($74,750,846 ÷ 9,757,656 shares) | $ | 7.66 | ||
| Class Z : | ||||
Net Asset Value , offering price and redemption price per share ($118,175,941 ÷ 15,428,699 shares) | $ | 7.66 | ||
(a)Redemption price per share is equal to net asset value less any applicable contingent deferred sales charge. | ||||
| Statement of Operations | ||||
Year ended October 31, 2022 | ||||
| Investment Income | ||||
| Dividends | $ | 20,777,554 | ||
| Non-Cash dividends | 2,255,133 | |||
| Income from Fidelity Central Funds (including $133,173 from security lending) | 348,709 | |||
| Income before foreign taxes withheld | 23,381,396 | |||
| Less foreign taxes withheld | (1,820,460) | |||
| Total Income | 21,560,936 | |||
| Expenses | ||||
| Management fee | ||||
| Basic fee | $ | 3,515,257 | ||
| Performance adjustment | 838,036 | |||
| Transfer agent fees | 863,032 | |||
| Distribution and service plan fees | 78,535 | |||
| Accounting fees | 260,386 | |||
| Custodian fees and expenses | 57,530 | |||
| Independent trustees' fees and expenses | 1,776 | |||
| Registration fees | 142,213 | |||
| Audit | 69,913 | |||
| Legal | 663 | |||
| Miscellaneous | 2,680 | |||
| Total expenses before reductions | 5,830,021 | |||
| Expense reductions | (395,200) | |||
| Total expenses after reductions | 5,434,821 | |||
| Net Investment income (loss) | 16,126,115 | |||
| Realized and Unrealized Gain (Loss) | ||||
| Net realized gain (loss) on: | ||||
| Investment Securities: | ||||
| Unaffiliated issuers | (28,540,923) | |||
| Foreign currency transactions | (75,439) | |||
| Total net realized gain (loss) | (28,616,362) | |||
| Change in net unrealized appreciation (depreciation) on: | ||||
| Investment Securities: | ||||
| Unaffiliated issuers | (91,955,008) | |||
| Assets and liabilities in foreign currencies | (248,070) | |||
| Total change in net unrealized appreciation (depreciation) | (92,203,078) | |||
| Net gain (loss) | (120,819,440) | |||
| Net increase (decrease) in net assets resulting from operations | $ | (104,693,325) | ||
| Statement of Changes in Net Assets | ||||
Year ended October 31, 2022 | Year ended October 31, 2021 | |||
| Increase (Decrease) in Net Assets | ||||
| Operations | ||||
| Net investment income (loss) | $ | 16,126,115 | $ | 18,097,505 |
| Net realized gain (loss) | (28,616,362) | 66,222,015 | ||
| Change in net unrealized appreciation (depreciation) | (92,203,078) | 94,524,515 | ||
| Net increase (decrease) in net assets resulting from operations | (104,693,325) | 178,844,035 | ||
| Distributions to shareholders | (17,928,873) | (9,153,610) | ||
| Share transactions - net increase (decrease) | 291,627,947 | (191,918,258) | ||
| Total increase (decrease) in net assets | 169,005,749 | (22,227,833) | ||
| Net Assets | ||||
| Beginning of period | 409,166,168 | 431,394,001 | ||
| End of period | $ | 578,171,917 | $ | 409,166,168 |
| Fidelity Advisor® International Value Fund Class A |
| Years ended October 31, | 2022 | 2021 | 2020 | 2019 | 2018 | |||||
Selected Per-Share Data | ||||||||||
| Net asset value, beginning of period | $ | 9.65 | $ | 6.87 | $ | 8.25 | $ | 8.13 | $ | 9.08 |
| Income from Investment Operations | ||||||||||
Net investment income (loss) A,B | .24 | .25 C | .13 | .25 | .21 | |||||
| Net realized and unrealized gain (loss) | (1.87) | 2.66 | (1.24) | .08 | (1.04) | |||||
| Total from investment operations | (1.63) | 2.91 | (1.11) | .33 | (.83) | |||||
| Distributions from net investment income | (.38) | (.13) | (.24) | (.21) | (.10) | |||||
| Distributions from net realized gain | - | - | (.03) | - | (.01) | |||||
| Total distributions | (.38) | (.13) | (.27) | (.21) | (.12) D | |||||
Redemption fees added to paid in capital A | - | - | - | - | - E | |||||
| Net asset value, end of period | $ | 7.64 | $ | 9.65 | $ | 6.87 | $ | 8.25 | $ | 8.13 |
Total Return F,G | (17.43)% | 42.56% | (14.01)% | 4.38% | (9.30)% | |||||
Ratios to Average Net Assets B,H,I | ||||||||||
| Expenses before reductions | 1.46% | 1.37% | 1.30% | 1.14% | 1.23% | |||||
| Expenses net of fee waivers, if any | 1.30% | 1.33% | 1.30% | 1.13% | 1.23% | |||||
| Expenses net of all reductions | 1.30% | 1.33% | 1.28% | 1.12% | 1.21% | |||||
| Net investment income (loss) | 2.85% | 2.77% C | 1.71% | 3.19% | 2.36% | |||||
| Supplemental Data | ||||||||||
| Net assets, end of period (000 omitted) | $ | 12,080 | $ | 10,566 | $ | 5,947 | $ | 7,806 | $ | 7,887 |
Portfolio turnover rate J | 25% | 29% K | 36% | 47% | 55% |
| Fidelity Advisor® International Value Fund Class M |
| Years ended October 31, | 2022 | 2021 | 2020 | 2019 | 2018 | |||||
Selected Per-Share Data | ||||||||||
| Net asset value, beginning of period | $ | 9.63 | $ | 6.86 | $ | 8.24 | $ | 8.11 | $ | 9.06 |
| Income from Investment Operations | ||||||||||
Net investment income (loss) A,B | .22 | .23 C | .11 | .23 | .18 | |||||
| Net realized and unrealized gain (loss) | (1.87) | 2.65 | (1.25) | .08 | (1.04) | |||||
| Total from investment operations | (1.65) | 2.88 | (1.14) | .31 | (.86) | |||||
| Distributions from net investment income | (.35) | (.11) | (.21) | (.18) | (.08) | |||||
| Distributions from net realized gain | - | - | (.03) | - | (.01) | |||||
| Total distributions | (.35) | (.11) | (.24) | (.18) | (.09) | |||||
Redemption fees added to paid in capital A | - | - | - | - | - D | |||||
| Net asset value, end of period | $ | 7.63 | $ | 9.63 | $ | 6.86 | $ | 8.24 | $ | 8.11 |
Total Return E,F | (17.65)% | 42.20% | (14.29)% | 4.11% | (9.59)% | |||||
Ratios to Average Net Assets B,G,H | ||||||||||
| Expenses before reductions | 1.72% | 1.62% | 1.57% | 1.44% | 1.56% | |||||
| Expenses net of fee waivers, if any | 1.55% | 1.58% | 1.57% | 1.43% | 1.55% | |||||
| Expenses net of all reductions | 1.55% | 1.58% | 1.55% | 1.42% | 1.54% | |||||
| Net investment income (loss) | 2.60% | 2.51% C | 1.44% | 2.89% | 2.04% | |||||
| Supplemental Data | ||||||||||
| Net assets, end of period (000 omitted) | $ | 3,498 | $ | 4,375 | $ | 2,884 | $ | 3,756 | $ | 3,920 |
Portfolio turnover rate I | 25% | 29% J | 36% | 47% | 55% |
| Fidelity Advisor® International Value Fund Class C |
| Years ended October 31, | 2022 | 2021 | 2020 | 2019 | 2018 | |||||
Selected Per-Share Data | ||||||||||
| Net asset value, beginning of period | $ | 9.60 | $ | 6.85 | $ | 8.22 | $ | 8.08 | $ | 9.04 |
| Income from Investment Operations | ||||||||||
Net investment income (loss) A,B | .18 | .18 C | .07 | .19 | .14 | |||||
| Net realized and unrealized gain (loss) | (1.87) | 2.65 | (1.24) | .08 | (1.04) | |||||
| Total from investment operations | (1.69) | 2.83 | (1.17) | .27 | (.90) | |||||
| Distributions from net investment income | (.27) | (.08) | (.17) | (.13) | (.04) | |||||
| Distributions from net realized gain | - | - | (.03) | - | (.01) | |||||
| Total distributions | (.27) | (.08) | (.20) | (.13) | (.06) D | |||||
Redemption fees added to paid in capital A | - | - | - | - | - E | |||||
| Net asset value, end of period | $ | 7.64 | $ | 9.60 | $ | 6.85 | $ | 8.22 | $ | 8.08 |
Total Return F,G | (18.01)% | 41.45% | (14.67)% | 3.53% | (10.06)% | |||||
Ratios to Average Net Assets B,H,I | ||||||||||
| Expenses before reductions | 2.23% | 2.12% | 2.07% | 1.93% | 2.04% | |||||
| Expenses net of fee waivers, if any | 2.05% | 2.09% | 2.07% | 1.92% | 2.04% | |||||
| Expenses net of all reductions | 2.05% | 2.09% | 2.05% | 1.91% | 2.02% | |||||
| Net investment income (loss) | 2.09% | 2.00% C | .94% | 2.40% | 1.55% | |||||
| Supplemental Data | ||||||||||
| Net assets, end of period (000 omitted) | $ | 2,190 | $ | 3,177 | $ | 2,947 | $ | 3,839 | $ | 5,339 |
Portfolio turnover rate J | 25% | 29% K | 36% | 47% | 55% |
| Fidelity® International Value Fund |
| Years ended October 31, | 2022 | 2021 | 2020 | 2019 | 2018 | |||||
Selected Per-Share Data | ||||||||||
| Net asset value, beginning of period | $ | 9.66 | $ | 6.87 | $ | 8.25 | $ | 8.14 | $ | 9.09 |
| Income from Investment Operations | ||||||||||
Net investment income (loss) A,B | .26 | .28 C | .15 | .28 | .24 | |||||
| Net realized and unrealized gain (loss) | (1.86) | 2.66 | (1.23) | .07 | (1.04) | |||||
| Total from investment operations | (1.60) | 2.94 | (1.08) | .35 | (.80) | |||||
| Distributions from net investment income | (.41) | (.15) | (.27) | (.24) | (.14) | |||||
| Distributions from net realized gain | - | - | (.03) | - | (.01) | |||||
| Total distributions | (.41) | (.15) | (.30) | (.24) | (.15) | |||||
Redemption fees added to paid in capital A | - | - | - | - | - D | |||||
| Net asset value, end of period | $ | 7.65 | $ | 9.66 | $ | 6.87 | $ | 8.25 | $ | 8.14 |
Total Return E | (17.20)% | 43.08% | (13.70)% | 4.65% | (8.95)% | |||||
Ratios to Average Net Assets B,F,G | ||||||||||
| Expenses before reductions | 1.13% | 1.01% | .94% | .79% | .89% | |||||
| Expenses net of fee waivers, if any | 1.05% | 1.01% | .94% | .78% | .89% | |||||
| Expenses net of all reductions | 1.05% | 1.01% | .92% | .78% | .87% | |||||
| Net investment income (loss) | 3.10% | 3.09% C | 2.07% | 3.54% | 2.70% | |||||
| Supplemental Data | ||||||||||
| Net assets, end of period (000 omitted) | $ | 367,478 | $ | 372,441 | $ | 406,661 | $ | 442,816 | $ | 433,015 |
Portfolio turnover rate H | 25% | 29% I | 36% | 47% | 55% |
| Fidelity Advisor® International Value Fund Class I |
| Years ended October 31, | 2022 | 2021 | 2020 | 2019 | 2018 | |||||
Selected Per-Share Data | ||||||||||
| Net asset value, beginning of period | $ | 9.67 | $ | 6.88 | $ | 8.26 | $ | 8.15 | $ | 9.10 |
| Income from Investment Operations | ||||||||||
Net investment income (loss) A,B | .25 | .28 C | .15 | .27 | .23 | |||||
| Net realized and unrealized gain (loss) | (1.86) | 2.66 | (1.24) | .08 | (1.04) | |||||
| Total from investment operations | (1.61) | 2.94 | (1.09) | .35 | (.81) | |||||
| Distributions from net investment income | (.40) | (.15) | (.26) | (.24) | (.13) | |||||
| Distributions from net realized gain | - | - | (.03) | - | (.01) | |||||
| Total distributions | (.40) | (.15) | (.29) | (.24) | (.14) | |||||
Redemption fees added to paid in capital A | - | - | - | - | - D | |||||
| Net asset value, end of period | $ | 7.66 | $ | 9.67 | $ | 6.88 | $ | 8.26 | $ | 8.15 |
Total Return E | (17.23)% | 43.05% | (13.75)% | 4.57% | (9.04)% | |||||
Ratios to Average Net Assets B,F,G | ||||||||||
| Expenses before reductions | 1.09% | 1.07% | .98% | .86% | .97% | |||||
| Expenses net of fee waivers, if any | 1.04% | 1.05% | .98% | .85% | .97% | |||||
| Expenses net of all reductions | 1.04% | 1.05% | .97% | .85% | .95% | |||||
| Net investment income (loss) | 3.10% | 3.05% C | 2.03% | 3.47% | 2.62% | |||||
| Supplemental Data | ||||||||||
| Net assets, end of period (000 omitted) | $ | 74,751 | $ | 6,661 | $ | 10,406 | $ | 8,495 | $ | 6,779 |
Portfolio turnover rate H | 25% | 29% I | 36% | 47% | 55% |
| Fidelity Advisor® International Value Fund Class Z |
| Years ended October 31, | 2022 | 2021 | 2020 | 2019 | 2018 A | |||||
Selected Per-Share Data | ||||||||||
| Net asset value, beginning of period | $ | 9.67 | $ | 6.87 | $ | 8.25 | $ | 8.14 | $ | 8.81 |
| Income from Investment Operations | ||||||||||
Net investment income (loss) B,C | .26 | .30 D | .16 | .29 | .01 | |||||
| Net realized and unrealized gain (loss) | (1.86) | 2.65 | (1.23) | .08 | (.68) | |||||
| Total from investment operations | (1.60) | 2.95 | (1.07) | .37 | (.67) | |||||
| Distributions from net investment income | (.41) | (.15) | (.28) | (.26) | - | |||||
| Distributions from net realized gain | - | - | (.03) | - | - | |||||
| Total distributions | (.41) | (.15) | (.31) | (.26) | - | |||||
Redemption fees added to paid in capital B | - | - | - | - | - E | |||||
| Net asset value, end of period | $ | 7.66 | $ | 9.67 | $ | 6.87 | $ | 8.25 | $ | 8.14 |
Total Return F,G | (17.13)% | 43.35% | (13.58)% | 4.84% | (7.60)% | |||||
Ratios to Average Net Assets C,H,I | ||||||||||
| Expenses before reductions | .94% | .89% | .82% | .67% | .84% J | |||||
| Expenses net of fee waivers, if any | .89% | .89% | .82% | .67% | .84% J | |||||
| Expenses net of all reductions | .89% | .89% | .81% | .66% | .82% J | |||||
| Net investment income (loss) | 3.25% | 3.21% D | 2.19% | 3.66% | 1.58% J | |||||
| Supplemental Data | ||||||||||
| Net assets, end of period (000 omitted) | $ | 118,176 | $ | 11,946 | $ | 2,549 | $ | 2,249 | $ | 92 |
Portfolio turnover rate K | 25% | 29% L | 36% | 47% | 55% J |
| Fidelity Central Fund | Investment Manager | Investment Objective | Investment Practices | Expense Ratio A |
| Fidelity Money Market Central Funds | Fidelity Management & Research Company LLC (FMR) | Each fund seeks to obtain a high level of current income consistent with the preservation of capital and liquidity. | Short-term Investments | Less than .005% |
| Gross unrealized appreciation | $27,058,895 |
| Gross unrealized depreciation | (89,328,898) |
| Net unrealized appreciation (depreciation) | $(62,270,003) |
| Tax Cost | $649,946,068 |
| Undistributed ordinary income | $10,851,727 |
| Capital loss carryforward | $(67,297,115) |
| Net unrealized appreciation (depreciation) on securities and other investments | $(62,519,062) |
Short-term | $(27,230,182) |
Long-term | (40,066,933) |
| Total capital loss carryforward | $(67,297,115) |
| October 31, 2022 | October 31, 2021 | |
| Ordinary Income | $17,928,873 | $9,153,610 |
| Total | $17,928,873 | $9,153,610 |
| Purchases ($) | Sales ($) | |
| Fidelity International Value Fund | 399,822,058 | 123,878,146 |
| Distribution Fee | Service Fee | Total Fees | Retained by FDC | |
| Class A | - % | .25% | $30,588 | $ 1,469 |
| Class M | .25% | .25% | 19,828 | - |
| Class C | .75% | .25% | 28,119 | 4,643 |
| $78,535 | $6,112 |
| Retained by FDC | |
| Class A | $8,708 |
| Class M | 168 |
Class C A | 182 |
| $9,058 |
| Amount | % of Class-Level Average Net Assets | |
| Class A | $32,618 | .27 |
| Class M | 10,638 | .27 |
| Class C | 7,591 | .27 |
| International Value | 716,271 | .18 |
| Class I | 70,960 | .19 |
| Class Z | 24,954 | .04 |
| $863,032 |
| % of Average Net Assets | |
| Fidelity International Value Fund | .05 |
| Amount | |
| Fidelity International Value Fund | $560 |
| Purchases ($) | Sales ($) | Realized Gain (Loss) ($) | |
| Fidelity International Value Fund | 11,685,318 | 3,379,263 | (554,303) |
| Shares | Total net realized gain or loss ($) | Total Proceeds ($) | Participating classes | |
| Fidelity International Value Fund | 25,377,058 | 57,480,336 | 238,544,345 | Class Z |
| Amount | |
| Fidelity International Value Fund | $874 |
| Total Security Lending Fees Paid to NFS | Security Lending Income From Securities Loaned to NFS | Value of Securities Loaned to NFS at Period End | |
| Fidelity International Value Fund | $14,184 | $- | $- |
| Expense Limitations | Reimbursement | |
| Class A | 1.30% | $19,858 |
| Class M | 1.55% | 6,708 |
| Class C | 2.05% | 4,939 |
| International Value | 1.05% | 302,884 |
| Class I | 1.05% | 15,990 |
| Class Z | .90% | 28,246 |
| $378,625 |
Year ended October 31, 2022 | Year ended October 31, 2021 | |
| Fidelity International Value Fund | ||
| Distributions to shareholders | ||
| Class A | $431,993 | $106,686 |
| Class M | 159,041 | 46,945 |
| Class C | 89,688 | 32,999 |
| International Value | 16,448,559 | 8,705,034 |
| Class I | 270,723 | 210,394 |
| Class Z | 528,869 | 51,552 |
Total | $17,928,873 | $9,153,610 |
| Shares | Shares | Dollars | Dollars | |
| Year ended October 31, 2022 | Year ended October 31, 2021 | Year ended October 31, 2022 | Year ended October 31, 2021 | |
| Fidelity International Value Fund | ||||
| Class A | ||||
| Shares sold | 816,905 | 379,781 | $ 7,279,150 | $ 3,507,076 |
| Reinvestment of distributions | 47,745 | 12,439 | 425,405 | 104,422 |
| Shares redeemed | (378,549) | (163,522) | (3,283,758) | (1,470,744) |
| Net increase (decrease) | 486,101 | 228,698 | $4,420,797 | $2,140,754 |
| Class M | ||||
| Shares sold | 71,311 | 71,451 | $ 629,674 | $ 640,857 |
| Reinvestment of distributions | 17,121 | 5,424 | 152,718 | 45,591 |
| Shares redeemed | (84,453) | (43,156) | (750,679) | (385,663) |
| Net increase (decrease) | 3,979 | 33,719 | $31,713 | $300,785 |
| Class C | ||||
| Shares sold | 59,969 | 92,170 | $543,223 | $842,206 |
| Reinvestment of distributions | 9,999 | 3,921 | 89,688 | 32,999 |
| Shares redeemed | (114,149) | (195,756) | (968,490) | (1,803,534) |
| Net increase (decrease) | (44,181) | (99,665) | $(335,579) | $(928,329) |
| International Value | ||||
| Shares sold | 32,895,367 | 13,959,911 | $280,320,847 | $129,814,337 |
| Reinvestment of distributions | 1,569,596 | 534,908 | 13,969,404 | 4,484,422 |
| Shares redeemed | (24,973,804) | (35,146,329) | (203,231,278) | (331,246,581) |
| Net increase (decrease) | 9,491,159 | (20,651,510) | $91,058,973 | $(196,947,822) |
| Class I | ||||
| Shares sold | 11,031,616 | 2,362,565 | $92,417,643 | $ 22,186,695 |
| Reinvestment of distributions | 29,506 | 24,378 | 263,195 | 204,597 |
| Shares redeemed | (1,992,300) | (3,211,043) | (15,704,798) | (29,755,410) |
| Net increase (decrease) | 9,068,822 | (824,100) | $76,976,040 | $7,364,118) |
| Class Z | ||||
| Shares sold | 17,947,816 | 28,776,748 | $150,148,371 | $272,875,410 |
| Reinvestment of distributions | 56,409 | 5,969 | 502,041 | 50,000 |
| Shares redeemed | (3,811,522) | (27,917,700) | (31,174,409) | (262,044,938) |
| Net increase (decrease) | 14,192,703 | 865,017 | $119,476,003 | $10,880,472 |
| Fund | % of shares held |
| Fidelity International Value Fund | 21% |
| The Example is based on an investment of $1,000 invested at the beginning of the period and held for the entire period (May 1, 2022 to October 31, 2022). |
Annualized Expense Ratio- A | Beginning Account Value May 1, 2022 | Ending Account Value October 31, 2022 | Expenses Paid During Period- C May 1, 2022 to October 31, 2022 | |||||||
| Fidelity® International Value Fund | ||||||||||
| Class A | 1.30% | |||||||||
| Actual | $ 1,000 | $ 887.30 | $ 6.18 | |||||||
Hypothetical- B | $ 1,000 | $ 1,018.65 | $ 6.61 | |||||||
| Class M | 1.55% | |||||||||
| Actual | $ 1,000 | $ 885.20 | $ 7.37 | |||||||
Hypothetical- B | $ 1,000 | $ 1,017.39 | $ 7.88 | |||||||
| Class C | 2.05% | |||||||||
| Actual | $ 1,000 | $ 883.20 | $ 9.73 | |||||||
Hypothetical- B | $ 1,000 | $ 1,014.87 | $ 10.41 | |||||||
| Fidelity® International Value Fund | 1.05% | |||||||||
| Actual | $ 1,000 | $ 888.50 | $ 5.00 | |||||||
Hypothetical- B | $ 1,000 | $ 1,019.91 | $ 5.35 | |||||||
| Class I | 1.05% | |||||||||
| Actual | $ 1,000 | $ 887.60 | $ 5.00 | |||||||
Hypothetical- B | $ 1,000 | $ 1,019.91 | $ 5.35 | |||||||
| Class Z | .90% | |||||||||
| Actual | $ 1,000 | $ 888.60 | $ 4.28 | |||||||
Hypothetical- B | $ 1,000 | $ 1,020.67 | $ 4.58 | |||||||
| Pay Date | Income | Taxes | |
| Fidelity International Value Fund | |||
| Class A | 12/06/21 | $0.4236 | $0.0416 |
| Class M | 12/06/21 | $0.3926 | $0.0416 |
| Class C | 12/06/21 | $0.3126 | $0.0416 |
| International Value | 12/06/21 | $0.4466 | $0.0416 |
| Class I | 12/06/21 | $0.4416 | $0.0416 |
| Class Z | 12/06/21 | $0.4526 | $0.0416 |
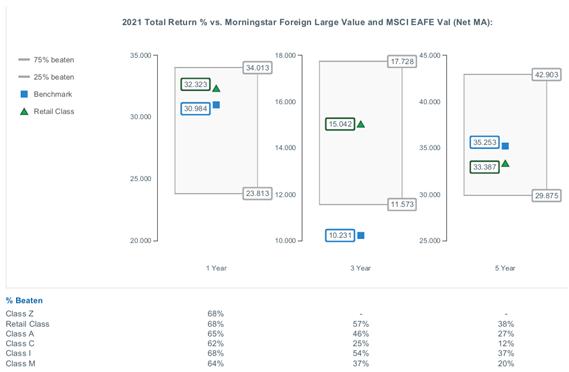
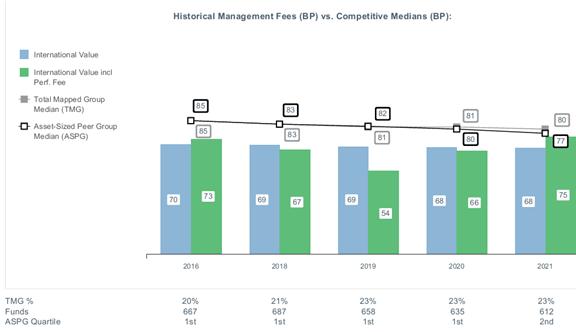
|


Contents
Board Approval of Investment Advisory Contracts and Management Fees |
| Average Annual Total Returns | |||
Periods ended October 31, 2022 | Past 1 year | Past 5 years | Past 10 years |
| Class A (incl.5.75% sales charge) | -32.14% | 1.73% | 5.37% |
| Class M (incl.3.50% sales charge) | -30.70% | 1.91% | 5.31% |
Class C (incl. contingent deferred sales charge) | -29.28% | 2.14% | 5.35% |
| Fidelity® International Growth Fund | -27.79% | 3.23% | 6.30% |
| Class I | -27.78% | 3.24% | 6.32% |
| Class Z | -27.68% | 3.37% | 6.45% |
| $10,000 Over 10 Years |
Let's say hypothetically that $10,000 was invested in Fidelity® International Growth Fund, a class of the fund, on October 31, 2012. The chart shows how the value of your investment would have changed, and also shows how the MSCI EAFE Growth Index performed over the same period. |
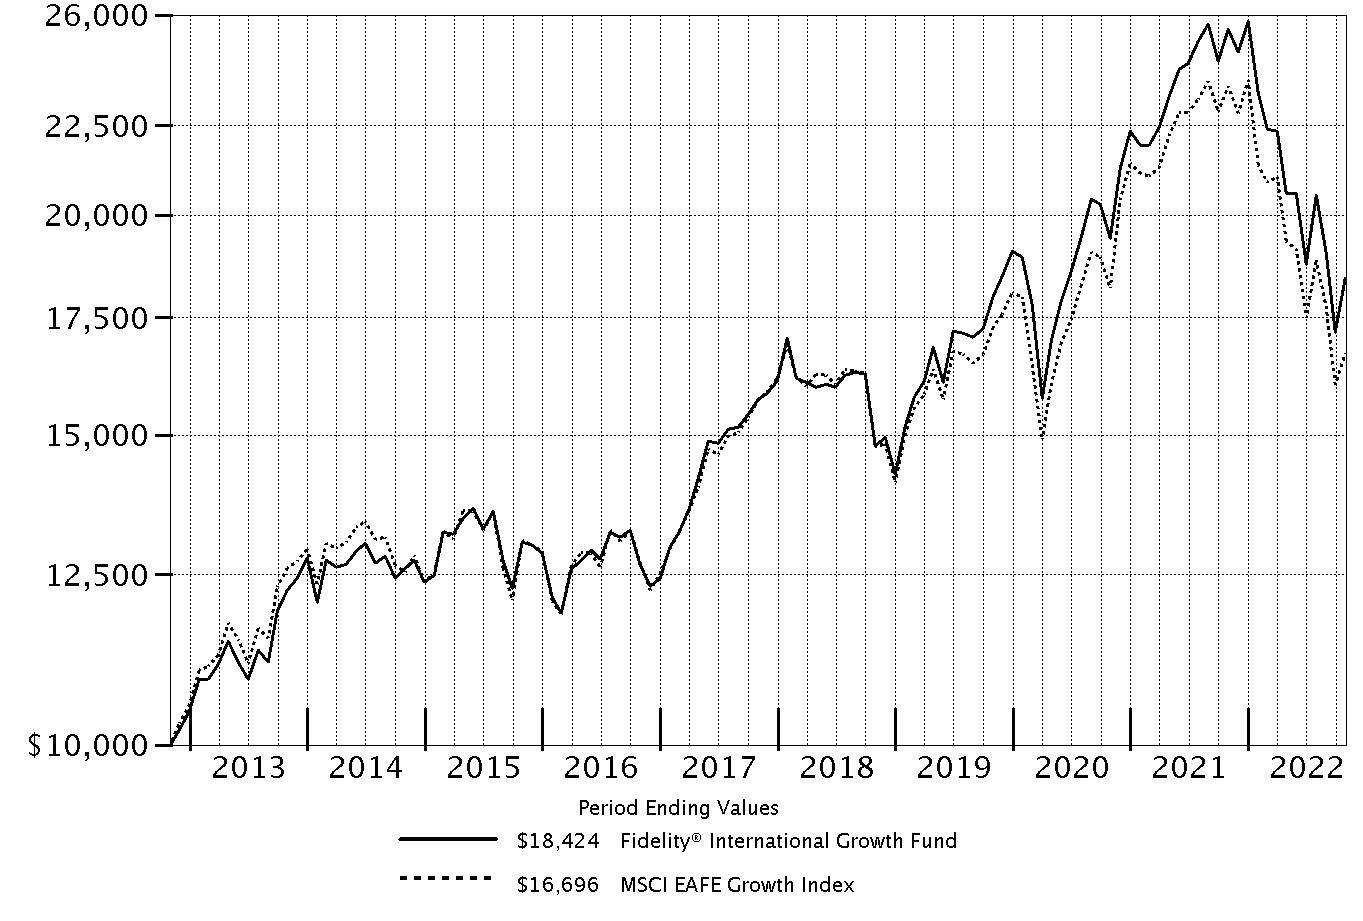 |
Top Holdings (% of Fund's net assets) | ||
| Nestle SA (Reg. S) (Switzerland, Food Products) | 5.7 | |
| ASML Holding NV (Netherlands) (Netherlands, Semiconductors & Semiconductor Equipment) | 4.8 | |
| LVMH Moet Hennessy Louis Vuitton SE (France, Textiles, Apparel & Luxury Goods) | 4.6 | |
| Roche Holding AG (participation certificate) (Switzerland, Pharmaceuticals) | 4.6 | |
| Linde PLC (Germany, Chemicals) | 3.6 | |
| Marsh & McLennan Companies, Inc. (United States of America, Insurance) | 3.2 | |
| Keyence Corp. (Japan, Electronic Equipment & Components) | 3.0 | |
| Atlas Copco AB (A Shares) (Sweden, Machinery) | 2.5 | |
| Amadeus IT Holding SA Class A (Spain, IT Services) | 2.5 | |
| Recruit Holdings Co. Ltd. (Japan, Professional Services) | 2.3 | |
| 36.8 | ||
| Market Sectors (% of Fund's net assets) | ||
| Industrials | 27.0 | |
| Information Technology | 21.2 | |
| Financials | 13.2 | |
| Consumer Discretionary | 9.7 | |
| Health Care | 9.6 | |
| Materials | 7.2 | |
| Consumer Staples | 6.3 | |
| Communication Services | 2.8 | |
| Energy | 1.0 | |
| Real Estate | 0.5 | |
Asset Allocation (% of Fund's net assets) |
 |
Foreign investments - 79.8% |
Geographic Diversification (% of Fund's net assets) |
 |
* Includes Short-Term investments and Net Other Assets (Liabilities). Percentages are based on country or territory of incorporation and are adjusted for the effect of futures contracts, if applicable. |
| Common Stocks - 98.2% | |||
| Shares | Value ($) | ||
| Bailiwick of Jersey - 1.6% | |||
| Experian PLC | 1,925,500 | 61,395,099 | |
| Belgium - 0.7% | |||
| Azelis Group NV | 542,793 | 12,423,376 | |
| UCB SA | 179,600 | 13,546,014 | |
TOTAL BELGIUM | 25,969,390 | ||
| Canada - 3.4% | |||
| CAE, Inc. (a) | 1,208,300 | 23,060,007 | |
| Canadian Pacific Railway Ltd. | 997,600 | 74,368,742 | |
| Franco-Nevada Corp. | 263,780 | 32,592,276 | |
TOTAL CANADA | 130,021,025 | ||
| Denmark - 0.9% | |||
| Vestas Wind Systems A/S | 1,729,400 | 34,092,815 | |
| Finland - 0.5% | |||
| Kone OYJ (B Shares) | 456,700 | 18,699,948 | |
| France - 9.8% | |||
| Edenred SA | 836,979 | 42,978,428 | |
| Lectra | 336,961 | 10,789,255 | |
| Legrand SA | 785,300 | 59,843,555 | |
| LVMH Moet Hennessy Louis Vuitton SE | 277,100 | 174,848,685 | |
| Safran SA | 727,600 | 81,032,802 | |
TOTAL FRANCE | 369,492,725 | ||
| Germany - 5.6% | |||
| Deutsche Borse AG | 350,500 | 56,998,229 | |
| Linde PLC | 449,979 | 134,585,958 | |
| Vonovia SE | 949,910 | 21,003,096 | |
TOTAL GERMANY | 212,587,283 | ||
| Hong Kong - 2.5% | |||
| AIA Group Ltd. | 10,988,000 | 83,231,837 | |
| Hong Kong Exchanges and Clearing Ltd. | 437,500 | 11,612,833 | |
TOTAL HONG KONG | 94,844,670 | ||
| India - 1.8% | |||
| Housing Development Finance Corp. Ltd. | 1,013,378 | 30,234,851 | |
| Kotak Mahindra Bank Ltd. | 863,600 | 19,842,039 | |
| Reliance Industries Ltd. | 320,000 | 9,855,907 | |
| Reliance Industries Ltd. sponsored GDR (b) | 140,900 | 8,601,945 | |
TOTAL INDIA | 68,534,742 | ||
| Ireland - 1.7% | |||
| CRH PLC sponsored ADR (c) | 1,811,366 | 65,589,563 | |
| Italy - 1.4% | |||
| Interpump Group SpA | 625,126 | 24,204,651 | |
| Prada SpA | 6,053,900 | 27,571,538 | |
TOTAL ITALY | 51,776,189 | ||
| Japan - 13.2% | |||
| Azbil Corp. | 1,601,470 | 43,565,326 | |
| FANUC Corp. | 209,700 | 27,439,587 | |
| Hoya Corp. | 786,700 | 73,408,403 | |
| Keyence Corp. | 302,148 | 114,442,149 | |
| Lasertec Corp. | 319,800 | 44,935,397 | |
| Misumi Group, Inc. | 2,323,985 | 49,700,880 | |
| OSG Corp. | 682,400 | 8,687,469 | |
| Recruit Holdings Co. Ltd. | 2,788,800 | 85,814,637 | |
| SHO-BOND Holdings Co. Ltd. | 630,200 | 27,294,045 | |
| USS Co. Ltd. | 1,546,600 | 23,371,399 | |
TOTAL JAPAN | 498,659,292 | ||
| Kenya - 0.5% | |||
| Safaricom Ltd. | 85,504,800 | 17,685,789 | |
| Netherlands - 8.0% | |||
| Aalberts Industries NV | 225,000 | 7,822,493 | |
| Airbus Group NV | 783,500 | 84,777,659 | |
| ASML Holding NV (Netherlands) | 386,900 | 181,489,823 | |
| IMCD NV | 226,600 | 29,402,987 | |
TOTAL NETHERLANDS | 303,492,962 | ||
| New Zealand - 0.3% | |||
| Auckland International Airport Ltd. (a) | 2,554,140 | 11,434,323 | |
| Norway - 0.6% | |||
| Adevinta ASA Class B (a) | 1,400,258 | 9,589,932 | |
| Schibsted ASA (B Shares) | 826,300 | 12,263,972 | |
TOTAL NORWAY | 21,853,904 | ||
| South Africa - 0.3% | |||
| Clicks Group Ltd. | 575,738 | 9,755,615 | |
| Spain - 3.1% | |||
| Amadeus IT Holding SA Class A (a) | 1,778,300 | 92,747,777 | |
| Cellnex Telecom SA (b) | 722,003 | 23,631,346 | |
TOTAL SPAIN | 116,379,123 | ||
| Sweden - 6.1% | |||
| ASSA ABLOY AB (B Shares) | 3,939,911 | 79,555,003 | |
| Atlas Copco AB (A Shares) (c) | 8,874,000 | 94,714,454 | |
| Epiroc AB (A Shares) (c) | 3,324,900 | 50,899,092 | |
| Lagercrantz Group AB (B Shares) | 429,100 | 3,682,319 | |
TOTAL SWEDEN | 228,850,868 | ||
| Switzerland - 10.7% | |||
| Nestle SA (Reg. S) | 1,961,649 | 213,542,762 | |
| Roche Holding AG (participation certificate) | 525,513 | 174,364,261 | |
| Schindler Holding AG: | |||
| (participation certificate) | 81,338 | 13,260,527 | |
| (Reg.) | 18,350 | 2,888,061 | |
TOTAL SWITZERLAND | 404,055,611 | ||
| Taiwan - 1.1% | |||
| Taiwan Semiconductor Manufacturing Co. Ltd. | 3,458,000 | 41,532,198 | |
| United Kingdom - 5.7% | |||
| BAE Systems PLC | 3,500,000 | 32,737,495 | |
| Compass Group PLC | 3,703,000 | 77,991,944 | |
| Dechra Pharmaceuticals PLC | 431,600 | 12,967,923 | |
| InterContinental Hotel Group PLC ADR (c) | 626,970 | 34,383,035 | |
| Rightmove PLC | 4,078,500 | 22,966,831 | |
| Spectris PLC | 993,957 | 34,424,071 | |
TOTAL UNITED KINGDOM | 215,471,299 | ||
| United States of America - 18.7% | |||
| Alphabet, Inc. Class A (a) | 214,720 | 20,293,187 | |
| Autoliv, Inc. | 379,469 | 30,490,334 | |
| Lam Research Corp. | 41,166 | 16,663,173 | |
| Marsh & McLennan Companies, Inc. | 741,351 | 119,720,773 | |
| MasterCard, Inc. Class A | 199,300 | 65,406,274 | |
| Moody's Corp. | 194,500 | 51,517,215 | |
| MSCI, Inc. | 155,800 | 73,048,388 | |
| NICE Ltd. sponsored ADR (a) | 277,700 | 52,732,453 | |
| NOV, Inc. | 910,000 | 20,384,000 | |
| Otis Worldwide Corp. | 305,000 | 21,545,200 | |
| PriceSmart, Inc. | 191,886 | 12,274,947 | |
| ResMed, Inc. | 382,400 | 85,539,056 | |
| S&P Global, Inc. | 159,200 | 51,143,000 | |
| Sherwin-Williams Co. | 181,700 | 40,887,951 | |
| Visa, Inc. Class A | 219,160 | 45,401,186 | |
TOTAL UNITED STATES OF AMERICA | 707,047,137 | ||
| TOTAL COMMON STOCKS (Cost $3,055,313,916) | 3,709,221,570 | ||
| Convertible Preferred Stocks - 0.3% | |||
| Shares | Value ($) | ||
| China - 0.3% | |||
ByteDance Ltd. Series E1 (a)(d)(e) (Cost $6,992,915) | 63,819 | 10,020,859 | |
| Money Market Funds - 1.5% | |||
| Shares | Value ($) | ||
| Fidelity Cash Central Fund 3.10% (f) | 21,702,459 | 21,706,800 | |
| Fidelity Securities Lending Cash Central Fund 3.10% (f)(g) | 34,810,217 | 34,813,698 | |
| TOTAL MONEY MARKET FUNDS (Cost $56,519,785) | 56,520,498 | ||
| TOTAL INVESTMENT IN SECURITIES - 100.0% (Cost $3,118,826,616) | 3,775,762,927 |
NET OTHER ASSETS (LIABILITIES) - 0.0% | (897,224) |
| NET ASSETS - 100.0% | 3,774,865,703 |
| (a) | Non-income producing |
| (b) | Security exempt from registration under Rule 144A of the Securities Act of 1933. These securities may be resold in transactions exempt from registration, normally to qualified institutional buyers. At the end of the period, the value of these securities amounted to $32,233,291 or 0.9% of net assets. |
| (c) | Security or a portion of the security is on loan at period end. |
| (d) | Restricted securities (including private placements) - Investment in securities not registered under the Securities Act of 1933 (excluding 144A issues). At the end of the period, the value of restricted securities (excluding 144A issues) amounted to $10,020,859 or 0.3% of net assets. |
| (e) | Level 3 security |
| (f) | Affiliated fund that is generally available only to investment companies and other accounts managed by Fidelity Investments. The rate quoted is the annualized seven-day yield of the fund at period end. A complete unaudited listing of the fund's holdings as of its most recent quarter end is available upon request. In addition, each Fidelity Central Fund's financial statements, which are not covered by the Fund's Report of Independent Registered Public Accounting Firm, are available on the SEC's website or upon request. |
| (g) | Investment made with cash collateral received from securities on loan. |
| Additional information on each restricted holding is as follows: | ||
| Security | Acquisition Date | Acquisition Cost ($) |
| ByteDance Ltd. Series E1 | 11/18/20 | 6,992,915 |
| Affiliate | Value, beginning of period ($) | Purchases ($) | Sales Proceeds ($) | Dividend Income ($) | Realized Gain (loss) ($) | Change in Unrealized appreciation (depreciation) ($) | Value, end of period ($) | % ownership, end of period |
| Fidelity Cash Central Fund 3.10% | 127,214,961 | 784,555,575 | 890,063,736 | 886,163 | - | - | 21,706,800 | 0.0% |
| Fidelity Securities Lending Cash Central Fund 3.10% | 70,248,753 | 641,355,599 | 676,790,654 | 177,440 | - | - | 34,813,698 | 0.1% |
| Total | 197,463,714 | 1,425,911,174 | 1,566,854,390 | 1,063,603 | - | - | 56,520,498 | |
| Valuation Inputs at Reporting Date: | ||||
| Description | Total ($) | Level 1 ($) | Level 2 ($) | Level 3 ($) |
Investments in Securities: | ||||
| Equities: | ||||
Communication Services | 106,431,057 | 59,832,880 | 46,598,177 | - |
Consumer Discretionary | 368,656,935 | 115,816,306 | 252,840,629 | - |
Consumer Staples | 235,573,324 | 22,030,562 | 213,542,762 | - |
Energy | 38,841,852 | 38,841,852 | - | - |
Financials | 497,349,165 | 345,506,266 | 151,842,899 | - |
Health Care | 359,825,657 | 185,461,396 | 174,364,261 | - |
Industrials | 1,017,094,907 | 306,092,761 | 711,002,146 | - |
Information Technology | 800,810,688 | 430,084,634 | 360,705,195 | 10,020,859 |
Materials | 273,655,748 | 273,655,748 | - | - |
Real Estate | 21,003,096 | - | 21,003,096 | - |
| Money Market Funds | 56,520,498 | 56,520,498 | - | - |
| Total Investments in Securities: | 3,775,762,927 | 1,833,842,903 | 1,931,899,165 | 10,020,859 |
| Statement of Assets and Liabilities | ||||
| October 31, 2022 | ||||
| Assets | ||||
| Investment in securities, at value (including securities loaned of $32,918,686) - See accompanying schedule: | ||||
Unaffiliated issuers (cost $3,062,306,831) | $3,719,242,429 | |||
Fidelity Central Funds (cost $56,519,785) | 56,520,498 | |||
| Total Investment in Securities (cost $3,118,826,616) | $ | 3,775,762,927 | ||
| Foreign currency held at value (cost $2,303,341) | 2,292,359 | |||
| Receivable for investments sold | 33,593,254 | |||
| Receivable for fund shares sold | 2,937,808 | |||
| Dividends receivable | 3,354,217 | |||
| Reclaims receivable | 10,577,295 | |||
| Distributions receivable from Fidelity Central Funds | 125,757 | |||
| Prepaid expenses | 6,394 | |||
Total assets | 3,828,650,011 | |||
| Liabilities | ||||
| Payable for investments purchased | $8,378,224 | |||
| Payable for fund shares redeemed | 6,514,763 | |||
| Accrued management fee | 2,595,998 | |||
| Distribution and service plan fees payable | 70,448 | |||
| Other affiliated payables | 582,919 | |||
| Other payables and accrued expenses | 828,961 | |||
| Collateral on securities loaned | 34,812,995 | |||
| Total Liabilities | 53,784,308 | |||
| Net Assets | $ | 3,774,865,703 | ||
| Net Assets consist of: | ||||
| Paid in capital | $ | 3,069,945,003 | ||
| Total accumulated earnings (loss) | 704,920,700 | |||
| Net Assets | $ | 3,774,865,703 | ||
| Net Asset Value and Maximum Offering Price | ||||
| Class A : | ||||
Net Asset Value and redemption price per share ($157,489,773 ÷ 10,577,276 shares) (a) | $ | 14.89 | ||
| Maximum offering price per share (100/94.25 of $14.89) | $ | 15.80 | ||
| Class M : | ||||
Net Asset Value and redemption price per share ($26,250,325 ÷ 1,775,156 shares) (a) | $ | 14.79 | ||
| Maximum offering price per share (100/96.50 of $14.79) | $ | 15.33 | ||
| Class C : | ||||
Net Asset Value and offering price per share ($33,574,802 ÷ 2,342,165 shares) (a) | $ | 14.33 | ||
| International Growth : | ||||
Net Asset Value , offering price and redemption price per share ($1,194,441,759 ÷ 79,369,637 shares) | $ | 15.05 | ||
| Class I : | ||||
Net Asset Value , offering price and redemption price per share ($1,373,849,856 ÷ 91,534,800 shares) | $ | 15.01 | ||
| Class Z : | ||||
Net Asset Value , offering price and redemption price per share ($989,259,188 ÷ 65,727,861 shares) | $ | 15.05 | ||
(a)Redemption price per share is equal to net asset value less any applicable contingent deferred sales charge. | ||||
| Statement of Operations | ||||
Year ended October 31, 2022 | ||||
| Investment Income | ||||
| Dividends | $ | 65,023,883 | ||
| Income from Fidelity Central Funds (including $177,440 from security lending) | 1,063,603 | |||
| Income before foreign taxes withheld | 66,087,486 | |||
| Less foreign taxes withheld | (5,636,348) | |||
| Total Income | 60,451,138 | |||
| Expenses | ||||
| Management fee | ||||
| Basic fee | $ | 31,014,398 | ||
| Performance adjustment | 5,688,467 | |||
| Transfer agent fees | 6,343,629 | |||
| Distribution and service plan fees | 1,096,374 | |||
| Accounting fees | 1,519,544 | |||
| Custodian fees and expenses | 308,535 | |||
| Independent trustees' fees and expenses | 16,011 | |||
| Registration fees | 258,740 | |||
| Audit | 78,176 | |||
| Legal | 6,231 | |||
| Miscellaneous | 21,285 | |||
| Total expenses before reductions | 46,351,390 | |||
| Expense reductions | (150,380) | |||
| Total expenses after reductions | 46,201,010 | |||
| Net Investment income (loss) | 14,250,128 | |||
| Realized and Unrealized Gain (Loss) | ||||
| Net realized gain (loss) on: | ||||
| Investment Securities: | ||||
| Unaffiliated issuers(net of foreign taxes of $9,469) | 86,142,556 | |||
| Foreign currency transactions | (309,841) | |||
| Total net realized gain (loss) | 85,832,715 | |||
| Change in net unrealized appreciation (depreciation) on: | ||||
| Investment Securities: | ||||
| Unaffiliated issuers (net of decrease in deferred foreign taxes of $877,671) | (1,634,527,918) | |||
| Assets and liabilities in foreign currencies | (1,148,574) | |||
| Total change in net unrealized appreciation (depreciation) | (1,635,676,492) | |||
| Net gain (loss) | (1,549,843,777) | |||
| Net increase (decrease) in net assets resulting from operations | $ | (1,535,593,649) | ||
| Statement of Changes in Net Assets | ||||
Year ended October 31, 2022 | Year ended October 31, 2021 | |||
| Increase (Decrease) in Net Assets | ||||
| Operations | ||||
| Net investment income (loss) | $ | 14,250,128 | $ | 4,242,975 |
| Net realized gain (loss) | 85,832,715 | 264,105,804 | ||
| Change in net unrealized appreciation (depreciation) | (1,635,676,492) | 1,069,199,466 | ||
| Net increase (decrease) in net assets resulting from operations | (1,535,593,649) | 1,337,548,245 | ||
| Distributions to shareholders | (105,083,685) | (6,966,212) | ||
| Share transactions - net increase (decrease) | (1,611,089) | (198,851,542) | ||
| Total increase (decrease) in net assets | (1,642,288,423) | 1,131,730,491 | ||
| Net Assets | ||||
| Beginning of period | 5,417,154,126 | 4,285,423,635 | ||
| End of period | $ | 3,774,865,703 | $ | 5,417,154,126 |
| Fidelity Advisor® International Growth Fund Class A |
| Years ended October 31, | 2022 | 2021 | 2020 | 2019 | 2018 | |||||
Selected Per-Share Data | ||||||||||
| Net asset value, beginning of period | $ | 21.04 | $ | 16.06 | $ | 15.03 | $ | 12.47 | $ | 13.34 |
| Income from Investment Operations | ||||||||||
Net investment income (loss) A,B | - C | (.04) | (.01) | .15 | .09 | |||||
| Net realized and unrealized gain (loss) | (5.80) | 5.02 | 1.16 | 2.48 | (.90) | |||||
| Total from investment operations | (5.80) | 4.98 | 1.15 | 2.63 | (.81) | |||||
| Distributions from net investment income | (.03) | - | (.12) | (.07) | (.04) | |||||
| Distributions from net realized gain | (.32) | - | - | - | (.02) | |||||
| Total distributions | (.35) | - | (.12) | (.07) | (.06) | |||||
| Net asset value, end of period | $ | 14.89 | $ | 21.04 | $ | 16.06 | $ | 15.03 | $ | 12.47 |
Total Return D,E | (28.00)% | 31.01% | 7.66% | 21.25% | (6.12)% | |||||
Ratios to Average Net Assets B,F,G | ||||||||||
| Expenses before reductions | 1.30% | 1.28% | 1.30% | 1.28% | 1.24% | |||||
| Expenses net of fee waivers, if any | 1.30% | 1.28% | 1.30% | 1.28% | 1.23% | |||||
| Expenses net of all reductions | 1.30% | 1.28% | 1.29% | 1.27% | 1.22% | |||||
| Net investment income (loss) | .02% | (.20)% | (.08)% | 1.14% | .64% | |||||
| Supplemental Data | ||||||||||
| Net assets, end of period (000 omitted) | $ | 157,490 | $ | 232,527 | $ | 174,561 | $ | 164,247 | $ | 138,802 |
Portfolio turnover rate H | 22% | 21% | 23% | 21% | 34% |
| Fidelity Advisor® International Growth Fund Class M |
| Years ended October 31, | 2022 | 2021 | 2020 | 2019 | 2018 | |||||
Selected Per-Share Data | ||||||||||
| Net asset value, beginning of period | $ | 20.92 | $ | 16.01 | $ | 14.99 | $ | 12.43 | $ | 13.30 |
| Income from Investment Operations | ||||||||||
Net investment income (loss) A,B | (.04) | (.09) | (.06) | .11 | .05 | |||||
| Net realized and unrealized gain (loss) | (5.77) | 5.00 | 1.15 | 2.48 | (.90) | |||||
| Total from investment operations | (5.81) | 4.91 | 1.09 | 2.59 | (.85) | |||||
| Distributions from net investment income | - | - | (.07) | (.03) | (.01) | |||||
| Distributions from net realized gain | (.32) | - | - | - | (.02) | |||||
| Total distributions | (.32) | - | (.07) | (.03) | (.02) C | |||||
| Net asset value, end of period | $ | 14.79 | $ | 20.92 | $ | 16.01 | $ | 14.99 | $ | 12.43 |
Total Return D,E | (28.18)% | 30.67% | 7.27% | 20.92% | (6.40)% | |||||
Ratios to Average Net Assets B,F,G | ||||||||||
| Expenses before reductions | 1.57% | 1.55% | 1.59% | 1.58% | 1.54% | |||||
| Expenses net of fee waivers, if any | 1.57% | 1.55% | 1.59% | 1.58% | 1.53% | |||||
| Expenses net of all reductions | 1.57% | 1.55% | 1.58% | 1.58% | 1.52% | |||||
| Net investment income (loss) | (.25)% | (.48)% | (.37)% | .83% | .34% | |||||
| Supplemental Data | ||||||||||
| Net assets, end of period (000 omitted) | $ | 26,250 | $ | 38,761 | $ | 30,353 | $ | 28,534 | $ | 26,479 |
Portfolio turnover rate H | 22% | 21% | 23% | 21% | 34% |
| Fidelity Advisor® International Growth Fund Class C |
| Years ended October 31, | 2022 | 2021 | 2020 | 2019 | 2018 | |||||
Selected Per-Share Data | ||||||||||
| Net asset value, beginning of period | $ | 20.39 | $ | 15.68 | $ | 14.68 | $ | 12.20 | $ | 13.10 |
| Income from Investment Operations | ||||||||||
Net investment income (loss) A,B | (.13) | (.18) | (.13) | .05 | (.01) | |||||
| Net realized and unrealized gain (loss) | (5.61) | 4.89 | 1.13 | 2.43 | (.89) | |||||
| Total from investment operations | (5.74) | 4.71 | 1.00 | 2.48 | (.90) | |||||
| Distributions from net realized gain | (.32) | - | - | - | - | |||||
| Total distributions | (.32) | - | - | - | - | |||||
| Net asset value, end of period | $ | 14.33 | $ | 20.39 | $ | 15.68 | $ | 14.68 | $ | 12.20 |
Total Return C,D | (28.58)% | 30.04% | 6.81% | 20.33% | (6.87)% | |||||
Ratios to Average Net Assets B,E,F | ||||||||||
| Expenses before reductions | 2.07% | 2.05% | 2.07% | 2.04% | 1.99% | |||||
| Expenses net of fee waivers, if any | 2.06% | 2.05% | 2.07% | 2.04% | 1.99% | |||||
| Expenses net of all reductions | 2.06% | 2.05% | 2.06% | 2.03% | 1.98% | |||||
| Net investment income (loss) | (.74)% | (.97)% | (.85)% | .38% | (.11)% | |||||
| Supplemental Data | ||||||||||
| Net assets, end of period (000 omitted) | $ | 33,575 | $ | 58,867 | $ | 55,013 | $ | 57,291 | $ | 60,489 |
Portfolio turnover rate G | 22% | 21% | 23% | 21% | 34% |
| Fidelity® International Growth Fund |
| Years ended October 31, | 2022 | 2021 | 2020 | 2019 | 2018 | |||||
Selected Per-Share Data | ||||||||||
| Net asset value, beginning of period | $ | 21.26 | $ | 16.20 | $ | 15.16 | $ | 12.57 | $ | 13.45 |
| Income from Investment Operations | ||||||||||
Net investment income (loss) A,B | .05 | .02 | .03 | .19 | .13 | |||||
| Net realized and unrealized gain (loss) | (5.85) | 5.06 | 1.17 | 2.51 | (.92) | |||||
| Total from investment operations | (5.80) | 5.08 | 1.20 | 2.70 | (.79) | |||||
| Distributions from net investment income | (.09) | (.02) | (.16) | (.11) | (.08) | |||||
| Distributions from net realized gain | (.32) | - | - | - | (.02) | |||||
| Total distributions | (.41) | (.02) | (.16) | (.11) | (.09) C | |||||
| Net asset value, end of period | $ | 15.05 | $ | 21.26 | $ | 16.20 | $ | 15.16 | $ | 12.57 |
Total Return D | (27.79)% | 31.38% | 7.93% | 21.66% | (5.89)% | |||||
Ratios to Average Net Assets B,E,F | ||||||||||
| Expenses before reductions | 1.01% | .99% | 1.01% | .99% | .95% | |||||
| Expenses net of fee waivers, if any | 1.01% | .99% | 1.01% | .99% | .95% | |||||
| Expenses net of all reductions | 1.01% | .99% | 1.00% | .99% | .94% | |||||
| Net investment income (loss) | .31% | .09% | .21% | 1.42% | .93% | |||||
| Supplemental Data | ||||||||||
| Net assets, end of period (000 omitted) | $ | 1,194,442 | $ | 1,773,433 | $ | 1,292,392 | $ | 1,040,532 | $ | 811,101 |
Portfolio turnover rate G | 22% | 21% | 23% | 21% | 34% |
| Fidelity Advisor® International Growth Fund Class I |
| Years ended October 31, | 2022 | 2021 | 2020 | 2019 | 2018 | |||||
Selected Per-Share Data | ||||||||||
| Net asset value, beginning of period | $ | 21.20 | $ | 16.16 | $ | 15.13 | $ | 12.55 | $ | 13.43 |
| Income from Investment Operations | ||||||||||
Net investment income (loss) A,B | .05 | .01 | .03 | .20 | .13 | |||||
| Net realized and unrealized gain (loss) | (5.83) | 5.05 | 1.16 | 2.49 | (.91) | |||||
| Total from investment operations | (5.78) | 5.06 | 1.19 | 2.69 | (.78) | |||||
| Distributions from net investment income | (.09) | (.02) | (.16) | (.11) | (.09) | |||||
| Distributions from net realized gain | (.32) | - | - | - | (.02) | |||||
| Total distributions | (.41) | (.02) | (.16) | (.11) | (.10) C | |||||
| Net asset value, end of period | $ | 15.01 | $ | 21.20 | $ | 16.16 | $ | 15.13 | $ | 12.55 |
Total Return D | (27.78)% | 31.36% | 7.90% | 21.64% | (5.83)% | |||||
Ratios to Average Net Assets B,E,F | ||||||||||
| Expenses before reductions | 1.02% | 1.00% | 1.01% | .97% | .93% | |||||
| Expenses net of fee waivers, if any | 1.02% | 1.00% | 1.01% | .97% | .93% | |||||
| Expenses net of all reductions | 1.02% | 1.00% | 1.00% | .97% | .92% | |||||
| Net investment income (loss) | .30% | .07% | .21% | 1.44% | .94% | |||||
| Supplemental Data | ||||||||||
| Net assets, end of period (000 omitted) | $ | 1,373,850 | $ | 2,035,690 | $ | 1,382,837 | $ | 953,360 | $ | 660,961 |
Portfolio turnover rate G | 22% | 21% | 23% | 21% | 34% |
| Fidelity Advisor® International Growth Fund Class Z |
| Years ended October 31, | 2022 | 2021 | 2020 | 2019 | 2018 | |||||
Selected Per-Share Data | ||||||||||
| Net asset value, beginning of period | $ | 21.25 | $ | 16.19 | $ | 15.16 | $ | 12.57 | $ | 13.45 |
| Income from Investment Operations | ||||||||||
Net investment income (loss) A,B | .08 | .04 | .05 | .22 | .15 | |||||
| Net realized and unrealized gain (loss) | (5.85) | 5.06 | 1.16 | 2.50 | (.91) | |||||
| Total from investment operations | (5.77) | 5.10 | 1.21 | 2.72 | (.76) | |||||
| Distributions from net investment income | (.11) | (.04) | (.18) | (.13) | (.10) | |||||
| Distributions from net realized gain | (.32) | - | - | - | (.02) | |||||
| Total distributions | (.43) | (.04) | (.18) | (.13) | (.12) | |||||
| Net asset value, end of period | $ | 15.05 | $ | 21.25 | $ | 16.19 | $ | 15.16 | $ | 12.57 |
Total Return C | (27.68)% | 31.55% | 8.01% | 21.85% | (5.71)% | |||||
Ratios to Average Net Assets A,D,E | ||||||||||
| Expenses before reductions | .89% | .87% | .88% | .84% | .80% | |||||
| Expenses net of fee waivers, if any | .89% | .87% | .88% | .84% | .80% | |||||
| Expenses net of all reductions | .89% | .87% | .87% | .84% | .79% | |||||
| Net investment income (loss) | .43% | .20% | .34% | 1.57% | 1.08% | |||||
| Supplemental Data | ||||||||||
| Net assets, end of period (000 omitted) | $ | 989,259 | $ | 1,277,877 | $ | 1,350,267 | $ | 1,082,899 | $ | 556,558 |
Portfolio turnover rate F | 22% | 21% | 23% | 21% | 34% |
| Fidelity Central Fund | Investment Manager | Investment Objective | Investment Practices | Expense Ratio A |
| Fidelity Money Market Central Funds | Fidelity Management & Research Company LLC (FMR) | Each fund seeks to obtain a high level of current income consistent with the preservation of capital and liquidity. | Short-term Investments | Less than .005% |
| Gross unrealized appreciation | $ 977,369,557 |
| Gross unrealized depreciation | (333,660,893) |
| Net unrealized appreciation (depreciation) | $ 643,708,664 |
| Tax Cost | $3,132,054,263 |
| Undistributed ordinary income | $8,718,742 |
| Undistributed long-term capital gain | $54,017,833 |
| Net unrealized appreciation (depreciation) on securities and other investments | $642,836,722 |
| October 31, 2022 | October 31, 2021 | |
| Ordinary Income | $ 23,472,059 | $6,966,212 |
| Long-term Capital Gains | 81,611,626 | - |
| Total | $ 105,083,685 | $6,966,212 |
| Purchases ($) | Sales ($) | |
| Fidelity International Growth Fund | 974,699,561 | 991,019,558 |
| Distribution Fee | Service Fee | Total Fees | Retained by FDC | |
| Class A | - % | .25% | $475,730 | $11,569 |
| Class M | .25% | .25% | 159,332 | 436 |
| Class C | .75% | .25% | 461,312 | 37,953 |
| $1,096,374 | $49,958 |
| Retained by FDC | |
| Class A | $45,870 |
| Class M | 3,254 |
Class C A | 560 |
| $49,684 |
| Amount | % of Class-Level Average Net Assets | |
| Class A | $386,250 | .20 |
| Class M | 71,518 | .22 |
| Class C | 99,948 | .22 |
| International Growth | 2,406,210 | .16 |
| Class I | 2,910,795 | .17 |
| Class Z | 468,908 | .04 |
| $6,343,629 |
| % of Average Net Assets | |
| Fidelity International Growth Fund | .03 |
| Amount | |
| Fidelity International Growth Fund | $1,841 |
| Purchases ($) | Sales ($) | Realized Gain (Loss) ($) | |
| Fidelity International Growth Fund | 51,599,575 | 45,593,152 | 1,366,611 |
| Amount ($) | |
| Fidelity International Growth Fund | 1,006 |
| Amount | |
| Fidelity International Growth Fund | $8,073 |
| Total Security Lending Fees Paid to NFS | Security Lending Income From Securities Loaned to NFS | Value of Securities Loaned to NFS at Period End | |
| Fidelity International Growth Fund | $19,069 | $- | $- |
Year ended October 31, 2022 | Year ended October 31, 2021 | |
| Fidelity International Growth Fund | ||
| Distributions to shareholders | ||
| Class A | $3,874,293 | $- |
| Class M | 584,059 | - |
| Class C | 921,429 | - |
| International Growth | 34,022,956 | 1,609,059 |
| Class I | 39,437,200 | 2,023,232 |
| Class Z | 26,243,748 | 3,333,921 |
Total | $105,083,685 | $6,966,212 |
| Shares | Shares | Dollars | Dollars | |
| Year ended October 31, 2022 | Year ended October 31, 2021 | Year ended October 31, 2022 | Year ended October 31, 2021 | |
| Fidelity International Growth Fund | ||||
| Class A | ||||
| Shares sold | 1,571,011 | 2,385,837 | $27,633,662 | $46,164,018 |
| Reinvestment of distributions | 192,594 | - | 3,867,288 | - |
| Shares redeemed | (2,239,322) | (2,203,020) | (38,758,166) | (42,705,074) |
| Net increase (decrease) | (475,717) | 182,817 | $(7,257,216) | $3,458,944 |
| Class M | ||||
| Shares sold | 182,229 | 258,454 | $ 3,218,457 | $ 4,902,416 |
| Reinvestment of distributions | 29,196 | - | 583,619 | - |
| Shares redeemed | (289,342) | (301,262) | (4,956,089) | (5,742,842) |
| Net increase (decrease) | (77,917) | (42,808) | $(1,154,013) | $(840,426) |
| Class C | ||||
| Shares sold | 235,265 | 395,788 | $ 4,302,683 | $ 7,361,117 |
| Reinvestment of distributions | 47,271 | - | 919,894 | - |
| Shares redeemed | (828,106) | (1,016,374) | (13,580,412) | (19,296,231) |
| Net increase (decrease) | (545,570) | (620,586) | $ (8,357,835) | $ (11,935,114) |
| International Growth | ||||
| Shares sold | 16,241,408 | 22,536,813 | $ 290,344,779 | $ 438,331,710 |
| Reinvestment of distributions | 1,547,748 | 82,672 | 31,326,431 | 1,489,742 |
| Shares redeemed | (21,846,639) | (18,982,578) | (372,519,642) | (366,283,627) |
| Net increase (decrease) | (4,057,483) | 3,636,907 | $ (50,848,432) | $ 73,537,825 |
| Class I | ||||
| Shares sold | 27,427,945 | 30,921,252 | $ 483,250,347 | $ 598,549,169 |
| Reinvestment of distributions | 1,891,163 | 107,536 | 38,182,588 | 1,933,497 |
| Shares redeemed | (33,802,275) | (20,585,127) | (571,344,966) | (404,458,678) |
| Net increase (decrease) | (4,483,167) | 10,443,661 | $ (49,912,031) | $ 196,023,988 |
| Class Z | ||||
| Shares sold | 45,989,188 | 15,802,092 | $ 767,374,148 | $ 310,522,031 |
| Reinvestment of distributions | 542,351 | 105,898 | 10,966,334 | 1,906,164 |
| Shares redeemed | (40,926,928) | (39,162,372) | (662,422,044) | (771,524,954) |
| Net increase (decrease) | 5,604,611 | (23,254,382) | $115,918,438 | $ (459,096,759) |
| The Example is based on an investment of $1,000 invested at the beginning of the period and held for the entire period (May 1, 2022 to October 31, 2022). |
Annualized Expense Ratio- A | Beginning Account Value May 1, 2022 | Ending Account Value October 31, 2022 | Expenses Paid During Period- C May 1, 2022 to October 31, 2022 | |||||||
| Fidelity® International Growth Fund | ||||||||||
| Class A | 1.29% | |||||||||
| Actual | $ 1,000 | $ 892.70 | $ 6.15 | |||||||
Hypothetical- B | $ 1,000 | $ 1,018.70 | $ 6.56 | |||||||
| Class M | 1.56% | |||||||||
| Actual | $ 1,000 | $ 892.00 | $ 7.44 | |||||||
Hypothetical- B | $ 1,000 | $ 1,017.34 | $ 7.93 | |||||||
| Class C | 2.05% | |||||||||
| Actual | $ 1,000 | $ 889.00 | $ 9.76 | |||||||
Hypothetical- B | $ 1,000 | $ 1,014.87 | $ 10.41 | |||||||
| Fidelity® International Growth Fund | 1.00% | |||||||||
| Actual | $ 1,000 | $ 894.20 | $ 4.77 | |||||||
Hypothetical- B | $ 1,000 | $ 1,020.16 | $ 5.09 | |||||||
| Class I | 1.00% | |||||||||
| Actual | $ 1,000 | $ 894.00 | $ 4.77 | |||||||
Hypothetical- B | $ 1,000 | $ 1,020.16 | $ 5.09 | |||||||
| Class Z | .87% | |||||||||
| Actual | $ 1,000 | $ 894.80 | $ 4.16 | |||||||
Hypothetical- B | $ 1,000 | $ 1,020.82 | $ 4.43 | |||||||
| Pay Date | Income | Taxes | |
| Fidelity International Growth Fund | |||
| Class A | 12/06/21 | $0.0620 | $0.0280 |
| Class M | 12/06/21 | $0.0000 | $0.0000 |
| Class C | 12/06/21 | $0.0000 | $0.0000 |
| International Growth | 12/06/21 | $0.1190 | $0.0280 |
| Class I | 12/06/21 | $0.1170 | $0.0280 |
| Class Z | 12/06/21 | $0.1390 | $0.0280 |
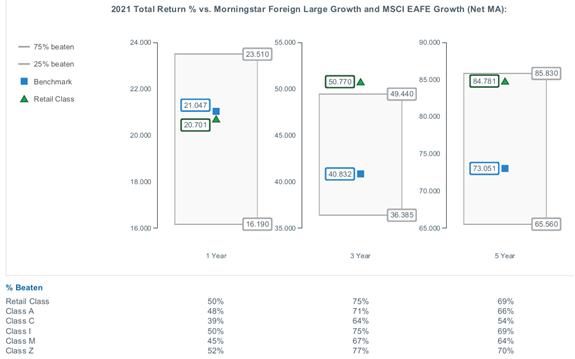
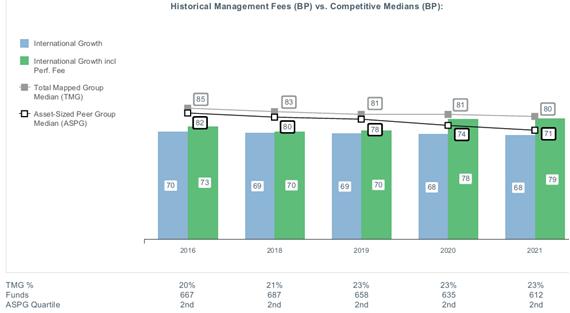
|


Contents
Board Approval of Investment Advisory Contracts and Management Fees |
| Average Annual Total Returns | |||
Periods ended October 31, 2022 | Past 1 year | Past 5 years | Past 10 years |
| Fidelity® Diversified International Fund | -29.36% | 1.05% | 5.14% |
| Class K | -29.31% | 1.15% | 5.27% |
| $10,000 Over 10 Years |
Let's say hypothetically that $10,000 was invested in Fidelity® Diversified International Fund, a class of the fund, on October 31, 2012. The chart shows how the value of your investment would have changed, and also shows how the MSCI EAFE Index performed over the same period. |
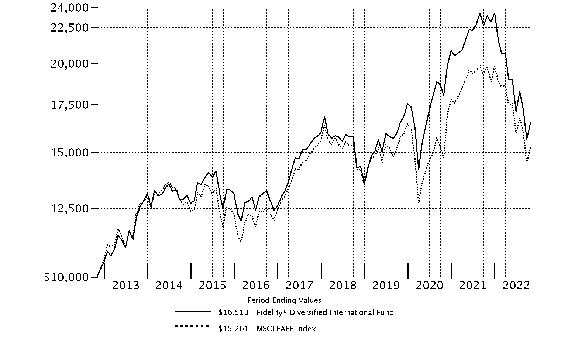 |
Top Holdings (% of Fund's net assets) | ||
| Roche Holding AG (participation certificate) (Switzerland, Pharmaceuticals) | 3.4 | |
| Nestle SA (Reg. S) (Switzerland, Food Products) | 3.1 | |
| ASML Holding NV (Netherlands, Semiconductors & Semiconductor Equipment) | 2.6 | |
| LVMH Moet Hennessy Louis Vuitton SE (France, Textiles, Apparel & Luxury Goods) | 2.3 | |
| Hoya Corp. (Japan, Health Care Equipment & Supplies) | 2.0 | |
| Canadian Natural Resources Ltd. (Canada, Oil, Gas & Consumable Fuels) | 1.8 | |
| AIA Group Ltd. (Hong Kong, Insurance) | 1.7 | |
| RELX PLC (Euronext N.V.) (United Kingdom, Professional Services) | 1.6 | |
| Linde PLC (Germany, Chemicals) | 1.6 | |
| HDFC Bank Ltd. (India, Banks) | 1.4 | |
| 21.5 | ||
| Market Sectors (% of Fund's net assets) | ||
| Industrials | 19.9 | |
| Financials | 19.5 | |
| Information Technology | 14.7 | |
| Health Care | 13.5 | |
| Consumer Discretionary | 7.9 | |
| Consumer Staples | 6.6 | |
| Materials | 5.9 | |
| Energy | 5.7 | |
| Communication Services | 1.2 | |
| Real Estate | 0.6 | |
Asset Allocation (% of Fund's net assets) |
 |
Foreign investments - 90.2% |
Geographic Diversification (% of Fund's net assets) |
 |
* Includes Short-Term investments and Net Other Assets (Liabilities). Percentages are based on country or territory of incorporation and are adjusted for the effect of futures contracts, if applicable. |
| Common Stocks - 95.0% | |||
| Shares | Value ($) | ||
| Australia - 0.5% | |||
| Aristocrat Leisure Ltd. | 947,269 | 22,461,477 | |
| Lynas Rare Earths Ltd. (a) | 3,850,257 | 20,515,265 | |
TOTAL AUSTRALIA | 42,976,742 | ||
| Bailiwick of Jersey - 2.8% | |||
| Experian PLC | 1,275,361 | 40,665,238 | |
| Ferguson PLC | 685,681 | 74,780,836 | |
| Glencore PLC | 14,615,567 | 83,792,123 | |
| WPP PLC | 4,550,961 | 40,049,143 | |
TOTAL BAILIWICK OF JERSEY | 239,287,340 | ||
| Belgium - 0.9% | |||
| KBC Group NV | 1,602,413 | 80,306,144 | |
| Bermuda - 0.5% | |||
| Hiscox Ltd. | 4,169,663 | 42,997,672 | |
| Canada - 6.7% | |||
| Alimentation Couche-Tard, Inc. Class A (multi-vtg.) | 511,660 | 22,909,869 | |
| Canadian Natural Resources Ltd. (b) | 2,585,447 | 155,067,989 | |
| Canadian Pacific Railway Ltd. | 375,191 | 27,947,978 | |
| Constellation Software, Inc. | 52,456 | 75,848,754 | |
| Fairfax India Holdings Corp. (a)(c) | 1,504,837 | 14,085,274 | |
| First Quantum Minerals Ltd. | 2,202,729 | 38,853,142 | |
| Franco-Nevada Corp. | 388,261 | 47,972,969 | |
| GFL Environmental, Inc. (b) | 1,252,383 | 33,801,817 | |
| Imperial Oil Ltd. | 727,480 | 39,573,929 | |
| Thomson Reuters Corp. | 343,179 | 36,498,114 | |
| Tourmaline Oil Corp. (b) | 1,550,051 | 87,335,791 | |
TOTAL CANADA | 579,895,626 | ||
| Cayman Islands - 0.9% | |||
| Anta Sports Products Ltd. | 2,972,907 | 26,132,450 | |
| GlobalFoundries, Inc. | 505,973 | 28,688,669 | |
| Li Ning Co. Ltd. | 4,536,367 | 23,463,021 | |
TOTAL CAYMAN ISLANDS | 78,284,140 | ||
| China - 0.3% | |||
| Kweichow Moutai Co. Ltd. (A Shares) | 156,555 | 28,805,557 | |
| Curacao - 1.2% | |||
| Schlumberger Ltd. | 1,936,829 | 100,773,213 | |
| Cyprus - 0.0% | |||
| Sunrisemezz Ltd. (a) | 703,914 | 56,973 | |
| Denmark - 1.7% | |||
| Carlsberg A/S Series B | 74,553 | 8,778,295 | |
| DSV A/S | 651,231 | 88,164,212 | |
| Novo Nordisk A/S Series B | 417,151 | 45,357,354 | |
TOTAL DENMARK | 142,299,861 | ||
| France - 9.8% | |||
| Air Liquide SA | 141,238 | 18,475,874 | |
| AXA SA | 1,785,199 | 44,085,324 | |
| BNP Paribas SA | 2,012,200 | 94,359,948 | |
| Capgemini SA | 661,414 | 108,399,702 | |
| Dassault Systemes SA | 754,970 | 25,305,672 | |
| Edenred SA | 374,395 | 19,224,985 | |
| EssilorLuxottica SA | 512,001 | 81,134,693 | |
| Legrand SA | 711,222 | 54,198,463 | |
| LVMH Moet Hennessy Louis Vuitton SE | 316,200 | 199,520,586 | |
| Pernod Ricard SA | 551,591 | 96,866,013 | |
| Sartorius Stedim Biotech | 84,177 | 26,719,960 | |
| Teleperformance | 272,103 | 72,954,141 | |
TOTAL FRANCE | 841,245,361 | ||
| Germany - 7.4% | |||
| Allianz SE | 552,218 | 99,346,512 | |
| Bayer AG | 627,684 | 33,004,299 | |
| Brenntag SE | 380,706 | 23,099,852 | |
| Deutsche Borse AG | 452,001 | 73,504,298 | |
| Deutsche Post AG | 1,898,585 | 67,114,653 | |
| Hannover Reuck SE | 316,976 | 51,623,853 | |
| Linde PLC | 470,248 | 140,648,291 | |
| Merck KGaA | 384,425 | 62,647,875 | |
| SAP SE | 108,685 | 10,461,244 | |
| Siemens Healthineers AG (c) | 891,621 | 40,847,458 | |
| Symrise AG | 271,048 | 27,666,563 | |
| Synlab AG | 370,833 | 4,775,179 | |
TOTAL GERMANY | 634,740,077 | ||
| Greece - 0.1% | |||
| Piraeus Financial Holdings SA (a) | 4,927,400 | 6,077,140 | |
| Hong Kong - 2.3% | |||
| AIA Group Ltd. | 18,928,905 | 143,382,557 | |
| Chervon Holdings Ltd. | 2,681,614 | 9,035,905 | |
| Hong Kong Exchanges and Clearing Ltd. | 400,805 | 10,638,815 | |
| Techtronic Industries Co. Ltd. | 3,627,101 | 34,344,180 | |
TOTAL HONG KONG | 197,401,457 | ||
| India - 4.1% | |||
| Axis Bank Ltd. | 3,656,800 | 40,022,479 | |
| HDFC Bank Ltd. (a) | 6,527,794 | 118,465,810 | |
| Housing Development Finance Corp. Ltd. | 2,637,447 | 78,690,101 | |
| Kotak Mahindra Bank Ltd. | 1,413,305 | 32,472,040 | |
| Reliance Industries Ltd. | 2,809,246 | 86,523,962 | |
TOTAL INDIA | 356,174,392 | ||
| Indonesia - 1.0% | |||
| PT Bank Central Asia Tbk | 76,178,463 | 42,979,354 | |
| PT Bank Rakyat Indonesia (Persero) Tbk | 147,183,214 | 43,878,951 | |
TOTAL INDONESIA | 86,858,305 | ||
| Ireland - 2.1% | |||
| Aon PLC | 254,317 | 71,587,692 | |
| Flutter Entertainment PLC (a) | 90,809 | 12,059,384 | |
| ICON PLC (a) | 228,842 | 45,274,101 | |
| Kingspan Group PLC (Ireland) | 719,131 | 36,315,810 | |
| Ryanair Holdings PLC sponsored ADR (a) | 281,638 | 19,402,042 | |
TOTAL IRELAND | 184,639,029 | ||
| Isle of Man - 0.2% | |||
| Entain PLC | 1,406,682 | 20,349,882 | |
| Italy - 0.7% | |||
| FinecoBank SpA | 3,477,480 | 46,875,492 | |
| Reply SpA | 109,508 | 11,915,163 | |
TOTAL ITALY | 58,790,655 | ||
| Japan - 15.6% | |||
| Daikin Industries Ltd. | 262,520 | 39,322,131 | |
| FUJIFILM Holdings Corp. | 1,352,791 | 62,037,606 | |
| Fujitsu Ltd. | 162,664 | 18,715,881 | |
| Hitachi Ltd. | 2,382,278 | 108,303,570 | |
| Hoya Corp. | 1,820,498 | 169,873,969 | |
| Itochu Corp. | 2,891,421 | 74,845,014 | |
| Keyence Corp. | 254,522 | 96,403,235 | |
| Minebea Mitsumi, Inc. | 4,569,318 | 67,727,744 | |
| Misumi Group, Inc. | 1,708,598 | 36,540,177 | |
| Nomura Research Institute Ltd. | 1,236,030 | 27,472,875 | |
| Olympus Corp. | 1,953,638 | 41,255,075 | |
| ORIX Corp. | 5,493,508 | 80,724,402 | |
| Persol Holdings Co. Ltd. | 2,362,999 | 47,452,268 | |
| Recruit Holdings Co. Ltd. | 880,840 | 27,104,477 | |
| Relo Group, Inc. | 1,754,741 | 24,805,579 | |
| Seven & i Holdings Co. Ltd. | 1,104,239 | 41,219,447 | |
| Shin-Etsu Chemical Co. Ltd. | 847,397 | 88,069,933 | |
| SMC Corp. | 168,275 | 67,545,967 | |
| Sony Group Corp. | 1,468,978 | 99,060,033 | |
| Suzuki Motor Corp. | 530,521 | 17,910,592 | |
| TIS, Inc. | 2,205,009 | 59,538,728 | |
| Tokyo Electron Ltd. | 204,669 | 53,847,722 | |
TOTAL JAPAN | 1,349,776,425 | ||
| Korea (South) - 0.7% | |||
| Samsung Electronics Co. Ltd. | 1,512,110 | 62,928,659 | |
| Luxembourg - 0.9% | |||
| B&M European Value Retail SA | 12,048,270 | 44,573,500 | |
| Eurofins Scientific SA | 573,354 | 36,705,455 | |
TOTAL LUXEMBOURG | 81,278,955 | ||
| Netherlands - 7.1% | |||
| Adyen BV (a)(c) | 19,975 | 28,516,300 | |
| Airbus Group NV | 791,141 | 85,604,444 | |
| Argenx SE (a) | 90,852 | 35,273,343 | |
| ASML Holding NV | 467,695 | 220,948,472 | |
| IMCD NV | 509,448 | 66,104,559 | |
| NXP Semiconductors NV | 405,334 | 59,211,191 | |
| Wolters Kluwer NV | 1,057,843 | 112,434,206 | |
TOTAL NETHERLANDS | 608,092,515 | ||
| Spain - 1.7% | |||
| Amadeus IT Holding SA Class A (a) | 184,156 | 9,604,712 | |
| Banco Santander SA (Spain) (b) | 7,514,673 | 19,471,957 | |
| CaixaBank SA | 10,418,650 | 34,548,713 | |
| Cellnex Telecom SA (c) | 930,657 | 30,460,646 | |
| Industria de Diseno Textil SA (b) | 2,135,614 | 48,415,341 | |
TOTAL SPAIN | 142,501,369 | ||
| Sweden - 2.4% | |||
| Hexagon AB (B Shares) | 5,767,302 | 57,014,950 | |
| Indutrade AB | 3,624,020 | 63,462,691 | |
| Investor AB (B Shares) | 4,300,089 | 70,242,732 | |
| Kry International AB (a)(d)(e) | 2,651 | 464,107 | |
| Nibe Industrier AB (B Shares) | 586,652 | 4,681,017 | |
| Nordnet AB | 789,719 | 9,798,890 | |
TOTAL SWEDEN | 205,664,387 | ||
| Switzerland - 8.5% | |||
| Julius Baer Group Ltd. | 289,337 | 13,882,063 | |
| Lonza Group AG | 26,238 | 13,506,908 | |
| Nestle SA (Reg. S) | 2,466,368 | 268,485,866 | |
| Roche Holding AG (participation certificate) | 879,960 | 291,969,131 | |
| Sika AG | 286,411 | 64,578,757 | |
| Sonova Holding AG | 210,118 | 49,667,879 | |
| Zurich Insurance Group Ltd. | 80,855 | 34,458,296 | |
TOTAL SWITZERLAND | 736,548,900 | ||
| Taiwan - 0.9% | |||
| ECLAT Textile Co. Ltd. | 654,000 | 8,607,398 | |
| Taiwan Semiconductor Manufacturing Co. Ltd. sponsored ADR | 1,095,340 | 67,418,177 | |
TOTAL TAIWAN | 76,025,575 | ||
| United Kingdom - 9.1% | |||
| AstraZeneca PLC (United Kingdom) | 759,085 | 89,065,107 | |
| BAE Systems PLC | 9,084,379 | 84,971,375 | |
| Beazley PLC | 3,323,063 | 23,799,000 | |
| Big Yellow Group PLC | 1,695,753 | 21,897,204 | |
| Compass Group PLC | 3,120,549 | 65,724,462 | |
| Diageo PLC | 2,450,382 | 100,839,384 | |
| Harbour Energy PLC | 4,130,496 | 17,900,567 | |
| JD Sports Fashion PLC | 19,033,441 | 21,268,765 | |
| Lloyds Banking Group PLC | 94,144,825 | 45,214,743 | |
| Prudential PLC | 2,679,630 | 24,892,882 | |
| RELX PLC (Euronext N.V.) | 5,264,067 | 141,656,294 | |
| Rentokil Initial PLC | 11,162,563 | 69,655,628 | |
| S4 Capital PLC (a) | 5,397,874 | 10,876,325 | |
| Smith & Nephew PLC | 2,075,946 | 24,531,277 | |
| Standard Chartered PLC (United Kingdom) | 2,680,705 | 15,992,157 | |
| Starling Bank Ltd. Series D (a)(d)(e) | 8,636,400 | 27,929,910 | |
TOTAL UNITED KINGDOM | 786,215,080 | ||
| United States of America - 4.9% | |||
| Alphabet, Inc. Class C (a) | 302,732 | 28,656,611 | |
| Booking Holdings, Inc. (a) | 12,796 | 23,921,866 | |
| IQVIA Holdings, Inc. (a) | 209,514 | 43,928,800 | |
| Kosmos Energy Ltd. (a) | 621,268 | 4,032,029 | |
| Marsh & McLennan Companies, Inc. | 474,453 | 76,619,415 | |
| Marvell Technology, Inc. | 1,275,033 | 50,593,309 | |
| MasterCard, Inc. Class A | 163,275 | 53,583,590 | |
| NICE Ltd. sponsored ADR (a) | 319,426 | 60,655,803 | |
| ResMed, Inc. | 60,138 | 13,452,269 | |
| S&P Global, Inc. | 212,326 | 68,209,728 | |
TOTAL UNITED STATES OF AMERICA | 423,653,420 | ||
| TOTAL COMMON STOCKS (Cost $6,657,693,633) | 8,194,644,851 | ||
| Preferred Stocks - 0.5% | |||
| Shares | Value ($) | ||
| Convertible Preferred Stocks - 0.5% | |||
| Estonia - 0.1% | |||
| Bolt Technology OU Series E (d)(e) | 79,275 | 9,684,826 | |
| United States of America - 0.4% | |||
| Wasabi Holdings, Inc. Series C (a)(d)(e) | 2,976,172 | 34,374,787 | |
TOTAL CONVERTIBLE PREFERRED STOCKS | 44,059,613 | ||
| Nonconvertible Preferred Stocks - 0.0% | |||
| Sweden - 0.0% | |||
| Kry International AB Series E (a)(d)(e) | 15,316 | 2,681,349 | |
| TOTAL PREFERRED STOCKS (Cost $59,932,348) | 46,740,962 | ||
| Money Market Funds - 6.4% | |||
| Shares | Value ($) | ||
| Fidelity Cash Central Fund 3.10% (f) | 378,091,944 | 378,167,562 | |
| Fidelity Securities Lending Cash Central Fund 3.10% (f)(g) | 172,592,911 | 172,610,171 | |
| TOTAL MONEY MARKET FUNDS (Cost $550,776,776) | 550,777,733 | ||
| TOTAL INVESTMENT IN SECURITIES - 101.9% (Cost $7,268,402,757) | 8,792,163,546 |
NET OTHER ASSETS (LIABILITIES) - (1.9)% | (164,789,078) |
| NET ASSETS - 100.0% | 8,627,374,468 |
| (a) | Non-income producing |
| (b) | Security or a portion of the security is on loan at period end. |
| (c) | Security exempt from registration under Rule 144A of the Securities Act of 1933. These securities may be resold in transactions exempt from registration, normally to qualified institutional buyers. At the end of the period, the value of these securities amounted to $113,909,678 or 1.3% of net assets. |
| (d) | Restricted securities (including private placements) - Investment in securities not registered under the Securities Act of 1933 (excluding 144A issues). At the end of the period, the value of restricted securities (excluding 144A issues) amounted to $75,134,979 or 0.9% of net assets. |
| (e) | Level 3 security |
| (f) | Affiliated fund that is generally available only to investment companies and other accounts managed by Fidelity Investments. The rate quoted is the annualized seven-day yield of the fund at period end. A complete unaudited listing of the fund's holdings as of its most recent quarter end is available upon request. In addition, each Fidelity Central Fund's financial statements, which are not covered by the Fund's Report of Independent Registered Public Accounting Firm, are available on the SEC's website or upon request. |
| (g) | Investment made with cash collateral received from securities on loan. |
| Additional information on each restricted holding is as follows: | ||
| Security | Acquisition Date | Acquisition Cost ($) |
| Bolt Technology OU Series E | 1/03/22 | 20,595,368 |
| Kry International AB | 5/14/21 | 1,151,345 |
| Kry International AB Series E | 5/14/21 | 7,002,062 |
| Starling Bank Ltd. Series D | 6/18/21 | 15,440,896 |
| Wasabi Holdings, Inc. Series C | 3/31/21 | 32,334,918 |
| Affiliate | Value, beginning of period ($) | Purchases ($) | Sales Proceeds ($) | Dividend Income ($) | Realized Gain (loss) ($) | Change in Unrealized appreciation (depreciation) ($) | Value, end of period ($) | % ownership, end of period |
| Fidelity Cash Central Fund 3.10% | 329,160,542 | 1,589,755,166 | 1,540,748,146 | 4,144,944 | 17,328 | (17,328) | 378,167,562 | 0.8% |
| Fidelity Securities Lending Cash Central Fund 3.10% | 119,807,250 | 1,307,091,053 | 1,254,288,132 | 651,191 | - | - | 172,610,171 | 0.5% |
| Total | 448,967,792 | 2,896,846,219 | 2,795,036,278 | 4,796,135 | 17,328 | (17,328) | 550,777,733 | |
| Valuation Inputs at Reporting Date: | ||||
| Description | Total ($) | Level 1 ($) | Level 2 ($) | Level 3 ($) |
Investments in Securities: | ||||
| Equities: | ||||
Communication Services | 110,042,725 | 39,532,936 | 70,509,789 | - |
Consumer Discretionary | 676,879,449 | 257,849,699 | 384,654,963 | 34,374,787 |
Consumer Staples | 567,904,431 | 148,581,439 | 419,322,992 | - |
Energy | 491,207,480 | 491,207,480 | - | - |
Financials | 1,681,221,317 | 836,205,302 | 817,086,105 | 27,929,910 |
Health Care | 1,148,990,132 | 512,787,380 | 636,202,752 | - |
Industrials | 1,706,698,898 | 1,113,072,490 | 593,626,408 | - |
Information Technology | 1,281,165,681 | 956,469,216 | 311,866,183 | 12,830,282 |
Materials | 530,572,917 | 247,989,667 | 282,583,250 | - |
Real Estate | 46,702,783 | 46,702,783 | - | - |
| Money Market Funds | 550,777,733 | 550,777,733 | - | - |
| Total Investments in Securities: | 8,792,163,546 | 5,201,176,125 | 3,515,852,442 | 75,134,979 |
| Statement of Assets and Liabilities | ||||
| October 31, 2022 | ||||
| Assets | ||||
| Investment in securities, at value (including securities loaned of $161,286,927) - See accompanying schedule: | ||||
Unaffiliated issuers (cost $6,717,625,981) | $8,241,385,813 | |||
Fidelity Central Funds (cost $550,776,776) | 550,777,733 | |||
| Total Investment in Securities (cost $7,268,402,757) | $ | 8,792,163,546 | ||
| Cash | 56,774 | |||
| Foreign currency held at value (cost $2,327,171) | 2,542,709 | |||
| Receivable for investments sold | 15,693,746 | |||
| Receivable for fund shares sold | 3,094,325 | |||
| Dividends receivable | 13,520,337 | |||
| Reclaims receivable | 31,127,991 | |||
| Distributions receivable from Fidelity Central Funds | 1,036,276 | |||
| Prepaid expenses | 14,643 | |||
| Other receivables | 1,276,066 | |||
Total assets | 8,860,526,413 | |||
| Liabilities | ||||
| Payable for investments purchased | $26,323,549 | |||
| Payable for fund shares redeemed | 10,543,954 | |||
| Accrued management fee | 5,497,950 | |||
| Other affiliated payables | 1,163,737 | |||
| Deferred taxes | 15,674,593 | |||
| Other payables and accrued expenses | 1,337,991 | |||
| Collateral on securities loaned | 172,610,171 | |||
| Total Liabilities | 233,151,945 | |||
| Net Assets | $ | 8,627,374,468 | ||
| Net Assets consist of: | ||||
| Paid in capital | $ | 7,078,910,310 | ||
| Total accumulated earnings (loss) | 1,548,464,158 | |||
| Net Assets | $ | 8,627,374,468 | ||
| Net Asset Value and Maximum Offering Price | ||||
| Diversified International : | ||||
Net Asset Value , offering price and redemption price per share ($7,230,515,461 ÷ 212,750,613 shares) | $ | 33.99 | ||
| Class K : | ||||
Net Asset Value , offering price and redemption price per share ($1,396,859,007 ÷ 41,153,553 shares) | $ | 33.94 | ||
| Statement of Operations | ||||
Year ended October 31, 2022 | ||||
| Investment Income | ||||
| Dividends | $ | 220,419,291 | ||
| Foreign Tax Reclaims | 15,219,175 | |||
| Income from Fidelity Central Funds (including $651,191 from security lending) | 4,796,135 | |||
| Income before foreign taxes withheld | 240,434,601 | |||
| Less foreign taxes withheld | (39,468,363) | |||
| Total Income | 200,966,238 | |||
| Expenses | ||||
| Management fee | ||||
| Basic fee | $ | 73,185,225 | ||
| Performance adjustment | 18,017,292 | |||
| Transfer agent fees | 14,502,574 | |||
| Accounting fees | 1,793,287 | |||
| Custodian fees and expenses | 1,076,157 | |||
| Independent trustees' fees and expenses | 40,207 | |||
| Registration fees | 206,372 | |||
| Audit | 127,349 | |||
| Legal | 13,973 | |||
| Miscellaneous | 55,140 | |||
| Total expenses before reductions | 109,017,576 | |||
| Expense reductions | (370,820) | |||
| Total expenses after reductions | 108,646,756 | |||
| Net Investment income (loss) | 92,319,482 | |||
| Realized and Unrealized Gain (Loss) | ||||
| Net realized gain (loss) on: | ||||
| Investment Securities: | ||||
| Unaffiliated issuers(net of foreign taxes of $5,626,473) | 668,945,188 | |||
| Fidelity Central Funds | 17,328 | |||
| Foreign currency transactions | (3,699,569) | |||
| Total net realized gain (loss) | 665,262,947 | |||
| Change in net unrealized appreciation (depreciation) on: | ||||
| Investment Securities: | ||||
| Unaffiliated issuers (net of decrease in deferred foreign taxes of $11,924,424) | (4,722,481,239) | |||
| Fidelity Central Funds | (17,328) | |||
| Assets and liabilities in foreign currencies | (3,890,607) | |||
| Total change in net unrealized appreciation (depreciation) | (4,726,389,174) | |||
| Net gain (loss) | (4,061,126,227) | |||
| Net increase (decrease) in net assets resulting from operations | $ | (3,968,806,745) | ||
| Statement of Changes in Net Assets | ||||
Year ended October 31, 2022 | Year ended October 31, 2021 | |||
| Increase (Decrease) in Net Assets | ||||
| Operations | ||||
| Net investment income (loss) | $ | 92,319,482 | $ | 51,343,548 |
| Net realized gain (loss) | 665,262,947 | 1,760,068,284 | ||
| Change in net unrealized appreciation (depreciation) | (4,726,389,174) | 1,940,356,322 | ||
| Net increase (decrease) in net assets resulting from operations | (3,968,806,745) | 3,751,768,154 | ||
| Distributions to shareholders | (1,395,065,915) | (149,529,825) | ||
| Share transactions - net increase (decrease) | (845,248,874) | (1,946,201,266) | ||
| Total increase (decrease) in net assets | (6,209,121,534) | 1,656,037,063 | ||
| Net Assets | ||||
| Beginning of period | 14,836,496,002 | 13,180,458,939 | ||
| End of period | $ | 8,627,374,468 | $ | 14,836,496,002 |
| Fidelity® Diversified International Fund |
| Years ended October 31, | 2022 | 2021 | 2020 | 2019 | 2018 | |||||
Selected Per-Share Data | ||||||||||
| Net asset value, beginning of period | $ | 53.38 | $ | 41.61 | $ | 38.67 | $ | 35.72 | $ | 41.39 |
| Income from Investment Operations | ||||||||||
Net investment income (loss) A,B | .33 | .16 | .10 | .50 | .50 | |||||
| Net realized and unrealized gain (loss) | (14.58) | 12.07 | 3.37 | 4.77 | (4.05) | |||||
| Total from investment operations | (14.25) | 12.23 | 3.47 | 5.27 | (3.55) | |||||
| Distributions from net investment income | (.57) | (.02) | (.53) | (.43) | (.43) | |||||
| Distributions from net realized gain | (4.57) | (.45) | - | (1.89) | (1.69) | |||||
| Total distributions | (5.14) | (.46) C | (.53) | (2.32) | (2.12) | |||||
| Net asset value, end of period | $ | 33.99 | $ | 53.38 | $ | 41.61 | $ | 38.67 | $ | 35.72 |
Total Return D | (29.36)% | 29.58% | 9.07% | 16.02% | (9.05)% | |||||
Ratios to Average Net Assets B,E,F | ||||||||||
| Expenses before reductions | .99% | 1.01% | 1.05% | .75% | .81% | |||||
| Expenses net of fee waivers, if any | .99% | 1.01% | 1.05% | .75% | .80% | |||||
| Expenses net of all reductions | .99% | 1.01% | 1.04% | .75% | .79% | |||||
| Net investment income (loss) | .80% | .32% | .26% | 1.42% | 1.27% | |||||
| Supplemental Data | ||||||||||
| Net assets, end of period (000 omitted) | $ | 7,230,515 | $ | 11,529,722 | $ | 9,419,192 | $ | 8,734,682 | $ | 9,275,299 |
Portfolio turnover rate G,H | 20% | 29% | 29% | 37% | 30% |
| Fidelity® Diversified International Fund Class K |
| Years ended October 31, | 2022 | 2021 | 2020 | 2019 | 2018 | |||||
Selected Per-Share Data | ||||||||||
| Net asset value, beginning of period | $ | 53.32 | $ | 41.56 | $ | 38.61 | $ | 35.68 | $ | 41.35 |
| Income from Investment Operations | ||||||||||
Net investment income (loss) A,B | .38 | .21 | .15 | .55 | .55 | |||||
| Net realized and unrealized gain (loss) | (14.58) | 12.06 | 3.37 | 4.74 | (4.05) | |||||
| Total from investment operations | (14.20) | 12.27 | 3.52 | 5.29 | (3.50) | |||||
| Distributions from net investment income | (.62) | (.06) | (.57) | (.47) | (.48) | |||||
| Distributions from net realized gain | (4.57) | (.45) | - | (1.89) | (1.69) | |||||
| Total distributions | (5.18) C | (.51) | (.57) | (2.36) | (2.17) | |||||
| Net asset value, end of period | $ | 33.94 | $ | 53.32 | $ | 41.56 | $ | 38.61 | $ | 35.68 |
Total Return D | (29.31)% | 29.71% | 9.22% | 16.14% | (8.95)% | |||||
Ratios to Average Net Assets B,E,F | ||||||||||
| Expenses before reductions | .88% | .91% | .94% | .63% | .69% | |||||
| Expenses net of fee waivers, if any | .88% | .91% | .94% | .63% | .69% | |||||
| Expenses net of all reductions | .88% | .91% | .93% | .63% | .67% | |||||
| Net investment income (loss) | .91% | .42% | .38% | 1.54% | 1.39% | |||||
| Supplemental Data | ||||||||||
| Net assets, end of period (000 omitted) | $ | 1,396,859 | $ | 3,306,774 | $ | 3,761,267 | $ | 4,246,651 | $ | 4,998,889 |
Portfolio turnover rate G,H | 20% | 29% | 29% | 37% | 30% |
| Fidelity Central Fund | Investment Manager | Investment Objective | Investment Practices | Expense Ratio A |
| Fidelity Money Market Central Funds | Fidelity Management & Research Company LLC (FMR) | Each fund seeks to obtain a high level of current income consistent with the preservation of capital and liquidity. | Short-term Investments | Less than .005% |
| Fidelity Diversified International Fund | $1,108,802 |
| Gross unrealized appreciation | $2,105,043,960 |
| Gross unrealized depreciation | (655,536,167) |
| Net unrealized appreciation (depreciation) | $1,449,507,793 |
| Tax Cost | $7,342,655,753 |
| Undistributed ordinary income | $33,273,903 |
| Undistributed long-term capital gain | $86,135,323 |
| Net unrealized appreciation (depreciation) on securities and other investments | $1,445,609,239 |
| October 31, 2022 | October 31, 2021 | |
| Ordinary Income | $156,793,723 | $9,270,617 |
| Long-term Capital Gains | 1,238,272,192 | 140,259,208 |
| Total | $1,395,065,915 | $149,529,825 |
| Purchases ($) | Sales ($) | |
| Fidelity Diversified International Fund | 2,162,369,529 | 3,345,852,397 |
| Shares | Total net realized gain or loss ($) | Total Proceeds ($) | Participating classes | |
| Fidelity Diversified International Fund | 26,571,800 | 431,418,900 | 1,092,083,654 | Diversified International and Class K |
| Shares | Total net realized gain or loss ($) | Total Proceeds ($) | Participating classes | |
| Fidelity Diversified International Fund | 12,120,689 | 302,712,975 | 611,863,014 | Diversified International and Class K |
| Amount | % of Class-Level Average Net Assets | |
| Diversified International | $13,631,646 | .15 |
| Class K | 870,928 | .04 |
| $14,502,574 |
| % of Average Net Assets | |
| Fidelity Diversified International Fund | .02 |
| Amount | |
| Fidelity Diversified International Fund | $7,288 |
| Purchases ($) | Sales ($) | Realized Gain (Loss) ($) | |
| Fidelity Diversified International Fund | 54,199,769 | 107,577,115 | 8,799,174 |
| Amount ($) | |
| Fidelity Diversified International Fund | 4,196 |
| Amount | |
| Fidelity Diversified International Fund | $20,241 |
| Total Security Lending Fees Paid to NFS | Security Lending Income From Securities Loaned to NFS | Value of Securities Loaned to NFS at Period End | |
| Fidelity Diversified International Fund | $70,042 | $- | $- |
Year ended October 31, 2022 | Year ended October 31, 2021 | |
| Fidelity Diversified International Fund | ||
| Distributions to shareholders | ||
| Diversified International | $1,090,192,506 | $104,309,903 |
| Class K | 304,873,409 | 45,219,922 |
Total | $1,395,065,915 | $149,529,825 |
| Shares | Shares | Dollars | Dollars | |
| Year ended October 31, 2022 | Year ended October 31, 2021 | Year ended October 31, 2022 | Year ended October 31, 2021 | |
| Fidelity Diversified International Fund | ||||
| Diversified International | ||||
| Shares sold | 48,845,163 | 22,494,237 | $1,865,951,127 | $1,111,665,577 |
| Reinvestment of distributions | 20,838,853 | 2,044,541 | 979,217,736 | 94,191,973 |
| Shares redeemed | (72,908,948) | (34,915,913) | (2,840,874,254) | (1,720,243,591) |
| Net increase (decrease) | (3,224,932) | (10,377,135) | $4,294,609 | $(514,386,041) |
| Class K | ||||
| Shares sold | 7,508,397 | 13,530,019 | $ 323,341,358 | $662,274,443 |
| Reinvestment of distributions | 6,500,350 | 983,393 | 304,736,401 | 45,206,563 |
| Shares redeemed | (34,873,914) | (42,999,587) | (1,477,621,242) | (2,139,296,231) |
| Net increase (decrease) | (20,865,167) | (28,486,175) | $(849,543,483) | $(1,431,815,225) |
| Strategic Advisers Fidelity International Fund | |
| Fidelity Diversified International Fund | 19% |
| Fund | % of shares held |
| Fidelity Diversified International Fund | 24% |
| Average Annual Total Returns | |||
Periods ended October 31, 2022 | Past 1 year | Past 5 years | Past 10 years |
| Fidelity® International Capital Appreciation Fund | -30.97% | 2.48% | 7.12% |
| $10,000 Over 10 Years |
Let's say hypothetically that $10,000 was invested in Fidelity® International Capital Appreciation Fund on October 31, 2012. The chart shows how the value of your investment would have changed, and also shows how the MSCI ACWI (All Country World Index) ex USA Index performed over the same period. |
 |
Top Holdings (% of Fund's net assets) | ||
| Nestle SA (Reg. S) (Switzerland, Food Products) | 3.0 | |
| LVMH Moet Hennessy Louis Vuitton SE (France, Textiles, Apparel & Luxury Goods) | 2.7 | |
| Taiwan Semiconductor Manufacturing Co. Ltd. (Taiwan, Semiconductors & Semiconductor Equipment) | 2.7 | |
| ASML Holding NV (Netherlands) (Netherlands, Semiconductors & Semiconductor Equipment) | 2.6 | |
| Novo Nordisk A/S Series B (Denmark, Pharmaceuticals) | 2.5 | |
| AstraZeneca PLC (United Kingdom) (United Kingdom, Pharmaceuticals) | 2.5 | |
| Keyence Corp. (Japan, Electronic Equipment & Components) | 2.2 | |
| L'Oreal SA (France, Personal Products) | 2.2 | |
| Canadian Pacific Railway Ltd. (Canada, Road & Rail) | 2.1 | |
| Hermes International SCA (France, Textiles, Apparel & Luxury Goods) | 2.0 | |
| 24.5 | ||
| Market Sectors (% of Fund's net assets) | ||
| Information Technology | 28.8 | |
| Industrials | 20.9 | |
| Health Care | 14.5 | |
| Consumer Discretionary | 11.7 | |
| Financials | 10.5 | |
| Consumer Staples | 7.1 | |
| Materials | 5.3 | |
Asset Allocation (% of Fund's net assets) |
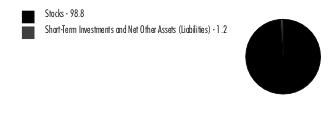 |
Foreign investments - 84.1% |
Geographic Diversification (% of Fund's net assets) |
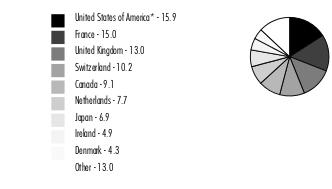 |
* Includes Short-Term investments and Net Other Assets (Liabilities). Percentages are based on country or territory of incorporation and are adjusted for the effect of futures contracts, if applicable. |
| Common Stocks - 98.8% | |||
| Shares | Value ($) | ||
| Canada - 9.1% | |||
| Canadian National Railway Co. | 612,512 | 72,565,374 | |
| Canadian Pacific Railway Ltd. | 1,087,188 | 81,047,318 | |
| Constellation Software, Inc. | 47,719 | 68,999,289 | |
| Thomson Reuters Corp. | 643,947 | 68,485,691 | |
| Waste Connections, Inc. (Canada) (a) | 436,747 | 57,644,128 | |
TOTAL CANADA | 348,741,800 | ||
| Denmark - 4.3% | |||
| DSV A/S | 509,932 | 69,035,032 | |
| Novo Nordisk A/S Series B | 868,112 | 94,390,912 | |
TOTAL DENMARK | 163,425,944 | ||
| France - 15.0% | |||
| Capgemini SA | 390,700 | 64,032,155 | |
| Dassault Systemes SA | 1,916,644 | 64,243,565 | |
| Hermes International SCA | 60,171 | 77,927,560 | |
| Kering SA | 134,660 | 61,669,071 | |
| L'Oreal SA | 262,500 | 82,426,153 | |
| LVMH Moet Hennessy Louis Vuitton SE | 164,745 | 103,953,254 | |
| Sartorius Stedim Biotech | 187,253 | 59,438,952 | |
| Teleperformance | 221,579 | 59,408,039 | |
TOTAL FRANCE | 573,098,749 | ||
| Germany - 1.5% | |||
| Nemetschek SE | 1,205,800 | 57,627,317 | |
| India - 3.7% | |||
| HDFC Bank Ltd. (b) | 4,029,464 | 73,126,345 | |
| Infosys Ltd. sponsored ADR | 3,587,700 | 67,197,621 | |
TOTAL INDIA | 140,323,966 | ||
| Ireland - 4.9% | |||
| Accenture PLC Class A | 221,961 | 63,014,728 | |
| Kingspan Group PLC (Ireland) | 1,158,571 | 58,507,343 | |
| Linde PLC | 220,621 | 65,601,654 | |
TOTAL IRELAND | 187,123,725 | ||
| Japan - 6.9% | |||
| Hoya Corp. | 703,558 | 65,650,272 | |
| Keyence Corp. | 217,667 | 82,443,965 | |
| Recruit Holdings Co. Ltd. | 1,860,400 | 57,246,683 | |
| Tokyo Electron Ltd. | 218,698 | 57,538,704 | |
TOTAL JAPAN | 262,879,624 | ||
| Luxembourg - 1.5% | |||
| Eurofins Scientific SA | 909,368 | 58,216,680 | |
| Netherlands - 7.7% | |||
| ASM International NV (Netherlands) | 247,144 | 54,905,165 | |
| ASML Holding NV (Netherlands) | 209,554 | 98,299,091 | |
| Ferrari NV (Italy) | 362,663 | 71,501,141 | |
| Wolters Kluwer NV | 666,342 | 70,823,018 | |
TOTAL NETHERLANDS | 295,528,415 | ||
| Sweden - 3.6% | |||
| Atlas Copco AB (A Shares) | 6,954,540 | 74,227,570 | |
| Hexagon AB (B Shares) | 6,395,405 | 63,224,311 | |
TOTAL SWEDEN | 137,451,881 | ||
| Switzerland - 10.2% | |||
| Compagnie Financiere Richemont SA Series A | 698,710 | 68,287,413 | |
| Givaudan SA | 20,808 | 62,132,042 | |
| Nestle SA (Reg. S) | 1,061,778 | 115,583,881 | |
| Partners Group Holding AG | 77,700 | 69,789,165 | |
| Sika AG | 329,375 | 74,266,101 | |
TOTAL SWITZERLAND | 390,058,602 | ||
| Taiwan - 2.7% | |||
| Taiwan Semiconductor Manufacturing Co. Ltd. | 8,536,000 | 102,521,355 | |
| United Kingdom - 13.0% | |||
| AstraZeneca PLC (United Kingdom) | 801,900 | 94,088,685 | |
| Compass Group PLC | 3,133,400 | 65,995,127 | |
| Diageo PLC | 1,818,981 | 74,855,644 | |
| Halma PLC | 2,517,600 | 61,063,935 | |
| London Stock Exchange Group PLC | 758,900 | 65,783,006 | |
| RELX PLC (London Stock Exchange) | 2,509,209 | 67,398,595 | |
| Rentokil Initial PLC | 10,961,797 | 68,402,826 | |
TOTAL UNITED KINGDOM | 497,587,818 | ||
| United States of America - 14.7% | |||
| Danaher Corp. | 244,494 | 61,531,805 | |
| Marsh & McLennan Companies, Inc. | 420,299 | 67,874,086 | |
| Moody's Corp. | 240,667 | 63,745,468 | |
| NICE Ltd. sponsored ADR (b) | 334,330 | 63,485,924 | |
| NVIDIA Corp. | 445,776 | 60,166,387 | |
| S&P Global, Inc. | 192,519 | 61,846,729 | |
| Thermo Fisher Scientific, Inc. | 121,254 | 62,320,918 | |
| Visa, Inc. Class A | 293,300 | 60,760,028 | |
| Zoetis, Inc. Class A | 392,735 | 59,216,583 | |
TOTAL UNITED STATES OF AMERICA | 560,947,928 | ||
| TOTAL COMMON STOCKS (Cost $3,494,429,581) | 3,775,533,804 | ||
| Money Market Funds - 1.4% | |||
| Shares | Value ($) | ||
| Fidelity Cash Central Fund 3.10% (c) | 44,799,794 | 44,808,754 | |
| Fidelity Securities Lending Cash Central Fund 3.10% (c)(d) | 10,586,991 | 10,588,050 | |
| TOTAL MONEY MARKET FUNDS (Cost $55,396,804) | 55,396,804 | ||
| TOTAL INVESTMENT IN SECURITIES - 100.2% (Cost $3,549,826,385) | 3,830,930,608 |
NET OTHER ASSETS (LIABILITIES) - (0.2)% | (7,667,175) |
| NET ASSETS - 100.0% | 3,823,263,433 |
| (a) | Security or a portion of the security is on loan at period end. |
| (b) | Non-income producing |
| (c) | Affiliated fund that is generally available only to investment companies and other accounts managed by Fidelity Investments. The rate quoted is the annualized seven-day yield of the fund at period end. A complete unaudited listing of the fund's holdings as of its most recent quarter end is available upon request. In addition, each Fidelity Central Fund's financial statements, which are not covered by the Fund's Report of Independent Registered Public Accounting Firm, are available on the SEC's website or upon request. |
| (d) | Investment made with cash collateral received from securities on loan. |
| Affiliate | Value, beginning of period ($) | Purchases ($) | Sales Proceeds ($) | Dividend Income ($) | Realized Gain (loss) ($) | Change in Unrealized appreciation (depreciation) ($) | Value, end of period ($) | % ownership, end of period |
| Fidelity Cash Central Fund 3.10% | 115,699,173 | 1,945,135,607 | 2,016,026,026 | 362,918 | - | - | 44,808,754 | 0.1% |
| Fidelity Securities Lending Cash Central Fund 3.10% | - | 685,971,838 | 675,383,788 | 182,631 | - | - | 10,588,050 | 0.0% |
| Total | 115,699,173 | 2,631,107,445 | 2,691,409,814 | 545,549 | - | - | 55,396,804 | |
| Valuation Inputs at Reporting Date: | ||||
| Description | Total ($) | Level 1 ($) | Level 2 ($) | Level 3 ($) |
Investments in Securities: | ||||
| Equities: | ||||
Consumer Discretionary | 449,333,566 | 149,428,701 | 299,904,865 | - |
Consumer Staples | 272,865,678 | - | 272,865,678 | - |
Financials | 402,164,799 | 263,255,448 | 138,909,351 | - |
Health Care | 554,854,807 | 366,375,210 | 188,479,597 | - |
Industrials | 804,791,617 | 537,515,943 | 267,275,674 | - |
Information Technology | 1,089,523,540 | 639,664,359 | 449,859,181 | - |
Materials | 201,999,797 | 127,733,696 | 74,266,101 | - |
| Money Market Funds | 55,396,804 | 55,396,804 | - | - |
| Total Investments in Securities: | 3,830,930,608 | 2,139,370,161 | 1,691,560,447 | - |
| Statement of Assets and Liabilities | ||||
| October 31, 2022 | ||||
| Assets | ||||
| Investment in securities, at value (including securities loaned of $10,005,190) - See accompanying schedule: | ||||
Unaffiliated issuers (cost $3,494,429,581) | $3,775,533,804 | |||
Fidelity Central Funds (cost $55,396,804) | 55,396,804 | |||
| Total Investment in Securities (cost $3,549,826,385) | $ | 3,830,930,608 | ||
| Foreign currency held at value (cost $587,062) | 587,005 | |||
| Receivable for investments sold | 180,576 | |||
| Receivable for fund shares sold | 1,071,957 | |||
| Dividends receivable | 2,834,005 | |||
| Reclaims receivable | 5,833,857 | |||
| Distributions receivable from Fidelity Central Funds | 97,324 | |||
| Prepaid expenses | 6,490 | |||
| Other receivables | 1,881,254 | |||
Total assets | 3,843,423,076 | |||
| Liabilities | ||||
| Payable for investments purchased | 1,335,045 | |||
| Payable for fund shares redeemed | 3,283,817 | |||
| Accrued management fee | 2,568,203 | |||
| Other affiliated payables | 651,709 | |||
| Deferred taxes | 1,538,744 | |||
| Other payables and accrued expenses | 194,075 | |||
| Collateral on securities loaned | 10,588,050 | |||
| Total Liabilities | 20,159,643 | |||
| Net Assets | $ | 3,823,263,433 | ||
| Net Assets consist of: | ||||
| Paid in capital | $ | 3,970,257,516 | ||
| Total accumulated earnings (loss) | (146,994,083) | |||
| Net Assets | $ | 3,823,263,433 | ||
Net Asset Value , offering price and redemption price per share ($3,823,263,433 ÷ 195,982,579 shares) | $ | 19.51 | ||
| Statement of Operations | ||||
Year ended October 31, 2022 | ||||
| Investment Income | ||||
| Dividends | $ | 56,982,044 | ||
| Foreign Tax Reclaims | 3,513,446 | |||
| Income from Fidelity Central Funds (including $182,631 from security lending) | 545,549 | |||
| Income before foreign taxes withheld | 61,041,039 | |||
| Less foreign taxes withheld | (9,376,772) | |||
| Total Income | 51,664,267 | |||
| Expenses | ||||
| Management fee | ||||
| Basic fee | $ | 32,222,623 | ||
| Performance adjustment | 5,150,567 | |||
| Transfer agent fees | 7,332,652 | |||
| Accounting fees | 1,526,883 | |||
| Custodian fees and expenses | 414,808 | |||
| Independent trustees' fees and expenses | 16,710 | |||
| Registration fees | 248,776 | |||
| Audit | 99,174 | |||
| Legal | 8,045 | |||
| Interest | 51,422 | |||
| Miscellaneous | 21,939 | |||
| Total expenses before reductions | 47,093,599 | |||
| Expense reductions | (155,392) | |||
| Total expenses after reductions | 46,938,207 | |||
| Net Investment income (loss) | 4,726,060 | |||
| Realized and Unrealized Gain (Loss) | ||||
| Net realized gain (loss) on: | ||||
| Investment Securities: | ||||
| Unaffiliated issuers(net of foreign taxes of $2,484,647) | (421,871,350) | |||
| Foreign currency transactions | (91,521) | |||
| Total net realized gain (loss) | (421,962,871) | |||
| Change in net unrealized appreciation (depreciation) on: | ||||
| Investment Securities: | ||||
| Unaffiliated issuers (net of decrease in deferred foreign taxes of $5,879,612) | (1,404,004,071) | |||
| Assets and liabilities in foreign currencies | (867,372) | |||
| Total change in net unrealized appreciation (depreciation) | (1,404,871,443) | |||
| Net gain (loss) | (1,826,834,314) | |||
| Net increase (decrease) in net assets resulting from operations | $ | (1,822,108,254) | ||
| Statement of Changes in Net Assets | ||||
Year ended October 31, 2022 | Year ended October 31, 2021 | |||
| Increase (Decrease) in Net Assets | ||||
| Operations | ||||
| Net investment income (loss) | $ | 4,726,060 | $ | (4,589,070) |
| Net realized gain (loss) | (421,962,871) | 558,318,284 | ||
| Change in net unrealized appreciation (depreciation) | (1,404,871,443) | 692,652,495 | ||
| Net increase (decrease) in net assets resulting from operations | (1,822,108,254) | 1,246,381,709 | ||
| Distributions to shareholders | (482,951,298) | (66,059,567) | ||
| Share transactions | ||||
| Proceeds from sales of shares | 1,823,528,638 | 1,217,696,177 | ||
| Reinvestment of distributions | 405,305,190 | 56,261,510 | ||
| Cost of shares redeemed | (1,952,267,374) | (1,116,865,992) | ||
Net increase (decrease) in net assets resulting from share transactions | 276,566,454 | 157,091,695 | ||
| Total increase (decrease) in net assets | (2,028,493,098) | 1,337,413,837 | ||
| Net Assets | ||||
| Beginning of period | 5,851,756,531 | 4,514,342,694 | ||
| End of period | $ | 3,823,263,433 | $ | 5,851,756,531 |
| Other Information | ||||
| Shares | ||||
| Sold | 78,948,065 | 42,651,879 | ||
| Issued in reinvestment of distributions | 14,830,047 | 2,109,542 | ||
| Redeemed | (87,008,238) | (39,288,434) | ||
| Net increase (decrease) | 6,769,874 | 5,472,987 | ||
| Fidelity® International Capital Appreciation Fund |
| Years ended October 31, | 2022 | 2021 | 2020 | 2019 | 2018 | |||||
Selected Per-Share Data | ||||||||||
| Net asset value, beginning of period | $ | 30.93 | $ | 24.57 | $ | 22.41 | $ | 18.84 | $ | 21.06 |
| Income from Investment Operations | ||||||||||
Net investment income (loss) A,B | .02 | (.02) | .06 | .17 C | .11 | |||||
| Net realized and unrealized gain (loss) | (8.86) | 6.74 | 2.86 | 3.93 | (1.63) | |||||
| Total from investment operations | (8.84) | 6.72 | 2.92 | 4.10 | (1.52) | |||||
| Distributions from net investment income | - | (.05) | (.13) | (.08) | (.07) | |||||
| Distributions from net realized gain | (2.58) | (.31) | (.62) | (.45) | (.63) | |||||
| Total distributions | (2.58) | (.36) | (.76) D | (.53) | (.70) | |||||
| Net asset value, end of period | $ | 19.51 | $ | 30.93 | $ | 24.57 | $ | 22.41 | $ | 18.84 |
Total Return E | (30.97)% | 27.56% | 13.35% | 22.45% | (7.51)% | |||||
Ratios to Average Net Assets B,F,G | ||||||||||
| Expenses before reductions | .99% | 1.00% | 1.03% | 1.01% | 1.06% | |||||
| Expenses net of fee waivers, if any | .98% | 1.00% | 1.03% | 1.01% | 1.06% | |||||
| Expenses net of all reductions | .98% | 1.00% | .99% | 1.00% | 1.01% | |||||
| Net investment income (loss) | .10% | (.08)% | .25% | .81% C | .54% | |||||
| Supplemental Data | ||||||||||
| Net assets, end of period (000 omitted) | $ | 3,823,263 | $ | 5,851,757 | $ | 4,514,343 | $ | 3,480,765 | $ | 2,165,082 |
Portfolio turnover rate H | 112% I | 141% | 135% | 131% I | 157% I |
| Fidelity Central Fund | Investment Manager | Investment Objective | Investment Practices | Expense Ratio A |
| Fidelity Money Market Central Funds | Fidelity Management & Research Company LLC (FMR) | Each fund seeks to obtain a high level of current income consistent with the preservation of capital and liquidity. | Short-term Investments | Less than .005% |
| Gross unrealized appreciation | $581,484,073 |
| Gross unrealized depreciation | (341,697,235) |
| Net unrealized appreciation (depreciation) | $239,786,838 |
| Tax Cost | $3,591,143,770 |
| Undistributed ordinary income | $1,585,564 |
| Capital loss carryforward | $(385,881,335) |
| Net unrealized appreciation (depreciation) on securities and other investments | $238,840,431 |
Short-term | $(385,881,335) |
| Total capital loss carryforward | $(385,881,335) |
| October 31, 2022 | October 31, 2021 | |
| Ordinary Income | $136,649,011 | $ 8,931,998 |
| Long-term Capital Gains | 346,302,287 | 57,127,569 |
| Total | $482,951,298 | $66,059,567 |
| Purchases ($) | Sales ($) | |
| Fidelity International Capital Appreciation Fund | 5,303,244,816 | 5,495,541,223 |
| Shares | Total net realized gain or loss ($) | Total Proceeds ($) | |
| Fidelity International Capital Appreciation Fund | 237,890 | 2,446,488 | 6,501,540 |
| % of Average Net Assets | |
| Fidelity International Capital Appreciation Fund | .03 |
| Amount | |
| Fidelity International Capital Appreciation Fund | $12,505 |
| Borrower or Lender | Average Loan Balance | Weighted Average Interest Rate | Interest Expense | |
Fidelity International Capital Appreciation Fund | Borrower | $ 21,460,696 | 1.49% | $49,710 |
| Purchases ($) | Sales ($) | Realized Gain (Loss) ($) | |
| Fidelity International Capital Appreciation Fund | 432,991,453 | 336,098,784 | (25,136,888) |
| Amount | |
| Fidelity International Capital Appreciation Fund | $8,444 |
| Total Security Lending Fees Paid to NFS | Security Lending Income From Securities Loaned to NFS | Value of Securities Loaned to NFS at Period End | |
| Fidelity International Capital Appreciation Fund | $ 19,738 | $- | $- |
| Average Loan Balance | Weighted Average Interest Rate | Interest Expense | |
| Fidelity International Capital Appreciation Fund | $13,891,600 | .89% | $1,712 |
| Strategic Advisers Fidelity International Fund | |
| Fidelity International Capital Appreciation Fund | 37% |
| Fund | % of shares held |
| Fidelity International Capital Appreciation Fund | 41% |
| Average Annual Total Returns | |||
Periods ended October 31, 2022 | Past 1 year | Past 5 years | Past 10 years |
| Fidelity® Overseas Fund | -30.12% | 1.17% | 6.37% |
| Class K | -30.04% | 1.28% | 6.50% |
| $10,000 Over 10 Years |
Let's say hypothetically that $10,000 was invested in Fidelity® Overseas Fund, a class of the fund, on October 31, 2012. The chart shows how the value of your investment would have changed, and also shows how the MSCI EAFE Index performed over the same period. |
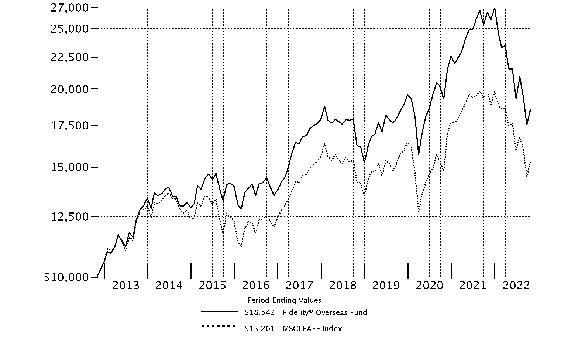 |
Top Holdings (% of Fund's net assets) | ||
| Nestle SA (Reg. S) (Switzerland, Food Products) | 3.5 | |
| Roche Holding AG (participation certificate) (Switzerland, Pharmaceuticals) | 2.8 | |
| LVMH Moet Hennessy Louis Vuitton SE (France, Textiles, Apparel & Luxury Goods) | 2.8 | |
| ASML Holding NV (Netherlands) (Netherlands, Semiconductors & Semiconductor Equipment) | 2.6 | |
| TotalEnergies SE (France, Oil, Gas & Consumable Fuels) | 2.5 | |
| Diageo PLC (United Kingdom, Beverages) | 2.1 | |
| Wolters Kluwer NV (Netherlands, Professional Services) | 1.9 | |
| Compass Group PLC (United Kingdom, Hotels, Restaurants & Leisure) | 1.7 | |
| RELX PLC (London Stock Exchange) (United Kingdom, Professional Services) | 1.6 | |
| AIA Group Ltd. (Hong Kong, Insurance) | 1.6 | |
| 23.1 | ||
| Market Sectors (% of Fund's net assets) | ||
| Industrials | 21.7 | |
| Financials | 20.7 | |
| Health Care | 14.7 | |
| Information Technology | 13.6 | |
| Consumer Discretionary | 9.4 | |
| Consumer Staples | 7.0 | |
| Materials | 4.7 | |
| Energy | 2.5 | |
| Real Estate | 1.2 | |
| Communication Services | 0.7 | |
Asset Allocation (% of Fund's net assets) |
 |
Foreign investments - 89.3% |
Geographic Diversification (% of Fund's net assets) |
 |
* Includes Short-Term investments and Net Other Assets (Liabilities). Percentages are based on country or territory of incorporation and are adjusted for the effect of futures contracts, if applicable. |
| Common Stocks - 96.2% | |||
| Shares | Value ($) | ||
| Bailiwick of Jersey - 2.4% | |||
| Experian PLC | 2,051,300 | 65,406,267 | |
| Ferguson PLC | 709,900 | 77,422,177 | |
| JTC PLC (a) | 2,649,000 | 21,234,734 | |
TOTAL BAILIWICK OF JERSEY | 164,063,178 | ||
| Belgium - 0.9% | |||
| Azelis Group NV | 593,600 | 13,586,240 | |
| KBC Group NV | 881,590 | 44,181,552 | |
TOTAL BELGIUM | 57,767,792 | ||
| Bermuda - 0.5% | |||
| Hiscox Ltd. | 2,935,313 | 30,269,023 | |
| Canada - 1.5% | |||
| Constellation Software, Inc. | 67,900 | 98,180,006 | |
| Topicus.Com, Inc. (b) | 122,288 | 6,346,212 | |
TOTAL CANADA | 104,526,218 | ||
| Denmark - 1.5% | |||
| DSV A/S | 743,000 | 100,587,978 | |
| Finland - 1.0% | |||
| Nordea Bank ABP | 7,207,600 | 68,882,545 | |
| France - 17.0% | |||
| Air Liquide SA | 665,629 | 87,073,435 | |
| ALTEN | 508,056 | 59,396,814 | |
| Antin Infrastructure Partners SA | 198,900 | 4,328,316 | |
| BNP Paribas SA | 1,392,200 | 65,285,717 | |
| Capgemini SA | 596,433 | 97,749,911 | |
| Edenred SA | 1,981,079 | 101,727,357 | |
| EssilorLuxottica SA (c) | 615,613 | 97,553,661 | |
| LVMH Moet Hennessy Louis Vuitton SE | 305,263 | 192,619,395 | |
| Pernod Ricard SA | 543,800 | 95,497,820 | |
| Safran SA | 806,100 | 89,775,346 | |
| Teleperformance | 358,366 | 96,082,306 | |
| TotalEnergies SE (c) | 3,088,544 | 168,490,474 | |
TOTAL FRANCE | 1,155,580,552 | ||
| Germany - 6.8% | |||
| Allianz SE | 440,901 | 79,320,081 | |
| Brenntag SE | 769,300 | 46,678,320 | |
| Deutsche Borse AG | 552,491 | 89,845,958 | |
| Hannover Reuck SE | 478,200 | 77,881,374 | |
| Merck KGaA | 608,900 | 99,229,475 | |
| Siemens Healthineers AG (a) | 1,518,300 | 69,557,240 | |
TOTAL GERMANY | 462,512,448 | ||
| Hong Kong - 1.7% | |||
| AIA Group Ltd. | 14,487,000 | 109,736,042 | |
| Chervon Holdings Ltd. | 699,700 | 2,357,693 | |
TOTAL HONG KONG | 112,093,735 | ||
| India - 1.1% | |||
| HDFC Bank Ltd. (b) | 4,271,000 | 77,509,718 | |
| Ireland - 3.8% | |||
| Flutter Entertainment PLC (b) | 305,074 | 40,513,656 | |
| ICON PLC (b) | 320,300 | 63,368,152 | |
| Kingspan Group PLC (Ireland) | 1,061,200 | 53,590,149 | |
| Linde PLC | 348,000 | 103,477,800 | |
TOTAL IRELAND | 260,949,757 | ||
| Italy - 2.5% | |||
| FinecoBank SpA | 4,669,000 | 62,936,860 | |
| GVS SpA (a)(b) | 528,100 | 2,708,634 | |
| Moncler SpA | 900,200 | 38,867,614 | |
| Recordati SpA | 1,654,330 | 62,174,929 | |
TOTAL ITALY | 166,688,037 | ||
| Japan - 10.6% | |||
| BayCurrent Consulting, Inc. | 598,000 | 16,850,735 | |
| Capcom Co. Ltd. | 968,300 | 26,992,189 | |
| FUJIFILM Holdings Corp. | 1,095,800 | 50,252,263 | |
| Hoya Corp. | 1,032,700 | 96,363,109 | |
| Iriso Electronics Co. Ltd. | 501,900 | 14,581,580 | |
| Misumi Group, Inc. | 1,737,300 | 37,154,000 | |
| NOF Corp. | 941,400 | 32,415,132 | |
| Olympus Corp. | 3,892,000 | 82,187,565 | |
| Persol Holdings Co. Ltd. | 2,299,400 | 46,175,113 | |
| Relo Group, Inc. | 1,741,700 | 24,621,227 | |
| SMC Corp. | 142,300 | 57,119,543 | |
| Sony Group Corp. | 1,451,400 | 97,874,667 | |
| Suzuki Motor Corp. | 1,456,500 | 49,171,996 | |
| TIS, Inc. | 1,542,800 | 41,658,038 | |
| Tokyo Electron Ltd. | 184,200 | 48,462,397 | |
TOTAL JAPAN | 721,879,554 | ||
| Kenya - 0.3% | |||
| Safaricom Ltd. | 99,329,800 | 20,545,348 | |
| Luxembourg - 0.9% | |||
| Eurofins Scientific SA | 915,300 | 58,596,440 | |
| Netherlands - 7.0% | |||
| ASM International NV (Netherlands) | 224,300 | 49,830,174 | |
| ASML Holding NV (Netherlands) | 374,400 | 175,626,234 | |
| Euronext NV (a) | 634,980 | 40,349,471 | |
| IMCD NV | 622,424 | 80,764,011 | |
| Wolters Kluwer NV | 1,201,600 | 127,713,604 | |
TOTAL NETHERLANDS | 474,283,494 | ||
| Spain - 1.2% | |||
| Amadeus IT Holding SA Class A (b) | 1,543,657 | 80,509,900 | |
| Sweden - 4.9% | |||
| Addlife AB | 2,778,272 | 25,967,981 | |
| AddTech AB (B Shares) | 3,841,696 | 46,485,037 | |
| Atlas Copco AB (A Shares) | 7,226,144 | 77,126,468 | |
| Hexagon AB (B Shares) | 8,094,542 | 80,021,804 | |
| Indutrade AB | 4,506,101 | 78,909,415 | |
| Kry International AB (b)(d)(e) | 2,787 | 487,916 | |
| Nordnet AB | 1,707,563 | 21,187,564 | |
TOTAL SWEDEN | 330,186,185 | ||
| Switzerland - 13.5% | |||
| Compagnie Financiere Richemont SA Series A | 978,040 | 95,587,328 | |
| Julius Baer Group Ltd. | 1,245,264 | 59,746,362 | |
| Nestle SA (Reg. S) | 2,196,520 | 239,110,529 | |
| Partners Group Holding AG | 68,620 | 61,633,623 | |
| Roche Holding AG (participation certificate) | 581,708 | 193,009,661 | |
| Sika AG | 432,452 | 97,507,473 | |
| Sonova Holding AG | 300,391 | 71,006,691 | |
| Zurich Insurance Group Ltd. | 238,210 | 101,518,899 | |
TOTAL SWITZERLAND | 919,120,566 | ||
| Taiwan - 0.4% | |||
| Taiwan Semiconductor Manufacturing Co. Ltd. | 2,221,000 | 26,675,249 | |
| United Kingdom - 9.8% | |||
| BAE Systems PLC | 6,230,700 | 58,279,288 | |
| Beazley PLC | 4,246,600 | 30,413,155 | |
| Compass Group PLC | 5,462,298 | 115,045,973 | |
| Dechra Pharmaceuticals PLC | 970,795 | 29,168,662 | |
| Diageo PLC | 3,517,300 | 144,745,744 | |
| Diploma PLC | 1,567,295 | 44,682,715 | |
| RELX PLC (London Stock Exchange) | 4,105,600 | 110,278,446 | |
| Rentokil Initial PLC | 12,413,815 | 77,463,579 | |
| St. James's Place PLC | 2,727,800 | 33,315,767 | |
| Volution Group PLC | 7,215,267 | 25,568,107 | |
TOTAL UNITED KINGDOM | 668,961,436 | ||
| United States of America - 6.9% | |||
| Ares Management Corp. | 272,500 | 20,663,675 | |
| CBRE Group, Inc. (b) | 791,300 | 56,134,822 | |
| Equifax, Inc. | 168,800 | 28,618,352 | |
| Intercontinental Exchange, Inc. | 608,700 | 58,173,459 | |
| Marsh & McLennan Companies, Inc. | 661,500 | 106,825,635 | |
| Moody's Corp. | 210,900 | 55,861,083 | |
| Pool Corp. | 26,700 | 8,122,941 | |
| S&P Global, Inc. | 252,805 | 81,213,606 | |
| Thermo Fisher Scientific, Inc. | 109,400 | 56,228,318 | |
TOTAL UNITED STATES OF AMERICA | 471,841,891 | ||
| TOTAL COMMON STOCKS (Cost $5,745,185,879) | 6,534,031,044 | ||
| Nonconvertible Preferred Stocks - 0.0% | |||
| Shares | Value ($) | ||
| Sweden - 0.0% | |||
Kry International AB Series E (b)(d)(e) (Cost $7,360,943) | 16,101 | 2,818,778 | |
| Money Market Funds - 3.4% | |||
| Shares | Value ($) | ||
| Fidelity Cash Central Fund 3.10% (f) | 214,935,753 | 214,978,741 | |
| Fidelity Securities Lending Cash Central Fund 3.10% (f)(g) | 17,312,656 | 17,314,388 | |
| TOTAL MONEY MARKET FUNDS (Cost $232,293,129) | 232,293,129 | ||
| TOTAL INVESTMENT IN SECURITIES - 99.6% (Cost $5,984,839,951) | 6,769,142,951 |
NET OTHER ASSETS (LIABILITIES) - 0.4% | 26,636,008 |
| NET ASSETS - 100.0% | 6,795,778,959 |
| (a) | Security exempt from registration under Rule 144A of the Securities Act of 1933. These securities may be resold in transactions exempt from registration, normally to qualified institutional buyers. At the end of the period, the value of these securities amounted to $133,850,079 or 2.0% of net assets. |
| (b) | Non-income producing |
| (c) | Security or a portion of the security is on loan at period end. |
| (d) | Restricted securities (including private placements) - Investment in securities not registered under the Securities Act of 1933 (excluding 144A issues). At the end of the period, the value of restricted securities (excluding 144A issues) amounted to $3,306,694 or 0.0% of net assets. |
| (e) | Level 3 security |
| (f) | Affiliated fund that is generally available only to investment companies and other accounts managed by Fidelity Investments. The rate quoted is the annualized seven-day yield of the fund at period end. A complete unaudited listing of the fund's holdings as of its most recent quarter end is available upon request. In addition, each Fidelity Central Fund's financial statements, which are not covered by the Fund's Report of Independent Registered Public Accounting Firm, are available on the SEC's website or upon request. |
| (g) | Investment made with cash collateral received from securities on loan. |
| Additional information on each restricted holding is as follows: | ||
| Security | Acquisition Date | Acquisition Cost ($) |
| Kry International AB | 5/14/21 | 1,210,410 |
| Kry International AB Series E | 5/14/21 | 7,360,943 |
| Affiliate | Value, beginning of period ($) | Purchases ($) | Sales Proceeds ($) | Dividend Income ($) | Realized Gain (loss) ($) | Change in Unrealized appreciation (depreciation) ($) | Value, end of period ($) | % ownership, end of period |
| Fidelity Cash Central Fund 3.10% | 322,300,071 | 1,960,929,307 | 2,068,250,637 | 1,849,132 | - | - | 214,978,741 | 0.4% |
| Fidelity Securities Lending Cash Central Fund 3.10% | - | 1,002,465,009 | 985,150,621 | 621,427 | - | - | 17,314,388 | 0.0% |
| Total | 322,300,071 | 2,963,394,316 | 3,053,401,258 | 2,470,559 | - | - | 232,293,129 | |
| Valuation Inputs at Reporting Date: | ||||
| Description | Total ($) | Level 1 ($) | Level 2 ($) | Level 3 ($) |
Investments in Securities: | ||||
| Equities: | ||||
Communication Services | 47,537,537 | 47,537,537 | - | - |
Consumer Discretionary | 640,161,263 | 139,033,900 | 501,127,363 | - |
Consumer Staples | 479,354,093 | 95,497,820 | 383,856,273 | - |
Energy | 168,490,474 | - | 168,490,474 | - |
Financials | 1,402,314,219 | 775,169,890 | 627,144,329 | - |
Health Care | 1,004,411,884 | 642,615,508 | 361,796,376 | - |
Industrials | 1,459,025,830 | 876,898,573 | 582,127,257 | - |
Information Technology | 934,324,633 | 421,972,444 | 509,045,495 | 3,306,694 |
Materials | 320,473,840 | 135,892,932 | 184,580,908 | - |
Real Estate | 80,756,049 | 80,756,049 | - | - |
| Money Market Funds | 232,293,129 | 232,293,129 | - | - |
| Total Investments in Securities: | 6,769,142,951 | 3,447,667,782 | 3,318,168,475 | 3,306,694 |
| Statement of Assets and Liabilities | ||||
| October 31, 2022 | ||||
| Assets | ||||
| Investment in securities, at value (including securities loaned of $16,468,329) - See accompanying schedule: | ||||
Unaffiliated issuers (cost $5,752,546,822) | $6,536,849,822 | |||
Fidelity Central Funds (cost $232,293,129) | 232,293,129 | |||
| Total Investment in Securities (cost $5,984,839,951) | $ | 6,769,142,951 | ||
| Foreign currency held at value (cost $13,970,625) | 13,966,990 | |||
| Receivable for investments sold | 13,436,299 | |||
| Receivable for fund shares sold | 2,503,873 | |||
| Dividends receivable | 7,269,354 | |||
| Reclaims receivable | 20,533,527 | |||
| Distributions receivable from Fidelity Central Funds | 591,319 | |||
| Prepaid expenses | 11,699 | |||
| Other receivables | 231,387 | |||
Total assets | 6,827,687,399 | |||
| Liabilities | ||||
| Payable for investments purchased | 4,565,587 | |||
| Payable for fund shares redeemed | 2,813,541 | |||
| Accrued management fee | 4,327,665 | |||
| Other affiliated payables | 931,619 | |||
| Deferred taxes | 1,580,113 | |||
| Other payables and accrued expenses | 375,527 | |||
| Collateral on securities loaned | 17,314,388 | |||
| Total Liabilities | 31,908,440 | |||
| Net Assets | $ | 6,795,778,959 | ||
| Net Assets consist of: | ||||
| Paid in capital | $ | 6,236,681,262 | ||
| Total accumulated earnings (loss) | 559,097,697 | |||
| Net Assets | $ | 6,795,778,959 | ||
| Net Asset Value and Maximum Offering Price | ||||
| Overseas : | ||||
Net Asset Value , offering price and redemption price per share ($6,175,775,773 ÷ 132,662,179 shares) | $ | 46.55 | ||
| Class K : | ||||
Net Asset Value , offering price and redemption price per share ($620,003,186 ÷ 13,339,627 shares) | $ | 46.48 | ||
| Statement of Operations | ||||
Year ended October 31, 2022 | ||||
| Investment Income | ||||
| Dividends | $ | 173,993,724 | ||
| Foreign Tax Reclaims | 12,959,313 | |||
| Income from Fidelity Central Funds (including $621,427 from security lending) | 2,470,559 | |||
| Income before foreign taxes withheld | 189,423,596 | |||
| Less foreign taxes withheld | (33,267,625) | |||
| Total Income | 156,155,971 | |||
| Expenses | ||||
| Management fee | ||||
| Basic fee | $ | 56,978,038 | ||
| Performance adjustment | 10,979,557 | |||
| Transfer agent fees | 11,411,741 | |||
| Accounting fees | 1,690,967 | |||
| Custodian fees and expenses | 375,200 | |||
| Independent trustees' fees and expenses | 30,599 | |||
| Registration fees | 202,873 | |||
| Audit | 109,129 | |||
| Legal | 10,102 | |||
| Interest | 1,762 | |||
| Miscellaneous | 39,117 | |||
| Total expenses before reductions | 81,829,085 | |||
| Expense reductions | (286,107) | |||
| Total expenses after reductions | 81,542,978 | |||
| Net Investment income (loss) | 74,612,993 | |||
| Realized and Unrealized Gain (Loss) | ||||
| Net realized gain (loss) on: | ||||
| Investment Securities: | ||||
| Unaffiliated issuers(net of foreign taxes of $3,009,946) | (254,184,558) | |||
| Foreign currency transactions | (1,742,019) | |||
| Futures contracts | (5,750,613) | |||
| Total net realized gain (loss) | (261,677,190) | |||
| Change in net unrealized appreciation (depreciation) on: | ||||
| Investment Securities: | ||||
| Unaffiliated issuers (net of decrease in deferred foreign taxes of $4,019,684) | (3,013,199,946) | |||
| Assets and liabilities in foreign currencies | (2,257,170) | |||
| Total change in net unrealized appreciation (depreciation) | (3,015,457,116) | |||
| Net gain (loss) | (3,277,134,306) | |||
| Net increase (decrease) in net assets resulting from operations | $ | (3,202,521,313) | ||
| Statement of Changes in Net Assets | ||||
Year ended October 31, 2022 | Year ended October 31, 2021 | |||
| Increase (Decrease) in Net Assets | ||||
| Operations | ||||
| Net investment income (loss) | $ | 74,612,993 | $ | 31,780,291 |
| Net realized gain (loss) | (261,677,190) | 475,517,138 | ||
| Change in net unrealized appreciation (depreciation) | (3,015,457,116) | 2,241,484,861 | ||
| Net increase (decrease) in net assets resulting from operations | (3,202,521,313) | 2,748,782,290 | ||
| Distributions to shareholders | (471,071,500) | (45,118,729) | ||
| Share transactions - net increase (decrease) | (103,633,659) | 686,322,636 | ||
| Total increase (decrease) in net assets | (3,777,226,472) | 3,389,986,197 | ||
| Net Assets | ||||
| Beginning of period | 10,573,005,431 | 7,183,019,234 | ||
| End of period | $ | 6,795,778,959 | $ | 10,573,005,431 |
| Fidelity® Overseas Fund |
| Years ended October 31, | 2022 | 2021 | 2020 | 2019 | 2018 | |||||
Selected Per-Share Data | ||||||||||
| Net asset value, beginning of period | $ | 69.79 | $ | 50.91 | $ | 49.51 | $ | 46.04 | $ | 50.18 |
| Income from Investment Operations | ||||||||||
Net investment income (loss) A,B | .47 | .21 | .13 | .77 | .68 | |||||
| Net realized and unrealized gain (loss) | (20.64) | 18.98 | 1.97 | 5.12 | (4.27) | |||||
| Total from investment operations | (20.17) | 19.19 | 2.10 | 5.89 | (3.59) | |||||
| Distributions from net investment income | (.20) | (.11) | (.70) | (.68) | (.52) | |||||
| Distributions from net realized gain | (2.87) | (.21) | - | (1.74) | (.03) | |||||
| Total distributions | (3.07) | (.31) C | (.70) | (2.42) | (.55) | |||||
| Net asset value, end of period | $ | 46.55 | $ | 69.79 | $ | 50.91 | $ | 49.51 | $ | 46.04 |
Total Return D | (30.12)% | 37.83% | 4.25% | 13.78% | (7.23)% | |||||
Ratios to Average Net Assets B,E,F | ||||||||||
| Expenses before reductions | .95% | .99% | 1.04% | .90% | .97% | |||||
| Expenses net of fee waivers, if any | .95% | .98% | 1.04% | .90% | .97% | |||||
| Expenses net of all reductions | .94% | .98% | 1.03% | .89% | .96% | |||||
| Net investment income (loss) | .84% | .33% | .27% | 1.68% | 1.35% | |||||
| Supplemental Data | ||||||||||
| Net assets, end of period (000 omitted) | $ | 6,175,776 | $ | 8,981,609 | $ | 6,160,617 | $ | 6,182,831 | $ | 5,825,757 |
Portfolio turnover rate G | 25% | 30% H | 41% | 46% H | 33% |
| Fidelity® Overseas Fund Class K |
| Years ended October 31, | 2022 | 2021 | 2020 | 2019 | 2018 | |||||
Selected Per-Share Data | ||||||||||
| Net asset value, beginning of period | $ | 69.68 | $ | 50.83 | $ | 49.43 | $ | 45.98 | $ | 50.11 |
| Income from Investment Operations | ||||||||||
Net investment income (loss) A,B | .54 | .27 | .19 | .82 | .73 | |||||
| Net realized and unrealized gain (loss) | (20.60) | 18.95 | 1.96 | 5.11 | (4.26) | |||||
| Total from investment operations | (20.06) | 19.22 | 2.15 | 5.93 | (3.53) | |||||
| Distributions from net investment income | (.26) | (.16) | (.75) | (.73) | (.57) | |||||
| Distributions from net realized gain | (2.87) | (.21) | - | (1.74) | (.03) | |||||
| Total distributions | (3.14) C | (.37) | (.75) | (2.48) C | (.60) | |||||
| Net asset value, end of period | $ | 46.48 | $ | 69.68 | $ | 50.83 | $ | 49.43 | $ | 45.98 |
Total Return D | (30.04)% | 37.97% | 4.36% | 13.90% | (7.13)% | |||||
Ratios to Average Net Assets B,E,F | ||||||||||
| Expenses before reductions | .84% | .89% | .94% | .78% | .86% | |||||
| Expenses net of fee waivers, if any | .84% | .88% | .93% | .78% | .86% | |||||
| Expenses net of all reductions | .84% | .88% | .93% | .77% | .85% | |||||
| Net investment income (loss) | .94% | .43% | .38% | 1.79% | 1.46% | |||||
| Supplemental Data | ||||||||||
| Net assets, end of period (000 omitted) | $ | 620,003 | $ | 1,591,397 | $ | 1,022,402 | $ | 1,040,002 | $ | 1,026,091 |
Portfolio turnover rate G | 25% | 30% H | 41% | 46% H | 33% |
| Fidelity Central Fund | Investment Manager | Investment Objective | Investment Practices | Expense Ratio A |
| Fidelity Money Market Central Funds | Fidelity Management & Research Company LLC (FMR) | Each fund seeks to obtain a high level of current income consistent with the preservation of capital and liquidity. | Short-term Investments | Less than .005% |
| Fidelity Overseas Fund | $231,356 |
| Gross unrealized appreciation | $1,364,485,764 |
| Gross unrealized depreciation | (608,868,602) |
| Net unrealized appreciation (depreciation) | $755,617,162 |
| Tax Cost | $6,013,525,789 |
| Undistributed ordinary income | $55,904,293 |
| Capital loss carryforward | $(248,124,930) |
| Net unrealized appreciation (depreciation) on securities and other investments | $753,088,695 |
Short-term | $(248,124,930) |
| Total capital loss carryforward | $(248,124,930) |
| October 31, 2022 | October 31, 2021 | |
| Ordinary Income | $57,969,693 | $16,186,407 |
| Long-term Capital Gains | 413,101,807 | 28,932,322 |
| Total | $471,071,500 | $45,118,729 |
| Equity Risk | Equity risk relates to the fluctuations in the value of financial instruments as a result of changes in market prices (other than those arising from interest rate risk or foreign exchange risk), whether caused by factors specific to an individual investment, its issuer, or all factors affecting all instruments traded in a market or market segment. |
| Purchases ($) | Sales ($) | |
| Fidelity Overseas Fund | 2,130,017,566 | 2,576,920,413 |
| Amount | % of Class-Level Average Net Assets | |
| Overseas | $10,921,951 | .14 |
| Class K | 489,790 | .04 |
| $11,411,741 |
| % of Average Net Assets | |
| Fidelity Overseas Fund | .02 |
| Amount | |
| Fidelity Overseas Fund | $ 2,260 |
| Borrower or Lender | Average Loan Balance | Weighted Average Interest Rate | Interest Expense | |
| Fidelity Overseas Fund | Borrower | $24,726,000 | 2.57% | $1,762 |
| Purchases ($) | Sales ($) | Realized Gain (Loss) ($) | |
| Fidelity Overseas Fund | 125,449,999 | 130,877,343 | (27,955,313) |
| Shares | Total Proceeds ($) | Participating classes | |
| Fidelity Overseas Fund | 1,544,949 | 98,196,961 | Overseas |
| Amount | |
| Fidelity Overseas Fund | $15,466 |
| Total Security Lending Fees Paid to NFS | Security Lending Income From Securities Loaned to NFS | Value of Securities Loaned to NFS at Period End | |
| Fidelity Overseas Fund | $63,849 | $ - | $- |
Year ended October 31, 2022 | Year ended October 31, 2021 | |
| Fidelity Overseas Fund | ||
| Distributions to shareholders | ||
| Overseas | $398,074,722 | $37,598,959 |
| Class K | 72,996,778 | 7,519,770 |
Total | $471,071,500 | $45,118,729 |
| Shares | Shares | Dollars | Dollars | |
| Year ended October 31, 2022 | Year ended October 31, 2021 | Year ended October 31, 2022 | Year ended October 31, 2021 | |
| Fidelity Overseas Fund | ||||
| Overseas | ||||
| Shares sold | 40,345,843 | 22,257,713 | $2,183,494,857 | $1,441,872,978 |
| Reinvestment of distributions | 5,519,644 | 591,381 | 355,685,872 | 34,075,384 |
| Shares redeemed | (41,890,883) | (15,174,982) | (2,190,097,209) | (956,264,272) |
| Net increase (decrease) | 3,974,604 | 7,674,112 | $ 349,083,520 | $ 519,684,090 |
| Class K | ||||
| Shares sold | 4,842,077 | 11,014,981 | $ 287,643,692 | $ 703,185,104 |
| Reinvestment of distributions | 1,135,606 | 130,824 | 72,996,779 | 7,519,770 |
| Shares redeemed | (15,475,778) | (8,423,101) | (813,357,650) | (544,066,328) |
| Net increase (decrease) | (9,498,095) | 2,722,704 | $(452,717,179) | $166,638,546 |
| Strategic Advisers Fidelity International Fund | |
| Fidelity Overseas Fund | 29% |
| Fund | % of shares held |
| Fidelity Overseas Fund | 48% |
| Average Annual Total Returns | |||
Periods ended October 31, 2022 | Past 1 year | Past 5 years | Past 10 years |
| Class A (incl.5.75% sales charge) | -31.49% | 5.88% | 8.87% |
| Class M (incl.3.50% sales charge) | -30.07% | 6.08% | 8.81% |
Class C (incl. contingent deferred sales charge) | -28.52% | 6.29% | 8.83% |
| Fidelity® Worldwide Fund | -27.12% | 7.44% | 9.84% |
| Class I | -27.13% | 7.43% | 9.81% |
| Class Z | -27.05% | 7.54% | 9.87% |
| $10,000 Over 10 Years |
Let's say hypothetically that $10,000 was invested in Fidelity® Worldwide Fund, a class of the fund, on October 31, 2012. The chart shows how the value of your investment would have changed, and also shows how the MSCI World Index performed over the same period. |
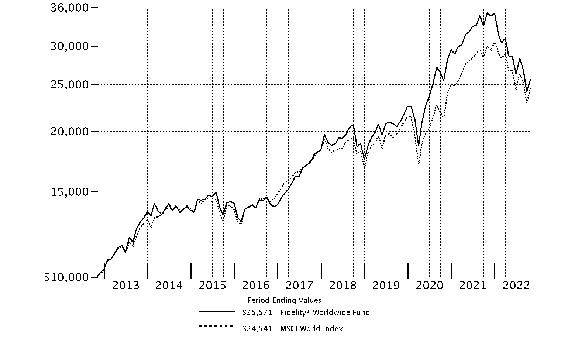 |
Top Holdings (% of Fund's net assets) | ||
| UnitedHealth Group, Inc. (United States of America, Health Care Providers & Services) | 5.1 | |
| Microsoft Corp. (United States of America, Software) | 4.2 | |
| Apple, Inc. (United States of America, Technology Hardware, Storage & Peripherals) | 4.1 | |
| Alphabet, Inc. Class A (United States of America, Interactive Media & Services) | 3.3 | |
| Amazon.com, Inc. (United States of America, Internet & Direct Marketing Retail) | 2.8 | |
| Estee Lauder Companies, Inc. Class A (United States of America, Personal Products) | 2.5 | |
| Constellation Energy Corp. (United States of America, Electric Utilities) | 2.4 | |
| Eli Lilly & Co. (United States of America, Pharmaceuticals) | 2.4 | |
| JPMorgan Chase & Co. (United States of America, Banks) | 2.3 | |
| The Travelers Companies, Inc. (United States of America, Insurance) | 2.2 | |
| 31.3 | ||
| Market Sectors (% of Fund's net assets) | ||
| Information Technology | 21.3 | |
| Health Care | 18.3 | |
| Financials | 16.3 | |
| Consumer Discretionary | 13.3 | |
| Industrials | 9.3 | |
| Consumer Staples | 6.6 | |
| Communication Services | 5.4 | |
| Energy | 3.1 | |
| Utilities | 2.6 | |
| Materials | 2.2 | |
| Real Estate | 0.5 | |
Asset Allocation (% of Fund's net assets) |
 |
Foreign investments - 31% |
Geographic Diversification (% of Fund's net assets) |
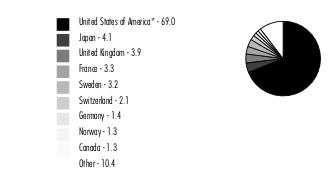 |
* Includes Short-Term investments and Net Other Assets (Liabilities). Percentages are based on country or territory of incorporation and are adjusted for the effect of futures contracts, if applicable. |
| Common Stocks - 98.5% | |||
| Shares | Value ($) | ||
| Australia - 0.3% | |||
| National Storage REIT unit | 3,925,764 | 6,554,010 | |
| Austria - 0.2% | |||
| Wienerberger AG | 203,600 | 4,655,946 | |
| Bailiwick of Jersey - 0.4% | |||
| Glencore PLC | 1,600,000 | 9,172,918 | |
| Belgium - 0.5% | |||
| Fagron NV | 185,330 | 2,307,720 | |
| KBC Group NV | 84,854 | 4,252,523 | |
| UCB SA | 60,600 | 4,570,648 | |
TOTAL BELGIUM | 11,130,891 | ||
| Bermuda - 0.6% | |||
| Hiscox Ltd. | 480,040 | 4,950,185 | |
| Lancashire Holdings Ltd. | 1,178,720 | 6,693,896 | |
TOTAL BERMUDA | 11,644,081 | ||
| Canada - 1.3% | |||
| Canadian Pacific Railway Ltd. | 67,000 | 4,994,693 | |
| Constellation Software, Inc. | 3,700 | 5,350,015 | |
| Definity Financial Corp. | 144,900 | 4,291,639 | |
| PrairieSky Royalty Ltd. | 836,000 | 12,984,740 | |
TOTAL CANADA | 27,621,087 | ||
| Cayman Islands - 0.1% | |||
| Tencent Holdings Ltd. | 120,000 | 3,153,215 | |
| China - 0.7% | |||
| Centre Testing International Group Co. Ltd. (A Shares) | 959,500 | 2,460,863 | |
| Kweichow Moutai Co. Ltd. (A Shares) | 18,100 | 3,330,335 | |
| PICC Property & Casualty Co. Ltd. (H Shares) | 5,706,946 | 5,263,711 | |
| Yunnan Baiyao Group Co. Ltd. (A Shares) | 372,120 | 2,780,110 | |
TOTAL CHINA | 13,835,019 | ||
| Cyprus - 0.0% | |||
| Fix Price Group Ltd. GDR (Reg. S) (a) | 139,553 | 51,541 | |
| Denmark - 0.6% | |||
| DSV A/S | 38,284 | 5,182,921 | |
| GN Store Nord A/S (b) | 214,875 | 4,568,835 | |
| ORSTED A/S (c) | 38,100 | 3,143,469 | |
TOTAL DENMARK | 12,895,225 | ||
| Finland - 0.9% | |||
| Nanoform Finland PLC (d) | 754,800 | 1,976,717 | |
| Olvi Oyj (A Shares) | 86,661 | 2,676,335 | |
| Sampo Oyj (A Shares) | 213,751 | 9,776,161 | |
| UPM-Kymmene Corp. | 131,930 | 4,421,180 | |
TOTAL FINLAND | 18,850,393 | ||
| France - 3.3% | |||
| Edenred SA | 115,291 | 5,920,132 | |
| L'Oreal SA | 20,800 | 6,531,291 | |
| LVMH Moet Hennessy Louis Vuitton SE | 60,717 | 38,312,117 | |
| Sanofi SA | 87,000 | 7,487,034 | |
| TotalEnergies SE (b) | 101,941 | 5,561,225 | |
| Worldline SA (c)(d) | 113,900 | 4,971,336 | |
TOTAL FRANCE | 68,783,135 | ||
| Germany - 1.4% | |||
| Brenntag SE | 110,000 | 6,674,399 | |
| Deutsche Post AG | 204,311 | 7,222,359 | |
| Instone Real Estate Group BV (b)(c) | 332,488 | 2,421,644 | |
| Nexus AG | 46,000 | 2,468,451 | |
| Novem Group SA | 292,876 | 1,829,227 | |
| Siemens Healthineers AG (c) | 63,100 | 2,890,774 | |
| Stabilus Se | 118,586 | 6,510,050 | |
TOTAL GERMANY | 30,016,904 | ||
| Hong Kong - 0.5% | |||
| AIA Group Ltd. | 761,327 | 5,766,895 | |
| Hong Kong Exchanges and Clearing Ltd. | 170,174 | 4,517,034 | |
TOTAL HONG KONG | 10,283,929 | ||
| Hungary - 0.1% | |||
| Richter Gedeon PLC | 86,900 | 1,715,900 | |
| India - 0.4% | |||
| Delhivery Private Ltd. (d)(e) | 203,700 | 804,637 | |
| HDFC Bank Ltd. (d) | 212,324 | 3,853,237 | |
| HDFC Bank Ltd. sponsored ADR | 40,335 | 2,513,274 | |
| Pine Labs Private Ltd. (a)(d)(e) | 792 | 397,418 | |
TOTAL INDIA | 7,568,566 | ||
| Indonesia - 1.0% | |||
| PT Astra International Tbk | 13,899,000 | 5,925,844 | |
| PT Bank Central Asia Tbk | 11,972,800 | 6,754,970 | |
| PT Bank Rakyat Indonesia (Persero) Tbk | 12,303,600 | 3,668,007 | |
| PT United Tractors Tbk | 2,284,600 | 4,731,052 | |
TOTAL INDONESIA | 21,079,873 | ||
| Ireland - 1.1% | |||
| Cairn Homes PLC | 1,030,838 | 994,201 | |
| CRH PLC | 196,900 | 7,091,916 | |
| Flutter Entertainment PLC (d) | 46,300 | 6,148,614 | |
| ICON PLC (d) | 9,900 | 1,958,616 | |
| Irish Residential Properties REIT PLC | 2,591,367 | 2,801,645 | |
| Kingspan Group PLC (Ireland) | 61,900 | 3,125,924 | |
TOTAL IRELAND | 22,120,916 | ||
| Italy - 0.7% | |||
| BFF Bank SpA (c) | 1,389,790 | 9,806,504 | |
| MARR SpA | 205,098 | 2,160,655 | |
| Prada SpA | 527,094 | 2,400,567 | |
TOTAL ITALY | 14,367,726 | ||
| Japan - 4.1% | |||
| Capcom Co. Ltd. | 141,934 | 3,956,531 | |
| Daiichi Sankyo Kabushiki Kaisha | 142,200 | 4,551,931 | |
| Daiichikosho Co. Ltd. | 116,080 | 3,333,411 | |
| FUJIFILM Holdings Corp. | 87,992 | 4,035,223 | |
| GMO Internet, Inc. | 300,866 | 5,202,102 | |
| Hitachi Ltd. | 219,300 | 9,969,858 | |
| Hoya Corp. | 63,443 | 5,919,981 | |
| Iriso Electronics Co. Ltd. | 115,285 | 3,349,347 | |
| Keyence Corp. | 19,340 | 7,325,255 | |
| Minebea Mitsumi, Inc. | 352,600 | 5,226,338 | |
| PALTAC Corp. | 93,491 | 2,659,585 | |
| Recruit Holdings Co. Ltd. | 191,300 | 5,886,525 | |
| Renesas Electronics Corp. (d) | 226,031 | 1,890,919 | |
| Shin-Etsu Chemical Co. Ltd. | 52,403 | 5,446,242 | |
| Sony Group Corp. | 116,703 | 7,869,827 | |
| Tsuruha Holdings, Inc. | 85,000 | 4,944,685 | |
| Z Holdings Corp. | 924,128 | 2,384,952 | |
| ZOZO, Inc. | 129,400 | 2,754,302 | |
TOTAL JAPAN | 86,707,014 | ||
| Kenya - 0.1% | |||
| Safaricom Ltd. | 5,920,700 | 1,224,636 | |
| Netherlands - 0.9% | |||
| Adyen BV (c)(d) | 2,200 | 3,140,719 | |
| Argenx SE ADR (d) | 1,400 | 543,102 | |
| ASML Holding NV (Netherlands) | 4,300 | 2,017,075 | |
| Heineken NV (Bearer) | 78,019 | 6,522,853 | |
| IMCD NV | 32,351 | 4,197,776 | |
| Prosus NV | 42,471 | 1,836,518 | |
| RHI Magnesita NV | 66,422 | 1,410,719 | |
TOTAL NETHERLANDS | 19,668,762 | ||
| Norway - 1.3% | |||
| Equinor ASA | 97,526 | 3,553,235 | |
| Kongsberg Gruppen ASA | 200,000 | 7,168,038 | |
| Schibsted ASA: | |||
| (A Shares) | 71,700 | 1,104,175 | |
| (B Shares) | 292,297 | 4,338,282 | |
| TGS ASA | 696,049 | 9,507,265 | |
| Volue A/S (d) | 825,800 | 2,144,698 | |
TOTAL NORWAY | 27,815,693 | ||
| Spain - 0.9% | |||
| Amadeus IT Holding SA Class A (d) | 150,796 | 7,864,811 | |
| Cellnex Telecom SA (c) | 89,256 | 2,921,372 | |
| Cie Automotive SA | 313,535 | 7,975,564 | |
TOTAL SPAIN | 18,761,747 | ||
| Sweden - 3.2% | |||
| Addlife AB | 197,240 | 1,843,565 | |
| Alfa Laval AB | 244,697 | 6,030,328 | |
| Dustin Group AB (c) | 1,042,798 | 4,344,519 | |
| Haypp Group (d) | 525,000 | 1,138,803 | |
| Hemnet Group AB | 673,430 | 8,368,166 | |
| HEXPOL AB (B Shares) | 1,162,959 | 11,480,865 | |
| Instalco AB | 441,771 | 1,769,093 | |
| INVISIO AB | 157,312 | 2,336,627 | |
| Kry International AB (a)(d)(e) | 489 | 85,608 | |
| Sandvik AB | 373,157 | 5,831,231 | |
| Stillfront Group AB (d) | 604,994 | 1,178,624 | |
| Swedbank AB (A Shares) | 727,850 | 10,850,823 | |
| Swedish Match Co. AB | 1,214,987 | 12,496,012 | |
TOTAL SWEDEN | 67,754,264 | ||
| Switzerland - 2.1% | |||
| Chubb Ltd. | 62,000 | 13,323,180 | |
| Nestle SA (Reg. S) | 133,350 | 14,516,321 | |
| Roche Holding AG (participation certificate) | 48,651 | 16,142,314 | |
TOTAL SWITZERLAND | 43,981,815 | ||
| Taiwan - 0.1% | |||
| Taiwan Semiconductor Manufacturing Co. Ltd. | 159,465 | 1,915,249 | |
| United Kingdom - 3.9% | |||
| AstraZeneca PLC (United Kingdom) | 104,843 | 12,301,459 | |
| Beazley PLC | 856,700 | 6,135,485 | |
| Clarkson PLC | 166,062 | 5,265,663 | |
| Close Brothers Group PLC | 269,273 | 3,032,438 | |
| Compass Group PLC | 344,435 | 7,254,430 | |
| Diageo PLC | 293,352 | 12,072,173 | |
| Harbour Energy PLC | 1,486,871 | 6,443,738 | |
| Mondi PLC | 196,151 | 3,289,835 | |
| Prudential PLC | 1,240,786 | 11,526,494 | |
| Rightmove PLC | 393,130 | 2,213,792 | |
| RS GROUP PLC | 303,095 | 3,331,644 | |
| Sabre Insurance Group PLC (c) | 5,555,301 | 5,720,996 | |
| WH Smith PLC (d) | 329,610 | 4,449,022 | |
| Zegona Communications PLC (d) | 30,559 | 26,284 | |
TOTAL UNITED KINGDOM | 83,063,453 | ||
| United States of America - 67.8% | |||
| Adobe, Inc. (d) | 35,000 | 11,147,500 | |
| Alphabet, Inc. Class A (d) | 739,000 | 69,842,890 | |
| Amazon.com, Inc. (d) | 573,000 | 58,698,120 | |
| Ameriprise Financial, Inc. | 22,000 | 6,800,640 | |
| Apple, Inc. | 557,000 | 85,410,380 | |
| Arthur J. Gallagher & Co. | 52,000 | 9,728,160 | |
| Autoliv, Inc. (depositary receipt) | 99,977 | 8,031,699 | |
| Automatic Data Processing, Inc. | 39,000 | 9,426,300 | |
| AutoZone, Inc. (d) | 6,500 | 16,463,720 | |
| Constellation Brands, Inc. Class A (sub. vtg.) | 84,000 | 20,754,720 | |
| Constellation Energy Corp. | 543,999 | 51,429,665 | |
| Cummins, Inc. | 91,500 | 22,372,665 | |
| Danaher Corp. | 71,000 | 17,868,570 | |
| Deckers Outdoor Corp. (d) | 78,255 | 27,383,772 | |
| Eli Lilly & Co. | 141,000 | 51,054,690 | |
| Estee Lauder Companies, Inc. Class A | 264,000 | 52,929,360 | |
| Fiserv, Inc. (d) | 248,201 | 25,500,171 | |
| Gilead Sciences, Inc. | 94,000 | 7,375,240 | |
| Globe Life, Inc. | 115,000 | 13,284,800 | |
| Humana, Inc. | 25,000 | 13,952,000 | |
| Intuit, Inc. | 62,000 | 26,505,000 | |
| J.B. Hunt Transport Services, Inc. | 27,000 | 4,618,890 | |
| JPMorgan Chase & Co. | 377,000 | 47,456,760 | |
| lululemon athletica, Inc. (d) | 11,800 | 3,882,672 | |
| Marvell Technology, Inc. | 157,847 | 6,263,369 | |
| MasterCard, Inc. Class A | 101,000 | 33,146,180 | |
| Microsoft Corp. | 377,000 | 87,513,010 | |
| Moody's Corp. | 16,872 | 4,468,887 | |
| MSCI, Inc. | 98,000 | 45,948,280 | |
| Netflix, Inc. (d) | 28,000 | 8,172,640 | |
| Northrop Grumman Corp. | 81,000 | 44,469,810 | |
| NVIDIA Corp. | 327,000 | 44,135,190 | |
| Oracle Corp. | 126,000 | 9,836,820 | |
| Palo Alto Networks, Inc. (d) | 34,000 | 5,834,060 | |
| PayPal Holdings, Inc. (d) | 84,000 | 7,020,720 | |
| Range Resources Corp. | 781,000 | 22,242,880 | |
| Regeneron Pharmaceuticals, Inc. (d) | 36,000 | 26,955,000 | |
| ResMed, Inc. | 20,596 | 4,607,119 | |
| Royalty Pharma PLC | 859,000 | 36,352,880 | |
| S&P Global, Inc. | 135,628 | 43,570,495 | |
| Stripe, Inc. Class B (a)(d)(e) | 10,000 | 238,100 | |
| Tesla, Inc. (d) | 150,500 | 34,244,770 | |
| The Travelers Companies, Inc. | 254,639 | 46,970,710 | |
| Thermo Fisher Scientific, Inc. | 43,000 | 22,100,710 | |
| TJX Companies, Inc. | 463,000 | 33,382,300 | |
| Union Pacific Corp. | 145,000 | 28,585,300 | |
| UnitedHealth Group, Inc. | 193,000 | 107,143,951 | |
| Vertex Pharmaceuticals, Inc. (d) | 81,000 | 25,272,000 | |
| Visa, Inc. Class A | 168,000 | 34,802,880 | |
TOTAL UNITED STATES OF AMERICA | 1,425,196,445 | ||
| TOTAL COMMON STOCKS (Cost $1,911,481,772) | 2,071,590,353 | ||
| Preferred Stocks - 0.4% | |||
| Shares | Value ($) | ||
| Convertible Preferred Stocks - 0.3% | |||
| China - 0.2% | |||
| ByteDance Ltd. Series E1 (a)(d)(e) | 14,425 | 2,265,014 | |
| dMed Biopharmaceutical Co. Ltd. Series C (a)(d)(e) | 138,905 | 1,245,978 | |
| 3,510,992 | |||
| United States of America - 0.1% | |||
| Circle Internet Financial Ltd. Series F (e) | 23,730 | 1,163,515 | |
| Instacart, Inc. Series I (a)(d)(e) | 8,000 | 296,800 | |
| Stripe, Inc. Series H (a)(d)(e) | 4,200 | 100,002 | |
| 1,560,317 | |||
TOTAL CONVERTIBLE PREFERRED STOCKS | 5,071,309 | ||
| Nonconvertible Preferred Stocks - 0.1% | |||
| India - 0.1% | |||
| Pine Labs Private Ltd.: | |||
| Series 1 (a)(d)(e) | 1,892 | 949,387 | |
| Series A (a)(d)(e) | 473 | 237,347 | |
| Series B (a)(d)(e) | 514 | 257,920 | |
| Series B2 (a)(d)(e) | 416 | 208,745 | |
| Series C (a)(d)(e) | 774 | 388,385 | |
| Series C1 (a)(d)(e) | 163 | 81,792 | |
| Series D (a)(d)(e) | 174 | 87,311 | |
| 2,210,887 | |||
| Sweden - 0.0% | |||
| Kry International AB Series E (a)(d)(e) | 2,824 | 494,393 | |
TOTAL NONCONVERTIBLE PREFERRED STOCKS | 2,705,280 | ||
| TOTAL PREFERRED STOCKS (Cost $8,655,882) | 7,776,589 | ||
| Money Market Funds - 1.1% | |||
| Shares | Value ($) | ||
| Fidelity Cash Central Fund 3.10% (f) | 15,581,384 | 15,584,500 | |
| Fidelity Securities Lending Cash Central Fund 3.10% (f)(g) | 7,255,515 | 7,256,240 | |
| TOTAL MONEY MARKET FUNDS (Cost $22,837,196) | 22,840,740 | ||
| TOTAL INVESTMENT IN SECURITIES - 100.0% (Cost $1,942,974,850) | 2,102,207,682 |
NET OTHER ASSETS (LIABILITIES) - 0.0% | 34,765 |
| NET ASSETS - 100.0% | 2,102,242,447 |
| (a) | Level 3 security |
| (b) | Security or a portion of the security is on loan at period end. |
| (c) | Security exempt from registration under Rule 144A of the Securities Act of 1933. These securities may be resold in transactions exempt from registration, normally to qualified institutional buyers. At the end of the period, the value of these securities amounted to $39,361,333 or 1.9% of net assets. |
| (d) | Non-income producing |
| (e) | Restricted securities (including private placements) - Investment in securities not registered under the Securities Act of 1933 (excluding 144A issues). At the end of the period, the value of restricted securities (excluding 144A issues) amounted to $9,302,352 or 0.4% of net assets. |
| (f) | Affiliated fund that is generally available only to investment companies and other accounts managed by Fidelity Investments. The rate quoted is the annualized seven-day yield of the fund at period end. A complete unaudited listing of the fund's holdings as of its most recent quarter end is available upon request. In addition, each Fidelity Central Fund's financial statements, which are not covered by the Fund's Report of Independent Registered Public Accounting Firm, are available on the SEC's website or upon request. |
| (g) | Investment made with cash collateral received from securities on loan. |
| Additional information on each restricted holding is as follows: | ||
| Security | Acquisition Date | Acquisition Cost ($) |
| ByteDance Ltd. Series E1 | 11/18/20 | 1,580,608 |
| Circle Internet Financial Ltd. Series F | 5/09/22 | 999,982 |
| Delhivery Private Ltd. | 5/20/21 | 994,308 |
| dMed Biopharmaceutical Co. Ltd. Series C | 12/01/20 | 1,972,888 |
| Instacart, Inc. Series I | 2/26/21 | 1,000,000 |
| Kry International AB | 5/14/21 | 212,376 |
| Kry International AB Series E | 5/14/21 | 1,291,057 |
| Pine Labs Private Ltd. | 6/30/21 | 295,305 |
| Pine Labs Private Ltd. Series 1 | 6/30/21 | 705,451 |
| Pine Labs Private Ltd. Series A | 6/30/21 | 176,363 |
| Pine Labs Private Ltd. Series B | 6/30/21 | 191,650 |
| Pine Labs Private Ltd. Series B2 | 6/30/21 | 155,110 |
| Pine Labs Private Ltd. Series C | 6/30/21 | 288,594 |
| Pine Labs Private Ltd. Series C1 | 6/30/21 | 60,776 |
| Pine Labs Private Ltd. Series D | 6/30/21 | 64,878 |
| Stripe, Inc. Class B | 5/18/21 | 401,284 |
| Stripe, Inc. Series H | 3/15/21 | 168,525 |
| Affiliate | Value, beginning of period ($) | Purchases ($) | Sales Proceeds ($) | Dividend Income ($) | Realized Gain (loss) ($) | Change in Unrealized appreciation (depreciation) ($) | Value, end of period ($) | % ownership, end of period |
| Fidelity Cash Central Fund 3.10% | 32,092,646 | 1,324,736,297 | 1,341,244,443 | 350,440 | - | - | 15,584,500 | 0.0% |
| Fidelity Securities Lending Cash Central Fund 3.10% | 13,243,601 | 118,142,030 | 124,129,391 | 164,511 | - | - | 7,256,240 | 0.0% |
| Total | 45,336,247 | 1,442,878,327 | 1,465,373,834 | 514,951 | - | - | 22,840,740 | |
| Valuation Inputs at Reporting Date: | ||||
| Description | Total ($) | Level 1 ($) | Level 2 ($) | Level 3 ($) |
Investments in Securities: | ||||
| Equities: | ||||
Communication Services | 112,218,970 | 101,545,639 | 10,673,331 | - |
Consumer Discretionary | 279,492,049 | 222,707,301 | 56,436,407 | 348,341 |
Consumer Staples | 138,934,740 | 93,318,943 | 45,615,797 | - |
Energy | 65,024,135 | 55,909,675 | 9,114,460 | - |
Financials | 340,926,184 | 300,159,178 | 40,767,006 | - |
Health Care | 387,955,295 | 343,335,805 | 43,373,512 | 1,245,978 |
Industrials | 194,035,632 | 167,616,481 | 26,419,151 | - |
Information Technology | 447,459,883 | 419,868,352 | 21,800,109 | 5,791,422 |
Materials | 46,969,621 | 25,258,545 | 21,711,076 | - |
Real Estate | 11,777,299 | 11,777,299 | - | - |
Utilities | 54,573,134 | 51,429,665 | 3,143,469 | - |
| Money Market Funds | 22,840,740 | 22,840,740 | - | - |
| Total Investments in Securities: | 2,102,207,682 | 1,815,767,623 | 279,054,318 | 7,385,741 |
| Net Unrealized Depreciation on Unfunded Commitments | (227,538) | - | - | (227,538) |
| Total | (227,538) | - | - | (227,538) |
| Statement of Assets and Liabilities | ||||
| October 31, 2022 | ||||
| Assets | ||||
| Investment in securities, at value (including securities loaned of $6,657,640) - See accompanying schedule: | ||||
Unaffiliated issuers (cost $1,920,137,654) | $2,079,366,942 | |||
Fidelity Central Funds (cost $22,837,196) | 22,840,740 | |||
| Total Investment in Securities (cost $1,942,974,850) | $ | 2,102,207,682 | ||
| Foreign currency held at value (cost $5,614,096) | 5,613,796 | |||
| Receivable for investments sold | 29,523,472 | |||
| Receivable for fund shares sold | 653,591 | |||
| Reclaims receivable | 2,893,303 | |||
| Distributions receivable from Fidelity Central Funds | 63,393 | |||
| Prepaid expenses | 3,543 | |||
| Other receivables | 34,497 | |||
Total assets | 2,140,993,277 | |||
| Liabilities | ||||
| Payable for investments purchased | 28,341,077 | |||
| Unrealized depreciation on unfunded commitments | 227,538 | |||
| Payable for fund shares redeemed | 1,168,420 | |||
| Accrued management fee | 1,165,484 | |||
| Distribution and service plan fees payable | 27,031 | |||
| Other affiliated payables | 327,037 | |||
| Deferred taxes | 108,909 | |||
| Other payables and accrued expenses | 129,094 | |||
| Collateral on securities loaned | 7,256,240 | |||
| Total Liabilities | 38,750,830 | |||
| Net Assets | $ | 2,102,242,447 | ||
| Net Assets consist of: | ||||
| Paid in capital | $ | 1,828,056,734 | ||
| Total accumulated earnings (loss) | 274,185,713 | |||
| Net Assets | $ | 2,102,242,447 | ||
| Net Asset Value and Maximum Offering Price | ||||
| Class A : | ||||
Net Asset Value and redemption price per share ($68,608,257 ÷ 2,664,887 shares) (a) | $ | 25.75 | ||
| Maximum offering price per share (100/94.25 of $25.75) | $ | 27.32 | ||
| Class M : | ||||
Net Asset Value and redemption price per share ($15,274,869 ÷ 600,378 shares) (a) | $ | 25.44 | ||
| Maximum offering price per share (100/96.50 of $25.44) | $ | 26.36 | ||
| Class C : | ||||
Net Asset Value and offering price per share ($8,516,555 ÷ 350,111 shares) (a) | $ | 24.33 | ||
| Worldwide : | ||||
Net Asset Value , offering price and redemption price per share ($1,899,787,662 ÷ 72,353,532 shares) | $ | 26.26 | ||
| Class I : | ||||
Net Asset Value , offering price and redemption price per share ($33,225,728 ÷ 1,275,881 shares) | $ | 26.04 | ||
| Class Z : | ||||
Net Asset Value , offering price and redemption price per share ($76,829,376 ÷ 2,949,653 shares) | $ | 26.05 | ||
(a)Redemption price per share is equal to net asset value less any applicable contingent deferred sales charge. | ||||
| Statement of Operations | ||||
Year ended October 31, 2022 | ||||
| Investment Income | ||||
| Dividends | $ | 37,344,360 | ||
| Non-Cash dividends | 2,922,598 | |||
| Income from Fidelity Central Funds (including $164,511 from security lending) | 514,951 | |||
| Income before foreign taxes withheld | 40,781,909 | |||
| Less foreign taxes withheld | (2,273,826) | |||
| Total Income | 38,508,083 | |||
| Expenses | ||||
| Management fee | ||||
| Basic fee | $ | 16,804,788 | ||
| Performance adjustment | 2,075,160 | |||
| Transfer agent fees | 3,774,814 | |||
| Distribution and service plan fees | 400,754 | |||
| Accounting fees | 735,763 | |||
| Custodian fees and expenses | 86,218 | |||
| Independent trustees' fees and expenses | 9,095 | |||
| Registration fees | 118,484 | |||
| Audit | 85,095 | |||
| Legal | 13,091 | |||
| Miscellaneous | 12,136 | |||
| Total expenses before reductions | 24,115,398 | |||
| Expense reductions | (85,113) | |||
| Total expenses after reductions | 24,030,285 | |||
| Net Investment income (loss) | 14,477,798 | |||
| Realized and Unrealized Gain (Loss) | ||||
| Net realized gain (loss) on: | ||||
| Investment Securities: | ||||
| Unaffiliated issuers(net of foreign taxes of $208,012) | 146,299,428 | |||
| Foreign currency transactions | (346,784) | |||
| Total net realized gain (loss) | 145,952,644 | |||
| Change in net unrealized appreciation (depreciation) on: | ||||
| Investment Securities: | ||||
| Unaffiliated issuers (net of decrease in deferred foreign taxes of $993,916) | (999,809,577) | |||
| Unfunded commitments | (227,538) | |||
| Assets and liabilities in foreign currencies | (354,687) | |||
| Total change in net unrealized appreciation (depreciation) | (1,000,391,802) | |||
| Net gain (loss) | (854,439,158) | |||
| Net increase (decrease) in net assets resulting from operations | $ | (839,961,360) | ||
| Statement of Changes in Net Assets | ||||
Year ended October 31, 2022 | Year ended October 31, 2021 | |||
| Increase (Decrease) in Net Assets | ||||
| Operations | ||||
| Net investment income (loss) | $ | 14,477,798 | $ | (2,163,208) |
| Net realized gain (loss) | 145,952,644 | 389,411,062 | ||
| Change in net unrealized appreciation (depreciation) | (1,000,391,802) | 532,577,145 | ||
| Net increase (decrease) in net assets resulting from operations | (839,961,360) | 919,824,999 | ||
| Distributions to shareholders | (362,130,555) | (212,769,678) | ||
| Share transactions - net increase (decrease) | 68,731,196 | 82,772,537 | ||
| Total increase (decrease) in net assets | (1,133,360,719) | 789,827,858 | ||
| Net Assets | ||||
| Beginning of period | 3,235,603,166 | 2,445,775,308 | ||
| End of period | $ | 2,102,242,447 | $ | 3,235,603,166 |
| Fidelity Advisor® Worldwide Fund Class A |
| Years ended October 31, | 2022 | 2021 | 2020 | 2019 | 2018 | |||||
Selected Per-Share Data | ||||||||||
| Net asset value, beginning of period | $ | 40.06 | $ | 31.49 | $ | 27.36 | $ | 26.57 | $ | 27.28 |
| Income from Investment Operations | ||||||||||
Net investment income (loss) A,B | .09 | (.13) | (.05) | .11 | .03 | |||||
| Net realized and unrealized gain (loss) | (9.90) | 11.40 | 5.50 | 2.84 | 1.00 | |||||
| Total from investment operations | (9.81) | 11.27 | 5.45 | 2.95 | 1.03 | |||||
| Distributions from net investment income | (.07) | - | (.12) | (.02) | (.09) | |||||
| Distributions from net realized gain | (4.43) | (2.70) | (1.20) | (2.14) | (1.65) | |||||
| Total distributions | (4.50) | (2.70) | (1.32) | (2.16) | (1.74) | |||||
| Net asset value, end of period | $ | 25.75 | $ | 40.06 | $ | 31.49 | $ | 27.36 | $ | 26.57 |
Total Return C,D | (27.31)% | 37.72% | 20.72% | 12.35% | 3.96% | |||||
Ratios to Average Net Assets B,E,F | ||||||||||
| Expenses before reductions | 1.21% | 1.29% | 1.34% | 1.26% | 1.23% | |||||
| Expenses net of fee waivers, if any | 1.21% | 1.28% | 1.34% | 1.26% | 1.23% | |||||
| Expenses net of all reductions | 1.21% | 1.28% | 1.33% | 1.25% | 1.22% | |||||
| Net investment income (loss) | .28% | (.34)% | (.18)% | .41% | .12% | |||||
| Supplemental Data | ||||||||||
| Net assets, end of period (000 omitted) | $ | 68,608 | $ | 99,731 | $ | 63,690 | $ | 52,516 | $ | 42,947 |
Portfolio turnover rate G | 137% | 96% | 112% | 147% | 117% |
| Fidelity Advisor® Worldwide Fund Class M |
| Years ended October 31, | 2022 | 2021 | 2020 | 2019 | 2018 | |||||
Selected Per-Share Data | ||||||||||
| Net asset value, beginning of period | $ | 39.62 | $ | 31.19 | $ | 27.10 | $ | 26.39 | $ | 27.11 |
| Income from Investment Operations | ||||||||||
Net investment income (loss) A,B | .01 | (.22) | (.13) | .03 | (.05) | |||||
| Net realized and unrealized gain (loss) | (9.81) | 11.29 | 5.46 | 2.82 | 1.00 | |||||
| Total from investment operations | (9.80) | 11.07 | 5.33 | 2.85 | .95 | |||||
| Distributions from net investment income | - | - | (.04) | - | (.02) | |||||
| Distributions from net realized gain | (4.38) | (2.64) | (1.20) | (2.14) | (1.65) | |||||
| Total distributions | (4.38) | (2.64) | (1.24) | (2.14) | (1.67) | |||||
| Net asset value, end of period | $ | 25.44 | $ | 39.62 | $ | 31.19 | $ | 27.10 | $ | 26.39 |
Total Return C,D | (27.53)% | 37.37% | 20.40% | 12.05% | 3.65% | |||||
Ratios to Average Net Assets B,E,F | ||||||||||
| Expenses before reductions | 1.47% | 1.55% | 1.61% | 1.55% | 1.52% | |||||
| Expenses net of fee waivers, if any | 1.47% | 1.55% | 1.61% | 1.54% | 1.52% | |||||
| Expenses net of all reductions | 1.47% | 1.55% | 1.61% | 1.54% | 1.51% | |||||
| Net investment income (loss) | .02% | (.61)% | (.45)% | .13% | (.17)% | |||||
| Supplemental Data | ||||||||||
| Net assets, end of period (000 omitted) | $ | 15,275 | $ | 22,771 | $ | 17,387 | $ | 13,066 | $ | 12,746 |
Portfolio turnover rate G | 137% | 96% | 112% | 147% | 117% |
| Fidelity Advisor® Worldwide Fund Class C |
| Years ended October 31, | 2022 | 2021 | 2020 | 2019 | 2018 | |||||
Selected Per-Share Data | ||||||||||
| Net asset value, beginning of period | $ | 38.05 | $ | 30.14 | $ | 26.33 | $ | 25.82 | $ | 26.67 |
| Income from Investment Operations | ||||||||||
Net investment income (loss) A,B | (.15) | (.39) | (.27) | (.10) | (.18) | |||||
| Net realized and unrealized gain (loss) | (9.39) | 10.88 | 5.28 | 2.75 | .98 | |||||
| Total from investment operations | (9.54) | 10.49 | 5.01 | 2.65 | .80 | |||||
| Distributions from net realized gain | (4.18) | (2.58) | (1.20) | (2.14) | (1.65) | |||||
| Total distributions | (4.18) | (2.58) | (1.20) | (2.14) | (1.65) | |||||
| Net asset value, end of period | $ | 24.33 | $ | 38.05 | $ | 30.14 | $ | 26.33 | $ | 25.82 |
Total Return C,D | (27.89)% | 36.63% | 19.76% | 11.49% | 3.12% | |||||
Ratios to Average Net Assets B,E,F | ||||||||||
| Expenses before reductions | 2.00% | 2.08% | 2.14% | 2.06% | 2.01% | |||||
| Expenses net of fee waivers, if any | 2.00% | 2.08% | 2.14% | 2.06% | 2.01% | |||||
| Expenses net of all reductions | 2.00% | 2.08% | 2.13% | 2.06% | 2.00% | |||||
| Net investment income (loss) | (.51)% | (1.14)% | (.98)% | (.39)% | (.66)% | |||||
| Supplemental Data | ||||||||||
| Net assets, end of period (000 omitted) | $ | 8,517 | $ | 13,602 | $ | 11,677 | $ | 10,618 | $ | 12,744 |
Portfolio turnover rate G | 137% | 96% | 112% | 147% | 117% |
| Fidelity® Worldwide Fund |
| Years ended October 31, | 2022 | 2021 | 2020 | 2019 | 2018 | |||||
Selected Per-Share Data | ||||||||||
| Net asset value, beginning of period | $ | 40.76 | $ | 31.97 | $ | 27.74 | $ | 26.90 | $ | 27.61 |
| Income from Investment Operations | ||||||||||
Net investment income (loss) A,B | .18 | (.02) | .03 | .18 | .11 | |||||
| Net realized and unrealized gain (loss) | (10.09) | 11.58 | 5.58 | 2.89 | 1.00 | |||||
| Total from investment operations | (9.91) | 11.56 | 5.61 | 3.07 | 1.11 | |||||
| Distributions from net investment income | (.16) | (.02) | (.18) | (.09) | (.17) | |||||
| Distributions from net realized gain | (4.43) | (2.75) | (1.20) | (2.14) | (1.65) | |||||
| Total distributions | (4.59) | (2.77) | (1.38) | (2.23) | (1.82) | |||||
| Net asset value, end of period | $ | 26.26 | $ | 40.76 | $ | 31.97 | $ | 27.74 | $ | 26.90 |
Total Return C | (27.12)% | 38.11% | 21.07% | 12.71% | 4.23% | |||||
Ratios to Average Net Assets B,D,E | ||||||||||
| Expenses before reductions | .92% | 1.00% | 1.05% | .99% | .94% | |||||
| Expenses net of fee waivers, if any | .92% | 1.00% | 1.05% | .99% | .94% | |||||
| Expenses net of all reductions | .92% | 1.00% | 1.05% | .98% | .93% | |||||
| Net investment income (loss) | .57% | (.06)% | .11% | .69% | .41% | |||||
| Supplemental Data | ||||||||||
| Net assets, end of period (000 omitted) | $ | 1,899,788 | $ | 2,896,684 | $ | 2,217,129 | $ | 2,020,487 | $ | 2,112,988 |
Portfolio turnover rate F | 137% | 96% | 112% | 147% | 117% |
| Fidelity Advisor® Worldwide Fund Class I |
| Years ended October 31, | 2022 | 2021 | 2020 | 2019 | 2018 | |||||
Selected Per-Share Data | ||||||||||
| Net asset value, beginning of period | $ | 40.46 | $ | 31.77 | $ | 27.58 | $ | 26.77 | $ | 27.49 |
| Income from Investment Operations | ||||||||||
Net investment income (loss) A,B | .17 | (.03) | .03 | .18 | .11 | |||||
| Net realized and unrealized gain (loss) | (10.01) | 11.49 | 5.55 | 2.86 | .99 | |||||
| Total from investment operations | (9.84) | 11.46 | 5.58 | 3.04 | 1.10 | |||||
| Distributions from net investment income | (.16) | (.02) | (.19) | (.09) | (.18) | |||||
| Distributions from net realized gain | (4.43) | (2.75) | (1.20) | (2.14) | (1.65) | |||||
| Total distributions | (4.58) C | (2.77) | (1.39) | (2.23) | (1.82) C | |||||
| Net asset value, end of period | $ | 26.04 | $ | 40.46 | $ | 31.77 | $ | 27.58 | $ | 26.77 |
Total Return D | (27.13)% | 38.06% | 21.08% | 12.70% | 4.22% | |||||
Ratios to Average Net Assets B,E,F | ||||||||||
| Expenses before reductions | .94% | 1.02% | 1.06% | .99% | .96% | |||||
| Expenses net of fee waivers, if any | .93% | 1.02% | 1.06% | .99% | .95% | |||||
| Expenses net of all reductions | .93% | 1.02% | 1.05% | .98% | .94% | |||||
| Net investment income (loss) | .56% | (.08)% | .10% | .69% | .40% | |||||
| Supplemental Data | ||||||||||
| Net assets, end of period (000 omitted) | $ | 33,226 | $ | 86,852 | $ | 64,615 | $ | 44,754 | $ | 50,956 |
Portfolio turnover rate G | 137% | 96% | 112% | 147% | 117% |
| Fidelity Advisor® Worldwide Fund Class Z |
| Years ended October 31, | 2022 | 2021 | 2020 | 2019 | 2018 A | |||||
Selected Per-Share Data | ||||||||||
| Net asset value, beginning of period | $ | 40.48 | $ | 31.76 | $ | 27.59 | $ | 26.78 | $ | 29.54 |
| Income from Investment Operations | ||||||||||
Net investment income (loss) B,C | .21 | .02 | .07 | .22 | (.01) | |||||
| Net realized and unrealized gain (loss) | (10.01) | 11.50 | 5.53 | 2.86 | (2.75) | |||||
| Total from investment operations | (9.80) | 11.52 | 5.60 | 3.08 | (2.76) | |||||
| Distributions from net investment income | (.20) | (.05) | (.23) | (.13) | - | |||||
| Distributions from net realized gain | (4.43) | (2.75) | (1.20) | (2.14) | - | |||||
| Total distributions | (4.63) | (2.80) | (1.43) | (2.27) | - | |||||
| Net asset value, end of period | $ | 26.05 | $ | 40.48 | $ | 31.76 | $ | 27.59 | $ | 26.78 |
Total Return D,E | (27.05)% | 38.27% | 21.19% | 12.85% | (9.34)% | |||||
Ratios to Average Net Assets C,F,G | ||||||||||
| Expenses before reductions | .81% | .90% | .93% | .85% | .88% H | |||||
| Expenses net of fee waivers, if any | .81% | .90% | .93% | .84% | .88% H | |||||
| Expenses net of all reductions | .81% | .90% | .93% | .84% | .87% H | |||||
| Net investment income (loss) | .68% | .04% | .23% | .83% | (.27)% H | |||||
| Supplemental Data | ||||||||||
| Net assets, end of period (000 omitted) | $ | 76,829 | $ | 115,963 | $ | 71,278 | $ | 205,197 | $ | 294 |
Portfolio turnover rate I | 137% | 96% | 112% | 147% | 117% |
| Fidelity Central Fund | Investment Manager | Investment Objective | Investment Practices | Expense Ratio A |
| Fidelity Money Market Central Funds | Fidelity Management & Research Company LLC (FMR) | Each fund seeks to obtain a high level of current income consistent with the preservation of capital and liquidity. | Short-term Investments | Less than .005% |
| Gross unrealized appreciation | $340,681,580 |
| Gross unrealized depreciation | (189,244,946) |
| Net unrealized appreciation (depreciation) | $151,436,634 |
| Tax Cost | $1,950,543,510 |
| Undistributed ordinary income | $14,849,136 |
| Undistributed long-term capital gain | $108,356,015 |
| Net unrealized appreciation (depreciation) on securities and other investments | $151,089,474 |
| October 31, 2022 | October 31, 2021 | |
| Ordinary Income | $81,038,229 | $ 14,367,075 |
| Long-term Capital Gains | 281,092,325 | 198,402,603 |
| Total | $362,130,554 | $ 212,769,678 |
| Investment to be Acquired | Commitment Amount | Unrealized Appreciation (depreciation) | |
| Fidelity Worldwide Fund | Stripe, Inc. | $227,538 | $(227,538) |
| Purchases ($) | Sales ($) | |
| Fidelity Worldwide Fund | 3,489,797,777 | 3,761,255,290 |
| Distribution Fee | Service Fee | Total Fees | Retained by FDC | |
| Class A | - % | .25% | $202,036 | $7,643 |
| Class M | .25% | .25% | 91,554 | 32 |
| Class C | .75% | .25% | 107,164 | 13,589 |
| $400,754 | $21,264 |
| Retained by FDC | |
| Class A | $35,321 |
| Class M | 1,248 |
Class C A | 975 |
| $37,544 |
| Amount | % of Class-Level Average Net Assets | |
| Class A | $151,465 | .19 |
| Class M | 36,808 | .20 |
| Class C | 24,819 | .23 |
| Worldwide | 3,424,440 | .15 |
| Class I | 100,508 | .17 |
| Class Z | 36,774 | .04 |
| $3,774,814 |
| % of Average Net Assets | |
| Fidelity Worldwide Fund | .03 |
| Amount | |
| Fidelity Worldwide Fund | $34,832 |
| Purchases ($) | Sales ($) | Realized Gain (Loss) ($) | |
| Fidelity Worldwide Fund | 250,172,800 | 331,573,195 | 18,872,556 |
| Amount ($) | |
| Fidelity Worldwide Fund | 3,353 |
| Amount ($) | |
| Fidelity Worldwide Fund | 4,585 |
| Total Security Lending Fees Paid to NFS | Security Lending Income From Securities Loaned to NFS | Value of Securities Loaned to NFS at Period End | |
| Fidelity Worldwide Fund | $17,461 | $- | $- |
Year ended October 31, 2022 | Year ended October 31, 2021 | |
| Fidelity Worldwide Fund | ||
| Distributions to shareholders | ||
| Class A | $ 11,246,925 | $5,558,931 |
| Class M | 2,460,774 | 1,453,529 |
| Class C | 1,484,213 | 982,551 |
| Worldwide | 323,847,724 | 192,474,658 |
| Class I | 9,721,033 | 5,902,121 |
| Class Z | 13,369,886 | 6,397,888 |
Total | $362,130,555 | $212,769,678 |
| Shares | Shares | Dollars | Dollars | |
| Year ended October 31, 2022 | Year ended October 31, 2021 | Year ended October 31, 2022 | Year ended October 31, 2021 | |
| Fidelity Worldwide Fund | ||||
| Class A | ||||
| Shares sold | 425,346 | 687,168 | $13,150,315 | $24,638,768 |
| Reinvestment of distributions | 323,585 | 167,703 | 11,111,902 | 5,488,908 |
| Shares redeemed | (573,433) | (387,967) | (17,987,153) | (14,002,191) |
| Net increase (decrease) | 175,498 | 466,904 | $6,275,064 | $16,125,485 |
| Class M | ||||
| Shares sold | 63,154 | 86,854 | $ 1,827,369 | $3,031,424 |
| Reinvestment of distributions | 71,924 | 44,443 | 2,446,862 | 1,442,165 |
| Shares redeemed | (109,465) | (113,937) | (3,332,351) | (4,049,636) |
| Net increase (decrease) | 25,613 | 17,360 | $941,880 | $423,953 |
| Class C | ||||
| Shares sold | 49,629 | 70,402 | $1,443,792 | $2,403,125 |
| Reinvestment of distributions | 45,376 | 31,369 | 1,482,892 | 982,175 |
| Shares redeemed | (102,345) | (131,707) | (2,936,201) | (4,545,518) |
| Net increase (decrease) | (7,340) | (29,936) | $(9,517) | $(1,160,218) |
| Worldwide | ||||
| Shares sold | 5,548,119 | 8,509,868 | $176,262,456 | $306,520,502 |
| Reinvestment of distributions | 8,857,534 | 5,570,483 | 309,393,660 | 184,995,722 |
| Shares redeemed | (13,126,499) | (12,365,391) | (404,042,333) | (449,935,236) |
| Net increase (decrease) | 1,279,154 | 1,714,960 | $81,613,783 | $41,580,988 |
| Class I | ||||
| Shares sold | 391,287 | 670,926 | $11,850,826 | $24,272,391 |
| Reinvestment of distributions | 274,142 | 174,445 | 9,499,030 | 5,753,187 |
| Shares redeemed | (1,536,108) | (732,928) | (45,074,681) | (25,932,444) |
| Net increase (decrease) | (870,679) | 112,443 | $(23,724,825) | $4,093,134 |
| Class Z | ||||
| Shares sold | 785,358 | 823,146 | $ 23,797,734 | $ 29,837,475 |
| Reinvestment of distributions | 358,516 | 185,769 | 12,415,394 | 6,122,936 |
| Shares redeemed | (1,058,983) | (388,243) | (32,578,317) | (14,251,216) |
| Net increase (decrease) | 84,891 | 620,672 | $3,634,811 | $21,709,195 |
| The Example is based on an investment of $1,000 invested at the beginning of the period and held for the entire period (May 1, 2022 to October 31, 2022). |
Annualized Expense Ratio- A | Beginning Account Value May 1, 2022 | Ending Account Value October 31, 2022 | Expenses Paid During Period- C May 1, 2022 to October 31, 2022 | |||||||
| Fidelity® Diversified International Fund | ||||||||||
| Fidelity® Diversified International Fund | .93% | |||||||||
| Actual | $ 1,000 | $ 869.10 | $ 4.38 | |||||||
Hypothetical- B | $ 1,000 | $ 1,020.52 | $ 4.74 | |||||||
| Class K | .80% | |||||||||
| Actual | $ 1,000 | $ 869.40 | $ 3.77 | |||||||
Hypothetical- B | $ 1,000 | $ 1,021.17 | $ 4.08 | |||||||
| Fidelity® International Capital Appreciation Fund | .92% | |||||||||
| Actual | $ 1,000 | $ 870.20 | $ 4.34 | |||||||
Hypothetical- B | $ 1,000 | $ 1,020.57 | $ 4.69 | |||||||
| Fidelity® Overseas Fund | ||||||||||
| Fidelity® Overseas Fund | .91% | |||||||||
| Actual | $ 1,000 | $ 861.20 | $ 4.27 | |||||||
Hypothetical- B | $ 1,000 | $ 1,020.62 | $ 4.63 | |||||||
| Class K | .78% | |||||||||
| Actual | $ 1,000 | $ 861.90 | $ 3.66 | |||||||
Hypothetical- B | $ 1,000 | $ 1,021.27 | $ 3.97 | |||||||
| Fidelity® Worldwide Fund | ||||||||||
| Class A | 1.16% | |||||||||
| Actual | $ 1,000 | $ 893.80 | $ 5.54 | |||||||
Hypothetical- B | $ 1,000 | $ 1,019.36 | $ 5.90 | |||||||
| Class M | 1.42% | |||||||||
| Actual | $ 1,000 | $ 892.30 | $ 6.77 | |||||||
Hypothetical- B | $ 1,000 | $ 1,018.05 | $ 7.22 | |||||||
| Class C | 1.96% | |||||||||
| Actual | $ 1,000 | $ 890.20 | $ 9.34 | |||||||
Hypothetical- B | $ 1,000 | $ 1,015.32 | $ 9.96 | |||||||
| Fidelity® Worldwide Fund | .87% | |||||||||
| Actual | $ 1,000 | $ 895.00 | $ 4.16 | |||||||
Hypothetical- B | $ 1,000 | $ 1,020.82 | $ 4.43 | |||||||
| Class I | .87% | |||||||||
| Actual | $ 1,000 | $ 894.80 | $ 4.16 | |||||||
Hypothetical- B | $ 1,000 | $ 1,020.82 | $ 4.43 | |||||||
| Class Z | .75% | |||||||||
| Actual | $ 1,000 | $ 895.20 | $ 3.58 | |||||||
Hypothetical- B | $ 1,000 | $ 1,021.42 | $ 3.82 | |||||||
| Fidelity Diversified International Fund | $240,530,880 |
| Fidelity International Capital Appreciation Fund | $0 |
| Fidelity Overseas Fund | $0 |
| Fidelity Worldwide Fund | $136,078,148 |
| December, 2021 | |
| Fidelity Diversified International Fund | - |
| Fidelity International Capital Appreciation Fund | 100% |
| Fidelity Overseas Fund | 100% |
| Fidelity Worldwide Fund | 100% |
| Class A | Class M | Class C | Retail Class | Class I | Class Z | Class K | |
| Fidelity Diversified International Fund | |||||||
| December, 2021 | - | - | - | 1% | - | - | 1% |
| Fidelity International Capital Appreciation Fund | |||||||
| December, 2021 | - | - | - | 1% | - | - | - |
| Fidelity Overseas Fund | |||||||
| December, 2021 | - | - | - | 7% | - | - | 6% |
| Fidelity Worldwide Fund | |||||||
| December, 2021 | 14% | 16% | 22% | 13% | 13% | 13% | - |
| Class A | Class M | Class C | Retail Class | Class I | Class Z | Class K | |
| Fidelity Diversified International Fund | |||||||
| December, 2021 | - | - | - | 100% | - | - | 100% |
| Fidelity International Capital Appreciation Fund | |||||||
| December, 2021 | - | - | - | 32% | - | - | - |
| Fidelity Overseas Fund | |||||||
| December, 2021 | - | - | - | 100% | - | - | 100% |
| Fidelity Worldwide Fund | |||||||
| December, 2021 | 33% | 38% | 50% | 30% | 30% | 29% | - |
| Class A | Class M | Class C | Retail Class | Class I | Class Z | Class K | |
| Fidelity Diversified International Fund | |||||||
| December, 2021 | - | - | - | - | - | - | - |
| Fidelity International Capital Appreciation Fund | |||||||
| December, 2021 | - | - | - | 1% | - | - | - |
| Fidelity Overseas Fund | |||||||
| December, 2021 | - | - | - | - | - | - | - |
| Fidelity Worldwide Fund | |||||||
| December, 2021 | 1% | 1% | 1% | 1% | 1% | 1% | - |
| Pay Date | Income | Taxes | |
| Fidelity Diversified International Fund | |||
| Diversified International | 12/06/21 | $0.6622 | $0.0942 |
| Class K | 12/06/21 | $0.7102 | $0.0942 |
| Fidelity International Capital Appreciation Fund | 12/06/21 | $0.2821 | $0.0423 |
| Fidelity Overseas Fund | |||
| Overseas | 12/06/21 | $0.4571 | $0.0871 |
| Class K | 12/06/21 | $0.5191 | $0.0871 |
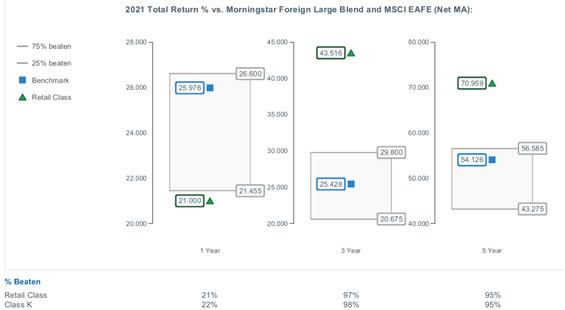

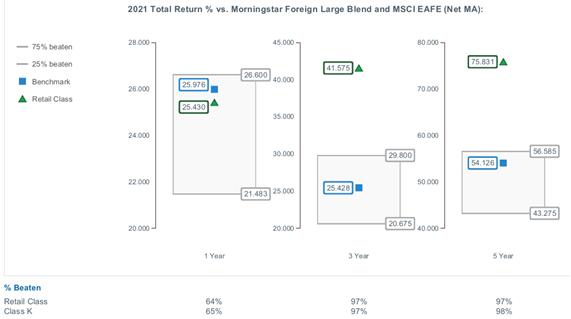
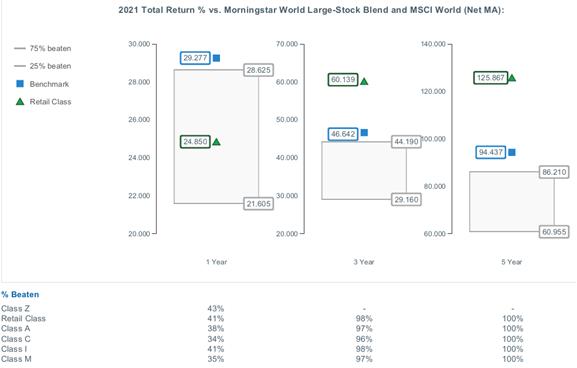
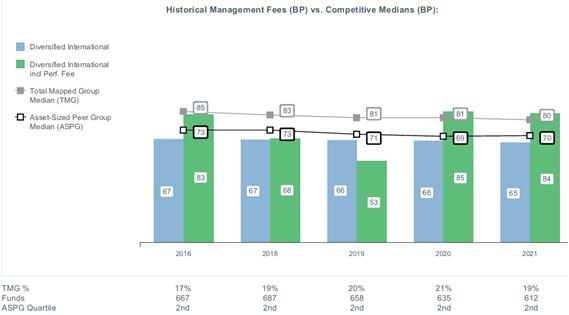
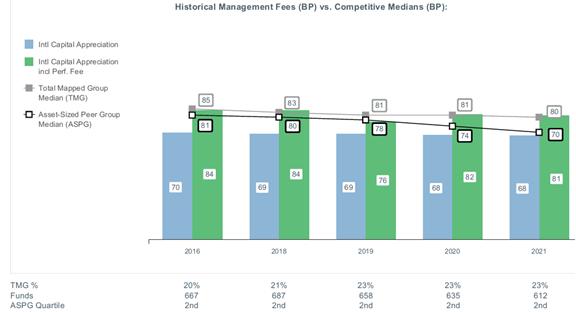
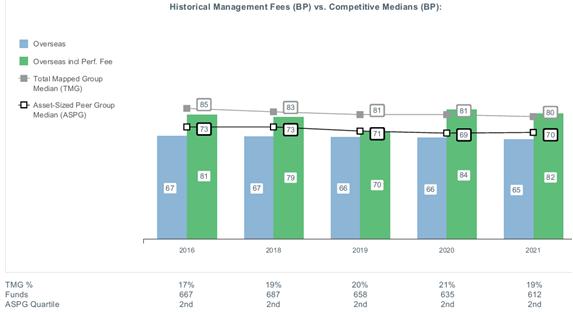
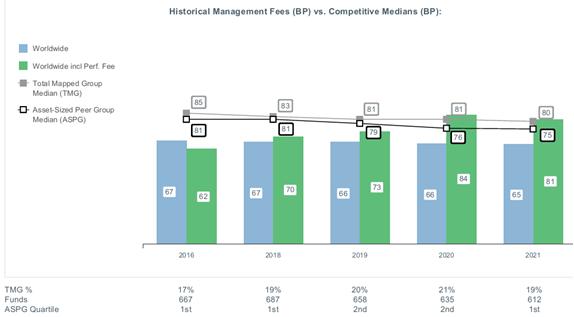
|


Contents
| $10,000 Over Life of Fund |
Let's say hypothetically that $10,000 was invested in Fidelity® Sustainable Emerging Markets Equity Fund, a class of the fund, on February 10, 2022, when the fund started. The chart shows how the value of your investment would have changed, and also shows how the MSCI Emerging Markets Index performed over the same period. |
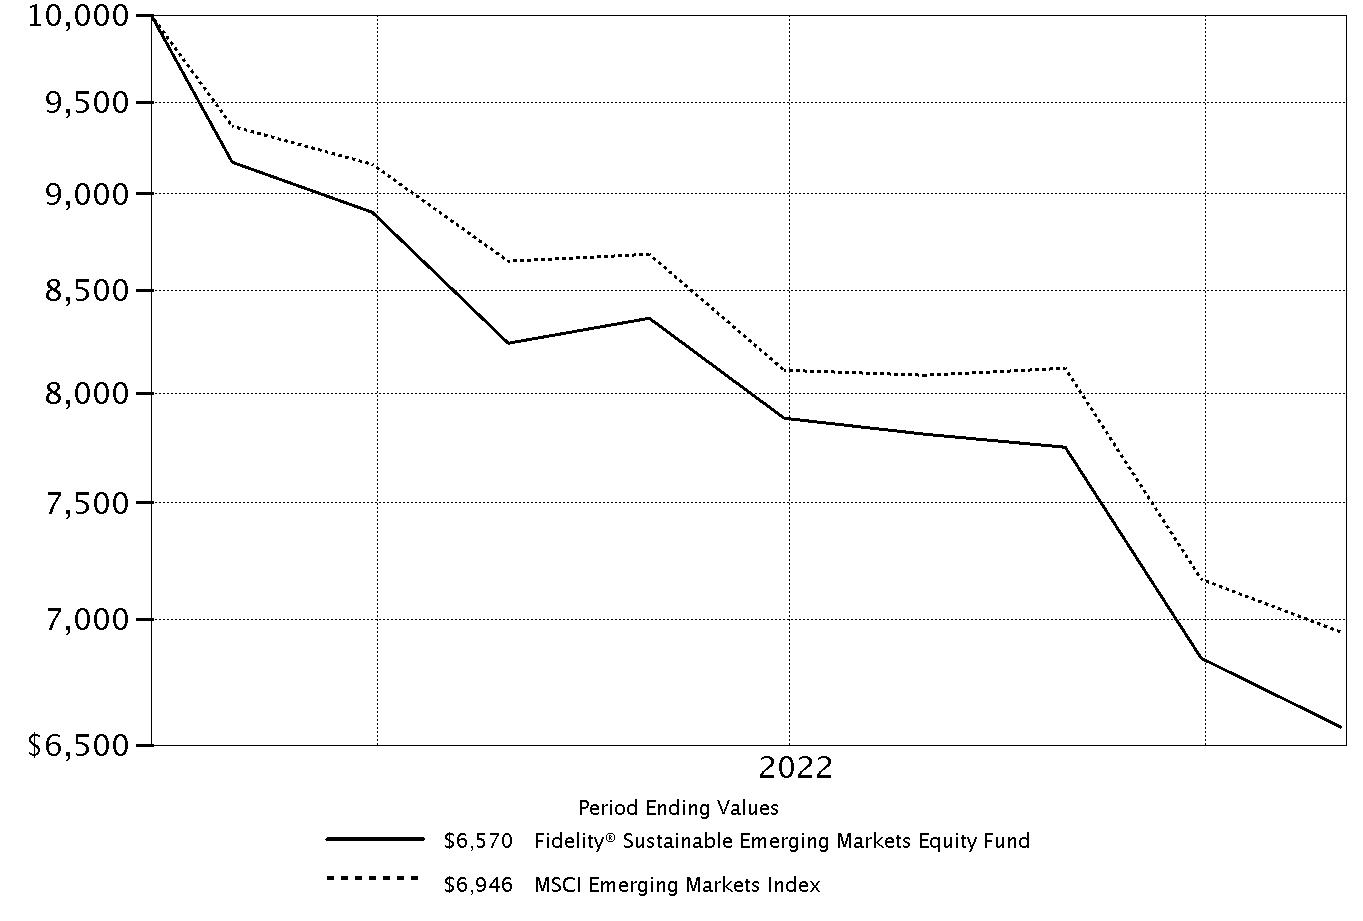 |
Top Holdings (% of Fund's net assets) | ||
| Taiwan Semiconductor Manufacturing Co. Ltd. sponsored ADR (Taiwan, Semiconductors & Semiconductor Equipment) | 8.0 | |
| Samsung Electronics Co. Ltd. (Korea (South), Technology Hardware, Storage & Peripherals) | 4.8 | |
| iShares MSCI India ETF (United States of America, Investment Companies) | 4.3 | |
| HDFC Bank Ltd. sponsored ADR (India, Banks) | 3.8 | |
| Tencent Holdings Ltd. (Cayman Islands, Interactive Media & Services) | 3.2 | |
| Wal-Mart de Mexico SA de CV Series V (Mexico, Food & Staples Retailing) | 2.8 | |
| China Construction Bank Corp. (H Shares) (China, Banks) | 2.6 | |
| Reliance Industries Ltd. sponsored GDR (India, Oil, Gas & Consumable Fuels) | 2.4 | |
| Alibaba Group Holding Ltd. sponsored ADR (Cayman Islands, Internet & Direct Marketing Retail) | 2.3 | |
| LG Chemical Ltd. (Korea (South), Chemicals) | 2.2 | |
| 36.4 | ||
| Market Sectors (% of Fund's net assets) | ||
| Financials | 24.6 | |
| Information Technology | 22.0 | |
| Consumer Discretionary | 12.1 | |
| Communication Services | 8.4 | |
| Consumer Staples | 7.0 | |
| Materials | 6.2 | |
| Health Care | 5.4 | |
| Industrials | 3.6 | |
| Energy | 2.4 | |
| Real Estate | 0.4 | |
| Utilities | 0.4 | |
Asset Allocation (% of Fund's net assets) |
 |
Foreign investments - 91.8% |
Geographic Diversification (% of Fund's net assets) |
 |
* Includes Short-Term investments and Net Other Assets (Liabilities). Percentages are based on country or territory of incorporation and are adjusted for the effect of futures contracts, if applicable. |
| Common Stocks - 90.4% | |||
| Shares | Value ($) | ||
| Bermuda - 1.2% | |||
| Credicorp Ltd. (United States) | 166 | 24,296 | |
| Kunlun Energy Co. Ltd. | 17,566 | 10,495 | |
TOTAL BERMUDA | 34,791 | ||
| Brazil - 4.6% | |||
| Banco do Brasil SA | 2,069 | 14,828 | |
| Hypera SA | 3,266 | 32,126 | |
| Localiza Rent a Car SA | 2,633 | 35,956 | |
| Localiza Rent a Car SA | 5 | 68 | |
| Localiza Rent a Car SA ADR | 1,948 | 26,415 | |
| Natura & Co. Holding SA (a) | 2,865 | 8,292 | |
| Suzano Papel e Celulose SA | 1,342 | 13,821 | |
| Suzano Papel e Celulose SA ADR | 768 | 7,903 | |
TOTAL BRAZIL | 139,409 | ||
| Cayman Islands - 17.5% | |||
| Alibaba Group Holding Ltd. sponsored ADR (a) | 1,103 | 70,129 | |
| Bilibili, Inc. ADR (a) | 671 | 5,985 | |
| Chailease Holding Co. Ltd. | 2,055 | 9,493 | |
| JD.com, Inc. sponsored ADR | 1,165 | 43,443 | |
| Li Ning Co. Ltd. | 1,766 | 9,134 | |
| Meituan Class B (a)(b) | 3,292 | 52,707 | |
| NetEase, Inc. ADR | 557 | 30,980 | |
| Pinduoduo, Inc. ADR (a) | 659 | 36,133 | |
| Sea Ltd. ADR (a) | 445 | 22,108 | |
| Shenzhou International Group Holdings Ltd. | 1,053 | 7,311 | |
| Silergy Corp. | 2,013 | 23,342 | |
| Sunny Optical Technology Group Co. Ltd. | 676 | 5,860 | |
| Tencent Holdings Ltd. | 3,706 | 97,382 | |
| Trip.com Group Ltd. ADR (a) | 2,552 | 57,752 | |
| Wuxi Biologics (Cayman), Inc. (a)(b) | 5,777 | 25,994 | |
| XP, Inc. Class A (a) | 427 | 7,827 | |
| XPeng, Inc. ADR (a) | 807 | 5,342 | |
| Zai Lab Ltd. (a) | 3,530 | 8,131 | |
| Zai Lab Ltd. ADR (a) | 412 | 9,179 | |
TOTAL CAYMAN ISLANDS | 528,232 | ||
| China - 6.5% | |||
| China Construction Bank Corp. (H Shares) | 145,260 | 77,088 | |
| China Merchants Bank Co. Ltd. (H Shares) | 2,093 | 6,879 | |
| China Tourism Group Duty Free Corp. Ltd. (H Shares) (a)(b) | 394 | 7,795 | |
| Haier Smart Home Co. Ltd. | 5,387 | 13,478 | |
| Kweichow Moutai Co. Ltd. (A Shares) | 70 | 12,880 | |
| Ping An Insurance Group Co. of China Ltd. (H Shares) | 8,692 | 34,797 | |
| Shenzhen Mindray Bio-Medical Electronics Co. Ltd. (A Shares) | 542 | 24,153 | |
| Wuliangye Yibin Co. Ltd. (A Shares) | 1,034 | 18,902 | |
TOTAL CHINA | 195,972 | ||
| Hong Kong - 0.8% | |||
| China Resources Beer Holdings Co. Ltd. | 4,803 | 22,639 | |
| Hungary - 0.7% | |||
| Richter Gedeon PLC | 1,121 | 22,135 | |
| India - 10.0% | |||
| Axis Bank Ltd. GDR (Reg. S) | 295 | 15,930 | |
| HDFC Bank Ltd. sponsored ADR | 1,837 | 114,463 | |
| ICICI Bank Ltd. sponsored ADR | 1,751 | 38,592 | |
| Infosys Ltd. sponsored ADR | 3,252 | 60,910 | |
| Reliance Industries Ltd. sponsored GDR (b) | 1,156 | 70,574 | |
TOTAL INDIA | 300,469 | ||
| Indonesia - 5.8% | |||
| PT Avia Avian Tbk | 199,971 | 10,064 | |
| PT Bank Central Asia Tbk | 104,323 | 58,858 | |
| PT Bank Mandiri (Persero) Tbk | 76,287 | 51,600 | |
| PT Bank Rakyat Indonesia (Persero) Tbk | 74,286 | 22,146 | |
| PT Telkom Indonesia Persero Tbk | 117,818 | 33,089 | |
TOTAL INDONESIA | 175,757 | ||
| Korea (South) - 14.3% | |||
| Db Insurance Co. Ltd. | 204 | 8,047 | |
| Hansol Chemical Co. Ltd. | 99 | 12,866 | |
| Hyundai Fire & Marine Insurance Co. Ltd. | 647 | 15,095 | |
| Hyundai Motor Co. | 66 | 7,607 | |
| LG Chemical Ltd. | 150 | 65,788 | |
| LG Energy Solution (a) | 25 | 9,248 | |
| NAVER Corp. | 184 | 21,851 | |
| POSCO | 346 | 60,183 | |
| Samsung Electronics Co. Ltd. | 3,481 | 144,867 | |
| Shinhan Financial Group Co. Ltd. | 372 | 9,436 | |
| SK Hynix, Inc. | 901 | 52,205 | |
| Woori Financial Group, Inc. ADR | 889 | 22,136 | |
TOTAL KOREA (SOUTH) | 429,329 | ||
| Mexico - 5.3% | |||
| CEMEX S.A.B. de CV sponsored ADR (a) | 1,200 | 4,632 | |
| Grupo Aeroportuario del Sureste S.A.B. de CV Series B | 399 | 9,338 | |
| Grupo Aeroportuario Norte S.A.B. de CV | 3,243 | 25,835 | |
| Grupo Financiero Banorte S.A.B. de CV Series O | 4,473 | 36,359 | |
| Wal-Mart de Mexico SA de CV Series V | 21,908 | 84,622 | |
TOTAL MEXICO | 160,786 | ||
| Netherlands - 0.1% | |||
| Yandex NV Series A (a)(c) | 517 | 1,773 | |
| Philippines - 0.4% | |||
| Ayala Land, Inc. | 28,968 | 12,817 | |
| Saudi Arabia - 0.4% | |||
| Dr Sulaiman Al Habib Medical Services Group Co. | 192 | 11,579 | |
| South Africa - 4.4% | |||
| Absa Group Ltd. | 2,962 | 32,209 | |
| Capitec Bank Holdings Ltd. | 53 | 5,484 | |
| Impala Platinum Holdings Ltd. | 1,915 | 19,607 | |
| MTN Group Ltd. | 5,861 | 41,429 | |
| Naspers Ltd. Class N | 339 | 34,945 | |
TOTAL SOUTH AFRICA | 133,674 | ||
| Taiwan - 13.9% | |||
| E.SUN Financial Holdings Co. Ltd. | 57,638 | 41,458 | |
| eMemory Technology, Inc. | 896 | 29,863 | |
| Hon Hai Precision Industry Co. Ltd. (Foxconn) | 13,917 | 44,227 | |
| MediaTek, Inc. | 2,733 | 49,993 | |
| Taiwan Semiconductor Manufacturing Co. Ltd. sponsored ADR | 3,899 | 239,984 | |
| Unimicron Technology Corp. | 3,139 | 12,117 | |
TOTAL TAIWAN | 417,642 | ||
| Thailand - 2.0% | |||
| CP ALL PCL (For. Reg.) | 27,589 | 43,510 | |
| SCB X PCL (For. Reg.) | 2,408 | 6,709 | |
| Thai Beverage PCL | 24,724 | 10,043 | |
TOTAL THAILAND | 60,262 | ||
| United Arab Emirates - 0.6% | |||
| Abu Dhabi Commercial Bank PJSC | 7,016 | 18,050 | |
| United Kingdom - 1.2% | |||
| Shenzhen Mindray Bio-Medical Electronics Co. Ltd. ELS (UBS AG London Branch Bank Warrant Programme) Class A warrants 12/7/22 (a)(b) | 572 | 25,490 | |
| Wuliangye Yibin Co. Ltd. ELS (UBS AG London Branch Bank Warrant Programme) Class A warrants 10/27/23 (a)(b) | 558 | 10,200 | |
TOTAL UNITED KINGDOM | 35,690 | ||
| United States of America - 0.7% | |||
| Li Auto, Inc. ADR (a) | 1,496 | 20,376 | |
| TOTAL COMMON STOCKS (Cost $3,489,340) | 2,721,382 | ||
| Nonconvertible Preferred Stocks - 2.1% | |||
| Shares | Value ($) | ||
| Brazil - 2.1% | |||
| Itau Unibanco Holding SA | 6,880 | 40,490 | |
| Itau Unibanco Holding SA sponsored ADR | 3,960 | 23,047 | |
| TOTAL NONCONVERTIBLE PREFERRED STOCKS (Cost $53,839) | 63,537 | ||
| Investment Companies - 4.3% | |||
| Shares | Value ($) | ||
| United States of America - 4.3% | |||
iShares MSCI India ETF (Cost $132,275) | 3,063 | 129,259 | |
| Money Market Funds - 3.4% | |||
| Shares | Value ($) | ||
Fidelity Cash Central Fund 3.10% (d) (Cost $102,935) | 102,915 | 102,935 | |
| TOTAL INVESTMENT IN SECURITIES - 100.2% (Cost $3,778,389) | 3,017,113 |
NET OTHER ASSETS (LIABILITIES) - (0.2)% | (4,788) |
| NET ASSETS - 100.0% | 3,012,325 |
| ELS | - | EQUITY-LINKED SECURITY |
| ETF | - | EXCHANGE-TRADED FUND |
| (a) | Non-income producing |
| (b) | Security exempt from registration under Rule 144A of the Securities Act of 1933. These securities may be resold in transactions exempt from registration, normally to qualified institutional buyers. At the end of the period, the value of these securities amounted to $192,760 or 6.4% of net assets. |
| (c) | Level 3 security |
| (d) | Affiliated fund that is generally available only to investment companies and other accounts managed by Fidelity Investments. The rate quoted is the annualized seven-day yield of the fund at period end. A complete unaudited listing of the fund's holdings as of its most recent quarter end is available upon request. In addition, each Fidelity Central Fund's financial statements, which are not covered by the Fund's Report of Independent Registered Public Accounting Firm, are available on the SEC's website or upon request. |
| Affiliate | Value, beginning of period ($) | Purchases ($) | Sales Proceeds ($) | Dividend Income ($) | Realized Gain (loss) ($) | Change in Unrealized appreciation (depreciation) ($) | Value, end of period ($) | % ownership, end of period |
| Fidelity Cash Central Fund 3.10% | - | 4,412,841 | 4,309,906 | 2,121 | - | - | 102,935 | 0.0% |
| Total | - | 4,412,841 | 4,309,906 | 2,121 | - | - | 102,935 | |
| Valuation Inputs at Reporting Date: | ||||
| Description | Total ($) | Level 1 ($) | Level 2 ($) | Level 3 ($) |
Investments in Securities: | ||||
| Equities: | ||||
Communication Services | 254,597 | 122,353 | 130,471 | 1,773 |
Consumer Discretionary | 366,152 | 271,189 | 94,963 | - |
Consumer Staples | 211,088 | 200,888 | 10,200 | - |
Energy | 70,574 | 70,574 | - | - |
Financials | 735,317 | 613,996 | 121,321 | - |
Health Care | 158,787 | 107,303 | 51,484 | - |
Industrials | 106,860 | 106,860 | - | - |
Information Technology | 663,368 | 663,368 | - | - |
Materials | 194,864 | 115,074 | 79,790 | - |
Real Estate | 12,817 | - | 12,817 | - |
Utilities | 10,495 | 10,495 | - | - |
| Investment Companies | 129,259 | 129,259 | - | - |
| Money Market Funds | 102,935 | 102,935 | - | - |
| Total Investments in Securities: | 3,017,113 | 2,514,294 | 501,046 | 1,773 |
| Statement of Assets and Liabilities | ||||
| October 31, 2022 | ||||
| Assets | ||||
| Investment in securities, at value - See accompanying schedule: | ||||
Unaffiliated issuers (cost $3,675,454) | $2,914,178 | |||
Fidelity Central Funds (cost $102,935) | 102,935 | |||
| Total Investment in Securities (cost $3,778,389) | $ | 3,017,113 | ||
| Cash | 1,892 | |||
| Foreign currency held at value (cost $539) | 538 | |||
| Receivable for investments sold | 31,757 | |||
| Receivable for fund shares sold | 6,416 | |||
| Dividends receivable | 2,905 | |||
| Distributions receivable from Fidelity Central Funds | 472 | |||
| Prepaid expenses | 27,278 | |||
| Receivable from investment adviser for expense reductions | 21,783 | |||
Total assets | 3,110,154 | |||
| Liabilities | ||||
| Payable for investments purchased | $40,589 | |||
| Payable for fund shares redeemed | 13 | |||
| Accrued management fee | 1,969 | |||
| Distribution and service plan fees payable | 246 | |||
| Other affiliated payables | 571 | |||
| Audit fee payable | 47,135 | |||
| Custody fee payable | 7,193 | |||
| Other payables and accrued expenses | 113 | |||
| Total Liabilities | 97,829 | |||
| Net Assets | $ | 3,012,325 | ||
| Net Assets consist of: | ||||
| Paid in capital | $ | 4,167,885 | ||
| Total accumulated earnings (loss) | (1,155,560) | |||
| Net Assets | $ | 3,012,325 | ||
| Net Asset Value and Maximum Offering Price | ||||
| Class A : | ||||
Net Asset Value and redemption price per share ($163,872 ÷ 25,000 shares) (a) | $ | 6.55 | ||
| Maximum offering price per share (100/94.25 of $6.55) | $ | 6.95 | ||
| Class M : | ||||
Net Asset Value and redemption price per share ($163,580 ÷ 25,000 shares) (a) | $ | 6.54 | ||
| Maximum offering price per share (100/96.50 of $6.54) | $ | 6.78 | ||
| Class C : | ||||
Net Asset Value and offering price per share ($162,986 ÷ 25,000 shares) (a) | $ | 6.52 | ||
| Fidelity Sustainable Emerging Markets Equity Fund : | ||||
Net Asset Value , offering price and redemption price per share ($2,082,050 ÷ 317,065 shares) | $ | 6.57 | ||
| Class I : | ||||
Net Asset Value , offering price and redemption price per share ($164,171 ÷ 25,000 shares) | $ | 6.57 | ||
| Class Z : | ||||
Net Asset Value , offering price and redemption price per share ($275,666 ÷ 41,956 shares) | $ | 6.57 | ||
(a)Redemption price per share is equal to net asset value less any applicable contingent deferred sales charge. | ||||
| Statement of Operations | ||||
| For the period February 10, 2022 (commencement of operations) through October 31, 2022 | ||||
| Investment Income | ||||
| Dividends | $ | 48,678 | ||
| Income from Fidelity Central Funds | 2,121 | |||
| Income before foreign taxes withheld | 50,799 | |||
| Less foreign taxes withheld | (6,506) | |||
| Total Income | 44,293 | |||
| Expenses | ||||
| Management fee | $ | 16,549 | ||
| Transfer agent fees | 3,480 | |||
| Distribution and service plan fees | 2,520 | |||
| Accounting fees and expenses | 1,076 | |||
| Custodian fees and expenses | 28,549 | |||
| Independent trustees' fees and expenses | 6 | |||
| Registration fees | 89,186 | |||
| Audit | 50,343 | |||
| Legal | 1 | |||
| Miscellaneous | 160 | |||
| Total expenses before reductions | 191,870 | |||
| Expense reductions | (162,457) | |||
| Total expenses after reductions | 29,413 | |||
| Net Investment income (loss) | 14,880 | |||
| Realized and Unrealized Gain (Loss) | ||||
| Net realized gain (loss) on: | ||||
| Investment Securities: | ||||
| Unaffiliated issuers | (377,829) | |||
| Foreign currency transactions | (3,596) | |||
| Futures contracts | (27,753) | |||
| Total net realized gain (loss) | (409,178) | |||
| Change in net unrealized appreciation (depreciation) on: | ||||
| Investment Securities: | ||||
| Unaffiliated issuers | (761,276) | |||
| Assets and liabilities in foreign currencies | 14 | |||
| Total change in net unrealized appreciation (depreciation) | (761,262) | |||
| Net gain (loss) | (1,170,440) | |||
| Net increase (decrease) in net assets resulting from operations | $ | (1,155,560) | ||
| Statement of Changes in Net Assets | ||
| For the period February 10, 2022 (commencement of operations) through October 31, 2022 | ||
| Increase (Decrease) in Net Assets | ||
| Operations | ||
| Net investment income (loss) | $ | 14,880 |
| Net realized gain (loss) | (409,178) | |
| Change in net unrealized appreciation (depreciation) | (761,262) | |
| Net increase (decrease) in net assets resulting from operations | (1,155,560) | |
| Share transactions - net increase (decrease) | 4,167,885 | |
| Total increase (decrease) in net assets | 3,012,325 | |
| Net Assets | ||
| Beginning of period | - | |
| End of period | $ | 3,012,325 |
| Fidelity Advisor® Sustainable Emerging Markets Equity Fund Class A |
| Years ended October 31, | 2022 A | |
Selected Per-Share Data | ||
| Net asset value, beginning of period | $ | 10.00 |
| Income from Investment Operations | ||
Net investment income (loss) B,C | .03 | |
| Net realized and unrealized gain (loss) | (3.48) | |
| Total from investment operations | (3.45) | |
| Net asset value, end of period | $ | 6.55 |
Total Return D,E,F | (34.50)% | |
Ratios to Average Net Assets C,G,H | ||
| Expenses before reductions | 8.77% I,J | |
| Expenses net of fee waivers, if any | 1.57% I | |
| Expenses net of all reductions | 1.56% I | |
| Net investment income (loss) | .51% I | |
| Supplemental Data | ||
| Net assets, end of period (000 omitted) | $ | 164 |
Portfolio turnover rate K | 84% I |
| Fidelity Advisor® Sustainable Emerging Markets Equity Fund Class M |
| Years ended October 31, | 2022 A | |
Selected Per-Share Data | ||
| Net asset value, beginning of period | $ | 10.00 |
| Income from Investment Operations | ||
Net investment income (loss) B,C | .01 | |
| Net realized and unrealized gain (loss) | (3.47) | |
| Total from investment operations | (3.46) | |
| Net asset value, end of period | $ | 6.54 |
Total Return D,E,F | (34.60)% | |
Ratios to Average Net Assets C,G,H | ||
| Expenses before reductions | 9.01% I,J | |
| Expenses net of fee waivers, if any | 1.82% I | |
| Expenses net of all reductions | 1.82% I | |
| Net investment income (loss) | .26% I | |
| Supplemental Data | ||
| Net assets, end of period (000 omitted) | $ | 164 |
Portfolio turnover rate K | 84% I |
| Fidelity Advisor® Sustainable Emerging Markets Equity Fund Class C |
| Years ended October 31, | 2022 A | |
Selected Per-Share Data | ||
| Net asset value, beginning of period | $ | 10.00 |
| Income from Investment Operations | ||
Net investment income (loss) B,C | (.01) | |
| Net realized and unrealized gain (loss) | (3.47) | |
| Total from investment operations | (3.48) | |
| Net asset value, end of period | $ | 6.52 |
Total Return D,E,F | (34.80)% | |
Ratios to Average Net Assets C,G,H | ||
| Expenses before reductions | 9.51% I,J | |
| Expenses net of fee waivers, if any | 2.32% I | |
| Expenses net of all reductions | 2.32% I | |
| Net investment income (loss) | (.24)% I | |
| Supplemental Data | ||
| Net assets, end of period (000 omitted) | $ | 163 |
Portfolio turnover rate K | 84% I |
| Fidelity® Sustainable Emerging Markets Equity Fund |
| Years ended October 31, | 2022 A | |
Selected Per-Share Data | ||
| Net asset value, beginning of period | $ | 10.00 |
| Income from Investment Operations | ||
Net investment income (loss) B,C | .05 | |
| Net realized and unrealized gain (loss) | (3.48) | |
| Total from investment operations | (3.43) | |
| Net asset value, end of period | $ | 6.57 |
Total Return D,E | (34.30)% | |
Ratios to Average Net Assets C,F,G | ||
| Expenses before reductions | 8.07% H,I | |
| Expenses net of fee waivers, if any | 1.25% H | |
| Expenses net of all reductions | 1.25% H | |
| Net investment income (loss) | .83% H | |
| Supplemental Data | ||
| Net assets, end of period (000 omitted) | $ | 2,082 |
Portfolio turnover rate J | 84% H |
| Fidelity Advisor Sustainable Emerging Markets Equity Fund Class I |
| Years ended October 31, | 2022 A | |
Selected Per-Share Data | ||
| Net asset value, beginning of period | $ | 10.00 |
| Income from Investment Operations | ||
Net investment income (loss) B,C | .04 | |
| Net realized and unrealized gain (loss) | (3.47) | |
| Total from investment operations | (3.43) | |
| Net asset value, end of period | $ | 6.57 |
Total Return D,E | (34.30)% | |
Ratios to Average Net Assets C,F,G | ||
| Expenses before reductions | 8.50% H,I | |
| Expenses net of fee waivers, if any | 1.31% H | |
| Expenses net of all reductions | 1.31% H | |
| Net investment income (loss) | .76% H | |
| Supplemental Data | ||
| Net assets, end of period (000 omitted) | $ | 164 |
Portfolio turnover rate J | 84% H |
| Fidelity Advisor® Sustainable Emerging Markets Equity Fund Class Z |
| Years ended October 31, | 2022 A | |
Selected Per-Share Data | ||
| Net asset value, beginning of period | $ | 10.00 |
| Income from Investment Operations | ||
Net investment income (loss) B,C | .05 | |
| Net realized and unrealized gain (loss) | (3.48) | |
| Total from investment operations | (3.43) | |
| Net asset value, end of period | $ | 6.57 |
Total Return D,E | (34.30)% | |
Ratios to Average Net Assets B,F,G | ||
| Expenses before reductions | 8.23% H,I | |
| Expenses net of fee waivers, if any | 1.15% H | |
| Expenses net of all reductions | 1.15% H | |
| Net investment income (loss) | .93% H | |
| Supplemental Data | ||
| Net assets, end of period (000 omitted) | $ | 276 |
Portfolio turnover rate J | 84% H |
| Fidelity Central Fund | Investment Manager | Investment Objective | Investment Practices | Expense Ratio A |
| Fidelity Money Market Central Funds | Fidelity Management & Research Company LLC (FMR) | Each fund seeks to obtain a high level of current income consistent with the preservation of capital and liquidity. | Short-term Investments | Less than .005% |
| Gross unrealized appreciation | $75,025 |
| Gross unrealized depreciation | (939,332) |
| Net unrealized appreciation (depreciation) | $(864,307) |
| Tax Cost | $3,881,420 |
| Undistributed ordinary income | $11,312 |
| Capital loss carryforward | $(302,578) |
| Net unrealized appreciation (depreciation) on securities and other investments | $(864,293) |
| Short-term | $(285,926) |
| Long-term | (16,652) |
| Total capital loss carryforward | $(302,578) |
| Equity Risk | Equity risk relates to the fluctuations in the value of financial instruments as a result of changes in market prices (other than those arising from interest rate risk or foreign exchange risk), whether caused by factors specific to an individual investment, its issuer, or all factors affecting all instruments traded in a market or market segment. |
| Purchases ($) | Sales ($) | |
| Fidelity Sustainable Emerging Markets Equity Fund | 5,701,406 | 1,675,466 |
| Distribution Fee | Service Fee | Total Fees | Retained by FDC | |
| Class A | - % | .25% | $361 | $361 |
| Class M | .25% | .25% | 720 | 720 |
| Class C | .75% | .25% | 1,439 | 1,439 |
| $2,520 | $2,520 |
| Amount | % of Class-Level Average Net Assets A | |
| Class A | $164 | .11 |
| Class M | 141 | .10 |
| Class C | 140 | .10 |
| Fidelity Sustainable Emerging Markets Equity Fund | 2,829 | .20 |
| Class I | 141 | .10 |
| Class Z | 65 | .04 |
| $3,480 |
| % of Average Net Assets | |
| Fidelity Sustainable Emerging Markets Equity Fund | .05 |
| Amount | |
| Fidelity Sustainable Emerging Markets Equity Fund | $38 |
| Purchases ($) | Sales ($) | Realized Gain (Loss) ($) | |
| Fidelity Sustainable Emerging Markets Equity Fund | 81,664 | 19,344 | (11,753) |
| Amount | |
| Fidelity Sustainable Emerging Markets Equity Fund | $3 |
| Expense Limitations | Reimbursement | |
| Class A | 1.55%/1.50% A | $11,341 |
| Class M | 1.80%/1.75% A | 11,296 |
| Class C | 2.30%/2.25% A | 11,273 |
| Fidelity Sustainable Emerging Markets Equity Fund | 1.30%/1.25% A | 104,948 |
| Class I | 1.30%/1.25% A | 11,318 |
| Class Z | 1.15%/1.10% A | 12,179 |
| $162,355 |
| Shares | Dollars | |
Year ended October 31, 2022 A | Year ended October 31, 2022 A | |
| Fidelity Sustainable Emerging Markets Equity Fund | ||
| Class A | ||
| Shares sold | 25,041 | $250,393 |
| Shares redeemed | (41) | (320) |
| Net increase (decrease) | 25,000 | $250,073 |
| Class M | ||
| Shares sold | 25,000 | $250,003 |
| Net increase (decrease) | 25,000 | $250,003 |
| Class C | ||
| Shares sold | 25,000 | $250,000 |
| Net increase (decrease) | 25,000 | $250,000 |
| Fidelity Sustainable Emerging Markets Equity Fund | ||
| Shares sold | 382,605 | $3,306,578 |
| Shares redeemed | (65,540) | (507,726) |
| Net increase (decrease) | 317,065 | $2,798,852 |
| Class I | ||
| Shares sold | 25,000 | $250,000 |
| Net increase (decrease) | 25,000 | $250,000 |
| Class Z | ||
| Shares sold | 42,008 | $369,361 |
| Shares redeemed | (52) | (404) |
| Net increase (decrease) | 41,956 | $368,957 |
| Fund | Affiliated % |
Fidelity Sustainable Emerging Markets Equity Fund | 44% |
| Fidelity Sustainable Multi-Asset Fund | |
| Fidelity Sustainable Emerging Markets Equity Fund | 12% |
| The Example is based on an investment of $1,000 invested at the beginning of the period and held for the entire period (May 1, 2022 to October 31, 2022). |
Annualized Expense Ratio- A | Beginning Account Value May 1, 2022 | Ending Account Value October 31, 2022 | Expenses Paid During Period- C May 1, 2022 to October 31, 2022 | |||||||
| Fidelity® Sustainable Emerging Markets Equity Fund | ||||||||||
| Class A | 1.57% | |||||||||
| Actual | $ 1,000 | $ 794.90 | $ 7.10 | |||||||
Hypothetical- B | $ 1,000 | $ 1,017.29 | $ 7.98 | |||||||
| Class M | 1.82% | |||||||||
| Actual | $ 1,000 | $ 793.70 | $ 8.23 | |||||||
Hypothetical- B | $ 1,000 | $ 1,016.03 | $ 9.25 | |||||||
| Class C | 2.33% | |||||||||
| Actual | $ 1,000 | $ 792.20 | $ 10.53 | |||||||
Hypothetical- B | $ 1,000 | $ 1,013.46 | $ 11.82 | |||||||
| Fidelity® Sustainable Emerging Markets Equity Fund | 1.24% | |||||||||
| Actual | $ 1,000 | $ 797.30 | $ 5.62 | |||||||
Hypothetical- B | $ 1,000 | $ 1,018.95 | $ 6.31 | |||||||
| Class I | 1.32% | |||||||||
| Actual | $ 1,000 | $ 797.30 | $ 5.98 | |||||||
Hypothetical- B | $ 1,000 | $ 1,018.55 | $ 6.72 | |||||||
| Class Z | 1.15% | |||||||||
| Actual | $ 1,000 | $ 796.40 | $ 5.21 | |||||||
Hypothetical- B | $ 1,000 | $ 1,019.41 | $ 5.85 | |||||||
|


Contents
Board Approval of Investment Advisory Contracts and Management Fees |
| Average Annual Total Returns | |||
Periods ended October 31, 2022 | Past 1 year | Past 5 years | Past 10 years |
| Class A (incl.5.75% sales charge) | -29.72% | 0.34% | 3.97% |
| Class M (incl.3.50% sales charge) | -28.20% | 0.57% | 3.96% |
Class C (incl. contingent deferred sales charge) | -26.72% | 0.78% | 3.98% |
| Fidelity® Total International Equity Fund | -25.25% | 1.80% | 4.90% |
| Class I | -25.28% | 1.79% | 4.86% |
| Class Z | -25.09% | 1.97% | 4.96% |
| $10,000 Over 10 Years |
Let's say hypothetically that $10,000 was invested in Fidelity® Total International Equity Fund, a class of the fund, on October 31, 2012. The chart shows how the value of your investment would have changed, and also shows how the MSCI ACWI (All Country World Index) ex USA Index performed over the same period. |
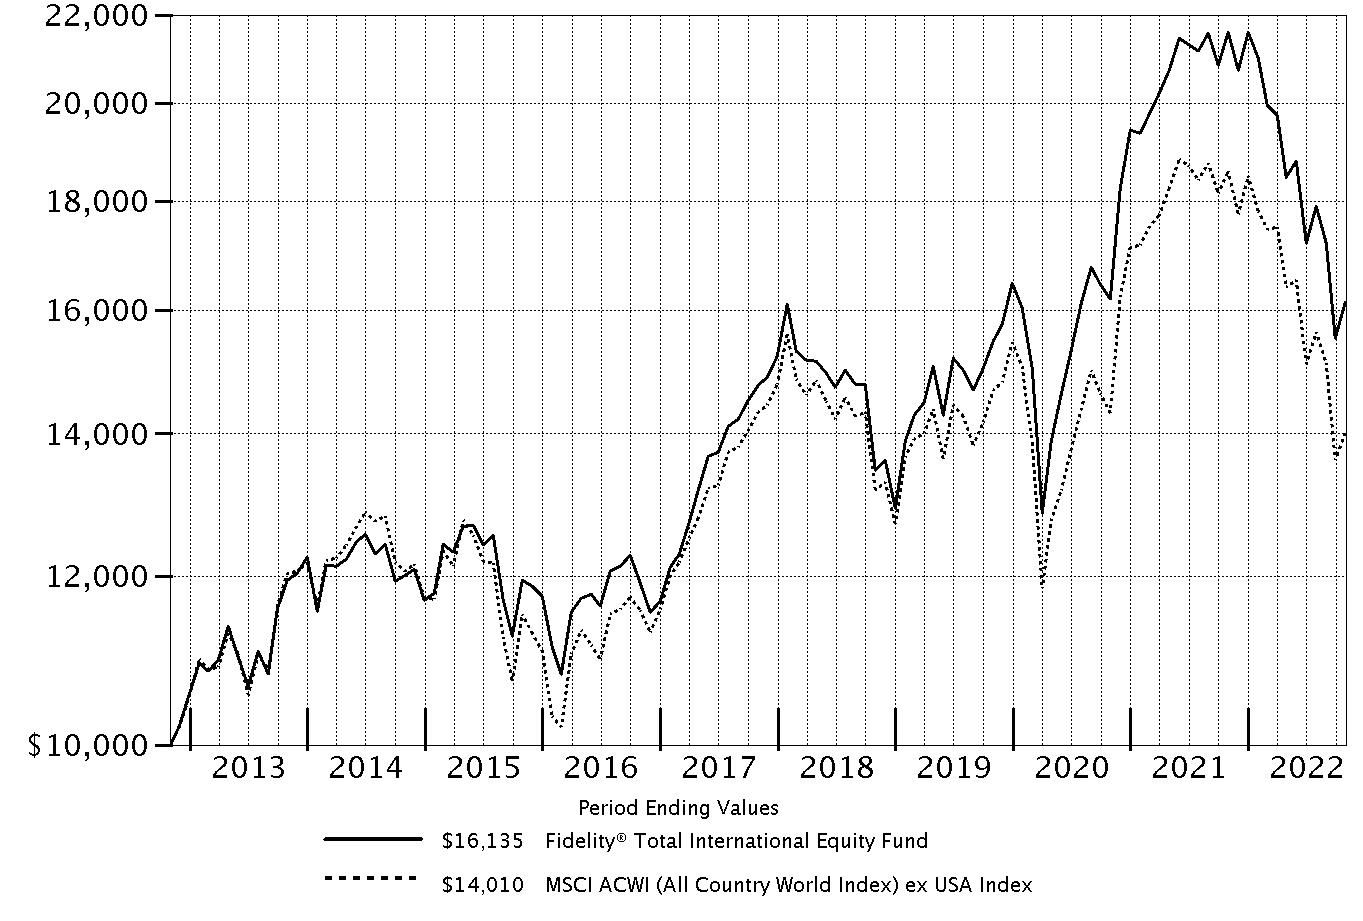 |
Top Holdings (% of Fund's net assets) | ||
| Samsung Electronics Co. Ltd. (Korea (South), Technology Hardware, Storage & Peripherals) | 2.8 | |
| Taiwan Semiconductor Manufacturing Co. Ltd. (Taiwan, Semiconductors & Semiconductor Equipment) | 2.7 | |
| Tencent Holdings Ltd. (Cayman Islands, Interactive Media & Services) | 1.9 | |
| Canadian Pacific Railway Ltd. (Canada, Road & Rail) | 1.7 | |
| Nestle SA (Reg. S) (Switzerland, Food Products) | 1.7 | |
| Roche Holding AG (participation certificate) (Switzerland, Pharmaceuticals) | 1.5 | |
| ASML Holding NV (Netherlands) (Netherlands, Semiconductors & Semiconductor Equipment) | 1.5 | |
| Linde PLC (Germany, Chemicals) | 1.5 | |
| LVMH Moet Hennessy Louis Vuitton SE (France, Textiles, Apparel & Luxury Goods) | 1.4 | |
| Housing Development Finance Corp. Ltd. (India, Diversified Financial Services) | 1.4 | |
| 18.1 | ||
| Market Sectors (% of Fund's net assets) | ||
| Financials | 20.9 | |
| Industrials | 18.2 | |
| Information Technology | 14.8 | |
| Materials | 10.8 | |
| Consumer Discretionary | 9.7 | |
| Health Care | 6.9 | |
| Energy | 6.4 | |
| Communication Services | 3.7 | |
| Consumer Staples | 3.3 | |
| Real Estate | 0.8 | |
| Utilities | 0.7 | |
Asset Allocation (% of Fund's net assets) |
 |
Foreign investments - 90.4% |
Geographic Diversification (% of Fund's net assets) |
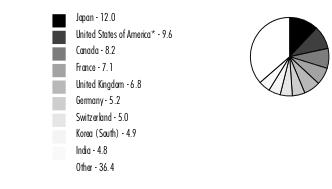 |
* Includes Short-Term investments and Net Other Assets (Liabilities). Percentages are based on country or territory of incorporation and are adjusted for the effect of futures contracts, if applicable. |
| Common Stocks - 94.7% | |||
| Shares | Value ($) | ||
| Australia - 2.1% | |||
| Aub Group Ltd. | 1,288 | 17,038 | |
| BHP Group Ltd. | 64,317 | 1,537,004 | |
| Imdex Ltd. | 23,979 | 31,290 | |
| Macquarie Group Ltd. | 4,861 | 527,033 | |
| National Australia Bank Ltd. | 27,772 | 576,881 | |
| Steadfast Group Ltd. | 11,336 | 36,690 | |
| Woodside Energy Group Ltd. | 23,682 | 545,032 | |
TOTAL AUSTRALIA | 3,270,968 | ||
| Austria - 0.1% | |||
| Erste Group Bank AG | 7,011 | 172,786 | |
| Bailiwick of Jersey - 1.2% | |||
| Experian PLC | 23,084 | 736,040 | |
| Ferguson PLC | 1,363 | 148,650 | |
| Glencore PLC | 169,105 | 969,491 | |
| Integrated Diagnostics Holdings PLC (a) | 40,522 | 31,202 | |
TOTAL BAILIWICK OF JERSEY | 1,885,383 | ||
| Belgium - 0.6% | |||
| Azelis Group NV | 8,320 | 190,427 | |
| KBC Ancora | 1,622 | 57,674 | |
| KBC Group NV | 7,490 | 375,367 | |
| UCB SA | 4,159 | 313,685 | |
TOTAL BELGIUM | 937,153 | ||
| Bermuda - 0.8% | |||
| Credicorp Ltd. (United States) | 5,868 | 858,840 | |
| Shangri-La Asia Ltd. (b) | 644,657 | 356,425 | |
TOTAL BERMUDA | 1,215,265 | ||
| Canada - 8.2% | |||
| Barrick Gold Corp. | 95,707 | 1,438,476 | |
| CAE, Inc. (b) | 44,298 | 845,413 | |
| Cameco Corp. | 21,500 | 509,902 | |
| Canadian Natural Resources Ltd. | 5,214 | 312,721 | |
| Canadian Pacific Railway Ltd. | 34,628 | 2,581,436 | |
| Constellation Software, Inc. | 725 | 1,048,314 | |
| Franco-Nevada Corp. | 7,181 | 887,274 | |
| McCoy Global, Inc. (b) | 7,000 | 5,138 | |
| Nutrien Ltd. | 17,164 | 1,450,250 | |
| Osisko Gold Royalties Ltd. | 2,296 | 24,623 | |
| Pason Systems, Inc. | 3,589 | 38,120 | |
| PrairieSky Royalty Ltd. | 1,500 | 23,298 | |
| Richelieu Hardware Ltd. | 20,467 | 549,402 | |
| Summit Industrial Income REIT | 19,994 | 255,511 | |
| Suncor Energy, Inc. | 28,362 | 975,552 | |
| The Toronto-Dominion Bank | 25,791 | 1,650,616 | |
TOTAL CANADA | 12,596,046 | ||
| Cayman Islands - 4.4% | |||
| Alibaba Group Holding Ltd. (b) | 116,246 | 903,802 | |
| Chlitina Holding Ltd. | 6,200 | 28,353 | |
| JD.com, Inc. Class A | 75,192 | 1,369,285 | |
| Li Ning Co. Ltd. | 59,769 | 309,138 | |
| Meituan Class B (a)(b) | 53,340 | 854,003 | |
| Sunny Optical Technology Group Co. Ltd. | 43,391 | 376,164 | |
| Tencent Holdings Ltd. | 114,116 | 2,998,603 | |
TOTAL CAYMAN ISLANDS | 6,839,348 | ||
| China - 3.6% | |||
| China Life Insurance Co. Ltd. (H Shares) | 1,235,165 | 1,346,895 | |
| Guangzhou Automobile Group Co. Ltd. (H Shares) | 919,716 | 560,056 | |
| Haier Smart Home Co. Ltd. (A Shares) | 422,200 | 1,202,503 | |
| Industrial & Commercial Bank of China Ltd. (H Shares) | 1,781,696 | 773,551 | |
| Shenzhen Inovance Technology Co. Ltd. (A Shares) | 53,000 | 484,068 | |
| Shenzhen Mindray Bio-Medical Electronics Co. Ltd. (A Shares) | 19,400 | 864,525 | |
| Zhejiang Sanhua Intelligent Controls Co. Ltd. (A Shares) | 115,100 | 334,918 | |
TOTAL CHINA | 5,566,516 | ||
| Denmark - 0.6% | |||
| DSV A/S | 1,789 | 242,196 | |
| ORSTED A/S (a) | 2,011 | 165,919 | |
| Spar Nord Bank A/S | 3,220 | 38,977 | |
| Vestas Wind Systems A/S | 20,731 | 408,684 | |
TOTAL DENMARK | 855,776 | ||
| Finland - 0.6% | |||
| Kone OYJ (B Shares) | 5,575 | 228,273 | |
| Musti Group OYJ | 1,956 | 36,766 | |
| Sampo Oyj (A Shares) | 13,814 | 631,800 | |
TOTAL FINLAND | 896,839 | ||
| France - 7.1% | |||
| Air Liquide SA | 4,527 | 592,194 | |
| ALTEN | 1,384 | 161,803 | |
| AXA SA | 33,820 | 835,182 | |
| BNP Paribas SA | 13,035 | 611,262 | |
| Capgemini SA | 2,062 | 337,943 | |
| Edenred SA | 11,158 | 572,957 | |
| Euroapi SASU (b) | 459 | 8,031 | |
| Laurent-Perrier Group SA | 451 | 43,946 | |
| Lectra | 7,405 | 237,103 | |
| Legrand SA | 9,414 | 717,391 | |
| LISI | 2,320 | 45,809 | |
| LVMH Moet Hennessy Louis Vuitton SE | 3,322 | 2,096,165 | |
| Safran SA | 8,923 | 993,754 | |
| Sanofi SA | 11,521 | 991,473 | |
| Teleperformance | 835 | 223,874 | |
| TotalEnergies SE | 28,898 | 1,576,483 | |
| Vetoquinol SA | 776 | 64,495 | |
| VINCI SA | 5,146 | 473,623 | |
| Vivendi SA (c) | 36,430 | 298,179 | |
TOTAL FRANCE | 10,881,667 | ||
| Germany - 4.9% | |||
| Bayer AG | 10,758 | 565,667 | |
| CTS Eventim AG (b) | 3,552 | 169,686 | |
| Deutsche Borse AG | 4,242 | 689,833 | |
| Deutsche Post AG | 9,829 | 347,453 | |
| Hannover Reuck SE | 3,467 | 564,648 | |
| Linde PLC (c) | 7,465 | 2,232,736 | |
| Muenchener Rueckversicherungs-Gesellschaft AG in Muenchen | 1,504 | 397,020 | |
| Nexus AG | 1,420 | 76,200 | |
| Rheinmetall AG | 3,213 | 522,328 | |
| RWE AG | 14,123 | 544,186 | |
| Scout24 AG (a) | 860 | 44,093 | |
| Siemens AG | 7,670 | 837,633 | |
| Stabilus Se | 702 | 38,538 | |
| Vonovia SE | 23,361 | 516,526 | |
TOTAL GERMANY | 7,546,547 | ||
| Greece - 0.6% | |||
| National Bank of Greece SA (b) | 272,179 | 987,160 | |
| Hong Kong - 1.5% | |||
| AIA Group Ltd. | 176,438 | 1,336,482 | |
| China Resources Beer Holdings Co. Ltd. | 162,625 | 766,547 | |
| Hong Kong Exchanges and Clearing Ltd. | 5,400 | 143,336 | |
TOTAL HONG KONG | 2,246,365 | ||
| Hungary - 0.6% | |||
| Richter Gedeon PLC | 44,120 | 871,180 | |
| India - 4.8% | |||
| Axis Bank Ltd. | 90,479 | 990,263 | |
| Embassy Office Parks (REIT) | 11,400 | 47,426 | |
| Housing Development Finance Corp. Ltd. | 70,058 | 2,090,230 | |
| Indian Energy Exchange Ltd. (a) | 15,519 | 26,227 | |
| Kotak Mahindra Bank Ltd. | 10,353 | 237,870 | |
| Larsen & Toubro Ltd. | 63,265 | 1,546,164 | |
| Reliance Industries Ltd. | 1,800 | 55,439 | |
| Reliance Industries Ltd. sponsored GDR (a) | 9,209 | 562,209 | |
| Shree Cement Ltd. | 2,422 | 665,348 | |
| Solar Industries India Ltd. | 18,046 | 850,601 | |
| Voltas Ltd. | 26,830 | 283,987 | |
TOTAL INDIA | 7,355,764 | ||
| Indonesia - 0.8% | |||
| PT Bank Mandiri (Persero) Tbk | 639,917 | 432,834 | |
| PT Bank Rakyat Indonesia (Persero) Tbk | 774,035 | 230,759 | |
| PT United Tractors Tbk | 315,824 | 654,022 | |
TOTAL INDONESIA | 1,317,615 | ||
| Ireland - 1.2% | |||
| Bank of Ireland Group PLC | 33,831 | 243,931 | |
| Cairn Homes PLC | 31,039 | 29,936 | |
| CRH PLC | 14,870 | 535,586 | |
| CRH PLC sponsored ADR | 21,716 | 786,336 | |
| Irish Residential Properties REIT PLC | 19,765 | 21,369 | |
| Ryanair Holdings PLC sponsored ADR (b) | 4,274 | 294,436 | |
TOTAL IRELAND | 1,911,594 | ||
| Israel - 0.4% | |||
| Icl Group Ltd. | 53,348 | 481,914 | |
| Ituran Location & Control Ltd. | 2,447 | 58,679 | |
| Maytronics Ltd. | 2,027 | 21,879 | |
| Strauss Group Ltd. | 887 | 22,210 | |
| Tel Aviv Stock Exchange Ltd. | 8,000 | 47,159 | |
TOTAL ISRAEL | 631,841 | ||
| Italy - 1.0% | |||
| Enel SpA | 77,029 | 344,115 | |
| Interpump Group SpA | 12,172 | 471,295 | |
| Mediobanca SpA (c) | 38,496 | 348,937 | |
| Prada SpA | 72,500 | 330,190 | |
TOTAL ITALY | 1,494,537 | ||
| Japan - 12.0% | |||
| Ai Holdings Corp. | 1,300 | 19,269 | |
| Aoki Super Co. Ltd. | 1,200 | 20,660 | |
| Artnature, Inc. | 3,300 | 17,111 | |
| Aucnet, Inc. | 2,100 | 31,649 | |
| Azbil Corp. | 28,300 | 769,854 | |
| Broadleaf Co. Ltd. | 17,000 | 62,309 | |
| Central Automotive Products Ltd. | 1,100 | 16,600 | |
| Curves Holdings Co. Ltd. | 13,700 | 79,697 | |
| Daiichikosho Co. Ltd. | 2,900 | 83,278 | |
| Daikokutenbussan Co. Ltd. | 600 | 18,319 | |
| DENSO Corp. | 9,590 | 475,817 | |
| Digital Hearts Holdings Co. Ltd. | 3,600 | 49,511 | |
| FANUC Corp. | 2,400 | 314,044 | |
| FUJIFILM Holdings Corp. | 7,976 | 365,771 | |
| Fujitec Co. Ltd. | 1,400 | 27,850 | |
| Fujitsu Ltd. | 1,979 | 227,701 | |
| Funai Soken Holdings, Inc. | 2,250 | 40,144 | |
| Goldcrest Co. Ltd. | 3,960 | 46,605 | |
| Hitachi Ltd. | 20,748 | 943,249 | |
| Hoya Corp. | 14,176 | 1,322,788 | |
| Ibiden Co. Ltd. | 4,441 | 150,229 | |
| Idemitsu Kosan Co. Ltd. | 9,667 | 211,290 | |
| Itochu Corp. | 20,157 | 521,768 | |
| JEOL Ltd. | 2,900 | 106,486 | |
| Keyence Corp. | 3,684 | 1,395,359 | |
| Kobayashi Pharmaceutical Co. Ltd. | 1,100 | 58,442 | |
| Koshidaka Holdings Co. Ltd. | 9,800 | 73,684 | |
| Kusuri No Aoki Holdings Co. Ltd. | 700 | 33,801 | |
| Lasertec Corp. | 4,850 | 681,478 | |
| Medikit Co. Ltd. | 2,000 | 32,550 | |
| Minebea Mitsumi, Inc. | 17,713 | 262,547 | |
| Miroku Jyoho Service Co., Ltd. | 2,400 | 24,114 | |
| Misumi Group, Inc. | 29,600 | 633,027 | |
| Mitsubishi Estate Co. Ltd. | 16,943 | 213,063 | |
| Mitsubishi UFJ Financial Group, Inc. | 146,921 | 694,033 | |
| Mitsuboshi Belting Ltd. | 700 | 14,900 | |
| Mitsui Fudosan Co. Ltd. | 11,548 | 221,299 | |
| Nagaileben Co. Ltd. | 4,500 | 61,798 | |
| Nihon Parkerizing Co. Ltd. | 13,600 | 88,536 | |
| NS Tool Co. Ltd. | 4,000 | 31,043 | |
| NSD Co. Ltd. | 2,800 | 47,905 | |
| OBIC Co. Ltd. | 1,350 | 203,097 | |
| ORIX Corp. | 35,988 | 528,826 | |
| OSG Corp. | 14,080 | 179,249 | |
| Paramount Bed Holdings Co. Ltd. | 1,800 | 32,055 | |
| ProNexus, Inc. | 4,200 | 27,088 | |
| Recruit Holdings Co. Ltd. | 37,626 | 1,157,796 | |
| Renesas Electronics Corp. (b) | 37,004 | 309,566 | |
| San-Ai Obbli Co. Ltd. | 4,600 | 38,051 | |
| Shin-Etsu Chemical Co. Ltd. | 5,251 | 545,736 | |
| Shiseido Co. Ltd. | 3,507 | 121,582 | |
| SHO-BOND Holdings Co. Ltd. | 10,980 | 475,545 | |
| Shoei Co. Ltd. | 3,200 | 118,148 | |
| SK Kaken Co. Ltd. | 320 | 79,734 | |
| SoftBank Group Corp. | 8,709 | 373,844 | |
| Software Service, Inc. | 500 | 27,674 | |
| Sony Group Corp. | 2,016 | 135,948 | |
| Sumitomo Mitsui Financial Group, Inc. | 18,865 | 529,759 | |
| Suzuki Motor Corp. | 12,044 | 406,610 | |
| Techno Medica Co. Ltd. | 500 | 5,494 | |
| The Monogatari Corp. | 620 | 28,437 | |
| TIS, Inc. | 9,114 | 246,092 | |
| Tocalo Co. Ltd. | 2,800 | 22,408 | |
| Tokio Marine Holdings, Inc. | 34,989 | 633,212 | |
| Toyota Motor Corp. | 102,029 | 1,415,613 | |
| USS Co. Ltd. | 22,900 | 346,053 | |
| Welcia Holdings Co. Ltd. | 1,600 | 33,464 | |
| YAKUODO Holdings Co. Ltd. | 1,600 | 29,978 | |
TOTAL JAPAN | 18,540,637 | ||
| Kenya - 0.1% | |||
| Safaricom Ltd. | 1,025,096 | 212,031 | |
| Korea (South) - 4.9% | |||
| BGF Retail Co. Ltd. | 301 | 39,330 | |
| Hyundai Mipo Dockyard Co. Ltd. (b) | 8,515 | 547,654 | |
| Hyundai Motor Co. | 5,336 | 614,979 | |
| Korea Aerospace Industries Ltd. | 24,461 | 811,471 | |
| Korea Zinc Co. Ltd. | 1,154 | 517,445 | |
| POSCO | 4,798 | 834,566 | |
| Samsung Electronics Co. Ltd. | 101,837 | 4,238,096 | |
TOTAL KOREA (SOUTH) | 7,603,541 | ||
| Luxembourg - 0.2% | |||
| ArcelorMittal SA (Netherlands) | 11,043 | 247,240 | |
| Mexico - 0.6% | |||
| Grupo Financiero Banorte S.A.B. de CV Series O | 50,805 | 412,969 | |
| Wal-Mart de Mexico SA de CV Series V | 121,280 | 468,458 | |
TOTAL MEXICO | 881,427 | ||
| Netherlands - 3.3% | |||
| Aalberts Industries NV | 7,179 | 249,590 | |
| AerCap Holdings NV (b) | 818 | 43,689 | |
| Airbus Group NV | 12,797 | 1,384,684 | |
| ASML Holding NV (Netherlands) | 4,774 | 2,239,422 | |
| IMCD NV | 3,284 | 426,123 | |
| NN Group NV | 11,946 | 505,871 | |
| Universal Music Group NV | 8,032 | 157,712 | |
| Yandex NV Series A (b)(d) | 15,421 | 52,892 | |
TOTAL NETHERLANDS | 5,059,983 | ||
| New Zealand - 0.1% | |||
| Auckland International Airport Ltd. (b) | 30,663 | 137,272 | |
| Norway - 0.5% | |||
| Adevinta ASA Class B (b) | 16,961 | 116,161 | |
| Equinor ASA | 11,083 | 403,795 | |
| Kongsberg Gruppen ASA | 3,112 | 111,535 | |
| Medistim ASA | 1,184 | 27,447 | |
| Schibsted ASA (B Shares) | 9,906 | 147,025 | |
| Volue A/S (b) | 6,514 | 16,918 | |
TOTAL NORWAY | 822,881 | ||
| Russia - 0.0% | |||
| LUKOIL PJSC sponsored ADR (d) | 15,040 | 4,255 | |
| Sberbank of Russia sponsored ADR (b)(d) | 62,556 | 1,114 | |
TOTAL RUSSIA | 5,369 | ||
| Singapore - 0.5% | |||
| United Overseas Bank Ltd. | 36,124 | 708,394 | |
| South Africa - 1.0% | |||
| Absa Group Ltd. | 48,783 | 530,462 | |
| Clicks Group Ltd. | 9,830 | 166,565 | |
| Impala Platinum Holdings Ltd. | 76,938 | 787,743 | |
| Thungela Resources Ltd. | 2,770 | 42,313 | |
TOTAL SOUTH AFRICA | 1,527,083 | ||
| Spain - 1.5% | |||
| Amadeus IT Holding SA Class A (b) | 21,319 | 1,111,899 | |
| Banco Santander SA (Spain) (c) | 256,600 | 664,900 | |
| Cellnex Telecom SA (a) | 12,308 | 402,844 | |
| Fluidra SA | 2,271 | 30,814 | |
| Unicaja Banco SA (a) | 103,737 | 91,856 | |
TOTAL SPAIN | 2,302,313 | ||
| Sweden - 2.7% | |||
| Addlife AB | 5,860 | 54,772 | |
| AddTech AB (B Shares) | 19,677 | 238,094 | |
| Alleima AB (b) | 2,191 | 7,465 | |
| ASSA ABLOY AB (B Shares) | 48,047 | 970,169 | |
| Atlas Copco AB (A Shares) | 106,388 | 1,135,506 | |
| Epiroc AB (A Shares) | 39,861 | 610,210 | |
| Hemnet Group AB | 4,101 | 50,960 | |
| Investor AB (B Shares) | 31,356 | 512,206 | |
| INVISIO AB | 2,675 | 39,733 | |
| John Mattson Fastighetsforetag (b) | 2,968 | 18,763 | |
| Lagercrantz Group AB (B Shares) | 39,750 | 341,114 | |
| Sandvik AB | 11,535 | 180,255 | |
| Teqnion AB | 2,800 | 31,699 | |
TOTAL SWEDEN | 4,190,946 | ||
| Switzerland - 5.0% | |||
| Nestle SA (Reg. S) | 23,517 | 2,560,032 | |
| Novartis AG | 5,447 | 440,612 | |
| Roche Holding AG (participation certificate) | 7,178 | 2,381,647 | |
| Schindler Holding AG: | |||
| (participation certificate) | 1,084 | 176,724 | |
| (Reg.) | 107 | 16,840 | |
| Swiss Life Holding AG | 705 | 341,394 | |
| Tecan Group AG | 259 | 95,028 | |
| UBS Group AG | 52,885 | 838,756 | |
| Zurich Insurance Group Ltd. | 2,152 | 917,126 | |
TOTAL SWITZERLAND | 7,768,159 | ||
| Taiwan - 3.8% | |||
| Addcn Technology Co. Ltd. | 5,778 | 32,245 | |
| ECLAT Textile Co. Ltd. | 46,942 | 617,811 | |
| HIWIN Technologies Corp. | 114,228 | 587,891 | |
| Taiwan Semiconductor Manufacturing Co. Ltd. | 343,051 | 4,120,203 | |
| Yageo Corp. | 38,775 | 441,199 | |
TOTAL TAIWAN | 5,799,349 | ||
| Thailand - 0.5% | |||
| Kasikornbank PCL (For. Reg.) | 189,901 | 728,757 | |
| Turkey - 0.3% | |||
| Turkiye Petrol Rafinerileri A/S (b) | 22,767 | 463,553 | |
| United Kingdom - 6.8% | |||
| Alliance Pharma PLC | 68,541 | 48,891 | |
| Anglo American PLC (United Kingdom) | 20,175 | 604,326 | |
| AstraZeneca PLC (United Kingdom) | 7,807 | 916,012 | |
| Avon Protection PLC | 2,554 | 30,461 | |
| BAE Systems PLC | 132,833 | 1,242,463 | |
| Beazley PLC | 36,282 | 259,843 | |
| Bodycote PLC | 12,462 | 70,828 | |
| BP PLC | 194,388 | 1,075,473 | |
| Clarkson PLC | 2,308 | 73,184 | |
| Compass Group PLC | 44,394 | 935,019 | |
| Dechra Pharmaceuticals PLC | 9,122 | 274,081 | |
| Helios Towers PLC (b) | 15,311 | 22,036 | |
| Howden Joinery Group PLC | 9,877 | 58,220 | |
| Imperial Brands PLC | 18,370 | 447,477 | |
| InterContinental Hotel Group PLC ADR | 7,516 | 412,177 | |
| Lloyds Banking Group PLC | 817,626 | 392,680 | |
| Rightmove PLC | 65,358 | 368,044 | |
| Shell PLC ADR | 34,353 | 1,911,057 | |
| Spectris PLC | 19,735 | 683,489 | |
| Spirax-Sarco Engineering PLC | 1,019 | 125,623 | |
| Standard Chartered PLC (United Kingdom) | 97,298 | 580,446 | |
TOTAL UNITED KINGDOM | 10,531,830 | ||
| United States of America - 5.8% | |||
| Alphabet, Inc. Class A (b) | 2,574 | 243,269 | |
| Autoliv, Inc. | 5,629 | 452,290 | |
| Lam Research Corp. | 516 | 208,866 | |
| Marsh & McLennan Companies, Inc. | 8,987 | 1,451,311 | |
| MasterCard, Inc. Class A | 2,389 | 784,022 | |
| Moody's Corp. | 2,370 | 627,742 | |
| Morningstar, Inc. | 570 | 132,343 | |
| MSCI, Inc. | 1,867 | 875,362 | |
| NICE Ltd. sponsored ADR (b) | 3,329 | 632,144 | |
| NOV, Inc. | 13,900 | 311,360 | |
| Otis Worldwide Corp. | 3,656 | 258,260 | |
| PriceSmart, Inc. | 3,197 | 204,512 | |
| ResMed, Inc. | 5,133 | 1,148,201 | |
| S&P Global, Inc. | 1,896 | 609,090 | |
| Sherwin-Williams Co. | 2,178 | 490,115 | |
| Visa, Inc. Class A | 2,627 | 544,209 | |
TOTAL UNITED STATES OF AMERICA | 8,973,096 | ||
| TOTAL COMMON STOCKS (Cost $152,407,685) | 145,984,211 | ||
| Preferred Stocks - 1.5% | |||
| Shares | Value ($) | ||
| Convertible Preferred Stocks - 0.1% | |||
| China - 0.1% | |||
| ByteDance Ltd. Series E1 (b)(d)(e) | 577 | 90,601 | |
| Nonconvertible Preferred Stocks - 1.4% | |||
| Brazil - 1.1% | |||
| Ambev SA sponsored ADR | 138,041 | 419,645 | |
| Itau Unibanco Holding SA | 123,717 | 728,099 | |
| Petroleo Brasileiro SA - Petrobras sponsored ADR | 44,913 | 575,785 | |
| 1,723,529 | |||
| Germany - 0.3% | |||
| Porsche Automobil Holding SE (Germany) | 7,719 | 431,278 | |
TOTAL NONCONVERTIBLE PREFERRED STOCKS | 2,154,807 | ||
| TOTAL PREFERRED STOCKS (Cost $1,913,654) | 2,245,408 | ||
| Money Market Funds - 5.3% | |||
| Shares | Value ($) | ||
| Fidelity Cash Central Fund 3.10% (f) | 5,393,020 | 5,394,098 | |
| Fidelity Securities Lending Cash Central Fund 3.10% (f)(g) | 2,836,602 | 2,836,886 | |
| TOTAL MONEY MARKET FUNDS (Cost $8,230,980) | 8,230,984 | ||
| TOTAL INVESTMENT IN SECURITIES - 101.5% (Cost $162,552,319) | 156,460,603 |
NET OTHER ASSETS (LIABILITIES) - (1.5)% | (2,342,975) |
| NET ASSETS - 100.0% | 154,117,628 |
| (a) | Security exempt from registration under Rule 144A of the Securities Act of 1933. These securities may be resold in transactions exempt from registration, normally to qualified institutional buyers. At the end of the period, the value of these securities amounted to $2,178,353 or 1.4% of net assets. |
| (b) | Non-income producing |
| (c) | Security or a portion of the security is on loan at period end. |
| (d) | Level 3 security |
| (e) | Restricted securities (including private placements) - Investment in securities not registered under the Securities Act of 1933 (excluding 144A issues). At the end of the period, the value of restricted securities (excluding 144A issues) amounted to $90,601 or 0.1% of net assets. |
| (f) | Affiliated fund that is generally available only to investment companies and other accounts managed by Fidelity Investments. The rate quoted is the annualized seven-day yield of the fund at period end. A complete unaudited listing of the fund's holdings as of its most recent quarter end is available upon request. In addition, each Fidelity Central Fund's financial statements, which are not covered by the Fund's Report of Independent Registered Public Accounting Firm, are available on the SEC's website or upon request. |
| (g) | Investment made with cash collateral received from securities on loan. |
| Additional information on each restricted holding is as follows: | ||
| Security | Acquisition Date | Acquisition Cost ($) |
| ByteDance Ltd. Series E1 | 11/18/20 | 63,224 |
| Affiliate | Value, beginning of period ($) | Purchases ($) | Sales Proceeds ($) | Dividend Income ($) | Realized Gain (loss) ($) | Change in Unrealized appreciation (depreciation) ($) | Value, end of period ($) | % ownership, end of period |
| Fidelity Cash Central Fund 3.10% | 2,208,399 | 154,057,091 | 150,871,392 | 53,862 | - | - | 5,394,098 | 0.0% |
| Fidelity Securities Lending Cash Central Fund 3.10% | 134,750 | 14,569,940 | 11,867,805 | 11,347 | - | 1 | 2,836,886 | 0.0% |
| Total | 2,343,149 | 168,627,031 | 162,739,197 | 65,209 | - | 1 | 8,230,984 | |
| Valuation Inputs at Reporting Date: | ||||
| Description | Total ($) | Level 1 ($) | Level 2 ($) | Level 3 ($) |
Investments in Securities: | ||||
| Equities: | ||||
Communication Services | 5,772,902 | 1,120,784 | 4,599,226 | 52,892 |
Consumer Discretionary | 14,661,958 | 6,045,028 | 8,616,930 | - |
Consumer Staples | 5,500,432 | 2,492,923 | 3,007,509 | - |
Energy | 10,294,848 | 7,234,842 | 3,055,751 | 4,255 |
Financials | 31,573,832 | 21,780,525 | 9,792,193 | 1,114 |
Health Care | 10,761,994 | 5,466,583 | 5,295,411 | - |
Industrials | 27,785,442 | 16,047,464 | 11,737,978 | - |
Information Technology | 22,797,400 | 13,678,587 | 9,028,212 | 90,601 |
Materials | 16,686,029 | 11,816,387 | 4,869,642 | - |
Real Estate | 1,340,562 | 610,973 | 729,589 | - |
Utilities | 1,054,220 | 544,186 | 510,034 | - |
| Money Market Funds | 8,230,984 | 8,230,984 | - | - |
| Total Investments in Securities: | 156,460,603 | 95,069,266 | 61,242,475 | 148,862 |
| Investments in Securities: | |||
| Beginning Balance | $ | 71,733 | |
| Net Realized Gain (Loss) on Investment Securities | - | ||
| Net Unrealized Gain (Loss) on Investment Securities | (3,274,991) | ||
| Cost of Purchases | 1,692,710 | ||
| Proceeds of Sales | - | ||
| Amortization/Accretion | - | ||
| Transfers into Level 3 | 1,659,410 | ||
| Transfers out of Level 3 | - | ||
| Ending Balance | $ | 148,862 | |
| The change in unrealized gain (loss) for the period attributable to Level 3 securities held at October 31, 2022 | $ | (3,274,991) | |
| The information used in the above reconciliation represents fiscal year to date activity for any Investments in Securities identified as using Level 3 inputs at either the beginning or the end of the current fiscal period. Cost of purchases and proceeds of sales may include securities received and/or delivered through in-kind transactions. Transfers into Level 3 were attributable to a lack of observable market data resulting from decreases in market activity, decreases in liquidity, security restructurings or corporate actions. Transfers out of Level 3 were attributable to observable market data becoming available for those securities. Transfers in or out of Level 3 represent the beginning value of any Security or Instrument where a change in the pricing level occurred from the beginning to the end of the period. The cost of purchases and the proceeds of sales may include securities received or delivered through corporate actions or exchanges. Realized and unrealized gains (losses) disclosed in the reconciliation are included in Net Gain (Loss) on the Fund's Statement of Operations. | |||
| Statement of Assets and Liabilities | ||||
| October 31, 2022 | ||||
| Assets | ||||
| Investment in securities, at value (including securities loaned of $2,644,852) - See accompanying schedule: | ||||
Unaffiliated issuers (cost $154,321,339) | $148,229,619 | |||
Fidelity Central Funds (cost $8,230,980) | 8,230,984 | |||
| Total Investment in Securities (cost $162,552,319) | $ | 156,460,603 | ||
| Cash | 19,271 | |||
| Foreign currency held at value (cost $62,438) | 63,033 | |||
| Receivable for investments sold | 388,550 | |||
| Receivable for fund shares sold | 288,335 | |||
| Dividends receivable | 240,068 | |||
| Reclaims receivable | 222,186 | |||
| Distributions receivable from Fidelity Central Funds | 15,659 | |||
| Prepaid expenses | 231 | |||
| Receivable from investment adviser for expense reductions | 53,748 | |||
| Other receivables | 20,764 | |||
Total assets | 157,772,448 | |||
| Liabilities | ||||
| Payable for investments purchased | $205,769 | |||
| Payable for fund shares redeemed | 243,941 | |||
| Accrued management fee | 103,338 | |||
| Distribution and service plan fees payable | 8,101 | |||
| Other affiliated payables | 27,632 | |||
| Other payables and accrued expenses | 229,153 | |||
| Collateral on securities loaned | 2,836,886 | |||
| Total Liabilities | 3,654,820 | |||
| Net Assets | $ | 154,117,628 | ||
| Net Assets consist of: | ||||
| Paid in capital | $ | 164,739,487 | ||
| Total accumulated earnings (loss) | (10,621,859) | |||
| Net Assets | $ | 154,117,628 | ||
| Net Asset Value and Maximum Offering Price | ||||
| Class A : | ||||
Net Asset Value and redemption price per share ($12,785,844 ÷ 1,493,072 shares) (a) | $ | 8.56 | ||
| Maximum offering price per share (100/94.25 of $8.56) | $ | 9.08 | ||
| Class M : | ||||
Net Asset Value and redemption price per share ($9,876,289 ÷ 1,147,179 shares) (a) | $ | 8.61 | ||
| Maximum offering price per share (100/96.50 of $8.61) | $ | 8.92 | ||
| Class C : | ||||
Net Asset Value and offering price per share ($1,893,418 ÷ 221,845 shares) (a) | $ | 8.53 | ||
| Total International Equity : | ||||
Net Asset Value , offering price and redemption price per share ($86,458,196 ÷ 10,054,641 shares) | $ | 8.60 | ||
| Class I : | ||||
Net Asset Value , offering price and redemption price per share ($35,422,526 ÷ 4,136,453 shares) | $ | 8.56 | ||
| Class Z : | ||||
Net Asset Value , offering price and redemption price per share ($7,681,355 ÷ 892,427 shares) | $ | 8.61 | ||
(a)Redemption price per share is equal to net asset value less any applicable contingent deferred sales charge. | ||||
| Statement of Operations | ||||
Year ended October 31, 2022 | ||||
| Investment Income | ||||
| Dividends | $ | 4,008,854 | ||
| Non-Cash dividends | 302,238 | |||
| Income from Fidelity Central Funds (including $11,347 from security lending) | 65,209 | |||
| Income before foreign taxes withheld | 4,376,301 | |||
| Less foreign taxes withheld | (362,827) | |||
| Total Income | 4,013,474 | |||
| Expenses | ||||
| Management fee | ||||
| Basic fee | $ | 954,132 | ||
| Performance adjustment | 196,641 | |||
| Transfer agent fees | 232,819 | |||
| Distribution and service plan fees | 101,884 | |||
| Accounting fees | 71,857 | |||
| Custodian fees and expenses | 91,433 | |||
| Independent trustees' fees and expenses | 464 | |||
| Registration fees | 94,248 | |||
| Audit | 92,597 | |||
| Legal | 4,207 | |||
| Miscellaneous | 671 | |||
| Total expenses before reductions | 1,840,953 | |||
| Expense reductions | (274,293) | |||
| Total expenses after reductions | 1,566,660 | |||
| Net Investment income (loss) | 2,446,814 | |||
| Realized and Unrealized Gain (Loss) | ||||
| Net realized gain (loss) on: | ||||
| Investment Securities: | ||||
| Unaffiliated issuers(net of foreign taxes of $44,392) | (5,024,975) | |||
| Foreign currency transactions | (61,521) | |||
| Total net realized gain (loss) | (5,086,496) | |||
| Change in net unrealized appreciation (depreciation) on: | ||||
| Investment Securities: | ||||
| Unaffiliated issuers (net of decrease in deferred foreign taxes of $16,399) | (39,902,811) | |||
| Fidelity Central Funds | 1 | |||
| Assets and liabilities in foreign currencies | (29,954) | |||
| Total change in net unrealized appreciation (depreciation) | (39,932,764) | |||
| Net gain (loss) | (45,019,260) | |||
| Net increase (decrease) in net assets resulting from operations | $ | (42,572,446) | ||
| Statement of Changes in Net Assets | ||||
Year ended October 31, 2022 | Year ended October 31, 2021 | |||
| Increase (Decrease) in Net Assets | ||||
| Operations | ||||
| Net investment income (loss) | $ | 2,446,814 | $ | 1,161,219 |
| Net realized gain (loss) | (5,086,496) | 8,462,796 | ||
| Change in net unrealized appreciation (depreciation) | (39,932,764) | 18,832,855 | ||
| Net increase (decrease) in net assets resulting from operations | (42,572,446) | 28,456,870 | ||
| Distributions to shareholders | (9,629,532) | (2,396,557) | ||
| Share transactions - net increase (decrease) | 88,690,287 | 6,173,375 | ||
| Total increase (decrease) in net assets | 36,488,309 | 32,233,688 | ||
| Net Assets | ||||
| Beginning of period | 117,629,319 | 85,395,631 | ||
| End of period | $ | 154,117,628 | $ | 117,629,319 |
| Fidelity Advisor® Total International Equity Fund Class A |
| Years ended October 31, | 2022 | 2021 | 2020 | 2019 | 2018 | |||||
Selected Per-Share Data | ||||||||||
| Net asset value, beginning of period | $ | 12.48 | $ | 9.60 | $ | 9.34 | $ | 8.20 | $ | 9.39 |
| Income from Investment Operations | ||||||||||
Net investment income (loss) A,B | .15 | .11 C | .05 | .14 | .08 | |||||
| Net realized and unrealized gain (loss) | (3.10) | 3.03 | .35 | 1.05 | (.89) | |||||
| Total from investment operations | (2.95) | 3.14 | .40 | 1.19 | (.81) | |||||
| Distributions from net investment income | (.19) | (.06) | (.14) | (.05) | (.15) | |||||
| Distributions from net realized gain | (.77) | (.20) | - | - | (.23) | |||||
| Total distributions | (.97) D | (.26) | (.14) | (.05) | (.38) | |||||
Redemption fees added to paid in capital A | - | - | - | - | - E | |||||
| Net asset value, end of period | $ | 8.56 | $ | 12.48 | $ | 9.60 | $ | 9.34 | $ | 8.20 |
Total Return F,G | (25.44)% | 33.04% | 4.31% | 14.63% | (9.04)% | |||||
Ratios to Average Net Assets B,H,I | ||||||||||
| Expenses before reductions | 1.56% | 1.60% | 1.66% | 1.51% | 1.60% | |||||
| Expenses net of fee waivers, if any | 1.30% | 1.34% | 1.39% | 1.45% | 1.45% | |||||
| Expenses net of all reductions | 1.30% | 1.34% | 1.37% | 1.44% | 1.44% | |||||
| Net investment income (loss) | 1.55% | .91% C | .58% | 1.55% | .90% | |||||
| Supplemental Data | ||||||||||
| Net assets, end of period (000 omitted) | $ | 12,786 | $ | 8,642 | $ | 6,091 | $ | 7,249 | $ | 7,526 |
Portfolio turnover rate J | 31% | 39% | 37% | 69% | 52% |
| Fidelity Advisor® Total International Equity Fund Class M |
| Years ended October 31, | 2022 | 2021 | 2020 | 2019 | 2018 | |||||
Selected Per-Share Data | ||||||||||
| Net asset value, beginning of period | $ | 12.53 | $ | 9.65 | $ | 9.38 | $ | 8.22 | $ | 9.42 |
| Income from Investment Operations | ||||||||||
Net investment income (loss) A,B | .13 | .08 C | .03 | .11 | .06 | |||||
| Net realized and unrealized gain (loss) | (3.12) | 3.04 | .36 | 1.07 | (.90) | |||||
| Total from investment operations | (2.99) | 3.12 | .39 | 1.18 | (.84) | |||||
| Distributions from net investment income | (.15) | (.04) | (.12) | (.02) | (.13) | |||||
| Distributions from net realized gain | (.77) | (.20) | - | - | (.23) | |||||
| Total distributions | (.93) D | (.24) | (.12) | (.02) | (.36) | |||||
Redemption fees added to paid in capital A | - | - | - | - | - E | |||||
| Net asset value, end of period | $ | 8.61 | $ | 12.53 | $ | 9.65 | $ | 9.38 | $ | 8.22 |
Total Return F,G | (25.59)% | 32.63% | 4.13% | 14.38% | (9.30)% | |||||
Ratios to Average Net Assets B,H,I | ||||||||||
| Expenses before reductions | 1.80% | 1.83% | 1.90% | 1.76% | 1.85% | |||||
| Expenses net of fee waivers, if any | 1.55% | 1.59% | 1.64% | 1.70% | 1.70% | |||||
| Expenses net of all reductions | 1.55% | 1.59% | 1.62% | 1.69% | 1.69% | |||||
| Net investment income (loss) | 1.29% | .65% C | .33% | 1.30% | .65% | |||||
| Supplemental Data | ||||||||||
| Net assets, end of period (000 omitted) | $ | 9,876 | $ | 12,936 | $ | 10,620 | $ | 11,733 | $ | 11,882 |
Portfolio turnover rate J | 31% | 39% | 37% | 69% | 52% |
| Fidelity Advisor® Total International Equity Fund Class C |
| Years ended October 31, | 2022 | 2021 | 2020 | 2019 | 2018 | |||||
Selected Per-Share Data | ||||||||||
| Net asset value, beginning of period | $ | 12.41 | $ | 9.57 | $ | 9.30 | $ | 8.17 | $ | 9.37 |
| Income from Investment Operations | ||||||||||
Net investment income (loss) A,B | .08 | .02 C | (.02) | .07 | .01 | |||||
| Net realized and unrealized gain (loss) | (3.11) | 3.02 | .36 | 1.06 | (.89) | |||||
| Total from investment operations | (3.03) | 3.04 | .34 | 1.13 | (.88) | |||||
| Distributions from net investment income | (.07) | - | (.07) | - | (.10) | |||||
| Distributions from net realized gain | (.77) | (.20) | - | - | (.23) | |||||
| Total distributions | (.85) D | (.20) | (.07) | - | (.32) D | |||||
Redemption fees added to paid in capital A | - | - | - | - | - E | |||||
| Net asset value, end of period | $ | 8.53 | $ | 12.41 | $ | 9.57 | $ | 9.30 | $ | 8.17 |
Total Return F,G | (26.04)% | 32.00% | 3.62% | 13.83% | (9.72)% | |||||
Ratios to Average Net Assets B,H,I | ||||||||||
| Expenses before reductions | 2.34% | 2.40% | 2.46% | 2.33% | 2.43% | |||||
| Expenses net of fee waivers, if any | 2.05% | 2.10% | 2.14% | 2.20% | 2.20% | |||||
| Expenses net of all reductions | 2.05% | 2.10% | 2.12% | 2.19% | 2.19% | |||||
| Net investment income (loss) | .79% | .15% C | (.17)% | .80% | .14% | |||||
| Supplemental Data | ||||||||||
| Net assets, end of period (000 omitted) | $ | 1,893 | $ | 1,982 | $ | 1,827 | $ | 2,203 | $ | 2,705 |
Portfolio turnover rate J | 31% | 39% | 37% | 69% | 52% |
| Fidelity® Total International Equity Fund |
| Years ended October 31, | 2022 | 2021 | 2020 | 2019 | 2018 | |||||
Selected Per-Share Data | ||||||||||
| Net asset value, beginning of period | $ | 12.54 | $ | 9.64 | $ | 9.37 | $ | 8.23 | $ | 9.40 |
| Income from Investment Operations | ||||||||||
Net investment income (loss) A,B | .18 | .14 C | .08 | .16 | .11 | |||||
| Net realized and unrealized gain (loss) | (3.12) | 3.04 | .35 | 1.06 | (.90) | |||||
| Total from investment operations | (2.94) | 3.18 | .43 | 1.22 | (.79) | |||||
| Distributions from net investment income | (.23) | (.08) | (.16) | (.08) | (.15) | |||||
| Distributions from net realized gain | (.77) | (.20) | - | - | (.23) | |||||
| Total distributions | (1.00) | (.28) | (.16) | (.08) | (.38) | |||||
Redemption fees added to paid in capital A | - | - | - | - | - D | |||||
| Net asset value, end of period | $ | 8.60 | $ | 12.54 | $ | 9.64 | $ | 9.37 | $ | 8.23 |
Total Return E | (25.25)% | 33.37% | 4.65% | 14.97% | (8.84)% | |||||
Ratios to Average Net Assets B,F,G | ||||||||||
| Expenses before reductions | 1.23% | 1.27% | 1.34% | 1.20% | 1.29% | |||||
| Expenses net of fee waivers, if any | 1.05% | 1.09% | 1.14% | 1.20% | 1.20% | |||||
| Expenses net of all reductions | 1.05% | 1.09% | 1.12% | 1.19% | 1.19% | |||||
| Net investment income (loss) | 1.79% | 1.16% C | .83% | 1.81% | 1.15% | |||||
| Supplemental Data | ||||||||||
| Net assets, end of period (000 omitted) | $ | 86,458 | $ | 82,604 | $ | 61,362 | $ | 70,251 | $ | 71,170 |
Portfolio turnover rate H | 31% | 39% | 37% | 69% | 52% |
| Fidelity Advisor® Total International Equity Fund Class I |
| Years ended October 31, | 2022 | 2021 | 2020 | 2019 | 2018 | |||||
Selected Per-Share Data | ||||||||||
| Net asset value, beginning of period | $ | 12.49 | $ | 9.60 | $ | 9.35 | $ | 8.19 | $ | 9.38 |
| Income from Investment Operations | ||||||||||
Net investment income (loss) A,B | .17 | .14 C | .08 | .16 | .10 | |||||
| Net realized and unrealized gain (loss) | (3.10) | 3.03 | .34 | 1.07 | (.89) | |||||
| Total from investment operations | (2.93) | 3.17 | .42 | 1.23 | (.79) | |||||
| Distributions from net investment income | (.23) | (.08) | (.17) | (.07) | (.17) | |||||
| Distributions from net realized gain | (.77) | (.20) | - | - | (.23) | |||||
| Total distributions | (1.00) | (.28) | (.17) | (.07) | (.40) | |||||
Redemption fees added to paid in capital A | - | - | - | - | - D | |||||
| Net asset value, end of period | $ | 8.56 | $ | 12.49 | $ | 9.60 | $ | 9.35 | $ | 8.19 |
Total Return E | (25.28)% | 33.40% | 4.50% | 15.11% | (8.86)% | |||||
Ratios to Average Net Assets B,F,G | ||||||||||
| Expenses before reductions | 1.22% | 1.26% | 1.33% | 1.18% | 1.29% | |||||
| Expenses net of fee waivers, if any | 1.04% | 1.06% | 1.14% | 1.18% | 1.20% | |||||
| Expenses net of all reductions | 1.04% | 1.06% | 1.13% | 1.17% | 1.19% | |||||
| Net investment income (loss) | 1.80% | 1.18% C | .82% | 1.82% | 1.15% | |||||
| Supplemental Data | ||||||||||
| Net assets, end of period (000 omitted) | $ | 35,423 | $ | 5,714 | $ | 2,073 | $ | 3,086 | $ | 9,405 |
Portfolio turnover rate H | 31% | 39% | 37% | 69% | 52% |
| Fidelity Advisor® Total International Equity Fund Class Z |
| Years ended October 31, | 2022 | 2021 | 2020 | 2019 | 2018 | |||||
Selected Per-Share Data | ||||||||||
| Net asset value, beginning of period | $ | 12.53 | $ | 9.62 | $ | 9.36 | $ | 8.22 | $ | 9.39 |
| Income from Investment Operations | ||||||||||
Net investment income (loss) A,B | .19 | .16 C | .09 | .18 | .12 | |||||
| Net realized and unrealized gain (loss) | (3.11) | 3.03 | .35 | 1.05 | (.89) | |||||
| Total from investment operations | (2.92) | 3.19 | .44 | 1.23 | (.77) | |||||
| Distributions from net investment income | (.23) | (.08) | (.18) | (.09) | (.17) | |||||
| Distributions from net realized gain | (.77) | (.20) | - | - | (.23) | |||||
| Total distributions | (1.00) | (.28) | (.18) | (.09) | (.40) | |||||
Redemption fees added to paid in capital A | - | - | - | - | - D | |||||
| Net asset value, end of period | $ | 8.61 | $ | 12.53 | $ | 9.62 | $ | 9.36 | $ | 8.22 |
Total Return E | (25.09)% | 33.54% | 4.74% | 15.13% | (8.63)% | |||||
Ratios to Average Net Assets B,F,G | ||||||||||
| Expenses before reductions | 1.10% | 1.16% | 1.22% | 1.09% | 1.16% | |||||
| Expenses net of fee waivers, if any | .90% | .94% | .98% | 1.04% | 1.05% | |||||
| Expenses net of all reductions | .90% | .94% | .97% | 1.03% | 1.04% | |||||
| Net investment income (loss) | 1.94% | 1.31% C | .99% | 1.97% | 1.30% | |||||
| Supplemental Data | ||||||||||
| Net assets, end of period (000 omitted) | $ | 7,681 | $ | 5,752 | $ | 3,422 | $ | 3,815 | $ | 216 |
Portfolio turnover rate H | 31% | 39% | 37% | 69% | 52% |
| Fidelity Central Fund | Investment Manager | Investment Objective | Investment Practices | Expense Ratio A |
| Fidelity Money Market Central Funds | Fidelity Management & Research Company LLC (FMR) | Each fund seeks to obtain a high level of current income consistent with the preservation of capital and liquidity. | Short-term Investments | Less than .005% |
| Gross unrealized appreciation | $18,225,216 |
| Gross unrealized depreciation | (27,308,025) |
| Net unrealized appreciation (depreciation) | $(9,082,809) |
| Tax Cost | $165,543,412 |
| Undistributed ordinary income | $1,585,476 |
| Capital loss carryforward | $(2,940,975) |
| Net unrealized appreciation (depreciation) on securities and other investments | $(9,110,303) |
| Short-term | $(2,940,975) |
| Total capital loss carryforward | $(2,940,975) |
| October 31, 2022 | October 31, 2021 | |
| Ordinary Income | $2,799,884 | $1,157,086 |
| Long-term Capital Gains | 6,829,648 | 1,239,471 |
| Total | $9,629,532 | $2,396,557 |
| Purchases ($) | Sales ($) | |
| Fidelity Total International Equity Fund | 120,119,429 | 42,064,763 |
| Distribution Fee | Service Fee | Total Fees | Retained by FDC | |
| Class A | -% | .25% | $24,453 | $942 |
| Class M | .25% | .25% | 57,159 | - |
| Class C | .75% | .25% | 20,272 | 4,972 |
| $101,884 | $5,914 |
| Retained by FDC | |
| Class A | $6,942 |
| Class M | 1,031 |
Class C A | 274 |
| $8,247 |
| Amount | % of Class-Level Average Net Assets | |
| Class A | $24,067 | .25 |
| Class M | 25,705 | .23 |
| Class C | 5,486 | .27 |
| Total International Equity | 142,932 | .16 |
| Class I | 30,999 | .16 |
| Class Z | 3,630 | .04 |
| $232,819 |
| % of Average Net Assets | |
| Fidelity Total International Equity Fund | .05 |
| Amount | |
| Fidelity Total International Equity Fund | $524 |
| Purchases ($) | Sales ($) | Realized Gain (Loss) ($) | |
| Fidelity Total International Equity Fund | 3,625,255 | 1,026,747 | (140,328) |
| Amount | |
| Fidelity Total International Equity Fund | $236 |
| Total Security Lending Fees Paid to NFS | Security Lending Income From Securities Loaned to NFS | Value of Securities Loaned to NFS at Period End | |
| Fidelity Total International Equity Fund | $1,219 | $- | $- |
| Expense Limitations | Reimbursement | |
| Class A | 1.30% | $26,022 |
| Class M | 1.55% | 28,442 |
| Class C | 2.05% | 5,858 |
| Total International Equity | 1.05% | 159,087 |
| Class I | 1.05% | 33,062 |
| Class Z | .90% | 17,259 |
| $269,730 |
Year ended October 31, 2022 | Year ended October 31, 2021 | |
| Fidelity Total International Equity Fund | ||
| Distributions to shareholders | ||
| Class A | $682,772 | $163,098 |
| Class M | 954,432 | 257,328 |
| Class C | 136,202 | 37,221 |
| Total International Equity | 6,786,798 | 1,782,745 |
| Class I | 530,168 | 54,453 |
| Class Z | 539,160 | 101,712 |
| Total | $9,629,532 | $2,396,557 |
| Shares | Shares | Dollars | Dollars | |
| Year ended October 31, 2022 | Year ended October 31, 2021 | Year ended October 31, 2022 | Year ended October 31, 2021 | |
| Fidelity Total International Equity Fund | ||||
| Class A | ||||
| Shares sold | 888,736 | 125,319 | $8,539,920 | $1,509,372 |
| Reinvestment of distributions | 60,242 | 14,903 | 667,482 | 163,036 |
| Shares redeemed | (148,110) | (82,275) | (1,522,197) | (972,870) |
| Net increase (decrease) | 800,868 | 57,947 | $7,685,205 | $699,538 |
| Class M | ||||
| Shares sold | 208,686 | 83,867 | $2,095,684 | $989,107 |
| Reinvestment of distributions | 85,446 | 23,372 | 954,432 | 257,328 |
| Shares redeemed | (179,080) | (175,897) | (1,802,328) | (2,080,986) |
| Net increase (decrease) | 115,052 | (68,658) | $1,247,788 | $(834,551) |
| Class C | ||||
| Shares sold | 104,691 | 25,618 | $1,089,289 | $301,180 |
| Reinvestment of distributions | 12,220 | 3,392 | 135,883 | 37,147 |
| Shares redeemed | (54,762) | (60,315) | (553,236) | (723,210) |
| Net increase (decrease) | 62,149 | (31,305) | $671,936 | $(384,883) |
| Total International Equity | ||||
| Shares sold | 4,897,322 | 1,265,827 | $50,896,948 | $14,978,032 |
| Reinvestment of distributions | 561,002 | 152,573 | 6,227,120 | 1,673,722 |
| Shares redeemed | (1,992,599) | (1,196,355) | (19,350,338) | (14,199,919) |
| Net increase (decrease) | 3,465,725 | 222,045 | $37,773,730 | $2,451,835 |
| Class I | ||||
| Shares sold | 4,463,099 | 318,329 | $43,483,713 | $3,927,656 |
| Reinvestment of distributions | 47,315 | 4,631 | 523,303 | 50,574 |
| Shares redeemed | (831,499) | (81,296) | (8,050,707) | (953,703) |
| Net increase (decrease) | 3,678,915 | 241,664 | $35,956,309 | $3,024,527 |
| Class Z | ||||
| Shares sold | 1,300,267 | 163,548 | $12,980,304 | $1,962,853 |
| Reinvestment of distributions | 45,956 | 8,826 | 510,116 | 96,647 |
| Shares redeemed | (912,726) | (69,127) | (8,135,101) | (842,591) |
| Net increase (decrease) | 433,497 | 103,247 | $5,355,319 | $1,216,909 |
| The Example is based on an investment of $1,000 invested at the beginning of the period and held for the entire period (May 1, 2022 to October 31, 2022). |
Annualized Expense Ratio- A | Beginning Account Value May 1, 2022 | Ending Account Value October 31, 2022 | Expenses Paid During Period- C May 1, 2022 to October 31, 2022 | |||||||
| Fidelity® Total International Equity Fund | ||||||||||
| Class A | 1.30% | |||||||||
| Actual | $ 1,000 | $ 872.60 | $ 6.14 | |||||||
Hypothetical- B | $ 1,000 | $ 1,018.65 | $ 6.61 | |||||||
| Class M | 1.55% | |||||||||
| Actual | $ 1,000 | $ 872.30 | $ 7.31 | |||||||
Hypothetical- B | $ 1,000 | $ 1,017.39 | $ 7.88 | |||||||
| Class C | 2.05% | |||||||||
| Actual | $ 1,000 | $ 869.50 | $ 9.66 | |||||||
Hypothetical- B | $ 1,000 | $ 1,014.87 | $ 10.41 | |||||||
| Fidelity® Total International Equity Fund | 1.05% | |||||||||
| Actual | $ 1,000 | $ 874.00 | $ 4.96 | |||||||
Hypothetical- B | $ 1,000 | $ 1,019.91 | $ 5.35 | |||||||
| Class I | 1.05% | |||||||||
| Actual | $ 1,000 | $ 873.50 | $ 4.96 | |||||||
Hypothetical- B | $ 1,000 | $ 1,019.91 | $ 5.35 | |||||||
| Class Z | .90% | |||||||||
| Actual | $ 1,000 | $ 875.00 | $ 4.25 | |||||||
Hypothetical- B | $ 1,000 | $ 1,020.67 | $ 4.58 | |||||||
| Pay Date | Income | Taxes | |
| Fidelity Total International Equity Fund | |||
| Class A | 12/06/21 | $0.2927 | $0.0267 |
| Class M | 12/06/21 | $0.2527 | $0.0267 |
| Class C | 12/06/21 | $0.1737 | $0.0267 |
| Total International Equity | 12/06/21 | $0.3257 | $0.0267 |
| Class I | 12/06/21 | $0.3257 | $0.0267 |
| Class Z | 12/06/21 | $0.3287 | $0.0267 |
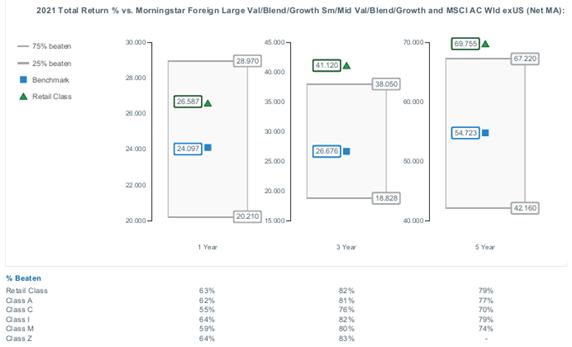
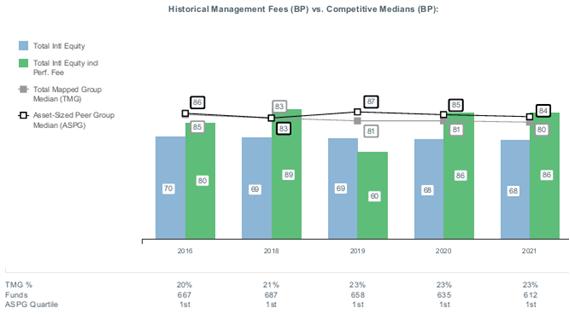
|


Contents
Board Approval of Investment Advisory Contracts and Management Fees |
| Average Annual Total Returns | |||
Periods ended October 31, 2022 | Past 1 year | Past 5 years | Past 10 years |
| Class A (incl.5.75% sales charge) | -26.09% | -1.09% | 2.48% |
| Class M (incl.3.50% sales charge) | -24.51% | -0.91% | 2.44% |
Class C (incl. contingent deferred sales charge) | -22.91% | -0.69% | 2.46% |
| Fidelity® Emerging Markets Discovery Fund | -21.37% | 0.38% | 3.37% |
| Class I | -21.37% | 0.39% | 3.38% |
| Class Z | -21.27% | 0.51% | 3.44% |
| $10,000 Over 10 Years |
Let's say hypothetically that $10,000 was invested in Fidelity® Emerging Markets Discovery Fund, a class of the fund, on October 31, 2012. The chart shows how the value of your investment would have changed, and also shows how the MSCI Emerging Markets SMID Cap Index performed over the same period. |
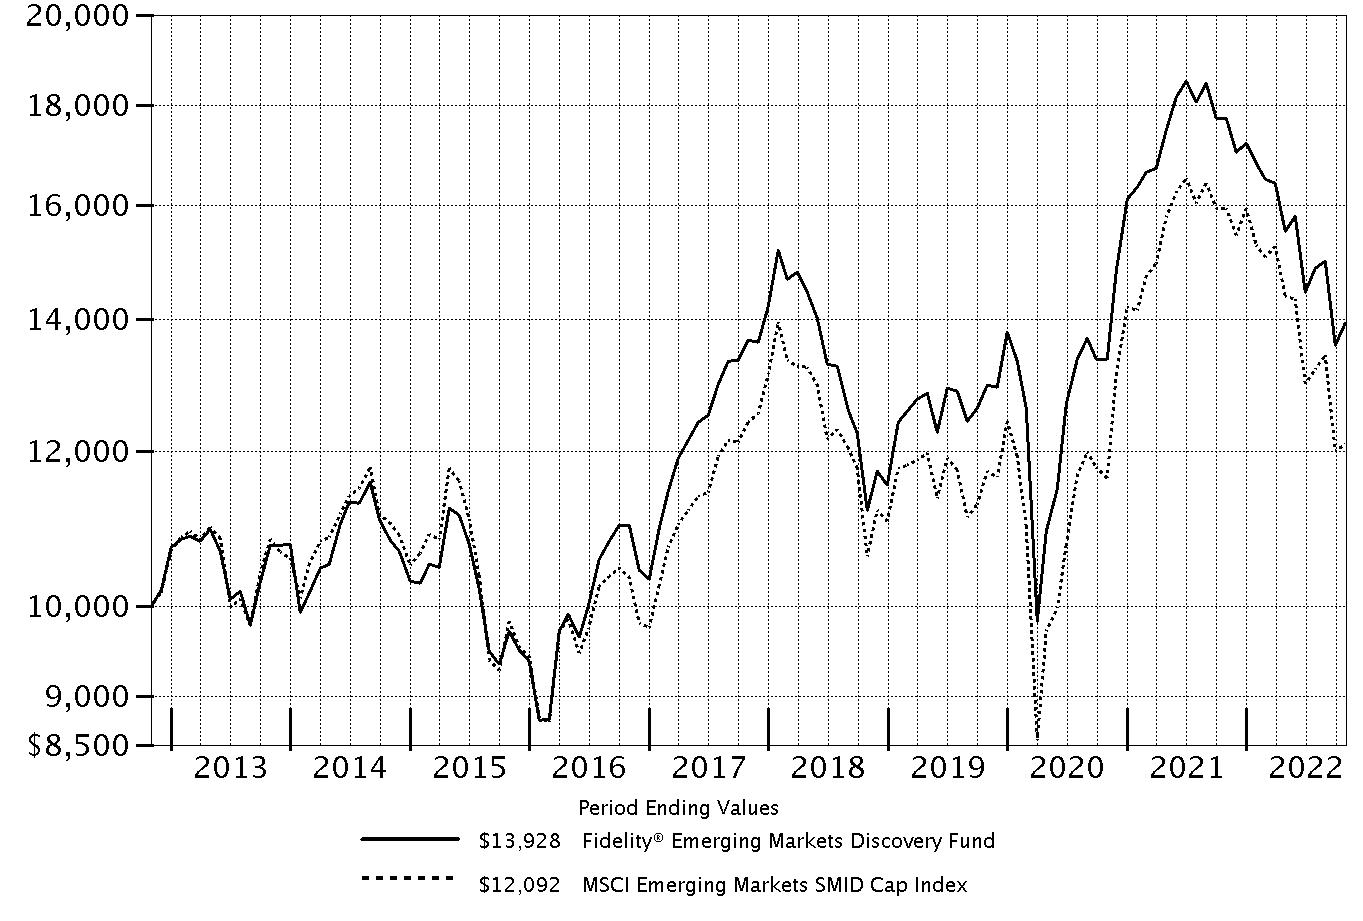 |
Top Holdings (% of Fund's net assets) | ||
| Grupo Comercial Chedraui S.A.B. de CV (Mexico, Food & Staples Retailing) | 1.7 | |
| Rumo SA (Brazil, Road & Rail) | 1.4 | |
| Eicher Motors Ltd. (India, Automobiles) | 1.4 | |
| Afya Ltd. (United States of America, Diversified Consumer Services) | 1.4 | |
| Equatorial Energia SA (Brazil, Electric Utilities) | 1.4 | |
| Bharat Electronics Ltd. (India, Aerospace & Defense) | 1.3 | |
| Hindustan Aeronautics Ltd. (India, Aerospace & Defense) | 1.3 | |
| ITC Ltd. (India, Tobacco) | 1.2 | |
| Regional S.A.B. de CV (Mexico, Banks) | 1.2 | |
| Aldar Properties PJSC (United Arab Emirates, Real Estate Management & Development) | 1.2 | |
| 13.5 | ||
| Market Sectors (% of Fund's net assets) | ||
| Industrials | 19.4 | |
| Financials | 17.1 | |
| Consumer Discretionary | 12.8 | |
| Health Care | 8.0 | |
| Materials | 7.7 | |
| Information Technology | 6.8 | |
| Real Estate | 6.4 | |
| Consumer Staples | 5.4 | |
| Utilities | 4.7 | |
| Energy | 3.9 | |
| Communication Services | 2.8 | |
Asset Allocation (% of Fund's net assets) |
 |
Foreign investments - 93.6% |
Geographic Diversification (% of Fund's net assets) |
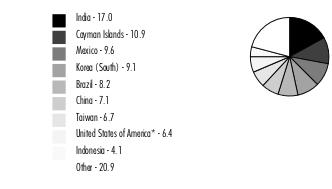 |
* Includes Short-Term investments and Net Other Assets (Liabilities). Percentages are based on country or territory of incorporation and are adjusted for the effect of futures contracts, if applicable. |
| Common Stocks - 94.1% | |||
| Shares | Value ($) | ||
| Bermuda - 1.5% | |||
| Credicorp Ltd. (United States) | 27,541 | 4,030,901 | |
| Pacific Basin Shipping Ltd. | 10,237,618 | 2,478,005 | |
TOTAL BERMUDA | 6,508,906 | ||
| Brazil - 7.3% | |||
| Enauta Participacoes SA | 711,371 | 2,098,789 | |
| Equatorial Energia SA | 1,033,135 | 6,006,203 | |
| Hapvida Participacoes e Investimentos SA (a) | 2,488,580 | 3,757,802 | |
| Localiza Rent a Car SA | 357,004 | 4,875,242 | |
| LOG Commercial Properties e Participacoes SA | 877,820 | 3,867,812 | |
| Rumo SA | 1,479,784 | 6,342,545 | |
| Suzano Papel e Celulose SA | 449,796 | 4,632,494 | |
TOTAL BRAZIL | 31,580,887 | ||
| Cayman Islands - 10.9% | |||
| ASMPT Ltd. | 420,170 | 2,312,376 | |
| BizLink Holding, Inc. | 514,757 | 3,934,011 | |
| Chailease Holding Co. Ltd. | 998,530 | 4,612,791 | |
| Fu Shou Yuan International Group Ltd. | 7,330,535 | 3,660,762 | |
| Haitian International Holdings Ltd. | 2,178,277 | 4,362,298 | |
| Hansoh Pharmaceutical Group Co. Ltd. (a) | 2,117,852 | 3,270,001 | |
| Innovent Biologics, Inc. (a)(b) | 1,287,440 | 4,559,545 | |
| New Horizon Health Ltd. (a)(b) | 1,902,678 | 4,241,828 | |
| Parade Technologies Ltd. | 206,148 | 3,892,359 | |
| Tongdao Liepin Group (b) | 4,386,307 | 3,822,125 | |
| WH Group Ltd. (a) | 3,681,018 | 1,861,693 | |
| XP, Inc. Class A (b) | 219,077 | 4,015,681 | |
| Zai Lab Ltd. (b) | 1,041,837 | 2,399,650 | |
TOTAL CAYMAN ISLANDS | 46,945,120 | ||
| Chile - 1.9% | |||
| Banco de Chile sponsored ADR (c) | 220,498 | 3,966,759 | |
| Sociedad Quimica y Minera de Chile SA (PN-B) sponsored ADR | 44,946 | 4,210,541 | |
TOTAL CHILE | 8,177,300 | ||
| China - 7.1% | |||
| China Communications Services Corp. Ltd. (H Shares) | 13,158,919 | 3,671,251 | |
| Haier Smart Home Co. Ltd. (A Shares) | 1,212,542 | 3,453,542 | |
| Pharmaron Beijing Co. Ltd. (H Shares) (a) | 692,098 | 2,327,669 | |
| Shenzhen Expressway Co. Ltd. (H Shares) | 5,672,747 | 4,068,661 | |
| Sinopec Engineering Group Co. Ltd. (H Shares) | 12,026,562 | 4,305,242 | |
| Sinopharm Group Co. Ltd. (H Shares) | 1,517,949 | 2,892,934 | |
| TravelSky Technology Ltd. (H Shares) | 2,587,161 | 3,757,319 | |
| Tsingtao Brewery Co. Ltd. (H Shares) | 469,473 | 3,289,448 | |
| Venus MedTech Hangzhou, Inc. (H Shares) (a)(b) | 2,414,457 | 2,968,223 | |
TOTAL CHINA | 30,734,289 | ||
| Cyprus - 0.0% | |||
| Etalon Group PLC GDR (Reg. S) (d) | 167,549 | 13,330 | |
| TCS Group Holding PLC unit (b)(d) | 59,253 | 113,145 | |
TOTAL CYPRUS | 126,475 | ||
| Hong Kong - 3.6% | |||
| China Merchants Holdings International Co. Ltd. | 3,412,093 | 3,999,064 | |
| China Resources Beer Holdings Co. Ltd. | 630,801 | 2,973,335 | |
| Far East Horizon Ltd. | 6,330,182 | 4,886,957 | |
| Guangdong Investment Ltd. | 5,632,938 | 3,552,138 | |
TOTAL HONG KONG | 15,411,494 | ||
| Hungary - 0.7% | |||
| Richter Gedeon PLC | 150,662 | 2,974,925 | |
| India - 17.0% | |||
| Bharat Electronics Ltd. | 4,399,878 | 5,679,234 | |
| Computer Age Management Services Private Ltd. | 140,293 | 4,320,221 | |
| Cyient Ltd. | 359,313 | 3,252,395 | |
| Deccan Cements Ltd. | 489,835 | 3,008,953 | |
| Eicher Motors Ltd. | 130,699 | 6,079,367 | |
| Embassy Office Parks (REIT) | 970,101 | 4,035,798 | |
| Hindustan Aeronautics Ltd. | 176,356 | 5,390,064 | |
| Indraprastha Gas Ltd. | 632,570 | 3,272,507 | |
| Indus Towers Ltd. | 1,783,900 | 3,997,505 | |
| ITC Ltd. | 1,271,710 | 5,356,913 | |
| JK Cement Ltd. | 114,718 | 3,759,239 | |
| Mahanagar Gas Ltd. | 284,449 | 2,960,806 | |
| Manappuram General Finance & Leasing Ltd. | 827,372 | 1,052,456 | |
| Oberoi Realty Ltd. | 364,139 | 4,067,421 | |
| Petronet LNG Ltd. | 1,703,464 | 4,229,851 | |
| Power Grid Corp. of India Ltd. | 1,605,347 | 4,424,498 | |
| Shriram Transport Finance Co. Ltd. | 269,808 | 4,006,215 | |
| Torrent Pharmaceuticals Ltd. | 211,590 | 4,217,486 | |
TOTAL INDIA | 73,110,929 | ||
| Indonesia - 4.1% | |||
| PT ACE Hardware Indonesia Tbk | 84,051,184 | 3,044,649 | |
| PT Astra International Tbk | 9,783,008 | 4,170,989 | |
| PT Bank Mandiri (Persero) Tbk | 7,528,783 | 5,092,397 | |
| PT United Tractors Tbk | 2,509,730 | 5,197,261 | |
TOTAL INDONESIA | 17,505,296 | ||
| Korea (South) - 9.1% | |||
| Coway Co. Ltd. | 111,640 | 4,325,373 | |
| Db Insurance Co. Ltd. | 107,347 | 4,234,254 | |
| Fila Holdings Corp. | 146,087 | 3,346,863 | |
| Hana Financial Group, Inc. | 56,911 | 1,644,746 | |
| Hanon Systems | 421,548 | 2,303,670 | |
| Hansol Chemical Co. Ltd. | 20,918 | 2,718,584 | |
| Hyundai Fire & Marine Insurance Co. Ltd. | 190,313 | 4,440,086 | |
| KB Financial Group, Inc. | 28,423 | 954,485 | |
| LG Corp. | 52,720 | 2,925,359 | |
| SaraminHR Co. Ltd. | 200,393 | 4,506,779 | |
| Shinhan Financial Group Co. Ltd. | 167,952 | 4,260,178 | |
| Soulbrain Co. Ltd. | 24,575 | 3,524,439 | |
TOTAL KOREA (SOUTH) | 39,184,816 | ||
| Luxembourg - 1.2% | |||
| Tenaris SA sponsored ADR | 160,749 | 5,050,734 | |
| Malaysia - 0.0% | |||
| Scientex Bhd warrants 1/14/26 (b) | 130,640 | 19,480 | |
| Mexico - 9.6% | |||
| CEMEX S.A.B. de CV sponsored ADR (b) | 819,054 | 3,161,548 | |
| FIBRA Macquarie Mexican (REIT) (a) | 2,619,568 | 3,483,855 | |
| Fibra Uno Administracion SA de CV | 3,075,402 | 3,588,719 | |
| Grupo Aeroportuario del Pacifico S.A.B. de CV Series B | 327,093 | 5,066,615 | |
| Grupo Aeroportuario del Sureste S.A.B. de CV Series B sponsored ADR | 22,648 | 5,286,496 | |
| Grupo Aeroportuario Norte S.A.B. de CV | 579,186 | 4,614,078 | |
| Grupo Comercial Chedraui S.A.B. de CV | 1,798,037 | 7,247,322 | |
| Qualitas Controladora S.A.B. de CV | 944,950 | 3,712,934 | |
| Regional S.A.B. de CV | 764,023 | 5,339,253 | |
TOTAL MEXICO | 41,500,820 | ||
| Netherlands - 0.0% | |||
| X5 Retail Group NV GDR (Reg. S) (d) | 101,790 | 21,253 | |
| Philippines - 0.9% | |||
| Robinsons Land Corp. | 15,441,734 | 3,961,156 | |
| Russia - 0.0% | |||
| LSR Group OJSC (b)(d) | 67,346 | 101,589 | |
| Saudi Arabia - 2.0% | |||
| Bupa Arabia for Cooperative Insurance Co. | 86,910 | 4,463,981 | |
| Saudi Airlines Catering Co. (b) | 210,850 | 4,348,811 | |
TOTAL SAUDI ARABIA | 8,812,792 | ||
| Singapore - 0.6% | |||
| First Resources Ltd. | 2,360,400 | 2,484,456 | |
| South Africa - 3.7% | |||
| Bidvest Group Ltd./The | 377,478 | 4,366,466 | |
| FirstRand Ltd. | 1,287,459 | 4,510,268 | |
| Impala Platinum Holdings Ltd. | 422,860 | 4,329,522 | |
| Mr Price Group Ltd. | 266,303 | 2,563,758 | |
TOTAL SOUTH AFRICA | 15,770,014 | ||
| Taiwan - 6.7% | |||
| Cleanaway Co. Ltd. | 724,746 | 3,752,483 | |
| International Games Systems Co. Ltd. | 382,658 | 4,170,158 | |
| Makalot Industrial Co. Ltd. | 684,296 | 4,243,170 | |
| Nanya Technology Corp. | 2,195,373 | 3,709,550 | |
| Poya International Co. Ltd. | 402,578 | 5,117,411 | |
| Unimicron Technology Corp. | 900,854 | 3,477,284 | |
| Yageo Corp. | 393,412 | 4,476,412 | |
TOTAL TAIWAN | 28,946,468 | ||
| Thailand - 0.4% | |||
| Siam Global House PCL (For. Reg.) | 3,437,345 | 1,816,024 | |
| Turkey - 1.2% | |||
| Mavi Jeans Class B (a) | 1,056,999 | 4,948,760 | |
| United Arab Emirates - 2.1% | |||
| Aldar Properties PJSC | 4,495,140 | 5,286,816 | |
| Emirates NBD Bank PJSC | 1,039,772 | 3,750,777 | |
TOTAL UNITED ARAB EMIRATES | 9,037,593 | ||
| United Kingdom - 1.0% | |||
| Bank of Georgia Group PLC | 175,478 | 4,276,311 | |
| United States of America - 1.4% | |||
| Afya Ltd. (b) | 411,465 | 6,064,994 | |
| Vietnam - 0.1% | |||
| FPT Corp. | 196,215 | 596,936 | |
| TOTAL COMMON STOCKS (Cost $446,382,321) | 405,669,817 | ||
| Nonconvertible Preferred Stocks - 0.9% | |||
| Shares | Value ($) | ||
| Brazil - 0.9% | |||
Metalurgica Gerdau SA (PN) (Cost $3,123,830) | 1,815,263 | 3,953,482 | |
| Money Market Funds - 4.2% | |||
| Shares | Value ($) | ||
| Fidelity Cash Central Fund 3.10% (e) | 16,537,179 | 16,540,486 | |
| Fidelity Securities Lending Cash Central Fund 3.10% (e)(f) | 1,598,240 | 1,598,400 | |
| TOTAL MONEY MARKET FUNDS (Cost $18,138,886) | 18,138,886 | ||
| TOTAL INVESTMENT IN SECURITIES - 99.2% (Cost $467,645,037) | 427,762,185 |
NET OTHER ASSETS (LIABILITIES) - 0.8% | 3,334,663 |
| NET ASSETS - 100.0% | 431,096,848 |
| (a) | Security exempt from registration under Rule 144A of the Securities Act of 1933. These securities may be resold in transactions exempt from registration, normally to qualified institutional buyers. At the end of the period, the value of these securities amounted to $31,419,376 or 7.3% of net assets. |
| (b) | Non-income producing |
| (c) | Security or a portion of the security is on loan at period end. |
| (d) | Level 3 security |
| (e) | Affiliated fund that is generally available only to investment companies and other accounts managed by Fidelity Investments. The rate quoted is the annualized seven-day yield of the fund at period end. A complete unaudited listing of the fund's holdings as of its most recent quarter end is available upon request. In addition, each Fidelity Central Fund's financial statements, which are not covered by the Fund's Report of Independent Registered Public Accounting Firm, are available on the SEC's website or upon request. |
| (f) | Investment made with cash collateral received from securities on loan. |
| Affiliate | Value, beginning of period ($) | Purchases ($) | Sales Proceeds ($) | Dividend Income ($) | Realized Gain (loss) ($) | Change in Unrealized appreciation (depreciation) ($) | Value, end of period ($) | % ownership, end of period |
| Fidelity Cash Central Fund 3.10% | 929,989 | 225,530,929 | 209,920,432 | 179,979 | - | - | 16,540,486 | 0.0% |
| Fidelity Securities Lending Cash Central Fund 3.10% | 8,894,003 | 38,753,663 | 46,049,266 | 52,365 | - | - | 1,598,400 | 0.0% |
| Total | 9,823,992 | 264,284,592 | 255,969,698 | 232,344 | - | - | 18,138,886 | |
| Valuation Inputs at Reporting Date: | ||||
| Description | Total ($) | Level 1 ($) | Level 2 ($) | Level 3 ($) |
Investments in Securities: | ||||
| Equities: | ||||
Communication Services | 11,989,788 | 11,989,788 | - | - |
Consumer Discretionary | 55,139,332 | 55,139,332 | - | - |
Consumer Staples | 23,234,420 | 23,213,167 | - | 21,253 |
Energy | 16,576,635 | 16,576,635 | - | - |
Financials | 73,364,575 | 68,036,767 | 5,214,663 | 113,145 |
Health Care | 33,610,063 | 33,610,063 | - | - |
Industrials | 83,972,704 | 83,972,704 | - | - |
Information Technology | 29,794,852 | 29,794,852 | - | - |
Materials | 33,318,282 | 28,988,760 | 4,329,522 | - |
Real Estate | 28,406,496 | 24,330,421 | 3,961,156 | 114,919 |
Utilities | 20,216,152 | 20,216,152 | - | - |
| Money Market Funds | 18,138,886 | 18,138,886 | - | - |
| Total Investments in Securities: | 427,762,185 | 414,007,527 | 13,505,341 | 249,317 |
| Investments in Securities: | |||
| Financials | |||
| Beginning Balance | $ | - | |
| Net Realized Gain (Loss) on Investment Securities | - | ||
| Net Unrealized Gain (Loss) on Investment Securities | (5,989,210) | ||
| Cost of Purchases | - | ||
| Proceeds of Sales | - | ||
| Amortization/Accretion | - | ||
| Transfers into Level 3 | 6,102,355 | ||
| Transfers out of Level 3 | - | ||
| Ending Balance | $ | 113,145 | |
| The change in unrealized gain (loss) for the period attributable to Level 3 securities held at October 31, 2022 | $ | (5,989,210) | |
| Other Investments in Securities | |||
| Beginning Balance | $ | - | |
| Net Realized Gain (Loss) on Investment Securities | (970,730) | ||
| Net Unrealized Gain (Loss) on Investment Securities | (4,063,527) | ||
| Cost of Purchases | 1,439,577 | ||
| Proceeds of Sales | (873,438) | ||
| Amortization/Accretion | - | ||
| Transfers into Level 3 | 4,604,290 | ||
| Transfers out of Level 3 | - | ||
| Ending Balance | $ | 136,172 | |
| The change in unrealized gain (loss) for the period attributable to Level 3 securities held at October 31, 2022 | $ | (4,063,527) | |
| The information used in the above reconciliation represents fiscal year to date activity for any Investments in Securities identified as using Level 3 inputs at either the beginning or the end of the current fiscal period. Cost of purchases and proceeds of sales may include securities received and/or delivered through in-kind transactions. Transfers into Level 3 were attributable to a lack of observable market data resulting from decreases in market activity, decreases in liquidity, security restructurings or corporate actions. Transfers out of Level 3 were attributable to observable market data becoming available for those securities. Transfers in or out of Level 3 represent the beginning value of any Security or Instrument where a change in the pricing level occurred from the beginning to the end of the period. The cost of purchases and the proceeds of sales may include securities received or delivered through corporate actions or exchanges. Realized and unrealized gains (losses) disclosed in the reconciliation are included in Net Gain (Loss) on the Fund's Statement of Operations. | |||
| Statement of Assets and Liabilities | ||||
| October 31, 2022 | ||||
| Assets | ||||
| Investment in securities, at value (including securities loaned of $1,554,336) - See accompanying schedule: | ||||
Unaffiliated issuers (cost $449,506,151) | $409,623,299 | |||
Fidelity Central Funds (cost $18,138,886) | 18,138,886 | |||
| Total Investment in Securities (cost $467,645,037) | $ | 427,762,185 | ||
| Foreign currency held at value (cost $42,998) | 43,053 | |||
| Receivable for investments sold | 6,290,532 | |||
| Receivable for fund shares sold | 486,583 | |||
| Dividends receivable | 360,028 | |||
| Distributions receivable from Fidelity Central Funds | 68,500 | |||
| Prepaid expenses | 582 | |||
| Other receivables | 109,378 | |||
Total assets | 435,120,841 | |||
| Liabilities | ||||
| Payable for fund shares redeemed | $114,837 | |||
| Accrued management fee | 288,306 | |||
| Distribution and service plan fees payable | 7,701 | |||
| Other affiliated payables | 85,160 | |||
| Deferred taxes | 1,747,274 | |||
| Other payables and accrued expenses | 182,315 | |||
| Collateral on securities loaned | 1,598,400 | |||
| Total Liabilities | 4,023,993 | |||
| Net Assets | $ | 431,096,848 | ||
| Net Assets consist of: | ||||
| Paid in capital | $ | 476,258,360 | ||
| Total accumulated earnings (loss) | (45,161,512) | |||
| Net Assets | $ | 431,096,848 | ||
| Net Asset Value and Maximum Offering Price | ||||
| Class A : | ||||
Net Asset Value and redemption price per share ($16,063,034 ÷ 1,246,338 shares) (a) | $ | 12.89 | ||
| Maximum offering price per share (100/94.25 of $12.89) | $ | 13.68 | ||
| Class M : | ||||
Net Asset Value and redemption price per share ($4,354,685 ÷ 338,964 shares) (a) | $ | 12.85 | ||
| Maximum offering price per share (100/96.50 of $12.85) | $ | 13.32 | ||
| Class C : | ||||
Net Asset Value and offering price per share ($3,078,714 ÷ 246,818 shares) (a) | $ | 12.47 | ||
| Emerging Markets Discovery : | ||||
Net Asset Value , offering price and redemption price per share ($248,804,756 ÷ 19,165,536 shares) | $ | 12.98 | ||
| Class I : | ||||
Net Asset Value , offering price and redemption price per share ($129,249,849 ÷ 9,917,168 shares) | $ | 13.03 | ||
| Class Z : | ||||
Net Asset Value , offering price and redemption price per share ($29,545,810 ÷ 2,272,425 shares) | $ | 13.00 | ||
(a)Redemption price per share is equal to net asset value less any applicable contingent deferred sales charge. | ||||
| Statement of Operations | ||||
Year ended October 31, 2022 | ||||
| Investment Income | ||||
| Dividends | $ | 14,047,212 | ||
| Interest | 1,054 | |||
| Income from Fidelity Central Funds (including $52,365 from security lending) | 232,344 | |||
| Income before foreign taxes withheld | 14,280,610 | |||
| Less foreign taxes withheld | (1,517,922) | |||
| Total Income | 12,762,688 | |||
| Expenses | ||||
| Management fee | $ | 2,924,476 | ||
| Transfer agent fees | 680,979 | |||
| Distribution and service plan fees | 107,240 | |||
| Accounting fees | 180,137 | |||
| Custodian fees and expenses | 200,856 | |||
| Independent trustees' fees and expenses | 1,189 | |||
| Registration fees | 125,247 | |||
| Audit | 78,696 | |||
| Legal | 3,733 | |||
| Interest | 520 | |||
| Miscellaneous | 1,515 | |||
| Total expenses before reductions | 4,304,588 | |||
| Expense reductions | (11,743) | |||
| Total expenses after reductions | 4,292,845 | |||
| Net Investment income (loss) | 8,469,843 | |||
| Realized and Unrealized Gain (Loss) | ||||
| Net realized gain (loss) on: | ||||
| Investment Securities: | ||||
| Unaffiliated issuers(net of foreign taxes of $721,387) | (5,890,518) | |||
| Foreign currency transactions | (70,590) | |||
| Total net realized gain (loss) | (5,961,108) | |||
| Change in net unrealized appreciation (depreciation) on: | ||||
| Investment Securities: | ||||
| Unaffiliated issuers (net of decrease in deferred foreign taxes of $137,803) | (86,301,119) | |||
| Assets and liabilities in foreign currencies | (22,176) | |||
| Total change in net unrealized appreciation (depreciation) | (86,323,295) | |||
| Net gain (loss) | (92,284,403) | |||
| Net increase (decrease) in net assets resulting from operations | $ | (83,814,560) | ||
| Statement of Changes in Net Assets | ||||
Year ended October 31, 2022 | Year ended October 31, 2021 | |||
| Increase (Decrease) in Net Assets | ||||
| Operations | ||||
| Net investment income (loss) | $ | 8,469,843 | $ | 2,827,395 |
| Net realized gain (loss) | (5,961,108) | 51,790,932 | ||
| Change in net unrealized appreciation (depreciation) | (86,323,295) | 25,826,045 | ||
| Net increase (decrease) in net assets resulting from operations | (83,814,560) | 80,444,372 | ||
| Distributions to shareholders | (35,200,802) | (1,678,231) | ||
| Share transactions - net increase (decrease) | 193,227,559 | 27,363,583 | ||
| Total increase (decrease) in net assets | 74,212,197 | 106,129,724 | ||
| Net Assets | ||||
| Beginning of period | 356,884,651 | 250,754,927 | ||
| End of period | $ | 431,096,848 | $ | 356,884,651 |
| Fidelity Advisor® Emerging Markets Discovery Fund Class A |
| Years ended October 31, | 2022 | 2021 | 2020 | 2019 | 2018 | |||||
Selected Per-Share Data | ||||||||||
| Net asset value, beginning of period | $ | 18.36 | $ | 13.93 | $ | 13.66 | $ | 12.01 | $ | 15.03 |
| Income from Investment Operations | ||||||||||
Net investment income (loss) A,B | .31 | .11 | .04 | .13 | .18 | |||||
| Net realized and unrealized gain (loss) | (3.92) | 4.37 | .34 C | 1.71 | (2.89) | |||||
| Total from investment operations | (3.61) | 4.48 | .38 | 1.84 | (2.71) | |||||
| Distributions from net investment income | (.37) | (.05) | (.11) | (.18) | (.08) | |||||
| Distributions from net realized gain | (1.49) | - | - | (.01) | (.23) | |||||
| Total distributions | (1.86) | (.05) | (.11) | (.19) | (.31) | |||||
Redemption fees added to paid in capital A | - | - | - | - | - D | |||||
| Net asset value, end of period | $ | 12.89 | $ | 18.36 | $ | 13.93 | $ | 13.66 | $ | 12.01 |
Total Return E,F | (21.58)% | 32.23% | 2.76% | 15.50% | (18.39)% | |||||
Ratios to Average Net Assets B,G,H | ||||||||||
| Expenses before reductions | 1.49% | 1.49% | 1.54% | 1.55% | 1.52% | |||||
| Expenses net of fee waivers, if any | 1.49% | 1.49% | 1.53% | 1.54% | 1.52% | |||||
| Expenses net of all reductions | 1.49% | 1.49% | 1.51% | 1.54% | 1.48% | |||||
| Net investment income (loss) | 2.11% | .60% | .33% | .96% | 1.22% | |||||
| Supplemental Data | ||||||||||
| Net assets, end of period (000 omitted) | $ | 16,063 | $ | 18,900 | $ | 11,745 | $ | 15,323 | $ | 14,472 |
Portfolio turnover rate I | 33% | 64% | 43% | 80% | 98% |
| Fidelity Advisor® Emerging Markets Discovery Fund Class M |
| Years ended October 31, | 2022 | 2021 | 2020 | 2019 | 2018 | |||||
Selected Per-Share Data | ||||||||||
| Net asset value, beginning of period | $ | 18.30 | $ | 13.89 | $ | 13.62 | $ | 11.94 | $ | 14.94 |
| Income from Investment Operations | ||||||||||
Net investment income (loss) A,B | .27 | .06 | - C | .08 | .14 | |||||
| Net realized and unrealized gain (loss) | (3.91) | 4.36 | .34 D | 1.71 | (2.87) | |||||
| Total from investment operations | (3.64) | 4.42 | .34 | 1.79 | (2.73) | |||||
| Distributions from net investment income | (.32) | (.01) | (.07) | (.10) | (.04) | |||||
| Distributions from net realized gain | (1.49) | - | - | (.01) | (.23) | |||||
| Total distributions | (1.81) | (.01) | (.07) | (.11) | (.27) | |||||
Redemption fees added to paid in capital A | - | - | - | - | - C | |||||
| Net asset value, end of period | $ | 12.85 | $ | 18.30 | $ | 13.89 | $ | 13.62 | $ | 11.94 |
Total Return E,F | (21.77)% | 31.82% | 2.49% | 15.06% | (18.58)% | |||||
Ratios to Average Net Assets B,G,H | ||||||||||
| Expenses before reductions | 1.75% | 1.76% | 1.83% | 1.86% | 1.79% | |||||
| Expenses net of fee waivers, if any | 1.75% | 1.76% | 1.83% | 1.86% | 1.79% | |||||
| Expenses net of all reductions | 1.75% | 1.76% | 1.80% | 1.86% | 1.75% | |||||
| Net investment income (loss) | 1.85% | .33% | .03% | .64% | .94% | |||||
| Supplemental Data | ||||||||||
| Net assets, end of period (000 omitted) | $ | 4,355 | $ | 6,095 | $ | 4,552 | $ | 5,773 | $ | 5,374 |
Portfolio turnover rate I | 33% | 64% | 43% | 80% | 98% |
| Fidelity Advisor® Emerging Markets Discovery Fund Class C |
| Years ended October 31, | 2022 | 2021 | 2020 | 2019 | 2018 | |||||
Selected Per-Share Data | ||||||||||
| Net asset value, beginning of period | $ | 17.78 | $ | 13.55 | $ | 13.29 | $ | 11.66 | $ | 14.64 |
| Income from Investment Operations | ||||||||||
Net investment income (loss) A,B | .19 | (.03) | (.06) | .02 | .06 | |||||
| Net realized and unrealized gain (loss) | (3.81) | 4.26 | .32 C | 1.67 | (2.79) | |||||
| Total from investment operations | (3.62) | 4.23 | .26 | 1.69 | (2.73) | |||||
| Distributions from net investment income | (.20) | - | - | (.05) | (.02) | |||||
| Distributions from net realized gain | (1.49) | - | - | (.01) | (.23) | |||||
| Total distributions | (1.69) | - | - | (.06) | (.25) | |||||
Redemption fees added to paid in capital A | - | - | - | - | - D | |||||
| Net asset value, end of period | $ | 12.47 | $ | 17.78 | $ | 13.55 | $ | 13.29 | $ | 11.66 |
Total Return E,F | (22.21)% | 31.22% | 1.96% | 14.54% | (18.97)% | |||||
Ratios to Average Net Assets B,G,H | ||||||||||
| Expenses before reductions | 2.25% | 2.25% | 2.32% | 2.36% | 2.28% | |||||
| Expenses net of fee waivers, if any | 2.25% | 2.25% | 2.31% | 2.35% | 2.28% | |||||
| Expenses net of all reductions | 2.25% | 2.25% | 2.29% | 2.35% | 2.24% | |||||
| Net investment income (loss) | 1.35% | (.16)% | (.45)% | .14% | .45% | |||||
| Supplemental Data | ||||||||||
| Net assets, end of period (000 omitted) | $ | 3,079 | $ | 4,995 | $ | 5,080 | $ | 7,562 | $ | 11,278 |
Portfolio turnover rate I | 33% | 64% | 43% | 80% | 98% |
| Fidelity® Emerging Markets Discovery Fund |
| Years ended October 31, | 2022 | 2021 | 2020 | 2019 | 2018 | |||||
Selected Per-Share Data | ||||||||||
| Net asset value, beginning of period | $ | 18.48 | $ | 14.02 | $ | 13.75 | $ | 12.10 | $ | 15.12 |
| Income from Investment Operations | ||||||||||
Net investment income (loss) A,B | .36 | .16 | .08 | .16 | .23 | |||||
| Net realized and unrealized gain (loss) | (3.95) | 4.40 | .34 C | 1.72 | (2.91) | |||||
| Total from investment operations | (3.59) | 4.56 | .42 | 1.88 | (2.68) | |||||
| Distributions from net investment income | (.42) | (.10) | (.15) | (.22) | (.11) | |||||
| Distributions from net realized gain | (1.49) | - | - | (.01) | (.23) | |||||
| Total distributions | (1.91) | (.10) | (.15) | (.23) | (.34) | |||||
Redemption fees added to paid in capital A | - | - | - | - | - D | |||||
| Net asset value, end of period | $ | 12.98 | $ | 18.48 | $ | 14.02 | $ | 13.75 | $ | 12.10 |
Total Return E | (21.37)% | 32.63% | 3.07% | 15.78% | (18.11)% | |||||
Ratios to Average Net Assets B,F,G | ||||||||||
| Expenses before reductions | 1.19% | 1.19% | 1.23% | 1.25% | 1.22% | |||||
| Expenses net of fee waivers, if any | 1.19% | 1.18% | 1.23% | 1.25% | 1.22% | |||||
| Expenses net of all reductions | 1.19% | 1.18% | 1.20% | 1.25% | 1.18% | |||||
| Net investment income (loss) | 2.41% | .90% | .63% | 1.25% | 1.51% | |||||
| Supplemental Data | ||||||||||
| Net assets, end of period (000 omitted) | $ | 248,805 | $ | 283,133 | $ | 189,784 | $ | 208,657 | $ | 188,690 |
Portfolio turnover rate H | 33% | 64% | 43% | 80% | 98% |
| Fidelity Advisor® Emerging Markets Discovery Fund Class I |
| Years ended October 31, | 2022 | 2021 | 2020 | 2019 | 2018 | |||||
Selected Per-Share Data | ||||||||||
| Net asset value, beginning of period | $ | 18.54 | $ | 14.06 | $ | 13.79 | $ | 12.13 | $ | 15.15 |
| Income from Investment Operations | ||||||||||
Net investment income (loss) A,B | .34 | .16 | .08 | .17 | .23 | |||||
| Net realized and unrealized gain (loss) | (3.95) | 4.41 | .34 C | 1.72 | (2.90) | |||||
| Total from investment operations | (3.61) | 4.57 | .42 | 1.89 | (2.67) | |||||
| Distributions from net investment income | (.41) | (.09) | (.15) | (.22) | (.12) | |||||
| Distributions from net realized gain | (1.49) | - | - | (.01) | (.23) | |||||
| Total distributions | (1.90) | (.09) | (.15) | (.23) | (.35) | |||||
Redemption fees added to paid in capital A | - | - | - | - | - D | |||||
| Net asset value, end of period | $ | 13.03 | $ | 18.54 | $ | 14.06 | $ | 13.79 | $ | 12.13 |
Total Return E | (21.37)% | 32.62% | 3.07% | 15.78% | (18.06)% | |||||
Ratios to Average Net Assets B,F,G | ||||||||||
| Expenses before reductions | 1.17% | 1.19% | 1.24% | 1.25% | 1.22% | |||||
| Expenses net of fee waivers, if any | 1.16% | 1.19% | 1.23% | 1.24% | 1.22% | |||||
| Expenses net of all reductions | 1.16% | 1.19% | 1.21% | 1.24% | 1.18% | |||||
| Net investment income (loss) | 2.44% | .90% | .63% | 1.26% | 1.51% | |||||
| Supplemental Data | ||||||||||
| Net assets, end of period (000 omitted) | $ | 129,250 | $ | 27,397 | $ | 28,034 | $ | 51,081 | $ | 57,506 |
Portfolio turnover rate H | 33% | 64% | 43% | 80% | 98% |
| Fidelity Advisor® Emerging Markets Discovery Fund Class Z |
| Years ended October 31, | 2022 | 2021 | 2020 | 2019 | 2018 A | |||||
Selected Per-Share Data | ||||||||||
| Net asset value, beginning of period | $ | 18.51 | $ | 14.04 | $ | 13.77 | $ | 12.13 | $ | 13.19 |
| Income from Investment Operations | ||||||||||
Net investment income (loss) B,C | .37 | .19 | .10 | .18 | - D | |||||
| Net realized and unrealized gain (loss) | (3.95) | 4.40 | .35 E | 1.72 | (1.06) | |||||
| Total from investment operations | (3.58) | 4.59 | .45 | 1.90 | (1.06) | |||||
| Distributions from net investment income | (.44) | (.12) | (.18) | (.26) | - | |||||
| Distributions from net realized gain | (1.49) | - | - | (.01) | - | |||||
| Total distributions | (1.93) | (.12) | (.18) | (.26) F | - | |||||
| Net asset value, end of period | $ | 13.00 | $ | 18.51 | $ | 14.04 | $ | 13.77 | $ | 12.13 |
Total Return G,H | (21.27)% | 32.82% | 3.24% | 15.97% | (8.04)% | |||||
Ratios to Average Net Assets C,I,J | ||||||||||
| Expenses before reductions | 1.03% | 1.05% | 1.09% | 1.10% | 1.17% K | |||||
| Expenses net of fee waivers, if any | 1.03% | 1.05% | 1.08% | 1.10% | 1.02% K | |||||
| Expenses net of all reductions | 1.03% | 1.05% | 1.06% | 1.10% | .98% K | |||||
| Net investment income (loss) | 2.57% | 1.04% | .78% | 1.40% | (.12)% K | |||||
| Supplemental Data | ||||||||||
| Net assets, end of period (000 omitted) | $ | 29,546 | $ | 16,365 | $ | 11,561 | $ | 18,267 | $ | 1,412 |
Portfolio turnover rate L | 33% | 64% | 43% | 80% | 98% |
| Fidelity Central Fund | Investment Manager | Investment Objective | Investment Practices | Expense Ratio A |
| Fidelity Money Market Central Funds | Fidelity Management & Research Company LLC (FMR) | Each fund seeks to obtain a high level of current income consistent with the preservation of capital and liquidity. | Short-term Investments | Less than .005% |
| Gross unrealized appreciation | $49,246,619 |
| Gross unrealized depreciation | (91,769,557) |
| Net unrealized appreciation (depreciation) | $(42,522,938) |
| Tax Cost | $470,285,123 |
| Undistributed ordinary income | $6,415,055 |
| Capital loss carryforward | $(7,265,539) |
| Net unrealized appreciation (depreciation) on securities and other investments | $(42,563,755) |
| Short-term | $(5,541,193) |
| Long-term | (1,724,346) |
| Total capital loss carryforward | $(7,265,539) |
| October 31, 2022 | October 31, 2021 | |
| Ordinary Income | $7,555,455 | $1,678,231 |
| Long-term Capital Gains | 27,645,347 | - |
| Total | $35,200,802 | $1,678,231 |
| Purchases ($) | Sales ($) | |
| Fidelity Emerging Markets Discovery Fund | 257,473,544 | 113,895,035 |
| Distribution Fee | Service Fee | Total Fees | Retained by FDC | |
| Class A | - % | .25% | $42,297 | $1,395 |
| Class M | .25% | .25% | 25,984 | 37 |
| Class C | .75% | .25% | 38,959 | 2,674 |
| $107,240 | $4,106 |
| Retained by FDC | |
| Class A | $3,843 |
| Class M | 675 |
Class C A | 308 |
| $4,826 |
| Amount | % of Class-Level Average Net Assets | |
| Class A | $41,793 | .25 |
| Class M | 13,354 | .26 |
| Class C | 9,988 | .26 |
| Emerging Markets Discovery | 501,367 | .20 |
| Class I | 107,109 | .17 |
| Class Z | 7,368 | .04 |
| $680,979 |
| % of Average Net Assets | |
| Fidelity Emerging Markets Discovery Fund | .05 |
| Amount | |
| Fidelity Emerging Markets Discovery Fund | $183 |
| Borrower or Lender | Average Loan Balance | Weighted Average Interest Rate | Interest Expense | |
Fidelity Emerging Markets Discovery Fund | Borrower | $5,408,545 | .31% | $520 |
| Purchases ($) | Sales ($) | Realized Gain (Loss) ($) | |
| Fidelity Emerging Markets Discovery Fund | 11,555,824 | 2,081,651 | (889,701) |
| Amount | |
| Fidelity Emerging Markets Discovery Fund | $603 |
| Total Security Lending Fees Paid to NFS | Security Lending Income From Securities Loaned to NFS | Value of Securities Loaned to NFS at Period End | |
| Fidelity Emerging Markets Discovery Fund | $5,631 | $- | $- |
Year ended October 31, 2022 | Year ended October 31, 2021 | |
| Fidelity Emerging Markets Discovery Fund | ||
| Distributions to shareholders | ||
| Class A | $1,910,190 | $43,438 |
| Class M | 606,383 | 2,654 |
| Class C | 467,124 | - |
| Emerging Markets Discovery | 27,737,464 | 1,342,123 |
| Class I | 2,782,285 | 179,027 |
| Class Z | 1,697,356 | 110,989 |
Total | $35,200,802 | $1,678,231 |
| Shares | Shares | Dollars | Dollars | |
| Year ended October 31, 2022 | Year ended October 31, 2021 | Year ended October 31, 2022 | Year ended October 31, 2021 | |
| Fidelity Emerging Markets Discovery Fund | ||||
| Class A | ||||
| Shares sold | 314,404 | 314,066 | $4,478,487 | $5,697,761 |
| Reinvestment of distributions | 120,206 | 2,718 | 1,910,075 | 43,438 |
| Shares redeemed | (217,629) | (130,443) | (3,180,396) | (2,336,122) |
| Net increase (decrease) | 216,981 | 186,341 | $3,208,166 | $3,405,077 |
| Class M | ||||
| Shares sold | 36,386 | 56,604 | $551,246 | $1,018,071 |
| Reinvestment of distributions | 38,167 | 166 | 606,098 | 2,654 |
| Shares redeemed | (68,600) | (51,511) | (1,005,289) | (891,524) |
| Net increase (decrease) | 5,953 | 5,259 | $152,055 | $129,201 |
| Class C | ||||
| Shares sold | 28,436 | 33,657 | $399,577 | $585,713 |
| Reinvestment of distributions | 30,156 | - | 467,124 | - |
| Shares redeemed | (92,682) | (127,596) | (1,325,981) | (2,221,246) |
| Net increase (decrease) | (34,090) | (93,939) | $(459,280) | $(1,635,533) |
| Emerging Markets Discovery | ||||
| Shares sold | 10,307,936 | 5,654,080 | $148,982,256 | $103,043,648 |
| Reinvestment of distributions | 1,414,497 | 68,892 | 22,589,516 | 1,105,024 |
| Shares redeemed | (7,875,882) | (3,938,307) | (118,180,120) | (70,585,881) |
| Net increase (decrease) | 3,846,551 | 1,784,665 | $53,391,652 | $33,562,791 |
| Class I | ||||
| Shares sold | 9,283,493 | 437,256 | $129,714,339 | $8,018,391 |
| Reinvestment of distributions | 170,907 | 11,029 | 2,737,935 | 177,453 |
| Shares redeemed | (1,015,195) | (964,322) | (14,790,592) | (17,067,625) |
| Net increase (decrease) | 8,439,205 | (516,037) | $117,661,682 | $(8,871,781) |
| Class Z | ||||
| Shares sold | 1,609,828 | 580,870 | $22,578,984 | $9,517,876 |
| Reinvestment of distributions | 104,684 | 5,999 | 1,671,802 | 96,227 |
| Shares redeemed | (326,408) | (526,020) | (4,977,502) | (8,840,275) |
| Net increase (decrease) | 1,388,104 | 60,849 | $19,273,284 | $773,828 |
| Fund | % of shares held |
| Fidelity Emerging Markets Discovery Fund | 24% |
| Average Annual Total Returns | |||
Periods ended October 31, 2022 | Past 1 year | Past 5 years | Past 10 years |
| Class A (incl.5.75% sales charge) | -36.56% | -4.97% | 0.51% |
| Class M (incl.3.50% sales charge) | -35.26% | -4.82% | 0.45% |
Class C (incl. contingent deferred sales charge) | -33.83% | -4.55% | 0.50% |
| Fidelity® Total Emerging Markets Fund | -32.52% | -3.58% | 1.35% |
| Class I | -32.50% | -3.57% | 1.37% |
| Class Z | -32.40% | -3.47% | 1.42% |
| $10,000 Over 10 Years |
Let's say hypothetically that $10,000 was invested in Fidelity® Total Emerging Markets Fund, a class of the fund, on October 31, 2012. The chart shows how the value of your investment would have changed, and also shows how the MSCI Emerging Markets Index performed over the same period. |
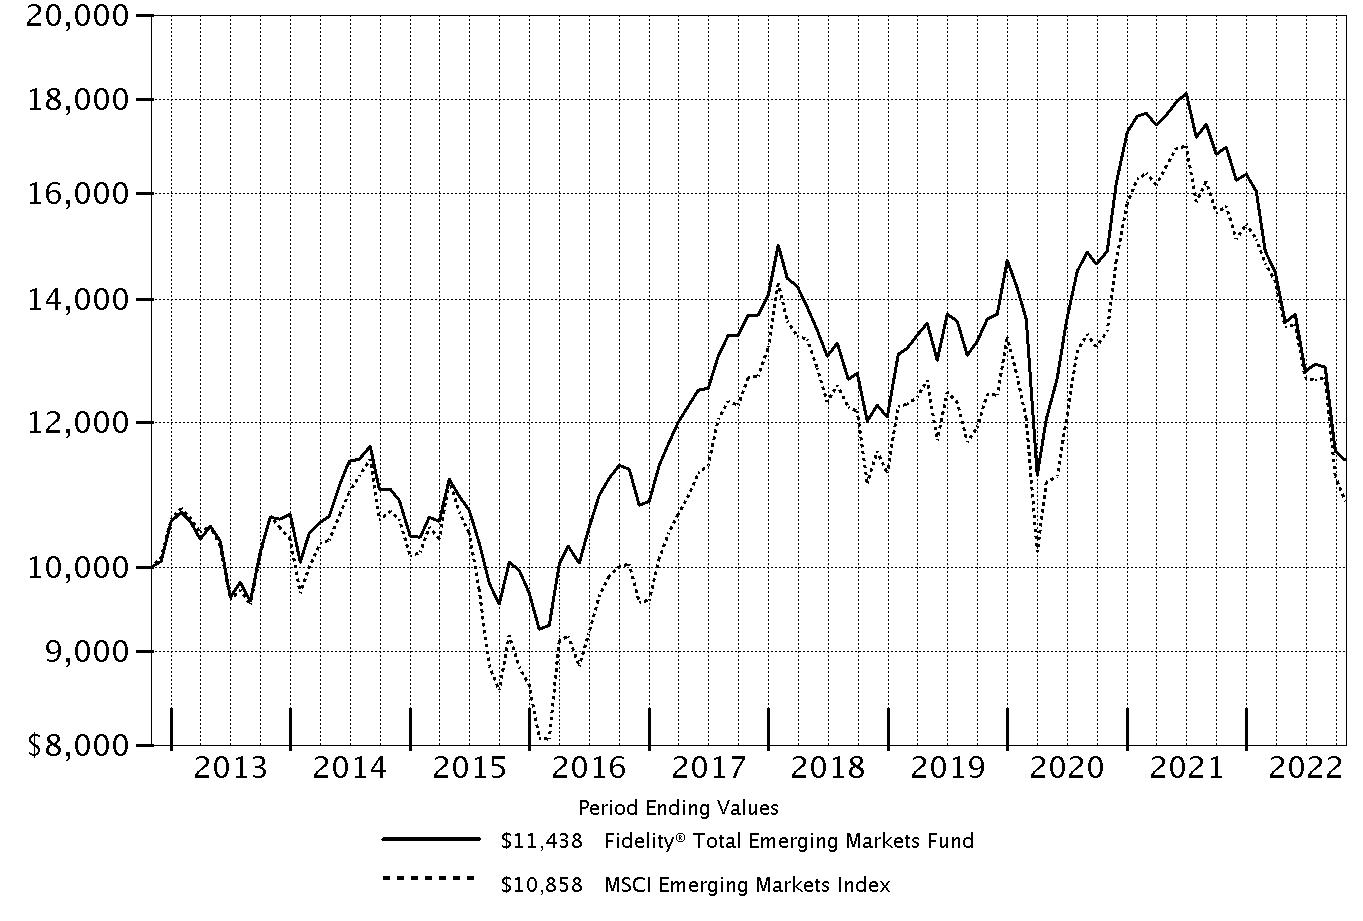 |
Top Holdings (% of Fund's net assets) | ||
| Taiwan Semiconductor Manufacturing Co. Ltd. (Taiwan, Semiconductors & Semiconductor Equipment) | 4.0 | |
| Samsung Electronics Co. Ltd. (Korea (South), Technology Hardware, Storage & Peripherals) | 3.0 | |
| Tencent Holdings Ltd. (Cayman Islands, Interactive Media & Services) | 2.1 | |
| HDFC Bank Ltd. (India, Banks) | 1.4 | |
| Alibaba Group Holding Ltd. (Cayman Islands, Internet & Direct Marketing Retail) | 1.3 | |
| Reliance Industries Ltd. (India, Oil, Gas & Consumable Fuels) | 1.3 | |
| Meituan Class B (Cayman Islands, Internet & Direct Marketing Retail) | 0.9 | |
| FirstCash Holdings, Inc. (United States of America, Consumer Finance) | 0.9 | |
| Infosys Ltd. sponsored ADR (India, IT Services) | 0.9 | |
| China Construction Bank Corp. (H Shares) (China, Banks) | 0.8 | |
| 16.6 | ||
| Market Sectors (% of Fund's net assets) | ||
| Financials | 14.6 | |
| Information Technology | 12.4 | |
| Energy | 10.7 | |
| Consumer Discretionary | 8.5 | |
| Materials | 7.6 | |
| Communication Services | 5.6 | |
| Industrials | 4.7 | |
| Consumer Staples | 4.6 | |
| Utilities | 4.0 | |
| Health Care | 2.4 | |
| Real Estate | 0.8 | |
Asset Allocation (% of Fund's net assets) |
 |
Foreign investments - 93.5% |
Geographic Diversification (% of Fund's net assets) |
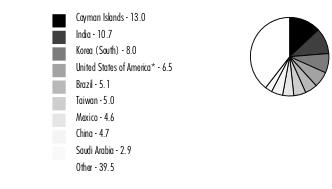 |
* Includes Short-Term investments and Net Other Assets (Liabilities). Percentages are based on country or territory of incorporation and are adjusted for the effect of futures contracts, if applicable. |
| Common Stocks - 57.6% | |||
| Shares | Value ($) | ||
| Belgium - 0.2% | |||
| Titan Cement International Trading SA | 42,400 | 471,814 | |
| Bermuda - 0.8% | |||
| China Gas Holdings Ltd. | 314,744 | 279,072 | |
| Credicorp Ltd. (United States) | 5,379 | 787,270 | |
| Huanxi Media Group Ltd. (a) | 1,726,596 | 197,963 | |
| Kerry Properties Ltd. | 72,000 | 113,921 | |
| Kunlun Energy Co. Ltd. | 540,040 | 322,662 | |
| Pacific Basin Shipping Ltd. | 435,000 | 105,291 | |
| Shangri-La Asia Ltd. (a) | 180,000 | 99,520 | |
TOTAL BERMUDA | 1,905,699 | ||
| Brazil - 2.8% | |||
| Arezzo Industria e Comercio SA | 15,851 | 320,672 | |
| Atacadao SA | 156,300 | 588,829 | |
| Dexco SA | 197,130 | 369,798 | |
| ENGIE Brasil Energia SA | 45,800 | 356,611 | |
| Equatorial Energia SA | 86,000 | 499,967 | |
| Localiza Rent a Car SA | 82,296 | 1,123,833 | |
| LOG Commercial Properties e Participacoes SA | 44,300 | 195,193 | |
| Lojas Renner SA | 85,918 | 513,961 | |
| Rede D'Oregon Sao Luiz SA (b) | 58,146 | 362,125 | |
| Rumo SA | 160,500 | 687,924 | |
| Suzano Papel e Celulose SA | 40,700 | 419,173 | |
| Transmissora Alianca de Energia Eletrica SA unit | 44,000 | 342,341 | |
| Vale SA sponsored ADR | 101,568 | 1,314,290 | |
TOTAL BRAZIL | 7,094,717 | ||
| Canada - 0.4% | |||
| Barrick Gold Corp. | 66,600 | 1,000,998 | |
| Cayman Islands - 11.2% | |||
| Akeso, Inc. (a)(b)(c) | 40,292 | 161,688 | |
| Alibaba Group Holding Ltd. (a) | 432,034 | 3,359,024 | |
| Alibaba Group Holding Ltd. sponsored ADR (a) | 1,964 | 124,871 | |
| Angelalign Technology, Inc. (b)(c) | 7,095 | 62,638 | |
| Ant International Co. Ltd. Class C (a)(d)(e) | 424,550 | 653,807 | |
| Antengene Corp. (a)(b) | 122,482 | 51,960 | |
| Archosaur Games, Inc. (a)(b) | 22,936 | 6,604 | |
| Baidu, Inc. sponsored ADR (a) | 2,478 | 189,740 | |
| BeiGene Ltd. ADR (a) | 271 | 45,769 | |
| Bilibili, Inc. ADR (a) | 46,615 | 415,806 | |
| BizLink Holding, Inc. | 36,000 | 275,129 | |
| Chailease Holding Co. Ltd. | 183,144 | 846,049 | |
| China Resources Land Ltd. | 64,510 | 202,168 | |
| CK Asset Holdings Ltd. | 19,000 | 105,049 | |
| Daqo New Energy Corp. ADR (a) | 675 | 29,693 | |
| ENN Energy Holdings Ltd. | 51,400 | 511,076 | |
| ESR Group Ltd. (b) | 51,400 | 87,744 | |
| GlobalFoundries, Inc. | 2,029 | 115,044 | |
| Greentown China Holdings Ltd. | 36,000 | 34,259 | |
| Haitian International Holdings Ltd. | 130,000 | 260,343 | |
| Hansoh Pharmaceutical Group Co. Ltd. (b) | 164,613 | 254,165 | |
| Innovent Biologics, Inc. (a)(b) | 66,180 | 234,380 | |
| Jacobio Pharmaceuticals Group Co. Ltd. (a)(b) | 144,216 | 63,568 | |
| JD Health International, Inc. (a)(b) | 19,409 | 106,445 | |
| JD.com, Inc.: | |||
| Class A | 46,105 | 839,596 | |
| sponsored ADR | 10,876 | 405,566 | |
| KE Holdings, Inc. ADR (a) | 6,600 | 67,188 | |
| Kuaishou Technology Class B (a)(b) | 33,893 | 139,464 | |
| Li Ning Co. Ltd. | 169,392 | 876,130 | |
| Longfor Properties Co. Ltd. (b) | 5,326 | 6,785 | |
| Medlive Technology Co. Ltd. (b) | 84,961 | 73,384 | |
| Meituan Class B (a)(b) | 146,009 | 2,337,684 | |
| NetEase, Inc. ADR | 12,483 | 694,304 | |
| PagSeguro Digital Ltd. (a) | 107,945 | 1,476,688 | |
| Parade Technologies Ltd. | 5,955 | 112,439 | |
| Pinduoduo, Inc. ADR (a) | 33,092 | 1,814,434 | |
| Sea Ltd. ADR (a) | 32,412 | 1,610,228 | |
| Silergy Corp. | 23,785 | 275,798 | |
| StoneCo Ltd. Class A (a) | 37,718 | 396,039 | |
| Sunny Optical Technology Group Co. Ltd. | 28,636 | 248,251 | |
| Tencent Holdings Ltd. | 196,395 | 5,160,631 | |
| Tencent Music Entertainment Group ADR (a) | 17,278 | 62,374 | |
| Tongdao Liepin Group (a) | 64,973 | 56,616 | |
| Trip.com Group Ltd. ADR (a) | 46,365 | 1,049,240 | |
| Uni-President China Holdings Ltd. | 320,600 | 236,887 | |
| Wuxi Biologics (Cayman), Inc. (a)(b) | 141,528 | 636,825 | |
| Xinyi Solar Holdings Ltd. | 170,775 | 169,477 | |
| XP, Inc. Class A (a) | 52,135 | 955,635 | |
| XPeng, Inc. ADR (a) | 23,620 | 156,364 | |
| Zai Lab Ltd. (a) | 83,560 | 192,463 | |
| Zai Lab Ltd. ADR (a) | 692 | 15,418 | |
TOTAL CAYMAN ISLANDS | 28,262,927 | ||
| Chile - 0.6% | |||
| Banco de Chile | 7,544,400 | 689,991 | |
| Sociedad Quimica y Minera de Chile SA (PN-B) sponsored ADR | 9,921 | 929,399 | |
TOTAL CHILE | 1,619,390 | ||
| China - 4.6% | |||
| Asymchem Laboratories Tianjin Co. Ltd. (H Shares) (b) | 5,608 | 60,012 | |
| Bafang Electric Suzhou Co. Ltd. (A Shares) | 6,245 | 99,572 | |
| Beijing Enlight Media Co. Ltd. (A Shares) | 153,200 | 141,182 | |
| BYD Co. Ltd. (H Shares) | 8,173 | 182,938 | |
| C&S Paper Co. Ltd. (A Shares) | 332,500 | 426,159 | |
| China Communications Services Corp. Ltd. (H Shares) | 574,000 | 160,142 | |
| China Construction Bank Corp. (H Shares) | 3,791,000 | 2,011,840 | |
| China Merchants Shekou Industrial Zone Holdings Co. Ltd. (A Shares) | 31,400 | 56,369 | |
| China Petroleum & Chemical Corp. (H Shares) | 1,896,000 | 751,435 | |
| China Tourism Group Duty Free Corp. Ltd. (A Shares) | 2,300 | 50,504 | |
| China Tower Corp. Ltd. (H Shares) (b) | 1,212,902 | 109,707 | |
| Daqin Railway Co. Ltd. (A Shares) | 615,800 | 540,508 | |
| Flat Glass Group Co. Ltd. (c) | 44,647 | 104,541 | |
| Gemdale Corp. (A Shares) | 21,558 | 23,084 | |
| Haier Smart Home Co. Ltd. | 175,000 | 437,854 | |
| Haier Smart Home Co. Ltd. (A Shares) | 12,560 | 35,773 | |
| Hangzhou First Applied Material Co. Ltd. (A Shares) | 7,866 | 68,999 | |
| Hongfa Technology Co. Ltd. (A Shares) | 65,506 | 307,756 | |
| LONGi Green Energy Technology Co. Ltd. | 15,046 | 98,852 | |
| Pharmaron Beijing Co. Ltd. (H Shares) (b) | 25,340 | 85,224 | |
| Ping An Insurance Group Co. of China Ltd. (H Shares) | 339,000 | 1,357,149 | |
| Poly Developments & Holdings (A Shares) | 13,800 | 26,077 | |
| Proya Cosmetics Co. Ltd. (A Shares) | 60,540 | 1,385,650 | |
| Shenzhen Mindray Bio-Medical Electronics Co. Ltd. (A Shares) | 15,829 | 705,390 | |
| Sinopec Engineering Group Co. Ltd. (H Shares) | 379,500 | 135,853 | |
| Sinopharm Group Co. Ltd. (H Shares) | 131,061 | 249,778 | |
| TravelSky Technology Ltd. (H Shares) | 173,000 | 251,247 | |
| Tsingtao Brewery Co. Ltd. (H Shares) | 134,000 | 938,895 | |
| Venus MedTech Hangzhou, Inc. (H Shares) (a)(b) | 48,180 | 59,230 | |
| Will Semiconductor Ltd. | 3,570 | 35,867 | |
| WuXi AppTec Co. Ltd. (H Shares) (b) | 23,524 | 188,500 | |
| Zhuzhou CRRC Times Electric Co. Ltd. (H Shares) | 109,300 | 474,119 | |
TOTAL CHINA | 11,560,206 | ||
| Cyprus - 0.0% | |||
| Fix Price Group Ltd. GDR (Reg. S) (e) | 68,238 | 25,202 | |
| Galaxy Cosmos Mezz PLC (a) | 45,977 | 7,424 | |
| Sunrisemezz Ltd. (a) | 42,900 | 3,472 | |
| TCS Group Holding PLC GDR (a)(e) | 56,395 | 70,750 | |
TOTAL CYPRUS | 106,848 | ||
| Germany - 0.1% | |||
| Delivery Hero AG (a)(b) | 8,120 | 267,220 | |
| Greece - 0.6% | |||
| Alpha Bank SA (a) | 1,241,400 | 1,150,751 | |
| Piraeus Financial Holdings SA (a) | 300,300 | 370,371 | |
TOTAL GREECE | 1,521,122 | ||
| Hong Kong - 0.8% | |||
| AIA Group Ltd. | 87,600 | 663,552 | |
| China Merchants Holdings International Co. Ltd. | 151,924 | 178,059 | |
| China Overseas Land and Investment Ltd. | 86,040 | 164,196 | |
| China Resources Beer Holdings Co. Ltd. | 162,666 | 766,740 | |
| Guangdong Investment Ltd. | 442,000 | 278,726 | |
| Sino-Ocean Group Holding Ltd. | 201,000 | 13,315 | |
TOTAL HONG KONG | 2,064,588 | ||
| Hungary - 0.1% | |||
| Richter Gedeon PLC | 17,860 | 352,658 | |
| India - 10.5% | |||
| Adani Ports & Special Economic Zone Ltd. | 63,466 | 631,402 | |
| Apollo Hospitals Enterprise Ltd. | 9,489 | 517,837 | |
| Bajaj Finance Ltd. | 13,064 | 1,127,453 | |
| Bandhan Bank Ltd. (a)(b) | 429,300 | 1,237,129 | |
| Bharat Electronics Ltd. | 460,600 | 594,529 | |
| CE Info Systems Ltd. | 6,264 | 98,996 | |
| Delhivery Private Ltd. | 4,995 | 20,769 | |
| Divi's Laboratories Ltd. | 6,033 | 263,016 | |
| Embassy Office Parks (REIT) | 17,700 | 73,635 | |
| HDFC Bank Ltd. (a) | 193,396 | 3,509,733 | |
| HDFC Standard Life Insurance Co. Ltd. (b) | 117,200 | 765,170 | |
| Indraprastha Gas Ltd. | 86,693 | 448,493 | |
| Indus Towers Ltd. | 15,400 | 34,510 | |
| Infosys Ltd. | 32,627 | 606,051 | |
| Infosys Ltd. sponsored ADR | 115,082 | 2,155,486 | |
| ITC Ltd. | 211,213 | 889,707 | |
| JK Cement Ltd. | 33,674 | 1,103,476 | |
| Larsen & Toubro Ltd. | 40,269 | 984,153 | |
| Mahanagar Gas Ltd. | 30,939 | 322,041 | |
| Manappuram General Finance & Leasing Ltd. | 443,251 | 563,836 | |
| Maruti Suzuki India Ltd. | 6,012 | 691,954 | |
| NTPC Ltd. | 345,084 | 721,600 | |
| Oberoi Realty Ltd. | 13,570 | 151,576 | |
| Oil & Natural Gas Corp. Ltd. | 336,500 | 544,912 | |
| Petronet LNG Ltd. | 88,206 | 219,023 | |
| Power Grid Corp. of India Ltd. | 336,710 | 928,007 | |
| Reliance Industries Ltd. | 105,013 | 3,234,370 | |
| Shree Cement Ltd. | 2,651 | 728,256 | |
| Sun Pharmaceutical Industries Ltd. | 12,742 | 156,527 | |
| Tata Motors Ltd. (a) | 79,290 | 396,981 | |
| Tata Steel Ltd. | 866,800 | 1,063,343 | |
| Torrent Pharmaceuticals Ltd. | 12,046 | 240,105 | |
| Vijaya Diagnostic Centre Pvt Ltd. | 14,138 | 74,652 | |
| Voltas Ltd. | 22,363 | 236,705 | |
| Zomato Ltd. (a) | 1,578,309 | 1,203,084 | |
TOTAL INDIA | 26,538,517 | ||
| Indonesia - 1.4% | |||
| PT Astra International Tbk | 723,200 | 308,337 | |
| PT Bank Central Asia Tbk | 2,286,000 | 1,289,745 | |
| PT Bank Rakyat Indonesia (Persero) Tbk | 4,616,879 | 1,376,406 | |
| PT Dayamitra Telekomunikasi Tbk | 766,000 | 35,114 | |
| PT Sumber Alfaria Trijaya Tbk | 1,192,300 | 215,566 | |
| PT United Tractors Tbk | 121,400 | 251,401 | |
TOTAL INDONESIA | 3,476,569 | ||
| Japan - 0.5% | |||
| Capcom Co. Ltd. | 4,803 | 133,888 | |
| JTOWER, Inc. (a) | 2,136 | 86,908 | |
| Money Forward, Inc. (a) | 3,960 | 112,918 | |
| Renesas Electronics Corp. (a) | 25,407 | 212,549 | |
| Sumco Corp. | 10,905 | 138,536 | |
| Z Holdings Corp. | 207,158 | 534,625 | |
TOTAL JAPAN | 1,219,424 | ||
| Korea (South) - 7.9% | |||
| AMOREPACIFIC Group, Inc. | 12,679 | 219,412 | |
| Coway Co. Ltd. | 8,140 | 315,376 | |
| Hana Financial Group, Inc. | 15,945 | 460,816 | |
| Hanon Systems | 27,300 | 149,189 | |
| Hyundai Fire & Marine Insurance Co. Ltd. | 14,260 | 332,692 | |
| Jeisys Medical, Inc. (a) | 19,800 | 98,354 | |
| Kakao Corp. | 14,965 | 531,574 | |
| Kakao Pay Corp. (a) | 4,703 | 116,478 | |
| KB Financial Group, Inc. | 59,078 | 1,983,923 | |
| Kia Corp. | 15,167 | 704,518 | |
| Korea Zinc Co. Ltd. | 889 | 398,621 | |
| L&F Co. Ltd. (a) | 200 | 31,528 | |
| LG Chemical Ltd. | 1,063 | 466,215 | |
| LG Corp. | 6,650 | 368,999 | |
| LG Electronics, Inc. | 1,735 | 99,190 | |
| LG Innotek Co. Ltd. | 227 | 47,155 | |
| NAVER Corp. | 2,954 | 350,799 | |
| NCSOFT Corp. | 1,063 | 290,453 | |
| Netmarble Corp. (b) | 1,175 | 36,716 | |
| POSCO | 7,952 | 1,383,174 | |
| S-Oil Corp. | 6,110 | 369,857 | |
| Samsung Biologics Co. Ltd. (a)(b) | 1,200 | 737,326 | |
| Samsung Electronics Co. Ltd. | 181,618 | 7,558,298 | |
| Samsung SDI Co. Ltd. | 1,984 | 1,024,443 | |
| SK Hynix, Inc. | 32,591 | 1,888,347 | |
| Studio Dragon Corp. (a) | 1,874 | 89,806 | |
TOTAL KOREA (SOUTH) | 20,053,259 | ||
| Luxembourg - 0.4% | |||
| Adecoagro SA | 4,900 | 42,434 | |
| Globant SA (a) | 1,999 | 377,171 | |
| Tenaris SA sponsored ADR | 16,300 | 512,146 | |
TOTAL LUXEMBOURG | 931,751 | ||
| Mauritius - 0.0% | |||
| Jumo World Ltd. (a)(e) | 30 | 122,049 | |
| Mexico - 2.0% | |||
| CEMEX S.A.B. de CV sponsored ADR (a) | 458,100 | 1,768,266 | |
| Corporacion Inmobiliaria Vesta S.A.B. de CV | 138,455 | 300,907 | |
| Grupo Aeroportuario del Pacifico S.A.B. de CV Series B | 31,400 | 486,381 | |
| Grupo Aeroportuario del Sureste S.A.B. de CV Series B sponsored ADR | 1,854 | 432,761 | |
| Grupo Aeroportuario Norte S.A.B. de CV | 28,100 | 223,858 | |
| Grupo Financiero Banorte S.A.B. de CV Series O | 187,321 | 1,522,639 | |
| Wal-Mart de Mexico SA de CV Series V | 110,300 | 426,046 | |
TOTAL MEXICO | 5,160,858 | ||
| Netherlands - 0.2% | |||
| CTP BV (b) | 1,652 | 17,142 | |
| NXP Semiconductors NV | 613 | 89,547 | |
| X5 Retail Group NV GDR (Reg. S) (e) | 77,500 | 16,181 | |
| Yandex NV Series A (a)(e) | 94,069 | 322,642 | |
TOTAL NETHERLANDS | 445,512 | ||
| Panama - 0.1% | |||
| Copa Holdings SA Class A (a) | 3,347 | 251,795 | |
| Philippines - 0.2% | |||
| Ayala Land, Inc. | 322,800 | 142,824 | |
| SM Investments Corp. | 18,000 | 255,770 | |
TOTAL PHILIPPINES | 398,594 | ||
| Poland - 0.1% | |||
| CD Projekt RED SA (c) | 11,670 | 310,688 | |
| Russia - 0.0% | |||
| Gazprom OAO sponsored ADR (Reg. S) (a)(e) | 155,600 | 35,545 | |
| LSR Group OJSC (a)(e) | 755 | 1,139 | |
| LUKOIL PJSC sponsored ADR (e) | 35,200 | 9,958 | |
| Novatek PJSC GDR (Reg. S) (e) | 9,100 | 2,325 | |
| Sberbank of Russia (a)(e) | 30 | 0 | |
| Sberbank of Russia sponsored ADR (a)(e) | 324,104 | 5,769 | |
| Severstal PAO GDR (Reg. S) (e) | 83,700 | 1,976 | |
TOTAL RUSSIA | 56,712 | ||
| Saudi Arabia - 2.1% | |||
| Al Rajhi Bank | 67,614 | 1,533,103 | |
| Alinma Bank | 84,700 | 845,298 | |
| Bupa Arabia for Cooperative Insurance Co. | 12,300 | 631,768 | |
| Saudi Arabian Oil Co. (b) | 33,920 | 315,048 | |
| Saudi Tadawul Group Holding Co. | 11,300 | 653,181 | |
| The Saudi National Bank | 84,800 | 1,340,533 | |
TOTAL SAUDI ARABIA | 5,318,931 | ||
| Singapore - 0.5% | |||
| CapitaLand Investment Ltd. | 107,000 | 227,515 | |
| First Resources Ltd. | 448,700 | 472,282 | |
| United Overseas Bank Ltd. | 27,500 | 539,277 | |
TOTAL SINGAPORE | 1,239,074 | ||
| South Africa - 1.9% | |||
| Capitec Bank Holdings Ltd. | 7,650 | 791,527 | |
| FirstRand Ltd. | 260,607 | 912,967 | |
| Impala Platinum Holdings Ltd. | 144,400 | 1,478,463 | |
| Naspers Ltd. Class N | 3,785 | 390,165 | |
| Pick 'n Pay Stores Ltd. | 358,000 | 1,150,667 | |
TOTAL SOUTH AFRICA | 4,723,789 | ||
| Taiwan - 5.0% | |||
| ECLAT Textile Co. Ltd. | 25,000 | 329,029 | |
| eMemory Technology, Inc. | 4,282 | 142,716 | |
| GlobalWafers Co. Ltd. | 8,197 | 91,109 | |
| MediaTek, Inc. | 53,221 | 973,535 | |
| Taiwan Semiconductor Manufacturing Co. Ltd. | 837,430 | 10,057,907 | |
| Uni-President Enterprises Corp. | 254,000 | 515,812 | |
| Unimicron Technology Corp. | 52,487 | 202,599 | |
| United Microelectronics Corp. | 22,943 | 27,561 | |
| Wiwynn Corp. | 11,440 | 256,792 | |
TOTAL TAIWAN | 12,597,060 | ||
| Thailand - 0.3% | |||
| Carabao Group PCL (For. Reg.) | 95,900 | 227,493 | |
| Land & House PCL (For. Reg.) | 402,800 | 97,405 | |
| PTT Global Chemical PCL (For. Reg.) | 381,300 | 435,972 | |
TOTAL THAILAND | 760,870 | ||
| Turkey - 0.3% | |||
| Bim Birlesik Magazalar A/S JSC | 100,000 | 719,879 | |
| United Kingdom - 0.4% | |||
| Helios Towers PLC (a) | 130,800 | 188,252 | |
| Prudential PLC | 79,335 | 736,996 | |
TOTAL UNITED KINGDOM | 925,248 | ||
| United States of America - 1.6% | |||
| Airbnb, Inc. Class A (a) | 1,400 | 149,674 | |
| Dlocal Ltd. (a) | 11,511 | 256,695 | |
| FirstCash Holdings, Inc. | 22,101 | 2,175,843 | |
| Legend Biotech Corp. ADR (a) | 2,859 | 142,435 | |
| Li Auto, Inc. ADR (a) | 34,818 | 474,221 | |
| Marvell Technology, Inc. | 3,337 | 132,412 | |
| MercadoLibre, Inc. (a) | 589 | 531,054 | |
| NVIDIA Corp. | 771 | 104,062 | |
TOTAL UNITED STATES OF AMERICA | 3,966,396 | ||
| TOTAL COMMON STOCKS (Cost $159,349,118) | 145,445,162 | ||
| Preferred Stocks - 2.2% | |||
| Shares | Value ($) | ||
| Convertible Preferred Stocks - 0.4% | |||
| Cayman Islands - 0.1% | |||
| Creditas Financial Solutions Ltd. Series F (d)(e) | 1,073 | 349,337 | |
| China - 0.1% | |||
| dMed Biopharmaceutical Co. Ltd. Series C (a)(d)(e) | 11,962 | 107,299 | |
| India - 0.2% | |||
| Meesho Series F (a)(d)(e) | 7,108 | 467,280 | |
TOTAL CONVERTIBLE PREFERRED STOCKS | 923,916 | ||
| Nonconvertible Preferred Stocks - 1.8% | |||
| Brazil - 1.6% | |||
| Ambev SA sponsored ADR | 369,600 | 1,123,584 | |
| Companhia de Transmissao de Energia Eletrica Paulista (PN) | 55,400 | 262,763 | |
| Metalurgica Gerdau SA (PN) | 405,470 | 883,078 | |
| Petroleo Brasileiro SA - Petrobras: | |||
| (PN) sponsored ADR (non-vtg.) | 79,206 | 911,661 | |
| sponsored ADR | 62,500 | 801,250 | |
| 3,982,336 | |||
| Korea (South) - 0.1% | |||
| Hyundai Motor Co. Series 2 | 7,206 | 402,880 | |
| United States of America - 0.1% | |||
| Gupshup, Inc. (a)(d)(e) | 8,409 | 157,585 | |
TOTAL NONCONVERTIBLE PREFERRED STOCKS | 4,542,801 | ||
| TOTAL PREFERRED STOCKS (Cost $4,513,533) | 5,466,717 | ||
| Nonconvertible Bonds - 15.0% | |||
Principal Amount (f) | Value ($) | ||
| Azerbaijan - 0.6% | |||
| Southern Gas Corridor CJSC 6.875% 3/24/26 (b) | 895,000 | 879,248 | |
| State Oil Co. of Azerbaijan Republic 6.95% 3/18/30 (Reg. S) | 585,000 | 566,646 | |
TOTAL AZERBAIJAN | 1,445,894 | ||
| Bahrain - 0.8% | |||
| The Oil and Gas Holding Co.: | |||
| 7.5% 10/25/27 (b) | 1,580,000 | 1,525,490 | |
| 7.625% 11/7/24 (b) | 400,000 | 396,325 | |
TOTAL BAHRAIN | 1,921,815 | ||
| Bailiwick of Jersey - 0.3% | |||
| Galaxy Pipeline Assets BidCo Ltd.: | |||
| 2.16% 3/31/34 (b) | 416,097 | 338,599 | |
| 2.625% 3/31/36 (b) | 570,000 | 431,526 | |
TOTAL BAILIWICK OF JERSEY | 770,125 | ||
| Bermuda - 0.5% | |||
| GeoPark Ltd. 5.5% 1/17/27 (b) | 500,000 | 403,375 | |
| Investment Energy Resources Ltd. 6.25% 4/26/29 (b) | 510,000 | 428,655 | |
| Tengizchevroil Finance Co. International Ltd. 3.25% 8/15/30 (b) | 550,000 | 351,725 | |
TOTAL BERMUDA | 1,183,755 | ||
| Brazil - 0.1% | |||
| Natura Cosmeticos SA 4.125% 5/3/28 (b) | 435,000 | 337,343 | |
| British Virgin Islands - 0.1% | |||
| ENN Clean Energy International Investment Ltd. 3.375% 5/12/26 (b) | 395,000 | 307,927 | |
| Canada - 0.1% | |||
| Gcm Mining Corp. 6.875% 8/9/26 (b) | 400,000 | 277,932 | |
| Cayman Islands - 1.3% | |||
| DP World Crescent Ltd.: | |||
| 3.875% 7/18/29 (Reg. S) | 700,000 | 621,765 | |
| 4.848% 9/26/28 (b) | 400,000 | 378,000 | |
| Lamar Funding Ltd. 3.958% 5/7/25 (b) | 430,000 | 395,546 | |
| Meituan 2.125% 10/28/25 (b) | 640,000 | 524,416 | |
| NagaCorp Ltd. 7.95% 7/6/24 (Reg. S) | 400,000 | 342,950 | |
| Sable International Finance Ltd. 5.75% 9/7/27 (b) | 600,000 | 528,750 | |
| Termocandelaria Power Ltd. 7.875% 1/30/29 (b) | 454,750 | 386,054 | |
TOTAL CAYMAN ISLANDS | 3,177,481 | ||
| Chile - 0.4% | |||
| Corporacion Nacional del Cobre de Chile (Codelco): | |||
| 3.7% 1/30/50 (b) | 300,000 | 192,431 | |
| 4.25% 7/17/42 (b) | 250,000 | 183,563 | |
| 4.5% 8/1/47 (b) | 250,000 | 186,375 | |
| Empresa Nacional de Petroleo 4.5% 9/14/47 (b) | 440,000 | 279,208 | |
| VTR Comunicaciones SpA 5.125% 1/15/28 (b) | 400,000 | 253,575 | |
TOTAL CHILE | 1,095,152 | ||
| Colombia - 0.1% | |||
| Oleoducto Central SA 4% 7/14/27 (b) | 350,000 | 284,769 | |
| Georgia - 0.1% | |||
| JSC Georgian Railway 4% 6/17/28 (b) | 300,000 | 226,181 | |
| Guatemala - 0.1% | |||
| CT Trust 5.125% 2/3/32 (b) | 440,000 | 350,295 | |
| Indonesia - 0.9% | |||
| PT Adaro Indonesia 4.25% 10/31/24 (b) | 250,000 | 233,641 | |
| PT Freeport Indonesia: | |||
| 5.315% 4/14/32 (b) | 250,000 | 208,438 | |
| 6.2% 4/14/52 (b) | 200,000 | 149,022 | |
| PT Hutama Karya Persero 3.75% 5/11/30 (b) | 600,000 | 512,738 | |
| PT Indonesia Asahan Aluminium Tbk: | |||
| 4.75% 5/15/25 (b) | 285,000 | 272,206 | |
| 5.45% 5/15/30 (b) | 400,000 | 348,575 | |
| PT Pertamina Persero: | |||
| 4.15% 2/25/60 (b) | 365,000 | 223,964 | |
| 4.175% 1/21/50 (b) | 450,000 | 297,938 | |
TOTAL INDONESIA | 2,246,522 | ||
| Ireland - 0.0% | |||
| SUEK Securities DAC 3.375% 9/15/26 (b)(g) | 255,000 | 85,576 | |
| Israel - 0.2% | |||
| Israel Electric Corp. Ltd. 3.75% 2/22/32 (Reg. S) (b) | 300,000 | 249,755 | |
| Leviathan Bond Ltd. 6.125% 6/30/25 (Reg. S) (b) | 250,000 | 237,331 | |
TOTAL ISRAEL | 487,086 | ||
| Kazakhstan - 0.1% | |||
| KazMunaiGaz National Co. 3.5% 4/14/33 (b) | 400,000 | 271,575 | |
| Luxembourg - 0.6% | |||
| Adecoagro SA 6% 9/21/27 (b) | 480,000 | 432,300 | |
| B2W Digital Lux SARL 4.375% 12/20/30 (b) | 385,000 | 263,557 | |
| EIG Pearl Holdings SARL 3.545% 8/31/36 (b) | 590,000 | 452,825 | |
| MC Brazil Downstream Trading SARL 7.25% 6/30/31 (b) | 385,000 | 292,254 | |
TOTAL LUXEMBOURG | 1,440,936 | ||
| Malaysia - 0.5% | |||
| MISC Capital Two (Labuan) Ltd. 3.75% 4/6/27 (b) | 380,000 | 338,390 | |
| Petronas Capital Ltd.: | |||
| 3.404% 4/28/61 (b) | 200,000 | 123,400 | |
| 3.5% 4/21/30 (b) | 450,000 | 399,238 | |
| 4.55% 4/21/50 (b) | 400,000 | 325,288 | |
TOTAL MALAYSIA | 1,186,316 | ||
| Mauritius - 0.4% | |||
| AXIAN Telecom 7.375% 2/16/27 (b) | 355,000 | 305,300 | |
| CA Magnum Holdings 5.375% 10/31/26 (b) | 400,000 | 335,000 | |
| HTA Group Ltd. 7% 12/18/25 (b) | 400,000 | 351,200 | |
TOTAL MAURITIUS | 991,500 | ||
| Mexico - 1.9% | |||
| Comision Federal de Electricid: | |||
| 3.348% 2/9/31 (b) | 450,000 | 330,975 | |
| 4.688% 5/15/29 (b) | 390,000 | 328,648 | |
| Petroleos Mexicanos: | |||
| 5.35% 2/12/28 | 320,000 | 254,551 | |
| 6.49% 1/23/27 | 590,000 | 515,306 | |
| 6.5% 6/2/41 | 1,170,000 | 728,442 | |
| 6.625% 6/15/35 | 410,000 | 282,736 | |
| 6.7% 2/16/32 | 415,000 | 311,796 | |
| 6.75% 9/21/47 | 960,000 | 577,440 | |
| 6.84% 1/23/30 | 520,000 | 412,428 | |
| 6.95% 1/28/60 | 1,075,000 | 640,969 | |
| 7.69% 1/23/50 | 589,000 | 379,724 | |
TOTAL MEXICO | 4,763,015 | ||
| Morocco - 0.2% | |||
| OCP SA 3.75% 6/23/31 (b) | 535,000 | 396,502 | |
| Multi-National - 0.3% | |||
| GEMS MENASA Cayman Ltd. 7.125% 7/31/26 (b) | 690,000 | 647,306 | |
| Netherlands - 0.5% | |||
| Mong Duong Finance Holdings BV 5.125% 5/7/29 (b) | 890,000 | 616,770 | |
| Prosus NV: | |||
| 3.832% 2/8/51 (b) | 425,000 | 224,188 | |
| 4.027% 8/3/50 (b) | 350,000 | 187,316 | |
| 4.193% 1/19/32 (b) | 445,000 | 316,453 | |
TOTAL NETHERLANDS | 1,344,727 | ||
| Panama - 0.3% | |||
| Aeropuerto Internacional de Tocumen SA: | |||
| 4% 8/11/41 (b) | 290,000 | 203,417 | |
| 5.125% 8/11/61 (b) | 200,000 | 134,975 | |
| Cable Onda SA 4.5% 1/30/30 (b) | 580,000 | 471,540 | |
TOTAL PANAMA | 809,932 | ||
| Paraguay - 0.1% | |||
| Telefonica Celular del Paraguay SA 5.875% 4/15/27 (b) | 250,000 | 225,828 | |
| Peru - 0.2% | |||
| Camposol SA 6% 2/3/27 (b) | 500,000 | 352,438 | |
| Compania de Minas Buenaventura SAA 5.5% 7/23/26 (b) | 165,000 | 136,517 | |
TOTAL PERU | 488,955 | ||
| Qatar - 0.7% | |||
| Qatar Petroleum: | |||
| 1.375% 9/12/26 (b) | 425,000 | 373,598 | |
| 2.25% 7/12/31 (b) | 700,000 | 561,750 | |
| 3.125% 7/12/41 (b) | 650,000 | 457,763 | |
| 3.3% 7/12/51 (b) | 580,000 | 391,500 | |
TOTAL QATAR | 1,784,611 | ||
| Saudi Arabia - 0.7% | |||
| Saudi Arabian Oil Co.: | |||
| 3.5% 4/16/29 (b) | 450,000 | 398,925 | |
| 4.25% 4/16/39 (b) | 1,680,000 | 1,377,617 | |
TOTAL SAUDI ARABIA | 1,776,542 | ||
| Singapore - 0.2% | |||
| Medco Bell Pte Ltd. 6.375% 1/30/27 (b) | 730,000 | 584,000 | |
| South Africa - 0.6% | |||
| Eskom Holdings SOC Ltd.: | |||
| 6.75% 8/6/23 (b) | 1,025,000 | 1,000,016 | |
| 7.125% 2/11/25 (b) | 650,000 | 605,028 | |
TOTAL SOUTH AFRICA | 1,605,044 | ||
| Spain - 0.2% | |||
| EnfraGen Energia Sur SA 5.375% 12/30/30 (b) | 690,000 | 356,595 | |
| Thailand - 0.1% | |||
| PTT Treasury Center Co. Ltd. 3.7% 7/16/70 (b) | 350,000 | 201,863 | |
| United Arab Emirates - 0.2% | |||
| Abu Dhabi National Energy Co. PJSC: | |||
| 4% 10/3/49 (b) | 390,000 | 313,414 | |
| 4.875% 4/23/30 (b) | 50,000 | 48,525 | |
| MDGH GMTN RSC Ltd. 5.5% 4/28/33 (b) | 200,000 | 198,840 | |
TOTAL UNITED ARAB EMIRATES | 560,779 | ||
| United Kingdom - 0.8% | |||
| Antofagasta PLC 2.375% 10/14/30 (b) | 450,000 | 329,625 | |
| Endeavour Mining PLC 5% 10/14/26 (b) | 405,000 | 314,584 | |
| Liquid Telecommunications Financing PLC 5.5% 9/4/26 (b) | 400,000 | 270,000 | |
| NAK Naftogaz Ukraine 7.375% 7/19/24 (Reg. S) (g) | 400,000 | 72,000 | |
| Tullow Oil PLC: | |||
| 7% 3/1/25 (b) | 840,000 | 552,300 | |
| 10.25% 5/15/26 (b) | 411,000 | 350,378 | |
TOTAL UNITED KINGDOM | 1,888,887 | ||
| United States of America - 0.5% | |||
| Kosmos Energy Ltd. 7.125% 4/4/26 (b) | 575,000 | 478,688 | |
| NBM U.S. Holdings, Inc. 6.625% 8/6/29 (b) | 130,000 | 120,234 | |
| Sasol Financing U.S.A. LLC 5.875% 3/27/24 | 200,000 | 194,250 | |
| Stillwater Mining Co. 4% 11/16/26 (b) | 690,000 | 564,851 | |
TOTAL UNITED STATES OF AMERICA | 1,358,023 | ||
| Uzbekistan - 0.2% | |||
| National Bank of Uzbekistan 4.85% 10/21/25 (Reg. S) | 350,000 | 305,550 | |
| Uzbekneftegaz JSC 4.75% 11/16/28 (b) | 400,000 | 296,000 | |
TOTAL UZBEKISTAN | 601,550 | ||
| Venezuela - 0.1% | |||
| Petroleos de Venezuela SA: | |||
| 6% 5/16/24 (b)(g) | 5,700,000 | 128,250 | |
| 6% 11/15/26 (Reg. S) (g) | 6,800,000 | 129,200 | |
TOTAL VENEZUELA | 257,450 | ||
| TOTAL NONCONVERTIBLE BONDS (Cost $50,101,906) | 37,739,789 | ||
| Government Obligations - 20.5% | |||
Principal Amount (f) | Value ($) | ||
| Angola - 0.8% | |||
| Angola Republic: | |||
| 8.25% 5/9/28 (b) | 1,020,000 | 854,250 | |
| 8.75% 4/14/32 (b) | 200,000 | 160,000 | |
| 9.125% 11/26/49 (b) | 225,000 | 168,863 | |
| 9.375% 5/8/48 (b) | 290,000 | 220,400 | |
| 9.5% 11/12/25 (b) | 620,000 | 602,950 | |
TOTAL ANGOLA | 2,006,463 | ||
| Argentina - 0.7% | |||
| Argentine Republic: | |||
| 0.5% 7/9/30 (i) | 1,995,365 | 418,029 | |
| 1% 7/9/29 | 498,666 | 101,977 | |
| 1.5% 7/9/35 (i) | 1,537,734 | 304,471 | |
| 3.875% 1/9/38 (i) | 2,011,834 | 517,167 | |
| Buenos Aires Province 5.25% 9/1/37 (b)(i) | 1,030,000 | 310,159 | |
TOTAL ARGENTINA | 1,651,803 | ||
| Armenia - 0.1% | |||
| Republic of Armenia 7.15% 3/26/25 (b) | 370,000 | 361,398 | |
| Bahrain - 0.1% | |||
| Bahrain Kingdom 5.625% 5/18/34 (b) | 200,000 | 157,584 | |
| Barbados - 0.1% | |||
| Barbados Government 6.5% 10/1/29 (b) | 290,000 | 267,308 | |
| Benin - 0.2% | |||
| Republic of Benin: | |||
| 4.875% 1/19/32 (b) | EUR | 140,000 | 94,427 |
| 5.75% 3/26/26 (b) | EUR | 450,000 | 423,116 |
TOTAL BENIN | 517,543 | ||
| Brazil - 0.6% | |||
| Brazilian Federative Republic: | |||
| 3.875% 6/12/30 | 1,390,000 | 1,167,426 | |
| 4.75% 1/14/50 | 505,000 | 337,498 | |
TOTAL BRAZIL | 1,504,924 | ||
| Cameroon - 0.1% | |||
| Cameroon Republic 5.95% 7/7/32 (b) | EUR | 360,000 | 231,651 |
| Chile - 0.5% | |||
| Chilean Republic: | |||
| 2.45% 1/31/31 | 785,000 | 626,430 | |
| 2.75% 1/31/27 | 220,000 | 197,450 | |
| 3.5% 1/31/34 | 280,000 | 225,540 | |
| 4% 1/31/52 | 200,000 | 141,200 | |
| 4.34% 3/7/42 | 200,000 | 154,100 | |
TOTAL CHILE | 1,344,720 | ||
| Colombia - 0.9% | |||
| Colombian Republic: | |||
| 3% 1/30/30 | 915,000 | 646,448 | |
| 3.125% 4/15/31 | 548,000 | 375,825 | |
| 5% 6/15/45 | 805,000 | 488,434 | |
| 5.2% 5/15/49 | 185,000 | 112,364 | |
| 6.125% 1/18/41 | 200,000 | 142,913 | |
| 7.375% 9/18/37 | 650,000 | 546,934 | |
TOTAL COLOMBIA | 2,312,918 | ||
| Costa Rica - 0.2% | |||
| Costa Rican Republic: | |||
| 5.625% 4/30/43 (b) | 325,000 | 236,194 | |
| 6.125% 2/19/31 (b) | 265,000 | 245,589 | |
TOTAL COSTA RICA | 481,783 | ||
| Dominican Republic - 1.3% | |||
| Dominican Republic: | |||
| 4.5% 1/30/30 (b) | 515,000 | 411,131 | |
| 4.875% 9/23/32 (b) | 870,000 | 667,344 | |
| 5.3% 1/21/41 (b) | 200,000 | 137,163 | |
| 5.875% 1/30/60 (b) | 900,000 | 603,000 | |
| 6% 7/19/28 (b) | 400,000 | 363,950 | |
| 6% 2/22/33 (b) | 425,000 | 354,158 | |
| 6.5% 2/15/48 (b) | 200,000 | 145,350 | |
| 6.85% 1/27/45 (b) | 350,000 | 268,909 | |
| 6.875% 1/29/26 (b) | 255,000 | 249,788 | |
TOTAL DOMINICAN REPUBLIC | 3,200,793 | ||
| Ecuador - 0.4% | |||
| Ecuador Republic: | |||
| 2.5% 7/31/35 (b)(i) | 1,385,256 | 503,281 | |
| 5.5% 7/31/30 (b)(i) | 985,630 | 522,261 | |
TOTAL ECUADOR | 1,025,542 | ||
| Egypt - 1.0% | |||
| Arab Republic of Egypt: | |||
| 5.875% 2/16/31 (b) | 400,000 | 243,200 | |
| 7.0529% 1/15/32 (b) | 890,000 | 559,476 | |
| 7.5% 1/31/27 (b) | 150,000 | 120,563 | |
| 7.5% 2/16/61 (b) | 300,000 | 169,500 | |
| 7.903% 2/21/48 (b) | 865,000 | 483,319 | |
| 8.5% 1/31/47 (b) | 1,160,000 | 682,950 | |
| 8.7002% 3/1/49 (b) | 400,000 | 236,500 | |
TOTAL EGYPT | 2,495,508 | ||
| El Salvador - 0.1% | |||
| El Salvador Republic 7.1246% 1/20/50 (b) | 560,000 | 187,880 | |
| Gabon - 0.2% | |||
| Gabonese Republic: | |||
| 6.95% 6/16/25 (b) | 200,000 | 179,500 | |
| 7% 11/24/31 (b) | 540,000 | 376,414 | |
TOTAL GABON | 555,914 | ||
| Georgia - 0.2% | |||
| Georgia Republic 2.75% 4/22/26 (b) | 505,000 | 422,938 | |
| Ghana - 0.2% | |||
| Ghana Republic: | |||
| 8.125% 1/18/26 (b) | 500,000 | 181,813 | |
| 8.627% 6/16/49 (b) | 615,000 | 165,012 | |
| 10.75% 10/14/30 (b) | 400,000 | 258,000 | |
TOTAL GHANA | 604,825 | ||
| Guatemala - 0.1% | |||
| Guatemalan Republic 6.125% 6/1/50 (b) | 350,000 | 300,519 | |
| Hungary - 0.2% | |||
| Hungarian Republic: | |||
| 2.125% 9/22/31 (b) | 500,000 | 356,031 | |
| 3.125% 9/21/51 (b) | 375,000 | 204,328 | |
TOTAL HUNGARY | 560,359 | ||
| Indonesia - 0.4% | |||
| Indonesian Republic: | |||
| 3.5% 2/14/50 | 380,000 | 255,503 | |
| 4.2% 10/15/50 | 600,000 | 448,566 | |
| 8.5% 10/12/35 (b) | 300,000 | 351,525 | |
TOTAL INDONESIA | 1,055,594 | ||
| Israel - 0.1% | |||
| Israeli State 4.5% 4/3/20 | 405,000 | 307,713 | |
| Ivory Coast - 0.3% | |||
| Ivory Coast: | |||
| 6.125% 6/15/33 (b) | 200,000 | 155,350 | |
| 6.375% 3/3/28 (b) | 635,000 | 574,794 | |
TOTAL IVORY COAST | 730,144 | ||
| Jordan - 0.2% | |||
| Jordanian Kingdom: | |||
| 5.85% 7/7/30 (b) | 200,000 | 165,500 | |
| 7.375% 10/10/47 (b) | 280,000 | 208,950 | |
TOTAL JORDAN | 374,450 | ||
| Kenya - 0.5% | |||
| Republic of Kenya: | |||
| 6.3% 1/23/34 (b) | 200,000 | 126,000 | |
| 6.875% 6/24/24 (b) | 830,000 | 724,175 | |
| 7% 5/22/27 (b) | 410,000 | 324,925 | |
TOTAL KENYA | 1,175,100 | ||
| Lebanon - 0.2% | |||
| Lebanese Republic: | |||
| 5.8% 12/31/49 (g) | 1,165,000 | 68,246 | |
| 6.375% 12/31/49 (g) | 7,090,000 | 407,675 | |
TOTAL LEBANON | 475,921 | ||
| Mexico - 0.6% | |||
| United Mexican States: | |||
| 2.659% 5/24/31 | 400,000 | 309,800 | |
| 3.25% 4/16/30 | 400,000 | 335,950 | |
| 4.35% 1/15/47 | 850,000 | 594,363 | |
| 4.75% 3/8/44 | 450,000 | 341,522 | |
TOTAL MEXICO | 1,581,635 | ||
| Mongolia - 0.1% | |||
| Mongolia Government: | |||
| 3.5% 7/7/27 (b) | 220,000 | 149,600 | |
| 5.125% 4/7/26 (b) | 200,000 | 152,522 | |
TOTAL MONGOLIA | 302,122 | ||
| Morocco - 0.2% | |||
| Moroccan Kingdom: | |||
| 2.375% 12/15/27 (b) | 375,000 | 307,453 | |
| 4% 12/15/50 (b) | 200,000 | 117,788 | |
TOTAL MOROCCO | 425,241 | ||
| Nigeria - 0.6% | |||
| Republic of Nigeria: | |||
| 6.125% 9/28/28 (b) | 325,000 | 213,688 | |
| 6.5% 11/28/27 (b) | 705,000 | 498,788 | |
| 7.143% 2/23/30 (b) | 850,000 | 552,500 | |
| 7.625% 11/28/47 (b) | 300,000 | 169,500 | |
TOTAL NIGERIA | 1,434,476 | ||
| Oman - 1.2% | |||
| Sultanate of Oman: | |||
| 4.75% 6/15/26 (b) | 450,000 | 425,250 | |
| 5.375% 3/8/27 (b) | 395,000 | 376,238 | |
| 5.625% 1/17/28 (b) | 420,000 | 399,000 | |
| 6% 8/1/29 (b) | 285,000 | 270,394 | |
| 6.25% 1/25/31 (b) | 690,000 | 657,225 | |
| 6.5% 3/8/47 (b) | 1,150,000 | 947,313 | |
TOTAL OMAN | 3,075,420 | ||
| Pakistan - 0.2% | |||
| Islamic Republic of Pakistan: | |||
| 6% 4/8/26 (b) | 880,000 | 275,097 | |
| 6.875% 12/5/27 (b) | 560,000 | 173,662 | |
TOTAL PAKISTAN | 448,759 | ||
| Panama - 0.7% | |||
| Panamanian Republic: | |||
| 2.252% 9/29/32 | 485,000 | 336,257 | |
| 3.16% 1/23/30 | 660,000 | 536,580 | |
| 3.298% 1/19/33 | 540,000 | 412,020 | |
| 3.87% 7/23/60 | 510,000 | 292,740 | |
| 4.5% 5/15/47 | 405,000 | 279,906 | |
TOTAL PANAMA | 1,857,503 | ||
| Paraguay - 0.3% | |||
| Republic of Paraguay: | |||
| 2.739% 1/29/33 (b) | 415,000 | 307,178 | |
| 5.4% 3/30/50 (b) | 415,000 | 315,997 | |
TOTAL PARAGUAY | 623,175 | ||
| Peru - 0.8% | |||
| Peruvian Republic: | |||
| 2.783% 1/23/31 | 1,435,000 | 1,130,780 | |
| 3% 1/15/34 | 260,000 | 193,570 | |
| 3.3% 3/11/41 | 855,000 | 575,415 | |
TOTAL PERU | 1,899,765 | ||
| Philippines - 0.3% | |||
| Philippine Republic: | |||
| 2.65% 12/10/45 | 430,000 | 259,660 | |
| 2.95% 5/5/45 | 320,000 | 205,635 | |
| 5.95% 10/13/47 | 225,000 | 219,962 | |
TOTAL PHILIPPINES | 685,257 | ||
| Qatar - 1.1% | |||
| State of Qatar: | |||
| 3.75% 4/16/30 (b) | 325,000 | 302,240 | |
| 4.4% 4/16/50 (b) | 1,430,000 | 1,201,171 | |
| 4.625% 6/2/46 (b) | 600,000 | 528,372 | |
| 4.817% 3/14/49 (b) | 855,000 | 761,130 | |
TOTAL QATAR | 2,792,913 | ||
| Romania - 0.5% | |||
| Romanian Republic: | |||
| 3% 2/27/27 (b) | 334,000 | 285,841 | |
| 3% 2/14/31 (b) | 574,000 | 423,433 | |
| 3.625% 3/27/32 (b) | 334,000 | 244,926 | |
| 6.125% 1/22/44 (b) | 400,000 | 318,950 | |
TOTAL ROMANIA | 1,273,150 | ||
| Russia - 0.1% | |||
| Ministry of Finance of the Russian Federation 5.1% 3/28/35(Reg. S) (g) | 600,000 | 252,000 | |
| Rwanda - 0.2% | |||
| Rwanda Republic 5.5% 8/9/31 (b) | 700,000 | 510,694 | |
| Saudi Arabia - 0.1% | |||
| Kingdom of Saudi Arabia 2.25% 2/2/33 (b) | 445,000 | 341,716 | |
| Senegal - 0.1% | |||
| Republic of Senegal: | |||
| 6.25% 5/23/33 (b) | 235,000 | 175,193 | |
| 6.75% 3/13/48 (b) | 200,000 | 126,663 | |
TOTAL SENEGAL | 301,856 | ||
| Serbia - 0.1% | |||
| Republic of Serbia 2.125% 12/1/30 (b) | 455,000 | 313,182 | |
| South Africa - 0.3% | |||
| South African Republic: | |||
| 4.85% 9/27/27 | 400,000 | 361,950 | |
| 5.75% 9/30/49 | 525,000 | 347,813 | |
TOTAL SOUTH AFRICA | 709,763 | ||
| Sri Lanka - 0.1% | |||
| Democratic Socialist Republic of Sri Lanka: | |||
| 6.2% 5/11/27 (b)(g) | 935,000 | 198,790 | |
| 6.85% 11/3/25 (b)(g) | 550,000 | 122,650 | |
| 7.55% 3/28/30 (b)(g) | 50,000 | 10,916 | |
| 7.85% 3/14/29 (b)(g) | 165,000 | 35,764 | |
TOTAL SRI LANKA | 368,120 | ||
| Tunisia - 0.0% | |||
| Tunisia Republic of 5.75% 1/30/25 (b) | 110,000 | 68,736 | |
| Turkey - 1.0% | |||
| Turkish Republic: | |||
| 4.25% 3/13/25 | 365,000 | 329,869 | |
| 4.75% 1/26/26 | 540,000 | 472,500 | |
| 4.875% 10/9/26 | 520,000 | 441,350 | |
| 4.875% 4/16/43 | 1,005,000 | 587,925 | |
| 5.125% 2/17/28 | 245,000 | 197,838 | |
| 5.75% 5/11/47 | 665,000 | 408,975 | |
| 6.125% 10/24/28 | 220,000 | 182,875 | |
TOTAL TURKEY | 2,621,332 | ||
| Ukraine - 0.3% | |||
| Ukraine Government: | |||
| 0% 8/1/41 (b)(j) | 775,000 | 192,200 | |
| 6.876% 5/21/31 (b) | 200,000 | 28,975 | |
| 7.253% 3/15/35 (b) | 380,000 | 56,715 | |
| 7.375% 9/25/34 (b) | 200,000 | 29,975 | |
| 7.75% 9/1/25 (b) | 830,000 | 173,937 | |
| 7.75% 9/1/26 (b) | 830,000 | 136,846 | |
| 7.75% 9/1/27 (b) | 345,000 | 57,313 | |
| 7.75% 9/1/28 (b) | 560,000 | 99,400 | |
| 7.75% 9/1/29 (b) | 400,000 | 69,950 | |
TOTAL UKRAINE | 845,311 | ||
| United Arab Emirates - 0.6% | |||
| Emirate of Abu Dhabi: | |||
| 1.7% 3/2/31 (b) | 350,000 | 274,816 | |
| 3.125% 9/30/49 (b) | 410,000 | 274,136 | |
| Emirate of Dubai: | |||
| 3.9% 9/9/50 (Reg. S) | 650,000 | 420,794 | |
| 5.25% 1/30/43 (Reg. S) | 295,000 | 245,643 | |
| United Arab Emirates 4.05% 7/7/32 (b) | 200,000 | 185,413 | |
TOTAL UNITED ARAB EMIRATES | 1,400,802 | ||
| United States of America - 0.7% | |||
| U.S. Treasury Bills, yield at date of purchase 3.33% to 3.67% 1/5/23 to 1/12/23 | 370,000 | 367,264 | |
| U.S. Treasury Bonds 2.875% 5/15/52 | 1,827,000 | 1,417,923 | |
TOTAL UNITED STATES OF AMERICA | 1,785,187 | ||
| Uruguay - 0.3% | |||
| Uruguay Republic 5.1% 6/18/50 | 730,000 | 653,259 | |
| Uzbekistan - 0.1% | |||
| Republic of Uzbekistan: | |||
| 3.7% 11/25/30 (b) | 200,000 | 143,663 | |
| 3.9% 10/19/31 (b) | 240,000 | 170,520 | |
TOTAL UZBEKISTAN | 314,183 | ||
| Venezuela - 0.2% | |||
| Venezuelan Republic 9.25% 9/15/27 (g) | 6,200,000 | 418,500 | |
| Zambia - 0.0% | |||
| Republic of Zambia: | |||
| 8.5% 4/14/24 (b) | 50,000 | 19,250 | |
| 8.97% 7/30/27 (b) | 250,000 | 92,500 | |
TOTAL ZAMBIA | 111,750 | ||
| TOTAL GOVERNMENT OBLIGATIONS (Cost $76,141,597) | 51,727,102 | ||
| Preferred Securities - 1.1% | |||
Principal Amount (f) | Value ($) | ||
| Cayman Islands - 0.4% | |||
| Banco Mercantil del Norte SA 6.75% (b)(h)(j) | 400,000 | 365,096 | |
| DP World Salaam 6% (Reg. S) (h)(j) | 600,000 | 591,970 | |
TOTAL CAYMAN ISLANDS | 957,066 | ||
| Georgia - 0.3% | |||
| Georgia Bank Joint Stock Co. 11.125% (Reg. S) (h)(j) | 700,000 | 698,809 | |
| Mexico - 0.1% | |||
| CEMEX S.A.B. de CV 5.125% (b)(h)(j) | 400,000 | 331,278 | |
| United Arab Emirates - 0.3% | |||
| Emirates NBD Bank PJSC 6.125% (Reg. S) (h)(j) | 400,000 | 380,793 | |
| NBK Tier 1 Financing 2 Ltd. 4.5% (b)(h)(j) | 400,000 | 357,728 | |
TOTAL UNITED ARAB EMIRATES | 738,521 | ||
| TOTAL PREFERRED SECURITIES (Cost $3,105,057) | 2,725,674 | ||
| Money Market Funds - 3.4% | |||
| Shares | Value ($) | ||
| Fidelity Cash Central Fund 3.10% (k) | 8,145,771 | 8,147,400 | |
| Fidelity Securities Lending Cash Central Fund 3.10% (k)(l) | 421,957 | 421,999 | |
| TOTAL MONEY MARKET FUNDS (Cost $8,569,102) | 8,569,399 | ||
| TOTAL INVESTMENT IN SECURITIES - 99.8% (Cost $301,780,313) | 251,673,843 |
NET OTHER ASSETS (LIABILITIES) - 0.2% | 584,941 |
| NET ASSETS - 100.0% | 252,258,784 |
| EUR | - | European Monetary Unit |
| (a) | Non-income producing |
| (b) | Security exempt from registration under Rule 144A of the Securities Act of 1933. These securities may be resold in transactions exempt from registration, normally to qualified institutional buyers. At the end of the period, the value of these securities amounted to $71,526,576 or 28.4% of net assets. |
| (c) | Security or a portion of the security is on loan at period end. |
| (d) | Restricted securities (including private placements) - Investment in securities not registered under the Securities Act of 1933 (excluding 144A issues). At the end of the period, the value of restricted securities (excluding 144A issues) amounted to $1,735,308 or 0.7% of net assets. |
| (e) | Level 3 security |
| (f) | Amount is stated in United States dollars unless otherwise noted. |
| (g) | Non-income producing - Security is in default. |
| (h) | Security is perpetual in nature with no stated maturity date. |
| (i) | Security initially issued at one coupon which converts to a higher coupon at a specified date. The rate shown is the rate at period end. |
| (j) | Coupon rates for floating and adjustable rate securities reflect the rates in effect at period end. |
| (k) | Affiliated fund that is generally available only to investment companies and other accounts managed by Fidelity Investments. The rate quoted is the annualized seven-day yield of the fund at period end. A complete unaudited listing of the fund's holdings as of its most recent quarter end is available upon request. In addition, each Fidelity Central Fund's financial statements, which are not covered by the Fund's Report of Independent Registered Public Accounting Firm, are available on the SEC's website or upon request. |
| (l) | Investment made with cash collateral received from securities on loan. |
| Additional information on each restricted holding is as follows: | ||
| Security | Acquisition Date | Acquisition Cost ($) |
| Ant International Co. Ltd. Class C | 5/16/18 | 1,618,120 |
| Creditas Financial Solutions Ltd. Series F | 1/28/22 | 337,976 |
| dMed Biopharmaceutical Co. Ltd. Series C | 12/01/20 | 169,898 |
| Gupshup, Inc. | 6/08/21 | 192,273 |
| Meesho Series F | 9/21/21 | 544,986 |
| Affiliate | Value, beginning of period ($) | Purchases ($) | Sales Proceeds ($) | Dividend Income ($) | Realized Gain (loss) ($) | Change in Unrealized appreciation (depreciation) ($) | Value, end of period ($) | % ownership, end of period |
| Fidelity Cash Central Fund 3.10% | 18,857,299 | 475,804,518 | 486,514,417 | 71,453 | 1 | (1) | 8,147,400 | 0.0% |
| Fidelity Securities Lending Cash Central Fund 3.10% | 1,116,639 | 10,135,845 | 10,830,485 | 21,452 | - | - | 421,999 | 0.0% |
| Total | 19,973,938 | 485,940,363 | 497,344,902 | 92,905 | 1 | (1) | 8,569,399 | |
| Valuation Inputs at Reporting Date: | ||||
| Description | Total ($) | Level 1 ($) | Level 2 ($) | Level 3 ($) |
Investments in Securities: | ||||
| Equities: | ||||
Communication Services | 11,730,594 | 5,712,696 | 5,695,256 | 322,642 |
Consumer Discretionary | 19,248,222 | 11,632,350 | 7,590,670 | 25,202 |
Consumer Staples | 10,362,223 | 10,346,042 | - | 16,181 |
Energy | 7,958,931 | 7,159,668 | 751,435 | 47,828 |
Financials | 34,375,251 | 22,910,346 | 10,263,193 | 1,201,712 |
Health Care | 6,192,726 | 5,448,602 | 636,825 | 107,299 |
Industrials | 8,736,079 | 8,480,309 | 255,770 | - |
Information Technology | 30,710,691 | 19,787,809 | 10,298,017 | 624,865 |
Materials | 14,216,312 | 11,352,699 | 2,861,637 | 1,976 |
Real Estate | 2,107,491 | 1,963,528 | 142,824 | 1,139 |
Utilities | 5,273,359 | 5,273,359 | - | - |
| Corporate Bonds | 37,739,789 | - | 37,739,789 | - |
| Government Obligations | 51,727,102 | - | 51,727,102 | - |
| Preferred Securities | 2,725,674 | - | 2,725,674 | - |
| Money Market Funds | 8,569,399 | 8,569,399 | - | - |
| Total Investments in Securities: | 251,673,843 | 118,636,807 | 130,688,192 | 2,348,844 |
| Investments in Securities: | |||
| Communication Services | |||
| Beginning Balance | $ | - | |
| Net Realized Gain (Loss) on Investment Securities | (414,845) | ||
| Net Unrealized Gain (Loss) on Investment Securities | (6,259,138) | ||
| Cost of Purchases | 2,232,622 | ||
| Proceeds of Sales | (1,093,696) | ||
| Amortization/Accretion | - | ||
| Transfers into Level 3 | 5,857,699 | ||
| Transfers out of Level 3 | - | ||
| Ending Balance | $ | 322,642 | |
| The change in unrealized gain (loss) for the period attributable to Level 3 securities held at October 31, 2022 | $ | (6,259,138) | |
| Energy | |||
| Beginning Balance | $ | - | |
| Net Realized Gain (Loss) on Investment Securities | 302,049 | ||
| Net Unrealized Gain (Loss) on Investment Securities | (8,075,007) | ||
| Cost of Purchases | 1,666,531 | ||
| Proceeds of Sales | (3,059,132) | ||
| Amortization/Accretion | - | ||
| Transfers into Level 3 | 9,213,387 | ||
| Transfers out of Level 3 | - | ||
| Ending Balance | $ | 47,828 | |
| The change in unrealized gain (loss) for the period attributable to Level 3 securities held at October 31, 2022 | $ | (8,075,007) | |
| Financials | |||
| Beginning Balance | $ | 1,138,255 | |
| Net Realized Gain (Loss) on Investment Securities | 355,832 | ||
| Net Unrealized Gain (Loss) on Investment Securities | (12,754,046) | ||
| Cost of Purchases | 1,773,535 | ||
| Proceeds of Sales | (1,287,307) | ||
| Amortization/Accretion | - | ||
| Transfers into Level 3 | 11,975,443 | ||
| Transfers out of Level 3 | - | ||
| Ending Balance | $ | 1,201,712 | |
| The change in unrealized gain (loss) for the period attributable to Level 3 securities held at October 31, 2022 | $ | (12,754,046) | |
| Other Investments in Securities | |||
| Beginning Balance | $ | 902,694 | |
| Net Realized Gain (Loss) on Investment Securities | (409,482) | ||
| Net Unrealized Gain (Loss) on Investment Securities | (4,754,480) | ||
| Cost of Purchases | 2,817,684 | ||
| Proceeds of Sales | (407,693) | ||
| Amortization/Accretion | - | ||
| Transfers into Level 3 | 2,627,939 | ||
| Transfers out of Level 3 | - | ||
| Ending Balance | $ | 776,662 | |
| The change in unrealized gain (loss) for the period attributable to Level 3 securities held at October 31, 2022 | $ | (4,754,480) | |
| The information used in the above reconciliation represents fiscal year to date activity for any Investments in Securities identified as using Level 3 inputs at either the beginning or the end of the current fiscal period. Cost of purchases and proceeds of sales may include securities received and/or delivered through in-kind transactions. Transfers into Level 3 were attributable to a lack of observable market data resulting from decreases in market activity, decreases in liquidity, security restructurings or corporate actions. Transfers out of Level 3 were attributable to observable market data becoming available for those securities. Transfers in or out of Level 3 represent the beginning value of any Security or Instrument where a change in the pricing level occurred from the beginning to the end of the period. The cost of purchases and the proceeds of sales may include securities received or delivered through corporate actions or exchanges. Realized and unrealized gains (losses) disclosed in the reconciliation are included in Net Gain (Loss) on the Fund's Statement of Operations. | |||
| Statement of Assets and Liabilities | ||||
| October 31, 2022 | ||||
| Assets | ||||
| Investment in securities, at value (including securities loaned of $401,799) - See accompanying schedule: | ||||
Unaffiliated issuers (cost $293,211,211) | $243,104,444 | |||
Fidelity Central Funds (cost $8,569,102) | 8,569,399 | |||
| Total Investment in Securities (cost $301,780,313) | $ | 251,673,843 | ||
| Foreign currency held at value (cost $611,139) | 553,877 | |||
| Receivable for investments sold | 4,955,992 | |||
| Receivable for fund shares sold | 77,758 | |||
| Dividends receivable | 178,670 | |||
| Interest receivable | 1,676,216 | |||
| Distributions receivable from Fidelity Central Funds | 23,753 | |||
| Prepaid expenses | 510 | |||
| Other receivables | 88,673 | |||
Total assets | 259,229,292 | |||
| Liabilities | ||||
| Payable to custodian bank | 2,775,562 | |||
| Payable for investments purchased | 2,366,343 | |||
| Payable for fund shares redeemed | 753,134 | |||
| Accrued management fee | 173,633 | |||
| Distribution and service plan fees payable | 20,304 | |||
| Other affiliated payables | 56,042 | |||
| Deferred taxes | 303,184 | |||
| Other payables and accrued expenses | 100,307 | |||
| Collateral on securities loaned | 421,999 | |||
| Total Liabilities | 6,970,508 | |||
| Net Assets | $ | 252,258,784 | ||
| Net Assets consist of: | ||||
| Paid in capital | $ | 328,542,838 | ||
| Total accumulated earnings (loss) | (76,284,054) | |||
| Net Assets | $ | 252,258,784 | ||
| Net Asset Value and Maximum Offering Price | ||||
| Class A : | ||||
Net Asset Value and redemption price per share ($28,301,786 ÷ 2,804,554 shares) (a) | $ | 10.09 | ||
| Maximum offering price per share (100/94.25 of $10.09) | $ | 10.71 | ||
| Class M : | ||||
Net Asset Value and redemption price per share ($6,237,455 ÷ 619,338 shares) (a) | $ | 10.07 | ||
| Maximum offering price per share (100/96.50 of $10.07) | $ | 10.44 | ||
| Class C : | ||||
Net Asset Value and offering price per share ($13,468,679 ÷ 1,347,535 shares) (a) | $ | 10.00 | ||
| Total Emerging Markets : | ||||
Net Asset Value , offering price and redemption price per share ($91,614,588 ÷ 9,054,255 shares) | $ | 10.12 | ||
| Class I : | ||||
Net Asset Value , offering price and redemption price per share ($98,727,161 ÷ 9,765,144 shares) | $ | 10.11 | ||
| Class Z : | ||||
Net Asset Value , offering price and redemption price per share ($13,909,115 ÷ 1,378,604 shares) | $ | 10.09 | ||
(a)Redemption price per share is equal to net asset value less any applicable contingent deferred sales charge. | ||||
| Statement of Operations | ||||
Year ended October 31, 2022 | ||||
| Investment Income | ||||
| Dividends | $ | 9,181,507 | ||
| Interest | 7,774,089 | |||
| Income from Fidelity Central Funds (including $21,452 from security lending) | 92,905 | |||
| Income before foreign taxes withheld | 17,048,501 | |||
| Less foreign taxes withheld | (965,348) | |||
| Total Income | 16,083,153 | |||
| Expenses | ||||
| Management fee | $ | 3,480,344 | ||
| Transfer agent fees | 755,078 | |||
| Distribution and service plan fees | 335,368 | |||
| Accounting fees | 222,687 | |||
| Custodian fees and expenses | 248,851 | |||
| Independent trustees' fees and expenses | 1,630 | |||
| Registration fees | 127,869 | |||
| Audit | 89,200 | |||
| Legal | 5,103 | |||
| Interest | 4,237 | |||
| Miscellaneous | 2,399 | |||
| Total expenses before reductions | 5,272,766 | |||
| Expense reductions | (14,816) | |||
| Total expenses after reductions | 5,257,950 | |||
| Net Investment income (loss) | 10,825,203 | |||
| Realized and Unrealized Gain (Loss) | ||||
| Net realized gain (loss) on: | ||||
| Investment Securities: | ||||
| Unaffiliated issuers(net of foreign taxes of $524,689) | (12,668,742) | |||
| Fidelity Central Funds | 1 | |||
| Foreign currency transactions | (261,678) | |||
| Futures contracts | 289,870 | |||
| Total net realized gain (loss) | (12,640,549) | |||
| Change in net unrealized appreciation (depreciation) on: | ||||
| Investment Securities: | ||||
| Unaffiliated issuers (net of decrease in deferred foreign taxes of $1,074,830) | (173,045,352) | |||
| Fidelity Central Funds | (1) | |||
| Assets and liabilities in foreign currencies | (30,778) | |||
| Futures contracts | 72,291 | |||
| Total change in net unrealized appreciation (depreciation) | (173,003,840) | |||
| Net gain (loss) | (185,644,389) | |||
| Net increase (decrease) in net assets resulting from operations | $ | (174,819,186) | ||
| Statement of Changes in Net Assets | ||||
Year ended October 31, 2022 | Year ended October 31, 2021 | |||
| Increase (Decrease) in Net Assets | ||||
| Operations | ||||
| Net investment income (loss) | $ | 10,825,203 | $ | 9,421,013 |
| Net realized gain (loss) | (12,640,549) | 41,853,240 | ||
| Change in net unrealized appreciation (depreciation) | (173,003,840) | 30,550,736 | ||
| Net increase (decrease) in net assets resulting from operations | (174,819,186) | 81,824,989 | ||
| Distributions to shareholders | (11,768,448) | (7,490,574) | ||
| Share transactions - net increase (decrease) | (182,422,186) | (20,710,210) | ||
| Total increase (decrease) in net assets | (369,009,820) | 53,624,205 | ||
| Net Assets | ||||
| Beginning of period | 621,268,604 | 567,644,399 | ||
| End of period | $ | 252,258,784 | $ | 621,268,604 |
| Fidelity Advisor® Total Emerging Markets Fund Class A |
| Years ended October 31, | 2022 | 2021 | 2020 | 2019 | 2018 | |||||
Selected Per-Share Data | ||||||||||
| Net asset value, beginning of period | $ | 15.26 | $ | 13.55 | $ | 12.80 | $ | 11.53 | $ | 13.56 |
| Income from Investment Operations | ||||||||||
Net investment income (loss) A,B | .28 | .20 | .19 | .37 C | .25 | |||||
| Net realized and unrealized gain (loss) | (5.19) | 1.67 | .89 | 1.14 | (1.94) | |||||
| Total from investment operations | (4.91) | 1.87 | 1.08 | 1.51 | (1.69) | |||||
| Distributions from net investment income | (.26) | (.16) | (.33) | (.24) | (.16) | |||||
| Distributions from net realized gain | - | - | - | - | (.19) | |||||
| Total distributions | (.26) | (.16) | (.33) | (.24) | (.34) D | |||||
Redemption fees added to paid in capital A | - | - | - | - | - E | |||||
| Net asset value, end of period | $ | 10.09 | $ | 15.26 | $ | 13.55 | $ | 12.80 | $ | 11.53 |
Total Return F,G | (32.69)% | 13.78% | 8.54% | 13.38% | (12.77)% | |||||
Ratios to Average Net Assets B,H,I | ||||||||||
| Expenses before reductions | 1.39% | 1.36% | 1.40% | 1.39% | 1.40% | |||||
| Expenses net of fee waivers, if any | 1.39% | 1.36% | 1.39% | 1.39% | 1.40% | |||||
| Expenses net of all reductions | 1.39% | 1.36% | 1.37% | 1.39% | 1.37% | |||||
| Net investment income (loss) | 2.21% | 1.26% | 1.49% | 3.02% C | 1.92% | |||||
| Supplemental Data | ||||||||||
| Net assets, end of period (000 omitted) | $ | 28,302 | $ | 46,981 | $ | 37,022 | $ | 39,958 | $ | 34,617 |
Portfolio turnover rate J | 67% | 58% | 58% | 75% | 94% |
| Fidelity Advisor® Total Emerging Markets Fund Class M |
| Years ended October 31, | 2022 | 2021 | 2020 | 2019 | 2018 | |||||
Selected Per-Share Data | ||||||||||
| Net asset value, beginning of period | $ | 15.23 | $ | 13.52 | $ | 12.78 | $ | 11.51 | $ | 13.55 |
| Income from Investment Operations | ||||||||||
Net investment income (loss) A,B | .24 | .15 | .15 | .33 C | .21 | |||||
| Net realized and unrealized gain (loss) | (5.19) | 1.67 | .88 | 1.15 | (1.93) | |||||
| Total from investment operations | (4.95) | 1.82 | 1.03 | 1.48 | (1.72) | |||||
| Distributions from net investment income | (.21) | (.11) | (.29) | (.21) | (.13) | |||||
| Distributions from net realized gain | - | - | - | - | (.19) | |||||
| Total distributions | (.21) | (.11) | (.29) | (.21) | (.32) | |||||
Redemption fees added to paid in capital A | - | - | - | - | - D | |||||
| Net asset value, end of period | $ | 10.07 | $ | 15.23 | $ | 13.52 | $ | 12.78 | $ | 11.51 |
Total Return E,F | (32.92)% | 13.47% | 8.16% | 13.05% | (13.03)% | |||||
Ratios to Average Net Assets B,G,H | ||||||||||
| Expenses before reductions | 1.69% | 1.66% | 1.71% | 1.72% | 1.74% | |||||
| Expenses net of fee waivers, if any | 1.69% | 1.66% | 1.71% | 1.71% | 1.74% | |||||
| Expenses net of all reductions | 1.69% | 1.66% | 1.69% | 1.71% | 1.71% | |||||
| Net investment income (loss) | 1.90% | .96% | 1.17% | 2.69% C | 1.58% | |||||
| Supplemental Data | ||||||||||
| Net assets, end of period (000 omitted) | $ | 6,237 | $ | 9,530 | $ | 7,885 | $ | 8,841 | $ | 8,519 |
Portfolio turnover rate I | 67% | 58% | 58% | 75% | 94% |
| Fidelity Advisor® Total Emerging Markets Fund Class C |
| Years ended October 31, | 2022 | 2021 | 2020 | 2019 | 2018 | |||||
Selected Per-Share Data | ||||||||||
| Net asset value, beginning of period | $ | 15.09 | $ | 13.41 | $ | 12.66 | $ | 11.40 | $ | 13.45 |
| Income from Investment Operations | ||||||||||
Net investment income (loss) A,B | .18 | .08 | .09 | .28 C | .15 | |||||
| Net realized and unrealized gain (loss) | (5.15) | 1.65 | .89 | 1.13 | (1.92) | |||||
| Total from investment operations | (4.97) | 1.73 | .98 | 1.41 | (1.77) | |||||
| Distributions from net investment income | (.12) | (.05) | (.23) | (.15) | (.09) | |||||
| Distributions from net realized gain | - | - | - | - | (.19) | |||||
| Total distributions | (.12) | (.05) | (.23) | (.15) | (.28) | |||||
Redemption fees added to paid in capital A | - | - | - | - | - D | |||||
| Net asset value, end of period | $ | 10.00 | $ | 15.09 | $ | 13.41 | $ | 12.66 | $ | 11.40 |
Total Return E,F | (33.17)% | 12.89% | 7.83% | 12.54% | (13.45)% | |||||
Ratios to Average Net Assets B,G,H | ||||||||||
| Expenses before reductions | 2.14% | 2.11% | 2.14% | 2.14% | 2.14% | |||||
| Expenses net of fee waivers, if any | 2.13% | 2.11% | 2.14% | 2.14% | 2.14% | |||||
| Expenses net of all reductions | 2.13% | 2.11% | 2.12% | 2.13% | 2.12% | |||||
| Net investment income (loss) | 1.46% | .51% | .74% | 2.27% C | 1.18% | |||||
| Supplemental Data | ||||||||||
| Net assets, end of period (000 omitted) | $ | 13,469 | $ | 27,673 | $ | 28,884 | $ | 35,545 | $ | 37,191 |
Portfolio turnover rate I | 67% | 58% | 58% | 75% | 94% |
| Fidelity® Total Emerging Markets Fund |
| Years ended October 31, | 2022 | 2021 | 2020 | 2019 | 2018 | |||||
Selected Per-Share Data | ||||||||||
| Net asset value, beginning of period | $ | 15.31 | $ | 13.59 | $ | 12.84 | $ | 11.56 | $ | 13.58 |
| Income from Investment Operations | ||||||||||
Net investment income (loss) A,B | .32 | .24 | .22 | .40 C | .29 | |||||
| Net realized and unrealized gain (loss) | (5.21) | 1.67 | .90 | 1.16 | (1.95) | |||||
| Total from investment operations | (4.89) | 1.91 | 1.12 | 1.56 | (1.66) | |||||
| Distributions from net investment income | (.30) | (.19) | (.37) | (.28) | (.17) | |||||
| Distributions from net realized gain | - | - | - | - | (.19) | |||||
| Total distributions | (.30) | (.19) | (.37) | (.28) | (.36) | |||||
Redemption fees added to paid in capital A | - | - | - | - | - D | |||||
| Net asset value, end of period | $ | 10.12 | $ | 15.31 | $ | 13.59 | $ | 12.84 | $ | 11.56 |
Total Return E | (32.52)% | 14.06% | 8.79% | 13.80% | (12.56)% | |||||
Ratios to Average Net Assets B,F,G | ||||||||||
| Expenses before reductions | 1.12% | 1.11% | 1.16% | 1.14% | 1.13% | |||||
| Expenses net of fee waivers, if any | 1.11% | 1.11% | 1.15% | 1.14% | 1.13% | |||||
| Expenses net of all reductions | 1.11% | 1.11% | 1.14% | 1.14% | 1.11% | |||||
| Net investment income (loss) | 2.48% | 1.51% | 1.73% | 3.27% C | 2.19% | |||||
| Supplemental Data | ||||||||||
| Net assets, end of period (000 omitted) | $ | 91,615 | $ | 259,331 | $ | 205,009 | $ | 199,708 | $ | 190,025 |
Portfolio turnover rate H | 67% | 58% | 58% | 75% | 94% |
| Fidelity Advisor® Total Emerging Markets Fund Class I |
| Years ended October 31, | 2022 | 2021 | 2020 | 2019 | 2018 | |||||
Selected Per-Share Data | ||||||||||
| Net asset value, beginning of period | $ | 15.29 | $ | 13.57 | $ | 12.82 | $ | 11.55 | $ | 13.58 |
| Income from Investment Operations | ||||||||||
Net investment income (loss) A,B | .32 | .24 | .22 | .41 C | .29 | |||||
| Net realized and unrealized gain (loss) | (5.20) | 1.67 | .90 | 1.14 | (1.95) | |||||
| Total from investment operations | (4.88) | 1.91 | 1.12 | 1.55 | (1.66) | |||||
| Distributions from net investment income | (.30) | (.19) | (.37) | (.28) | (.19) | |||||
| Distributions from net realized gain | - | - | - | - | (.19) | |||||
| Total distributions | (.30) | (.19) | (.37) | (.28) | (.37) D | |||||
Redemption fees added to paid in capital A | - | - | - | - | - E | |||||
| Net asset value, end of period | $ | 10.11 | $ | 15.29 | $ | 13.57 | $ | 12.82 | $ | 11.55 |
Total Return F | (32.50)% | 14.10% | 8.85% | 13.77% | (12.56)% | |||||
Ratios to Average Net Assets B,G,H | ||||||||||
| Expenses before reductions | 1.10% | 1.09% | 1.11% | 1.11% | 1.12% | |||||
| Expenses net of fee waivers, if any | 1.10% | 1.08% | 1.10% | 1.10% | 1.12% | |||||
| Expenses net of all reductions | 1.10% | 1.08% | 1.09% | 1.10% | 1.10% | |||||
| Net investment income (loss) | 2.49% | 1.54% | 1.78% | 3.30% C | 2.20% | |||||
| Supplemental Data | ||||||||||
| Net assets, end of period (000 omitted) | $ | 98,727 | $ | 209,635 | $ | 232,450 | $ | 372,286 | $ | 341,720 |
Portfolio turnover rate I | 67% | 58% | 58% | 75% | 94% |
| Fidelity Advisor® Total Emerging Markets Fund Class Z |
| Years ended October 31, | 2022 | 2021 | 2020 | 2019 | 2018 A | |||||
Selected Per-Share Data | ||||||||||
| Net asset value, beginning of period | $ | 15.26 | $ | 13.55 | $ | 12.80 | $ | 11.55 | $ | 12.17 |
| Income from Investment Operations | ||||||||||
Net investment income (loss) B,C | .34 | .26 | .24 | .43 D | .01 | |||||
| Net realized and unrealized gain (loss) | (5.19) | 1.66 | .90 | 1.13 | (.63) | |||||
| Total from investment operations | (4.85) | 1.92 | 1.14 | 1.56 | (.62) | |||||
| Distributions from net investment income | (.32) | (.21) | (.39) | (.31) | - | |||||
| Total distributions | (.32) | (.21) | (.39) | (.31) | - | |||||
| Net asset value, end of period | $ | 10.09 | $ | 15.26 | $ | 13.55 | $ | 12.80 | $ | 11.55 |
Total Return E,F | (32.40)% | 14.21% | 9.03% | 13.85% | (5.09)% | |||||
Ratios to Average Net Assets C,G,H | ||||||||||
| Expenses before reductions | .97% | .96% | .98% | .98% | 1.07% I | |||||
| Expenses net of fee waivers, if any | .97% | .96% | .98% | .97% | 1.04% I | |||||
| Expenses net of all reductions | .97% | .96% | .96% | .97% | 1.02% I | |||||
| Net investment income (loss) | 2.62% | 1.66% | 1.91% | 3.43% D | 1.51% I | |||||
| Supplemental Data | ||||||||||
| Net assets, end of period (000 omitted) | $ | 13,909 | $ | 68,119 | $ | 56,395 | $ | 61,175 | $ | 1,603 |
Portfolio turnover rate J | 67% | 58% | 58% | 75% | 94% |
| Fidelity Central Fund | Investment Manager | Investment Objective | Investment Practices | Expense Ratio A |
| Fidelity Money Market Central Funds | Fidelity Management & Research Company LLC (FMR) | Each fund seeks to obtain a high level of current income consistent with the preservation of capital and liquidity. | Short-term Investments | Less than .005% |
| Gross unrealized appreciation | $33,850,495 |
| Gross unrealized depreciation | (86,292,320) |
| Net unrealized appreciation (depreciation) | $(52,441,825) |
| Tax Cost | $304,115,668 |
| Undistributed ordinary income | $5,559,373 |
| Capital loss carryforward | $(29,016,054) |
| Net unrealized appreciation (depreciation) on securities and other investments | $(52,524,188) |
| Short-term | $(29,016,054) |
| Long-term | - |
| Total capital loss carryforward | $(29,016,054) |
| October 31, 2022 | October 31, 2021 | |
| Ordinary Income | $11,768,448 | $7,490,574 |
| Equity Risk | Equity risk relates to the fluctuations in the value of financial instruments as a result of changes in market prices (other than those arising from interest rate risk or foreign exchange risk), whether caused by factors specific to an individual investment, its issuer, or all factors affecting all instruments traded in a market or market segment. |
| Purchases ($) | Sales ($) | |
| Fidelity Total Emerging Markets Fund | 287,761,208 | 456,188,153 |
| Distribution Fee | Service Fee | Total Fees | Retained by FDC | |
| Class A | - % | .25% | $93,509 | $1,200 |
| Class M | .25% | .25% | 38,760 | 30 |
| Class C | .75% | .25% | 203,099 | 15,139 |
| $335,368 | $16,369 |
| Retained by FDC | |
| Class A | $15,715 |
| Class M | 1,721 |
Class C A | 123 |
| $17,559 |
| Amount | % of Class-Level Average Net Assets | |
| Class A | $76,531 | .20 |
| Class M | 20,159 | .26 |
| Class C | 40,872 | .20 |
| Total Emerging Markets | 344,796 | .18 |
| Class I | 255,850 | .17 |
| Class Z | 16,870 | .04 |
| $755,078 |
| % of Average Net Assets | |
| Fidelity Total Emerging Markets Fund | .05 |
| Amount | |
| Fidelity Total Emerging Markets Fund | $1,823 |
| Borrower or Lender | Average Loan Balance | Weighted Average Interest Rate | Interest Expense | |
Fidelity Total Emerging Markets Fund | Borrower | $5,421,500 | .66% | $3,772 |
| Purchases ($) | Sales ($) | Realized Gain (Loss) ($) | |
| Fidelity Total Emerging Markets Fund | 4,580,169 | 34,971,561 | (4,324,193) |
| Amount | |
| Fidelity Total Emerging Markets Fund | $823 |
| Total Security Lending Fees Paid to NFS | Security Lending Income From Securities Loaned to NFS | Value of Securities Loaned to NFS at Period End | |
| Fidelity Total Emerging Markets Fund | $2,272 | $- | $- |
| Average Loan Balance | Weighted Average Interest Rate | Interest Expense | |
| Fidelity Total Emerging Markets Fund | $3,426,250 | 1.22% | $465 |
Year ended October 31, 2022 | Year ended October 31, 2021 | |
| Fidelity Total Emerging Markets Fund | ||
| Distributions to shareholders | ||
| Class A | $783,324 | $422,903 |
| Class M | 128,984 | 63,392 |
| Class C | 226,893 | 106,573 |
| Total Emerging Markets | 5,176,420 | 2,785,749 |
| Class I | 4,027,359 | 3,208,654 |
| Class Z | 1,425,468 | 903,303 |
Total | $11,768,448 | $7,490,574 |
| Shares | Shares | Dollars | Dollars | |
| Year ended October 31, 2022 | Year ended October 31, 2021 | Year ended October 31, 2022 | Year ended October 31, 2021 | |
| Fidelity Total Emerging Markets Fund | ||||
| Class A | ||||
| Shares sold | 539,278 | 834,490 | $6,972,605 | $13,192,973 |
| Reinvestment of distributions | 54,325 | 27,836 | 781,197 | 420,606 |
| Shares redeemed | (867,088) | (515,577) | (10,923,910) | (8,058,282) |
| Net increase (decrease) | (273,485) | 346,749 | $(3,170,108) | $5,555,297 |
| Class M | ||||
| Shares sold | 68,332 | 121,390 | $870,856 | $1,929,827 |
| Reinvestment of distributions | 8,958 | 4,191 | 128,908 | 63,329 |
| Shares redeemed | (83,685) | (82,865) | (1,103,957) | (1,301,485) |
| Net increase (decrease) | (6,395) | 42,716 | $(104,193) | $691,671 |
| Class C | ||||
| Shares sold | 172,996 | 359,452 | $2,372,908 | $5,590,331 |
| Reinvestment of distributions | 15,806 | 7,086 | 226,656 | 106,573 |
| Shares redeemed | (675,110) | (687,261) | (8,531,245) | (10,684,440) |
| Net increase (decrease) | (486,308) | (320,723) | $(5,931,681) | $(4,987,536) |
| Total Emerging Markets | ||||
| Shares sold | 20,327,420 | 10,790,055 | $276,182,533 | $167,466,754 |
| Reinvestment of distributions | 196,824 | 142,523 | 2,832,302 | 2,154,942 |
| Shares redeemed | (28,410,344) | (9,079,050) | (367,959,039) | (141,937,844) |
| Net increase (decrease) | (7,886,100) | 1,853,528 | $(88,944,204) | $27,683,852 |
| Class I | ||||
| Shares sold | 1,916,908 | 4,228,136 | $ 24,629,924 | $67,215,923 |
| Reinvestment of distributions | 276,622 | 209,572 | 3,975,058 | 3,164,533 |
| Shares redeemed | (6,138,529) | (7,854,786) | (76,056,229) | (124,620,710) |
| Net increase (decrease) | (3,944,999) | (3,417,078) | $(47,451,247) | $(54,240,254) |
| Class Z | ||||
| Shares sold | 486,703 | 1,815,321 | $6,448,746 | $28,671,066 |
| Reinvestment of distributions | 72,407 | 42,495 | 1,036,865 | 639,553 |
| Shares redeemed | (3,644,178) | (1,556,785) | (44,306,364) | (24,723,859) |
| Net increase (decrease) | (3,085,068) | 301,031 | $(36,820,753) | $4,586,760 |
| The Example is based on an investment of $1,000 invested at the beginning of the period and held for the entire period (May 1, 2022 to October 31, 2022). |
Annualized Expense Ratio- A | Beginning Account Value May 1, 2022 | Ending Account Value October 31, 2022 | Expenses Paid During Period- C May 1, 2022 to October 31, 2022 | |||||||
| Fidelity® Emerging Markets Discovery Fund | ||||||||||
| Class A | 1.44% | |||||||||
| Actual | $ 1,000 | $ 895.80 | $ 6.88 | |||||||
Hypothetical- B | $ 1,000 | $ 1,017.95 | $ 7.32 | |||||||
| Class M | 1.70% | |||||||||
| Actual | $ 1,000 | $ 894.80 | $ 8.12 | |||||||
Hypothetical- B | $ 1,000 | $ 1,016.64 | $ 8.64 | |||||||
| Class C | 2.19% | |||||||||
| Actual | $ 1,000 | $ 892.00 | $ 10.44 | |||||||
Hypothetical- B | $ 1,000 | $ 1,014.17 | $ 11.12 | |||||||
| Fidelity® Emerging Markets Discovery Fund | 1.15% | |||||||||
| Actual | $ 1,000 | $ 897.00 | $ 5.50 | |||||||
Hypothetical- B | $ 1,000 | $ 1,019.41 | $ 5.85 | |||||||
| Class I | 1.16% | |||||||||
| Actual | $ 1,000 | $ 897.40 | $ 5.55 | |||||||
Hypothetical- B | $ 1,000 | $ 1,019.36 | $ 5.90 | |||||||
| Class Z | 1.00% | |||||||||
| Actual | $ 1,000 | $ 897.80 | $ 4.78 | |||||||
Hypothetical- B | $ 1,000 | $ 1,020.16 | $ 5.09 | |||||||
| Fidelity® Total Emerging Markets Fund | ||||||||||
| Class A | 1.40% | |||||||||
| Actual | $ 1,000 | $ 838.70 | $ 6.49 | |||||||
Hypothetical- B | $ 1,000 | $ 1,018.15 | $ 7.12 | |||||||
| Class M | 1.71% | |||||||||
| Actual | $ 1,000 | $ 837.80 | $ 7.92 | |||||||
Hypothetical- B | $ 1,000 | $ 1,016.59 | $ 8.69 | |||||||
| Class C | 2.15% | |||||||||
| Actual | $ 1,000 | $ 836.10 | $ 9.95 | |||||||
Hypothetical- B | $ 1,000 | $ 1,014.37 | $ 10.92 | |||||||
| Fidelity® Total Emerging Markets Fund | 1.14% | |||||||||
| Actual | $ 1,000 | $ 840.50 | $ 5.29 | |||||||
Hypothetical- B | $ 1,000 | $ 1,019.46 | $ 5.80 | |||||||
| Class I | 1.11% | |||||||||
| Actual | $ 1,000 | $ 840.40 | $ 5.15 | |||||||
Hypothetical- B | $ 1,000 | $ 1,019.61 | $ 5.65 | |||||||
| Class Z | .98% | |||||||||
| Actual | $ 1,000 | $ 840.80 | $ 4.55 | |||||||
Hypothetical- B | $ 1,000 | $ 1,020.27 | $ 4.99 | |||||||
| Class A | Class M | Class C | Retail Class | Class I | Class Z | |
| Fidelity Emerging Markets Discovery Fund | ||||||
| December 2021 | 0% | 0% | 0% | 0% | 0% | 0% |
| Fidelity Total Emerging Markets Fund | ||||||
| December 2021 | 0% | 0% | 1% | 0% | 0% | 0% |
| Class A | Class M | Class C | Retail Class | Class I | Class Z | |
| Fidelity Emerging Markets Discovery Fund | ||||||
| December 2021 | 67% | 76% | 100% | 60% | 60% | 57% |
| Fidelity Total Emerging Markets Fund | ||||||
| December 2021 | 69% | 83% | 100% | 60% | 60% | 57% |
| Fidelity Total Emerging Markets Fund | $2,572,860 |
| Pay Date | Income | Taxes | |
| Fidelity Emerging Markets Discovery Fund | |||
| Class A | 12/06/21 | $0.4054 | $0.0404 |
| Class M | 12/06/21 | $0.3584 | $0.0404 |
| Class C | 12/06/21 | $0.2374 | $0.0404 |
| Emerging Markets Discovery | 12/06/21 | $0.4554 | $0.0404 |
| Class I | 12/06/21 | $0.4514 | $0.0404 |
| Class Z | 12/06/21 | $0.4794 | $0.0404 |
| Fidelity Total Emerging Markets Fund | |||
| Class A | 12/06/21 | $0.2886 | $0.0306 |
| Class M | 12/06/21 | $0.2406 | $0.0306 |
| Class C | 12/06/21 | $0.1526 | $0.0306 |
| Total Emerging Markets | 12/06/21 | $0.3316 | $0.0306 |
| Class I | 12/06/21 | $0.3296 | $0.0306 |
| Class Z | 12/06/21 | $0.3516 | $0.0306 |
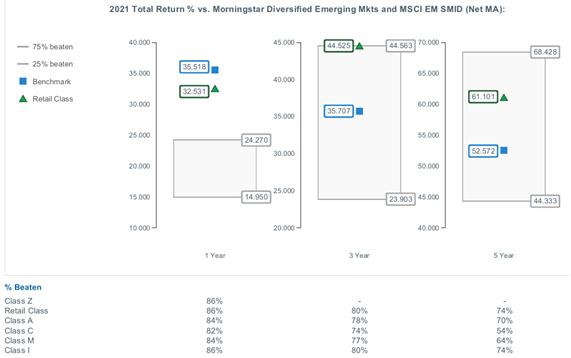
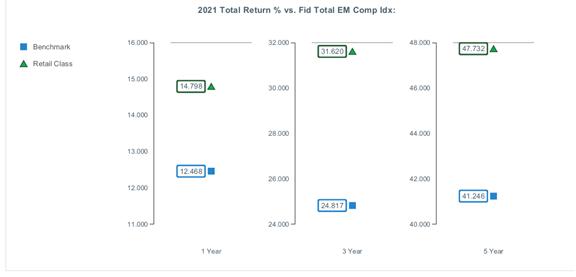
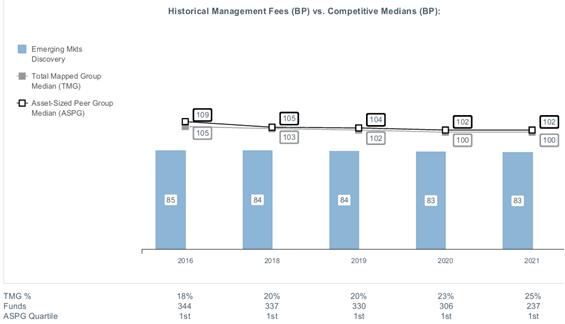
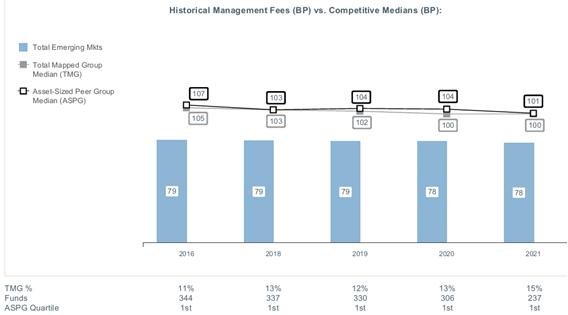
|


Contents
| $10,000 Over Life of Fund |
Let's say hypothetically that $10,000 was invested in Fidelity® Sustainable International Equity Fund, a class of the fund, on February 10, 2022, when the fund started. The chart shows how the value of your investment would have changed, and also shows how the MSCI EAFE Index performed over the same period. |
 |
Top Holdings (% of Fund's net assets) | ||
| Roche Holding AG (participation certificate) (Switzerland, Pharmaceuticals) | 4.0 | |
| AstraZeneca PLC (United Kingdom) (United Kingdom, Pharmaceuticals) | 3.9 | |
| Nestle SA (Reg. S) (Switzerland, Food Products) | 3.9 | |
| ORIX Corp. (Japan, Diversified Financial Services) | 3.2 | |
| Sony Group Corp. (Japan, Household Durables) | 3.2 | |
| LVMH Moet Hennessy Louis Vuitton SE (France, Textiles, Apparel & Luxury Goods) | 2.4 | |
| AIA Group Ltd. (Hong Kong, Insurance) | 2.3 | |
| HDFC Bank Ltd. sponsored ADR (India, Banks) | 2.3 | |
| ASML Holding NV (Netherlands) (Netherlands, Semiconductors & Semiconductor Equipment) | 2.2 | |
| Hitachi Ltd. (Japan, Industrial Conglomerates) | 2.1 | |
| 29.5 | ||
| Market Sectors (% of Fund's net assets) | ||
| Financials | 19.1 | |
| Health Care | 15.4 | |
| Industrials | 12.6 | |
| Information Technology | 11.8 | |
| Consumer Staples | 11.1 | |
| Consumer Discretionary | 10.2 | |
| Materials | 7.1 | |
| Utilities | 4.4 | |
| Communication Services | 2.4 | |
| Energy | 1.6 | |
| Real Estate | 0.7 | |
Asset Allocation (% of Fund's net assets) |
 |
Foreign investments - 96.2% |
Geographic Diversification (% of Fund's net assets) |
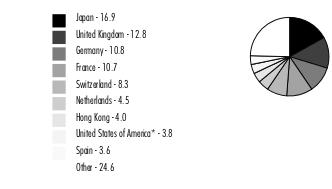 |
* Includes Short-Term investments and Net Other Assets (Liabilities). Percentages are based on country or territory of incorporation and are adjusted for the effect of futures contracts, if applicable. |
| Common Stocks - 96.4% | |||
| Shares | Value ($) | ||
| Australia - 0.8% | |||
| Bapcor Ltd. | 9,361 | 39,639 | |
| Austria - 1.9% | |||
| Verbund AG | 849 | 66,493 | |
| Wienerberger AG | 1,062 | 24,286 | |
TOTAL AUSTRIA | 90,779 | ||
| Bailiwick of Jersey - 0.3% | |||
| Experian PLC | 1 | 32 | |
| Ferguson PLC | 139 | 15,159 | |
TOTAL BAILIWICK OF JERSEY | 15,191 | ||
| Belgium - 1.7% | |||
| KBC Group NV | 410 | 20,547 | |
| UCB SA | 819 | 61,772 | |
TOTAL BELGIUM | 82,319 | ||
| Canada - 2.1% | |||
| Nutrien Ltd. | 741 | 62,610 | |
| The Toronto-Dominion Bank | 632 | 40,448 | |
TOTAL CANADA | 103,058 | ||
| Denmark - 1.1% | |||
| ORSTED A/S (a) | 664 | 54,784 | |
| Finland - 1.6% | |||
| Neste OYJ | 1,767 | 77,428 | |
| France - 10.7% | |||
| Air Liquide SA | 393 | 51,410 | |
| AXA SA | 3,328 | 82,185 | |
| BNP Paribas SA | 1,283 | 60,165 | |
| Capgemini SA | 343 | 56,215 | |
| Edenred SA | 477 | 24,494 | |
| L'Oreal SA | 86 | 27,004 | |
| LVMH Moet Hennessy Louis Vuitton SE | 186 | 117,365 | |
| Pernod Ricard SA | 435 | 76,391 | |
| Worldline SA (a)(b) | 484 | 21,125 | |
TOTAL FRANCE | 516,354 | ||
| Germany - 10.8% | |||
| Brenntag SE | 482 | 29,246 | |
| Deutsche Borse AG | 419 | 68,138 | |
| Deutsche Post AG | 1,696 | 59,953 | |
| Linde PLC | 278 | 83,148 | |
| Merck KGaA | 614 | 100,061 | |
| Muenchener Rueckversicherungs-Gesellschaft AG in Muenchen | 172 | 45,404 | |
| Puma AG | 432 | 19,130 | |
| SAP SE | 230 | 22,138 | |
| Siemens AG | 868 | 94,793 | |
TOTAL GERMANY | 522,011 | ||
| Hong Kong - 4.0% | |||
| AIA Group Ltd. | 14,824 | 112,289 | |
| Chervon Holdings Ltd. | 5,837 | 19,668 | |
| Hang Seng Bank Ltd. | 4,291 | 60,408 | |
TOTAL HONG KONG | 192,365 | ||
| India - 2.3% | |||
| HDFC Bank Ltd. sponsored ADR | 1,739 | 108,357 | |
| Ireland - 2.2% | |||
| CRH PLC | 1,394 | 50,076 | |
| Dalata Hotel Group PLC (b) | 13,246 | 42,478 | |
| Kerry Group PLC Class A | 134 | 11,653 | |
TOTAL IRELAND | 104,207 | ||
| Italy - 0.6% | |||
| Carel Industries SpA (a) | 1,347 | 29,352 | |
| Japan - 16.9% | |||
| FUJIFILM Holdings Corp. | 1,715 | 78,648 | |
| Fujitsu Ltd. | 327 | 37,624 | |
| Hitachi Ltd. | 2,227 | 101,244 | |
| Hoya Corp. | 1,007 | 93,965 | |
| Itochu Corp. | 3,170 | 82,056 | |
| Nomura Research Institute Ltd. | 1,487 | 33,051 | |
| ORIX Corp. | 10,576 | 155,409 | |
| Persol Holdings Co. Ltd. | 2,615 | 52,513 | |
| Sony Group Corp. | 2,265 | 152,740 | |
| TIS, Inc. | 883 | 23,842 | |
TOTAL JAPAN | 811,092 | ||
| Kenya - 0.6% | |||
| Safaricom Ltd. | 135,294 | 27,984 | |
| Netherlands - 4.5% | |||
| ASML Holding NV (Netherlands) | 224 | 105,076 | |
| Heineken NV (Bearer) | 586 | 48,993 | |
| Koninklijke KPN NV | 22,640 | 63,326 | |
TOTAL NETHERLANDS | 217,395 | ||
| New Zealand - 1.9% | |||
| EBOS Group Ltd. | 3,120 | 68,024 | |
| Ryman Healthcare Ltd. | 4,975 | 24,239 | |
TOTAL NEW ZEALAND | 92,263 | ||
| Norway - 1.6% | |||
| DNB Bank ASA | 3,959 | 70,022 | |
| Schibsted ASA (A Shares) | 612 | 9,425 | |
TOTAL NORWAY | 79,447 | ||
| Singapore - 0.9% | |||
| United Overseas Bank Ltd. | 2,103 | 41,240 | |
| Spain - 3.6% | |||
| Amadeus IT Holding SA Class A (b) | 1,327 | 69,210 | |
| Cellnex Telecom SA (a) | 458 | 14,990 | |
| EDP Renovaveis SA | 1,602 | 33,737 | |
| Iberdrola SA | 5,488 | 55,809 | |
TOTAL SPAIN | 173,746 | ||
| Sweden - 3.5% | |||
| Boliden AB | 2,537 | 73,896 | |
| Instalco AB | 3,014 | 12,070 | |
| Investor AB (B Shares) | 1,516 | 24,764 | |
| Lagercrantz Group AB (B Shares) | 1,618 | 13,885 | |
| Nibe Industrier AB (B Shares) | 5,519 | 44,037 | |
TOTAL SWEDEN | 168,652 | ||
| Switzerland - 8.3% | |||
| Nestle SA (Reg. S) | 1,708 | 185,931 | |
| Roche Holding AG (participation certificate) | 585 | 194,104 | |
| SGS SA (Reg.) | 9 | 19,841 | |
TOTAL SWITZERLAND | 399,876 | ||
| Taiwan - 1.5% | |||
| Taiwan Semiconductor Manufacturing Co. Ltd. | 5,901 | 70,874 | |
| United Kingdom - 12.8% | |||
| AstraZeneca PLC (United Kingdom) | 1,587 | 186,206 | |
| Beazley PLC | 4,090 | 29,292 | |
| Big Yellow Group PLC | 1,224 | 15,805 | |
| Bunzl PLC | 798 | 25,999 | |
| Compass Group PLC | 4,768 | 100,423 | |
| Dechra Pharmaceuticals PLC | 377 | 11,327 | |
| Diageo PLC | 2,116 | 87,079 | |
| Grainger Trust PLC | 7,402 | 19,269 | |
| Impax Asset Management Group PLC | 1,363 | 10,473 | |
| Reckitt Benckiser Group PLC | 1,388 | 92,113 | |
| Renewi PLC (b) | 2,075 | 12,588 | |
| Smart Metering Systems PLC | 2,900 | 24,344 | |
TOTAL UNITED KINGDOM | 614,918 | ||
| United States of America - 0.2% | |||
| Mobileye Global, Inc. (b) | 300 | 7,914 | |
| TOTAL COMMON STOCKS (Cost $5,302,197) | 4,641,245 | ||
| Money Market Funds - 4.7% | |||
| Shares | Value ($) | ||
Fidelity Cash Central Fund 3.10% (c) (Cost $225,629) | 225,584 | 225,629 | |
| TOTAL INVESTMENT IN SECURITIES - 101.1% (Cost $5,527,826) | 4,866,874 |
NET OTHER ASSETS (LIABILITIES) - (1.1)% | (54,943) |
| NET ASSETS - 100.0% | 4,811,931 |
| (a) | Security exempt from registration under Rule 144A of the Securities Act of 1933. These securities may be resold in transactions exempt from registration, normally to qualified institutional buyers. At the end of the period, the value of these securities amounted to $120,251 or 2.5% of net assets. |
| (b) | Non-income producing |
| (c) | Affiliated fund that is generally available only to investment companies and other accounts managed by Fidelity Investments. The rate quoted is the annualized seven-day yield of the fund at period end. A complete unaudited listing of the fund's holdings as of its most recent quarter end is available upon request. In addition, each Fidelity Central Fund's financial statements, which are not covered by the Fund's Report of Independent Registered Public Accounting Firm, are available on the SEC's website or upon request. |
| Affiliate | Value, beginning of period ($) | Purchases ($) | Sales Proceeds ($) | Dividend Income ($) | Realized Gain (loss) ($) | Change in Unrealized appreciation (depreciation) ($) | Value, end of period ($) | % ownership, end of period |
| Fidelity Cash Central Fund 3.10% | - | 5,441,117 | 5,215,488 | 2,079 | - | - | 225,629 | 0.0% |
| Total | - | 5,441,117 | 5,215,488 | 2,079 | - | - | 225,629 | |
| Valuation Inputs at Reporting Date: | ||||
| Description | Total ($) | Level 1 ($) | Level 2 ($) | Level 3 ($) |
Investments in Securities: | ||||
| Equities: | ||||
Communication Services | 115,725 | 37,409 | 78,316 | - |
Consumer Discretionary | 491,443 | 120,915 | 370,528 | - |
Consumer Staples | 529,164 | 137,037 | 392,127 | - |
Energy | 77,428 | 77,428 | - | - |
Financials | 929,141 | 409,983 | 519,158 | - |
Health Care | 739,698 | 259,327 | 480,371 | - |
Industrials | 603,227 | 399,362 | 203,865 | - |
Information Technology | 564,096 | 181,834 | 382,262 | - |
Materials | 345,426 | 243,940 | 101,486 | - |
Real Estate | 35,074 | 35,074 | - | - |
Utilities | 210,823 | 100,230 | 110,593 | - |
| Money Market Funds | 225,629 | 225,629 | - | - |
| Total Investments in Securities: | 4,866,874 | 2,228,168 | 2,638,706 | - |
| Statement of Assets and Liabilities | ||||
| October 31, 2022 | ||||
| Assets | ||||
| Investment in securities, at value - See accompanying schedule: | ||||
Unaffiliated issuers (cost $5,302,197) | $4,641,245 | |||
Fidelity Central Funds (cost $225,629) | 225,629 | |||
| Total Investment in Securities (cost $5,527,826) | $ | 4,866,874 | ||
| Cash | 580 | |||
| Foreign currency held at value (cost $283) | 283 | |||
| Receivable for investments sold | 2 | |||
| Receivable for fund shares sold | 29,227 | |||
| Dividends receivable | 7,739 | |||
| Distributions receivable from Fidelity Central Funds | 867 | |||
| Prepaid expenses | 27,278 | |||
| Receivable from investment adviser for expense reductions | 16,348 | |||
| Other receivables | 6 | |||
Total assets | 4,949,204 | |||
| Liabilities | ||||
| Payable for investments purchased | $80,203 | |||
| Payable for fund shares redeemed | 23 | |||
| Accrued management fee | 2,382 | |||
| Distribution and service plan fees payable | 258 | |||
| Other affiliated payables | 781 | |||
| Audit fee payable | 45,984 | |||
| Custody fee payable | 7,487 | |||
| Other payables and accrued expenses | 155 | |||
| Total Liabilities | 137,273 | |||
| Net Assets | $ | 4,811,931 | ||
| Net Assets consist of: | ||||
| Paid in capital | $ | 5,738,435 | ||
| Total accumulated earnings (loss) | (926,504) | |||
| Net Assets | $ | 4,811,931 | ||
| Net Asset Value and Maximum Offering Price | ||||
| Class A : | ||||
Net Asset Value and redemption price per share ($184,578 ÷ 25,633 shares) (a) | $ | 7.20 | ||
| Maximum offering price per share (100/94.25 of $7.20) | $ | 7.64 | ||
| Class M : | ||||
Net Asset Value and redemption price per share ($179,670 ÷ 25,000 shares) (a) | $ | 7.19 | ||
| Maximum offering price per share (100/96.50 of $7.19) | $ | 7.45 | ||
| Class C : | ||||
Net Asset Value and offering price per share ($179,018 ÷ 25,000 shares) (a) | $ | 7.16 | ||
| Fidelity Sustainable International Equity Fund : | ||||
Net Asset Value , offering price and redemption price per share ($3,907,806 ÷ 541,692 shares) | $ | 7.21 | ||
| Class I : | ||||
Net Asset Value , offering price and redemption price per share ($180,347 ÷ 25,000 shares) | $ | 7.21 | ||
| Class Z : | ||||
Net Asset Value , offering price and redemption price per share ($180,512 ÷ 25,000 shares) | $ | 7.22 | ||
(a)Redemption price per share is equal to net asset value less any applicable contingent deferred sales charge. | ||||
| Statement of Operations | ||||
| For the period February 10, 2022 (commencement of operations) through October 31, 2022 | ||||
| Investment Income | ||||
| Dividends | $ | 58,005 | ||
| Non-Cash dividends | 2,786 | |||
| Income from Fidelity Central Funds | 2,079 | |||
| Income before foreign taxes withheld | 62,870 | |||
| Less foreign taxes withheld | (8,225) | |||
| Total Income | 54,645 | |||
| Expenses | ||||
| Management fee | $ | 15,013 | ||
| Transfer agent fees | 3,903 | |||
| Distribution and service plan fees | 2,567 | |||
| Accounting fees and expenses | 1,120 | |||
| Custodian fees and expenses | 19,583 | |||
| Independent trustees' fees and expenses | 7 | |||
| Registration fees | 93,127 | |||
| Audit | 49,019 | |||
| Legal | 1 | |||
| Miscellaneous | 159 | |||
| Total expenses before reductions | 184,499 | |||
| Expense reductions | (159,516) | |||
| Total expenses after reductions | 24,983 | |||
| Net Investment income (loss) | 29,662 | |||
| Realized and Unrealized Gain (Loss) | ||||
| Net realized gain (loss) on: | ||||
| Investment Securities: | ||||
| Unaffiliated issuers | (291,907) | |||
| Foreign currency transactions | (3,255) | |||
| Total net realized gain (loss) | (295,162) | |||
| Change in net unrealized appreciation (depreciation) on: | ||||
| Investment Securities: | ||||
| Unaffiliated issuers | (660,952) | |||
| Assets and liabilities in foreign currencies | (145) | |||
| Total change in net unrealized appreciation (depreciation) | (661,097) | |||
| Net gain (loss) | (956,259) | |||
| Net increase (decrease) in net assets resulting from operations | $ | (926,597) | ||
| Statement of Changes in Net Assets | ||
| For the period February 10, 2022 (commencement of operations) through October 31, 2022 | ||
| Increase (Decrease) in Net Assets | ||
| Operations | ||
| Net investment income (loss) | $ | 29,662 |
| Net realized gain (loss) | (295,162) | |
| Change in net unrealized appreciation (depreciation) | (661,097) | |
| Net increase (decrease) in net assets resulting from operations | (926,597) | |
| Share transactions - net increase (decrease) | 5,738,528 | |
| Total increase (decrease) in net assets | 4,811,931 | |
| Net Assets | ||
| Beginning of period | - | |
| End of period | $ | 4,811,931 |
| Fidelity Advisor® Sustainable International Equity Fund Class A |
| Years ended October 31, | 2022 A | |
Selected Per-Share Data | ||
| Net asset value, beginning of period | $ | 10.00 |
| Income from Investment Operations | ||
Net investment income (loss) B,C | .07 | |
| Net realized and unrealized gain (loss) | (2.87) | |
| Total from investment operations | (2.80) | |
| Net asset value, end of period | $ | 7.20 |
Total Return D,E,F | (28.00)% | |
Ratios to Average Net Assets C,G,H | ||
| Expenses before reductions | 7.77% I,J | |
| Expenses net of fee waivers, if any | 1.30% J | |
| Expenses net of all reductions | 1.28% J | |
| Net investment income (loss) | 1.18% J | |
| Supplemental Data | ||
| Net assets, end of period (000 omitted) | $ | 185 |
Portfolio turnover rate K | 43% J |
| Fidelity Advisor® Sustainable International Equity Fund Class M |
| Years ended October 31, | 2022 A | |
Selected Per-Share Data | ||
| Net asset value, beginning of period | $ | 10.00 |
| Income from Investment Operations | ||
Net investment income (loss) B,C | .05 | |
| Net realized and unrealized gain (loss) | (2.86) | |
| Total from investment operations | (2.81) | |
| Net asset value, end of period | $ | 7.19 |
Total Return D,E,F | (28.10)% | |
Ratios to Average Net Assets C,G,H | ||
| Expenses before reductions | 8.02% I,J | |
| Expenses net of fee waivers, if any | 1.55% J | |
| Expenses net of all reductions | 1.55% J | |
| Net investment income (loss) | .91% J | |
| Supplemental Data | ||
| Net assets, end of period (000 omitted) | $ | 180 |
Portfolio turnover rate K | 43% J |
| Fidelity Advisor® Sustainable International Equity Fund Class C |
| Years ended October 31, | 2022 A | |
Selected Per-Share Data | ||
| Net asset value, beginning of period | $ | 10.00 |
| Income from Investment Operations | ||
Net investment income (loss) B,C | .02 | |
| Net realized and unrealized gain (loss) | (2.86) | |
| Total from investment operations | (2.84) | |
| Net asset value, end of period | $ | 7.16 |
Total Return D,E,F | (28.40)% | |
Ratios to Average Net Assets C,G,H | ||
| Expenses before reductions | 8.51% I,J | |
| Expenses net of fee waivers, if any | 2.05% J | |
| Expenses net of all reductions | 2.05% J | |
| Net investment income (loss) | .41% J | |
| Supplemental Data | ||
| Net assets, end of period (000 omitted) | $ | 179 |
Portfolio turnover rate K | 43% J |
| Fidelity® Sustainable International Equity Fund |
| Years ended October 31, | 2022 A | |
Selected Per-Share Data | ||
| Net asset value, beginning of period | $ | 10.00 |
| Income from Investment Operations | ||
Net investment income (loss) B,C | .08 | |
| Net realized and unrealized gain (loss) | (2.87) | |
| Total from investment operations | (2.79) | |
| Net asset value, end of period | $ | 7.21 |
Total Return D,E | (27.90)% | |
Ratios to Average Net Assets C,F,G | ||
| Expenses before reductions | 7.64% H,I | |
| Expenses net of fee waivers, if any | 1.05% I | |
| Expenses net of all reductions | 1.01% I | |
| Net investment income (loss) | 1.45% I | |
| Supplemental Data | ||
| Net assets, end of period (000 omitted) | $ | 3,908 |
Portfolio turnover rate J | 43% I |
| Fidelity Advisor® Sustainable International Equity Fund Class I |
| Years ended October 31, | 2022 A | |
Selected Per-Share Data | ||
| Net asset value, beginning of period | $ | 10.00 |
| Income from Investment Operations | ||
Net investment income (loss) B,C | .08 | |
| Net realized and unrealized gain (loss) | (2.87) | |
| Total from investment operations | (2.79) | |
| Net asset value, end of period | $ | 7.21 |
Total Return D,E | (27.90)% | |
Ratios to Average Net Assets C,F,G | ||
| Expenses before reductions | 7.52% H,I | |
| Expenses net of fee waivers, if any | 1.05% I | |
| Expenses net of all reductions | 1.03% I | |
| Net investment income (loss) | 1.43% I | |
| Supplemental Data | ||
| Net assets, end of period (000 omitted) | $ | 180 |
Portfolio turnover rate J | 43% I |
| Fidelity Advisor® Sustainable International Equity Fund Class Z |
| Years ended October 31, | 2022 A | |
Selected Per-Share Data | ||
| Net asset value, beginning of period | $ | 10.00 |
| Income from Investment Operations | ||
Net investment income (loss) B,C | .09 | |
| Net realized and unrealized gain (loss) | (2.87) | |
| Total from investment operations | (2.78) | |
| Net asset value, end of period | $ | 7.22 |
Total Return D,E | (27.80)% | |
Ratios to Average Net Assets C,F,G | ||
| Expenses before reductions | 7.46% H,I | |
| Expenses net of fee waivers, if any | .90% I | |
| Expenses net of all reductions | .90% I | |
| Net investment income (loss) | 1.56% I | |
| Supplemental Data | ||
| Net assets, end of period (000 omitted) | $ | 181 |
Portfolio turnover rate J | 43% I |
| Fidelity Central Fund | Investment Manager | Investment Objective | Investment Practices | Expense Ratio A |
| Fidelity Money Market Central Funds | Fidelity Management & Research Company LLC (FMR) | Each fund seeks to obtain a high level of current income consistent with the preservation of capital and liquidity. | Short-term Investments | Less than .005% |
| Gross unrealized appreciation | $62,252 |
| Gross unrealized depreciation | (781,832) |
| Net unrealized appreciation (depreciation) | $(719,580) |
| Tax Cost | $5,586,454 |
| Undistributed ordinary income | $28,011 |
| Capital loss carryforward | $(234,791) |
| Net unrealized appreciation (depreciation) on securities and other investments | $(719,725) |
Short-term | $(234,791) |
| Purchases ($) | Sales ($) | |
| Fidelity Sustainable International Equity Fund | 6,535,131 | 940,645 |
| Distribution Fee | Service Fee | Total Fees | Retained by FDC | |
| Class A | - % | .25% | $369 | $367 |
| Class M | .25% | .25% | 734 | 734 |
| Class C | .75% | .25% | 1,464 | 1,464 |
| $2,567 | $2,565 |
| Amount | % of Class-Level Average Net Assets A | |
| Class A | $153 | .10 |
| Class M | 142 | .10 |
| Class C | 142 | .10 |
| Fidelity Sustainable International Equity Fund | 3,256 | .22 |
| Class I | 149 | .10 |
| Class Z | 61 | .04 |
| $3,903 | ||
| % of Average Net Assets | |
| Fidelity Sustainable International Equity Fund | .05 |
| Purchases ($) | Sales ($) | Realized Gain (Loss) ($) | |
| Fidelity Sustainable International Equity Fund | 281,039 | 63,299 | (12,497) |
| Amount | |
| Fidelity Sustainable International Equity Fund | $3 |
| Expense Limitations | Reimbursement | |
| Class A | 1.30% | $11,086 |
| Class M | 1.55% | 11,015 |
| Class C | 2.05% | 10,996 |
| Fidelity Sustainable International Equity Fund | 1.05% | 103,437 |
| Class I | 1.05% | 11,058 |
| Class Z | .90% | 11,180 |
| $158,772 |
| Expense reduction | |
| Class A | $29 |
| Fidelity Sustainable International Equity Fund | 571 |
| Class I | 29 |
| $629 |
| Shares | Dollars | |
Year ended October 31, 2022 A | Year ended October 31, 2022 A | |
| Fidelity Sustainable International Equity Fund | ||
| Class A | ||
| Shares sold | 25,690 | $255,541 |
| Shares redeemed | (57) | (435) |
| Net increase (decrease) | 25,633 | $255,106 |
| Class M | ||
| Shares sold | 25,000 | $ 250,003 |
| Net increase (decrease) | 25,000 | $250,003 |
| Class C | ||
| Shares sold | 25,000 | $ 250,000 |
| Net increase (decrease) | 25,000 | $250,000 |
| Fidelity Sustainable International Equity Fund | ||
| Shares sold | 564,957 | $ 4,670,389 |
| Shares redeemed | (23,265) | (187,070) |
| Net increase (decrease) | 541,692 | $4,483,319 |
| Class I | ||
| Shares sold | 25,054 | $250,509 |
| Shares redeemed | (54) | (409) |
| Net increase (decrease) | 25,000 | $250,100 |
| Class Z | ||
| Shares sold | 25,000 | $ 250,000 |
| Net increase (decrease) | 25,000 | $250,000 |
| Fund | Affiliated % |
Fidelity Sustainable International Equity Fund | 30% |
| Fidelity Sustainable Multi-Asset Fund | |
| Fidelity Sustainable International Equity Fund | 21% |
| The Example is based on an investment of $1,000 invested at the beginning of the period and held for the entire period (May 1, 2022 to October 31, 2022). |
Annualized Expense Ratio- A | Beginning Account Value May 1, 2022 | Ending Account Value October 31, 2022 | Expenses Paid During Period- C May 1, 2022 to October 31, 2022 | |||||||
| Fidelity® Sustainable International Equity Fund | ||||||||||
| Class A | 1.30% | |||||||||
| Actual | $ 1,000 | $ 847.10 | $ 6.05 | |||||||
Hypothetical- B | $ 1,000 | $ 1,018.65 | $ 6.61 | |||||||
| Class M | 1.55% | |||||||||
| Actual | $ 1,000 | $ 846.90 | $ 7.22 | |||||||
Hypothetical- B | $ 1,000 | $ 1,017.39 | $ 7.88 | |||||||
| Class C | 2.05% | |||||||||
| Actual | $ 1,000 | $ 844.30 | $ 9.53 | |||||||
Hypothetical- B | $ 1,000 | $ 1,014.87 | $ 10.41 | |||||||
| Fidelity® Sustainable International Equity Fund | 1.05% | |||||||||
| Actual | $ 1,000 | $ 848.20 | $ 4.89 | |||||||
Hypothetical- B | $ 1,000 | $ 1,019.91 | $ 5.35 | |||||||
| Class I | 1.05% | |||||||||
| Actual | $ 1,000 | $ 848.20 | $ 4.89 | |||||||
Hypothetical- B | $ 1,000 | $ 1,019.91 | $ 5.35 | |||||||
| Class Z | .90% | |||||||||
| Actual | $ 1,000 | $ 848.40 | $ 4.19 | |||||||
Hypothetical- B | $ 1,000 | $ 1,020.67 | $ 4.58 | |||||||
|


Contents
| $10,000 Over Life of Fund |
Let's say hypothetically that $10,000 was invested in Fidelity SAI Sustainable International Equity Fund, on April 14, 2022, when the fund started. The chart shows how the value of your investment would have changed, and also shows how the MSCI EAFE Index performed over the same period. |
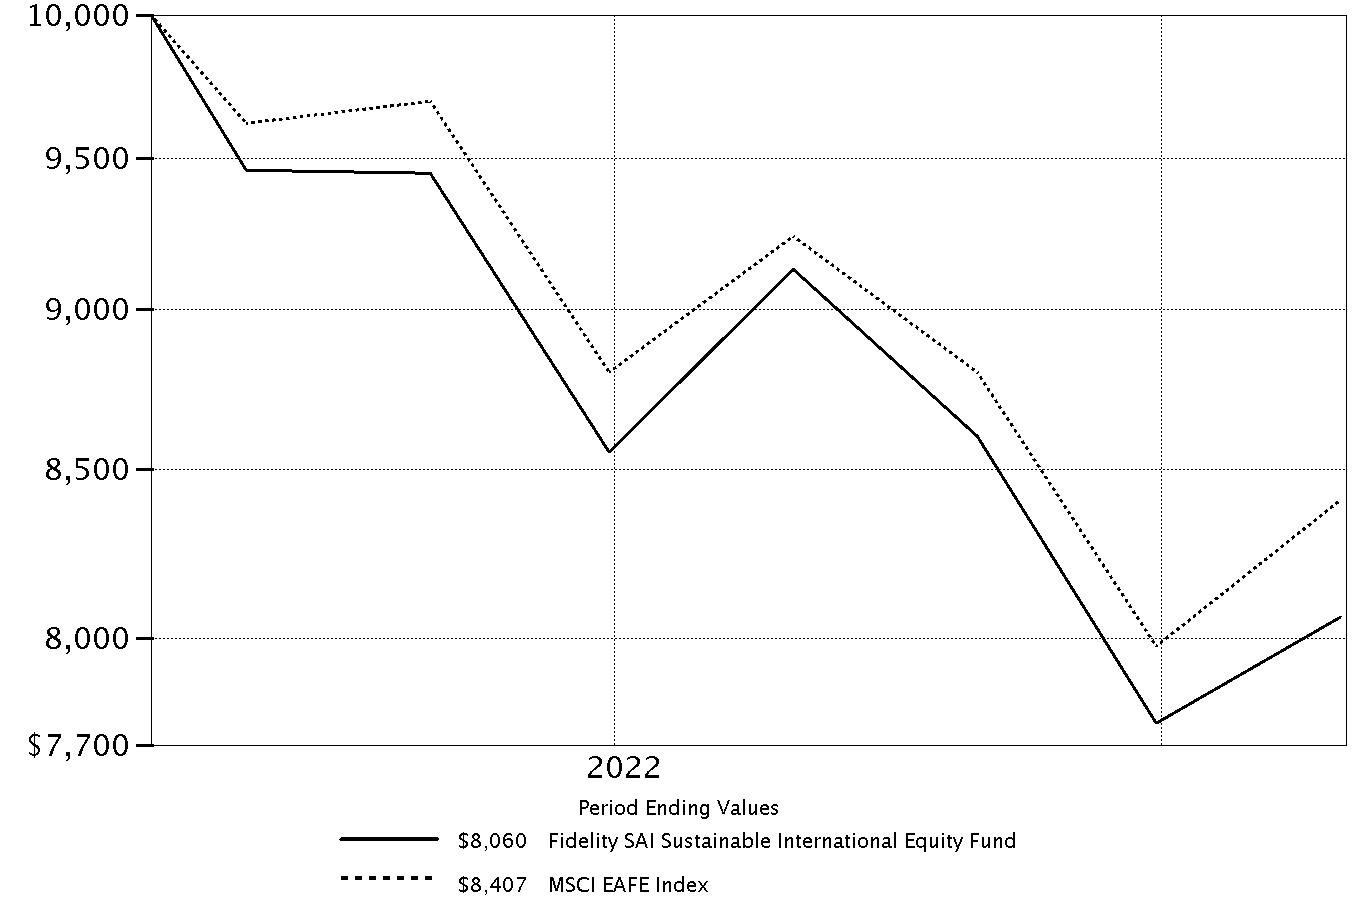 |
Top Holdings (% of Fund's net assets) | ||
| Roche Holding AG (participation certificate) (Switzerland, Pharmaceuticals) | 4.0 | |
| AstraZeneca PLC (United Kingdom) (United Kingdom, Pharmaceuticals) | 3.9 | |
| Nestle SA (Reg. S) (Switzerland, Food Products) | 3.9 | |
| ORIX Corp. (Japan, Diversified Financial Services) | 3.3 | |
| Sony Group Corp. (Japan, Household Durables) | 3.2 | |
| LVMH Moet Hennessy Louis Vuitton SE (France, Textiles, Apparel & Luxury Goods) | 2.4 | |
| AIA Group Ltd. (Hong Kong, Insurance) | 2.3 | |
| HDFC Bank Ltd. sponsored ADR (India, Banks) | 2.3 | |
| ASML Holding NV (Netherlands) (Netherlands, Semiconductors & Semiconductor Equipment) | 2.2 | |
| Hitachi Ltd. (Japan, Industrial Conglomerates) | 2.1 | |
| 29.6 | ||
| Market Sectors (% of Fund's net assets) | ||
| Financials | 19.6 | |
| Health Care | 15.4 | |
| Industrials | 12.7 | |
| Information Technology | 11.9 | |
| Consumer Staples | 11.1 | |
| Consumer Discretionary | 10.2 | |
| Materials | 7.2 | |
| Utilities | 4.4 | |
| Communication Services | 2.4 | |
| Energy | 1.6 | |
| Real Estate | 0.7 | |
Asset Allocation (% of Fund's net assets) |
 |
Foreign investments - 96.8% |
Geographic Diversification (% of Fund's net assets) |
 |
* Includes Short-Term investments and Net Other Assets (Liabilities). Percentages are based on country or territory of incorporation and are adjusted for the effect of futures contracts, if applicable. |
| Common Stocks - 97.2% | |||
| Shares | Value ($) | ||
| Australia - 0.8% | |||
| Bapcor Ltd. | 4,297 | 18,196 | |
| Austria - 1.9% | |||
| Verbund AG | 387 | 30,309 | |
| Wienerberger AG | 478 | 10,931 | |
TOTAL AUSTRIA | 41,240 | ||
| Bailiwick of Jersey - 0.3% | |||
| Experian PLC | 1 | 32 | |
| Ferguson PLC | 63 | 6,871 | |
TOTAL BAILIWICK OF JERSEY | 6,903 | ||
| Belgium - 1.7% | |||
| KBC Group NV | 183 | 9,171 | |
| UCB SA | 375 | 28,284 | |
TOTAL BELGIUM | 37,455 | ||
| Canada - 2.2% | |||
| Nutrien Ltd. | 340 | 28,728 | |
| The Toronto-Dominion Bank | 290 | 18,560 | |
TOTAL CANADA | 47,288 | ||
| Denmark - 1.1% | |||
| ORSTED A/S (a) | 305 | 25,164 | |
| Finland - 1.6% | |||
| Neste OYJ | 805 | 35,274 | |
| France - 10.8% | |||
| Air Liquide SA | 180 | 23,546 | |
| AXA SA | 1,517 | 37,462 | |
| BNP Paribas SA | 588 | 27,574 | |
| Capgemini SA | 157 | 25,731 | |
| Edenred SA | 217 | 11,143 | |
| L'Oreal SA | 39 | 12,246 | |
| LVMH Moet Hennessy Louis Vuitton SE | 85 | 53,635 | |
| Pernod Ricard SA | 200 | 35,122 | |
| Worldline SA (a)(b) | 217 | 9,471 | |
TOTAL FRANCE | 235,930 | ||
| Germany - 10.9% | |||
| Brenntag SE | 221 | 13,409 | |
| Deutsche Borse AG | 191 | 31,060 | |
| Deutsche Post AG | 777 | 27,467 | |
| Linde PLC | 127 | 37,985 | |
| Merck KGaA | 280 | 45,630 | |
| Muenchener Rueckversicherungs-Gesellschaft AG in Muenchen | 79 | 20,854 | |
| Puma AG | 193 | 8,547 | |
| SAP SE | 103 | 9,914 | |
| Siemens AG | 396 | 43,247 | |
TOTAL GERMANY | 238,113 | ||
| Hong Kong - 4.0% | |||
| AIA Group Ltd. | 6,779 | 51,350 | |
| Chervon Holdings Ltd. | 2,574 | 8,673 | |
| Hang Seng Bank Ltd. | 1,967 | 27,691 | |
TOTAL HONG KONG | 87,714 | ||
| India - 2.3% | |||
| HDFC Bank Ltd. sponsored ADR | 794 | 49,474 | |
| Ireland - 2.2% | |||
| CRH PLC | 640 | 22,991 | |
| Dalata Hotel Group PLC (b) | 6,080 | 19,498 | |
| Kerry Group PLC Class A | 62 | 5,392 | |
TOTAL IRELAND | 47,881 | ||
| Italy - 0.6% | |||
| Carel Industries SpA (a) | 617 | 13,445 | |
| Japan - 17.0% | |||
| FUJIFILM Holdings Corp. | 786 | 36,045 | |
| Fujitsu Ltd. | 150 | 17,259 | |
| Hitachi Ltd. | 1,016 | 46,190 | |
| Hoya Corp. | 459 | 42,830 | |
| Itochu Corp. | 1,453 | 37,611 | |
| Nomura Research Institute Ltd. | 684 | 15,203 | |
| ORIX Corp. | 4,833 | 71,019 | |
| Persol Holdings Co. Ltd. | 1,196 | 24,017 | |
| Sony Group Corp. | 1,035 | 69,795 | |
| TIS, Inc. | 402 | 10,855 | |
TOTAL JAPAN | 370,824 | ||
| Kenya - 0.6% | |||
| Safaricom Ltd. | 62,176 | 12,860 | |
| Netherlands - 4.6% | |||
| ASML Holding NV (Netherlands) | 103 | 48,316 | |
| Heineken NV (Bearer) | 269 | 22,490 | |
| Koninklijke KPN NV | 10,377 | 29,026 | |
TOTAL NETHERLANDS | 99,832 | ||
| New Zealand - 1.9% | |||
| EBOS Group Ltd. | 1,430 | 31,178 | |
| Ryman Healthcare Ltd. | 2,239 | 10,909 | |
TOTAL NEW ZEALAND | 42,087 | ||
| Norway - 1.7% | |||
| DNB Bank ASA | 1,815 | 32,102 | |
| Schibsted ASA (A Shares) | 283 | 4,358 | |
TOTAL NORWAY | 36,460 | ||
| Singapore - 0.9% | |||
| United Overseas Bank Ltd. | 966 | 18,943 | |
| Spain - 3.6% | |||
| Amadeus IT Holding SA Class A (b) | 609 | 31,763 | |
| Cellnex Telecom SA (a) | 206 | 6,742 | |
| EDP Renovaveis SA | 735 | 15,479 | |
| Iberdrola SA | 2,516 | 25,586 | |
TOTAL SPAIN | 79,570 | ||
| Sweden - 3.5% | |||
| Boliden AB | 1,163 | 33,875 | |
| Instalco AB | 1,404 | 5,622 | |
| Investor AB (B Shares) | 682 | 11,141 | |
| Lagercrantz Group AB (B Shares) | 748 | 6,419 | |
| Nibe Industrier AB (B Shares) | 2,534 | 20,219 | |
TOTAL SWEDEN | 77,276 | ||
| Switzerland - 8.3% | |||
| Nestle SA (Reg. S) | 781 | 85,019 | |
| Roche Holding AG (participation certificate) | 268 | 88,920 | |
| SGS SA (Reg.) | 4 | 8,818 | |
TOTAL SWITZERLAND | 182,757 | ||
| Taiwan - 1.5% | |||
| Taiwan Semiconductor Manufacturing Co. Ltd. | 2,705 | 32,488 | |
| United Kingdom - 12.8% | |||
| AstraZeneca PLC (United Kingdom) | 725 | 85,066 | |
| Beazley PLC | 1,876 | 13,435 | |
| Big Yellow Group PLC | 562 | 7,257 | |
| Bunzl PLC | 366 | 11,925 | |
| Compass Group PLC | 2,175 | 45,809 | |
| Dechra Pharmaceuticals PLC | 176 | 5,288 | |
| Diageo PLC | 968 | 39,836 | |
| Grainger Trust PLC | 3,315 | 8,630 | |
| Impax Asset Management Group PLC | 630 | 4,841 | |
| Reckitt Benckiser Group PLC | 633 | 42,008 | |
| Renewi PLC (b) | 942 | 5,715 | |
| Smart Metering Systems PLC | 1,304 | 10,947 | |
TOTAL UNITED KINGDOM | 280,757 | ||
| United States of America - 0.4% | |||
| Mobileye Global, Inc. (b) | 300 | 7,914 | |
| TOTAL COMMON STOCKS (Cost $2,446,595) | 2,125,845 | ||
| Money Market Funds - 4.7% | |||
| Shares | Value ($) | ||
Fidelity Cash Central Fund 3.10% (c) (Cost $102,083) | 102,062 | 102,083 | |
| TOTAL INVESTMENT IN SECURITIES - 101.9% (Cost $2,548,678) | 2,227,928 |
NET OTHER ASSETS (LIABILITIES) - (1.9)% | (42,246) |
| NET ASSETS - 100.0% | 2,185,682 |
| (a) | Security exempt from registration under Rule 144A of the Securities Act of 1933. These securities may be resold in transactions exempt from registration, normally to qualified institutional buyers. At the end of the period, the value of these securities amounted to $54,822 or 2.5% of net assets. |
| (b) | Non-income producing |
| (c) | Affiliated fund that is generally available only to investment companies and other accounts managed by Fidelity Investments. The rate quoted is the annualized seven-day yield of the fund at period end. A complete unaudited listing of the fund's holdings as of its most recent quarter end is available upon request. In addition, each Fidelity Central Fund's financial statements, which are not covered by the Fund's Report of Independent Registered Public Accounting Firm, are available on the SEC's website or upon request. |
| Affiliate | Value, beginning of period ($) | Purchases ($) | Sales Proceeds ($) | Dividend Income ($) | Realized Gain (loss) ($) | Change in Unrealized appreciation (depreciation) ($) | Value, end of period ($) | % ownership, end of period |
| Fidelity Cash Central Fund 3.10% | - | 2,447,606 | 2,345,523 | 895 | - | - | 102,083 | 0.0% |
| Total | - | 2,447,606 | 2,345,523 | 895 | - | - | 102,083 | |
| Valuation Inputs at Reporting Date: | ||||
| Description | Total ($) | Level 1 ($) | Level 2 ($) | Level 3 ($) |
Investments in Securities: | ||||
| Equities: | ||||
Communication Services | 52,986 | 17,218 | 35,768 | - |
Consumer Discretionary | 224,153 | 54,914 | 169,239 | - |
Consumer Staples | 242,113 | 63,004 | 179,109 | - |
Energy | 35,274 | 35,274 | - | - |
Financials | 424,677 | 187,413 | 237,264 | - |
Health Care | 338,105 | 118,489 | 219,616 | - |
Industrials | 275,535 | 182,562 | 92,973 | - |
Information Technology | 262,521 | 87,579 | 174,942 | - |
Materials | 158,056 | 111,519 | 46,537 | - |
Real Estate | 15,887 | 15,887 | - | - |
Utilities | 96,538 | 45,788 | 50,750 | - |
| Money Market Funds | 102,083 | 102,083 | - | - |
| Total Investments in Securities: | 2,227,928 | 1,021,730 | 1,206,198 | - |
| Statement of Assets and Liabilities | ||||
| October 31, 2022 | ||||
| Assets | ||||
| Investment in securities, at value - See accompanying schedule: | ||||
Unaffiliated issuers (cost $2,446,595) | $2,125,845 | |||
Fidelity Central Funds (cost $102,083) | 102,083 | |||
| Total Investment in Securities (cost $2,548,678) | $ | 2,227,928 | ||
| Cash | 4,487 | |||
| Foreign currency held at value (cost $251) | 250 | |||
| Receivable for fund shares sold | 5,152 | |||
| Dividends receivable | 3,918 | |||
| Distributions receivable from Fidelity Central Funds | 328 | |||
| Prepaid expenses | 11,369 | |||
| Receivable from investment adviser for expense reductions | 12,026 | |||
Total assets | 2,265,458 | |||
| Liabilities | ||||
| Payable for investments purchased | $35,473 | |||
| Accrued management fee | 1,149 | |||
| Audit fee payable | 37,312 | |||
| Other payables and accrued expenses | 5,842 | |||
| Total Liabilities | 79,776 | |||
| Net Assets | $ | 2,185,682 | ||
| Net Assets consist of: | ||||
| Paid in capital | $ | 2,579,428 | ||
| Total accumulated earnings (loss) | (393,746) | |||
| Net Assets | $ | 2,185,682 | ||
Net Asset Value , offering price and redemption price per share ($2,185,682 ÷ 271,254 shares) | $ | 8.06 | ||
| Statement of Operations | ||||
| For the period April 14, 2022 (commencement of operations) through October 31, 2022 | ||||
| Investment Income | ||||
| Dividends | $ | 26,044 | ||
| Non-Cash dividends | 1,843 | |||
| Income from Fidelity Central Funds | 895 | |||
| Income before foreign taxes withheld | 28,782 | |||
| Less foreign taxes withheld | (3,589) | |||
| Total Income | 25,193 | |||
| Expenses | ||||
| Management fee | $ | 6,884 | ||
| Custodian fees and expenses | 14,539 | |||
| Independent trustees' fees and expenses | 3 | |||
| Registration fees | 16,088 | |||
| Audit | 38,968 | |||
| Miscellaneous | 29 | |||
| Total expenses before reductions | 76,511 | |||
| Expense reductions | (69,565) | |||
| Total expenses after reductions | 6,946 | |||
| Net Investment income (loss) | 18,247 | |||
| Realized and Unrealized Gain (Loss) | ||||
| Net realized gain (loss) on: | ||||
| Investment Securities: | ||||
| Unaffiliated issuers | (89,160) | |||
| Foreign currency transactions | (2,065) | |||
| Total net realized gain (loss) | (91,225) | |||
| Change in net unrealized appreciation (depreciation) on: | ||||
| Investment Securities: | ||||
| Unaffiliated issuers | (320,750) | |||
| Assets and liabilities in foreign currencies | (116) | |||
| Total change in net unrealized appreciation (depreciation) | (320,866) | |||
| Net gain (loss) | (412,091) | |||
| Net increase (decrease) in net assets resulting from operations | $ | (393,844) | ||
| Statement of Changes in Net Assets | ||
| For the period April 14, 2022 (commencement of operations) through October 31, 2022 | ||
| Increase (Decrease) in Net Assets | ||
| Operations | ||
| Net investment income (loss) | $ | 18,247 |
| Net realized gain (loss) | (91,225) | |
| Change in net unrealized appreciation (depreciation) | (320,866) | |
| Net increase (decrease) in net assets resulting from operations | (393,844) | |
| Share transactions | ||
| Proceeds from sales of shares | 2,599,216 | |
| Cost of shares redeemed | (19,690) | |
Net increase (decrease) in net assets resulting from share transactions | 2,579,526 | |
| Total increase (decrease) in net assets | 2,185,682 | |
| Net Assets | ||
| Beginning of period | - | |
| End of period | $ | 2,185,682 |
| Other Information | ||
| Shares | ||
| Sold | 273,624 | |
| Redeemed | (2,370) | |
| Net increase (decrease) | 271,254 | |
| Fidelity SAI Sustainable International Equity Fund |
| Years ended October 31, | 2022 A | |
Selected Per-Share Data | ||
| Net asset value, beginning of period | $ | 10.00 |
| Income from Investment Operations | ||
Net investment income (loss) B,C | .08 | |
| Net realized and unrealized gain (loss) | (2.02) | |
| Total from investment operations | (1.94) | |
| Net asset value, end of period | $ | 8.06 |
Total Return D,E | (19.40)% | |
Ratios to Average Net Assets C,F,G | ||
| Expenses before reductions | 5.78% H,I | |
| Expenses net of fee waivers, if any | .75% H | |
| Expenses net of all reductions | .68% H | |
| Net investment income (loss) | 1.79% H | |
| Supplemental Data | ||
| Net assets, end of period (000 omitted) | $ | 2,186 |
Portfolio turnover rate J | 51% H |
| Fidelity Central Fund | Investment Manager | Investment Objective | Investment Practices | Expense Ratio A |
| Fidelity Money Market Central Funds | Fidelity Management & Research Company LLC (FMR) | Each fund seeks to obtain a high level of current income consistent with the preservation of capital and liquidity. | Short-term Investments | Less than .005% |
| Gross unrealized appreciation | $27,612 |
| Gross unrealized depreciation | (355,519) |
| Net unrealized appreciation (depreciation) | $(327,907) |
| Tax Cost | $2,555,835 |
| Undistributed ordinary income | $16,813 |
| Capital loss carryforward | $(82,536) |
| Net unrealized appreciation (depreciation) on securities and other investments | $(328,023) |
Short-term | $(82,536) |
| Total capital loss carryforward | $(82,536) |
| Purchases ($) | Sales ($) | |
| Fidelity SAI Sustainable International Equity Fund | 3,044,584 | 508,308 |
| Amount | |
| Fidelity SAI Sustainable International Equity Fund | $2 |
| Purchases ($) | Sales ($) | Realized Gain (Loss) ($) | |
| Fidelity SAI Sustainable International Equity Fund | 237,156 | 29,334 | (2,111) |
| Fund | Affiliated % |
| Fidelity SAI Sustainable International Equity Fund | 74% |
| The Example is based on an investment of $1,000 invested at the beginning of the period and held for the entire period (May 1, 2022 to October 31, 2022). |
Annualized Expense Ratio- A | Beginning Account Value May 1, 2022 | Ending Account Value October 31, 2022 | Expenses Paid During Period- C May 1, 2022 to October 31, 2022 | |||||||
| Fidelity® SAI Sustainable International Equity Fund | .75% | |||||||||
| Actual | $ 1,000 | $ 852.00 | $ 3.50 | |||||||
Hypothetical- B | $ 1,000 | $ 1,021.42 | $ 3.82 | |||||||
|


Contents
Board Approval of Investment Advisory Contracts and Management Fees |
| Average Annual Total Returns | |||
Periods ended October 31, 2022 | Past 1 year | Past 5 years | Past 10 years |
| Class A (incl.5.75% sales charge) | -29.50% | -1.44% | 6.03% |
| Class M (incl.3.50% sales charge) | -28.04% | -1.27% | 5.97% |
Class C (incl. contingent deferred sales charge) | -26.46% | -1.03% | 6.01% |
| Fidelity® International Small Cap Fund | -25.01% | 0.01% | 6.96% |
| Class I | -24.98% | 0.01% | 6.99% |
| Class Z | -24.89% | 0.12% | 7.05% |
| $10,000 Over 10 Years |
Let's say hypothetically that $10,000 was invested in Fidelity® International Small Cap Fund, a class of the fund, on October 31, 2012. The chart shows how the value of your investment would have changed, and also shows how the MSCI ACWI (All Country World Index) ex USA Small Cap Index performed over the same period. |
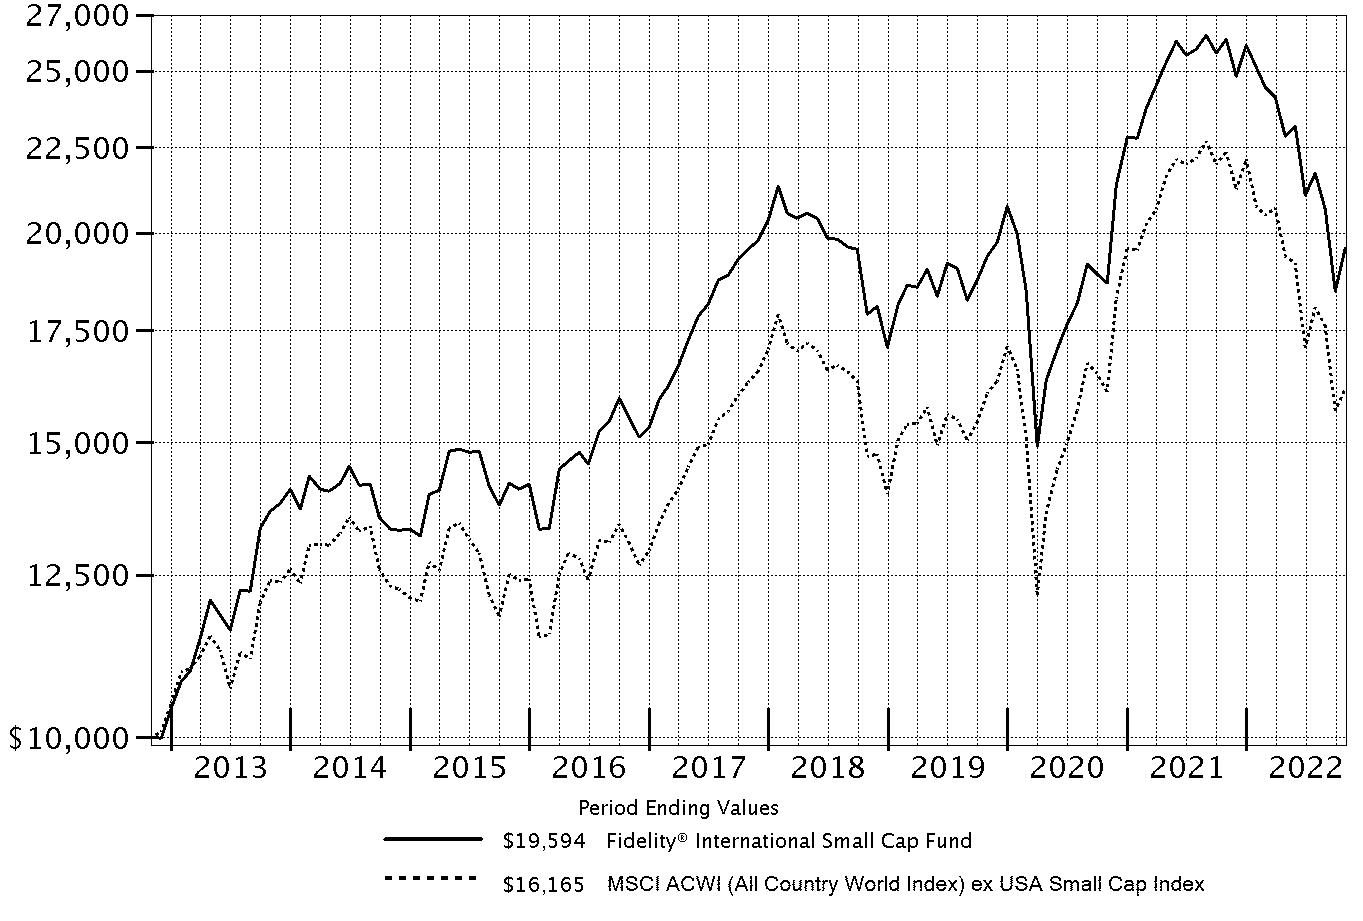 |
Top Holdings (% of Fund's net assets) | ||
| Hypera SA (Brazil, Pharmaceuticals) | 1.3 | |
| Rheinmetall AG (Germany, Aerospace & Defense) | 1.3 | |
| Talanx AG (Germany, Insurance) | 1.2 | |
| Mayr-Melnhof Karton AG (Austria, Containers & Packaging) | 1.0 | |
| Renesas Electronics Corp. (Japan, Semiconductors & Semiconductor Equipment) | 1.0 | |
| Compania de Distribucion Integral Logista Holdings SA (Spain, Air Freight & Logistics) | 0.9 | |
| Ship Healthcare Holdings, Inc. (Japan, Health Care Providers & Services) | 0.9 | |
| Hiscox Ltd. (Bermuda, Insurance) | 0.9 | |
| Adtalem Global Education, Inc. (United States of America, Diversified Consumer Services) | 0.9 | |
| Thermador Groupe SA (France, Trading Companies & Distributors) | 0.9 | |
| 10.3 | ||
| Market Sectors (% of Fund's net assets) | ||
| Industrials | 20.8 | |
| Consumer Discretionary | 15.9 | |
| Financials | 11.0 | |
| Information Technology | 10.7 | |
| Materials | 8.9 | |
| Consumer Staples | 8.4 | |
| Health Care | 7.3 | |
| Real Estate | 7.3 | |
| Energy | 4.0 | |
| Communication Services | 3.5 | |
Asset Allocation (% of Fund's net assets) |
 |
Foreign investments - 96.1% |
Geographic Diversification (% of Fund's net assets) |
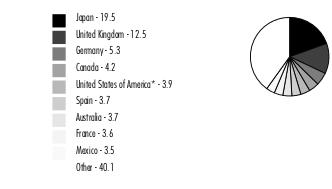 |
* Includes Short-Term investments and Net Other Assets (Liabilities). Percentages are based on country or territory of incorporation and are adjusted for the effect of futures contracts, if applicable. |
| Common Stocks - 97.8% | |||
| Shares | Value ($) | ||
| Australia - 3.7% | |||
| Flight Centre Travel Group Ltd. (a)(b) | 1,200,000 | 12,780,207 | |
| GUD Holdings Ltd. | 2,776,586 | 14,279,388 | |
| Imdex Ltd. | 9,534,507 | 12,441,445 | |
| Inghams Group Ltd. | 13,590,647 | 21,993,941 | |
| Nanosonics Ltd. (a) | 4,832,614 | 12,704,756 | |
| National Storage REIT unit | 8,515,622 | 14,216,716 | |
| Servcorp Ltd. (c) | 7,066,585 | 15,413,681 | |
| SomnoMed Ltd. (a)(c) | 4,189,521 | 3,698,161 | |
TOTAL AUSTRALIA | 107,528,295 | ||
| Austria - 2.0% | |||
| Mayr-Melnhof Karton AG | 200,700 | 28,561,216 | |
| Strabag SE | 231,797 | 8,899,501 | |
| Wienerberger AG | 900,900 | 20,601,876 | |
TOTAL AUSTRIA | 58,062,593 | ||
| Belgium - 1.1% | |||
| Econocom Group SA | 4,466,595 | 12,160,880 | |
| Fagron NV | 1,546,200 | 19,253,205 | |
TOTAL BELGIUM | 31,414,085 | ||
| Bermuda - 1.2% | |||
| Hiscox Ltd. | 2,634,148 | 27,163,402 | |
| Norwegian Cruise Line Holdings Ltd. (a)(b) | 500,000 | 8,445,000 | |
TOTAL BERMUDA | 35,608,402 | ||
| Brazil - 1.9% | |||
| Hypera SA | 4,038,100 | 39,720,423 | |
| YDUQS Participacoes SA | 5,269,200 | 16,453,818 | |
TOTAL BRAZIL | 56,174,241 | ||
| Canada - 4.2% | |||
| CCL Industries, Inc. Class B (b) | 329,900 | 15,497,926 | |
| Computer Modelling Group Ltd. | 2,172,763 | 8,612,266 | |
| ECN Capital Corp. | 2,149,300 | 6,484,107 | |
| Genesis Land Development Corp. (c) | 4,033,799 | 5,655,343 | |
| Lassonde Industries, Inc. Class A (sub. vtg.) | 159,299 | 13,749,748 | |
| McCoy Global, Inc. (a)(b) | 1,328,570 | 975,205 | |
| North West Co., Inc. | 702,300 | 18,274,698 | |
| Open Text Corp. | 750,996 | 21,752,341 | |
| Parkland Corp. | 294,500 | 5,953,338 | |
| Richelieu Hardware Ltd. | 289,400 | 7,768,457 | |
| Total Energy Services, Inc. | 570,100 | 3,280,790 | |
| VerticalScope Holdings, Inc. (a) | 677,619 | 3,606,076 | |
| Western Forest Products, Inc. | 12,682,775 | 11,450,665 | |
TOTAL CANADA | 123,060,960 | ||
| Cayman Islands - 2.1% | |||
| ASMPT Ltd. | 2,622,500 | 14,432,745 | |
| Best Pacific International Holdings Ltd. | 22,158,900 | 3,133,436 | |
| China Metal Recycling (Holdings) Ltd. (a)(d) | 436,800 | 1 | |
| Impro Precision Industries Ltd. (e) | 20,906,300 | 5,433,217 | |
| Pico Far East Holdings Ltd. | 61,300,071 | 8,355,924 | |
| Precision Tsugami China Corp. Ltd. | 9,659,453 | 8,490,853 | |
| WH Group Ltd. (e) | 14,000,000 | 7,080,570 | |
| Xingda International Holdings Ltd. | 75,499,631 | 14,619,689 | |
TOTAL CAYMAN ISLANDS | 61,546,435 | ||
| China - 2.8% | |||
| Qingdao Port International Co. Ltd. (H Shares) (e) | 33,596,000 | 14,080,990 | |
| Shenzhen YUTO Packaging Technology Co. Ltd. (A Shares) | 5,651,666 | 25,174,752 | |
| Sinopharm Group Co. Ltd. (H Shares) | 6,719,200 | 12,805,569 | |
| TravelSky Technology Ltd. (H Shares) | 12,360,000 | 17,950,354 | |
| Weifu High-Technology Group Co. Ltd. (B Shares) | 7,043,386 | 10,704,630 | |
TOTAL CHINA | 80,716,295 | ||
| Denmark - 0.6% | |||
| Spar Nord Bank A/S | 1,368,775 | 16,568,531 | |
| Finland - 1.3% | |||
| Huhtamaki Oyj | 617,700 | 22,189,568 | |
| Nanoform Finland PLC (a) | 797,822 | 2,089,386 | |
| Rovio Entertainment OYJ (e) | 2,594,169 | 14,792,477 | |
TOTAL FINLAND | 39,071,431 | ||
| France - 3.6% | |||
| Altarea SCA | 129,957 | 17,312,365 | |
| Antin Infrastructure Partners SA | 365,255 | 7,948,411 | |
| ARGAN SA | 200,000 | 15,001,635 | |
| Elior SA (a)(b)(e) | 2,973,500 | 6,611,763 | |
| Lectra | 361,754 | 11,583,110 | |
| Maisons du Monde SA (e) | 1,033,807 | 10,134,865 | |
| Thermador Groupe SA (b) | 315,366 | 26,272,976 | |
| Vicat SA | 484,492 | 11,108,142 | |
TOTAL FRANCE | 105,973,267 | ||
| Germany - 5.3% | |||
| DIC Asset AG | 253,969 | 1,751,874 | |
| DWS Group GmbH & Co. KGaA (e) | 226,600 | 6,135,886 | |
| JOST Werke AG (e) | 425,820 | 18,179,278 | |
| NORMA Group AG | 623,692 | 9,892,636 | |
| Rheinmetall AG | 232,425 | 37,784,664 | |
| Stabilus Se | 308,800 | 16,952,282 | |
| Synlab AG (b) | 977,100 | 12,582,017 | |
| Takkt AG (b) | 1,310,212 | 16,962,103 | |
| Talanx AG | 934,467 | 35,110,976 | |
TOTAL GERMANY | 155,351,716 | ||
| Greece - 0.8% | |||
| Mytilineos SA | 1,472,216 | 24,704,499 | |
| Hong Kong - 1.5% | |||
| Chervon Holdings Ltd. | 2,580,400 | 8,694,856 | |
| Far East Horizon Ltd. | 24,669,000 | 19,044,689 | |
| Magnificent Hotel Investment Ltd. (a) | 316,412,000 | 4,111,524 | |
| Sino Land Ltd. | 11,344,375 | 12,125,293 | |
TOTAL HONG KONG | 43,976,362 | ||
| Hungary - 0.7% | |||
| Richter Gedeon PLC | 1,000,000 | 19,745,686 | |
| India - 1.9% | |||
| Cyient Ltd. | 419,091 | 3,793,487 | |
| Embassy Office Parks (REIT) | 4,940,200 | 20,552,139 | |
| IndusInd Bank Ltd. | 1,209,700 | 16,698,039 | |
| Shriram Transport Finance Co. Ltd. | 1,064,852 | 15,811,341 | |
TOTAL INDIA | 56,855,006 | ||
| Indonesia - 0.8% | |||
| PT Avia Avian Tbk | 200,607,200 | 10,096,275 | |
| PT Selamat Sempurna Tbk | 143,601,100 | 13,810,011 | |
TOTAL INDONESIA | 23,906,286 | ||
| Ireland - 2.2% | |||
| Adient PLC (a) | 582,400 | 20,372,352 | |
| Dalata Hotel Group PLC (a) | 4,560,609 | 14,625,286 | |
| Irish Residential Properties REIT PLC | 14,699,100 | 15,891,866 | |
| Mincon Group PLC (c) | 13,529,844 | 13,237,160 | |
TOTAL IRELAND | 64,126,664 | ||
| Italy - 2.4% | |||
| Banca Generali SpA (b) | 648,500 | 19,393,033 | |
| BFF Bank SpA (e) | 2,955,056 | 20,851,186 | |
| MARR SpA (a) | 985,827 | 10,385,436 | |
| Recordati SpA | 513,811 | 19,310,635 | |
TOTAL ITALY | 69,940,290 | ||
| Japan - 19.5% | |||
| Amano Corp. | 955,050 | 16,359,073 | |
| Arcland Sakamoto Co. Ltd. | 1,785,934 | 17,715,812 | |
| ASKUL Corp. | 1,521,300 | 15,909,220 | |
| Capcom Co. Ltd. | 800,000 | 22,300,683 | |
| Central Automotive Products Ltd. | 425,700 | 6,424,364 | |
| DaikyoNishikawa Corp. | 2,516,700 | 10,155,150 | |
| Dexerials Corp. | 763,200 | 17,835,973 | |
| Dip Corp. | 572,900 | 16,066,398 | |
| Funai Soken Holdings, Inc. | 1,100,000 | 19,626,080 | |
| GMO Internet, Inc. | 1,113,100 | 19,245,974 | |
| Inaba Denki Sangyo Co. Ltd. | 1,091,800 | 20,397,595 | |
| Isuzu Motors Ltd. | 1,832,500 | 21,492,855 | |
| JEOL Ltd. | 250,000 | 9,179,865 | |
| Kamigumi Co. Ltd. | 1,000,000 | 19,018,797 | |
| LIXIL Group Corp. (b) | 899,400 | 13,615,450 | |
| Maruwa Ceramic Co. Ltd. | 210,700 | 24,811,574 | |
| Meitec Corp. | 933,600 | 15,753,068 | |
| Minebea Mitsumi, Inc. | 1,059,500 | 15,704,213 | |
| Mitani Shoji Co. Ltd. | 893,300 | 8,903,262 | |
| Nishimoto Co. Ltd. | 360,400 | 10,094,933 | |
| NSD Co. Ltd. | 1,301,300 | 22,263,743 | |
| PALTAC Corp. | 679,900 | 19,341,451 | |
| Park24 Co. Ltd. (a) | 752,600 | 10,046,814 | |
| Persol Holdings Co. Ltd. | 1,070,500 | 21,497,112 | |
| Renesas Electronics Corp. (a) | 3,367,500 | 28,171,671 | |
| Roland Corp. | 707,900 | 20,137,980 | |
| S Foods, Inc. | 1,137,623 | 20,848,197 | |
| San-Ai Obbli Co. Ltd. | 2,265,100 | 18,736,830 | |
| Ship Healthcare Holdings, Inc. | 1,417,100 | 27,170,733 | |
| Sumco Corp. | 1,217,000 | 15,460,594 | |
| TIS, Inc. | 812,000 | 21,925,283 | |
| TKC Corp. | 286,800 | 7,329,365 | |
| Tsuruha Holdings, Inc. | 306,100 | 17,806,685 | |
TOTAL JAPAN | 571,346,797 | ||
| Korea (South) - 1.6% | |||
| Hyundai Fire & Marine Insurance Co. Ltd. | 533,476 | 12,446,228 | |
| Soulbrain Co. Ltd. | 154,200 | 22,114,690 | |
| Vitzrocell Co. Ltd. (c) | 1,472,541 | 12,328,605 | |
TOTAL KOREA (SOUTH) | 46,889,523 | ||
| Luxembourg - 0.6% | |||
| B&M European Value Retail SA | 4,520,800 | 16,725,047 | |
| Mexico - 3.5% | |||
| Bolsa Mexicana de Valores S.A.B. de CV | 9,976,900 | 18,168,200 | |
| GCC S.A.B. de CV | 2,856,200 | 17,734,302 | |
| Genomma Lab Internacional SA de CV | 17,396,561 | 13,407,636 | |
| Gruma S.A.B. de CV Series B | 2,258,600 | 26,199,669 | |
| Grupo Comercial Chedraui S.A.B. de CV | 2,864,334 | 11,545,234 | |
| Qualitas Controladora S.A.B. de CV | 3,595,835 | 14,128,893 | |
TOTAL MEXICO | 101,183,934 | ||
| Multi-National - 0.2% | |||
| HKT Trust/HKT Ltd. unit | 6,000,000 | 6,779,920 | |
| Netherlands - 2.6% | |||
| Acomo NV | 851,899 | 15,928,543 | |
| AerCap Holdings NV (a) | 339,072 | 18,109,836 | |
| Arcadis NV | 396,350 | 13,466,402 | |
| RHI Magnesita NV | 1,109,491 | 23,564,186 | |
| Van Lanschot Kempen NV (Bearer) | 283,041 | 6,111,779 | |
TOTAL NETHERLANDS | 77,180,746 | ||
| New Zealand - 0.4% | |||
| EBOS Group Ltd. | 602,795 | 13,142,438 | |
| Norway - 0.9% | |||
| Europris ASA (e) | 3,185,800 | 18,968,659 | |
| Selvaag Bolig ASA | 2,186,000 | 7,075,590 | |
TOTAL NORWAY | 26,044,249 | ||
| Panama - 0.6% | |||
| Intercorp Financial Services, Inc. | 683,100 | 16,804,260 | |
| Philippines - 1.4% | |||
| Century Pacific Food, Inc. | 58,034,700 | 23,774,265 | |
| Robinsons Land Corp. | 73,007,700 | 18,728,136 | |
TOTAL PHILIPPINES | 42,502,401 | ||
| Romania - 0.6% | |||
| Banca Transilvania SA | 4,929,712 | 16,865,927 | |
| Singapore - 2.5% | |||
| Boustead Singapore Ltd. | 13,008,812 | 7,213,844 | |
| HRnetgroup Ltd. | 29,852,200 | 15,394,254 | |
| Mapletree Industrial (REIT) | 13,868,431 | 21,553,086 | |
| The Hour Glass Ltd. | 13,304,580 | 18,327,162 | |
| Wing Tai Holdings Ltd. | 9,410,300 | 10,104,306 | |
TOTAL SINGAPORE | 72,592,652 | ||
| Spain - 3.7% | |||
| Cie Automotive SA | 830,300 | 21,120,802 | |
| Compania de Distribucion Integral Logista Holdings SA | 1,353,100 | 28,000,991 | |
| Grupo Catalana Occidente SA | 714,422 | 19,415,757 | |
| Indra Sistemas SA (b) | 1,848,677 | 16,533,943 | |
| Prosegur Compania de Seguridad SA (Reg.) | 6,813,081 | 12,705,223 | |
| Viscofan Envolturas Celulosicas SA | 175,000 | 10,419,861 | |
TOTAL SPAIN | 108,196,577 | ||
| Sweden - 1.7% | |||
| Dustin Group AB (e) | 1,477,482 | 6,155,506 | |
| Granges AB | 1,936,876 | 13,095,297 | |
| Haypp Group (a) | 1,154,900 | 2,505,149 | |
| HEXPOL AB (B Shares) | 2,327,700 | 22,979,323 | |
| Nordnet AB | 376,000 | 4,665,435 | |
TOTAL SWEDEN | 49,400,710 | ||
| Taiwan - 3.0% | |||
| International Games Systems Co. Ltd. | 2,392,000 | 26,067,713 | |
| Lumax International Corp. Ltd. | 4,537,292 | 9,256,335 | |
| Sporton International, Inc. | 1,917,312 | 12,007,721 | |
| Test Research, Inc. | 7,690,000 | 14,352,886 | |
| Tripod Technology Corp. | 4,420,000 | 12,223,724 | |
| Yageo Corp. | 824,578 | 9,382,406 | |
| Yung Chi Paint & Varnish Manufacturing Co. Ltd. | 2,538,000 | 5,484,548 | |
TOTAL TAIWAN | 88,775,333 | ||
| Thailand - 0.7% | |||
| Star Petroleum Refining PCL (For. Reg.) | 68,317,400 | 21,368,828 | |
| United Kingdom - 12.5% | |||
| Alliance Pharma PLC | 17,811,827 | 12,705,347 | |
| Anhui Heli Co. Ltd. ELS (UBS AG London Branch Bank Warrant Programme) Class A warrants 1/5/24 (a)(e) | 8,203,956 | 15,277,981 | |
| Ashtead Technology Holdings PLC (a)(c) | 6,821,000 | 19,751,365 | |
| Bodycote PLC | 1,917,671 | 10,899,161 | |
| easyJet PLC (a) | 2,100,000 | 8,390,448 | |
| Grainger Trust PLC | 6,569,466 | 17,101,870 | |
| Harbour Energy PLC | 4,357,894 | 18,886,054 | |
| Hyve Group PLC (a) | 3,976,191 | 2,439,544 | |
| Informa PLC | 2,816,033 | 17,942,694 | |
| J.D. Wetherspoon PLC (a) | 1,976,700 | 10,223,627 | |
| Jet2 PLC (a) | 1,717,200 | 16,734,984 | |
| John Wood Group PLC (a) | 12,082,200 | 19,384,358 | |
| LSL Property Services PLC | 4,204,235 | 11,041,044 | |
| Luxfer Holdings PLC sponsored | 1,052,059 | 15,223,294 | |
| Mears Group PLC (c) | 7,921,714 | 17,260,781 | |
| On The Beach Group PLC (a)(e) | 6,908,136 | 8,191,607 | |
| Pets At Home Group PLC | 2,700,000 | 8,911,324 | |
| Premier Foods PLC | 11,170,096 | 13,271,021 | |
| Rathbone Brothers PLC | 400,000 | 8,596,413 | |
| RS GROUP PLC | 2,222,553 | 24,430,476 | |
| Sabre Insurance Group PLC (e) | 9,800,000 | 10,092,299 | |
| Savills PLC | 1,207,300 | 11,429,309 | |
| Tate & Lyle PLC | 3,258,343 | 26,194,041 | |
| Ten Entertainment Group PLC (c) | 5,931,311 | 14,590,349 | |
| Vistry Group PLC | 1,696,898 | 11,734,396 | |
| WH Smith PLC (a) | 1,130,000 | 15,252,555 | |
TOTAL UNITED KINGDOM | 365,956,342 | ||
| United States of America - 1.7% | |||
| Adtalem Global Education, Inc. (a) | 639,900 | 26,683,830 | |
| Antero Resources Corp. (a) | 655,200 | 24,019,632 | |
TOTAL UNITED STATES OF AMERICA | 50,703,462 | ||
| TOTAL COMMON STOCKS (Cost $3,267,659,272) | 2,866,790,190 | ||
| Money Market Funds - 1.0% | |||
| Shares | Value ($) | ||
Fidelity Securities Lending Cash Central Fund 3.10% (f)(g) (Cost $28,602,852) | 28,599,992 | 28,602,852 | |
| TOTAL INVESTMENT IN SECURITIES - 98.8% (Cost $3,296,262,124) | 2,895,393,042 |
NET OTHER ASSETS (LIABILITIES) - 1.2% | 35,819,911 |
| NET ASSETS - 100.0% | 2,931,212,953 |
| ELS | - | EQUITY-LINKED SECURITY |
| (a) | Non-income producing |
| (b) | Security or a portion of the security is on loan at period end. |
| (c) | Affiliated company |
| (d) | Level 3 security |
| (e) | Security exempt from registration under Rule 144A of the Securities Act of 1933. These securities may be resold in transactions exempt from registration, normally to qualified institutional buyers. At the end of the period, the value of these securities amounted to $161,986,284 or 5.5% of net assets. |
| (f) | Affiliated fund that is generally available only to investment companies and other accounts managed by Fidelity Investments. The rate quoted is the annualized seven-day yield of the fund at period end. A complete unaudited listing of the fund's holdings as of its most recent quarter end is available upon request. In addition, each Fidelity Central Fund's financial statements, which are not covered by the Fund's Report of Independent Registered Public Accounting Firm, are available on the SEC's website or upon request. |
| (g) | Investment made with cash collateral received from securities on loan. |
| Affiliate | Value, beginning of period ($) | Purchases ($) | Sales Proceeds ($) | Dividend Income ($) | Realized Gain (loss) ($) | Change in Unrealized appreciation (depreciation) ($) | Value, end of period ($) | % ownership, end of period |
| Fidelity Cash Central Fund 3.10% | 73,879,832 | 701,215,597 | 775,095,429 | 420,465 | 4,759 | (4,759) | - | 0.0% |
| Fidelity Securities Lending Cash Central Fund 3.10% | 6,261,744 | 256,311,065 | 233,969,957 | 186,494 | - | - | 28,602,852 | 0.1% |
| Total | 80,141,576 | 957,526,662 | 1,009,065,386 | 606,959 | 4,759 | (4,759) | 28,602,852 | |
| Affiliate | Value, beginning of period ($) | Purchases ($) | Sales Proceeds ($) | Dividend Income ($) | Realized Gain (loss) ($) | Change in Unrealized appreciation (depreciation) ($) | Value, end of period ($) |
| Ashtead Technology Holdings PLC | - | 15,438,151 | - | - | - | 4,313,214 | 19,751,365 |
| Genesis Land Development Corp. | 6,238,912 | 1,650,372 | - | 201,350 | - | (2,233,941) | 5,655,343 |
| Mears Group PLC | 21,465,698 | - | - | 836,187 | - | (4,204,917) | 17,260,781 |
| Mincon Group PLC | 19,187,958 | 1,369,159 | - | 309,042 | - | (7,319,957) | 13,237,160 |
| Servcorp Ltd. | 21,529,146 | - | - | 997,307 | - | (6,115,465) | 15,413,681 |
| SomnoMed Ltd. | 8,131,043 | - | - | - | - | (4,432,882) | 3,698,161 |
| Ten Entertainment Group PLC | 21,673,179 | - | - | 198,536 | - | (7,082,830) | 14,590,349 |
| Vitzrocell Co. Ltd. | 19,748,086 | 595,477 | - | 144,227 | - | (8,014,958) | 12,328,605 |
| Total | 117,974,022 | 19,053,159 | - | 2,686,649 | - | (35,091,736) | 101,935,445 |
| Valuation Inputs at Reporting Date: | ||||
| Description | Total ($) | Level 1 ($) | Level 2 ($) | Level 3 ($) |
Investments in Securities: | ||||
| Equities: | ||||
Communication Services | 102,285,031 | 102,285,031 | - | - |
Consumer Discretionary | 466,305,773 | 466,305,773 | - | - |
Consumer Staples | 247,566,842 | 223,792,577 | 23,774,265 | - |
Energy | 121,217,301 | 121,217,301 | - | - |
Financials | 318,504,792 | 318,504,792 | - | - |
Health Care | 217,515,857 | 217,515,857 | - | - |
Industrials | 608,777,003 | 593,499,022 | 15,277,981 | - |
Information Technology | 307,569,126 | 279,397,455 | 28,171,671 | - |
Materials | 262,094,212 | 262,094,211 | - | 1 |
Real Estate | 214,954,253 | 196,226,117 | 18,728,136 | - |
| Money Market Funds | 28,602,852 | 28,602,852 | - | - |
| Total Investments in Securities: | 2,895,393,042 | 2,809,440,988 | 85,952,053 | 1 |
| Statement of Assets and Liabilities | ||||
| October 31, 2022 | ||||
| Assets | ||||
| Investment in securities, at value (including securities loaned of $26,092,987) - See accompanying schedule: | ||||
Unaffiliated issuers (cost $3,137,691,125) | $2,764,854,745 | |||
Fidelity Central Funds (cost $28,602,852) | 28,602,852 | |||
Other affiliated issuers (cost $129,968,147) | 101,935,445 | |||
| Total Investment in Securities (cost $3,296,262,124) | $ | 2,895,393,042 | ||
| Cash | 883 | |||
| Foreign currency held at value (cost $69,021,532) | 68,757,462 | |||
| Receivable for investments sold | 3,385,340 | |||
| Receivable for fund shares sold | 9,504,226 | |||
| Dividends receivable | 6,004,041 | |||
| Reclaims receivable | 2,114,369 | |||
| Distributions receivable from Fidelity Central Funds | 42,615 | |||
| Prepaid expenses | 5,008 | |||
| Other receivables | 28,286 | |||
Total assets | 2,985,235,272 | |||
| Liabilities | ||||
| Payable for investments purchased | $4,658,944 | |||
| Payable for fund shares redeemed | 8,155,086 | |||
| Accrued management fee | 2,040,914 | |||
| Distribution and service plan fees payable | 36,101 | |||
| Notes payable to affiliates | 8,614,000 | |||
| Other affiliated payables | 439,527 | |||
| Other payables and accrued expenses | 1,478,989 | |||
| Collateral on securities loaned | 28,598,758 | |||
| Total Liabilities | 54,022,319 | |||
| Net Assets | $ | 2,931,212,953 | ||
| Net Assets consist of: | ||||
| Paid in capital | $ | 3,386,578,609 | ||
| Total accumulated earnings (loss) | (455,365,656) | |||
| Net Assets | $ | 2,931,212,953 | ||
| Net Asset Value and Maximum Offering Price | ||||
| Class A : | ||||
Net Asset Value and redemption price per share ($95,905,706 ÷ 4,016,869 shares) (a) | $ | 23.88 | ||
| Maximum offering price per share (100/94.25 of $23.88) | $ | 25.34 | ||
| Class M : | ||||
Net Asset Value and redemption price per share ($13,761,455 ÷ 579,816 shares) (a) | $ | 23.73 | ||
| Maximum offering price per share (100/96.50 of $23.73) | $ | 24.59 | ||
| Class C : | ||||
Net Asset Value and offering price per share ($13,556,068 ÷ 592,427 shares) (a) | $ | 22.88 | ||
| International Small Cap : | ||||
Net Asset Value , offering price and redemption price per share ($1,145,773,580 ÷ 46,898,032 shares) | $ | 24.43 | ||
| Class I : | ||||
Net Asset Value , offering price and redemption price per share ($696,514,818 ÷ 28,316,973 shares) | $ | 24.60 | ||
| Class Z : | ||||
Net Asset Value , offering price and redemption price per share ($965,701,326 ÷ 39,272,466 shares) | $ | 24.59 | ||
(a)Redemption price per share is equal to net asset value less any applicable contingent deferred sales charge. | ||||
| Statement of Operations | ||||
Year ended October 31, 2022 | ||||
| Investment Income | ||||
| Dividends (including $2,686,649 earned from affiliated issuers) | $ | 123,557,876 | ||
| Income from Fidelity Central Funds (including $186,494 from security lending) | 606,959 | |||
| Income before foreign taxes withheld | 124,164,835 | |||
| Less foreign taxes withheld | (11,776,852) | |||
| Total Income | 112,387,983 | |||
| Expenses | ||||
| Management fee | ||||
| Basic fee | $ | 27,693,906 | ||
| Performance adjustment | (1,434,285) | |||
| Transfer agent fees | 4,533,367 | |||
| Distribution and service plan fees | 550,154 | |||
| Accounting fees | 1,409,702 | |||
| Custodian fees and expenses | 421,812 | |||
| Independent trustees' fees and expenses | 11,490 | |||
| Registration fees | 225,733 | |||
| Audit | 101,917 | |||
| Legal | 3,120 | |||
| Interest | 3,502 | |||
| Miscellaneous | 14,515 | |||
| Total expenses before reductions | 33,534,933 | |||
| Expense reductions | (108,556) | |||
| Total expenses after reductions | 33,426,377 | |||
| Net Investment income (loss) | 78,961,606 | |||
| Realized and Unrealized Gain (Loss) | ||||
| Net realized gain (loss) on: | ||||
| Investment Securities: | ||||
| Unaffiliated issuers(net of foreign taxes of $2,244,989) | (40,029,740) | |||
| Fidelity Central Funds | 4,759 | |||
| Foreign currency transactions | (16,555,905) | |||
| Total net realized gain (loss) | (56,580,886) | |||
| Change in net unrealized appreciation (depreciation) on: | ||||
| Investment Securities: | ||||
| Unaffiliated issuers (net of decrease in deferred foreign taxes of $4,092,323) | (957,990,887) | |||
| Fidelity Central Funds | (4,759) | |||
| Other affiliated issuers | (35,091,736) | |||
| Assets and liabilities in foreign currencies | (87,414) | |||
| Total change in net unrealized appreciation (depreciation) | (993,174,796) | |||
| Net gain (loss) | (1,049,755,682) | |||
| Net increase (decrease) in net assets resulting from operations | $ | (970,794,076) | ||
| Statement of Changes in Net Assets | ||||
Year ended October 31, 2022 | Year ended October 31, 2021 | |||
| Increase (Decrease) in Net Assets | ||||
| Operations | ||||
| Net investment income (loss) | $ | 78,961,606 | $ | 37,418,269 |
| Net realized gain (loss) | (56,580,886) | 202,743,430 | ||
| Change in net unrealized appreciation (depreciation) | (993,174,796) | 628,841,749 | ||
| Net increase (decrease) in net assets resulting from operations | (970,794,076) | 869,003,448 | ||
| Distributions to shareholders | (242,362,167) | (21,019,114) | ||
| Share transactions - net increase (decrease) | 612,399,770 | 558,815,987 | ||
| Total increase (decrease) in net assets | (600,756,473) | 1,406,800,321 | ||
| Net Assets | ||||
| Beginning of period | 3,531,969,426 | 2,125,169,105 | ||
| End of period | $ | 2,931,212,953 | $ | 3,531,969,426 |
| Fidelity Advisor® International Small Cap Fund Class A |
| Years ended October 31, | 2022 | 2021 | 2020 | 2019 | 2018 | |||||
Selected Per-Share Data | ||||||||||
| Net asset value, beginning of period | $ | 34.31 | $ | 24.75 | $ | 26.32 | $ | 25.78 | $ | 29.24 |
| Income from Investment Operations | ||||||||||
Net investment income (loss) A,B | .58 | .31 | .27 | .49 | .38 | |||||
| Net realized and unrealized gain (loss) | (8.74) | 9.42 | (1.26) | 1.43 | (2.87) | |||||
| Total from investment operations | (8.16) | 9.73 | (.99) | 1.92 | (2.49) | |||||
| Distributions from net investment income | (.75) | (.17) | (.44) | (.38) | (.23) | |||||
| Distributions from net realized gain | (1.52) | - | (.14) | (1.00) | (.74) | |||||
| Total distributions | (2.27) | (.17) | (.58) | (1.38) | (.97) | |||||
Redemption fees added to paid in capital A | - | - | - | - | - C | |||||
| Net asset value, end of period | $ | 23.88 | $ | 34.31 | $ | 24.75 | $ | 26.32 | $ | 25.78 |
Total Return D,E | (25.19)% | 39.43% | (3.91)% | 8.00% | (8.83)% | |||||
Ratios to Average Net Assets B,F,G | ||||||||||
| Expenses before reductions | 1.29% | 1.29% | 1.36% | 1.47% | 1.49% | |||||
| Expenses net of fee waivers, if any | 1.29% | 1.29% | 1.36% | 1.47% | 1.49% | |||||
| Expenses net of all reductions | 1.29% | 1.29% | 1.35% | 1.46% | 1.48% | |||||
| Net investment income (loss) | 2.06% | .95% | 1.09% | 1.94% | 1.33% | |||||
| Supplemental Data | ||||||||||
| Net assets, end of period (000 omitted) | $ | 95,906 | $ | 136,131 | $ | 92,044 | $ | 105,786 | $ | 80,395 |
Portfolio turnover rate H | 17% | 28% | 43% | 28% | 25% |
| Fidelity Advisor® International Small Cap Fund Class M |
| Years ended October 31, | 2022 | 2021 | 2020 | 2019 | 2018 | |||||
Selected Per-Share Data | ||||||||||
| Net asset value, beginning of period | $ | 34.12 | $ | 24.62 | $ | 26.18 | $ | 25.62 | $ | 29.07 |
| Income from Investment Operations | ||||||||||
Net investment income (loss) A,B | .50 | .22 | .19 | .41 | .30 | |||||
| Net realized and unrealized gain (loss) | (8.70) | 9.38 | (1.25) | 1.43 | (2.86) | |||||
| Total from investment operations | (8.20) | 9.60 | (1.06) | 1.84 | (2.56) | |||||
| Distributions from net investment income | (.66) | (.10) | (.36) | (.27) | (.15) | |||||
| Distributions from net realized gain | (1.52) | - | (.14) | (1.00) | (.74) | |||||
| Total distributions | (2.19) C | (.10) | (.50) | (1.28) C | (.89) | |||||
Redemption fees added to paid in capital A | - | - | - | - | - D | |||||
| Net asset value, end of period | $ | 23.73 | $ | 34.12 | $ | 24.62 | $ | 26.18 | $ | 25.62 |
Total Return E,F | (25.43)% | 39.07% | (4.19)% | 7.65% | (9.10)% | |||||
Ratios to Average Net Assets B,G,H | ||||||||||
| Expenses before reductions | 1.57% | 1.57% | 1.67% | 1.78% | 1.77% | |||||
| Expenses net of fee waivers, if any | 1.56% | 1.57% | 1.67% | 1.78% | 1.77% | |||||
| Expenses net of all reductions | 1.56% | 1.57% | 1.65% | 1.77% | 1.76% | |||||
| Net investment income (loss) | 1.79% | .68% | .78% | 1.62% | 1.05% | |||||
| Supplemental Data | ||||||||||
| Net assets, end of period (000 omitted) | $ | 13,761 | $ | 19,926 | $ | 12,492 | $ | 16,013 | $ | 16,362 |
Portfolio turnover rate I | 17% | 28% | 43% | 28% | 25% |
| Fidelity Advisor® International Small Cap Fund Class C |
| Years ended October 31, | 2022 | 2021 | 2020 | 2019 | 2018 | |||||
Selected Per-Share Data | ||||||||||
| Net asset value, beginning of period | $ | 32.93 | $ | 23.80 | $ | 25.27 | $ | 24.77 | $ | 28.21 |
| Income from Investment Operations | ||||||||||
Net investment income (loss) A,B | .35 | .06 | .08 | .28 | .16 | |||||
| Net realized and unrealized gain (loss) | (8.40) | 9.07 | (1.23) | 1.39 | (2.76) | |||||
| Total from investment operations | (8.05) | 9.13 | (1.15) | 1.67 | (2.60) | |||||
| Distributions from net investment income | (.48) | - | (.18) | (.17) | (.10) | |||||
| Distributions from net realized gain | (1.52) | - | (.14) | (1.00) | (.74) | |||||
| Total distributions | (2.00) | - | (.32) | (1.17) | (.84) | |||||
Redemption fees added to paid in capital A | - | - | - | - | - C | |||||
| Net asset value, end of period | $ | 22.88 | $ | 32.93 | $ | 23.80 | $ | 25.27 | $ | 24.77 |
Total Return D,E | (25.77)% | 38.36% | (4.65)% | 7.17% | (9.51)% | |||||
Ratios to Average Net Assets B,F,G | ||||||||||
| Expenses before reductions | 2.06% | 2.05% | 2.13% | 2.24% | 2.24% | |||||
| Expenses net of fee waivers, if any | 2.05% | 2.05% | 2.13% | 2.24% | 2.24% | |||||
| Expenses net of all reductions | 2.05% | 2.05% | 2.11% | 2.23% | 2.23% | |||||
| Net investment income (loss) | 1.30% | .19% | .32% | 1.16% | .58% | |||||
| Supplemental Data | ||||||||||
| Net assets, end of period (000 omitted) | $ | 13,556 | $ | 21,683 | $ | 17,659 | $ | 23,937 | $ | 41,918 |
Portfolio turnover rate H | 17% | 28% | 43% | 28% | 25% |
| Fidelity® International Small Cap Fund |
| Years ended October 31, | 2022 | 2021 | 2020 | 2019 | 2018 | |||||
Selected Per-Share Data | ||||||||||
| Net asset value, beginning of period | $ | 35.05 | $ | 25.28 | $ | 26.86 | $ | 26.29 | $ | 29.77 |
| Income from Investment Operations | ||||||||||
Net investment income (loss) A,B | .67 | .41 | .34 | .57 | .48 | |||||
| Net realized and unrealized gain (loss) | (8.94) | 9.61 | (1.27) | 1.45 | (2.93) | |||||
| Total from investment operations | (8.27) | 10.02 | (.93) | 2.02 | (2.45) | |||||
| Distributions from net investment income | (.83) | (.25) | (.51) | (.45) | (.29) | |||||
| Distributions from net realized gain | (1.52) | - | (.14) | (1.00) | (.74) | |||||
| Total distributions | (2.35) | (.25) | (.65) | (1.45) | (1.03) | |||||
Redemption fees added to paid in capital A | - | - | - | - | - C | |||||
| Net asset value, end of period | $ | 24.43 | $ | 35.05 | $ | 25.28 | $ | 26.86 | $ | 26.29 |
Total Return D | (25.01)% | 39.83% | (3.61)% | 8.27% | (8.54)% | |||||
Ratios to Average Net Assets B,E,F | ||||||||||
| Expenses before reductions | 1.02% | 1.01% | 1.08% | 1.19% | 1.20% | |||||
| Expenses net of fee waivers, if any | 1.02% | 1.01% | 1.08% | 1.19% | 1.20% | |||||
| Expenses net of all reductions | 1.02% | 1.01% | 1.07% | 1.18% | 1.19% | |||||
| Net investment income (loss) | 2.33% | 1.23% | 1.37% | 2.22% | 1.62% | |||||
| Supplemental Data | ||||||||||
| Net assets, end of period (000 omitted) | $ | 1,145,773 | $ | 1,534,214 | $ | 1,122,746 | $ | 1,282,412 | $ | 1,256,193 |
Portfolio turnover rate G | 17% | 28% | 43% | 28% | 25% |
| Fidelity Advisor® International Small Cap Fund Class I |
| Years ended October 31, | 2022 | 2021 | 2020 | 2019 | 2018 | |||||
Selected Per-Share Data | ||||||||||
| Net asset value, beginning of period | $ | 35.27 | $ | 25.44 | $ | 27.03 | $ | 26.45 | $ | 29.97 |
| Income from Investment Operations | ||||||||||
Net investment income (loss) A,B | .68 | .41 | .35 | .58 | .47 | |||||
| Net realized and unrealized gain (loss) | (8.99) | 9.67 | (1.28) | 1.46 | (2.95) | |||||
| Total from investment operations | (8.31) | 10.08 | (.93) | 2.04 | (2.48) | |||||
| Distributions from net investment income | (.84) | (.25) | (.52) | (.46) | (.30) | |||||
| Distributions from net realized gain | (1.52) | - | (.14) | (1.00) | (.74) | |||||
| Total distributions | (2.36) | (.25) | (.66) | (1.46) | (1.04) | |||||
Redemption fees added to paid in capital A | - | - | - | - | - C | |||||
| Net asset value, end of period | $ | 24.60 | $ | 35.27 | $ | 25.44 | $ | 27.03 | $ | 26.45 |
Total Return D | (24.98)% | 39.80% | (3.62)% | 8.28% | (8.58)% | |||||
Ratios to Average Net Assets B,E,F | ||||||||||
| Expenses before reductions | 1.02% | 1.02% | 1.08% | 1.19% | 1.21% | |||||
| Expenses net of fee waivers, if any | 1.01% | 1.02% | 1.08% | 1.18% | 1.21% | |||||
| Expenses net of all reductions | 1.01% | 1.02% | 1.06% | 1.18% | 1.20% | |||||
| Net investment income (loss) | 2.34% | 1.22% | 1.38% | 2.22% | 1.61% | |||||
| Supplemental Data | ||||||||||
| Net assets, end of period (000 omitted) | $ | 696,515 | $ | 1,080,258 | $ | 605,100 | $ | 777,771 | $ | 564,988 |
Portfolio turnover rate G | 17% | 28% | 43% | 28% | 25% |
| Fidelity Advisor® International Small Cap Fund Class Z |
| Years ended October 31, | 2022 | 2021 | 2020 | 2019 | 2018 A | |||||
Selected Per-Share Data | ||||||||||
| Net asset value, beginning of period | $ | 35.26 | $ | 25.43 | $ | 27.03 | $ | 26.46 | $ | 28.78 |
| Income from Investment Operations | ||||||||||
Net investment income (loss) B,C | .70 | .45 | .38 | .61 | .03 | |||||
| Net realized and unrealized gain (loss) | (8.97) | 9.67 | (1.28) | 1.47 | (2.35) | |||||
| Total from investment operations | (8.27) | 10.12 | (.90) | 2.08 | (2.32) | |||||
| Distributions from net investment income | (.88) | (.29) | (.56) | (.50) | - | |||||
| Distributions from net realized gain | (1.52) | - | (.14) | (1.00) | - | |||||
| Total distributions | (2.40) | (.29) | (.70) | (1.51) D | - | |||||
| Net asset value, end of period | $ | 24.59 | $ | 35.26 | $ | 25.43 | $ | 27.03 | $ | 26.46 |
Total Return E,F | (24.89)% | 39.99% | (3.51)% | 8.44% | (8.06)% | |||||
Ratios to Average Net Assets C,G,H | ||||||||||
| Expenses before reductions | .89% | .89% | .94% | 1.05% | 1.15% I | |||||
| Expenses net of fee waivers, if any | .89% | .89% | .94% | 1.05% | 1.15% I | |||||
| Expenses net of all reductions | .89% | .89% | .93% | 1.04% | 1.14% I | |||||
| Net investment income (loss) | 2.47% | 1.35% | 1.51% | 2.35% | 2.01% I | |||||
| Supplemental Data | ||||||||||
| Net assets, end of period (000 omitted) | $ | 965,701 | $ | 739,757 | $ | 275,127 | $ | 245,252 | $ | 7,421 |
Portfolio turnover rate J | 17% | 28% | 43% | 28% | 25% |
| Fidelity Central Fund | Investment Manager | Investment Objective | Investment Practices | Expense Ratio A |
| Fidelity Money Market Central Funds | Fidelity Management & Research Company LLC (FMR) | Each fund seeks to obtain a high level of current income consistent with the preservation of capital and liquidity. | Short-term Investments | Less than .005% |
| Gross unrealized appreciation | $309,471,529 |
| Gross unrealized depreciation | (739,030,295) |
| Net unrealized appreciation (depreciation) | $(429,558,766) |
| Tax Cost | $3,324,951,808 |
| Undistributed ordinary income | $18,129,547 |
| Capital loss carryforward | $(42,069,008) |
| Net unrealized appreciation (depreciation) on securities and other investments | $(430,166,859) |
Short-term | $(27,055,387) |
Long-term | (15,013,621) |
| Total capital loss carryforward | $(42,069,008) |
| October 31, 2022 | October 31, 2021 | |
| Ordinary Income | $ 136,799,647 | $ 21,019,114 |
| Long-term Capital Gains | 105,562,520 | - |
| Total | $242,362,167 | $21,019,114 |
| Purchases ($) | Sales ($) | |
| Fidelity International Small Cap Fund | 1,126,228,014 | 556,225,532 |
| Distribution Fee | Service Fee | Total Fees | Retained by FDC | |
| Class A | - % | .25% | $290,660 | $5,231 |
| Class M | .25% | .25% | 83,566 | 57 |
| Class C | .75% | .25% | 175,928 | 16,534 |
| $550,154 | $21,822 |
| Retained by FDC | |
| Class A | $17,256 |
| Class M | 2,264 |
Class C A | 82 |
| $19,602 |
| Amount | % of Class-Level Average Net Assets | |
| Class A | $226,004 | .19 |
| Class M | 36,170 | .22 |
| Class C | 36,139 | .21 |
| International Small Cap | 2,274,839 | .17 |
| Class I | 1,559,314 | .17 |
| Class Z | 400,901 | .04 |
| $4,533,367 |
| % of Average Net Assets | |
| Fidelity International Small Cap Fund | .04 |
| Amount | |
| Fidelity International Small Cap Fund | $1,625 |
| Borrower or Lender | Average Loan Balance | Weighted Average Interest Rate | Interest Expense | |
Fidelity International Small Cap Fund . | Borrower | $10,035,000 | 2.09% | $3,502 |
| Purchases ($) | Sales ($) | Realized Gain (Loss) ($) | |
| Fidelity International Small Cap Fund | 41,891,053 | 42,676,684 | (9,817,377) |
| Amount ($) | |
| Fidelity International Small Cap Fund | 55,117 |
| Amount | |
| Fidelity International Small Cap Fund | $5,827 |
| Total Security Lending Fees Paid to NFS | Security Lending Income From Securities Loaned to NFS | Value of Securities Loaned to NFS at Period End | |
| Fidelity International Small Cap Fund | $ 20,222 | $- | $- |
Year ended October 31, 2022 | Year ended October 31, 2021 | |
| Fidelity International Small Cap Fund | ||
| Distributions to shareholders | ||
| Class A | $ 9,065,367 | $622,406 |
| Class M | 1,272,726 | 53,224 |
| Class C | 1,312,589 | - |
| International Small Cap | 100,730,178 | 11,248,767 |
| Class I | 74,208,475 | 5,954,650 |
| Class Z | 55,772,832 | 3,140,067 |
Total | $242,362,167 | $21,019,114 |
| Shares | Shares | Dollars | Dollars | |
| Year ended October 31, 2022 | Year ended October 31, 2021 | Year ended October 31, 2022 | Year ended October 31, 2021 | |
| Fidelity International Small Cap Fund | ||||
| Class A | ||||
| Shares sold | 830,534 | 1,096,168 | $ 23,685,249 | $ 36,087,902 |
| Reinvestment of distributions | 295,136 | 20,641 | 8,995,592 | 602,724 |
| Shares redeemed | (1,076,634) | (868,345) | (30,435,716) | (27,783,984) |
| Net increase (decrease) | 49,036 | 248,464 | $2,245,125 | $ 8,906,642 |
| Class M | ||||
| Shares sold | 86,516 | 192,504 | $2,471,290 | $6,165,671 |
| Reinvestment of distributions | 41,863 | 1,822 | 1,271,367 | 53,041 |
| Shares redeemed | (132,638) | (117,643) | (3,771,297) | (3,719,741) |
| Net increase (decrease) | (4,259) | 76,683 | $(28,640) | $2,498,971 |
| Class C | ||||
| Shares sold | 60,983 | 124,712 | $1,691,801 | $3,881,022 |
| Reinvestment of distributions | 44,584 | - | 1,311,796 | - |
| Shares redeemed | (171,531) | (208,320) | (4,624,227) | (6,445,073) |
| Net increase (decrease) | (65,964) | (83,608) | $(1,620,630) | $(2,564,051) |
| International Small Cap | ||||
| Shares sold | 13,356,832 | 11,483,683 | $375,220,830 | $380,507,391 |
| Reinvestment of distributions | 2,945,011 | 351,180 | 91,615,712 | 10,447,597 |
| Shares redeemed | (13,181,058) | (12,475,148) | (380,933,549) | (415,087,040) |
| Net increase (decrease) | 3,120,785 | (640,285) | $85,902,993 | $(24,132,052) |
| Class I | ||||
| Shares sold | 13,697,966 | 14,337,771 | $404,258,743 | $ 478,972,006 |
| Reinvestment of distributions | 2,305,754 | 190,830 | 72,208,170 | 5,715,372 |
| Shares redeemed | (18,313,122) | (7,690,269) | (518,387,511) | (254,833,029) |
| Net increase (decrease) | (2,309,402) | 6,838,332 | $(41,920,598) | $229,854,349 |
| Class Z | ||||
| Shares sold | 35,845,899 | 15,195,411 | $1,046,158,928 | $516,119,932 |
| Reinvestment of distributions | 1,517,664 | 86,491 | 47,460,406 | 2,586,946 |
| Shares redeemed | (19,068,812) | (5,123,203) | (525,797,814) | (174,454,750) |
| Net increase (decrease) | 18,294,751 | 10,158,699 | $567,821,520 | $344,252,128 |
| The Example is based on an investment of $1,000 invested at the beginning of the period and held for the entire period (May 1, 2022 to October 31, 2022). |
Annualized Expense Ratio- A | Beginning Account Value May 1, 2022 | Ending Account Value October 31, 2022 | Expenses Paid During Period- C May 1, 2022 to October 31, 2022 | |||||||
| Fidelity® International Small Cap Fund | ||||||||||
| Class A | 1.30% | |||||||||
| Actual | $ 1,000 | $ 856.20 | $ 6.08 | |||||||
Hypothetical- B | $ 1,000 | $ 1,018.65 | $ 6.61 | |||||||
| Class M | 1.58% | |||||||||
| Actual | $ 1,000 | $ 854.80 | $ 7.39 | |||||||
Hypothetical- B | $ 1,000 | $ 1,017.24 | $ 8.03 | |||||||
| Class C | 2.06% | |||||||||
| Actual | $ 1,000 | $ 852.80 | $ 9.62 | |||||||
Hypothetical- B | $ 1,000 | $ 1,014.82 | $ 10.46 | |||||||
| Fidelity® International Small Cap Fund | 1.03% | |||||||||
| Actual | $ 1,000 | $ 857.20 | $ 4.82 | |||||||
Hypothetical- B | $ 1,000 | $ 1,020.01 | $ 5.24 | |||||||
| Class I | 1.02% | |||||||||
| Actual | $ 1,000 | $ 857.40 | $ 4.78 | |||||||
Hypothetical- B | $ 1,000 | $ 1,020.06 | $ 5.19 | |||||||
| Class Z | .89% | |||||||||
| Actual | $ 1,000 | $ 858.00 | $ 4.17 | |||||||
Hypothetical- B | $ 1,000 | $ 1,020.72 | $ 4.53 | |||||||
| Class A | Class M | Class C | International Small Cap | Class I | Class Z | |
| Fidelity International Small Cap Fund | ||||||
| December 3, 2021 | 42% | 45% | 54% | 40% | 40% | 38% |
| December 28, 2021 | 36% | 36% | 36% | 36% | 36% | 36% |
| Pay Date | Income | Taxes | |
| Fidelity International Small Cap Fund | |||
| Class A | 12/06/21 | $0.9521 | $0.1315 |
| Class M | 12/06/21 | $0.8876 | $0.1315 |
| Class C | 12/06/21 | $0.7495 | $0.1315 |
| International Small Cap | 12/06/21 | $1.0129 | $0.1315 |
| Class I | 12/06/21 | $1.0174 | $0.1315 |
| Class Z | 12/06/21 | $1.0493 | $0.1315 |
| Class A | 12/29/21 | $0.0000 | $0.0000 |
| Class M | 12/29/21 | $0.0000 | $0.0000 |
| Class C | 12/29/21 | $0.0000 | $0.0000 |
| International Small Cap | 12/29/21 | $0.0000 | $0.0000 |
| Class I | 12/29/21 | $0.0000 | $0.0000 |
| Class Z | 12/29/21 | $0.0000 | $0.0000 |
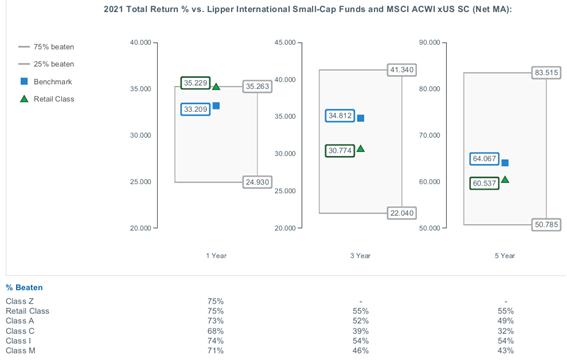
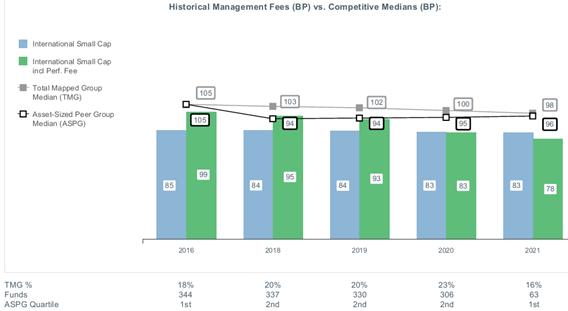
|


Contents
Board Approval of Investment Advisory Contracts and Management Fees |
| Average Annual Total Returns | |||
Periods ended October 31, 2022 | Past 1 year | Past 5 years | Past 10 years |
| Class A (incl.5.75% sales charge) | 16.18% | 10.19% | 4.13% |
| Class M (incl.3.50% sales charge) | 18.62% | 10.40% | 4.08% |
Class C (incl. contingent deferred sales charge) | 21.34% | 10.70% | 4.12% |
| Fidelity® Global Commodity Stock Fund | 23.57% | 11.80% | 5.01% |
| Class I | 23.56% | 11.87% | 5.09% |
| Class Z | 23.72% | 11.98% | 5.14% |
| $10,000 Over 10 Years |
Let's say hypothetically that $10,000 was invested in Fidelity® Global Commodity Stock Fund, a class of the fund, on October 31, 2012. The chart shows how the value of your investment would have changed, and also shows how the MSCI All Country World Index (Net MA) performed over the same period. |
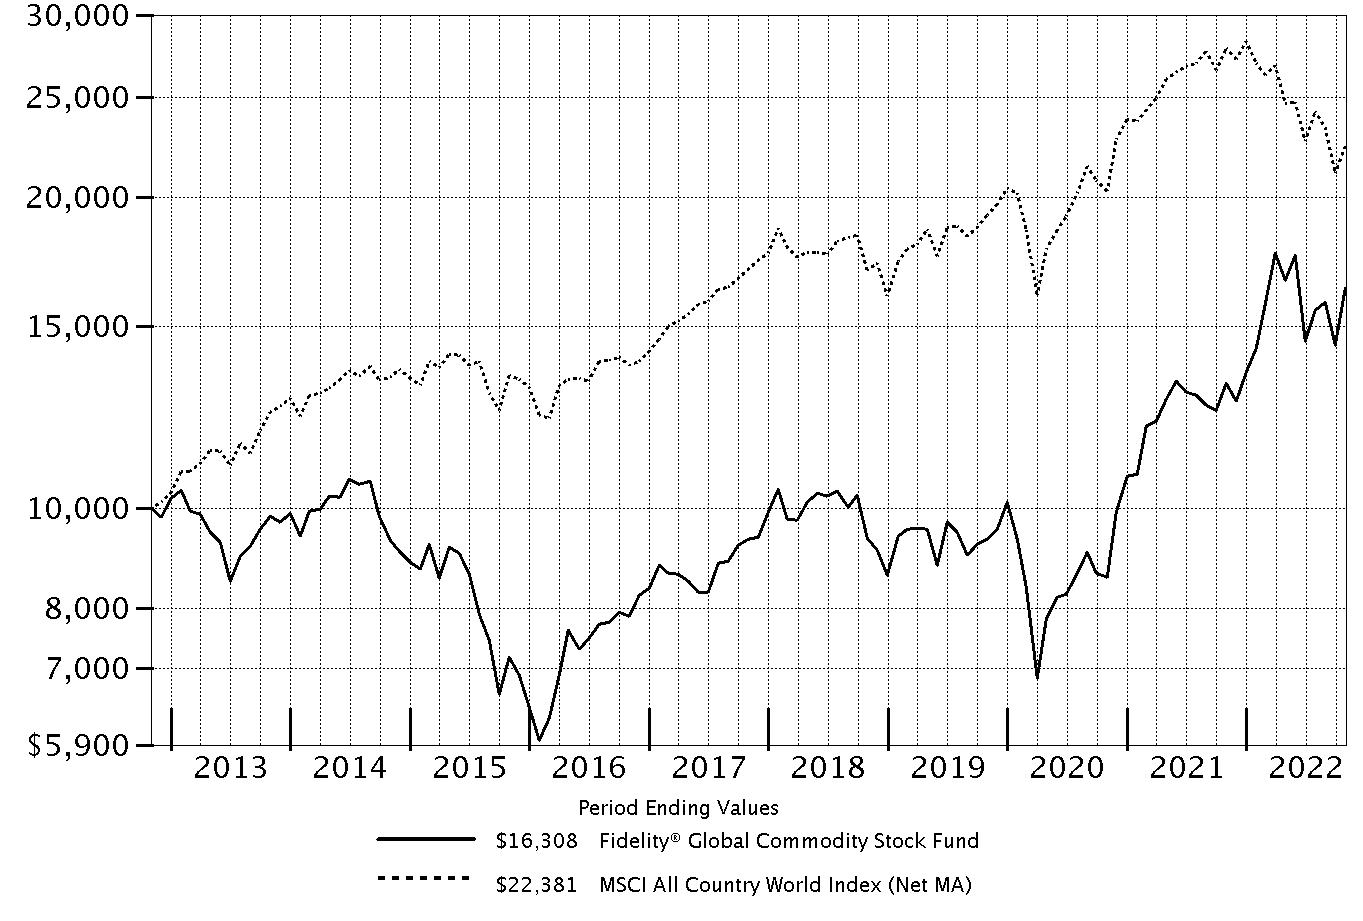 |
Top Holdings (% of Fund's net assets) | ||
| Exxon Mobil Corp. | 9.8 | |
| Nutrien Ltd. | 6.1 | |
| Archer Daniels Midland Co. | 6.1 | |
| Chevron Corp. | 6.0 | |
| Corteva, Inc. | 5.4 | |
| CF Industries Holdings, Inc. | 4.8 | |
| ConocoPhillips Co. | 3.8 | |
| Diamondback Energy, Inc. | 2.9 | |
| Canadian Natural Resources Ltd. | 2.6 | |
| Rio Tinto PLC | 2.4 | |
| 49.9 | ||
| Industries (% of Fund's net assets) | ||
| Oil, Gas & Consumable Fuels | 40.0 | |
| Chemicals | 22.7 | |
| Metals & Mining | 22.0 | |
| Food Products | 8.9 | |
| Paper & Forest Products | 5.3 | |
Geographic Diversification (% of Fund's net assets) |
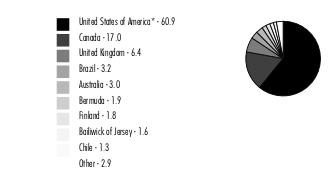 |
* Includes Short-Term investments and Net Other Assets (Liabilities). Percentages are based on country or territory of incorporation and are adjusted for the effect of futures contracts, if applicable. |
| Common Stocks - 97.6% | |||
| Shares | Value ($) | ||
| Chemicals - 21.4% | |||
| Fertilizers & Agricultural Chemicals - 20.0% | |||
| CF Industries Holdings, Inc. | 821,860 | 87,330,844 | |
| Corteva, Inc. | 1,509,000 | 98,598,060 | |
| FMC Corp. | 179,500 | 21,342,550 | |
| Icl Group Ltd. | 1,354,000 | 12,231,235 | |
| Nutrien Ltd. (a) | 1,315,983 | 111,192,280 | |
| The Mosaic Co. | 600,561 | 32,280,154 | |
| 362,975,123 | |||
| Specialty Chemicals - 1.4% | |||
| Albemarle Corp. | 31,300 | 8,759,931 | |
| Ecolab, Inc. | 104,600 | 16,429,522 | |
| 25,189,453 | |||
TOTAL CHEMICALS | 388,164,576 | ||
| Food Products - 8.9% | |||
| Agricultural Products - 8.9% | |||
| Archer Daniels Midland Co. | 1,144,300 | 110,974,214 | |
| Bunge Ltd. | 304,800 | 30,083,760 | |
| Darling Ingredients, Inc. (b) | 144,600 | 11,348,208 | |
| Wilmar International Ltd. | 3,346,800 | 9,173,201 | |
| 161,579,383 | |||
| Metals & Mining - 22.0% | |||
| Aluminum - 1.5% | |||
| Alcoa Corp. | 714,300 | 27,879,129 | |
| Copper - 2.9% | |||
| First Quantum Minerals Ltd. | 822,824 | 14,513,496 | |
| Freeport-McMoRan, Inc. | 994,100 | 31,503,029 | |
| Lundin Mining Corp. | 1,328,600 | 6,963,118 | |
| 52,979,643 | |||
| Diversified Metals & Mining - 7.9% | |||
| Anglo American PLC (United Kingdom) | 635,847 | 19,046,299 | |
| BHP Group Ltd. (London) | 963,700 | 22,948,879 | |
| Glencore PLC | 4,996,500 | 28,645,303 | |
| Grupo Mexico SA de CV Series B | 577,020 | 2,091,927 | |
| IGO Ltd. | 1,426,344 | 13,949,999 | |
| Ivanhoe Mines Ltd. (b) | 724,500 | 5,025,526 | |
| Rio Tinto PLC | 844,430 | 44,131,308 | |
| Teck Resources Ltd. Class B (sub. vtg.) | 218,400 | 6,648,107 | |
| 142,487,348 | |||
| Gold - 5.1% | |||
| Agnico Eagle Mines Ltd. (Canada) (a) | 572,717 | 25,193,915 | |
| Barrick Gold Corp. (Canada) | 1,371,347 | 20,625,317 | |
| Franco-Nevada Corp. | 60,871 | 7,521,133 | |
| Newcrest Mining Ltd. | 650,612 | 7,205,711 | |
| Newmont Corp. | 519,900 | 22,002,168 | |
| Wheaton Precious Metals Corp. | 309,000 | 10,109,098 | |
| 92,657,342 | |||
| Precious Metals & Minerals - 0.3% | |||
| Anglo American Platinum Ltd. ADR (a) | 146,700 | 1,954,044 | |
| Impala Platinum Holdings Ltd. | 372,900 | 3,817,999 | |
| 5,772,043 | |||
| Steel - 4.3% | |||
| Commercial Metals Co. | 214,600 | 9,764,300 | |
| Fortescue Metals Group Ltd. | 908,243 | 8,556,562 | |
| Nucor Corp. | 145,992 | 19,180,429 | |
| Steel Dynamics, Inc. | 126,300 | 11,878,515 | |
| Vale SA | 2,199,400 | 28,583,046 | |
| 77,962,852 | |||
TOTAL METALS & MINING | 399,738,357 | ||
| Oil, Gas & Consumable Fuels - 40.0% | |||
| Integrated Oil & Gas - 22.6% | |||
| Cenovus Energy, Inc. (Canada) | 1,623,000 | 32,809,058 | |
| Chevron Corp. | 596,200 | 107,852,580 | |
| Equinor ASA | 363,900 | 13,258,232 | |
| Exxon Mobil Corp. | 1,610,000 | 178,404,095 | |
| Occidental Petroleum Corp. | 397,500 | 28,858,500 | |
| Petroleo Brasileiro SA - Petrobras (ON) | 2,018,900 | 12,999,441 | |
| Shell PLC (London) | 1,297,659 | 35,947,240 | |
| 410,129,146 | |||
| Oil & Gas Exploration & Production - 17.4% | |||
| Antero Resources Corp. (b) | 631,312 | 23,143,898 | |
| Canadian Natural Resources Ltd. (a) | 800,600 | 48,017,783 | |
| ConocoPhillips Co. | 551,300 | 69,513,417 | |
| Diamondback Energy, Inc. | 329,400 | 51,752,034 | |
| Hess Corp. | 210,000 | 29,626,800 | |
| MEG Energy Corp. (b) | 359,349 | 5,373,024 | |
| Ovintiv, Inc. | 568,800 | 28,809,720 | |
| Ovintiv, Inc. | 340,200 | 17,231,131 | |
| Range Resources Corp. | 1,476,900 | 42,062,112 | |
| 315,529,919 | |||
TOTAL OIL, GAS & CONSUMABLE FUELS | 725,659,065 | ||
| Paper & Forest Products - 5.3% | |||
| Forest Products - 1.4% | |||
| Svenska Cellulosa AB SCA (B Shares) | 967,100 | 11,412,992 | |
| West Fraser Timber Co. Ltd. | 188,000 | 14,115,697 | |
| 25,528,689 | |||
| Paper Products - 3.9% | |||
| Mondi PLC | 1,072,673 | 17,990,818 | |
| Nine Dragons Paper (Holdings) Ltd. | 4,257,000 | 2,521,775 | |
| Suzano Papel e Celulose SA | 1,647,545 | 16,968,230 | |
| UPM-Kymmene Corp. | 994,800 | 33,337,298 | |
| 70,818,121 | |||
TOTAL PAPER & FOREST PRODUCTS | 96,346,810 | ||
| TOTAL COMMON STOCKS (Cost $1,519,723,941) | 1,771,488,191 | ||
| Nonconvertible Preferred Stocks - 1.3% | |||
| Shares | Value ($) | ||
| Chemicals - 1.3% | |||
| Fertilizers & Agricultural Chemicals - 1.3% | |||
Sociedad Quimica y Minera de Chile SA (PN-B) (Cost $15,615,028) | 243,770 | 23,201,427 | |
| Money Market Funds - 2.9% | |||
| Shares | Value ($) | ||
| Fidelity Cash Central Fund 3.10% (c) | 32,022,504 | 32,028,909 | |
| Fidelity Securities Lending Cash Central Fund 3.10% (c)(d) | 20,389,411 | 20,391,450 | |
| TOTAL MONEY MARKET FUNDS (Cost $52,420,359) | 52,420,359 | ||
| TOTAL INVESTMENT IN SECURITIES - 101.8% (Cost $1,587,759,328) | 1,847,109,977 |
NET OTHER ASSETS (LIABILITIES) - (1.8)% | (31,993,177) |
| NET ASSETS - 100.0% | 1,815,116,800 |
| (a) | Security or a portion of the security is on loan at period end. |
| (b) | Non-income producing |
| (c) | Affiliated fund that is generally available only to investment companies and other accounts managed by Fidelity Investments. The rate quoted is the annualized seven-day yield of the fund at period end. A complete unaudited listing of the fund's holdings as of its most recent quarter end is available upon request. In addition, each Fidelity Central Fund's financial statements, which are not covered by the Fund's Report of Independent Registered Public Accounting Firm, are available on the SEC's website or upon request. |
| (d) | Investment made with cash collateral received from securities on loan. |
| Affiliate | Value, beginning of period ($) | Purchases ($) | Sales Proceeds ($) | Dividend Income ($) | Realized Gain (loss) ($) | Change in Unrealized appreciation (depreciation) ($) | Value, end of period ($) | % ownership, end of period |
| Fidelity Cash Central Fund 3.10% | 12,474,618 | 735,763,358 | 716,209,067 | 243,547 | - | - | 32,028,909 | 0.1% |
| Fidelity Securities Lending Cash Central Fund 3.10% | - | 635,578,090 | 615,186,640 | 120,123 | - | - | 20,391,450 | 0.1% |
| Total | 12,474,618 | 1,371,341,448 | 1,331,395,707 | 363,670 | - | - | 52,420,359 | |
| Valuation Inputs at Reporting Date: | ||||
| Description | Total ($) | Level 1 ($) | Level 2 ($) | Level 3 ($) |
Investments in Securities: | ||||
| Common Stocks | 1,771,488,191 | 1,610,879,537 | 160,608,654 | - |
| Nonconvertible Preferred Stocks | 23,201,427 | 23,201,427 | - | - |
| Money Market Funds | 52,420,359 | 52,420,359 | - | - |
| Total Investments in Securities: | 1,847,109,977 | 1,686,501,323 | 160,608,654 | - |
| Statement of Assets and Liabilities | ||||
| October 31, 2022 | ||||
| Assets | ||||
| Investment in securities, at value (including securities loaned of $19,548,722) - See accompanying schedule: | ||||
Unaffiliated issuers (cost $1,535,338,969) | $1,794,689,618 | |||
Fidelity Central Funds (cost $52,420,359) | 52,420,359 | |||
| Total Investment in Securities (cost $1,587,759,328) | $ | 1,847,109,977 | ||
| Cash | 24 | |||
| Foreign currency held at value (cost $483) | 483 | |||
| Receivable for investments sold | 6,186,568 | |||
| Receivable for fund shares sold | 6,125,808 | |||
| Dividends receivable | 798,254 | |||
| Distributions receivable from Fidelity Central Funds | 91,905 | |||
| Prepaid expenses | 2,354 | |||
| Other receivables | 3,062 | |||
Total assets | 1,860,318,435 | |||
| Liabilities | ||||
| Payable for investments purchased | $19,526,251 | |||
| Payable for fund shares redeemed | 3,849,722 | |||
| Accrued management fee | 970,821 | |||
| Distribution and service plan fees payable | 62,609 | |||
| Other affiliated payables | 299,551 | |||
| Other payables and accrued expenses | 101,231 | |||
| Collateral on securities loaned | 20,391,450 | |||
| Total Liabilities | 45,201,635 | |||
| Net Assets | $ | 1,815,116,800 | ||
| Net Assets consist of: | ||||
| Paid in capital | $ | 1,736,670,310 | ||
| Total accumulated earnings (loss) | 78,446,490 | |||
| Net Assets | $ | 1,815,116,800 | ||
| Net Asset Value and Maximum Offering Price | ||||
| Class A : | ||||
Net Asset Value and redemption price per share ($128,362,714 ÷ 6,581,493 shares) (a) | $ | 19.50 | ||
| Maximum offering price per share (100/94.25 of $19.50) | $ | 20.69 | ||
| Class M : | ||||
Net Asset Value and redemption price per share ($24,512,629 ÷ 1,259,668 shares) (a) | $ | 19.46 | ||
| Maximum offering price per share (100/96.50 of $19.46) | $ | 20.17 | ||
| Class C : | ||||
Net Asset Value and offering price per share ($34,984,014 ÷ 1,813,240 shares) (a) | $ | 19.29 | ||
| Global Commodity Stock : | ||||
Net Asset Value , offering price and redemption price per share ($893,636,313 ÷ 45,716,889 shares) | $ | 19.55 | ||
| Class I : | ||||
Net Asset Value , offering price and redemption price per share ($499,190,848 ÷ 25,545,632 shares) | $ | 19.54 | ||
| Class Z : | ||||
Net Asset Value , offering price and redemption price per share ($234,430,282 ÷ 12,002,480 shares) | $ | 19.53 | ||
(a)Redemption price per share is equal to net asset value less any applicable contingent deferred sales charge. | ||||
| Statement of Operations | ||||
Year ended October 31, 2022 | ||||
| Investment Income | ||||
| Dividends | $ | 51,593,604 | ||
| Income from Fidelity Central Funds (including $120,123 from security lending) | 363,670 | |||
| Income before foreign taxes withheld | 51,957,274 | |||
| Less foreign taxes withheld | (2,233,521) | |||
| Total Income | 49,723,753 | |||
| Expenses | ||||
| Management fee | $ | 9,023,904 | ||
| Transfer agent fees | 2,256,921 | |||
| Distribution and service plan fees | 540,127 | |||
| Accounting fees | 591,448 | |||
| Custodian fees and expenses | 90,972 | |||
| Independent trustees' fees and expenses | 4,228 | |||
| Registration fees | 289,344 | |||
| Audit | 46,317 | |||
| Legal | 2,445 | |||
| Interest | 256 | |||
| Miscellaneous | 4,945 | |||
| Total expenses before reductions | 12,850,907 | |||
| Expense reductions | (43,601) | |||
| Total expenses after reductions | 12,807,306 | |||
| Net Investment income (loss) | 36,916,447 | |||
| Realized and Unrealized Gain (Loss) | ||||
| Net realized gain (loss) on: | ||||
| Investment Securities: | ||||
| Unaffiliated issuers | (10,596,192) | |||
| Foreign currency transactions | (1,018,522) | |||
| Total net realized gain (loss) | (11,614,714) | |||
| Change in net unrealized appreciation (depreciation) on: | ||||
| Investment Securities: | ||||
| Unaffiliated issuers | 103,882,129 | |||
| Assets and liabilities in foreign currencies | (22,561) | |||
| Total change in net unrealized appreciation (depreciation) | 103,859,568 | |||
| Net gain (loss) | 92,244,854 | |||
| Net increase (decrease) in net assets resulting from operations | $ | 129,161,301 | ||
| Statement of Changes in Net Assets | ||||
Year ended October 31, 2022 | Year ended October 31, 2021 | |||
| Increase (Decrease) in Net Assets | ||||
| Operations | ||||
| Net investment income (loss) | $ | 36,916,447 | $ | 22,696,698 |
| Net realized gain (loss) | (11,614,714) | 1,122,633 | ||
| Change in net unrealized appreciation (depreciation) | 103,859,568 | 181,251,005 | ||
| Net increase (decrease) in net assets resulting from operations | 129,161,301 | 205,070,336 | ||
| Distributions to shareholders | (25,407,967) | (6,996,946) | ||
| Share transactions - net increase (decrease) | 953,160,143 | 301,019,880 | ||
| Total increase (decrease) in net assets | 1,056,913,477 | 499,093,270 | ||
| Net Assets | ||||
| Beginning of period | 758,203,323 | 259,110,053 | ||
| End of period | $ | 1,815,116,800 | $ | 758,203,323 |
| Fidelity Advisor® Global Commodity Stock Fund Class A |
| Years ended October 31, | 2022 | 2021 | 2020 | 2019 | 2018 | |||||
Selected Per-Share Data | ||||||||||
| Net asset value, beginning of period | $ | 16.35 | $ | 10.80 | $ | 12.14 | $ | 12.42 | $ | 12.56 |
| Income from Investment Operations | ||||||||||
Net investment income (loss) A,B | .47 | .48 | .28 | .35 | .21 | |||||
| Net realized and unrealized gain (loss) | 3.19 | 5.24 | (1.26) | (.41) | (.22) | |||||
| Total from investment operations | 3.66 | 5.72 | (.98) | (.06) | (.01) | |||||
| Distributions from net investment income | (.51) | (.17) | (.36) | (.20) | (.09) | |||||
| Distributions from net realized gain | - | - | - | (.02) | (.05) | |||||
| Total distributions | (.51) | (.17) | (.36) | (.22) | (.13) C | |||||
Redemption fees added to paid in capital A | - | - | - | - | - D | |||||
| Net asset value, end of period | $ | 19.50 | $ | 16.35 | $ | 10.80 | $ | 12.14 | $ | 12.42 |
Total Return E,F | 23.27% | 53.37% | (8.39)% | (.44)% | (.05)% | |||||
Ratios to Average Net Assets B,G,H | ||||||||||
| Expenses before reductions | 1.19% | 1.23% | 1.31% | 1.29% | 1.28% | |||||
| Expenses net of fee waivers, if any | 1.19% | 1.22% | 1.31% | 1.28% | 1.28% | |||||
| Expenses net of all reductions | 1.19% | 1.22% | 1.29% | 1.28% | 1.27% | |||||
| Net investment income (loss) | 2.53% | 3.18% | 2.53% | 2.86% | 1.55% | |||||
| Supplemental Data | ||||||||||
| Net assets, end of period (000 omitted) | $ | 128,363 | $ | 45,343 | $ | 20,453 | $ | 25,779 | $ | 27,258 |
Portfolio turnover rate I | 42% | 37% | 40% | 55% | 70% |
| Fidelity Advisor® Global Commodity Stock Fund Class M |
| Years ended October 31, | 2022 | 2021 | 2020 | 2019 | 2018 | |||||
Selected Per-Share Data | ||||||||||
| Net asset value, beginning of period | $ | 16.32 | $ | 10.78 | $ | 12.12 | $ | 12.39 | $ | 12.53 |
| Income from Investment Operations | ||||||||||
Net investment income (loss) A,B | .42 | .44 | .25 | .31 | .16 | |||||
| Net realized and unrealized gain (loss) | 3.19 | 5.24 | (1.27) | (.40) | (.20) | |||||
| Total from investment operations | 3.61 | 5.68 | (1.02) | (.09) | (.04) | |||||
| Distributions from net investment income | (.47) | (.14) | (.32) | (.16) | (.06) | |||||
| Distributions from net realized gain | - | - | - | (.02) | (.05) | |||||
| Total distributions | (.47) | (.14) | (.32) | (.18) | (.10) C | |||||
Redemption fees added to paid in capital A | - | - | - | - | - D | |||||
| Net asset value, end of period | $ | 19.46 | $ | 16.32 | $ | 10.78 | $ | 12.12 | $ | 12.39 |
Total Return E,F | 22.93% | 52.97% | (8.72)% | (.70)% | (.30)% | |||||
Ratios to Average Net Assets B,G,H | ||||||||||
| Expenses before reductions | 1.46% | 1.52% | 1.59% | 1.59% | 1.59% | |||||
| Expenses net of fee waivers, if any | 1.46% | 1.52% | 1.59% | 1.59% | 1.59% | |||||
| Expenses net of all reductions | 1.46% | 1.52% | 1.58% | 1.59% | 1.58% | |||||
| Net investment income (loss) | 2.26% | 2.88% | 2.24% | 2.55% | 1.24% | |||||
| Supplemental Data | ||||||||||
| Net assets, end of period (000 omitted) | $ | 24,513 | $ | 8,888 | $ | 4,378 | $ | 5,416 | $ | 7,200 |
Portfolio turnover rate I | 42% | 37% | 40% | 55% | 70% |
| Fidelity Advisor® Global Commodity Stock Fund Class C |
| Years ended October 31, | 2022 | 2021 | 2020 | 2019 | 2018 | |||||
Selected Per-Share Data | ||||||||||
| Net asset value, beginning of period | $ | 16.17 | $ | 10.68 | $ | 11.99 | $ | 12.26 | $ | 12.39 |
| Income from Investment Operations | ||||||||||
Net investment income (loss) A,B | .33 | .37 | .20 | .26 | .11 | |||||
| Net realized and unrealized gain (loss) | 3.18 | 5.20 | (1.26) | (.41) | (.19) | |||||
| Total from investment operations | 3.51 | 5.57 | (1.06) | (.15) | (.08) | |||||
| Distributions from net investment income | (.39) | (.08) | (.25) | (.11) | - | |||||
| Distributions from net realized gain | - | - | - | (.02) | (.05) | |||||
| Total distributions | (.39) | (.08) | (.25) | (.12) C | (.05) | |||||
Redemption fees added to paid in capital A | - | - | - | - | - D | |||||
| Net asset value, end of period | $ | 19.29 | $ | 16.17 | $ | 10.68 | $ | 11.99 | $ | 12.26 |
Total Return E,F | 22.34% | 52.30% | (9.11)% | (1.16)% | (.67)% | |||||
Ratios to Average Net Assets B,G,H | ||||||||||
| Expenses before reductions | 1.94% | 1.97% | 2.05% | 2.02% | 2.00% | |||||
| Expenses net of fee waivers, if any | 1.93% | 1.96% | 2.04% | 2.02% | 1.99% | |||||
| Expenses net of all reductions | 1.93% | 1.96% | 2.03% | 2.01% | 1.98% | |||||
| Net investment income (loss) | 1.78% | 2.44% | 1.79% | 2.13% | .84% | |||||
| Supplemental Data | ||||||||||
| Net assets, end of period (000 omitted) | $ | 34,984 | $ | 11,020 | $ | 7,871 | $ | 11,294 | $ | 20,793 |
Portfolio turnover rate I | 42% | 37% | 40% | 55% | 70% |
| Fidelity® Global Commodity Stock Fund |
| Years ended October 31, | 2022 | 2021 | 2020 | 2019 | 2018 | |||||
Selected Per-Share Data | ||||||||||
| Net asset value, beginning of period | $ | 16.39 | $ | 10.82 | $ | 12.15 | $ | 12.44 | $ | 12.59 |
| Income from Investment Operations | ||||||||||
Net investment income (loss) A,B | .52 | .53 | .31 | .37 | .23 | |||||
| Net realized and unrealized gain (loss) | 3.19 | 5.26 | (1.26) | (.41) | (.20) | |||||
| Total from investment operations | 3.71 | 5.79 | (.95) | (.04) | .03 | |||||
| Distributions from net investment income | (.55) | (.22) | (.38) | (.23) | (.13) | |||||
| Distributions from net realized gain | - | - | - | (.02) | (.05) | |||||
| Total distributions | (.55) | (.22) | (.38) | (.25) | (.18) | |||||
Redemption fees added to paid in capital A | - | - | - | - | - C | |||||
| Net asset value, end of period | $ | 19.55 | $ | 16.39 | $ | 10.82 | $ | 12.15 | $ | 12.44 |
Total Return D | 23.57% | 53.95% | (8.16)% | (.23)% | .23% | |||||
Ratios to Average Net Assets B,E,F | ||||||||||
| Expenses before reductions | .94% | .94% | 1.02% | 1.06% | 1.08% | |||||
| Expenses net of fee waivers, if any | .94% | .94% | 1.02% | 1.06% | 1.08% | |||||
| Expenses net of all reductions | .94% | .94% | 1.00% | 1.06% | 1.06% | |||||
| Net investment income (loss) | 2.78% | 3.46% | 2.82% | 3.08% | 1.75% | |||||
| Supplemental Data | ||||||||||
| Net assets, end of period (000 omitted) | $ | 893,636 | $ | 546,863 | $ | 176,718 | $ | 257,011 | $ | 369,563 |
Portfolio turnover rate G | 42% | 37% | 40% | 55% | 70% |
| Fidelity Advisor® Global Commodity Stock Fund Class I |
| Years ended October 31, | 2022 | 2021 | 2020 | 2019 | 2018 | |||||
Selected Per-Share Data | ||||||||||
| Net asset value, beginning of period | $ | 16.39 | $ | 10.81 | $ | 12.16 | $ | 12.45 | $ | 12.60 |
| Income from Investment Operations | ||||||||||
Net investment income (loss) A,B | .52 | .53 | .32 | .39 | .25 | |||||
| Net realized and unrealized gain (loss) | 3.19 | 5.25 | (1.26) | (.41) | (.21) | |||||
| Total from investment operations | 3.71 | 5.78 | (.94) | (.02) | .04 | |||||
| Distributions from net investment income | (.56) | (.20) | (.41) | (.25) | (.14) | |||||
| Distributions from net realized gain | - | - | - | (.02) | (.05) | |||||
| Total distributions | (.56) | (.20) | (.41) | (.27) | (.19) | |||||
Redemption fees added to paid in capital A | - | - | - | - | - C | |||||
| Net asset value, end of period | $ | 19.54 | $ | 16.39 | $ | 10.81 | $ | 12.16 | $ | 12.45 |
Total Return D | 23.56% | 53.97% | (8.11)% | (.06)% | .30% | |||||
Ratios to Average Net Assets B,E,F | ||||||||||
| Expenses before reductions | .92% | .93% | .95% | .92% | .93% | |||||
| Expenses net of fee waivers, if any | .92% | .93% | .95% | .92% | .93% | |||||
| Expenses net of all reductions | .92% | .93% | .93% | .91% | .91% | |||||
| Net investment income (loss) | 2.80% | 3.48% | 2.88% | 3.23% | 1.90% | |||||
| Supplemental Data | ||||||||||
| Net assets, end of period (000 omitted) | $ | 499,191 | $ | 85,252 | $ | 33,185 | $ | 102,633 | $ | 117,981 |
Portfolio turnover rate G | 42% | 37% | 40% | 55% | 70% |
| Fidelity Advisor® Global Commodity Stock Fund Class Z |
| Years ended October 31, | 2022 | 2021 | 2020 | 2019 | 2018 A | |||||
Selected Per-Share Data | ||||||||||
| Net asset value, beginning of period | $ | 16.38 | $ | 10.81 | $ | 12.16 | $ | 12.46 | $ | 13.84 |
| Income from Investment Operations | ||||||||||
Net investment income (loss) B,C | .54 | .56 | .34 | .39 | (.01) | |||||
| Net realized and unrealized gain (loss) | 3.19 | 5.23 | (1.26) | (.40) | (1.37) | |||||
| Total from investment operations | 3.73 | 5.79 | (.92) | (.01) | (1.38) | |||||
| Distributions from net investment income | (.58) | (.22) | (.43) | (.27) | - | |||||
| Distributions from net realized gain | - | - | - | (.02) | - | |||||
| Total distributions | (.58) | (.22) | (.43) | (.29) | - | |||||
| Net asset value, end of period | $ | 19.53 | $ | 16.38 | $ | 10.81 | $ | 12.16 | $ | 12.46 |
Total Return D,E | 23.72% | 54.07% | (7.99)% | .03% | (9.97)% | |||||
Ratios to Average Net Assets C,F,G | ||||||||||
| Expenses before reductions | .79% | .80% | .85% | .83% | .89% H | |||||
| Expenses net of fee waivers, if any | .79% | .80% | .84% | .83% | .89% H | |||||
| Expenses net of all reductions | .79% | .80% | .83% | .82% | .87% H | |||||
| Net investment income (loss) | 2.93% | 3.60% | 2.99% | 3.32% | (.70)% H | |||||
| Supplemental Data | ||||||||||
| Net assets, end of period (000 omitted) | $ | 234,430 | $ | 60,837 | $ | 16,505 | $ | 104,489 | $ | 5,118 |
Portfolio turnover rate I | 42% | 37% | 40% | 55% | 70% |
| Fidelity Central Fund | Investment Manager | Investment Objective | Investment Practices | Expense Ratio A |
| Fidelity Money Market Central Funds | Fidelity Management & Research Company LLC (FMR) | Each fund seeks to obtain a high level of current income consistent with the preservation of capital and liquidity. | Short-term Investments | Less than .005% |
| Gross unrealized appreciation | $371,384,491 |
| Gross unrealized depreciation | (134,569,081) |
| Net unrealized appreciation (depreciation) | $236,815,410 |
| Tax Cost | $1,610,294,567 |
| Undistributed ordinary income | $26,135,635 |
| Capital loss carryforward | $(184,466,563) |
| Net unrealized appreciation (depreciation) on securities and other investments | $236,777,418 |
| Short-term | $(61,986,325) |
| Long-term | (122,480,238) |
| Total capital loss carryforward | $(184,466,563) |
| October 31, 2022 | October 31, 2021 | |
| Ordinary Income | $25,407,967 | $6,996,946 |
| Purchases ($) | Sales ($) | |
| Fidelity Global Commodity Stock Fund | 1,512,147,404 | 555,856,181 |
| Distribution Fee | Service Fee | Total Fees | Retained by FDC | |
| Class A | -% | .25% | $219,379 | $13,130 |
| Class M | .25% | .25% | 84,299 | - |
| Class C | .75% | .25% | 236,449 | 90,712 |
| $540,127 | $103,842 |
| Retained by FDC | |
| Class A | $154,270 |
| Class M | 8,165 |
Class C A | 62 |
| $162,497 |
| Amount | % of Class-Level Average Net Assets | |
| Class A | $169,451 | .19 |
| Class M | 36,084 | .21 |
| Class C | 44,956 | .19 |
| Global Commodity Stock | 1,440,664 | .19 |
| Class I | 505,023 | .17 |
| Class Z | 60,743 | .04 |
| $2,256,921 |
| % of Average Net Assets | |
| Fidelity Global Commodity Stock Fund | .04 |
| Amount | |
| Fidelity Global Commodity Stock Fund | $11,168 |
| Borrower or Lender | Average Loan Balance | Weighted Average Interest Rate | Interest Expense | |
| Fidelity Global Commodity Stock Fund | Borrower | $5,090,000 | 1.81% | $256 |
| Purchases ($) | Sales ($) | Realized Gain (Loss) ($) | |
| Fidelity Global Commodity Stock Fund | 59,628,011 | 30,237,287 | 4,185,902 |
| Amount | |
| Fidelity Global Commodity Stock Fund | $2,145 |
| Total Security Lending Fees Paid to NFS | Security Lending Income From Securities Loaned to NFS | Value of Securities Loaned to NFS at Period End | |
| Fidelity Global Commodity Stock Fund | $12,974 | $- | $- |
Year ended October 31, 2022 | Year ended October 31, 2021 | |
| Fidelity Global Commodity Stock Fund | ||
| Distributions to shareholders | ||
| Class A | $1,448,690 | $330,900 |
| Class M | 259,454 | 55,155 |
| Class C | 264,183 | 54,858 |
| Global Commodity Stock | 18,171,488 | 5,592,593 |
| Class I | 3,064,346 | 607,688 |
| Class Z | 2,199,806 | 355,752 |
| Total | $25,407,967 | $6,996,946 |
| Shares | Shares | Dollars | Dollars | |
| Year ended October 31, 2022 | Year ended October 31, 2021 | Year ended October 31, 2022 | Year ended October 31, 2021 | |
| Fidelity Global Commodity Stock Fund | ||||
| Class A | ||||
| Shares sold | 5,245,104 | 1,497,596 | $102,330,553 | $23,243,182 |
| Reinvestment of distributions | 93,881 | 24,735 | 1,435,437 | 326,260 |
| Shares redeemed | (1,530,075) | (643,914) | (28,265,460) | (9,896,306) |
| Net increase (decrease) | 3,808,910 | 878,417 | $75,500,530 | $13,673,136 |
| Class M | ||||
| Shares sold | 994,128 | 185,666 | $18,969,401 | $2,932,586 |
| Reinvestment of distributions | 16,878 | 4,164 | 258,240 | 54,963 |
| Shares redeemed | (295,956) | (51,392) | (5,535,121) | (761,387) |
| Net increase (decrease) | 715,050 | 138,438 | $13,692,520 | $2,226,162 |
| Class C | ||||
| Shares sold | 1,526,059 | 325,501 | $29,910,914 | $5,031,255 |
| Reinvestment of distributions | 17,324 | 4,142 | 263,849 | 54,381 |
| Shares redeemed | (411,550) | (385,192) | (7,532,050) | (5,709,900) |
| Net increase (decrease) | 1,131,833 | (55,549) | $22,642,713 | $(624,264) |
| Global Commodity Stock | ||||
| Shares sold | 37,700,647 | 26,509,390 | $735,708,594 | $367,175,381 |
| Reinvestment of distributions | 1,053,837 | 364,169 | 16,113,170 | 4,799,750 |
| Shares redeemed | (26,409,632) | (9,830,285) | (482,758,151) | (150,535,532) |
| Net increase (decrease) | 12,344,852 | 17,043,274 | $269,063,613 | $221,439,599 |
| Class I | ||||
| Shares sold | 29,119,851 | 4,496,884 | $566,732,834 | $70,249,986 |
| Reinvestment of distributions | 198,222 | 45,805 | 3,028,836 | 603,715 |
| Shares redeemed | (8,975,269) | (2,409,382) | (163,585,245) | (37,277,273) |
| Net increase (decrease) | 20,342,804 | 2,133,307 | $406,176,425 | $33,576,428 |
| Class Z | ||||
| Shares sold | 12,915,308 | 4,377,495 | $249,174,298 | $65,145,411 |
| Reinvestment of distributions | 129,470 | 23,487 | 1,975,709 | 309,090 |
| Shares redeemed | (4,757,037) | (2,213,665) | (85,065,665) | (34,725,682) |
| Net increase (decrease) | 8,287,741 | 2,187,317 | $166,084,342 | $30,728,819 |
| The Example is based on an investment of $1,000 invested at the beginning of the period and held for the entire period (May 1, 2022 to October 31, 2022). |
Annualized Expense Ratio- A | Beginning Account Value May 1, 2022 | Ending Account Value October 31, 2022 | Expenses Paid During Period- C May 1, 2022 to October 31, 2022 | |||||||
| Fidelity® Global Commodity Stock Fund | ||||||||||
| Class A | 1.19% | |||||||||
| Actual | $ 1,000 | $ 979.90 | $ 5.94 | |||||||
Hypothetical- B | $ 1,000 | $ 1,019.21 | $ 6.06 | |||||||
| Class M | 1.45% | |||||||||
| Actual | $ 1,000 | $ 978.90 | $ 7.23 | |||||||
Hypothetical- B | $ 1,000 | $ 1,017.90 | $ 7.38 | |||||||
| Class C | 1.94% | |||||||||
| Actual | $ 1,000 | $ 976.20 | $ 9.66 | |||||||
Hypothetical- B | $ 1,000 | $ 1,015.43 | $ 9.86 | |||||||
| Fidelity® Global Commodity Stock Fund | .94% | |||||||||
| Actual | $ 1,000 | $ 981.40 | $ 4.69 | |||||||
Hypothetical- B | $ 1,000 | $ 1,020.47 | $ 4.79 | |||||||
| Class I | .92% | |||||||||
| Actual | $ 1,000 | $ 981.40 | $ 4.59 | |||||||
Hypothetical- B | $ 1,000 | $ 1,020.57 | $ 4.69 | |||||||
| Class Z | .79% | |||||||||
| Actual | $ 1,000 | $ 981.90 | $ 3.95 | |||||||
Hypothetical- B | $ 1,000 | $ 1,021.22 | $ 4.02 | |||||||
| Pay Date | Income | Taxes | |
| Fidelity Global Commodity Stock Fund | |||
| Class A | 12/06/2021 | 0.4755 | 0.0180 |
| Class M | 12/06/2021 | 0.4397 | 0.0180 |
| Class C | 12/06/2021 | 0.3644 | 0.0180 |
| Global Commodity Stock | 12/06/2021 | 0.5086 | 0.0180 |
| Class I | 12/06/2021 | 0.5149 | 0.0180 |
| Class Z | 12/06/2021 | 0.5310 | 0.0180 |
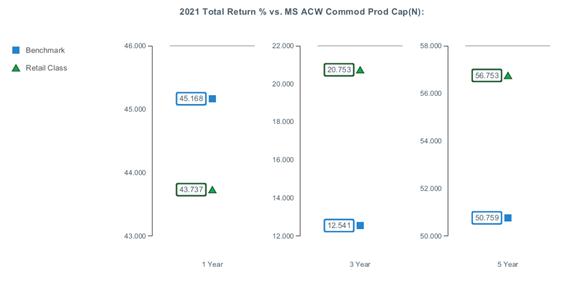
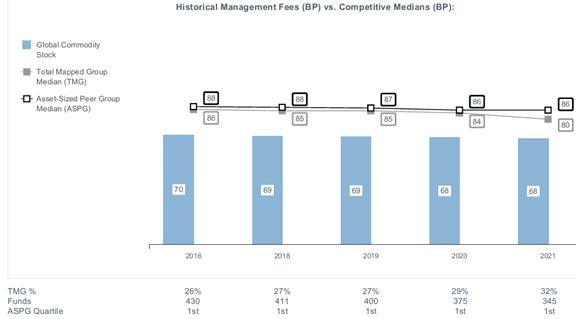
|


Contents
Board Approval of Investment Advisory Contracts and Management Fees |
| Average Annual Total Returns | |||
Periods ended October 31, 2022 | Past 1 year | Life of Fund A |
| Fidelity® Series Emerging Markets Fund | -36.53% | -6.71% |
| $10,000 Over Life of Fund |
Let's say hypothetically that $10,000 was invested in Fidelity® Series Emerging Markets Fund, on August 29, 2018, when the fund started. The chart shows how the value of your investment would have changed, and also shows how the MSCI Emerging Markets Index performed over the same period. |
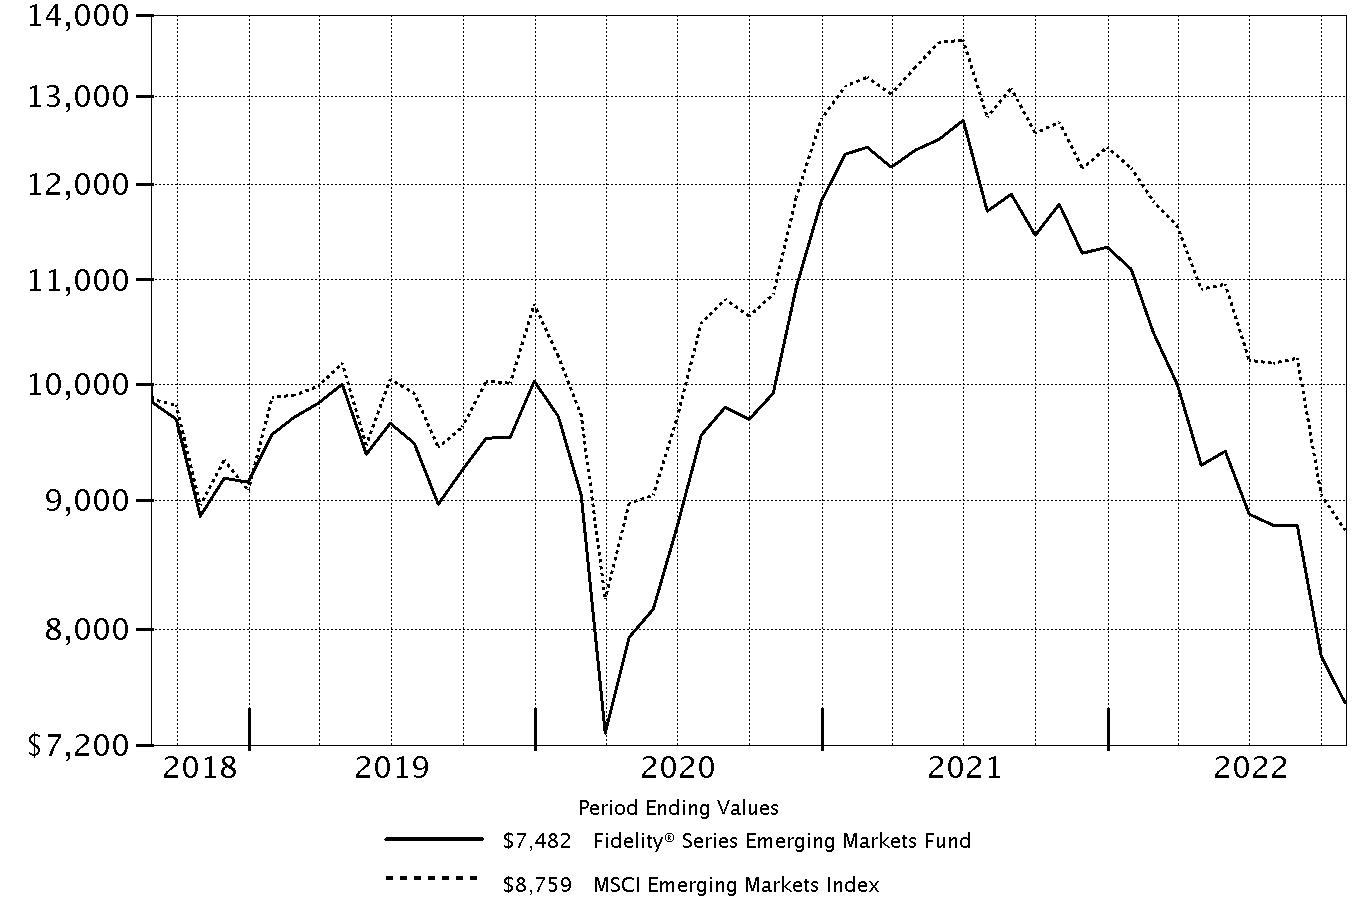 |
Top Holdings (% of Fund's net assets) | ||
| Taiwan Semiconductor Manufacturing Co. Ltd. (Taiwan, Semiconductors & Semiconductor Equipment) | 6.7 | |
| Samsung Electronics Co. Ltd. (Korea (South), Technology Hardware, Storage & Peripherals) | 4.9 | |
| Tencent Holdings Ltd. (Cayman Islands, Interactive Media & Services) | 3.1 | |
| ICICI Bank Ltd. (India, Banks) | 2.2 | |
| Alibaba Group Holding Ltd. sponsored ADR (Cayman Islands, Internet & Direct Marketing Retail) | 2.1 | |
| LG Chemical Ltd. (Korea (South), Chemicals) | 1.9 | |
| Reliance Industries Ltd. (India, Oil, Gas & Consumable Fuels) | 1.9 | |
| HDFC Bank Ltd. (India, Banks) | 1.8 | |
| Meituan Class B (Cayman Islands, Internet & Direct Marketing Retail) | 1.8 | |
| Trip.com Group Ltd. ADR (Cayman Islands, Hotels, Restaurants & Leisure) | 1.7 | |
| 28.1 | ||
| Market Sectors (% of Fund's net assets) | ||
| Financials | 24.3 | |
| Information Technology | 19.0 | |
| Consumer Discretionary | 13.0 | |
| Communication Services | 10.0 | |
| Materials | 7.9 | |
| Consumer Staples | 5.5 | |
| Energy | 4.5 | |
| Health Care | 4.1 | |
| Industrials | 2.9 | |
| Utilities | 1.0 | |
| Real Estate | 0.7 | |
Asset Allocation (% of Fund's net assets) |
 |
Foreign investments - 92.3% |
Geographic Diversification (% of Fund's net assets) |
 |
* Includes Short-Term investments and Net Other Assets (Liabilities). Percentages are based on country or territory of incorporation and are adjusted for the effect of futures contracts, if applicable. |
| Common Stocks - 90.4% | |||
| Shares | Value ($) | ||
| Bermuda - 1.3% | |||
| Credicorp Ltd. (United States) | 111,117 | 16,263,084 | |
| Kunlun Energy Co. Ltd. | 27,055,030 | 16,164,809 | |
TOTAL BERMUDA | 32,427,893 | ||
| Brazil - 4.5% | |||
| Banco do Brasil SA | 775,884 | 5,560,590 | |
| Hypera SA | 3,170,514 | 31,186,490 | |
| Localiza Rent a Car SA | 4,191 | 57,232 | |
| Localiza Rent a Car SA | 1,831,541 | 25,011,500 | |
| Natura & Co. Holding SA (a) | 1,753,940 | 5,076,257 | |
| Suzano Papel e Celulose SA | 1,056,164 | 10,877,538 | |
| Vale SA | 1,648,597 | 21,424,899 | |
| Vamos Locacao de Caminhoes Maquinas e Equipamentos SA | 3,290,000 | 10,267,118 | |
TOTAL BRAZIL | 109,461,624 | ||
| Cayman Islands - 16.5% | |||
| Alibaba Group Holding Ltd. sponsored ADR (a) | 818,000 | 52,008,440 | |
| Bilibili, Inc. ADR (a)(b) | 587,635 | 5,241,704 | |
| Chailease Holding Co. Ltd. | 1,583,831 | 7,316,637 | |
| JD.com, Inc. sponsored ADR | 734,339 | 27,383,501 | |
| KE Holdings, Inc. ADR (a) | 1,216,205 | 12,380,967 | |
| Li Ning Co. Ltd. | 1,726,182 | 8,928,167 | |
| Meituan Class B (a)(c) | 2,717,220 | 43,504,176 | |
| NetEase, Inc. ADR | 339,709 | 18,894,615 | |
| Parade Technologies Ltd. | 318,408 | 6,011,982 | |
| Pinduoduo, Inc. ADR (a) | 454,972 | 24,946,115 | |
| Sea Ltd. ADR (a) | 316,700 | 15,733,656 | |
| Silergy Corp. | 1,362,703 | 15,801,170 | |
| Sunny Optical Technology Group Co. Ltd. | 544,805 | 4,723,011 | |
| Tencent Holdings Ltd. | 2,864,992 | 75,282,804 | |
| Trip.com Group Ltd. ADR (a) | 1,841,445 | 41,671,900 | |
| Wuxi Biologics (Cayman), Inc. (a)(c) | 3,969,251 | 17,860,210 | |
| XP, Inc. Class A (a) | 264,829 | 4,854,316 | |
| XPeng, Inc. ADR (a)(b) | 849,133 | 5,621,260 | |
| Zai Lab Ltd. (a) | 1,357,270 | 3,126,183 | |
| Zai Lab Ltd. ADR (a) | 474,628 | 10,574,712 | |
TOTAL CAYMAN ISLANDS | 401,865,526 | ||
| China - 7.8% | |||
| China Construction Bank Corp. (H Shares) | 57,064,884 | 30,283,675 | |
| China Life Insurance Co. Ltd. (H Shares) | 7,861,106 | 8,572,203 | |
| China Merchants Bank Co. Ltd. (H Shares) | 1,207,297 | 3,968,108 | |
| China Tourism Group Duty Free Corp. Ltd. (H Shares) (a)(c) | 649,642 | 12,852,726 | |
| Guangzhou Automobile Group Co. Ltd. (H Shares) | 31,024,280 | 18,892,060 | |
| Haier Smart Home Co. Ltd. | 3,896,278 | 9,748,575 | |
| Industrial & Commercial Bank of China Ltd. (H Shares) | 35,651,385 | 15,478,599 | |
| Kweichow Moutai Co. Ltd. (A Shares) | 94,246 | 17,340,925 | |
| Ping An Insurance Group Co. of China Ltd. (H Shares) | 3,949,902 | 15,813,000 | |
| Shenzhen Mindray Bio-Medical Electronics Co. Ltd. (A Shares) | 539,661 | 24,048,977 | |
| Wuliangye Yibin Co. Ltd. (A Shares) | 1,053,170 | 19,252,379 | |
| Zijin Mining Group Co. Ltd. (H Shares) | 15,672,458 | 14,974,354 | |
TOTAL CHINA | 191,225,581 | ||
| Hong Kong - 0.3% | |||
| China Resources Beer Holdings Co. Ltd. | 1,448,390 | 6,827,111 | |
| Hungary - 0.4% | |||
| Richter Gedeon PLC | 534,606 | 10,556,162 | |
| India - 16.3% | |||
| Axis Bank Ltd. | 1,018,694 | 11,149,272 | |
| Bharti Airtel Ltd. | 3,487,396 | 35,050,900 | |
| Eicher Motors Ltd. | 313,815 | 14,596,871 | |
| HDFC Bank Ltd. (a) | 2,456,660 | 44,583,242 | |
| HDFC Standard Life Insurance Co. Ltd. (c) | 2,167,056 | 14,148,169 | |
| Hindustan Unilever Ltd. | 296,589 | 9,138,796 | |
| Housing Development Finance Corp. Ltd. | 789,337 | 23,550,429 | |
| ICICI Bank Ltd. | 4,830,052 | 53,106,512 | |
| Infosys Ltd. | 2,002,725 | 37,200,895 | |
| ITC Ltd. | 2,178,666 | 9,177,348 | |
| Larsen & Toubro Ltd. | 1,279,686 | 31,274,858 | |
| NTPC Ltd. | 4,592,556 | 9,603,424 | |
| Oil & Natural Gas Corp. Ltd. | 1,120,771 | 1,814,923 | |
| PVR Ltd. (a) | 621,923 | 13,335,508 | |
| Reliance Industries Ltd. | 1,505,314 | 46,363,235 | |
| Tata Consultancy Services Ltd. | 186,605 | 7,198,088 | |
| Tata Steel Ltd. | 18,420,085 | 22,596,758 | |
| Ultratech Cement Ltd. | 158,107 | 12,825,327 | |
TOTAL INDIA | 396,714,555 | ||
| Indonesia - 4.1% | |||
| PT Avia Avian Tbk | 72,384,227 | 3,642,995 | |
| PT Bank Central Asia Tbk | 31,000,232 | 17,490,113 | |
| PT Bank Mandiri (Persero) Tbk | 51,608,268 | 34,907,339 | |
| PT Bank Rakyat Indonesia (Persero) Tbk | 32,565,821 | 9,708,676 | |
| PT Telkom Indonesia Persero Tbk | 31,400,195 | 8,818,773 | |
| PT United Tractors Tbk | 12,517,236 | 25,921,252 | |
TOTAL INDONESIA | 100,489,148 | ||
| Korea (South) - 13.8% | |||
| Db Insurance Co. Ltd. | 288,532 | 11,381,016 | |
| Hana Financial Group, Inc. | 461,564 | 13,339,346 | |
| Hansol Chemical Co. Ltd. | 53,259 | 6,921,745 | |
| Hyundai Fire & Marine Insurance Co. Ltd. | 309,884 | 7,229,729 | |
| Hyundai Motor Co. | 119,360 | 13,756,355 | |
| KB Financial Group, Inc. | 538,225 | 18,074,356 | |
| Kia Corp. | 97,995 | 4,551,935 | |
| LG Chemical Ltd. | 107,861 | 47,306,130 | |
| NAVER Corp. | 118,997 | 14,131,373 | |
| POSCO | 196,730 | 34,219,285 | |
| Samsung Electronics Co. Ltd. | 2,853,854 | 118,767,289 | |
| Shinhan Financial Group Co. Ltd. | 267,722 | 6,790,888 | |
| SK Hynix, Inc. | 599,294 | 34,723,547 | |
| Woori Financial Group, Inc. | 557,831 | 4,592,183 | |
TOTAL KOREA (SOUTH) | 335,785,177 | ||
| Mexico - 4.0% | |||
| America Movil S.A.B. de CV Series L | 14,945,222 | 14,143,386 | |
| CEMEX S.A.B. de CV sponsored ADR (a) | 620,847 | 2,396,469 | |
| Fomento Economico Mexicano S.A.B. de CV sponsored ADR | 137,376 | 9,838,869 | |
| Gruma S.A.B. de CV Series B | 168,000 | 1,948,793 | |
| Grupo Aeroportuario del Sureste S.A.B. de CV Series B | 224,224 | 5,247,699 | |
| Grupo Financiero Banorte S.A.B. de CV Series O | 4,546,672 | 36,957,630 | |
| Grupo Mexico SA de CV Series B | 1,461,116 | 5,297,126 | |
| Sitios Latinoamerica S.A.B. de CV (a) | 709,283 | 206,917 | |
| Wal-Mart de Mexico SA de CV Series V | 5,723,902 | 22,109,232 | |
TOTAL MEXICO | 98,146,121 | ||
| Netherlands - 0.1% | |||
| Yandex NV Series A (a)(d) | 583,741 | 2,002,138 | |
| Philippines - 0.2% | |||
| Ayala Land, Inc. | 10,464,976 | 4,630,266 | |
| Russia - 0.0% | |||
| LUKOIL PJSC (d) | 568,462 | 263,852 | |
| Sberbank of Russia (a)(d) | 5,098,115 | 47,004 | |
TOTAL RUSSIA | 310,856 | ||
| Saudi Arabia - 4.3% | |||
| Al Rajhi Bank | 1,731,677 | 39,264,649 | |
| Alinma Bank | 2,744,676 | 27,391,612 | |
| Dr Sulaiman Al Habib Medical Services Group Co. | 82,914 | 5,000,150 | |
| Saudi Arabian Oil Co. (c) | 803,166 | 7,459,779 | |
| Saudi Telecom Co. | 905,238 | 9,732,835 | |
| The Saudi National Bank | 964,672 | 15,249,702 | |
TOTAL SAUDI ARABIA | 104,098,727 | ||
| South Africa - 3.8% | |||
| Absa Group Ltd. | 2,081,751 | 22,636,758 | |
| Capitec Bank Holdings Ltd. | 50,461 | 5,221,077 | |
| Impala Platinum Holdings Ltd. | 1,174,133 | 12,021,556 | |
| MTN Group Ltd. | 4,102,572 | 28,999,140 | |
| Naspers Ltd. Class N | 221,778 | 22,861,292 | |
TOTAL SOUTH AFRICA | 91,739,823 | ||
| Taiwan - 9.9% | |||
| E.SUN Financial Holdings Co. Ltd. | 6,440,088 | 4,632,295 | |
| eMemory Technology, Inc. | 522,416 | 17,411,707 | |
| Hon Hai Precision Industry Co. Ltd. (Foxconn) | 4,479,276 | 14,234,693 | |
| International Games Systems Co. Ltd. | 25,000 | 272,447 | |
| MediaTek, Inc. | 1,869,210 | 34,192,159 | |
| Taiwan Semiconductor Manufacturing Co. Ltd. | 13,582,797 | 163,135,755 | |
| Unimicron Technology Corp. | 2,042,672 | 7,884,686 | |
TOTAL TAIWAN | 241,763,742 | ||
| Thailand - 1.8% | |||
| Bangkok Bank PCL (For. Reg.) | 2,396,753 | 9,166,186 | |
| CP ALL PCL (For. Reg.) | 14,694,795 | 23,174,864 | |
| SCB X PCL (For. Reg.) | 1,217,321 | 3,391,668 | |
| Thai Beverage PCL | 22,210,665 | 9,021,710 | |
TOTAL THAILAND | 44,754,428 | ||
| United Arab Emirates - 0.7% | |||
| Abu Dhabi Commercial Bank PJSC | 4,438,100 | 11,418,160 | |
| First Abu Dhabi Bank PJSC | 1,045,604 | 5,095,508 | |
TOTAL UNITED ARAB EMIRATES | 16,513,668 | ||
| United States of America - 0.6% | |||
| Li Auto, Inc. ADR (a) | 1,043,725 | 14,215,535 | |
| TOTAL COMMON STOCKS (Cost $2,569,974,927) | 2,203,528,081 | ||
| Nonconvertible Preferred Stocks - 2.5% | |||
| Shares | Value ($) | ||
| Brazil - 2.5% | |||
| Banco Bradesco SA (PN) | 1,272,800 | 4,893,584 | |
| Itau Unibanco Holding SA | 5,151,070 | 30,315,077 | |
| Petroleo Brasileiro SA - Petrobras sponsored ADR | 1,995,657 | 25,584,323 | |
| TOTAL NONCONVERTIBLE PREFERRED STOCKS (Cost $49,517,522) | 60,792,984 | ||
| Government Obligations - 0.2% | |||
Principal Amount (e) | Value ($) | ||
| United States of America - 0.2% | |||
U.S. Treasury Bills, yield at date of purchase 3.1% to 3.99% 12/15/22 to 1/26/23 (f) (Cost $4,700,734) | 4,720,000 | 4,698,696 | |
| Money Market Funds - 7.6% | |||
| Shares | Value ($) | ||
| Fidelity Cash Central Fund 3.10% (g) | 175,875,857 | 175,911,032 | |
| Fidelity Securities Lending Cash Central Fund 3.10% (g)(h) | 9,724,353 | 9,725,325 | |
| TOTAL MONEY MARKET FUNDS (Cost $185,636,357) | 185,636,357 | ||
| TOTAL INVESTMENT IN SECURITIES - 100.7% (Cost $2,809,829,540) | 2,454,656,118 |
NET OTHER ASSETS (LIABILITIES) - (0.7)% | (17,912,408) |
| NET ASSETS - 100.0% | 2,436,743,710 |
| Futures Contracts | |||||
Number of contracts | Expiration Date | Notional Amount ($) | Value ($) | Unrealized Appreciation/ (Depreciation) ($) | |
| Purchased | |||||
| Equity Index Contracts | |||||
| ICE E-mini MSCI Emerging Markets Index Contracts (United States) | 1,740 | Dec 2022 | 74,263,200 | (11,805,038) | (11,805,038) |
| The notional amount of futures purchased as a percentage of Net Assets is 3.0% | |||||
| (a) | Non-income producing |
| (b) | Security or a portion of the security is on loan at period end. |
| (c) | Security exempt from registration under Rule 144A of the Securities Act of 1933. These securities may be resold in transactions exempt from registration, normally to qualified institutional buyers. At the end of the period, the value of these securities amounted to $95,825,060 or 3.9% of net assets. |
| (d) | Level 3 security |
| (e) | Amount is stated in United States dollars unless otherwise noted. |
| (f) | Security or a portion of the security was pledged to cover margin requirements for futures contracts. At period end, the value of securities pledged amounted to $4,698,696. |
| (g) | Affiliated fund that is generally available only to investment companies and other accounts managed by Fidelity Investments. The rate quoted is the annualized seven-day yield of the fund at period end. A complete unaudited listing of the fund's holdings as of its most recent quarter end is available upon request. In addition, each Fidelity Central Fund's financial statements, which are not covered by the Fund's Report of Independent Registered Public Accounting Firm, are available on the SEC's website or upon request. |
| (h) | Investment made with cash collateral received from securities on loan. |
| Affiliate | Value, beginning of period ($) | Purchases ($) | Sales Proceeds ($) | Dividend Income ($) | Realized Gain (loss) ($) | Change in Unrealized appreciation (depreciation) ($) | Value, end of period ($) | % ownership, end of period |
| Fidelity Cash Central Fund 3.10% | 162,778,712 | 1,214,157,924 | 1,201,025,604 | 1,849,997 | - | - | 175,911,032 | 0.4% |
| Fidelity Securities Lending Cash Central Fund 3.10% | 13,301,000 | 407,730,437 | 411,306,112 | 176,679 | - | - | 9,725,325 | 0.0% |
| Total | 176,079,712 | 1,621,888,361 | 1,612,331,716 | 2,026,676 | - | - | 185,636,357 | |
| Valuation Inputs at Reporting Date: | ||||
| Description | Total ($) | Level 1 ($) | Level 2 ($) | Level 3 ($) |
Investments in Securities: | ||||
| Equities: | ||||
Communication Services | 241,846,196 | 155,742,481 | 84,101,577 | 2,002,138 |
Consumer Discretionary | 315,538,908 | 249,173,440 | 66,365,468 | - |
Consumer Staples | 132,906,284 | 132,906,284 | - | - |
Energy | 107,407,364 | 107,143,512 | - | 263,852 |
Financials | 593,842,392 | 401,092,913 | 192,702,475 | 47,004 |
Health Care | 102,352,884 | 84,492,674 | 17,860,210 | - |
Industrials | 71,858,407 | 71,858,407 | - | - |
Information Technology | 461,284,982 | 298,149,227 | 163,135,755 | - |
Materials | 194,504,182 | 148,263,341 | 46,240,841 | - |
Real Estate | 17,011,233 | 12,380,967 | 4,630,266 | - |
Utilities | 25,768,233 | 25,768,233 | - | - |
| Government Obligations | 4,698,696 | - | 4,698,696 | - |
| Money Market Funds | 185,636,357 | 185,636,357 | - | - |
| Total Investments in Securities: | 2,454,656,118 | 1,872,607,836 | 579,735,288 | 2,312,994 |
Derivative Instruments: | ||||
| Liabilities | ||||
Futures Contracts | (11,805,038) | (11,805,038) | - | - |
| Total Liabilities | (11,805,038) | (11,805,038) | - | - |
| Total Derivative Instruments: | (11,805,038) | (11,805,038) | - | - |
| Investments in Securities: | |||
| Communication Services | |||
| Beginning Balance | $ | - | |
| Net Realized Gain (Loss) on Investment Securities | 661,317 | ||
| Net Unrealized Gain (Loss) on Investment Securities | (30,166,606) | ||
| Cost of Purchases | 12,617,724 | ||
| Proceeds of Sales | (7,589,606) | ||
| Amortization/Accretion | - | ||
| Transfers into Level 3 | 26,479,309 | ||
| Transfers out of Level 3 | - | ||
| Ending Balance | $ | 2,002,138 | |
| The change in unrealized gain (loss) for the period attributable to Level 3 securities held at October 31, 2022 | $ | (30,166,606) | |
| Energy | |||
| Beginning Balance | $ | - | |
| Net Realized Gain (Loss) on Investment Securities | - | ||
| Net Unrealized Gain (Loss) on Investment Securities | (57,418,162) | ||
| Cost of Purchases | 2,619,233 | ||
| Proceeds of Sales | - | ||
| Amortization/Accretion | - | ||
| Transfers into Level 3 | 55,062,781 | ||
| Transfers out of Level 3 | - | ||
| Ending Balance | $ | 263,852 | |
| The change in unrealized gain (loss) for the period attributable to Level 3 securities held at October 31, 2022 | $ | (57,418,162) | |
| Financials | |||
| Beginning Balance | $ | - | |
| Net Realized Gain (Loss) on Investment Securities | (4,465,710) | ||
| Net Unrealized Gain (Loss) on Investment Securities | (29,869,684) | ||
| Cost of Purchases | 11,276,019 | ||
| Proceeds of Sales | (14,023,318) | ||
| Amortization/Accretion | - | ||
| Transfers into Level 3 | 37,129,697 | ||
| Transfers out of Level 3 | - | ||
| Ending Balance | $ | 47,004 | |
| The change in unrealized gain (loss) for the period attributable to Level 3 securities held at October 31, 2022 | $ | (29,869,684) | |
| The information used in the above reconciliation represents fiscal year to date activity for any Investments in Securities identified as using Level 3 inputs at either the beginning or the end of the current fiscal period. Cost of purchases and proceeds of sales may include securities received and/or delivered through in-kind transactions. Transfers into Level 3 were attributable to a lack of observable market data resulting from decreases in market activity, decreases in liquidity, security restructurings or corporate actions. Transfers out of Level 3 were attributable to observable market data becoming available for those securities. Transfers in or out of Level 3 represent the beginning value of any Security or Instrument where a change in the pricing level occurred from the beginning to the end of the period. The cost of purchases and the proceeds of sales may include securities received or delivered through corporate actions or exchanges. Realized and unrealized gains (losses) disclosed in the reconciliation are included in Net Gain (Loss) on the Fund's Statement of Operations. | |||
Primary Risk Exposure / Derivative Type | Value | |
| Asset ($) | Liability ($) | |
| Equity Risk | ||
Futures Contracts (a) | 0 | (11,805,038) |
| Total Equity Risk | 0 | (11,805,038) |
| Total Value of Derivatives | 0 | (11,805,038) |
| Statement of Assets and Liabilities | ||||
| October 31, 2022 | ||||
| Assets | ||||
| Investment in securities, at value (including securities loaned of $9,080,358) - See accompanying schedule: | ||||
Unaffiliated issuers (cost $2,624,193,183) | $2,269,019,761 | |||
Fidelity Central Funds (cost $185,636,357) | 185,636,357 | |||
| Total Investment in Securities (cost $2,809,829,540) | $ | 2,454,656,118 | ||
| Foreign currency held at value (cost $5,696,955) | 5,675,031 | |||
| Receivable for investments sold | 13,498,232 | |||
| Receivable for fund shares sold | 111,054,787 | |||
| Dividends receivable | 2,212,530 | |||
| Distributions receivable from Fidelity Central Funds | 442,734 | |||
| Receivable from investment adviser for expense reductions | 77,631 | |||
| Other receivables | 984,209 | |||
Total assets | 2,588,601,272 | |||
| Liabilities | ||||
| Payable for investments purchased | $134,712,089 | |||
| Payable for fund shares redeemed | 36,542 | |||
| Payable for daily variation margin on futures contracts | 263,554 | |||
| Other payables and accrued expenses | 7,120,052 | |||
| Collateral on securities loaned | 9,725,325 | |||
| Total Liabilities | 151,857,562 | |||
| Net Assets | $ | 2,436,743,710 | ||
| Net Assets consist of: | ||||
| Paid in capital | $ | 3,110,550,249 | ||
| Total accumulated earnings (loss) | (673,806,539) | |||
| Net Assets | $ | 2,436,743,710 | ||
Net Asset Value , offering price and redemption price per share ($2,436,743,710 ÷ 351,287,840 shares) | $ | 6.94 | ||
| Statement of Operations | ||||
Year ended October 31, 2022 | ||||
| Investment Income | ||||
| Dividends | $ | 75,340,771 | ||
| Non-Cash dividends | 5,367,621 | |||
| Interest | 45,246 | |||
| Income from Fidelity Central Funds (including $176,679 from security lending) | 2,026,676 | |||
| Income before foreign taxes withheld | 82,780,314 | |||
| Less foreign taxes withheld | (7,889,014) | |||
| Total Income | 74,891,300 | |||
| Expenses | ||||
| Custodian fees and expenses | 995,148 | |||
| Independent trustees' fees and expenses | 9,974 | |||
| Total expenses before reductions | 1,005,122 | |||
| Expense reductions | (624,168) | |||
| Total expenses after reductions | 380,954 | |||
| Net Investment income (loss) | 74,510,346 | |||
| Realized and Unrealized Gain (Loss) | ||||
| Net realized gain (loss) on: | ||||
| Investment Securities: | ||||
| Unaffiliated issuers(net of foreign taxes of $372,421) | (295,313,701) | |||
| Foreign currency transactions | (993,181) | |||
| Futures contracts | (28,320,825) | |||
| Total net realized gain (loss) | (324,627,707) | |||
| Change in net unrealized appreciation (depreciation) on: | ||||
| Investment Securities: | ||||
| Unaffiliated issuers (net of decrease in deferred foreign taxes of $2,910,443) | (1,018,489,253) | |||
| Assets and liabilities in foreign currencies | (134,543) | |||
| Futures contracts | (8,802,473) | |||
| Total change in net unrealized appreciation (depreciation) | (1,027,426,269) | |||
| Net gain (loss) | (1,352,053,976) | |||
| Net increase (decrease) in net assets resulting from operations | $ | (1,277,543,630) | ||
| Statement of Changes in Net Assets | ||||
Year ended October 31, 2022 | Year ended October 31, 2021 | |||
| Increase (Decrease) in Net Assets | ||||
| Operations | ||||
| Net investment income (loss) | $ | 74,510,346 | $ | 58,276,181 |
| Net realized gain (loss) | (324,627,707) | 327,438,278 | ||
| Change in net unrealized appreciation (depreciation) | (1,027,426,269) | 193,605,419 | ||
| Net increase (decrease) in net assets resulting from operations | (1,277,543,630) | 579,319,878 | ||
| Distributions to shareholders | (105,313,301) | (47,189,249) | ||
| Share transactions | ||||
| Proceeds from sales of shares | 739,859,925 | 595,001,775 | ||
| Reinvestment of distributions | 105,313,301 | 47,189,249 | ||
| Cost of shares redeemed | (265,266,031) | (930,503,195) | ||
Net increase (decrease) in net assets resulting from share transactions | 579,907,195 | (288,312,171) | ||
| Total increase (decrease) in net assets | (802,949,736) | 243,818,458 | ||
| Net Assets | ||||
| Beginning of period | 3,239,693,446 | 2,995,874,988 | ||
| End of period | $ | 2,436,743,710 | $ | 3,239,693,446 |
| Other Information | ||||
| Shares | ||||
| Sold | 84,221,344 | 51,314,277 | ||
| Issued in reinvestment of distributions | �� | 9,925,853 | 4,297,746 | |
| Redeemed | (29,402,412) | (79,489,388) | ||
| Net increase (decrease) | 64,744,785 | (23,877,365) | ||
| Fidelity® Series Emerging Markets Fund |
| Years ended October 31, | 2022 | 2021 | 2020 | 2019 | 2018 A | |||||
Selected Per-Share Data | ||||||||||
| Net asset value, beginning of period | $ | 11.31 | $ | 9.65 | $ | 9.48 | $ | 8.87 | $ | 10.00 |
| Income from Investment Operations | ||||||||||
Net investment income (loss) B,C | .23 | .20 | .17 | .30 D | .01 | |||||
| Net realized and unrealized gain (loss) | (4.24) | 1.62 | .22 | .35 | (1.14) | |||||
| Total from investment operations | (4.01) | 1.82 | .39 | .65 | (1.13) | |||||
| Distributions from net investment income | (.30) | (.16) | (.22) | (.04) | - | |||||
| Distributions from net realized gain | (.07) | - | - | - | - | |||||
| Total distributions | (.36) E | (.16) | (.22) | (.04) | - | |||||
| Net asset value, end of period | $ | 6.94 | $ | 11.31 | $ | 9.65 | $ | 9.48 | $ | 8.87 |
Total Return F,G | (36.53)% | 18.88% | 4.16% | 7.33% | (11.30)% | |||||
Ratios to Average Net Assets C,H,I | ||||||||||
| Expenses before reductions | .04% | .04% | .05% | .04% | .04% J | |||||
| Expenses net of fee waivers, if any | .01% | .01% | .01% | .01% | .01% J | |||||
| Expenses net of all reductions | .01% | .01% | .01% | .01% | .01% J | |||||
| Net investment income (loss) | 2.61% | 1.70% | 1.86% | 3.24% D | .65% J | |||||
| Supplemental Data | ||||||||||
| Net assets, end of period (000 omitted) | $ | 2,436,744 | $ | 3,239,693 | $ | 2,995,875 | $ | 2,065,165 | $ | 1,431,017 |
Portfolio turnover rate K | 65% | 78% | 117% L | 47% | 15% L,M |
| Average Annual Total Returns | |||
Periods ended October 31, 2022 | Past 1 year | Past 5 years | Past 10 years |
| Fidelity® Series Emerging Markets Opportunities Fund | -35.33% | -2.28% | 2.19% |
| $10,000 Over 10 Years |
Let's say hypothetically that $10,000 was invested in Fidelity® Series Emerging Markets Opportunities Fund on October 31, 2012. The chart shows how the value of your investment would have changed, and also shows how the MSCI Emerging Markets Index performed over the same period. |
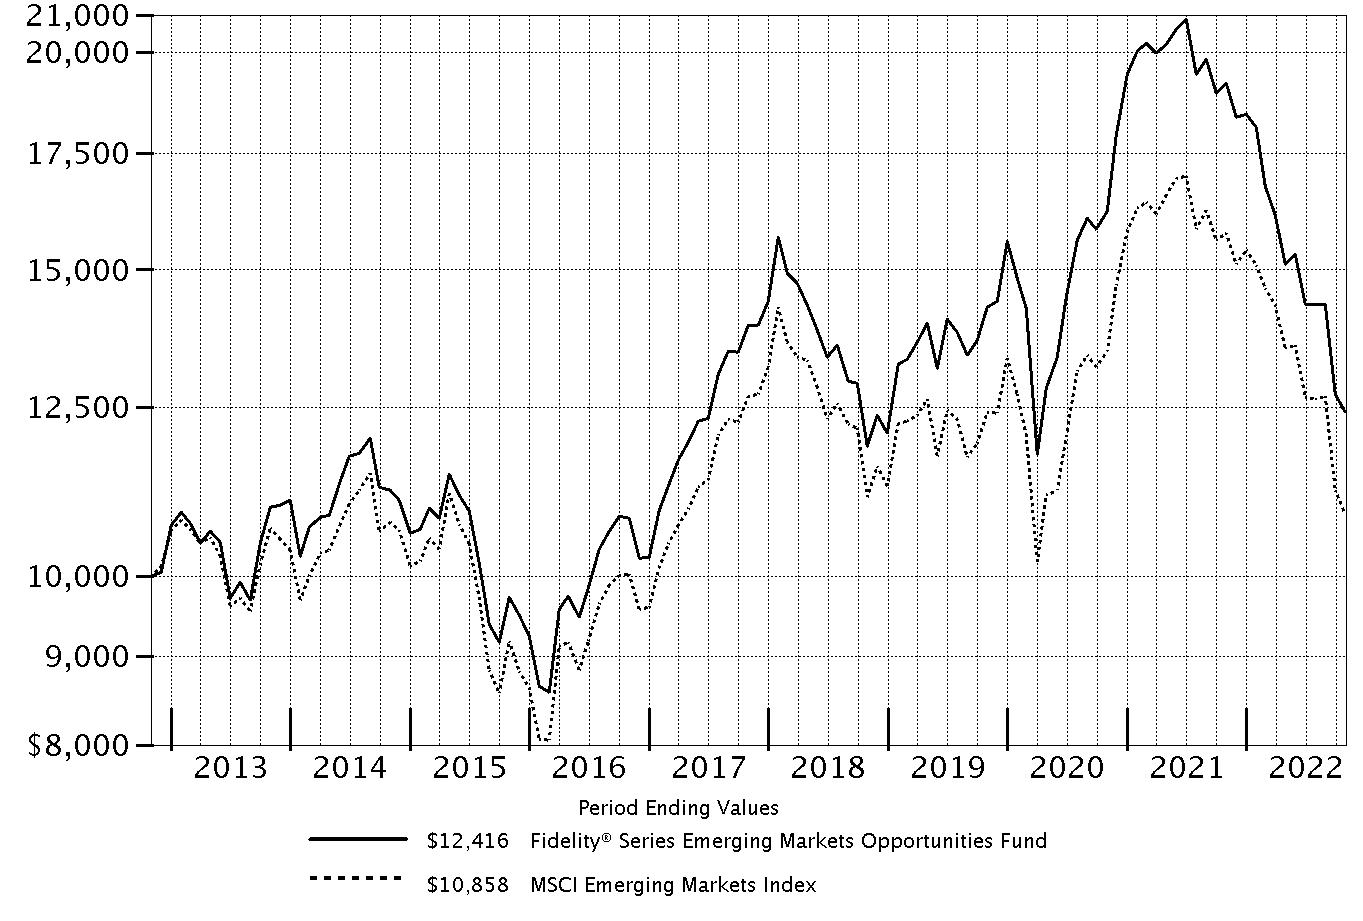 |
Top Holdings (% of Fund's net assets) | ||
| Taiwan Semiconductor Manufacturing Co. Ltd. (Taiwan, Semiconductors & Semiconductor Equipment) | 6.1 | |
| Samsung Electronics Co. Ltd. (Korea (South), Technology Hardware, Storage & Peripherals) | 4.6 | |
| Tencent Holdings Ltd. (Cayman Islands, Interactive Media & Services) | 3.1 | |
| HDFC Bank Ltd. (India, Banks) | 2.7 | |
| Alibaba Group Holding Ltd. (Cayman Islands, Internet & Direct Marketing Retail) | 2.1 | |
| Reliance Industries Ltd. (India, Oil, Gas & Consumable Fuels) | 2.0 | |
| Infosys Ltd. | 1.5 | |
| China Construction Bank Corp. (H Shares) (China, Banks) | 1.5 | |
| Meituan Class B (Cayman Islands, Internet & Direct Marketing Retail) | 1.4 | |
| Grupo Financiero Banorte S.A.B. de CV Series O (Mexico, Banks) | 1.2 | |
| 26.2 | ||
| Market Sectors (% of Fund's net assets) | ||
| Financials | 22.2 | |
| Information Technology | 19.2 | |
| Consumer Discretionary | 12.0 | |
| Materials | 9.3 | |
| Communication Services | 6.9 | |
| Consumer Staples | 6.1 | |
| Industrials | 5.8 | |
| Energy | 5.1 | |
| Health Care | 3.5 | |
| Utilities | 3.4 | |
| Real Estate | 1.3 | |
Asset Allocation (% of Fund's net assets) |
 |
Foreign investments - 92.6% |
Geographic Diversification (% of Fund's net assets) |
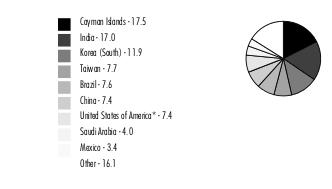 |
* ��Includes Short-Term investments and Net Other Assets (Liabilities). Percentages are based on country or territory of incorporation and are adjusted for the effect of futures contracts, if applicable. |
| Common Stocks - 90.9% | |||
| Shares | Value ($) | ||
| Belgium - 0.3% | |||
| Titan Cement International Trading SA (a) | 5,898,500 | 65,636,709 | |
| Bermuda - 1.3% | |||
| China Gas Holdings Ltd. | 43,145,600 | 38,255,639 | |
| Credicorp Ltd. (United States) | 939,622 | 137,523,076 | |
| Huanxi Media Group Ltd. (b) | 142,155,870 | 16,298,852 | |
| Kerry Properties Ltd. | 10,509,000 | 16,627,720 | |
| Kunlun Energy Co. Ltd. | 74,018,000 | 44,224,191 | |
| Pacific Basin Shipping Ltd. | 62,296,000 | 15,078,685 | |
| Shangri-La Asia Ltd. (b) | 25,114,000 | 13,885,302 | |
TOTAL BERMUDA | 281,893,465 | ||
| Brazil - 4.9% | |||
| Arezzo Industria e Comercio SA | 2,313,875 | 46,810,558 | |
| Atacadao SA | 29,028,400 | 109,358,758 | |
| Dexco SA | 27,407,210 | 51,413,390 | |
| ENGIE Brasil Energia SA | 7,054,700 | 54,929,829 | |
| Equatorial Energia SA | 13,252,300 | 77,043,184 | |
| Localiza Rent a Car SA | 12,674,960 | 173,089,087 | |
| LOG Commercial Properties e Participacoes SA (a) | 5,669,311 | 24,979,870 | |
| Lojas Renner SA | 12,473,683 | 74,617,521 | |
| Rede D'Oregon Sao Luiz SA (c) | 9,046,600 | 56,340,939 | |
| Rumo SA | 25,246,500 | 108,209,759 | |
| Suzano Papel e Celulose SA | 7,655,100 | 78,840,639 | |
| Transmissora Alianca de Energia Eletrica SA unit | 6,784,700 | 52,788,131 | |
| Vale SA sponsored ADR (d) | 14,114,270 | 182,638,654 | |
TOTAL BRAZIL | 1,091,060,319 | ||
| Canada - 0.8% | |||
| Barrick Gold Corp. | 12,536,500 | 188,423,595 | |
| Cayman Islands - 17.4% | |||
| Akeso, Inc. (b)(c) | 5,235,545 | 21,009,812 | |
| Alibaba Group Holding Ltd. (b) | 59,540,985 | 462,925,604 | |
| Alibaba Group Holding Ltd. sponsored ADR (b) | 286,121 | 18,191,573 | |
| Angelalign Technology, Inc. (c)(d) | 922,000 | 8,139,802 | |
| Ant International Co. Ltd. Class C (b)(e)(f) | 9,361,123 | 14,416,129 | |
| Antengene Corp. (b)(c) | 16,122,025 | 6,839,330 | |
| Archosaur Games, Inc. (b)(c) | 2,704,865 | 778,760 | |
| Baidu, Inc. sponsored ADR (b) | 332,743 | 25,478,132 | |
| BeiGene Ltd. ADR (b) | 43,800 | 7,397,382 | |
| Bilibili, Inc. ADR (b)(d) | 6,260,531 | 55,843,937 | |
| BizLink Holding, Inc. | 5,165,000 | 39,473,321 | |
| Chailease Holding Co. Ltd. | 30,887,341 | 142,686,607 | |
| China Resources Land Ltd. | 9,045,720 | 28,348,361 | |
| CK Asset Holdings Ltd. | 2,608,500 | 14,422,159 | |
| Daqo New Energy Corp. ADR (b) | 109,350 | 4,810,307 | |
| ENN Energy Holdings Ltd. | 7,039,300 | 69,992,594 | |
| ESR Group Ltd. (c) | 6,587,200 | 11,244,894 | |
| GlobalFoundries, Inc. | 314,681 | 17,842,413 | |
| Greentown China Holdings Ltd. | 5,034,000 | 4,790,530 | |
| Haitian International Holdings Ltd. | 18,609,306 | 37,267,686 | |
| Hansoh Pharmaceutical Group Co. Ltd. (c) | 21,389,724 | 33,026,116 | |
| Innovent Biologics, Inc. (b)(c) | 8,599,362 | 30,455,149 | |
| Jacobio Pharmaceuticals Group Co. Ltd. (b)(c) | 18,739,328 | 8,259,996 | |
| JD Health International, Inc. (b)(c) | 2,522,058 | 13,831,776 | |
| JD.com, Inc.: | |||
| Class A | 6,456,159 | 117,570,012 | |
| sponsored ADR (d) | 1,584,375 | 59,081,344 | |
| KE Holdings, Inc. ADR (b) | 999,800 | 10,177,964 | |
| Kuaishou Technology Class B (b)(c) | 4,551,927 | 18,730,420 | |
| Li Ning Co. Ltd. | 23,375,048 | 120,900,543 | |
| Longfor Properties Co. Ltd. (c) | 751,756 | 957,694 | |
| Medlive Technology Co. Ltd. (c) | 11,039,780 | 9,535,420 | |
| Meituan Class B (b)(c) | 20,035,936 | 320,786,273 | |
| NetEase, Inc. ADR | 1,676,424 | 93,242,703 | |
| PagSeguro Digital Ltd. (b)(d) | 13,690,549 | 187,286,710 | |
| Parade Technologies Ltd. | 807,752 | 15,251,472 | |
| Pinduoduo, Inc. ADR (b) | 4,721,201 | 258,863,451 | |
| Sea Ltd. ADR (b)(d) | 4,692,719 | 233,134,280 | |
| Silergy Corp. | 3,226,591 | 37,413,810 | |
| StoneCo Ltd. Class A (b) | 5,848,800 | 61,412,400 | |
| Sunny Optical Technology Group Co. Ltd. | 3,889,156 | 33,715,779 | |
| Tencent Holdings Ltd. | 26,380,043 | 693,182,954 | |
| Tencent Music Entertainment Group ADR (b) | 2,320,459 | 8,376,857 | |
| Tongdao Liepin Group (b) | 8,726,062 | 7,603,685 | |
| Trip.com Group Ltd. ADR (b) | 6,754,577 | 152,856,078 | |
| Uni-President China Holdings Ltd. | 48,748,000 | 36,019,237 | |
| Wuxi Biologics (Cayman), Inc. (b)(c) | 18,390,087 | 82,748,816 | |
| Xinyi Solar Holdings Ltd. | 23,167,154 | 22,991,105 | |
| XP, Inc. Class A (b)(d) | 9,143,965 | 167,608,878 | |
| XPeng, Inc. ADR (b)(d) | 3,440,999 | 22,779,413 | |
| Zai Lab Ltd. (a)(b) | 11,266,002 | 25,948,841 | |
| Zai Lab Ltd. ADR (a)(b) | 49,300 | 1,098,404 | |
TOTAL CAYMAN ISLANDS | 3,876,746,913 | ||
| Chile - 1.3% | |||
| Banco de Chile | 1,275,662,800 | 116,668,726 | |
| Sociedad Quimica y Minera de Chile SA (PN-B) sponsored ADR | 1,873,962 | 175,552,760 | |
TOTAL CHILE | 292,221,486 | ||
| China - 7.1% | |||
| Asymchem Laboratories Tianjin Co. Ltd. (H Shares) (c) | 728,780 | 7,798,758 | |
| Bafang Electric Suzhou Co. Ltd. (A Shares) | 862,174 | 13,746,805 | |
| Beijing Enlight Media Co. Ltd. (A Shares) | 20,566,276 | 18,952,887 | |
| BYD Co. Ltd. (H Shares) | 1,119,326 | 25,054,057 | |
| C&S Paper Co. Ltd. (A Shares) | 22,252,600 | 28,520,771 | |
| China Communications Services Corp. Ltd. (H Shares) | 82,018,000 | 22,882,475 | |
| China Construction Bank Corp. (H Shares) | 641,111,000 | 340,230,208 | |
| China Merchants Shekou Industrial Zone Holdings Co. Ltd. (A Shares) | 4,020,528 | 7,217,560 | |
| China Petroleum & Chemical Corp. (H Shares) | 259,564,000 | 102,872,078 | |
| China Tourism Group Duty Free Corp. Ltd. (A Shares) | 334,600 | 7,347,281 | |
| China Tower Corp. Ltd. (H Shares) (c) | 162,899,186 | 14,734,214 | |
| Daqin Railway Co. Ltd. (A Shares) | 88,037,700 | 77,273,639 | |
| Flat Glass Group Co. Ltd. (d) | 6,056,781 | 14,181,987 | |
| Gemdale Corp. (A Shares) | 2,996,700 | 3,208,889 | |
| Haier Smart Home Co. Ltd. | 25,735,016 | 64,389,586 | |
| Haier Smart Home Co. Ltd. (A Shares) | 1,171,203 | 3,335,801 | |
| Hangzhou First Applied Material Co. Ltd. (A Shares) | 1,056,240 | 9,265,187 | |
| Hongfa Technology Co. Ltd. (A Shares) | 9,013,440 | 42,346,345 | |
| LONGi Green Energy Technology Co. Ltd. | 2,042,740 | 13,420,787 | |
| Pharmaron Beijing Co. Ltd. (H Shares) (c) | 3,292,762 | 11,074,241 | |
| Ping An Insurance Group Co. of China Ltd. (H Shares) | 56,991,000 | 228,157,228 | |
| Poly Developments & Holdings (A Shares) | 1,927,734 | 3,642,762 | |
| Proya Cosmetics Co. Ltd. (A Shares) | 5,145,230 | 117,764,887 | |
| Shenzhen Mindray Bio-Medical Electronics Co. Ltd. (A Shares) | 2,052,739 | 91,476,452 | |
| Sinopec Engineering Group Co. Ltd. (H Shares) | 54,259,687 | 19,423,760 | |
| Sinopharm Group Co. Ltd. (H Shares) | 12,140,800 | 23,138,149 | |
| TravelSky Technology Ltd. (H Shares) | 24,719,000 | 35,899,257 | |
| Tsingtao Brewery Co. Ltd. (H Shares) | 20,373,384 | 142,749,819 | |
| Venus MedTech Hangzhou, Inc. (H Shares) (b)(c) | 6,260,487 | 7,696,356 | |
| Will Semiconductor Ltd. | 452,625 | 4,547,385 | |
| WuXi AppTec Co. Ltd. (H Shares) (c) | 3,056,704 | 24,493,663 | |
| Zhuzhou CRRC Times Electric Co. Ltd. (H Shares) | 15,632,000 | 67,808,068 | |
TOTAL CHINA | 1,594,651,342 | ||
| Cyprus - 0.0% | |||
| Fix Price Group Ltd. GDR (Reg. S) (f) | 5,084,349 | 1,877,803 | |
| Galaxy Cosmos Mezz PLC (b) | 3,187,556 | 514,727 | |
| Sunrisemezz Ltd. (b) | 2,973,378 | 240,658 | |
| TCS Group Holding PLC GDR (b)(f) | 4,004,379 | 5,023,694 | |
TOTAL CYPRUS | 7,656,882 | ||
| Germany - 0.2% | |||
| Delivery Hero AG (b)(c) | 1,090,514 | 35,887,643 | |
| Greece - 0.5% | |||
| Alpha Bank SA (b) | 86,064,100 | 79,779,571 | |
| Piraeus Financial Holdings SA (b) | 20,813,647 | 25,670,220 | |
TOTAL GREECE | 105,449,791 | ||
| Hong Kong - 1.4% | |||
| AIA Group Ltd. | 14,558,800 | 110,279,912 | |
| China Merchants Holdings International Co. Ltd. | 21,733,398 | 25,472,124 | |
| China Overseas Land and Investment Ltd. | 12,122,900 | 23,134,922 | |
| China Resources Beer Holdings Co. Ltd. | 24,560,666 | 115,768,810 | |
| Guangdong Investment Ltd. | 60,640,000 | 38,239,667 | |
| Sino-Ocean Group Holding Ltd. | 29,284,500 | 1,939,951 | |
TOTAL HONG KONG | 314,835,386 | ||
| Hungary - 0.1% | |||
| Richter Gedeon PLC | 1,760,700 | 34,766,230 | |
| India - 16.8% | |||
| Adani Ports & Special Economic Zone Ltd. | 9,071,547 | 90,249,729 | |
| Apollo Hospitals Enterprise Ltd. | 1,233,100 | 67,293,178 | |
| Bajaj Finance Ltd. | 2,213,477 | 191,028,039 | |
| Bandhan Bank Ltd. (b)(c) | 29,752,232 | 85,738,040 | |
| Bharat Electronics Ltd. | 65,852,100 | 84,999,962 | |
| CE Info Systems Ltd. | 849,648 | 13,427,784 | |
| Delhivery Private Ltd. | 698,316 | 2,903,604 | |
| Divi's Laboratories Ltd. | 784,000 | 34,179,483 | |
| Embassy Office Parks (REIT) | 2,265,500 | 9,424,896 | |
| HDFC Bank Ltd. (b) | 32,700,488 | 593,445,473 | |
| HDFC Standard Life Insurance Co. Ltd. (c) | 19,825,041 | 129,432,754 | |
| Indraprastha Gas Ltd. | 11,866,994 | 61,392,126 | |
| Indus Towers Ltd. | 1,964,000 | 4,401,087 | |
| Infosys Ltd. | 4,421,351 | 82,127,209 | |
| Infosys Ltd. sponsored ADR | 17,845,425 | 334,244,810 | |
| ITC Ltd. | 32,040,454 | 134,966,252 | |
| JK Cement Ltd. (a) | 4,684,331 | 153,502,664 | |
| Larsen & Toubro Ltd. | 5,757,844 | 140,718,703 | |
| Mahanagar Gas Ltd. | 4,235,034 | 44,082,110 | |
| Manappuram General Finance & Leasing Ltd. | 30,717,187 | 39,073,687 | |
| Maruti Suzuki India Ltd. | 827,245 | 95,212,122 | |
| NTPC Ltd. | 47,282,145 | 98,870,975 | |
| Oberoi Realty Ltd. | 1,728,872 | 19,311,446 | |
| Oil & Natural Gas Corp. Ltd. | 46,102,600 | 74,656,361 | |
| Petronet LNG Ltd. | 12,081,180 | 29,998,629 | |
| Pine Labs Private Ltd. (b)(e)(f) | 9,606 | 4,820,195 | |
| Power Grid Corp. of India Ltd. | 46,144,554 | 127,179,029 | |
| Reliance Industries Ltd. | 14,370,792 | 442,616,227 | |
| Shree Cement Ltd. | 370,268 | 101,716,350 | |
| Sun Pharmaceutical Industries Ltd. | 1,655,800 | 20,340,457 | |
| Tata Motors Ltd. (b) | 10,911,050 | 54,628,287 | |
| Tata Steel Ltd. | 120,497,800 | 147,820,145 | |
| Torrent Pharmaceuticals Ltd. | 1,565,272 | 31,199,551 | |
| Vijaya Diagnostic Centre Pvt Ltd. | 1,837,200 | 9,700,895 | |
| Voltas Ltd. | 3,077,381 | 32,573,100 | |
| Zomato Ltd. (b) | 214,258,017 | 163,320,619 | |
TOTAL INDIA | 3,750,595,978 | ||
| Indonesia - 2.5% | |||
| PT Astra International Tbk | 99,511,900 | 42,426,936 | |
| PT Bank Central Asia Tbk | 386,543,160 | 218,084,937 | |
| PT Bank Rakyat Indonesia (Persero) Tbk | 780,793,039 | 232,773,690 | |
| PT Dayamitra Telekomunikasi Tbk | 104,720,900 | 4,800,477 | |
| PT Sumber Alfaria Trijaya Tbk | 138,845,700 | 25,103,053 | |
| PT United Tractors Tbk | 17,356,200 | 35,941,995 | |
TOTAL INDONESIA | 559,131,088 | ||
| Japan - 0.7% | |||
| Capcom Co. Ltd. | 644,983 | 17,979,451 | |
| JTOWER, Inc. (b) | 286,780 | 11,668,308 | |
| Money Forward, Inc. (b) | 537,206 | 15,318,292 | |
| Renesas Electronics Corp. (b) | 3,446,613 | 28,833,511 | |
| Sumco Corp. | 1,479,268 | 18,792,409 | |
| Z Holdings Corp. | 27,822,275 | 71,802,608 | |
TOTAL JAPAN | 164,394,579 | ||
| Korea (South) - 11.6% | |||
| AMOREPACIFIC Group, Inc. | 1,924,119 | 33,297,186 | |
| Coway Co. Ltd. | 1,164,470 | 45,116,155 | |
| Hana Financial Group, Inc. | 1,113,273 | 32,173,942 | |
| Hanon Systems | 3,903,700 | 21,332,890 | |
| Hyundai Fire & Marine Insurance Co. Ltd. | 2,411,330 | 56,257,384 | |
| Jeisys Medical, Inc. (b) | 638,010 | 3,169,220 | |
| Kakao Corp. | 2,009,835 | 71,391,583 | |
| Kakao Pay Corp. (b)(d) | 629,653 | 15,594,424 | |
| KB Financial Group, Inc. | 4,702,855 | 157,928,515 | |
| Kia Corp. | 2,087,049 | 96,944,868 | |
| Korea Zinc Co. Ltd. | 123,716 | 55,473,363 | |
| L&F Co. Ltd. (b)(d) | 31,000 | 4,886,781 | |
| LG Chemical Ltd. | 145,176 | 63,671,900 | |
| LG Corp. | 950,738 | 52,755,128 | |
| LG Electronics, Inc. | 238,715 | 13,647,356 | |
| LG Innotek Co. Ltd. | 30,760 | 6,389,836 | |
| NAVER Corp. | 396,661 | 47,105,092 | |
| NCSOFT Corp. | 142,684 | 38,986,885 | |
| Netmarble Corp. (c) | 157,677 | 4,926,992 | |
| POSCO | 1,105,806 | 192,344,281 | |
| S-Oil Corp. | 836,750 | 50,651,010 | |
| Samsung Biologics Co. Ltd. (b)(c) | 158,578 | 97,436,388 | |
| Samsung Electronics Co. Ltd. | 24,584,198 | 1,023,107,195 | |
| Samsung SDI Co. Ltd. | 268,863 | 138,828,035 | |
| SK Hynix, Inc. | 4,407,260 | 255,359,977 | |
| Studio Dragon Corp. (b) | 251,586 | 12,056,499 | |
TOTAL KOREA (SOUTH) | 2,590,832,885 | ||
| Luxembourg - 0.6% | |||
| Adecoagro SA (d) | 629,118 | 5,448,162 | |
| Globant SA (b) | 291,114 | 54,927,390 | |
| Tenaris SA sponsored ADR | 2,509,700 | 78,854,774 | |
TOTAL LUXEMBOURG | 139,230,326 | ||
| Mauritius - 0.0% | |||
| Jumo World Ltd. (b)(f) | 2,021 | 8,222,014 | |
| Mexico - 3.4% | |||
| CEMEX S.A.B. de CV sponsored ADR (b) | 52,268,900 | 201,757,954 | |
| Corporacion Inmobiliaria Vesta S.A.B. de CV | 18,182,184 | 39,515,714 | |
| Grupo Aeroportuario del Pacifico S.A.B. de CV Series B | 4,936,400 | 76,463,996 | |
| Grupo Aeroportuario del Sureste S.A.B. de CV Series B sponsored ADR | 291,600 | 68,065,272 | |
| Grupo Aeroportuario Norte S.A.B. de CV | 4,411,100 | 35,140,969 | |
| Grupo Financiero Banorte S.A.B. de CV Series O | 32,844,278 | 266,974,763 | |
| Wal-Mart de Mexico SA de CV Series V | 20,491,000 | 79,148,853 | |
TOTAL MEXICO | 767,067,521 | ||
| Netherlands - 0.2% | |||
| CTP BV (c) | 237,377 | 2,463,172 | |
| NXP Semiconductors NV | 95,096 | 13,891,624 | |
| X5 Retail Group NV GDR (Reg. S) (f) | 6,393,700 | 1,334,941 | |
| Yandex NV Series A (b)(d)(f) | 6,677,608 | 22,903,127 | |
TOTAL NETHERLANDS | 40,592,864 | ||
| Panama - 0.2% | |||
| Copa Holdings SA Class A (b)(d) | 526,559 | 39,613,034 | |
| Philippines - 0.2% | |||
| Ayala Land, Inc. | 41,226,524 | 18,240,823 | |
| SM Investments Corp. | 2,563,000 | 36,418,841 | |
TOTAL PHILIPPINES | 54,659,664 | ||
| Poland - 0.2% | |||
| CD Projekt RED SA (d) | 1,567,280 | 41,725,412 | |
| Russia - 0.0% | |||
| Gazprom OAO sponsored ADR (Reg. S) (b)(f) | 10,986,900 | 2,509,847 | |
| LSR Group OJSC (b)(f) | 98,230 | 148,176 | |
| LUKOIL PJSC sponsored ADR (f) | 2,479,000 | 701,284 | |
| Novatek PJSC GDR (Reg. S) (f) | 648,900 | 165,774 | |
| Sberbank of Russia (b)(f) | 12,899,053 | 118,929 | |
| Sberbank of Russia sponsored ADR (b)(f) | 19,633,994 | 349,485 | |
| Severstal PAO GDR (Reg. S) (f) | 6,035,400 | 142,496 | |
TOTAL RUSSIA | 4,135,991 | ||
| Saudi Arabia - 4.0% | |||
| Al Rajhi Bank | 11,433,615 | 259,249,777 | |
| Alinma Bank | 14,319,200 | 142,904,286 | |
| Bupa Arabia for Cooperative Insurance Co. | 2,083,500 | 107,015,342 | |
| Saudi Arabian Oil Co. (c) | 4,638,810 | 43,085,114 | |
| Saudi Tadawul Group Holding Co. | 1,904,700 | 110,098,559 | |
| The Saudi National Bank | 14,350,100 | 226,848,862 | |
TOTAL SAUDI ARABIA | 889,201,940 | ||
| Singapore - 0.9% | |||
| CapitaLand Investment Ltd. | 14,888,800 | 31,658,158 | |
| First Resources Ltd. | 68,074,400 | 71,652,201 | |
| United Overseas Bank Ltd. | 4,648,400 | 91,155,400 | |
TOTAL SINGAPORE | 194,465,759 | ||
| South Africa - 3.0% | |||
| Capitec Bank Holdings Ltd. (d) | 1,295,861 | 134,079,594 | |
| FirstRand Ltd. (d) | 44,073,061 | 154,398,175 | |
| Impala Platinum Holdings Ltd. | 20,081,502 | 205,607,799 | |
| Naspers Ltd. Class N | 551,310 | 56,830,068 | |
| Pick 'n Pay Stores Ltd. (a)(d) | 37,310,884 | 119,922,945 | |
TOTAL SOUTH AFRICA | 670,838,581 | ||
| Taiwan - 7.7% | |||
| ECLAT Textile Co. Ltd. | 3,446,000 | 45,353,352 | |
| eMemory Technology, Inc. | 580,814 | 19,358,066 | |
| GlobalWafers Co. Ltd. | 1,112,000 | 12,359,769 | |
| MediaTek, Inc. | 7,219,875 | 132,068,154 | |
| Taiwan Semiconductor Manufacturing Co. Ltd. | 113,453,141 | 1,362,625,315 | |
| Uni-President Enterprises Corp. | 38,668,000 | 78,525,268 | |
| Unimicron Technology Corp. | 7,120,349 | 27,484,450 | |
| United Microelectronics Corp. | 3,139,453 | 3,771,384 | |
| Wiwynn Corp. | 1,510,292 | 33,901,265 | |
TOTAL TAIWAN | 1,715,447,023 | ||
| Thailand - 0.5% | |||
| Carabao Group PCL (For. Reg.) | 11,955,400 | 28,360,490 | |
| Land & House PCL (For. Reg.) | 55,067,500 | 13,316,362 | |
| PTT Global Chemical PCL (For. Reg.) | 53,000,300 | 60,599,633 | |
TOTAL THAILAND | 102,276,485 | ||
| Turkey - 0.5% | |||
| Bim Birlesik Magazalar A/S JSC | 15,120,000 | 108,845,642 | |
| United Kingdom - 0.7% | |||
| Helios Towers PLC (b) | 18,209,900 | 26,208,307 | |
| Prudential PLC | 13,120,148 | 121,881,861 | |
TOTAL UNITED KINGDOM | 148,090,168 | ||
| United States of America - 1.9% | |||
| Airbnb, Inc. Class A (b) | 186,500 | 19,938,715 | |
| Dlocal Ltd. (b) | 1,784,975 | 39,804,943 | |
| FirstCash Holdings, Inc. | 1,783,554 | 175,590,891 | |
| Legend Biotech Corp. ADR (b) | 460,500 | 22,942,110 | |
| Li Auto, Inc. ADR (b) | 5,040,770 | 68,655,287 | |
| Marvell Technology, Inc. | 376,585 | 14,942,893 | |
| MercadoLibre, Inc. (b) | 73,867 | 66,599,965 | |
| NVIDIA Corp. | 119,592 | 16,141,332 | |
TOTAL UNITED STATES OF AMERICA | 424,616,136 | ||
| TOTAL COMMON STOCKS (Cost $22,970,148,064) | 20,303,212,851 | ||
| Preferred Stocks - 3.6% | |||
| Shares | Value ($) | ||
| Convertible Preferred Stocks - 0.5% | |||
| Cayman Islands - 0.1% | |||
| Creditas Financial Solutions Ltd. Series F (e)(f) | 70,500 | 22,952,685 | |
| China - 0.3% | |||
| ByteDance Ltd. Series E1 (b)(e)(f) | 399,541 | 62,735,928 | |
| dMed Biopharmaceutical Co. Ltd. Series C (b)(e)(f) | 769,712 | 6,904,317 | |
| 69,640,245 | |||
| India - 0.1% | |||
| Meesho Series F (b)(e)(f) | 431,274 | 28,351,953 | |
TOTAL CONVERTIBLE PREFERRED STOCKS | 120,944,883 | ||
| Nonconvertible Preferred Stocks - 3.1% | |||
| Brazil - 2.7% | |||
| Ambev SA sponsored ADR | 56,071,500 | 170,457,360 | |
| Companhia de Transmissao de Energia Eletrica Paulista (PN) | 8,532,900 | 40,471,600 | |
| Metalurgica Gerdau SA (PN) | 56,363,022 | 122,753,654 | |
| Petroleo Brasileiro SA - Petrobras: | |||
| (PN) sponsored ADR (non-vtg.) | 12,223,900 | 140,697,089 | |
| sponsored ADR | 9,647,400 | 123,679,668 | |
| 598,059,371 | |||
| India - 0.1% | |||
| Pine Labs Private Ltd.: | |||
| Series 1 (b)(e)(f) | 22,959 | 11,520,597 | |
| Series A (b)(e)(f) | 5,737 | 2,878,769 | |
| Series B (b)(e)(f) | 6,242 | 3,132,173 | |
| Series B2 (b)(e)(f) | 5,049 | 2,533,538 | |
| Series C (b)(e)(f) | 9,391 | 4,712,310 | |
| Series C1 (b)(e)(f) | 1,978 | 992,541 | |
| Series D (b)(e)(f) | 2,116 | 1,061,788 | |
| 26,831,716 | |||
| Korea (South) - 0.3% | |||
| Hyundai Motor Co. Series 2 | 991,643 | 55,441,745 | |
| United States of America - 0.0% | |||
| Gupshup, Inc. (b)(e)(f) | 566,129 | 10,609,257 | |
TOTAL NONCONVERTIBLE PREFERRED STOCKS | 690,942,089 | ||
| TOTAL PREFERRED STOCKS (Cost $674,862,087) | 811,886,972 | ||
| Government Obligations - 0.1% | |||
Principal Amount (g) | Value ($) | ||
| United States of America - 0.1% | |||
U.S. Treasury Bills, yield at date of purchase 2.45% to 3.21% 11/3/22 to 12/29/22 (h) (Cost $21,752,132) | 21,840,000 | 21,735,926 | |
| Money Market Funds - 5.2% | |||
| Shares | Value ($) | ||
| Fidelity Cash Central Fund 3.10% (i) | 722,864,008 | 723,008,581 | |
| Fidelity Securities Lending Cash Central Fund 3.10% (i)(j) | 428,998,637 | 429,041,537 | |
| TOTAL MONEY MARKET FUNDS (Cost $1,152,031,638) | 1,152,050,118 | ||
| TOTAL INVESTMENT IN SECURITIES - 99.8% (Cost $24,818,793,921) | 22,288,885,867 |
NET OTHER ASSETS (LIABILITIES) - 0.2% | 41,390,684 |
| NET ASSETS - 100.0% | 22,330,276,551 |
| Futures Contracts | |||||
Number of contracts | Expiration Date | Notional Amount ($) | Value ($) | Unrealized Appreciation/ (Depreciation) ($) | |
| Purchased | |||||
| Equity Index Contracts | |||||
| ICE E-mini MSCI Emerging Markets Index Contracts (United States) | 17,223 | Dec 2022 | 735,077,640 | (4,775,049) | (4,775,049) |
| The notional amount of futures purchased as a percentage of Net Assets is 3.3% | |||||
| (a) | Affiliated company |
| (b) | Non-income producing |
| (c) | Security exempt from registration under Rule 144A of the Securities Act of 1933. These securities may be resold in transactions exempt from registration, normally to qualified institutional buyers. At the end of the period, the value of these securities amounted to $1,087,452,532 or 4.9% of net assets. |
| (d) | Security or a portion of the security is on loan at period end. |
| (e) | Restricted securities (including private placements) - Investment in securities not registered under the Securities Act of 1933 (excluding 144A issues). At the end of the period, the value of restricted securities (excluding 144A issues) amounted to $177,622,180 or 0.8% of net assets. |
| (f) | Level 3 security |
| (g) | Amount is stated in United States dollars unless otherwise noted. |
| (h) | Security or a portion of the security was pledged to cover margin requirements for futures contracts. At period end, the value of securities pledged amounted to $11,224,990. |
| (i) | Affiliated fund that is generally available only to investment companies and other accounts managed by Fidelity Investments. The rate quoted is the annualized seven-day yield of the fund at period end. A complete unaudited listing of the fund's holdings as of its most recent quarter end is available upon request. In addition, each Fidelity Central Fund's financial statements, which are not covered by the Fund's Report of Independent Registered Public Accounting Firm, are available on the SEC's website or upon request. |
| (j) | Investment made with cash collateral received from securities on loan. |
| Additional information on each restricted holding is as follows: | ||
| Security | Acquisition Date | Acquisition Cost ($) |
| Ant International Co. Ltd. Class C | 5/16/18 | 35,678,747 |
| ByteDance Ltd. Series E1 | 11/18/20 | 43,779,377 |
| Creditas Financial Solutions Ltd. Series F | 1/28/22 | 22,206,259 |
| dMed Biopharmaceutical Co. Ltd. Series C | 12/01/20 | 10,932,333 |
| Gupshup, Inc. | 6/08/21 | 12,944,653 |
| Meesho Series F | 9/21/21 | 33,066,770 |
| Pine Labs Private Ltd. | 6/30/21 | 3,581,693 |
| Pine Labs Private Ltd. Series 1 | 6/30/21 | 8,560,493 |
| Pine Labs Private Ltd. Series A | 6/30/21 | 2,139,098 |
| Pine Labs Private Ltd. Series B | 6/30/21 | 2,327,392 |
| Pine Labs Private Ltd. Series B2 | 6/30/21 | 1,882,570 |
| Pine Labs Private Ltd. Series C | 6/30/21 | 3,501,528 |
| Pine Labs Private Ltd. Series C1 | 6/30/21 | 737,517 |
| Pine Labs Private Ltd. Series D | 6/30/21 | 788,972 |
| Affiliate | Value, beginning of period ($) | Purchases ($) | Sales Proceeds ($) | Dividend Income ($) | Realized Gain (loss) ($) | Change in Unrealized appreciation (depreciation) ($) | Value, end of period ($) | % ownership, end of period |
| Fidelity Cash Central Fund 3.10% | 91,212,294 | 16,226,924,332 | 15,595,128,044 | 7,001,339 | - | (1) | 723,008,581 | 1.4% |
| Fidelity Securities Lending Cash Central Fund 3.10% | 671,802,601 | 4,478,086,330 | 4,720,847,394 | 4,755,868 | - | - | 429,041,537 | 1.2% |
| Total | 763,014,895 | 20,705,010,662 | 20,315,975,438 | 11,757,207 | - | (1) | 1,152,050,118 | |
| Affiliate | Value, beginning of period ($) | Purchases ($) | Sales Proceeds ($) | Dividend Income ($) | Realized Gain (loss) ($) | Change in Unrealized appreciation (depreciation) ($) | Value, end of period ($) |
| First Resources Ltd. | 112,766,729 | 12,593,354 | 35,000,899 | 4,650,232 | (581,217) | (18,125,766) | - |
| JK Cement Ltd. | 206,550,633 | 14,708,843 | 11,114,072 | 674,043 | (3,706,567) | (52,936,173) | 153,502,664 |
| LOG Commercial Properties e Participacoes SA | 9,222,095 | 15,152,476 | - | 900,552 | - | 605,299 | 24,979,870 |
| Pick 'n Pay Stores Ltd. | 143,251,457 | 2,204,520 | - | 4,451,702 | - | (25,533,032) | 119,922,945 |
| Titan Cement International Trading SA | 105,966,764 | 756,916 | 3,882,746 | 3,075,041 | (3,202,522) | (34,001,703) | 65,636,709 |
| Zai Lab Ltd. | 83,860,202 | 16,314,309 | 3,259,589 | - | (2,988,010) | (67,978,071) | 25,948,841 |
| Zai Lab Ltd. ADR | - | 1,877,776 | - | - | - | (779,372) | 1,098,404 |
| Total | 661,617,880 | 63,608,194 | 53,257,306 | 13,751,570 | (10,478,316) | (198,748,818) | 391,089,433 |
| Valuation Inputs at Reporting Date: | ||||
| Description | Total ($) | Level 1 ($) | Level 2 ($) | Level 3 ($) |
Investments in Securities: | ||||
| Equities: | ||||
Communication Services | 1,562,313,509 | 774,424,820 | 764,985,562 | 22,903,127 |
Consumer Discretionary | 2,680,186,789 | 1,629,681,099 | 1,048,627,887 | 1,877,803 |
Consumer Staples | 1,407,244,635 | 1,405,909,694 | - | 1,334,941 |
Energy | 1,126,429,850 | 1,020,180,867 | 102,872,078 | 3,376,905 |
Financials | 4,926,576,718 | 3,323,570,585 | 1,551,923,197 | 51,082,936 |
Health Care | 784,409,455 | 694,756,322 | 82,748,816 | 6,904,317 |
Industrials | 1,288,227,287 | 1,251,808,446 | 36,418,841 | - |
Information Technology | 4,259,574,496 | 2,730,995,237 | 1,395,230,210 | 133,349,049 |
Materials | 2,047,895,986 | 1,649,801,410 | 397,952,080 | 142,496 |
Real Estate | 284,772,023 | 266,383,024 | 18,240,823 | 148,176 |
Utilities | 747,469,075 | 747,469,075 | - | - |
| Government Obligations | 21,735,926 | - | 21,735,926 | - |
| Money Market Funds | 1,152,050,118 | 1,152,050,118 | - | - |
| Total Investments in Securities: | 22,288,885,867 | 16,647,030,697 | 5,420,735,420 | 221,119,750 |
Derivative Instruments: | ||||
| Liabilities | ||||
Futures Contracts | (4,775,049) | (4,775,049) | - | - |
| Total Liabilities | (4,775,049) | (4,775,049) | - | - |
| Total Derivative Instruments: | (4,775,049) | (4,775,049) | - | - |
| (Amounts in thousands) | |||
| Investments in Securities: | |||
| Communication Services | |||
| Beginning Balance | $ | - | |
| Net Realized Gain (Loss) on Investment Securities | (24,731,717) | ||
| Net Unrealized Gain (Loss) on Investment Securities | (437,230,467) | ||
| Cost of Purchases | 164,608,675 | ||
| Proceeds of Sales | (38,305,866) | ||
| Amortization/Accretion | - | ||
| Transfers into Level 3 | 358,562,502 | ||
| Transfers out of Level 3 | - | ||
| Ending Balance | $ | 22,903,127 | |
| The change in unrealized gain (loss) for the period attributable to Level 3 securities held at October 31, 2022 | $ | (437,230,467) | |
| Energy | |||
| Beginning Balance | $ | - | |
| Net Realized Gain (Loss) on Investment Securities | (2,417,385) | ||
| Net Unrealized Gain (Loss) on Investment Securities | (537,578,761) | ||
| Cost of Purchases | 94,374,004 | ||
| Proceeds of Sales | (128,985,355) | ||
| Amortization/Accretion | - | ||
| Transfers into Level 3 | 577,984,402 | ||
| Transfers out of Level 3 | - | ||
| Ending Balance | $ | 3,376,905 | |
| The change in unrealized gain (loss) for the period attributable to Level 3 securities held at October 31, 2022 | $ | (537,578,761) | |
| Financials | |||
| Beginning Balance | $ | 35,315,704 | |
| Net Realized Gain (Loss) on Investment Securities | (3,168,018) | ||
| Net Unrealized Gain (Loss) on Investment Securities | (837,130,916) | ||
| Cost of Purchases | 140,256,067 | ||
| Proceeds of Sales | (18,613,983) | ||
| Amortization/Accretion | - | ||
| Transfers into Level 3 | 734,424,082 | ||
| Transfers out of Level 3 | - | ||
| Ending Balance | $ | 51,082,936 | |
| The change in unrealized gain (loss) for the period attributable to Level 3 securities held at October 31, 2022 | $ | (837,130,916) | |
| Other Investments in Securities | |||
| Beginning Balance | $ | 133,369,962 | |
| Net Realized Gain (Loss) on Investment Securities | (120,009) | ||
| Net Unrealized Gain (Loss) on Investment Securities | (345,325,796) | ||
| Cost of Purchases | 202,443,757 | ||
| Proceeds of Sales | (4,137,630) | ||
| Amortization/Accretion | - | ||
| Transfers into Level 3 | 157,526,498 | ||
| Transfers out of Level 3 | - | ||
| Ending Balance | $ | 143,756,782 | |
| The change in unrealized gain (loss) for the period attributable to Level 3 securities held at October 31, 2022 | $ | (345,325,796) | |
| The information used in the above reconciliation represents fiscal year to date activity for any Investments in Securities identified as using Level 3 inputs at either the beginning or the end of the current fiscal period. Cost of purchases and proceeds of sales may include securities received and/or delivered through in-kind transactions. Transfers into Level 3 were attributable to a lack of observable market data resulting from decreases in market activity, decreases in liquidity, security restructurings or corporate actions. Transfers out of Level 3 were attributable to observable market data becoming available for those securities. Transfers in or out of Level 3 represent the beginning value of any Security or Instrument where a change in the pricing level occurred from the beginning to the end of the period. The cost of purchases and the proceeds of sales may include securities received or delivered through corporate actions or exchanges. Realized and unrealized gains (losses) disclosed in the reconciliation are included in Net Gain (Loss) on the Fund's Statement of Operations. | |||
Primary Risk Exposure / Derivative Type | Value | |
| Asset ($) | Liability ($) | |
| Equity Risk | ||
Futures Contracts (a) | 0 | (4,775,049) |
| Total Equity Risk | 0 | (4,775,049) |
| Total Value of Derivatives | 0 | (4,775,049) |
| Statement of Assets and Liabilities | ||||
| October 31, 2022 | ||||
| Assets | ||||
| Investment in securities, at value (including securities loaned of $408,859,432) - See accompanying schedule: | ||||
Unaffiliated issuers (cost $23,267,927,095) | $20,745,746,316 | |||
Fidelity Central Funds (cost $1,152,031,638) | 1,152,050,118 | |||
Other affiliated issuers (cost $398,835,188) | 391,089,433 | |||
| Total Investment in Securities (cost $24,818,793,921) | $ | 22,288,885,867 | ||
| Foreign currency held at value (cost $38,936,421) | 35,236,227 | |||
| Receivable for investments sold | 35,155,091 | |||
| Receivable for fund shares sold | 590,350,146 | |||
| Dividends receivable | 19,643,185 | |||
| Distributions receivable from Fidelity Central Funds | 2,434,387 | |||
| Receivable from investment adviser for expense reductions | 452,170 | |||
| Other receivables | 3,076,794 | |||
Total assets | 22,975,233,867 | |||
| Liabilities | ||||
| Payable to custodian bank | 71,846 | |||
| Payable for investments purchased | 139,108,368 | |||
| Payable for fund shares redeemed | 790,273 | |||
| Payable for daily variation margin on futures contracts | 900,919 | |||
| Deferred taxes | 73,167,360 | |||
| Other payables and accrued expenses | 1,882,108 | |||
| Collateral on securities loaned | 429,036,442 | |||
| Total Liabilities | 644,957,316 | |||
| Net Assets | $ | 22,330,276,551 | ||
| Net Assets consist of: | ||||
| Paid in capital | $ | 25,917,083,090 | ||
| Total accumulated earnings (loss) | (3,586,806,539) | |||
| Net Assets | $ | 22,330,276,551 | ||
Net Asset Value , offering price and redemption price per share ($22,330,276,551 ÷ 1,576,343,964 shares) | $ | 14.17 | ||
| Statement of Operations | ||||
Year ended October 31, 2022 | ||||
| Investment Income | ||||
| Dividends (including $13,751,570 earned from affiliated issuers) | $ | 714,721,284 | ||
| Non-Cash dividends | 47,772,983 | |||
| Interest | 171,305 | |||
| Income from Fidelity Central Funds (including $4,755,868 from security lending) | 11,757,207 | |||
| Income before foreign taxes withheld | 774,422,779 | |||
| Less foreign taxes withheld | (83,364,184) | |||
| Total Income | 691,058,595 | |||
| Expenses | ||||
| Custodian fees and expenses | 7,567,432 | |||
| Independent trustees' fees and expenses | 90,736 | |||
| Total expenses before reductions | 7,658,168 | |||
| Expense reductions | (4,184,633) | |||
| Total expenses after reductions | 3,473,535 | |||
| Net Investment income (loss) | 687,585,060 | |||
| Realized and Unrealized Gain (Loss) | ||||
| Net realized gain (loss) on: | ||||
| Investment Securities: | ||||
| Unaffiliated issuers(net of foreign taxes of $17,962,305) | (928,970,284) | |||
| Affiliated issuers | (10,478,316) | |||
| Foreign currency transactions | (11,133,371) | |||
| Futures contracts | (119,281,388) | |||
| Total net realized gain (loss) | (1,069,863,359) | |||
| Change in net unrealized appreciation (depreciation) on: | ||||
| Investment Securities: | ||||
| Unaffiliated issuers (net of decrease in deferred foreign taxes of $55,650,317) | (10,599,786,389) | |||
| Fidelity Central Funds | (1) | |||
| Other affiliated issuers | (198,748,818) | |||
| Assets and liabilities in foreign currencies | (1,636,707) | |||
| Futures contracts | (1,239,312) | |||
| Total change in net unrealized appreciation (depreciation) | (10,801,411,227) | |||
| Net gain (loss) | (11,871,274,586) | |||
| Net increase (decrease) in net assets resulting from operations | $ | (11,183,689,526) | ||
| Statement of Changes in Net Assets | ||||
Year ended October 31, 2022 | Year ended October 31, 2021 | |||
| Increase (Decrease) in Net Assets | ||||
| Operations | ||||
| Net investment income (loss) | $ | 687,585,060 | $ | 563,417,592 |
| Net realized gain (loss) | (1,069,863,359) | 2,456,466,938 | ||
| Change in net unrealized appreciation (depreciation) | (10,801,411,227) | 2,113,225,691 | ||
| Net increase (decrease) in net assets resulting from operations | (11,183,689,526) | 5,133,110,221 | ||
| Distributions to shareholders | (3,331,305,613) | (909,906,288) | ||
| Share transactions | ||||
| Proceeds from sales of shares | 7,263,042,676 | 5,298,433,914 | ||
| Reinvestment of distributions | 3,331,305,613 | 909,906,288 | ||
| Cost of shares redeemed | (2,937,614,184) | (8,072,789,703) | ||
Net increase (decrease) in net assets resulting from share transactions | 7,656,734,105 | (1,864,449,501) | ||
| Total increase (decrease) in net assets | (6,858,261,034) | 2,358,754,432 | ||
| Net Assets | ||||
| Beginning of period | 29,188,537,585 | 26,829,783,153 | ||
| End of period | $ | 22,330,276,551 | $ | 29,188,537,585 |
| Other Information | ||||
| Shares | ||||
| Sold | 398,835,244 | 208,064,485 | ||
| Issued in reinvestment of distributions | 156,693,585 | 37,646,102 | ||
| Redeemed | (161,208,420) | (311,910,589) | ||
| Net increase (decrease) | 394,320,409 | (66,200,002) | ||
| Fidelity® Series Emerging Markets Opportunities Fund |
| Years ended October 31, | 2022 | 2021 | 2020 | 2019 | 2018 | |||||
Selected Per-Share Data | ||||||||||
| Net asset value, beginning of period | $ | 24.69 | $ | 21.49 | $ | 19.39 | $ | 17.66 | $ | 21.35 |
| Income from Investment Operations | ||||||||||
Net investment income (loss) A,B | .48 | .47 | .35 | .57 C | .45 | |||||
| Net realized and unrealized gain (loss) | (8.30) | 3.48 | 2.26 | 2.71 | (3.52) | |||||
| Total from investment operations | (7.82) | 3.95 | 2.61 | 3.28 | (3.07) | |||||
| Distributions from net investment income | (.68) | (.33) | (.50) | (.41) | (.39) | |||||
| Distributions from net realized gain | (2.01) | (.41) | (.02) | (1.14) | (.23) | |||||
| Total distributions | (2.70) D | (.75) D | (.51) D | (1.55) | (.62) | |||||
| Net asset value, end of period | $ | 14.17 | $ | 24.69 | $ | 21.49 | $ | 19.39 | $ | 17.66 |
Total Return E | (35.33)% | 18.44% | 13.66% | 20.13% | (14.82)% | |||||
Ratios to Average Net Assets B,F,G | ||||||||||
| Expenses before reductions | .03% | .03% | .04% | .04% | .05% | |||||
| Expenses net of fee waivers, if any | .01% | .01% | .01% | .01% | .01% | |||||
| Expenses net of all reductions | .01% | .01% | .01% | .01% | .01% | |||||
| Net investment income (loss) | 2.64% | 1.82% | 1.78% | 3.12% C | 2.16% | |||||
| Supplemental Data | ||||||||||
| Net assets, end of period (000 omitted) | $ | 22,330,277 | $ | 29,188,538 | $ | 26,829,783 | $ | 18,675,048 | $ | 13,597,809 |
Portfolio turnover rate H | 37% | 69% | 42% I | 54% | 64% |
| Average Annual Total Returns | |||
Periods ended October 31, 2022 | Past 1 year | Past 5 years | Past 10 years |
| Fidelity® Series International Growth Fund | -27.31% | 4.31% | 6.87% |
| $10,000 Over 10 Years |
Let's say hypothetically that $10,000 was invested in Fidelity® Series International Growth Fund on October 31, 2012. The chart shows how the value of your investment would have changed, and also shows how the MSCI EAFE Growth Index performed over the same period. |
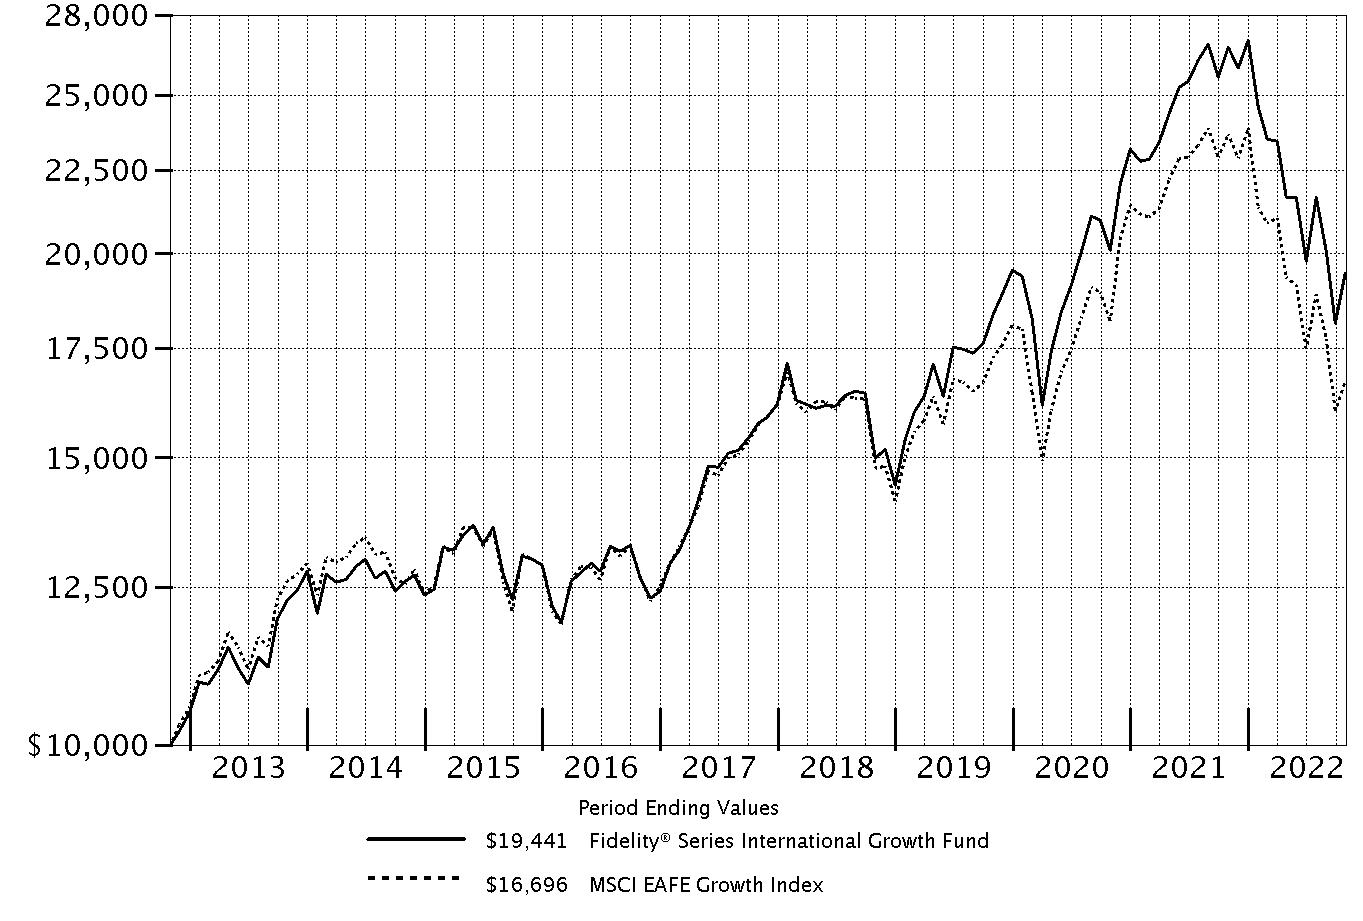 |
Top Holdings (% of Fund's net assets) | ||
| Nestle SA (Reg. S) (Switzerland, Food Products) | 5.6 | |
| ASML Holding NV (Netherlands) (Netherlands, Semiconductors & Semiconductor Equipment) | 4.8 | |
| LVMH Moet Hennessy Louis Vuitton SE (France, Textiles, Apparel & Luxury Goods) | 4.6 | |
| Roche Holding AG (participation certificate) (Switzerland, Pharmaceuticals) | 4.6 | |
| Linde PLC (Germany, Chemicals) | 3.5 | |
| Marsh & McLennan Companies, Inc. (United States of America, Insurance) | 3.1 | |
| Keyence Corp. (Japan, Electronic Equipment & Components) | 3.0 | |
| Atlas Copco AB (A Shares) (Sweden, Machinery) | 2.5 | |
| Amadeus IT Holding SA Class A (Spain, IT Services) | 2.4 | |
| ResMed, Inc. (United States of America, Health Care Equipment & Supplies) | 2.3 | |
| 36.4 | ||
| Market Sectors (% of Fund's net assets) | ||
| Industrials | 26.2 | |
| Information Technology | 21.0 | |
| Financials | 12.9 | |
| Consumer Discretionary | 9.7 | |
| Health Care | 9.5 | |
| Materials | 7.0 | |
| Consumer Staples | 6.2 | |
| Communication Services | 2.6 | |
| Energy | 1.0 | |
| Real Estate | 0.6 | |
Asset Allocation (% of Fund's net assets) |
 |
Foreign investments - 78.3% |
Geographic Diversification (% of Fund's net assets) |
 |
* Includes Short-Term investments and Net Other Assets (Liabilities). Percentages are based on country or territory of incorporation and are adjusted for the effect of futures contracts, if applicable. |
| Common Stocks - 96.5% | |||
| Shares | Value ($) | ||
| Bailiwick of Jersey - 1.6% | |||
| Experian PLC | 6,235,889 | 198,833,042 | |
| Belgium - 0.7% | |||
| Azelis Group NV | 1,757,983 | 40,236,487 | |
| UCB SA | 553,300 | 41,731,679 | |
TOTAL BELGIUM | 81,968,166 | ||
| Canada - 3.3% | |||
| CAE, Inc. (a) | 3,832,300 | 73,138,180 | |
| Canadian Pacific Railway Ltd. (b) | 3,230,840 | 240,851,551 | |
| Franco-Nevada Corp. | 791,428 | 97,787,702 | |
TOTAL CANADA | 411,777,433 | ||
| Denmark - 0.9% | |||
| Vestas Wind Systems A/S | 5,487,500 | 108,178,745 | |
| Finland - 0.5% | |||
| Kone OYJ (B Shares) | 1,488,400 | 60,943,734 | |
| France - 9.6% | |||
| Edenred SA | 2,664,490 | 136,820,150 | |
| Lectra | 1,072,788 | 34,349,921 | |
| Legrand SA | 2,494,744 | 190,111,231 | |
| LVMH Moet Hennessy Louis Vuitton SE | 897,396 | 566,252,295 | |
| Safran SA | 2,369,700 | 263,913,457 | |
TOTAL FRANCE | 1,191,447,054 | ||
| Germany - 5.6% | |||
| Deutsche Borse AG | 1,128,245 | 183,474,940 | |
| Linde PLC (b) | 1,460,601 | 436,856,796 | |
| Vonovia SE | 3,077,062 | 68,035,738 | |
TOTAL GERMANY | 688,367,474 | ||
| Hong Kong - 2.5% | |||
| AIA Group Ltd. | 36,019,301 | 272,838,788 | |
| Hong Kong Exchanges and Clearing Ltd. | 1,442,025 | 38,276,562 | |
TOTAL HONG KONG | 311,115,350 | ||
| India - 1.8% | |||
| Housing Development Finance Corp. Ltd. | 3,282,200 | 97,926,764 | |
| Kotak Mahindra Bank Ltd. | 2,808,100 | 64,518,794 | |
| Reliance Industries Ltd. | 925,000 | 28,489,732 | |
| Reliance Industries Ltd. sponsored GDR (c) | 514,400 | 31,404,120 | |
TOTAL INDIA | 222,339,410 | ||
| Ireland - 1.7% | |||
| CRH PLC sponsored ADR | 5,752,940 | 208,313,957 | |
| Italy - 1.3% | |||
| Interpump Group SpA | 1,742,620 | 67,473,611 | |
| Prada SpA | 19,606,100 | 89,292,908 | |
TOTAL ITALY | 156,766,519 | ||
| Japan - 12.8% | |||
| Azbil Corp. | 4,952,505 | 134,724,656 | |
| FANUC Corp. | 677,515 | 88,653,942 | |
| Hoya Corp. | 2,532,800 | 236,340,159 | |
| Keyence Corp. | 992,187 | 375,802,628 | |
| Lasertec Corp. | 1,062,000 | 149,222,614 | |
| Misumi Group, Inc. | 6,892,406 | 147,401,399 | |
| OSG Corp. | 2,224,346 | 28,317,610 | |
| Recruit Holdings Co. Ltd. | 9,031,705 | 277,916,123 | |
| SHO-BOND Holdings Co. Ltd. | 1,943,000 | 84,151,585 | |
| USS Co. Ltd. | 4,484,000 | 67,759,831 | |
TOTAL JAPAN | 1,590,290,547 | ||
| Kenya - 0.4% | |||
| Safaricom Ltd. | 269,131,800 | 55,667,146 | |
| Netherlands - 7.9% | |||
| Aalberts Industries NV | 598,297 | 20,800,774 | |
| Airbus Group NV | 2,505,200 | 271,072,101 | |
| ASML Holding NV (Netherlands) | 1,278,646 | 599,796,424 | |
| IMCD NV | 700,376 | 90,878,847 | |
TOTAL NETHERLANDS | 982,548,146 | ||
| New Zealand - 0.3% | |||
| Auckland International Airport Ltd. (a) | 7,792,862 | 34,886,929 | |
| Norway - 0.5% | |||
| Adevinta ASA Class B (a) | 4,256,302 | 29,150,089 | |
| Schibsted ASA (B Shares) | 2,529,554 | 37,543,724 | |
TOTAL NORWAY | 66,693,813 | ||
| South Africa - 0.3% | |||
| Clicks Group Ltd. | 1,864,622 | 31,595,160 | |
| Spain - 3.0% | |||
| Amadeus IT Holding SA Class A (a) | 5,716,764 | 298,159,564 | |
| Cellnex Telecom SA (c) | 2,350,642 | 76,937,124 | |
TOTAL SPAIN | 375,096,688 | ||
| Sweden - 6.0% | |||
| ASSA ABLOY AB (B Shares) | 12,869,544 | 259,862,878 | |
| Atlas Copco AB (A Shares) (b) | 28,739,144 | 306,740,176 | |
| Epiroc AB (A Shares) | 10,768,036 | 164,842,027 | |
| Lagercrantz Group AB (B Shares) | 1,353,600 | 11,615,911 | |
TOTAL SWEDEN | 743,060,992 | ||
| Switzerland - 10.6% | |||
| Nestle SA (Reg. S) | 6,352,950 | 691,574,530 | |
| Roche Holding AG (participation certificate) | 1,701,914 | 564,691,982 | |
| Schindler Holding AG: | |||
| (participation certificate) | 177,981 | 29,016,226 | |
| (Reg.) | 155,582 | 24,486,666 | |
TOTAL SWITZERLAND | 1,309,769,404 | ||
| Taiwan - 1.1% | |||
| Taiwan Semiconductor Manufacturing Co. Ltd. | 11,306,885 | 135,800,981 | |
| United Kingdom - 5.7% | |||
| BAE Systems PLC | 11,484,700 | 107,422,945 | |
| Compass Group PLC | 11,992,400 | 252,581,848 | |
| Dechra Pharmaceuticals PLC | 1,359,600 | 40,850,759 | |
| InterContinental Hotel Group PLC ADR (b) | 2,031,430 | 111,403,621 | |
| Rightmove PLC | 13,212,492 | 74,402,127 | |
| Spectris PLC | 3,306,086 | 114,500,866 | |
TOTAL UNITED KINGDOM | 701,162,166 | ||
| United States of America - 18.4% | |||
| Alphabet, Inc. Class A (a) | 710,440 | 67,143,684 | |
| Autoliv, Inc. | 1,212,734 | 97,443,177 | |
| Lam Research Corp. | 136,013 | 55,055,342 | |
| Marsh & McLennan Companies, Inc. | 2,392,231 | 386,321,384 | |
| MasterCard, Inc. Class A | 629,331 | 206,533,848 | |
| Moody's Corp. | 628,759 | 166,539,396 | |
| MSCI, Inc. | 504,627 | 236,599,415 | |
| NICE Ltd. sponsored ADR (a)(b) | 899,354 | 170,778,331 | |
| NOV, Inc. | 2,940,700 | 65,871,680 | |
| Otis Worldwide Corp. | 987,800 | 69,778,192 | |
| PriceSmart, Inc. | 621,532 | 39,759,402 | |
| ResMed, Inc. | 1,259,918 | 281,831,057 | |
| S&P Global, Inc. | 516,580 | 165,951,325 | |
| Sherwin-Williams Co. | 570,041 | 128,276,326 | |
| Visa, Inc. Class A | 709,870 | 147,056,669 | |
TOTAL UNITED STATES OF AMERICA | 2,284,939,228 | ||
| TOTAL COMMON STOCKS (Cost $9,323,355,672) | 11,951,562,084 | ||
| Convertible Preferred Stocks - 0.2% | |||
| Shares | Value ($) | ||
| China - 0.2% | |||
ByteDance Ltd. Series E1 (a)(d)(e) (Cost $18,859,141) | 172,113 | 27,025,183 | |
| Money Market Funds - 6.5% | |||
| Shares | Value ($) | ||
| Fidelity Cash Central Fund 3.10% (f) | 350,079,836 | 350,149,852 | |
| Fidelity Securities Lending Cash Central Fund 3.10% (f)(g) | 459,158,584 | 459,204,500 | |
| TOTAL MONEY MARKET FUNDS (Cost $809,354,352) | 809,354,352 | ||
| TOTAL INVESTMENT IN SECURITIES - 103.2% (Cost $10,151,569,165) | 12,787,941,619 |
NET OTHER ASSETS (LIABILITIES) - (3.2)% | (395,771,085) |
| NET ASSETS - 100.0% | 12,392,170,534 |
| (a) | Non-income producing |
| (b) | Security or a portion of the security is on loan at period end. |
| (c) | Security exempt from registration under Rule 144A of the Securities Act of 1933. These securities may be resold in transactions exempt from registration, normally to qualified institutional buyers. At the end of the period, the value of these securities amounted to $108,341,244 or 0.9% of net assets. |
| (d) | Restricted securities (including private placements) - Investment in securities not registered under the Securities Act of 1933 (excluding 144A issues). At the end of the period, the value of restricted securities (excluding 144A issues) amounted to $27,025,183 or 0.2% of net assets. |
| (e) | Level 3 security |
| (f) | Affiliated fund that is generally available only to investment companies and other accounts managed by Fidelity Investments. The rate quoted is the annualized seven-day yield of the fund at period end. A complete unaudited listing of the fund's holdings as of its most recent quarter end is available upon request. In addition, each Fidelity Central Fund's financial statements, which are not covered by the Fund's Report of Independent Registered Public Accounting Firm, are available on the SEC's website or upon request. |
| (g) | Investment made with cash collateral received from securities on loan. |
| Additional information on each restricted holding is as follows: | ||
| Security | Acquisition Date | Acquisition Cost ($) |
| ByteDance Ltd. Series E1 | 11/18/20 | 18,859,141 |
| Affiliate | Value, beginning of period ($) | Purchases ($) | Sales Proceeds ($) | Dividend Income ($) | Realized Gain (loss) ($) | Change in Unrealized appreciation (depreciation) ($) | Value, end of period ($) | % ownership, end of period |
| Fidelity Cash Central Fund 3.10% | 289,691,163 | 4,567,409,335 | 4,506,950,646 | 3,100,901 | - | - | 350,149,852 | 0.7% |
| Fidelity Securities Lending Cash Central Fund 3.10% | 40,631,762 | 2,881,234,696 | 2,462,661,958 | 550,966 | - | - | 459,204,500 | 1.3% |
| Total | 330,322,925 | 7,448,644,031 | 6,969,612,604 | 3,651,867 | - | - | 809,354,352 | |
| Valuation Inputs at Reporting Date: | ||||
| Description | Total ($) | Level 1 ($) | Level 2 ($) | Level 3 ($) |
Investments in Securities: | ||||
| Equities: | ||||
Communication Services | 340,843,894 | 189,504,643 | 151,339,251 | - |
Consumer Discretionary | 1,184,733,680 | 365,899,537 | 818,834,143 | - |
Consumer Staples | 762,929,092 | 71,354,562 | 691,574,530 | - |
Energy | 125,765,532 | 125,765,532 | - | - |
Financials | 1,612,447,368 | 1,117,857,078 | 494,590,290 | - |
Health Care | 1,165,445,636 | 600,753,654 | 564,691,982 | - |
Industrials | 3,249,908,458 | 951,418,057 | 2,298,490,401 | - |
Information Technology | 2,597,243,088 | 1,387,238,322 | 1,182,979,583 | 27,025,183 |
Materials | 871,234,781 | 871,234,781 | - | - |
Real Estate | 68,035,738 | - | 68,035,738 | - |
| Money Market Funds | 809,354,352 | 809,354,352 | - | - |
| Total Investments in Securities: | 12,787,941,619 | 6,490,380,518 | 6,270,535,918 | 27,025,183 |
| Statement of Assets and Liabilities | ||||
| October 31, 2022 | ||||
| Assets | ||||
| Investment in securities, at value (including securities loaned of $382,411,814) - See accompanying schedule: | ||||
Unaffiliated issuers (cost $9,342,214,813) | $11,978,587,267 | |||
Fidelity Central Funds (cost $809,354,352) | 809,354,352 | |||
| Total Investment in Securities (cost $10,151,569,165) | $ | 12,787,941,619 | ||
| Cash | 80,680 | |||
| Foreign currency held at value (cost $6,501,675) | 6,465,196 | |||
| Receivable for investments sold | 96,601,596 | |||
| Receivable for fund shares sold | 47,665,692 | |||
| Dividends receivable | 10,447,100 | |||
| Reclaims receivable | 38,447,170 | |||
| Interest receivable | 1,095 | |||
| Distributions receivable from Fidelity Central Funds | 842,307 | |||
| Other receivables | 24,381 | |||
Total assets | 12,988,516,836 | |||
| Liabilities | ||||
| Payable for investments purchased | 34,284,067 | |||
| Payable for fund shares redeemed | 99,915,041 | |||
| Other payables and accrued expenses | 2,942,694 | |||
| Collateral on securities loaned | 459,204,500 | |||
| Total Liabilities | 596,346,302 | |||
| Net Assets | $ | 12,392,170,534 | ||
| Net Assets consist of: | ||||
| Paid in capital | $ | 9,407,696,304 | ||
| Total accumulated earnings (loss) | 2,984,474,230 | |||
| Net Assets | $ | 12,392,170,534 | ||
Net Asset Value , offering price and redemption price per share ($12,392,170,534 ÷ 900,986,800 shares) | $ | 13.75 | ||
| Statement of Operations | ||||
Year ended October 31, 2022 | ||||
| Investment Income | ||||
| Dividends | $ | 198,003,451 | ||
| Interest | 9,297 | |||
| Income from Fidelity Central Funds (including $550,966 from security lending) | 3,651,867 | |||
| Income before foreign taxes withheld | 201,664,615 | |||
| Less foreign taxes withheld | (17,769,072) | |||
| Total Income | 183,895,543 | |||
| Expenses | ||||
| Custodian fees and expenses | 911,774 | |||
| Independent trustees' fees and expenses | 47,909 | |||
| Interest | 220 | |||
| Total expenses before reductions | 959,903 | |||
| Expense reductions | (167) | |||
| Total expenses after reductions | 959,736 | |||
| Net Investment income (loss) | 182,935,807 | |||
| Realized and Unrealized Gain (Loss) | ||||
| Net realized gain (loss) on: | ||||
| Investment Securities: | ||||
| Unaffiliated issuers(net of foreign taxes of $726,484) | 297,823,755 | |||
| Redemptions in-kind with affiliated entities | 20,221,102 | |||
| Foreign currency transactions | (1,577,980) | |||
| Total net realized gain (loss) | 316,466,877 | |||
| Change in net unrealized appreciation (depreciation) on: | ||||
| Investment Securities: | ||||
| Unaffiliated issuers (net of decrease in deferred foreign taxes of $1,623,563) | (4,978,985,142) | |||
| Assets and liabilities in foreign currencies | (4,131,896) | |||
| Total change in net unrealized appreciation (depreciation) | (4,983,117,038) | |||
| Net gain (loss) | (4,666,650,161) | |||
| Net increase (decrease) in net assets resulting from operations | $ | (4,483,714,354) | ||
| Statement of Changes in Net Assets | ||||
Year ended October 31, 2022 | Year ended October 31, 2021 | |||
| Increase (Decrease) in Net Assets | ||||
| Operations | ||||
| Net investment income (loss) | $ | 182,935,807 | $ | 150,726,737 |
| Net realized gain (loss) | 316,466,877 | 1,036,472,737 | ||
| Change in net unrealized appreciation (depreciation) | (4,983,117,038) | 2,647,507,454 | ||
| Net increase (decrease) in net assets resulting from operations | (4,483,714,354) | 3,834,706,928 | ||
| Distributions to shareholders | (1,228,456,975) | (1,893,653,837) | ||
| Share transactions | ||||
| Proceeds from sales of shares | 3,357,019,808 | 2,688,569,606 | ||
| Reinvestment of distributions | 1,228,456,975 | 1,893,653,837 | ||
| Cost of shares redeemed | (1,948,259,376) | (2,614,147,031) | ||
Net increase (decrease) in net assets resulting from share transactions | 2,637,217,407 | 1,968,076,412 | ||
| Total increase (decrease) in net assets | (3,074,953,922) | 3,909,129,503 | ||
| Net Assets | ||||
| Beginning of period | 15,467,124,456 | 11,557,994,953 | ||
| End of period | $ | 12,392,170,534 | $ | 15,467,124,456 |
| Other Information | ||||
| Shares | ||||
| Sold | 205,948,049 | 140,533,087 | ||
| Issued in reinvestment of distributions | 65,032,132 | 110,675,268 | ||
| Redeemed | (124,061,175) | (138,785,466) | ||
| Net increase (decrease) | 146,919,006 | 112,422,889 | ||
| Fidelity® Series International Growth Fund |
| Years ended October 31, | 2022 | 2021 | 2020 | 2019 | 2018 | |||||
Selected Per-Share Data | ||||||||||
| Net asset value, beginning of period | $ | 20.51 | $ | 18.01 | $ | 17.07 | $ | 14.96 | $ | 16.22 |
| Income from Investment Operations | ||||||||||
Net investment income (loss) A,B | .21 | .20 | .20 | .37 C | .30 | |||||
| Net realized and unrealized gain (loss) | (5.38) | 5.19 | 1.38 | 2.74 | (1.05) | |||||
| Total from investment operations | (5.17) | 5.39 | 1.58 | 3.11 | (.75) | |||||
| Distributions from net investment income | (.28) | (.24) | (.37) | (.28) | (.24) | |||||
| Distributions from net realized gain | (1.31) | (2.65) | (.27) | (.72) | (.27) | |||||
| Total distributions | (1.59) | (2.89) | (.64) | (1.00) | (.51) | |||||
| Net asset value, end of period | $ | 13.75 | $ | 20.51 | $ | 18.01 | $ | 17.07 | $ | 14.96 |
Total Return D | (27.31)% | 33.10% | 9.39% | 22.58% | (4.82)% | |||||
Ratios to Average Net Assets B,E,F | ||||||||||
| Expenses before reductions | .01% | .01% | .01% | .01% | .01% | |||||
| Expenses net of fee waivers, if any | .01% | .01% | .01% | .01% | .01% | |||||
| Expenses net of all reductions | .01% | .01% | .01% | .01% | -% G | |||||
| Net investment income (loss) | 1.32% | 1.06% | 1.18% | 2.38% C | 1.84% | |||||
| Supplemental Data | ||||||||||
| Net assets, end of period (000 omitted) | $ | 12,392,171 | $ | 15,467,124 | $ | 11,557,995 | $ | 16,501,791 | $ | 14,113,600 |
Portfolio turnover rate H | 22% I | 24% | 16% I | 24% | 33% |
| Average Annual Total Returns | |||
Periods ended October 31, 2022 | Past 1 year | Past 5 years | Past 10 years |
| Fidelity® Series International Small Cap Fund | -31.82% | 2.37% | 7.00% |
| $10,000 Over 10 Years |
Let's say hypothetically that $10,000 was invested in Fidelity® Series International Small Cap Fund on October 31, 2012. The chart shows how the value of your investment would have changed, and also shows how the MSCI EAFE Small Cap Index performed over the same period. |
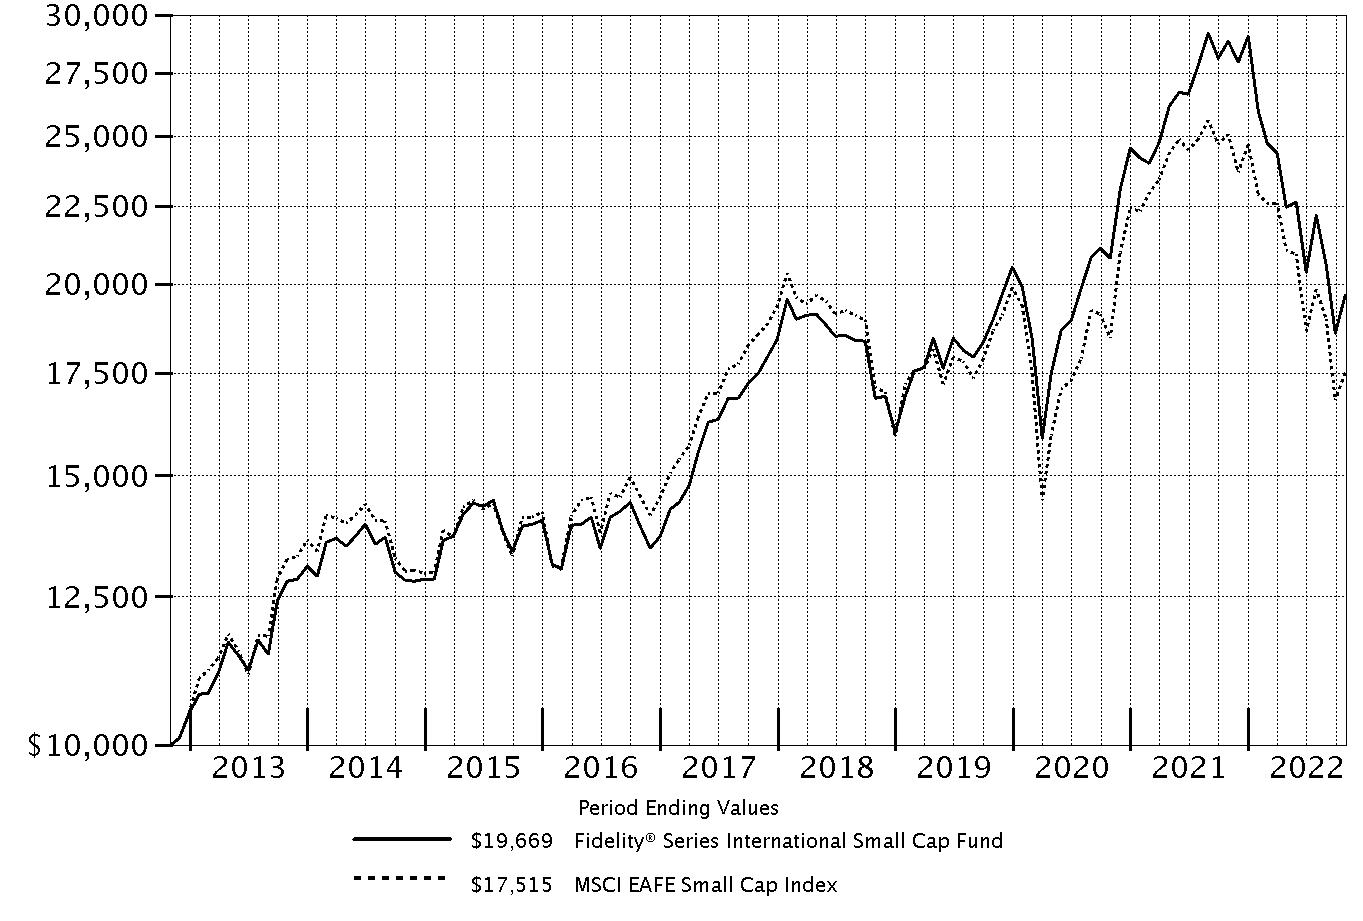 |
Top Holdings (% of Fund's net assets) | ||
| Spectris PLC (United Kingdom, Electronic Equipment & Components) | 3.0 | |
| Azbil Corp. (Japan, Electronic Equipment & Components) | 2.9 | |
| Lagercrantz Group AB (B Shares) (Sweden, Electronic Equipment & Components) | 2.7 | |
| AddTech AB (B Shares) (Sweden, Trading Companies & Distributors) | 2.6 | |
| Aalberts Industries NV (Netherlands, Machinery) | 2.4 | |
| OBIC Co. Ltd. (Japan, IT Services) | 2.2 | |
| CTS Eventim AG (Germany, Entertainment) | 2.0 | |
| Interpump Group SpA (Italy, Machinery) | 1.9 | |
| SHO-BOND Holdings Co. Ltd. (Japan, Construction & Engineering) | 1.7 | |
| Morningstar, Inc. (United States of America, Capital Markets) | 1.5 | |
| 22.9 | ||
| Market Sectors (% of Fund's net assets) | ||
| Industrials | 28.7 | |
| Information Technology | 19.1 | |
| Health Care | 10.9 | |
| Consumer Discretionary | 9.1 | |
| Communication Services | 6.4 | |
| Financials | 6.0 | |
| Consumer Staples | 5.9 | |
| Materials | 3.7 | |
| Real Estate | 3.6 | |
| Energy | 2.3 | |
Asset Allocation (% of Fund's net assets) |
 |
Foreign investments - 90.9% |
Geographic Diversification (% of Fund's net assets) |
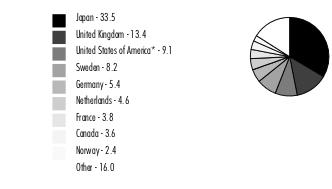 |
* Includes Short-Term investments and Net Other Assets (Liabilities). Percentages are based on country or territory of incorporation and are adjusted for the effect of futures contracts, if applicable. |
| Common Stocks - 95.9% | |||
| Shares | Value ($) | ||
| Australia - 1.1% | |||
| Aub Group Ltd. | 465,000 | 6,151,002 | |
| GUD Holdings Ltd. | 100,000 | 514,279 | |
| Imdex Ltd. | 7,612,984 | 9,934,076 | |
| Reliance Worldwide Corp. Ltd. | 1,000,000 | 2,053,277 | |
| Steadfast Group Ltd. | 5,266,595 | 17,046,014 | |
TOTAL AUSTRALIA | 35,698,648 | ||
| Austria - 0.2% | |||
| Mayr-Melnhof Karton AG | 24,700 | 3,515,008 | |
| Wienerberger AG | 150,000 | 3,430,216 | |
TOTAL AUSTRIA | 6,945,224 | ||
| Bailiwick of Jersey - 0.4% | |||
| Integrated Diagnostics Holdings PLC (a) | 15,716,953 | 12,102,054 | |
| Belgium - 1.4% | |||
| Azelis Group NV | 665,687 | 15,236,158 | |
| Econocom Group SA | 550,000 | 1,497,446 | |
| Fagron NV | 497,500 | 6,194,845 | |
| KBC Ancora | 621,679 | 22,105,186 | |
TOTAL BELGIUM | 45,033,635 | ||
| Bermuda - 0.3% | |||
| Kerry Properties Ltd. | 1,300,000 | 2,056,907 | |
| Lancashire Holdings Ltd. | 1,463,768 | 8,312,671 | |
TOTAL BERMUDA | 10,369,578 | ||
| Brazil - 0.1% | |||
| LOG Commercial Properties e Participacoes SA | 927,500 | 4,086,710 | |
| Canada - 3.6% | |||
| CAE, Inc. (b) | 1,044,900 | 19,941,572 | |
| Cogeco Communications, Inc. (c) | 57,300 | 2,922,306 | |
| ECN Capital Corp. | 983,550 | 2,967,219 | |
| McCoy Global, Inc. (b) | 1,107,650 | 813,044 | |
| MTY Food Group, Inc. (c) | 81,100 | 3,287,218 | |
| North West Co., Inc. | 60,000 | 1,561,273 | |
| Onex Corp. (sub. vtg.) | 30,000 | 1,509,964 | |
| Osisko Gold Royalties Ltd. | 827,300 | 8,872,062 | |
| Parkland Corp. | 182,500 | 3,689,250 | |
| Pason Systems, Inc. | 1,227,500 | 13,037,711 | |
| Real Matters, Inc. (b) | 710,000 | 2,407,751 | |
| Richelieu Hardware Ltd. | 1,239,205 | 33,264,379 | |
| Summit Industrial Income REIT | 1,647,500 | 21,054,043 | |
| Total Energy Services, Inc. | 329,000 | 1,893,317 | |
TOTAL CANADA | 117,221,109 | ||
| Cayman Islands - 0.4% | |||
| ASMPT Ltd. | 250,000 | 1,375,858 | |
| Chlitina Holding Ltd. | 2,026,000 | 9,265,052 | |
| Kindstar Globalgene Technology, Inc. (a)(b) | 4,000,000 | 912,143 | |
| WH Group Ltd. (a) | 3,000,000 | 1,517,265 | |
TOTAL CAYMAN ISLANDS | 13,070,318 | ||
| Denmark - 0.8% | |||
| Cadeler A/S (b) | 1,000,000 | 3,206,956 | |
| SimCorp A/S | 47,632 | 2,844,909 | |
| Spar Nord Bank A/S | 1,723,897 | 20,867,155 | |
TOTAL DENMARK | 26,919,020 | ||
| Finland - 0.6% | |||
| Huhtamaki Oyj | 115,489 | 4,148,698 | |
| Musti Group OYJ | 718,378 | 13,503,003 | |
| Nanoform Finland PLC (b) | 425,000 | 1,113,017 | |
| Olvi Oyj (A Shares) | 74,900 | 2,313,123 | |
TOTAL FINLAND | 21,077,841 | ||
| France - 3.8% | |||
| Altarea SCA | 21,100 | 2,810,860 | |
| ARGAN SA | 73,600 | 5,520,602 | |
| Elis SA | 275,000 | 3,155,235 | |
| Exclusive Networks SA | 260,000 | 4,177,926 | |
| Groupe Gorge SA (b) | 114,000 | 2,235,184 | |
| Laurent-Perrier Group SA | 149,831 | 14,599,750 | |
| Lectra | 1,005,400 | 32,192,204 | |
| LISI | 861,095 | 17,002,523 | |
| Maisons du Monde SA (a) | 400,947 | 3,930,660 | |
| Somfy SA | 23,000 | 2,450,267 | |
| Stef SA | 51,700 | 4,118,058 | |
| Thermador Groupe SA | 33,900 | 2,824,191 | |
| Vallourec SA (b) | 230,000 | 2,449,131 | |
| Vetoquinol SA | 272,141 | 22,618,135 | |
| Vicat SA | 98,900 | 2,267,520 | |
TOTAL FRANCE | 122,352,246 | ||
| Germany - 5.4% | |||
| Brenntag SE | 28,000 | 1,698,938 | |
| CTS Eventim AG (b) | 1,391,838 | 66,490,892 | |
| DIC Asset AG | 363,800 | 2,509,487 | |
| Nexus AG | 618,016 | 33,163,959 | |
| NORMA Group AG | 98,900 | 1,568,694 | |
| Novem Group SA | 255,000 | 1,592,664 | |
| Rheinmetall AG | 142,600 | 23,182,072 | |
| Scout24 AG (a) | 313,500 | 16,073,274 | |
| Shop Apotheke Europe NV (a)(b) | 31,000 | 1,285,170 | |
| Stabilus Se | 391,000 | 21,464,840 | |
| Talanx AG | 80,000 | 3,005,861 | |
| Wacker Chemie AG | 31,800 | 3,705,167 | |
TOTAL GERMANY | 175,741,018 | ||
| Greece - 0.1% | |||
| Mytilineos SA | 234,500 | 3,935,024 | |
| Hong Kong - 0.0% | |||
| Chervon Holdings Ltd. | 420,000 | 1,415,222 | |
| Hungary - 0.2% | |||
| Richter Gedeon PLC | 352,100 | 6,952,456 | |
| India - 0.8% | |||
| Embassy Office Parks (REIT) | 4,232,200 | 17,606,729 | |
| Indian Energy Exchange Ltd. (a) | 5,595,208 | 9,456,023 | |
TOTAL INDIA | 27,062,752 | ||
| Indonesia - 0.1% | |||
| PT Selamat Sempurna Tbk | 40,916,800 | 3,934,938 | |
| Ireland - 1.0% | |||
| Adient PLC (b) | 47,100 | 1,647,558 | |
| Bank of Ireland Group PLC | 510,000 | 3,677,239 | |
| Cairn Homes PLC | 10,811,434 | 10,427,183 | |
| Irish Residential Properties REIT PLC | 10,887,500 | 11,770,972 | |
| Mincon Group PLC | 3,865,000 | 3,781,390 | |
TOTAL IRELAND | 31,304,342 | ||
| Israel - 1.6% | |||
| Ituran Location & Control Ltd. | 919,635 | 22,052,847 | |
| Maytronics Ltd. | 945,622 | 10,206,739 | |
| Strauss Group Ltd. | 314,764 | 7,881,682 | |
| Tel Aviv Stock Exchange Ltd. | 1,766,857 | 10,415,483 | |
TOTAL ISRAEL | 50,556,751 | ||
| Italy - 2.2% | |||
| BFF Bank SpA (a) | 525,000 | 3,704,455 | |
| Intercos SpA (b) | 269,000 | 2,677,001 | |
| Interpump Group SpA | 1,615,037 | 62,533,643 | |
| MARR SpA | 131,400 | 1,384,266 | |
TOTAL ITALY | 70,299,365 | ||
| Japan - 33.5% | |||
| Ai Holdings Corp. | 454,692 | 6,739,575 | |
| Aoki Super Co. Ltd. | 307,387 | 5,292,113 | |
| Arcland Sakamoto Co. Ltd. | 193,700 | 1,921,433 | |
| Artnature, Inc. | 1,119,300 | 5,803,694 | |
| ASKUL Corp. | 355,000 | 3,712,465 | |
| Aucnet, Inc. | 696,460 | 10,496,431 | |
| Azbil Corp. | 3,400,825 | 92,513,784 | |
| Bank of Kyoto Ltd. | 156,153 | 5,628,838 | |
| BayCurrent Consulting, Inc. | 119,000 | 3,353,240 | |
| Broadleaf Co. Ltd. (d) | 5,982,673 | 21,927,817 | |
| Central Automotive Products Ltd. | 183,879 | 2,774,972 | |
| CKD Corp. | 149,900 | 1,841,806 | |
| Curves Holdings Co. Ltd. (d) | 5,022,459 | 29,217,035 | |
| Daiichikosho Co. Ltd. | 1,060,314 | 30,448,507 | |
| Daikokutenbussan Co. Ltd. | 192,500 | 5,877,467 | |
| Digital Hearts Holdings Co. Ltd. (d) | 1,335,450 | 18,366,423 | |
| Dip Corp. | 121,200 | 3,398,931 | |
| Dowa Holdings Co. Ltd. | 115,000 | 3,662,026 | |
| Food & Life Companies Ltd. | 164,300 | 2,772,310 | |
| Fujitec Co. Ltd. | 475,300 | 9,455,176 | |
| Funai Soken Holdings, Inc. | 1,232,157 | 21,984,011 | |
| GMO Internet, Inc. | 251,181 | 4,343,027 | |
| Goldcrest Co. Ltd. | 1,753,600 | 20,638,219 | |
| i-mobile Co. Ltd. | 220,000 | 1,757,692 | |
| Inaba Denki Sangyo Co. Ltd. | 386,300 | 7,217,064 | |
| Invincible Investment Corp. | 5,000 | 1,570,329 | |
| Iwatani Corp. | 55,000 | 2,026,968 | |
| Iwatsuka Confectionary Co. Ltd. | 105,800 | 2,860,325 | |
| JEOL Ltd. | 1,191,900 | 43,765,924 | |
| JINS Holdings, Inc. | 88,300 | 2,660,372 | |
| JTOWER, Inc. (b) | 125,000 | 5,085,914 | |
| Kamigumi Co. Ltd. | 370,800 | 7,052,170 | |
| Kobayashi Pharmaceutical Co. Ltd. | 381,400 | 20,263,358 | |
| Kobe Bussan Co. Ltd. | 56,900 | 1,237,913 | |
| Koshidaka Holdings Co. Ltd. | 3,561,659 | 26,779,211 | |
| Kusuri No Aoki Holdings Co. Ltd. | 232,658 | 11,234,301 | |
| Kyoritsu Maintenance Co. Ltd. | 86,500 | 3,565,991 | |
| Kyushu Railway Co. | 115,000 | 2,405,259 | |
| Lasertec Corp. | 336,360 | 47,262,258 | |
| Maruwa Ceramic Co. Ltd. | 58,300 | 6,865,281 | |
| MCJ Co. Ltd. | 530,000 | 3,350,483 | |
| Mebuki Financial Group, Inc. | 1,700,000 | 3,304,079 | |
| Medikit Co. Ltd. | 691,500 | 11,254,111 | |
| Meitec Corp. | 201,000 | 3,391,567 | |
| Miroku Jyoho Service Co., Ltd. | 815,891 | 8,197,593 | |
| Misumi Group, Inc. | 1,471,300 | 31,465,308 | |
| Mitsuboshi Belting Ltd. | 317,952 | 6,767,666 | |
| Miura Co. Ltd. | 76,600 | 1,563,476 | |
| Monex Group, Inc. | 380,000 | 1,323,784 | |
| Nagaileben Co. Ltd. | 1,513,000 | 20,777,740 | |
| Net One Systems Co. Ltd. | 399,400 | 8,219,268 | |
| Nihon Parkerizing Co. Ltd. | 5,732,968 | 37,321,450 | |
| Nitto Kohki Co. Ltd. | 270,000 | 2,867,144 | |
| NOF Corp. | 194,800 | 6,707,529 | |
| NS Tool Co. Ltd. (d) | 1,356,400 | 10,526,821 | |
| NSD Co. Ltd. | 1,280,480 | 21,907,536 | |
| OBIC Co. Ltd. | 485,000 | 72,964,457 | |
| Open House Group Co. Ltd. | 75,700 | 2,698,208 | |
| OSG Corp. | 2,120,875 | 27,000,346 | |
| PALTAC Corp. | 122,000 | 3,470,594 | |
| Paramount Bed Holdings Co. Ltd. | 641,612 | 11,425,997 | |
| ProNexus, Inc. | 1,245,977 | 8,035,858 | |
| Qol Holdings Co. Ltd. | 240,000 | 1,980,430 | |
| Raccoon Holdings, Inc. | 171,500 | 1,423,256 | |
| Relo Group, Inc. | 273,600 | 3,867,697 | |
| Renesas Electronics Corp. (b) | 281,200 | 2,352,450 | |
| Roland Corp. | 63,700 | 1,812,105 | |
| San-Ai Obbli Co. Ltd. | 1,956,110 | 16,180,876 | |
| Sekisui Jushi Corp. | 175,000 | 2,005,447 | |
| SHO-BOND Holdings Co. Ltd. | 1,257,800 | 54,475,483 | |
| Shoei Co. Ltd. | 1,186,700 | 43,814,405 | |
| SK Kaken Co. Ltd. | 93,904 | 23,397,849 | |
| Software Service, Inc. | 181,500 | 10,045,698 | |
| Sumco Corp. | 415,500 | 5,278,453 | |
| Techno Medica Co. Ltd. | 283,000 | 3,109,869 | |
| The Monogatari Corp. | 231,996 | 10,640,659 | |
| TIS, Inc. | 887,836 | 23,972,975 | |
| Tocalo Co. Ltd. | 1,435,449 | 11,487,840 | |
| Tsuruha Holdings, Inc. | 124,635 | 7,250,363 | |
| USS Co. Ltd. | 1,593,300 | 24,077,105 | |
| Welcia Holdings Co. Ltd. | 544,670 | 11,391,935 | |
| YAKUODO Holdings Co. Ltd. | 677,500 | 12,693,870 | |
| Yamato Holdings Co. Ltd. | 215,000 | 3,186,792 | |
| Zuken, Inc. | 96,000 | 2,166,045 | |
TOTAL JAPAN | 1,086,932,247 | ||
| Korea (South) - 0.5% | |||
| BGF Retail Co. Ltd. | 104,578 | 13,664,628 | |
| Hansol Chemical Co. Ltd. | 18,660 | 2,425,125 | |
| Soulbrain Co. Ltd. | 13,000 | 1,864,403 | |
TOTAL KOREA (SOUTH) | 17,954,156 | ||
| Luxembourg - 0.2% | |||
| B&M European Value Retail SA | 1,471,031 | 5,442,192 | |
| Mexico - 0.1% | |||
| Bolsa Mexicana de Valores S.A.B. de CV | 1,173,400 | 2,136,793 | |
| Netherlands - 4.6% | |||
| Aalberts Industries NV | 2,235,235 | 77,711,600 | |
| AerCap Holdings NV (b) | 333,400 | 17,806,894 | |
| Arcadis NV | 107,100 | 3,638,833 | |
| IMCD NV | 308,353 | 40,011,030 | |
| RHI Magnesita NV | 119,000 | 2,527,410 | |
| Van Lanschot Kempen NV (Bearer) | 305,761 | 6,602,378 | |
TOTAL NETHERLANDS | 148,298,145 | ||
| New Zealand - 0.1% | |||
| EBOS Group Ltd. | 121,630 | 2,651,838 | |
| Norway - 2.4% | |||
| Europris ASA (a) | 1,254,800 | 7,471,239 | |
| Kongsberg Gruppen ASA | 1,266,808 | 45,402,640 | |
| Medistim ASA | 409,945 | 9,503,205 | |
| Selvaag Bolig ASA | 840,200 | 2,719,538 | |
| TGS ASA | 390,000 | 5,326,972 | |
| Volue A/S (b) | 3,374,402 | 8,763,711 | |
TOTAL NORWAY | 79,187,305 | ||
| Singapore - 0.2% | |||
| Boustead Singapore Ltd. | 8,000,000 | 4,436,281 | |
| Keppel DC (REIT) | 1,400,000 | 1,740,605 | |
TOTAL SINGAPORE | 6,176,886 | ||
| South Africa - 0.6% | |||
| Clicks Group Ltd. | 1,164,331 | 19,729,052 | |
| Spain - 1.1% | |||
| Applus Services SA | 425,000 | 2,515,837 | |
| Cie Automotive SA | 264,600 | 6,730,777 | |
| Compania de Distribucion Integral Logista Holdings SA | 488,400 | 10,106,928 | |
| eDreams ODIGEO SA (b) | 100,000 | 415,065 | |
| Fluidra SA (c) | 1,086,218 | 14,738,536 | |
TOTAL SPAIN | 34,507,143 | ||
| Sweden - 8.2% | |||
| Addlife AB | 2,119,601 | 19,811,508 | |
| AddTech AB (B Shares) | 6,926,965 | 83,817,205 | |
| Arjo AB | 370,000 | 1,476,488 | |
| Betsson AB (B Shares) | 570,000 | 4,150,636 | |
| BHG Group AB (b) | 896,000 | 1,502,909 | |
| Dometic Group AB (a) | 487,400 | 2,792,534 | |
| Hemnet Group AB | 2,032,500 | 25,256,222 | |
| HEXPOL AB (B Shares) | 220,700 | 2,178,776 | |
| Instalco AB | 551,500 | 2,208,507 | |
| INVISIO AB | 1,219,734 | 18,117,268 | |
| JM AB (B Shares) | 125,000 | 1,883,853 | |
| John Mattson Fastighetsforetag (b) | 1,106,779 | 6,996,810 | |
| Lagercrantz Group AB (B Shares) | 10,294,023 | 88,338,104 | |
| MIPS AB | 36,600 | 1,184,730 | |
| Stillfront Group AB (b) | 1,250,000 | 2,435,197 | |
| Teqnion AB | 431,829 | 4,888,837 | |
TOTAL SWEDEN | 267,039,584 | ||
| Switzerland - 1.4% | |||
| Kardex AG | 14,990 | 2,290,378 | |
| PolyPeptide Group AG (a) | 41,950 | 1,219,937 | |
| Tecan Group AG | 104,505 | 38,343,373 | |
| VZ Holding AG | 41,172 | 2,837,038 | |
TOTAL SWITZERLAND | 44,690,726 | ||
| Taiwan - 0.5% | |||
| Addcn Technology Co. Ltd. | 1,948,764 | 10,875,473 | |
| eMemory Technology, Inc. | 63,000 | 2,099,740 | |
| International Games Systems Co. Ltd. | 248,000 | 2,702,673 | |
TOTAL TAIWAN | 15,677,886 | ||
| United Kingdom - 13.4% | |||
| Alliance Pharma PLC | 26,930,070 | 19,209,477 | |
| Avon Protection PLC | 1,313,872 | 15,670,183 | |
| Baltic Classifieds Group PLC | 1,000,000 | 1,596,346 | |
| Beazley PLC | 750,000 | 5,371,324 | |
| Bodycote PLC | 4,999,161 | 28,412,935 | |
| Clarkson PLC | 1,043,401 | 33,085,223 | |
| Close Brothers Group PLC | 1,429 | 16,093 | |
| Computacenter PLC | 69,400 | 1,440,541 | |
| Dechra Pharmaceuticals PLC | 1,606,913 | 48,281,565 | |
| Discoverie Group PLC | 380,100 | 3,247,445 | |
| Domino's Pizza UK & IRL PLC | 848,400 | 2,200,802 | |
| DP Poland PLC (b) | 32,210,430 | 2,788,889 | |
| Energean PLC | 230,000 | 3,774,463 | |
| FDM Group Holdings PLC | 187,700 | 1,358,255 | |
| Grainger Trust PLC | 2,028,839 | 5,281,547 | |
| H&T Group PLC | 580,000 | 2,840,165 | |
| Harbour Energy PLC | 875,800 | 3,795,505 | |
| Helios Towers PLC (b) | 5,389,616 | 7,756,919 | |
| Hill & Smith Holdings PLC | 225,514 | 2,555,160 | |
| Howden Joinery Group PLC | 3,693,282 | 21,770,243 | |
| J.D. Wetherspoon PLC (b) | 333,500 | 1,724,885 | |
| Jet2 PLC (b) | 260,000 | 2,533,832 | |
| John Wood Group PLC (b) | 1,450,000 | 2,326,341 | |
| Londonmetric Properity PLC | 808,062 | 1,731,975 | |
| LSL Property Services PLC | 694,900 | 1,824,927 | |
| Mears Group PLC | 1,248,458 | 2,720,290 | |
| Mitie Group PLC | 2,200,000 | 1,801,393 | |
| On The Beach Group PLC (a)(b) | 1,651,900 | 1,958,808 | |
| Petershill Partners PLC (a) | 1,150,000 | 2,613,901 | |
| Pets At Home Group PLC | 2,401,500 | 7,926,128 | |
| Rightmove PLC | 5,937,770 | 33,436,745 | |
| S4 Capital PLC (b) | 1,748,700 | 3,523,504 | |
| Sabre Insurance Group PLC (a) | 2,650,000 | 2,729,040 | |
| Savills PLC | 100,430 | 950,754 | |
| Softcat PLC | 222,845 | 2,862,257 | |
| Spectris PLC | 2,855,028 | 98,879,207 | |
| Spirax-Sarco Engineering PLC | 355,497 | 43,826,026 | |
| Tate & Lyle PLC | 806,300 | 6,481,901 | |
| Ten Entertainment Group PLC | 887,600 | 2,183,395 | |
| Vistry Group PLC | 240,000 | 1,659,649 | |
TOTAL UNITED KINGDOM | 434,148,038 | ||
| United States of America - 5.0% | |||
| Autoliv, Inc. | 390,100 | 31,344,535 | |
| Concentrix Corp. | 24,600 | 3,006,858 | |
| Morningstar, Inc. | 212,200 | 49,268,596 | |
| NOV, Inc. | 908,300 | 20,345,920 | |
| PriceSmart, Inc. | 339,588 | 21,723,444 | |
| Ramaco Resources, Inc. (c) | 220,000 | 2,483,800 | |
| ResMed, Inc. | 158,100 | 35,365,389 | |
TOTAL UNITED STATES OF AMERICA | 163,538,542 | ||
| TOTAL COMMON STOCKS (Cost $2,807,354,633) | 3,114,188,784 | ||
| Money Market Funds - 4.3% | |||
| Shares | Value ($) | ||
| Fidelity Cash Central Fund 3.10% (e) | 121,267,462 | 121,291,715 | |
| Fidelity Securities Lending Cash Central Fund 3.10% (e)(f) | 18,449,230 | 18,451,075 | |
| TOTAL MONEY MARKET FUNDS (Cost $139,741,830) | 139,742,790 | ||
| TOTAL INVESTMENT IN SECURITIES - 100.2% (Cost $2,947,096,463) | 3,253,931,574 |
NET OTHER ASSETS (LIABILITIES) - (0.2)% | (7,673,249) |
| NET ASSETS - 100.0% | 3,246,258,325 |
| (a) | Security exempt from registration under Rule 144A of the Securities Act of 1933. These securities may be resold in transactions exempt from registration, normally to qualified institutional buyers. At the end of the period, the value of these securities amounted to $67,766,503 or 2.1% of net assets. |
| (b) | Non-income producing |
| (c) | Security or a portion of the security is on loan at period end. |
| (d) | Affiliated company |
| (e) | Affiliated fund that is generally available only to investment companies and other accounts managed by Fidelity Investments. The rate quoted is the annualized seven-day yield of the fund at period end. A complete unaudited listing of the fund's holdings as of its most recent quarter end is available upon request. In addition, each Fidelity Central Fund's financial statements, which are not covered by the Fund's Report of Independent Registered Public Accounting Firm, are available on the SEC's website or upon request. |
| (f) | Investment made with cash collateral received from securities on loan. |
| Affiliate | Value, beginning of period ($) | Purchases ($) | Sales Proceeds ($) | Dividend Income ($) | Realized Gain (loss) ($) | Change in Unrealized appreciation (depreciation) ($) | Value, end of period ($) | % ownership, end of period |
| Fidelity Cash Central Fund 3.10% | 144,309,124 | 865,961,013 | 888,978,422 | 1,262,242 | - | - | 121,291,715 | 0.2% |
| Fidelity Securities Lending Cash Central Fund 3.10% | 15,744,442 | 197,851,210 | 195,144,577 | 79,785 | - | - | 18,451,075 | 0.1% |
| Total | 160,053,566 | 1,063,812,223 | 1,084,122,999 | 1,342,027 | - | - | 139,742,790 | |
| Affiliate | Value, beginning of period ($) | Purchases ($) | Sales Proceeds ($) | Dividend Income ($) | Realized Gain (loss) ($) | Change in Unrealized appreciation (depreciation) ($) | Value, end of period ($) |
| Avon Protection PLC | 48,128,171 | 2,156,318 | 8,755,614 | 607,577 | (13,270,484) | (12,588,208) | - |
| Broadleaf Co. Ltd. | 28,718,099 | - | - | 207,804 | - | (6,790,282) | 21,927,817 |
| Curves Holdings Co. Ltd. | 33,855,013 | 3,854,945 | - | 231,578 | - | (8,492,923) | 29,217,035 |
| DP Poland PLC | 3,295,626 | 242,908 | 195,627 | - | (1,334,763) | 780,745 | - |
| Digital Hearts Holdings Co. Ltd. | 13,608,617 | 7,241,900 | - | 160,423 | - | (2,484,094) | 18,366,423 |
| Goldcrest Co. Ltd. | 21,877,398 | 3,651,179 | 678,970 | 1,013,420 | (646,840) | (3,564,548) | - |
| Ituran Location & Control Ltd. | 28,945,489 | - | 4,815,398 | 417,747 | 1,206,039 | (3,283,283) | - |
| NS Tool Co. Ltd. | 17,657,258 | 303,100 | - | 205,269 | - | (7,433,537) | 10,526,821 |
| Shoei Co. Ltd. | 67,483,152 | 1,356,436 | 13,783,372 | 1,010,456 | 9,364,388 | (20,606,199) | - |
| Total | 263,568,823 | 18,806,786 | 28,228,981 | 3,854,274 | (4,681,660) | (64,462,329) | 80,038,096 |
| Valuation Inputs at Reporting Date: | ||||
| Description | Total ($) | Level 1 ($) | Level 2 ($) | Level 3 ($) |
Investments in Securities: | ||||
| Equities: | ||||
Communication Services | 210,361,664 | 176,924,919 | 33,436,745 | - |
Consumer Discretionary | 305,657,042 | 305,657,042 | - | - |
Consumer Staples | 189,969,376 | 189,969,376 | - | - |
Energy | 75,659,498 | 75,659,498 | - | - |
Financials | 193,890,301 | 193,890,301 | - | - |
Health Care | 359,298,728 | 359,298,728 | - | - |
Industrials | 923,892,150 | 922,193,212 | 1,698,938 | - |
Information Technology | 617,317,288 | 567,702,580 | 49,614,708 | - |
Materials | 120,996,275 | 120,996,275 | - | - |
Real Estate | 117,146,462 | 117,146,462 | - | - |
| Money Market Funds | 139,742,790 | 139,742,790 | - | - |
| Total Investments in Securities: | 3,253,931,574 | 3,169,181,183 | 84,750,391 | - |
| Statement of Assets and Liabilities | ||||
| October 31, 2022 | ||||
| Assets | ||||
| Investment in securities, at value (including securities loaned of $17,857,661) - See accompanying schedule: | ||||
Unaffiliated issuers (cost $2,718,339,957) | $3,034,150,688 | |||
Fidelity Central Funds (cost $139,741,830) | 139,742,790 | |||
Other affiliated issuers (cost $89,014,676) | 80,038,096 | |||
| Total Investment in Securities (cost $2,947,096,463) | $ | 3,253,931,574 | ||
| Cash | 256,459 | |||
| Foreign currency held at value (cost $6,355) | 6,348 | |||
| Receivable for investments sold | 5,249,384 | |||
| Receivable for fund shares sold | 519,796 | |||
| Dividends receivable | 9,951,857 | |||
| Reclaims receivable | 3,916,154 | |||
| Distributions receivable from Fidelity Central Funds | 239,939 | |||
| Other receivables | 7,782 | |||
Total assets | 3,274,079,293 | |||
| Liabilities | ||||
| Payable for investments purchased | 5,453,321 | |||
| Payable for fund shares redeemed | 2,436,510 | |||
| Other payables and accrued expenses | 1,480,066 | |||
| Collateral on securities loaned | 18,451,071 | |||
| Total Liabilities | 27,820,968 | |||
| Net Assets | $ | 3,246,258,325 | ||
| Net Assets consist of: | ||||
| Paid in capital | $ | 2,752,419,475 | ||
| Total accumulated earnings (loss) | 493,838,850 | |||
| Net Assets | $ | 3,246,258,325 | ||
Net Asset Value , offering price and redemption price per share ($3,246,258,325 ÷ 224,146,131 shares) | $ | 14.48 | ||
| Statement of Operations | ||||
Year ended October 31, 2022 | ||||
| Investment Income | ||||
| Dividends (including $3,854,274 earned from affiliated issuers) | $ | 86,298,126 | ||
| Interest | 3,420 | |||
| Income from Fidelity Central Funds (including $79,785 from security lending) | 1,342,027 | |||
| Income before foreign taxes withheld | 87,643,573 | |||
| Less foreign taxes withheld | (8,507,766) | |||
| Total Income | 79,135,807 | |||
| Expenses | ||||
| Custodian fees and expenses | 343,887 | |||
| Independent trustees' fees and expenses | 13,681 | |||
| Total Expenses | 357,568 | |||
| Net Investment income (loss) | 78,778,239 | |||
| Realized and Unrealized Gain (Loss) | ||||
| Net realized gain (loss) on: | ||||
| Investment Securities: | ||||
| Unaffiliated issuers(net of foreign taxes of $835,624) | 176,915,110 | |||
| Affiliated issuers | (4,681,660) | |||
| Foreign currency transactions | (1,635,078) | |||
| Total net realized gain (loss) | 170,598,372 | |||
| Change in net unrealized appreciation (depreciation) on: | ||||
| Investment Securities: | ||||
| Unaffiliated issuers (net of decrease in deferred foreign taxes of $1,749,678) | (1,706,951,048) | |||
| Affiliated issuers | (64,462,329) | |||
| Assets and liabilities in foreign currencies | (796,798) | |||
| Total change in net unrealized appreciation (depreciation) | (1,772,210,175) | |||
| Net gain (loss) | (1,601,611,803) | |||
| Net increase (decrease) in net assets resulting from operations | $ | (1,522,833,564) | ||
| Statement of Changes in Net Assets | ||||
Year ended October 31, 2022 | Year ended October 31, 2021 | |||
| Increase (Decrease) in Net Assets | ||||
| Operations | ||||
| Net investment income (loss) | $ | 78,778,239 | $ | 60,448,635 |
| Net realized gain (loss) | 170,598,372 | 531,151,176 | ||
| Change in net unrealized appreciation (depreciation) | (1,772,210,175) | 803,627,779 | ||
| Net increase (decrease) in net assets resulting from operations | (1,522,833,564) | 1,395,227,590 | ||
| Distributions to shareholders | (562,935,286) | (34,455,580) | ||
| Share transactions | ||||
| Proceeds from sales of shares | 318,375,461 | 462,541,841 | ||
| Reinvestment of distributions | 562,935,286 | 34,455,580 | ||
| Cost of shares redeemed | (397,219,829) | (662,874,221) | ||
Net increase (decrease) in net assets resulting from share transactions | 484,090,918 | (165,876,800) | ||
| Total increase (decrease) in net assets | (1,601,677,932) | 1,194,895,210 | ||
| Net Assets | ||||
| Beginning of period | 4,847,936,257 | 3,653,041,047 | ||
| End of period | $ | 3,246,258,325 | $ | 4,847,936,257 |
| Other Information | ||||
| Shares | ||||
| Sold | 18,537,989 | 21,517,155 | ||
| Issued in reinvestment of distributions | 27,025,218 | 1,762,434 | ||
| Redeemed | (22,410,759) | (30,467,291) | ||
| Net increase (decrease) | 23,152,448 | (7,187,702) | ||
| Fidelity® Series International Small Cap Fund |
| Years ended October 31, | 2022 | 2021 | 2020 | 2019 | 2018 | |||||
Selected Per-Share Data | ||||||||||
| Net asset value, beginning of period | $ | 24.12 | $ | 17.55 | $ | 16.71 | $ | 16.43 | $ | 18.17 |
| Income from Investment Operations | ||||||||||
Net investment income (loss) A,B | .35 | .29 | .22 | .36 | .38 | |||||
| Net realized and unrealized gain (loss) | (7.16) | 6.45 | 1.36 | 1.47 | (.99) | |||||
| Total from investment operations | (6.81) | 6.74 | 1.58 | 1.83 | (.61) | |||||
| Distributions from net investment income | (.47) | (.17) | (.36) | (.37) | (.29) | |||||
| Distributions from net realized gain | (2.35) | - | (.38) | (1.18) | (.85) | |||||
| Total distributions | (2.83) C | (.17) | (.74) | (1.55) | (1.13) C | |||||
| Net asset value, end of period | $ | 14.48 | $ | 24.12 | $ | 17.55 | $ | 16.71 | $ | 16.43 |
Total Return D | (31.82)% | 38.60% | 9.60% | 12.77% | (3.72)% | |||||
Ratios to Average Net Assets B,E,F | ||||||||||
| Expenses before reductions | .01% | .01% | .01% | .01% | .01% | |||||
| Expenses net of fee waivers, if any | .01% | .01% | .01% | .01% | .01% | |||||
| Expenses net of all reductions | .01% | .01% | .01% | .01% | .01% | |||||
| Net investment income (loss) | 2.03% | 1.34% | 1.36% | 2.28% | 2.08% | |||||
| Supplemental Data | ||||||||||
| Net assets, end of period (000 omitted) | $ | 3,246,258 | $ | 4,847,936 | $ | 3,653,041 | $ | 3,498,064 | $ | 3,225,502 |
Portfolio turnover rate G | 25% | 32% | 24% H | 23% | 14% |
| Average Annual Total Returns | |||
Periods ended October 31, 2022 | Past 1 year | Past 5 years | Past 10 years |
| Fidelity® Series International Value Fund | -16.40% | 0.54% | 3.83% |
| $10,000 Over 10 Years |
Let's say hypothetically that $10,000 was invested in Fidelity® Series International Value Fund on October 31, 2012. The chart shows how the value of your investment would have changed, and also shows how the MSCI EAFE Value Index performed over the same period. |
 |
Top Holdings (% of Fund's net assets) | ||
| Shell PLC ADR (United Kingdom, Oil, Gas & Consumable Fuels) | 4.2 | |
| TotalEnergies SE (France, Oil, Gas & Consumable Fuels) | 3.4 | |
| BHP Group Ltd. (Australia, Metals & Mining) | 3.3 | |
| Toyota Motor Corp. (Japan, Automobiles) | 3.1 | |
| BP PLC (United Kingdom, Oil, Gas & Consumable Fuels) | 2.3 | |
| Sanofi SA (France, Pharmaceuticals) | 2.2 | |
| Glencore PLC (Bailiwick of Jersey, Metals & Mining) | 2.1 | |
| Hitachi Ltd. (Japan, Industrial Conglomerates) | 2.0 | |
| Zurich Insurance Group Ltd. (Switzerland, Insurance) | 2.0 | |
| AstraZeneca PLC (United Kingdom) (United Kingdom, Pharmaceuticals) | 2.0 | |
| 26.6 | ||
| Market Sectors (% of Fund's net assets) | ||
| Financials | 30.2 | |
| Industrials | 13.8 | |
| Energy | 13.4 | |
| Materials | 13.1 | |
| Health Care | 8.3 | |
| Consumer Discretionary | 6.3 | |
| Information Technology | 4.2 | |
| Utilities | 2.3 | |
| Communication Services | 2.1 | |
| Real Estate | 1.6 | |
| Consumer Staples | 1.2 | |
Asset Allocation (% of Fund's net assets) |
 |
Foreign investments - 96.5% |
Geographic Diversification (% of Fund's net assets) |
 |
* Includes Short-Term investments and Net Other Assets (Liabilities). Percentages are based on country or territory of incorporation and are adjusted for the effect of futures contracts, if applicable. |
| Common Stocks - 95.5% | |||
| Shares | Value ($) | ||
| Australia - 6.9% | |||
| BHP Group Ltd. | 17,236,552 | 411,907,468 | |
| Macquarie Group Ltd. | 1,298,241 | 140,756,166 | |
| National Australia Bank Ltd. | 7,421,869 | 154,167,413 | |
| Woodside Energy Group Ltd. | 6,321,603 | 145,489,209 | |
TOTAL AUSTRALIA | 852,320,256 | ||
| Austria - 0.4% | |||
| Erste Group Bank AG | 1,935,964 | 47,711,730 | |
| Bailiwick of Jersey - 2.4% | |||
| Ferguson PLC | 372,155 | 40,587,477 | |
| Glencore PLC | 45,275,027 | 259,565,068 | |
TOTAL BAILIWICK OF JERSEY | 300,152,545 | ||
| Belgium - 1.1% | |||
| KBC Group NV | 1,968,987 | 98,677,278 | |
| UCB SA | 553,800 | 41,769,390 | |
TOTAL BELGIUM | 140,446,668 | ||
| Canada - 0.8% | |||
| Nutrien Ltd. | 1,192,100 | 100,724,947 | |
| Denmark - 0.9% | |||
| DSV A/S | 486,800 | 65,903,402 | |
| ORSTED A/S (a) | 547,211 | 45,148,055 | |
TOTAL DENMARK | 111,051,457 | ||
| Finland - 1.4% | |||
| Sampo Oyj (A Shares) | 3,703,387 | 169,378,886 | |
| France - 13.3% | |||
| Air Liquide SA | 1,211,099 | 158,428,419 | |
| ALTEN | 374,308 | 43,760,339 | |
| AXA SA | 9,130,779 | 225,483,742 | |
| BNP Paribas SA | 3,498,770 | 164,071,044 | |
| Capgemini SA | 554,248 | 90,836,175 | |
| Euroapi SASU (b) | 148,770 | 2,603,024 | |
| Sanofi SA | 3,085,906 | 265,566,478 | |
| Teleperformance | 224,631 | 60,226,317 | |
| TotalEnergies SE (c) | 7,742,892 | 422,400,828 | |
| VINCI SA | 1,366,029 | 125,725,240 | |
| Vivendi SA | 10,054,986 | 82,299,866 | |
TOTAL FRANCE | 1,641,401,472 | ||
| Germany - 10.0% | |||
| Bayer AG | 2,875,682 | 151,206,450 | |
| Deutsche Post AG | 2,642,307 | 93,405,098 | |
| Hannover Reuck SE | 926,263 | 150,854,527 | |
| Linde PLC (c) | 554,474 | 165,839,771 | |
| Muenchener Rueckversicherungs-Gesellschaft AG in Muenchen | 396,617 | 104,697,394 | |
| Rheinmetall AG | 810,441 | 131,751,064 | |
| RWE AG | 3,769,600 | 145,249,728 | |
| Siemens AG | 2,068,707 | 225,921,495 | |
| Vonovia SE | 3,309,341 | 73,171,570 | |
TOTAL GERMANY | 1,242,097,097 | ||
| Hong Kong - 0.7% | |||
| AIA Group Ltd. | 11,473,647 | 86,910,513 | |
| India - 0.8% | |||
| Reliance Industries Ltd. sponsored GDR (a) | 1,713,000 | 104,578,650 | |
| Indonesia - 0.5% | |||
| PT Bank Rakyat Indonesia (Persero) Tbk | 213,689,537 | 63,706,129 | |
| Ireland - 2.4% | |||
| Bank of Ireland Group PLC | 9,294,900 | 67,018,757 | |
| CRH PLC | 3,968,808 | 142,947,961 | |
| Ryanair Holdings PLC sponsored ADR (b) | 1,180,700 | 81,338,423 | |
TOTAL IRELAND | 291,305,141 | ||
| Italy - 1.5% | |||
| Enel SpA | 20,688,350 | 92,422,083 | |
| Mediobanca SpA (c) | 10,345,055 | 93,769,948 | |
TOTAL ITALY | 186,192,031 | ||
| Japan - 21.9% | |||
| DENSO Corp. | 2,545,096 | 126,277,297 | |
| FUJIFILM Holdings Corp. | 2,139,300 | 98,106,101 | |
| Fujitsu Ltd. | 547,000 | 62,937,017 | |
| Hitachi Ltd. | 5,553,100 | 252,456,075 | |
| Hoya Corp. | 1,266,842 | 118,211,324 | |
| Ibiden Co. Ltd. | 1,221,644 | 41,325,326 | |
| Idemitsu Kosan Co. Ltd. | 2,669,276 | 58,341,888 | |
| Itochu Corp. | 5,375,153 | 139,136,917 | |
| Minebea Mitsumi, Inc. | 4,890,951 | 72,495,081 | |
| Mitsubishi Estate Co. Ltd. | 4,676,233 | 58,805,028 | |
| Mitsubishi UFJ Financial Group, Inc. | 39,524,624 | 186,708,428 | |
| Mitsui Fudosan Co. Ltd. | 3,150,496 | 60,374,178 | |
| ORIX Corp. | 9,603,533 | 141,119,201 | |
| Recruit Holdings Co. Ltd. | 1,166,816 | 35,904,293 | |
| Renesas Electronics Corp. (b) | 9,878,000 | 82,636,902 | |
| Shin-Etsu Chemical Co. Ltd. | 1,403,958 | 145,913,294 | |
| Shiseido Co. Ltd. | 955,600 | 33,129,009 | |
| SoftBank Group Corp. | 2,340,337 | 100,461,825 | |
| Sony Group Corp. | 557,345 | 37,584,371 | |
| Sumitomo Mitsui Financial Group, Inc. | 5,031,263 | 141,285,746 | |
| Suzuki Motor Corp. | 3,170,382 | 107,033,307 | |
| TIS, Inc. | 1,964,356 | 53,040,717 | |
| Tokio Marine Holdings, Inc. | 9,379,545 | 169,745,826 | |
| Toyota Motor Corp. | 27,463,520 | 381,045,675 | |
TOTAL JAPAN | 2,704,074,826 | ||
| Korea (South) - 0.4% | |||
| Samsung Electronics Co. Ltd. | 1,152,675 | 47,970,248 | |
| Luxembourg - 0.6% | |||
| ArcelorMittal SA (Netherlands) | 3,053,645 | 68,367,459 | |
| Netherlands - 2.2% | |||
| Airbus Group NV | 892,387 | 96,559,643 | |
| NN Group NV | 3,179,102 | 134,623,883 | |
| Universal Music Group NV | 2,222,387 | 43,637,583 | |
TOTAL NETHERLANDS | 274,821,109 | ||
| Norway - 0.9% | |||
| Equinor ASA | 2,921,900 | 106,455,694 | |
| Singapore - 1.5% | |||
| United Overseas Bank Ltd. (c) | 9,712,989 | 190,472,291 | |
| South Africa - 0.1% | |||
| Thungela Resources Ltd. | 760,674 | 11,619,581 | |
| Spain - 1.9% | |||
| Banco Santander SA (Spain) (c) | 68,913,444 | 178,567,931 | |
| Cellnex Telecom SA (a) | 981,138 | 32,112,902 | |
| Unicaja Banco SA (a) | 27,630,531 | 24,466,062 | |
TOTAL SPAIN | 235,146,895 | ||
| Sweden - 1.5% | |||
| Alleima AB (b) | 605,100 | 2,061,720 | |
| Investor AB (B Shares) | 8,350,460 | 136,406,275 | |
| Sandvik AB | 3,183,500 | 49,747,753 | |
TOTAL SWEDEN | 188,215,748 | ||
| Switzerland - 6.1% | |||
| Novartis AG | 1,441,190 | 116,578,962 | |
| Roche Holding AG (participation certificate) | 242,400 | 80,427,881 | |
| Swiss Life Holding AG | 189,390 | 91,711,401 | |
| UBS Group AG | 14,282,091 | 226,513,963 | |
| Zurich Insurance Group Ltd. | 575,420 | 245,229,021 | |
TOTAL SWITZERLAND | 760,461,228 | ||
| United Kingdom - 15.3% | |||
| Anglo American PLC (United Kingdom) | 5,416,108 | 162,235,272 | |
| AstraZeneca PLC (United Kingdom) | 2,087,799 | 244,966,033 | |
| BAE Systems PLC | 24,524,186 | 229,388,690 | |
| Beazley PLC | 10,015,617 | 71,729,505 | |
| BP PLC | 52,137,852 | 288,458,307 | |
| Imperial Brands PLC | 4,837,383 | 117,834,291 | |
| Lloyds Banking Group PLC | 216,019,816 | 103,747,396 | |
| Shell PLC ADR | 9,235,448 | 513,767,970 | |
| Standard Chartered PLC (United Kingdom) | 26,114,622 | 155,790,789 | |
TOTAL UNITED KINGDOM | 1,887,918,253 | ||
| TOTAL COMMON STOCKS (Cost $11,213,043,791) | 11,813,500,854 | ||
| Nonconvertible Preferred Stocks - 1.0% | |||
| Shares | Value ($) | ||
| Germany - 1.0% | |||
Porsche Automobil Holding SE (Germany) (Cost $136,007,032) | 2,043,977 | 114,201,691 | |
| Money Market Funds - 7.3% | |||
| Shares | Value ($) | ||
| Fidelity Cash Central Fund 3.10% (d) | 391,906,018 | 391,984,399 | |
| Fidelity Securities Lending Cash Central Fund 3.10% (d)(e) | 513,451,567 | 513,502,912 | |
| TOTAL MONEY MARKET FUNDS (Cost $905,487,311) | 905,487,311 | ||
| TOTAL INVESTMENT IN SECURITIES - 103.8% (Cost $12,254,538,134) | 12,833,189,856 |
NET OTHER ASSETS (LIABILITIES) - (3.8)% | (465,211,598) |
| NET ASSETS - 100.0% | 12,367,978,258 |
| (a) | Security exempt from registration under Rule 144A of the Securities Act of 1933. These securities may be resold in transactions exempt from registration, normally to qualified institutional buyers. At the end of the period, the value of these securities amounted to $206,305,669 or 1.7% of net assets. |
| (b) | Non-income producing |
| (c) | Security or a portion of the security is on loan at period end. |
| (d) | Affiliated fund that is generally available only to investment companies and other accounts managed by Fidelity Investments. The rate quoted is the annualized seven-day yield of the fund at period end. A complete unaudited listing of the fund's holdings as of its most recent quarter end is available upon request. In addition, each Fidelity Central Fund's financial statements, which are not covered by the Fund's Report of Independent Registered Public Accounting Firm, are available on the SEC's website or upon request. |
| (e) | Investment made with cash collateral received from securities on loan. |
| Affiliate | Value, beginning of period ($) | Purchases ($) | Sales Proceeds ($) | Dividend Income ($) | Realized Gain (loss) ($) | Change in Unrealized appreciation (depreciation) ($) | Value, end of period ($) | % ownership, end of period |
| Fidelity Cash Central Fund 3.10% | 296,762,755 | 4,309,696,462 | 4,214,474,818 | 4,334,803 | - | - | 391,984,399 | 0.8% |
| Fidelity Securities Lending Cash Central Fund 3.10% | 293,807,795 | 5,288,164,968 | 5,068,469,851 | 4,075,393 | - | - | 513,502,912 | 1.4% |
| Total | 590,570,550 | 9,597,861,430 | 9,282,944,669 | 8,410,196 | - | - | 905,487,311 | |
| Valuation Inputs at Reporting Date: | ||||
| Description | Total ($) | Level 1 ($) | Level 2 ($) | Level 3 ($) |
Investments in Securities: | ||||
| Equities: | ||||
Communication Services | 258,512,176 | - | 258,512,176 | - |
Consumer Discretionary | 766,142,341 | 107,033,307 | 659,109,034 | - |
Consumer Staples | 150,963,300 | 33,129,009 | 117,834,291 | - |
Energy | 1,651,112,127 | 833,797,298 | 817,314,829 | - |
Financials | 3,765,321,245 | 2,206,631,540 | 1,558,689,705 | - |
Health Care | 1,021,329,542 | 162,583,738 | 858,745,804 | - |
Industrials | 1,700,546,968 | 843,894,756 | 856,652,212 | - |
Information Technology | 520,612,825 | 284,202,731 | 236,410,094 | - |
Materials | 1,617,991,379 | 748,901,365 | 869,090,014 | - |
Real Estate | 192,350,776 | 60,374,178 | 131,976,598 | - |
Utilities | 282,819,866 | 145,249,728 | 137,570,138 | - |
| Money Market Funds | 905,487,311 | 905,487,311 | - | - |
| Total Investments in Securities: | 12,833,189,856 | 6,331,284,961 | 6,501,904,895 | - |
| Statement of Assets and Liabilities | ||||
| October 31, 2022 | ||||
| Assets | ||||
| Investment in securities, at value (including securities loaned of $471,025,314) - See accompanying schedule: | ||||
Unaffiliated issuers (cost $11,349,050,823) | $11,927,702,545 | |||
Fidelity Central Funds (cost $905,487,311) | 905,487,311 | |||
| Total Investment in Securities (cost $12,254,538,134) | $ | 12,833,189,856 | ||
| Foreign currency held at value (cost $557,758) | 552,950 | |||
| Receivable for investments sold | 136,679,371 | |||
| Receivable for fund shares sold | 3,009,071 | |||
| Dividends receivable | 40,292,681 | |||
| Reclaims receivable | 38,629,821 | |||
| Interest receivable | 105 | |||
| Distributions receivable from Fidelity Central Funds | 1,227,049 | |||
Total assets | 13,053,580,904 | |||
| Liabilities | ||||
| Payable for fund shares redeemed | 171,928,056 | |||
| Other payables and accrued expenses | 171,678 | |||
| Collateral on securities loaned | 513,502,912 | |||
| Total Liabilities | 685,602,646 | |||
| Net Assets | $ | 12,367,978,258 | ||
| Net Assets consist of: | ||||
| Paid in capital | $ | 12,650,879,939 | ||
| Total accumulated earnings (loss) | (282,901,681) | |||
| Net Assets | $ | 12,367,978,258 | ||
Net Asset Value , offering price and redemption price per share ($12,367,978,258 ÷ 1,339,208,137 shares) | $ | 9.24 | ||
| Statement of Operations | ||||
Year ended October 31, 2022 | ||||
| Investment Income | ||||
| Dividends | $ | 549,700,276 | ||
| Non-Cash dividends | 60,632,586 | |||
| Interest | 19,540 | |||
| Income from Fidelity Central Funds (including $4,075,393 from security lending) | 8,410,196 | |||
| Income before foreign taxes withheld | 618,762,598 | |||
| Less foreign taxes withheld | (46,239,668) | |||
| Total Income | 572,522,930 | |||
| Expenses | ||||
| Custodian fees and expenses | 763,002 | |||
| Independent trustees' fees and expenses | 48,119 | |||
| Interest | 3,435 | |||
| Total expenses before reductions | 814,556 | |||
| Expense reductions | (240) | |||
| Total expenses after reductions | 814,316 | |||
| Net Investment income (loss) | 571,708,614 | |||
| Realized and Unrealized Gain (Loss) | ||||
| Net realized gain (loss) on: | ||||
| Investment Securities: | ||||
| Unaffiliated issuers | (151,202,404) | |||
| Redemptions in-kind with affiliated entities | 9,807,643 | |||
| Foreign currency transactions | (6,856,789) | |||
| Total net realized gain (loss) | (148,251,550) | |||
| Change in net unrealized appreciation (depreciation) on: | ||||
| Investment Securities: | ||||
| Unaffiliated issuers | (2,769,482,283) | |||
| Assets and liabilities in foreign currencies | (5,313,051) | |||
| Total change in net unrealized appreciation (depreciation) | (2,774,795,334) | |||
| Net gain (loss) | (2,923,046,884) | |||
| Net increase (decrease) in net assets resulting from operations | $ | (2,351,338,270) | ||
| Statement of Changes in Net Assets | ||||
Year ended October 31, 2022 | Year ended October 31, 2021 | |||
| Increase (Decrease) in Net Assets | ||||
| Operations | ||||
| Net investment income (loss) | $ | 571,708,614 | $ | 568,501,292 |
| Net realized gain (loss) | (148,251,550) | 711,104,230 | ||
| Change in net unrealized appreciation (depreciation) | (2,774,795,334) | 3,663,836,805 | ||
| Net increase (decrease) in net assets resulting from operations | (2,351,338,270) | 4,943,442,327 | ||
| Distributions to shareholders | (770,910,384) | (373,393,666) | ||
| Share transactions | ||||
| Proceeds from sales of shares | 2,577,499,861 | 2,735,781,749 | ||
| Reinvestment of distributions | 770,910,384 | 373,393,666 | ||
| Cost of shares redeemed | (3,188,665,043) | (3,954,452,072) | ||
Net increase (decrease) in net assets resulting from share transactions | 159,745,202 | (845,276,657) | ||
| Total increase (decrease) in net assets | (2,962,503,452) | 3,724,772,004 | ||
| Net Assets | ||||
| Beginning of period | 15,330,481,710 | 11,605,709,706 | ||
| End of period | $ | 12,367,978,258 | $ | 15,330,481,710 |
| Other Information | ||||
| Shares | ||||
| Sold | 248,540,462 | 245,691,599 | ||
| Issued in reinvestment of distributions | 70,596,189 | 38,062,555 | ||
| Redeemed | (298,779,921) | (372,495,173) | ||
| Net increase (decrease) | 20,356,730 | (88,741,019) | ||
| Fidelity® Series International Value Fund |
| Years ended October 31, | 2022 | 2021 | 2020 | 2019 | 2018 | |||||
Selected Per-Share Data | ||||||||||
| Net asset value, beginning of period | $ | 11.62 | $ | 8.25 | $ | 9.82 | $ | 9.68 | $ | 10.87 |
| Income from Investment Operations | ||||||||||
Net investment income (loss) A,B | .42 | .43 C | .26 | .39 | .38 | |||||
| Net realized and unrealized gain (loss) | (2.24) | 3.23 | (1.43) | .10 | (1.23) | |||||
| Total from investment operations | (1.82) | 3.66 | (1.17) | .49 | (.85) | |||||
| Distributions from net investment income | (.56) | (.29) | (.36) | (.35) | (.31) | |||||
| Distributions from net realized gain | - | - | (.04) | - | (.03) | |||||
| Total distributions | (.56) | (.29) | (.40) | (.35) | (.34) | |||||
| Net asset value, end of period | $ | 9.24 | $ | 11.62 | $ | 8.25 | $ | 9.82 | $ | 9.68 |
Total Return D | (16.40)% | 44.95% | (12.55)% | 5.48% | (8.11)% | |||||
Ratios to Average Net Assets B,E,F | ||||||||||
| Expenses before reductions | .01% | .01% | .01% | .01% | .01% | |||||
| Expenses net of fee waivers, if any | .01% | .01% | .01% | .01% | .01% | |||||
| Expenses net of all reductions | .01% | .01% | .01% | .01% | -% G | |||||
| Net investment income (loss) | 4.09% | 3.97% C | 2.92% | 4.23% | 3.60% | |||||
| Supplemental Data | ||||||||||
| Net assets, end of period (000 omitted) | $ | 12,367,978 | $ | 15,330,482 | $ | 11,605,710 | $ | 15,992,396 | $ | 14,030,676 |
Portfolio turnover rate H | 31% I | 34% | 36% I | 41% | 43% |
| Fidelity Central Fund | Investment Manager | Investment Objective | Investment Practices | Expense Ratio A |
| Fidelity Money Market Central Funds | Fidelity Management & Research Company LLC (FMR) | Each fund seeks to obtain a high level of current income consistent with the preservation of capital and liquidity. | Short-term Investments | Less than .005% |
| Tax cost | Gross unrealized appreciation | Gross unrealized depreciation | Net unrealized appreciation (depreciation) | |
Fidelity Series Emerging Markets Fund | $2,873,687,205 | $230,369,851 | $(649,400,938) | $(419,031,087) |
Fidelity Series Emerging Markets Opportunities Fund | 25,386,312,243 | 3,590,771,195 | (6,688,197,571) | (3,097,426,376) |
Fidelity Series International Growth Fund | 10,211,557,270 | 3,709,497,051 | (1,133,112,702) | 2,576,384,349 |
Fidelity Series International Small Cap Fund | 2,963,078,900 | 824,908,792 | (534,056,669) | 290,852,123 |
| Fidelity Series International Value Fund | 12,485,040,648 | 1,527,981,573 | (1,179,832,365) | 348,149,208 |
| Undistributed ordinary income | Undistributed long-term capital gain | Capital loss carryforward | Net unrealized appreciation (depreciation) on securities and other investments | |
Fidelity Series Emerging Markets Fund | $49,624,281 | $- | $(297,426,554) | $(419,139,468) |
Fidelity Series Emerging Markets Opportunities Fund | 422,953,792 | - | (834,830,045) | (3,101,762,927) |
Fidelity Series International Growth Fund | 151,934,332 | 261,708,278 | - | 2,573,584,326 |
Fidelity Series International Small Cap Fund | 41,257,144 | 163,880,557 | - | 290,113,311 |
| Fidelity Series International Value Fund | 381,887,841 | - | (1,007,762,687) | 342,973,166 |
Short-term | Long-term | Total capital loss carryforward | |
Fidelity Series Emerging Markets Fund | $(259,568,802) | $(37,857,752) | $(297,426,554) |
Fidelity Series Emerging Markets Opportunities Fund | (834,830,045) | - | (834,830,045) |
| Fidelity Series International Value Fund | (1,007,762,687) | - | (1,007,762,687) |
| October 31, 2022 | |||
| Ordinary Income | Long-term Capital Gains | Total | |
Fidelity Series Emerging Markets Fund | $ 105,313,301 | $ - | $ 105,313,301 |
Fidelity Series Emerging Markets Opportunities Fund | 1,355,505,288 | 1,975,800,325 | 3,331,305,613 |
Fidelity Series International Growth Fund | 332,369,715 | 896,087,260 | 1,228,456,975 |
Fidelity Series International Small Cap Fund | 97,971,051 | 464,964,235 | 562,935,286 |
| Fidelity Series International Value Fund | 770,910,384 | - | 770,910,384 |
| October 31, 2021 | |||
| Ordinary Income | Long-term Capital Gains | Total | |
Fidelity Series Emerging Markets Fund | $ 47,189,249 | $ - | $ 47,189,249 |
Fidelity Series Emerging Markets Opportunities Fund | 404,944,890 | 504,961,398 | 909,906,288 |
Fidelity Series International Growth Fund | 174,415,485 | 1,719,238,352 | 1,893,653,837 |
Fidelity Series International Small Cap Fund | 34,455,580 | - | 34,455,580 |
| Fidelity Series International Value Fund | 373,393,666 | - | 373,393,666 |
| Equity Risk | Equity risk relates to the fluctuations in the value of financial instruments as a result of changes in market prices (other than those arising from interest rate risk or foreign exchange risk), whether caused by factors specific to an individual investment, its issuer, or all factors affecting all instruments traded in a market or market segment. |
| Purchases ($) | Sales ($) | |
| Fidelity Series Emerging Markets Fund | 2,322,362,250 | 1,750,176,871 |
| Fidelity Series Emerging Markets Opportunities Fund | 13,957,340,250 | 9,443,815,008 |
| Fidelity Series International Growth Fund | 4,352,506,268 | 2,944,129,286 |
| Fidelity Series International Small Cap Fund | 962,060,115 | 933,991,857 |
| Fidelity Series International Value Fund | 4,136,000,499 | 4,320,912,703 |
| Amount | |
| Fidelity Series Emerging Markets Fund | $ 965 |
| Fidelity Series Emerging Markets Opportunities Fund | 130,055 |
| Fidelity Series International Growth Fund | 6,761 |
| Fidelity Series International Small Cap Fund | 714 |
| Fidelity Series International Value Fund | 5,221 |
| Borrower or Lender | Average Loan Balance | Weighted Average Interest Rate | Interest Expense | |
Fidelity Series International Growth Fund | Borrower | $12,576,000 | .32% | $ 220 |
| Fidelity Series International Value Fund | Borrower | $ 130,860,667 | .32% | $ 3,435 |
| Purchases ($) | Sales ($) | Realized Gain (Loss) ($) | |
| Fidelity Series Emerging Markets Fund | 20,735,155 | 32,432,512 | (1,664,139) |
| Fidelity Series Emerging Markets Opportunities Fund | 284,874,718 | 142,547,382 | (26,520,410) |
| Fidelity Series International Growth Fund | 218,358,370 | 139,128,081 | 2,609,219 |
| Fidelity Series International Small Cap Fund | 68,679,823 | 8,092,826 | 1,256,398 |
| Fidelity Series International Value Fund | 82,850,054 | 104,071,974 | 5,954,913 |
| Shares | Total net realized gain or loss ($) | Total Proceeds ($) | |
| Fidelity Series International Growth Fund | 3,489,700 | 20,221,102 | 47,323,914 |
| Fidelity Series International Value Fund | 5,171,078 | 9,807,643 | 46,949,274 |
| Amount ($) | |
| Fidelity Series Emerging Markets Opportunities Fund | 41,157 |
| Fidelity Series International Growth Fund | 4,126 |
| Total Security Lending Fees Paid to NFS | Security Lending Income From Securities Loaned to NFS | Value of Securities Loaned to NFS at Period End | |
| Fidelity Series Emerging Markets Fund | $ 18,937 | $ - | $- |
| Fidelity Series Emerging Markets Opportunities Fund | $ 511,461 | $ 11 | $- |
| Fidelity Series International Growth Fund | $ 60,135 | $ - | $ - |
| Fidelity Series International Small Cap Fund | $ 9,020 | $ - | $ - |
| Fidelity Series International Value Fund | $ 436,872 | $ - | $- |
| Expense Limitations | Reimbursement | |
| Fidelity Series Emerging Markets Fund | .013% | $ 624,015 |
| Fidelity Series Emerging Markets Opportunities Fund | .013% | $ 4,180,484 |
| Custodian credits | |
Fidelity Series Emerging Markets Fund | $153 |
Fidelity Series Emerging Markets Opportunities Fund | 4,149 |
Fidelity Series International Growth Fund | 167 |
Fidelity Series International Value Fund | 240 |
| The Example is based on an investment of $1,000 invested at the beginning of the period and held for the entire period (May 1, 2022 to October 31, 2022). |
Annualized Expense Ratio- A | Beginning Account Value May 1, 2022 | Ending Account Value October 31, 2022 | Expenses Paid During Period- C May 1, 2022 to October 31, 2022 | |||||||
| Fidelity® Series Emerging Markets Fund | .01% | |||||||||
| Actual | $ 1,000 | $ 805.10 | $ .05 | |||||||
Hypothetical- B | $ 1,000 | $ 1,025.16 | $ .05 | |||||||
| Fidelity® Series Emerging Markets Opportunities Fund | .01% | |||||||||
| Actual | $ 1,000 | $ 822.40 | $ .05 | |||||||
Hypothetical- B | $ 1,000 | $ 1,025.16 | $ .05 | |||||||
| Fidelity® Series International Growth Fund | .01% | |||||||||
| Actual | $ 1,000 | $ 898.10 | $ .05 | |||||||
Hypothetical- B | $ 1,000 | $ 1,025.16 | $ .05 | |||||||
| Fidelity® Series International Small Cap Fund | .01% | |||||||||
| Actual | $ 1,000 | $ 876.00 | $ .05 | |||||||
Hypothetical- B | $ 1,000 | $ 1,025.16 | $ .05 | |||||||
| Fidelity® Series International Value Fund | .01% | |||||||||
| Actual | $ 1,000 | $ 892.80 | $ .05 | |||||||
Hypothetical- B | $ 1,000 | $ 1,025.16 | $ .05 | |||||||
| Fidelity Series International Growth Fund | $324,975,788 |
| Fidelity Series International Small Cap Fund | $174,366,556 |
| Fidelity Series International Growth Fund | |
| December, 2021 | 5% |
| Fidelity Series Emerging Markets Opportunities Fund | |
| December, 2021 | 33% |
| Fidelity Series International Growth Fund | |
| December, 2021 | 38% |
| Fidelity Series International Value Fund | |
| December, 2021 | 46% |
| Fidelity Series International Small Cap Fund | |
| December, 2021 | 51% |
| Fidelity Series Emerging Markets Fund | |
| December, 2021 | 38% |
Fidelity Series International Growth Fund
Fidelity Series International Value Fund
|


Contents
Board Approval of Investment Advisory Contracts and Management Fees |
| Average Annual Total Returns | |||
Periods ended October 31, 2022 | Past 1 year | Past 5 years | Past 10 years |
| Class A (incl.5.75% sales charge) | -37.60% | 0.18% | 6.07% |
| Class M (incl.3.50% sales charge) | -36.26% | 0.38% | 6.02% |
Class C (incl. contingent deferred sales charge) | -34.88% | 0.60% | 6.04% |
| Fidelity® International Small Cap Opportunities Fund | -33.62% | 1.66% | 7.01% |
| Class I | -33.60% | 1.66% | 7.00% |
| Class Z | -33.52% | 1.76% | 7.05% |
| $10,000 Over 10 Years |
Let's say hypothetically that $10,000 was invested in Fidelity® International Small Cap Opportunities Fund, a class of the fund, on October 31, 2012. The chart shows how the value of your investment would have changed, and also shows how the MSCI EAFE Small Cap Index performed over the same period. |
 |
Top Holdings (% of Fund's net assets) | ||
| Spectris PLC (United Kingdom, Electronic Equipment & Components) | 3.5 | |
| Lagercrantz Group AB (B Shares) (Sweden, Electronic Equipment & Components) | 3.3 | |
| Azbil Corp. (Japan, Electronic Equipment & Components) | 3.3 | |
| AddTech AB (B Shares) (Sweden, Trading Companies & Distributors) | 3.2 | |
| Aalberts Industries NV (Netherlands, Machinery) | 3.0 | |
| OBIC Co. Ltd. (Japan, IT Services) | 2.7 | |
| Interpump Group SpA (Italy, Machinery) | 2.6 | |
| CTS Eventim AG (Germany, Entertainment) | 2.4 | |
| SHO-BOND Holdings Co. Ltd. (Japan, Construction & Engineering) | 2.1 | |
| Morningstar, Inc. (United States of America, Capital Markets) | 1.9 | |
| 28.0 | ||
| Market Sectors (% of Fund's net assets) | ||
| Industrials | 29.6 | |
| Information Technology | 20.9 | |
| Health Care | 12.6 | |
| Consumer Discretionary | 8.2 | |
| Communication Services | 7.0 | |
| Consumer Staples | 6.3 | |
| Financials | 4.8 | |
| Materials | 3.1 | |
| Real Estate | 2.7 | |
| Energy | 2.0 | |
Asset Allocation (% of Fund's net assets) |
 |
Foreign investments - 91.2% |
Geographic Diversification (% of Fund's net assets) |
 |
* Includes Short-Term investments and Net Other Assets (Liabilities). Percentages are based on country or territory of incorporation and are adjusted for the effect of futures contracts, if applicable. |
| Common Stocks - 97.2% | |||
| Shares | Value ($) | ||
| Australia - 1.1% | |||
| Aub Group Ltd. | 190,000 | 2,513,313 | |
| Imdex Ltd. | 3,047,752 | 3,976,969 | |
| Steadfast Group Ltd. | 1,650,000 | 5,340,438 | |
TOTAL AUSTRALIA | 11,830,720 | ||
| Bailiwick of Jersey - 0.4% | |||
| Integrated Diagnostics Holdings PLC (a) | 5,996,716 | 4,617,471 | |
| Belgium - 1.4% | |||
| Azelis Group NV | 265,800 | 6,083,596 | |
| KBC Ancora | 239,989 | 8,533,345 | |
TOTAL BELGIUM | 14,616,941 | ||
| Canada - 3.5% | |||
| CAE, Inc. (b) | 411,600 | 7,855,250 | |
| McCoy Global, Inc. (b) | 630,715 | 462,961 | |
| Osisko Gold Royalties Ltd. | 335,000 | 3,592,579 | |
| Pason Systems, Inc. | 495,000 | 5,257,570 | |
| Richelieu Hardware Ltd. (c) | 442,263 | 11,871,808 | |
| Summit Industrial Income REIT (c) | 561,500 | 7,175,627 | |
TOTAL CANADA | 36,215,795 | ||
| Cayman Islands - 0.4% | |||
| Chlitina Holding Ltd. | 829,500 | 3,793,367 | |
| Denmark - 0.7% | |||
| SimCorp A/S | 18,943 | 1,131,406 | |
| Spar Nord Bank A/S | 480,455 | 5,815,736 | |
TOTAL DENMARK | 6,947,142 | ||
| Finland - 0.5% | |||
| Musti Group OYJ | 289,502 | 5,441,629 | |
| France - 3.4% | |||
| Laurent-Perrier Group SA | 66,632 | 6,492,719 | |
| Lectra | 412,400 | 13,204,759 | |
| LISI | 343,264 | 6,777,828 | |
| Vetoquinol SA | 112,417 | 9,343,182 | |
TOTAL FRANCE | 35,818,488 | ||
| Germany - 5.5% | |||
| CTS Eventim AG (b) | 521,054 | 24,891,794 | |
| Nexus AG | 291,358 | 15,634,846 | |
| Rheinmetall AG | 32,000 | 5,202,148 | |
| Scout24 AG (a) | 127,200 | 6,521,596 | |
| Stabilus Se | 93,636 | 5,140,362 | |
TOTAL GERMANY | 57,390,746 | ||
| India - 1.1% | |||
| Embassy Office Parks (REIT) | 1,706,000 | 7,097,273 | |
| Indian Energy Exchange Ltd. (a) | 2,298,585 | 3,884,659 | |
TOTAL INDIA | 10,981,932 | ||
| Ireland - 0.7% | |||
| Cairn Homes PLC | 4,369,500 | 4,214,203 | |
| Irish Residential Properties REIT PLC | 2,925,000 | 3,162,351 | |
TOTAL IRELAND | 7,376,554 | ||
| Israel - 1.9% | |||
| Ituran Location & Control Ltd. (c) | 355,577 | 8,526,736 | |
| Maytronics Ltd. | 294,515 | 3,178,900 | |
| Strauss Group Ltd. | 130,984 | 3,279,836 | |
| Tel Aviv Stock Exchange Ltd. | 734,996 | 4,332,744 | |
TOTAL ISRAEL | 19,318,216 | ||
| Italy - 2.6% | |||
| Interpump Group SpA | 686,943 | 26,598,182 | |
| Japan - 35.6% | |||
| Ai Holdings Corp. | 185,800 | 2,753,981 | |
| Aoki Super Co. Ltd. | 175,000 | 3,012,879 | |
| Artnature, Inc. | 483,700 | 2,508,038 | |
| Aucnet, Inc. | 306,977 | 4,626,487 | |
| Azbil Corp. | 1,255,592 | 34,156,291 | |
| Broadleaf Co. Ltd. | 2,509,998 | 9,199,697 | |
| Central Automotive Products Ltd. | 151,500 | 2,286,331 | |
| Curves Holdings Co. Ltd. | 2,020,026 | 11,751,051 | |
| Daiichikosho Co. Ltd. | 418,800 | 12,026,470 | |
| Daikokutenbussan Co. Ltd. (c) | 77,500 | 2,366,253 | |
| Digital Hearts Holdings Co. Ltd. | 558,714 | 7,683,985 | |
| Fujitec Co. Ltd. | 203,000 | 4,038,293 | |
| Funai Soken Holdings, Inc. | 325,650 | 5,810,212 | |
| Goldcrest Co. Ltd. | 595,530 | 7,008,827 | |
| Iwatsuka Confectionary Co. Ltd. | 18,900 | 510,965 | |
| JEOL Ltd. | 413,200 | 15,172,481 | |
| Kobayashi Pharmaceutical Co. Ltd. | 160,550 | 8,529,843 | |
| Koshidaka Holdings Co. Ltd. | 1,447,400 | 10,882,634 | |
| Kusuri No Aoki Holdings Co. Ltd. | 93,500 | 4,514,812 | |
| Lasertec Corp. | 131,644 | 18,497,422 | |
| Medikit Co. Ltd. | 294,400 | 4,791,338 | |
| Miroku Jyoho Service Co., Ltd. | 349,800 | 3,514,585 | |
| Misumi Group, Inc. | 650,268 | 13,906,670 | |
| Mitsuboshi Belting Ltd. | 124,780 | 2,655,965 | |
| Nagaileben Co. Ltd. | 671,327 | 9,219,205 | |
| Nihon Parkerizing Co. Ltd. | 2,013,600 | 13,108,476 | |
| NS Tool Co. Ltd. | 594,500 | 4,613,827 | |
| NSD Co. Ltd. | 432,049 | 7,391,860 | |
| OBIC Co. Ltd. | 188,600 | 28,373,395 | |
| OSG Corp. | 849,800 | 10,818,598 | |
| Paramount Bed Holdings Co. Ltd. | 262,220 | 4,669,683 | |
| ProNexus, Inc. | 497,100 | 3,206,018 | |
| San-Ai Obbli Co. Ltd. | 839,700 | 6,945,970 | |
| SHO-BOND Holdings Co. Ltd. | 507,100 | 21,962,568 | |
| Shoei Co. Ltd. | 480,352 | 17,735,179 | |
| SK Kaken Co. Ltd. | 40,900 | 10,190,961 | |
| Software Service, Inc. | 74,600 | 4,128,975 | |
| Techno Medica Co. Ltd. | 80,791 | 887,807 | |
| The Monogatari Corp. | 94,200 | 4,320,549 | |
| TIS, Inc. | 291,800 | 7,879,061 | |
| Tocalo Co. Ltd. | 558,336 | 4,468,340 | |
| USS Co. Ltd. | 647,100 | 9,778,632 | |
| Welcia Holdings Co. Ltd. | 230,700 | 4,825,159 | |
| YAKUODO Holdings Co. Ltd. | 235,900 | 4,419,902 | |
TOTAL JAPAN | 371,149,675 | ||
| Korea (South) - 0.6% | |||
| BGF Retail Co. Ltd. | 44,596 | 5,827,112 | |
| Netherlands - 5.1% | |||
| Aalberts Industries NV | 904,480 | 31,445,726 | |
| AerCap Holdings NV (b)(c) | 121,000 | 6,462,610 | |
| IMCD NV | 113,917 | 14,781,554 | |
TOTAL NETHERLANDS | 52,689,890 | ||
| Norway - 2.2% | |||
| Kongsberg Gruppen ASA | 444,181 | 15,919,532 | |
| Medistim ASA | 175,242 | 4,062,400 | |
| Volue A/S (b) | 963,944 | 2,503,474 | |
TOTAL NORWAY | 22,485,406 | ||
| South Africa - 0.7% | |||
| Clicks Group Ltd. | 461,429 | 7,818,702 | |
| Spain - 0.4% | |||
| Fluidra SA (c) | 335,001 | 4,545,519 | |
| Sweden - 8.9% | |||
| Addlife AB | 821,408 | 7,677,545 | |
| AddTech AB (B Shares) | 2,734,665 | 33,089,813 | |
| Hemnet Group AB | 605,600 | 7,525,298 | |
| INVISIO AB | 395,859 | 5,879,875 | |
| John Mattson Fastighetsforetag (b)(c) | 435,213 | 2,751,319 | |
| Lagercrantz Group AB (B Shares) | 4,054,287 | 34,791,843 | |
| Teqnion AB | 122,243 | 1,383,942 | |
TOTAL SWEDEN | 93,099,635 | ||
| Switzerland - 1.3% | |||
| Tecan Group AG | 37,821 | 13,876,702 | |
| Taiwan - 0.5% | |||
| Addcn Technology Co. Ltd. | 855,032 | 4,771,680 | |
| United Kingdom - 12.7% | |||
| Alliance Pharma PLC | 9,107,237 | 6,496,280 | |
| Avon Protection PLC | 521,507 | 6,219,868 | |
| Bodycote PLC | 1,851,267 | 10,521,752 | |
| Clarkson PLC | 346,149 | 10,976,046 | |
| Dechra Pharmaceuticals PLC | 576,495 | 17,321,461 | |
| DP Poland PLC (b) | 15,541,591 | 1,345,644 | |
| Helios Towers PLC (b) | 2,265,833 | 3,261,064 | |
| Howden Joinery Group PLC | 1,461,900 | 8,617,246 | |
| Rightmove PLC | 2,399,170 | 13,510,196 | |
| Spectris PLC | 1,043,878 | 36,152,997 | |
| Spirax-Sarco Engineering PLC | 143,991 | 17,751,354 | |
TOTAL UNITED KINGDOM | 132,173,908 | ||
| United States of America - 6.0% | |||
| Autoliv, Inc. | 156,800 | 12,598,880 | |
| Morningstar, Inc. (c) | 84,400 | 19,595,992 | |
| NOV, Inc. | 365,000 | 8,176,000 | |
| PriceSmart, Inc. | 132,660 | 8,486,260 | |
| ResMed, Inc. | 63,495 | 14,203,197 | |
TOTAL UNITED STATES OF AMERICA | 63,060,329 | ||
| TOTAL COMMON STOCKS (Cost $874,786,552) | 1,012,445,741 | ||
| Money Market Funds - 3.9% | |||
| Shares | Value ($) | ||
| Fidelity Cash Central Fund 3.10% (d) | 26,876,072 | 26,881,448 | |
| Fidelity Securities Lending Cash Central Fund 3.10% (d)(e) | 13,985,059 | 13,986,458 | |
| TOTAL MONEY MARKET FUNDS (Cost $40,867,905) | 40,867,906 | ||
| TOTAL INVESTMENT IN SECURITIES - 101.1% (Cost $915,654,457) | 1,053,313,647 |
NET OTHER ASSETS (LIABILITIES) - (1.1)% | (11,167,858) |
| NET ASSETS - 100.0% | 1,042,145,789 |
| (a) | Security exempt from registration under Rule 144A of the Securities Act of 1933. These securities may be resold in transactions exempt from registration, normally to qualified institutional buyers. At the end of the period, the value of these securities amounted to $15,023,726 or 1.4% of net assets. |
| (b) | Non-income producing |
| (c) | Security or a portion of the security is on loan at period end. |
| (d) | Affiliated fund that is generally available only to investment companies and other accounts managed by Fidelity Investments. The rate quoted is the annualized seven-day yield of the fund at period end. A complete unaudited listing of the fund's holdings as of its most recent quarter end is available upon request. In addition, each Fidelity Central Fund's financial statements, which are not covered by the Fund's Report of Independent Registered Public Accounting Firm, are available on the SEC's website or upon request. |
| (e) | Investment made with cash collateral received from securities on loan. |
| Affiliate | Value, beginning of period ($) | Purchases ($) | Sales Proceeds ($) | Dividend Income ($) | Realized Gain (loss) ($) | Change in Unrealized appreciation (depreciation) ($) | Value, end of period ($) | % ownership, end of period |
| Fidelity Cash Central Fund 3.10% | 36,511,034 | 205,244,824 | 214,874,411 | 187,524 | 29 | (28) | 26,881,448 | 0.1% |
| Fidelity Securities Lending Cash Central Fund 3.10% | 7,881,340 | 323,942,967 | 317,837,849 | 26,687 | - | - | 13,986,458 | 0.0% |
| Total | 44,392,374 | 529,187,791 | 532,712,260 | 214,211 | 29 | (28) | 40,867,906 | |
| Valuation Inputs at Reporting Date: | ||||
| Description | Total ($) | Level 1 ($) | Level 2 ($) | Level 3 ($) |
Investments in Securities: | ||||
| Equities: | ||||
Communication Services | 72,508,098 | 58,997,902 | 13,510,196 | - |
Consumer Discretionary | 88,160,119 | 88,160,119 | - | - |
Consumer Staples | 66,385,847 | 66,385,847 | - | - |
Energy | 20,842,501 | 20,842,501 | - | - |
Financials | 50,016,227 | 50,016,227 | - | - |
Health Care | 132,102,573 | 132,102,573 | - | - |
Industrials | 308,604,502 | 308,604,502 | - | - |
Information Technology | 215,761,492 | 197,264,070 | 18,497,422 | - |
Materials | 30,868,985 | 30,868,985 | - | - |
Real Estate | 27,195,397 | 27,195,397 | - | - |
| Money Market Funds | 40,867,906 | 40,867,906 | - | - |
| Total Investments in Securities: | 1,053,313,647 | 1,021,306,029 | 32,007,618 | - |
| Statement of Assets and Liabilities | ||||
| October 31, 2022 | ||||
| Assets | ||||
| Investment in securities, at value (including securities loaned of $13,502,564) - See accompanying schedule: | ||||
Unaffiliated issuers (cost $874,786,552) | $1,012,445,741 | |||
Fidelity Central Funds (cost $40,867,905) | 40,867,906 | |||
| Total Investment in Securities (cost $915,654,457) | $ | 1,053,313,647 | ||
| Foreign currency held at value (cost $99,083) | 97,336 | |||
| Receivable for investments sold | 995,410 | |||
| Receivable for fund shares sold | 1,291,388 | |||
| Dividends receivable | 3,530,996 | |||
| Reclaims receivable | 1,421,363 | |||
| Distributions receivable from Fidelity Central Funds | 49,998 | |||
| Prepaid expenses | 1,764 | |||
| Other receivables | 2,578 | |||
Total assets | 1,060,704,480 | |||
| Liabilities | ||||
| Payable for investments purchased | $215,291 | |||
| Payable for fund shares redeemed | 2,577,853 | |||
| Accrued management fee | 896,867 | |||
| Distribution and service plan fees payable | 12,128 | |||
| Other affiliated payables | 166,983 | |||
| Other payables and accrued expenses | 699,501 | |||
| Collateral on securities loaned | 13,990,068 | |||
| Total Liabilities | 18,558,691 | |||
| Net Assets | $ | 1,042,145,789 | ||
| Net Assets consist of: | ||||
| Paid in capital | $ | 844,816,501 | ||
| Total accumulated earnings (loss) | 197,329,288 | |||
| Net Assets | $ | 1,042,145,789 | ||
| Net Asset Value and Maximum Offering Price | ||||
| Class A : | ||||
Net Asset Value and redemption price per share ($26,380,110 ÷ 1,536,586 shares) (a) | $ | 17.17 | ||
| Maximum offering price per share (100/94.25 of $17.17) | $ | 18.22 | ||
| Class M : | ||||
Net Asset Value and redemption price per share ($10,115,426 ÷ 598,351 shares) (a) | $ | 16.91 | ||
| Maximum offering price per share (100/96.50 of $16.91) | $ | 17.52 | ||
| Class C : | ||||
Net Asset Value and offering price per share ($3,314,414 ÷ 204,382 shares) (a) | $ | 16.22 | ||
| International Small Cap Opportunities : | ||||
Net Asset Value , offering price and redemption price per share ($700,271,203 ÷ 40,073,833 shares) | $ | 17.47 | ||
| Class I : | ||||
Net Asset Value , offering price and redemption price per share ($82,704,625 ÷ 4,737,796 shares) | $ | 17.46 | ||
| Class Z : | ||||
Net Asset Value , offering price and redemption price per share ($219,360,011 ÷ 12,575,596 shares) | $ | 17.44 | ||
(a)Redemption price per share is equal to net asset value less any applicable contingent deferred sales charge. | ||||
| Statement of Operations | ||||
Year ended October 31, 2022 | ||||
| Investment Income | ||||
| Dividends | $ | 26,500,157 | ||
| Income from Fidelity Central Funds (including $26,687 from security lending) | 214,211 | |||
| Income before foreign taxes withheld | 26,714,368 | |||
| Less foreign taxes withheld | (2,582,778) | |||
| Total Income | 24,131,590 | |||
| Expenses | ||||
| Management fee | ||||
| Basic fee | $ | 11,158,221 | ||
| Performance adjustment | 1,829,551 | |||
| Transfer agent fees | 1,914,218 | |||
| Distribution and service plan fees | 196,690 | |||
| Accounting fees | 603,200 | |||
| Custodian fees and expenses | 117,639 | |||
| Independent trustees' fees and expenses | 4,809 | |||
| Registration fees | 93,128 | |||
| Audit | 77,455 | |||
| Legal | 2,093 | |||
| Miscellaneous | 6,571 | |||
| Total expenses before reductions | 16,003,575 | |||
| Expense reductions | (44,285) | |||
| Total expenses after reductions | 15,959,290 | |||
| Net Investment income (loss) | 8,172,300 | |||
| Realized and Unrealized Gain (Loss) | ||||
| Net realized gain (loss) on: | ||||
| Investment Securities: | ||||
| Unaffiliated issuers(net of foreign taxes of $368,474) | 73,059,106 | |||
| Fidelity Central Funds | 29 | |||
| Foreign currency transactions | (733,793) | |||
| Total net realized gain (loss) | 72,325,342 | |||
| Change in net unrealized appreciation (depreciation) on: | ||||
| Investment Securities: | ||||
| Unaffiliated issuers (net of decrease in deferred foreign taxes of $729,080) | (657,538,973) | |||
| Fidelity Central Funds | (28) | |||
| Assets and liabilities in foreign currencies | (262,199) | |||
| Total change in net unrealized appreciation (depreciation) | (657,801,200) | |||
| Net gain (loss) | (585,475,858) | |||
| Net increase (decrease) in net assets resulting from operations | $ | (577,303,558) | ||
| Statement of Changes in Net Assets | ||||
Year ended October 31, 2022 | Year ended October 31, 2021 | |||
| Increase (Decrease) in Net Assets | ||||
| Operations | ||||
| Net investment income (loss) | $ | 8,172,300 | $ | 628,545 |
| Net realized gain (loss) | 72,325,342 | 178,864,218 | ||
| Change in net unrealized appreciation (depreciation) | (657,801,200) | 315,607,273 | ||
| Net increase (decrease) in net assets resulting from operations | (577,303,558) | 495,100,036 | ||
| Distributions to shareholders | (145,923,001) | - | ||
| Share transactions - net increase (decrease) | (23,291,061) | (112,591,520) | ||
| Total increase (decrease) in net assets | (746,517,620) | 382,508,516 | ||
| Net Assets | ||||
| Beginning of period | 1,788,663,409 | 1,406,154,893 | ||
| End of period | $ | 1,042,145,789 | $ | 1,788,663,409 |
| Fidelity Advisor® International Small Cap Opportunities Fund Class A |
| Years ended October 31, | 2022 | 2021 | 2020 | 2019 | 2018 | |||||
Selected Per-Share Data | ||||||||||
| Net asset value, beginning of period | $ | 28.35 | $ | 20.86 | $ | 19.02 | $ | 17.33 | $ | 18.47 |
| Income from Investment Operations | ||||||||||
Net investment income (loss) A,B | .06 | (.06) | (.04) | .11 | .12 | |||||
| Net realized and unrealized gain (loss) | (8.93) | 7.55 | 2.05 | 2.01 | (.92) | |||||
| Total from investment operations | (8.87) | 7.49 | 2.01 | 2.12 | (.80) | |||||
| Distributions from net investment income | - | - | (.11) | (.11) | (.09) | |||||
| Distributions from net realized gain | (2.31) | - | (.05) | (.31) | (.24) | |||||
| Total distributions | (2.31) | - | (.17) C | (.43) C | (.34) C | |||||
Redemption fees added to paid in capital A | - | - | - | - | - D | |||||
| Net asset value, end of period | $ | 17.17 | $ | 28.35 | $ | 20.86 | $ | 19.02 | $ | 17.33 |
Total Return E,F | (33.79)% | 35.91% | 10.58% | 12.61% | (4.48)% | |||||
Ratios to Average Net Assets B,G,H | ||||||||||
| Expenses before reductions | 1.49% | 1.50% | 1.57% | 1.49% | 1.38% | |||||
| Expenses net of fee waivers, if any | 1.48% | 1.50% | 1.57% | 1.49% | 1.38% | |||||
| Expenses net of all reductions | 1.48% | 1.50% | 1.56% | 1.48% | 1.37% | |||||
| Net investment income (loss) | .30% | (.25)% | (.20)% | .64% | .65% | |||||
| Supplemental Data | ||||||||||
| Net assets, end of period (000 omitted) | $ | 26,380 | $ | 45,981 | $ | 37,771 | $ | 41,679 | $ | 41,164 |
Portfolio turnover rate I | 13% | 21% | 20% | 17% | 19% |
| Fidelity Advisor® International Small Cap Opportunities Fund Class M |
| Years ended October 31, | 2022 | 2021 | 2020 | 2019 | 2018 | |||||
Selected Per-Share Data | ||||||||||
| Net asset value, beginning of period | $ | 28.02 | $ | 20.67 | $ | 18.85 | $ | 17.17 | $ | 18.32 |
| Income from Investment Operations | ||||||||||
Net investment income (loss) A,B | .01 | (.13) | (.09) | .06 | .07 | |||||
| Net realized and unrealized gain (loss) | (8.81) | 7.48 | 2.03 | 1.99 | (.92) | |||||
| Total from investment operations | (8.80) | 7.35 | 1.94 | 2.05 | (.85) | |||||
| Distributions from net investment income | - | - | (.06) | (.06) | (.06) | |||||
| Distributions from net realized gain | (2.31) | - | (.05) | (.31) | (.24) | |||||
| Total distributions | (2.31) | - | (.12) C | (.37) | (.30) | |||||
Redemption fees added to paid in capital A | - | - | - | - | - D | |||||
| Net asset value, end of period | $ | 16.91 | $ | 28.02 | $ | 20.67 | $ | 18.85 | $ | 17.17 |
Total Return E,F | (33.95)% | 35.56% | 10.29% | 12.29% | (4.74)% | |||||
Ratios to Average Net Assets B,G,H | ||||||||||
| Expenses before reductions | 1.74% | 1.75% | 1.84% | 1.77% | 1.67% | |||||
| Expenses net of fee waivers, if any | 1.74% | 1.75% | 1.84% | 1.77% | 1.67% | |||||
| Expenses net of all reductions | 1.74% | 1.75% | 1.83% | 1.77% | 1.66% | |||||
| Net investment income (loss) | .05% | (.50)% | (.47)% | .36% | .36% | |||||
| Supplemental Data | ||||||||||
| Net assets, end of period (000 omitted) | $ | 10,115 | $ | 16,378 | $ | 13,141 | $ | 13,875 | $ | 13,245 |
Portfolio turnover rate I | 13% | 21% | 20% | 17% | 19% |
| Fidelity Advisor® International Small Cap Opportunities Fund Class C |
| Years ended October 31, | 2022 | 2021 | 2020 | 2019 | 2018 | |||||
Selected Per-Share Data | ||||||||||
| Net asset value, beginning of period | $ | 27.10 | $ | 20.09 | $ | 18.31 | $ | 16.69 | $ | 17.84 |
| Income from Investment Operations | ||||||||||
Net investment income (loss) A,B | (.09) | (.25) | (.18) | (.02) | (.02) | |||||
| Net realized and unrealized gain (loss) | (8.48) | 7.26 | 1.96 | 1.93 | (.89) | |||||
| Total from investment operations | (8.57) | 7.01 | 1.78 | 1.91 | (.91) | |||||
| Distributions from net realized gain | (2.31) | - | - | (.29) | (.24) | |||||
| Total distributions | (2.31) | - | - | (.29) | (.24) | |||||
Redemption fees added to paid in capital A | - | - | - | - | - C | |||||
| Net asset value, end of period | $ | 16.22 | $ | 27.10 | $ | 20.09 | $ | 18.31 | $ | 16.69 |
Total Return D,E | (34.28)% | 34.89% | 9.72% | 11.74% | (5.19)% | |||||
Ratios to Average Net Assets B,F,G | ||||||||||
| Expenses before reductions | 2.26% | 2.26% | 2.33% | 2.27% | 2.15% | |||||
| Expenses net of fee waivers, if any | 2.25% | 2.26% | 2.33% | 2.26% | 2.15% | |||||
| Expenses net of all reductions | 2.25% | 2.26% | 2.33% | 2.26% | 2.14% | |||||
| Net investment income (loss) | (.47)% | (1.01)% | (.96)% | (.13)% | (.12)% | |||||
| Supplemental Data | ||||||||||
| Net assets, end of period (000 omitted) | $ | 3,314 | $ | 6,770 | $ | 7,253 | $ | 9,424 | $ | 14,461 |
Portfolio turnover rate H | 13% | 21% | 20% | 17% | 19% |
| Fidelity® International Small Cap Opportunities Fund |
| Years ended October 31, | 2022 | 2021 | 2020 | 2019 | 2018 | |||||
Selected Per-Share Data | ||||||||||
| Net asset value, beginning of period | $ | 28.77 | $ | 21.10 | $ | 19.24 | $ | 17.53 | $ | 18.69 |
| Income from Investment Operations | ||||||||||
Net investment income (loss) A,B | .13 | .01 | .02 | .17 | .18 | |||||
| Net realized and unrealized gain (loss) | (9.09) | 7.66 | 2.07 | 2.02 | (.95) | |||||
| Total from investment operations | (8.96) | 7.67 | 2.09 | 2.19 | (.77) | |||||
| Distributions from net investment income | (.04) | - | (.17) | (.17) | (.15) | |||||
| Distributions from net realized gain | (2.31) | - | (.05) | (.31) | (.24) | |||||
| Total distributions | (2.34) C | - | (.23) C | (.48) | (.39) | |||||
Redemption fees added to paid in capital A | - | - | - | - | - D | |||||
| Net asset value, end of period | $ | 17.47 | $ | 28.77 | $ | 21.10 | $ | 19.24 | $ | 17.53 |
Total Return E | (33.62)% | 36.35% | 10.90% | 12.97% | (4.25)% | |||||
Ratios to Average Net Assets B,F,G | ||||||||||
| Expenses before reductions | 1.19% | 1.21% | 1.26% | 1.19% | 1.10% | |||||
| Expenses net of fee waivers, if any | 1.19% | 1.20% | 1.26% | 1.19% | 1.10% | |||||
| Expenses net of all reductions | 1.19% | 1.20% | 1.25% | 1.19% | 1.09% | |||||
| Net investment income (loss) | .60% | .05% | .11% | .94% | .93% | |||||
| Supplemental Data | ||||||||||
| Net assets, end of period (000 omitted) | $ | 700,271 | $ | 1,268,421 | $ | 1,152,472 | $ | 1,040,989 | $ | 965,482 |
Portfolio turnover rate H | 13% | 21% | 20% | 17% | 19% |
| Fidelity Advisor® International Small Cap Opportunities Fund Class I |
| Years ended October 31, | 2022 | 2021 | 2020 | 2019 | 2018 | |||||
Selected Per-Share Data | ||||||||||
| Net asset value, beginning of period | $ | 28.75 | $ | 21.09 | $ | 19.22 | $ | 17.51 | $ | 18.66 |
| Income from Investment Operations | ||||||||||
Net investment income (loss) A,B | .13 | .01 | .02 | .17 | .18 | |||||
| Net realized and unrealized gain (loss) | (9.07) | 7.65 | 2.07 | 2.02 | (.94) | |||||
| Total from investment operations | (8.94) | 7.66 | 2.09 | 2.19 | (.76) | |||||
| Distributions from net investment income | (.04) | - | (.16) | (.16) | (.15) | |||||
| Distributions from net realized gain | (2.31) | - | (.05) | (.31) | (.24) | |||||
| Total distributions | (2.35) | - | (.22) C | (.48) C | (.39) | |||||
Redemption fees added to paid in capital A | - | - | - | - | - D | |||||
| Net asset value, end of period | $ | 17.46 | $ | 28.75 | $ | 21.09 | $ | 19.22 | $ | 17.51 |
Total Return E | (33.60)% | 36.32% | 10.90% | 12.93% | (4.21)% | |||||
Ratios to Average Net Assets B,F,G | ||||||||||
| Expenses before reductions | 1.20% | 1.22% | 1.28% | 1.20% | 1.12% | |||||
| Expenses net of fee waivers, if any | 1.19% | 1.22% | 1.27% | 1.19% | 1.12% | |||||
| Expenses net of all reductions | 1.19% | 1.22% | 1.27% | 1.19% | 1.11% | |||||
| Net investment income (loss) | .59% | .04% | .09% | .93% | .91% | |||||
| Supplemental Data | ||||||||||
| Net assets, end of period (000 omitted) | $ | 82,705 | $ | 141,310 | $ | 113,041 | $ | 142,854 | $ | 159,968 |
Portfolio turnover rate H | 13% | 21% | 20% | 17% | 19% |
| Fidelity Advisor® International Small Cap Opportunities Fund Class Z |
| Years ended October 31, | 2022 | 2021 | 2020 | 2019 | 2018 A | |||||
Selected Per-Share Data | ||||||||||
| Net asset value, beginning of period | $ | 28.73 | $ | 21.05 | $ | 19.20 | $ | 17.51 | $ | 19.11 |
| Income from Investment Operations | ||||||||||
Net investment income (loss) B,C | .15 | .04 | .05 | .19 | - D | |||||
| Net realized and unrealized gain (loss) | (9.05) | 7.64 | 2.05 | 2.02 | (1.60) | |||||
| Total from investment operations | (8.90) | 7.68 | 2.10 | 2.21 | (1.60) | |||||
| Distributions from net investment income | (.08) | - | (.20) | (.20) | - | |||||
| Distributions from net realized gain | (2.31) | - | (.05) | (.31) | - | |||||
| Total distributions | (2.39) | - | (.25) | (.52) E | - | |||||
| Net asset value, end of period | $ | 17.44 | $ | 28.73 | $ | 21.05 | $ | 19.20 | $ | 17.51 |
Total Return F,G | (33.52)% | 36.48% | 11.03% | 13.10% | (8.37)% | |||||
Ratios to Average Net Assets C,H,I | ||||||||||
| Expenses before reductions | 1.07% | 1.09% | 1.14% | 1.05% | 1.03% J | |||||
| Expenses net of fee waivers, if any | 1.07% | 1.09% | 1.13% | 1.05% | 1.03% J | |||||
| Expenses net of all reductions | 1.07% | 1.09% | 1.13% | 1.05% | 1.02% J | |||||
| Net investment income (loss) | .72% | .16% | .23% | 1.08% | .16% J | |||||
| Supplemental Data | ||||||||||
| Net assets, end of period (000 omitted) | $ | 219,360 | $ | 309,803 | $ | 82,476 | $ | 76,527 | $ | 4,617 |
Portfolio turnover rate K | 13% | 21% | 20% | 17% | 19% |
| Fidelity Central Fund | Investment Manager | Investment Objective | Investment Practices | Expense Ratio A |
| Fidelity Money Market Central Funds | Fidelity Management & Research Company LLC (FMR) | Each fund seeks to obtain a high level of current income consistent with the preservation of capital and liquidity. | Short-term Investments | Less than .005% |
| Gross unrealized appreciation | $286,797,676 |
| Gross unrealized depreciation | (153,196,360) |
| Net unrealized appreciation (depreciation) | $133,601,316 |
| Tax Cost | $919,712,331 |
| Undistributed ordinary income | $585,497 |
| Undistributed long-term capital gain | $64,042,521 |
| Net unrealized appreciation (depreciation) on securities and other investments | $133,328,764 |
| October 31, 2022 | October 31, 2021 | |
| Ordinary Income | $2,549,889 | $- |
| Long-term Capital Gains | 143,373,112 | - |
| Total | $145,923,001 | $- |
| Purchases ($) | Sales ($) | |
| Fidelity International Small Cap Opportunities Fund | 167,270,813 | 310,844,213 |
| Distribution Fee | Service Fee | Total Fees | Retained by FDC | |
| Class A | - % | .25% | $85,731 | $259 |
| Class M | .25% | .25% | 63,478 | 71 |
| Class C | .75% | .25% | 47,481 | 1,728 |
| $196,690 | $2,058 |
| Retained by FDC | |
| Class A | $1,357 |
| Class M | 427 |
Class C A | 12 |
| $1,796 |
| Amount | % of Class-Level Average Net Assets | |
| Class A | $70,790 | .21 |
| Class M | 27,307 | .22 |
| Class C | 10,776 | .23 |
| International Small Cap Opportunities | 1,526,297 | .16 |
| Class I | 175,933 | .17 |
| Class Z | 103,115 | .04 |
| $1,914,218 |
| % of Average Net Assets | |
| Fidelity International Small Cap Opportunities Fund | .04 |
| Amount | |
| Fidelity International Small Cap Opportunities Fund | $478 |
| Purchases ($) | Sales ($) | Realized Gain (Loss) ($) | |
| Fidelity International Small Cap Opportunities Fund | 16,169,457 | 5,871,127 | (554,000) |
| Amount | |
| Fidelity International Small Cap Opportunities Fund | $2,423 |
| Total Security Lending Fees Paid to NFS | Security Lending Income From Securities Loaned to NFS | Value of Securities Loaned to NFS at Period End | |
| Fidelity International Small Cap Opportunities Fund | $2,849 | $- | $- |
Year ended October 31, 2022 | Year ended October 31, 2021 | |
| Fidelity International Small Cap Opportunities Fund | ||
| Distributions to shareholders | ||
| Class A | $3,712,302 | $- |
| Class M | 1,347,073 | - |
| Class C | 565,280 | - |
| International Small Cap Opportunities | 103,110,108 | - |
| Class I | 11,507,400 | - |
| Class Z | 25,680,838 | - |
Total | $145,923,001 | $- |
| Shares | Shares | Dollars | Dollars | |
| Year ended October 31, 2022 | Year ended October 31, 2021 | Year ended October 31, 2022 | Year ended October 31, 2021 | |
| Fidelity International Small Cap Opportunities Fund | ||||
| Class A | ||||
| Shares sold | 107,181 | 151,070 | $2,213,121 | $3,794,092 |
| Reinvestment of distributions | 146,450 | - | 3,629,027 | - |
| Shares redeemed | (339,023) | (340,135) | (7,042,478) | (8,897,910) |
| Net increase (decrease) | (85,392) | (189,065) | $(1,200,330) | $(5,103,818) |
| Class M | ||||
| Shares sold | 19,908 | 17,473 | $424,699 | $451,365 |
| Reinvestment of distributions | 54,676 | - | 1,337,368 | - |
| Shares redeemed | (60,774) | (68,804) | (1,238,854) | (1,743,983) |
| Net increase (decrease) | 13,810 | (51,331) | $523,213 | $(1,292,618) |
| Class C | ||||
| Shares sold | 9,960 | 9,328 | $199,008 | $229,373 |
| Reinvestment of distributions | 23,946 | - | 564,404 | - |
| Shares redeemed | (79,310) | (120,495) | (1,567,463) | (2,950,299) |
| Net increase (decrease) | (45,404) | (111,167) | $(804,051) | $(2,720,926) |
| International Small Cap Opportunities | ||||
| Shares sold | 2,966,612 | 2,518,067 | $62,249,598 | $64,960,834 |
| Reinvestment of distributions | 3,165,438 | - | 79,642,429 | - |
| Shares redeemed | (10,146,566) | (13,038,246) | (202,796,085) | (357,315,392) |
| Net increase (decrease) | (4,014,516) | (10,520,179) | $(60,904,058) | $(292,354,558) |
| Class I | ||||
| Shares sold | 698,127 | 614,813 | $14,776,475 | $16,295,899 |
| Reinvestment of distributions | 335,375 | - | 8,427,973 | - |
| Shares redeemed | (1,211,577) | (1,059,106) | (25,532,337) | (26,919,774) |
| Net increase (decrease) | (178,075) | (444,293) | $(2,327,889) | $(10,623,875) |
| Class Z | ||||
| Shares sold | 2,588,492 | 8,684,967 | $51,781,304 | $244,920,787 |
| Reinvestment of distributions | 928,091 | - | 23,276,518 | - |
| Shares redeemed | (1,722,683) | (1,820,708) | (33,635,768) | (45,416,512) |
| Net increase (decrease) | 1,793,900 | 6,864,259 | $41,422,054 | $199,504,275 |
| Fund | % of shares held |
| Fidelity International Small Cap Opportunities Fund | 23% |
| The Example is based on an investment of $1,000 invested at the beginning of the period and held for the entire period (May 1, 2022 to October 31, 2022). |
Annualized Expense Ratio- A | Beginning Account Value May 1, 2022 | Ending Account Value October 31, 2022 | Expenses Paid During Period- C May 1, 2022 to October 31, 2022 | |||||||
| Fidelity® International Small Cap Opportunities Fund | ||||||||||
| Class A | 1.47% | |||||||||
| Actual | $ 1,000 | $ 875.60 | $ 6.95 | |||||||
Hypothetical- B | $ 1,000 | $ 1,017.80 | $ 7.48 | |||||||
| Class M | 1.73% | |||||||||
| Actual | $ 1,000 | $ 874.40 | $ 8.17 | |||||||
Hypothetical- B | $ 1,000 | $ 1,016.48 | $ 8.79 | |||||||
| Class C | 2.25% | |||||||||
| Actual | $ 1,000 | $ 872.00 | $ 10.62 | |||||||
Hypothetical- B | $ 1,000 | $ 1,013.86 | $ 11.42 | |||||||
| Fidelity® International Small Cap Opportunities Fund | 1.17% | |||||||||
| Actual | $ 1,000 | $ 876.60 | $ 5.53 | |||||||
Hypothetical- B | $ 1,000 | $ 1,019.31 | $ 5.96 | |||||||
| Class I | 1.17% | |||||||||
| Actual | $ 1,000 | $ 876.90 | $ 5.54 | |||||||
Hypothetical- B | $ 1,000 | $ 1,019.31 | $ 5.96 | |||||||
| Class Z | 1.05% | |||||||||
| Actual | $ 1,000 | $ 877.30 | $ 4.97 | |||||||
Hypothetical- B | $ 1,000 | $ 1,019.91 | $ 5.35 | |||||||
| Pay Date | Income | Taxes | |
| Fidelity International Small Cap Opportunities Fund | |||
| Class A | 12/06/2021 | $0.0000 | $0.0000 |
| Class M | 12/06/2021 | $0.0000 | $0.0000 |
| Class C | 12/06/2021 | $0.0000 | $0.0000 |
| International Small Cap Opportunities | 12/06/2021 | $0.0740 | $0.0390 |
| Class I | 12/06/2021 | $0.0760 | $0.0390 |
| Class Z | 12/06/2021 | $0.1160 | $0.0390 |


|


Contents
Board Approval of Investment Advisory Contracts and Management Fees |
| Average Annual Total Returns | |||
Periods ended October 31, 2022 | Past 1 year | Past 5 years | Past 10 years |
| Class A (incl.5.75% sales charge) | -34.56% | -1.13% | 3.94% |
| Class M (incl.3.50% sales charge) | -33.18% | -0.91% | 3.93% |
Class C (incl. contingent deferred sales charge) | -31.76% | -0.75% | 3.92% |
| Fidelity® International Discovery Fund | -30.36% | 0.38% | 4.91% |
| Class K | -30.28% | 0.49% | 5.04% |
| Class I | -30.37% | 0.36% | 4.90% |
| Class Z | -30.29% | 0.49% | 5.03% |
| $10,000 Over 10 Years |
Let's say hypothetically that $10,000 was invested in Fidelity® International Discovery Fund, a class of the fund, on October 31, 2012. The chart shows how the value of your investment would have changed, and also shows how the MSCI EAFE Index performed over the same period. |
 |
Top Holdings (% of Fund's net assets) | ||
| Nestle SA (Reg. S) (Switzerland, Food Products) | 3.9 | |
| Roche Holding AG (participation certificate) (Switzerland, Pharmaceuticals) | 3.5 | |
| Equinor ASA (Norway, Oil, Gas & Consumable Fuels) | 3.4 | |
| LVMH Moet Hennessy Louis Vuitton SE (France, Textiles, Apparel & Luxury Goods) | 2.8 | |
| AstraZeneca PLC (United Kingdom) (United Kingdom, Pharmaceuticals) | 2.7 | |
| ASML Holding NV (Netherlands) (Netherlands, Semiconductors & Semiconductor Equipment) | 1.9 | |
| Housing Development Finance Corp. Ltd. (India, Diversified Financial Services) | 1.8 | |
| Hitachi Ltd. (Japan, Industrial Conglomerates) | 1.6 | |
| Canadian Natural Resources Ltd. (Canada, Oil, Gas & Consumable Fuels) | 1.6 | |
| Diageo PLC (United Kingdom, Beverages) | 1.6 | |
| 24.8 | ||
| Market Sectors (% of Fund's net assets) | ||
| Financials | 17.3 | |
| Health Care | 16.5 | |
| Industrials | 13.7 | |
| Information Technology | 13.6 | |
| Consumer Discretionary | 9.5 | |
| Consumer Staples | 8.4 | |
| Energy | 6.8 | |
| Materials | 5.2 | |
| Real Estate | 1.5 | |
| Communication Services | 1.5 | |
| Utilities | 0.6 | |
Asset Allocation (% of Fund's net assets) |
 |
Foreign investments - 94.2% |
Geographic Diversification (% of Fund's net assets) |
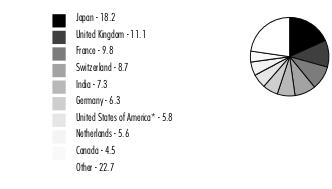 |
* Includes Short-Term investments and Net Other Assets (Liabilities). Percentages are based on country or territory of incorporation and are adjusted for the effect of futures contracts, if applicable. |
| Common Stocks - 93.7% | |||
| Shares | Value ($) (000s) | ||
| Australia - 2.2% | |||
| Bapcor Ltd. | 5,665,432 | 23,990 | |
| Flight Centre Travel Group Ltd. (a)(b) | 3,399,258 | 36,203 | |
| Iperionx Ltd. (a)(c) | 14,929,158 | 6,780 | |
| Lynas Rare Earths Ltd. (a) | 5,459,237 | 29,088 | |
| National Storage REIT unit | 41,083,037 | 68,588 | |
TOTAL AUSTRALIA | 164,649 | ||
| Bailiwick of Jersey - 0.4% | |||
| JTC PLC (d) | 3,272,715 | 26,235 | |
| Belgium - 1.6% | |||
| KBC Group NV | 1,104,794 | 55,368 | |
| UCB SA | 877,717 | 66,200 | |
TOTAL BELGIUM | 121,568 | ||
| Brazil - 0.2% | |||
| Rede D'Oregon Sao Luiz SA (d) | 2,095,900 | 13,053 | |
| Canada - 4.5% | |||
| Canadian Natural Resources Ltd. (b) | 1,942,815 | 116,525 | |
| Constellation Software, Inc. | 56,664 | 81,933 | |
| Definity Financial Corp. | 515,094 | 15,256 | |
| Nutrien Ltd. | 713,133 | 60,255 | |
| The Toronto-Dominion Bank | 831,181 | 53,195 | |
| Topicus.Com, Inc. (a) | 103,234 | 5,357 | |
TOTAL CANADA | 332,521 | ||
| Cayman Islands - 0.4% | |||
| Li Ning Co. Ltd. | 4,057,483 | 20,986 | |
| Medlive Technology Co. Ltd. (d) | 2,275,509 | 1,965 | |
| Silergy Corp. | 501,000 | 5,809 | |
TOTAL CAYMAN ISLANDS | 28,760 | ||
| China - 0.1% | |||
| Asymchem Laboratories Tianjin Co. Ltd. (H Shares) (d) | 248,985 | 2,664 | |
| WuXi AppTec Co. Ltd. (H Shares) (d) | 954,013 | 7,645 | |
TOTAL CHINA | 10,309 | ||
| Cyprus - 0.0% | |||
| Fix Price Group Ltd. GDR (Reg. S) (e) | 619,390 | 229 | |
| Denmark - 1.4% | |||
| DSV A/S | 421,739 | 57,095 | |
| ORSTED A/S (d) | 587,604 | 48,481 | |
TOTAL DENMARK | 105,576 | ||
| Finland - 0.5% | |||
| Musti Group OYJ | 546,401 | 10,270 | |
| Neste OYJ | 599,343 | 26,263 | |
TOTAL FINLAND | 36,533 | ||
| France - 9.8% | |||
| Air Liquide SA | 722,193 | 94,473 | |
| AXA SA | 4,028,714 | 99,489 | |
| BNP Paribas SA | 1,010,654 | 47,394 | |
| Capgemini SA | 620,551 | 101,703 | |
| Edenred SA | 970,990 | 49,860 | |
| EssilorLuxottica SA | 330,760 | 52,414 | |
| Exclusive Networks SA | 1,465,990 | 23,557 | |
| LVMH Moet Hennessy Louis Vuitton SE | 327,812 | 206,848 | |
| Teleperformance | 176,581 | 47,344 | |
TOTAL FRANCE | 723,082 | ||
| Germany - 6.3% | |||
| Brenntag SE | 843,873 | 51,203 | |
| Deutsche Borse AG | 481,859 | 78,360 | |
| Deutsche Post AG | 1,664,317 | 58,833 | |
| Linde PLC | 158,583 | 47,431 | |
| Merck KGaA | 382,509 | 62,336 | |
| Muenchener Rueckversicherungs-Gesellschaft AG in Muenchen | 137,717 | 36,354 | |
| Nexus AG | 562,762 | 30,199 | |
| Rheinmetall AG | 144,416 | 23,477 | |
| Siemens AG | 492,598 | 53,796 | |
| Siemens Healthineers AG (d) | 482,927 | 22,124 | |
TOTAL GERMANY | 464,113 | ||
| Hong Kong - 1.8% | |||
| AIA Group Ltd. | 13,079,327 | 99,073 | |
| Chervon Holdings Ltd. | 1,160,863 | 3,912 | |
| Techtronic Industries Co. Ltd. | 3,453,082 | 32,696 | |
TOTAL HONG KONG | 135,681 | ||
| Hungary - 0.2% | |||
| Richter Gedeon PLC | 864,578 | 17,072 | |
| India - 7.0% | |||
| Avenue Supermarts Ltd. (a)(d) | 505,358 | 26,378 | |
| Delhivery Private Ltd. (a)(f) | 1,020,800 | 4,032 | |
| Eicher Motors Ltd. | 595,700 | 27,709 | |
| HDFC Bank Ltd. (a) | 3,117,382 | 56,574 | |
| HDFC Bank Ltd. sponsored ADR | 1,601,665 | 99,800 | |
| Housing Development Finance Corp. Ltd. | 4,533,815 | 135,270 | |
| ITC Ltd. | 4,656,000 | 19,613 | |
| Pine Labs Private Ltd. (a)(e)(f) | 8,672 | 4,352 | |
| PVR Ltd. (a) | 649,600 | 13,929 | |
| Reliance Industries Ltd. | 2,618,180 | 80,639 | |
| Reliance Industries Ltd. sponsored GDR (d) | 402,445 | 24,569 | |
| Star Health & Allied Insurance Co. Ltd. | 992,200 | 8,553 | |
| Sunteck Realty Ltd. | 2,762,804 | 12,995 | |
TOTAL INDIA | 514,413 | ||
| Ireland - 1.7% | |||
| Cairn Homes PLC | 28,430,122 | 27,420 | |
| CRH PLC | 1,174,418 | 42,300 | |
| Dalata Hotel Group PLC (a)(c) | 11,357,745 | 36,423 | |
| ICON PLC (a) | 109,527 | 21,669 | |
TOTAL IRELAND | 127,812 | ||
| Italy - 0.4% | |||
| BFF Bank SpA (d) | 3,207,326 | 22,631 | |
| FinecoBank SpA | 564,041 | 7,603 | |
TOTAL ITALY | 30,234 | ||
| Japan - 18.2% | |||
| Daiichi Sankyo Kabushiki Kaisha | 1,790,744 | 57,323 | |
| FUJIFILM Holdings Corp. | 1,739,574 | 79,775 | |
| Fujitsu Ltd. | 352,420 | 40,549 | |
| Hitachi Ltd. | 2,651,949 | 120,563 | |
| Hoya Corp. | 1,127,801 | 105,237 | |
| Itochu Corp. | 2,883,661 | 74,644 | |
| JEOL Ltd. | 1,033,111 | 37,935 | |
| Keyence Corp. | 130,812 | 49,547 | |
| Minebea Mitsumi, Inc. | 4,322,712 | 64,072 | |
| Misumi Group, Inc. | 953,236 | 20,386 | |
| Mitsubishi UFJ Financial Group, Inc. | 9,731,948 | 45,972 | |
| Murata Manufacturing Co. Ltd. | 759,689 | 35,963 | |
| Olympus Corp. | 4,722,694 | 99,729 | |
| ORIX Corp. | 7,788,432 | 114,447 | |
| Persol Holdings Co. Ltd. | 2,359,950 | 47,391 | |
| Renesas Electronics Corp. (a) | 7,033,907 | 58,844 | |
| Shin-Etsu Chemical Co. Ltd. | 716,507 | 74,467 | |
| SMC Corp. | 72,167 | 28,968 | |
| Sony Group Corp. | 1,704,591 | 114,949 | |
| TIS, Inc. | 1,442,195 | 38,942 | |
| ZOZO, Inc. | 1,377,495 | 29,320 | |
TOTAL JAPAN | 1,339,023 | ||
| Luxembourg - 0.9% | |||
| Eurofins Scientific SA | 478,664 | 30,644 | |
| Globant SA (a) | 102,400 | 19,321 | |
| Samsonite International SA (a)(d) | 6,432,477 | 13,832 | |
TOTAL LUXEMBOURG | 63,797 | ||
| Netherlands - 5.6% | |||
| Airbus Group NV | 523,390 | 56,633 | |
| ASML Holding NV (Netherlands) | 293,061 | 137,471 | |
| Heineken NV (Bearer) | 831,294 | 69,501 | |
| IMCD NV | 228,925 | 29,705 | |
| ING Groep NV (Certificaten Van Aandelen) | 3,512,991 | 34,566 | |
| Koninklijke KPN NV | 20,276,280 | 56,715 | |
| RHI Magnesita NV | 422,437 | 8,972 | |
| Universal Music Group NV | 966,794 | 18,983 | |
TOTAL NETHERLANDS | 412,546 | ||
| New Zealand - 0.9% | |||
| EBOS Group Ltd. | 1,735,648 | 37,841 | |
| Ryman Healthcare Ltd. | 5,648,395 | 27,520 | |
TOTAL NEW ZEALAND | 65,361 | ||
| Norway - 3.4% | |||
| Equinor ASA | 6,785,142 | 247,208 | |
| Volue A/S (a) | 993,542 | 2,580 | |
TOTAL NORWAY | 249,788 | ||
| Singapore - 0.7% | |||
| United Overseas Bank Ltd. | 2,659,400 | 52,151 | |
| Spain - 1.7% | |||
| Aena SME SA (a)(d) | 137,292 | 16,136 | |
| Amadeus IT Holding SA Class A (a) | 1,322,173 | 68,958 | |
| Cellnex Telecom SA (d) | 579,798 | 18,977 | |
| Cie Automotive SA | 838,979 | 21,342 | |
TOTAL SPAIN | 125,413 | ||
| Sweden - 2.6% | |||
| ASSA ABLOY AB (B Shares) | 1,466,834 | 29,618 | |
| HEXPOL AB (B Shares) | 1,993,576 | 19,681 | |
| Indutrade AB | 1,841,531 | 32,248 | |
| Kry International AB (a)(e)(f) | 4,183 | 732 | |
| Lagercrantz Group AB (B Shares) | 2,987,799 | 25,640 | |
| Nibe Industrier AB (B Shares) | 1,681,987 | 13,421 | |
| Nordnet AB | 1,922,735 | 23,857 | |
| Svenska Handelsbanken AB (A Shares) | 4,774,028 | 44,356 | |
TOTAL SWEDEN | 189,553 | ||
| Switzerland - 8.7% | |||
| Lonza Group AG | 84,056 | 43,271 | |
| Nestle SA (Reg. S) | 2,654,163 | 288,930 | |
| Partners Group Holding AG | 55,229 | 49,606 | |
| Roche Holding AG (participation certificate) | 772,251 | 256,231 | |
TOTAL SWITZERLAND | 638,038 | ||
| Taiwan - 1.0% | |||
| MediaTek, Inc. | 1,624,000 | 29,707 | |
| Taiwan Semiconductor Manufacturing Co. Ltd. | 3,535,000 | 42,457 | |
TOTAL TAIWAN | 72,164 | ||
| United Kingdom - 11.1% | |||
| AstraZeneca PLC (United Kingdom) | 1,678,104 | 196,896 | |
| BAE Systems PLC | 6,459,103 | 60,416 | |
| Beazley PLC | 3,714,955 | 26,606 | |
| Big Yellow Group PLC | 2,138,254 | 27,611 | |
| Bunzl PLC | 2,416,177 | 78,720 | |
| Bytes Technology Group PLC | 867,627 | 3,574 | |
| Compass Group PLC | 5,195,771 | 109,432 | |
| Dechra Pharmaceuticals PLC | 593,129 | 17,821 | |
| Diageo PLC | 2,803,259 | 115,361 | |
| Dr. Martens Ltd. | 4,294,896 | 12,254 | |
| M&G PLC | 11,012,942 | 22,127 | |
| Reckitt Benckiser Group PLC | 1,508,742 | 100,126 | |
| Smart Metering Systems PLC | 2,899,899 | 24,343 | |
| Starling Bank Ltd. Series D (a)(e)(f) | 6,223,100 | 20,125 | |
| Zegona Communications PLC (a)(c) | 327,826 | 282 | |
TOTAL UNITED KINGDOM | 815,694 | ||
| United States of America - 0.4% | |||
| Mobileye Global, Inc. (a) | 131,300 | 3,464 | |
| NICE Ltd. sponsored ADR (a) | 153,070 | 29,066 | |
TOTAL UNITED STATES OF AMERICA | 32,530 | ||
| TOTAL COMMON STOCKS (Cost $6,428,244) | 6,907,898 | ||
| Preferred Stocks - 0.9% | |||
| Shares | Value ($) (000s) | ||
| Convertible Preferred Stocks - 0.5% | |||
| China - 0.4% | |||
| ByteDance Ltd. Series E1 (a)(e)(f) | 131,235 | 20,607 | |
| dMed Biopharmaceutical Co. Ltd. Series C (a)(e)(f) | 727,754 | 6,528 | |
| 27,135 | |||
| Estonia - 0.1% | |||
| Bolt Technology OU Series E (e)(f) | 87,239 | 10,658 | |
TOTAL CONVERTIBLE PREFERRED STOCKS | 37,793 | ||
| Nonconvertible Preferred Stocks - 0.4% | |||
| India - 0.3% | |||
| Pine Labs Private Ltd.: | |||
| Series 1 (a)(e)(f) | 20,726 | 10,400 | |
| Series A (a)(e)(f) | 5,179 | 2,599 | |
| Series B (a)(e)(f) | 5,635 | 2,828 | |
| Series B2 (a)(e)(f) | 4,558 | 2,287 | |
| Series C (a)(e)(f) | 8,478 | 4,254 | |
| Series C1 (a)(e)(f) | 1,786 | 896 | |
| Series D (a)(e)(f) | 1,910 | 958 | |
| 24,222 | |||
| Sweden - 0.1% | |||
| Kry International AB Series E (a)(e)(f) | 24,162 | 4,230 | |
TOTAL NONCONVERTIBLE PREFERRED STOCKS | 28,452 | ||
| TOTAL PREFERRED STOCKS (Cost $76,424) | 66,245 | ||
| Money Market Funds - 5.5% | |||
| Shares | Value ($) (000s) | ||
| Fidelity Cash Central Fund 3.10% (g) | 376,616,488 | 376,692 | |
| Fidelity Securities Lending Cash Central Fund 3.10% (g)(h) | 29,425,752 | 29,429 | |
| TOTAL MONEY MARKET FUNDS (Cost $406,121) | 406,121 | ||
| TOTAL INVESTMENT IN SECURITIES - 100.1% (Cost $6,910,789) | 7,380,264 |
NET OTHER ASSETS (LIABILITIES) - (0.1)% | (9,974) |
| NET ASSETS - 100.0% | 7,370,290 |
| (a) | Non-income producing |
| (b) | Security or a portion of the security is on loan at period end. |
| (c) | Affiliated company |
| (d) | Security exempt from registration under Rule 144A of the Securities Act of 1933. These securities may be resold in transactions exempt from registration, normally to qualified institutional buyers. At the end of the period, the value of these securities amounted to $244,690,000 or 3.3% of net assets. |
| (e) | Level 3 security |
| (f) | Restricted securities (including private placements) - Investment in securities not registered under the Securities Act of 1933 (excluding 144A issues). At the end of the period, the value of restricted securities (excluding 144A issues) amounted to $95,486,000 or 1.3% of net assets. |
| (g) | Affiliated fund that is generally available only to investment companies and other accounts managed by Fidelity Investments. The rate quoted is the annualized seven-day yield of the fund at period end. A complete unaudited listing of the fund's holdings as of its most recent quarter end is available upon request. In addition, each Fidelity Central Fund's financial statements, which are not covered by the Fund's Report of Independent Registered Public Accounting Firm, are available on the SEC's website or upon request. |
| (h) | Investment made with cash collateral received from securities on loan. |
| Additional information on each restricted holding is as follows: | ||
| Security | Acquisition Date | Acquisition Cost ($) (000s) |
| Bolt Technology OU Series E | 1/03/22 | 22,664 |
| ByteDance Ltd. Series E1 | 11/18/20 | 14,380 |
| Delhivery Private Ltd. | 5/20/21 | 4,983 |
| dMed Biopharmaceutical Co. Ltd. Series C | 12/01/20 | 10,336 |
| Kry International AB | 5/14/21 | 1,817 |
| Kry International AB Series E | 5/14/21 | 11,046 |
| Pine Labs Private Ltd. | 6/30/21 | 3,233 |
| Pine Labs Private Ltd. Series 1 | 6/30/21 | 7,728 |
| Pine Labs Private Ltd. Series A | 6/30/21 | 1,931 |
| Pine Labs Private Ltd. Series B | 6/30/21 | 2,101 |
| Pine Labs Private Ltd. Series B2 | 6/30/21 | 1,699 |
| Pine Labs Private Ltd. Series C | 6/30/21 | 3,161 |
| Pine Labs Private Ltd. Series C1 | 6/30/21 | 666 |
| Pine Labs Private Ltd. Series D | 6/30/21 | 712 |
| Starling Bank Ltd. Series D | 6/18/21 | 11,126 |
| Affiliate (Amounts in thousands) | Value, beginning of period ($) | Purchases ($) | Sales Proceeds ($) | Dividend Income ($) | Realized Gain (loss) ($) | Change in Unrealized appreciation (depreciation) ($) | Value, end of period ($) | % ownership, end of period |
| Fidelity Cash Central Fund 3.10% | 398,277 | 2,657,184 | 2,678,769 | 4,783 | - | - | 376,692 | 0.8% |
| Fidelity Securities Lending Cash Central Fund 3.10% | 2,886 | 1,351,661 | 1,325,118 | 1,114 | - | - | 29,429 | 0.1% |
| Total | 401,163 | 4,008,845 | 4,003,887 | 5,897 | - | - | 406,121 | |
| Affiliate (Amounts in thousands) | Value, beginning of period ($) | Purchases ($) | Sales Proceeds ($) | Dividend Income ($) | Realized Gain (loss) ($) | Change in Unrealized appreciation (depreciation) ($) | Value, end of period ($) |
| Dalata Hotel Group PLC | 56,215 | - | 6,788 | - | (4,075) | (8,929) | 36,423 |
| Iperionx Ltd. | 9,332 | 1,561 | 229 | - | (85) | (3,799) | 6,780 |
| Zegona Communications PLC | 495 | - | 12 | - | (1) | (200) | 282 |
| Total | 66,042 | 1,561 | 7,029 | - | (4,161) | (12,928) | 43,485 |
| Valuation Inputs at Reporting Date: | ||||
Description (Amounts in thousands) | Total ($) | Level 1 ($) | Level 2 ($) | Level 3 ($) |
Investments in Securities: | ||||
| Equities: | ||||
Communication Services | 108,886 | 14,211 | 94,675 | - |
Consumer Discretionary | 695,119 | 263,661 | 431,229 | 229 |
Consumer Staples | 619,909 | 115,492 | 504,417 | - |
Energy | 495,204 | 247,996 | 247,208 | - |
Financials | 1,274,968 | 657,337 | 597,506 | 20,125 |
Health Care | 1,214,317 | 569,608 | 638,181 | 6,528 |
Industrials | 1,025,740 | 633,409 | 392,331 | - |
Information Technology | 998,878 | 448,132 | 485,945 | 64,801 |
Materials | 383,447 | 172,207 | 211,240 | - |
Real Estate | 109,194 | 109,194 | - | - |
Utilities | 48,481 | - | 48,481 | - |
| Money Market Funds | 406,121 | 406,121 | - | - |
| Total Investments in Securities: | 7,380,264 | 3,637,368 | 3,651,213 | 91,683 |
| (Amounts in thousands) | |||
| Investments in Securities: | |||
| Beginning Balance | $ | 78,917 | |
| Net Realized Gain (Loss) on Investment Securities | (1,955) | ||
| Net Unrealized Gain (Loss) on Investment Securities | (9,882) | ||
| Cost of Purchases | 22,664 | ||
| Proceeds of Sales | (3,246) | ||
| Amortization/Accretion | - | ||
| Transfers into Level 3 | 10,041 | ||
| Transfers out of Level 3 | (4,856) | ||
| Ending Balance | $ | 91,683 | |
| The change in unrealized gain (loss) for the period attributable to Level 3 securities held at October 31, 2022 | $ | (9,882) | |
| The information used in the above reconciliation represents fiscal year to date activity for any Investments in Securities identified as using Level 3 inputs at either the beginning or the end of the current fiscal period. Cost of purchases and proceeds of sales may include securities received and/or delivered through in-kind transactions. Transfers into Level 3 were attributable to a lack of observable market data resulting from decreases in market activity, decreases in liquidity, security restructurings or corporate actions. Transfers out of Level 3 were attributable to observable market data becoming available for those securities. Transfers in or out of Level 3 represent the beginning value of any Security or Instrument where a change in the pricing level occurred from the beginning to the end of the period. The cost of purchases and the proceeds of sales may include securities received or delivered through corporate actions or exchanges. Realized and unrealized gains (losses) disclosed in the reconciliation are included in Net Gain (Loss) on the Fund's Statement of Operations. | |||
| Statement of Assets and Liabilities | ||||
| Amounts in thousands (except per-share amounts) | October 31, 2022 | |||
| Assets | ||||
| Investment in securities, at value (including securities loaned of $27,909) - See accompanying schedule: | ||||
Unaffiliated issuers (cost $6,438,559) | $6,930,658 | |||
Fidelity Central Funds (cost $406,121) | 406,121 | |||
Other affiliated issuers (cost $66,109) | 43,485 | |||
| Total Investment in Securities (cost $6,910,789) | $ | 7,380,264 | ||
| Foreign currency held at value (cost $501) | 501 | |||
| Receivable for fund shares sold | 2,489 | |||
| Dividends receivable | 10,680 | |||
| Reclaims receivable | 26,327 | |||
| Distributions receivable from Fidelity Central Funds | 1,170 | |||
| Prepaid expenses | 12 | |||
| Other receivables | 3,394 | |||
Total assets | 7,424,837 | |||
| Liabilities | ||||
| Payable for investments purchased | $8,409 | |||
| Payable for fund shares redeemed | 5,410 | |||
| Accrued management fee | 4,685 | |||
| Distribution and service plan fees payable | 38 | |||
| Other affiliated payables | 798 | |||
| Other payables and accrued expenses | 5,778 | |||
| Collateral on securities loaned | 29,429 | |||
| Total Liabilities | 54,547 | |||
| Net Assets | $ | 7,370,290 | ||
| Net Assets consist of: | ||||
| Paid in capital | $ | 7,348,313 | ||
| Total accumulated earnings (loss) | 21,977 | |||
| Net Assets | $ | 7,370,290 | ||
| Net Asset Value and Maximum Offering Price | ||||
| Class A : | ||||
Net Asset Value and redemption price per share ($130,702 ÷ 3,564 shares) (a)(b) | $ | 36.68 | ||
| Maximum offering price per share (100/94.25 of $36.68) | $ | 38.92 | ||
| Class M : | ||||
Net Asset Value and redemption price per share ($16,100 ÷ 443 shares) (a)(b) | $ | 36.38 | ||
| Maximum offering price per share (100/96.50 of $36.38) | $ | 37.70 | ||
| Class C : | ||||
Net Asset Value and offering price per share ($5,429 ÷ 151 shares) (a)(b) | $ | 35.96 | ||
| International Discovery : | ||||
Net Asset Value , offering price and redemption price per share ($3,385,800 ÷ 91,400 shares) | $ | 37.04 | ||
| Class K : | ||||
Net Asset Value , offering price and redemption price per share ($602,552 ÷ 16,315 shares) | $ | 36.93 | ||
| Class I : | ||||
Net Asset Value , offering price and redemption price per share ($509,367 ÷ 13,803 shares) | $ | 36.90 | ||
| Class Z : | ||||
Net Asset Value , offering price and redemption price per share ($2,720,340 ÷ 73,754 shares) | $ | 36.88 | ||
(a)Redemption price per share is equal to net asset value less any applicable contingent deferred sales charge. | ||||
(b)Corresponding Net Asset Value does not calculate due to rounding of fractional net assets and/or units | ||||
| Statement of Operations | ||||
| Amounts in thousands | Year ended October 31, 2022 | |||
| Investment Income | ||||
| Dividends | $ | 220,586 | ||
| Non-Cash dividends | 35,774 | |||
| Interest | 16 | |||
| Income from Fidelity Central Funds (including $1,114 from security lending) | 5,897 | |||
| Income before foreign taxes withheld | 262,273 | |||
| Less foreign taxes withheld | (26,452) | |||
| Total Income | 235,821 | |||
| Expenses | ||||
| Management fee | ||||
| Basic fee | $ | 59,526 | ||
| Performance adjustment | 13,310 | |||
| Transfer agent fees | 9,126 | |||
| Distribution and service plan fees | 585 | |||
| Accounting fees | 1,707 | |||
| Custodian fees and expenses | 890 | |||
| Independent trustees' fees and expenses | 32 | |||
| Registration fees | 268 | |||
| Audit | 162 | |||
| Legal | 11 | |||
| Miscellaneous | 43 | |||
| Total expenses before reductions | 85,660 | |||
| Expense reductions | (299) | |||
| Total expenses after reductions | 85,361 | |||
| Net Investment income (loss) | 150,460 | |||
| Realized and Unrealized Gain (Loss) | ||||
| Net realized gain (loss) on: | ||||
| Investment Securities: | ||||
| Unaffiliated issuers(net of foreign taxes of $2) | (296,433) | |||
| Affiliated issuers | (4,161) | |||
| Foreign currency transactions | (4,111) | |||
| Total net realized gain (loss) | (304,705) | |||
| Change in net unrealized appreciation (depreciation) on: | ||||
| Investment Securities: | ||||
| Unaffiliated issuers (net of decrease in deferred foreign taxes of $4,997) | (3,188,370) | |||
| Affiliated issuers | (12,928) | |||
| Assets and liabilities in foreign currencies | (3,867) | |||
| Total change in net unrealized appreciation (depreciation) | (3,205,165) | |||
| Net gain (loss) | (3,509,870) | |||
| Net increase (decrease) in net assets resulting from operations | $ | (3,359,410) | ||
| Statement of Changes in Net Assets | ||||
| Amount in thousands | Year ended October 31, 2022 | Year ended October 31, 2021 | ||
| Increase (Decrease) in Net Assets | ||||
| Operations | ||||
| Net investment income (loss) | $ | 150,460 | $ | 70,896 |
| Net realized gain (loss) | (304,705) | 1,053,318 | ||
| Change in net unrealized appreciation (depreciation) | (3,205,165) | 1,775,523 | ||
| Net increase (decrease) in net assets resulting from operations | (3,359,410) | 2,899,737 | ||
| Distributions to shareholders | (1,127,528) | (373,978) | ||
| Share transactions - net increase (decrease) | 588,890 | (89,410) | ||
| Total increase (decrease) in net assets | (3,898,048) | 2,436,349 | ||
| Net Assets | ||||
| Beginning of period | 11,268,338 | 8,831,989 | ||
| End of period | $ | 7,370,290 | $ | 11,268,338 |
| Fidelity Advisor® International Discovery Fund Class A |
| Years ended October 31, | 2022 | 2021 | 2020 | 2019 | 2018 | |||||
Selected Per-Share Data | ||||||||||
| Net asset value, beginning of period | $ | 58.79 | $ | 45.84 | $ | 43.31 | $ | 39.99 | $ | 46.66 |
| Income from Investment Operations | ||||||||||
Net investment income (loss) A,B | .56 C | .18 | .16 | .63 D | .37 | |||||
| Net realized and unrealized gain (loss) | (16.91) | 14.60 | 3.27 | 3.93 | (4.87) | |||||
| Total from investment operations | (16.35) | 14.78 | 3.43 | 4.56 | (4.50) | |||||
| Distributions from net investment income | (1.38) | (.12) | (.62) | (.33) | (.34) | |||||
| Distributions from net realized gain | (4.38) | (1.71) | (.28) | (.91) | (1.83) | |||||
| Total distributions | (5.76) | (1.83) | (.90) | (1.24) | (2.17) | |||||
| Net asset value, end of period | $ | 36.68 | $ | 58.79 | $ | 45.84 | $ | 43.31 | $ | 39.99 |
Total Return E,F | (30.57)% | 32.86% | 8.02% | 11.90% | (10.11)% | |||||
Ratios to Average Net Assets B,G,H | ||||||||||
| Expenses before reductions | 1.31% | 1.32% | 1.36% | 1.12% | 1.22% | |||||
| Expenses net of fee waivers, if any | 1.30% | 1.32% | 1.36% | 1.12% | 1.22% | |||||
| Expenses net of all reductions | 1.30% | 1.32% | 1.36% | 1.11% | 1.21% | |||||
| Net investment income (loss) | 1.27% C | .32% | .38% | 1.57% D | .83% | |||||
| Supplemental Data | ||||||||||
| Net assets, end of period (in millions) | $ | 131 | $ | 206 | $ | 173 | $ | 185 | $ | 191 |
Portfolio turnover rate I | 43% J | 41% J | 34% J | 70% J | 45% J |
| Fidelity Advisor® International Discovery Fund Class M |
| Years ended October 31, | 2022 | 2021 | 2020 | 2019 | 2018 | |||||
Selected Per-Share Data | ||||||||||
| Net asset value, beginning of period | $ | 58.35 | $ | 45.53 | $ | 43.01 | $ | 39.71 | $ | 46.35 |
| Income from Investment Operations | ||||||||||
Net investment income (loss) A,B | .45 C | .04 | .06 | .53 D | .27 | |||||
| Net realized and unrealized gain (loss) | (16.81) | 14.51 | 3.24 | 3.91 | (4.84) | |||||
| Total from investment operations | (16.36) | 14.55 | 3.30 | 4.44 | (4.57) | |||||
| Distributions from net investment income | (1.23) | (.02) | (.51) | (.22) | (.24) | |||||
| Distributions from net realized gain | (4.38) | (1.71) | (.28) | (.91) | (1.83) | |||||
| Total distributions | (5.61) | (1.73) | (.78) E | (1.14) E | (2.07) | |||||
| Net asset value, end of period | $ | 36.38 | $ | 58.35 | $ | 45.53 | $ | 43.01 | $ | 39.71 |
Total Return F,G | (30.76)% | 32.53% | 7.77% | 11.62% | (10.31)% | |||||
Ratios to Average Net Assets B,H,I | ||||||||||
| Expenses before reductions | 1.55% | 1.57% | 1.61% | 1.37% | 1.46% | |||||
| Expenses net of fee waivers, if any | 1.55% | 1.57% | 1.61% | 1.37% | 1.46% | |||||
| Expenses net of all reductions | 1.55% | 1.57% | 1.60% | 1.35% | 1.45% | |||||
| Net investment income (loss) | 1.02% C | .07% | .13% | 1.32% D | .59% | |||||
| Supplemental Data | ||||||||||
| Net assets, end of period (in millions) | $ | 16 | $ | 25 | $ | 21 | $ | 24 | $ | 28 |
Portfolio turnover rate J | 43% K | 41% K | 34% K | 70% K | 45% K |
| Fidelity Advisor® International Discovery Fund Class C |
| Years ended October 31, | 2022 | 2021 | 2020 | 2019 | 2018 | |||||
Selected Per-Share Data | ||||||||||
| Net asset value, beginning of period | $ | 57.59 | $ | 45.18 | $ | 42.60 | $ | 39.32 | $ | 45.94 |
| Income from Investment Operations | ||||||||||
Net investment income (loss) A,B | .21 C | (.27) | (.18) | .31 D | .02 | |||||
| Net realized and unrealized gain (loss) | (16.66) | 14.38 | 3.22 | 3.88 | (4.79) | |||||
| Total from investment operations | (16.45) | 14.11 | 3.04 | 4.19 | (4.77) | |||||
| Distributions from net investment income | (.80) | - | (.19) | - | (.02) | |||||
| Distributions from net realized gain | (4.38) | (1.70) | (.28) | (.91) | (1.83) | |||||
| Total distributions | (5.18) | (1.70) | (.46) E | (.91) | (1.85) | |||||
| Net asset value, end of period | $ | 35.96 | $ | 57.59 | $ | 45.18 | $ | 42.60 | $ | 39.32 |
Total Return F,G | (31.14)% | 31.79% | 7.19% | 11.02% | (10.80)% | |||||
Ratios to Average Net Assets B,H,I | ||||||||||
| Expenses before reductions | 2.10% | 2.14% | 2.16% | 1.91% | 2.00% | |||||
| Expenses net of fee waivers, if any | 2.10% | 2.13% | 2.15% | 1.91% | 2.00% | |||||
| Expenses net of all reductions | 2.10% | 2.13% | 2.15% | 1.90% | 1.99% | |||||
| Net investment income (loss) | .48% C | (.50)% | (.41)% | .78% D | .05% | |||||
| Supplemental Data | ||||||||||
| Net assets, end of period (in millions) | $ | 5 | $ | 10 | $ | 11 | $ | 12 | $ | 22 |
Portfolio turnover rate J | 43% K | 41% K | 34% K | 70% K | 45% K |
| Fidelity® International Discovery Fund |
| Years ended October 31, | 2022 | 2021 | 2020 | 2019 | 2018 | |||||
Selected Per-Share Data | ||||||||||
| Net asset value, beginning of period | $ | 59.31 | $ | 46.20 | $ | 43.65 | $ | 40.32 | $ | 47.04 |
| Income from Investment Operations | ||||||||||
Net investment income (loss) A,B | .72 C | .36 | .32 | .78 D | .53 | |||||
| Net realized and unrealized gain (loss) | (17.07) | 14.71 | 3.29 | 3.95 | (4.92) | |||||
| Total from investment operations | (16.35) | 15.07 | 3.61 | 4.73 | (4.39) | |||||
| Distributions from net investment income | (1.54) | (.25) | (.78) | (.49) | (.50) | |||||
| Distributions from net realized gain | (4.38) | (1.71) | (.28) | (.91) | (1.83) | |||||
| Total distributions | (5.92) | (1.96) | (1.06) | (1.40) | (2.33) | |||||
| Net asset value, end of period | $ | 37.04 | $ | 59.31 | $ | 46.20 | $ | 43.65 | $ | 40.32 |
Total Return E | (30.36)% | 33.29% | 8.39% | 12.31% | (9.81)% | |||||
Ratios to Average Net Assets B,F,G | ||||||||||
| Expenses before reductions | .98% | .99% | 1.02% | .78% | .88% | |||||
| Expenses net of fee waivers, if any | .97% | .99% | 1.02% | .78% | .88% | |||||
| Expenses net of all reductions | .97% | .99% | 1.01% | .76% | .87% | |||||
| Net investment income (loss) | 1.60% C | .65% | .72% | 1.92% D | 1.17% | |||||
| Supplemental Data | ||||||||||
| Net assets, end of period (in millions) | $ | 3,386 | $ | 5,117 | $ | 6,784 | $ | 6,726 | $ | 6,515 |
Portfolio turnover rate H | 43% I | 41% I | 34% I | 70% I | 45% I |
| Fidelity® International Discovery Fund Class K |
| Years ended October 31, | 2022 | 2021 | 2020 | 2019 | 2018 | |||||
Selected Per-Share Data | ||||||||||
| Net asset value, beginning of period | $ | 59.18 | $ | 46.10 | $ | 43.55 | $ | 40.25 | $ | 46.96 |
| Income from Investment Operations | ||||||||||
Net investment income (loss) A,B | .78 C | .41 | .36 | .82 D | .58 | |||||
| Net realized and unrealized gain (loss) | (17.02) | 14.67 | 3.29 | 3.93 | (4.90) | |||||
| Total from investment operations | (16.24) | 15.08 | 3.65 | 4.75 | (4.32) | |||||
| Distributions from net investment income | (1.62) | (.29) | (.82) | (.54) | (.55) | |||||
| Distributions from net realized gain | (4.38) | (1.71) | (.28) | (.91) | (1.83) | |||||
| Total distributions | (6.01) E | (2.00) | (1.10) | (1.45) | (2.39) E | |||||
| Net asset value, end of period | $ | 36.93 | $ | 59.18 | $ | 46.10 | $ | 43.55 | $ | 40.25 |
Total Return F | (30.28)% | 33.40% | 8.52% | 12.41% | (9.70)% | |||||
Ratios to Average Net Assets B,G,H | ||||||||||
| Expenses before reductions | .87% | .90% | .91% | .66% | .77% | |||||
| Expenses net of fee waivers, if any | .87% | .90% | .91% | .66% | .77% | |||||
| Expenses net of all reductions | .87% | .90% | .91% | .65% | .76% | |||||
| Net investment income (loss) | 1.71% C | .74% | .83% | 2.03% D | 1.29% | |||||
| Supplemental Data | ||||||||||
| Net assets, end of period (in millions) | $ | 603 | $ | 1,371 | $ | 1,401 | $ | 1,566 | $ | 2,064 |
Portfolio turnover rate I | 43% J | 41% J | 34% J | 70% J | 45% J |
| Fidelity Advisor® International Discovery Fund Class I |
| Years ended October 31, | 2022 | 2021 | 2020 | 2019 | 2018 | |||||
Selected Per-Share Data | ||||||||||
| Net asset value, beginning of period | $ | 59.15 | $ | 46.08 | $ | 43.53 | $ | 40.22 | $ | 46.92 |
| Income from Investment Operations | ||||||||||
Net investment income (loss) A,B | .69 C | .35 | .31 | .77 D | .52 | |||||
| Net realized and unrealized gain (loss) | (16.99) | 14.67 | 3.28 | 3.93 | (4.90) | |||||
| Total from investment operations | (16.30) | 15.02 | 3.59 | 4.70 | (4.38) | |||||
| Distributions from net investment income | (1.57) | (.24) | (.76) | (.48) | (.49) | |||||
| Distributions from net realized gain | (4.38) | (1.71) | (.28) | (.91) | (1.83) | |||||
| Total distributions | (5.95) | (1.95) | (1.04) | (1.39) | (2.32) | |||||
| Net asset value, end of period | $ | 36.90 | $ | 59.15 | $ | 46.08 | $ | 43.53 | $ | 40.22 |
Total Return E | (30.37)% | 33.26% | 8.37% | 12.26% | (9.81)% | |||||
Ratios to Average Net Assets B,F,G | ||||||||||
| Expenses before reductions | .99% | 1.02% | 1.04% | .80% | .91% | |||||
| Expenses net of fee waivers, if any | .99% | 1.02% | 1.04% | .80% | .91% | |||||
| Expenses net of all reductions | .99% | 1.02% | 1.03% | .79% | .90% | |||||
| Net investment income (loss) | 1.59% C | .62% | .70% | 1.89% D | 1.15% | |||||
| Supplemental Data | ||||||||||
| Net assets, end of period (in millions) | $ | 509 | $ | 566 | $ | 388 | $ | 463 | $ | 579 |
Portfolio turnover rate H | 43% I | 41% I | 34% I | 70% I | 45% I |
| Fidelity Advisor® International Discovery Fund Class Z |
| Years ended October 31, | 2022 | 2021 | 2020 | 2019 | 2018 | |||||
Selected Per-Share Data | ||||||||||
| Net asset value, beginning of period | $ | 59.14 | $ | 46.07 | $ | 43.52 | $ | 40.22 | $ | 46.92 |
| Income from Investment Operations | ||||||||||
Net investment income (loss) A,B | .76 C | .43 | .36 | .82 D | .58 | |||||
| Net realized and unrealized gain (loss) | (16.99) | 14.64 | 3.29 | 3.94 | (4.89) | |||||
| Total from investment operations | (16.23) | 15.07 | 3.65 | 4.76 | (4.31) | |||||
| Distributions from net investment income | (1.65) | (.29) | (.82) | (.54) | (.56) | |||||
| Distributions from net realized gain | (4.38) | (1.71) | (.28) | (.91) | (1.83) | |||||
| Total distributions | (6.03) | (2.00) | (1.10) | (1.46) E | (2.39) | |||||
| Net asset value, end of period | $ | 36.88 | $ | 59.14 | $ | 46.07 | $ | 43.52 | $ | 40.22 |
Total Return F | (30.29)% | 33.40% | 8.53% | 12.42% | (9.68)% | |||||
Ratios to Average Net Assets B,G,H | ||||||||||
| Expenses before reductions | .87% | .90% | .91% | .66% | .77% | |||||
| Expenses net of fee waivers, if any | .87% | .90% | .91% | .66% | .77% | |||||
| Expenses net of all reductions | .87% | .90% | .91% | .65% | .76% | |||||
| Net investment income (loss) | 1.71% C | .74% | .83% | 2.03% D | 1.29% | |||||
| Supplemental Data | ||||||||||
| Net assets, end of period (in millions) | $ | 2,720 | $ | 3,972 | $ | 54 | $ | 82 | $ | 118 |
Portfolio turnover rate I | 43% J | 41% J | 34% J | 70% J | 45% J |
| Fidelity Central Fund | Investment Manager | Investment Objective | Investment Practices | Expense Ratio A |
| Fidelity Money Market Central Funds | Fidelity Management & Research Company LLC (FMR) | Each fund seeks to obtain a high level of current income consistent with the preservation of capital and liquidity. | Short-term Investments | Less than .005% |
| Asset Type | Fair Value | Valuation Technique(s) | Unobservable Input | Amount or Range/Weighted Average | Impact to Valuation from an Increase in Input A |
| Equities | $91,683 | Market comparable | Enterprise value/Revenue multiple (EV/R) | 2.0 - 19.0 / 10.3 | Increase |
| Enterprise value/Net income multiple (EV/NI) | 14.0 | Increase | |||
| Market approach | Discount rate | 49.5% - 50.0% / 49.5% | Decrease | ||
| Transaction price | $17.75 | Increase |
| Fidelity International Discovery Fund | $356 |
| Gross unrealized appreciation | $1,228,182 |
| Gross unrealized depreciation | (833,219) |
| Net unrealized appreciation (depreciation) | $394,963 |
| Tax Cost | $6,985,301 |
| Undistributed ordinary income | $26,681 |
| Capital loss carryforward | $(389,025) |
| Net unrealized appreciation (depreciation) on securities and other investments | $389,769 |
Short-term | $(389,025) |
| October 31, 2022 | October 31, 2022 | |
| Ordinary Income | $382,080 | $49,750 |
| Long-term Capital Gains | 745,448 | 324,228 |
| Total | $1,127,528 | $373,978 |
| Purchases ($) | Sales ($) | |
| Fidelity International Discovery Fund | 3,786,372 | 3,865,224 |
| Shares | Total net realized gain or loss ($) | Total Proceeds ($) | Participating classes | |
| Fidelity International Discovery Fund | 5,635 | 85,105 | 263,151 | International Discovery and Class K |
| Shares | Total net realized gain or loss ($) | Total Proceeds ($) | Participating classes | |
| Fidelity International Discovery Fund | 5,142 | 121,741 | 296,500 | International Discovery and Class K |
| Distribution Fee | Service Fee | Total Fees | Retained by FDC | |
| Class A | - % | .25% | $410 | $1 |
| Class M | .25% | .25% | 100 | - |
| Class C | .75% | .25% | 75 | 5 |
| $585 | $6 |
| Retained by FDC | |
| Class A | $10 |
| Class M | 1 |
| $11 |
| Amount | % of Class-Level Average Net Assets | |
| Class A | $371 | .23 |
| Class M | 45 | .22 |
| Class C | 20 | .27 |
| International Discovery | 6,047 | .15 |
| Class K | 363 | .04 |
| Class I | 922 | .16 |
| Class Z | 1,358 | .04 |
| $9,126 |
| % of Average Net Assets | |
| Fidelity International Discovery Fund | .02 |
| Amount | |
| Fidelity International Discovery Fund | $3 |
| Purchases ($) | Sales ($) | Realized Gain (Loss) ($) | |
| Fidelity International Discovery Fund | 68,209 | 102,201 | (30,159) |
| Amount ($) | |
| Fidelity International Discovery Fund | 21 |
| Amount | |
| Fidelity International Discovery Fund | $16 |
| Total Security Lending Fees Paid to NFS | Security Lending Income From Securities Loaned to NFS | Value of Securities Loaned to NFS at Period End | |
| Fidelity International Discovery Fund | $114 | $- | $- |
Year ended October 31, 2022 | Year ended October 31, 2021 | |
| Fidelity International Discovery Fund | ||
| Distributions to shareholders | ||
| Class A | $20,037 | $6,843 |
| Class M | 2,384 | 802 |
| Class C | 909 | 398 |
| International Discovery | 509,968 | 286,406 |
| Class K | 134,333 | 61,075 |
| Class I | 53,775 | 16,153 |
| Class Z | 406,122 | 2,301 |
Total | $1,127,528 | $373,978 |
| Shares | Shares | Dollars | Dollars | |
| Year ended October 31, 2022 | Year ended October 31, 2021 | Year ended October 31, 2022 | Year ended October 31, 2021 | |
| Fidelity International Discovery Fund | ||||
| Class A | ||||
| Shares sold | 268 | 238 | $11,889 | $13,197 |
| Reinvestment of distributions | 387 | 133 | 19,790 | 6,770 |
| Shares redeemed | (597) | (634) | (26,398) | (35,444) |
| Net increase (decrease) | 58 | (263) | $5,281 | $(15,477) |
| Class M | ||||
| Shares sold | 22 | 17 | $962 | $947 |
| Reinvestment of distributions | 47 | 16 | 2,368 | 797 |
| Shares redeemed | (58) | (70) | (2,608) | (3,858) |
| Net increase (decrease) | 11 | (37) | $722 | $(2,114) |
| Class C | ||||
| Shares sold | 12 | 29 | $599 | $1,540 |
| Reinvestment of distributions | 18 | 8 | 888 | 392 |
| Shares redeemed | (57) | (96) | (2,536) | (5,269) |
| Net increase (decrease) | (27) | (59) | $(1,049) | $(3,337) |
| International Discovery | ||||
| Shares sold | 7,204 | 12,516 | $327,014 | $714,365 |
| Reinvestment of distributions | 9,116 | 5,339 | 469,882 | 273,648 |
| Shares redeemed | (11,205) | (78,418) | (499,877) | (4,595,438) |
| Net increase (decrease) | 5,115 | (60,563) | $297,019 | $(3,607,425) |
| Class K | ||||
| Shares sold | 2,511 | 5,378 | $114,979 | $296,062 |
| Reinvestment of distributions | 2,616 | 1,195 | 134,333 | 61,075 |
| Shares redeemed | (11,983) | (13,782) | (555,470) | (776,307) |
| Net increase (decrease) | (6,856) | (7,209) | $(306,158) | $(419,170) |
| Class I | ||||
| Shares sold | 34,479 | 2,483 | $1,453,949 | $143,258 |
| Reinvestment of distributions | 298 | 94 | 15,297 | 4,805 |
| Shares redeemed | (30,537) | (1,442) | (1,266,702) | (80,483) |
| Net increase (decrease) | 4,240 | 1,135 | $202,544 | $67,580 |
| Class Z | ||||
| Shares sold | 3,672 | 66,388 | $187,806 | $3,911,924 |
| Reinvestment of distributions | 7,866 | 36 | 403,304 | 1,857 |
| Shares redeemed | (4,955) | (424) | (200,579) | (23,248) |
| Net increase (decrease) | 6,583 | 66,000 | $390,531 | $3,890,533 |
| Strategic Advisers Fidelity International Fund | Strategic Advisers International Fund | |
| Fidelity International Discovery Fund | 26% | 10% |
| Fund | % of shares held |
| Fidelity International Discovery Fund | 39% |
| The Example is based on an investment of $1,000 invested at the beginning of the period and held for the entire period (May 1, 2022 to October 31, 2022). |
Annualized Expense Ratio- A | Beginning Account Value May 1, 2022 | Ending Account Value October 31, 2022 | Expenses Paid During Period- C May 1, 2022 to October 31, 2022 | |||||||
| Fidelity® International Discovery Fund | ||||||||||
| Class A | 1.27% | |||||||||
| Actual | $ 1,000 | $ 864.30 | $ 5.97 | |||||||
Hypothetical- B | $ 1,000 | $ 1,018.80 | $ 6.46 | |||||||
| Class M | 1.52% | |||||||||
| Actual | $ 1,000 | $ 863.10 | $ 7.14 | |||||||
Hypothetical- B | $ 1,000 | $ 1,017.54 | $ 7.73 | |||||||
| Class C | 2.03% | |||||||||
| Actual | $ 1,000 | $ 860.70 | $ 9.52 | |||||||
Hypothetical- B | $ 1,000 | $ 1,014.97 | $ 10.31 | |||||||
| Fidelity® International Discovery Fund | .93% | |||||||||
| Actual | $ 1,000 | $ 865.60 | $ 4.37 | |||||||
Hypothetical- B | $ 1,000 | $ 1,020.52 | $ 4.74 | |||||||
| Class K | .81% | |||||||||
| Actual | $ 1,000 | $ 866.10 | $ 3.81 | |||||||
Hypothetical- B | $ 1,000 | $ 1,021.12 | $ 4.13 | |||||||
| Class I | .95% | |||||||||
| Actual | $ 1,000 | $ 865.60 | $ 4.47 | |||||||
Hypothetical- B | $ 1,000 | $ 1,020.42 | $ 4.84 | |||||||
| Class Z | .82% | |||||||||
| Actual | $ 1,000 | $ 865.90 | $ 3.86 | |||||||
Hypothetical- B | $ 1,000 | $ 1,021.07 | $ 4.18 | |||||||
| Pay Date | Income | Taxes | |
| Fidelity International Discovery Fund | |||
| Class A | 12/06/2021 | 1.5870 | 0.1105 |
| Class M | 12/06/2021 | 1.4547 | 0.1105 |
| Class C | 12/06/2021 | 1.0696 | 0.1105 |
| International Discovery | 12/06/2021 | 1.7301 | 0.1105 |
| Class K | 12/06/2021 | 1.8093 | 0.1105 |
| Class I | 12/06/2021 | 1.7607 | 0.1105 |
| Class Z | 12/06/2021 | 1.8300 | 0.1105 |
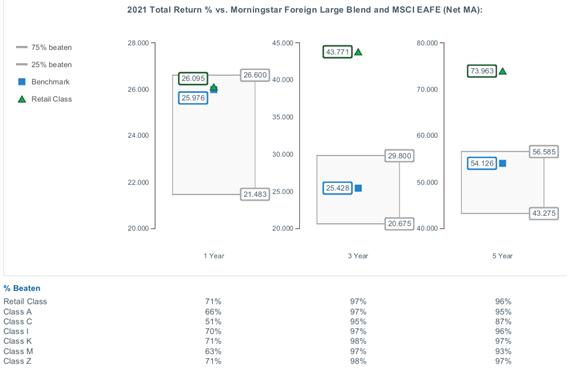
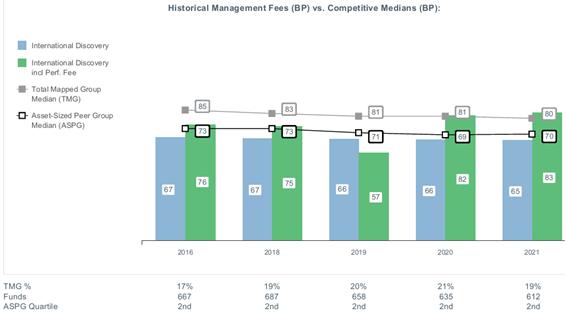
|


Contents
Board Approval of Investment Advisory Contracts and Management Fees |
| Average Annual Total Returns | |||
Periods ended October 31, 2022 | Past 1 year | Life of Fund A |
| Fidelity® Series Overseas Fund | -28.66% | 1.64% |
| $10,000 Over Life of Fund |
Let's say hypothetically that $10,000 was invested in Fidelity® Series Overseas Fund, on June 21, 2019, when the fund started. The chart shows how the value of your investment would have changed, and also shows how the MSCI EAFE Index performed over the same period. |
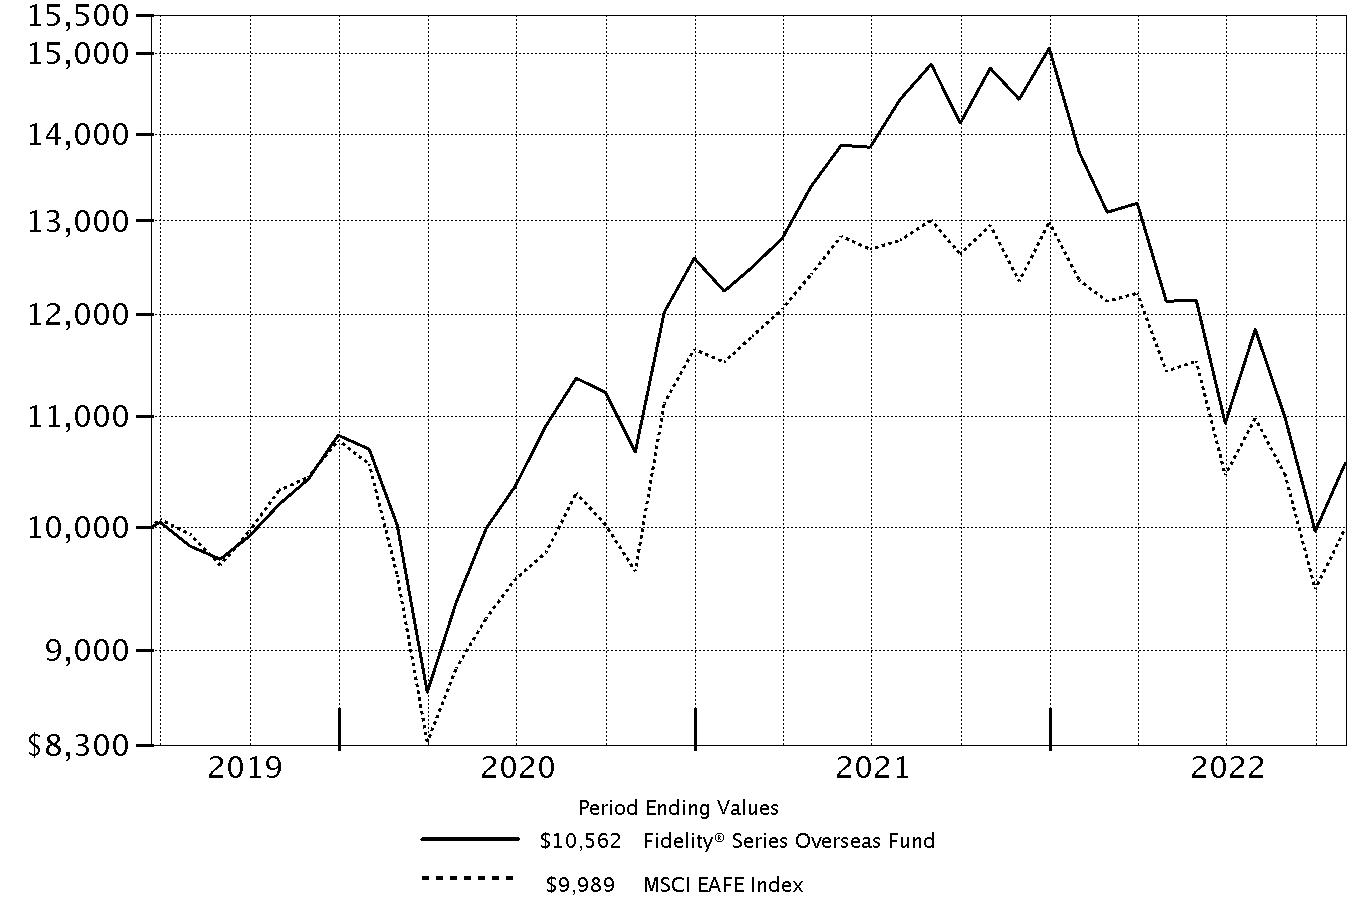 |
Top Holdings (% of Fund's net assets) | ||
| Nestle SA (Reg. S) (Switzerland, Food Products) | 3.7 | |
| Roche Holding AG (participation certificate) (Switzerland, Pharmaceuticals) | 3.0 | |
| LVMH Moet Hennessy Louis Vuitton SE (France, Textiles, Apparel & Luxury Goods) | 2.9 | |
| ASML Holding NV (Netherlands) (Netherlands, Semiconductors & Semiconductor Equipment) | 2.7 | |
| TotalEnergies SE (France, Oil, Gas & Consumable Fuels) | 2.6 | |
| Diageo PLC (United Kingdom, Beverages) | 2.2 | |
| Wolters Kluwer NV (Netherlands, Professional Services) | 1.9 | |
| Compass Group PLC (United Kingdom, Hotels, Restaurants & Leisure) | 1.8 | |
| RELX PLC (London Stock Exchange) (United Kingdom, Professional Services) | 1.7 | |
| AIA Group Ltd. (Hong Kong, Insurance) | 1.7 | |
| 24.2 | ||
| Market Sectors (% of Fund's net assets) | ||
| Industrials | 21.0 | |
| Financials | 20.9 | |
| Health Care | 15.1 | |
| Information Technology | 14.0 | |
| Consumer Discretionary | 9.7 | |
| Consumer Staples | 7.4 | |
| Materials | 4.4 | |
| Energy | 2.6 | |
| Real Estate | 1.3 | |
| Communication Services | 0.4 | |
Asset Allocation (% of Fund's net assets) |
 |
Foreign investments - 89.6% |
Geographic Diversification (% of Fund's net assets) |
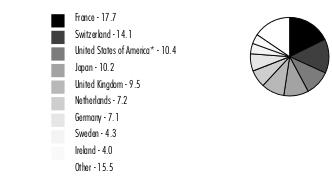 |
* Includes Short-Term investments and Net Other Assets (Liabilities). Percentages are based on country or territory of incorporation and are adjusted for the effect of futures contracts, if applicable. |
| Common Stocks - 96.7% | |||
| Shares | Value ($) | ||
| Bailiwick of Jersey - 2.2% | |||
| Experian PLC | 3,852,500 | 122,838,026 | |
| Ferguson PLC | 1,339,200 | 146,054,062 | |
TOTAL BAILIWICK OF JERSEY | 268,892,088 | ||
| Belgium - 0.9% | |||
| Azelis Group NV | 1,088,943 | 24,923,586 | |
| KBC Group NV | 1,647,365 | 82,558,947 | |
TOTAL BELGIUM | 107,482,533 | ||
| Bermuda - 0.4% | |||
| Hiscox Ltd. | 4,769,572 | 49,183,949 | |
| Canada - 1.6% | |||
| Constellation Software, Inc. | 127,970 | 185,038,223 | |
| Topicus.Com, Inc. (a) | 193,877 | 10,061,367 | |
TOTAL CANADA | 195,099,590 | ||
| Denmark - 1.5% | |||
| DSV A/S | 1,401,631 | 189,754,008 | |
| Finland - 1.0% | |||
| Nordea Bank ABP | 13,444,800 | 128,491,042 | |
| France - 17.7% | |||
| Air Liquide SA | 1,255,660 | 164,257,611 | |
| ALTEN | 959,300 | 112,151,739 | |
| Antin Infrastructure Partners SA | 354,600 | 7,716,545 | |
| BNP Paribas SA | 2,650,500 | 124,292,337 | |
| Capgemini SA | 1,125,162 | 184,403,756 | |
| Edenred SA | 3,737,227 | 191,904,626 | |
| EssilorLuxottica SA (b) | 1,161,316 | 184,028,971 | |
| LVMH Moet Hennessy Louis Vuitton SE | 575,739 | 363,288,370 | |
| Pernod Ricard SA | 1,025,800 | 180,142,816 | |
| Safran SA | 1,520,600 | 169,349,201 | |
| Teleperformance | 676,028 | 181,251,372 | |
| TotalEnergies SE (b) | 5,826,479 | 317,854,047 | |
TOTAL FRANCE | 2,180,641,391 | ||
| Germany - 7.1% | |||
| Allianz SE | 831,633 | 149,614,532 | |
| Brenntag SE | 1,450,800 | 88,029,256 | |
| Deutsche Borse AG | 1,042,160 | 169,475,817 | |
| Hannover Reuck SE | 902,116 | 146,921,860 | |
| Merck KGaA | 1,148,600 | 187,181,763 | |
| Siemens Healthineers AG (c) | 2,864,300 | 131,220,973 | |
TOTAL GERMANY | 872,444,201 | ||
| Hong Kong - 1.7% | |||
| AIA Group Ltd. | 27,329,788 | 207,017,516 | |
| Chervon Holdings Ltd. | 1,030,100 | 3,471,001 | |
TOTAL HONG KONG | 210,488,517 | ||
| India - 1.2% | |||
| HDFC Bank Ltd. (a) | 8,075,800 | 146,558,882 | |
| Ireland - 4.0% | |||
| Flutter Entertainment PLC (a) | 575,402 | 76,413,063 | |
| ICON PLC (a) | 604,200 | 119,534,928 | |
| Kingspan Group PLC (Ireland) | 2,008,300 | 101,418,297 | |
| Linde PLC | 656,500 | 195,210,275 | |
TOTAL IRELAND | 492,576,563 | ||
| Italy - 2.5% | |||
| FinecoBank SpA | 8,807,985 | 118,729,260 | |
| GVS SpA (a)(c) | 884,038 | 4,534,246 | |
| Moncler SpA | 1,675,300 | 72,333,829 | |
| Recordati SpA | 3,120,839 | 117,290,953 | |
TOTAL ITALY | 312,888,288 | ||
| Japan - 10.2% | |||
| BayCurrent Consulting, Inc. | 1,119,400 | 31,542,997 | |
| Capcom Co. Ltd. | 1,835,600 | 51,168,916 | |
| FUJIFILM Holdings Corp. | 2,067,100 | 94,795,083 | |
| Hoya Corp. | 1,948,107 | 181,781,396 | |
| Misumi Group, Inc. | 2,712,161 | 58,002,434 | |
| Olympus Corp. | 7,342,192 | 155,045,448 | |
| Persol Holdings Co. Ltd. | 4,040,153 | 81,131,826 | |
| Relo Group, Inc. | 3,292,628 | 46,545,641 | |
| SMC Corp. | 268,421 | 107,744,799 | |
| Sony Group Corp. | 2,738,100 | 184,642,845 | |
| Suzuki Motor Corp. | 2,722,245 | 91,904,031 | |
| TIS, Inc. | 2,921,700 | 78,890,518 | |
| Tokyo Electron Ltd. | 351,400 | 92,452,151 | |
TOTAL JAPAN | 1,255,648,085 | ||
| Luxembourg - 0.9% | |||
| Eurofins Scientific SA | 1,723,100 | 110,310,855 | |
| Netherlands - 7.2% | |||
| ASM International NV (Netherlands) | 423,100 | 93,995,304 | |
| ASML Holding NV (Netherlands) | 706,228 | 331,282,489 | |
| Euronext NV (c) | 1,197,860 | 76,117,385 | |
| IMCD NV | 1,118,851 | 145,179,002 | |
| Wolters Kluwer NV | 2,266,851 | 240,935,178 | |
TOTAL NETHERLANDS | 887,509,358 | ||
| Norway - 0.0% | |||
| Equinor ASA | 400 | 14,573 | |
| Spain - 1.2% | |||
| Amadeus IT Holding SA Class A (a) | 2,912,070 | 151,879,896 | |
| Sweden - 4.2% | |||
| AddTech AB (B Shares) | 4,728,719 | 57,218,134 | |
| Atlas Copco AB (A Shares) (b) | 13,632,200 | 145,499,930 | |
| Hexagon AB (B Shares) | 15,270,316 | 150,960,762 | |
| Indutrade AB | 7,221,875 | 126,467,189 | |
| Kry International AB (a)(d)(e) | 4,451 | 779,230 | |
| Nordnet AB | 2,646,909 | 32,843,036 | |
TOTAL SWEDEN | 513,768,281 | ||
| Switzerland - 14.1% | |||
| Compagnie Financiere Richemont SA Series A | 1,845,070 | 180,325,254 | |
| Julius Baer Group Ltd. | 2,350,888 | 112,792,955 | |
| Nestle SA (Reg. S) | 4,143,731 | 451,081,593 | |
| Partners Group Holding AG | 129,520 | 116,333,238 | |
| Roche Holding AG (participation certificate) | 1,097,392 | 364,112,677 | |
| Sika AG | 815,811 | 183,945,660 | |
| Sonova Holding AG | 566,683 | 133,953,030 | |
| Zurich Insurance Group Ltd. | 449,380 | 191,514,055 | |
TOTAL SWITZERLAND | 1,734,058,462 | ||
| Taiwan - 0.4% | |||
| Taiwan Semiconductor Manufacturing Co. Ltd. | 4,348,684 | 52,229,730 | |
| United Kingdom - 9.5% | |||
| BAE Systems PLC | 11,700,200 | 109,438,639 | |
| Beazley PLC | 8,064,556 | 57,756,463 | |
| Compass Group PLC | 10,304,587 | 217,033,424 | |
| Dechra Pharmaceuticals PLC | 1,831,363 | 55,025,426 | |
| Diageo PLC | 6,635,347 | 273,061,223 | |
| Diploma PLC | 1,533,631 | 43,722,973 | |
| RELX PLC (London Stock Exchange) | 7,745,155 | 208,038,693 | |
| Rentokil Initial PLC | 23,418,622 | 146,134,793 | |
| St. James's Place PLC | 5,096,700 | 62,248,138 | |
TOTAL UNITED KINGDOM | 1,172,459,772 | ||
| United States of America - 7.2% | |||
| Ares Management Corp. | 365,800 | 27,738,614 | |
| CBRE Group, Inc. (a) | 1,494,400 | 106,012,736 | |
| Equifax, Inc. | 324,100 | 54,947,914 | |
| Intercontinental Exchange, Inc. | 1,149,700 | 109,876,829 | |
| Marsh & McLennan Companies, Inc. | 1,247,928 | 201,527,893 | |
| Moody's Corp. | 398,700 | 105,603,669 | |
| Pool Corp. | 51,500 | 15,667,845 | |
| S&P Global, Inc. | 476,851 | 153,188,384 | |
| Thermo Fisher Scientific, Inc. | 204,900 | 105,312,453 | |
TOTAL UNITED STATES OF AMERICA | 879,876,337 | ||
| TOTAL COMMON STOCKS (Cost $11,697,547,095) | 11,912,256,401 | ||
| Nonconvertible Preferred Stocks - 0.1% | |||
| Shares | Value ($) | ||
| Sweden - 0.1% | |||
Kry International AB Series E (a)(d)(e) (Cost $11,754,376) | 25,711 | 4,501,186 | |
| Money Market Funds - 5.5% | |||
| Shares | Value ($) | ||
| Fidelity Cash Central Fund 3.10% (f) | 433,136,242 | 433,222,869 | |
| Fidelity Securities Lending Cash Central Fund 3.10% (f)(g) | 246,447,730 | 246,472,375 | |
| TOTAL MONEY MARKET FUNDS (Cost $679,695,244) | 679,695,244 | ||
| TOTAL INVESTMENT IN SECURITIES - 102.3% (Cost $12,388,996,715) | 12,596,452,831 |
NET OTHER ASSETS (LIABILITIES) - (2.3)% | (279,208,444) |
| NET ASSETS - 100.0% | 12,317,244,387 |
| (a) | Non-income producing |
| (b) | Security or a portion of the security is on loan at period end. |
| (c) | Security exempt from registration under Rule 144A of the Securities Act of 1933. These securities may be resold in transactions exempt from registration, normally to qualified institutional buyers. At the end of the period, the value of these securities amounted to $211,872,604 or 1.7% of net assets. |
| (d) | Restricted securities (including private placements) - Investment in securities not registered under the Securities Act of 1933 (excluding 144A issues). At the end of the period, the value of restricted securities (excluding 144A issues) amounted to $5,280,416 or 0.0% of net assets. |
| (e) | Level 3 security |
| (f) | Affiliated fund that is generally available only to investment companies and other accounts managed by Fidelity Investments. The rate quoted is the annualized seven-day yield of the fund at period end. A complete unaudited listing of the fund's holdings as of its most recent quarter end is available upon request. In addition, each Fidelity Central Fund's financial statements, which are not covered by the Fund's Report of Independent Registered Public Accounting Firm, are available on the SEC's website or upon request. |
| (g) | Investment made with cash collateral received from securities on loan. |
| Additional information on each restricted holding is as follows: | ||
| Security | Acquisition Date | Acquisition Cost ($) |
| Kry International AB | 5/14/21 | 1,933,095 |
| Kry International AB Series E | 5/14/21 | 11,754,376 |
| Affiliate | Value, beginning of period ($) | Purchases ($) | Sales Proceeds ($) | Dividend Income ($) | Realized Gain (loss) ($) | Change in Unrealized appreciation (depreciation) ($) | Value, end of period ($) | % ownership, end of period |
| Fidelity Cash Central Fund 3.10% | 344,150,559 | 4,469,653,538 | 4,380,581,228 | 3,791,368 | - | - | 433,222,869 | 0.9% |
| Fidelity Securities Lending Cash Central Fund 3.10% | - | 1,942,762,009 | 1,696,289,634 | 932,233 | - | - | 246,472,375 | 0.7% |
| Total | 344,150,559 | 6,412,415,547 | 6,076,870,862 | 4,723,601 | - | - | 679,695,244 | |
| Valuation Inputs at Reporting Date: | ||||
| Description | Total ($) | Level 1 ($) | Level 2 ($) | Level 3 ($) |
Investments in Securities: | ||||
| Equities: | ||||
Communication Services | 51,168,916 | 51,168,916 | - | - |
Consumer Discretionary | 1,205,079,662 | 259,789,769 | 945,289,893 | - |
Consumer Staples | 904,285,632 | 180,142,816 | 724,142,816 | - |
Energy | 317,868,620 | - | 317,868,620 | - |
Financials | 2,578,101,346 | 1,394,276,305 | 1,183,825,041 | - |
Health Care | 1,844,798,873 | 1,162,283,460 | 682,515,413 | - |
Industrials | 2,584,156,555 | 1,487,083,218 | 1,097,073,337 | - |
Information Technology | 1,735,326,060 | 766,836,860 | 963,208,784 | 5,280,416 |
Materials | 543,413,546 | 195,210,275 | 348,203,271 | - |
Real Estate | 152,558,377 | 152,558,377 | - | - |
| Money Market Funds | 679,695,244 | 679,695,244 | - | - |
| Total Investments in Securities: | 12,596,452,831 | 6,329,045,240 | 6,262,127,175 | 5,280,416 |
| Statement of Assets and Liabilities | ||||
| October 31, 2022 | ||||
| Assets | ||||
| Investment in securities, at value (including securities loaned of $231,570,513) - See accompanying schedule: | ||||
Unaffiliated issuers (cost $11,709,301,471) | $11,916,757,587 | |||
Fidelity Central Funds (cost $679,695,244) | 679,695,244 | |||
| Total Investment in Securities (cost $12,388,996,715) | $ | 12,596,452,831 | ||
| Foreign currency held at value (cost $101,708) | 101,750 | |||
| Receivable for investments sold | 24,594,331 | |||
| Receivable for fund shares sold | 26,642,905 | |||
| Dividends receivable | 11,852,994 | |||
| Reclaims receivable | 35,621,747 | |||
| Distributions receivable from Fidelity Central Funds | 1,058,607 | |||
Total assets | 12,696,325,165 | |||
| Liabilities | ||||
| Payable for investments purchased | $8,370,243 | |||
| Payable for fund shares redeemed | 120,521,603 | |||
| Other payables and accrued expenses | 3,716,557 | |||
| Collateral on securities loaned | 246,472,375 | |||
| Total Liabilities | 379,080,778 | |||
| Net Assets | $ | 12,317,244,387 | ||
| Net Assets consist of: | ||||
| Paid in capital | $ | 12,508,221,053 | ||
| Total accumulated earnings (loss) | (190,976,666) | |||
| Net Assets | $ | 12,317,244,387 | ||
Net Asset Value , offering price and redemption price per share ($12,317,244,387 ÷ 1,219,001,399 shares) | $ | 10.10 | ||
| Statement of Operations | ||||
Year ended October 31, 2022 | ||||
| Investment Income | ||||
| Dividends | $ | 275,370,717 | ||
| Foreign Tax Reclaims | 21,770,886 | |||
| Income from Fidelity Central Funds (including $932,233 from security lending) | 4,723,601 | |||
| Income before foreign taxes withheld | 301,865,204 | |||
| Less foreign taxes withheld | (51,938,028) | |||
| Total Income | 249,927,176 | |||
| Expenses | ||||
| Custodian fees and expenses | 994,933 | |||
| Independent trustees' fees and expenses | 47,851 | |||
| Total Expenses | 1,042,784 | |||
| Net Investment income (loss) | 248,884,392 | |||
| Realized and Unrealized Gain (Loss) | ||||
| Net realized gain (loss) on: | ||||
| Investment Securities: | ||||
| Unaffiliated issuers(net of foreign taxes of $7,275,584) | (589,233,851) | |||
| Redemptions in-kind with affiliated entities | 10,846,765 | |||
| Foreign currency transactions | (1,896,506) | |||
| Total net realized gain (loss) | (580,283,592) | |||
| Change in net unrealized appreciation (depreciation) on: | ||||
| Investment Securities: | ||||
| Unaffiliated issuers (net of decrease in deferred foreign taxes of $8,706,333) | (4,367,411,163) | |||
| Assets and liabilities in foreign currencies | (4,014,232) | |||
| Total change in net unrealized appreciation (depreciation) | (4,371,425,395) | |||
| Net gain (loss) | (4,951,708,987) | |||
| Net increase (decrease) in net assets resulting from operations | $ | (4,702,824,595) | ||
| Statement of Changes in Net Assets | ||||
Year ended October 31, 2022 | Year ended October 31, 2021 | |||
| Increase (Decrease) in Net Assets | ||||
| Operations | ||||
| Net investment income (loss) | $ | 248,884,392 | $ | 183,300,410 |
| Net realized gain (loss) | (580,283,592) | 622,896,208 | ||
| Change in net unrealized appreciation (depreciation) | (4,371,425,395) | 3,619,908,617 | ||
| Net increase (decrease) in net assets resulting from operations | (4,702,824,595) | 4,426,105,235 | ||
| Distributions to shareholders | (454,822,647) | (148,790,299) | ||
| Share transactions | ||||
| Proceeds from sales of shares | 3,241,589,484 | 2,149,702,200 | ||
| Reinvestment of distributions | 454,822,647 | 148,790,299 | ||
| Cost of shares redeemed | (1,640,720,377) | (2,664,983,793) | ||
Net increase (decrease) in net assets resulting from share transactions | 2,055,691,754 | (366,491,294) | ||
| Total increase (decrease) in net assets | (3,101,955,488) | 3,910,823,642 | ||
| Net Assets | ||||
| Beginning of period | 15,419,199,875 | 11,508,376,233 | ||
| End of period | $ | 12,317,244,387 | $ | 15,419,199,875 |
| Other Information | ||||
| Shares | ||||
| Sold | 267,011,806 | 162,065,989 | ||
| Issued in reinvestment of distributions | 32,302,745 | 12,451,071 | ||
| Redeemed | (137,519,813) | (201,460,713) | ||
| Net increase (decrease) | 161,794,738 | (26,943,653) | ||
| Fidelity® Series Overseas Fund |
| Years ended October 31, | 2022 | 2021 | 2020 | 2019 A | ||||
Selected Per-Share Data | ||||||||
| Net asset value, beginning of period | $ | 14.58 | $ | 10.62 | $ | 10.20 | $ | 10.00 |
| Income from Investment Operations | ||||||||
Net investment income (loss) B,C | .21 | .17 | .14 | .06 D | ||||
| Net realized and unrealized gain (loss) | (4.27) | 3.93 | .32 | .14 | ||||
| Total from investment operations | (4.06) | 4.10 | .46 | .20 | ||||
| Distributions from net investment income | (.17) | (.14) | (.04) | - | ||||
| Distributions from net realized gain | (.25) | - | - | - | ||||
| Total distributions | (.42) | (.14) | (.04) | - | ||||
| Net asset value, end of period | $ | 10.10 | $ | 14.58 | $ | 10.62 | $ | 10.20 |
Total Return E | (28.66)% | 38.89% | 4.51% | 2.00% | ||||
Ratios to Average Net Assets C,F,G | ||||||||
| Expenses before reductions | .01% | .01% | .01% | .01% H | ||||
| Expenses net of fee waivers, if any | .01% | .01% | .01% | .01% H | ||||
| Expenses net of all reductions | .01% | .01% | .01% | .01% H | ||||
| Net investment income (loss) | 1.79% | 1.29% | 1.35% | 1.69% D,H | ||||
| Supplemental Data | ||||||||
| Net assets, end of period (000 omitted) | $ | 12,317,244 | $ | 15,419,200 | $ | 11,508,376 | $ | 6,226,806 |
Portfolio turnover rate I | 28% J | 33% | 50% | 12% J,K |
| Fidelity Central Fund | Investment Manager | Investment Objective | Investment Practices | Expense Ratio A |
| Fidelity Money Market Central Funds | Fidelity Management & Research Company LLC (FMR) | Each fund seeks to obtain a high level of current income consistent with the preservation of capital and liquidity. | Short-term Investments | Less than .005% |
| Gross unrealized appreciation | $1,364,302,779 |
| Gross unrealized depreciation | (1,190,233,224) |
| Net unrealized appreciation (depreciation) | $174,069,555 |
| Tax Cost | $12,422,383,276 |
| Undistributed ordinary income | $ 207,105,817 |
| Capital loss carryforward | $(564,531,807) |
| Net unrealized appreciation (depreciation) on securities and other investments | $169,944,548 |
Short-term | $(373,833,934) |
Long-term | (190,697,873) |
| Total capital loss carryforward | $(564,531,807) |
| October 31, 2022 | October 31, 2021 | |
| Ordinary Income | $ 186,260,703 | $148,790,299 |
| Long-term Capital Gains | 268,561,944 | - |
| Total | $454,822,647 | $148,790,299 |
| Purchases ($) | Sales ($) | |
| Fidelity Series Overseas Fund | 5,561,736,198 | 3,746,376,625 |
| Amount | |
| Fidelity Series Overseas Fund | $4,471 |
| Purchases ($) | Sales ($) | Realized Gain (Loss) ($) | |
| Fidelity Series Overseas Fund | 328,062,412 | 68,762,267 | (4,002,709) |
| Shares | Total net realized gain or loss ($) | Total Proceeds ($) | |
| Fidelity Series Overseas Fund | 4,714,174 | 10,846,765 | 47,182,852 |
| Total Security Lending Fees Paid to NFS | Security Lending Income From Securities Loaned to NFS | Value of Securities Loaned to NFS at Period End | |
| Fidelity Series Overseas Fund | $98,295 | $- | $- |
| The Example is based on an investment of $1,000 invested at the beginning of the period and held for the entire period (May 1, 2022 to October 31, 2022). |
Annualized Expense Ratio- A | Beginning Account Value May 1, 2022 | Ending Account Value October 31, 2022 | Expenses Paid During Period- C May 1, 2022 to October 31, 2022 | |||||||
| Fidelity® Series Overseas Fund | .01% | |||||||||
| Actual | $ 1,000 | $ 870.70 | $ .05 | |||||||
Hypothetical- B | $ 1,000 | $ 1,025.16 | $ .05 | |||||||
|


Contents
Board Approval of Investment Advisory Contracts and Management Fees |
| Average Annual Total Returns | |||
Periods ended October 31, 2022 | Past 1 year | Past 5 years | Life of Fund A |
| Fidelity® Series Canada Fund | -7.45% | 6.76% | 7.79% |
| $10,000 Over Life of Fund |
Let's say hypothetically that $10,000 was invested in Fidelity® Series Canada Fund, on August 15, 2017, when the fund started. The chart shows how the value of your investment would have changed, and also shows how the MSCI Canada Index performed over the same period. |
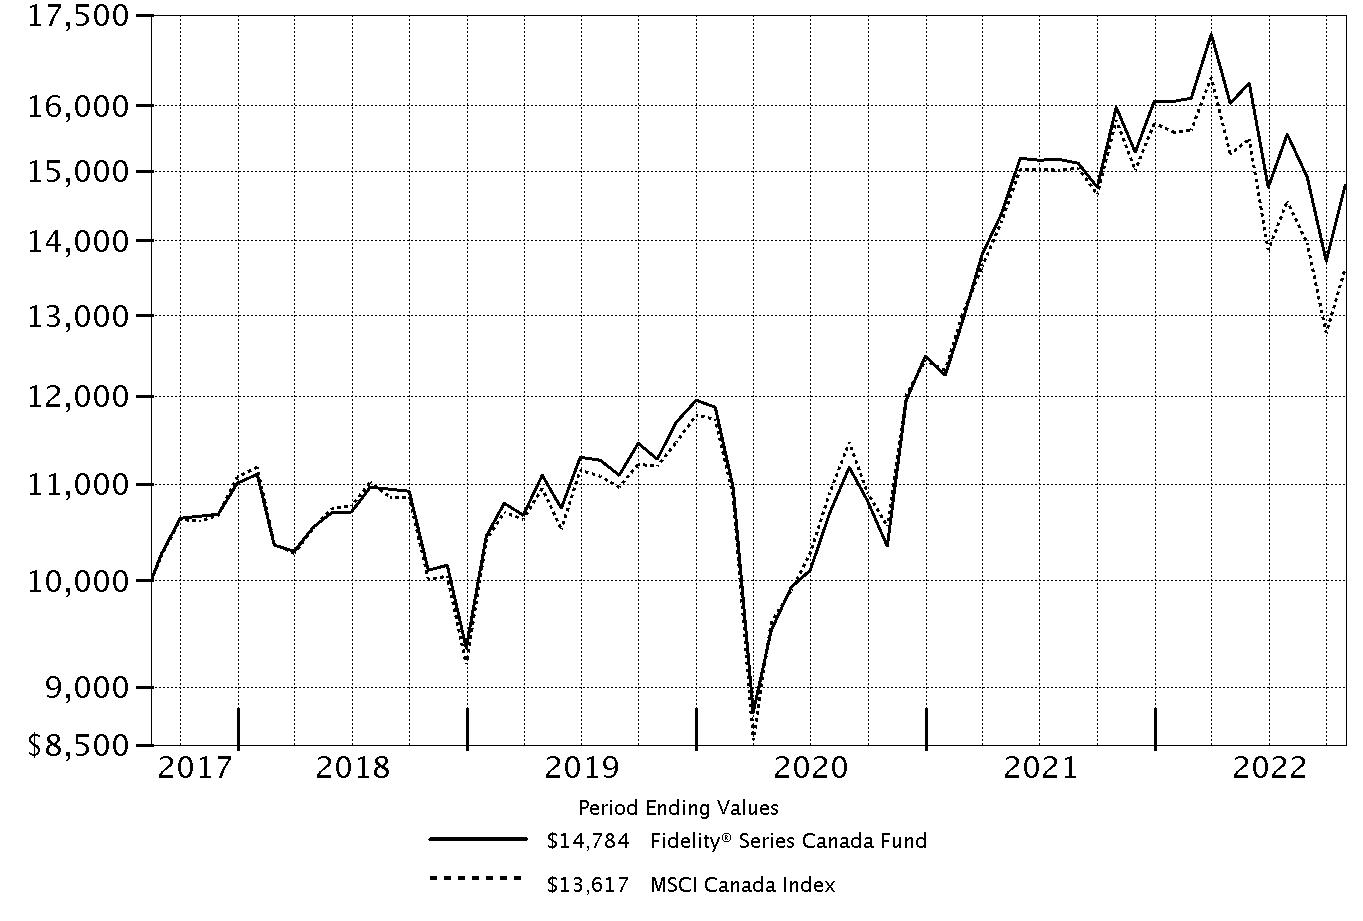 |
Top Holdings (% of Fund's net assets) | ||
| The Toronto-Dominion Bank (Banks) | 8.2 | |
| Canadian Pacific Railway Ltd. (Road & Rail) | 7.0 | |
| Canadian Natural Resources Ltd. (Oil, Gas & Consumable Fuels) | 6.2 | |
| Alimentation Couche-Tard, Inc. Class A (multi-vtg.) (Food & Staples Retailing) | 5.4 | |
| Royal Bank of Canada (Banks) | 4.9 | |
| Bank of Montreal (Banks) | 4.9 | |
| Suncor Energy, Inc. (Oil, Gas & Consumable Fuels) | 4.9 | |
| Brookfield Asset Management, Inc. (Canada) Class A (Capital Markets) | 4.1 | |
| Nutrien Ltd. (Chemicals) | 3.6 | |
| Canadian National Railway Co. (Road & Rail) | 3.6 | |
| 52.8 | ||
| Market Sectors (% of Fund's net assets) | ||
| Financials | 31.7 | |
| Energy | 19.6 | |
| Industrials | 14.6 | |
| Materials | 11.2 | |
| Consumer Staples | 6.4 | |
| Information Technology | 6.0 | |
| Consumer Discretionary | 5.7 | |
| Communication Services | 3.1 | |
| Health Care | 0.7 | |
| Real Estate | 0.3 | |
Asset Allocation (% of Fund's net assets) |
 |
Geographic Diversification (% of Fund's net assets) |
 |
* Includes Short-Term investments and Net Other Assets (Liabilities). Percentages are based on country or territory of incorporation and are adjusted for the effect of futures contracts, if applicable. |
| Common Stocks - 99.1% | |||
| Shares | Value ($) | ||
| COMMUNICATION SERVICES - 2.9% | |||
| Diversified Telecommunication Services - 1.3% | |||
| TELUS Corp. | 3,334,200 | 69,628,209 | |
| Interactive Media & Services - 0.1% | |||
| VerticalScope Holdings, Inc. (a) | 514,000 | 2,735,347 | |
| Media - 0.1% | |||
| Quebecor, Inc. Class A | 354,900 | 6,718,443 | |
| Wireless Telecommunication Services - 1.4% | |||
| Rogers Communications, Inc. Class B (non-vtg.) (b) | 1,871,800 | 77,916,672 | |
TOTAL COMMUNICATION SERVICES | 156,998,671 | ||
| CONSUMER DISCRETIONARY - 5.7% | |||
| Auto Components - 0.9% | |||
| Magna International, Inc. Class A (sub. vtg.) | 913,900 | 50,929,121 | |
| Hotels, Restaurants & Leisure - 2.0% | |||
| Restaurant Brands International, Inc. | 1,779,100 | 105,713,029 | |
| Multiline Retail - 2.7% | |||
| Dollarama, Inc. (b) | 2,446,300 | 145,357,643 | |
| Specialty Retail - 0.0% | |||
| Diversified Royalty Corp. (b) | 1,087,300 | 2,394,319 | |
| Textiles, Apparel & Luxury Goods - 0.1% | |||
| Canada Goose Holdings, Inc. (a) | 410,683 | 6,719,363 | |
TOTAL CONSUMER DISCRETIONARY | 311,113,475 | ||
| CONSUMER STAPLES - 6.4% | |||
| Beverages - 0.1% | |||
| GURU Organic Energy Corp. (a)(c) | 1,884,596 | 5,007,698 | |
| Food & Staples Retailing - 6.1% | |||
| Alimentation Couche-Tard, Inc. Class A (multi-vtg.) (b) | 6,543,000 | 292,966,565 | |
| Neighbourly Pharmacy, Inc. | 512,575 | 8,732,606 | |
| North West Co., Inc. | 1,198,600 | 31,189,026 | |
| 332,888,197 | |||
| Personal Products - 0.2% | |||
| Jamieson Wellness, Inc. (d) | 432,000 | 10,568,914 | |
TOTAL CONSUMER STAPLES | 348,464,809 | ||
| ENERGY - 19.6% | |||
| Energy Equipment & Services - 0.8% | |||
| Computer Modelling Group Ltd. | 2,632,500 | 10,434,543 | |
| Pason Systems, Inc. | 2,967,182 | 31,515,487 | |
| 41,950,030 | |||
| Oil, Gas & Consumable Fuels - 18.8% | |||
| Cameco Corp. | 1,435,300 | 34,040,109 | |
| Canadian Natural Resources Ltd. (b) | 5,613,300 | 336,670,270 | |
| Enbridge, Inc. (b) | 4,036,000 | 157,250,985 | |
| Parkland Corp. (b) | 3,128,500 | 63,242,845 | |
| PrairieSky Royalty Ltd. (b) | 10,550,380 | 163,868,346 | |
| Suncor Energy, Inc. | 7,601,300 | 261,457,715 | |
| 1,016,530,270 | |||
TOTAL ENERGY | 1,058,480,300 | ||
| FINANCIALS - 31.7% | |||
| Banks - 19.6% | |||
| Bank of Montreal (b) | 2,849,900 | 262,512,534 | |
| Bank of Nova Scotia | 1,811,500 | 87,559,933 | |
| Royal Bank of Canada (b) | 2,861,300 | 264,738,771 | |
| The Toronto-Dominion Bank | 6,926,330 | 443,283,090 | |
| 1,058,094,328 | |||
| Capital Markets - 5.5% | |||
| Brookfield Asset Management, Inc. (Canada) Class A | 5,625,188 | 222,761,326 | |
| TMX Group Ltd. | 757,900 | 72,866,548 | |
| 295,627,874 | |||
| Insurance - 6.6% | |||
| Definity Financial Corp. (b) | 2,592,824 | 76,794,105 | |
| Intact Financial Corp. (b) | 815,500 | 123,915,774 | |
| Sun Life Financial, Inc. (b) | 3,714,600 | 157,761,776 | |
| 358,471,655 | |||
TOTAL FINANCIALS | 1,712,193,857 | ||
| HEALTH CARE - 0.7% | |||
| Health Care Providers & Services - 0.7% | |||
| Andlauer Healthcare Group, Inc. | 856,570 | 32,833,035 | |
| dentalcorp Holdings Ltd. (a) | 1,201,300 | 6,692,749 | |
| 39,525,784 | |||
| INDUSTRIALS - 14.6% | |||
| Commercial Services & Supplies - 1.9% | |||
| GFL Environmental, Inc. (b) | 3,874,414 | 104,570,927 | |
| Professional Services - 2.1% | |||
| Thomson Reuters Corp. | 1,050,800 | 111,755,725 | |
| Road & Rail - 10.6% | |||
| Canadian National Railway Co. | 1,643,700 | 194,732,029 | |
| Canadian Pacific Railway Ltd. (b) | 5,048,921 | 376,385,229 | |
| 571,117,258 | |||
TOTAL INDUSTRIALS | 787,443,910 | ||
| INFORMATION TECHNOLOGY - 6.0% | |||
| IT Services - 1.1% | |||
| Shopify, Inc. Class A (a) | 1,655,400 | 56,757,613 | |
| Software - 4.9% | |||
| ApplyBoard, Inc. (a)(e)(f) | 10,248 | 705,882 | |
| ApplyBoard, Inc. (non-vtg.) (a)(e)(f) | 2,527 | 174,060 | |
| Constellation Software, Inc. | 118,400 | 171,200,482 | |
| Dye & Durham Ltd. | 2,789,800 | 30,860,121 | |
| Open Text Corp. | 2,178,100 | 63,087,919 | |
| 266,028,464 | |||
TOTAL INFORMATION TECHNOLOGY | 322,786,077 | ||
| MATERIALS - 11.2% | |||
| Chemicals - 3.6% | |||
| Nutrien Ltd. | 2,327,678 | 196,674,140 | |
| Containers & Packaging - 1.3% | |||
| CCL Industries, Inc. Class B (b) | 1,441,400 | 67,713,583 | |
| Metals & Mining - 5.9% | |||
| Franco-Nevada Corp. | 1,350,597 | 166,877,816 | |
| Lundin Mining Corp. | 6,427,100 | 33,684,071 | |
| Wheaton Precious Metals Corp. | 3,628,000 | 118,691,937 | |
| 319,253,824 | |||
| Paper & Forest Products - 0.4% | |||
| Stella-Jones, Inc. | 594,300 | 17,898,579 | |
| Western Forest Products, Inc. | 5,978,100 | 5,397,338 | |
| 23,295,917 | |||
TOTAL MATERIALS | 606,937,464 | ||
| REAL ESTATE - 0.3% | |||
| Equity Real Estate Investment Trusts (REITs) - 0.3% | |||
| Allied Properties (REIT) (b) | 646,600 | 12,525,250 | |
| Real Estate Management & Development - 0.0% | |||
| Information Services Corp. | 81,900 | 1,405,529 | |
TOTAL REAL ESTATE | 13,930,779 | ||
| TOTAL COMMON STOCKS (Cost $4,260,953,591) | 5,357,875,126 | ||
| Nonconvertible Preferred Stocks - 0.0% | |||
| Shares | Value ($) | ||
| INFORMATION TECHNOLOGY - 0.0% | |||
| Software - 0.0% | |||
| ApplyBoard, Inc.: | |||
| Series A1 (a)(e)(f) | 12,606 | 868,301 | |
| Series A2 (a)(e)(f) | 9,868 | 679,708 | |
| Series A3 (a)(e)(f) | 563 | 38,779 | |
| Series D (a)(e)(f) | 27,521 | 1,895,646 | |
| Series Seed (a)(e)(f) | 3,768 | 259,540 | |
| (Cost $4,705,692) | 3,741,974 | ||
| Convertible Bonds - 0.2% | |||
Principal Amount (g) | Value ($) | ||
| COMMUNICATION SERVICES - 0.2% | |||
| Entertainment - 0.2% | |||
Cineplex, Inc. 5.75% 9/30/25 (d) (Cost $9,716,997) | CAD | 14,075,000 | 10,615,526 |
| Money Market Funds - 14.4% | |||
| Shares | Value ($) | ||
| Fidelity Cash Central Fund 3.10% (h) | 4,118,597 | 4,119,421 | |
| Fidelity Securities Lending Cash Central Fund 3.10% (h)(i) | 772,892,655 | 772,969,944 | |
| TOTAL MONEY MARKET FUNDS (Cost $777,089,365) | 777,089,365 | ||
| TOTAL INVESTMENT IN SECURITIES - 113.7% (Cost $5,052,465,645) | 6,149,321,991 |
NET OTHER ASSETS (LIABILITIES) - (13.7)% | (742,124,981) |
| NET ASSETS - 100.0% | 5,407,197,010 |
| CAD | - | Canadian dollar |
| (a) | Non-income producing |
| (b) | Security or a portion of the security is on loan at period end. |
| (c) | Affiliated company |
| (d) | Security exempt from registration under Rule 144A of the Securities Act of 1933. These securities may be resold in transactions exempt from registration, normally to qualified institutional buyers. At the end of the period, the value of these securities amounted to $21,184,440 or 0.4% of net assets. |
| (e) | Restricted securities (including private placements) - Investment in securities not registered under the Securities Act of 1933 (excluding 144A issues). At the end of the period, the value of restricted securities (excluding 144A issues) amounted to $4,621,916 or 0.1% of net assets. |
| (f) | Level 3 security |
| (g) | Amount is stated in United States dollars unless otherwise noted. |
| (h) | Affiliated fund that is generally available only to investment companies and other accounts managed by Fidelity Investments. The rate quoted is the annualized seven-day yield of the fund at period end. A complete unaudited listing of the fund's holdings as of its most recent quarter end is available upon request. In addition, each Fidelity Central Fund's financial statements, which are not covered by the Fund's Report of Independent Registered Public Accounting Firm, are available on the SEC's website or upon request. |
| (i) | Investment made with cash collateral received from securities on loan. |
| Additional information on each restricted holding is as follows: | ||
| Security | Acquisition Date | Acquisition Cost ($) |
| ApplyBoard, Inc. | 6/04/21 - 6/30/21 | 524,312 |
| ApplyBoard, Inc. (non-vtg.) | 6/30/21 | 269,861 |
| ApplyBoard, Inc. Series A1 | 6/04/21 | 816,255 |
| ApplyBoard, Inc. Series A2 | 6/04/21 | 638,966 |
| ApplyBoard, Inc. Series A3 | 6/04/21 | 36,455 |
| ApplyBoard, Inc. Series D | 6/04/21 | 2,970,033 |
| ApplyBoard, Inc. Series Seed | 6/04/21 | 243,983 |
| Affiliate | Value, beginning of period ($) | Purchases ($) | Sales Proceeds ($) | Dividend Income ($) | Realized Gain (loss) ($) | Change in Unrealized appreciation (depreciation) ($) | Value, end of period ($) | % ownership, end of period |
| Fidelity Cash Central Fund 3.10% | 3,421,935 | 685,084,306 | 684,386,820 | 96,369 | - | - | 4,119,421 | 0.0% |
| Fidelity Securities Lending Cash Central Fund 3.10% | 1,018,238,194 | 7,535,650,389 | 7,780,918,639 | 1,585,189 | - | - | 772,969,944 | 2.2% |
| Total | 1,021,660,129 | 8,220,734,695 | 8,465,305,459 | 1,681,558 | - | - | 777,089,365 | |
| Affiliate | Value, beginning of period ($) | Purchases ($) | Sales Proceeds ($) | Dividend Income ($) | Realized Gain (loss) ($) | Change in Unrealized appreciation (depreciation) ($) | Value, end of period ($) |
| GURU Organic Energy Corp. | 15,921,138 | - | 19,238 | - | (10,890) | (19,585,858) | 5,007,698 |
| GURU Organic Energy Corp. | 7,685,151 | - | - | - | - | 1,017,395 | - |
| Total | 23,606,289 | - | 19,238 | - | (10,890) | (18,568,463) | 5,007,698 |
| Valuation Inputs at Reporting Date: | ||||
| Description | Total ($) | Level 1 ($) | Level 2 ($) | Level 3 ($) |
Investments in Securities: | ||||
| Equities: | ||||
Communication Services | 156,998,671 | 156,998,671 | - | - |
Consumer Discretionary | 311,113,475 | 311,113,475 | - | - |
Consumer Staples | 348,464,809 | 348,464,809 | - | - |
Energy | 1,058,480,300 | 1,058,480,300 | - | - |
Financials | 1,712,193,857 | 1,712,193,857 | - | - |
Health Care | 39,525,784 | 39,525,784 | - | - |
Industrials | 787,443,910 | 787,443,910 | - | - |
Information Technology | 326,528,051 | 321,906,135 | - | 4,621,916 |
Materials | 606,937,464 | 606,937,464 | - | - |
Real Estate | 13,930,779 | 13,930,779 | - | - |
| Corporate Bonds | 10,615,526 | - | 10,615,526 | - |
| Money Market Funds | 777,089,365 | 777,089,365 | - | - |
| Total Investments in Securities: | 6,149,321,991 | 6,134,084,549 | 10,615,526 | 4,621,916 |
| Statement of Assets and Liabilities | ||||
| October 31, 2022 | ||||
| Assets | ||||
| Investment in securities, at value (including securities loaned of $727,459,514) - See accompanying schedule: | ||||
Unaffiliated issuers (cost $4,261,679,951) | $5,367,224,928 | |||
Fidelity Central Funds (cost $777,089,365) | 777,089,365 | |||
Other affiliated issuers (cost $13,696,329) | 5,007,698 | |||
| Total Investment in Securities (cost $5,052,465,645) | $ | 6,149,321,991 | ||
| Cash | 459,002 | |||
| Foreign currency held at value (cost $32,880,861) | 32,859,154 | |||
| Receivable for investments sold | 75,698,763 | |||
| Receivable for fund shares sold | 3,776,315 | |||
| Dividends receivable | 10,913,173 | |||
| Interest receivable | 52,082 | |||
| Distributions receivable from Fidelity Central Funds | 179,212 | |||
Total assets | 6,273,259,692 | |||
| Liabilities | ||||
| Payable for fund shares redeemed | $93,083,043 | |||
| Other payables and accrued expenses | 11,466 | |||
| Collateral on securities loaned | 772,968,173 | |||
| Total Liabilities | 866,062,682 | |||
| Net Assets | $ | 5,407,197,010 | ||
| Net Assets consist of: | ||||
| Paid in capital | $ | 4,232,686,518 | ||
| Total accumulated earnings (loss) | 1,174,510,492 | |||
| Net Assets | $ | 5,407,197,010 | ||
Net Asset Value , offering price and redemption price per share ($5,407,197,010 ÷ 404,404,871 shares) | $ | 13.37 | ||
| Statement of Operations | ||||
Year ended October 31, 2022 | ||||
| Investment Income | ||||
| Dividends | $ | 154,357,341 | ||
| Interest | 1,005,950 | |||
| Income from Fidelity Central Funds (including $1,585,189 from security lending) | 1,681,558 | |||
| Income before foreign taxes withheld | 157,044,849 | |||
| Less foreign taxes withheld | (23,222,765) | |||
| Total Income | 133,822,084 | |||
| Expenses | ||||
| Custodian fees and expenses | 50,841 | |||
| Independent trustees' fees and expenses | 19,809 | |||
| Interest | 30,761 | |||
| Total Expenses | 101,411 | |||
| Net Investment income (loss) | 133,720,673 | |||
| Realized and Unrealized Gain (Loss) | ||||
| Net realized gain (loss) on: | ||||
| Investment Securities: | ||||
| Unaffiliated issuers | 46,126,746 | |||
| Redemptions in-kind with affiliated entities | 9,969,579 | |||
| Affiliated issuers | (10,890) | |||
| Foreign currency transactions | (5,684,930) | |||
| Total net realized gain (loss) | 50,400,505 | |||
| Change in net unrealized appreciation (depreciation) on: | ||||
| Investment Securities: | ||||
| Unaffiliated issuers | (606,427,743) | |||
| Affiliated issuers | (18,568,463) | |||
| Assets and liabilities in foreign currencies | 9,995 | |||
| Total change in net unrealized appreciation (depreciation) | (624,986,211) | |||
| Net gain (loss) | (574,585,706) | |||
| Net increase (decrease) in net assets resulting from operations | $ | (440,865,033) | ||
| Statement of Changes in Net Assets | ||||
Year ended October 31, 2022 | Year ended October 31, 2021 | |||
| Increase (Decrease) in Net Assets | ||||
| Operations | ||||
| Net investment income (loss) | $ | 133,720,673 | $ | 108,709,412 |
| Net realized gain (loss) | 50,400,505 | 22,443,969 | ||
| Change in net unrealized appreciation (depreciation) | (624,986,211) | 1,915,956,394 | ||
| Net increase (decrease) in net assets resulting from operations | (440,865,033) | 2,047,109,775 | ||
| Distributions to shareholders | (132,881,856) | (93,451,768) | ||
| Share transactions | ||||
| Proceeds from sales of shares | 958,291,641 | 1,111,955,563 | ||
| Reinvestment of distributions | 132,881,856 | 93,451,768 | ||
| Cost of shares redeemed | (1,175,374,764) | (1,008,336,876) | ||
Net increase (decrease) in net assets resulting from share transactions | (84,201,267) | 197,070,455 | ||
| Total increase (decrease) in net assets | (657,948,156) | 2,150,728,462 | ||
| Net Assets | ||||
| Beginning of period | 6,065,145,166 | 3,914,416,704 | ||
| End of period | $ | 5,407,197,010 | $ | 6,065,145,166 |
| Other Information | ||||
| Shares | ||||
| Sold | 67,737,438 | 82,470,040 | ||
| Issued in reinvestment of distributions | 9,351,292 | 8,063,138 | ||
| Redeemed | (83,298,959) | (80,373,626) | ||
| Net increase (decrease) | (6,210,229) | 10,159,552 | ||
| Fidelity® Series Canada Fund |
| Years ended October 31, | 2022 | 2021 | 2020 | 2019 | 2018 | |||||
Selected Per-Share Data | ||||||||||
| Net asset value, beginning of period | $ | 14.77 | $ | 9.77 | $ | 10.89 | $ | 9.99 | $ | 10.66 |
| Income from Investment Operations | ||||||||||
Net investment income (loss) A,B | .32 | .28 | .27 | .27 | .26 | |||||
| Net realized and unrealized gain (loss) | (1.40) | 4.97 | (1.14) | .86 | (.81) | |||||
| Total from investment operations | (1.08) | 5.25 | (.87) | 1.13 | (.55) | |||||
| Distributions from net investment income | (.32) | (.25) | (.25) | (.23) | (.10) | |||||
| Distributions from net realized gain | - | - | - | - | (.02) | |||||
| Total distributions | (.32) | (.25) | (.25) | (.23) | (.12) | |||||
| Net asset value, end of period | $ | 13.37 | $ | 14.77 | $ | 9.77 | $ | 10.89 | $ | 9.99 |
Total Return C | (7.45)% | 54.40% | (8.22)% | 11.62% | (5.26)% | |||||
Ratios to Average Net Assets B,D,E | ||||||||||
Expenses before reductions F | -% | -% | -% | -% | -% | |||||
Expenses net of fee waivers, if any F | -% | -% | -% | -% | -% | |||||
Expenses net of all reductions F | -% | -% | -% | -% | -% | |||||
| Net investment income (loss) | 2.29% | 2.13% | 2.70% | 2.63% | 2.42% | |||||
| Supplemental Data | ||||||||||
| Net assets, end of period (000 omitted) | $ | 5,407,197 | $ | 6,065,145 | $ | 3,914,417 | $ | 1,916,409 | $ | 1,385,499 |
Portfolio turnover rate G | 19% H | 19% | 14% | 12% H | 36% |
| Fidelity Central Fund | Investment Manager | Investment Objective | Investment Practices | Expense Ratio A |
| Fidelity Money Market Central Funds | Fidelity Management & Research Company LLC (FMR) | Each fund seeks to obtain a high level of current income consistent with the preservation of capital and liquidity. | Short-term Investments | Less than .005% |
| Gross unrealized appreciation | $1,333,506,795 |
| Gross unrealized depreciation | (295,105,431) |
| Net unrealized appreciation (depreciation) | $1,038,401,364 |
| Tax Cost | $5,110,920,627 |
| Undistributed ordinary income | $133,513,424 |
| Undistributed long-term capital gain | $2,623,110 |
| Net unrealized appreciation (depreciation) on securities and other investments | $1,038,373,958 |
| October 31, 2022 | October 31, 2021 | |
| Ordinary Income | $132,881,856 | $93,451,768 |
| Purchases ($) | Sales ($) | |
| Fidelity Series Canada Fund | 1,123,746,434 | 1,138,392,198 |
| Borrower or Lender | Average Loan Balance | Weighted Average Interest Rate | Interest Expense | |
| Fidelity Series Canada Fund | Borrower | $47,787,250 | 1.15% | $30,524 |
| Purchases ($) | Sales ($) | Realized Gain (Loss) ($) | |
| Fidelity Series Canada Fund | 78,993,502 | 52,431,301 | (2,066,200) |
| Shares | Total net realized gain or loss ($) | Total Proceeds ($) | |
| Fidelity Series Canada Fund | 1,619,205 | 9,969,579 | 21,259,781 |
| Total Security Lending Fees Paid to NFS | Security Lending Income From Securities Loaned to NFS | Value of Securities Loaned to NFS at Period End | |
| Fidelity Series Canada Fund | $ 171,432 | $- | $- |
| Average Loan Balance | Weighted Average Interest Rate | Interest Expense | |
| Fidelity Series Canada Fund | $4,105,000 | 2.08% | $237 |
| The Example is based on an investment of $1,000 invested at the beginning of the period and held for the entire period (May 1, 2022 to October 31, 2022). |
Annualized Expense Ratio- A | Beginning Account Value May 1, 2022 | Ending Account Value October 31, 2022 | Expenses Paid During Period- C May 1, 2022 to October 31, 2022 | |||||||
| Fidelity® Series Canada Fund | -%- D | |||||||||
| Actual | $ 1,000 | $ 922.10 | $- E | |||||||
Hypothetical- B | $ 1,000 | $ 1,025.21 | $- E | |||||||
|


Contents
| $10,000 Over Life of Fund |
Let's say hypothetically that $10,000 was invested in Fidelity SAI Sustainable Emerging Markets Equity Fund, on April 14, 2022, when the fund started. The chart shows how the value of your investment would have changed, and also shows how the MSCI Emerging Markets Index performed over the same period. |
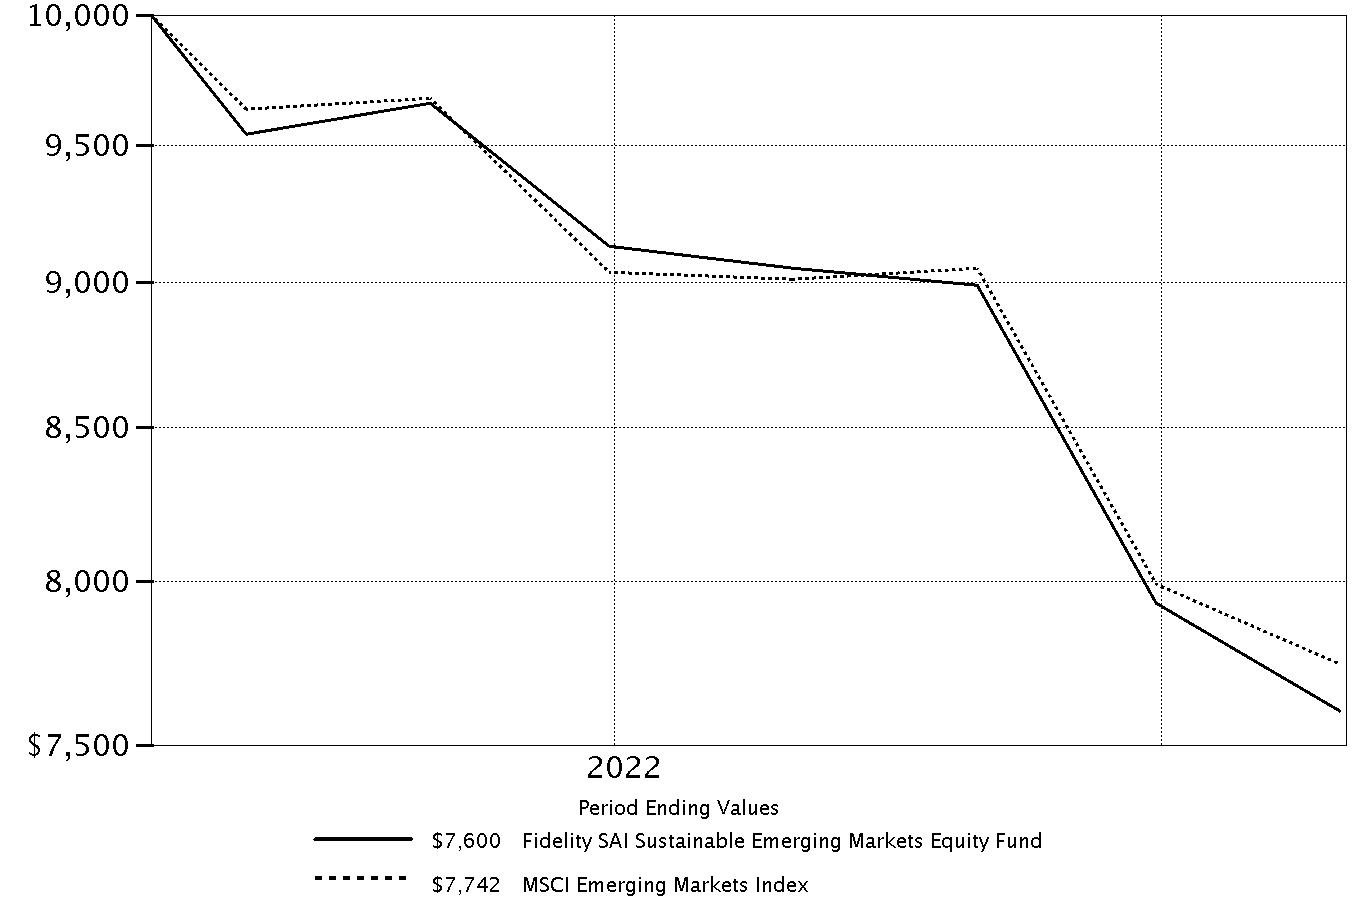 |
Top Holdings (% of Fund's net assets) | ||
| Taiwan Semiconductor Manufacturing Co. Ltd. sponsored ADR (Taiwan, Semiconductors & Semiconductor Equipment) | 8.0 | |
| Samsung Electronics Co. Ltd. (Korea (South), Technology Hardware, Storage & Peripherals) | 5.0 | |
| iShares MSCI India ETF (United States of America, Investment Companies) | 4.3 | |
| HDFC Bank Ltd. sponsored ADR (India, Banks) | 3.6 | |
| Tencent Holdings Ltd. (Cayman Islands, Interactive Media & Services) | 3.2 | |
| Wal-Mart de Mexico SA de CV Series V (Mexico, Food & Staples Retailing) | 2.7 | |
| China Construction Bank Corp. (H Shares) (China, Banks) | 2.4 | |
| Alibaba Group Holding Ltd. sponsored ADR (Cayman Islands, Internet & Direct Marketing Retail) | 2.3 | |
| Reliance Industries Ltd. sponsored GDR (India, Oil, Gas & Consumable Fuels) | 2.3 | |
| LG Chemical Ltd. (Korea (South), Chemicals) | 2.1 | |
| 35.9 | ||
| Market Sectors (% of Fund's net assets) | ||
| Financials | 23.8 | |
| Information Technology | 22.3 | |
| Consumer Discretionary | 12.2 | |
| Communication Services | 8.2 | |
| Consumer Staples | 6.8 | |
| Materials | 6.3 | |
| Health Care | 5.4 | |
| Industrials | 3.5 | |
| Energy | 2.3 | |
| Utilities | 0.3 | |
| Real Estate | 0.3 | |
Asset Allocation (% of Fund's net assets) |
 |
Foreign investments - 90.7% |
Geographic Diversification (% of Fund's net assets) |
 |
* Includes Short-Term investments and Net Other Assets (Liabilities). Percentages are based on country or territory of incorporation and are adjusted for the effect of futures contracts, if applicable. |
| Common Stocks - 89.4% | |||
| Shares | Value ($) | ||
| Bermuda - 1.1% | |||
| Credicorp Ltd. (United States) | 96 | 14,051 | |
| Kunlun Energy Co. Ltd. | 10,414 | 6,222 | |
TOTAL BERMUDA | 20,273 | ||
| Brazil - 4.6% | |||
| Banco do Brasil SA | 1,219 | 8,736 | |
| Hypera SA | 1,939 | 19,073 | |
| Localiza Rent a Car SA | 2,701 | 36,885 | |
| Localiza Rent a Car SA | 6 | 82 | |
| Natura & Co. Holding SA (a) | 1,602 | 4,637 | |
| Suzano Papel e Celulose SA | 1,251 | 12,884 | |
TOTAL BRAZIL | 82,297 | ||
| Cayman Islands - 17.5% | |||
| Alibaba Group Holding Ltd. sponsored ADR (a) | 635 | 40,373 | |
| Bilibili, Inc. ADR (a) | 335 | 2,988 | |
| Chailease Holding Co. Ltd. | 1,196 | 5,525 | |
| JD.com, Inc. sponsored ADR | 676 | 25,208 | |
| Li Ning Co. Ltd. | 956 | 4,945 | |
| Meituan Class B (a)(b) | 1,937 | 31,012 | |
| NetEase, Inc. ADR | 318 | 17,687 | |
| Pinduoduo, Inc. ADR (a) | 386 | 21,164 | |
| Sea Ltd. ADR (a) | 273 | 13,563 | |
| Shenzhou International Group Holdings Ltd. | 648 | 4,499 | |
| Silergy Corp. | 1,236 | 14,332 | |
| Sunny Optical Technology Group Co. Ltd. | 414 | 3,589 | |
| Tencent Holdings Ltd. | 2,153 | 56,574 | |
| Trip.com Group Ltd. ADR (a) | 1,570 | 35,529 | |
| Wuxi Biologics (Cayman), Inc. (a)(b) | 3,364 | 15,137 | |
| XP, Inc. Class A (a) | 251 | 4,601 | |
| XPeng, Inc. ADR (a) | 449 | 2,972 | |
| Zai Lab Ltd. ADR (a) | 444 | 9,892 | |
TOTAL CAYMAN ISLANDS | 309,590 | ||
| China - 7.5% | |||
| China Construction Bank Corp. (H Shares) | 81,577 | 43,292 | |
| China Merchants Bank Co. Ltd. (H Shares) | 1,255 | 4,125 | |
| China Tourism Group Duty Free Corp. Ltd. (H Shares) (a)(b) | 234 | 4,630 | |
| Haier Smart Home Co. Ltd. | 3,131 | 7,834 | |
| Kweichow Moutai Co. Ltd. (A Shares) | 43 | 7,912 | |
| Ping An Insurance Group Co. of China Ltd. (H Shares) | 4,959 | 19,853 | |
| Shenzhen Mindray Bio-Medical Electronics Co. Ltd. (A Shares) | 674 | 30,036 | |
| Wuliangye Yibin Co. Ltd. (A Shares) | 839 | 15,337 | |
TOTAL CHINA | 133,019 | ||
| Hong Kong - 0.8% | |||
| China Resources Beer Holdings Co. Ltd. | 2,856 | 13,462 | |
| Hungary - 0.7% | |||
| Richter Gedeon PLC | 628 | 12,400 | |
| India - 9.8% | |||
| Axis Bank Ltd. GDR (Reg. S) | 175 | 9,450 | |
| HDFC Bank Ltd. sponsored ADR | 1,033 | 64,366 | |
| ICICI Bank Ltd. sponsored ADR | 1,089 | 24,002 | |
| Infosys Ltd. sponsored ADR | 1,868 | 34,988 | |
| Reliance Industries Ltd. sponsored GDR (b) | 658 | 40,171 | |
TOTAL INDIA | 172,977 | ||
| Indonesia - 5.6% | |||
| PT Avia Avian Tbk | 124,153 | 6,248 | |
| PT Bank Central Asia Tbk | 57,718 | 32,564 | |
| PT Bank Mandiri (Persero) Tbk | 44,291 | 29,958 | |
| PT Bank Rakyat Indonesia (Persero) Tbk | 42,149 | 12,566 | |
| PT Telkom Indonesia Persero Tbk | 63,271 | 17,770 | |
TOTAL INDONESIA | 99,106 | ||
| Korea (South) - 14.4% | |||
| Db Insurance Co. Ltd. | 136 | 5,364 | |
| Hansol Chemical Co. Ltd. | 57 | 7,408 | |
| Hyundai Fire & Marine Insurance Co. Ltd. | 377 | 8,796 | |
| Hyundai Motor Co. | 40 | 4,610 | |
| LG Chemical Ltd. | 86 | 37,718 | |
| LG Energy Solution (a) | 17 | 6,289 | |
| NAVER Corp. | 98 | 11,638 | |
| POSCO | 195 | 33,918 | |
| Samsung Electronics Co. Ltd. | 2,126 | 88,477 | |
| Shinhan Financial Group Co. Ltd. | 219 | 5,555 | |
| SK Hynix, Inc. | 548 | 31,752 | |
| Woori Financial Group, Inc. ADR | 550 | 13,695 | |
TOTAL KOREA (SOUTH) | 255,220 | ||
| Mexico - 5.2% | |||
| CEMEX S.A.B. de CV sponsored ADR (a) | 823 | 3,177 | |
| Grupo Aeroportuario del Sureste S.A.B. de CV Series B | 221 | 5,172 | |
| Grupo Aeroportuario Norte S.A.B. de CV | 1,910 | 15,216 | |
| Grupo Financiero Banorte S.A.B. de CV Series O | 2,634 | 21,410 | |
| Wal-Mart de Mexico SA de CV Series V | 12,326 | 47,611 | |
TOTAL MEXICO | 92,586 | ||
| Philippines - 0.3% | |||
| Ayala Land, Inc. | 13,180 | 5,832 | |
| Saudi Arabia - 0.5% | |||
| Dr Sulaiman Al Habib Medical Services Group Co. | 142 | 8,563 | |
| South Africa - 4.4% | |||
| Absa Group Ltd. | 1,772 | 19,269 | |
| Capitec Bank Holdings Ltd. | 31 | 3,207 | |
| Impala Platinum Holdings Ltd. | 1,091 | 11,170 | |
| MTN Group Ltd. | 3,352 | 23,694 | |
| Naspers Ltd. Class N | 196 | 20,204 | |
TOTAL SOUTH AFRICA | 77,544 | ||
| Taiwan - 13.8% | |||
| E.SUN Financial Holdings Co. Ltd. | 33,275 | 23,934 | |
| eMemory Technology, Inc. | 527 | 17,564 | |
| Hon Hai Precision Industry Co. Ltd. (Foxconn) GDR (Reg. S) | 4,106 | 25,539 | |
| MediaTek, Inc. | 1,608 | 29,414 | |
| Taiwan Semiconductor Manufacturing Co. Ltd. sponsored ADR | 2,295 | 141,257 | |
| Unimicron Technology Corp. | 1,789 | 6,906 | |
TOTAL TAIWAN | 244,614 | ||
| Thailand - 1.9% | |||
| CP ALL PCL (For. Reg.) | 15,603 | 24,607 | |
| SCB X PCL (For. Reg.) | 1,400 | 3,901 | |
| Thai Beverage PCL | 14,467 | 5,876 | |
TOTAL THAILAND | 34,384 | ||
| United Arab Emirates - 0.6% | |||
| Abu Dhabi Commercial Bank PJSC | 4,151 | 10,680 | |
| United States of America - 0.7% | |||
| Li Auto, Inc. ADR (a) | 894 | 12,176 | |
| TOTAL COMMON STOCKS (Cost $1,958,916) | 1,584,723 | ||
| Nonconvertible Preferred Stocks - 2.0% | |||
| Shares | Value ($) | ||
| Brazil - 2.0% | |||
Itau Unibanco Holding SA (Cost $33,879) | 6,094 | 35,864 | |
| Investment Companies - 6.0% | |||
| Shares | Value ($) | ||
| United States of America - 6.0% | |||
| iShares MSCI Emerging Markets Index ETF | 893 | 30,532 | |
| iShares MSCI India ETF | 1,786 | 75,369 | |
| TOTAL INVESTMENT COMPANIES (Cost $115,039) | 105,901 | ||
| Government Obligations - 0.6% | |||
Principal Amount (c) | Value ($) | ||
| United States of America - 0.6% | |||
U.S. Treasury Bills, yield at date of purchase 2.5% 11/10/22 (Cost $9,994) | 10,000 | 9,993 | |
| Money Market Funds - 3.2% | |||
| Shares | Value ($) | ||
Fidelity Cash Central Fund 3.10% (d) (Cost $56,344) | 56,333 | 56,344 | |
| TOTAL INVESTMENT IN SECURITIES - 101.2% (Cost $2,174,172) | 1,792,825 |
NET OTHER ASSETS (LIABILITIES) - (1.2)% | (20,554) |
| NET ASSETS - 100.0% | 1,772,271 |
| ETF | - | EXCHANGE-TRADED FUND |
| (a) | Non-income producing |
| (b) | Security exempt from registration under Rule 144A of the Securities Act of 1933. These securities may be resold in transactions exempt from registration, normally to qualified institutional buyers. At the end of the period, the value of these securities amounted to $90,950 or 5.1% of net assets. |
| (c) | Amount is stated in United States dollars unless otherwise noted. |
| (d) | Affiliated fund that is generally available only to investment companies and other accounts managed by Fidelity Investments. The rate quoted is the annualized seven-day yield of the fund at period end. A complete unaudited listing of the fund's holdings as of its most recent quarter end is available upon request. In addition, each Fidelity Central Fund's financial statements, which are not covered by the Fund's Report of Independent Registered Public Accounting Firm, are available on the SEC's website or upon request. |
| Affiliate | Value, beginning of period ($) | Purchases ($) | Sales Proceeds ($) | Dividend Income ($) | Realized Gain (loss) ($) | Change in Unrealized appreciation (depreciation) ($) | Value, end of period ($) | % ownership, end of period |
| Fidelity Cash Central Fund 3.10% | - | 2,356,796 | 2,300,452 | 1,314 | - | - | 56,344 | 0.0% |
| Total | - | 2,356,796 | 2,300,452 | 1,314 | - | - | 56,344 | |
| Valuation Inputs at Reporting Date: | ||||
| Description | Total ($) | Level 1 ($) | Level 2 ($) | Level 3 ($) |
Investments in Securities: | ||||
| Equities: | ||||
Communication Services | 143,914 | 69,570 | 74,344 | - |
Consumer Discretionary | 215,156 | 159,441 | 55,715 | - |
Consumer Staples | 119,442 | 119,442 | - | - |
Energy | 40,171 | 40,171 | - | - |
Financials | 424,764 | 356,064 | 68,700 | - |
Health Care | 95,101 | 79,964 | 15,137 | - |
Industrials | 63,644 | 63,644 | - | - |
Information Technology | 393,818 | 393,818 | - | - |
Materials | 112,523 | 67,435 | 45,088 | - |
Real Estate | 5,832 | - | 5,832 | - |
Utilities | 6,222 | 6,222 | - | - |
| Investment Companies | 105,901 | 105,901 | - | - |
| Government Obligations | 9,993 | - | 9,993 | - |
| Money Market Funds | 56,344 | 56,344 | - | - |
| Total Investments in Securities: | 1,792,825 | 1,518,016 | 274,809 | - |
| Statement of Assets and Liabilities | ||||
| October 31, 2022 | ||||
| Assets | ||||
| Investment in securities, at value - See accompanying schedule: | ||||
Unaffiliated issuers (cost $2,117,828) | $1,736,481 | |||
Fidelity Central Funds (cost $56,344) | 56,344 | |||
| Total Investment in Securities (cost $2,174,172) | $ | 1,792,825 | ||
| Foreign currency held at value (cost $236) | 236 | |||
| Receivable for investments sold | 23,837 | |||
| Receivable for fund shares sold | 2,402 | |||
| Dividends receivable | 1,689 | |||
| Distributions receivable from Fidelity Central Funds | 385 | |||
| Prepaid expenses | 11,369 | |||
| Receivable from investment adviser for expense reductions | 17,687 | |||
Total assets | 1,850,430 | |||
| Liabilities | ||||
| Payable to custodian bank | $3,560 | |||
| Payable for investments purchased | 23,911 | |||
| Accrued management fee | 1,144 | |||
| Audit fee payable | 42,503 | |||
| Custody fee payable | 5,264 | |||
| Other payables and accrued expenses | 1,777 | |||
| Total Liabilities | 78,159 | |||
| Net Assets | $ | 1,772,271 | ||
| Net Assets consist of: | ||||
| Paid in capital | $ | 2,272,615 | ||
| Total accumulated earnings (loss) | (500,344) | |||
| Net Assets | $ | 1,772,271 | ||
Net Asset Value , offering price and redemption price per share ($1,772,271 ÷ 233,048 shares) | $ | 7.60 | ||
| Statement of Operations | ||||
| For the period April 14, 2022 (commencement of operations) through October 31, 2022 | ||||
| Investment Income | ||||
| Dividends | $ | 23,856 | ||
| Income from Fidelity Central Funds | 1,314 | |||
| Income before foreign taxes withheld | 25,170 | |||
| Less foreign taxes withheld | (2,835) | |||
| Total Income | 22,335 | |||
| Expenses | ||||
| Management fee | $ | 7,779 | ||
| Custodian fees and expenses | 13,798 | |||
| Independent trustees' fees and expenses | 3 | |||
| Registration fees | 18,080 | |||
| Audit | 44,374 | |||
| Miscellaneous | 29 | |||
| Total expenses before reductions | 84,063 | |||
| Expense reductions | (74,474) | |||
| Total expenses after reductions | 9,589 | |||
| Net Investment income (loss) | 12,746 | |||
| Realized and Unrealized Gain (Loss) | ||||
| Net realized gain (loss) on: | ||||
| Investment Securities: | ||||
| Unaffiliated issuers | (116,769) | |||
| Foreign currency transactions | (2,458) | |||
| Futures contracts | (12,526) | |||
| Total net realized gain (loss) | (131,753) | |||
| Change in net unrealized appreciation (depreciation) on: | ||||
| Investment Securities: | ||||
| Unaffiliated issuers | (381,347) | |||
| Assets and liabilities in foreign currencies | 10 | |||
| Total change in net unrealized appreciation (depreciation) | (381,337) | |||
| Net gain (loss) | (513,090) | |||
| Net increase (decrease) in net assets resulting from operations | $ | (500,344) | ||
| Statement of Changes in Net Assets | ||
| For the period April 14, 2022 (commencement of operations) through October 31, 2022 | ||
| Increase (Decrease) in Net Assets | ||
| Operations | ||
| Net investment income (loss) | $ | 12,746 |
| Net realized gain (loss) | (131,753) | |
| Change in net unrealized appreciation (depreciation) | (381,337) | |
| Net increase (decrease) in net assets resulting from operations | (500,344) | |
| Share transactions | ||
| Proceeds from sales of shares | 2,279,784 | |
| Cost of shares redeemed | (7,169) | |
Net increase (decrease) in net assets resulting from share transactions | 2,272,615 | |
| Total increase (decrease) in net assets | 1,772,271 | |
| Net Assets | ||
| Beginning of period | - | |
| End of period | $ | 1,772,271 |
| Other Information | ||
| Shares | ||
| Sold | 233,926 | |
| Redeemed | (878) | |
| Net increase (decrease) | 233,048 | |
| Fidelity SAI Sustainable Emerging Markets Equity Fund |
| Years ended October 31, | 2022 A | |
Selected Per-Share Data | ||
| Net asset value, beginning of period | $ | 10.00 |
| Income from Investment Operations | ||
Net investment income (loss) B,C | .06 | |
| Net realized and unrealized gain (loss) | (2.46) | |
| Total from investment operations | (2.40) | |
| Net asset value, end of period | $ | 7.60 |
Total Return D,E | (24.00)% | |
Ratios to Average Net Assets C,F,G | ||
| Expenses before reductions | 6.38% H,I | |
| Expenses net of fee waivers, if any | .96% I | |
| Expenses net of all reductions | .96% I | |
| Net investment income (loss) | 1.27% I | |
| Supplemental Data | ||
| Net assets, end of period (000 omitted) | $ | 1,772 |
Portfolio turnover rate J | 74% I |
| Fidelity Central Fund | Investment Manager | Investment Objective | Investment Practices | Expense Ratio A |
| Fidelity Money Market Central Funds | Fidelity Management & Research Company LLC (FMR) | Each fund seeks to obtain a high level of current income consistent with the preservation of capital and liquidity. | Short-term Investments | Less than .005% |
| Gross unrealized appreciation | $34,750 |
| Gross unrealized depreciation | (452,532) |
| Net unrealized appreciation (depreciation) | $(417,782) |
| Tax Cost | $2,210,607 |
| Undistributed ordinary income | $10,316 |
| Capital loss carryforward | $(92,888) |
| Net unrealized appreciation (depreciation) on securities and other investments | $(417,772) |
| Short-term | $(85,372) |
| Long-term | (7,516) |
| Total capital loss carryforward | $(92,888) |
| Equity Risk | Equity risk relates to the fluctuations in the value of financial instruments as a result of changes in market prices (other than those arising from interest rate risk or foreign exchange risk), whether caused by factors specific to an individual investment, its issuer, or all factors affecting all instruments traded in a market or market segment. |
| Purchases ($) | Sales ($) | |
| Fidelity SAI Sustainable Emerging Markets Equity Fund | 2,914,962 | 690,138 |
| Amount | |
| Fidelity SAI Sustainable Emerging Markets Equity Fund | $7 |
| Purchases ($) | Sales ($) | Realized Gain (Loss) ($) | |
| Fidelity SAI Sustainable Emerging Markets Equity Fund | 17,081 | 3,047 | (2,071) |
| Fund | Affiliated % |
Fidelity SAI Sustainable Emerging Markets Equity Fund | 86% |
| The Example is based on an investment of $1,000 invested at the beginning of the period and held for the entire period (May 1, 2022 to October 31, 2022). |
Annualized Expense Ratio- A | Beginning Account Value May 1, 2022 | Ending Account Value October 31, 2022 | Expenses Paid During Period- C May 1, 2022 to October 31, 2022 | |||||||
| Fidelity® SAI Sustainable Emerging Markets Equity Fund | .96% | |||||||||
| Actual | $ 1,000 | $ 796.60 | $ 4.35 | |||||||
Hypothetical- B | $ 1,000 | $ 1,020.37 | $ 4.89 | |||||||
|


Contents
Board Approval of Investment Advisory Contracts and Management Fees |
| Average Annual Total Returns | |||
Periods ended October 31, 2022 | Past 1 year | Life of Fund A |
| Fidelity® International Discovery K6 Fund | -30.35% | 1.67% |
| $10,000 Over Life of Fund |
Let's say hypothetically that $10,000 was invested in Fidelity® International Discovery K6 Fund, on June 13, 2019, when the fund started. The chart shows how the value of your investment would have changed, and also shows how the MSCI EAFE Index performed over the same period. |
 |
Top Holdings (% of Fund's net assets) | ||
| Nestle SA (Reg. S) (Switzerland, Food Products) | 4.0 | |
| Roche Holding AG (participation certificate) (Switzerland, Pharmaceuticals) | 3.5 | |
| Equinor ASA (Norway, Oil, Gas & Consumable Fuels) | 3.4 | |
| LVMH Moet Hennessy Louis Vuitton SE (France, Textiles, Apparel & Luxury Goods) | 2.8 | |
| AstraZeneca PLC (United Kingdom) (United Kingdom, Pharmaceuticals) | 2.7 | |
| HDFC Bank Ltd. sponsored ADR (India, Banks) | 2.2 | |
| ASML Holding NV (Netherlands) (Netherlands, Semiconductors & Semiconductor Equipment) | 1.9 | |
| Housing Development Finance Corp. Ltd. (India, Diversified Financial Services) | 1.8 | |
| Hitachi Ltd. (Japan, Industrial Conglomerates) | 1.6 | |
| Canadian Natural Resources Ltd. (Canada, Oil, Gas & Consumable Fuels) | 1.6 | |
| 25.5 | ||
| Market Sectors (% of Fund's net assets) | ||
| Financials | 17.4 | |
| Health Care | 16.3 | |
| Industrials | 13.8 | |
| Information Technology | 13.0 | |
| Consumer Discretionary | 9.5 | |
| Consumer Staples | 8.5 | |
| Energy | 6.8 | |
| Materials | 5.4 | |
| Real Estate | 1.5 | |
| Communication Services | 1.5 | |
| Utilities | 0.7 | |
Asset Allocation (% of Fund's net assets) |
 |
Foreign investments - 94.1% |
Geographic Diversification (% of Fund's net assets) |
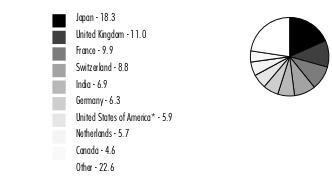 |
* Includes Short-Term investments and Net Other Assets (Liabilities). Percentages are based on country or territory of incorporation and are adjusted for the effect of futures contracts, if applicable. |
| Common Stocks - 94.3% | |||
| Shares | Value ($) | ||
| Australia - 2.2% | |||
| Bapcor Ltd. | 356,075 | 1,507,794 | |
| Flight Centre Travel Group Ltd. (a)(b) | 215,424 | 2,294,303 | |
| Iperionx Ltd. (a) | 938,256 | 426,110 | |
| Lynas Rare Earths Ltd. (a) | 341,169 | 1,817,845 | |
| National Storage REIT unit | 2,659,570 | 4,440,116 | |
TOTAL AUSTRALIA | 10,486,168 | ||
| Bailiwick of Jersey - 0.4% | |||
| JTC PLC (c) | 212,047 | 1,699,797 | |
| Belgium - 1.7% | |||
| KBC Group NV | 70,614 | 3,538,874 | |
| UCB SA | 56,877 | 4,289,848 | |
TOTAL BELGIUM | 7,828,722 | ||
| Brazil - 0.2% | |||
| Rede D'Oregon Sao Luiz SA (c) | 140,618 | 875,749 | |
| Canada - 4.6% | |||
| Canadian Natural Resources Ltd. | 124,742 | 7,481,682 | |
| Constellation Software, Inc. | 3,656 | 5,286,393 | |
| Definity Financial Corp. | 32,211 | 954,023 | |
| Nutrien Ltd. | 46,332 | 3,914,762 | |
| The Toronto-Dominion Bank | 53,771 | 3,441,328 | |
| Topicus.Com, Inc. (a) | 6,643 | 344,743 | |
TOTAL CANADA | 21,422,931 | ||
| Cayman Islands - 0.4% | |||
| Li Ning Co. Ltd. | 263,362 | 1,362,162 | |
| Medlive Technology Co. Ltd. (c) | 137,869 | 119,082 | |
| Silergy Corp. | 37,733 | 437,532 | |
TOTAL CAYMAN ISLANDS | 1,918,776 | ||
| China - 0.1% | |||
| Asymchem Laboratories Tianjin Co. Ltd. (H Shares) (c) | 16,838 | 180,185 | |
| WuXi AppTec Co. Ltd. (H Shares) (c) | 60,463 | 484,496 | |
TOTAL CHINA | 664,681 | ||
| Cyprus - 0.0% | |||
| Fix Price Group Ltd. GDR (Reg. S) (d) | 38,476 | 14,210 | |
| Denmark - 1.5% | |||
| DSV A/S | 27,012 | 3,656,908 | |
| ORSTED A/S (c) | 38,374 | 3,166,076 | |
TOTAL DENMARK | 6,822,984 | ||
| Finland - 0.5% | |||
| Musti Group OYJ | 35,727 | 671,543 | |
| Neste OYJ | 38,287 | 1,677,698 | |
TOTAL FINLAND | 2,349,241 | ||
| France - 9.9% | |||
| Air Liquide SA | 46,427 | 6,073,291 | |
| AXA SA | 259,149 | 6,399,661 | |
| BNP Paribas SA | 65,277 | 3,061,094 | |
| Capgemini SA | 39,909 | 6,540,720 | |
| Edenred SA | 63,235 | 3,247,084 | |
| EssilorLuxottica SA | 21,185 | 3,357,100 | |
| Exclusive Networks SA | 92,726 | 1,490,009 | |
| LVMH Moet Hennessy Louis Vuitton SE | 21,143 | 13,341,125 | |
| Teleperformance | 11,538 | 3,093,479 | |
TOTAL FRANCE | 46,603,563 | ||
| Germany - 6.3% | |||
| Brenntag SE | 55,027 | 3,338,838 | |
| Deutsche Borse AG | 30,863 | 5,018,934 | |
| Deutsche Post AG | 106,599 | 3,768,256 | |
| Linde PLC | 10,367 | 3,100,706 | |
| Merck KGaA | 24,855 | 4,050,499 | |
| Muenchener Rueckversicherungs-Gesellschaft AG in Muenchen | 8,914 | 2,353,083 | |
| Nexus AG | 22,732 | 1,219,844 | |
| Rheinmetall AG | 9,198 | 1,495,292 | |
| Siemens AG | 31,801 | 3,472,957 | |
| Siemens Healthineers AG (c) | 32,107 | 1,470,905 | |
| Talanx AG | 82 | 3,081 | |
TOTAL GERMANY | 29,292,395 | ||
| Hong Kong - 1.8% | |||
| AIA Group Ltd. | 838,996 | 6,355,222 | |
| Techtronic Industries Co. Ltd. | 218,834 | 2,072,089 | |
TOTAL HONG KONG | 8,427,311 | ||
| Hungary - 0.2% | |||
| Richter Gedeon PLC | 55,480 | 1,095,491 | |
| India - 6.9% | |||
| Avenue Supermarts Ltd. (a)(c) | 31,656 | 1,652,361 | |
| Delhivery Private Ltd. (a)(e) | 17,300 | 68,337 | |
| Eicher Motors Ltd. | 38,046 | 1,769,681 | |
| HDFC Bank Ltd. sponsored ADR | 162,078 | 10,099,080 | |
| Housing Development Finance Corp. Ltd. | 283,976 | 8,472,625 | |
| ITC Ltd. | 285,396 | 1,202,194 | |
| PVR Ltd. (a) | 42,827 | 918,313 | |
| Reliance Industries Ltd. | 164,145 | 5,055,618 | |
| Reliance Industries Ltd. sponsored GDR (c) | 25,699 | 1,568,924 | |
| Star Health & Allied Insurance Co. Ltd. | 62,392 | 537,809 | |
| Sunteck Realty Ltd. | 181,105 | 851,815 | |
TOTAL INDIA | 32,196,757 | ||
| Ireland - 1.8% | |||
| Cairn Homes PLC | 1,843,813 | 1,778,282 | |
| CRH PLC | 75,032 | 2,702,492 | |
| Dalata Hotel Group PLC (a) | 719,781 | 2,308,245 | |
| DCC PLC (United Kingdom) | 253 | 14,043 | |
| ICON PLC (a) | 7,125 | 1,409,610 | |
| Ryanair Holdings PLC (a) | 3,200 | 38,865 | |
TOTAL IRELAND | 8,251,537 | ||
| Italy - 0.4% | |||
| BFF Bank SpA (c) | 209,163 | 1,475,876 | |
| FinecoBank SpA | 35,900 | 483,922 | |
TOTAL ITALY | 1,959,798 | ||
| Japan - 18.3% | |||
| Daiichi Sankyo Kabushiki Kaisha | 115,367 | 3,692,986 | |
| FUJIFILM Holdings Corp. | 112,363 | 5,152,852 | |
| Fujitsu Ltd. | 22,523 | 2,591,463 | |
| Hitachi Ltd. | 169,924 | 7,725,117 | |
| Hoya Corp. | 72,402 | 6,755,962 | |
| Itochu Corp. | 186,238 | 4,820,808 | |
| JEOL Ltd. | 65,880 | 2,419,078 | |
| Keyence Corp. | 8,363 | 3,167,586 | |
| Minebea Mitsumi, Inc. | 279,413 | 4,141,540 | |
| Misumi Group, Inc. | 59,653 | 1,275,743 | |
| Mitsubishi UFJ Financial Group, Inc. | 616,748 | 2,913,426 | |
| Murata Manufacturing Co. Ltd. | 48,309 | 2,286,921 | |
| Olympus Corp. | 302,487 | 6,387,634 | |
| ORIX Corp. | 499,219 | 7,335,778 | |
| Persol Holdings Co. Ltd. | 147,852 | 2,969,071 | |
| Renesas Electronics Corp. (a) | 445,763 | 3,729,143 | |
| Shin-Etsu Chemical Co. Ltd. | 46,257 | 4,807,488 | |
| SMC Corp. | 4,724 | 1,896,224 | |
| Sony Group Corp. | 109,179 | 7,362,449 | |
| TIS, Inc. | 91,840 | 2,479,825 | |
| ZOZO, Inc. | 89,197 | 1,898,574 | |
TOTAL JAPAN | 85,809,668 | ||
| Luxembourg - 0.9% | |||
| Eurofins Scientific SA | 30,692 | 1,964,866 | |
| Globant SA (a) | 7,047 | 1,329,628 | |
| Samsonite International SA (a)(c) | 405,378 | 871,731 | |
TOTAL LUXEMBOURG | 4,166,225 | ||
| Netherlands - 5.7% | |||
| Airbus Group NV | 34,142 | 3,694,293 | |
| ASML Holding NV (Netherlands) | 18,792 | 8,815,086 | |
| Heineken NV (Bearer) | 53,112 | 4,440,479 | |
| IMCD NV | 14,327 | 1,859,032 | |
| ING Groep NV (Certificaten Van Aandelen) | 224,615 | 2,210,120 | |
| Koninklijke KPN NV | 1,310,789 | 3,666,416 | |
| RHI Magnesita NV | 27,394 | 581,814 | |
| Universal Music Group NV | 62,867 | 1,234,422 | |
TOTAL NETHERLANDS | 26,501,662 | ||
| New Zealand - 0.9% | |||
| EBOS Group Ltd. | 112,376 | 2,450,078 | |
| Ryman Healthcare Ltd. | 360,432 | 1,756,072 | |
TOTAL NEW ZEALAND | 4,206,150 | ||
| Norway - 3.4% | |||
| Equinor ASA | 437,161 | 15,927,403 | |
| Volue A/S (a) | 64,986 | 168,776 | |
TOTAL NORWAY | 16,096,179 | ||
| Singapore - 0.7% | |||
| United Overseas Bank Ltd. | 172,420 | 3,381,166 | |
| Spain - 1.7% | |||
| Aena SME SA (a)(c) | 8,621 | 1,013,239 | |
| Amadeus IT Holding SA Class A (a) | 85,597 | 4,464,338 | |
| Cellnex Telecom SA (c) | 36,501 | 1,194,687 | |
| Cie Automotive SA | 54,999 | 1,399,040 | |
TOTAL SPAIN | 8,071,304 | ||
| Sweden - 2.6% | |||
| ASSA ABLOY AB (B Shares) | 93,762 | 1,893,250 | |
| HEXPOL AB (B Shares) | 127,663 | 1,260,304 | |
| Indutrade AB | 116,390 | 2,038,185 | |
| Kry International AB (a)(d)(e) | 71 | 12,430 | |
| Lagercrantz Group AB (B Shares) | 185,223 | 1,589,490 | |
| Nibe Industrier AB (B Shares) | 108,245 | 863,709 | |
| Nordnet AB | 124,094 | 1,539,767 | |
| Svenska Handelsbanken AB (A Shares) | 306,900 | 2,851,419 | |
TOTAL SWEDEN | 12,048,554 | ||
| Switzerland - 8.8% | |||
| Lonza Group AG | 5,467 | 2,814,325 | |
| Nestle SA (Reg. S) | 170,805 | 18,593,623 | |
| Partners Group Holding AG | 3,531 | 3,171,500 | |
| Roche Holding AG (participation certificate) | 49,747 | 16,505,964 | |
TOTAL SWITZERLAND | 41,085,412 | ||
| Taiwan - 1.0% | |||
| MediaTek, Inc. | 101,732 | 1,860,913 | |
| Taiwan Semiconductor Manufacturing Co. Ltd. | 221,415 | 2,659,298 | |
TOTAL TAIWAN | 4,520,211 | ||
| United Kingdom - 11.0% | |||
| AstraZeneca PLC (United Kingdom) | 108,288 | 12,705,668 | |
| BAE Systems PLC | 413,702 | 3,869,591 | |
| Beazley PLC | 241,765 | 1,731,464 | |
| Big Yellow Group PLC | 140,969 | 1,820,328 | |
| Bunzl PLC | 154,755 | 5,042,009 | |
| Bytes Technology Group PLC | 60,071 | 247,451 | |
| Compass Group PLC | 333,343 | 7,020,812 | |
| Dechra Pharmaceuticals PLC | 36,839 | 1,106,870 | |
| Diageo PLC | 179,462 | 7,385,313 | |
| Dr. Martens Ltd. | 273,351 | 779,936 | |
| M&G PLC | 756,491 | 1,519,937 | |
| Reckitt Benckiser Group PLC | 96,634 | 6,413,021 | |
| Smart Metering Systems PLC | 184,164 | 1,545,979 | |
| Starling Bank Ltd. Series D (a)(d)(e) | 137,500 | 444,672 | |
| Zegona Communications PLC (a) | 19,285 | 16,587 | |
TOTAL UNITED KINGDOM | 51,649,638 | ||
| United States of America - 0.4% | |||
| Mobileye Global, Inc. (a) | 8,300 | 218,954 | |
| NICE Ltd. sponsored ADR (a) | 9,919 | 1,883,519 | |
TOTAL UNITED STATES OF AMERICA | 2,102,473 | ||
| TOTAL COMMON STOCKS (Cost $507,049,567) | 441,548,753 | ||
| Preferred Stocks - 0.2% | |||
| Shares | Value ($) | ||
| Convertible Preferred Stocks - 0.2% | |||
| China - 0.1% | |||
| ByteDance Ltd. Series E1 (a)(d)(e) | 1,533 | 240,712 | |
| dMed Biopharmaceutical Co. Ltd. Series C (a)(d)(e) | 8,434 | 75,653 | |
| 316,365 | |||
| Estonia - 0.1% | |||
| Bolt Technology OU Series E (d)(e) | 3,347 | 408,895 | |
TOTAL CONVERTIBLE PREFERRED STOCKS | 725,260 | ||
| Nonconvertible Preferred Stocks - 0.0% | |||
| Sweden - 0.0% | |||
| Kry International AB Series E (a)(d)(e) | 413 | 72,303 | |
| TOTAL PREFERRED STOCKS (Cost $1,346,117) | 797,563 | ||
| Money Market Funds - 6.2% | |||
| Shares | Value ($) | ||
| Fidelity Cash Central Fund 3.10% (f) | 27,101,106 | 27,106,527 | |
| Fidelity Securities Lending Cash Central Fund 3.10% (f)(g) | 1,938,597 | 1,938,791 | |
| TOTAL MONEY MARKET FUNDS (Cost $29,045,318) | 29,045,318 | ||
| TOTAL INVESTMENT IN SECURITIES - 100.7% (Cost $537,441,002) | 471,391,634 |
NET OTHER ASSETS (LIABILITIES) - (0.7)% | (3,339,228) |
| NET ASSETS - 100.0% | 468,052,406 |
| (a) | Non-income producing |
| (b) | Security or a portion of the security is on loan at period end. |
| (c) | Security exempt from registration under Rule 144A of the Securities Act of 1933. These securities may be resold in transactions exempt from registration, normally to qualified institutional buyers. At the end of the period, the value of these securities amounted to $15,773,108 or 3.4% of net assets. |
| (d) | Level 3 security |
| (e) | Restricted securities (including private placements) - Investment in securities not registered under the Securities Act of 1933 (excluding 144A issues). At the end of the period, the value of restricted securities (excluding 144A issues) amounted to $1,323,002 or 0.3% of net assets. |
| (f) | Affiliated fund that is generally available only to investment companies and other accounts managed by Fidelity Investments. The rate quoted is the annualized seven-day yield of the fund at period end. A complete unaudited listing of the fund's holdings as of its most recent quarter end is available upon request. In addition, each Fidelity Central Fund's financial statements, which are not covered by the Fund's Report of Independent Registered Public Accounting Firm, are available on the SEC's website or upon request. |
| (g) | Investment made with cash collateral received from securities on loan. |
| Additional information on each restricted holding is as follows: | ||
| Security | Acquisition Date | Acquisition Cost ($) |
| Bolt Technology OU Series E | 1/03/22 | 869,539 |
| ByteDance Ltd. Series E1 | 11/18/20 | 167,977 |
| Delhivery Private Ltd. | 5/20/21 | 84,445 |
| dMed Biopharmaceutical Co. Ltd. Series C | 12/01/20 | 119,789 |
| Kry International AB | 5/14/21 | 30,836 |
| Kry International AB Series E | 5/14/21 | 188,812 |
| Starling Bank Ltd. Series D | 6/18/21 - 4/05/22 | 286,270 |
| Affiliate | Value, beginning of period ($) | Purchases ($) | Sales Proceeds ($) | Dividend Income ($) | Realized Gain (loss) ($) | Change in Unrealized appreciation (depreciation) ($) | Value, end of period ($) | % ownership, end of period |
| Fidelity Cash Central Fund 3.10% | 12,924,183 | 177,857,021 | 163,674,677 | 306,191 | - | - | 27,106,527 | 0.1% |
| Fidelity Securities Lending Cash Central Fund 3.10% | 56,848 | 50,596,093 | 48,714,150 | 70,255 | - | - | 1,938,791 | 0.0% |
| Total | 12,981,031 | 228,453,114 | 212,388,827 | 376,446 | - | - | 29,045,318 | |
| Valuation Inputs at Reporting Date: | ||||
| Description | Total ($) | Level 1 ($) | Level 2 ($) | Level 3 ($) |
Investments in Securities: | ||||
| Equities: | ||||
Communication Services | 7,030,425 | 934,900 | 6,095,525 | - |
Consumer Discretionary | 44,379,887 | 16,641,291 | 27,724,386 | 14,210 |
Consumer Staples | 39,686,991 | 7,295,034 | 32,391,957 | - |
Energy | 31,711,325 | 15,783,922 | 15,927,403 | - |
Financials | 80,993,658 | 45,847,153 | 34,701,833 | 444,672 |
Health Care | 77,187,965 | 35,871,965 | 41,240,347 | 75,653 |
Industrials | 65,666,854 | 40,540,915 | 25,125,939 | - |
Information Technology | 60,726,064 | 28,904,755 | 31,086,969 | 734,340 |
Materials | 24,684,812 | 11,101,541 | 13,583,271 | - |
Real Estate | 7,112,259 | 7,112,259 | - | - |
Utilities | 3,166,076 | - | 3,166,076 | - |
| Money Market Funds | 29,045,318 | 29,045,318 | - | - |
| Total Investments in Securities: | 471,391,634 | 239,079,053 | 231,043,706 | 1,268,875 |
| Statement of Assets and Liabilities | ||||
| October 31, 2022 | ||||
| Assets | ||||
| Investment in securities, at value (including securities loaned of $1,838,575) - See accompanying schedule: | ||||
Unaffiliated issuers (cost $508,395,684) | $442,346,316 | |||
Fidelity Central Funds (cost $29,045,318) | 29,045,318 | |||
| Total Investment in Securities (cost $537,441,002) | $ | 471,391,634 | ||
| Cash | 3 | |||
| Foreign currency held at value (cost $29,860) | 29,855 | |||
| Receivable for fund shares sold | 466,328 | |||
| Dividends receivable | 669,896 | |||
| Reclaims receivable | 683,558 | |||
| Distributions receivable from Fidelity Central Funds | 79,358 | |||
| Other receivables | 214 | |||
Total assets | 473,320,846 | |||
| Liabilities | ||||
| Payable for investments purchased | $2,520,394 | |||
| Payable for fund shares redeemed | 423,114 | |||
| Accrued management fee | 225,270 | |||
| Other payables and accrued expenses | 160,871 | |||
| Collateral on securities loaned | 1,938,791 | |||
| Total Liabilities | 5,268,440 | |||
| Net Assets | $ | 468,052,406 | ||
| Net Assets consist of: | ||||
| Paid in capital | $ | 593,989,112 | ||
| Total accumulated earnings (loss) | (125,936,706) | |||
| Net Assets | $ | 468,052,406 | ||
Net Asset Value , offering price and redemption price per share ($468,052,406 ÷ 45,736,181 shares) | $ | 10.23 | ||
| Statement of Operations | ||||
Year ended October 31, 2022 | ||||
| Investment Income | ||||
| Dividends | $ | 11,832,018 | ||
| Non-Cash dividends | 1,314,280 | |||
| Interest | 234 | |||
| Income from Fidelity Central Funds (including $70,255 from security lending) | 376,446 | |||
| Income before foreign taxes withheld | 13,522,978 | |||
| Less foreign taxes withheld | (1,383,852) | |||
| Total Income | 12,139,126 | |||
| Expenses | ||||
| Management fee | $ | 2,819,601 | ||
| Independent trustees' fees and expenses | 1,547 | |||
| Total expenses before reductions | 2,821,148 | |||
| Expense reductions | (22) | |||
| Total expenses after reductions | 2,821,126 | |||
| Net Investment income (loss) | 9,318,000 | |||
| Realized and Unrealized Gain (Loss) | ||||
| Net realized gain (loss) on: | ||||
| Investment Securities: | ||||
| Unaffiliated issuers(net of foreign taxes of $601) | (61,649,459) | |||
| Foreign currency transactions | (212,876) | |||
| Total net realized gain (loss) | (61,862,335) | |||
| Change in net unrealized appreciation (depreciation) on: | ||||
| Investment Securities: | ||||
| Unaffiliated issuers (net of decrease in deferred foreign taxes of $169,401) | (118,346,811) | |||
| Assets and liabilities in foreign currencies | (71,347) | |||
| Total change in net unrealized appreciation (depreciation) | (118,418,158) | |||
| Net gain (loss) | (180,280,493) | |||
| Net increase (decrease) in net assets resulting from operations | $ | (170,962,493) | ||
| Statement of Changes in Net Assets | ||||
Year ended October 31, 2022 | Year ended October 31, 2021 | |||
| Increase (Decrease) in Net Assets | ||||
| Operations | ||||
| Net investment income (loss) | $ | 9,318,000 | $ | 2,727,816 |
| Net realized gain (loss) | (61,862,335) | (664,469) | ||
| Change in net unrealized appreciation (depreciation) | (118,418,158) | 43,685,166 | ||
| Net increase (decrease) in net assets resulting from operations | (170,962,493) | 45,748,513 | ||
| Distributions to shareholders | (8,038,015) | (779,078) | ||
| Share transactions | ||||
| Proceeds from sales of shares | 304,547,005 | 350,979,730 | ||
| Reinvestment of distributions | 8,038,015 | 779,078 | ||
| Cost of shares redeemed | (96,424,320) | (69,009,150) | ||
Net increase (decrease) in net assets resulting from share transactions | 216,160,700 | 282,749,658 | ||
| Total increase (decrease) in net assets | 37,160,192 | 327,719,093 | ||
| Net Assets | ||||
| Beginning of period | 430,892,214 | 103,173,121 | ||
| End of period | $ | 468,052,406 | $ | 430,892,214 |
| Other Information | ||||
| Shares | ||||
| Sold | 24,327,055 | 24,312,789 | ||
| Issued in reinvestment of distributions | 555,879 | 60,865 | ||
| Redeemed | (7,923,935) | (4,731,209) | ||
| Net increase (decrease) | 16,958,999 | 19,642,445 | ||
| Fidelity® International Discovery K6 Fund |
| Years ended October 31, | 2022 | 2021 | 2020 | 2019 A | ||||
Selected Per-Share Data | ||||||||
| Net asset value, beginning of period | $ | 14.97 | $ | 11.29 | $ | 10.49 | $ | 10.00 |
| Income from Investment Operations | ||||||||
Net investment income (loss) B,C | .24 | .16 | .12 | .06 D | ||||
| Net realized and unrealized gain (loss) | (4.70) | 3.60 | .77 | .43 | ||||
| Total from investment operations | (4.46) | 3.76 | .89 | .49 | ||||
| Distributions from net investment income | (.28) | (.08) | (.04) | - | ||||
| Distributions from net realized gain | - | - | (.05) | - | ||||
| Total distributions | (.28) | (.08) | (.09) | - | ||||
| Net asset value, end of period | $ | 10.23 | $ | 14.97 | $ | 11.29 | $ | 10.49 |
Total Return E,F | (30.35)% | 33.43% | 8.51% | 4.90% | ||||
Ratios to Average Net Assets C,G,H | ||||||||
| Expenses before reductions | .60% | .60% | .60% | .60% I | ||||
| Expenses net of fee waivers, if any | .60% | .60% | .60% | .60% I | ||||
| Expenses net of all reductions | .60% | .60% | .60% | .60% I | ||||
| Net investment income (loss) | 1.98% | 1.11% | 1.16% | 1.67% D,I | ||||
| Supplemental Data | ||||||||
| Net assets, end of period (000 omitted) | $ | 468,052 | $ | 430,892 | $ | 103,173 | $ | 61,421 |
Portfolio turnover rate J | 50% K | 58% K | 42% K | 59% K,L |
| Fidelity Central Fund | Investment Manager | Investment Objective | Investment Practices | Expense Ratio A |
| Fidelity Money Market Central Funds | Fidelity Management & Research Company LLC (FMR) | Each fund seeks to obtain a high level of current income consistent with the preservation of capital and liquidity. | Short-term Investments | Less than .005% |
| Gross unrealized appreciation | $19,029,918 |
| Gross unrealized depreciation | (86,775,072) |
| Net unrealized appreciation (depreciation) | $(67,745,154) |
| Tax Cost | $539,136,788 |
| Undistributed ordinary income | $4,831,606 |
| Capital loss carryforward | $(62,786,514) |
| Net unrealized appreciation (depreciation) on securities and other investments | $(67,820,930) |
| Short-term | $(55,440,972) |
| Long-term | (7,345,542) |
| Total capital loss carryforward | $(62,786,514) |
| October 31, 2022 | October 31, 2021 | |
| Ordinary Income | $ 8,038,015 | $779,078 |
| Purchases ($) | Sales ($) | |
| Fidelity International Discovery K6 Fund | 228,723,368 | 212,541,160 |
| Shares | Total Proceeds ($) | |
| Fidelity International Discovery K6 Fund | 15,540,854 | 197,763,447 |
| Shares | Total Proceeds ($) | |
| Fidelity International Discovery K6 Fund | 18,759,599 | 272,598,908 |
| Amount | |
| Fidelity International Discovery K6 Fund | $166 |
| Purchases ($) | Sales ($) | Realized Gain (Loss) ($) | |
| Fidelity International Discovery K6 Fund | 4,590,055 | 6,794,531 | (2,547,798) |
| Total Security Lending Fees Paid to NFS | Security Lending Income From Securities Loaned to NFS | Value of Securities Loaned to NFS at Period End | |
| Fidelity International Discovery K6 Fund | $7,547 | $- | $- |
| The Example is based on an investment of $1,000 invested at the beginning of the period and held for the entire period (May 1, 2022 to October 31, 2022). |
Annualized Expense Ratio- A | Beginning Account Value May 1, 2022 | Ending Account Value October 31, 2022 | Expenses Paid During Period- C May 1, 2022 to October 31, 2022 | |||||||
| Fidelity® International Discovery K6 Fund | .60% | |||||||||
| Actual | $ 1,000 | $ 868.40 | $ 2.83 | |||||||
Hypothetical- B | $ 1,000 | $ 1,022.18 | $ 3.06 | |||||||
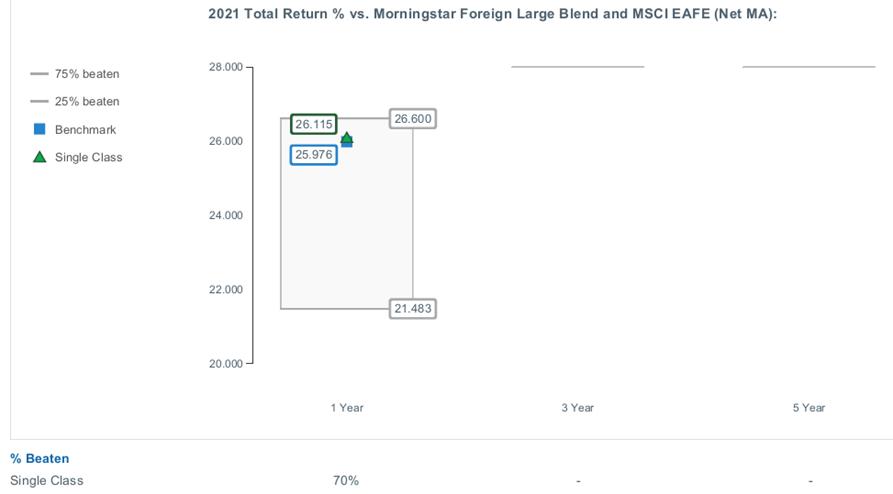
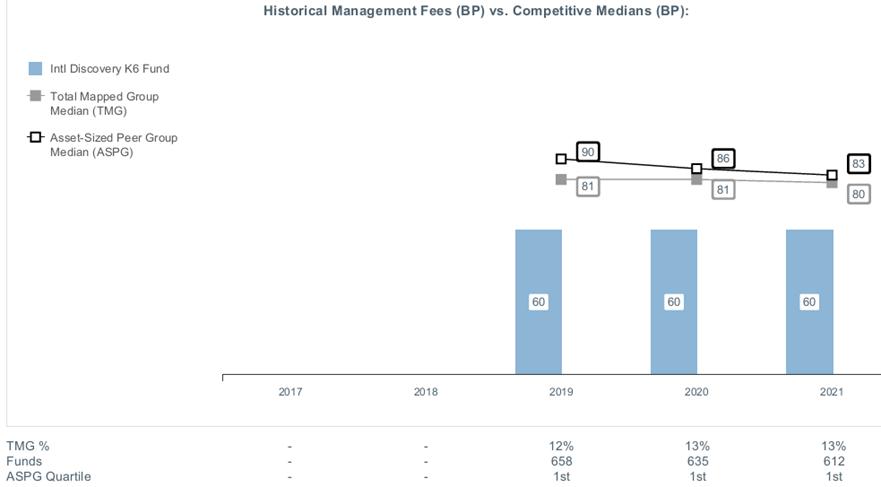
|


Contents
Board Approval of Investment Advisory Contracts and Management Fees |
| Average Annual Total Returns | |||
Periods ended October 31, 2022 | Past 1 year | Past 5 years | Life of Fund A |
| Fidelity® International Capital Appreciation K6 Fund | -30.83% | 2.77% | 4.38% |
| $10,000 Over Life of Fund |
Let's say hypothetically that $10,000 was invested in Fidelity® International Capital Appreciation K6 Fund, on May 25, 2017, when the fund started. The chart shows how the value of your investment would have changed, and also shows how the MSCI ACWI (All Country World Index) ex USA Index performed over the same period. |
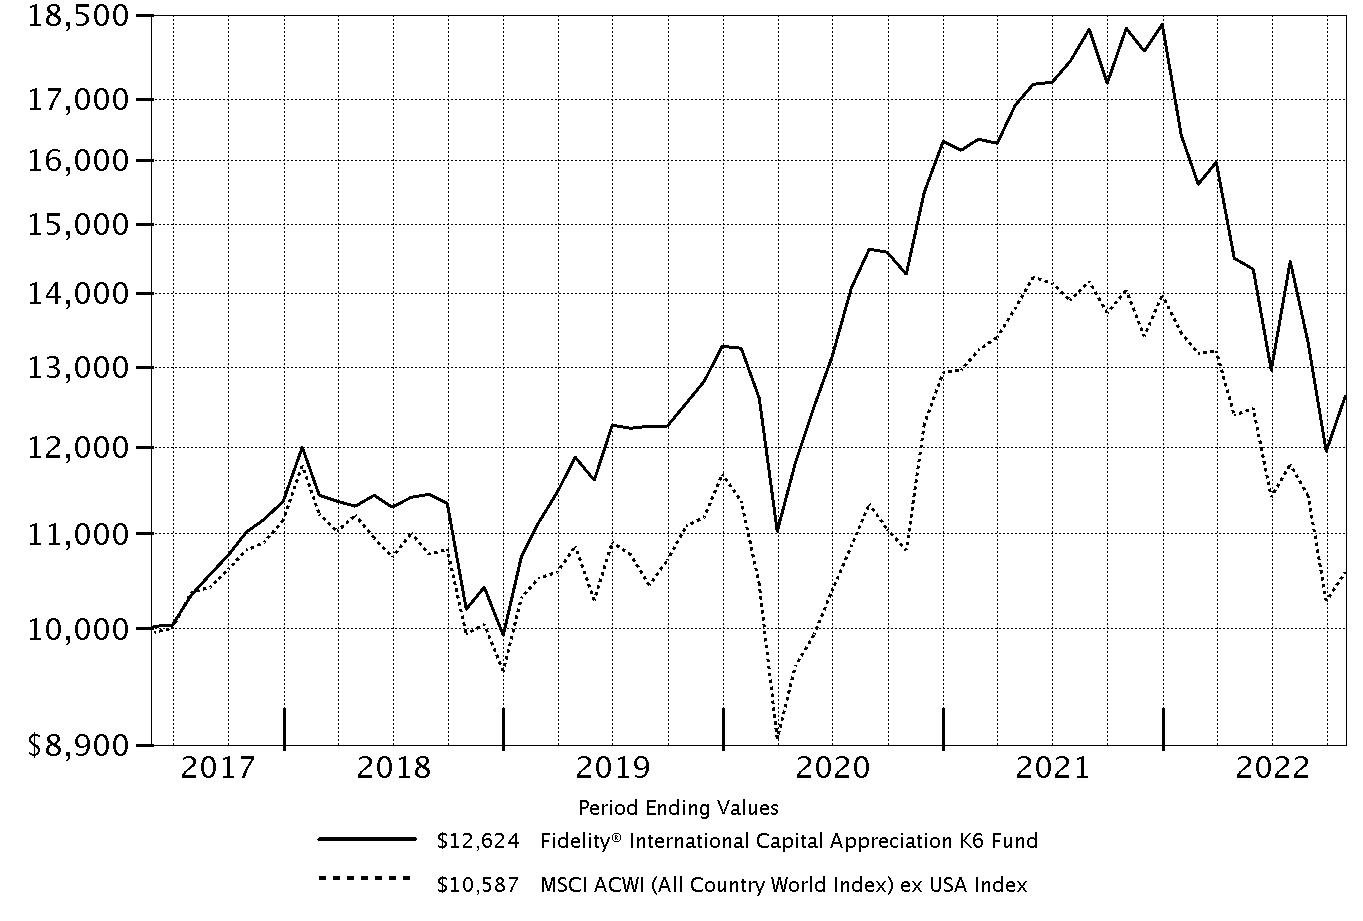 |
Top Holdings (% of Fund's net assets) | ||
| Nestle SA (Reg. S) (Switzerland, Food Products) | 3.0 | |
| LVMH Moet Hennessy Louis Vuitton SE (France, Textiles, Apparel & Luxury Goods) | 2.7 | |
| Taiwan Semiconductor Manufacturing Co. Ltd. (Taiwan, Semiconductors & Semiconductor Equipment) | 2.7 | |
| ASML Holding NV (Netherlands) (Netherlands, Semiconductors & Semiconductor Equipment) | 2.6 | |
| Novo Nordisk A/S Series B (Denmark, Pharmaceuticals) | 2.5 | |
| AstraZeneca PLC (United Kingdom) (United Kingdom, Pharmaceuticals) | 2.5 | |
| L'Oreal SA (France, Personal Products) | 2.2 | |
| Keyence Corp. (Japan, Electronic Equipment & Components) | 2.2 | |
| Canadian Pacific Railway Ltd. (Canada, Road & Rail) | 2.1 | |
| Hermes International SCA (France, Textiles, Apparel & Luxury Goods) | 2.0 | |
| 24.5 | ||
| Market Sectors (% of Fund's net assets) | ||
| Information Technology | 28.7 | |
| Industrials | 20.9 | |
| Health Care | 14.5 | |
| Consumer Discretionary | 11.7 | |
| Financials | 10.5 | |
| Consumer Staples | 7.1 | |
| Materials | 5.3 | |
Asset Allocation (% of Fund's net assets) |
 |
Foreign investments - 84.1% |
Geographic Diversification (% of Fund's net assets) |
 |
* Includes Short-Term investments and Net Other Assets (Liabilities). Percentages are based on country or territory of incorporation and are adjusted for the effect of futures contracts, if applicable. |
| Common Stocks - 98.7% | |||
| Shares | Value ($) | ||
| Canada - 9.1% | |||
| Canadian National Railway Co. | 122,174 | 14,474,169 | |
| Canadian Pacific Railway Ltd. | 216,886 | 16,168,343 | |
| Constellation Software, Inc. | 9,521 | 13,766,890 | |
| Thomson Reuters Corp. | 128,441 | 13,660,085 | |
| Waste Connections, Inc. (Canada) | 87,088 | 11,494,325 | |
TOTAL CANADA | 69,563,812 | ||
| Denmark - 4.3% | |||
| DSV A/S | 101,679 | 13,765,390 | |
| Novo Nordisk A/S Series B | 173,177 | 18,829,754 | |
TOTAL DENMARK | 32,595,144 | ||
| France - 15.0% | |||
| Capgemini SA | 77,900 | 12,767,097 | |
| Dassault Systemes SA | 382,298 | 12,814,162 | |
| Hermes International SCA | 12,029 | 15,578,778 | |
| Kering SA | 26,820 | 12,282,523 | |
| L'Oreal SA | 52,412 | 16,457,598 | |
| LVMH Moet Hennessy Louis Vuitton SE | 32,863 | 20,736,385 | |
| Sartorius Stedim Biotech | 37,377 | 11,864,428 | |
| Teleperformance | 44,197 | 11,849,756 | |
TOTAL FRANCE | 114,350,727 | ||
| Germany - 1.5% | |||
| Nemetschek SE | 240,100 | 11,474,804 | |
| India - 3.7% | |||
| HDFC Bank Ltd. (a) | 803,714 | 14,585,728 | |
| Infosys Ltd. sponsored ADR | 715,600 | 13,403,188 | |
TOTAL INDIA | 27,988,916 | ||
| Ireland - 4.9% | |||
| Accenture PLC Class A | 44,240 | 12,559,736 | |
| Kingspan Group PLC (Ireland) | 231,105 | 11,670,704 | |
| Linde PLC | 44,268 | 13,163,090 | |
TOTAL IRELAND | 37,393,530 | ||
| Japan - 6.9% | |||
| Hoya Corp. | 140,363 | 13,097,526 | |
| Keyence Corp. | 43,398 | 16,437,509 | |
| Recruit Holdings Co. Ltd. | 371,100 | 11,419,181 | |
| Tokyo Electron Ltd. | 43,612 | 11,474,170 | |
TOTAL JAPAN | 52,428,386 | ||
| Luxembourg - 1.5% | |||
| Eurofins Scientific SA | 181,403 | 11,613,209 | |
| Netherlands - 7.7% | |||
| ASM International NV (Netherlands) | 49,271 | 10,945,976 | |
| ASML Holding NV (Netherlands) | 41,759 | 19,588,611 | |
| Ferrari NV (Italy) | 72,356 | 14,265,411 | |
| Wolters Kluwer NV | 132,859 | 14,121,090 | |
TOTAL NETHERLANDS | 58,921,088 | ||
| Sweden - 3.6% | |||
| Atlas Copco AB (A Shares) (b) | 1,387,145 | 14,805,351 | |
| Hexagon AB (B Shares) | 1,275,609 | 12,610,538 | |
TOTAL SWEDEN | 27,415,889 | ||
| Switzerland - 10.2% | |||
| Compagnie Financiere Richemont SA Series A | 139,360 | 13,620,148 | |
| Givaudan SA | 4,148 | 12,385,799 | |
| Nestle SA (Reg. S) | 211,770 | 23,053,026 | |
| Partners Group Holding AG | 15,498 | 13,920,109 | |
| Sika AG | 65,698 | 14,813,311 | |
TOTAL SWITZERLAND | 77,792,393 | ||
| Taiwan - 2.7% | |||
| Taiwan Semiconductor Manufacturing Co. Ltd. | 1,702,640 | 20,449,503 | |
| United Kingdom - 13.0% | |||
| AstraZeneca PLC (United Kingdom) | 159,900 | 18,761,417 | |
| Compass Group PLC | 625,033 | 13,164,337 | |
| Diageo PLC | 362,783 | 14,929,433 | |
| Halma PLC | 502,200 | 12,180,771 | |
| London Stock Exchange Group PLC | 151,400 | 13,123,662 | |
| RELX PLC (London Stock Exchange) | 500,484 | 13,443,248 | |
| Rentokil Initial PLC | 2,182,633 | 13,619,871 | |
TOTAL UNITED KINGDOM | 99,222,739 | ||
| United States of America - 14.6% | |||
| Danaher Corp. | 48,772 | 12,274,449 | |
| Marsh & McLennan Companies, Inc. | 83,878 | 13,545,458 | |
| Moody's Corp. | 48,047 | 12,726,209 | |
| NICE Ltd. sponsored ADR (a)(b) | 66,703 | 12,666,233 | |
| NVIDIA Corp. | 88,950 | 12,005,582 | |
| S&P Global, Inc. | 38,386 | 12,331,503 | |
| Thermo Fisher Scientific, Inc. | 24,180 | 12,427,795 | |
| Visa, Inc. Class A | 58,540 | 12,127,146 | |
| Zoetis, Inc. Class A | 78,362 | 11,815,422 | |
TOTAL UNITED STATES OF AMERICA | 111,919,797 | ||
| TOTAL COMMON STOCKS (Cost $716,171,863) | 753,129,937 | ||
| Money Market Funds - 3.0% | |||
| Shares | Value ($) | ||
| Fidelity Cash Central Fund 3.10% (c) | 9,864,119 | 9,866,092 | |
| Fidelity Securities Lending Cash Central Fund 3.10% (c)(d) | 13,241,943 | 13,243,268 | |
| TOTAL MONEY MARKET FUNDS (Cost $23,109,360) | 23,109,360 | ||
| TOTAL INVESTMENT IN SECURITIES - 101.7% (Cost $739,281,223) | 776,239,297 |
NET OTHER ASSETS (LIABILITIES) - (1.7)% | (13,121,565) |
| NET ASSETS - 100.0% | 763,117,732 |
| (a) | Non-income producing |
| (b) | Security or a portion of the security is on loan at period end. |
| (c) | Affiliated fund that is generally available only to investment companies and other accounts managed by Fidelity Investments. The rate quoted is the annualized seven-day yield of the fund at period end. A complete unaudited listing of the fund's holdings as of its most recent quarter end is available upon request. In addition, each Fidelity Central Fund's financial statements, which are not covered by the Fund's Report of Independent Registered Public Accounting Firm, are available on the SEC's website or upon request. |
| (d) | Investment made with cash collateral received from securities on loan. |
| Affiliate | Value, beginning of period ($) | Purchases ($) | Sales Proceeds ($) | Dividend Income ($) | Realized Gain (loss) ($) | Change in Unrealized appreciation (depreciation) ($) | Value, end of period ($) | % ownership, end of period |
| Fidelity Cash Central Fund 3.10% | 17,246,777 | 424,938,808 | 432,319,493 | 90,278 | - | - | 9,866,092 | 0.0% |
| Fidelity Securities Lending Cash Central Fund 3.10% | - | 182,101,238 | 168,857,970 | 35,581 | - | - | 13,243,268 | 0.0% |
| Total | 17,246,777 | 607,040,046 | 601,177,463 | 125,859 | - | - | 23,109,360 | |
| Valuation Inputs at Reporting Date: | ||||
| Description | Total ($) | Level 1 ($) | Level 2 ($) | Level 3 ($) |
Investments in Securities: | ||||
| Equities: | ||||
Consumer Discretionary | 89,647,582 | 29,844,189 | 59,803,393 | - |
Consumer Staples | 54,440,057 | - | 54,440,057 | - |
Financials | 80,232,669 | 52,523,279 | 27,709,390 | - |
Health Care | 110,684,000 | 73,092,829 | 37,591,171 | - |
Industrials | 160,491,513 | 107,203,862 | 53,287,651 | - |
Information Technology | 217,271,916 | 127,567,835 | 89,704,081 | - |
Materials | 40,362,200 | 25,548,889 | 14,813,311 | - |
| Money Market Funds | 23,109,360 | 23,109,360 | - | - |
| Total Investments in Securities: | 776,239,297 | 438,890,243 | 337,349,054 | - |
| Statement of Assets and Liabilities | ||||
| October 31, 2022 | ||||
| Assets | ||||
| Investment in securities, at value (including securities loaned of $12,807,383) - See accompanying schedule: | ||||
Unaffiliated issuers (cost $716,171,863) | $753,129,937 | |||
Fidelity Central Funds (cost $23,109,360) | 23,109,360 | |||
| Total Investment in Securities (cost $739,281,223) | $ | 776,239,297 | ||
| Foreign currency held at value (cost $132,164) | 131,123 | |||
| Receivable for investments sold | 38,195 | |||
| Receivable for fund shares sold | 731,332 | |||
| Dividends receivable | 557,320 | |||
| Reclaims receivable | 1,069,450 | |||
| Distributions receivable from Fidelity Central Funds | 24,249 | |||
| Other receivables | 162,754 | |||
Total assets | 778,953,720 | |||
| Liabilities | ||||
| Payable for investments purchased | $1,664,353 | |||
| Payable for fund shares redeemed | 313,757 | |||
| Accrued management fee | 403,596 | |||
| Other payables and accrued expenses | 211,014 | |||
| Collateral on securities loaned | 13,243,268 | |||
| Total Liabilities | 15,835,988 | |||
| Net Assets | $ | 763,117,732 | ||
| Net Assets consist of: | ||||
| Paid in capital | $ | 797,073,028 | ||
| Total accumulated earnings (loss) | (33,955,296) | |||
| Net Assets | $ | 763,117,732 | ||
Net Asset Value , offering price and redemption price per share ($763,117,732 ÷ 67,580,795 shares) | $ | 11.29 | ||
| Statement of Operations | ||||
Year ended October 31, 2022 | ||||
| Investment Income | ||||
| Dividends | $ | 9,998,380 | ||
| Foreign Tax Reclaims | 541,027 | |||
| Income from Fidelity Central Funds (including $35,581 from security lending) | 125,859 | |||
| Income before foreign taxes withheld | 10,665,266 | |||
| Less foreign taxes withheld | (1,583,988) | |||
| Total Income | 9,081,278 | |||
| Expenses | ||||
| Management fee | $ | 5,421,271 | ||
| Independent trustees' fees and expenses | 2,888 | |||
| Interest | 8,271 | |||
| Total expenses before reductions | 5,432,430 | |||
| Expense reductions | (41) | |||
| Total expenses after reductions | 5,432,389 | |||
| Net Investment income (loss) | 3,648,889 | |||
| Realized and Unrealized Gain (Loss) | ||||
| Net realized gain (loss) on: | ||||
| Investment Securities: | ||||
| Unaffiliated issuers(net of foreign taxes of $399,427) | (72,379,946) | |||
| Foreign currency transactions | 4,973 | |||
| Total net realized gain (loss) | (72,374,973) | |||
| Change in net unrealized appreciation (depreciation) on: | ||||
| Investment Securities: | ||||
| Unaffiliated issuers (net of decrease in deferred foreign taxes of $825,626) | (233,694,303) | |||
| Assets and liabilities in foreign currencies | (143,941) | |||
| Total change in net unrealized appreciation (depreciation) | (233,838,244) | |||
| Net gain (loss) | (306,213,217) | |||
| Net increase (decrease) in net assets resulting from operations | $ | (302,564,328) | ||
| Statement of Changes in Net Assets | ||||
Year ended October 31, 2022 | Year ended October 31, 2021 | |||
| Increase (Decrease) in Net Assets | ||||
| Operations | ||||
| Net investment income (loss) | $ | 3,648,889 | $ | 2,730,324 |
| Net realized gain (loss) | (72,374,973) | 87,802,527 | ||
| Change in net unrealized appreciation (depreciation) | (233,838,244) | 124,225,329 | ||
| Net increase (decrease) in net assets resulting from operations | (302,564,328) | 214,758,180 | ||
| Distributions to shareholders | (75,709,685) | (3,677,736) | ||
| Share transactions | ||||
| Proceeds from sales of shares | 376,598,093 | 357,797,473 | ||
| Reinvestment of distributions | 75,709,685 | 3,677,736 | ||
| Cost of shares redeemed | (234,149,001) | (410,282,639) | ||
Net increase (decrease) in net assets resulting from share transactions | 218,158,777 | (48,807,430) | ||
| Total increase (decrease) in net assets | (160,115,236) | 162,273,014 | ||
| Net Assets | ||||
| Beginning of period | 923,232,968 | 760,959,954 | ||
| End of period | $ | 763,117,732 | $ | 923,232,968 |
| Other Information | ||||
| Shares | ||||
| Sold | 28,863,775 | 22,114,523 | ||
| Issued in reinvestment of distributions | 4,794,787 | 240,061 | ||
| Redeemed | (17,893,097) | (24,934,580) | ||
| Net increase (decrease) | 15,765,465 | (2,579,996) | ||
| Fidelity® International Capital Appreciation K6 Fund |
| Years ended October 31, | 2022 | 2021 | 2020 | 2019 | 2018 | |||||
Selected Per-Share Data | ||||||||||
| Net asset value, beginning of period | $ | 17.82 | $ | 13.99 | $ | 12.40 | $ | 10.17 | $ | 11.01 |
| Income from Investment Operations | ||||||||||
Net investment income (loss) A,B | .06 | .05 | .08 | .13 C | .11 | |||||
| Net realized and unrealized gain (loss) | (5.14) | 3.85 | 1.62 | 2.18 | (.92) | |||||
| Total from investment operations | (5.08) | 3.90 | 1.70 | 2.31 | (.81) | |||||
| Distributions from net investment income | (.04) | (.07) | (.11) | (.08) | (.02) | |||||
| Distributions from net realized gain | (1.41) | - | - | - | (.01) | |||||
| Total distributions | (1.45) | (.07) | (.11) | (.08) | (.03) | |||||
| Net asset value, end of period | $ | 11.29 | $ | 17.82 | $ | 13.99 | $ | 12.40 | $ | 10.17 |
Total Return D | (30.83)% | 27.93% | 13.82% | 22.90% | (7.36)% | |||||
Ratios to Average Net Assets B,E,F | ||||||||||
| Expenses before reductions | .65% | .65% | .65% | .65% | .65% | |||||
| Expenses net of fee waivers, if any | .65% | .65% | .65% | .65% | .65% | |||||
| Expenses net of all reductions | .65% | .65% | .61% | .63% | .58% | |||||
| Net investment income (loss) | .44% | .29% | .62% | 1.16% C | .99% | |||||
| Supplemental Data | ||||||||||
| Net assets, end of period (000 omitted) | $ | 763,118 | $ | 923,233 | $ | 760,960 | $ | 524,353 | $ | 360,963 |
Portfolio turnover rate G | 119% H | 149% | 138% | 144% H | 158% H |
| Fidelity Central Fund | Investment Manager | Investment Objective | Investment Practices | Expense Ratio A |
| Fidelity Money Market Central Funds | Fidelity Management & Research Company LLC (FMR) | Each fund seeks to obtain a high level of current income consistent with the preservation of capital and liquidity. | Short-term Investments | Less than .005% |
| Gross unrealized appreciation | $90,873,223 |
| Gross unrealized depreciation | (66,385,280) |
| Net unrealized appreciation (depreciation) | $24,487,943 |
| Tax Cost | $751,751,354 |
| Undistributed ordinary income | $3,186,271 |
| Capital loss carryforward | $(61,308,944) |
| Net unrealized appreciation (depreciation) on securities and other investments | $24,370,770 |
| Short-term | $(61,308,944) |
| Total capital loss carryforward | $(61,308,944) |
| October 31, 2022 | October 31, 2021 | |
| Ordinary Income | $25,306,280 | $3,677,736 |
| Long-term Capital Gains | 50,403,405 | - |
| Total | $75,709,685 | $3,677,736 |
| Purchases ($) | Sales ($) | |
| Fidelity International Capital Appreciation K6 Fund | 1,034,841,338 | 977,446,813 |
| Shares | Total Proceeds ($) | |
| Fidelity International Capital Appreciation K6 Fund | 6,790,346 | 84,381,011 |
| Amount | |
| Fidelity International Capital Appreciation K6 Fund | $2,228 |
| Borrower or Lender | Average Loan Balance | Weighted Average Interest Rate | Interest Expense | |
| Fidelity International Capital Appreciation K6 Fund | Borrower | $9,663,400 | 1.48% | $7,960 |
| Purchases ($) | Sales ($) | Realized Gain (Loss) ($) | |
| Fidelity International Capital Appreciation K6 Fund | 85,170,790 | 57,076,628 | (4,511,009) |
| Total Security Lending Fees Paid to NFS | Security Lending Income From Securities Loaned to NFS | Value of Securities Loaned to NFS at Period End | |
| Fidelity International Capital Appreciation K6 Fund | $3,862 | $- | $- |
| Average Loan Balance | Weighted Average Interest Rate | Interest Expense | |
| Fidelity International Capital Appreciation K6 Fund | $3,064,000 | .73% | $311 |
| The Example is based on an investment of $1,000 invested at the beginning of the period and held for the entire period (May 1, 2022 to October 31, 2022). |
Annualized Expense Ratio- A | Beginning Account Value May 1, 2022 | Ending Account Value October 31, 2022 | Expenses Paid During Period- C May 1, 2022 to October 31, 2022 | |||||||
| Fidelity® International Capital Appreciation K6 Fund | .65% | |||||||||
| Actual | $ 1,000 | $ 870.50 | $ 3.06 | |||||||
Hypothetical- B | $ 1,000 | $ 1,021.93 | $ 3.31 | |||||||
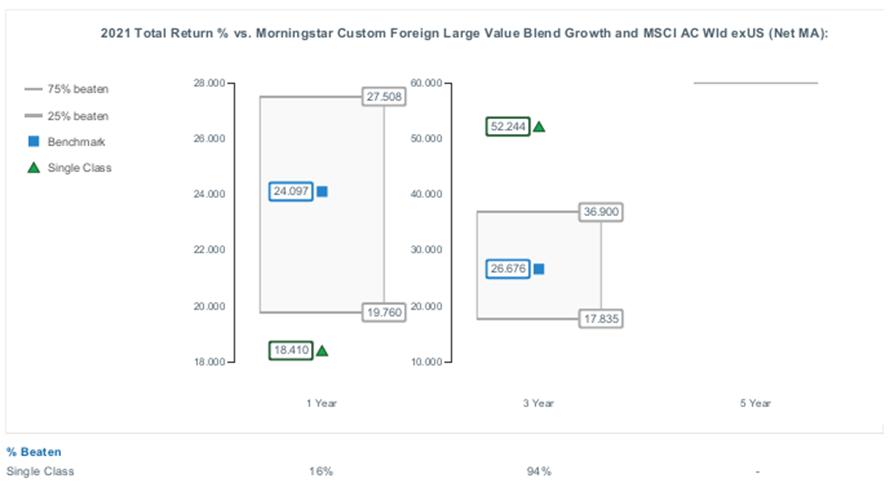
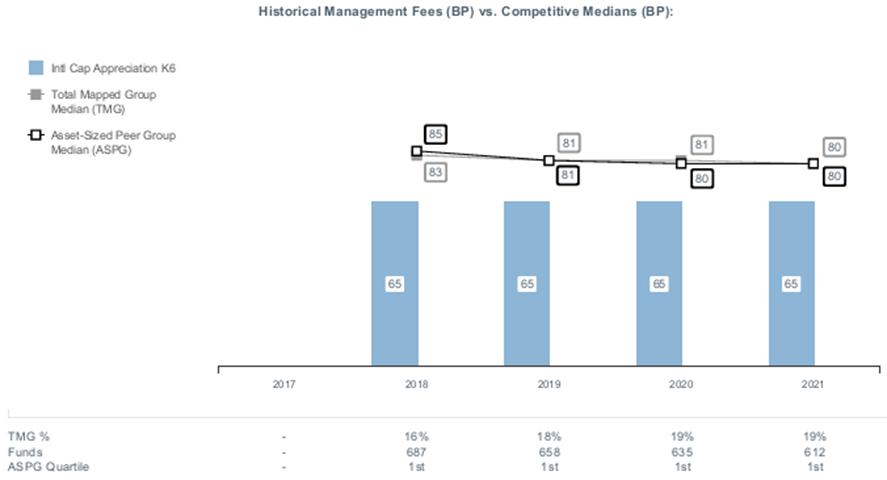
|


Contents
Board Approval of Investment Advisory Contracts and Management Fees |
| Average Annual Total Returns | |||
Periods ended October 31, 2022 | Past 1 year | Past 5 years | Life of Fund A |
| Fidelity® Diversified International K6 Fund | -28.81% | 1.41% | 2.48% |
| $10,000 Over Life of Fund |
Let's say hypothetically that $10,000 was invested in Fidelity® Diversified International K6 Fund, on May 25, 2017, when the fund started. The chart shows how the value of your investment would have changed, and also shows how the MSCI EAFE Index performed over the same period. |
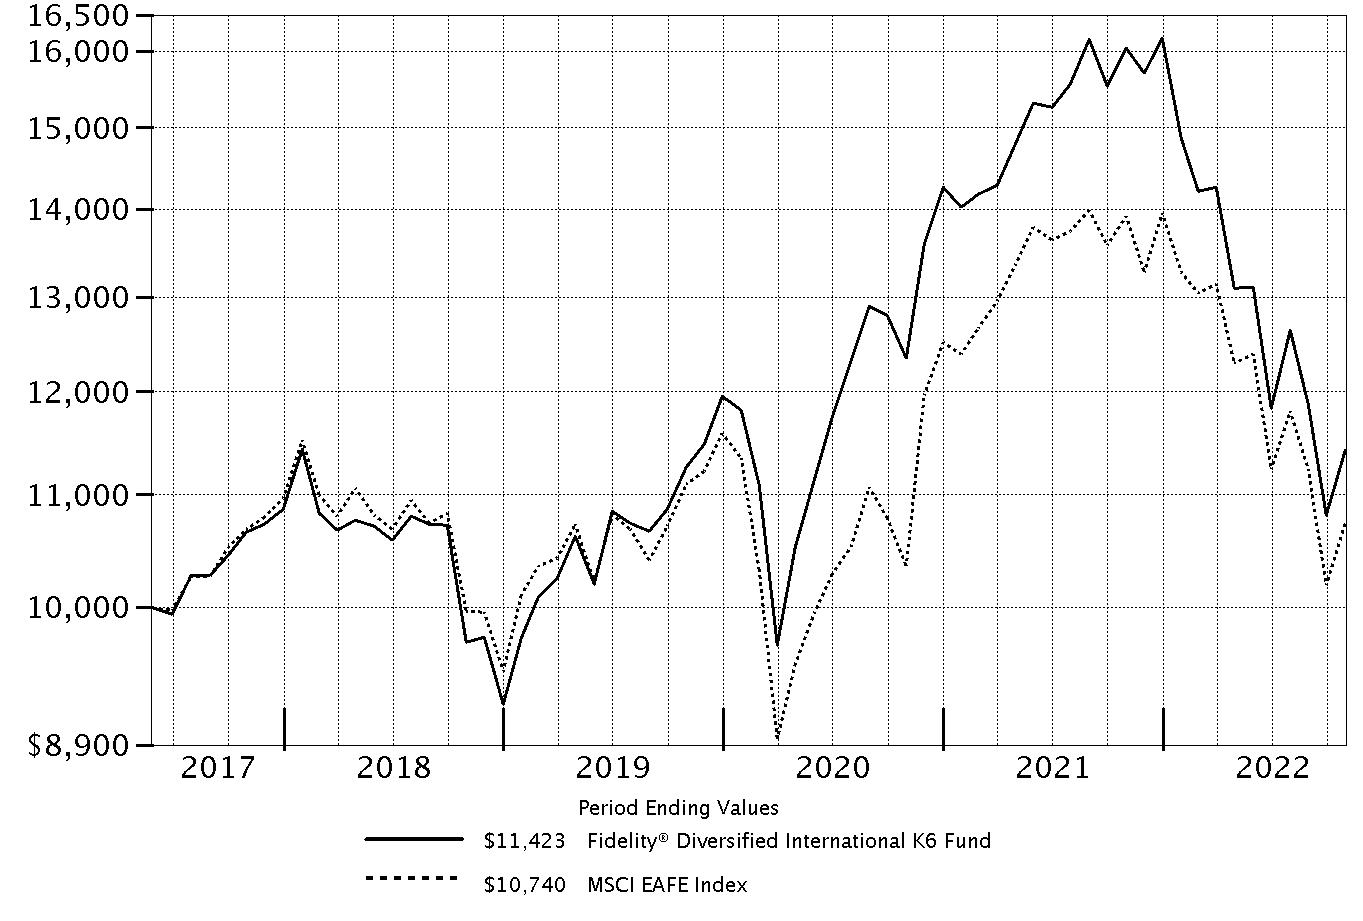 |
Top Holdings (% of Fund's net assets) | ||
| Roche Holding AG (participation certificate) (Switzerland, Pharmaceuticals) | 3.3 | |
| Nestle SA (Reg. S) (Switzerland, Food Products) | 3.1 | |
| ASML Holding NV (Netherlands, Semiconductors & Semiconductor Equipment) | 2.6 | |
| LVMH Moet Hennessy Louis Vuitton SE (France, Textiles, Apparel & Luxury Goods) | 2.3 | |
| Hoya Corp. (Japan, Health Care Equipment & Supplies) | 2.0 | |
| Canadian Natural Resources Ltd. (Canada, Oil, Gas & Consumable Fuels) | 1.8 | |
| AIA Group Ltd. (Hong Kong, Insurance) | 1.7 | |
| RELX PLC (Euronext N.V.) (United Kingdom, Professional Services) | 1.6 | |
| Linde PLC (Germany, Chemicals) | 1.6 | |
| HDFC Bank Ltd. (India, Banks) | 1.3 | |
| 21.3 | ||
| Market Sectors (% of Fund's net assets) | ||
| Industrials | 19.9 | |
| Financials | 19.4 | |
| Information Technology | 14.7 | |
| Health Care | 13.3 | |
| Consumer Discretionary | 7.9 | |
| Consumer Staples | 6.6 | |
| Materials | 6.0 | |
| Energy | 5.6 | |
| Communication Services | 1.1 | |
| Real Estate | 0.6 | |
Asset Allocation (% of Fund's net assets) |
 |
Foreign investments - 89.8% |
Geographic Diversification (% of Fund's net assets) |
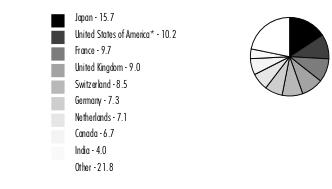 |
* Includes Short-Term investments and Net Other Assets (Liabilities). Percentages are based on country or territory of incorporation and are adjusted for the effect of futures contracts, if applicable. |
| Common Stocks - 94.6% | |||
| Shares | Value ($) | ||
| Australia - 0.5% | |||
| Aristocrat Leisure Ltd. | 381,471 | 9,045,374 | |
| Lynas Rare Earths Ltd. (a) | 1,550,524 | 8,261,633 | |
TOTAL AUSTRALIA | 17,307,007 | ||
| Bailiwick of Jersey - 2.8% | |||
| Experian PLC | 520,283 | 16,589,367 | |
| Ferguson PLC | 276,142 | 30,116,234 | |
| Glencore PLC | 5,885,795 | 33,743,697 | |
| WPP PLC | �� | 1,832,723 | 16,128,239 |
TOTAL BAILIWICK OF JERSEY | 96,577,537 | ||
| Belgium - 0.9% | |||
| KBC Group NV | 643,702 | 32,259,614 | |
| Bermuda - 0.5% | |||
| Hiscox Ltd. | 1,659,508 | 17,112,889 | |
| Canada - 6.7% | |||
| Alimentation Couche-Tard, Inc. Class A (multi-vtg.) | 204,369 | 9,150,739 | |
| Canadian Natural Resources Ltd. | 1,032,664 | 61,936,342 | |
| Canadian Pacific Railway Ltd. | 151,284 | 11,269,145 | |
| Constellation Software, Inc. | 21,109 | 30,522,559 | |
| Fairfax India Holdings Corp. (a)(b) | 596,680 | 5,584,925 | |
| First Quantum Minerals Ltd. | 888,252 | 15,667,556 | |
| Franco-Nevada Corp. | 160,153 | 19,788,274 | |
| GFL Environmental, Inc. (c) | 505,037 | 13,630,949 | |
| Imperial Oil Ltd. | 292,266 | 15,898,876 | |
| Thomson Reuters Corp. | 138,212 | 14,699,260 | |
| Tourmaline Oil Corp. | 627,242 | 35,341,209 | |
TOTAL CANADA | 233,489,834 | ||
| Cayman Islands - 0.9% | |||
| Anta Sports Products Ltd. | 1,225,722 | 10,774,343 | |
| GlobalFoundries, Inc. | 203,764 | 11,553,419 | |
| Li Ning Co. Ltd. | 1,826,889 | 9,449,045 | |
TOTAL CAYMAN ISLANDS | 31,776,807 | ||
| China - 0.3% | |||
| Kweichow Moutai Co. Ltd. (A Shares) | 62,031 | 11,413,481 | |
| Curacao - 1.2% | |||
| Schlumberger Ltd. | 774,757 | 40,310,607 | |
| Cyprus - 0.0% | |||
| Sunrisemezz Ltd. (a) | 275,648 | 22,310 | |
| Denmark - 1.6% | |||
| Carlsberg A/S Series B | 30,015 | 3,534,137 | |
| DSV A/S | 261,619 | 35,418,205 | |
| Novo Nordisk A/S Series B | 167,566 | 18,219,662 | |
TOTAL DENMARK | 57,172,004 | ||
| France - 9.7% | |||
| Air Liquide SA | 56,864 | 7,438,594 | |
| AXA SA | 714,117 | 17,635,053 | |
| BNP Paribas SA | 808,343 | 37,906,373 | |
| Capgemini SA | 266,368 | 43,655,278 | |
| Dassault Systemes SA | 304,422 | 10,203,853 | |
| Edenred SA | 149,620 | 7,682,908 | |
| EssilorLuxottica SA | 206,340 | 32,697,851 | |
| Legrand SA | 286,413 | 21,826,018 | |
| LVMH Moet Hennessy Louis Vuitton SE | 127,036 | 80,159,067 | |
| Pernod Ricard SA | 222,137 | 39,009,929 | |
| Sartorius Stedim Biotech | 33,933 | 10,771,213 | |
| Teleperformance | 109,317 | 29,309,224 | |
TOTAL FRANCE | 338,295,361 | ||
| Germany - 7.3% | |||
| Allianz SE | 220,557 | 39,679,200 | |
| Bayer AG | 253,076 | 13,307,008 | |
| Brenntag SE | 153,320 | 9,302,899 | |
| Deutsche Borse AG | 182,150 | 29,621,191 | |
| Deutsche Post AG | 765,208 | 27,049,971 | |
| Hannover Reuck SE | 127,814 | 20,816,248 | |
| Linde PLC | 189,371 | 56,639,704 | |
| Merck KGaA | 153,610 | 25,033,076 | |
| SAP SE | 43,446 | 4,181,803 | |
| Siemens Healthineers AG (b) | 359,360 | 16,463,209 | |
| Symrise AG | 109,224 | 11,148,773 | |
| Synlab AG | 148,166 | 1,907,918 | |
TOTAL GERMANY | 255,151,000 | ||
| Greece - 0.1% | |||
| Piraeus Financial Holdings SA (a) | 1,929,538 | 2,379,769 | |
| Hong Kong - 2.3% | |||
| AIA Group Ltd. | 7,604,278 | 57,600,840 | |
| Chervon Holdings Ltd. | 1,071,658 | 3,611,034 | |
| Hong Kong Exchanges and Clearing Ltd. | 166,261 | 4,413,169 | |
| Techtronic Industries Co. Ltd. | 1,460,738 | 13,831,390 | |
TOTAL HONG KONG | 79,456,433 | ||
| India - 4.0% | |||
| Axis Bank Ltd. | 1,447,673 | 15,844,307 | |
| HDFC Bank Ltd. (a) | 2,549,994 | 46,277,058 | |
| Housing Development Finance Corp. Ltd. | 1,030,263 | 30,738,627 | |
| Kotak Mahindra Bank Ltd. | 550,670 | 12,652,172 | |
| Reliance Industries Ltd. | 1,114,281 | 34,319,532 | |
TOTAL INDIA | 139,831,696 | ||
| Indonesia - 1.0% | |||
| PT Bank Central Asia Tbk | 30,722,709 | 17,333,537 | |
| PT Bank Rakyat Indonesia (Persero) Tbk | 59,358,863 | 17,696,343 | |
TOTAL INDONESIA | 35,029,880 | ||
| Ireland - 2.2% | |||
| Aon PLC | 105,208 | 29,615,000 | |
| Flutter Entertainment PLC (a) | 37,062 | 4,921,813 | |
| ICON PLC (a) | 93,222 | 18,443,040 | |
| Kingspan Group PLC (Ireland) | 298,633 | 15,080,840 | |
| Ryanair Holdings PLC sponsored ADR (a) | 112,488 | 7,749,298 | |
TOTAL IRELAND | 75,809,991 | ||
| Isle of Man - 0.2% | |||
| Entain PLC | 580,521 | 8,398,155 | |
| Italy - 0.7% | |||
| FinecoBank SpA | 1,416,619 | 19,095,642 | |
| Reply SpA | 44,111 | 4,799,556 | |
TOTAL ITALY | 23,895,198 | ||
| Japan - 15.7% | |||
| Daikin Industries Ltd. | 105,789 | 15,845,836 | |
| FUJIFILM Holdings Corp. | 544,786 | 24,983,327 | |
| Fujitsu Ltd. | 64,925 | 7,470,175 | |
| Hitachi Ltd. | 959,354 | 43,614,332 | |
| Hoya Corp. | 731,289 | 68,237,902 | |
| Itochu Corp. | 1,200,856 | 31,084,399 | |
| Keyence Corp. | 102,494 | 38,820,822 | |
| Minebea Mitsumi, Inc. | 1,840,077 | 27,274,150 | |
| Misumi Group, Inc. | 709,637 | 15,176,339 | |
| Nomura Research Institute Ltd. | 497,772 | 11,063,832 | |
| Olympus Corp. | 787,052 | 16,620,218 | |
| ORIX Corp. | 2,263,115 | 33,255,364 | |
| Persol Holdings Co. Ltd. | 951,596 | 19,109,356 | |
| Recruit Holdings Co. Ltd. | 352,339 | 10,841,883 | |
| Relo Group, Inc. | 728,737 | 10,301,659 | |
| Seven & i Holdings Co. Ltd. | 435,754 | 16,265,988 | |
| Shin-Etsu Chemical Co. Ltd. | 351,425 | 36,523,585 | |
| SMC Corp. | 69,617 | 27,944,422 | |
| Sony Group Corp. | 591,577 | 39,892,794 | |
| Suzuki Motor Corp. | 213,699 | 7,214,560 | |
| TIS, Inc. | 882,024 | 23,816,042 | |
| Tokyo Electron Ltd. | 83,513 | 21,971,988 | |
TOTAL JAPAN | 547,328,973 | ||
| Korea (South) - 0.7% | |||
| Samsung Electronics Co. Ltd. | 590,685 | 24,582,216 | |
| Luxembourg - 0.9% | |||
| B&M European Value Retail SA | 4,852,132 | 17,950,835 | |
| Eurofins Scientific SA | 230,889 | 14,781,245 | |
TOTAL LUXEMBOURG | 32,732,080 | ||
| Netherlands - 7.1% | |||
| Adyen BV (a)(b) | 8,044 | 11,483,610 | |
| Airbus Group NV | 319,027 | 34,519,926 | |
| Argenx SE (a) | 37,503 | 14,560,562 | |
| ASML Holding NV | 190,808 | 90,141,515 | |
| IMCD NV | 209,861 | 27,230,981 | |
| NXP Semiconductors NV | 163,267 | 23,850,043 | |
| Wolters Kluwer NV | 423,165 | 44,976,637 | |
TOTAL NETHERLANDS | 246,763,274 | ||
| Spain - 1.6% | |||
| Amadeus IT Holding SA Class A (a) | 73,652 | 3,841,342 | |
| Banco Santander SA (Spain) (c) | 3,018,870 | 7,822,470 | |
| CaixaBank SA | 4,185,349 | 13,878,806 | |
| Cellnex Telecom SA (b) | 375,267 | 12,282,587 | |
| Industria de Diseno Textil SA (c) | 860,314 | 19,503,710 | |
TOTAL SPAIN | 57,328,915 | ||
| Sweden - 2.4% | |||
| Hexagon AB (B Shares) | 2,325,175 | 22,986,439 | |
| Indutrade AB | 1,459,428 | 25,557,041 | |
| Investor AB (B Shares) | 1,733,406 | 28,315,501 | |
| Kry International AB (a)(d)(e) | 663 | 116,070 | |
| Nibe Industrier AB (B Shares) | 226,484 | 1,807,162 | |
| Nordnet AB | 310,888 | 3,857,521 | |
TOTAL SWEDEN | 82,639,734 | ||
| Switzerland - 8.5% | |||
| Julius Baer Group Ltd. | 116,613 | 5,594,960 | |
| Lonza Group AG | 10,576 | 5,444,358 | |
| Nestle SA (Reg. S) | 993,224 | 108,121,175 | |
| Roche Holding AG (participation certificate) | 351,463 | 116,614,785 | |
| Sika AG | 113,019 | 25,483,053 | |
| Sonova Holding AG | 83,962 | 19,847,012 | |
| Zurich Insurance Group Ltd. | 33,511 | 14,281,516 | |
TOTAL SWITZERLAND | 295,386,859 | ||
| Taiwan - 0.9% | |||
| ECLAT Textile Co. Ltd. | 254,000 | 3,342,934 | |
| Taiwan Semiconductor Manufacturing Co. Ltd. sponsored ADR | 452,500 | 27,851,375 | |
TOTAL TAIWAN | 31,194,309 | ||
| United Kingdom - 9.0% | |||
| AstraZeneca PLC (United Kingdom) | 302,990 | 35,550,481 | |
| BAE Systems PLC | 3,663,279 | 34,264,736 | |
| Beazley PLC | 1,325,136 | 9,490,314 | |
| Big Yellow Group PLC | 704,668 | 9,099,355 | |
| Compass Group PLC | 1,246,366 | 26,250,744 | |
| Diageo PLC | 988,119 | 40,663,583 | |
| Harbour Energy PLC | 1,665,464 | 7,217,717 | |
| JD Sports Fashion PLC | 7,904,582 | 8,832,911 | |
| Lloyds Banking Group PLC | 37,983,748 | 18,242,377 | |
| Prudential PLC | 1,085,073 | 10,079,971 | |
| RELX PLC (Euronext N.V.) | 2,119,887 | 57,046,260 | |
| Rentokil Initial PLC | 4,495,228 | 28,050,720 | |
| S4 Capital PLC (a) | 2,239,222 | 4,511,870 | |
| Smith & Nephew PLC | 836,685 | 9,887,035 | |
| Standard Chartered PLC (United Kingdom) | 1,079,522 | 6,440,054 | |
| Starling Bank Ltd. Series D (a)(d)(e) | 2,406,800 | 7,783,533 | |
TOTAL UNITED KINGDOM | 313,411,661 | ||
| United States of America - 4.9% | |||
| Alphabet, Inc. Class C (a) | 124,148 | 11,751,850 | |
| Booking Holdings, Inc. (a) | 5,152 | 9,631,561 | |
| IQVIA Holdings, Inc. (a) | 85,322 | 17,889,464 | |
| Kosmos Energy Ltd. (a) | 256,889 | 1,667,210 | |
| Marsh & McLennan Companies, Inc. | 191,055 | 30,853,472 | |
| Marvell Technology, Inc. | 512,176 | 20,323,144 | |
| MasterCard, Inc. Class A | 65,769 | 21,584,070 | |
| NICE Ltd. sponsored ADR (a) | 127,667 | 24,242,687 | |
| ResMed, Inc. | 24,867 | 5,562,499 | |
| S&P Global, Inc. | 83,797 | 26,919,786 | |
TOTAL UNITED STATES OF AMERICA | 170,425,743 | ||
| TOTAL COMMON STOCKS (Cost $3,184,932,366) | 3,297,483,337 | ||
| Preferred Stocks - 0.5% | |||
| Shares | Value ($) | ||
| Convertible Preferred Stocks - 0.5% | |||
| Estonia - 0.1% | |||
| Bolt Technology OU Series E (d)(e) | 21,668 | 2,647,125 | |
| United States of America - 0.4% | |||
| Wasabi Holdings, Inc.: | |||
| Series C (a)(d)(e) | 743,562 | 8,588,141 | |
| Series D (d)(e) | 304,085 | 4,257,190 | |
| 12,845,331 | |||
TOTAL CONVERTIBLE PREFERRED STOCKS | 15,492,456 | ||
| Nonconvertible Preferred Stocks - 0.0% | |||
| Sweden - 0.0% | |||
| Kry International AB Series E (a)(d)(e) | 3,828 | 670,162 | |
| TOTAL PREFERRED STOCKS (Cost $19,777,817) | 16,162,618 | ||
| Money Market Funds - 5.9% | |||
| Shares | Value ($) | ||
| Fidelity Cash Central Fund 3.10% (f) | 165,385,776 | 165,418,854 | |
| Fidelity Securities Lending Cash Central Fund 3.10% (f)(g) | 39,186,948 | 39,190,867 | |
| TOTAL MONEY MARKET FUNDS (Cost $204,609,098) | 204,609,721 | ||
| TOTAL INVESTMENT IN SECURITIES - 101.0% (Cost $3,409,319,281) | 3,518,255,676 |
NET OTHER ASSETS (LIABILITIES) - (1.0)% | (34,838,428) |
| NET ASSETS - 100.0% | 3,483,417,248 |
| (a) | Non-income producing |
| (b) | Security exempt from registration under Rule 144A of the Securities Act of 1933. These securities may be resold in transactions exempt from registration, normally to qualified institutional buyers. At the end of the period, the value of these securities amounted to $45,814,331 or 1.3% of net assets. |
| (c) | Security or a portion of the security is on loan at period end. |
| (d) | Restricted securities (including private placements) - Investment in securities not registered under the Securities Act of 1933 (excluding 144A issues). At the end of the period, the value of restricted securities (excluding 144A issues) amounted to $24,062,221 or 0.7% of net assets. |
| (e) | Level 3 security |
| (f) | Affiliated fund that is generally available only to investment companies and other accounts managed by Fidelity Investments. The rate quoted is the annualized seven-day yield of the fund at period end. A complete unaudited listing of the fund's holdings as of its most recent quarter end is available upon request. In addition, each Fidelity Central Fund's financial statements, which are not covered by the Fund's Report of Independent Registered Public Accounting Firm, are available on the SEC's website or upon request. |
| (g) | Investment made with cash collateral received from securities on loan. |
| Additional information on each restricted holding is as follows: | ||
| Security | Acquisition Date | Acquisition Cost ($) |
| Bolt Technology OU Series E | 1/03/22 | 5,629,271 |
| Kry International AB | 5/14/21 | 287,945 |
| Kry International AB Series E | 5/14/21 | 1,750,058 |
| Starling Bank Ltd. Series D | 6/18/21 - 4/05/22 | 4,642,638 |
| Wasabi Holdings, Inc. Series C | 3/31/21 | 8,078,504 |
| Wasabi Holdings, Inc. Series D | 9/09/22 | 4,319,984 |
| Affiliate | Value, beginning of period ($) | Purchases ($) | Sales Proceeds ($) | Dividend Income ($) | Realized Gain (loss) ($) | Change in Unrealized appreciation (depreciation) ($) | Value, end of period ($) | % ownership, end of period |
| Fidelity Cash Central Fund 3.10% | 161,131,920 | 854,189,824 | 849,902,891 | 1,563,976 | - | 1 | 165,418,854 | 0.3% |
| Fidelity Securities Lending Cash Central Fund 3.10% | 33,872,696 | 485,775,260 | 480,457,089 | 282,508 | - | - | 39,190,867 | 0.1% |
| Total | 195,004,616 | 1,339,965,084 | 1,330,359,980 | 1,846,484 | - | 1 | 204,609,721 | |
| Valuation Inputs at Reporting Date: | ||||
| Description | Total ($) | Level 1 ($) | Level 2 ($) | Level 3 ($) |
Investments in Securities: | ||||
| Equities: | ||||
Communication Services | 44,674,546 | 16,263,720 | 28,410,826 | - |
Consumer Discretionary | 271,824,211 | 104,278,120 | 154,700,760 | 12,845,331 |
Consumer Staples | 228,159,032 | 59,574,149 | 168,584,883 | - |
Energy | 196,691,493 | 196,691,493 | - | - |
Financials | 671,099,912 | 335,846,251 | 327,470,128 | 7,783,533 |
Health Care | 461,838,538 | 206,758,362 | 255,080,176 | - |
Industrials | 690,216,980 | 450,149,812 | 240,067,168 | - |
Information Technology | 515,045,360 | 385,817,515 | 125,794,488 | 3,433,357 |
Materials | 214,694,869 | 100,357,167 | 114,337,702 | - |
Real Estate | 19,401,014 | 19,401,014 | - | - |
| Money Market Funds | 204,609,721 | 204,609,721 | - | - |
| Total Investments in Securities: | 3,518,255,676 | 2,079,747,324 | 1,414,446,131 | 24,062,221 |
| Statement of Assets and Liabilities | ||||
| October 31, 2022 | ||||
| Assets | ||||
| Investment in securities, at value (including securities loaned of $36,129,479) - See accompanying schedule: | ||||
Unaffiliated issuers (cost $3,204,710,183) | $3,313,645,955 | |||
Fidelity Central Funds (cost $204,609,098) | 204,609,721 | |||
| Total Investment in Securities (cost $3,409,319,281) | $ | 3,518,255,676 | ||
| Foreign currency held at value (cost $1,852) | 1,836 | |||
| Receivable for investments sold | 5,843,958 | |||
| Receivable for fund shares sold | 1,407,784 | |||
| Dividends receivable | 6,003,446 | |||
| Reclaims receivable | 8,299,488 | |||
| Distributions receivable from Fidelity Central Funds | 421,387 | |||
Total assets | 3,540,233,575 | |||
| Liabilities | ||||
| Payable to custodian bank | $6,499 | |||
| Payable for investments purchased | 11,239,789 | |||
| Payable for fund shares redeemed | 1,690,139 | |||
| Accrued management fee | 1,697,347 | |||
| Deferred taxes | 2,991,686 | |||
| Collateral on securities loaned | 39,190,867 | |||
| Total Liabilities | 56,816,327 | |||
| Net Assets | $ | 3,483,417,248 | ||
| Net Assets consist of: | ||||
| Paid in capital | $ | 3,632,335,116 | ||
| Total accumulated earnings (loss) | (148,917,868) | |||
| Net Assets | $ | 3,483,417,248 | ||
Net Asset Value , offering price and redemption price per share ($3,483,417,248 ÷ 319,950,339 shares) | $ | 10.89 | ||
| Statement of Operations | ||||
Year ended October 31, 2022 | ||||
| Investment Income | ||||
| Dividends | $ | 75,740,285 | ||
| Foreign Tax Reclaims | 4,625,557 | |||
| Income from Fidelity Central Funds (including $282,508 from security lending) | 1,846,484 | |||
| Income before foreign taxes withheld | 82,212,326 | |||
| Less foreign taxes withheld | (12,981,506) | |||
| Total Income | 69,230,820 | |||
| Expenses | ||||
| Management fee | $ | 22,994,046 | ||
| Independent trustees' fees and expenses | 13,056 | |||
| Total expenses before reductions | 23,007,102 | |||
| Expense reductions | (210) | |||
| Total expenses after reductions | 23,006,892 | |||
| Net Investment income (loss) | 46,223,928 | |||
| Realized and Unrealized Gain (Loss) | ||||
| Net realized gain (loss) on: | ||||
| Investment Securities: | ||||
| Unaffiliated issuers(net of foreign taxes of $2,339,325) | (174,542,221) | |||
| Foreign currency transactions | (1,338,096) | |||
| Total net realized gain (loss) | (175,880,317) | |||
| Change in net unrealized appreciation (depreciation) on: | ||||
| Investment Securities: | ||||
| Unaffiliated issuers (net of decrease in deferred foreign taxes of $3,728,229) | (1,164,175,989) | |||
| Fidelity Central Funds | 1 | |||
| Assets and liabilities in foreign currencies | (1,031,783) | |||
| Total change in net unrealized appreciation (depreciation) | (1,165,207,771) | |||
| Net gain (loss) | (1,341,088,088) | |||
| Net increase (decrease) in net assets resulting from operations | $ | (1,294,864,160) | ||
| Statement of Changes in Net Assets | ||||
Year ended October 31, 2022 | Year ended October 31, 2021 | |||
| Increase (Decrease) in Net Assets | ||||
| Operations | ||||
| Net investment income (loss) | $ | 46,223,928 | $ | 26,974,857 |
| Net realized gain (loss) | (175,880,317) | 291,669,537 | ||
| Change in net unrealized appreciation (depreciation) | (1,165,207,771) | 602,926,094 | ||
| Net increase (decrease) in net assets resulting from operations | (1,294,864,160) | 921,570,488 | ||
| Distributions to shareholders | (40,087,762) | (22,064,152) | ||
| Share transactions | ||||
| Proceeds from sales of shares | 1,845,177,962 | 1,357,060,441 | ||
| Reinvestment of distributions | 40,087,762 | 22,064,152 | ||
| Cost of shares redeemed | (1,028,832,082) | (1,418,989,092) | ||
Net increase (decrease) in net assets resulting from share transactions | 856,433,642 | (39,864,499) | ||
| Total increase (decrease) in net assets | (478,518,280) | 859,641,837 | ||
| Net Assets | ||||
| Beginning of period | 3,961,935,528 | 3,102,293,691 | ||
| End of period | $ | 3,483,417,248 | $ | 3,961,935,528 |
| Other Information | ||||
| Shares | ||||
| Sold | 141,560,986 | 93,633,650 | ||
| Issued in reinvestment of distributions | 2,683,250 | 1,661,457 | ||
| Redeemed | (80,800,526) | (98,214,817) | ||
| Net increase (decrease) | 63,443,710 | (2,919,710) | ||
| Fidelity® Diversified International K6 Fund |
| Years ended October 31, | 2022 | 2021 | 2020 | 2019 | 2018 | |||||
Selected Per-Share Data | ||||||||||
| Net asset value, beginning of period | $ | 15.45 | $ | 11.96 | $ | 11.08 | $ | 9.69 | $ | 10.65 |
| Income from Investment Operations | ||||||||||
Net investment income (loss) A,B | .15 | .10 | .08 | .16 | .18 | |||||
| Net realized and unrealized gain (loss) | (4.56) | 3.47 | .98 | 1.36 | (1.12) | |||||
| Total from investment operations | (4.41) | 3.57 | 1.06 | 1.52 | (.94) | |||||
| Distributions from net investment income | (.15) | (.08) | (.15) | (.13) | (.02) | |||||
| Distributions from net realized gain | - | - | (.03) | - | (.01) | |||||
| Total distributions | (.15) | (.08) | (.18) | (.13) | (.02) C | |||||
| Net asset value, end of period | $ | 10.89 | $ | 15.45 | $ | 11.96 | $ | 11.08 | $ | 9.69 |
Total Return D | (28.81)% | 30.00% | 9.70% | 15.89% | (8.83)% | |||||
Ratios to Average Net Assets B,E,F | ||||||||||
| Expenses before reductions | .60% | .60% | .60% | .60% | .60% | |||||
| Expenses net of fee waivers, if any | .60% | .60% | .60% | .60% | .60% | |||||
| Expenses net of all reductions | .60% | .60% | .59% | .59% | .58% | |||||
| Net investment income (loss) | 1.21% | .73% | .73% | 1.59% | 1.67% | |||||
| Supplemental Data | ||||||||||
| Net assets, end of period (000 omitted) | $ | 3,483,417 | $ | 3,961,936 | $ | 3,102,294 | $ | 2,977,388 | $ | 2,207,355 |
Portfolio turnover rate G | 31% H | 30% H | 34% | 48% H | 48% H |
| Fidelity Central Fund | Investment Manager | Investment Objective | Investment Practices | Expense Ratio A |
| Fidelity Money Market Central Funds | Fidelity Management & Research Company LLC (FMR) | Each fund seeks to obtain a high level of current income consistent with the preservation of capital and liquidity. | Short-term Investments | Less than .005% |
| Gross unrealized appreciation | $478,822,033 |
| Gross unrealized depreciation | (377,639,633) |
| Net unrealized appreciation (depreciation) | $101,182,400 |
| Tax Cost | $3,417,073,276 |
| Undistributed ordinary income | $30,481,749 |
| Capital loss carryforward | $(276,639,443) |
| Net unrealized appreciation (depreciation) on securities and other investments | $100,231,513 |
Short-term | $(264,515,026) |
Long-term | (12,124,417) |
| Total capital loss carryforward | $ (276,639,443) |
| October 31, 2022 | October 31, 2021 | |
| Ordinary Income | $ 40,087,762 | $ 22,064,152 |
| Purchases ($) | Sales ($) | |
| Fidelity Diversified International K6 Fund | 1,103,017,967 | 1,112,866,182 |
| Shares | Total net realized gain or loss ($) | Total Proceeds ($) | |
| Fidelity Diversified International K6 Fund | 4,786,586 | 30,753,342 | 72,038,115 |
| Shares | Total Proceeds ($) | |
| Fidelity Diversified International K6 Fund | 75,623,497 | 961,127,384 |
| Shares | Total net realized gain or loss ($) | Total Proceeds ($) | |
| Fidelity Diversified International K6 Fund | 8,576,678 | 54,044,218 | 128,650,169 |
| Shares | Total Proceeds ($) | |
| Fidelity Diversified International K6 Fund | 29,580,433 | 434,308,676 |
| Amount | |
| Fidelity Diversified International K6 Fund | $2,298 |
| Purchases ($) | Sales ($) | Realized Gain (Loss) ($) | |
| Fidelity Diversified International K6 Fund | 32,637,153 | 44,363,138 | (10,293,574) |
| Amount ($) | |
| Fidelity Diversified International K6 Fund | 1,043 |
| Total Security Lending Fees Paid to NFS | Security Lending Income From Securities Loaned to NFS | Value of Securities Loaned to NFS at Period End | |
| Fidelity Diversified International K6 Fund | $30,688 | $1 | $- |
| The Example is based on an investment of $1,000 invested at the beginning of the period and held for the entire period (May 1, 2022 to October 31, 2022). |
Annualized Expense Ratio- A | Beginning Account Value May 1, 2022 | Ending Account Value October 31, 2022 | Expenses Paid During Period- C May 1, 2022 to October 31, 2022 | |||||||
| Fidelity® Diversified International K6 Fund | .60% | |||||||||
| Actual | $ 1,000 | $ 871.90 | $ 2.83 | |||||||
Hypothetical- B | $ 1,000 | $ 1,022.18 | $ 3.06 | |||||||


|


Contents
Board Approval of Investment Advisory Contracts and Management Fees |
| Average Annual Total Returns | |||
Periods ended October 31, 2022 | Past 1 year | Life of Fund A |
| Fidelity® Enduring Opportunities Fund | -32.65% | 4.02% |
| $10,000 Over Life of Fund |
Let's say hypothetically that $10,000 was invested in Fidelity® Enduring Opportunities Fund, on November 05, 2019, when the fund started. The chart shows how the value of your investment would have changed, and also shows how the MSCI ACWI (All Country World Index) Index performed over the same period. |
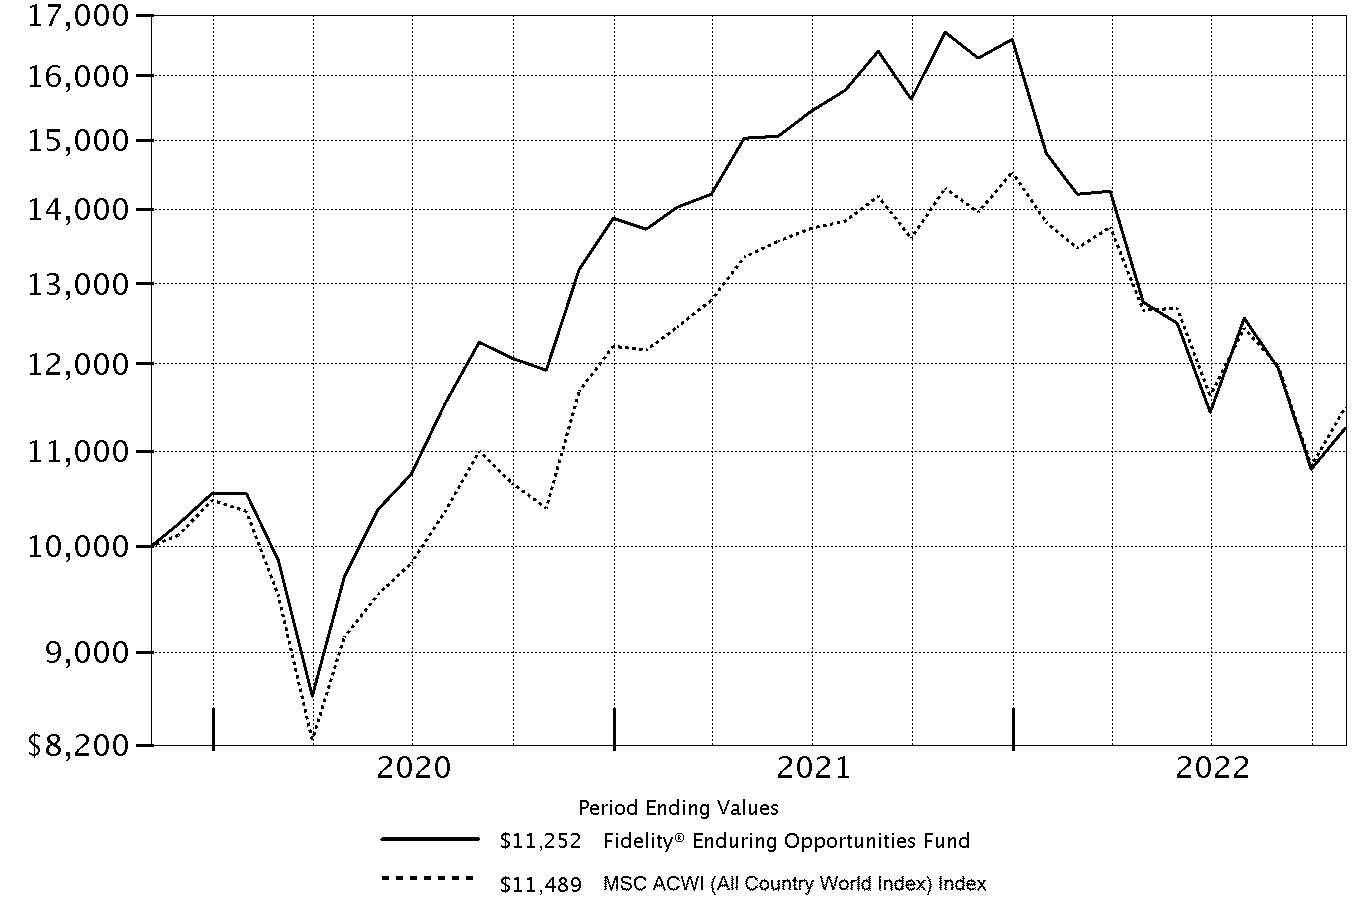 |
Top Holdings (% of Fund's net assets) | ||
| Microsoft Corp. | 3.5 | |
| Amazon.com, Inc. | 2.0 | |
| Alphabet, Inc. Class A | 1.4 | |
| Tesla, Inc. | 1.4 | |
| Alphabet, Inc. Class C | 1.4 | |
| UnitedHealth Group, Inc. | 1.3 | |
| JPMorgan Chase & Co. | 1.1 | |
| The Home Depot, Inc. | 1.0 | |
| Bank of America Corp. | 0.9 | |
| Costco Wholesale Corp. | 0.9 | |
| 14.9 | ||
| Market Sectors (% of Fund's net assets) | ||
| Information Technology | 21.2 | |
| Consumer Discretionary | 18.8 | |
| Industrials | 13.8 | |
| Financials | 11.3 | |
| Health Care | 9.0 | |
| Communication Services | 7.3 | |
| Consumer Staples | 6.8 | |
| Real Estate | 4.5 | |
| Materials | 4.1 | |
| Energy | 2.1 | |
| Utilities | 1.2 | |
Asset Allocation (% of Fund's net assets) |
 |
Short-Term Investments and Net Other Assets (Liabilities) - (0.1)%* |
Foreign investments - 38.6% |
*Short-Term Investments and Net Other Assets (Liabilities) are not available in the pie chart. |
Geographic Diversification (% of Fund's net assets) |
 |
* Includes Short-Term investments and Net Other Assets (Liabilities). Percentages are based on country or territory of incorporation and are adjusted for the effect of futures contracts, if applicable. |
| Common Stocks - 99.9% | |||
| Shares | Value ($) | ||
| COMMUNICATION SERVICES - 7.3% | |||
| Diversified Telecommunication Services - 0.2% | |||
| Elisa Corp. (A Shares) | 443 | 21,413 | |
| Entertainment - 1.6% | |||
| Netflix, Inc. (a) | 256 | 74,721 | |
| Sea Ltd. ADR (a) | 288 | 14,308 | |
| The Walt Disney Co. (a) | 608 | 64,776 | |
| Universal Music Group NV | 1,045 | 20,519 | |
| 174,324 | |||
| Interactive Media & Services - 4.7% | |||
| Adevinta ASA Class B (a) | 2,741 | 18,772 | |
| Alphabet, Inc.: | |||
| Class A (a) | 1,635 | 154,524 | |
| Class C (a) | 1,603 | 151,740 | |
| Hemnet Group AB | 1,213 | 15,073 | |
| Kakao Corp. | 398 | 14,137 | |
| Match Group, Inc. (a) | 623 | 26,914 | |
| Meta Platforms, Inc. Class A (a) | 671 | 62,510 | |
| NAVER Corp. | 101 | 11,994 | |
| Rightmove PLC | 2,316 | 13,042 | |
| Tencent Holdings Ltd. | 1,684 | 44,250 | |
| Yandex NV Series A (a)(b) | 472 | 1,619 | |
| Z Holdings Corp. | 5,179 | 13,366 | |
| 527,941 | |||
| Media - 0.8% | |||
| Cable One, Inc. | 21 | 18,048 | |
| Liberty Media Corp. Liberty Media Class A (a) | 717 | 37,298 | |
| S4 Capital PLC (a) | 11,815 | 23,806 | |
| Schibsted ASA (A Shares) | 957 | 14,738 | |
| 93,890 | |||
TOTAL COMMUNICATION SERVICES | 817,568 | ||
| CONSUMER DISCRETIONARY - 18.8% | |||
| Auto Components - 0.6% | |||
| Aptiv PLC (a) | 367 | 33,423 | |
| DENSO Corp. | 537 | 26,644 | |
| 60,067 | |||
| Automobiles - 2.4% | |||
| Ferrari NV (Italy) | 151 | 29,771 | |
| Maruti Suzuki India Ltd. | 299 | 34,414 | |
| Tesla, Inc. (a) | 668 | 151,997 | |
| Toyota Motor Corp. | 3,892 | 54,000 | |
| 270,182 | |||
| Hotels, Restaurants & Leisure - 3.6% | |||
| Chipotle Mexican Grill, Inc. (a) | 32 | 47,947 | |
| Churchill Downs, Inc. | 222 | 46,156 | |
| Compass Group PLC | 1,236 | 26,032 | |
| Domino's Pizza, Inc. | 103 | 34,221 | |
| Evolution AB (c) | 184 | 17,164 | |
| Hilton Worldwide Holdings, Inc. | 397 | 53,698 | |
| Jubilant Foodworks Ltd. | 2,564 | 18,892 | |
| Oriental Land Co. Ltd. | 202 | 27,102 | |
| Restaurant Brands Asia Ltd. (a) | 12,252 | 17,998 | |
| Vail Resorts, Inc. | 141 | 30,897 | |
| Wingstop, Inc. | 270 | 42,765 | |
| Yum! Brands, Inc. | 356 | 42,097 | |
| 404,969 | |||
| Household Durables - 0.6% | |||
| Berkeley Group Holdings PLC | 397 | 15,803 | |
| Maytronics Ltd. | 1,154 | 12,456 | |
| NVR, Inc. (a) | 10 | 42,378 | |
| 70,637 | |||
| Internet & Direct Marketing Retail - 3.3% | |||
| Amazon.com, Inc. (a) | 2,239 | 229,363 | |
| Doordash, Inc. (a) | 544 | 23,680 | |
| Meituan Class B (a)(c) | 1,961 | 31,397 | |
| MercadoLibre, Inc. (a) | 29 | 26,147 | |
| Prosus NV | 295 | 12,763 | |
| Wayfair LLC Class A (a) | 605 | 22,942 | |
| Zomato Ltd. (a) | 32,462 | 24,745 | |
| 371,037 | |||
| Leisure Products - 0.4% | |||
| Roland Corp. | 647 | 18,406 | |
| SHIMANO, Inc. | 129 | 19,962 | |
| 38,368 | |||
| Multiline Retail - 0.9% | |||
| B&M European Value Retail SA | 4,042 | 14,954 | |
| Dollarama, Inc. | 393 | 23,352 | |
| Next PLC | 328 | 18,540 | |
| Target Corp. | 268 | 44,019 | |
| 100,865 | |||
| Specialty Retail - 4.6% | |||
| Carvana Co. Class A (a) | 893 | 12,082 | |
| Fast Retailing Co. Ltd. | 49 | 27,348 | |
| Five Below, Inc. (a) | 243 | 35,563 | |
| Floor & Decor Holdings, Inc. Class A (a) | 460 | 33,750 | |
| JD Sports Fashion PLC | 10,731 | 11,991 | |
| Lowe's Companies, Inc. | 354 | 69,012 | |
| National Vision Holdings, Inc. (a) | 773 | 28,632 | |
| Nitori Holdings Co. Ltd. | 184 | 16,674 | |
| The Home Depot, Inc. | 381 | 112,826 | |
| TJX Companies, Inc. | 702 | 50,614 | |
| Ulta Beauty, Inc. (a) | 114 | 47,808 | |
| Warby Parker, Inc. (a) | 2,721 | 43,672 | |
| WH Smith PLC (a) | 1,154 | 15,577 | |
| Workman Co. Ltd. | 350 | 11,981 | |
| 517,530 | |||
| Textiles, Apparel & Luxury Goods - 2.4% | |||
| adidas AG | 108 | 10,542 | |
| Hermes International SCA | 25 | 32,378 | |
| lululemon athletica, Inc. (a) | 192 | 63,176 | |
| LVMH Moet Hennessy Louis Vuitton SE | 94 | 59,314 | |
| Moncler SpA | 590 | 25,474 | |
| NIKE, Inc. Class B | 557 | 51,623 | |
| PVH Corp. | 349 | 17,911 | |
| Shenzhou International Group Holdings Ltd. | 1,715 | 11,907 | |
| 272,325 | |||
TOTAL CONSUMER DISCRETIONARY | 2,105,980 | ||
| CONSUMER STAPLES - 6.8% | |||
| Beverages - 1.5% | |||
| Ambev SA | 10,110 | 31,315 | |
| China Resources Beer Holdings Co. Ltd. | 3,609 | 17,011 | |
| Davide Campari Milano NV | 2,686 | 24,139 | |
| Kweichow Moutai Co. Ltd. (A Shares) | 115 | 21,160 | |
| Monster Beverage Corp. (a) | 458 | 42,924 | |
| Pernod Ricard SA | 178 | 31,259 | |
| 167,808 | |||
| Food & Staples Retailing - 3.6% | |||
| Alimentation Couche-Tard, Inc. Class A (multi-vtg.) | 809 | 36,223 | |
| Avenue Supermarts Ltd. (a)(c) | 498 | 25,994 | |
| Casey's General Stores, Inc. | 191 | 44,448 | |
| Clicks Group Ltd. | 1,652 | 27,992 | |
| Cosmos Pharmaceutical Corp. | 150 | 14,526 | |
| Costco Wholesale Corp. | 190 | 95,285 | |
| Ocado Group PLC (a) | 1,951 | 10,577 | |
| Wal-Mart de Mexico SA de CV Series V | 9,745 | 37,641 | |
| Walmart, Inc. | 665 | 94,649 | |
| Welcia Holdings Co. Ltd. | 782 | 16,356 | |
| 403,691 | |||
| Food Products - 0.8% | |||
| Barry Callebaut AG | 12 | 22,697 | |
| Freshpet, Inc. (a) | 503 | 29,652 | |
| McCormick & Co., Inc. (non-vtg.) | 426 | 33,501 | |
| 85,850 | |||
| Household Products - 0.2% | |||
| Unicharm Corp. | 693 | 21,061 | |
| Personal Products - 0.7% | |||
| Hindustan Unilever Ltd. | 924 | 28,471 | |
| L'Oreal SA | 113 | 35,482 | |
| Shiseido Co. Ltd. | 471 | 16,329 | |
| 80,282 | |||
TOTAL CONSUMER STAPLES | 758,692 | ||
| ENERGY - 2.1% | |||
| Oil, Gas & Consumable Fuels - 2.1% | |||
| Cheniere Energy, Inc. | 307 | 54,158 | |
| Hess Corp. | 510 | 71,951 | |
| Parkland Corp. | 761 | 15,384 | |
| PrairieSky Royalty Ltd. | 3,064 | 47,590 | |
| Reliance Industries Ltd. | 1,450 | 44,660 | |
| 233,743 | |||
| FINANCIALS - 11.3% | |||
| Banks - 3.9% | |||
| Bank of America Corp. | 2,719 | 97,993 | |
| Credicorp Ltd. (United States) | 270 | 39,517 | |
| FinecoBank SpA | 1,536 | 20,705 | |
| First Republic Bank | 271 | 32,547 | |
| JPMorgan Chase & Co. | 1,013 | 127,516 | |
| KBC Group NV | 431 | 21,600 | |
| PNC Financial Services Group, Inc. | 293 | 47,416 | |
| PT Bank Central Asia Tbk | 55,143 | 31,111 | |
| SVB Financial Group (a) | 96 | 22,172 | |
| 440,577 | |||
| Capital Markets - 4.5% | |||
| Avanza Bank Holding AB | 742 | 14,818 | |
| Banca Generali SpA | 585 | 17,494 | |
| Bolsa Mexicana de Valores S.A.B. de CV | 13,232 | 24,096 | |
| Brookfield Asset Management, Inc. (Canada) Class A | 823 | 32,591 | |
| Charles Schwab Corp. | 916 | 72,978 | |
| CME Group, Inc. | 243 | 42,112 | |
| Houlihan Lokey | 442 | 39,479 | |
| HUB24 Ltd. | 1,140 | 18,478 | |
| Moody's Corp. | 141 | 37,347 | |
| Morningstar, Inc. | 159 | 36,917 | |
| MSCI, Inc. | 97 | 45,479 | |
| Netwealth Group Ltd. | 1,886 | 14,670 | |
| Partners Group Holding AG | 19 | 17,066 | |
| S&P Global, Inc. | 175 | 56,219 | |
| St. James's Place PLC | 1,319 | 16,110 | |
| VZ Holding AG | 239 | 16,469 | |
| 502,323 | |||
| Consumer Finance - 0.3% | |||
| Bajaj Finance Ltd. | 341 | 29,429 | |
| Diversified Financial Services - 0.2% | |||
| Zenkoku Hosho Co. Ltd. | 657 | 21,695 | |
| Insurance - 2.4% | |||
| Arthur J. Gallagher & Co. | 321 | 60,053 | |
| Assurant, Inc. | 249 | 33,829 | |
| Chubb Ltd. | 397 | 85,311 | |
| Hannover Reuck SE | 148 | 24,104 | |
| Lifenet Insurance Co. (a) | 3,090 | 20,656 | |
| Linea Directa Aseguradora SA Compania de Seguros y Reaseguros | 11,333 | 10,623 | |
| Qualitas Controladora S.A.B. de CV | 5,626 | 22,106 | |
| Steadfast Group Ltd. | 5,820 | 18,837 | |
| 275,519 | |||
TOTAL FINANCIALS | 1,269,543 | ||
| HEALTH CARE - 8.8% | |||
| Biotechnology - 0.5% | |||
| Abcam PLC (a) | 1,158 | 17,925 | |
| Repligen Corp. (a) | 159 | 29,016 | |
| Zai Lab Ltd. (a) | 4,853 | 11,178 | |
| 58,119 | |||
| Health Care Equipment & Supplies - 3.7% | |||
| Align Technology, Inc. (a) | 146 | 28,368 | |
| Boston Scientific Corp. (a) | 1,214 | 52,336 | |
| Coloplast A/S Series B | 165 | 18,393 | |
| Fisher & Paykel Healthcare Corp. | 1,258 | 14,321 | |
| Hoya Corp. | 287 | 26,780 | |
| IDEXX Laboratories, Inc. (a) | 92 | 33,091 | |
| Inspire Medical Systems, Inc. (a) | 177 | 34,506 | |
| Intuitive Surgical, Inc. (a) | 197 | 48,555 | |
| Masimo Corp. (a) | 285 | 37,506 | |
| ResMed, Inc. | 195 | 43,620 | |
| Shenzhen Mindray Bio-Medical Electronics Co. Ltd. (A Shares) | 486 | 21,658 | |
| Straumann Holding AG | 192 | 18,273 | |
| The Cooper Companies, Inc. | 117 | 31,987 | |
| 409,394 | |||
| Health Care Providers & Services - 2.5% | |||
| Apollo Hospitals Enterprise Ltd. | 437 | 23,848 | |
| Chemed Corp. | 85 | 39,684 | |
| Humana, Inc. | 118 | 65,853 | |
| UnitedHealth Group, Inc. | 271 | 150,446 | |
| 279,831 | |||
| Health Care Technology - 0.2% | |||
| Veeva Systems, Inc. Class A (a) | 159 | 26,702 | |
| Life Sciences Tools & Services - 1.7% | |||
| 10X Genomics, Inc. (a) | 568 | 15,438 | |
| Danaher Corp. | 268 | 67,448 | |
| Lonza Group AG | 47 | 24,195 | |
| Maravai LifeSciences Holdings, Inc. (a) | 1,081 | 17,945 | |
| Sartorius Stedim Biotech | 66 | 20,950 | |
| West Pharmaceutical Services, Inc. | 148 | 34,055 | |
| Wuxi Biologics (Cayman), Inc. (a)(c) | 3,155 | 14,196 | |
| 194,227 | |||
| Pharmaceuticals - 0.2% | |||
| Jiangsu Hengrui Medicine Co. Ltd. (A Shares) | 3,959 | 21,793 | |
TOTAL HEALTH CARE | 990,066 | ||
| INDUSTRIALS - 13.8% | |||
| Aerospace & Defense - 1.1% | |||
| HEICO Corp. | 248 | 40,335 | |
| INVISIO AB | 1,159 | 17,215 | |
| Northrop Grumman Corp. | 130 | 71,371 | |
| 128,921 | |||
| Air Freight & Logistics - 1.3% | |||
| C.H. Robinson Worldwide, Inc. | 506 | 49,446 | |
| Deutsche Post AG | 779 | 27,538 | |
| DSV A/S | 145 | 19,630 | |
| Expeditors International of Washington, Inc. | 381 | 37,281 | |
| ZTO Express, Inc. sponsored ADR | 960 | 16,214 | |
| 150,109 | |||
| Airlines - 0.1% | |||
| Ryanair Holdings PLC sponsored ADR (a) | 221 | 15,225 | |
| Building Products - 0.6% | |||
| ASSA ABLOY AB (B Shares) | 1,297 | 26,189 | |
| Belimo Holding AG (Reg.) | 49 | 19,965 | |
| Kingspan Group PLC (Ireland) | 315 | 15,907 | |
| 62,061 | |||
| Commercial Services & Supplies - 1.5% | |||
| Casella Waste Systems, Inc. Class A (a) | 525 | 42,950 | |
| Cintas Corp. | 87 | 37,197 | |
| Copart, Inc. (a) | 345 | 39,682 | |
| GFL Environmental, Inc. | 625 | 16,869 | |
| Sunny Friend Environmental Technology Co. Ltd. | 3,528 | 14,712 | |
| Waste Connections, Inc. (Canada) | 135 | 17,818 | |
| 169,228 | |||
| Construction & Engineering - 0.1% | |||
| Sweco AB (B Shares) | 1,610 | 12,103 | |
| Electrical Equipment - 1.1% | |||
| AMETEK, Inc. | 325 | 42,140 | |
| Eaton Corp. PLC | 312 | 46,822 | |
| Generac Holdings, Inc. (a) | 123 | 14,257 | |
| Nidec Corp. | 346 | 19,024 | |
| 122,243 | |||
| Industrial Conglomerates - 0.6% | |||
| Honeywell International, Inc. | 327 | 66,715 | |
| Machinery - 2.8% | |||
| Atlas Copco AB (A Shares) | 2,383 | 25,434 | |
| Fortive Corp. | 645 | 41,216 | |
| Haitian International Holdings Ltd. | 8,136 | 16,293 | |
| IDEX Corp. | 200 | 44,462 | |
| Indutrade AB | 942 | 16,496 | |
| Kone OYJ (B Shares) | 371 | 15,191 | |
| Minebea Mitsumi, Inc. | 935 | 13,859 | |
| Misumi Group, Inc. | 855 | 18,285 | |
| Rational AG | 22 | 12,414 | |
| Schindler Holding AG (participation certificate) | 87 | 14,184 | |
| Shenzhen Inovance Technology Co. Ltd. (A Shares) | 3,413 | 31,172 | |
| SMC Corp. | 48 | 19,267 | |
| Spirax-Sarco Engineering PLC | 136 | 16,766 | |
| Tocalo Co. Ltd. | 1,606 | 12,853 | |
| Zhejiang Sanhua Intelligent Controls Co. Ltd. (A Shares) | 4,467 | 12,998 | |
| 310,890 | |||
| Professional Services - 3.1% | |||
| BayCurrent Consulting, Inc. | 540 | 15,216 | |
| Centre Testing International Group Co. Ltd. (A Shares) | 4,438 | 11,382 | |
| CoStar Group, Inc. (a) | 599 | 49,549 | |
| Equifax, Inc. | 215 | 36,451 | |
| Experian PLC | 903 | 28,792 | |
| Funai Soken Holdings, Inc. | 852 | 15,201 | |
| Headhunter Group PLC ADR (b) | 622 | 1,693 | |
| Recruit Holdings Co. Ltd. | 902 | 27,756 | |
| RELX PLC (London Stock Exchange) | 1,384 | 37,175 | |
| Sporton International, Inc. | 3,374 | 21,131 | |
| Thomson Reuters Corp. | 252 | 26,801 | |
| TriNet Group, Inc. (a) | 474 | 30,801 | |
| Verisk Analytics, Inc. | 229 | 41,868 | |
| 343,816 | |||
| Road & Rail - 0.9% | |||
| Localiza Rent a Car SA | 2,219 | 30,303 | |
| Old Dominion Freight Lines, Inc. | 177 | 48,604 | |
| Vamos Locacao de Caminhoes Maquinas e Equipamentos SA | 7,033 | 21,948 | |
| 100,855 | |||
| Trading Companies & Distributors - 0.6% | |||
| AddTech AB (B Shares) | 1,555 | 18,816 | |
| Ashtead Group PLC | 501 | 26,142 | |
| IMCD NV | 158 | 20,502 | |
| 65,460 | |||
TOTAL INDUSTRIALS | 1,547,626 | ||
| INFORMATION TECHNOLOGY - 21.2% | |||
| Communications Equipment - 0.3% | |||
| Lumentum Holdings, Inc. (a) | 468 | 34,843 | |
| Electronic Equipment & Components - 2.4% | |||
| Amphenol Corp. Class A | 633 | 48,000 | |
| Azbil Corp. | 666 | 18,117 | |
| CDW Corp. | 257 | 44,412 | |
| Cognex Corp. | 628 | 29,032 | |
| Keyence Corp. | 87 | 32,952 | |
| Lagercrantz Group AB (B Shares) | 2,284 | 19,600 | |
| Murata Manufacturing Co. Ltd. | 476 | 22,534 | |
| Sunny Optical Technology Group Co. Ltd. | 1,278 | 11,079 | |
| Teledyne Technologies, Inc. (a) | 102 | 40,594 | |
| 266,320 | |||
| IT Services - 3.6% | |||
| Adyen BV (a)(c) | 13 | 18,559 | |
| Amadeus IT Holding SA Class A (a) | 495 | 25,817 | |
| Capgemini SA | 177 | 29,009 | |
| Cloudflare, Inc. (a) | 417 | 23,485 | |
| Edenred SA | 403 | 20,694 | |
| FDM Group Holdings PLC | 1,642 | 11,882 | |
| GMO Internet, Inc. | 1,007 | 17,411 | |
| Kainos Group PLC | 981 | 13,916 | |
| Keywords Studios PLC | 863 | 23,851 | |
| Maximus, Inc. | 526 | 32,438 | |
| Nagarro SE (a) | 139 | 13,847 | |
| Reply SpA | 122 | 13,274 | |
| SHIFT, Inc. (a) | 109 | 17,087 | |
| Shopify, Inc. Class A (a) | 364 | 12,460 | |
| Softcat PLC | 1,050 | 13,486 | |
| Toast, Inc. (a) | 2,176 | 48,068 | |
| Twilio, Inc. Class A (a) | 328 | 24,393 | |
| VeriSign, Inc. (a) | 220 | 44,101 | |
| 403,778 | |||
| Semiconductors & Semiconductor Equipment - 3.6% | |||
| ASM International NV (Netherlands) | 88 | 19,550 | |
| ASML Holding NV (Netherlands) | 124 | 58,167 | |
| BE Semiconductor Industries NV | 276 | 14,107 | |
| Disco Corp. | 105 | 25,209 | |
| eMemory Technology, Inc. | 518 | 17,265 | |
| Entegris, Inc. | 375 | 29,753 | |
| Monolithic Power Systems, Inc. | 101 | 34,284 | |
| Silergy Corp. | 930 | 10,784 | |
| Silicon Laboratories, Inc. (a) | 339 | 38,958 | |
| Taiwan Semiconductor Manufacturing Co. Ltd. | 7,001 | 84,085 | |
| Teradyne, Inc. | 382 | 31,076 | |
| Tokyo Electron Ltd. | 93 | 24,468 | |
| Universal Display Corp. | 193 | 18,377 | |
| 406,083 | |||
| Software - 11.3% | |||
| Adobe, Inc. (a) | 171 | 54,464 | |
| ANSYS, Inc. (a) | 137 | 30,299 | |
| Atlassian Corp. PLC (a) | 76 | 15,407 | |
| ATOSS Software AG | 139 | 16,951 | |
| Bill.Com Holdings, Inc. (a) | 227 | 30,273 | |
| Black Knight, Inc. (a) | 583 | 35,254 | |
| Cadence Design Systems, Inc. (a) | 299 | 45,266 | |
| Ceridian HCM Holding, Inc. (a) | 692 | 45,803 | |
| Confluent, Inc. (a) | 1,110 | 29,837 | |
| Constellation Software, Inc. | 17 | 24,581 | |
| Coupa Software, Inc. (a) | 429 | 22,836 | |
| CyberArk Software Ltd. (a) | 200 | 31,382 | |
| Dassault Systemes SA | 788 | 26,413 | |
| Fortnox AB | 3,520 | 14,985 | |
| HubSpot, Inc. (a) | 111 | 32,918 | |
| Microsoft Corp. | 1,681 | 390,210 | |
| Money Forward, Inc. (a) | 614 | 17,508 | |
| Nemetschek SE | 276 | 13,191 | |
| Netcompany Group A/S (a)(c) | 353 | 12,116 | |
| Paycom Software, Inc. (a) | 128 | 44,288 | |
| Procore Technologies, Inc. (a) | 635 | 34,709 | |
| Roper Technologies, Inc. | 101 | 41,869 | |
| Salesforce.com, Inc. (a) | 350 | 56,907 | |
| SAP SE | 391 | 37,635 | |
| ServiceNow, Inc. (a) | 103 | 43,336 | |
| SimCorp A/S | 205 | 12,244 | |
| Synopsys, Inc. (a) | 169 | 49,441 | |
| Topicus.Com, Inc. (a) | 266 | 13,804 | |
| Workday, Inc. Class A (a) | 194 | 30,229 | |
| Xero Ltd. (a) | 304 | 15,181 | |
| 1,269,337 | |||
TOTAL INFORMATION TECHNOLOGY | 2,380,361 | ||
| MATERIALS - 4.1% | |||
| Chemicals - 3.2% | |||
| Aica Kogyo Co. Ltd. | 938 | 20,186 | |
| Air Products & Chemicals, Inc. | 177 | 44,321 | |
| Asian Paints Ltd. | 663 | 24,890 | |
| Ecolab, Inc. | 245 | 38,482 | |
| Givaudan SA | 8 | 23,888 | |
| Linde PLC | 187 | 55,604 | |
| NOF Corp. | 431 | 14,841 | |
| Quaker Houghton | 173 | 28,137 | |
| Sherwin-Williams Co. | 182 | 40,955 | |
| Shin-Etsu Chemical Co. Ltd. | 225 | 23,384 | |
| Sika AG | 129 | 29,086 | |
| Symrise AG | 185 | 18,883 | |
| 362,657 | |||
| Metals & Mining - 0.9% | |||
| First Quantum Minerals Ltd. | 931 | 16,422 | |
| Freeport-McMoRan, Inc. | 1,313 | 41,609 | |
| Lynas Rare Earths Ltd. (a) | 4,253 | 22,661 | |
| Press Metal Bhd | 19,537 | 17,975 | |
| 98,667 | |||
TOTAL MATERIALS | 461,324 | ||
| REAL ESTATE - 4.5% | |||
| Equity Real Estate Investment Trusts (REITs) - 3.6% | |||
| American Tower Corp. | 218 | 45,167 | |
| ARGAN SA | 181 | 13,576 | |
| Big Yellow Group PLC | 1,115 | 14,398 | |
| Embassy Office Parks (REIT) | 6,513 | 27,095 | |
| Equinix, Inc. | 73 | 41,350 | |
| Equity Lifestyle Properties, Inc. | 589 | 37,672 | |
| Extra Space Storage, Inc. | 226 | 40,101 | |
| Irish Residential Properties REIT PLC | 13,468 | 14,561 | |
| National Storage REIT unit | 16,314 | 27,236 | |
| Prologis (REIT), Inc. | 457 | 50,613 | |
| Safestore Holdings PLC | 1,481 | 15,345 | |
| Segro PLC | 1,591 | 14,323 | |
| Summit Industrial Income REIT | 1,233 | 15,757 | |
| Sun Communities, Inc. | 264 | 35,600 | |
| Warehouses de Pauw | 525 | 13,479 | |
| 406,273 | |||
| Real Estate Management & Development - 0.9% | |||
| Ayala Land, Inc. | 36,338 | 16,078 | |
| CBRE Group, Inc. (a) | 484 | 34,335 | |
| Colliers International Group, Inc. | 176 | 16,518 | |
| Oberoi Realty Ltd. | 2,789 | 31,153 | |
| 98,084 | |||
TOTAL REAL ESTATE | 504,357 | ||
| UTILITIES - 1.2% | |||
| Electric Utilities - 0.7% | |||
| NextEra Energy, Inc. | 954 | 73,935 | |
| Gas Utilities - 0.2% | |||
| Nippon Gas Co. Ltd. | 1,244 | 18,079 | |
| Water Utilities - 0.3% | |||
| American Water Works Co., Inc. | 254 | 36,916 | |
TOTAL UTILITIES | 128,930 | ||
| TOTAL COMMON STOCKS (Cost $11,405,807) | 11,198,190 | ||
| Nonconvertible Preferred Stocks - 0.2% | |||
| Shares | Value ($) | ||
| HEALTH CARE - 0.2% | |||
| Life Sciences Tools & Services - 0.2% | |||
Sartorius AG (non-vtg.) (Cost $13,707) | 63 | 22,233 | |
| TOTAL INVESTMENT IN SECURITIES - 100.1% (Cost $11,419,514) | 11,220,423 |
NET OTHER ASSETS (LIABILITIES) - (0.1)% | (12,241) |
| NET ASSETS - 100.0% | 11,208,182 |
| (a) | Non-income producing |
| (b) | Level 3 security |
| (c) | Security exempt from registration under Rule 144A of the Securities Act of 1933. These securities may be resold in transactions exempt from registration, normally to qualified institutional buyers. At the end of the period, the value of these securities amounted to $119,426 or 1.1% of net assets. |
| Affiliate | Value, beginning of period ($) | Purchases ($) | Sales Proceeds ($) | Dividend Income ($) | Realized Gain (loss) ($) | Change in Unrealized appreciation (depreciation) ($) | Value, end of period ($) | % ownership, end of period |
| Fidelity Cash Central Fund 3.10% | 97,273 | 3,000,909 | 3,098,182 | 1,442 | - | - | - | 0.0% |
| Total | 97,273 | 3,000,909 | 3,098,182 | 1,442 | - | - | - | |
| Valuation Inputs at Reporting Date: | ||||
| Description | Total ($) | Level 1 ($) | Level 2 ($) | Level 3 ($) |
Investments in Securities: | ||||
| Equities: | ||||
Communication Services | 817,568 | 724,772 | 91,177 | 1,619 |
Consumer Discretionary | 2,105,980 | 1,832,344 | 273,636 | - |
Consumer Staples | 758,692 | 691,572 | 67,120 | - |
Energy | 233,743 | 233,743 | - | - |
Financials | 1,269,543 | 1,247,943 | 21,600 | - |
Health Care | 1,012,299 | 919,317 | 92,982 | - |
Industrials | 1,547,626 | 1,319,567 | 226,366 | 1,693 |
Information Technology | 2,380,361 | 2,053,674 | 326,687 | - |
Materials | 461,324 | 389,971 | 71,353 | - |
Real Estate | 504,357 | 488,279 | 16,078 | - |
Utilities | 128,930 | 128,930 | - | - |
| Total Investments in Securities: | 11,220,423 | 10,030,112 | 1,186,999 | 3,312 |
| Statement of Assets and Liabilities | ||||
| October 31, 2022 | ||||
| Assets | ||||
Investment in securities, at value - See accompanying schedule Unaffiliated issuers (cost $11,419,514): | $ | 11,220,423 | ||
| Cash | 3,882 | |||
| Foreign currency held at value (cost $718) | 713 | |||
| Receivable for fund shares sold | 4,782 | |||
| Dividends receivable | 10,175 | |||
| Distributions receivable from Fidelity Central Funds | 409 | |||
| Prepaid expenses | 22 | |||
| Receivable from investment adviser for expense reductions | 19,246 | |||
Total assets | 11,259,652 | |||
| Liabilities | ||||
| Accrued management fee | $5,152 | |||
| Transfer agent fee payable | 2,975 | |||
| Other affiliated payables | 361 | |||
| Deferred taxes | 5,380 | |||
| Audit fee payable | 31,629 | |||
| Other payables and accrued expenses | 5,973 | |||
| Total Liabilities | 51,470 | |||
| Net Assets | $ | 11,208,182 | ||
| Net Assets consist of: | ||||
| Paid in capital | $ | 12,448,653 | ||
| Total accumulated earnings (loss) | (1,240,471) | |||
| Net Assets | $ | 11,208,182 | ||
Net Asset Value , offering price and redemption price per share ($11,208,182 ÷ 1,024,481 shares) | $ | 10.94 | ||
| Statement of Operations | ||||
Year ended October 31, 2022 | ||||
| Investment Income | ||||
| Dividends | $ | 182,236 | ||
| Income from Fidelity Central Funds | 1,442 | |||
| Income before foreign taxes withheld | 183,678 | |||
| Less foreign taxes withheld | (12,598) | |||
| Total Income | 171,080 | |||
| Expenses | ||||
| Management fee | ||||
| Basic fee | $ | 100,620 | ||
| Performance adjustment | 5,247 | |||
| Transfer agent fees | 40,857 | |||
| Accounting fees and expenses | 6,248 | |||
| Custodian fees and expenses | 11,884 | |||
| Independent trustees' fees and expenses | 58 | |||
| Registration fees | 21,224 | |||
| Audit | 47,343 | |||
| Legal | 17 | |||
| Miscellaneous | 212 | |||
| Total expenses before reductions | 233,710 | |||
| Expense reductions | (71,436) | |||
| Total expenses after reductions | 162,274 | |||
| Net Investment income (loss) | 8,806 | |||
| Realized and Unrealized Gain (Loss) | ||||
| Net realized gain (loss) on: | ||||
| Investment Securities: | ||||
| Unaffiliated issuers (net of foreign taxes of $4,324) | (930,336) | |||
| Foreign currency transactions | (3,604) | |||
| Total net realized gain (loss) | (933,940) | |||
| Change in net unrealized appreciation (depreciation) on: | ||||
| Investment Securities: | ||||
| Unaffiliated issuers (net of decrease in deferred foreign taxes of $9,880) | (6,032,643) | |||
| Assets and liabilities in foreign currencies | (481) | |||
| Total change in net unrealized appreciation (depreciation) | (6,033,124) | |||
| Net gain (loss) | (6,967,064) | |||
| Net increase (decrease) in net assets resulting from operations | $ | (6,958,258) | ||
| Statement of Changes in Net Assets | ||||
Year ended October 31, 2022 | Year ended October 31, 2021 | |||
| Increase (Decrease) in Net Assets | ||||
| Operations | ||||
| Net investment income (loss) | $ | 8,806 | $ | (42,567) |
| Net realized gain (loss) | (933,940) | 611,309 | ||
| Change in net unrealized appreciation (depreciation) | (6,033,124) | 4,480,723 | ||
| Net increase (decrease) in net assets resulting from operations | (6,958,258) | 5,049,465 | ||
| Distributions to shareholders | (572,700) | - | ||
| Share transactions | ||||
| Proceeds from sales of shares | 3,817,785 | 11,858,773 | ||
| Reinvestment of distributions | 537,633 | - | ||
| Cost of shares redeemed | (7,108,348) | (5,470,813) | ||
Net increase (decrease) in net assets resulting from share transactions | (2,752,930) | 6,387,960 | ||
| Total increase (decrease) in net assets | (10,283,888) | 11,437,425 | ||
| Net Assets | ||||
| Beginning of period | 21,492,070 | 10,054,645 | ||
| End of period | $ | 11,208,182 | $ | 21,492,070 |
| Other Information | ||||
| Shares | ||||
| Sold | 278,587 | 815,088 | ||
| Issued in reinvestment of distributions | 33,571 | - | ||
| Redeemed | (575,644) | (371,566) | ||
| Net increase (decrease) | (263,486) | 443,522 | ||
| Fidelity® Enduring Opportunities Fund |
| Years ended October 31, | 2022 | 2021 | 2020 A | |||
Selected Per-Share Data | ||||||
| Net asset value, beginning of period | $ | 16.69 | $ | 11.91 | $ | 10.00 |
| Income from Investment Operations | ||||||
Net investment income (loss) B,C | .01 | (.04) | (.01) | |||
| Net realized and unrealized gain (loss) | (5.32) | 4.82 | 1.93 | |||
| Total from investment operations | (5.31) | 4.78 | 1.92 | |||
| Distributions from net investment income | (.03) | - | - D | |||
| Distributions from net realized gain | (.41) | - | - | |||
| Tax return of capital | - | - | (.01) | |||
| Total distributions | (.44) | - | (.01) | |||
| Net asset value, end of period | $ | 10.94 | $ | 16.69 | $ | 11.91 |
Total Return E,F | (32.65)% | 40.13% | 19.22% | |||
Ratios to Average Net Assets C,G,H | ||||||
| Expenses before reductions | 1.41% | 1.70% | 2.63% I | |||
| Expenses net of fee waivers, if any | .98% | 1.08% | 1.10% I | |||
| Expenses net of all reductions | .98% | 1.08% | 1.09% I | |||
| Net investment income (loss) | .05% | (.25)% | (.10)% I | |||
| Supplemental Data | ||||||
| Net assets, end of period (000 omitted) | $ | 11,208 | $ | 21,492 | $ | 10,055 |
Portfolio turnover rate J | 15% | 23% | 17% I |
| Fidelity Central Fund | Investment Manager | Investment Objective | Investment Practices | Expense Ratio A |
| Fidelity Money Market Central Funds | Fidelity Management & Research Company LLC (FMR) | Each fund seeks to obtain a high level of current income consistent with the preservation of capital and liquidity. | Short-term Investments | Less than .005% |
| Gross unrealized appreciation | $1,715,140 |
| Gross unrealized depreciation | (1,958,641) |
| Net unrealized appreciation (depreciation) | $(243,501) |
| Tax Cost | $11,463,924 |
| Capital loss carryforward | $(981,040) |
| Net unrealized appreciation (depreciation) on securities and other investments | $(243,907) |
Short-term | $(440,776) |
Long-term | (540,264) |
| Total capital loss carryforward | $(981,040) |
| October 31, 2022 | October 31, 2021 | |
| Ordinary Income | $161,718 | $- |
| Long-term Capital Gains | 410,982 | - |
| Total | $572,700 | $- |
| Purchases ($) | Sales ($) | |
| Fidelity Enduring Opportunities Fund | 2,531,708 | 5,684,835 |
| % of Average Net Assets | |
| Fidelity Enduring Opportunities Fund | .04 |
| Amount | |
| Fidelity Enduring Opportunities Fund | $9 |
| Purchases ($) | Sales ($) | Realized Gain (Loss) ($) | |
| Fidelity Enduring Opportunities Fund | 80,538 | 55,672 | (7,489) |
| Amount | |
| Fidelity Enduring Opportunities Fund | $29 |
| Fund | Affiliated % |
| Fidelity Enduring Opportunities Fund. | 19% |
| The Example is based on an investment of $1,000 invested at the beginning of the period and held for the entire period (May 1, 2022 to October 31, 2022). |
Annualized Expense Ratio- A | Beginning Account Value May 1, 2022 | Ending Account Value October 31, 2022 | Expenses Paid During Period- C May 1, 2022 to October 31, 2022 | |||||||
| Fidelity® Enduring Opportunities Fund | .95% | |||||||||
| Actual | $ 1,000 | $ 881.50 | $ 4.51 | |||||||
Hypothetical- B | $ 1,000 | $ 1,020.42 | $ 4.84 | |||||||
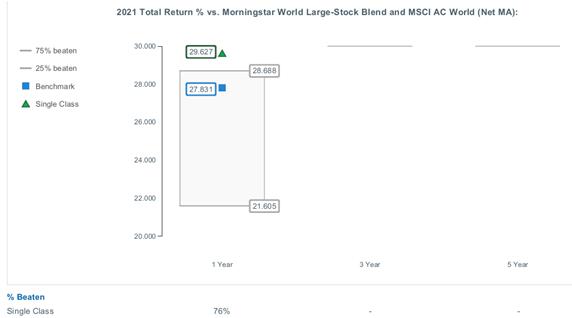
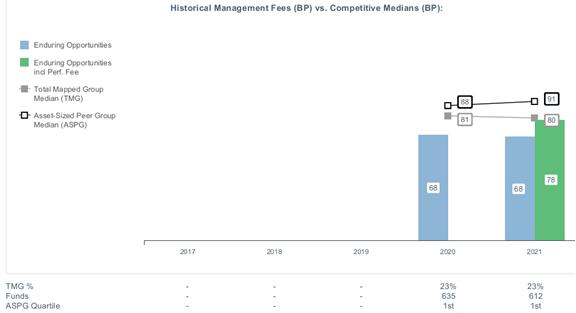
|


Contents
Board Approval of Investment Advisory Contracts and Management Fees |
| Average Annual Total Returns | |||
Periods ended October 31, 2022 | Past 1 year | Past 5 years | Past 10 years |
| Fidelity® Global Equity Income Fund | -11.45% | 7.03% | 9.06% |
| $10,000 Over 10 Years |
Let's say hypothetically that $10,000 was invested in Fidelity® Global Equity Income Fund on October 31, 2012. The chart shows how the value of your investment would have changed, and also shows how the MSCI ACWI (All Country World Index) Index performed over the same period. |
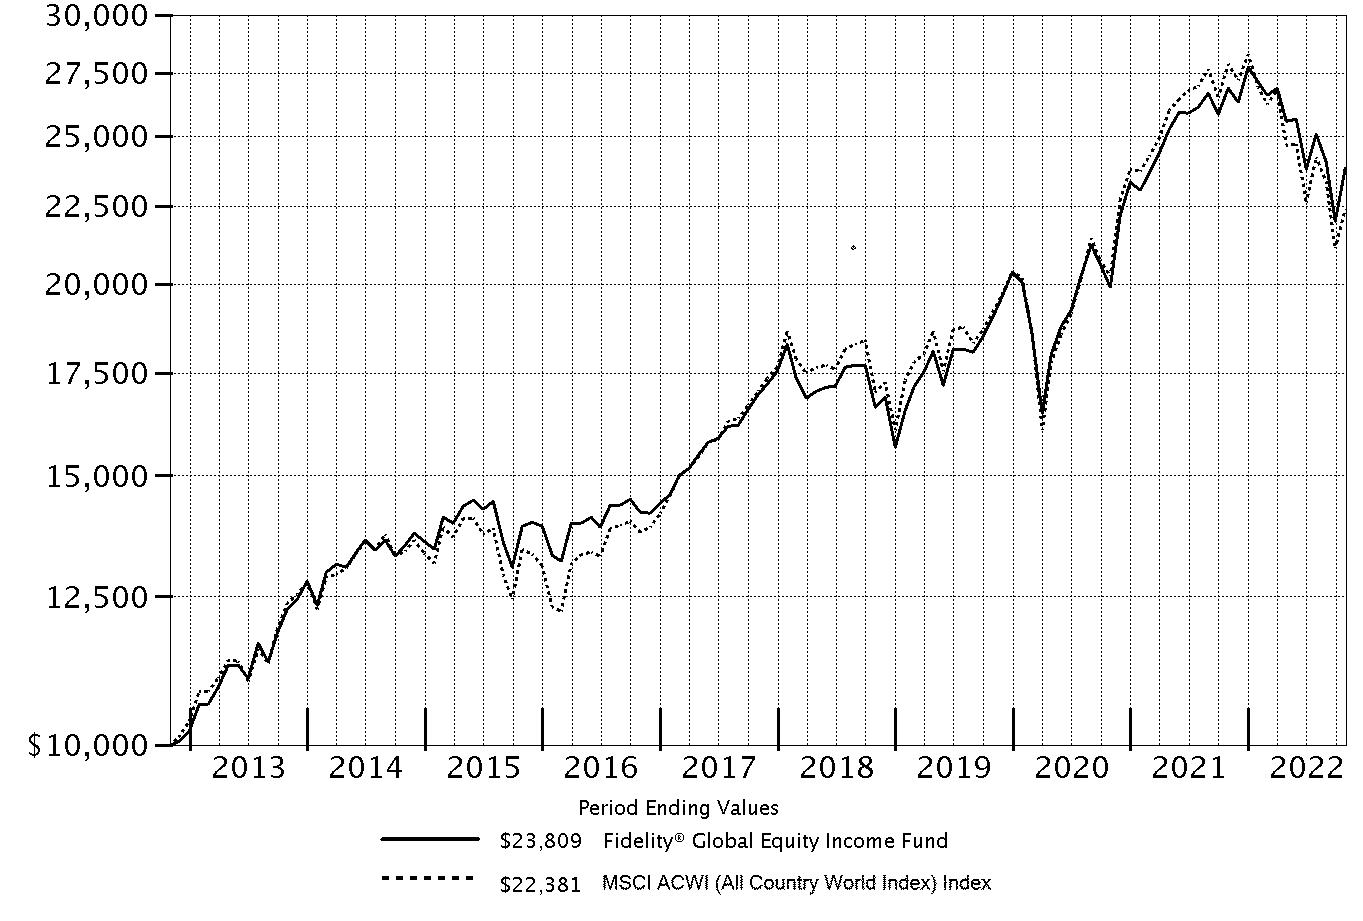 |
Top Holdings (% of Fund's net assets) | ||
| Apple, Inc. (United States of America, Technology Hardware, Storage & Peripherals) | 5.0 | |
| Microsoft Corp. (United States of America, Software) | 3.6 | |
| UnitedHealth Group, Inc. (United States of America, Health Care Providers & Services) | 2.0 | |
| Exxon Mobil Corp. (United States of America, Oil, Gas & Consumable Fuels) | 1.8 | |
| Eli Lilly & Co. (United States of America, Pharmaceuticals) | 1.8 | |
| Roche Holding AG (participation certificate) (Switzerland, Pharmaceuticals) | 1.6 | |
| Bristol-Myers Squibb Co. (United States of America, Pharmaceuticals) | 1.6 | |
| Bank of America Corp. (United States of America, Banks) | 1.6 | |
| JPMorgan Chase & Co. (United States of America, Banks) | 1.5 | |
| Danaher Corp. (United States of America, Life Sciences Tools & Services) | 1.5 | |
| 22.0 | ||
| Market Sectors (% of Fund's net assets) | ||
| Information Technology | 19.7 | |
| Health Care | 15.0 | |
| Financials | 11.9 | |
| Consumer Staples | 10.7 | |
| Industrials | 8.8 | |
| Consumer Discretionary | 7.7 | |
| Energy | 7.4 | |
| Communication Services | 7.0 | |
| Materials | 4.0 | |
| Utilities | 3.7 | |
| Real Estate | 1.3 | |
Asset Allocation (% of Fund's net assets) |
 |
Geographic Diversification (% of Fund's net assets) |
 |
* Includes Short-Term investments and Net Other Assets (Liabilities). Percentages are based on country or territory of incorporation and are adjusted for the effect of futures contracts, if applicable. |
| Common Stocks - 97.2% | |||
| Shares | Value ($) | ||
| Bailiwick of Guernsey - 0.5% | |||
| Amdocs Ltd. | 8,493 | 733,031 | |
| Bailiwick of Jersey - 0.1% | |||
| Experian PLC | 5,228 | 166,696 | |
| Belgium - 0.5% | |||
| KBC Group NV | 8,600 | 430,996 | |
| UCB SA | 3,431 | 258,777 | |
TOTAL BELGIUM | 689,773 | ||
| Brazil - 0.8% | |||
| Equatorial Energia SA | 196,008 | 1,139,506 | |
| Canada - 4.7% | |||
| Alimentation Couche-Tard, Inc. Class A (multi-vtg.) | 31,270 | 1,400,132 | |
| Canadian Natural Resources Ltd. | 17,127 | 1,027,230 | |
| Constellation Software, Inc. | 362 | 523,434 | |
| Imperial Oil Ltd. | 17,491 | 951,487 | |
| Nutrien Ltd. | 3,829 | 323,526 | |
| Open Text Corp. | 23,949 | 693,675 | |
| Shaw Communications, Inc. Class B | 25,441 | 653,415 | |
| Suncor Energy, Inc. | 27,372 | 941,500 | |
TOTAL CANADA | 6,514,399 | ||
| Cayman Islands - 0.6% | |||
| HKBN Ltd. | 1,167,630 | 788,371 | |
| SITC International Holdings Co. Ltd. | 59,088 | 96,803 | |
TOTAL CAYMAN ISLANDS | 885,174 | ||
| China - 0.5% | |||
| Kweichow Moutai Co. Ltd. (A Shares) | 2,833 | 521,262 | |
| TravelSky Technology Ltd. (H Shares) | 174,253 | 253,067 | |
TOTAL CHINA | 774,329 | ||
| Denmark - 0.2% | |||
| DSV A/S | 1,700 | 230,147 | |
| Finland - 1.1% | |||
| Elisa Corp. (A Shares) | 25,757 | 1,244,973 | |
| Neste OYJ | 7,306 | 320,142 | |
TOTAL FINLAND | 1,565,115 | ||
| France - 4.4% | |||
| Capgemini SA | 8,583 | 1,406,675 | |
| Edenred SA | 20,520 | 1,053,691 | |
| LVMH Moet Hennessy Louis Vuitton SE | 2,494 | 1,573,701 | |
| Sanofi SA | 14,133 | 1,216,256 | |
| Teleperformance | 1,180 | 316,372 | |
| VINCI SA | 5,828 | 536,392 | |
TOTAL FRANCE | 6,103,087 | ||
| Germany - 1.2% | |||
| Deutsche Telekom AG | 34,465 | 650,544 | |
| Rheinmetall AG | 2,245 | 364,963 | |
| Siemens AG | 5,600 | 611,571 | |
TOTAL GERMANY | 1,627,078 | ||
| Hong Kong - 0.5% | |||
| AIA Group Ltd. | 102,168 | 773,902 | |
| India - 1.1% | |||
| HDFC Bank Ltd. sponsored ADR | 5,539 | 345,135 | |
| Redington (India) Ltd. | 113,772 | 187,879 | |
| Reliance Industries Ltd. | 32,110 | 988,979 | |
TOTAL INDIA | 1,521,993 | ||
| Indonesia - 0.4% | |||
| PT Bank Central Asia Tbk | 906,148 | 511,242 | |
| Ireland - 3.1% | |||
| Accenture PLC Class A | 6,587 | 1,870,049 | |
| Johnson Controls International PLC | 8,942 | 517,205 | |
| Linde PLC | 6,439 | 1,914,637 | |
TOTAL IRELAND | 4,301,891 | ||
| Japan - 5.2% | |||
| Capcom Co. Ltd. | 10,216 | 284,780 | |
| Daiichikosho Co. Ltd. | 22,442 | 644,456 | |
| FUJIFILM Holdings Corp. | 5,938 | 272,311 | |
| Fujitsu Ltd. | 2,624 | 301,914 | |
| Hitachi Ltd. | 12,848 | 584,098 | |
| Hoya Corp. | 16,014 | 1,494,295 | |
| Inaba Denki Sangyo Co. Ltd. | 32,906 | 614,768 | |
| Minebea Mitsumi, Inc. | 29,066 | 430,825 | |
| Renesas Electronics Corp. (a) | 43,482 | 363,760 | |
| Roland Corp. | 10,889 | 309,765 | |
| Shin-Etsu Chemical Co. Ltd. | 2,009 | 208,795 | |
| Sony Group Corp. | 16,062 | 1,083,136 | |
| Toyota Motor Corp. | 47,823 | 663,526 | |
TOTAL JAPAN | 7,256,429 | ||
| Kenya - 0.5% | |||
| Safaricom Ltd. | 3,669,546 | 759,008 | |
| Korea (South) - 1.3% | |||
| Samsung Electronics Co. Ltd. | 43,394 | 1,805,904 | |
| Luxembourg - 0.4% | |||
| B&M European Value Retail SA | 144,440 | 534,367 | |
| Netherlands - 1.4% | |||
| Airbus Group NV | 6,173 | 667,942 | |
| NXP Semiconductors NV | 9,085 | 1,327,137 | |
TOTAL NETHERLANDS | 1,995,079 | ||
| New Zealand - 0.3% | |||
| Auckland International Airport Ltd. (a) | 84,946 | 380,285 | |
| Spain - 1.2% | |||
| Aena SME SA (a)(b) | 2,985 | 350,832 | |
| Amadeus IT Holding SA Class A (a) | 24,502 | 1,277,909 | |
TOTAL SPAIN | 1,628,741 | ||
| Sweden - 0.4% | |||
| EQT AB | 3,600 | 70,949 | |
| HEXPOL AB (B Shares) | 44,826 | 442,527 | |
TOTAL SWEDEN | 513,476 | ||
| Switzerland - 3.5% | |||
| Chubb Ltd. | 3,599 | 773,389 | |
| Nestle SA (Reg. S) | 11,525 | 1,254,598 | |
| Roche Holding AG (participation certificate) | 6,944 | 2,304,007 | |
| Sika AG | 2,566 | 578,571 | |
TOTAL SWITZERLAND | 4,910,565 | ||
| Taiwan - 1.7% | |||
| MediaTek, Inc. | 28,796 | 526,745 | |
| Taiwan Semiconductor Manufacturing Co. Ltd. | 149,722 | 1,798,231 | |
TOTAL TAIWAN | 2,324,976 | ||
| United Kingdom - 6.0% | |||
| Anglo American PLC (United Kingdom) | 19,200 | 575,121 | |
| AstraZeneca PLC sponsored ADR | 22,986 | 1,351,807 | |
| BAE Systems PLC | 93,678 | 876,224 | |
| Bunzl PLC | 11,900 | 387,709 | |
| Compass Group PLC | 37,351 | 786,680 | |
| Diageo PLC | 22,057 | 907,701 | |
| JD Sports Fashion PLC | 252,197 | 281,816 | |
| Reckitt Benckiser Group PLC | 12,291 | 815,680 | |
| RELX PLC (London Stock Exchange) | 30,705 | 824,751 | |
| RS GROUP PLC | 30,705 | 337,512 | |
| Starling Bank Ltd. Series D (a)(c)(d) | 62,800 | 203,094 | |
| Unilever PLC | 14,541 | 660,952 | |
| WH Smith PLC (a) | 23,517 | 317,429 | |
TOTAL UNITED KINGDOM | 8,326,476 | ||
| United States of America - 55.6% | |||
| AbbVie, Inc. | 10,675 | 1,562,820 | |
| Activision Blizzard, Inc. | 6,595 | 480,116 | |
| Albertsons Companies, Inc. | 10,539 | 216,155 | |
| Ameren Corp. | 10,129 | 825,716 | |
| American Tower Corp. | 3,323 | 688,492 | |
| Amgen, Inc. | 7,723 | 2,087,913 | |
| Apple, Inc. | 45,172 | 6,926,666 | |
| AT&T, Inc. | 19,383 | 353,352 | |
| Ball Corp. | 6,100 | 301,279 | |
| Bank of America Corp. | 61,932 | 2,232,029 | |
| BJ's Wholesale Club Holdings, Inc. (a) | 14,328 | 1,108,987 | |
| BlackRock, Inc. Class A | 1,251 | 808,033 | |
| Bristol-Myers Squibb Co. | 29,606 | 2,293,577 | |
| Capital One Financial Corp. | 14,488 | 1,536,018 | |
| Cisco Systems, Inc. | 25,211 | 1,145,336 | |
| Comcast Corp. Class A | 29,855 | 947,598 | |
| Costco Wholesale Corp. | 1,882 | 943,823 | |
| Crane Holdings Co. | 3,993 | 400,658 | |
| Crown Holdings, Inc. | 9,400 | 644,746 | |
| Danaher Corp. | 8,304 | 2,089,868 | |
| Dollar Tree, Inc. (a) | 4,772 | 756,362 | |
| Dominion Energy, Inc. | 10,101 | 706,767 | |
| Eli Lilly & Co. | 6,834 | 2,474,523 | |
| Exxon Mobil Corp. | 23,121 | 2,562,038 | |
| Freeport-McMoRan, Inc. | 22,172 | 702,631 | |
| General Electric Co. | 12,456 | 969,201 | |
| H&R Block, Inc. | 13,397 | 551,287 | |
| Hartford Financial Services Group, Inc. | 7,121 | 515,632 | |
| Hess Corp. | 10,406 | 1,468,078 | |
| JPMorgan Chase & Co. | 16,957 | 2,134,547 | |
| KBR, Inc. | 10,123 | 503,822 | |
| Keurig Dr. Pepper, Inc. | 21,739 | 844,343 | |
| Lamar Advertising Co. Class A | 11,463 | 1,057,232 | |
| Lowe's Companies, Inc. | 2,481 | 483,671 | |
| M&T Bank Corp. | 6,978 | 1,174,886 | |
| McDonald's Corp. | 3,989 | 1,087,641 | |
| Merck & Co., Inc. | 9,220 | 933,064 | |
| Microsoft Corp. | 21,766 | 5,052,542 | |
| Mondelez International, Inc. | 15,146 | 931,176 | |
| MSCI, Inc. | 927 | 434,633 | |
| NextEra Energy, Inc. | 14,681 | 1,137,778 | |
| Northrop Grumman Corp. | 1,700 | 933,317 | |
| PG&E Corp. (a) | 17,858 | 266,620 | |
| Philip Morris International, Inc. | 5,032 | 462,189 | |
| Phillips 66 Co. | 10,570 | 1,102,345 | |
| PNC Financial Services Group, Inc. | 7,752 | 1,254,506 | |
| Procter & Gamble Co. | 10,649 | 1,434,101 | |
| T-Mobile U.S., Inc. (a) | 12,560 | 1,903,594 | |
| Target Corp. | 7,692 | 1,263,411 | |
| The Coca-Cola Co. | 28,154 | 1,685,017 | |
| The Travelers Companies, Inc. | 7,185 | 1,325,345 | |
| TJX Companies, Inc. | 14,635 | 1,055,184 | |
| United Parcel Service, Inc. Class B | 5,322 | 892,872 | |
| UnitedHealth Group, Inc. | 5,021 | 2,787,408 | |
| Valero Energy Corp. | 8,064 | 1,012,435 | |
| Verizon Communications, Inc. | 26,895 | 1,005,066 | |
| Vistra Corp. | 31,350 | 720,110 | |
| Walmart, Inc. | 12,172 | 1,732,441 | |
| Watsco, Inc. | 387 | 104,862 | |
| WEC Energy Group, Inc. | 5,050 | 461,217 | |
| Wells Fargo & Co. | 43,240 | 1,988,608 | |
TOTAL UNITED STATES OF AMERICA | 77,465,684 | ||
| TOTAL COMMON STOCKS (Cost $120,784,348) | 135,438,353 | ||
| Money Market Funds - 3.0% | |||
| Shares | Value ($) | ||
Fidelity Cash Central Fund 3.10% (e) (Cost $4,132,184) | 4,131,357 | 4,132,184 | |
| TOTAL INVESTMENT IN SECURITIES - 100.2% (Cost $124,916,532) | 139,570,537 |
NET OTHER ASSETS (LIABILITIES) - (0.2)% | (215,505) |
| NET ASSETS - 100.0% | 139,355,032 |
| (a) | Non-income producing |
| (b) | Security exempt from registration under Rule 144A of the Securities Act of 1933. These securities may be resold in transactions exempt from registration, normally to qualified institutional buyers. At the end of the period, the value of these securities amounted to $350,832 or 0.3% of net assets. |
| (c) | Restricted securities (including private placements) - Investment in securities not registered under the Securities Act of 1933 (excluding 144A issues). At the end of the period, the value of restricted securities (excluding 144A issues) amounted to $203,094 or 0.1% of net assets. |
| (d) | Level 3 security |
| (e) | Affiliated fund that is generally available only to investment companies and other accounts managed by Fidelity Investments. The rate quoted is the annualized seven-day yield of the fund at period end. A complete unaudited listing of the fund's holdings as of its most recent quarter end is available upon request. In addition, each Fidelity Central Fund's financial statements, which are not covered by the Fund's Report of Independent Registered Public Accounting Firm, are available on the SEC's website or upon request. |
| Additional information on each restricted holding is as follows: | ||
| Security | Acquisition Date | Acquisition Cost ($) |
| Starling Bank Ltd. Series D | 6/18/21 - 4/05/22 | 130,682 |
| Affiliate | Value, beginning of period ($) | Purchases ($) | Sales Proceeds ($) | Dividend Income ($) | Realized Gain (loss) ($) | Change in Unrealized appreciation (depreciation) ($) | Value, end of period ($) | % ownership, end of period |
| Fidelity Cash Central Fund 3.10% | 3,966,178 | 131,681,053 | 131,515,047 | 89,176 | 4 | (4) | 4,132,184 | 0.0% |
| Fidelity Securities Lending Cash Central Fund 3.10% | 659,698 | 7,403,550 | 8,063,248 | 4,960 | - | - | - | 0.0% |
| Total | 4,625,876 | 139,084,603 | 139,578,295 | 94,136 | 4 | (4) | 4,132,184 | |
| Valuation Inputs at Reporting Date: | ||||
| Description | Total ($) | Level 1 ($) | Level 2 ($) | Level 3 ($) |
Investments in Securities: | ||||
| Equities: | ||||
Communication Services | 9,715,273 | 9,064,729 | 650,544 | - |
Consumer Discretionary | 10,747,976 | 6,640,933 | 4,107,043 | - |
Consumer Staples | 14,918,557 | 11,279,626 | 3,638,931 | - |
Energy | 10,374,234 | 10,374,234 | - | - |
Financials | 16,512,944 | 15,104,952 | 1,204,898 | 203,094 |
Health Care | 20,854,315 | 17,334,052 | 3,520,263 | - |
Industrials | 12,099,827 | 8,065,419 | 4,034,408 | - |
Information Technology | 27,519,956 | 22,371,467 | 5,148,489 | - |
Materials | 5,691,833 | 4,329,346 | 1,362,487 | - |
Real Estate | 1,745,724 | 1,745,724 | - | - |
Utilities | 5,257,714 | 5,257,714 | - | - |
| Money Market Funds | 4,132,184 | 4,132,184 | - | - |
| Total Investments in Securities: | 139,570,537 | 115,700,380 | 23,667,063 | 203,094 |
| Statement of Assets and Liabilities | ||||
| October 31, 2022 | ||||
| Assets | ||||
| Investment in securities, at value - See accompanying schedule: | ||||
Unaffiliated issuers (cost $120,784,348) | $135,438,353 | |||
Fidelity Central Funds (cost $4,132,184) | 4,132,184 | |||
| Total Investment in Securities (cost $124,916,532) | $ | 139,570,537 | ||
| Cash | 1,565 | |||
| Foreign currency held at value (cost $7,381) | 8,961 | |||
| Receivable for fund shares sold | 30,849 | |||
| Dividends receivable | 295,919 | |||
| Reclaims receivable | 105,157 | |||
| Distributions receivable from Fidelity Central Funds | 10,377 | |||
| Prepaid expenses | 321 | |||
| Other receivables | 100 | |||
Total assets | 140,023,786 | |||
| Liabilities | ||||
| Payable for fund shares redeemed | $477,708 | |||
| Accrued management fee | 77,126 | |||
| Other affiliated payables | 29,320 | |||
| Audit fee payable | 45,058 | |||
| Other payables and accrued expenses | 39,542 | |||
| Total Liabilities | 668,754 | |||
| Net Assets | $ | 139,355,032 | ||
| Net Assets consist of: | ||||
| Paid in capital | $ | 134,769,503 | ||
| Total accumulated earnings (loss) | 4,585,529 | |||
| Net Assets | $ | 139,355,032 | ||
Net Asset Value , offering price and redemption price per share ($139,355,032 ÷ 8,944,281 shares) | $ | 15.58 | ||
| Statement of Operations | ||||
Year ended October 31, 2022 | ||||
| Investment Income | ||||
| Dividends | $ | 3,853,953 | ||
| Income from Fidelity Central Funds (including $4,960 from security lending) | 94,136 | |||
| Income before foreign taxes withheld | 3,948,089 | |||
| Less foreign taxes withheld | (222,568) | |||
| Total Income | 3,725,521 | |||
| Expenses | ||||
| Management fee | $ | 1,145,940 | ||
| Transfer agent fees | 289,422 | |||
| Accounting fees | 86,317 | |||
| Custodian fees and expenses | 22,831 | |||
| Independent trustees' fees and expenses | 551 | |||
| Registration fees | 50,434 | |||
| Audit | 64,444 | |||
| Legal | 3,195 | |||
| Interest | 411 | |||
| Miscellaneous | 731 | |||
| Total expenses before reductions | 1,664,276 | |||
| Expense reductions | (5,196) | |||
| Total expenses after reductions | 1,659,080 | |||
| Net Investment income (loss) | 2,066,441 | |||
| Realized and Unrealized Gain (Loss) | ||||
| Net realized gain (loss) on: | ||||
| Investment Securities: | ||||
| Unaffiliated issuers(net of foreign taxes of $71,566) | (10,134,353) | |||
| Fidelity Central Funds | 4 | |||
| Foreign currency transactions | (33,665) | |||
| Total net realized gain (loss) | (10,168,014) | |||
| Change in net unrealized appreciation (depreciation) on: | ||||
| Investment Securities: | ||||
| Unaffiliated issuers (net of decrease in deferred foreign taxes of $67,845) | (14,266,623) | |||
| Fidelity Central Funds | (4) | |||
| Assets and liabilities in foreign currencies | (14,130) | |||
| Total change in net unrealized appreciation (depreciation) | (14,280,757) | |||
| Net gain (loss) | (24,448,771) | |||
| Net increase (decrease) in net assets resulting from operations | $ | (22,382,330) | ||
| Statement of Changes in Net Assets | ||||
Year ended October 31, 2022 | Year ended October 31, 2021 | |||
| Increase (Decrease) in Net Assets | ||||
| Operations | ||||
| Net investment income (loss) | $ | 2,066,441 | $ | 710,148 |
| Net realized gain (loss) | (10,168,014) | 10,997,567 | ||
| Change in net unrealized appreciation (depreciation) | (14,280,757) | 11,786,658 | ||
| Net increase (decrease) in net assets resulting from operations | (22,382,330) | 23,494,373 | ||
| Distributions to shareholders | (11,336,009) | (2,418,051) | ||
| Share transactions | ||||
| Proceeds from sales of shares | 189,149,366 | 23,383,926 | ||
| Reinvestment of distributions | 10,521,484 | 2,268,914 | ||
| Cost of shares redeemed | (119,515,550) | (20,526,418) | ||
Net increase (decrease) in net assets resulting from share transactions | 80,155,300 | 5,126,422 | ||
| Total increase (decrease) in net assets | 46,436,961 | 26,202,744 | ||
| Net Assets | ||||
| Beginning of period | 92,918,071 | 66,715,327 | ||
| End of period | $ | 139,355,032 | $ | 92,918,071 |
| Other Information | ||||
| Shares | ||||
| Sold | 10,942,111 | 1,260,411 | ||
| Issued in reinvestment of distributions | 597,381 | 131,869 | ||
| Redeemed | (7,288,853) | (1,109,823) | ||
| Net increase (decrease) | 4,250,639 | 282,457 | ||
| Fidelity® Global Equity Income Fund |
| Years ended October 31, | 2022 | 2021 | 2020 | 2019 | 2018 | |||||
Selected Per-Share Data | ||||||||||
| Net asset value, beginning of period | $ | 19.80 | $ | 15.12 | $ | 14.64 | $ | 13.53 | $ | 14.21 |
| Income from Investment Operations | ||||||||||
Net investment income (loss) A,B | .20 | .15 | .16 | .23 | .25 | |||||
| Net realized and unrealized gain (loss) | (2.21) | 5.07 | .48 | 1.63 | (.50) | |||||
| Total from investment operations | (2.01) | 5.22 | .64 | 1.86 | (.25) | |||||
| Distributions from net investment income | (.17) | (.16) | (.15) | (.24) | (.25) | |||||
| Distributions from net realized gain | (2.04) | (.38) | (.01) | (.51) | (.18) | |||||
| Total distributions | (2.21) | (.54) | (.16) | (.75) | (.43) | |||||
Redemption fees added to paid in capital A | - | - | - | - | - C | |||||
| Net asset value, end of period | $ | 15.58 | $ | 19.80 | $ | 15.12 | $ | 14.64 | $ | 13.53 |
Total Return D | (11.45)% | 35.09% | 4.44% | 14.60% | (1.88)% | |||||
Ratios to Average Net Assets B,E,F | ||||||||||
| Expenses before reductions | .98% | 1.02% | 1.09% | 1.09% | 1.06% | |||||
| Expenses net of fee waivers, if any | .98% | 1.02% | 1.09% | 1.09% | 1.06% | |||||
| Expenses net of all reductions | .98% | 1.02% | 1.09% | 1.08% | 1.05% | |||||
| Net investment income (loss) | 1.22% | .84% | 1.08% | 1.72% | 1.75% | |||||
| Supplemental Data | ||||||||||
| Net assets, end of period (000 omitted) | $ | 139,355 | $ | 92,918 | $ | 66,715 | $ | 67,764 | $ | 68,532 |
Portfolio turnover rate G | 61% | 43% | 48% | 20% H | 34% |
| Fidelity Central Fund | Investment Manager | Investment Objective | Investment Practices | Expense Ratio A |
| Fidelity Money Market Central Funds | Fidelity Management & Research Company LLC (FMR) | Each fund seeks to obtain a high level of current income consistent with the preservation of capital and liquidity. | Short-term Investments | Less than .005% |
| Gross unrealized appreciation | $ 26,933,942 |
| Gross unrealized depreciation | (12,926,712) |
| Net unrealized appreciation (depreciation) | $14,007,230 |
| Tax Cost | $125,563,307 |
| Undistributed ordinary income | $193,578 |
| Capital loss carryforward | $(9,572,799) |
| Net unrealized appreciation (depreciation) on securities and other investments | $13,996,527 |
| Short-term | $(9,095,365) |
| Long-term | (477,434) |
| Total capital loss carryforward | $(9,572,799) |
| October 31, 2022 | October 31, 2021 | |
| Ordinary Income | $1,785,513 | $742,673 |
| Long-term Capital Gains | 9,550,496 | 1,675,378 |
| Total | $11,336,009 | $2,418,051 |
| Purchases ($) | Sales ($) | |
| Fidelity Global Equity Income Fund | 167,307,643 | 96,322,143 |
| % of Average Net Assets | |
| Fidelity Global Equity Income Fund | .05 |
| Amount | |
| Fidelity Global Equity Income Fund | $863 |
| Purchases ($) | Sales ($) | Realized Gain (Loss) ($) | |
| Fidelity Global Equity Income Fund | 7,224,419 | 2,216,771 | (88,037) |
| Amount | |
| Fidelity Global Equity Income Fund | $285 |
| Total Security Lending Fees Paid to NFS | Security Lending Income From Securities Loaned to NFS | Value of Securities Loaned to NFS at Period End | |
| Fidelity Global Equity Income Fund | $522 | $- | $- |
| Average Loan Balance | Weighted Average Interest Rate | Interest Expense | |
| Fidelity Global Equity Income Fund | $ 25,517,000 | .58% | $411 |
| The Example is based on an investment of $1,000 invested at the beginning of the period and held for the entire period (May 1, 2022 to October 31, 2022). |
Annualized Expense Ratio- A | Beginning Account Value May 1, 2022 | Ending Account Value October 31, 2022 | Expenses Paid During Period- C May 1, 2022 to October 31, 2022 | |||||||
| Fidelity® Global Equity Income Fund | .96% | |||||||||
| Actual | $ 1,000 | $ 931.80 | $ 4.67 | |||||||
Hypothetical- B | $ 1,000 | $ 1,020.37 | $ 4.89 | |||||||
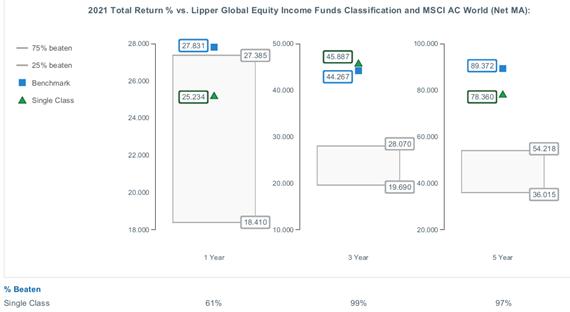
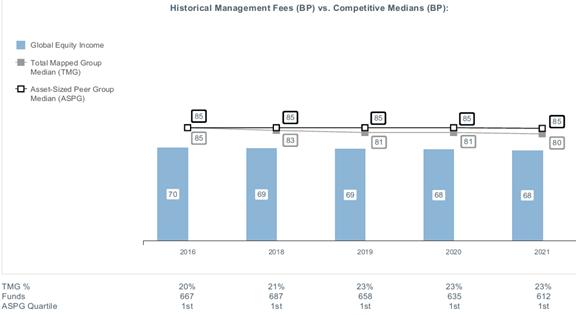
|


Contents
Board Approval of Investment Advisory Contracts and Management Fees |
| Average Annual Total Returns | |||
Periods ended October 31, 2022 | Past 1 year | Life of Fund A |
| Fidelity® SAI International SMA Completion Fund | -34.09% | 0.87% |
| $10,000 Over Life of Fund |
Let's say hypothetically that $10,000 was invested in Fidelity® SAI International SMA Completion Fund, on April 11, 2019, when the fund started. The chart shows how the value of your investment would have changed, and also shows how the MSCI EAFE Index performed over the same period. |
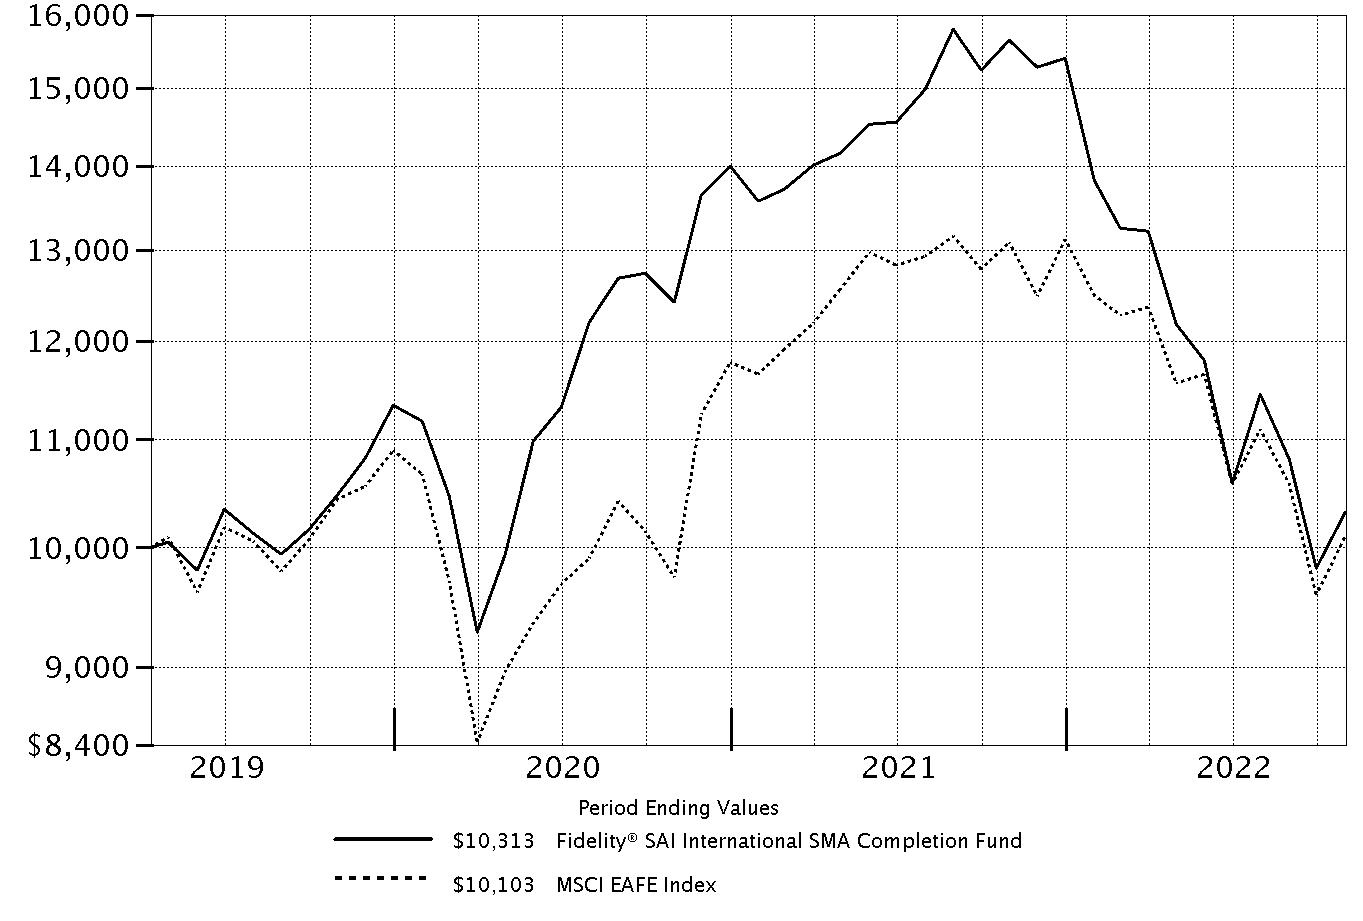 |
Top Holdings (% of Fund's net assets) | ||
| Hannover Reuck SE (Germany, Insurance) | 5.2 | |
| Keyence Corp. (Japan, Electronic Equipment & Components) | 5.2 | |
| Itochu Corp. (Japan, Trading Companies & Distributors) | 4.4 | |
| Teleperformance (France, Professional Services) | 4.3 | |
| Minebea Mitsumi, Inc. (Japan, Machinery) | 4.2 | |
| Reliance Industries Ltd. (India, Oil, Gas & Consumable Fuels) | 4.0 | |
| Tourmaline Oil Corp. (Canada, Oil, Gas & Consumable Fuels) | 3.8 | |
| Samsung Electronics Co. Ltd. (Korea (South), Technology Hardware, Storage & Peripherals) | 3.6 | |
| Constellation Software, Inc. (Canada, Software) | 3.5 | |
| Indutrade AB (Sweden, Machinery) | 3.2 | |
| 41.4 | ||
| Market Sectors (% of Fund's net assets) | ||
| Industrials | 23.8 | |
| Financials | 21.4 | |
| Information Technology | 17.8 | |
| Energy | 9.3 | |
| Consumer Discretionary | 8.1 | |
| Communication Services | 4.7 | |
| Materials | 3.8 | |
| Health Care | 3.2 | |
| Consumer Staples | 0.9 | |
Asset Allocation (% of Fund's net assets) |
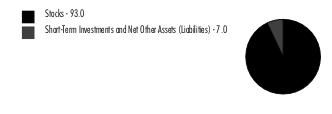 |
Foreign investments - 93% |
Geographic Diversification (% of Fund's net assets) |
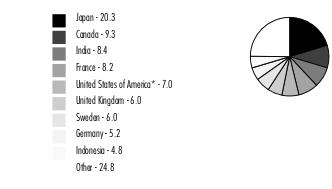 |
* Includes Short-Term investments and Net Other Assets (Liabilities). Percentages are based on country or territory of incorporation and are adjusted for the effect of futures contracts, if applicable. |
| Common Stocks - 93.0% | |||
| Shares | Value ($) | ||
| Australia - 2.3% | |||
| Aristocrat Leisure Ltd. | 431,781 | 10,238,316 | |
| Canada - 9.3% | |||
| Alimentation Couche-Tard, Inc. Class A (multi-vtg.) | 37,500 | 1,679,084 | |
| Constellation Software, Inc. | 10,652 | 15,402,260 | |
| First Quantum Minerals Ltd. | 381,868 | 6,735,632 | |
| Tourmaline Oil Corp. | 297,751 | 16,776,428 | |
TOTAL CANADA | 40,593,404 | ||
| Cayman Islands - 2.5% | |||
| Anta Sports Products Ltd. | 556,949 | 4,895,694 | |
| Li Ning Co. Ltd. | 1,188,581 | 6,147,585 | |
TOTAL CAYMAN ISLANDS | 11,043,279 | ||
| China - 0.5% | |||
| Kweichow Moutai Co. Ltd. (A Shares) | 11,000 | 2,023,960 | |
| France - 8.2% | |||
| Capgemini SA | 50,808 | 8,326,966 | |
| Sartorius Stedim Biotech | 27,701 | 8,793,015 | |
| Teleperformance | 70,558 | 18,917,462 | |
TOTAL FRANCE | 36,037,443 | ||
| Germany - 5.2% | |||
| Hannover Reuck SE | 141,052 | 22,972,236 | |
| India - 8.4% | |||
| Axis Bank Ltd. | 509,700 | 5,578,500 | |
| Housing Development Finance Corp. Ltd. | 363,629 | 10,849,129 | |
| Kotak Mahindra Bank Ltd. | 117,300 | 2,695,080 | |
| Reliance Industries Ltd. | 574,005 | 17,679,188 | |
TOTAL INDIA | 36,801,897 | ||
| Indonesia - 4.8% | |||
| PT Bank Central Asia Tbk | 21,239,433 | 11,983,139 | |
| PT Bank Rakyat Indonesia (Persero) Tbk | 30,642,861 | 9,135,394 | |
TOTAL INDONESIA | 21,118,533 | ||
| Ireland - 1.9% | |||
| Kingspan Group PLC (Ireland) | 163,195 | 8,241,278 | |
| Italy - 1.8% | |||
| FinecoBank SpA | 566,176 | 7,631,900 | |
| Japan - 20.3% | |||
| Itochu Corp. | 750,737 | 19,432,978 | |
| Keyence Corp. | 59,794 | 22,647,689 | |
| Minebea Mitsumi, Inc. | 1,245,096 | 18,455,171 | |
| Misumi Group, Inc. | 199,574 | 4,268,101 | |
| Nomura Research Institute Ltd. | 102,700 | 2,282,683 | |
| Recruit Holdings Co. Ltd. | 269,478 | 8,292,153 | |
| TIS, Inc. | 505,191 | 13,640,955 | |
TOTAL JAPAN | 89,019,730 | ||
| Korea (South) - 3.6% | |||
| Samsung Electronics Co. Ltd. | 373,850 | 15,558,312 | |
| Luxembourg - 3.5% | |||
| B&M European Value Retail SA | 2,750,021 | 10,173,914 | |
| Eurofins Scientific SA | 82,276 | 5,267,214 | |
TOTAL LUXEMBOURG | 15,441,128 | ||
| Netherlands - 2.9% | |||
| IMCD NV | 98,810 | 12,821,311 | |
| Spain - 3.6% | |||
| CaixaBank SA | 1,521,700 | 5,046,026 | |
| Cellnex Telecom SA (a) | 333,193 | 10,905,494 | |
TOTAL SPAIN | 15,951,520 | ||
| Sweden - 6.0% | |||
| Indutrade AB | 800,413 | 14,016,579 | |
| Investor AB (B Shares) | 626,908 | 10,240,656 | |
| Nordnet AB | 164,268 | 2,038,249 | |
TOTAL SWEDEN | 26,295,484 | ||
| Switzerland - 2.2% | |||
| Sika AG | 42,865 | 9,665,021 | |
| United Kingdom - 6.0% | |||
| Beazley PLC | 426,100 | 3,051,628 | |
| Bridgepoint Group Holdings Ltd. (a) | 1,086,642 | 2,483,599 | |
| Harbour Energy PLC | 1,497,362 | 6,489,203 | |
| JD Sports Fashion PLC | 3,938,303 | 4,400,825 | |
| S4 Capital PLC (b) | 4,933,577 | 9,940,800 | |
TOTAL UNITED KINGDOM | 26,366,055 | ||
| TOTAL COMMON STOCKS (Cost $467,733,150) | 407,820,807 | ||
| Money Market Funds - 9.9% | |||
| Shares | Value ($) | ||
Fidelity Cash Central Fund 3.10% (c) (Cost $43,600,978) | 43,592,260 | 43,600,978 | |
| TOTAL INVESTMENT IN SECURITIES - 102.9% (Cost $511,334,128) | 451,421,785 |
NET OTHER ASSETS (LIABILITIES) - (2.9)% | (12,714,743) |
| NET ASSETS - 100.0% | 438,707,042 |
| (a) | Security exempt from registration under Rule 144A of the Securities Act of 1933. These securities may be resold in transactions exempt from registration, normally to qualified institutional buyers. At the end of the period, the value of these securities amounted to $13,389,093 or 3.1% of net assets. |
| (b) | Non-income producing |
| (c) | Affiliated fund that is generally available only to investment companies and other accounts managed by Fidelity Investments. The rate quoted is the annualized seven-day yield of the fund at period end. A complete unaudited listing of the fund's holdings as of its most recent quarter end is available upon request. In addition, each Fidelity Central Fund's financial statements, which are not covered by the Fund's Report of Independent Registered Public Accounting Firm, are available on the SEC's website or upon request. |
| Affiliate | Value, beginning of period ($) | Purchases ($) | Sales Proceeds ($) | Dividend Income ($) | Realized Gain (loss) ($) | Change in Unrealized appreciation (depreciation) ($) | Value, end of period ($) | % ownership, end of period |
| Fidelity Cash Central Fund 3.10% | 27,138,764 | 196,795,945 | 180,333,731 | 371,463 | - | - | 43,600,978 | 0.1% |
| Total | 27,138,764 | 196,795,945 | 180,333,731 | 371,463 | - | - | 43,600,978 | |
| Valuation Inputs at Reporting Date: | ||||
| Description | Total ($) | Level 1 ($) | Level 2 ($) | Level 3 ($) |
Investments in Securities: | ||||
| Equities: | ||||
Communication Services | 20,846,294 | 9,940,800 | 10,905,494 | - |
Consumer Discretionary | 35,856,334 | 35,856,334 | - | - |
Consumer Staples | 3,703,044 | 3,703,044 | - | - |
Energy | 40,944,819 | 40,944,819 | - | - |
Financials | 93,705,536 | 88,659,510 | 5,046,026 | - |
Health Care | 14,060,229 | 14,060,229 | - | - |
Industrials | 104,445,033 | 96,152,880 | 8,292,153 | - |
Information Technology | 77,858,865 | 69,531,899 | 8,326,966 | - |
Materials | 16,400,653 | 6,735,632 | 9,665,021 | - |
| Money Market Funds | 43,600,978 | 43,600,978 | - | - |
| Total Investments in Securities: | 451,421,785 | 409,186,125 | 42,235,660 | - |
| Statement of Assets and Liabilities | ||||
| October 31, 2022 | ||||
| Assets | ||||
| Investment in securities, at value - See accompanying schedule: | ||||
Unaffiliated issuers (cost $467,733,150) | $407,820,807 | |||
Fidelity Central Funds (cost $43,600,978) | 43,600,978 | |||
| Total Investment in Securities (cost $511,334,128) | $ | 451,421,785 | ||
| Foreign currency held at value (cost $449) | 444 | |||
| Receivable for investments sold | 13,930,523 | |||
| Receivable for fund shares sold | 1,311,918 | |||
| Dividends receivable | 702,394 | |||
| Reclaims receivable | 576,557 | |||
| Distributions receivable from Fidelity Central Funds | 127,331 | |||
Total assets | 468,070,952 | |||
| Liabilities | ||||
| Payable for investments purchased | $26,635,561 | |||
| Payable for fund shares redeemed | 2,532,062 | |||
| Other payables and accrued expenses | 196,287 | |||
| Total Liabilities | 29,363,910 | |||
| Net Assets | $ | 438,707,042 | ||
| Net Assets consist of: | ||||
| Paid in capital | $ | 537,296,896 | ||
| Total accumulated earnings (loss) | (98,589,854) | |||
| Net Assets | $ | 438,707,042 | ||
Net Asset Value , offering price and redemption price per share ($438,707,042 ÷ 45,669,408 shares) | $ | 9.61 | ||
| Statement of Operations | ||||
Year ended October 31, 2022 | ||||
| Investment Income | ||||
| Dividends | $ | 8,537,101 | ||
| Income from Fidelity Central Funds | 371,463 | |||
| Income before foreign taxes withheld | 8,908,564 | |||
| Less foreign taxes withheld | (1,081,248) | |||
| Total Income | 7,827,316 | |||
| Expenses | ||||
| Independent trustees' fees and expenses | 1,727 | |||
| Total expenses before reductions | 1,727 | |||
| Expense reductions | (1) | |||
| Total expenses after reductions | 1,726 | |||
| Net Investment income (loss) | 7,825,590 | |||
| Realized and Unrealized Gain (Loss) | ||||
| Net realized gain (loss) on: | ||||
| Investment Securities: | ||||
| Unaffiliated issuers(net of foreign taxes of $147,878) | (43,307,465) | |||
| Foreign currency transactions | (109,635) | |||
| Futures contracts | 207,889 | |||
| Total net realized gain (loss) | (43,209,211) | |||
| Change in net unrealized appreciation (depreciation) on: | ||||
| Investment Securities: | ||||
| Unaffiliated issuers (net of decrease in deferred foreign taxes of $506,538) | (177,039,065) | |||
| Assets and liabilities in foreign currencies | (95,825) | |||
| Futures contracts | 168,516 | |||
| Total change in net unrealized appreciation (depreciation) | (176,966,374) | |||
| Net gain (loss) | (220,175,585) | |||
| Net increase (decrease) in net assets resulting from operations | $ | (212,349,995) | ||
| Statement of Changes in Net Assets | ||||
Year ended October 31, 2022 | Year ended October 31, 2021 | |||
| Increase (Decrease) in Net Assets | ||||
| Operations | ||||
| Net investment income (loss) | $ | 7,825,590 | $ | 5,894,966 |
| Net realized gain (loss) | (43,209,211) | 31,448,140 | ||
| Change in net unrealized appreciation (depreciation) | (176,966,374) | 58,954,071 | ||
| Net increase (decrease) in net assets resulting from operations | (212,349,995) | 96,297,177 | ||
| Distributions to shareholders | (34,086,499) | (3,364,042) | ||
| Share transactions | ||||
| Proceeds from sales of shares | 318,466,891 | 227,915,926 | ||
| Reinvestment of distributions | 10,192,289 | 919,885 | ||
| Cost of shares redeemed | (227,226,081) | (56,420,352) | ||
Net increase (decrease) in net assets resulting from share transactions | 101,433,099 | 172,415,459 | ||
| Total increase (decrease) in net assets | (145,003,395) | 265,348,594 | ||
| Net Assets | ||||
| Beginning of period | 583,710,437 | 318,361,843 | ||
| End of period | $ | 438,707,042 | $ | 583,710,437 |
| Other Information | ||||
| Shares | ||||
| Sold | 28,001,783 | 15,944,652 | ||
| Issued in reinvestment of distributions | 704,861 | 68,140 | ||
| Redeemed | (20,788,845) | (3,970,533) | ||
| Net increase (decrease) | 7,917,799 | 12,042,259 | ||
| Fidelity® SAI International SMA Completion Fund |
| Years ended October 31, | 2022 | 2021 | 2020 | 2019 A | ||||
Selected Per-Share Data | ||||||||
| Net asset value, beginning of period | $ | 15.46 | $ | 12.38 | $ | 10.47 | $ | 10.00 |
| Income from Investment Operations | ||||||||
Net investment income (loss) B,C | .18 | .19 | .17 D | .08 | ||||
| Net realized and unrealized gain (loss) | (5.16) | 3.01 | 1.77 | .39 | ||||
| Total from investment operations | (4.98) | 3.20 | 1.94 | .47 | ||||
| Distributions from net investment income | (.16) | (.12) | (.03) | - | ||||
| Distributions from net realized gain | (.71) | - | - | - | ||||
| Total distributions | (.87) | (.12) | (.03) | - | ||||
| Net asset value, end of period | $ | 9.61 | $ | 15.46 | $ | 12.38 | $ | 10.47 |
Total Return E,F | (34.09)% | 26.03% | 18.57% | 4.70% | ||||
Ratios to Average Net Assets C,G,H | ||||||||
Expenses before reductions I | -% | -% | -% | -% J | ||||
Expenses net of fee waivers, if any I | -% | -% | -% | -% J | ||||
Expenses net of all reductions I | -% | -% | -% | -% J | ||||
| Net investment income (loss) | 1.56% | 1.30% | 1.45% D | 1.41% J | ||||
| Supplemental Data | ||||||||
| Net assets, end of period (000 omitted) | $ | 438,707 | $ | 583,710 | $ | 318,362 | $ | 46,836 |
Portfolio turnover rate K | 40% | 37% | 17% | 24% J |
| Fidelity Central Fund | Investment Manager | Investment Objective | Investment Practices | Expense Ratio A |
| Fidelity Money Market Central Funds | Fidelity Management & Research Company LLC (FMR) | Each fund seeks to obtain a high level of current income consistent with the preservation of capital and liquidity. | Short-term Investments | Less than .005% |
| Gross unrealized appreciation | $31,182,586 |
| Gross unrealized depreciation | (96,171,242) |
| Net unrealized appreciation (depreciation) | $(64,988,656) |
| Tax Cost | $516,410,441 |
| Undistributed ordinary income | $4,979,582 |
| Capital loss carryforward | $(38,272,092) |
| Net unrealized appreciation (depreciation) on securities and other investments | $(65,101,081) |
| October 31, 2022 | |
| Short-term | $(14,508,749) |
| Long-term | (23,763,343) |
| Total capital loss carryforward | $(38,272,092) |
| October 31, 2022 | October 31, 2021 | |
| Ordinary Income | $16,945,636 | $3,364,042 |
| Long-term Capital Gains | 17,140,863 | - |
| Total | $34,086,499 | $3,364,042 |
| Equity Risk | Equity risk relates to the fluctuations in the value of financial instruments as a result of changes in market prices (other than those arising from interest rate risk or foreign exchange risk), whether caused by factors specific to an individual investment, its issuer, or all factors affecting all instruments traded in a market or market segment. |
| Purchases ($) | Sales ($) | |
| Fidelity SAI International SMA Completion Fund | 265,985,791 | 192,640,734 |
| Purchases ($) | Sales ($) | Realized Gain (Loss) ($) | |
| Fidelity SAI International SMA Completion Fund | 7,357,108 | 528,908 | (77,185) |
| The Example is based on an investment of $1,000 invested at the beginning of the period and held for the entire period (May 1, 2022 to October 31, 2022). |
Annualized Expense Ratio- A | Beginning Account Value May 1, 2022 | Ending Account Value October 31, 2022 | Expenses Paid During Period- C May 1, 2022 to October 31, 2022 | |||||||
| Fidelity® SAI International SMA Completion Fund | -%- D | |||||||||
| Actual | $ 1,000 | $ 846.70 | $- E | |||||||
Hypothetical- B | $ 1,000 | $ 1,025.21 | $- E | |||||||
|


Contents
Board Approval of Investment Advisory Contracts and Management Fees |
| Average Annual Total Returns | |||
Periods ended October 31, 2022 | Past 1 year | Life of Fund A |
| Fidelity® Infrastructure Fund | -9.95% | 4.81% |
| $10,000 Over Life of Fund |
Let's say hypothetically that $10,000 was invested in Fidelity® Infrastructure Fund, on November 05, 2019, when the fund started. The chart shows how the value of your investment would have changed, and also shows how the MSCI All Country World Index (Net MA) performed over the same period. |
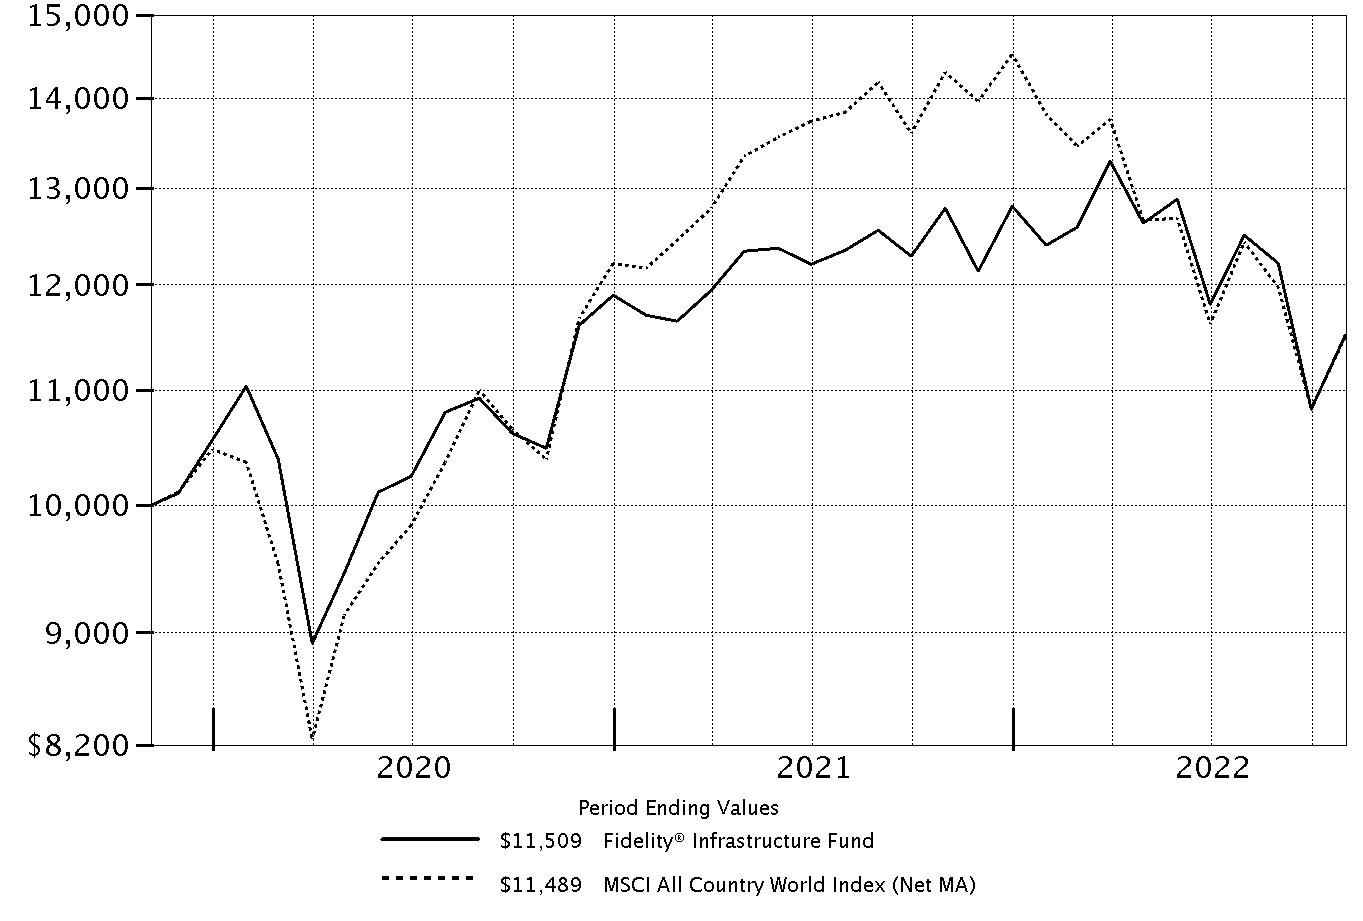 |
Top Holdings (% of Fund's net assets) | ||
| NextEra Energy, Inc. | 7.8 | |
| Cheniere Energy, Inc. | 6.0 | |
| Aena SME SA | 5.7 | |
| Waste Connections, Inc. (United States) | 4.2 | |
| Iberdrola SA | 4.1 | |
| Grupo Aeroportuario del Pacifico S.A.B. de CV sponsored ADR | 3.9 | |
| The Williams Companies, Inc. | 3.8 | |
| Cellnex Telecom SA | 3.7 | |
| Grupo Aeroportuario Norte S.A.B. de CV ADR | 3.5 | |
| Getlink SE | 3.2 | |
| 45.9 | ||
| Market Sectors (% of Fund's net assets) | ||
| Utilities | 34.7 | |
| Industrials | 31.9 | |
| Energy | 15.6 | |
| Real Estate | 8.9 | |
| Communication Services | 5.8 | |
Asset Allocation (% of Fund's net assets) |
 |
Foreign investments - 46.5% |
Geographic Diversification (% of Fund's net assets) |
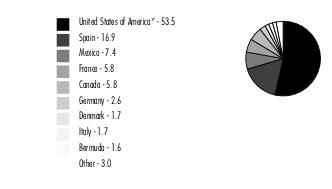 |
* Includes Short-Term investments and Net Other Assets (Liabilities). Percentages are based on country or territory of incorporation and are adjusted for the effect of futures contracts, if applicable. |
| Common Stocks - 96.9% | |||
| Shares | Value ($) | ||
| COMMUNICATION SERVICES - 5.8% | |||
| Diversified Telecommunication Services - 4.7% | |||
| Cellnex Telecom SA (a) | 42,188 | 1,380,824 | |
| Helios Towers PLC (b) | 269,576 | 387,983 | |
| 1,768,807 | |||
| Media - 1.1% | |||
| Charter Communications, Inc. Class A (b) | 1,087 | 399,603 | |
TOTAL COMMUNICATION SERVICES | 2,168,410 | ||
| ENERGY - 15.6% | |||
| Oil, Gas & Consumable Fuels - 15.6% | |||
| Cheniere Energy, Inc. | 12,672 | 2,235,468 | |
| DT Midstream, Inc. | 6,158 | 367,633 | |
| Enterprise Products Partners LP | 9,168 | 231,492 | |
| ONEOK, Inc. | 6,791 | 402,842 | |
| Targa Resources Corp. | 16,843 | 1,151,556 | |
| The Williams Companies, Inc. | 43,514 | 1,424,213 | |
| 5,813,204 | |||
| INDUSTRIALS - 31.9% | |||
| Commercial Services & Supplies - 10.3% | |||
| GFL Environmental, Inc. (c) | 22,533 | 608,166 | |
| Republic Services, Inc. | 9,055 | 1,200,874 | |
| Waste Connections, Inc. (United States) | 11,732 | 1,547,568 | |
| Waste Management, Inc. | 3,056 | 483,979 | |
| 3,840,587 | |||
| Construction & Engineering - 3.0% | |||
| Ferrovial SA | 29,277 | 714,934 | |
| VINCI SA | 4,636 | 426,684 | |
| 1,141,618 | |||
| Road & Rail - 0.8% | |||
| Union Pacific Corp. | 1,449 | 285,656 | |
| Transportation Infrastructure - 17.8% | |||
| Aena SME SA (a)(b) | 18,009 | 2,116,625 | |
| Flughafen Zuerich AG (b) | 3,640 | 564,893 | |
| Getlink SE | 76,078 | 1,205,201 | |
| Grupo Aeroportuario del Pacifico S.A.B. de CV sponsored ADR | 9,417 | 1,460,200 | |
| Grupo Aeroportuario Norte S.A.B. de CV ADR (c) | 20,658 | 1,317,361 | |
| 6,664,280 | |||
TOTAL INDUSTRIALS | 11,932,141 | ||
| REAL ESTATE - 8.9% | |||
| Equity Real Estate Investment Trusts (REITs) - 8.9% | |||
| American Tower Corp. | 3,510 | 727,237 | |
| Crown Castle International Corp. | 4,549 | 606,200 | |
| Digital Realty Trust, Inc. | 3,423 | 343,156 | |
| Equinix, Inc. | 1,002 | 567,573 | |
| Prologis (REIT), Inc. | 2,643 | 292,712 | |
| SBA Communications Corp. Class A | 2,179 | 588,112 | |
| Segro PLC | 11,444 | 103,023 | |
| Warehouses de Pauw | 3,272 | 84,008 | |
| 3,312,021 | |||
| UTILITIES - 34.7% | |||
| Electric Utilities - 20.7% | |||
| Constellation Energy Corp. | 9,870 | 933,110 | |
| Enel SpA | 143,799 | 642,400 | |
| Exelon Corp. | 28,162 | 1,086,772 | |
| Iberdrola SA | 149,504 | 1,520,348 | |
| NextEra Energy, Inc. | 37,486 | 2,905,163 | |
| ORSTED A/S (a) | 7,935 | 654,683 | |
| 7,742,476 | |||
| Independent Power and Renewable Electricity Producers - 9.3% | |||
| Brookfield Renewable Partners LP | 20,284 | 591,887 | |
| EDP Renovaveis SA | 26,623 | 560,670 | |
| NextEra Energy Partners LP | 10,137 | 750,848 | |
| RWE AG | 25,264 | 973,469 | |
| The AES Corp. | 23,444 | 613,295 | |
| 3,490,169 | |||
| Multi-Utilities - 4.7% | |||
| Engie SA | 37,442 | 486,498 | |
| Veolia Environnement SA | 3,300 | 73,643 | |
| WEC Energy Group, Inc. | 12,859 | 1,174,412 | |
| 1,734,553 | |||
TOTAL UTILITIES | 12,967,198 | ||
| TOTAL COMMON STOCKS (Cost $35,054,390) | 36,192,974 | ||
| Money Market Funds - 4.5% | |||
| Shares | Value ($) | ||
| Fidelity Cash Central Fund 3.10% (d) | 1,292,196 | 1,292,455 | |
| Fidelity Securities Lending Cash Central Fund 3.10% (d)(e) | 377,137 | 377,175 | |
| TOTAL MONEY MARKET FUNDS (Cost $1,669,630) | 1,669,630 | ||
| TOTAL INVESTMENT IN SECURITIES - 101.4% (Cost $36,724,020) | 37,862,604 |
NET OTHER ASSETS (LIABILITIES) - (1.4)% | (506,574) |
| NET ASSETS - 100.0% | 37,356,030 |
| (a) | Security exempt from registration under Rule 144A of the Securities Act of 1933. These securities may be resold in transactions exempt from registration, normally to qualified institutional buyers. At the end of the period, the value of these securities amounted to $4,152,132 or 11.1% of net assets. |
| (b) | Non-income producing |
| (c) | Security or a portion of the security is on loan at period end. |
| (d) | Affiliated fund that is generally available only to investment companies and other accounts managed by Fidelity Investments. The rate quoted is the annualized seven-day yield of the fund at period end. A complete unaudited listing of the fund's holdings as of its most recent quarter end is available upon request. In addition, each Fidelity Central Fund's financial statements, which are not covered by the Fund's Report of Independent Registered Public Accounting Firm, are available on the SEC's website or upon request. |
| (e) | Investment made with cash collateral received from securities on loan. |
| Affiliate | Value, beginning of period ($) | Purchases ($) | Sales Proceeds ($) | Dividend Income ($) | Realized Gain (loss) ($) | Change in Unrealized appreciation (depreciation) ($) | Value, end of period ($) | % ownership, end of period |
| Fidelity Cash Central Fund 3.10% | 2,707,951 | 30,681,115 | 32,096,611 | 15,328 | - | - | 1,292,455 | 0.0% |
| Fidelity Securities Lending Cash Central Fund 3.10% | 870,800 | 15,923,488 | 16,417,113 | 1,776 | - | - | 377,175 | 0.0% |
| Total | 3,578,751 | 46,604,603 | 48,513,724 | 17,104 | - | - | 1,669,630 | |
| Valuation Inputs at Reporting Date: | ||||
| Description | Total ($) | Level 1 ($) | Level 2 ($) | Level 3 ($) |
Investments in Securities: | ||||
| Equities: | ||||
Communication Services | 2,168,410 | 787,586 | 1,380,824 | - |
Energy | 5,813,204 | 5,813,204 | - | - |
Industrials | 11,932,141 | 9,388,832 | 2,543,309 | - |
Real Estate | 3,312,021 | 3,312,021 | - | - |
Utilities | 12,967,198 | 9,589,626 | 3,377,572 | - |
| Money Market Funds | 1,669,630 | 1,669,630 | - | - |
| Total Investments in Securities: | 37,862,604 | 30,560,899 | 7,301,705 | - |
| Statement of Assets and Liabilities | ||||
| October 31, 2022 | ||||
| Assets | ||||
| Investment in securities, at value (including securities loaned of $370,661) - See accompanying schedule: | ||||
Unaffiliated issuers (cost $35,054,390) | $36,192,974 | |||
Fidelity Central Funds (cost $1,669,630) | 1,669,630 | |||
| Total Investment in Securities (cost $36,724,020) | $ | 37,862,604 | ||
| Foreign currency held at value (cost $17) | 17 | |||
| Receivable for investments sold | 53,108 | |||
| Receivable for fund shares sold | 23,105 | |||
| Dividends receivable | 34,044 | |||
| Distributions receivable from Fidelity Central Funds | 3,244 | |||
| Prepaid expenses | 75 | |||
| Receivable from investment adviser for expense reductions | 18,863 | |||
Total assets | 37,995,060 | |||
| Liabilities | ||||
| Payable for fund shares redeemed | $186,553 | |||
| Accrued management fee | 21,847 | |||
| Other affiliated payables | 11,119 | |||
| Registration fee payable | 40,194 | |||
| Other payables and accrued expenses | 2,142 | |||
| Collateral on securities loaned | 377,175 | |||
| Total Liabilities | 639,030 | |||
| Net Assets | $ | 37,356,030 | ||
| Net Assets consist of: | ||||
| Paid in capital | $ | 39,802,185 | ||
| Total accumulated earnings (loss) | (2,446,155) | |||
| Net Assets | $ | 37,356,030 | ||
Net Asset Value , offering price and redemption price per share ($37,356,030 ÷ 3,329,772 shares) | $ | 11.22 | ||
| Statement of Operations | ||||
Year ended October 31, 2022 | ||||
| Investment Income | ||||
| Dividends | $ | 910,797 | ||
| Non-Cash dividends | 78,945 | |||
| Special dividends | 112,676 | |||
| Income from Fidelity Central Funds (including $1,776 from security lending) | 17,104 | |||
| Income before foreign taxes withheld | 1,119,522 | |||
| Less foreign taxes withheld | (73,274) | |||
| Total Income | 1,046,248 | |||
| Expenses | ||||
| Management fee | $ | 343,097 | ||
| Transfer agent fees | 132,173 | |||
| Accounting fees | 19,059 | |||
| Custodian fees and expenses | 5,544 | |||
| Independent trustees' fees and expenses | 172 | |||
| Registration fees | 26,448 | |||
| Audit | 46,155 | |||
| Legal | 46 | |||
| Miscellaneous | 333 | |||
| Total expenses before reductions | 573,027 | |||
| Expense reductions | (74,868) | |||
| Total expenses after reductions | 498,159 | |||
| Net Investment income (loss) | 548,089 | |||
| Realized and Unrealized Gain (Loss) | ||||
| Net realized gain (loss) on: | ||||
| Investment Securities: | ||||
| Unaffiliated issuers | (2,130,182) | |||
| Foreign currency transactions | 12,739 | |||
| Total net realized gain (loss) | (2,117,443) | |||
| Change in net unrealized appreciation (depreciation) on: | ||||
| Investment Securities: | ||||
| Unaffiliated issuers | (4,460,321) | |||
| Assets and liabilities in foreign currencies | (2,093) | |||
| Total change in net unrealized appreciation (depreciation) | (4,462,414) | |||
| Net gain (loss) | (6,579,857) | |||
| Net increase (decrease) in net assets resulting from operations | $ | (6,031,768) | ||
| Statement of Changes in Net Assets | ||||
Year ended October 31, 2022 | Year ended October 31, 2021 | |||
| Increase (Decrease) in Net Assets | ||||
| Operations | ||||
| Net investment income (loss) | $ | 548,089 | $ | 228,039 |
| Net realized gain (loss) | (2,117,443) | (642,084) | ||
| Change in net unrealized appreciation (depreciation) | (4,462,414) | 5,174,571 | ||
| Net increase (decrease) in net assets resulting from operations | (6,031,768) | 4,760,526 | ||
| Distributions to shareholders | (639,029) | (149,403) | ||
| Share transactions | ||||
| Proceeds from sales of shares | 27,766,378 | 55,669,179 | ||
| Reinvestment of distributions | 598,670 | 140,331 | ||
| Cost of shares redeemed | (30,384,461) | (27,136,405) | ||
Net increase (decrease) in net assets resulting from share transactions | (2,019,413) | 28,673,105 | ||
| Total increase (decrease) in net assets | (8,690,210) | 33,284,228 | ||
| Net Assets | ||||
| Beginning of period | 46,046,240 | 12,762,012 | ||
| End of period | $ | 37,356,030 | $ | 46,046,240 |
| Other Information | ||||
| Shares | ||||
| Sold | 2,232,445 | 4,660,061 | ||
| Issued in reinvestment of distributions | 51,607 | 12,118 | ||
| Redeemed | (2,600,860) | (2,248,442) | ||
| Net increase (decrease) | (316,808) | 2,423,737 | ||
| Fidelity® Infrastructure Fund |
| Years ended October 31, | 2022 | 2021 | 2020 A | |||
Selected Per-Share Data | ||||||
| Net asset value, beginning of period | $ | 12.63 | $ | 10.44 | $ | 10.00 |
| Income from Investment Operations | ||||||
Net investment income (loss) B,C | .13 D | .07 | .17 | |||
| Net realized and unrealized gain (loss) | (1.38) | 2.21 | .31 | |||
| Total from investment operations | (1.25) | 2.28 | .48 | |||
| Distributions from net investment income | (.16) | (.09) | (.04) | |||
| Total distributions | (.16) | (.09) | (.04) | |||
| Net asset value, end of period | $ | 11.22 | $ | 12.63 | $ | 10.44 |
Total Return E,F | (9.95)% | 21.96% | 4.79% | |||
Ratios to Average Net Assets C,G,H | ||||||
| Expenses before reductions | 1.13% | 1.24% | 2.24% I | |||
| Expenses net of fee waivers, if any | .98% | 1.00% | 1.00% I | |||
| Expenses net of all reductions | .98% | 1.00% | .98% I | |||
| Net investment income (loss) | 1.08% D | .61% | 1.67% I | |||
| Supplemental Data | ||||||
| Net assets, end of period (000 omitted) | $ | 37,356 | $ | 46,046 | $ | 12,762 |
Portfolio turnover rate J | 91% | 46% | 50% I |
| Fidelity Central Fund | Investment Manager | Investment Objective | Investment Practices | Expense Ratio A |
| Fidelity Money Market Central Funds | Fidelity Management & Research Company LLC (FMR) | Each fund seeks to obtain a high level of current income consistent with the preservation of capital and liquidity. | Short-term Investments | Less than .005% |
| Gross unrealized appreciation | $4,534,988 |
| Gross unrealized depreciation | (3,627,751) |
| Net unrealized appreciation (depreciation) | $907,237 |
| Tax Cost | $36,955,367 |
| Undistributed ordinary income | $136,313 |
| Capital loss carryforward | $(3,401,550) |
| Net unrealized appreciation (depreciation) on securities and other investments | $ 819,082 |
Short-term | $(3,401,550) |
| October 31, 2022 | October 31, 2021 | |
| Ordinary Income | $639,029 | $149,403 |
| Purchases ($) | Sales ($) | |
| Fidelity Infrastructure Fund | 43,865,936 | 44,331,055 |
| % of Average Net Assets | |
| Fidelity Infrastructure Fund | .04 |
| Amount | |
| Fidelity Infrastructure Fund | $282 |
| Purchases ($) | Sales ($) | Realized Gain (Loss) ($) | |
| Fidelity Infrastructure Fund | 300,521 | 944,862 | 94,018 |
| Amount | |
| Fidelity Infrastructure Fund | $87 |
| Total Security Lending Fees Paid to NFS | Security Lending Income From Securities Loaned to NFS | Value of Securities Loaned to NFS at Period End | |
| Fidelity Infrastructure Fund | $198 | $- | $- |
| The Example is based on an investment of $1,000 invested at the beginning of the period and held for the entire period (May 1, 2022 to October 31, 2022). |
Annualized Expense Ratio- A | Beginning Account Value May 1, 2022 | Ending Account Value October 31, 2022 | Expenses Paid During Period- C May 1, 2022 to October 31, 2022 | |||||||
| Fidelity® Infrastructure Fund | .97% | |||||||||
| Actual | $ 1,000 | $ 911.80 | $ 4.67 | |||||||
Hypothetical- B | $ 1,000 | $ 1,020.32 | $ 4.94 | |||||||
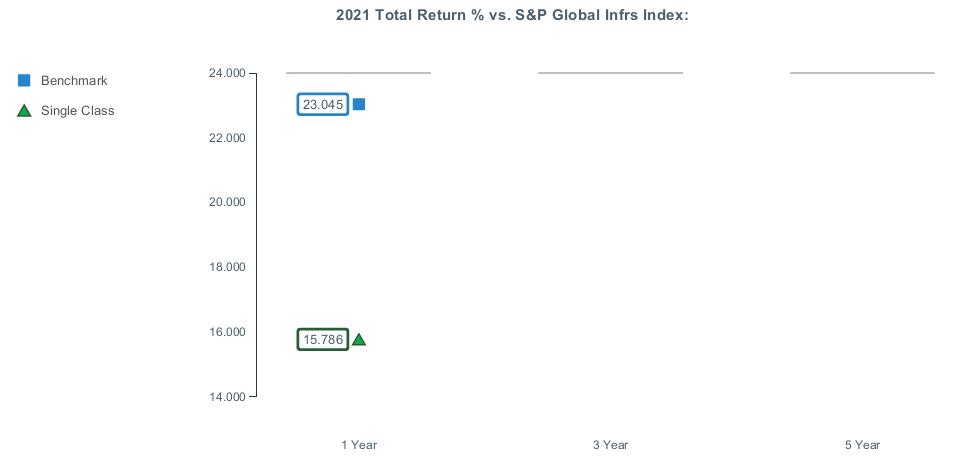

|
Item 2.
Code of Ethics
As of the end of the period, October 31, 2022, Fidelity Investment Trust (the trust) has adopted a code of ethics, as defined in Item 2 of Form N-CSR, that applies to its President and Treasurer and its Chief Financial Officer. A copy of the code of ethics is filed as an exhibit to this Form N-CSR.
Item 3.
Audit Committee Financial Expert
The Board of Trustees of the trust has determined that Donald F. Donahue is an audit committee financial expert, as defined in Item 3 of Form N-CSR. Mr. Donahue is independent for purposes of Item 3 of Form N-CSR.
Item 4.
Principal Accountant Fees and Services
Fees and Services
The following table presents fees billed by Deloitte & Touche LLP, the member firms of Deloitte Touche Tohmatsu, and their respective affiliates (collectively, “Deloitte Entities”) in each of the last two fiscal years for services rendered to Fidelity Diversified International Fund, Fidelity Diversified International K6 Fund, Fidelity Global Equity Income Fund, Fidelity International Capital Appreciation Fund, Fidelity International Capital Appreciation K6 Fund, Fidelity International Discovery K6 Fund, Fidelity International Small Cap Fund, Fidelity International Small Cap Opportunities Fund, Fidelity International Value Fund, Fidelity SAI International SMA Completion Fund, Fidelity SAI Sustainable Emerging Markets Equity Fund, Fidelity SAI Sustainable International Equity Fund, Fidelity Series Emerging Markets Fund, Fidelity Series Emerging Markets Opportunities Fund, Fidelity Series International Small Cap Fund, Fidelity Series International Value Fund, Fidelity Series Overseas Fund, Fidelity Sustainable International Equity Fund, Fidelity Total International Equity Fund and Fidelity Worldwide Fund (the “Fund(s)”):
Services Billed by Deloitte Entities
October 31, 2022 FeesA,B
Audit Fees | Audit-Related Fees | Tax Fees | All Other Fees | |
Fidelity Diversified International Fund | $71,100 | $- | $11,400 | $1,300 |
Fidelity Diversified International K6 Fund | $65,200 | $- | $11,400 | $1,200 |
Fidelity Global Equity Income Fund | $44,100 | $- | $9,300 | $1,100 |
Fidelity International Capital Appreciation Fund | $49,100 | $- | $11,200 | $1,200 |
Fidelity International Capital Appreciation K6 Fund | $49,400 | $- | $11,100 | $1,200 |
Fidelity International Discovery K6 Fund | $59,200 | $- | $11,200 | $1,100 |
Fidelity International Small Cap Fund | $55,500 | $- | $11,200 | $1,300 |
Fidelity International Small Cap Opportunities Fund | $50,100 | $- | $8,800 | $1,200 |
Fidelity International Value Fund | $51,200 | $- | $8,800 | $1,100 |
Fidelity SAI International SMA Completion Fund | $45,700 | $- | $11,400 | $1,200 |
Fidelity SAI Sustainable Emerging Markets Equity Fund | $33,700 | $- | $9,000 | $500 |
Fidelity SAI Sustainable International Equity Fund | $28,600 | $- | $9,000 | $400 |
Fidelity Series Emerging Markets Fund | $44,300 | $- | $11,200 | $1,100 |
Fidelity Series Emerging Markets Opportunities Fund | $42,900 | $- | $11,200 | $1,100 |
Fidelity Series International Small Cap Fund | $41,800 | $- | $8,800 | $1,000 |
Fidelity Series International Value Fund | $41,800 | $- | $8,800 | $1,000 |
Fidelity Series Overseas Fund | $44,100 | $- | $9,300 | $1,100 |
Fidelity Sustainable International Equity Fund | $39,300 | $- | $11,200 | $700 |
Fidelity Total International Equity Fund | $52,400 | $- | $10,700 | $1,300 |
Fidelity Worldwide Fund | $49,700 | $- | $8,800 | $1,200 |
October 31, 2021 FeesA,B
Audit Fees | Audit-Related Fees | Tax Fees | All Other Fees | |
Fidelity Diversified International Fund | $52,300 | $- | $11,600 | $1,300 |
Fidelity Diversified International K6 Fund | $48,600 | $- | $11,100 | $1,200 |
Fidelity Global Equity Income Fund | $42,800 | $- | $9,000 | $1,100 |
Fidelity International Capital Appreciation Fund | $47,600 | $- | $11,100 | $1,200 |
Fidelity International Capital Appreciation K6 Fund | $47,600 | $- | $11,000 | $1,200 |
Fidelity International Discovery K6 Fund | $47,100 | $- | $11,100 | $1,200 |
Fidelity International Small Cap Fund | $53,900 | $- | $11,100 | $1,400 |
Fidelity International Small Cap Opportunities Fund | $48,300 | $- | $8,700 | $1,200 |
Fidelity International Value Fund | $46,500 | $- | $8,700 | $1,200 |
Fidelity SAI International SMA Completion Fund | $44,600 | $- | $11,100 | $1,200 |
Fidelity SAI Sustainable Emerging Markets Equity Fund | $- | $- | $- | $- |
Fidelity SAI Sustainable International Equity Fund | $- | $- | $- | $- |
Fidelity Series Emerging Markets Fund | $45,400 | $- | $11,200 | $1,100 |
Fidelity Series Emerging Markets Opportunities Fund | $43,800 | $- | $11,200 | $1,100 |
Fidelity Series International Small Cap Fund | $43,100 | $- | $8,700 | $1,000 |
Fidelity Series International Value Fund | $43,000 | $- | $8,700 | $1,000 |
Fidelity Series Overseas Fund | $42,800 | $- | $9,000 | $1,100 |
Fidelity Sustainable International Equity Fund | $- | $- | $- | $- |
Fidelity Total International Equity Fund | $50,500 | $- | $10,600 | $1,300 |
Fidelity Worldwide Fund | $48,000 | $- | $9,000 | $1,200 |
A Amounts may reflect rounding
B Fidelity Sustainable International Equity Fund commenced operations on February 10,
2022. Fidelity SAI Sustainable Emerging Markets Equity Fund and Fidelity SAI Sustainable International Equity Fund and commenced operations on April 14, 2022.
The following table presents fees billed by PricewaterhouseCoopers LLP (“PwC”) in each of the last two fiscal years for services rendered to Fidelity Canada Fund, Fidelity China Region Fund, Fidelity Emerging Asia Fund, Emerging Markets Discovery Fund, Fidelity Emerging Markets Fund, Fidelity Enduring Opportunities Fund, Fidelity Europe Fund, Fidelity Global Commodity Stock Fund, Fidelity Infrastructure Fund, Fidelity International Discovery Fund, Fidelity International Growth Fund, Fidelity Japan Fund, Fidelity Japan Smaller Companies Fund, Fidelity Latin America Fund, Fidelity Nordic Fund, Fidelity Overseas Fund, Fidelity Pacific Basin Fund, Fidelity Series Canada Fund, Fidelity Series International Growth Fund, Fidelity Sustainable Emerging Markets Equity Fund, and Fidelity Total Emerging Markets Fund (the “Fund(s)”):
Services Billed by PwC
October 31, 2022 FeesA,B
Audit Fees | Audit-Related Fees | Tax Fees | All Other Fees | |
Fidelity Canada Fund | $48,900 | $4,500 | $10,900 | $1,500 |
Fidelity China Region Fund | $60,300 | $5,400 | $10,900 | $1,800 |
Fidelity Emerging Asia Fund | $52,800 | $4,800 | $11,800 | $1,600 |
Fidelity Emerging Markets Discovery Fund | $46,300 | $4,300 | $10,900 | $1,500 |
Fidelity Emerging Markets Fund | $77,300 | $5,800 | $13,300 | $2,000 |
Fidelity Enduring Opportunities Fund | $28,400 | $2,600 | $6,500 | $900 |
Fidelity Europe Fund | $58,400 | $5,100 | $12,300 | $1,700 |
Fidelity Global Commodity Stock Fund | $35,500 | $3,100 | $6,000 | $1,100 |
Fidelity Infrastructure Fund | $36,700 | $3,300 | $7,600 | $1,100 |
Fidelity International Discovery Fund | $102,300 | $5,600 | $39,100 | $1,900 |
Fidelity International Growth Fund | $50,800 | $4,400 | $11,400 | $1,500 |
Fidelity Japan Fund | $51,800 | $4,800 | $10,900 | $1,600 |
Fidelity Japan Smaller Companies Fund | $43,300 | $4,100 | $10,900 | $1,400 |
Fidelity Latin America Fund | $54,000 | $4,900 | $10,900 | $1,700 |
Fidelity Nordic Fund | $42,700 | $4,000 | $12,300 | $1,400 |
Fidelity Overseas Fund | $77,600 | $5,100 | $15,400 | $1,700 |
Fidelity Pacific Basin Fund | $52,500 | $4,900 | $12,700 | $1,700 |
Fidelity Series Canada Fund | $43,400 | $4,100 | $11,000 | $1,400 |
Fidelity Series International Growth Fund | $52,600 | $3,700 | $13,200 | $1,300 |
Fidelity Sustainable Emerging Markets Equity Fund | $40,600 | $2,900 | $11,300 | $1,000 |
Fidelity Total Emerging Markets Fund | $53,200 | $4,800 | $10,100 | $1,600 |
October 31, 2021 FeesA,B
Audit Fees | Audit-Related Fees | Tax Fees | All Other Fees | |
Fidelity Canada Fund | $47,600 | $4,800 | $10,600 | $1,600 |
Fidelity China Region Fund | $58,700 | $5,700 | $10,600 | $1,900 |
Fidelity Emerging Asia Fund | $51,400 | $5,100 | $11,400 | $1,700 |
Fidelity Emerging Markets Discovery Fund | $45,000 | $4,600 | $10,600 | $1,500 |
Fidelity Emerging Markets Fund | $72,400 | $5,800 | $10,900 | $2,000 |
Fidelity Enduring Opportunities Fund | $27,700 | $2,700 | $10,300 | $900 |
Fidelity Europe Fund | $54,600 | $5,300 | $10,600 | $1,800 |
Fidelity Global Commodity Stock Fund | $35,100 | $3,300 | $5,800 | $1,100 |
Fidelity Infrastructure Fund | $35,700 | $3,400 | $9,000 | $1,200 |
Fidelity International Discovery Fund | $67,300 | $5,900 | $20,500 | $2,000 |
Fidelity International Growth Fund | $46,500 | $4,700 | $10,600 | $1,600 |
Fidelity Japan Fund | $50,600 | $5,200 | $10,600 | $1,700 |
Fidelity Japan Smaller Companies Fund | $42,100 | $4,300 | $10,600 | $1,500 |
Fidelity Latin America Fund | $52,500 | $5,200 | $10,600 | $1,700 |
Fidelity Nordic Fund | $41,600 | $4,300 | $10,600 | $1,400 |
Fidelity Overseas Fund | $53,000 | $5,300 | $13,200 | $1,800 |
Fidelity Pacific Basin Fund | $51,100 | $5,200 | $12,300 | $1,700 |
Fidelity Series Canada Fund | $42,200 | $4,300 | $10,700 | $1,500 |
Fidelity Series International Growth Fund | $40,300 | $3,900 | $10,900 | $1,300 |
Fidelity Sustainable Emerging Markets Equity Fund | $- | $- | $- | $- |
Fidelity Total Emerging Markets Fund | $51,800 | $5,000 | $9,800 | $1,700 |
A Amounts may reflect rounding.
B Fidelity Sustainable Emerging Markets Equity Fund commenced operations on February 10, 2022
The following table(s) present(s) fees billed by Deloitte Entities and PwC that were required to be approved by the Audit Committee for services that relate directly to the operations and financial reporting of the Fund(s) and that are rendered on behalf of Fidelity Management & Research Company LLC ("FMR") and entities controlling, controlled by, or under common control with FMR (not including any sub-adviser whose role is primarily portfolio management and is subcontracted with or overseen by another investment adviser) that provide ongoing services to the Fund(s) (“Fund Service Providers”):
Services Billed by Deloitte Entities
October 31, 2022A,B | October 31, 2021A,B | |
Audit-Related Fees | $- | $- |
Tax Fees | $- | $- |
All Other Fees | $- | $- |
A Amounts may reflect rounding.
B May include amounts billed prior to the Fidelity SAI Sustainable Emerging Markets Equity Fund, Fidelity SAI Sustainable International Equity Fund, and Fidelity Sustainable International Equity Funds’ commencement of operations.
Services Billed by PwC
October 31, 2022A,B | October 31, 2021A,B | |
Audit-Related Fees | $7,914,600 | $8,830,600 |
Tax Fees | $1,000 | $354,200 |
All Other Fees | $- | $- |
A Amounts may reflect rounding
B May include amounts billed prior to the Fidelity Sustainable Emerging Markets Equity Fund’s commencement of operations.
“Audit-Related Fees” represent fees billed for assurance and related services that are reasonably related to the performance of the fund audit or the review of the fund's financial statements and that are not reported under Audit Fees.
“Tax Fees” represent fees billed for tax compliance, tax advice or tax planning that relate directly to the operations and financial reporting of the fund.
“All Other Fees” represent fees billed for services provided to the fund or Fund Service Provider, a significant portion of which are assurance related, that relate directly to the operations and financial reporting of the fund, excluding those services that are reported under Audit Fees, Audit-Related Fees or Tax Fees.
Assurance services must be performed by an independent public accountant.
* * *
The aggregate non-audit fees billed by Deloitte Entities and PwC for services rendered to the Fund(s), FMR (not including any sub-adviser whose role is primarily portfolio management and is subcontracted with or overseen by another investment adviser), and any Fund Service Provider for each of the last two fiscal years of the Fund(s) are as follows:
Billed By | October 31, 2022A,B | October 31, 2021A,B |
Deloitte Entities | $694,200 | $726,100 |
PwC | $13,266,000 | $14,833,300 |
A Amounts may reflect rounding.
B May include amounts billed prior to the Fidelity SAI Sustainable Emerging Markets Equity Fund, Fidelity SAI Sustainable International Equity Fund, Fidelity Sustainable Emerging Markets Equity Fund, and Fidelity Sustainable International Equity Funds’ commencement of operations.
The trust's Audit Committee has considered non-audit services that were not pre-approved that were provided by Deloitte Entities and PwC to Fund Service Providers to be compatible with maintaining the independence of Deloitte Entities and PwC in its(their) audit of the Fund(s), taking into account representations from Deloitte Entities and PwC, in accordance with Public Company Accounting Oversight Board rules, regarding its independence from the Fund(s) and its(their) related entities and FMR’s
review of the appropriateness and permissibility under applicable law of such non-audit services prior to their provision to the Fund(s) Service Providers.
Audit Committee Pre-Approval Policies and Procedures
The trust’s Audit Committee must pre-approve all audit and non-audit services provided by a fund’s independent registered public accounting firm relating to the operations or financial reporting of the fund. Prior to the commencement of any audit or non-audit services to a fund, the Audit Committee reviews the services to determine whether they are appropriate and permissible under applicable law.
The Audit Committee has adopted policies and procedures to, among other purposes, provide a framework for the Committee’s consideration of non-audit services by the audit firms that audit the Fidelity funds. The policies and procedures require that any non-audit service provided by a fund audit firm to a Fidelity fund and any non-audit service provided by a fund auditor to a Fund Service Provider that relates directly to the operations and financial reporting of a Fidelity fund (“Covered Service”) are subject to approval by the Audit Committee before such service is provided.
All Covered Services must be approved in advance of provision of the service either: (i) by formal resolution of the Audit Committee, or (ii) by oral or written approval of the service by the Chair of the Audit Committee (or if the Chair is unavailable, such other member of the Audit Committee as may be designated by the Chair to act in the Chair’s absence). The approval contemplated by (ii) above is permitted where the Treasurer determines that action on such an engagement is necessary before the next meeting of the Audit Committee.
Non-audit services provided by a fund audit firm to a Fund Service Provider that do not relate directly to the operations and financial reporting of a Fidelity fund are reported to the Audit Committee periodically.
Non-Audit Services Approved Pursuant to Rule 2-01(c)(7)(i)(C) and (ii) of Regulation S-X (“De Minimis Exception”)
There were no non-audit services approved or required to be approved by the Audit Committee pursuant to the De Minimis Exception during the Fund’s(s’) last two fiscal years relating to services provided to (i) the Fund(s) or (ii) any Fund Service Provider that relate directly to the operations and financial reporting of the Fund(s).
Item 5.
Audit Committee of Listed Registrants
Not applicable.
Item 6.
Investments
(a)
Not applicable.
(b)
Not applicable.
Item 7.
Disclosure of Proxy Voting Policies and Procedures for Closed-End Management Investment Companies
Not applicable.
Item 8.
Portfolio Managers of Closed-End Management Investment Companies
Not applicable.
Item 9.
Purchase of Equity Securities by Closed-End Management Investment Company and Affiliated Purchasers
Not applicable.
Item 10.
Submission of Matters to a Vote of Security Holders
There were no material changes to the procedures by which shareholders may recommend nominees to the trust’s Board of Trustees.
Item 11.
Controls and Procedures
(a)(i) The President and Treasurer and the Chief Financial Officer have concluded that the trust’s disclosure controls and procedures (as defined in Rule 30a-3(c) under the Investment Company Act) provide reasonable assurances that material information relating to the trust is made known to them by the appropriate persons, based on their evaluation of these controls and procedures as of a date within 90 days of the filing date of this report.
(a)(ii) There was no change in the trust’s internal control over financial reporting (as defined in Rule 30a-3(d) under the Investment Company Act) that occurred during the period covered by this report that has materially affected, or is reasonably likely to materially affect, the trust’s internal control over financial reporting.
Item 12.
Disclosure of Securities Lending Activities for Closed-End Management
Investment Companies
Not applicable.
Item 13.
Exhibits
(a) | (1) | Code of Ethics pursuant to Item 2 of Form N-CSR is filed and attached hereto as EX-99.CODE ETH. |
(a) | (2) | |
(a) | (3) | Not applicable. |
(b) |
SIGNATURES
Pursuant to the requirements of the Securities Exchange Act of 1934 and the Investment Company Act of 1940, the registrant has duly caused this report to be signed on its behalf by the undersigned, thereunto duly authorized.
Fidelity Investment Trust
By: | /s/Stacie M. Smith |
Stacie M. Smith | |
President and Treasurer | |
Date: | December 21, 2022 |
Pursuant to the requirements of the Securities Exchange Act of 1934 and the Investment Company Act of 1940, this report has been signed below by the following persons on behalf of the registrant and in the capacities and on the dates indicated.
By: | /s/Stacie M. Smith |
Stacie M. Smith | |
President and Treasurer | |
Date: | December 21, 2022 |
By: | /s/John J. Burke III |
John J. Burke III | |
Chief Financial Officer | |
Date: | December 21, 2022 |