UNITED STATES
SECURITIES AND EXCHANGE COMMISSION
Washington, D.C. 20549
FORM N-CSR
CERTIFIED SHAREHOLDER REPORT OF REGISTERED
MANAGEMENT INVESTMENT COMPANIES
Investment Company Act file number 811-04008
Fidelity Investment Trust
(Exact name of registrant as specified in charter)
245 Summer St., Boston, Massachusetts 02210
(Address of principal executive offices) (Zip code)
Margaret Carey, Secretary
245 Summer St.
Boston, Massachusetts 02210
(Name and address of agent for service)
Registrant's telephone number, including area code:
617-563-7000
| |
Date of fiscal year end: | October 31 |
|
|
Date of reporting period: | October 31, 2023 |
Item 1.
Reports to Stockholders
Fidelity's Targeted International Equity Funds®
Fidelity® Canada Fund
Fidelity® China Region Fund
Fidelity® Emerging Asia Fund
Fidelity® Emerging Markets Fund
Fidelity® Europe Fund
Fidelity® Japan Fund
Fidelity® Japan Smaller Companies Fund
Fidelity® Latin America Fund
Fidelity® Nordic Fund
Fidelity® Pacific Basin Fund
Annual Report
October 31, 2023
Includes Fidelity and Fidelity Advisor share classes
Contents
To view a fund's proxy voting guidelines and proxy voting record for the 12-month period ended June 30, visit http://www.fidelity.com/proxyvotingresults or visit the Securities and Exchange Commission's (SEC) web site at http://www.sec.gov.
You may also call 1-800-544-8544 if you're an individual investing directly with Fidelity, call 1-800-835-5092 if you're a plan sponsor or participant with Fidelity as your recordkeeper or call 1-877-208-0098 on institutional accounts or if you're an advisor or invest through one to request a free copy of the proxy voting guidelines.
Standard & Poor's, S&P and S&P 500 are registered service marks of The McGraw-Hill Companies, Inc. and have been licensed for use by Fidelity Distributors Corporation.
Other third-party marks appearing herein are the property of their respective owners.
All other marks appearing herein are registered or unregistered trademarks or service marks of FMR LLC or an affiliated company. © 2023 FMR LLC. All rights reserved.
This report and the financial statements contained herein are submitted for the general information of the shareholders of the Funds. This report is not authorized for distribution to prospective investors in the Funds unless preceded or accompanied by an effective prospectus.
A fund files its complete schedule of portfolio holdings with the SEC for the first and third quarters of each fiscal year on Form N-PORT. Forms N-PORT are available on the SEC's web site at http://www.sec.gov. A fund's Forms N-PORT may be reviewed and copied at the SEC's Public Reference Room in Washington, DC. Information regarding the operation of the SEC's Public Reference Room may be obtained by calling 1-800-SEC-0330.
For a complete list of a fund's portfolio holdings, view the most recent holdings listing, semiannual report, or annual report on Fidelity's web site at http://www.fidelity.com, http://www.institutional.fidelity.com, or http://www.401k.com, as applicable.
NOT FDIC INSURED •MAY LOSE VALUE •NO BANK GUARANTEE
Neither the Funds nor Fidelity Distributors Corporation is a bank.
Average annual total return reflects the change in the value of an investment, assuming reinvestment of distributions from dividend income and capital gains (the profits earned upon the sale of securities that have grown in value, if any) and assuming a constant rate of performance each year. The hypothetical investment and the average annual total returns do not reflect the deduction of taxes that a shareholder would pay on fund distributions or the redemption of fund shares. During periods of reimbursement by Fidelity, a fund's total return will be greater than it would be had the reimbursement not occurred. How a fund did yesterday is no guarantee of how it will do tomorrow.
| Average Annual Total Returns |
| | | | |
Periods ended October 31, 2023 | Past 1 year | Past 5 years | Past 10 years |
Class A (incl. 5.75% sales charge) | -4.92% | 6.30% | 3.57% |
Class M (incl. 3.50% sales charge) | -2.90% | 6.51% | 3.52% |
Class C (incl. contingent deferred sales charge) | -0.88% | 6.75% | 3.57% |
| Fidelity® Canada Fund | 1.18% | 7.90% | 4.51% |
| Class I | 1.20% | 7.95% | 4.54% |
| Class Z | 1.33% | 8.06% | 4.60% |
Class C shares' contingent deferred sales charges included in the past one year, past five years and past ten years total return figures are 1%, 0% and 0%, respectively.
The initial offering of Class Z shares took place on October 2, 2018. Returns prior to October 2, 2018, are those of Class I.
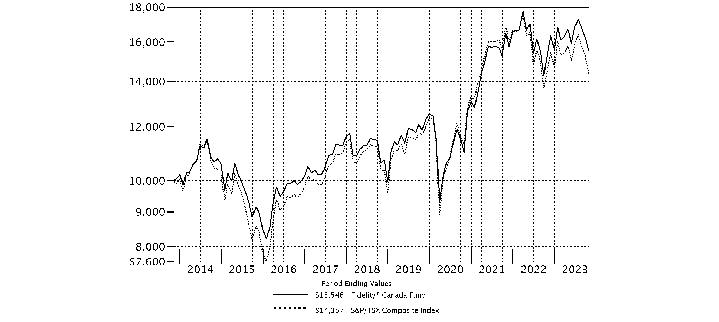
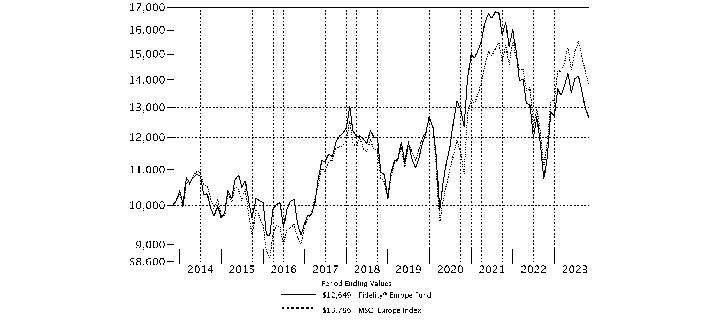
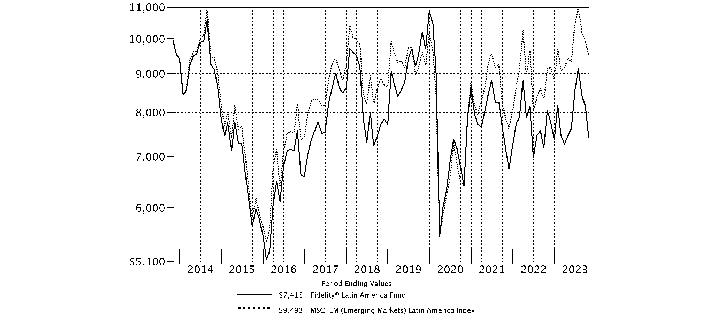
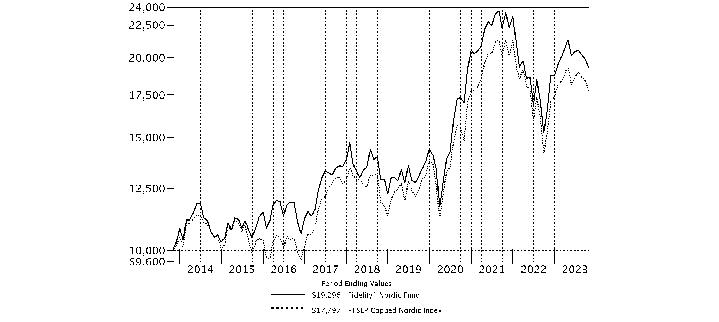
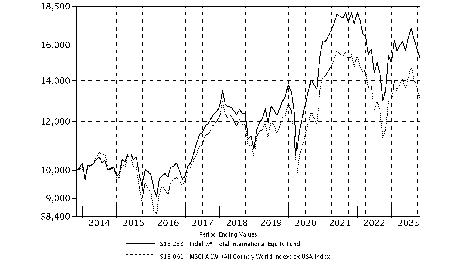
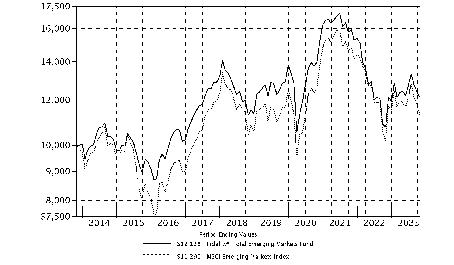
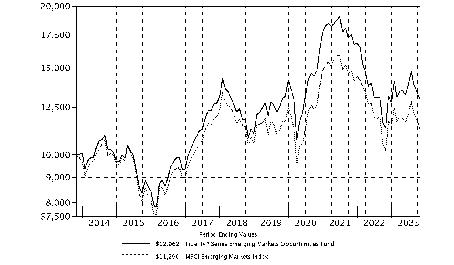
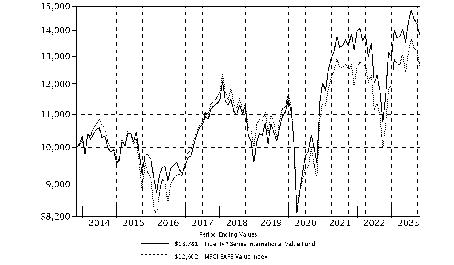
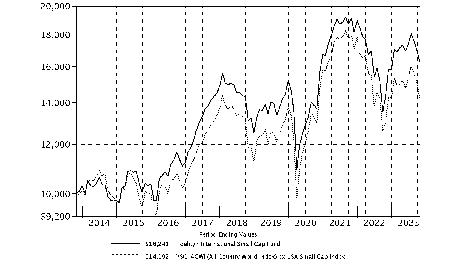
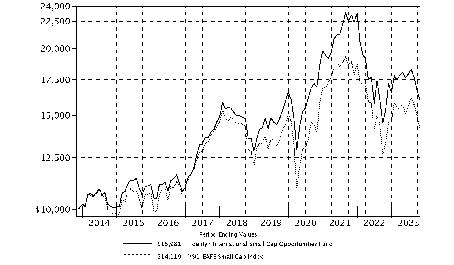
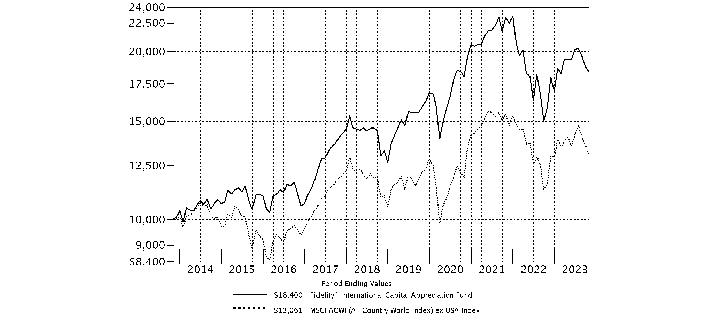
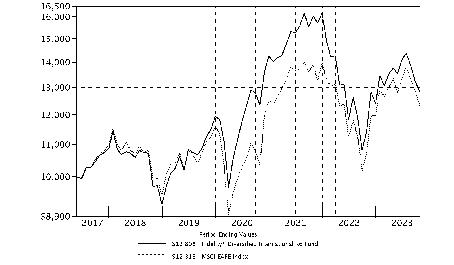
| $10,000 Over 10 Years |
| |
Let's say hypothetically that $10,000 was invested in Fidelity® Canada Fund, a class of the fund, on October 31, 2013. The chart shows how the value of your investment would have changed, and also shows how the S&P/TSX Composite Index performed over the same period. |
|
|
Fidelity® Canada Fund
Market Recap:
International (non-U.S.) equities gained 12.27% for the 12 months ending October 31, 2023, according to the MSCI ACWI (All Country World Index) ex USA Index, as global economic expansion and a slowing in the pace of inflation in some markets provided a favorable backdrop for risk assets. After returning -15.86% in 2022, the index's upturn has been largely driven by a narrow set of companies in the information technology and communication services sectors, in part due to excitement for generative artificial intelligence applications. The index gained 14.07% year to date through July, including strong gains in both June (+4.50%) and July (+4.07%). The rally for international equities sputtered for the next three months (-11.33%) amid a stalling pattern in disinflationary trends, heightened global recession and geopolitical risks, soaring yields on longer-term U.S. government bonds and particularly weak economic conditions in the eurozone and China. The three-month decline left non-U.S. stocks up 1.15% year to date through October. For the full 12 months, nearly all regions advanced, with Europe ex U.K. (+18%) and Japan (+17%) leading, whereas Canada (-0.38%) lagged by the widest margin. Each of the 11 sectors advanced, with information technology (+21%) and consumer discretionary (+19%) leading the way. Energy and industrials each rose about 14%. Conversely, four defensive-oriented sectors lagged by the widest margin: real estate (+4%), health care (+6%), consumer staples (+7%) and utilities (+8%).
Comments from Portfolio Manager Ryan Oldham:
For the fiscal year ending October 31, 2023, the fund's share classes (excluding sales charges, if applicable) returned about 0% to 1%, versus -1.32% for the benchmark S&P/TSX Composite Index. By sector, the biggest contributor to performance versus the benchmark was stock selection in energy. An underweight in utilities also boosted relative performance. Further helping our relative result were stock picking and an overweight in consumer staples, primarily within the consumer staples distribution & retail industry. The top individual relative contributor was an overweight in Alimentation Couche-Tard (+22%). The stock was among the portfolio's biggest holdings. The second-largest relative contributor was an overweight in Constellation Software (+41%), which was also among the fund's largest holdings. An overweight and timely positioning in Brookfield Asset Management (-11%) also helped. This was an investment we established this period. In contrast, the biggest detractor by sector from performance versus the benchmark was stock selection in materials. Security selection in information technology, primarily within the software & services industry, also hampered the fund's result. Further detracting from our result were stock selection and a modest overweight in health care, primarily within the health care equipment & services industry. The biggest individual relative detractor was an underweight in Brookfield Corporation, the parent company of Brookfield Asset Management, which returned roughly -26% for the fund. A second notable relative detractor was an overweight in Nutrien (-35%), a top-20 fund holding this period. Avoiding Fairfax Financial, a benchmark component that gained about 72%, also hurt. By sector, meaningful changes in positioning the past 12 months include a higher allocation to information technology.
The views expressed above reflect those of the portfolio manager(s) only through the end of the period as stated on the cover of this report and do not necessarily represent the views of Fidelity or any other person in the Fidelity organization. Any such views are subject to change at any time based upon market or other conditions and Fidelity disclaims any responsibility to update such views. These views may not be relied on as investment advice and, because investment decisions for a Fidelity fund are based on numerous factors, may not be relied on as an indication of trading intent on behalf of any Fidelity fund.
Fidelity® Canada Fund
Top Holdings (% of Fund's net assets) |
| |
| Royal Bank of Canada (Banks) | 7.1 | |
| The Toronto-Dominion Bank (Banks) | 7.0 | |
| Canadian Pacific Kansas City Ltd. (Ground Transportation) | 6.6 | |
| Alimentation Couche-Tard, Inc. Class A (multi-vtg.) (Consumer Staples Distribution & Retail) | 6.5 | |
| Canadian Natural Resources Ltd. (Oil, Gas & Consumable Fuels) | 5.6 | |
| Constellation Software, Inc. (Software) | 4.7 | |
| Suncor Energy, Inc. (Oil, Gas & Consumable Fuels) | 4.3 | |
| PrairieSky Royalty Ltd. (Oil, Gas & Consumable Fuels) | 4.0 | |
| Franco-Nevada Corp. (Metals & Mining) | 3.8 | |
| Dollarama, Inc. (Broadline Retail) | 3.2 | |
| | 52.8 | |
| |
| Market Sectors (% of Fund's net assets) |
| |
| Financials | 25.9 | |
| Energy | 18.8 | |
| Industrials | 14.3 | |
| Materials | 11.4 | |
| Consumer Staples | 9.9 | |
| Information Technology | 8.3 | |
| Consumer Discretionary | 6.8 | |
| Communication Services | 3.7 | |
| Health Care | 0.7 | |
| Utilities | 0.2 | |
| |
Market Sectors may include more than one industry category.
The Fund may invest up to 35% of its total assets in any industry that represents more than 20% of the Canadian market. As of October 31, 2023, the Fund did not have more than 25% of its total assets invested in any one industry.
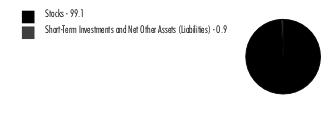
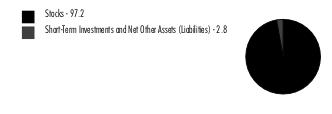
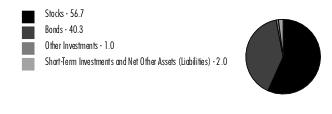
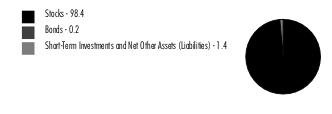
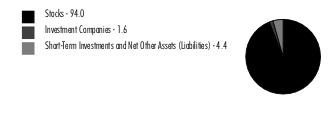
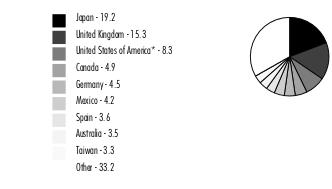
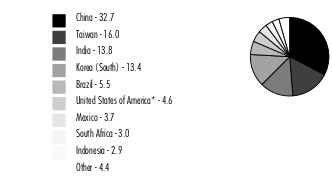
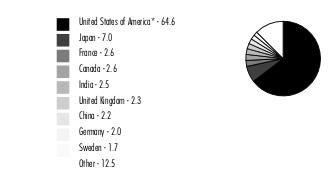
Asset Allocation (% of Fund's net assets) |
|
|
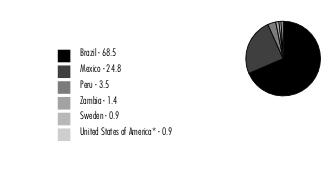
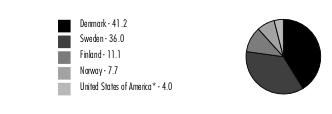
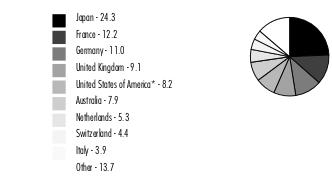
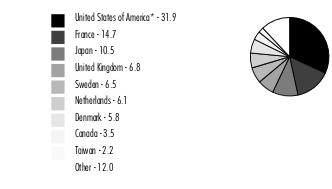
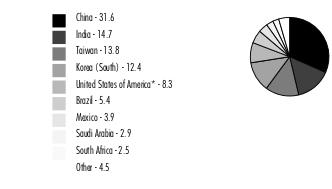
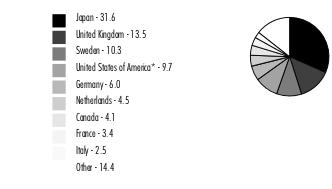
Geographic Diversification (% of Fund's net assets) |
|
* Includes Short-Term investments and Net Other Assets (Liabilities). Percentages are adjusted for the effect of derivatives, if applicable. |
| |
Fidelity® Canada Fund
Showing Percentage of Net Assets
| Common Stocks - 99.6% |
| | | Shares | Value ($) |
| COMMUNICATION SERVICES - 3.4% | | | |
| Diversified Telecommunication Services - 2.1% | | | |
| Quebecor, Inc.: | | | |
| Class A | | 352,400 | 7,689,651 |
| Class B (sub. vtg.) | | 171,000 | 3,527,896 |
| TELUS Corp. | | 354,700 | 5,719,194 |
| | | | 16,936,741 |
| Wireless Telecommunication Services - 1.3% | | | |
| Rogers Communications, Inc. Class B (non-vtg.) | | 292,100 | 10,822,497 |
TOTAL COMMUNICATION SERVICES | | | 27,759,238 |
| CONSUMER DISCRETIONARY - 6.8% | | | |
| Automobile Components - 0.7% | | | |
| Magna International, Inc. Class A (sub. vtg.) | | 118,400 | 5,689,689 |
| Broadline Retail - 3.2% | | | |
| Dollarama, Inc. | | 384,000 | 26,223,039 |
| Hotels, Restaurants & Leisure - 2.3% | | | |
| Restaurant Brands International, Inc. | | 281,700 | 18,922,196 |
| Specialty Retail - 0.4% | | | |
| Aritzia, Inc. (a) | | 159,800 | 2,485,586 |
| Diversified Royalty Corp. (b) | | 817,400 | 1,432,329 |
| | | | 3,917,915 |
| Textiles, Apparel & Luxury Goods - 0.2% | | | |
| Canada Goose Holdings, Inc. (a)(b) | | 140,876 | 1,562,411 |
TOTAL CONSUMER DISCRETIONARY | | | 56,315,250 |
| CONSUMER STAPLES - 9.9% | | | |
| Beverages - 0.1% | | | |
| GURU Organic Energy Corp. (a)(b) | | 322,600 | 521,092 |
| Consumer Staples Distribution & Retail - 9.5% | | | |
| Alimentation Couche-Tard, Inc. Class A (multi-vtg.) | | 979,700 | 53,331,569 |
| Metro, Inc. | | 351,195 | 17,838,959 |
| North West Co., Inc. (b) | | 277,500 | 7,075,825 |
| | | | 78,246,353 |
| Personal Care Products - 0.3% | | | |
| Jamieson Wellness, Inc. (c) | | 160,800 | 2,640,286 |
TOTAL CONSUMER STAPLES | | | 81,407,731 |
| ENERGY - 18.8% | | | |
| Energy Equipment & Services - 0.7% | | | |
| Pason Systems, Inc. | | 605,200 | 5,799,970 |
| Oil, Gas & Consumable Fuels - 18.1% | | | |
| Cameco Corp. | | 184,100 | 7,531,273 |
| Canadian Natural Resources Ltd. | | 732,098 | 46,488,949 |
| Enbridge, Inc. | | 385,800 | 12,363,405 |
| Parkland Corp. | | 491,600 | 14,878,278 |
| PrairieSky Royalty Ltd. (b) | | 1,855,318 | 32,577,605 |
| Suncor Energy, Inc. | | 1,095,600 | 35,481,086 |
| | | | 149,320,596 |
TOTAL ENERGY | | | 155,120,566 |
| FINANCIALS - 25.9% | | | |
| Banks - 14.1% | | | |
| Royal Bank of Canada (b) | | 730,900 | 58,377,128 |
| The Toronto-Dominion Bank | | 1,030,600 | 57,566,451 |
| | | | 115,943,579 |
| Capital Markets - 4.9% | | | |
| Brookfield Asset Management Ltd. Class A | | 441,201 | 12,646,648 |
| Brookfield Corp. (Canada) Class A | | 537,406 | 15,656,176 |
| TMX Group Ltd. | | 569,500 | 11,860,220 |
| | | | 40,163,044 |
| Insurance - 6.9% | | | |
| Definity Financial Corp. (b) | | 486,213 | 13,442,514 |
| Intact Financial Corp. | | 139,025 | 19,533,175 |
| Sun Life Financial, Inc. | | 526,800 | 24,061,664 |
| | | | 57,037,353 |
TOTAL FINANCIALS | | | 213,143,976 |
| HEALTH CARE - 0.7% | | | |
| Health Care Providers & Services - 0.7% | | | |
| Andlauer Healthcare Group, Inc. | | 179,000 | 5,013,420 |
| dentalcorp Holdings Ltd. (a)(b) | | 223,500 | 886,425 |
| | | | 5,899,845 |
| INDUSTRIALS - 14.3% | | | |
| Commercial Services & Supplies - 2.4% | | | |
| GFL Environmental, Inc. | | 693,300 | 19,972,839 |
| Ground Transportation - 9.1% | | | |
| Canadian National Railway Co. | | 196,250 | 20,764,927 |
| Canadian Pacific Kansas City Ltd. | | 764,362 | 54,270,115 |
| | | | 75,035,042 |
| Professional Services - 2.8% | | | |
| Thomson Reuters Corp. | | 187,600 | 22,471,416 |
TOTAL INDUSTRIALS | | | 117,479,297 |
| INFORMATION TECHNOLOGY - 8.2% | | | |
| IT Services - 2.5% | | | |
| Shopify, Inc. Class A (a) | | 428,400 | 20,231,416 |
| Software - 5.7% | | | |
| ApplyBoard, Inc. (a)(d)(e) | | 1,677 | 95,136 |
| ApplyBoard, Inc. (non-vtg.) (a)(d)(e) | | 414 | 23,486 |
| Computer Modelling Group Ltd. | | 513,400 | 3,391,198 |
| Constellation Software, Inc. | | 19,100 | 38,289,664 |
| Constellation Software, Inc. warrants 8/22/28 (a)(e) | | 19,300 | 1 |
| Dye & Durham Ltd. | | 717,900 | 4,188,074 |
| Lumine Group, Inc. | | 86,107 | 1,082,896 |
| | | | 47,070,455 |
TOTAL INFORMATION TECHNOLOGY | | | 67,301,871 |
| MATERIALS - 11.4% | | | |
| Chemicals - 2.5% | | | |
| Nutrien Ltd. | | 384,481 | 20,649,825 |
| Containers & Packaging - 1.1% | | | |
| CCL Industries, Inc.: | | | |
| Class A | | 25,900 | 1,017,697 |
| Class B | | 209,600 | 8,195,069 |
| | | | 9,212,766 |
| Metals & Mining - 7.1% | | | |
| Franco-Nevada Corp. | | 255,100 | 31,033,258 |
| Lundin Mining Corp. | | 947,900 | 5,919,462 |
| Triple Flag Precious Metals Corp. | | 180,900 | 2,299,814 |
| Wheaton Precious Metals Corp. | | 447,700 | 18,908,808 |
| | | | 58,161,342 |
| Paper & Forest Products - 0.7% | | | |
| Stella-Jones, Inc. | | 112,723 | 5,904,596 |
| Western Forest Products, Inc. | | 416,270 | 216,127 |
| | | | 6,120,723 |
TOTAL MATERIALS | | | 94,144,656 |
| UTILITIES - 0.2% | | | |
| Independent Power and Renewable Electricity Producers - 0.2% | | | |
| Brookfield Renewable Corp. | | 66,500 | 1,513,540 |
| TOTAL COMMON STOCKS (Cost $498,096,392) | | | 820,085,970 |
| | | | |
| Nonconvertible Preferred Stocks - 0.1% |
| | | Shares | Value ($) |
| INFORMATION TECHNOLOGY - 0.1% | | | |
| Software - 0.1% | | | |
| ApplyBoard, Inc.: | | | |
| Series A1 (a)(d)(e) | | 2,063 | 117,034 |
| Series A2 (a)(d)(e) | | 1,615 | 91,619 |
| Series A3 (a)(d)(e) | | 92 | 5,219 |
| Series D (a)(d)(e) | | 4,504 | 255,512 |
| Series Seed (a)(d)(e) | | 617 | 35,002 |
| (Cost $770,130) | | | 504,386 |
| | | | |
| Convertible Bonds - 0.3% |
| | | Principal Amount (f) | Value ($) |
| COMMUNICATION SERVICES - 0.3% | | | |
| Entertainment - 0.3% | | | |
Cineplex, Inc. 5.75% 9/30/25 (c) (Cost $2,375,263) | CAD | 3,203,000 | 2,286,620 |
| | | | |
| Money Market Funds - 2.8% |
| | | Shares | Value ($) |
| Fidelity Cash Central Fund 5.40% (g) | | 373,266 | 373,341 |
| Fidelity Securities Lending Cash Central Fund 5.40% (g)(h) | | 22,378,257 | 22,380,495 |
| TOTAL MONEY MARKET FUNDS (Cost $22,753,836) | | | 22,753,836 |
| | | | |
| TOTAL INVESTMENT IN SECURITIES - 102.8% (Cost $523,995,621) | 845,630,812 |
NET OTHER ASSETS (LIABILITIES) - (2.8)% | (22,658,043) |
| NET ASSETS - 100.0% | 822,972,769 |
| | |
Currency Abbreviations
Legend
| (b) | Security or a portion of the security is on loan at period end. |
| (c) | Security exempt from registration under Rule 144A of the Securities Act of 1933. These securities may be resold in transactions exempt from registration, normally to qualified institutional buyers. At the end of the period, the value of these securities amounted to $4,926,906 or 0.6% of net assets. |
| (d) | Restricted securities (including private placements) - Investment in securities not registered under the Securities Act of 1933 (excluding 144A issues). At the end of the period, the value of restricted securities (excluding 144A issues) amounted to $623,008 or 0.1% of net assets. |
| (f) | Amount is stated in United States dollars unless otherwise noted. |
| (g) | Affiliated fund that is generally available only to investment companies and other accounts managed by Fidelity Investments. The rate quoted is the annualized seven-day yield of the fund at period end. A complete unaudited listing of the fund's holdings as of its most recent quarter end is available upon request. In addition, each Fidelity Central Fund's financial statements, which are not covered by the Fund's Report of Independent Registered Public Accounting Firm, are available on the SEC's website or upon request. |
| (h) | Investment made with cash collateral received from securities on loan. |
| Additional information on each restricted holding is as follows: |
| Security | Acquisition Date | Acquisition Cost ($) |
| ApplyBoard, Inc. | 6/04/21 - 6/30/21 | 85,688 |
| | | |
| ApplyBoard, Inc. (non-vtg.) | 6/30/21 | 44,290 |
| | | |
| ApplyBoard, Inc. Series A1 | 6/04/21 | 133,582 |
| | | |
| ApplyBoard, Inc. Series A2 | 6/04/21 | 104,573 |
| | | |
| ApplyBoard, Inc. Series A3 | 6/04/21 | 5,957 |
| | | |
| ApplyBoard, Inc. Series D | 6/04/21 | 486,066 |
| | | |
| ApplyBoard, Inc. Series Seed | 6/04/21 | 39,952 |
| | | |
Affiliated Central Funds
Fiscal year to date information regarding the Fund's investments in Fidelity Central Funds, including the ownership percentage, is presented below.
| Affiliate | Value, beginning of period ($) | Purchases ($) | Sales Proceeds ($) | Dividend Income ($) | Realized Gain (loss) ($) | Change in Unrealized appreciation (depreciation) ($) | Value, end of period ($) | % ownership, end of period |
| Fidelity Cash Central Fund 5.40% | 505,538 | 30,470,111 | 30,602,308 | 17,196 | - | - | 373,341 | 0.0% |
| Fidelity Securities Lending Cash Central Fund 5.40% | 29,353,183 | 893,587,576 | 900,560,264 | 166,086 | - | - | 22,380,495 | 0.1% |
| Total | 29,858,721 | 924,057,687 | 931,162,572 | 183,282 | - | - | 22,753,836 | |
| | | | | | | | | |
Amounts in the dividend income column in the above table include any capital gain distributions from underlying funds, which are presented in the corresponding line item in the Statement of Operations, if applicable.
Amounts in the dividend income column for Fidelity Securities Lending Cash Central Fund represents the income earned on investing cash collateral, less rebates paid to borrowers and any lending agent fees associated with the loan, plus any premium payments received for lending certain types of securities.
Amounts included in the purchases and sales proceeds columns may include in-kind transactions, if applicable.
Investment Valuation
The following is a summary of the inputs used, as of October 31, 2023, involving the Fund's assets and liabilities carried at fair value. The inputs or methodology used for valuing securities may not be an indication of the risk associated with investing in those securities. For more information on valuation inputs, and their aggregation into the levels used below, please refer to the Investment Valuation section in the accompanying Notes to Financial Statements.
| Valuation Inputs at Reporting Date: |
| Description | Total ($) | Level 1 ($) | Level 2 ($) | Level 3 ($) |
Investments in Securities: | | | | |
|
| Equities: | | | | |
Communication Services | 27,759,238 | 27,759,238 | - | - |
Consumer Discretionary | 56,315,250 | 56,315,250 | - | - |
Consumer Staples | 81,407,731 | 81,407,731 | - | - |
Energy | 155,120,566 | 155,120,566 | - | - |
Financials | 213,143,976 | 213,143,976 | - | - |
Health Care | 5,899,845 | 5,899,845 | - | - |
Industrials | 117,479,297 | 117,479,297 | - | - |
Information Technology | 67,806,257 | 67,183,248 | - | 623,009 |
Materials | 94,144,656 | 94,144,656 | - | - |
Utilities | 1,513,540 | 1,513,540 | - | - |
|
| Corporate Bonds | 2,286,620 | - | 2,286,620 | - |
|
| Money Market Funds | 22,753,836 | 22,753,836 | - | - |
| Total Investments in Securities: | 845,630,812 | 842,721,183 | 2,286,620 | 623,009 |
Fidelity® Canada Fund
| Statement of Assets and Liabilities |
| | | | October 31, 2023 |
| | | | | |
| Assets | | | | |
| Investment in securities, at value (including securities loaned of $21,296,454) - See accompanying schedule: | | | | |
Unaffiliated issuers (cost $501,241,785) | $ | 822,876,976 | | |
Fidelity Central Funds (cost $22,753,836) | | 22,753,836 | | |
| | | | | |
| | | | | |
| Total Investment in Securities (cost $523,995,621) | | | $ | 845,630,812 |
| Receivable for investments sold | | | | 133,877 |
| Receivable for fund shares sold | | | | 79,039 |
| Dividends receivable | | | | 1,326,980 |
| Interest receivable | | | | 11,644 |
| Distributions receivable from Fidelity Central Funds | | | | 24,064 |
| Prepaid expenses | | | | 1,243 |
Total assets | | | | 847,207,659 |
| Liabilities | | | | |
| Payable to custodian bank | $ | 630,407 | | |
| Payable for investments purchased | | 43,978 | | |
| Payable for fund shares redeemed | | 327,516 | | |
| Accrued management fee | | 623,556 | | |
| Distribution and service plan fees payable | | 9,602 | | |
| Other affiliated payables | | 161,114 | | |
| Other payables and accrued expenses | | 61,796 | | |
| Collateral on securities loaned | | 22,376,921 | | |
| Total Liabilities | | | | 24,234,890 |
| Net Assets | | | $ | 822,972,769 |
| Net Assets consist of: | | | | |
| Paid in capital | | | $ | 476,382,574 |
| Total accumulated earnings (loss) | | | | 346,590,195 |
| Net Assets | | | $ | 822,972,769 |
| | | | | |
| Net Asset Value and Maximum Offering Price | | | | |
| Class A : | | | | |
Net Asset Value and redemption price per share ($28,547,580 ÷ 493,896 shares)(a) | | | $ | 57.80 |
| Maximum offering price per share (100/94.25 of $57.80) | | | $ | 61.33 |
| Class M : | | | | |
Net Asset Value and redemption price per share ($6,254,821 ÷ 108,807 shares)(a) | | | $ | 57.49 |
| Maximum offering price per share (100/96.50 of $57.49) | | | $ | 59.58 |
| Class C : | | | | |
Net Asset Value and offering price per share ($844,278 ÷ 14,835 shares)(a) | | | $ | 56.91 |
| Canada : | | | | |
Net Asset Value, offering price and redemption price per share ($774,062,446 ÷ 13,312,880 shares) | | | $ | 58.14 |
| Class I : | | | | |
Net Asset Value, offering price and redemption price per share ($10,571,236 ÷ 181,653 shares) | | | $ | 58.19 |
| Class Z : | | | | |
Net Asset Value, offering price and redemption price per share ($2,692,408 ÷ 46,413 shares) | | | $ | 58.01 |
(a)Redemption price per share is equal to net asset value less any applicable contingent deferred sales charge. |
| Statement of Operations |
| | | | Year ended October 31, 2023 |
| Investment Income | | | | |
| Dividends | | | $ | 23,871,296 |
| Interest | | | | 213,515 |
| Income from Fidelity Central Funds (including $166,086 from security lending) | | | | 183,282 |
| Income before foreign taxes withheld | | | $ | 24,268,093 |
| Less foreign taxes withheld | | | | (3,592,804) |
| Total Income | | | | 20,675,289 |
| Expenses | | | | |
| Management fee | | | | |
| Basic fee | $ | 6,094,294 | | |
| Performance adjustment | | 1,226,787 | | |
| Transfer agent fees | | 1,575,938 | | |
| Distribution and service plan fees | | 123,826 | | |
| Accounting fees | | 408,208 | | |
| Custodian fees and expenses | | 20,923 | | |
| Independent trustees' fees and expenses | | 5,098 | | |
| Registration fees | | 84,922 | | |
| Audit | | 64,953 | | |
| Legal | | 1,817 | | |
| Miscellaneous | | 4,257 | | |
| Total expenses before reductions | | 9,611,023 | | |
| Expense reductions | | (55,182) | | |
| Total expenses after reductions | | | | 9,555,841 |
| Net Investment income (loss) | | | | 11,119,448 |
| Realized and Unrealized Gain (Loss) | | | | |
| Net realized gain (loss) on: | | | | |
| Investment Securities: | | | | |
| Unaffiliated issuers | | 21,012,530 | | |
| Foreign currency transactions | | (97,192) | | |
| Total net realized gain (loss) | | | | 20,915,338 |
| Change in net unrealized appreciation (depreciation) on: | | | | |
| Investment Securities: | | | | |
| Unaffiliated issuers | | (17,871,260) | | |
| Assets and liabilities in foreign currencies | | (2,428) | | |
| Total change in net unrealized appreciation (depreciation) | | | | (17,873,688) |
| Net gain (loss) | | | | 3,041,650 |
| Net increase (decrease) in net assets resulting from operations | | | $ | 14,161,098 |
| Statement of Changes in Net Assets |
| |
| | Year ended October 31, 2023 | | Year ended October 31, 2022 |
| Increase (Decrease) in Net Assets | | | | |
| Operations | | | | |
| Net investment income (loss) | $ | 11,119,448 | $ | 11,825,119 |
| Net realized gain (loss) | | 20,915,338 | | 24,520,329 |
| Change in net unrealized appreciation (depreciation) | | (17,873,688) | | (104,988,178) |
| Net increase (decrease) in net assets resulting from operations | | 14,161,098 | | (68,642,730) |
| Distributions to shareholders | | (34,966,270) | | (44,124,388) |
| | | | | |
| Share transactions - net increase (decrease) | | (43,174,882) | | 99,770,958 |
| | | | | |
| Total increase (decrease) in net assets | | (63,980,054) | | (12,996,160) |
| | | | | |
| Net Assets | | | | |
| Beginning of period | | 886,952,823 | | 899,948,983 |
| End of period | $ | 822,972,769 | $ | 886,952,823 |
| | | | | |
| | | | | |
Financial Highlights
| Fidelity Advisor® Canada Fund Class A |
| |
| Years ended October 31, | | 2023 | | 2022 | | 2021 | | 2020 | | 2019 |
Selected Per-Share Data | | | | | | | | | | |
| Net asset value, beginning of period | $ | 59.44 | $ | 67.23 | $ | 46.01 | $ | 51.95 | $ | 49.75 |
| Income from Investment Operations | | | | | | | | | | |
Net investment income (loss) A,B | | .57 | | .63 | | .55 | | .61 | | .66 |
| Net realized and unrealized gain (loss) | | (.01) C | | (5.30) | | 21.89 | | (4.38) | | 4.56 |
| Total from investment operations | | .56 | | (4.67) | | 22.44 | | (3.77) | | 5.22 |
| Distributions from net investment income | | (.68) | | (.61) | | (.63) | | (.77) | | (.39) |
| Distributions from net realized gain | | (1.52) | | (2.51) | | (.59) | | (1.40) | | (2.63) |
| Total distributions | | (2.20) | | (3.12) | | (1.22) | | (2.17) | | (3.02) |
| Net asset value, end of period | $ | 57.80 | $ | 59.44 | $ | 67.23 | $ | 46.01 | $ | 51.95 |
Total Return D,E | | .88% | | (7.06)% | | 49.45% | | (7.70)% | | 11.34% |
Ratios to Average Net Assets B,F,G | | | | | | | | | | |
| Expenses before reductions | | 1.36% | | 1.20% | | 1.12% | | 1.20% | | 1.20% |
| Expenses net of fee waivers, if any | | 1.36% | | 1.20% | | 1.12% | | 1.20% | | 1.20% |
| Expenses net of all reductions | | 1.35% | | 1.20% | | 1.12% | | 1.19% | | 1.19% |
| Net investment income (loss) | | .94% | | 1.00% | | .92% | | 1.27% | | 1.32% |
| Supplemental Data | | | | | | | | | | |
| Net assets, end of period (000 omitted) | $ | 28,548 | $ | 31,707 | $ | 33,087 | $ | 23,395 | $ | 30,598 |
Portfolio turnover rate H | | 9% | | 13% | | 7% | | 11% | | 8% I |
ACalculated based on average shares outstanding during the period.
BNet investment income (loss) is affected by the timing of the declaration of dividends by any underlying mutual funds or exchange-traded funds (ETFs). Net investment income (loss) of any mutual funds or ETFs is not included in the Fund's net investment income (loss) ratio.
CThe amount shown for a share outstanding does not correspond with the aggregate net gain (loss) on investments for the period due to the timing of sales and repurchases of shares in relation to fluctuating market values of the investments of the Fund.
DTotal returns would have been lower if certain expenses had not been reduced during the applicable periods shown.
ETotal returns do not include the effect of the sales charges.
FFees and expenses of any underlying mutual funds or exchange-traded funds (ETFs) are not included in the Fund's expense ratio. The Fund indirectly bears its proportionate share of these expenses. For additional expense information related to investments in Fidelity Central Funds, please refer to the "Investments in Fidelity Central Funds" note found in the Notes to Financial Statements section of the most recent Annual or Semi-Annual report.
GExpense ratios reflect operating expenses of the class. Expenses before reductions do not reflect amounts reimbursed, waived, or reduced through arrangements with the investment adviser, brokerage services, or other offset arrangements, if applicable, and do not represent the amount paid by the class during periods when reimbursements, waivers or reductions occur.
HAmount does not include the portfolio activity of any underlying mutual funds or exchange-traded funds (ETFs).
IPortfolio turnover rate excludes securities received or delivered in-kind.
| Fidelity Advisor® Canada Fund Class M |
| |
| Years ended October 31, | | 2023 | | 2022 | | 2021 | | 2020 | | 2019 |
Selected Per-Share Data | | | | | | | | | | |
| Net asset value, beginning of period | $ | 59.09 | $ | 66.84 | $ | 45.74 | $ | 51.67 | $ | 49.46 |
| Income from Investment Operations | | | | | | | | | | |
Net investment income (loss) A,B | | .41 | | .45 | | .38 | | .47 | | .51 |
| Net realized and unrealized gain (loss) | | - C | | (5.26) | | 21.78 | | (4.36) | | 4.55 |
| Total from investment operations | | .41 | | (4.81) | | 22.16 | | (3.89) | | 5.06 |
| Distributions from net investment income | | (.49) | | (.42) | | (.47) | | (.64) | | (.22) |
| Distributions from net realized gain | | (1.52) | | (2.51) | | (.59) | | (1.40) | | (2.63) |
| Total distributions | | (2.01) | | (2.94) D | | (1.06) | | (2.04) | | (2.85) |
| Net asset value, end of period | $ | 57.49 | $ | 59.09 | $ | 66.84 | $ | 45.74 | $ | 51.67 |
Total Return E,F | | .62% | | (7.32)% | | 49.04% | | (7.95)% | | 11.02% |
Ratios to Average Net Assets B,G,H | | | | | | | | | | |
| Expenses before reductions | | 1.63% | | 1.48% | | 1.40% | | 1.47% | | 1.49% |
| Expenses net of fee waivers, if any | | 1.63% | | 1.48% | | 1.39% | | 1.47% | | 1.48% |
| Expenses net of all reductions | | 1.62% | | 1.48% | | 1.39% | | 1.47% | | 1.48% |
| Net investment income (loss) | | .68% | | .72% | | .64% | | .99% | | 1.03% |
| Supplemental Data | | | | | | | | | | |
| Net assets, end of period (000 omitted) | $ | 6,255 | $ | 6,641 | $ | 7,829 | $ | 5,911 | $ | 8,589 |
Portfolio turnover rate I | | 9% | | 13% | | 7% | | 11% | | 8% J |
ACalculated based on average shares outstanding during the period.
BNet investment income (loss) is affected by the timing of the declaration of dividends by any underlying mutual funds or exchange-traded funds (ETFs). Net investment income (loss) of any mutual funds or ETFs is not included in the Fund's net investment income (loss) ratio.
CAmount represents less than $.005 per share.
DTotal distributions per share do not sum due to rounding.
ETotal returns would have been lower if certain expenses had not been reduced during the applicable periods shown.
FTotal returns do not include the effect of the sales charges.
GFees and expenses of any underlying mutual funds or exchange-traded funds (ETFs) are not included in the Fund's expense ratio. The Fund indirectly bears its proportionate share of these expenses. For additional expense information related to investments in Fidelity Central Funds, please refer to the "Investments in Fidelity Central Funds" note found in the Notes to Financial Statements section of the most recent Annual or Semi-Annual report.
HExpense ratios reflect operating expenses of the class. Expenses before reductions do not reflect amounts reimbursed, waived, or reduced through arrangements with the investment adviser, brokerage services, or other offset arrangements, if applicable, and do not represent the amount paid by the class during periods when reimbursements, waivers or reductions occur.
IAmount does not include the portfolio activity of any underlying mutual funds or exchange-traded funds (ETFs).
JPortfolio turnover rate excludes securities received or delivered in-kind.
| Fidelity Advisor® Canada Fund Class C |
| |
| Years ended October 31, | | 2023 | | 2022 | | 2021 | | 2020 | | 2019 |
Selected Per-Share Data | | | | | | | | | | |
| Net asset value, beginning of period | $ | 58.39 | $ | 65.76 | $ | 44.96 | $ | 50.61 | $ | 48.48 |
| Income from Investment Operations | | | | | | | | | | |
Net investment income (loss) A,B | | .10 | | .14 | | .08 | | .24 | | .29 |
| Net realized and unrealized gain (loss) | | - C | | (5.19) | | 21.46 | | (4.31) | | 4.47 |
| Total from investment operations | | .10 | | (5.05) | | 21.54 | | (4.07) | | 4.76 |
| Distributions from net investment income | | (.05) | | - | | (.15) | | (.18) | | - |
| Distributions from net realized gain | | (1.52) | | (2.32) | | (.59) | | (1.40) | | (2.63) |
| Total distributions | | (1.58) D | | (2.32) | | (.74) | | (1.58) | | (2.63) |
| Net asset value, end of period | $ | 56.91 | $ | 58.39 | $ | 65.76 | $ | 44.96 | $ | 50.61 |
Total Return E,F | | .10% | | (7.79)% | | 48.31% | | (8.39)% | | 10.53% |
Ratios to Average Net Assets B,G,H | | | | | | | | | | |
| Expenses before reductions | | 2.14% | | 1.99% | | 1.90% | | 1.95% | | 1.92% |
| Expenses net of fee waivers, if any | | 2.13% | | 1.98% | | 1.90% | | 1.95% | | 1.92% |
| Expenses net of all reductions | | 2.13% | | 1.98% | | 1.90% | | 1.95% | | 1.91% |
| Net investment income (loss) | | .16% | | .22% | | .14% | | .51% | | .60% |
| Supplemental Data | | | | | | | | | | |
| Net assets, end of period (000 omitted) | $ | 844 | $ | 1,109 | $ | 1,683 | $ | 3,151 | $ | 6,226 |
Portfolio turnover rate I | | 9% | | 13% | | 7% | | 11% | | 8% J |
ACalculated based on average shares outstanding during the period.
BNet investment income (loss) is affected by the timing of the declaration of dividends by any underlying mutual funds or exchange-traded funds (ETFs). Net investment income (loss) of any mutual funds or ETFs is not included in the Fund's net investment income (loss) ratio.
CAmount represents less than $.005 per share.
DTotal distributions per share do not sum due to rounding.
ETotal returns would have been lower if certain expenses had not been reduced during the applicable periods shown.
FTotal returns do not include the effect of the contingent deferred sales charge.
GFees and expenses of any underlying mutual funds or exchange-traded funds (ETFs) are not included in the Fund's expense ratio. The Fund indirectly bears its proportionate share of these expenses. For additional expense information related to investments in Fidelity Central Funds, please refer to the "Investments in Fidelity Central Funds" note found in the Notes to Financial Statements section of the most recent Annual or Semi-Annual report.
HExpense ratios reflect operating expenses of the class. Expenses before reductions do not reflect amounts reimbursed, waived, or reduced through arrangements with the investment adviser, brokerage services, or other offset arrangements, if applicable, and do not represent the amount paid by the class during periods when reimbursements, waivers or reductions occur.
IAmount does not include the portfolio activity of any underlying mutual funds or exchange-traded funds (ETFs).
JPortfolio turnover rate excludes securities received or delivered in-kind.
| Years ended October 31, | | 2023 | | 2022 | | 2021 | | 2020 | | 2019 |
Selected Per-Share Data | | | | | | | | | | |
| Net asset value, beginning of period | $ | 59.79 | $ | 67.62 | $ | 46.26 | $ | 52.21 | $ | 50.02 |
| Income from Investment Operations | | | | | | | | | | |
Net investment income (loss) A,B | | .77 | | .83 | | .74 | | .76 | | .82 |
| Net realized and unrealized gain (loss) | | (.03) C | | (5.33) | | 21.99 | | (4.38) | | 4.58 |
| Total from investment operations | | .74 | | (4.50) | | 22.73 | | (3.62) | | 5.40 |
| Distributions from net investment income | | (.87) | | (.82) | | (.78) | | (.92) | | (.58) |
| Distributions from net realized gain | | (1.52) | | (2.51) | | (.59) | | (1.40) | | (2.63) |
| Total distributions | | (2.39) | | (3.33) | | (1.37) | | (2.33) D | | (3.21) |
| Net asset value, end of period | $ | 58.14 | $ | 59.79 | $ | 67.62 | $ | 46.26 | $ | 52.21 |
Total Return E | | 1.18% | | (6.77)% | | 49.91% | | (7.40)% | | 11.70% |
Ratios to Average Net Assets B,F,G | | | | | | | | | | |
| Expenses before reductions | | 1.05% | | .89% | | .80% | | .88% | | .88% |
| Expenses net of fee waivers, if any | | 1.04% | | .88% | | .80% | | .88% | | .88% |
| Expenses net of all reductions | | 1.04% | | .88% | | .80% | | .88% | | .87% |
| Net investment income (loss) | | 1.25% | | 1.32% | | 1.24% | | 1.58% | | 1.64% |
| Supplemental Data | | | | | | | | | | |
| Net assets, end of period (000 omitted) | $ | 774,062 | $ | 825,488 | $ | 821,617 | $ | 612,716 | $ | 803,629 |
Portfolio turnover rate H | | 9% | | 13% | | 7% | | 11% | | 8% I |
ACalculated based on average shares outstanding during the period.
BNet investment income (loss) is affected by the timing of the declaration of dividends by any underlying mutual funds or exchange-traded funds (ETFs). Net investment income (loss) of any mutual funds or ETFs is not included in the Fund's net investment income (loss) ratio.
CThe amount shown for a share outstanding does not correspond with the aggregate net gain (loss) on investments for the period due to the timing of sales and repurchases of shares in relation to fluctuating market values of the investments of the Fund.
DTotal distributions per share do not sum due to rounding.
ETotal returns would have been lower if certain expenses had not been reduced during the applicable periods shown.
FFees and expenses of any underlying mutual funds or exchange-traded funds (ETFs) are not included in the Fund's expense ratio. The Fund indirectly bears its proportionate share of these expenses. For additional expense information related to investments in Fidelity Central Funds, please refer to the "Investments in Fidelity Central Funds" note found in the Notes to Financial Statements section of the most recent Annual or Semi-Annual report.
GExpense ratios reflect operating expenses of the class. Expenses before reductions do not reflect amounts reimbursed, waived, or reduced through arrangements with the investment adviser, brokerage services, or other offset arrangements, if applicable, and do not represent the amount paid by the class during periods when reimbursements, waivers or reductions occur.
HAmount does not include the portfolio activity of any underlying mutual funds or exchange-traded funds (ETFs).
IPortfolio turnover rate excludes securities received or delivered in-kind.
| Fidelity Advisor® Canada Fund Class I |
| |
| Years ended October 31, | | 2023 | | 2022 | | 2021 | | 2020 | | 2019 |
Selected Per-Share Data | | | | | | | | | | |
| Net asset value, beginning of period | $ | 59.84 | $ | 67.70 | $ | 46.24 | $ | 52.11 | $ | 49.93 |
| Income from Investment Operations | | | | | | | | | | |
Net investment income (loss) A,B | | .78 | | .85 | | .78 | | .79 | | .85 |
| Net realized and unrealized gain (loss) | | (.03) C | | (5.34) | | 22.00 | | (4.39) | | 4.55 |
| Total from investment operations | | .75 | | (4.49) | | 22.78 | | (3.60) | | 5.40 |
| Distributions from net investment income | | (.88) | | (.86) | | (.73) | | (.87) | | (.59) |
| Distributions from net realized gain | | (1.52) | | (2.51) | | (.59) | | (1.40) | | (2.63) |
| Total distributions | | (2.40) | | (3.37) | | (1.32) | | (2.27) | | (3.22) |
| Net asset value, end of period | $ | 58.19 | $ | 59.84 | $ | 67.70 | $ | 46.24 | $ | 52.11 |
Total Return D | | 1.20% | | (6.74)% | | 50.02% | | (7.35)% | | 11.74% |
Ratios to Average Net Assets B,E,F | | | | | | | | | | |
| Expenses before reductions | | 1.03% | | .86% | | .74% | | .81% | | .84% |
| Expenses net of fee waivers, if any | | 1.03% | | .86% | | .74% | | .81% | | .84% |
| Expenses net of all reductions | | 1.03% | | .86% | | .74% | | .81% | | .83% |
| Net investment income (loss) | | 1.27% | | 1.34% | | 1.29% | | 1.65% | | 1.68% |
| Supplemental Data | | | | | | | | | | |
| Net assets, end of period (000 omitted) | $ | 10,571 | $ | 16,165 | $ | 13,724 | $ | 8,392 | $ | 14,507 |
Portfolio turnover rate G | | 9% | | 13% | | 7% | | 11% | | 8% H |
ACalculated based on average shares outstanding during the period.
BNet investment income (loss) is affected by the timing of the declaration of dividends by any underlying mutual funds or exchange-traded funds (ETFs). Net investment income (loss) of any mutual funds or ETFs is not included in the Fund's net investment income (loss) ratio.
CThe amount shown for a share outstanding does not correspond with the aggregate net gain (loss) on investments for the period due to the timing of sales and repurchases of shares in relation to fluctuating market values of the investments of the Fund.
DTotal returns would have been lower if certain expenses had not been reduced during the applicable periods shown.
EFees and expenses of any underlying mutual funds or exchange-traded funds (ETFs) are not included in the Fund's expense ratio. The Fund indirectly bears its proportionate share of these expenses. For additional expense information related to investments in Fidelity Central Funds, please refer to the "Investments in Fidelity Central Funds" note found in the Notes to Financial Statements section of the most recent Annual or Semi-Annual report.
FExpense ratios reflect operating expenses of the class. Expenses before reductions do not reflect amounts reimbursed, waived, or reduced through arrangements with the investment adviser, brokerage services, or other offset arrangements, if applicable, and do not represent the amount paid by the class during periods when reimbursements, waivers or reductions occur.
GAmount does not include the portfolio activity of any underlying mutual funds or exchange-traded funds (ETFs).
HPortfolio turnover rate excludes securities received or delivered in-kind.
| Fidelity Advisor® Canada Fund Class Z |
| |
| Years ended October 31, | | 2023 | | 2022 | | 2021 | | 2020 | | 2019 |
Selected Per-Share Data | | | | | | | | | | |
| Net asset value, beginning of period | $ | 59.55 | $ | 67.38 | $ | 46.11 | $ | 52.07 | $ | 49.94 |
| Income from Investment Operations | | | | | | | | | | |
Net investment income (loss) A,B | | .85 | | .92 | | .82 | | .84 | | .92 |
| Net realized and unrealized gain (loss) | | (.03) C | | (5.33) | | 21.91 | | (4.37) | | 4.53 |
| Total from investment operations | | .82 | | (4.41) | | 22.73 | | (3.53) | | 5.45 |
| Distributions from net investment income | | (.84) | | (.91) | | (.87) | | (1.03) | | (.69) |
| Distributions from net realized gain | | (1.52) | | (2.51) | | (.59) | | (1.40) | | (2.63) |
| Total distributions | | (2.36) | | (3.42) | | (1.46) | | (2.43) | | (3.32) |
| Net asset value, end of period | $ | 58.01 | $ | 59.55 | $ | 67.38 | $ | 46.11 | $ | 52.07 |
Total Return D | | 1.33% | | (6.66)% | | 50.13% | | (7.24)% | | 11.87% |
Ratios to Average Net Assets B,E,F | | | | | | | | | | |
| Expenses before reductions | | .92% | | .75% | | .66% | | .72% | | .72% |
| Expenses net of fee waivers, if any | | .91% | | .75% | | .66% | | .72% | | .72% |
| Expenses net of all reductions | | .91% | | .75% | | .66% | | .72% | | .71% |
| Net investment income (loss) | | 1.38% | | 1.45% | | 1.38% | | 1.74% | | 1.80% |
| Supplemental Data | | | | | | | | | | |
| Net assets, end of period (000 omitted) | $ | 2,692 | $ | 5,843 | $ | 22,010 | $ | 15,221 | $ | 20,496 |
Portfolio turnover rate G | | 9% | | 13% | | 7% | | 11% | | 8% H |
ACalculated based on average shares outstanding during the period.
BNet investment income (loss) is affected by the timing of the declaration of dividends by any underlying mutual funds or exchange-traded funds (ETFs). Net investment income (loss) of any mutual funds or ETFs is not included in the Fund's net investment income (loss) ratio.
CThe amount shown for a share outstanding does not correspond with the aggregate net gain (loss) on investments for the period due to the timing of sales and repurchases of shares in relation to fluctuating market values of the investments of the Fund.
DTotal returns would have been lower if certain expenses had not been reduced during the applicable periods shown.
EFees and expenses of any underlying mutual funds or exchange-traded funds (ETFs) are not included in the Fund's expense ratio. The Fund indirectly bears its proportionate share of these expenses. For additional expense information related to investments in Fidelity Central Funds, please refer to the "Investments in Fidelity Central Funds" note found in the Notes to Financial Statements section of the most recent Annual or Semi-Annual report.
FExpense ratios reflect operating expenses of the class. Expenses before reductions do not reflect amounts reimbursed, waived, or reduced through arrangements with the investment adviser, brokerage services, or other offset arrangements, if applicable, and do not represent the amount paid by the class during periods when reimbursements, waivers or reductions occur.
GAmount does not include the portfolio activity of any underlying mutual funds or exchange-traded funds (ETFs).
HPortfolio turnover rate excludes securities received or delivered in-kind.
For the period ended October 31, 2023
1. Organization.
Fidelity Canada Fund (the Fund) is a fund of Fidelity Investment Trust (the Trust) and is authorized to issue an unlimited number of shares. The Trust is registered under the Investment Company Act of 1940, as amended (the 1940 Act), as an open-end management investment company organized as a Massachusetts business trust. The Fund offers Class A, Class M, Class C, Canada, Class I and Class Z shares, each of which has equal rights as to assets and voting privileges. Class A, Class M, Class C, Class I and Class Z are Fidelity Advisor classes. Each class has exclusive voting rights with respect to matters that affect that class. Class C shares will automatically convert to Class A shares after a holding period of eight years from the initial date of purchase, with certain exceptions.
2. Investments in Fidelity Central Funds.
Funds may invest in Fidelity Central Funds, which are open-end investment companies generally available only to other investment companies and accounts managed by the investment adviser and its affiliates. The Schedule of Investments lists any Fidelity Central Funds held as an investment as of period end, but does not include the underlying holdings of each Fidelity Central Fund. An investing fund indirectly bears its proportionate share of the expenses of the underlying Fidelity Central Funds.
Based on its investment objective, each Fidelity Central Fund may invest or participate in various investment vehicles or strategies that are similar to those of the investing fund. These strategies are consistent with the investment objectives of the investing fund and may involve certain economic risks which may cause a decline in value of each of the Fidelity Central Funds and thus a decline in the value of the investing fund.
| Fidelity Central Fund | Investment Manager | Investment Objective | Investment Practices | Expense RatioA |
| Fidelity Money Market Central Funds | Fidelity Management & Research Company LLC (FMR) | Each fund seeks to obtain a high level of current income consistent with the preservation of capital and liquidity. | Short-term Investments | Less than .005% |
A Expenses expressed as a percentage of average net assets and are as of each underlying Central Fund's most recent annual or semi-annual shareholder report.
A complete unaudited list of holdings for each Fidelity Central Fund is available upon request or at the Securities and Exchange Commission website at www.sec.gov. In addition, the financial statements of the Fidelity Central Funds which contain the significant accounting policies (including investment valuation policies) of those funds, and are not covered by the Report of Independent Registered Public Accounting Firm, are available on the Securities and Exchange Commission website or upon request.
3. Significant Accounting Policies.
The Fund is an investment company and applies the accounting and reporting guidance of the Financial Accounting Standards Board (FASB) Accounting Standards Codification Topic 946 Financial Services - Investment Companies. The financial statements have been prepared in conformity with accounting principles generally accepted in the United States of America (GAAP), which require management to make certain estimates and assumptions at the date of the financial statements. Actual results could differ from those estimates. Subsequent events, if any, through the date that the financial statements were issued have been evaluated in the preparation of the financial statements. The Fund's Schedule of Investments lists any underlying mutual funds or exchange-traded funds (ETFs) but does not include the underlying holdings of these funds. The following summarizes the significant accounting policies of the Fund:
Investment Valuation. Investments are valued as of 4:00 p.m. Eastern time on the last calendar day of the period. The Board of Trustees (the Board) has designated the Fund's investment adviser as the valuation designee responsible for the fair valuation function and performing fair value determinations as needed. The investment adviser has established a Fair Value Committee (the Committee) to carry out the day-to-day fair valuation responsibilities and has adopted policies and procedures to govern the fair valuation process and the activities of the Committee. In accordance with these fair valuation policies and procedures, which have been approved by the Board, the Fund attempts to obtain prices from one or more third party pricing services or brokers to value its investments. When current market prices, quotations or currency exchange rates are not readily available or reliable, investments will be fair valued in good faith by the Committee, in accordance with the policies and procedures. Factors used in determining fair value vary by investment type and may include market or investment specific events, transaction data, estimated cash flows, and market observations of comparable investments. The frequency that the fair valuation procedures are used cannot be predicted and they may be utilized to a significant extent. The Committee manages the Fund's fair valuation practices and maintains the fair valuation policies and procedures. The Fund's investment adviser reports to the Board information regarding the fair valuation process and related material matters.
The Fund categorizes the inputs to valuation techniques used to value its investments into a disclosure hierarchy consisting of three levels as shown below:
Level 1 - unadjusted quoted prices in active markets for identical investments
Level 2 - other significant observable inputs (including quoted prices for similar investments, interest rates, prepayment speeds, etc.)
Level 3 - unobservable inputs (including the Fund's own assumptions based on the best information available)
Valuation techniques used to value the Fund's investments by major category are as follows:
Equity securities, including restricted securities, for which market quotations are readily available, are valued at the last reported sale price or official closing price as reported by a third party pricing service on the primary market or exchange on which they are traded and are categorized as Level 1 in the hierarchy. In the event there were no sales during the day or closing prices are not available, securities are valued at the last quoted bid price or may be valued using the last available price and are generally categorized as Level 2 in the hierarchy. For foreign equity securities, when market or security specific events arise, comparisons to the valuation of American Depositary Receipts (ADRs), futures contracts, ETFs and certain indexes as well as quoted prices for similar securities may be used and would be categorized as Level 2 in the hierarchy. For equity securities, including restricted securities, where observable inputs are limited, assumptions about market activity and risk are used and these securities may be categorized as Level 3 in the hierarchy.
Debt securities, including restricted securities, are valued based on evaluated prices received from third party pricing services or from brokers who make markets in such securities. Corporate bonds are valued by pricing services who utilize matrix pricing which considers yield or price of bonds of comparable quality, coupon, maturity and type or by broker-supplied prices. When independent prices are unavailable or unreliable, debt securities may be valued utilizing pricing methodologies which consider similar factors that would be used by third party pricing services. Debt securities are generally categorized as Level 2 in the hierarchy but may be Level 3 depending on the circumstances.
Investments in open-end mutual funds, including the Fidelity Central Funds, are valued at their closing net asset value (NAV) each business day and are categorized as Level 1 in the hierarchy.
Changes in valuation techniques may result in transfers in or out of an assigned level within the disclosure hierarchy. The aggregate value of investments by input level as of October 31, 2023 is included at the end of the Fund's Schedule of Investments.
Foreign Currency. Certain Funds may use foreign currency contracts to facilitate transactions in foreign-denominated securities. Gains and losses from these transactions may arise from changes in the value of the foreign currency or if the counterparties do not perform under the contracts' terms.
Foreign-denominated assets, including investment securities, and liabilities are translated into U.S. dollars at the exchange rates at period end. Purchases and sales of investment securities, income and dividends received, and expenses denominated in foreign currencies are translated into U.S. dollars at the exchange rate in effect on the transaction date.
The effects of exchange rate fluctuations on investments are included with the net realized and unrealized gain (loss) on investment securities. Other foreign currency transactions resulting in realized and unrealized gain (loss) are disclosed separately.
Investment Transactions and Income. For financial reporting purposes, the Fund's investment holdings and NAV include trades executed through the end of the last business day of the period. The NAV per share for processing shareholder transactions is calculated as of the close of business of the New York Stock Exchange (NYSE), normally 4:00 p.m. Eastern time and includes trades executed through the end of the prior business day. Gains and losses on securities sold are determined on the basis of identified cost. Commissions paid to certain brokers with whom the investment adviser, or its affiliates, places trades on behalf of a fund include an amount in addition to trade execution, which may be rebated back to a fund. Any such rebates are included in net realized gain (loss) on investments in the Statement of Operations. Dividend income is recorded on the ex-dividend date, except for certain dividends from foreign securities where the ex-dividend date may have passed, which are recorded as soon as the Fund is informed of the ex-dividend date. Non-cash dividends included in dividend income, if any, are recorded at the fair market value of the securities received. Income and capital gain distributions from Fidelity Central Funds, if any, are recorded on the ex-dividend date. Certain distributions received by the Fund represent a return of capital or capital gain. The Fund determines the components of these distributions subsequent to the ex-dividend date, based upon receipt of tax filings or other correspondence relating to the underlying investment. These distributions are recorded as a reduction of cost of investments and/or as a realized gain. Interest income is accrued as earned and includes coupon interest and amortization of premium and accretion of discount on debt securities as applicable. Investment income is recorded net of foreign taxes withheld where recovery of such taxes is uncertain.
Class Allocations and Expenses. Investment income, realized and unrealized capital gains and losses, common expenses of a fund, and certain fund-level expense reductions, if any, are allocated daily on a pro-rata basis to each class based on the relative net assets of each class to the total net assets of a fund. Each class differs with respect to transfer agent and distribution and service plan fees incurred, as applicable. Certain expense reductions may also differ by class, if applicable. For the reporting period, the allocated portion of income and expenses to each class as a percent of its average net assets may vary due to the timing of recording these transactions in relation to fluctuating net assets of the classes. Expenses directly attributable to a fund are charged to that fund. Expenses attributable to more than one fund are allocated among the respective funds on the basis of relative net assets or other appropriate methods. Expenses included in the accompanying financial statements reflect the expenses of that fund and do not include any expenses associated with any underlying mutual funds or exchange-traded funds (ETFs). Although not included in a fund's expenses, a fund indirectly bears its proportionate share of these expenses through the net asset value of each underlying mutual fund or exchange-traded fund (ETF). Expense estimates are accrued in the period to which they relate and adjustments are made when actual amounts are known.
Income Tax Information and Distributions to Shareholders. Each year, the Fund intends to qualify as a regulated investment company under Subchapter M of the Internal Revenue Code, including distributing substantially all of its taxable income and realized gains. As a result, no provision for U.S. Federal income taxes is required. As of October 31, 2023, the Fund did not have any unrecognized tax benefits in the financial statements; nor is the Fund aware of any tax positions for which it is reasonably possible that the total amounts of unrecognized tax benefits will significantly change in the next twelve months. The Fund files a U.S. federal tax return, in addition to state and local tax returns as required. The Fund's federal income tax returns are subject to examination by the Internal Revenue Service (IRS) for a period of three fiscal years after they are filed. State and local tax returns may be subject to examination for an additional fiscal year depending on the jurisdiction. Foreign taxes are provided for based on the Fund's understanding of the tax rules and rates that exist in the foreign markets in which it invests.
Distributions are declared and recorded on the ex-dividend date. Income and capital gain distributions are declared separately for each class. Income and capital gain distributions are determined in accordance with income tax regulations, which may differ from GAAP. In addition, the Fund claimed a portion of the payment made to redeeming shareholders as a distribution for income tax purposes.
Capital accounts within the financial statements are adjusted for permanent book-tax differences. These adjustments have no impact on net assets or the results of operations. Capital accounts are not adjusted for temporary book-tax differences which will reverse in a subsequent period.
Book-tax differences are primarily due to foreign currency transactions, passive foreign investment companies (PFIC) and losses deferred due to wash sales.
As of period end, the cost and unrealized appreciation (depreciation) in securities, and derivatives if applicable, for federal income tax purposes were as follows:
| Gross unrealized appreciation | $347,459,833 |
| Gross unrealized depreciation | (28,846,274) |
| Net unrealized appreciation (depreciation) | $318,613,559 |
| Tax Cost | $527,017,253 |
The tax-based components of distributable earnings as of period end were as follows:
| Undistributed ordinary income | $9,640,053 |
| Undistributed long-term capital gain | $18,340,438 |
| Net unrealized appreciation (depreciation) on securities and other investments | $318,609,706 |
The tax character of distributions paid was as follows:
| | October 31, 2023 | October 31, 2022 |
| Ordinary Income | $12,611,012 | $13,229,283 |
| Long-term Capital Gains | 22,355,258 | 30,895,105 |
| Total | $34,966,270 | $44,124,388 |
Restricted Securities (including Private Placements). Funds may invest in securities that are subject to legal or contractual restrictions on resale. These securities generally may be resold in transactions exempt from registration or to the public if the securities are registered. Disposal of these securities may involve time-consuming negotiations and expense, and prompt sale at an acceptable price may be difficult. Information regarding restricted securities held at period end is included at the end of the Schedule of Investments, if applicable.
4. Purchases and Sales of Investments.
Purchases and sales of securities, other than short-term securities and in-kind transactions, as applicable, are noted in the table below.
| | Purchases ($) | Sales ($) |
| Fidelity Canada Fund | 78,095,772 | 139,775,458 |
5. Fees and Other Transactions with Affiliates.
Management Fee. Fidelity Management & Research Company LLC (the investment adviser) and its affiliates provide the Fund with investment management related services for which the Fund pays a monthly management fee. The management fee is the sum of an individual fund fee rate that is based on an annual rate of .45% of the Fund's average net assets and an annualized group fee rate that averaged .23% during the period. The group fee rate is based upon the monthly average net assets of a group of registered investment companies with which the investment adviser has management contracts. The group fee rate decreases as assets under management increase and increases as assets under management decrease. In addition, the management fee is subject to a performance adjustment (up to a maximum of +/- .20% of the Fund's average net assets over a 36 month performance period). The upward or downward adjustment to the management fee is based on the relative investment performance of Canada as compared to its benchmark index, the S&P/TSX Composite Index, over the same 36 month performance period. For the reporting period, the total annual management fee rate, including the performance adjustment, was .81% of the Fund's average net assets. The performance adjustment included in the management fee rate may be higher or lower than the maximum performance adjustment rate due to the difference between the average net assets for the reporting and performance periods.
Distribution and Service Plan Fees. In accordance with Rule 12b-1 of the 1940 Act, the Fund has adopted separate Distribution and Service Plans for each class of shares. Certain classes pay Fidelity Distributors Company LLC (FDC), an affiliate of the investment adviser, separate Distribution and Service Fees, each of which is based on an annual percentage of each class' average net assets. In addition, FDC may pay financial intermediaries for selling shares of the Fund and providing shareholder support services. For the period, the Distribution and Service Fee rates, total fees and amounts retained by FDC were as follows:
| | Distribution Fee | Service Fee | Total Fees | Retained by FDC |
| Class A | - % | .25% | $79,642 | $380 |
| Class M | .25% | .25% | 34,004 | 102 |
| Class C | .75% | .25% | 10,180 | 958 |
| | | | $123,826 | $1,440 |
Sales Load. FDC may receive a front-end sales charge of up to 5.75% for selling Class A shares and 3.50% for selling Class M shares, some of which is paid to financial intermediaries for selling shares of the Fund. Depending on the holding period, FDC may receive contingent deferred sales charges levied on Class A, Class M and Class C redemptions. The deferred sales charges are 1.00% for Class C shares, 1.00% for certain purchases of Class A shares and .25% for certain purchases of Class M shares.
For the period, sales charge amounts retained by FDC were as follows:
| | Retained by FDC |
| Class A | $4,416 |
| Class M | 418 |
Class CA | 107 |
| | $4,941 |
A When Class C shares are initially sold, FDC pays commissions from its own resources to financial intermediaries through which the sales are made.
Transfer Agent Fees. Fidelity Investments Institutional Operations Company LLC (FIIOC), an affiliate of the investment adviser, is the transfer, dividend disbursing and shareholder servicing agent for each class of the Fund. FIIOC receives account fees and asset-based fees that vary according to the account size and type of account of the shareholders of the respective classes of the Fund, except for Class Z. FIIOC receives an asset-based fee of Class Z's average net assets. FIIOC pays for typesetting, printing and mailing of shareholder reports, except proxy statements.
For the period, transfer agent fees for each class were as follows:
| | Amount | % of Class-Level Average Net Assets |
| Class A | $74,400 | .23 |
| Class M | 17,403 | .26 |
| Class C | 2,608 | .26 |
| Canada | 1,458,610 | .17 |
| Class I | 21,450 | .16 |
| Class Z | 1,467 | .04 |
| | $1,575,938 | |
During November 2023, the Board approved a change in the transfer agent fees effective December 1, 2023 to a fixed annual rate of class-level average net assets as follows:
| | % of Class-Level Average Net Assets |
| Class A | 0.2000 |
| Class M | 0.2000 |
| Class C | 0.2000 |
| Canada | 0.1694 |
| Class I | 0.1500 |
Accounting Fees. Fidelity Service Company, Inc. (FSC), an affiliate of the investment adviser, maintains the Fund's accounting records. The accounting fee is based on the level of average net assets for each month. For the period, the fees were equivalent to the following annual rates:
| | % of Average Net Assets |
| Fidelity Canada Fund | .05 |
During November 2023, the Board approved a change in the accounting fees effective December 1, 2023 to a fixed annual rate of average net assets as follows:
| | % of Average Net Assets |
| Fidelity Canada Fund | 0.0450 |
Interfund Trades. Funds may purchase from or sell securities to other Fidelity Funds under procedures adopted by the Board. The procedures have been designed to ensure these interfund trades are executed in accordance with Rule 17a-7 of the 1940 Act. Any interfund trades are included within the respective purchases and sales amounts shown in the Purchases and Sales of Investments note. Interfund trades during the period are noted in the table below.
| | Purchases ($) | Sales ($) | Realized Gain (Loss) ($) |
| Fidelity Canada Fund | 441,130 | 3,356,574 | (112,725) |
6. Committed Line of Credit.
Certain Funds participate with other funds managed by the investment adviser or an affiliate in a $4.25 billion credit facility (the "line of credit") to be utilized for temporary or emergency purposes to fund shareholder redemptions or for other short-term liquidity purposes. The participating funds have agreed to pay commitment fees on their pro-rata portion of the line of credit, which are reflected in Miscellaneous expenses on the Statement of Operations, and are listed below. During the period, there were no borrowings on this line of credit.
| | Amount |
| Fidelity Canada Fund | $1,645 |
7. Security Lending.
Funds lend portfolio securities from time to time in order to earn additional income. Lending agents are used, including National Financial Services (NFS), an affiliate of the investment adviser. Pursuant to a securities lending agreement, NFS will receive a fee, which is capped at 9.9% of a fund's daily lending revenue, for its services as lending agent. A fund may lend securities to certain qualified borrowers, including NFS. On the settlement date of the loan, a fund receives collateral (in the form of U.S. Treasury obligations, letters of credit and/or cash) against the loaned securities and maintains collateral in an amount not less than 100% of the market value of the loaned securities during the period of the loan. The market value of the loaned securities is determined at the close of business of a fund and any additional required collateral is delivered to a fund on the next business day. A fund or borrower may terminate the loan at any time, and if the borrower defaults on its obligation to return the securities loaned because of insolvency or other reasons, a fund may apply collateral received from the borrower against the obligation. A fund may experience delays and costs in recovering the securities loaned. Any cash collateral received is invested in the Fidelity Securities Lending Cash Central Fund. Any loaned securities are identified as such in the Schedule of Investments, and the value of loaned securities and cash collateral at period end, as applicable, are presented in the Statement of Assets and Liabilities. Security lending income represents the income earned on investing cash collateral, less rebates paid to borrowers and any lending agent fees associated with the loan, plus any premium payments received for lending certain types of securities. Security lending income is presented in the Statement of Operations as a component of income from Fidelity Central Funds. Affiliated security lending activity, if any, was as follows:
| | Total Security Lending Fees Paid to NFS | Security Lending Income From Securities Loaned to NFS | Value of Securities Loaned to NFS at Period End |
| Fidelity Canada Fund | $17,938 | $- | $- |
8. Expense Reductions.
Through arrangements with each class' transfer agent, credits realized as a result of certain uninvested cash balances were used to reduce the Fund's expenses. During the period, transfer agent credits reduced each class' expenses as noted in the table below.
| | Expense reduction |
| Class A | $104 |
| Class M | 793 |
| Class C | 11 |
| | $908 |
In addition, during the period the investment adviser or an affiliate reimbursed and/or waived a portion of fund-level operating expenses in the amount of $54,274.
9. Distributions to Shareholders.
Distributions to shareholders of each class were as follows:
| | Year ended October 31, 2023 | Year ended October 31, 2022 |
| Fidelity Canada Fund | | |
| Distributions to shareholders | | |
| Class A | $ 1,149,850 | $1,521,087 |
| Class M | 223,562 | 339,044 |
| Class C | 28,556 | 58,947 |
| Canada | 32,768,937 | 40,254,541 |
| Class I | 643,345 | 818,871 |
| Class Z | 152,020 | 1,131,898 |
Total | $34,966,270 | $44,124,388 |
10. Share Transactions.
Share transactions for each class were as follows and may contain in-kind transactions, automatic conversions between classes or exchanges between affiliated funds:
| | Shares | Shares | Dollars | Dollars |
| | Year ended October 31, 2023 | Year ended October 31, 2022 | Year ended October 31, 2023 | Year ended October 31, 2022 |
| Fidelity Canada Fund | | | | |
| Class A | | | | |
| Shares sold | 21,447 | 91,502 | $1,305,304 | $5,737,202 |
| Reinvestment of distributions | 18,742 | 23,772 | 1,102,198 | 1,449,851 |
| Shares redeemed | (79,708) | (73,975) | (4,871,865) | (4,692,234) |
| Net increase (decrease) | (39,519) | 41,299 | $(2,464,363) | $2,494,819 |
| Class M | | | | |
| Shares sold | 3,145 | 6,970 | $189,947 | $443,908 |
| Reinvestment of distributions | 3,795 | 5,557 | 222,444 | 337,743 |
| Shares redeemed | (10,510) | (17,269) | (631,738) | (1,094,130) |
| Net increase (decrease) | (3,570) | (4,742) | $(219,347) | $(312,479) |
| Class C | | | | |
| Shares sold | 1,809 | 3,877 | $108,691 | $245,296 |
| Reinvestment of distributions | 490 | 977 | 28,556 | 58,947 |
| Shares redeemed | (6,450) | (11,456) | (390,489) | (711,381) |
| Net increase (decrease) | (4,151) | (6,602) | $(253,242) | $(407,138) |
| Canada | | | | |
| Shares sold | 602,311 | 2,660,313 | $36,851,268 | $168,972,527 |
| Reinvestment of distributions | 524,933 | 619,960 | 30,971,047 | 37,922,967 |
| Shares redeemed | (1,620,750) | (1,624,197) | (99,399,772) | (101,772,732) |
| Net increase (decrease) | (493,506) | 1,656,076 | $(31,577,457) | $105,122,762 |
| Class I | | | | |
| Shares sold | 65,023 | 238,697 | $3,953,919 | $15,537,489 |
| Reinvestment of distributions | 10,141 | 12,737 | 598,723 | 779,507 |
| Shares redeemed | (163,668) | (183,998) | (10,006,385) | (11,689,703) |
| Net increase (decrease) | (88,504) | 67,436 | $(5,453,743) | $4,627,293 |
| Class Z | | | | |
| Shares sold | 28,551 | 156,264 | $1,711,374 | $10,087,519 |
| Reinvestment of distributions | 2,264 | 18,285 | 133,088 | 1,112,618 |
| Shares redeemed | (82,521) | (403,081) | (5,051,192) | (22,954,436) |
| Net increase (decrease) | (51,706) | (228,532) | $(3,206,730) | $(11,754,299) |
11. Other.
A fund's organizational documents provide former and current trustees and officers with a limited indemnification against liabilities arising in connection with the performance of their duties to the fund. In the normal course of business, a fund may also enter into contracts that provide general indemnifications. A fund's maximum exposure under these arrangements is unknown as this would be dependent on future claims that may be made against a fund. The risk of material loss from such claims is considered remote.
12. Risk and Uncertainties.
Many factors affect a fund's performance. Developments that disrupt global economies and financial markets, such as pandemics, epidemics, outbreaks of infectious diseases, war, terrorism, and environmental disasters, may significantly affect a fund's investment performance. The effects of these developments to a fund will be impacted by the types of securities in which a fund invests, the financial condition, industry, economic sector, and geographic location of an issuer, and a fund's level of investment in the securities of that issuer. Significant concentrations in security types, issuers, industries, sectors, and geographic locations may magnify the factors that affect a fund's performance.
Average annual total return reflects the change in the value of an investment, assuming reinvestment of distributions from dividend income and capital gains (the profits earned upon the sale of securities that have grown in value, if any) and assuming a constant rate of performance each year. The hypothetical investment and the average annual total returns do not reflect the deduction of taxes that a shareholder would pay on fund distributions or the redemption of fund shares. During periods of reimbursement by Fidelity, a fund's total return will be greater than it would be had the reimbursement not occurred. How a fund did yesterday is no guarantee of how it will do tomorrow.
| Average Annual Total Returns |
| | | | |
Periods ended October 31, 2023 | Past 1 year | Past 5 years | Past 10 years |
Class A (incl. 5.75% sales charge) | 16.85% | 3.46% | 3.55% |
Class M (incl. 3.50% sales charge) | 19.31% | 3.63% | 3.47% |
Class C (incl. contingent deferred sales charge) | 22.06% | 3.92% | 3.55% |
| Fidelity® China Region Fund | 24.34% | 5.01% | 4.49% |
| Class I | 24.40% | 5.01% | 4.49% |
| Class Z | 24.55% | 5.15% | 4.56% |
Class C shares' contingent deferred sales charges included in the past one year, past five years and past ten years total return figures are 1%, 0% and 0%, respectively.
The initial offering of Class Z shares took place on October 2, 2018. Returns prior to October 2, 2018, are those of Class I.
| $10,000 Over 10 Years |
| |
Let's say hypothetically that $10,000 was invested in Fidelity® China Region Fund, a class of the fund, on October 31, 2013. The chart shows how the value of your investment would have changed, and also shows how the MSCI Golden Dragon Index performed over the same period. |
|
|
Fidelity® China Region Fund
Market Recap:
International (non-U.S.) equities gained 12.27% for the 12 months ending October 31, 2023, according to the MSCI ACWI (All Country World Index) ex USA Index, as global economic expansion and a slowing in the pace of inflation in some markets provided a favorable backdrop for risk assets. After returning -15.86% in 2022, the index's upturn has been largely driven by a narrow set of companies in the information technology and communication services sectors, in part due to excitement for generative artificial intelligence applications. The index gained 14.07% year to date through July, including strong gains in both June (+4.50%) and July (+4.07%). The rally for international equities sputtered the next three months (-11.33%) amid a stalling pattern in disinflationary trends, heightened global recession and geopolitical risks, soaring yields on longer-term U.S. government bonds and particularly weak economic conditions in the eurozone and China. The three-month decline left non-U.S. stocks up 1.15% year to date through October. Currency fluctuation also helped bolster non-U.S. equity performance overall. For the full 12 months, nearly all regions advanced, with Europe ex U.K. (+18%) and Japan (+17%) leading, whereas Canada (-0.38%) lagged by the widest margin. Each of the 11 sectors advanced, with information technology (+21%) and consumer discretionary (+19%) leading the way. Energy and industrials each rose about 14%. Conversely, four defensive-oriented sectors lagged by the widest margin: real estate (+4%), health care (+6%), consumer staples (+7%) and utilities (+8%).
Comments from Co-Managers Peifang Sun and Ivan Xie:
For the fiscal year ending October 31, 2023, the fund's share classes (excluding sales charges, if applicable) gained about 23% to 25%, versus 21.06% for both the Fidelity China Region Fund Linked Index and the broad-based MSCI Golden Dragon Net MA Index. From a country standpoint, security selection in China and Taiwan, along with stock picking and an underweight in Hong Kong, contributed to the fund's performance versus the benchmark. By sector, the biggest relative contributor was security selection in communication services. Stock picks and an overweight in information technology, primarily within the semiconductors & semiconductor equipment industry, and stock selection in consumer discretionary also boosted relative performance. The top individual relative contributor was an overweight in Zijin Mining (+66%), a stock that was among the fund's biggest holdings this period. The second-largest relative contributor was an overweight in Taiwan Semiconductor (+37%), the fund's top holding. An overweight in NetEase (+102%), the portfolio's sixth-largest holding at period end, also helped. In contrast, from a regional standpoint, a non-benchmark allocation to the U.K. detracted modestly from the fund's relative result. By sector, the biggest detractor was security selection in financials. Positioning in the health care and energy sectors also hurt our relative result. Lastly, the fund's position in cash was a notable detractor. The biggest individual relative detractors were overweight positions in Shenzhen YUTO Packaging Technology (-17%) and Meituan (-11%). Meituan was one of the fund's largest holdings. Untimely positioning in MediaTek (+51%) also detracted, as we decreased our stake during the period. Notable changes in positioning include decreased exposure to cash and Hong Kong. By sector, meaningful changes include increased exposure to communication services and a lower allocation to materials.
The views expressed above reflect those of the portfolio manager(s) only through the end of the period as stated on the cover of this report and do not necessarily represent the views of Fidelity or any other person in the Fidelity organization. Any such views are subject to change at any time based upon market or other conditions and Fidelity disclaims any responsibility to update such views. These views may not be relied on as investment advice and, because investment decisions for a Fidelity fund are based on numerous factors, may not be relied on as an indication of trading intent on behalf of any Fidelity fund.
Fidelity® China Region Fund
Top Holdings (% of Fund's net assets) |
| |
| Taiwan Semiconductor Manufacturing Co. Ltd. (Semiconductors & Semiconductor Equipment) | 20.4 | |
| Tencent Holdings Ltd. (Interactive Media & Services) | 9.9 | |
| Alibaba Group Holding Ltd. (Broadline Retail) | 6.5 | |
| AIA Group Ltd. (Insurance) | 4.6 | |
| Meituan Class B (Hotels, Restaurants & Leisure) | 3.4 | |
| NetEase, Inc. (Entertainment) | 2.8 | |
| China Construction Bank Corp. (H Shares) (Banks) | 2.7 | |
| Industrial & Commercial Bank of China Ltd. (H Shares) (Banks) | 2.6 | |
| PDD Holdings, Inc. ADR (Broadline Retail) | 2.5 | |
| Kweichow Moutai Co. Ltd. (A Shares) (Beverages) | 2.2 | |
| | 57.6 | |
| |
| Market Sectors (% of Fund's net assets) |
| |
| Information Technology | 27.1 | |
| Consumer Discretionary | 21.8 | |
| Financials | 14.5 | |
| Communication Services | 14.4 | |
| Health Care | 5.6 | |
| Industrials | 4.6 | |
| Consumer Staples | 4.3 | |
| Materials | 3.0 | |
| Energy | 1.8 | |
| Real Estate | 1.4 | |
| |
Market Sectors may include more than one industry category.
The Fund may invest up to 35% of its total assets in any industry that represents more than 20% of the Hong Kong, Taiwanese and Chinese markets. As of October 31, 2023, the Fund did not have more than 25% of its total assets invested in any one industry.
Asset Allocation (% of Fund's net assets) |
|
|
Geographic Diversification (% of Fund's net assets) |
|
* Includes Short-Term investments and Net Other Assets (Liabilities). Percentages are adjusted for the effect of derivatives, if applicable. |
| |
Fidelity® China Region Fund
Showing Percentage of Net Assets
| Common Stocks - 95.9% |
| | | Shares | Value ($) |
| COMMUNICATION SERVICES - 13.4% | | | |
| Entertainment - 3.1% | | | |
| NetEase, Inc. | | 1,190,900 | 25,487,107 |
| Sea Ltd. ADR (a) | | 62,600 | 2,610,420 |
| | | | 28,097,527 |
| Interactive Media & Services - 10.3% | | | |
| JOYY, Inc. ADR | | 94,531 | 3,679,147 |
| Tencent Holdings Ltd. | | 2,387,700 | 88,365,807 |
| | | | 92,044,954 |
TOTAL COMMUNICATION SERVICES | | | 120,142,481 |
| CONSUMER DISCRETIONARY - 21.8% | | | |
| Automobile Components - 0.6% | | | |
| Fuyao Glass Industries Group Co. Ltd. (H Shares) (b) | | 1,255,200 | 5,722,572 |
| Automobiles - 2.7% | | | |
| BYD Co. Ltd. (H Shares) | | 290,000 | 8,818,937 |
| Guangzhou Automobile Group Co. Ltd. (H Shares) | | 9,646,000 | 4,519,132 |
| Li Auto, Inc. ADR (a) | | 309,700 | 10,470,957 |
| | | | 23,809,026 |
| Broadline Retail - 9.0% | | | |
| Alibaba Group Holding Ltd. (a) | | 5,675,200 | 58,426,633 |
| PDD Holdings, Inc. ADR (a) | | 220,105 | 22,323,049 |
| | | | 80,749,682 |
| Diversified Consumer Services - 0.5% | | | |
| New Oriental Education & Technology Group, Inc. sponsored ADR (a) | | 69,100 | 4,525,359 |
| Hotels, Restaurants & Leisure - 6.1% | | | |
| Galaxy Entertainment Group Ltd. | | 1,317,000 | 7,403,471 |
| Meituan Class B (a)(b) | | 2,163,358 | 30,665,630 |
| Trip.com Group Ltd. (a) | | 144,000 | 4,907,754 |
| Trip.com Group Ltd. ADR (a) | | 330,400 | 11,233,600 |
| | | | 54,210,455 |
| Household Durables - 1.0% | | | |
| Haier Smart Home Co. Ltd. (A Shares) | | 2,981,127 | 9,059,627 |
| Textiles, Apparel & Luxury Goods - 1.9% | | | |
| Li Ning Co. Ltd. | | 1,458,000 | 4,467,901 |
| LVMH Moet Hennessy Louis Vuitton SE | | 9,600 | 6,872,933 |
| Shenzhou International Group Holdings Ltd. | | 555,300 | 5,454,419 |
| | | | 16,795,253 |
TOTAL CONSUMER DISCRETIONARY | | | 194,871,974 |
| CONSUMER STAPLES - 4.3% | | | |
| Beverages - 2.7% | | | |
| Kweichow Moutai Co. Ltd. (A Shares) | | 84,845 | 19,544,405 |
| Wuliangye Yibin Co. Ltd. (A Shares) | | 232,360 | 4,954,170 |
| | | | 24,498,575 |
| Food Products - 0.8% | | | |
| Uni-President Enterprises Corp. | | 3,562,000 | 7,467,137 |
| Personal Care Products - 0.8% | | | |
| Proya Cosmetics Co. Ltd.: | | | |
| (A Shares) | | 374,164 | 5,313,792 |
| (A Shares) | | 109,100 | 1,549,414 |
| | | | 6,863,206 |
TOTAL CONSUMER STAPLES | | | 38,828,918 |
| ENERGY - 1.8% | | | |
| Energy Equipment & Services - 1.6% | | | |
| China Oilfield Services Ltd. (H Shares) | | 12,112,000 | 14,320,256 |
| Oil, Gas & Consumable Fuels - 0.2% | | | |
| PetroChina Co. Ltd. (H Shares) | | 3,152,000 | 2,057,360 |
TOTAL ENERGY | | | 16,377,616 |
| FINANCIALS - 14.5% | | | |
| Banks - 6.2% | | | |
| China Construction Bank Corp. (H Shares) | | 42,977,610 | 24,306,335 |
| E.SUN Financial Holdings Co. Ltd. | | 11,208,185 | 8,252,271 |
| Industrial & Commercial Bank of China Ltd. (H Shares) | | 48,698,000 | 23,338,262 |
| | | | 55,896,868 |
| Capital Markets - 0.9% | | | |
| Hong Kong Exchanges and Clearing Ltd. | | 227,000 | 7,941,062 |
| Financial Services - 1.0% | | | |
| Far East Horizon Ltd. | | 13,122,500 | 9,233,472 |
| Insurance - 6.4% | | | |
| AIA Group Ltd. | | 4,747,000 | 41,222,037 |
| China Pacific Insurance (Group) Co. Ltd. (H Shares) | | 2,937,000 | 7,234,918 |
| Ping An Insurance Group Co. of China Ltd. (H Shares) | | 955,500 | 4,846,751 |
| Prudential PLC | | 359,500 | 3,759,072 |
| | | | 57,062,778 |
TOTAL FINANCIALS | | | 130,134,180 |
| HEALTH CARE - 5.4% | | | |
| Biotechnology - 1.5% | | | |
| Innovent Biologics, Inc. (a)(b) | | 1,021,000 | 6,016,920 |
| Zai Lab Ltd. (a) | | 986,000 | 2,516,327 |
| Zai Lab Ltd. ADR (a)(c) | | 182,900 | 4,609,080 |
| | | | 13,142,327 |
| Health Care Equipment & Supplies - 1.4% | | | |
| MicroTech Medical (Hangzhou) Co. Ltd. (H Shares) (a)(b) | | 2,176,600 | 1,176,411 |
| Shenzhen Mindray Bio-Medical Electronics Co. Ltd. (A Shares) (a) | | 281,510 | 11,005,191 |
| | | | 12,181,602 |
| Life Sciences Tools & Services - 1.8% | | | |
| Pharmaron Beijing Co. Ltd. (H Shares) (b) | | 922,350 | 2,201,769 |
| WuXi AppTec Co. Ltd. (H Shares) (b)(c) | | 346,500 | 4,163,733 |
| Wuxi Biologics (Cayman), Inc. (a)(b) | | 1,622,500 | 10,088,286 |
| | | | 16,453,788 |
| Pharmaceuticals - 0.7% | | | |
| Asymchem Laboratories Tianjin Co. Ltd. (H Shares) (b)(c) | | 481,440 | 6,260,803 |
TOTAL HEALTH CARE | | | 48,038,520 |
| INDUSTRIALS - 4.6% | | | |
| Aerospace & Defense - 0.1% | | | |
| Space Exploration Technologies Corp. Class A (a)(d)(e) | | 10,000 | 810,000 |
| Air Freight & Logistics - 0.9% | | | |
| Milkyway Chemical Supply Chain Service Co. Ltd. (A Shares) | | 308,329 | 2,741,086 |
| ZTO Express, Inc. sponsored ADR | | 220,200 | 5,190,114 |
| | | | 7,931,200 |
| Construction & Engineering - 0.6% | | | |
| China State Construction International Holdings Ltd. | | 5,064,000 | 5,424,254 |
| Electrical Equipment - 0.3% | | | |
| Sungrow Power Supply Co. Ltd. (A Shares) | | 191,634 | 2,208,808 |
| Machinery - 2.2% | | | |
| Shenzhen Inovance Technology Co. Ltd. (A Shares) | | 546,613 | 4,519,294 |
| Sinotruk Hong Kong Ltd. | | 2,086,000 | 3,928,988 |
| Techtronic Industries Co. Ltd. | | 454,500 | 4,149,369 |
| Weichai Power Co. Ltd. (H Shares) | | 3,298,000 | 4,936,519 |
| Zhejiang Sanhua Intelligent Controls Co. Ltd. (A Shares) | | 693,784 | 2,539,719 |
| | | | 20,073,889 |
| Professional Services - 0.5% | | | |
| Centre Testing International Group Co. Ltd. (A Shares) | | 2,100,000 | 4,345,951 |
TOTAL INDUSTRIALS | | | 40,794,102 |
| INFORMATION TECHNOLOGY - 25.9% | | | |
| Electronic Equipment, Instruments & Components - 1.2% | | | |
| E Ink Holdings, Inc. | | 366,000 | 1,902,877 |
| Hon Hai Precision Industry Co. Ltd. (Foxconn) | | 2,213,000 | 6,600,085 |
| Yageo Corp. | | 130,000 | 2,117,828 |
| | | | 10,620,790 |
| IT Services - 0.3% | | | |
| Vnet Group, Inc. ADR (a) | | 913,783 | 2,937,812 |
| Semiconductors & Semiconductor Equipment - 24.2% | | | |
| Advanced Micro-Fabrication Equipment, Inc., China (A Shares) | | 213,991 | 5,013,260 |
| eMemory Technology, Inc. | | 159,481 | 9,984,020 |
| MediaTek, Inc. | | 197,000 | 5,137,614 |
| Micron Technology, Inc. | | 102,100 | 6,827,427 |
| NAURA Technology Group Co. Ltd. | | 80,500 | 2,823,838 |
| Parade Technologies Ltd. | | 113,000 | 3,702,065 |
| Taiwan Semiconductor Manufacturing Co. Ltd. | | 11,192,000 | 182,652,773 |
| | | | 216,140,997 |
| Software - 0.2% | | | |
| LongShine Technology Group Co. Ltd. (A Shares) | | 808,100 | 2,066,456 |
TOTAL INFORMATION TECHNOLOGY | | | 231,766,055 |
| MATERIALS - 3.0% | | | |
| Chemicals - 0.1% | | | |
| Weihai Guangwei Composites Co. Ltd. (A Shares) | | 169,692 | 594,432 |
| Construction Materials - 0.2% | | | |
| West China Cement Ltd. | | 24,942,000 | 2,265,783 |
| Containers & Packaging - 0.6% | | | |
| Shenzhen YUTO Packaging Technology Co. Ltd. (A Shares) | | 1,464,571 | 5,258,507 |
| Metals & Mining - 2.1% | | | |
| Zijin Mining Group Co. Ltd. (H Shares) | | 12,278,000 | 18,992,984 |
TOTAL MATERIALS | | | 27,111,706 |
| REAL ESTATE - 1.2% | | | |
| Real Estate Management & Development - 1.2% | | | |
| China Resources Mixc Lifestyle Services Ltd. (b) | | 1,142,000 | 4,455,420 |
| KE Holdings, Inc. ADR | | 402,170 | 5,915,921 |
| | | | 10,371,341 |
| TOTAL COMMON STOCKS (Cost $782,014,049) | | | 858,436,893 |
| | | | |
| Preferred Stocks - 2.6% |
| | | Shares | Value ($) |
| Convertible Preferred Stocks - 1.4% | | | |
| COMMUNICATION SERVICES - 1.0% | | | |
| Interactive Media & Services - 1.0% | | | |
| ByteDance Ltd. Series E1 (a)(d)(e) | | 38,752 | 9,054,405 |
| | | | |
| HEALTH CARE - 0.2% | | | |
| Health Care Providers & Services - 0.2% | | | |
| dMed Biopharmaceutical Co. Ltd. Series C (a)(d)(e) | | 275,211 | 1,620,993 |
| | | | |
| REAL ESTATE - 0.2% | | | |
| Real Estate Management & Development - 0.2% | | | |
| ZKH Group Ltd. Series F (d)(e) | | 3,131,343 | 1,158,597 |
| | | | |
| TOTAL CONVERTIBLE PREFERRED STOCKS | | | 11,833,995 |
| Nonconvertible Preferred Stocks - 1.2% | | | |
| INFORMATION TECHNOLOGY - 1.2% | | | |
| Technology Hardware, Storage & Peripherals - 1.2% | | | |
| Samsung Electronics Co. Ltd. | | 273,930 | 10,920,368 |
| | | | |
| TOTAL PREFERRED STOCKS (Cost $21,962,567) | | | 22,754,363 |
| | | | |
| Money Market Funds - 2.2% |
| | | Shares | Value ($) |
| Fidelity Cash Central Fund 5.40% (f) | | 13,691,212 | 13,693,950 |
| Fidelity Securities Lending Cash Central Fund 5.40% (f)(g) | | 6,127,021 | 6,127,633 |
| TOTAL MONEY MARKET FUNDS (Cost $19,821,583) | | | 19,821,583 |
| | | | |
| TOTAL INVESTMENT IN SECURITIES - 100.7% (Cost $823,798,199) | 901,012,839 |
NET OTHER ASSETS (LIABILITIES) - (0.7)% | (6,054,296) |
| NET ASSETS - 100.0% | 894,958,543 |
| | |
Legend
| (b) | Security exempt from registration under Rule 144A of the Securities Act of 1933. These securities may be resold in transactions exempt from registration, normally to qualified institutional buyers. At the end of the period, the value of these securities amounted to $70,751,544 or 7.9% of net assets. |
| (c) | Security or a portion of the security is on loan at period end. |
| (d) | Restricted securities (including private placements) - Investment in securities not registered under the Securities Act of 1933 (excluding 144A issues). At the end of the period, the value of restricted securities (excluding 144A issues) amounted to $12,643,995 or 1.4% of net assets. |
| (f) | Affiliated fund that is generally available only to investment companies and other accounts managed by Fidelity Investments. The rate quoted is the annualized seven-day yield of the fund at period end. A complete unaudited listing of the fund's holdings as of its most recent quarter end is available upon request. In addition, each Fidelity Central Fund's financial statements, which are not covered by the Fund's Report of Independent Registered Public Accounting Firm, are available on the SEC's website or upon request. |
| (g) | Investment made with cash collateral received from securities on loan. |
| Additional information on each restricted holding is as follows: |
| Security | Acquisition Date | Acquisition Cost ($) |
| ByteDance Ltd. Series E1 | 11/18/20 | 4,246,219 |
| | | |
| dMed Biopharmaceutical Co. Ltd. Series C | 12/01/20 | 3,908,863 |
| | | |
| Space Exploration Technologies Corp. Class A | 2/16/21 | 419,990 |
| | | |
| ZKH Group Ltd. Series F | 2/24/22 | 1,771,978 |
| | | |
Affiliated Central Funds
Fiscal year to date information regarding the Fund's investments in Fidelity Central Funds, including the ownership percentage, is presented below.
| Affiliate | Value, beginning of period ($) | Purchases ($) | Sales Proceeds ($) | Dividend Income ($) | Realized Gain (loss) ($) | Change in Unrealized appreciation (depreciation) ($) | Value, end of period ($) | % ownership, end of period |
| Fidelity Cash Central Fund 5.40% | 31,370,924 | 231,802,061 | 249,479,035 | 1,088,531 | - | - | 13,693,950 | 0.0% |
| Fidelity Securities Lending Cash Central Fund 5.40% | 4,494,305 | 121,208,651 | 119,575,323 | 87,862 | - | - | 6,127,633 | 0.0% |
| Total | 35,865,229 | 353,010,712 | 369,054,358 | 1,176,393 | - | - | 19,821,583 | |
| | | | | | | | | |
Amounts in the dividend income column in the above table include any capital gain distributions from underlying funds, which are presented in the corresponding line item in the Statement of Operations, if applicable.
Amounts in the dividend income column for Fidelity Securities Lending Cash Central Fund represents the income earned on investing cash collateral, less rebates paid to borrowers and any lending agent fees associated with the loan, plus any premium payments received for lending certain types of securities.
Amounts included in the purchases and sales proceeds columns may include in-kind transactions, if applicable.
Investment Valuation
The following is a summary of the inputs used, as of October 31, 2023, involving the Fund's assets and liabilities carried at fair value. The inputs or methodology used for valuing securities may not be an indication of the risk associated with investing in those securities. For more information on valuation inputs, and their aggregation into the levels used below, please refer to the Investment Valuation section in the accompanying Notes to Financial Statements.
| Valuation Inputs at Reporting Date: |
| Description | Total ($) | Level 1 ($) | Level 2 ($) | Level 3 ($) |
Investments in Securities: | | | | |
|
| Equities: | | | | |
Communication Services | 129,196,886 | 6,289,567 | 113,852,914 | 9,054,405 |
Consumer Discretionary | 194,871,974 | 48,552,965 | 146,319,009 | - |
Consumer Staples | 38,828,918 | - | 38,828,918 | - |
Energy | 16,377,616 | - | 16,377,616 | - |
Financials | 130,134,180 | - | 130,134,180 | - |
Health Care | 49,659,513 | 4,609,080 | 43,429,440 | 1,620,993 |
Industrials | 40,794,102 | 5,190,114 | 34,793,988 | 810,000 |
Information Technology | 242,686,423 | 9,765,239 | 232,921,184 | - |
Materials | 27,111,706 | - | 27,111,706 | - |
Real Estate | 11,529,938 | 5,915,921 | 4,455,420 | 1,158,597 |
|
| Money Market Funds | 19,821,583 | 19,821,583 | - | - |
| Total Investments in Securities: | 901,012,839 | 100,144,469 | 788,224,375 | 12,643,995 |
The following is a reconciliation of Investments in Securities for which Level 3 inputs were used in determining value:
| |
| Investments in Securities: | |
| Communication Services | | | |
| Beginning Balance | $ | 6,084,839 | |
| Net Realized Gain (Loss) on Investment Securities | | - | |
| Net Unrealized Gain (Loss) on Investment Securities | | 2,969,566 | |
| Cost of Purchases | | - | |
| Proceeds of Sales | | - | |
| Amortization/Accretion | | - | |
| Transfers into Level 3 | | - | |
| Transfers out of Level 3 | | - | |
| Ending Balance | $ | 9,054,405 | |
| The change in unrealized gain (loss) for the period attributable to Level 3 securities held at October 31, 2023 | $ | 2,969,566 | |
| Other Investments in Securities | | | |
| Beginning Balance | $ | 4,940,670 | |
| Net Realized Gain (Loss) on Investment Securities | | - | |
| Net Unrealized Gain (Loss) on Investment Securities | | (1,351,080) | |
| Cost of Purchases | | - | |
| Proceeds of Sales | | - | |
| Amortization/Accretion | | - | |
| Transfers into Level 3 | | - | |
| Transfers out of Level 3 | | - | |
| Ending Balance | $ | 3,589,590 | |
| The change in unrealized gain (loss) for the period attributable to Level 3 securities held at October 31, 2023 | $ | (1,351,080) | |
| The information used in the above reconciliation represents fiscal year to date activity for any Investments in Securities identified as using Level 3 inputs at either the beginning or the end of the current fiscal period. Cost of purchases and proceeds of sales may include securities received and/or delivered through in-kind transactions, corporate actions or exchanges. Transfers into Level 3 were attributable to a lack of observable market data resulting from decreases in market activity, decreases in liquidity, security restructurings or corporate actions. Transfers out of Level 3 were attributable to observable market data becoming available for those securities. Transfers in or out of Level 3 represent the beginning value of any Security or Instrument where a change in the pricing level occurred from the beginning to the end of the period. Realized and unrealized gains (losses) disclosed in the reconciliation are included in Net Gain (Loss) on the Fund's Statement of Operations. | |
Fidelity® China Region Fund
| Statement of Assets and Liabilities |
| | | | October 31, 2023 |
| | | | | |
| Assets | | | | |
| Investment in securities, at value (including securities loaned of $5,912,829) - See accompanying schedule: | | | | |
Unaffiliated issuers (cost $803,976,616) | $ | 881,191,256 | | |
Fidelity Central Funds (cost $19,821,583) | | 19,821,583 | | |
| | | | | |
| | | | | |
| Total Investment in Securities (cost $823,798,199) | | | $ | 901,012,839 |
| Foreign currency held at value (cost $5,836) | | | | 5,836 |
| Receivable for investments sold | | | | 1,682,981 |
| Receivable for fund shares sold | | | | 174,815 |
| Dividends receivable | | | | 162,953 |
| Distributions receivable from Fidelity Central Funds | | | | 116,159 |
| Prepaid expenses | | | | 1,422 |
| Other receivables | | | | 16,920 |
Total assets | | | | 903,173,925 |
| Liabilities | | | | |
| Payable for investments purchased | $ | 356,168 | | |
| Payable for fund shares redeemed | | 855,302 | | |
| Accrued management fee | | 513,219 | | |
| Distribution and service plan fees payable | | 11,506 | | |
| Other affiliated payables | | 181,997 | | |
| Other payables and accrued expenses | | 169,557 | | |
| Collateral on securities loaned | | 6,127,633 | | |
| Total Liabilities | | | | 8,215,382 |
| Net Assets | | | $ | 894,958,543 |
| Net Assets consist of: | | | | |
| Paid in capital | | | $ | 1,004,828,771 |
| Total accumulated earnings (loss) | | | | (109,870,228) |
| Net Assets | | | $ | 894,958,543 |
| | | | | |
| Net Asset Value and Maximum Offering Price | | | | |
| Class A : | | | | |
Net Asset Value and redemption price per share ($21,354,002 ÷ 697,241 shares)(a) | | | $ | 30.63 |
| Maximum offering price per share (100/94.25 of $30.63) | | | $ | 32.50 |
| Class M : | | | | |
Net Asset Value and redemption price per share ($6,610,115 ÷ 217,841 shares)(a) | | | $ | 30.34 |
| Maximum offering price per share (100/96.50 of $30.34) | | | $ | 31.44 |
| Class C : | | | | |
Net Asset Value and offering price per share ($4,833,564 ÷ 166,480 shares)(a) | | | $ | 29.03 |
| China Region : | | | | |
Net Asset Value, offering price and redemption price per share ($809,282,920 ÷ 26,014,646 shares) | | | $ | 31.11 |
| Class I : | | | | |
Net Asset Value, offering price and redemption price per share ($26,682,737 ÷ 864,487 shares) | | | $ | 30.87 |
| Class Z : | | | | |
Net Asset Value, offering price and redemption price per share ($26,195,205 ÷ 847,738 shares) | | | $ | 30.90 |
(a)Redemption price per share is equal to net asset value less any applicable contingent deferred sales charge. |
| Statement of Operations |
| | | | Year ended October 31, 2023 |
| Investment Income | | | | |
| Dividends | | | $ | 20,920,374 |
| Income from Fidelity Central Funds (including $87,862 from security lending) | | | | 1,176,393 |
| Income before foreign taxes withheld | | | $ | 22,096,767 |
| Less foreign taxes withheld | | | | (2,231,765) |
| Total Income | | | | 19,865,002 |
| Expenses | | | | |
| Management fee | $ | 7,033,238 | | |
| Transfer agent fees | | 1,926,839 | | |
| Distribution and service plan fees | | 175,795 | | |
| Accounting fees | | 463,145 | | |
| Custodian fees and expenses | | 266,823 | | |
| Independent trustees' fees and expenses | | 6,157 | | |
| Registration fees | | 105,870 | | |
| Audit | | 87,948 | | |
| Legal | | 1,997 | | |
| Miscellaneous | | 5,308 | | |
| Total expenses before reductions | | 10,073,120 | | |
| Expense reductions | | (64,762) | | |
| Total expenses after reductions | | | | 10,008,358 |
| Net Investment income (loss) | | | | 9,856,644 |
| Realized and Unrealized Gain (Loss) | | | | |
| Net realized gain (loss) on: | | | | |
| Investment Securities: | | | | |
| Unaffiliated issuers | | (42,448,916) | | |
| Foreign currency transactions | | 123,639 | | |
| Total net realized gain (loss) | | | | (42,325,277) |
| Change in net unrealized appreciation (depreciation) on: | | | | |
| Investment Securities: | | | | |
| Unaffiliated issuers | | 222,679,469 | | |
| Assets and liabilities in foreign currencies | | 316,485 | | |
| Total change in net unrealized appreciation (depreciation) | | | | 222,995,954 |
| Net gain (loss) | | | | 180,670,677 |
| Net increase (decrease) in net assets resulting from operations | | | $ | 190,527,321 |
| Statement of Changes in Net Assets |
| |
| | Year ended October 31, 2023 | | Year ended October 31, 2022 |
| Increase (Decrease) in Net Assets | | | | |
| Operations | | | | |
| Net investment income (loss) | $ | 9,856,644 | $ | 8,621,218 |
| Net realized gain (loss) | | (42,325,277) | | (142,874,829) |
| Change in net unrealized appreciation (depreciation) | | 222,995,954 | | (593,880,795) |
| Net increase (decrease) in net assets resulting from operations | | 190,527,321 | | (728,134,406) |
| Distributions to shareholders | | (10,463,693) | | (163,021,571) |
| | | | | |
| Share transactions - net increase (decrease) | | (76,688,681) | | (137,715,540) |
| | | | | |
| Total increase (decrease) in net assets | | 103,374,947 | | (1,028,871,517) |
| | | | | |
| Net Assets | | | | |
| Beginning of period | | 791,583,596 | | 1,820,455,113 |
| End of period | $ | 894,958,543 | $ | 791,583,596 |
| | | | | |
| | | | | |
Financial Highlights
| Fidelity Advisor® China Region Fund Class A |
| |
| Years ended October 31, | | 2023 | | 2022 | | 2021 | | 2020 | | 2019 |
Selected Per-Share Data | | | | | | | | | | |
| Net asset value, beginning of period | $ | 24.85 | $ | 50.32 | $ | 50.90 | $ | 35.86 | $ | 28.73 |
| Income from Investment Operations | | | | | | | | | | |
Net investment income (loss) A,B | | .22 | | .14 | | .06 | | .08 | | .15 |
| Net realized and unrealized gain (loss) | | 5.75 C | | (20.99) | | 1.95 | | 15.11 | | 7.10 |
| Total from investment operations | | 5.97 | | (20.85) | | 2.01 | | 15.19 | | 7.25 |
| Distributions from net investment income | | (.19) | | - | | (.44) | | (.15) | | (.12) |
| Distributions from net realized gain | | - | | (4.62) | | (2.16) | | - | | - |
| Total distributions | | (.19) | | (4.62) | | (2.59) D | | (.15) | | (.12) |
| Net asset value, end of period | $ | 30.63 | $ | 24.85 | $ | 50.32 | $ | 50.90 | $ | 35.86 |
Total Return E,F | | 23.98% C | | (45.20)% | | 3.65% | | 42.52% | | 25.30% |
Ratios to Average Net Assets A,G,H | | | | | | | | | | |
| Expenses before reductions | | 1.25% | | 1.23% | | 1.21% | | 1.24% | | 1.27% |
| Expenses net of fee waivers, if any | | 1.25% | | 1.22% | | 1.21% | | 1.24% | | 1.26% |
| Expenses net of all reductions | | 1.25% | | 1.22% | | 1.21% | | 1.22% | | 1.26% |
| Net investment income (loss) | | .66% | | .38% | | .11% | | .18% | | .44% |
| Supplemental Data | | | | | | | | | | |
| Net assets, end of period (000 omitted) | $ | 21,354 | $ | 19,362 | $ | 45,301 | $ | 39,303 | $ | 29,963 |
Portfolio turnover rate I | | 24% | | 20% | | 60% | | 60% | | 80% |
ANet investment income (loss) is affected by the timing of the declaration of dividends by any underlying mutual funds or exchange-traded funds (ETFs). Net investment income (loss) of any mutual funds or ETFs is not included in the Fund's net investment income (loss) ratio.
BCalculated based on average shares outstanding during the period.
CAmount includes a reimbursement from the investment adviser for an operational error which amounted to less than $.01 per share. Excluding this reimbursement, the total return would have been 23.96%.
DTotal distributions per share do not sum due to rounding.
ETotal returns would have been lower if certain expenses had not been reduced during the applicable periods shown.
FTotal returns do not include the effect of the sales charges.
GFees and expenses of any underlying mutual funds or exchange-traded funds (ETFs) are not included in the Fund's expense ratio. The Fund indirectly bears its proportionate share of these expenses. For additional expense information related to investments in Fidelity Central Funds, please refer to the "Investments in Fidelity Central Funds" note found in the Notes to Financial Statements section of the most recent Annual or Semi-Annual report.
HExpense ratios reflect operating expenses of the class. Expenses before reductions do not reflect amounts reimbursed, waived, or reduced through arrangements with the investment adviser, brokerage services, or other offset arrangements, if applicable, and do not represent the amount paid by the class during periods when reimbursements, waivers or reductions occur.
IAmount does not include the portfolio activity of any underlying mutual funds or exchange-traded funds (ETFs).
| Fidelity Advisor® China Region Fund Class M |
| |
| Years ended October 31, | | 2023 | | 2022 | | 2021 | | 2020 | | 2019 |
Selected Per-Share Data | | | | | | | | | | |
| Net asset value, beginning of period | $ | 24.61 | $ | 50.02 | $ | 50.64 | $ | 35.66 | $ | 28.55 |
| Income from Investment Operations | | | | | | | | | | |
Net investment income (loss) A,B | | .13 | | .03 | | (.10) | | (.05) | | .04 |
| Net realized and unrealized gain (loss) | | 5.69 C | | (20.82) | | 1.96 | | 15.04 | | 7.07 |
| Total from investment operations | | 5.82 | | (20.79) | | 1.86 | | 14.99 | | 7.11 |
| Distributions from net investment income | | (.09) | | - | | (.32) | �� | (.01) | | - |
| Distributions from net realized gain | | - | | (4.62) | | (2.16) | | - | | - |
| �� Total distributions | | (.09) | | (4.62) | | (2.48) | | (.01) | | - |
| Net asset value, end of period | $ | 30.34 | $ | 24.61 | $ | 50.02 | $ | 50.64 | $ | 35.66 |
Total Return D,E | | 23.64% C | | (45.37)% | | 3.36% | | 42.04% | | 24.90% |
Ratios to Average Net Assets B,F,G | | | | | | | | | | |
| Expenses before reductions | | 1.52% | | 1.53% | | 1.50% | | 1.56% | | 1.59% |
| Expenses net of fee waivers, if any | | 1.52% | | 1.53% | | 1.50% | | 1.56% | | 1.59% |
| Expenses net of all reductions | | 1.51% | | 1.53% | | 1.50% | | 1.53% | | 1.58% |
| Net investment income (loss) | | .40% | | .08% | | (.18)% | | (.13)% | | .12% |
| Supplemental Data | | | | | | | | | | |
| Net assets, end of period (000 omitted) | $ | 6,610 | $ | 5,803 | $ | 12,623 | $ | 12,028 | $ | 9,251 |
Portfolio turnover rate H | | 24% | | 20% | | 60% | | 60% | | 80% |
ACalculated based on average shares outstanding during the period.
BNet investment income (loss) is affected by the timing of the declaration of dividends by any underlying mutual funds or exchange-traded funds (ETFs). Net investment income (loss) of any mutual funds or ETFs is not included in the Fund's net investment income (loss) ratio.
CAmount includes a reimbursement from the investment adviser for an operational error which amounted to less than $.01 per share. Excluding this reimbursement, the total return would have been 23.62%.
DTotal returns would have been lower if certain expenses had not been reduced during the applicable periods shown.
ETotal returns do not include the effect of the sales charges.
FFees and expenses of any underlying mutual funds or exchange-traded funds (ETFs) are not included in the Fund's expense ratio. The Fund indirectly bears its proportionate share of these expenses. For additional expense information related to investments in Fidelity Central Funds, please refer to the "Investments in Fidelity Central Funds" note found in the Notes to Financial Statements section of the most recent Annual or Semi-Annual report.
GExpense ratios reflect operating expenses of the class. Expenses before reductions do not reflect amounts reimbursed, waived, or reduced through arrangements with the investment adviser, brokerage services, or other offset arrangements, if applicable, and do not represent the amount paid by the class during periods when reimbursements, waivers or reductions occur.
HAmount does not include the portfolio activity of any underlying mutual funds or exchange-traded funds (ETFs).
| Fidelity Advisor® China Region Fund Class C |
| |
| Years ended October 31, | | 2023 | | 2022 | | 2021 | | 2020 | | 2019 |
Selected Per-Share Data | | | | | | | | | | |
| Net asset value, beginning of period | $ | 23.59 | $ | 48.34 | $ | 49.10 | $ | 34.71 | $ | 27.90 |
| Income from Investment Operations | | | | | | | | | | |
Net investment income (loss) A,B | | (.02) | | (.13) | | (.35) | | (.22) | | (.09) |
| Net realized and unrealized gain (loss) | | 5.46 C | | (20.00) | | 1.92 | | 14.61 | | 6.90 |
| Total from investment operations | | 5.44 | | (20.13) | | 1.57 | | 14.39 | | 6.81 |
| Distributions from net investment income | | - | | - | | (.17) | | - | | - |
| Distributions from net realized gain | | - | | (4.62) | | (2.16) | | - | | - |
| Total distributions | | - | | (4.62) | | (2.33) | | - | | - |
| Net asset value, end of period | $ | 29.03 | $ | 23.59 | $ | 48.34 | $ | 49.10 | $ | 34.71 |
Total Return D,E | | 23.06% C | | (45.60)% | | 2.89% | | 41.46% | | 24.41% |
Ratios to Average Net Assets B,F,G | | | | | | | | | | |
| Expenses before reductions | | 1.97% | | 1.96% | | 1.96% | | 1.98% | | 2.00% |
| Expenses net of fee waivers, if any | | 1.96% | | 1.96% | | 1.96% | | 1.98% | | 2.00% |
| Expenses net of all reductions | | 1.96% | | 1.96% | | 1.96% | | 1.96% | | 1.99% |
| Net investment income (loss) | | (.05)% | | (.36)% | | (.65)% | | (.55)% | | (.29)% |
| Supplemental Data | | | | | | | | | | |
| Net assets, end of period (000 omitted) | $ | 4,834 | $ | 5,784 | $ | 13,168 | $ | 11,308 | $ | 9,437 |
Portfolio turnover rate H | | 24% | | 20% | | 60% | | 60% | | 80% |
ACalculated based on average shares outstanding during the period.
BNet investment income (loss) is affected by the timing of the declaration of dividends by any underlying mutual funds or exchange-traded funds (ETFs). Net investment income (loss) of any mutual funds or ETFs is not included in the Fund's net investment income (loss) ratio.
CAmount includes a reimbursement from the investment adviser for an operational error which amounted to less than $.01 per share. Excluding this reimbursement, the total return would have been 23.04%.
DTotal returns would have been lower if certain expenses had not been reduced during the applicable periods shown.
ETotal returns do not include the effect of the contingent deferred sales charge.
FFees and expenses of any underlying mutual funds or exchange-traded funds (ETFs) are not included in the Fund's expense ratio. The Fund indirectly bears its proportionate share of these expenses. For additional expense information related to investments in Fidelity Central Funds, please refer to the "Investments in Fidelity Central Funds" note found in the Notes to Financial Statements section of the most recent Annual or Semi-Annual report.
GExpense ratios reflect operating expenses of the class. Expenses before reductions do not reflect amounts reimbursed, waived, or reduced through arrangements with the investment adviser, brokerage services, or other offset arrangements, if applicable, and do not represent the amount paid by the class during periods when reimbursements, waivers or reductions occur.
HAmount does not include the portfolio activity of any underlying mutual funds or exchange-traded funds (ETFs).
| Fidelity® China Region Fund |
| |
| Years ended October 31, | | 2023 | | 2022 | | 2021 | | 2020 | | 2019 |
Selected Per-Share Data | | | | | | | | | | |
| Net asset value, beginning of period | $ | 25.28 | $ | 51.03 | $ | 51.53 | $ | 36.30 | $ | 29.11 |
| Income from Investment Operations | | | | | | | | | | |
Net investment income (loss) A,B | | .32 | | .25 | | .23 | | .21 | | .25 |
| Net realized and unrealized gain (loss) | | 5.85 C | | (21.32) | | 1.97 | | 15.28 | | 7.19 |
| Total from investment operations | | 6.17 | | (21.07) | | 2.20 | | 15.49 | | 7.44 |
| Distributions from net investment income | | (.34) | | (.06) | | (.54) | | (.26) | | (.25) |
| Distributions from net realized gain | | - | | (4.62) | | (2.16) | | - | | - |
| Total distributions | | (.34) | | (4.68) | | (2.70) | | (.26) | | (.25) |
| Net asset value, end of period | $ | 31.11 | $ | 25.28 | $ | 51.03 | $ | 51.53 | $ | 36.30 |
Total Return D | | 24.34% C | | (45.04)% | | 3.97% | | 42.95% | | 25.72% |
Ratios to Average Net Assets B,E,F | | | | | | | | | | |
| Expenses before reductions | | .95% | | .94% | | .91% | | .93% | | .95% |
| Expenses net of fee waivers, if any | | .95% | | .93% | | .91% | | .93% | | .95% |
| Expenses net of all reductions | | .95% | | .93% | | .91% | | .91% | | .95% |
| Net investment income (loss) | | .96% | | .67% | | .41% | | .49% | | .76% |
| Supplemental Data | | | | | | | | | | |
| Net assets, end of period (000 omitted) | $ | 809,283 | $ | 736,185 | $ | 1,609,326 | $ | 1,518,404 | $ | 1,093,827 |
Portfolio turnover rate G | | 24% | | 20% | | 60% | | 60% | | 80% |
ACalculated based on average shares outstanding during the period.
BNet investment income (loss) is affected by the timing of the declaration of dividends by any underlying mutual funds or exchange-traded funds (ETFs). Net investment income (loss) of any mutual funds or ETFs is not included in the Fund's net investment income (loss) ratio.
CAmount includes a reimbursement from the investment adviser for an operational error which amounted to less than $.01 per share. Excluding this reimbursement, the total return would have been 24.32%.
DTotal returns would have been lower if certain expenses had not been reduced during the applicable periods shown.
EFees and expenses of any underlying mutual funds or exchange-traded funds (ETFs) are not included in the Fund's expense ratio. The Fund indirectly bears its proportionate share of these expenses. For additional expense information related to investments in Fidelity Central Funds, please refer to the "Investments in Fidelity Central Funds" note found in the Notes to Financial Statements section of the most recent Annual or Semi-Annual report.
FExpense ratios reflect operating expenses of the class. Expenses before reductions do not reflect amounts reimbursed, waived, or reduced through arrangements with the investment adviser, brokerage services, or other offset arrangements, if applicable, and do not represent the amount paid by the class during periods when reimbursements, waivers or reductions occur.
GAmount does not include the portfolio activity of any underlying mutual funds or exchange-traded funds (ETFs).
| Fidelity Advisor® China Region Fund Class I |
| |
| Years ended October 31, | | 2023 | | 2022 | | 2021 | | 2020 | | 2019 |
Selected Per-Share Data | | | | | | | | | | |
| Net asset value, beginning of period | $ | 25.07 | $ | 50.63 | $ | 51.16 | $ | 36.05 | $ | 28.90 |
| Income from Investment Operations | | | | | | | | | | |
Net investment income (loss) A,B | | .32 | | .25 | | .22 | | .20 | | .25 |
| Net realized and unrealized gain (loss) | | 5.82 C | | (21.15) | | 1.96 | | 15.17 | | 7.13 |
| Total from investment operations | | 6.14 | | (20.90) | | 2.18 | | 15.37 | | 7.38 |
| Distributions from net investment income | | (.34) | | (.04) | | (.55) | | (.26) | | (.23) |
| Distributions from net realized gain | | - | | (4.62) | | (2.16) | | - | | - |
| Total distributions | | (.34) | | (4.66) | | (2.71) | | (.26) | | (.23) |
| Net asset value, end of period | $ | 30.87 | $ | 25.07 | $ | 50.63 | $ | 51.16 | $ | 36.05 |
Total Return D | | 24.40% C | | (45.05)% | | 3.96% | | 42.91% | | 25.71% |
Ratios to Average Net Assets B,E,F | | | | | | | | | | |
| Expenses before reductions | | .94% | | .93% | | .93% | | .95% | | .97% |
| Expenses net of fee waivers, if any | | .93% | | .93% | | .93% | | .95% | | .96% |
| Expenses net of all reductions | | .93% | | .93% | | .93% | | .93% | | .96% |
| Net investment income (loss) | | .98% | | .68% | | .39% | | .48% | | .74% |
| Supplemental Data | | | | | | | | | | |
| Net assets, end of period (000 omitted) | $ | 26,683 | $ | 20,509 | $ | 68,464 | $ | 47,688 | $ | 27,410 |
Portfolio turnover rate G | | 24% | | 20% | | 60% | | 60% | | 80% |
ACalculated based on average shares outstanding during the period.
BNet investment income (loss) is affected by the timing of the declaration of dividends by any underlying mutual funds or exchange-traded funds (ETFs). Net investment income (loss) of any mutual funds or ETFs is not included in the Fund's net investment income (loss) ratio.
CAmount includes a reimbursement from the investment adviser for an operational error which amounted to less than $.01 per share. Excluding this reimbursement, the total return would have been 24.38%.
DTotal returns would have been lower if certain expenses had not been reduced during the applicable periods shown.
EFees and expenses of any underlying mutual funds or exchange-traded funds (ETFs) are not included in the Fund's expense ratio. The Fund indirectly bears its proportionate share of these expenses. For additional expense information related to investments in Fidelity Central Funds, please refer to the "Investments in Fidelity Central Funds" note found in the Notes to Financial Statements section of the most recent Annual or Semi-Annual report.
FExpense ratios reflect operating expenses of the class. Expenses before reductions do not reflect amounts reimbursed, waived, or reduced through arrangements with the investment adviser, brokerage services, or other offset arrangements, if applicable, and do not represent the amount paid by the class during periods when reimbursements, waivers or reductions occur.
GAmount does not include the portfolio activity of any underlying mutual funds or exchange-traded funds (ETFs).
| Fidelity Advisor® China Region Fund Class Z |
| |
| Years ended October 31, | | 2023 | | 2022 | | 2021 | | 2020 | | 2019 |
Selected Per-Share Data | | | | | | | | | | |
| Net asset value, beginning of period | $ | 25.02 | $ | 50.57 | $ | 51.07 | $ | 36.00 | $ | 28.91 |
| Income from Investment Operations | | | | | | | | | | |
Net investment income (loss) A,B | | .36 | | .30 | | .29 | | .26 | | .30 |
| Net realized and unrealized gain (loss) | | 5.80 C | | (21.10) | | 1.95 | | 15.14 | | 7.11 |
| Total from investment operations | | 6.16 | | (20.80) | | 2.24 | | 15.40 | | 7.41 |
| Distributions from net investment income | | (.28) | | (.12) | | (.59) | | (.33) | | (.32) |
| Distributions from net realized gain | | - | | (4.62) | | (2.16) | | - | | - |
| Total distributions | | (.28) | | (4.75) D | | (2.74) D | | (.33) | | (.32) |
| Net asset value, end of period | $ | 30.90 | $ | 25.02 | $ | 50.57 | $ | 51.07 | $ | 36.00 |
Total Return E | | 24.55% C | | (44.97)% | | 4.09% | | 43.13% | | 25.86% |
Ratios to Average Net Assets B,F,G | | | | | | | | | | |
| Expenses before reductions | | .81% | | .80% | | .80% | | .81% | | .82% |
| Expenses net of fee waivers, if any | | .80% | | .80% | | .80% | | .81% | | .82% |
| Expenses net of all reductions | | .80% | | .80% | | .80% | | .79% | | .81% |
| Net investment income (loss) | | 1.11% | | .81% | | .52% | | .61% | | .89% |
| Supplemental Data | | | | | | | | | | |
| Net assets, end of period (000 omitted) | $ | 26,195 | $ | 3,940 | $ | 71,573 | $ | 71,121 | $ | 46,861 |
Portfolio turnover rate H | | 24% | | 20% | | 60% | | 60% | | 80% |
ACalculated based on average shares outstanding during the period.
BNet investment income (loss) is affected by the timing of the declaration of dividends by any underlying mutual funds or exchange-traded funds (ETFs). Net investment income (loss) of any mutual funds or ETFs is not included in the Fund's net investment income (loss) ratio.
CAmount includes a reimbursement from the investment adviser for an operational error which amounted to less than $.01 per share. Excluding this reimbursement, the total return would have been 24.53%.
DTotal distributions per share do not sum due to rounding.
ETotal returns would have been lower if certain expenses had not been reduced during the applicable periods shown.
FFees and expenses of any underlying mutual funds or exchange-traded funds (ETFs) are not included in the Fund's expense ratio. The Fund indirectly bears its proportionate share of these expenses. For additional expense information related to investments in Fidelity Central Funds, please refer to the "Investments in Fidelity Central Funds" note found in the Notes to Financial Statements section of the most recent Annual or Semi-Annual report.
GExpense ratios reflect operating expenses of the class. Expenses before reductions do not reflect amounts reimbursed, waived, or reduced through arrangements with the investment adviser, brokerage services, or other offset arrangements, if applicable, and do not represent the amount paid by the class during periods when reimbursements, waivers or reductions occur.
HAmount does not include the portfolio activity of any underlying mutual funds or exchange-traded funds (ETFs).
For the period ended October 31, 2023
1. Organization.
Fidelity China Region Fund (the Fund) is a fund of Fidelity Investment Trust (the Trust) and is authorized to issue an unlimited number of shares. The Trust is registered under the Investment Company Act of 1940, as amended (the 1940 Act), as an open-end management investment company organized as a Massachusetts business trust. The Fund offers Class A, Class M, Class C, China Region, Class I and Class Z shares, each of which has equal rights as to assets and voting privileges. Class A, Class M, Class C, Class I and Class Z are Fidelity Advisor classes. Each class has exclusive voting rights with respect to matters that affect that class. Class C shares will automatically convert to Class A shares after a holding period of eight years from the initial date of purchase, with certain exceptions. The Fund's investments in emerging markets can be subject to social, economic, regulatory, and political uncertainties and can be extremely volatile.
2. Investments in Fidelity Central Funds.
Funds may invest in Fidelity Central Funds, which are open-end investment companies generally available only to other investment companies and accounts managed by the investment adviser and its affiliates. The Schedule of Investments lists any Fidelity Central Funds held as an investment as of period end, but does not include the underlying holdings of each Fidelity Central Fund. An investing fund indirectly bears its proportionate share of the expenses of the underlying Fidelity Central Funds.
Based on its investment objective, each Fidelity Central Fund may invest or participate in various investment vehicles or strategies that are similar to those of the investing fund. These strategies are consistent with the investment objectives of the investing fund and may involve certain economic risks which may cause a decline in value of each of the Fidelity Central Funds and thus a decline in the value of the investing fund.
| Fidelity Central Fund | Investment Manager | Investment Objective | Investment Practices | Expense RatioA |
| Fidelity Money Market Central Funds | Fidelity Management & Research Company LLC (FMR) | Each fund seeks to obtain a high level of current income consistent with the preservation of capital and liquidity. | Short-term Investments | Less than .005% |
A Expenses expressed as a percentage of average net assets and are as of each underlying Central Fund's most recent annual or semi-annual shareholder report.
A complete unaudited list of holdings for each Fidelity Central Fund is available upon request or at the Securities and Exchange Commission website at www.sec.gov. In addition, the financial statements of the Fidelity Central Funds which contain the significant accounting policies (including investment valuation policies) of those funds, and are not covered by the Report of Independent Registered Public Accounting Firm, are available on the Securities and Exchange Commission website or upon request.
3. Significant Accounting Policies.
The Fund is an investment company and applies the accounting and reporting guidance of the Financial Accounting Standards Board (FASB) Accounting Standards Codification Topic 946 Financial Services - Investment Companies. The financial statements have been prepared in conformity with accounting principles generally accepted in the United States of America (GAAP), which require management to make certain estimates and assumptions at the date of the financial statements. Actual results could differ from those estimates. Subsequent events, if any, through the date that the financial statements were issued have been evaluated in the preparation of the financial statements. The Fund's Schedule of Investments lists any underlying mutual funds or exchange-traded funds (ETFs) but does not include the underlying holdings of these funds. The following summarizes the significant accounting policies of the Fund:
Investment Valuation. Investments are valued as of 4:00 p.m. Eastern time on the last calendar day of the period. The Board of Trustees (the Board) has designated the Fund's investment adviser as the valuation designee responsible for the fair valuation function and performing fair value determinations as needed. The investment adviser has established a Fair Value Committee (the Committee) to carry out the day-to-day fair valuation responsibilities and has adopted policies and procedures to govern the fair valuation process and the activities of the Committee. In accordance with these fair valuation policies and procedures, which have been approved by the Board, the Fund attempts to obtain prices from one or more third party pricing services or brokers to value its investments. When current market prices, quotations or currency exchange rates are not readily available or reliable, investments will be fair valued in good faith by the Committee, in accordance with the policies and procedures. Factors used in determining fair value vary by investment type and may include market or investment specific events, transaction data, estimated cash flows, and market observations of comparable investments. The frequency that the fair valuation procedures are used cannot be predicted and they may be utilized to a significant extent. The Committee manages the Fund's fair valuation practices and maintains the fair valuation policies and procedures. The Fund's investment adviser reports to the Board information regarding the fair valuation process and related material matters.
The Fund categorizes the inputs to valuation techniques used to value its investments into a disclosure hierarchy consisting of three levels as shown below:
Level 1 - unadjusted quoted prices in active markets for identical investments
Level 2 - other significant observable inputs (including quoted prices for similar investments, interest rates, prepayment speeds, etc.)
Level 3 - unobservable inputs (including the Fund's own assumptions based on the best information available)
Valuation techniques used to value the Fund's investments by major category are as follows:
Equity securities, including restricted securities, for which market quotations are readily available, are valued at the last reported sale price or official closing price as reported by a third party pricing service on the primary market or exchange on which they are traded and are categorized as Level 1 in the hierarchy. In the event there were no sales during the day or closing prices are not available, securities are valued at the last quoted bid price or may be valued using the last available price and are generally categorized as Level 2 in the hierarchy. For foreign equity securities, when market or security specific events arise, comparisons to the valuation of American Depositary Receipts (ADRs), futures contracts, ETFs and certain indexes as well as quoted prices for similar securities may be used and would be categorized as Level 2 in the hierarchy. For equity securities, including restricted securities, where observable inputs are limited, assumptions about market activity and risk are used and these securities may be categorized as Level 3 in the hierarchy. Securities, including private placements or other restricted securities, for which observable inputs are not available are valued using alternate valuation approaches, including the market approach, the income approach and cost approach, and are categorized as Level 3 in the hierarchy. The market approach considers factors including the price of recent investments in the same or a similar security or financial metrics of comparable securities. The income approach considers factors including expected future cash flows, security specific risks and corresponding discount rates. The cost approach considers factors including the value of the security's underlying assets and liabilities.
Investments in open-end mutual funds, including the Fidelity Central Funds, are valued at their closing net asset value (NAV) each business day and are categorized as Level 1 in the hierarchy.
The following provides information on Level 3 securities held by the Fund that were valued at period end based on unobservable inputs. These amounts exclude valuations provided by a broker.
| Asset Type | Fair Value | Valuation Technique(s) | Unobservable Input | Amount or Range/Weighted Average | Impact to Valuation from an Increase in InputA |
| Equities | $12,643,995 | Market comparable | Enterprise value/EBITDA multiple (EV/EBITDA) | 13.1 | Increase |
| | | | Enterprise value/Revenue multiple (EV/R) | 1.2 - 4.0 / 3.6 | Increase |
| | | Black scholes | Discount rate | 4.9% | Increase |
| | | | Volatility | 60.0% | Increase |
| | | | Term | 3.0 | Increase |
A Represents the directional change in the fair value of the Level 3 investments that could have resulted from an increase in the corresponding input as of period end. A decrease to the unobservable input would have had the opposite effect. Significant changes in these inputs may have resulted in a significantly higher or lower fair value measurement at period end.
Changes in valuation techniques may result in transfers in or out of an assigned level within the disclosure hierarchy. The aggregate value of investments by input level as of October 31, 2023, as well as a roll forward of Level 3 investments, is included at the end of the Fund's Schedule of Investments.
Foreign Currency. Certain Funds may use foreign currency contracts to facilitate transactions in foreign-denominated securities. Gains and losses from these transactions may arise from changes in the value of the foreign currency or if the counterparties do not perform under the contracts' terms.
Foreign-denominated assets, including investment securities, and liabilities are translated into U.S. dollars at the exchange rates at period end. Purchases and sales of investment securities, income and dividends received, and expenses denominated in foreign currencies are translated into U.S. dollars at the exchange rate in effect on the transaction date.
The effects of exchange rate fluctuations on investments are included with the net realized and unrealized gain (loss) on investment securities. Other foreign currency transactions resulting in realized and unrealized gain (loss) are disclosed separately.
Investment Transactions and Income. For financial reporting purposes, the Fund's investment holdings and NAV include trades executed through the end of the last business day of the period. The NAV per share for processing shareholder transactions is calculated as of the close of business of the New York Stock Exchange (NYSE), normally 4:00 p.m. Eastern time and includes trades executed through the end of the prior business day. Gains and losses on securities sold are determined on the basis of identified cost and include proceeds received from litigation. Commissions paid to certain brokers with whom the investment adviser, or its affiliates, places trades on behalf of a fund include an amount in addition to trade execution, which may be rebated back to a fund. Any such rebates are included in net realized gain (loss) on investments in the Statement of Operations. Dividend income is recorded on the ex-dividend date, except for certain dividends from foreign securities where the ex-dividend date may have passed, which are recorded as soon as the Fund is informed of the ex-dividend date. Non-cash dividends included in dividend income, if any, are recorded at the fair market value of the securities received. Income and capital gain distributions from Fidelity Central Funds, if any, are recorded on the ex-dividend date. Investment income is recorded net of foreign taxes withheld where recovery of such taxes is uncertain. Funds may file withholding tax reclaims in certain jurisdictions to recover a portion of amounts previously withheld. Any withholding tax reclaims income is included in the Statement of Operations in foreign taxes withheld. Any receivables for withholding tax reclaims are included in the Statement of Assets and Liabilities in dividends receivable.
Class Allocations and Expenses. Investment income, realized and unrealized capital gains and losses, common expenses of a fund, and certain fund-level expense reductions, if any, are allocated daily on a pro-rata basis to each class based on the relative net assets of each class to the total net assets of a fund. Each class differs with respect to transfer agent and distribution and service plan fees incurred, as applicable. Certain expense reductions may also differ by class, if applicable. For the reporting period, the allocated portion of income and expenses to each class as a percent of its average net assets may vary due to the timing of recording these transactions in relation to fluctuating net assets of the classes. Expenses directly attributable to a fund are charged to that fund. Expenses attributable to more than one fund are allocated among the respective funds on the basis of relative net assets or other appropriate methods. Expenses included in the accompanying financial statements reflect the expenses of that fund and do not include any expenses associated with any underlying mutual funds or exchange-traded funds (ETFs). Although not included in a fund's expenses, a fund indirectly bears its proportionate share of these expenses through the net asset value of each underlying mutual fund or exchange-traded fund (ETF). Expense estimates are accrued in the period to which they relate and adjustments are made when actual amounts are known.
Income Tax Information and Distributions to Shareholders. Each year, the Fund intends to qualify as a regulated investment company under Subchapter M of the Internal Revenue Code, including distributing substantially all of its taxable income and realized gains. As a result, no provision for U.S. Federal income taxes is required. As of October 31, 2023, the Fund did not have any unrecognized tax benefits in the financial statements; nor is the Fund aware of any tax positions for which it is reasonably possible that the total amounts of unrecognized tax benefits will significantly change in the next twelve months. The Fund files a U.S. federal tax return, in addition to state and local tax returns as required. The Fund's federal income tax returns are subject to examination by the Internal Revenue Service (IRS) for a period of three fiscal years after they are filed. State and local tax returns may be subject to examination for an additional fiscal year depending on the jurisdiction. Foreign taxes are provided for based on the Fund's understanding of the tax rules and rates that exist in the foreign markets in which it invests.
Distributions are declared and recorded on the ex-dividend date. Income and capital gain distributions are declared separately for each class. Income and capital gain distributions are determined in accordance with income tax regulations, which may differ from GAAP. In addition, the Fund claimed a portion of the payment made to redeeming shareholders as a distribution for income tax purposes.
Capital accounts within the financial statements are adjusted for permanent book-tax differences. These adjustments have no impact on net assets or the results of operations. Capital accounts are not adjusted for temporary book-tax differences which will reverse in a subsequent period.
Book-tax differences are primarily due to foreign currency transactions, passive foreign investment companies (PFIC), capital loss carryforwards, certain corporate actions and losses deferred due to wash sales.
As of period end, the cost and unrealized appreciation (depreciation) in securities, and derivatives if applicable, for federal income tax purposes were as follows:
| Gross unrealized appreciation | $221,938,876 |
| Gross unrealized depreciation | (169,580,274) |
| Net unrealized appreciation (depreciation) | $52,358,602 |
| Tax Cost | $848,654,237 |
The tax-based components of distributable earnings as of period end were as follows:
| Undistributed ordinary income | $16,609,616 |
| Capital loss carryforward | $(178,833,304) |
| Net unrealized appreciation (depreciation) on securities and other investments | $52,353,460 |
Capital loss carryforwards are only available to offset future capital gains of the Fund to the extent provided by regulations and may be limited. The capital loss carryforward information presented below, including any applicable limitation, is estimated as of fiscal period end and is subject to adjustment.
Short-term | $(114,807,939) |
Long-term | (64,025,365) |
| Total capital loss carryforward | $(178,833,304) |
The tax character of distributions paid was as follows:
| | October 31, 2023 | October 31, 2022 |
| Ordinary Income | $10,463,693 | $1,969,102 |
| Long-term Capital Gains | - | 161,052,469 |
| Total | $10,463,693 | $163,021,571 |
Restricted Securities (including Private Placements). Funds may invest in securities that are subject to legal or contractual restrictions on resale. These securities generally may be resold in transactions exempt from registration or to the public if the securities are registered. Disposal of these securities may involve time-consuming negotiations and expense, and prompt sale at an acceptable price may be difficult. Information regarding restricted securities held at period end is included at the end of the Schedule of Investments, if applicable.
New Accounting Pronouncement. In June 2022, the Financial Accounting Standards Board (FASB) issued Accounting Standards Update (ASU) 2022-03 Fair Value Measurement (Topic 820): Fair Value Measurement of Equity Securities Subject to Contractual Sale Restrictions. The amendments in this ASU clarify that a contractual restriction on the sale of an equity security is not considered part of the unit of account of the equity security and, therefore, is not considered in measuring fair value. They also clarify that an entity cannot, as a separate unit of account, recognize and measure a contractual sale restriction. They also require additional disclosures for equity securities subject to contractual sale restrictions. ASU 2022-03 will be effective for fiscal years, including interim periods within those fiscal years, beginning after December 15, 2023, and allows for early adoption. ASU 2022-03 will only be applicable to an equity security in which the contractual arrangement that restricts its sale is executed or modified on or after the adoption date. Management is currently evaluating the potential impact of ASU 2022-03 to the financial statements.
4. Purchases and Sales of Investments.
Purchases and sales of securities, other than short-term securities and in-kind transactions, as applicable, are noted in the table below.
| | Purchases ($) | Sales ($) |
| Fidelity China Region Fund | 237,817,118 | 289,360,955 |
5. Fees and Other Transactions with Affiliates.
Management Fee. Fidelity Management & Research Company LLC (the investment adviser) and its affiliates provide the Fund with investment management related services for which the Fund pays a monthly management fee. The management fee is the sum of an individual fund fee rate that is based on an annual rate of .45% of the Fund's average net assets and an annualized group fee rate that averaged .23% during the period. The group fee rate is based upon the monthly average net assets of a group of registered investment companies with which the investment adviser has management contracts. The group fee rate decreases as assets under management increase and increases as assets under management decrease. For the reporting period, the total annual management fee rate was .68% of the Fund's average net assets.
Distribution and Service Plan Fees. In accordance with Rule 12b-1 of the 1940 Act, the Fund has adopted separate Distribution and Service Plans for each class of shares. Certain classes pay Fidelity Distributors Company LLC (FDC), an affiliate of the investment adviser, separate Distribution and Service Fees, each of which is based on an annual percentage of each class' average net assets. In addition, FDC may pay financial intermediaries for selling shares of the Fund and providing shareholder support services. For the period, the Distribution and Service Fee rates, total fees and amounts retained by FDC were as follows:
| | Distribution Fee | Service Fee | Total Fees | Retained by FDC |
| Class A | - % | .25% | $64,515 | $1,799 |
| Class M | .25% | .25% | 40,584 | 119 |
| Class C | .75% | .25% | 70,696 | 11,664 |
| | | | $175,795 | $13,582 |
Sales Load. FDC may receive a front-end sales charge of up to 5.75% for selling Class A shares and 3.50% for selling Class M shares, some of which is paid to financial intermediaries for selling shares of the Fund. Depending on the holding period, FDC may receive contingent deferred sales charges levied on Class A, Class M and Class C redemptions. The deferred sales charges are 1.00% for Class C shares, 1.00% for certain purchases of Class A shares and .25% for certain purchases of Class M shares.
For the period, sales charge amounts retained by FDC were as follows:
| | Retained by FDC |
| Class A | $4,917 |
| Class M | 1,200 |
Class CA | 75 |
| | $6,192 |
A When Class C shares are initially sold, FDC pays commissions from its own resources to financial intermediaries through which the sales are made.
Transfer Agent Fees. Fidelity Investments Institutional Operations Company LLC (FIIOC), an affiliate of the investment adviser, is the transfer, dividend disbursing and shareholder servicing agent for each class of the Fund. FIIOC receives account fees and asset-based fees that vary according to the account size and type of account of the shareholders of the respective classes of the Fund, except for Class Z. FIIOC receives an asset-based fee of Class Z's average net assets. FIIOC pays for typesetting, printing and mailing of shareholder reports, except proxy statements.
For the period, transfer agent fees for each class were as follows:
| | Amount | % of Class-Level Average Net Assets |
| Class A | $61,296 | .24 |
| Class M | 20,662 | .26 |
| Class C | 14,059 | .20 |
| China Region | 1,765,751 | .19 |
| Class I | 60,215 | .17 |
| Class Z | 4,856 | .04 |
| | $1,926,839 | |
During November 2023, the Board approved a change in the transfer agent fees effective December 1, 2023 to a fixed annual rate of class-level average net assets as follows:
| | % of Class-Level Average Net Assets |
| Class A | 0.2000 |
| Class M | 0.2000 |
| Class C | 0.2000 |
| China Region | 0.1844 |
| Class I | 0.1762 |
Accounting Fees. Fidelity Service Company, Inc. (FSC), an affiliate of the investment adviser, maintains the Fund's accounting records. The accounting fee is based on the level of average net assets for each month. For the period, the fees were equivalent to the following annual rates:
| | % of Average Net Assets |
| Fidelity China Region Fund | .04 |
During November 2023, the Board approved a change in the accounting fees effective December 1, 2023 to a fixed annual rate of average net assets as follows:
| | % of Average Net Assets |
| Fidelity China Region Fund | 0.0445 |
Brokerage Commissions. A portion of portfolio transactions were placed with brokerage firms which are affiliates of the investment adviser. Brokerage commissions are included in net realized gain (loss) and change in net unrealized appreciation (depreciation) in the Statement of Operations. The commissions paid to these affiliated firms were as follows:
| | Amount |
| Fidelity China Region Fund | $1,898 |
Interfund Trades. Funds may purchase from or sell securities to other Fidelity Funds under procedures adopted by the Board. The procedures have been designed to ensure these interfund trades are executed in accordance with Rule 17a-7 of the 1940 Act. Any interfund trades are included within the respective purchases and sales amounts shown in the Purchases and Sales of Investments note. Interfund trades during the period are noted in the table below.
| | Purchases ($) | Sales ($) | Realized Gain (Loss) ($) |
| Fidelity China Region Fund | 8,857,783 | 7,416,141 | 2,011,677 |
Other. During the period, FMR reimbursed the Fund $254,190 for an operational error which is included in Net Realized Gain (Loss) in the accompanying Statement of Operations.
6. Committed Line of Credit.
Certain Funds participate with other funds managed by the investment adviser or an affiliate in a $4.25 billion credit facility (the "line of credit") to be utilized for temporary or emergency purposes to fund shareholder redemptions or for other short-term liquidity purposes. The participating funds have agreed to pay commitment fees on their pro-rata portion of the line of credit, which are reflected in Miscellaneous expenses on the Statement of Operations, and are listed below. During the period, there were no borrowings on this line of credit.
| | Amount |
| Fidelity China Region Fund | $1,906 |
7. Security Lending.
Funds lend portfolio securities from time to time in order to earn additional income. Lending agents are used, including National Financial Services (NFS), an affiliate of the investment adviser. Pursuant to a securities lending agreement, NFS will receive a fee, which is capped at 9.9% of a fund's daily lending revenue, for its services as lending agent. A fund may lend securities to certain qualified borrowers, including NFS. On the settlement date of the loan, a fund receives collateral (in the form of U.S. Treasury obligations, letters of credit and/or cash) against the loaned securities and maintains collateral in an amount not less than 100% of the market value of the loaned securities during the period of the loan. The market value of the loaned securities is determined at the close of business of a fund and any additional required collateral is delivered to a fund on the next business day. A fund or borrower may terminate the loan at any time, and if the borrower defaults on its obligation to return the securities loaned because of insolvency or other reasons, a fund may apply collateral received from the borrower against the obligation. A fund may experience delays and costs in recovering the securities loaned. Any cash collateral received is invested in the Fidelity Securities Lending Cash Central Fund. Any loaned securities are identified as such in the Schedule of Investments, and the value of loaned securities and cash collateral at period end, as applicable, are presented in the Statement of Assets and Liabilities. Security lending income represents the income earned on investing cash collateral, less rebates paid to borrowers and any lending agent fees associated with the loan, plus any premium payments received for lending certain types of securities. Security lending income is presented in the Statement of Operations as a component of income from Fidelity Central Funds. Affiliated security lending activity, if any, was as follows:
| | Total Security Lending Fees Paid to NFS | Security Lending Income From Securities Loaned to NFS | Value of Securities Loaned to NFS at Period End |
| Fidelity China Region Fund | $9,129 | $- | $- |
8. Expense Reductions.
Through arrangements with the Fund's custodian and each class' transfer agent, credits realized as a result of certain uninvested cash balances were used to reduce the Fund's expenses. During the period, custodian credits reduced the Fund's expenses by $1,236. During the period, transfer agent credits reduced each class' expenses as noted in the table below.
| | Expense reduction |
| Class A | $497 |
| Class M | 674 |
| Class C | 60 |
| | $1,231 |
In addition, during the period the investment adviser or an affiliate reimbursed and/or waived a portion of fund-level operating expenses in the amount of $62,295.
9. Distributions to Shareholders.
Distributions to shareholders of each class were as follows:
| | Year ended October 31, 2023 | Year ended October 31, 2022 |
| Fidelity China Region Fund | | |
| Distributions to shareholders | | |
| Class A | $147,676 | $4,134,709 |
| Class M | 22,086 | 1,142,842 |
| Class C | - | 1,227,041 |
| China Region | 9,963,708 | 144,410,750 |
| Class I | 287,558 | 5,718,145 |
| Class Z | 42,665 | 6,388,084 |
Total | $10,463,693 | $163,021,571 |
10. Share Transactions.
Share transactions for each class were as follows and may contain in-kind transactions, automatic conversions between classes or exchanges between affiliated funds:
| | Shares | Shares | Dollars | Dollars |
| | Year ended October 31, 2023 | Year ended October 31, 2022 | Year ended October 31, 2023 | Year ended October 31, 2022 |
| Fidelity China Region Fund | | | | |
| Class A | | | | |
| Shares sold | 213,022 | 167,076 | $7,300,449 | $6,290,832 |
| Reinvestment of distributions | 4,346 | 93,787 | 141,383 | 3,954,050 |
| Shares redeemed | (299,344) | (381,933) | (9,796,907) | (12,663,126) |
| Net increase (decrease) | (81,976) | (121,070) | $(2,355,075) | $(2,418,244) |
| Class M | | | | |
| Shares sold | 55,083 | 14,193 | $1,982,190 | $518,243 |
| Reinvestment of distributions | 682 | 27,154 | 22,023 | 1,136,944 |
| Shares redeemed | (73,707) | (57,927) | (2,410,361) | (2,269,682) |
| Net increase (decrease) | (17,942) | (16,580) | $(406,148) | $(614,495) |
| Class C | | | | |
| Shares sold | 85,870 | 52,147 | $2,816,391 | $1,830,320 |
| Reinvestment of distributions | - | 28,637 | - | 1,153,507 |
| Shares redeemed | (164,625) | (107,986) | (5,078,761) | (4,068,826) |
| Net increase (decrease) | (78,755) | (27,202) | $(2,262,370) | $(1,084,999) |
| China Region | | | | |
| Shares sold | 4,425,610 | 4,318,983 | $152,711,723 | $163,821,858 |
| Reinvestment of distributions | 285,364 | 3,187,084 | 9,405,600 | 136,311,566 |
| Shares redeemed | (7,820,514) | (9,920,317) | (259,958,996) | (380,571,112) |
| Net increase (decrease) | (3,109,540) | (2,414,250) | $(97,841,673) | $(80,437,688) |
| Class I | | | | |
| Shares sold | 909,474 | 518,992 | $31,717,017 | $19,260,467 |
| Reinvestment of distributions | 7,396 | 117,730 | 241,861 | 4,994,105 |
| Shares redeemed | (870,332) | (1,171,014) | (29,080,141) | (44,285,642) |
| Net increase (decrease) | 46,538 | (534,292) | $2,878,737 | $(20,031,070) |
| Class Z | | | | |
| Shares sold | 915,990 | 625,286 | $30,707,964 | $23,658,178 |
| Reinvestment of distributions | 1,256 | 148,353 | 41,047 | 6,272,360 |
| Shares redeemed | (226,966) | (2,031,604) | (7,451,163) | (63,059,582) |
| Net increase (decrease) | 690,280 | (1,257,965) | $23,297,848 | $(33,129,044) |
11. Other.
A fund's organizational documents provide former and current trustees and officers with a limited indemnification against liabilities arising in connection with the performance of their duties to the fund. In the normal course of business, a fund may also enter into contracts that provide general indemnifications. A fund's maximum exposure under these arrangements is unknown as this would be dependent on future claims that may be made against a fund. The risk of material loss from such claims is considered remote.
12. Risk and Uncertainties.
Many factors affect a fund's performance. Developments that disrupt global economies and financial markets, such as pandemics, epidemics, outbreaks of infectious diseases, war, terrorism, and environmental disasters, may significantly affect a fund's investment performance. The effects of these developments to a fund will be impacted by the types of securities in which a fund invests, the financial condition, industry, economic sector, and geographic location of an issuer, and a fund's level of investment in the securities of that issuer. Significant concentrations in security types, issuers, industries, sectors, and geographic locations may magnify the factors that affect a fund's performance.
Average annual total return reflects the change in the value of an investment, assuming reinvestment of distributions from dividend income and capital gains (the profits earned upon the sale of securities that have grown in value, if any) and assuming a constant rate of performance each year. The hypothetical investment and the average annual total returns do not reflect the deduction of taxes that a shareholder would pay on fund distributions or the redemption of fund shares. During periods of reimbursement by Fidelity, a fund's total return will be greater than it would be had the reimbursement not occurred. How a fund did yesterday is no guarantee of how it will do tomorrow.
| Average Annual Total Returns |
| | | | |
Periods ended October 31, 2023 | Past 1 year | Past 5 years | Past 10 years |
| Fidelity® Emerging Asia Fund | 18.99% | 7.20% | 5.82% |
| $10,000 Over 10 Years |
| |
Let's say hypothetically that $10,000 was invested in Fidelity® Emerging Asia Fund on October 31, 2013. The chart shows how the value of your investment would have changed, and also shows how the MSCI AC (All Country) Asia ex Japan Index performed over the same period. |
|
|
Fidelity® Emerging Asia Fund
Market Recap:
International (non-U.S.) equities gained 12.27% for the 12 months ending October 31, 2023, according to the MSCI ACWI (All Country World Index) ex USA Index, as global economic expansion and a slowing in the pace of inflation in some markets provided a favorable backdrop for risk assets. After returning -15.86% in 2022, the index's upturn has been largely driven by a narrow set of companies in the information technology and communication services sectors, in part due to excitement for generative artificial intelligence applications. The index gained 14.07% year to date through July, including strong gains in both June (+4.50%) and July (+4.07%). The rally for international equities sputtered the next three months (-11.33%) amid a stalling pattern in disinflationary trends, heightened global recession and geopolitical risks, soaring yields on longer-term U.S. government bonds and particularly weak economic conditions in the eurozone and China. The three-month decline left non-U.S. stocks up 1.15% year to date through October. Currency fluctuation also helped bolster non-U.S. equity performance overall. For the full 12 months, nearly all regions advanced, with Europe ex U.K. (+18%) and Japan (+17%) leading, whereas Canada (-0.38%) lagged by the widest margin. Each of the 11 sectors advanced, with information technology (+21%) and consumer discretionary (+19%) leading the way. Energy and industrials each rose about 14%. Conversely, four defensive-oriented sectors lagged by the widest margin: real estate (+4%), health care (+6%), consumer staples (+7%) and utilities (+8%).
Comments from Portfolio Manager Xiaoting Zhao:
For the fiscal year ending October 31, 2023, the fund gained 18.99%, versus 13.52% for both the Fidelity Emerging Asia Fund Linked Index and the broad-based MSCI AC Asia Ex Japan (Net Mass) Linked Index. From a regional standpoint, positioning in emerging markets, primarily in India and South Korea, and a non-benchmark allocation to the United States meaningfully contributed to the fund's performance versus the benchmark. By sector, the biggest contributor to relative performance was stock selection in consumer discretionary, primarily within the consumer discretionary distribution & retail industry. Not holding any utilities stocks, the weakest-performing benchmark sector, also boosted relative performance. Further lifting the fund's relative result were stock selection and an overweight in information technology, primarily within the semiconductors & semiconductor equipment industry. The top individual relative contributor was an overweight in PDD Holdings (+87%), a stock that was among the fund's biggest positions. The second-largest relative contributor was an overweight in Zomato (+66%), also among our largest holdings. A non-benchmark stake in Nvidia gained about 205% and notably helped as well. We decreased our position in Nvidia during the 12-month period. In contrast, from a regional standpoint, non-benchmark allocations to Europe ex-U.K., primarily in Netherlands and Switzerland, detracted from the fund's relative result. By sector, the biggest detractors from performance versus the benchmark were stock picks and an underweight in communication services. Picks in industrials and materials also hurt. The biggest individual relative detractor was an underweight in Tencent Holdings (+50%), a stock that was not held at period end. The second-largest relative detractor was our non-benchmark stake in Adyen (-61%). This was a stake we established this period. Our overweight stake in Sungrow Power Supply (-21%) also hurt. The stock was not held at period end. Notable changes in positioning include decreased exposure to Japan and a higher allocation to South Korea. By sector, meaningful positioning changes include decreased exposure to the industrials sector and a higher allocation to health care.
The views expressed above reflect those of the portfolio manager(s) only through the end of the period as stated on the cover of this report and do not necessarily represent the views of Fidelity or any other person in the Fidelity organization. Any such views are subject to change at any time based upon market or other conditions and Fidelity disclaims any responsibility to update such views. These views may not be relied on as investment advice and, because investment decisions for a Fidelity fund are based on numerous factors, may not be relied on as an indication of trading intent on behalf of any Fidelity fund.
Fidelity® Emerging Asia Fund
Top Holdings (% of Fund's net assets) |
| |
| Taiwan Semiconductor Manufacturing Co. Ltd. (Taiwan, Semiconductors & Semiconductor Equipment) | 8.9 | |
| Samsung Electronics Co. Ltd. (Korea (South), Technology Hardware, Storage & Peripherals) | 5.7 | |
| PDD Holdings, Inc. ADR (China, Broadline Retail) | 5.3 | |
| Zomato Ltd. (India, Hotels, Restaurants & Leisure) | 4.2 | |
| Alibaba Group Holding Ltd. (China, Broadline Retail) | 3.9 | |
| MakeMyTrip Ltd. (India, Hotels, Restaurants & Leisure) | 3.0 | |
| Reliance Industries Ltd. (India, Oil, Gas & Consumable Fuels) | 2.8 | |
| Sea Ltd. ADR (Singapore, Entertainment) | 2.7 | |
| HDFC Bank Ltd. (India, Banks) | 2.4 | |
| One97 Communications Ltd. (India, Financial Services) | 2.4 | |
| | 41.3 | |
| |
| Market Sectors (% of Fund's net assets) |
| |
| Information Technology | 29.3 | |
| Consumer Discretionary | 25.1 | |
| Financials | 14.3 | |
| Health Care | 13.0 | |
| Communication Services | 6.4 | |
| Industrials | 5.3 | |
| Energy | 2.8 | |
| Materials | 1.2 | |
| Consumer Staples | 0.8 | |
| Real Estate | 0.4 | |
| |
Asset Allocation (% of Fund's net assets) |
|
|
Geographic Diversification (% of Fund's net assets) |
|
* Includes Short-Term investments and Net Other Assets (Liabilities). Percentages are adjusted for the effect of derivatives, if applicable. |
| |
Fidelity® Emerging Asia Fund
Showing Percentage of Net Assets
| Common Stocks - 96.6% |
| | | Shares | Value ($) |
| China - 32.4% | | | |
| Advanced Micro-Fabrication Equipment, Inc., China (A Shares) | | 260,300 | 6,098,161 |
| AK Medical Holdings Ltd. (a) | | 2,834,000 | 2,758,943 |
| Akeso, Inc. (a)(b) | | 612,697 | 3,440,634 |
| Alibaba Group Holding Ltd. (b) | | 2,916,218 | 30,022,695 |
| Alibaba Group Holding Ltd. sponsored ADR (b) | | 50,635 | 4,179,413 |
| Asymchem Laboratories Tianjin Co. Ltd.: | | | |
| (A Shares) | | 217,600 | 4,491,399 |
| (H Shares) (a) | | 208,200 | 2,707,501 |
| Baidu, Inc. Class A (b) | | 103,600 | 1,360,145 |
| BC Technology Group Ltd. (b) | | 1,490,217 | 668,882 |
| Beijing Chunlizhengda Medical Instruments Co. Ltd. | | 742,200 | 3,068,601 |
| Beijing Sinohytec Co. Ltd. (A Shares) | | 589,232 | 3,967,443 |
| BYD Co. Ltd.: | | | |
| (A Shares) | | 94,500 | 3,084,159 |
| (H Shares) | | 624,244 | 18,983,341 |
| Empyrean Technology Co. Ltd. (A Shares) | | 220,400 | 3,115,605 |
| Estun Automation Co. Ltd. (A Shares) | | 3,160,900 | 8,131,187 |
| Glodon Co. Ltd. (A Shares) | | 1,160,040 | 2,923,963 |
| GRG Metrology & Test Co. Ltd. (A Shares) | | 1,041,390 | 2,002,888 |
| Guangzhou Kingmed Diagnostics Group Co. Ltd. (A Shares) | | 529,932 | 4,485,646 |
| Hangzhou Tigermed Consulting Co. Ltd. (A Shares) | | 445,297 | 4,063,452 |
| Hundsun Technologies, Inc. (A Shares) | | 1,103,786 | 4,701,245 |
| Innovent Biologics, Inc. (a)(b) | | 675,585 | 3,981,333 |
| Joinn Laboratories China Co. Ltd. (A Shares) | | 831,860 | 3,048,381 |
| JOYY, Inc. ADR | | 15,100 | 587,692 |
| Kangji Medical Holdings Ltd. (c) | | 1,511,945 | 1,241,892 |
| Kindstar Globalgene Technology, Inc. (a)(b) | | 6,775,265 | 1,342,698 |
| Maxscend Microelectronics Co. Ltd. (A Shares) | | 160,800 | 3,318,168 |
| Meituan Class B (a)(b) | | 1,043,900 | 14,797,297 |
| Microport Cardioflow Medtech Corp. (a)(b)(c) | | 12,173,311 | 2,864,872 |
| MicroTech Medical (Hangzhou) Co. Ltd. (H Shares) (a)(b) | | 1,296,269 | 700,609 |
| Ming Yuan Cloud Group Holdings Ltd. (b)(c) | | 7,847,504 | 3,281,311 |
| NAURA Technology Group Co. Ltd. | | 82,297 | 2,886,874 |
| NXP Semiconductors NV | | 38,562 | 6,649,246 |
| PDD Holdings, Inc. ADR (b) | | 454,538 | 46,099,244 |
| RLX Technology, Inc. ADR (b)(c) | | 746,592 | 1,269,206 |
| SG Micro Corp. (A Shares) | | 88,340 | 1,083,438 |
| Shandong Weigao Orthopaedic Device Co. Ltd. (A Shares) | | 375,000 | 2,122,285 |
| Shanghai Aohua Photoelectricity Endoscope Co. Ltd. (A Shares) (b) | | 179,400 | 1,624,992 |
| Shenzhen Mindray Bio-Medical Electronics Co. Ltd. (A Shares) (b) | | 393,789 | 15,394,562 |
| Silergy Corp. | | 250,000 | 2,232,739 |
| Smoore International Holdings Ltd. (a)(c) | | 2,133,176 | 1,643,949 |
| SonoScape Medical Corp. | | 227,900 | 1,502,999 |
| Tofflon Science & Technology Group Co. Ltd. (A Shares) | | 1,291,500 | 3,349,147 |
| Venus MedTech Hangzhou, Inc. (H Shares) (a)(b) | | 2,490,882 | 1,412,971 |
| Weihai Guangwei Composites Co. Ltd. (A Shares) | | 1,026,336 | 3,595,260 |
| WuXi AppTec Co. Ltd. (H Shares) (a)(c) | | 1,410,110 | 16,944,652 |
| Wuxi Biologics (Cayman), Inc. (a)(b) | | 3,280,843 | 20,399,435 |
| Zai Lab Ltd. ADR (b) | | 121,950 | 3,073,140 |
TOTAL CHINA | | | 280,703,695 |
| Hong Kong - 2.1% | | | |
| AIA Group Ltd. | | 1,865,975 | 16,203,769 |
| Huanxi Media Group Ltd. (b)(c) | | 19,829,015 | 1,823,531 |
TOTAL HONG KONG | | | 18,027,300 |
| India - 26.0% | | | |
| Amber Enterprises India Ltd. (b) | | 79,174 | 2,791,576 |
| Aster DM Healthcare Ltd. (a)(b) | | 663,051 | 2,627,155 |
| Bajaj Finance Ltd. | | 95,102 | 8,558,489 |
| Campus Activewear Ltd. (b) | | 460,245 | 1,470,857 |
| Computer Age Management Services Private Ltd. | | 381,639 | 10,298,533 |
| Delhivery Private Ltd. (b) | | 1,590,016 | 7,890,825 |
| Devyani International Ltd. (b) | | 1,617,292 | 3,492,707 |
| HDFC Asset Management Co. Ltd. (a) | | 341,088 | 11,200,460 |
| HDFC Bank Ltd. | | 1,192,274 | 21,150,065 |
| HDFC Standard Life Insurance Co. Ltd. (a) | | 1,191,089 | 8,845,580 |
| Hindustan Aeronautics Ltd. | | 326,067 | 7,133,775 |
| Kotak Mahindra Bank Ltd. | | 198,506 | 4,148,501 |
| Larsen & Toubro Ltd. | | 137,800 | 4,847,865 |
| MakeMyTrip Ltd. (b) | | 667,045 | 25,834,653 |
| One97 Communications Ltd. (b) | | 1,857,407 | 20,549,951 |
| Page Industries Ltd. | | 5,450 | 2,475,661 |
| Reliance Industries Ltd. | | 878,996 | 24,163,263 |
| Sapphire Foods India Ltd. (b) | | 304,805 | 4,744,878 |
| SRF Ltd. | | 130,364 | 3,436,511 |
| Tata Motors Ltd. | | 1,092,284 | 8,247,585 |
| Ultratech Cement Ltd. | | 35,600 | 3,601,793 |
| Vijaya Diagnostic Centre Pvt Ltd. | | 196,617 | 1,385,075 |
| Zomato Ltd. (b) | | 29,037,091 | 36,715,929 |
TOTAL INDIA | | | 225,611,687 |
| Indonesia - 1.8% | | | |
| PT Bank Central Asia Tbk | | 16,247,993 | 8,951,355 |
| PT Bank Rakyat Indonesia (Persero) Tbk | | 20,258,698 | 6,334,569 |
TOTAL INDONESIA | | | 15,285,924 |
| Japan - 0.6% | | | |
| Money Forward, Inc. (b) | | 215,186 | 5,435,175 |
| Korea (South) - 12.1% | | | |
| ASICLAND Co. Ltd. (d) | | 700 | 12,938 |
| Coupang, Inc. Class A (b) | | 292,368 | 4,970,256 |
| Delivery Hero AG (a)(b) | | 292,551 | 7,419,871 |
| Gabia, Inc. | | 128,155 | 1,382,639 |
| Kakao Corp. | | 119,168 | 3,353,870 |
| Kakao Pay Corp. (b) | | 181,764 | 4,626,942 |
| Kia Corp. | | 50,188 | 2,863,063 |
| LG Energy Solution (b) | | 3,400 | 973,229 |
| NAVER Corp. | | 97,111 | 13,556,301 |
| Samsung Electronics Co. Ltd. | | 995,267 | 49,465,857 |
| SK Hynix, Inc. | | 192,535 | 16,695,363 |
TOTAL KOREA (SOUTH) | | | 105,320,329 |
| Netherlands - 0.9% | | | |
| Adyen BV (a)(b) | | 5,547 | 3,741,374 |
| ASML Holding NV (Netherlands) | | 7,402 | 4,449,493 |
TOTAL NETHERLANDS | | | 8,190,867 |
| Russia - 0.2% | | | |
| Yandex NV Series A (b)(c)(e) | | 153,309 | 1,671,068 |
| Singapore - 3.7% | | | |
| Oversea-Chinese Banking Corp. Ltd. | | 528,017 | 4,895,307 |
| Sea Ltd. ADR (b) | | 554,842 | 23,136,911 |
| United Overseas Bank Ltd. | | 192,400 | 3,795,032 |
TOTAL SINGAPORE | | | 31,827,250 |
| Switzerland - 0.6% | | | |
| Yunnan Botanee Bio-Technology Group Co. Ltd. ELS (UBS AG London Branch Bank Warrant Programme) Class A warrants 3/10/25 (a)(b) | | 179,025 | 1,948,940 |
| Zwsoft Co. Ltd. Guangzhou ELS (UBS AG London Branch Bank Warrant Programme) Class A warrants 9/25/25 (a)(b) | | 202,088 | 2,999,589 |
TOTAL SWITZERLAND | | | 4,948,529 |
| Taiwan - 9.8% | | | |
| Taiwan Semiconductor Manufacturing Co. Ltd. | | 4,268,892 | 69,668,064 |
| Taiwan Semiconductor Manufacturing Co. Ltd. sponsored ADR | | 91,553 | 7,901,939 |
| Unimicron Technology Corp. | | 1,731,000 | 7,714,166 |
TOTAL TAIWAN | | | 85,284,169 |
| United Kingdom - 0.8% | | | |
| Endava PLC ADR (b) | | 143,872 | 7,216,620 |
| United States of America - 5.3% | | | |
| EPAM Systems, Inc. (b) | | 32,273 | 7,021,637 |
| Frontage Holdings Corp. (a)(b) | | 16,890,490 | 4,202,779 |
| Micron Technology, Inc. | | 192,817 | 12,893,673 |
| NVIDIA Corp. | | 19,929 | 8,127,046 |
| ON Semiconductor Corp. (b) | | 92,724 | 5,808,231 |
| Snap, Inc. Class A (b) | | 379,823 | 3,802,028 |
| Space Exploration Technologies Corp. Class A (b)(e)(f) | | 11,000 | 891,000 |
| Teradyne, Inc. | | 42,388 | 3,529,649 |
TOTAL UNITED STATES OF AMERICA | | | 46,276,043 |
| Vietnam - 0.3% | | | |
| Vietnam Dairy Products Corp. | | 1,043,400 | 2,889,818 |
| TOTAL COMMON STOCKS (Cost $819,957,479) | | | 838,688,474 |
| | | | |
| Preferred Stocks - 2.0% |
| | | Shares | Value ($) |
| Convertible Preferred Stocks - 1.1% | | | |
| China - 1.1% | | | |
| ByteDance Ltd. Series E1 (b)(e)(f) | | 23,366 | 5,459,466 |
| dMed Biopharmaceutical Co. Ltd. Series C (b)(e)(f) | | 128,423 | 756,411 |
| ZKH Group Ltd. Series F (e)(f) | | 8,603,093 | 3,183,144 |
| | | | 9,399,021 |
| Nonconvertible Preferred Stocks - 0.9% | | | |
| Korea (South) - 0.9% | | | |
| Samsung Electronics Co. Ltd. | | 191,205 | 7,622,491 |
| TOTAL PREFERRED STOCKS (Cost $15,761,699) | | | 17,021,512 |
| | | | |
| Money Market Funds - 3.0% |
| | | Shares | Value ($) |
| Fidelity Cash Central Fund 5.40% (g) | | 8,973,390 | 8,975,185 |
| Fidelity Securities Lending Cash Central Fund 5.40% (g)(h) | | 16,832,852 | 16,834,536 |
| TOTAL MONEY MARKET FUNDS (Cost $25,809,720) | | | 25,809,721 |
| | | | |
| TOTAL INVESTMENT IN SECURITIES - 101.6% (Cost $861,528,898) | 881,519,707 |
NET OTHER ASSETS (LIABILITIES) - (1.6)% | (13,866,231) |
| NET ASSETS - 100.0% | 867,653,476 |
| | |
Security Type Abbreviations
| ELS | - | EQUITY-LINKED SECURITY |
Legend
| (a) | Security exempt from registration under Rule 144A of the Securities Act of 1933. These securities may be resold in transactions exempt from registration, normally to qualified institutional buyers. At the end of the period, the value of these securities amounted to $115,980,642 or 13.4% of net assets. |
| (c) | Security or a portion of the security is on loan at period end. |
| (d) | Security or a portion of the security purchased on a delayed delivery or when-issued basis. |
| (f) | Restricted securities (including private placements) - Investment in securities not registered under the Securities Act of 1933 (excluding 144A issues). At the end of the period, the value of restricted securities (excluding 144A issues) amounted to $10,290,021 or 1.2% of net assets. |
| (g) | Affiliated fund that is generally available only to investment companies and other accounts managed by Fidelity Investments. The rate quoted is the annualized seven-day yield of the fund at period end. A complete unaudited listing of the fund's holdings as of its most recent quarter end is available upon request. In addition, each Fidelity Central Fund's financial statements, which are not covered by the Fund's Report of Independent Registered Public Accounting Firm, are available on the SEC's website or upon request. |
| (h) | Investment made with cash collateral received from securities on loan. |
| Additional information on each restricted holding is as follows: |
| Security | Acquisition Date | Acquisition Cost ($) |
| ByteDance Ltd. Series E1 | 11/18/20 | 2,560,310 |
| | | |
| dMed Biopharmaceutical Co. Ltd. Series C | 12/01/20 | 1,824,011 |
| | | |
| Space Exploration Technologies Corp. Class A | 2/16/21 | 461,989 |
| | | |
| ZKH Group Ltd. Series F | 2/24/22 | 4,868,356 |
| | | |
Affiliated Central Funds
Fiscal year to date information regarding the Fund's investments in Fidelity Central Funds, including the ownership percentage, is presented below.
| Affiliate | Value, beginning of period ($) | Purchases ($) | Sales Proceeds ($) | Dividend Income ($) | Realized Gain (loss) ($) | Change in Unrealized appreciation (depreciation) ($) | Value, end of period ($) | % ownership, end of period |
| Fidelity Cash Central Fund 5.40% | 180,369 | 297,117,599 | 288,322,783 | 528,614 | - | - | 8,975,185 | 0.0% |
| Fidelity Securities Lending Cash Central Fund 5.40% | 32,545,160 | 253,143,357 | 268,853,982 | 701,320 | - | 1 | 16,834,536 | 0.1% |
| Total | 32,725,529 | 550,260,956 | 557,176,765 | 1,229,934 | - | 1 | 25,809,721 | |
| | | | | | | | | |
Amounts in the dividend income column in the above table include any capital gain distributions from underlying funds, which are presented in the corresponding line item in the Statement of Operations, if applicable.
Amounts in the dividend income column for Fidelity Securities Lending Cash Central Fund represents the income earned on investing cash collateral, less rebates paid to borrowers and any lending agent fees associated with the loan, plus any premium payments received for lending certain types of securities.
Amounts included in the purchases and sales proceeds columns may include in-kind transactions, if applicable.
Investment Valuation
The following is a summary of the inputs used, as of October 31, 2023, involving the Fund's assets and liabilities carried at fair value. The inputs or methodology used for valuing securities may not be an indication of the risk associated with investing in those securities. For more information on valuation inputs, and their aggregation into the levels used below, please refer to the Investment Valuation section in the accompanying Notes to Financial Statements.
| Valuation Inputs at Reporting Date: |
| Description | Total ($) | Level 1 ($) | Level 2 ($) | Level 3 ($) |
Investments in Securities: | | | | |
|
| Equities: | | | | |
Communication Services | 54,751,012 | 27,526,631 | 20,093,847 | 7,130,534 |
Consumer Discretionary | 218,193,185 | 88,503,437 | 129,689,748 | - |
Consumer Staples | 7,751,913 | 1,269,206 | 6,482,707 | - |
Energy | 24,163,263 | - | 24,163,263 | - |
Financials | 123,670,276 | - | 123,670,276 | - |
Health Care | 112,991,564 | 3,073,140 | 109,162,013 | 756,411 |
Industrials | 46,136,745 | - | 45,245,745 | 891,000 |
Information Technology | 254,235,320 | 59,148,041 | 195,087,279 | - |
Materials | 10,633,564 | - | 10,633,564 | - |
Real Estate | 3,183,144 | - | - | 3,183,144 |
|
| Money Market Funds | 25,809,721 | 25,809,721 | - | - |
| Total Investments in Securities: | 881,519,707 | 205,330,176 | 664,228,442 | 11,961,089 |
The following is a reconciliation of Investments in Securities for which Level 3 inputs were used in determining value:
| |
| Investments in Securities: | |
| Beginning Balance | $ | 12,231,826 | |
| Net Realized Gain (Loss) on Investment Securities | | (8,816,223) | |
| Net Unrealized Gain (Loss) on Investment Securities | | 9,439,600 | |
| Cost of Purchases | | - | |
| Proceeds of Sales | | (894,114) | |
| Amortization/Accretion | | - | |
| Transfers into Level 3 | | - | |
| Transfers out of Level 3 | | - | |
| Ending Balance | $ | 11,961,089 | |
| The change in unrealized gain (loss) for the period attributable to Level 3 securities held at October 31, 2023 | $ | 975,891 | |
| The information used in the above reconciliation represents fiscal year to date activity for any Investments in Securities identified as using Level 3 inputs at either the beginning or the end of the current fiscal period. Cost of purchases and proceeds of sales may include securities received and/or delivered through in-kind transactions, corporate actions or exchanges. Transfers into Level 3 were attributable to a lack of observable market data resulting from decreases in market activity, decreases in liquidity, security restructurings or corporate actions. Transfers out of Level 3 were attributable to observable market data becoming available for those securities. Transfers in or out of Level 3 represent the beginning value of any Security or Instrument where a change in the pricing level occurred from the beginning to the end of the period. Realized and unrealized gains (losses) disclosed in the reconciliation are included in Net Gain (Loss) on the Fund's Statement of Operations. | |
Fidelity® Emerging Asia Fund
| Statement of Assets and Liabilities |
| | | | October 31, 2023 |
| | | | | |
| Assets | | | | |
| Investment in securities, at value (including securities loaned of $15,153,432) - See accompanying schedule: | | | | |
Unaffiliated issuers (cost $835,719,178) | $ | 855,709,986 | | |
Fidelity Central Funds (cost $25,809,720) | | 25,809,721 | | |
| | | | | |
| | | | | |
| Total Investment in Securities (cost $861,528,898) | | | $ | 881,519,707 |
| Foreign currency held at value (cost $3,404,442) | | | | 3,403,995 |
| Receivable for investments sold | | | | 5,997,886 |
| Receivable for fund shares sold | | | | 124,971 |
| Dividends receivable | | | | 461,745 |
| Distributions receivable from Fidelity Central Funds | | | | 111,952 |
| Prepaid expenses | | | | 1,341 |
| Other receivables | | | | 697,946 |
Total assets | | | | 892,319,543 |
| Liabilities | | | | |
| Payable for investments purchased | | | | |
Regular delivery | $ | 944,069 | | |
Delayed delivery | | 13,068 | | |
| Payable for fund shares redeemed | | 225,039 | | |
| Accrued management fee | | 242,397 | | |
| Other affiliated payables | | 182,849 | | |
| Deferred taxes | | 5,555,982 | | |
| Other payables and accrued expenses | | 666,898 | | |
| Collateral on securities loaned | | 16,835,765 | | |
| Total Liabilities | | | | 24,666,067 |
| Net Assets | | | $ | 867,653,476 |
| Net Assets consist of: | | | | |
| Paid in capital | | | $ | 1,162,849,855 |
| Total accumulated earnings (loss) | | | | (295,196,379) |
| Net Assets | | | $ | 867,653,476 |
Net Asset Value, offering price and redemption price per share ($867,653,476 ÷ 24,122,845 shares) | | | $ | 35.97 |
| Statement of Operations |
| | | | Year ended October 31, 2023 |
| Investment Income | | | | |
| Dividends | | | $ | 9,730,846 |
| Income from Fidelity Central Funds (including $701,320 from security lending) | | | | 1,229,934 |
| Income before foreign taxes withheld | | | $ | 10,960,780 |
| Less foreign taxes withheld | | | | (1,338,023) |
| Total Income | | | | 9,622,757 |
| Expenses | | | | |
| Management fee | | | | |
| Basic fee | $ | 6,519,766 | | |
| Performance adjustment | | (799,155) | | |
| Transfer agent fees | | 1,881,724 | | |
| Accounting fees | | 433,106 | | |
| Custodian fees and expenses | | 214,696 | | |
| Independent trustees' fees and expenses | | 5,692 | | |
| Registration fees | | 24,952 | | |
| Audit | | 116,948 | | |
| Legal | | 2,334 | | |
| Interest | | 4,608 | | |
| Miscellaneous | | 4,829 | | |
| Total expenses before reductions | | 8,409,500 | | |
| Expense reductions | | (58,122) | | |
| Total expenses after reductions | | | | 8,351,378 |
| Net Investment income (loss) | | | | 1,271,379 |
| Realized and Unrealized Gain (Loss) | | | | |
| Net realized gain (loss) on: | | | | |
| Investment Securities: | | | | |
| Unaffiliated issuers (net of foreign taxes of $1,673,299) | | (172,544,781) | | |
| Foreign currency transactions | | (112,695) | | |
| Total net realized gain (loss) | | | | (172,657,476) |
| Change in net unrealized appreciation (depreciation) on: | | | | |
| Investment Securities: | | | | |
| Unaffiliated issuers(net of increase in deferred foreign taxes of $2,109,859) | | 329,086,174 | | |
| Fidelity Central Funds | | 1 | | |
| Assets and liabilities in foreign currencies | | 135,392 | | |
| Total change in net unrealized appreciation (depreciation) | | | | 329,221,567 |
| Net gain (loss) | | | | 156,564,091 |
| Net increase (decrease) in net assets resulting from operations | | | $ | 157,835,470 |
| Statement of Changes in Net Assets |
| |
| | Year ended October 31, 2023 | | Year ended October 31, 2022 |
| Increase (Decrease) in Net Assets | | | | |
| Operations | | | | |
| Net investment income (loss) | $ | 1,271,379 | $ | (6,406,902) |
| Net realized gain (loss) | | (172,657,476) | | (135,551,761) |
| Change in net unrealized appreciation (depreciation) | | 329,221,567 | | (672,888,572) |
| Net increase (decrease) in net assets resulting from operations | | 157,835,470 | | (814,847,235) |
| Distributions to shareholders | | - | | (218,312,620) |
| | | | | |
| Share transactions | | | | |
| Proceeds from sales of shares | | 89,917,598 | | 116,575,535 |
| Reinvestment of distributions | | - | | 202,673,713 |
| Cost of shares redeemed | | (203,626,450) | | (462,682,896) |
| | | | | |
Net increase (decrease) in net assets resulting from share transactions | | (113,708,852) | | (143,433,648) |
| Total increase (decrease) in net assets | | 44,126,618 | | (1,176,593,503) |
| | | | | |
| Net Assets | | | | |
| Beginning of period | | 823,526,858 | | 2,000,120,361 |
| End of period | $ | 867,653,476 | $ | 823,526,858 |
| | | | | |
| Other Information | | | | |
| Shares | | | | |
| Sold | | 2,379,648 | | 2,698,029 |
| Issued in reinvestment of distributions | | - | | 3,879,665 |
| Redeemed | | (5,497,734) | | (10,270,869) |
| Net increase (decrease) | | (3,118,086) | | (3,693,175) |
| | | | | |
Financial Highlights
| Fidelity® Emerging Asia Fund |
| |
| Years ended October 31, | | 2023 | | 2022 | | 2021 | | 2020 | | 2019 |
Selected Per-Share Data | | | | | | | | | | |
| Net asset value, beginning of period | $ | 30.23 | $ | 64.66 | $ | 63.60 | $ | 45.03 | $ | 36.69 |
| Income from Investment Operations | | | | | | | | | | |
Net investment income (loss) A,B | | .05 | | (.22) | | (.31) C | | (.12) | | .34 |
| Net realized and unrealized gain (loss) | | 5.69 | | (26.97) | | 11.00 | | 21.49 | | 9.27 |
| Total from investment operations | | 5.74 | | (27.19) | | 10.69 | | 21.37 | | 9.61 |
| Distributions from net investment income | | - | | (.09) | | - | | (.29) D | | (.39) |
| Distributions from net realized gain | | - | | (7.15) | | (9.63) | | (2.51) D | | (.88) |
| Total distributions | | - | | (7.24) | | (9.63) | | (2.80) | | (1.27) |
| Net asset value, end of period | $ | 35.97 | $ | 30.23 | $ | 64.66 | $ | 63.60 | $ | 45.03 |
Total Return E | | 18.99% | | (46.77)% | | 17.02% | | 50.46% | | 26.95% |
Ratios to Average Net Assets B,F,G | | | | | | | | | | |
| Expenses before reductions | | .87% | | 1.18% | | 1.02% | | 1.13% | | 1.11% |
| Expenses net of fee waivers, if any | | .87% | | 1.17% | | 1.02% | | 1.13% | | 1.11% |
| Expenses net of all reductions | | .87% | | 1.17% | | 1.02% | | 1.10% | | 1.11% |
| Net investment income (loss) | | .13% | | (.51)% | | (.45)% C | | (.24)% | | .82% |
| Supplemental Data | | | | | | | | | | |
| Net assets, end of period (000 omitted) | $ | 867,653 | $ | 823,527 | $ | 2,000,120 | $ | 1,578,782 | $ | 993,620 |
Portfolio turnover rate H | | 50% | | 44% | | 85% | | 114% | | 61% I |
ACalculated based on average shares outstanding during the period.
BNet investment income (loss) is affected by the timing of the declaration of dividends by any underlying mutual funds or exchange-traded funds (ETFs). Net investment income (loss) of any mutual funds or ETFs is not included in the Fund's net investment income (loss) ratio.
CNet investment income per share reflects one or more large, non-recurring dividend(s) which amounted to $.06 per share. Excluding such non-recurring dividend(s), the ratio of net investment income (loss) to average net assets would have been (.54)%.
DThe amount shown reflects reclassifications related to book to tax differences that were made in the year shown.
ETotal returns would have been lower if certain expenses had not been reduced during the applicable periods shown.
FFees and expenses of any underlying mutual funds or exchange-traded funds (ETFs) are not included in the Fund's expense ratio. The Fund indirectly bears its proportionate share of these expenses. For additional expense information related to investments in Fidelity Central Funds, please refer to the "Investments in Fidelity Central Funds" note found in the Notes to Financial Statements section of the most recent Annual or Semi-Annual report.
GExpense ratios reflect operating expenses of the class. Expenses before reductions do not reflect amounts reimbursed, waived, or reduced through arrangements with the investment adviser, brokerage services, or other offset arrangements, if applicable, and do not represent the amount paid by the class during periods when reimbursements, waivers or reductions occur.
HAmount does not include the portfolio activity of any underlying mutual funds or exchange-traded funds (ETFs).
IPortfolio turnover rate excludes securities received or delivered in-kind.
For the period ended October 31, 2023
1. Organization.
Fidelity Emerging Asia Fund (the Fund) is a fund of Fidelity Investment Trust (the Trust) and is authorized to issue an unlimited number of shares. Share transactions on the Statement of Changes in Net Assets may contain exchanges between affiliated funds. The Trust is registered under the Investment Company Act of 1940, as amended (the 1940 Act), as an open-end management investment company organized as a Massachusetts business trust. The Fund's investments in emerging markets can be subject to social, economic, regulatory, and political uncertainties and can be extremely volatile.
2. Investments in Fidelity Central Funds.
Funds may invest in Fidelity Central Funds, which are open-end investment companies generally available only to other investment companies and accounts managed by the investment adviser and its affiliates. The Schedule of Investments lists any Fidelity Central Funds held as an investment as of period end, but does not include the underlying holdings of each Fidelity Central Fund. An investing fund indirectly bears its proportionate share of the expenses of the underlying Fidelity Central Funds.
Based on its investment objective, each Fidelity Central Fund may invest or participate in various investment vehicles or strategies that are similar to those of the investing fund. These strategies are consistent with the investment objectives of the investing fund and may involve certain economic risks which may cause a decline in value of each of the Fidelity Central Funds and thus a decline in the value of the investing fund.
| Fidelity Central Fund | Investment Manager | Investment Objective | Investment Practices | Expense RatioA |
| Fidelity Money Market Central Funds | Fidelity Management & Research Company LLC (FMR) | Each fund seeks to obtain a high level of current income consistent with the preservation of capital and liquidity. | Short-term Investments | Less than .005% |
A Expenses expressed as a percentage of average net assets and are as of each underlying Central Fund's most recent annual or semi-annual shareholder report.
A complete unaudited list of holdings for each Fidelity Central Fund is available upon request or at the Securities and Exchange Commission website at www.sec.gov. In addition, the financial statements of the Fidelity Central Funds which contain the significant accounting policies (including investment valuation policies) of those funds, and are not covered by the Report of Independent Registered Public Accounting Firm, are available on the Securities and Exchange Commission website or upon request.
3. Significant Accounting Policies.
The Fund is an investment company and applies the accounting and reporting guidance of the Financial Accounting Standards Board (FASB) Accounting Standards Codification Topic 946 Financial Services - Investment Companies. The financial statements have been prepared in conformity with accounting principles generally accepted in the United States of America (GAAP), which require management to make certain estimates and assumptions at the date of the financial statements. Actual results could differ from those estimates. Subsequent events, if any, through the date that the financial statements were issued have been evaluated in the preparation of the financial statements. The Fund's Schedule of Investments lists any underlying mutual funds or exchange-traded funds (ETFs) but does not include the underlying holdings of these funds. The following summarizes the significant accounting policies of the Fund:
Investment Valuation. Investments are valued as of 4:00 p.m. Eastern time on the last calendar day of the period. The Board of Trustees (the Board) has designated the Fund's investment adviser as the valuation designee responsible for the fair valuation function and performing fair value determinations as needed. The investment adviser has established a Fair Value Committee (the Committee) to carry out the day-to-day fair valuation responsibilities and has adopted policies and procedures to govern the fair valuation process and the activities of the Committee. In accordance with these fair valuation policies and procedures, which have been approved by the Board, the Fund attempts to obtain prices from one or more third party pricing services or brokers to value its investments. When current market prices, quotations or currency exchange rates are not readily available or reliable, investments will be fair valued in good faith by the Committee, in accordance with the policies and procedures. Factors used in determining fair value vary by investment type and may include market or investment specific events, transaction data, estimated cash flows, and market observations of comparable investments. The frequency that the fair valuation procedures are used cannot be predicted and they may be utilized to a significant extent. The Committee manages the Fund's fair valuation practices and maintains the fair valuation policies and procedures. The Fund's investment adviser reports to the Board information regarding the fair valuation process and related material matters.
The Fund categorizes the inputs to valuation techniques used to value its investments into a disclosure hierarchy consisting of three levels as shown below:
Level 1 - unadjusted quoted prices in active markets for identical investments
Level 2 - other significant observable inputs (including quoted prices for similar investments, interest rates, prepayment speeds, etc.)
Level 3 - unobservable inputs (including the Fund's own assumptions based on the best information available)
Valuation techniques used to value the Fund's investments by major category are as follows:
Equity securities, including restricted securities, for which market quotations are readily available, are valued at the last reported sale price or official closing price as reported by a third party pricing service on the primary market or exchange on which they are traded and are categorized as Level 1 in the hierarchy. In the event there were no sales during the day or closing prices are not available, securities are valued at the last quoted bid price or may be valued using the last available price and are generally categorized as Level 2 in the hierarchy. For foreign equity securities, when market or security specific events arise, comparisons to the valuation of American Depositary Receipts (ADRs), futures contracts, ETFs and certain indexes as well as quoted prices for similar securities may be used and would be categorized as Level 2 in the hierarchy. For equity securities, including restricted securities, where observable inputs are limited, assumptions about market activity and risk are used and these securities may be categorized as Level 3 in the hierarchy. Securities, including private placements or other restricted securities, for which observable inputs are not available are valued using alternate valuation approaches, including the market approach, the income approach and cost approach, and are categorized as Level 3 in the hierarchy. The market approach considers factors including the price of recent investments in the same or a similar security or financial metrics of comparable securities. The income approach considers factors including expected future cash flows, security specific risks and corresponding discount rates. The cost approach considers factors including the value of the security's underlying assets and liabilities.
Investments in open-end mutual funds, including the Fidelity Central Funds, are valued at their closing net asset value (NAV) each business day and are categorized as Level 1 in the hierarchy.
The following provides information on Level 3 securities held by the Fund that were valued at period end based on unobservable inputs. These amounts exclude valuations provided by a broker.
| Asset Type | Fair Value | Valuation Technique(s) | Unobservable Input | Amount or Range/Weighted Average | Impact to Valuation from an Increase in InputA |
| Equities | $11,961,089 | Market comparable | Enterprise value/EBITDA multiple (EV/EBITDA) | 13.1 | Increase |
| | | | Enterprise value/Revenue multiple (EV/R) | 1.2 - 4.0 / 2.9 | Increase |
| | | Market approach | Discount rate | 20.0% | Decrease |
| | | Black scholes | Discount rate | 4.9% | Increase |
| | | | Volatility | 60.0% | Increase |
| | | | Term | 3.0 | Increase |
A Represents the directional change in the fair value of the Level 3 investments that could have resulted from an increase in the corresponding input as of period end. A decrease to the unobservable input would have had the opposite effect. Significant changes in these inputs may have resulted in a significantly higher or lower fair value measurement at period end.
Changes in valuation techniques may result in transfers in or out of an assigned level within the disclosure hierarchy. The aggregate value of investments by input level as of October 31, 2023, as well as a roll forward of Level 3 investments, is included at the end of the Fund's Schedule of Investments.
Foreign Currency. Certain Funds may use foreign currency contracts to facilitate transactions in foreign-denominated securities. Gains and losses from these transactions may arise from changes in the value of the foreign currency or if the counterparties do not perform under the contracts' terms.
Foreign-denominated assets, including investment securities, and liabilities are translated into U.S. dollars at the exchange rates at period end. Purchases and sales of investment securities, income and dividends received, and expenses denominated in foreign currencies are translated into U.S. dollars at the exchange rate in effect on the transaction date.
The effects of exchange rate fluctuations on investments are included with the net realized and unrealized gain (loss) on investment securities. Other foreign currency transactions resulting in realized and unrealized gain (loss) are disclosed separately.
Investment Transactions and Income. For financial reporting purposes, the Fund's investment holdings and NAV include trades executed through the end of the last business day of the period. The NAV per share for processing shareholder transactions is calculated as of the close of business of the New York Stock Exchange (NYSE), normally 4:00 p.m. Eastern time and includes trades executed through the end of the prior business day. Gains and losses on securities sold are determined on the basis of identified cost and include proceeds received from litigation. Commissions paid to certain brokers with whom the investment adviser, or its affiliates, places trades on behalf of a fund include an amount in addition to trade execution, which may be rebated back to a fund. Any such rebates are included in net realized gain (loss) on investments in the Statement of Operations. Dividend income is recorded on the ex-dividend date, except for certain dividends from foreign securities where the ex-dividend date may have passed, which are recorded as soon as the Fund is informed of the ex-dividend date. Non-cash dividends included in dividend income, if any, are recorded at the fair market value of the securities received. Income and capital gain distributions from Fidelity Central Funds, if any, are recorded on the ex-dividend date. Investment income is recorded net of foreign taxes withheld where recovery of such taxes is uncertain. Funds may file withholding tax reclaims in certain jurisdictions to recover a portion of amounts previously withheld. Any withholding tax reclaims income is included in the Statement of Operations in foreign taxes withheld. Any receivables for withholding tax reclaims are included in the Statement of Assets and Liabilities in dividends receivable.
Expenses. Expenses directly attributable to a fund are charged to that fund. Expenses attributable to more than one fund are allocated among the respective funds on the basis of relative net assets or other appropriate methods. Expenses included in the accompanying financial statements reflect the expenses of that fund and do not include any expenses associated with any underlying mutual funds or exchange-traded funds. Although not included in a fund's expenses, a fund indirectly bears its proportionate share of these expenses through the net asset value of each underlying mutual fund or exchange-traded fund. Expense estimates are accrued in the period to which they relate and adjustments are made when actual amounts are known.
Income Tax Information and Distributions to Shareholders. Each year, the Fund intends to qualify as a regulated investment company under Subchapter M of the Internal Revenue Code, including distributing substantially all of its taxable income and realized gains. As a result, no provision for U.S. Federal income taxes is required. As of October 31, 2023, the Fund did not have any unrecognized tax benefits in the financial statements; nor is the Fund aware of any tax positions for which it is reasonably possible that the total amounts of unrecognized tax benefits will significantly change in the next twelve months. The Fund files a U.S. federal tax return, in addition to state and local tax returns as required. The Fund's federal income tax returns are subject to examination by the Internal Revenue Service (IRS) for a period of three fiscal years after they are filed. State and local tax returns may be subject to examination for an additional fiscal year depending on the jurisdiction. Foreign taxes are provided for based on the Fund's understanding of the tax rules and rates that exist in the foreign markets in which it invests. The Fund is subject to a tax imposed on capital gains by certain countries in which it invests. An estimated deferred tax liability for net unrealized appreciation on the applicable securities is included in Deferred taxes on the Statement of Assets & Liabilities.
Distributions are declared and recorded on the ex-dividend date. Income and capital gain distributions are determined in accordance with income tax regulations, which may differ from GAAP.
Capital accounts within the financial statements are adjusted for permanent book-tax differences. These adjustments have no impact on net assets or the results of operations. Capital accounts are not adjusted for temporary book-tax differences which will reverse in a subsequent period.
Book-tax differences are primarily due to foreign currency transactions, certain foreign taxes, passive foreign investment companies (PFIC), net operating losses, capital loss carryforwards and losses deferred due to wash sales and excise tax regulations.
As of period end, the cost and unrealized appreciation (depreciation) in securities, and derivatives if applicable, for federal income tax purposes were as follows:
| Gross unrealized appreciation | $219,872,867 |
| Gross unrealized depreciation | (201,029,120) |
| Net unrealized appreciation (depreciation) | $18,843,747 |
| Tax Cost | $862,675,960 |
The tax-based components of distributable earnings as of period end were as follows:
| Capital loss carryforward | $(307,955,975) |
| Net unrealized appreciation (depreciation) on securities and other investments | $18,315,578 |
Capital loss carryforwards are only available to offset future capital gains of the Fund to the extent provided by regulations and may be limited. The capital loss carryforward information presented below, including any applicable limitation, is estimated as of fiscal period end and is subject to adjustment.
Short-term | $(114,943,944) |
Long-term | (193,012,031) |
| Total capital loss carryforward | $(307,955,975) |
The tax character of distributions paid was as follows:
| | October 31, 2023 | October 31, 2022 |
| Ordinary Income | $- | $2,682,937 |
| Long-term Capital Gains | - | 215,629,683 |
| Total | $- | $218,312,620 |
Delayed Delivery Transactions and When-Issued Securities. During the period, certain Funds transacted in securities on a delayed delivery or when-issued basis. Payment and delivery may take place after the customary settlement period for that security. The price of the underlying securities and the date when the securities will be delivered and paid for are fixed at the time the transaction is negotiated. Securities purchased on a delayed delivery or when-issued basis are identified as such in the Schedule of Investments. Compensation for interest forgone in the purchase of a delayed delivery or when-issued debt security may be received. With respect to purchase commitments, each applicable Fund identifies securities as segregated in its records with a value at least equal to the amount of the commitment. Payables and receivables associated with the purchases and sales of delayed delivery securities having the same coupon, settlement date and broker are offset. Delayed delivery or when-issued securities that have been purchased from and sold to different brokers are reflected as both payables and receivables in the Statement of Assets and Liabilities under the caption "Delayed delivery", as applicable. Losses may arise due to changes in the value of the underlying securities or if the counterparty does not perform under the contract's terms, or if the issuer does not issue the securities due to political, economic, or other factors.
Restricted Securities (including Private Placements). Funds may invest in securities that are subject to legal or contractual restrictions on resale. These securities generally may be resold in transactions exempt from registration or to the public if the securities are registered. Disposal of these securities may involve time-consuming negotiations and expense, and prompt sale at an acceptable price may be difficult. Information regarding restricted securities held at period end is included at the end of the Schedule of Investments, if applicable.
New Accounting Pronouncement. In June 2022, the Financial Accounting Standards Board (FASB) issued Accounting Standards Update (ASU) 2022-03 Fair Value Measurement (Topic 820): Fair Value Measurement of Equity Securities Subject to Contractual Sale Restrictions. The amendments in this ASU clarify that a contractual restriction on the sale of an equity security is not considered part of the unit of account of the equity security and, therefore, is not considered in measuring fair value. They also clarify that an entity cannot, as a separate unit of account, recognize and measure a contractual sale restriction. They also require additional disclosures for equity securities subject to contractual sale restrictions. ASU 2022-03 will be effective for fiscal years, including interim periods within those fiscal years, beginning after December 15, 2023, and allows for early adoption. ASU 2022-03 will only be applicable to an equity security in which the contractual arrangement that restricts its sale is executed or modified on or after the adoption date. Management is currently evaluating the potential impact of ASU 2022-03 to the financial statements.
4. Purchases and Sales of Investments.
Purchases and sales of securities, other than short-term securities and in-kind transactions, as applicable, are noted in the table below.
| | Purchases ($) | Sales ($) |
| Fidelity Emerging Asia Fund | 468,155,515 | 601,552,046 |
5. Fees and Other Transactions with Affiliates.
Management Fee. Fidelity Management & Research Company LLC (the investment adviser) and its affiliates provide the Fund with investment management related services for which the Fund pays a monthly management fee. The management fee is the sum of an individual fund fee rate that is based on an annual rate of .45% of the Fund's average net assets and an annualized group fee rate that averaged .23% during the period. The group fee rate is based upon the monthly average net assets of a group of registered investment companies with which the investment adviser has management contracts. The group fee rate decreases as assets under management increase and increases as assets under management decrease. In addition, the management fee is subject to a performance adjustment (up to a maximum of +/- .20% of the Fund's average net assets over a 36 month performance period). The upward or downward adjustment to the management fee is based on the Fund's relative investment performance as compared to its benchmark index, the MSCI All Country Asia ex Japan Index, over the same 36 month performance period. For the reporting period, the total annual management fee rate, including the performance adjustment, was .59% of the Fund's average net assets. The performance adjustment included in the management fee rate may be higher or lower than the maximum performance adjustment rate due to the difference between the average net assets for the reporting and performance periods.
Transfer Agent Fees. Fidelity Investments Institutional Operations Company LLC (FIIOC), an affiliate of the investment adviser, is the Fund's transfer, dividend disbursing and shareholder servicing agent. FIIOC receives account fees and asset-based fees that vary according to account size and type of account. FIIOC pays for typesetting, printing and mailing of shareholder reports, except proxy statements. For the period, the transfer agent fees were equivalent to an annual rate of .20% of average net assets.
During November 2023, the Board approved a change in the transfer agent fees effective December 1, 2023 to a fixed annual rate of 0.1908% of average net assets.
Accounting Fees. Fidelity Service Company, Inc. (FSC), an affiliate of the investment adviser, maintains the Fund's accounting records. The accounting fee is based on the level of average net assets for each month. For the period, the fees were equivalent to the following annual rates:
| | % of Average Net Assets |
| Fidelity Emerging Asia Fund | .04 |
During November 2023, the Board approved a change in the accounting fees effective December 1, 2023 to a fixed annual rate of average net assets as follows:
| | % of Average Net Assets |
| Fidelity Emerging Asia Fund | 0.0447 |
Brokerage Commissions. A portion of portfolio transactions were placed with brokerage firms which are affiliates of the investment adviser. Brokerage commissions are included in net realized gain (loss) and change in net unrealized appreciation (depreciation) in the Statement of Operations. The commissions paid to these affiliated firms were as follows:
| | Amount |
| Fidelity Emerging Asia Fund | $5,145 |
Interfund Lending Program. Pursuant to an Exemptive Order issued by the Securities and Exchange Commission (the SEC), the Fund, along with other registered investment companies having management contracts with Fidelity Management & Research Company LLC (FMR), or other affiliated entities of FMR, may participate in an interfund lending program. This program provides an alternative credit facility allowing the Fund to borrow from, or lend money to, other participating affiliated funds. At period end, there were no interfund loans outstanding. Activity in this program during the period for which loans were outstanding was as follows:
| | Borrower or Lender | Average Loan Balance | Weighted Average Interest Rate | Interest Expense |
| Fidelity Emerging Asia Fund | Borrower | $4,093,875 | 5.07% | $4,608 |
Interfund Trades. Funds may purchase from or sell securities to other Fidelity Funds under procedures adopted by the Board. The procedures have been designed to ensure these interfund trades are executed in accordance with Rule 17a-7 of the 1940 Act. Any interfund trades are included within the respective purchases and sales amounts shown in the Purchases and Sales of Investments note. Interfund trades during the period are noted in the table below.
| | Purchases ($) | Sales ($) | Realized Gain (Loss) ($) |
| Fidelity Emerging Asia Fund | 3,456,202 | 13,435,211 | (8,327,375) |
6. Committed Line of Credit.
Certain Funds participate with other funds managed by the investment adviser or an affiliate in a $4.25 billion credit facility (the "line of credit") to be utilized for temporary or emergency purposes to fund shareholder redemptions or for other short-term liquidity purposes. The participating funds have agreed to pay commitment fees on their pro-rata portion of the line of credit, which are reflected in Miscellaneous expenses on the Statement of Operations, and are listed below. During the period, there were no borrowings on this line of credit.
| | Amount |
| Fidelity Emerging Asia Fund | $1,757 |
7. Security Lending.
Funds lend portfolio securities from time to time in order to earn additional income. Lending agents are used, including National Financial Services (NFS), an affiliate of the investment adviser. Pursuant to a securities lending agreement, NFS will receive a fee, which is capped at 9.9% of a fund's daily lending revenue, for its services as lending agent. A fund may lend securities to certain qualified borrowers, including NFS. On the settlement date of the loan, a fund receives collateral (in the form of U.S. Treasury obligations, letters of credit and/or cash) against the loaned securities and maintains collateral in an amount not less than 100% of the market value of the loaned securities during the period of the loan. The market value of the loaned securities is determined at the close of business of a fund and any additional required collateral is delivered to a fund on the next business day. A fund or borrower may terminate the loan at any time, and if the borrower defaults on its obligation to return the securities loaned because of insolvency or other reasons, a fund may apply collateral received from the borrower against the obligation. A fund may experience delays and costs in recovering the securities loaned. Any cash collateral received is invested in the Fidelity Securities Lending Cash Central Fund. Any loaned securities are identified as such in the Schedule of Investments, and the value of loaned securities and cash collateral at period end, as applicable, are presented in the Statement of Assets and Liabilities. Security lending income represents the income earned on investing cash collateral, less rebates paid to borrowers and any lending agent fees associated with the loan, plus any premium payments received for lending certain types of securities. Security lending income is presented in the Statement of Operations as a component of income from Fidelity Central Funds. Affiliated security lending activity, if any, was as follows:
| | Total Security Lending Fees Paid to NFS | Security Lending Income From Securities Loaned to NFS | Value of Securities Loaned to NFS at Period End |
| Fidelity Emerging Asia Fund | $75,023 | $- | $- |
8. Expense Reductions.
In addition, during the period the investment adviser or an affiliate reimbursed and/or waived a portion of operating expenses in the amount of $58,122.
9. Other.
A fund's organizational documents provide former and current trustees and officers with a limited indemnification against liabilities arising in connection with the performance of their duties to the fund. In the normal course of business, a fund may also enter into contracts that provide general indemnifications. A fund's maximum exposure under these arrangements is unknown as this would be dependent on future claims that may be made against a fund. The risk of material loss from such claims is considered remote.
10. Risk and Uncertainties.
Many factors affect a fund's performance. Developments that disrupt global economies and financial markets, such as pandemics, epidemics, outbreaks of infectious diseases, war, terrorism, and environmental disasters, may significantly affect a fund's investment performance. The effects of these developments to a fund will be impacted by the types of securities in which a fund invests, the financial condition, industry, economic sector, and geographic location of an issuer, and a fund's level of investment in the securities of that issuer. Significant concentrations in security types, issuers, industries, sectors, and geographic locations may magnify the factors that affect a fund's performance.
Average annual total return reflects the change in the value of an investment, assuming reinvestment of distributions from dividend income and capital gains (the profits earned upon the sale of securities that have grown in value, if any) and assuming a constant rate of performance each year. The hypothetical investment and the average annual total returns do not reflect the deduction of taxes that a shareholder would pay on fund distributions or the redemption of fund shares. During periods of reimbursement by Fidelity, a fund's total return will be greater than it would be had the reimbursement not occurred. How a fund did yesterday is no guarantee of how it will do tomorrow.
| Average Annual Total Returns |
| | | | |
Periods ended October 31, 2023 | Past 1 year | Past 5 years | Past 10 years |
Class A (incl. 5.75% sales charge) | 8.56% | 4.53% | 3.39% |
Class M (incl. 3.50% sales charge) | 10.87% | 4.88% | 3.57% |
Class C (incl. contingent deferred sales charge) | 13.32% | 5.37% | 3.81% |
| Fidelity® Emerging Markets Fund | 15.56% | 5.94% | 4.09% |
| Class K | 15.69% | 6.07% | 4.25% |
| Class I | 15.54% | 5.94% | 4.09% |
| Class Z | 15.67% | 6.00% | 4.12% |
Class A shares bear a 0.25% 12b-1 fee. The initial offering of Class A shares took place on May 11, 2021. Returns prior to May 11, 2021, are those of Fidelity® Emerging Markets Fund, the original class of the fund, which has no 12b-1 fee. Had Class A's 12b-1 fee been reflected, returns prior to May 11, 2021, would have been lower.
Class M shares bear a 0.50% 12b-1 fee. The initial offering of Class M shares took place on May 11, 2021. Returns prior to May 11, 2021, are those of Fidelity® Emerging Markets Fund, the original class of the fund, which has no 12b-1 fee. Had Class M's 12b-1 fee been reflected, returns prior to May 11, 2021, would have been lower.
Class C shares bear a 1.00% 12b-1 fee. The initial offering of Class C shares took place on May 11, 2021. Returns prior to May 11, 2021, are those of Fidelity® Emerging Markets Fund, the original class of the fund, which has no 12b-1 fee. Had Class C's 12b-1 fee been reflected, returns prior to May 11, 2021, would have been lower.
Class C shares' contingent deferred sales charges included in the past one year, past five years and past ten years total return figures are 1%, 0% and 0%, respectively.
The initial offering of Class I shares took place on May 11, 2021. Returns prior to May 11, 2021, are those of Fidelity® Emerging Markets Fund, the original class of the fund.
The initial offering of Class Z shares took place on May 11, 2021. Returns prior to May 11, 2021, are those of Fidelity® Emerging Markets Fund, the original class of the fund.
| $10,000 Over 10 Years |
| |
Let's say hypothetically that $10,000 was invested in Fidelity® Emerging Markets Fund, a class of the fund, on October 31, 2013. The chart shows how the value of your investment would have changed, and also shows how the MSCI Emerging Markets Index performed over the same period. |
|
|
Fidelity® Emerging Markets Fund
Market Recap:
International (non-U.S.) equities gained 12.27% for the 12 months ending October 31, 2023, according to the MSCI ACWI (All Country World Index) ex USA Index, as global economic expansion and a slowing in the pace of inflation in some markets provided a favorable backdrop for risk assets. After returning -15.86% in 2022, the index's upturn has been largely driven by a narrow set of companies in the information technology and communication services sectors, in part due to excitement for generative artificial intelligence applications. The index gained 14.07% year to date through July, including strong gains in both June (+4.50%) and July (+4.07%). The rally for international equities sputtered for the next three months (-11.33%) amid a stalling pattern in disinflationary trends, heightened global recession and geopolitical risks, soaring yields on longer-term U.S. government bonds and particularly weak economic conditions in the eurozone and China. The three-month decline left non-U.S. stocks up 1.15% year to date through October. Currency fluctuation also helped bolster non-U.S. equity performance overall. For the full 12 months, nearly all regions advanced, with Europe ex U.K. (+18%) and Japan (+17%) leading, whereas Canada (-0.38%) lagged by the widest margin. Each of the 11 sectors advanced, with information technology (+21%) and consumer discretionary (+19%) leading the way. Energy and industrials each rose about 14%. Conversely, four defensive-oriented sectors lagged by the widest margin: real estate (+4%), health care (+6%), consumer staples (+7%) and utilities (+8%).
Comments from Portfolio Manager John Dance:
For the fiscal year ending October 31, 2023, the fund's share classes (excluding sales charges, if applicable) gained about 14% to 16%, versus 10.84% for the benchmark MSCI Emerging Markets (Net MA) Index. From a regional standpoint, non-benchmark exposure to the U.S. and Europe ex-U.K. - primarily the Netherlands - contributed to the fund's performance versus the benchmark. Within the benchmark, stock picking in Taiwan and China stood out. By sector, picks among information technology companies led the way, where our investment choices in semiconductors & semiconductor equipment helped most. Stock picks and an underweight in communication services also proved beneficial. Security selection and an underweight in utilities further boosted relative performance. The fund's non-benchmark stake in Nvidia gained 202% and was the top individual relative contributor. The stock was one of our largest holdings on October 31. A second notable relative contributor was an overweight in PDD Holdings (+85%), another of the portfolio's more sizable holdings. A non-benchmark stake in BE Semiconductor Industries (+113%) aided the fund's relative result as well. In contrast, stock selection in Brazil, as well as non-benchmark exposure to Kenya and Uruguay, detracted from the portfolio's relative return this period. Sector-wise, the biggest detractor from performance versus the benchmark was stock picking in financials, particularly among banks. Security selection in industrials and energy also hurt. The fund's non-benchmark stake in Safaricom returned -58% and was the largest individual relative detractor. A smaller-than-benchmark position in Alibaba (+31%), one of our largest holdings at period end after adding significantly to the position, also pressured relative performance. Another notable relative detractor was our non-benchmark stake in DLocal (-49%), though it was no longer held at period end. Notable changes in positioning include higher allocations to equity markets in Mexico and the U.S. By sector, meaningful shifts include increased exposure to the consumer staples sector and a lower allocation to health care stocks.
The views expressed above reflect those of the portfolio manager(s) only through the end of the period as stated on the cover of this report and do not necessarily represent the views of Fidelity or any other person in the Fidelity organization. Any such views are subject to change at any time based upon market or other conditions and Fidelity disclaims any responsibility to update such views. These views may not be relied on as investment advice and, because investment decisions for a Fidelity fund are based on numerous factors, may not be relied on as an indication of trading intent on behalf of any Fidelity fund.
Fidelity® Emerging Markets Fund
Top Holdings (% of Fund's net assets) |
| |
| Taiwan Semiconductor Manufacturing Co. Ltd. (Taiwan, Semiconductors & Semiconductor Equipment) | 8.6 | |
| Tencent Holdings Ltd. (China, Interactive Media & Services) | 5.2 | |
| Samsung Electronics Co. Ltd. (Korea (South), Technology Hardware, Storage & Peripherals) | 4.7 | |
| NVIDIA Corp. (United States of America, Semiconductors & Semiconductor Equipment) | 4.4 | |
| HDFC Bank Ltd. (India, Banks) | 3.7 | |
| PDD Holdings, Inc. ADR (China, Broadline Retail) | 3.4 | |
| Alibaba Group Holding Ltd. (China, Broadline Retail) | 3.3 | |
| PT Bank Central Asia Tbk (Indonesia, Banks) | 2.9 | |
| Reliance Industries Ltd. (India, Oil, Gas & Consumable Fuels) | 2.8 | |
| Kweichow Moutai Co. Ltd. (A Shares) (China, Beverages) | 2.6 | |
| | 41.6 | |
| |
| Market Sectors (% of Fund's net assets) |
| |
| Information Technology | 25.7 | |
| Financials | 19.0 | |
| Consumer Discretionary | 13.3 | |
| Communication Services | 9.2 | |
| Consumer Staples | 7.4 | |
| Industrials | 6.3 | |
| Health Care | 5.8 | |
| Energy | 5.7 | |
| Materials | 4.9 | |
| Utilities | 2.5 | |
| Real Estate | 0.2 | |
| |
Asset Allocation (% of Fund's net assets) |
|
|
Geographic Diversification (% of Fund's net assets) |
|
* Includes Short-Term investments and Net Other Assets (Liabilities). Percentages are adjusted for the effect of derivatives, if applicable. |
| |
Fidelity® Emerging Markets Fund
Showing Percentage of Net Assets
| Common Stocks - 98.5% |
| | | Shares | Value ($) |
| Australia - 0.4% | | | |
| Lynas Rare Earths Ltd. (a) | | 5,885,228 | 26,474,049 |
| Brazil - 5.1% | | | |
| Hapvida Participacoes e Investimentos SA (a)(b) | | 59,733,900 | 43,718,568 |
| Localiza Rent a Car SA | | 8,641,710 | 87,192,699 |
| Localiza Rent a Car SA rights 11/10/23 (a) | | 63,367 | 87,979 |
| Nu Holdings Ltd. (a) | | 8,684,900 | 71,216,180 |
| Raia Drogasil SA | | 10,313,600 | 52,777,484 |
| Vamos Locacao de Caminhoes Maquinas e Equipamentos SA | | 17,010,284 | 26,417,518 |
| XP, Inc. Class A | | 3,322,700 | 66,454,000 |
TOTAL BRAZIL | | | 347,864,428 |
| China - 23.5% | | | |
| Alibaba Group Holding Ltd. (a) | | 22,001,932 | 226,511,630 |
| Bank of Chengdu Co. Ltd. (A Shares) | | 17,931,644 | 30,312,263 |
| Chervon Holdings Ltd. | | 9,903,337 | 24,392,412 |
| JOYY, Inc. ADR | | 827,200 | 32,194,624 |
| Kweichow Moutai Co. Ltd. (A Shares) | | 775,715 | 178,689,234 |
| Meituan Class B (a)(b) | | 8,800,310 | 124,744,519 |
| NetEase, Inc. ADR | | 465,100 | 49,728,492 |
| PDD Holdings, Inc. ADR (a) | | 2,280,800 | 231,318,736 |
| Shandong Sinocera Functional Material Co. Ltd. (A Shares) | | 8,804,849 | 29,708,290 |
| Shenzhen Mindray Bio-Medical Electronics Co. Ltd. (A Shares) (a) | | 2,897,154 | 113,259,681 |
| Sinopharm Group Co. Ltd. (H Shares) | | 21,850,899 | 52,251,687 |
| Tencent Holdings Ltd. | | 9,641,800 | 356,831,025 |
| Wuliangye Yibin Co. Ltd. (A Shares) | | 4,075,771 | 86,899,907 |
| Wuxi Biologics (Cayman), Inc. (a)(b) | | 11,281,000 | 70,142,346 |
TOTAL CHINA | | | 1,606,984,846 |
| France - 2.7% | | | |
| Gaztransport et Technigaz SA | | 527,141 | 67,322,584 |
| Hermes International SCA | | 41,119 | 76,556,701 |
| LVMH Moet Hennessy Louis Vuitton SE | | 58,199 | 41,666,443 |
TOTAL FRANCE | | | 185,545,728 |
| Greece - 0.5% | | | |
| OPAP SA | | 1,849,000 | 31,302,830 |
| Hong Kong - 1.3% | | | |
| AIA Group Ltd. | | 10,430,600 | 90,577,329 |
| Hungary - 0.8% | | | |
| Richter Gedeon PLC | | 2,267,800 | 53,173,650 |
| India - 19.6% | | | |
| 360 ONE WAM Ltd. | | 5,887,472 | 37,140,404 |
| Asian Paints Ltd. | | 2,042,300 | 73,544,285 |
| Computer Age Management Services Private Ltd. | | 1,410,500 | 38,062,359 |
| HDFC Bank Ltd. | | 14,374,567 | 254,994,260 |
| HDFC Standard Life Insurance Co. Ltd. (b) | | 8,040,600 | 59,713,228 |
| Kotak Mahindra Bank Ltd. | | 4,413,348 | 92,232,866 |
| Larsen & Toubro Ltd. | | 3,305,632 | 116,293,608 |
| Mankind Pharma Ltd. | | 77,402 | 1,621,120 |
| One97 Communications Ltd. (a) | | 6,013,431 | 66,531,306 |
| Petronet LNG Ltd. | | 17,050,477 | 40,857,189 |
| Power Grid Corp. of India Ltd. | | 70,127,033 | 170,269,530 |
| Reliance Industries Ltd. | | 7,001,618 | 192,471,797 |
| Restaurant Brands Asia Ltd. (a)(c) | | 25,702,456 | 34,411,680 |
| Tata Consultancy Services Ltd. | | 2,013,600 | 81,493,544 |
| Ultratech Cement Ltd. | | 759,700 | 76,861,867 |
TOTAL INDIA | | | 1,336,499,043 |
| Indonesia - 2.9% | | | |
| PT Bank Central Asia Tbk | | 355,664,170 | 195,942,738 |
| Italy - 1.2% | | | |
| Ferrari NV | | 277,100 | 83,584,444 |
| Kazakhstan - 1.1% | | | |
| Kaspi.KZ JSC GDR (Reg. S) | | 861,034 | 77,837,474 |
| Kenya - 0.3% | | | |
| Safaricom Ltd. | | 233,129,100 | 19,279,026 |
| Korea (South) - 6.1% | | | |
| JYP Entertainment Corp. | | 369,500 | 28,084,551 |
| NAVER Corp. | | 464,590 | 64,854,875 |
| Samsung Electronics Co. Ltd. | | 6,522,917 | 324,196,103 |
TOTAL KOREA (SOUTH) | | | 417,135,529 |
| Mexico - 4.1% | | | |
| Banco del Bajio SA (b) | | 19,132,722 | 58,558,079 |
| Becle S.A.B. de CV | | 26,172,396 | 46,149,008 |
| GCC S.A.B. de CV | | 5,310,400 | 47,283,738 |
| Grupo Aeroportuario Norte S.A.B. de CV | | 8,538,587 | 65,181,970 |
| Wal-Mart de Mexico SA de CV Series V | | 17,778,500 | 63,633,402 |
TOTAL MEXICO | | | 280,806,197 |
| Netherlands - 2.6% | | | |
| ASML Holding NV (Netherlands) | | 188,700 | 113,431,422 |
| BE Semiconductor Industries NV | | 590,400 | 60,783,528 |
TOTAL NETHERLANDS | | | 174,214,950 |
| Philippines - 0.4% | | | |
| TaskUs, Inc. (a)(d) | | 2,981,872 | 27,671,772 |
| Poland - 1.1% | | | |
| Dino Polska SA (a)(b) | | 823,481 | 77,909,137 |
| Russia - 0.2% | | | |
| LUKOIL PJSC sponsored ADR (a)(e) | | 802,595 | 227,046 |
| Sberbank of Russia (e) | | 25,741,060 | 158,304 |
| Yandex NV Series A (a)(e) | | 1,084,187 | 11,817,638 |
TOTAL RUSSIA | | | 12,202,988 |
| Saudi Arabia - 4.8% | | | |
| Al Rajhi Bank | | 6,092,020 | 108,960,055 |
| Arabian Internet and Communications Services Co. Ltd. | | 503,800 | 42,005,715 |
| Dr Sulaiman Al Habib Medical Services Group Co. | | 903,000 | 60,655,720 |
| Sabic Agriculture-Nutrients Co. | | 1,652,500 | 58,936,054 |
| Saudi Arabian Oil Co. (b) | | 6,533,010 | 57,988,387 |
TOTAL SAUDI ARABIA | | | 328,545,931 |
| Sweden - 0.2% | | | |
| VEF AB (a)(c) | | 95,309,129 | 15,223,914 |
| Taiwan - 12.9% | | | |
| ASPEED Tech, Inc. | | 1,041,000 | 83,130,257 |
| Chailease Holding Co. Ltd. | | 7,770,168 | 42,117,202 |
| eMemory Technology, Inc. | | 1,292,000 | 80,883,327 |
| International Games Systems Co. Ltd. | | 2,221,036 | 42,777,330 |
| Taiwan Semiconductor Manufacturing Co. Ltd. | | 35,980,000 | 587,191,441 |
| Voltronic Power Technology Corp. | | 1,114,868 | 44,676,151 |
TOTAL TAIWAN | | | 880,775,708 |
| United Arab Emirates - 0.5% | | | |
| Adnoc Gas PLC | | 37,888,100 | 33,112,116 |
| United States of America - 5.9% | | | |
| Energy Recovery, Inc. (a) | | 1,513,300 | 23,002,160 |
| Globant SA (a)(d) | | 330,100 | 56,212,729 |
| Lattice Semiconductor Corp. (a) | | 427,700 | 23,784,397 |
| NVIDIA Corp. | | 726,408 | 296,229,182 |
TOTAL UNITED STATES OF AMERICA | | | 399,228,468 |
| Zambia - 0.3% | | | |
| First Quantum Minerals Ltd. | | 1,970,400 | 22,833,480 |
| TOTAL COMMON STOCKS (Cost $5,849,490,685) | | | 6,724,725,775 |
| | | | |
| Preferred Stocks - 1.0% |
| | | Shares | Value ($) |
| Convertible Preferred Stocks - 0.5% | | | |
| China - 0.5% | | | |
| ByteDance Ltd. Series E1 (a)(e)(f) | | 85,253 | 19,919,363 |
| ZKH Group Ltd. Series F (e)(f) | | 37,926,244 | 14,032,710 |
| | | | 33,952,073 |
| Nonconvertible Preferred Stocks - 0.5% | | | |
| Brazil - 0.5% | | | |
| Alpargatas SA (PN) | | 21,970,500 | 35,951,133 |
| TOTAL PREFERRED STOCKS (Cost $78,165,745) | | | 69,903,206 |
| | | | |
| Convertible Bonds - 0.5% |
| | | Principal Amount (g) | Value ($) |
| Brazil - 0.5% | | | |
Creditas Financial Solutions Ltd. 5% 7/28/27 (e)(f) (Cost $30,523,684) | | 30,523,684 | 30,508,423 |
| | | | |
| Money Market Funds - 1.2% |
| | | Shares | Value ($) |
| Fidelity Cash Central Fund 5.40% (h) | | 53,168,517 | 53,179,150 |
| Fidelity Securities Lending Cash Central Fund 5.40% (h)(i) | | 27,681,476 | 27,684,244 |
| TOTAL MONEY MARKET FUNDS (Cost $80,863,394) | | | 80,863,394 |
| | | | |
| TOTAL INVESTMENT IN SECURITIES - 101.2% (Cost $6,039,043,508) | 6,906,000,798 |
NET OTHER ASSETS (LIABILITIES) - (1.2)% | (78,657,350) |
| NET ASSETS - 100.0% | 6,827,343,448 |
| | |
Legend
| (b) | Security exempt from registration under Rule 144A of the Securities Act of 1933. These securities may be resold in transactions exempt from registration, normally to qualified institutional buyers. At the end of the period, the value of these securities amounted to $492,774,264 or 7.2% of net assets. |
| (d) | Security or a portion of the security is on loan at period end. |
| (f) | Restricted securities (including private placements) - Investment in securities not registered under the Securities Act of 1933 (excluding 144A issues). At the end of the period, the value of restricted securities (excluding 144A issues) amounted to $64,460,496 or 0.9% of net assets. |
| (g) | Amount is stated in United States dollars unless otherwise noted. |
| (h) | Affiliated fund that is generally available only to investment companies and other accounts managed by Fidelity Investments. The rate quoted is the annualized seven-day yield of the fund at period end. A complete unaudited listing of the fund's holdings as of its most recent quarter end is available upon request. In addition, each Fidelity Central Fund's financial statements, which are not covered by the Fund's Report of Independent Registered Public Accounting Firm, are available on the SEC's website or upon request. |
| (i) | Investment made with cash collateral received from securities on loan. |
| Additional information on each restricted holding is as follows: |
| Security | Acquisition Date | Acquisition Cost ($) |
| ByteDance Ltd. Series E1 | 11/18/20 | 9,341,528 |
| | | |
| Creditas Financial Solutions Ltd. 5% 7/28/27 | 1/28/22 - 7/28/23 | 30,523,684 |
| | | |
| ZKH Group Ltd. Series F | 2/24/22 | 21,461,870 |
| | | |
Affiliated Central Funds
Fiscal year to date information regarding the Fund's investments in Fidelity Central Funds, including the ownership percentage, is presented below.
| Affiliate | Value, beginning of period ($) | Purchases ($) | Sales Proceeds ($) | Dividend Income ($) | Realized Gain (loss) ($) | Change in Unrealized appreciation (depreciation) ($) | Value, end of period ($) | % ownership, end of period |
| Fidelity Cash Central Fund 5.40% | 67,633,060 | 1,539,642,842 | 1,554,096,752 | 4,545,354 | - | - | 53,179,150 | 0.1% |
| Fidelity Securities Lending Cash Central Fund 5.40% | 93,754,025 | 752,027,828 | 818,097,609 | 348,005 | - | - | 27,684,244 | 0.1% |
| Total | 161,387,085 | 2,291,670,670 | 2,372,194,361 | 4,893,359 | - | - | 80,863,394 | |
| | | | | | | | | |
Amounts in the dividend income column in the above table include any capital gain distributions from underlying funds, which are presented in the corresponding line item in the Statement of Operations, if applicable.
Amounts in the dividend income column for Fidelity Securities Lending Cash Central Fund represents the income earned on investing cash collateral, less rebates paid to borrowers and any lending agent fees associated with the loan, plus any premium payments received for lending certain types of securities.
Amounts included in the purchases and sales proceeds columns may include in-kind transactions, if applicable.
Other Affiliated Issuers
An affiliated company is a company in which the Fund has ownership of at least 5% of the voting securities. Fiscal year to date transactions with companies which are or were affiliates are presented in the table below. Certain corporate actions, such as mergers, are excluded from the amounts in this table if applicable. A dash in the Value end of period ($) column means either the issuer is no longer held at period end, or the issuer is held at period end but is no longer an affiliate.
| Affiliate | Value, beginning of period ($) | Purchases ($) | Sales Proceeds ($) | Dividend Income ($) | Realized Gain (loss) ($) | Change in Unrealized appreciation (depreciation) ($) | Value, end of period ($) |
| Restaurant Brands Asia Ltd. | 38,433,791 | - | 645,685 | - | (345,077) | (3,031,349) | 34,411,680 |
| VEF AB | 18,957,451 | 3,112,504 | - | - | - | (6,846,041) | 15,223,914 |
| Total | 57,391,242 | 3,112,504 | 645,685 | - | (345,077) | (9,877,390) | 49,635,594 |
Amounts included in the purchases and sales proceeds columns may include in-kind transactions, if applicable.
Investment Valuation
The following is a summary of the inputs used, as of October 31, 2023, involving the Fund's assets and liabilities carried at fair value. The inputs or methodology used for valuing securities may not be an indication of the risk associated with investing in those securities. For more information on valuation inputs, and their aggregation into the levels used below, please refer to the Investment Valuation section in the accompanying Notes to Financial Statements.
| Valuation Inputs at Reporting Date: |
| Description | Total ($) | Level 1 ($) | Level 2 ($) | Level 3 ($) |
Investments in Securities: | | | | |
|
| Equities: | | | | |
Communication Services | 625,486,924 | 101,202,142 | 492,547,781 | 31,737,001 |
Consumer Discretionary | 910,440,528 | 458,713,844 | 451,726,684 | - |
Consumer Staples | 506,058,172 | 240,469,031 | 265,589,141 | - |
Energy | 391,979,119 | 158,423,087 | 233,328,986 | 227,046 |
Financials | 1,267,969,602 | 398,249,702 | 869,561,596 | 158,304 |
Health Care | 394,822,772 | 157,547,938 | 237,274,834 | - |
Industrials | 428,586,216 | 229,554,098 | 199,032,118 | - |
Information Technology | 1,749,341,645 | 479,015,551 | 1,270,326,094 | - |
Materials | 335,641,763 | 129,053,272 | 206,588,491 | - |
Real Estate | 14,032,710 | - | - | 14,032,710 |
Utilities | 170,269,530 | - | 170,269,530 | - |
|
| Corporate Bonds | 30,508,423 | - | - | 30,508,423 |
|
| Money Market Funds | 80,863,394 | 80,863,394 | - | - |
| Total Investments in Securities: | 6,906,000,798 | 2,433,092,059 | 4,396,245,255 | 76,663,484 |
The following is a reconciliation of Investments in Securities for which Level 3 inputs were used in determining value:
| |
| Investments in Securities: | |
| Beginning Balance | $ | 60,064,977 | |
| Net Realized Gain (Loss) on Investment Securities | | - | |
| Net Unrealized Gain (Loss) on Investment Securities | | 6,423,946 | |
| Cost of Purchases | | 10,174,561 | |
| Proceeds of Sales | | - | |
| Amortization/Accretion | | - | |
| Transfers into Level 3 | | - | |
| Transfers out of Level 3 | | - | |
| Ending Balance | $ | 76,663,484 | |
| The change in unrealized gain (loss) for the period attributable to Level 3 securities held at October 31, 2023 | $ | 7,107,947 | |
| The information used in the above reconciliation represents fiscal year to date activity for any Investments in Securities identified as using Level 3 inputs at either the beginning or the end of the current fiscal period. Cost of purchases and proceeds of sales may include securities received and/or delivered through in-kind transactions, corporate actions or exchanges. Transfers into Level 3 were attributable to a lack of observable market data resulting from decreases in market activity, decreases in liquidity, security restructurings or corporate actions. Transfers out of Level 3 were attributable to observable market data becoming available for those securities. Transfers in or out of Level 3 represent the beginning value of any Security or Instrument where a change in the pricing level occurred from the beginning to the end of the period. Realized and unrealized gains (losses) disclosed in the reconciliation are included in Net Gain (Loss) on the Fund's Statement of Operations. | |
Fidelity® Emerging Markets Fund
| Statement of Assets and Liabilities |
| | | | October 31, 2023 |
| | | | | |
| Assets | | | | |
| Investment in securities, at value (including securities loaned of $27,386,387) - See accompanying schedule: | | | | |
Unaffiliated issuers (cost $5,877,922,836) | $ | 6,775,501,810 | | |
Fidelity Central Funds (cost $80,863,394) | | 80,863,394 | | |
Other affiliated issuers (cost $80,257,278) | | 49,635,594 | | |
| | | | | |
| | | | | |
| Total Investment in Securities (cost $6,039,043,508) | | | $ | 6,906,000,798 |
| Foreign currency held at value (cost $2,045,199) | | | | 1,245,023 |
| Receivable for investments sold | | | | 48,495,241 |
| Receivable for fund shares sold | | | | 5,472,834 |
| Dividends receivable | | | | 3,322,439 |
| Interest receivable | | | | 401,407 |
| Distributions receivable from Fidelity Central Funds | | | | 78,372 |
| Prepaid expenses | | | | 10,107 |
| Other receivables | | | | 1,733,969 |
Total assets | | | | 6,966,760,190 |
| Liabilities | | | | |
| Payable for investments purchased | $ | 67,040,434 | | |
| Payable for fund shares redeemed | | 6,535,868 | | |
| Accrued management fee | | 3,940,950 | | |
| Distribution and service plan fees payable | | 6,133 | | |
| Other affiliated payables | | 876,128 | | |
| Deferred taxes | | 31,771,600 | | |
| Other payables and accrued expenses | | 1,561,385 | | |
| Collateral on securities loaned | | 27,684,244 | | |
| Total Liabilities | | | | 139,416,742 |
| Net Assets | | | $ | 6,827,343,448 |
| Net Assets consist of: | | | | |
| Paid in capital | | | $ | 6,670,477,389 |
| Total accumulated earnings (loss) | | | | 156,866,059 |
| Net Assets | | | $ | 6,827,343,448 |
| | | | | |
| Net Asset Value and Maximum Offering Price | | | | |
| Class A : | | | | |
Net Asset Value and redemption price per share ($15,288,422 ÷ 480,762 shares)(a) | | | $ | 31.80 |
| Maximum offering price per share (100/94.25 of $31.80) | | | $ | 33.74 |
| Class M : | | | | |
Net Asset Value and redemption price per share ($3,069,981 ÷ 96,535 shares)(a) | | | $ | 31.80 |
| Maximum offering price per share (100/96.50 of $31.80) | | | $ | 32.95 |
| Class C : | | | | |
Net Asset Value and offering price per share ($1,767,549 ÷ 56,043 shares)(a) | | | $ | 31.54 |
| Emerging Markets : | | | | |
Net Asset Value, offering price and redemption price per share ($3,985,433,297 ÷ 124,665,297 shares) | | | $ | 31.97 |
| Class K : | | | | |
Net Asset Value, offering price and redemption price per share ($1,095,216,818 ÷ 34,222,779 shares) | | | $ | 32.00 |
| Class I : | | | | |
Net Asset Value, offering price and redemption price per share ($114,991,934 ÷ 3,606,015 shares) | | | $ | 31.89 |
| Class Z : | | | | |
Net Asset Value, offering price and redemption price per share ($1,611,575,447 ÷ 50,418,561 shares) | | | $ | 31.96 |
(a)Redemption price per share is equal to net asset value less any applicable contingent deferred sales charge. |
| Statement of Operations |
| | | | Year ended October 31, 2023 |
| Investment Income | | | | |
| Dividends | | | $ | 123,836,805 |
| Non-Cash dividends | | | | 23,096,816 |
| Interest | | | | 407,397 |
| Income from Fidelity Central Funds (including $348,005 from security lending) | | | | 4,893,359 |
| Income before foreign taxes withheld | | | $ | 152,234,377 |
| Less foreign taxes withheld | | | | (15,464,172) |
| Total Income | | | | 136,770,205 |
| Expenses | | | | |
| Management fee | $ | 46,939,063 | | |
| Transfer agent fees | | 8,593,759 | | |
| Distribution and service plan fees | | 68,092 | | |
| Accounting fees | | 1,575,719 | | |
| Custodian fees and expenses | | 1,644,669 | | |
| Independent trustees' fees and expenses | | 38,769 | | |
| Registration fees | | 236,458 | | |
| Audit | | 132,980 | | |
| Legal | | 7,290 | | |
| Interest | | 857 | | |
| Miscellaneous | | 48,574 | | |
| Total expenses before reductions | | 59,286,230 | | |
| Expense reductions | | (432,476) | | |
| Total expenses after reductions | | | | 58,853,754 |
| Net Investment income (loss) | | | | 77,916,451 |
| Realized and Unrealized Gain (Loss) | | | | |
| Net realized gain (loss) on: | | | | |
| Investment Securities: | | | | |
| Unaffiliated issuers (net of foreign taxes of $6,985,844) | | (415,723,368) | | |
| Affiliated issuers | | (345,077) | | |
| Foreign currency transactions | | (2,046,150) | | |
| Total net realized gain (loss) | | | | (418,114,595) |
| Change in net unrealized appreciation (depreciation) on: | | | | |
| Investment Securities: | | | | |
| Unaffiliated issuers(net of increase in deferred foreign taxes of $2,434,555) | | 1,179,611,495 | | |
| Affiliated issuers | | (9,877,390) | | |
| Assets and liabilities in foreign currencies | | (691,956) | | |
| Total change in net unrealized appreciation (depreciation) | | | | 1,169,042,149 |
| Net gain (loss) | | | | 750,927,554 |
| Net increase (decrease) in net assets resulting from operations | | | $ | 828,844,005 |
| Statement of Changes in Net Assets |
| |
| | Year ended October 31, 2023 | | Year ended October 31, 2022 |
| Increase (Decrease) in Net Assets | | | | |
| Operations | | | | |
| Net investment income (loss) | $ | 77,916,451 | $ | 57,338,565 |
| Net realized gain (loss) | | (418,114,595) | | (249,065,256) |
| Change in net unrealized appreciation (depreciation) | | 1,169,042,149 | | (3,129,085,535) |
| Net increase (decrease) in net assets resulting from operations | | 828,844,005 | | (3,320,812,226) |
| Distributions to shareholders | | (50,450,464) | | (481,791,574) |
| | | | | |
| Share transactions - net increase (decrease) | | 524,409,567 | | 787,871,888 |
| | | | | |
| Total increase (decrease) in net assets | | 1,302,803,108 | | (3,014,731,912) |
| | | | | |
| Net Assets | | | | |
| Beginning of period | | 5,524,540,340 | | 8,539,272,252 |
| End of period | $ | 6,827,343,448 | $ | 5,524,540,340 |
| | | | | |
| | | | | |
Financial Highlights
| Fidelity Advisor® Emerging Markets Fund Class A |
| |
| Years ended October 31, | | 2023 | | 2022 | | 2021 A |
Selected Per-Share Data | | | | | | |
| Net asset value, beginning of period | $ | 27.73 | $ | 47.48 | $ | 46.83 |
| Income from Investment Operations | | | | | | |
Net investment income (loss) B,C | | .26 D | | .16 E | | (.04) |
| Net realized and unrealized gain (loss) | | 3.95 | | (17.27) | | .69 |
| Total from investment operations | | 4.21 | | (17.11) | | .65 |
| Distributions from net investment income | | (.14) | | (.48) | | - |
| Distributions from net realized gain | | - | | (2.16) | | - |
| Total distributions | | (.14) | | (2.64) | | - |
| Net asset value, end of period | $ | 31.80 | $ | 27.73 | $ | 47.48 |
Total Return F,G,H | | 15.18% | | (38.00)% | | 1.39% |
Ratios to Average Net Assets C,I,J | | | | | | |
| Expenses before reductions | | 1.20% | | 1.21% | | 1.25% K |
| Expenses net of fee waivers, if any | | 1.20% | | 1.21% | | 1.25% K |
| Expenses net of all reductions | | 1.20% | | 1.21% | | 1.25% K |
| Net investment income (loss) | | .77% D | | .45% E | | (.17)% K |
| Supplemental Data | | | | | | |
| Net assets, end of period (000 omitted) | $ | 15,288 | $ | 10,046 | $ | 6,248 |
Portfolio turnover rate L | | 23% | | 34% | | 38% K,M |
AFor the period May 11, 2021 (commencement of sale of shares) through October 31, 2021.
BCalculated based on average shares outstanding during the period.
CNet investment income (loss) is affected by the timing of the declaration of dividends by any underlying mutual funds or exchange-traded funds (ETFs). Net investment income (loss) of any mutual funds or ETFs is not included in the Fund's net investment income (loss) ratio.
DNet investment income per share reflects one or more large, non-recurring dividend(s) which amounted to $.11 per share. Excluding such non-recurring dividend(s), the ratio of net investment income (loss) to average net assets would have been .44%.
ENet investment income per share reflects one or more large, non-recurring dividend(s) which amounted to $.08 per share. Excluding such non-recurring dividend(s), the ratio of net investment income (loss) to average net assets would have been .22%.
FTotal returns for periods of less than one year are not annualized.
GTotal returns would have been lower if certain expenses had not been reduced during the applicable periods shown.
HTotal returns do not include the effect of the sales charges.
IFees and expenses of any underlying mutual funds or exchange-traded funds (ETFs) are not included in the Fund's expense ratio. The Fund indirectly bears its proportionate share of these expenses. For additional expense information related to investments in Fidelity Central Funds, please refer to the "Investments in Fidelity Central Funds" note found in the Notes to Financial Statements section of the most recent Annual or Semi-Annual report.
JExpense ratios reflect operating expenses of the class. Expenses before reductions do not reflect amounts reimbursed, waived, or reduced through arrangements with the investment adviser, brokerage services, or other offset arrangements, if applicable, and do not represent the amount paid by the class during periods when reimbursements, waivers or reductions occur.
KAnnualized.
LAmount does not include the portfolio activity of any underlying mutual funds or exchange-traded funds (ETFs).
MThe portfolio turnover rate does not include the assets acquired in the merger.
| Fidelity Advisor® Emerging Markets Fund Class M |
| |
| Years ended October 31, | | 2023 | | 2022 | | 2021 A |
Selected Per-Share Data | | | | | | |
| Net asset value, beginning of period | $ | 27.71 | $ | 47.42 | $ | 46.83 |
| Income from Investment Operations | | | | | | |
Net investment income (loss) B,C | | .17 D | | .05 E | | (.09) |
| Net realized and unrealized gain (loss) | | 3.96 | | (17.29) | | .68 |
| Total from investment operations | | 4.13 | | (17.24) | | .59 |
| Distributions from net investment income | | (.04) | | (.32) | | - |
| Distributions from net realized gain | | - | | (2.16) | | - |
| Total distributions | | (.04) | | (2.47) F | | - |
| Net asset value, end of period | $ | 31.80 | $ | 27.71 | $ | 47.42 |
Total Return G,H,I | | 14.90% | | (38.20)% | | 1.26% |
Ratios to Average Net Assets C,J,K | | | | | | |
| Expenses before reductions | | 1.48% | | 1.51% | | 1.52% L |
| Expenses net of fee waivers, if any | | 1.47% | | 1.50% | | 1.51% L |
| Expenses net of all reductions | | 1.47% | | 1.50% | | 1.51% L |
| Net investment income (loss) | | .50% D | | .15% E | | (.39)% L |
| Supplemental Data | | | | | | |
| Net assets, end of period (000 omitted) | $ | 3,070 | $ | 1,392 | $ | 2,234 |
Portfolio turnover rate M | | 23% | | 34% | | 38% L,N |
AFor the period May 11, 2021 (commencement of sale of shares) through October 31, 2021.
BCalculated based on average shares outstanding during the period.
CNet investment income (loss) is affected by the timing of the declaration of dividends by any underlying mutual funds or exchange-traded funds (ETFs). Net investment income (loss) of any mutual funds or ETFs is not included in the Fund's net investment income (loss) ratio.
DNet investment income per share reflects one or more large, non-recurring dividend(s) which amounted to $.11 per share. Excluding such non-recurring dividend(s), the ratio of net investment income (loss) to average net assets would have been .17%.
ENet investment income per share reflects one or more large, non-recurring dividend(s) which amounted to $.08 per share. Excluding such non-recurring dividend(s), the ratio of net investment income (loss) to average net assets would have been (.08)%.
FTotal distributions per share do not sum due to rounding.
GTotal returns for periods of less than one year are not annualized.
HTotal returns would have been lower if certain expenses had not been reduced during the applicable periods shown.
ITotal returns do not include the effect of the sales charges.
JFees and expenses of any underlying mutual funds or exchange-traded funds (ETFs) are not included in the Fund's expense ratio. The Fund indirectly bears its proportionate share of these expenses. For additional expense information related to investments in Fidelity Central Funds, please refer to the "Investments in Fidelity Central Funds" note found in the Notes to Financial Statements section of the most recent Annual or Semi-Annual report.
KExpense ratios reflect operating expenses of the class. Expenses before reductions do not reflect amounts reimbursed, waived, or reduced through arrangements with the investment adviser, brokerage services, or other offset arrangements, if applicable, and do not represent the amount paid by the class during periods when reimbursements, waivers or reductions occur.
LAnnualized.
MAmount does not include the portfolio activity of any underlying mutual funds or exchange-traded funds (ETFs).
NThe portfolio turnover rate does not include the assets acquired in the merger.
| Fidelity Advisor® Emerging Markets Fund Class C |
| |
| Years ended October 31, | | 2023 | | 2022 | | 2021 A |
Selected Per-Share Data | | | | | | |
| Net asset value, beginning of period | $ | 27.59 | $ | 47.31 | $ | 46.83 |
| Income from Investment Operations | | | | | | |
Net investment income (loss) B,C | | - D,E | | (.12) F | | (.19) |
| Net realized and unrealized gain (loss) | | 3.95 | | (17.26) | | .67 |
| Total from investment operations | | 3.95 | | (17.38) | | .48 |
| Distributions from net investment income | | - | | (.18) | | - |
| Distributions from net realized gain | | - | | (2.16) | | - |
| Total distributions | | - | | (2.34) | | - |
| Net asset value, end of period | $ | 31.54 | $ | 27.59 | $ | 47.31 |
Total Return G,H,I | | 14.32% | | (38.50)% | | 1.02% |
Ratios to Average Net Assets C,J,K | | | | | | |
| Expenses before reductions | | 1.98% | | 2.00% | | 2.01% L |
| Expenses net of fee waivers, if any | | 1.98% | | 2.00% | | 2.01% L |
| Expenses net of all reductions | | 1.97% | | 2.00% | | 2.01% L |
| Net investment income (loss) | | (.01)% D | | (.34)% F | | (.86)% L |
| Supplemental Data | | | | | | |
| Net assets, end of period (000 omitted) | $ | 1,768 | $ | 1,377 | $ | 1,587 |
Portfolio turnover rate M | | 23% | | 34% | | 38% L,N |
AFor the period May 11, 2021 (commencement of sale of shares) through October 31, 2021.
BCalculated based on average shares outstanding during the period.
CNet investment income (loss) is affected by the timing of the declaration of dividends by any underlying mutual funds or exchange-traded funds (ETFs). Net investment income (loss) of any mutual funds or ETFs is not included in the Fund's net investment income (loss) ratio.
DNet investment income per share reflects one or more large, non-recurring dividend(s) which amounted to $.11 per share. Excluding such non-recurring dividend(s), the ratio of net investment income (loss) to average net assets would have been (.34)%.
EAmount represents less than $.005 per share.
FNet investment income per share reflects one or more large, non-recurring dividend(s) which amounted to $.08 per share. Excluding such non-recurring dividend(s), the ratio of net investment income (loss) to average net assets would have been (.57)%.
GTotal returns for periods of less than one year are not annualized.
HTotal returns would have been lower if certain expenses had not been reduced during the applicable periods shown.
ITotal returns do not include the effect of the contingent deferred sales charge.
JFees and expenses of any underlying mutual funds or exchange-traded funds (ETFs) are not included in the Fund's expense ratio. The Fund indirectly bears its proportionate share of these expenses. For additional expense information related to investments in Fidelity Central Funds, please refer to the "Investments in Fidelity Central Funds" note found in the Notes to Financial Statements section of the most recent Annual or Semi-Annual report.
KExpense ratios reflect operating expenses of the class. Expenses before reductions do not reflect amounts reimbursed, waived, or reduced through arrangements with the investment adviser, brokerage services, or other offset arrangements, if applicable, and do not represent the amount paid by the class during periods when reimbursements, waivers or reductions occur.
LAnnualized.
MAmount does not include the portfolio activity of any underlying mutual funds or exchange-traded funds (ETFs).
NThe portfolio turnover rate does not include the assets acquired in the merger.
| Fidelity® Emerging Markets Fund |
| |
| Years ended October 31, | | 2023 | | 2022 | | 2021 | | 2020 | | 2019 |
Selected Per-Share Data | | | | | | | | | | |
| Net asset value, beginning of period | $ | 27.87 | $ | 47.56 | $ | 40.26 | $ | 33.03 | $ | 26.66 |
| Income from Investment Operations | | | | | | | | | | |
Net investment income (loss) A,B | | .36 C | | .28 D | | .12 | | .15 | | .61 E |
| Net realized and unrealized gain (loss) | | 3.98 | | (17.35) | | 7.81 | | 7.68 | | 5.98 |
| Total from investment operations | | 4.34 | | (17.07) | | 7.93 | | 7.83 | | 6.59 |
| Distributions from net investment income | | (.24) | | (.46) | | (.09) | | (.60) | | (.22) |
| Distributions from net realized gain | | - | | (2.16) | | (.54) | | - | | - |
| Total distributions | | (.24) | | (2.62) | | (.63) | | (.60) | | (.22) |
| Net asset value, end of period | $ | 31.97 | $ | 27.87 | $ | 47.56 | $ | 40.26 | $ | 33.03 |
Total Return F | | 15.56% | | (37.83)% | | 19.83% | | 24.09% | | 24.91% |
Ratios to Average Net Assets B,G,H | | | | | | | | | | |
| Expenses before reductions | | .90% | | .90% | | .88% | | .92% | | .94% |
| Expenses net of fee waivers, if any | | .90% | | .90% | | .88% | | .92% | | .94% |
| Expenses net of all reductions | | .90% | | .90% | | .88% | | .91% | | .92% |
| Net investment income (loss) | | 1.07% C | | .76% D | | .26% | | .43% | | 2.02% E |
| Supplemental Data | | | | | | | | | | |
| Net assets, end of period (000 omitted) | $ | 3,985,433 | $ | 3,330,900 | $ | 5,016,159 | $ | 4,526,531 | $ | 3,104,887 |
Portfolio turnover rate I | | 23% | | 34% | | 38% J | | 34% | | 85% K |
ACalculated based on average shares outstanding during the period.
BNet investment income (loss) is affected by the timing of the declaration of dividends by any underlying mutual funds or exchange-traded funds (ETFs). Net investment income (loss) of any mutual funds or ETFs is not included in the Fund's net investment income (loss) ratio.
CNet investment income per share reflects one or more large, non-recurring dividend(s) which amounted to $.11 per share. Excluding such non-recurring dividend(s), the ratio of net investment income (loss) to average net assets would have been .74%.
DNet investment income per share reflects one or more large, non-recurring dividend(s) which amounted to $.08 per share. Excluding such non-recurring dividend(s), the ratio of net investment income (loss) to average net assets would have been .53%.
ENet investment income per share reflects one or more large, non-recurring dividend(s) which amounted to $.34 per share. Excluding such non-recurring dividend(s), the ratio of net investment income (loss) to average net assets would have been .88%.
FTotal returns would have been lower if certain expenses had not been reduced during the applicable periods shown.
GFees and expenses of any underlying mutual funds or exchange-traded funds (ETFs) are not included in the Fund's expense ratio. The Fund indirectly bears its proportionate share of these expenses. For additional expense information related to investments in Fidelity Central Funds, please refer to the "Investments in Fidelity Central Funds" note found in the Notes to Financial Statements section of the most recent Annual or Semi-Annual report.
HExpense ratios reflect operating expenses of the class. Expenses before reductions do not reflect amounts reimbursed, waived, or reduced through arrangements with the investment adviser, brokerage services, or other offset arrangements, if applicable, and do not represent the amount paid by the class during periods when reimbursements, waivers or reductions occur.
IAmount does not include the portfolio activity of any underlying mutual funds or exchange-traded funds (ETFs).
JThe portfolio turnover rate does not include the assets acquired in the merger.
KPortfolio turnover rate excludes securities received or delivered in-kind.
| Fidelity® Emerging Markets Fund Class K |
| |
| Years ended October 31, | | 2023 | | 2022 | | 2021 | | 2020 | | 2019 |
Selected Per-Share Data | | | | | | | | | | |
| Net asset value, beginning of period | $ | 27.90 | $ | 47.62 | $ | 40.30 | $ | 33.07 | $ | 26.70 |
| Income from Investment Operations | | | | | | | | | | |
Net investment income (loss) A,B | | .40 C | | .33 D | | .16 | | .19 | | .65 E |
| Net realized and unrealized gain (loss) | | 3.98 | | (17.35) | | 7.83 | | 7.69 | | 5.99 |
| Total from investment operations | | 4.38 | | (17.02) | | 7.99 | | 7.88 | | 6.64 |
| Distributions from net investment income | | (.28) | | (.54) | | (.12) | | (.65) | | (.26) |
| Distributions from net realized gain | | - | | (2.16) | | (.54) | | - | | - F |
| Total distributions | | (.28) | | (2.70) | | (.67) G | | (.65) | | (.27) G |
| Net asset value, end of period | $ | 32.00 | $ | 27.90 | $ | 47.62 | $ | 40.30 | $ | 33.07 |
Total Return H | | 15.69% | | (37.73)% | | 19.94% | | 24.24% | | 25.08% |
Ratios to Average Net Assets B,I,J | | | | | | | | | | |
| Expenses before reductions | | .77% | | .77% | | .77% | | .80% | | .80% |
| Expenses net of fee waivers, if any | | .76% | | .77% | | .77% | | .80% | | .80% |
| Expenses net of all reductions | | .76% | | .77% | | .77% | | .79% | | .79% |
| Net investment income (loss) | | 1.20% C | | .88% D | | .34% | | .55% | | 2.15% E |
| Supplemental Data | | | | | | | | | | |
| Net assets, end of period (000 omitted) | $ | 1,095,217 | $ | 826,468 | $ | 1,689,454 | $ | 1,227,097 | $ | 1,018,765 |
Portfolio turnover rate K | | 23% | | 34% | | 38% L | | 34% | | 85% M |
ACalculated based on average shares outstanding during the period.
BNet investment income (loss) is affected by the timing of the declaration of dividends by any underlying mutual funds or exchange-traded funds (ETFs). Net investment income (loss) of any mutual funds or ETFs is not included in the Fund's net investment income (loss) ratio.
CNet investment income per share reflects one or more large, non-recurring dividend(s) which amounted to $.11 per share. Excluding such non-recurring dividend(s), the ratio of net investment income (loss) to average net assets would have been .87%.
DNet investment income per share reflects one or more large, non-recurring dividend(s) which amounted to $.08 per share. Excluding such non-recurring dividend(s), the ratio of net investment income (loss) to average net assets would have been .66%.
ENet investment income per share reflects one or more large, non-recurring dividend(s) which amounted to $.34 per share. Excluding such non-recurring dividend(s), the ratio of net investment income (loss) to average net assets would have been 1.02%.
FAmount represents less than $.005 per share.
GTotal distributions per share do not sum due to rounding.
HTotal returns would have been lower if certain expenses had not been reduced during the applicable periods shown.
IFees and expenses of any underlying mutual funds or exchange-traded funds (ETFs) are not included in the Fund's expense ratio. The Fund indirectly bears its proportionate share of these expenses. For additional expense information related to investments in Fidelity Central Funds, please refer to the "Investments in Fidelity Central Funds" note found in the Notes to Financial Statements section of the most recent Annual or Semi-Annual report.
JExpense ratios reflect operating expenses of the class. Expenses before reductions do not reflect amounts reimbursed, waived, or reduced through arrangements with the investment adviser, brokerage services, or other offset arrangements, if applicable, and do not represent the amount paid by the class during periods when reimbursements, waivers or reductions occur.
KAmount does not include the portfolio activity of any underlying mutual funds or exchange-traded funds (ETFs).
LThe portfolio turnover rate does not include the assets acquired in the merger.
MPortfolio turnover rate excludes securities received or delivered in-kind.
| Fidelity Advisor® Emerging Markets Fund Class I |
| |
| Years ended October 31, | | 2023 | | 2022 | | 2021 A |
Selected Per-Share Data | | | | | | |
| Net asset value, beginning of period | $ | 27.83 | $ | 47.55 | $ | 46.83 |
| Income from Investment Operations | | | | | | |
Net investment income (loss) B,C | | .36 D | | .26 E | | .04 |
| Net realized and unrealized gain (loss) | | 3.97 | | (17.29) | | .68 |
| Total from investment operations | | 4.33 | | (17.03) | | .72 |
| Distributions from net investment income | | (.27) | | (.53) | | - |
| Distributions from net realized gain | | - | | (2.16) | | - |
| Total distributions | | (.27) | | (2.69) | | - |
| Net asset value, end of period | $ | 31.89 | $ | 27.83 | $ | 47.55 |
Total Return F,G | | 15.54% | | (37.81)% | | 1.54% |
Ratios to Average Net Assets C,H,I | | | | | | |
| Expenses before reductions | | .91% | | .89% | | .94% J |
| Expenses net of fee waivers, if any | | .90% | | .89% | | .93% J |
| Expenses net of all reductions | | .90% | | .89% | | .93% J |
| Net investment income (loss) | | 1.06% D | | .76% E | | .17% J |
| Supplemental Data | | | | | | |
| Net assets, end of period (000 omitted) | $ | 114,992 | $ | 47,819 | $ | 25,824 |
Portfolio turnover rate K | | 23% | | 34% | | 38% J,L |
AFor the period May 11, 2021 (commencement of sale of shares) through October 31, 2021.
BCalculated based on average shares outstanding during the period.
CNet investment income (loss) is affected by the timing of the declaration of dividends by any underlying mutual funds or exchange-traded funds (ETFs). Net investment income (loss) of any mutual funds or ETFs is not included in the Fund's net investment income (loss) ratio.
DNet investment income per share reflects one or more large, non-recurring dividend(s) which amounted to $.11 per share. Excluding such non-recurring dividend(s), the ratio of net investment income (loss) to average net assets would have been .73%.
ENet investment income per share reflects one or more large, non-recurring dividend(s) which amounted to $.08 per share. Excluding such non-recurring dividend(s), the ratio of net investment income (loss) to average net assets would have been .53%.
FTotal returns for periods of less than one year are not annualized.
GTotal returns would have been lower if certain expenses had not been reduced during the applicable periods shown.
HFees and expenses of any underlying mutual funds or exchange-traded funds (ETFs) are not included in the Fund's expense ratio. The Fund indirectly bears its proportionate share of these expenses. For additional expense information related to investments in Fidelity Central Funds, please refer to the "Investments in Fidelity Central Funds" note found in the Notes to Financial Statements section of the most recent Annual or Semi-Annual report.
IExpense ratios reflect operating expenses of the class. Expenses before reductions do not reflect amounts reimbursed, waived, or reduced through arrangements with the investment adviser, brokerage services, or other offset arrangements, if applicable, and do not represent the amount paid by the class during periods when reimbursements, waivers or reductions occur.
JAnnualized.
KAmount does not include the portfolio activity of any underlying mutual funds or exchange-traded funds (ETFs).
LThe portfolio turnover rate does not include the assets acquired in the merger.
| Fidelity Advisor® Emerging Markets Fund Class Z |
| |
| Years ended October 31, | | 2023 | | 2022 | | 2021 A |
Selected Per-Share Data | | | | | | |
| Net asset value, beginning of period | $ | 27.87 | $ | 47.59 | $ | 46.83 |
| Income from Investment Operations | | | | | | |
Net investment income (loss) B,C | | .40 D | | .32 E | | (.03) |
| Net realized and unrealized gain (loss) | | 3.97 | | (17.33) | | .79 |
| Total from investment operations | | 4.37 | | (17.01) | | .76 |
| Distributions from net investment income | | (.28) | | (.55) | | - |
| Distributions from net realized gain | | - | | (2.16) | | - |
| Total distributions | | (.28) | | (2.71) | | - |
| Net asset value, end of period | $ | 31.96 | $ | 27.87 | $ | 47.59 |
Total Return F,G | | 15.67% | | (37.74)% | | 1.62% |
Ratios to Average Net Assets C,H,I | | | | | | |
| Expenses before reductions | | .77% | | .77% | | .78% J |
| Expenses net of fee waivers, if any | | .76% | | .77% | | .78% J |
| Expenses net of all reductions | | .76% | | .77% | | .78% J |
| Net investment income (loss) | | 1.20% D | | .88% E | | (.13)% J |
| Supplemental Data | | | | | | |
| Net assets, end of period (000 omitted) | $ | 1,611,575 | $ | 1,306,539 | $ | 1,797,766 |
Portfolio turnover rate K | | 23% | | 34% | | 38% J,L |
AFor the period May 11, 2021 (commencement of sale of shares) through October 31, 2021.
BCalculated based on average shares outstanding during the period.
CNet investment income (loss) is affected by the timing of the declaration of dividends by any underlying mutual funds or exchange-traded funds (ETFs). Net investment income (loss) of any mutual funds or ETFs is not included in the Fund's net investment income (loss) ratio.
DNet investment income per share reflects one or more large, non-recurring dividend(s) which amounted to $.11 per share. Excluding such non-recurring dividend(s), the ratio of net investment income (loss) to average net assets would have been .87%.
ENet investment income per share reflects one or more large, non-recurring dividend(s) which amounted to $.08 per share. Excluding such non-recurring dividend(s), the ratio of net investment income (loss) to average net assets would have been .66%.
FTotal returns for periods of less than one year are not annualized.
GTotal returns would have been lower if certain expenses had not been reduced during the applicable periods shown.
HFees and expenses of any underlying mutual funds or exchange-traded funds (ETFs) are not included in the Fund's expense ratio. The Fund indirectly bears its proportionate share of these expenses. For additional expense information related to investments in Fidelity Central Funds, please refer to the "Investments in Fidelity Central Funds" note found in the Notes to Financial Statements section of the most recent Annual or Semi-Annual report.
IExpense ratios reflect operating expenses of the class. Expenses before reductions do not reflect amounts reimbursed, waived, or reduced through arrangements with the investment adviser, brokerage services, or other offset arrangements, if applicable, and do not represent the amount paid by the class during periods when reimbursements, waivers or reductions occur.
JAnnualized.
KAmount does not include the portfolio activity of any underlying mutual funds or exchange-traded funds (ETFs).
LThe portfolio turnover rate does not include the assets acquired in the merger.
For the period ended October 31, 2023
1. Organization.
Fidelity Emerging Markets Fund (the Fund) is a fund of Fidelity Investment Trust (the Trust) and is authorized to issue an unlimited number of shares. The Trust is registered under the Investment Company Act of 1940, as amended (the 1940 Act), as an open-end management investment company organized as a Massachusetts business trust. The Fund offers Class A, Class M, Class C, Emerging Markets, Class K, Class I and Class Z shares, each of which has equal rights as to assets and voting privileges. Class A, Class M, Class C, Class I and Class Z are Fidelity Advisor classes. Each class has exclusive voting rights with respect to matters that affect that class. Class C shares will automatically convert to Class A shares after a holding period of eight years from the initial date of purchase, with certain exceptions. The Fund's investments in emerging markets can be subject to social, economic, regulatory, and political uncertainties and can be extremely volatile.
2. Investments in Fidelity Central Funds.
Funds may invest in Fidelity Central Funds, which are open-end investment companies generally available only to other investment companies and accounts managed by the investment adviser and its affiliates. The Schedule of Investments lists any Fidelity Central Funds held as an investment as of period end, but does not include the underlying holdings of each Fidelity Central Fund. An investing fund indirectly bears its proportionate share of the expenses of the underlying Fidelity Central Funds.
Based on its investment objective, each Fidelity Central Fund may invest or participate in various investment vehicles or strategies that are similar to those of the investing fund. These strategies are consistent with the investment objectives of the investing fund and may involve certain economic risks which may cause a decline in value of each of the Fidelity Central Funds and thus a decline in the value of the investing fund.
| Fidelity Central Fund | Investment Manager | Investment Objective | Investment Practices | Expense RatioA |
| Fidelity Money Market Central Funds | Fidelity Management & Research Company LLC (FMR) | Each fund seeks to obtain a high level of current income consistent with the preservation of capital and liquidity. | Short-term Investments | Less than .005% |
A Expenses expressed as a percentage of average net assets and are as of each underlying Central Fund's most recent annual or semi-annual shareholder report.
A complete unaudited list of holdings for each Fidelity Central Fund is available upon request or at the Securities and Exchange Commission website at www.sec.gov. In addition, the financial statements of the Fidelity Central Funds which contain the significant accounting policies (including investment valuation policies) of those funds, and are not covered by the Report of Independent Registered Public Accounting Firm, are available on the Securities and Exchange Commission website or upon request.
3. Significant Accounting Policies.
The Fund is an investment company and applies the accounting and reporting guidance of the Financial Accounting Standards Board (FASB) Accounting Standards Codification Topic 946 Financial Services - Investment Companies. The financial statements have been prepared in conformity with accounting principles generally accepted in the United States of America (GAAP), which require management to make certain estimates and assumptions at the date of the financial statements. Actual results could differ from those estimates. Subsequent events, if any, through the date that the financial statements were issued have been evaluated in the preparation of the financial statements. The Fund's Schedule of Investments lists any underlying mutual funds or exchange-traded funds (ETFs) but does not include the underlying holdings of these funds. The following summarizes the significant accounting policies of the Fund:
Investment Valuation. Investments are valued as of 4:00 p.m. Eastern time on the last calendar day of the period. The Board of Trustees (the Board) has designated the Fund's investment adviser as the valuation designee responsible for the fair valuation function and performing fair value determinations as needed. The investment adviser has established a Fair Value Committee (the Committee) to carry out the day-to-day fair valuation responsibilities and has adopted policies and procedures to govern the fair valuation process and the activities of the Committee. In accordance with these fair valuation policies and procedures, which have been approved by the Board, the Fund attempts to obtain prices from one or more third party pricing services or brokers to value its investments. When current market prices, quotations or currency exchange rates are not readily available or reliable, investments will be fair valued in good faith by the Committee, in accordance with the policies and procedures. Factors used in determining fair value vary by investment type and may include market or investment specific events, transaction data, estimated cash flows, and market observations of comparable investments. The frequency that the fair valuation procedures are used cannot be predicted and they may be utilized to a significant extent. The Committee manages the Fund's fair valuation practices and maintains the fair valuation policies and procedures. The Fund's investment adviser reports to the Board information regarding the fair valuation process and related material matters.
The Fund categorizes the inputs to valuation techniques used to value its investments into a disclosure hierarchy consisting of three levels as shown below:
Level 1 - unadjusted quoted prices in active markets for identical investments
Level 2 - other significant observable inputs (including quoted prices for similar investments, interest rates, prepayment speeds, etc.)
Level 3 - unobservable inputs (including the Fund's own assumptions based on the best information available)
Valuation techniques used to value the Fund's investments by major category are as follows:
Equity securities, including restricted securities, for which market quotations are readily available, are valued at the last reported sale price or official closing price as reported by a third party pricing service on the primary market or exchange on which they are traded and are categorized as Level 1 in the hierarchy. In the event there were no sales during the day or closing prices are not available, securities are valued at the last quoted bid price or may be valued using the last available price and are generally categorized as Level 2 in the hierarchy. For foreign equity securities, when market or security specific events arise, comparisons to the valuation of American Depositary Receipts (ADRs), futures contracts, ETFs and certain indexes as well as quoted prices for similar securities may be used and would be categorized as Level 2 in the hierarchy. For equity securities, including restricted securities, where observable inputs are limited, assumptions about market activity and risk are used and these securities may be categorized as Level 3 in the hierarchy.
Debt securities, including restricted securities, are valued based on evaluated prices received from third party pricing services or from brokers who make markets in such securities. Corporate bonds are valued by pricing services who utilize matrix pricing which considers yield or price of bonds of comparable quality, coupon, maturity and type or by broker-supplied prices. When independent prices are unavailable or unreliable, debt securities may be valued utilizing pricing methodologies which consider similar factors that would be used by third party pricing services. Debt securities are generally categorized as Level 2 in the hierarchy but may be Level 3 depending on the circumstances.
Investments in open-end mutual funds, including the Fidelity Central Funds, are valued at their closing net asset value (NAV) each business day and are categorized as Level 1 in the hierarchy.
The following provides information on Level 3 securities held by the Fund that were valued at period end based on unobservable inputs. These amounts exclude valuations provided by a broker.
| Asset Type | Fair Value | Valuation Technique(s) | Unobservable Input | Amount or Range/Weighted Average | Impact to Valuation from an Increase in InputA |
| Equities | $46,155,061 | Market comparable | Enterprise value/Revenue multiple (EV/R) | 1.2 - 4.0 / 2.8 | Increase |
| | | Market approach | Discount rate | 20.0% - 50.0% / 20.9% | Decrease |
| Corporate Bonds | $30,508,423 | Market comparable | Enterprise value/Revenue multiple (EV/R) | 6.0 | Increase |
A Represents the directional change in the fair value of the Level 3 investments that could have resulted from an increase in the corresponding input as of period end. A decrease to the unobservable input would have had the opposite effect. Significant changes in these inputs may have resulted in a significantly higher or lower fair value measurement at period end.
Changes in valuation techniques may result in transfers in or out of an assigned level within the disclosure hierarchy. The aggregate value of investments by input level as of October 31, 2023, as well as a roll forward of Level 3 investments, is included at the end of the Fund's Schedule of Investments.
Foreign Currency. Certain Funds may use foreign currency contracts to facilitate transactions in foreign-denominated securities. Gains and losses from these transactions may arise from changes in the value of the foreign currency or if the counterparties do not perform under the contracts' terms.
Foreign-denominated assets, including investment securities, and liabilities are translated into U.S. dollars at the exchange rates at period end. Purchases and sales of investment securities, income and dividends received, and expenses denominated in foreign currencies are translated into U.S. dollars at the exchange rate in effect on the transaction date.
The effects of exchange rate fluctuations on investments are included with the net realized and unrealized gain (loss) on investment securities. Other foreign currency transactions resulting in realized and unrealized gain (loss) are disclosed separately.
Investment Transactions and Income. For financial reporting purposes, the Fund's investment holdings and NAV include trades executed through the end of the last business day of the period. The NAV per share for processing shareholder transactions is calculated as of the close of business of the New York Stock Exchange (NYSE), normally 4:00 p.m. Eastern time and includes trades executed through the end of the prior business day. Gains and losses on securities sold are determined on the basis of identified cost and include proceeds received from litigation. Commissions paid to certain brokers with whom the investment adviser, or its affiliates, places trades on behalf of a fund include an amount in addition to trade execution, which may be rebated back to a fund. Any such rebates are included in net realized gain (loss) on investments in the Statement of Operations. Dividend income is recorded on the ex-dividend date, except for certain dividends from foreign securities where the ex-dividend date may have passed, which are recorded as soon as the Fund is informed of the ex-dividend date. Non-cash dividends included in dividend income, if any, are recorded at the fair market value of the securities received. Income and capital gain distributions from Fidelity Central Funds, if any, are recorded on the ex-dividend date. Large, non-recurring dividends recognized by the Fund are presented separately on the Statement of Operations in "Non-cash dividends" and the impact of these dividends is presented in the Financial Highlights. Interest income is accrued as earned and includes coupon interest and amortization of premium and accretion of discount on debt securities as applicable. Investment income is recorded net of foreign taxes withheld where recovery of such taxes is uncertain. Funds may file withholding tax reclaims in certain jurisdictions to recover a portion of amounts previously withheld. Any withholding tax reclaims income is included in the Statement of Operations in foreign taxes withheld. Any receivables for withholding tax reclaims are included in the Statement of Assets and Liabilities in dividends receivable.
Class Allocations and Expenses. Investment income, realized and unrealized capital gains and losses, common expenses of a fund, and certain fund-level expense reductions, if any, are allocated daily on a pro-rata basis to each class based on the relative net assets of each class to the total net assets of a fund. Each class differs with respect to transfer agent and distribution and service plan fees incurred, as applicable. Certain expense reductions may also differ by class, if applicable. For the reporting period, the allocated portion of income and expenses to each class as a percent of its average net assets may vary due to the timing of recording these transactions in relation to fluctuating net assets of the classes. Expenses directly attributable to a fund are charged to that fund. Expenses attributable to more than one fund are allocated among the respective funds on the basis of relative net assets or other appropriate methods. Expenses included in the accompanying financial statements reflect the expenses of that fund and do not include any expenses associated with any underlying mutual funds or exchange-traded funds (ETFs). Although not included in a fund's expenses, a fund indirectly bears its proportionate share of these expenses through the net asset value of each underlying mutual fund or exchange-traded fund (ETF). Expense estimates are accrued in the period to which they relate and adjustments are made when actual amounts are known.
Income Tax Information and Distributions to Shareholders. Each year, the Fund intends to qualify as a regulated investment company under Subchapter M of the Internal Revenue Code, including distributing substantially all of its taxable income and realized gains. As a result, no provision for U.S. Federal income taxes is required. As of October 31, 2023, the Fund did not have any unrecognized tax benefits in the financial statements; nor is the Fund aware of any tax positions for which it is reasonably possible that the total amounts of unrecognized tax benefits will significantly change in the next twelve months. The Fund files a U.S. federal tax return, in addition to state and local tax returns as required. The Fund's federal income tax returns are subject to examination by the Internal Revenue Service (IRS) for a period of three fiscal years after they are filed. State and local tax returns may be subject to examination for an additional fiscal year depending on the jurisdiction. Foreign taxes are provided for based on the Fund's understanding of the tax rules and rates that exist in the foreign markets in which it invests. The Fund is subject to a tax imposed on capital gains by certain countries in which it invests. An estimated deferred tax liability for net unrealized appreciation on the applicable securities is included in Deferred taxes on the Statement of Assets & Liabilities.
Distributions are declared and recorded on the ex-dividend date. Income and capital gain distributions are declared separately for each class. Income and capital gain distributions are determined in accordance with income tax regulations, which may differ from GAAP. In addition, the Fund claimed a portion of the payment made to redeeming shareholders as a distribution for income tax purposes.
Capital accounts within the financial statements are adjusted for permanent book-tax differences. These adjustments have no impact on net assets or the results of operations. Capital accounts are not adjusted for temporary book-tax differences which will reverse in a subsequent period.
Book-tax differences are primarily due to foreign currency transactions, certain foreign taxes, passive foreign investment companies (PFIC), capital loss carryforwards and losses deferred due to wash sales.
As of period end, the cost and unrealized appreciation (depreciation) in securities, and derivatives if applicable, for federal income tax purposes were as follows:
| Gross unrealized appreciation | $1,857,134,486 |
| Gross unrealized depreciation | (1,044,194,786) |
| Net unrealized appreciation (depreciation) | $812,939,700 |
| Tax Cost | $6,093,061,098 |
The tax-based components of distributable earnings as of period end were as follows:
| Undistributed ordinary income | $69,710,466 |
| Capital loss carryforward | $(692,207,341) |
| Net unrealized appreciation (depreciation) on securities and other investments | $811,134,535 |
Capital loss carryforwards are only available to offset future capital gains of the Fund to the extent provided by regulations and may be limited. The capital loss carryforward information presented below, including any applicable limitation, is estimated as of fiscal period end and is subject to adjustment.
Short-term | $(370,826,960) |
Long-term | (321,380,381) |
| Total capital loss carryforward | $(692,207,341) |
The tax character of distributions paid was as follows:
| | October 31, 2023 | October 31, 2022 |
| Ordinary Income | $50,450,464 | $90,092,233 |
| Long-term Capital Gains | - | 391,699,341 |
| Total | $50,450,464 | $481,791,574 |
Restricted Securities (including Private Placements). Funds may invest in securities that are subject to legal or contractual restrictions on resale. These securities generally may be resold in transactions exempt from registration or to the public if the securities are registered. Disposal of these securities may involve time-consuming negotiations and expense, and prompt sale at an acceptable price may be difficult. Information regarding restricted securities held at period end is included at the end of the Schedule of Investments, if applicable.
New Accounting Pronouncement. In June 2022, the Financial Accounting Standards Board (FASB) issued Accounting Standards Update (ASU) 2022-03 Fair Value Measurement (Topic 820): Fair Value Measurement of Equity Securities Subject to Contractual Sale Restrictions. The amendments in this ASU clarify that a contractual restriction on the sale of an equity security is not considered part of the unit of account of the equity security and, therefore, is not considered in measuring fair value. They also clarify that an entity cannot, as a separate unit of account, recognize and measure a contractual sale restriction. They also require additional disclosures for equity securities subject to contractual sale restrictions. ASU 2022-03 will be effective for fiscal years, including interim periods within those fiscal years, beginning after December 15, 2023, and allows for early adoption. ASU 2022-03 will only be applicable to an equity security in which the contractual arrangement that restricts its sale is executed or modified on or after the adoption date. Management is currently evaluating the potential impact of ASU 2022-03 to the financial statements.
4. Purchases and Sales of Investments.
Purchases and sales of securities, other than short-term securities and in-kind transactions, as applicable, are noted in the table below.
| | Purchases ($) | Sales ($) |
| Fidelity Emerging Markets Fund | 2,127,648,208 | 1,536,002,003 |
5. Fees and Other Transactions with Affiliates.
Management Fee. Fidelity Management & Research Company LLC (the investment adviser) and its affiliates provide the Fund with investment management related services for which the Fund pays a monthly management fee. The management fee is the sum of an individual fund fee rate that is based on an annual rate of .45% of the Fund's average net assets and an annualized group fee rate that averaged .23% during the period. The group fee rate is based upon the monthly average net assets of a group of registered investment companies with which the investment adviser has management contracts. The group fee rate decreases as assets under management increase and increases as assets under management decrease. For the reporting period, the total annual management fee rate was .67% of the Fund's average net assets.
Distribution and Service Plan Fees. In accordance with Rule 12b-1 of the 1940 Act, the Fund has adopted separate Distribution and Service Plans for each class of shares. Certain classes pay Fidelity Distributors Company LLC (FDC), an affiliate of the investment adviser, separate Distribution and Service Fees, each of which is based on an annual percentage of each class' average net assets. In addition, FDC may pay financial intermediaries for selling shares of the Fund and providing shareholder support services. For the period, the Distribution and Service Fee rates, total fees and amounts retained by FDC were as follows:
| | Distribution Fee | Service Fee | Total Fees | Retained by FDC |
| Class A | - % | .25% | $38,020 | $4,048 |
| Class M | .25% | .25% | 12,072 | - |
| Class C | .75% | .25% | 18,000 | 8,831 |
| | | | $68,092 | $12,879 |
Sales Load. FDC may receive a front-end sales charge of up to 5.75% for selling Class A shares and 3.50% for selling Class M shares, some of which is paid to financial intermediaries for selling shares of the Fund. Depending on the holding period, FDC may receive contingent deferred sales charges levied on Class A, Class M and Class C redemptions. The deferred sales charges are 1.00% for Class C shares, 1.00% for certain purchases of Class A shares and .25% for certain purchases of Class M shares.
For the period, sales charge amounts retained by FDC were as follows:
| | Retained by FDC |
| Class A | $26,654 |
| Class M | 1,072 |
Class CA | 84 |
| | $27,810 |
A When Class C shares are initially sold, FDC pays commissions from its own resources to financial intermediaries through which the sales are made.
Transfer Agent Fees. Fidelity Investments Institutional Operations Company LLC (FIIOC), an affiliate of the investment adviser, is the transfer, dividend disbursing and shareholder servicing agent for each class of the Fund. FIIOC receives account fees and asset-based fees that vary according to the account size and type of account of the shareholders of the respective classes of the Fund, except for Class K and Class Z. FIIOC receives an asset-based fee of Class K's and Class Z's average net assets. FIIOC pays for typesetting, printing and mailing of shareholder reports, except proxy statements.
For the period, transfer agent fees for each class were as follows:
| | Amount | % of Class-Level Average Net Assets |
| Class A | $34,377 | .23 |
| Class M | 6,140 | .25 |
| Class C | 4,599 | .26 |
| Emerging Markets | 7,243,375 | .17 |
| Class K | 445,481 | .04 |
| Class I | 186,774 | .18 |
| Class Z | 673,013 | .04 |
| | $8,593,759 | |
During November 2023, the Board approved a change in the transfer agent fees effective December 1, 2023 to a fixed annual rate of class-level average net assets as follows:
| | % of Class-Level Average Net Assets |
| Class A | 0.2000 |
| Class M | 0.2000 |
| Class C | 0.2000 |
| Emerging Markets | 0.1718 |
| Class I | 0.1894 |
Accounting Fees. Fidelity Service Company, Inc. (FSC), an affiliate of the investment adviser, maintains the Fund's accounting records. The accounting fee is based on the level of average net assets for each month. For the period, the fees were equivalent to the following annual rates:
| | % of Average Net Assets |
| Fidelity Emerging Markets Fund | .02 |
During November 2023, the Board approved a change in the accounting fees effective December 1, 2023 to a fixed annual rate of average net assets as follows:
| | % of Average Net Assets |
| Fidelity Emerging Markets Fund | 0.0211 |
Brokerage Commissions. A portion of portfolio transactions were placed with brokerage firms which are affiliates of the investment adviser. Brokerage commissions are included in net realized gain (loss) and change in net unrealized appreciation (depreciation) in the Statement of Operations. The commissions paid to these affiliated firms were as follows:
| | Amount |
| Fidelity Emerging Markets Fund | $20,934 |
Interfund Lending Program. Pursuant to an Exemptive Order issued by the Securities and Exchange Commission (the SEC), the Fund, along with other registered investment companies having management contracts with Fidelity Management & Research Company LLC (FMR), or other affiliated entities of FMR, may participate in an interfund lending program. This program provides an alternative credit facility allowing the Fund to borrow from, or lend money to, other participating affiliated funds. At period end, there were no interfund loans outstanding. Activity in this program during the period for which loans were outstanding was as follows:
| | Borrower or Lender | Average Loan Balance | Weighted Average Interest Rate | Interest Expense |
| Fidelity Emerging Markets Fund | Borrower | $ 2,768,500 | 5.57% | $857 |
Interfund Trades. Funds may purchase from or sell securities to other Fidelity Funds under procedures adopted by the Board. The procedures have been designed to ensure these interfund trades are executed in accordance with Rule 17a-7 of the 1940 Act. Any interfund trades are included within the respective purchases and sales amounts shown in the Purchases and Sales of Investments note. Interfund trades during the period are noted in the table below.
| | Purchases ($) | Sales ($) | Realized Gain (Loss) ($) |
| Fidelity Emerging Markets Fund | 21,504,562 | 32,997,546 | (10,074,019) |
Other. During the period, the investment adviser reimbursed the Fund for certain losses as follows:
| | Amount ($) |
| Fidelity Emerging Markets Fund | 67,156 |
6. Committed Line of Credit.
Certain Funds participate with other funds managed by the investment adviser or an affiliate in a $4.25 billion credit facility (the "line of credit") to be utilized for temporary or emergency purposes to fund shareholder redemptions or for other short-term liquidity purposes. The participating funds have agreed to pay commitment fees on their pro-rata portion of the line of credit, which are reflected in Miscellaneous expenses on the Statement of Operations, and are listed below. During the period, there were no borrowings on this line of credit.
| | Amount |
| Fidelity Emerging Markets Fund | $12,380 |
7. Security Lending.
Funds lend portfolio securities from time to time in order to earn additional income. Lending agents are used, including National Financial Services (NFS), an affiliate of the investment adviser. Pursuant to a securities lending agreement, NFS will receive a fee, which is capped at 9.9% of a fund's daily lending revenue, for its services as lending agent. A fund may lend securities to certain qualified borrowers, including NFS. On the settlement date of the loan, a fund receives collateral (in the form of U.S. Treasury obligations, letters of credit and/or cash) against the loaned securities and maintains collateral in an amount not less than 100% of the market value of the loaned securities during the period of the loan. The market value of the loaned securities is determined at the close of business of a fund and any additional required collateral is delivered to a fund on the next business day. A fund or borrower may terminate the loan at any time, and if the borrower defaults on its obligation to return the securities loaned because of insolvency or other reasons, a fund may apply collateral received from the borrower against the obligation. A fund may experience delays and costs in recovering the securities loaned. Any cash collateral received is invested in the Fidelity Securities Lending Cash Central Fund. Any loaned securities are identified as such in the Schedule of Investments, and the value of loaned securities and cash collateral at period end, as applicable, are presented in the Statement of Assets and Liabilities. Security lending income represents the income earned on investing cash collateral, less rebates paid to borrowers and any lending agent fees associated with the loan, plus any premium payments received for lending certain types of securities. Security lending income is presented in the Statement of Operations as a component of income from Fidelity Central Funds. Affiliated security lending activity, if any, was as follows:
| | Total Security Lending Fees Paid to NFS | Security Lending Income From Securities Loaned to NFS | Value of Securities Loaned to NFS at Period End |
| Fidelity Emerging Markets Fund | $37,490 | $ 38,413 | $- |
8. Expense Reductions.
Through arrangements with the Fund's custodian and each class' transfer agent, credits realized as a result of certain uninvested cash balances were used to reduce the Fund's expenses. During the period, custodian credits reduced the Fund's expenses by $7,635. During the period, transfer agent credits reduced each class' expenses as noted in the table below.
| | Expense reduction |
| Class A | $45 |
| Class M | 140 |
| Class C | 26 |
| | $211 |
In addition, during the period the investment adviser or an affiliate reimbursed and/or waived a portion of fund-level operating expenses in the amount of $424,630.
9. Distributions to Shareholders.
Distributions to shareholders of each class were as follows:
| | Year ended October 31, 2023 | Year ended October 31, 2022 |
| Fidelity Emerging Markets Fund | | |
| Distributions to shareholders | | |
| Class A | $53,539 | $625,889 |
| Class M | 1,926 | 114,309 |
| Class C | - | 82,608 |
| Emerging Markets | 28,390,916 | 277,953,427 |
| Class K | 8,364,511 | 95,062,813 |
| Class I | 674,976 | 1,596,371 |
| Class Z | 12,964,596 | 106,356,157 |
Total | $50,450,464 | $481,791,574 |
10. Share Transactions.
Share transactions for each class were as follows and may contain in-kind transactions, automatic conversions between classes or exchanges between affiliated funds:
| | Shares | Shares | Dollars | Dollars |
| | Year ended October 31, 2023 | Year ended October 31, 2022 | Year ended October 31, 2023 | Year ended October 31, 2022 |
| Fidelity Emerging Markets Fund | | | | |
| Class A | | | | |
| Shares sold | 311,663 | 405,334 | $10,362,526 | $16,326,133 |
| Reinvestment of distributions | 1,632 | 14,217 | 52,760 | 609,645 |
| Shares redeemed | (194,860) | (188,821) | (6,441,724) | (6,470,572) |
| Net increase (decrease) | 118,435 | 230,730 | $3,973,562 | $10,465,206 |
| Class M | | | | |
| Shares sold | 53,614 | 9,094 | $1,831,527 | $331,845 |
| Reinvestment of distributions | 60 | 2,657 | 1,926 | 114,195 |
| Shares redeemed | (7,386) | (8,614) | (241,523) | (305,492) |
| Net increase (decrease) | 46,288 | 3,137 | $1,591,930 | $140,548 |
| Class C | | | | |
| Shares sold | 28,408 | 27,888 | $941,354 | $1,033,697 |
| Reinvestment of distributions | - | 1,916 | - | 82,366 |
| Shares redeemed | (22,275) | (13,429) | (725,503) | (473,302) |
| Net increase (decrease) | 6,133 | 16,375 | $215,851 | $642,761 |
| Emerging Markets | | | | |
| Shares sold | 32,842,894 | 90,211,588 | $1,091,041,239 | $3,178,493,756 |
| Reinvestment of distributions | 705,770 | 4,752,444 | 22,902,138 | 204,307,548 |
| Shares redeemed | (28,385,896) | (80,932,071) | (937,069,628) | (2,841,698,156) |
| Net increase (decrease) | 5,162,768 | 14,031,961 | $176,873,749 | $541,103,148 |
| Class K | | | | |
| Shares sold | 13,987,503 | 8,137,924 | $471,747,111 | $295,826,108 |
| Reinvestment of distributions | 257,656 | 2,211,734 | 8,363,213 | 95,060,337 |
| Shares redeemed | (9,646,138) | (16,201,876) | (321,986,003) | (567,669,911) |
| Net increase (decrease) | 4,599,021 | (5,852,218) | $158,124,321 | $(176,783,466) |
| Class I | | | | |
| Shares sold | 3,147,089 | 2,413,035 | $103,953,662 | $83,439,062 |
| Reinvestment of distributions | 19,449 | 35,220 | 629,629 | 1,511,652 |
| Shares redeemed | (1,278,880) | (1,272,970) | (41,874,106) | (42,317,885) |
| Net increase (decrease) | 1,887,658 | 1,175,285 | $62,709,185 | $42,632,829 |
| Class Z | | | | |
| Shares sold | 6,017,620 | 8,050,253 | $203,435,458 | $312,633,669 |
| Reinvestment of distributions | 395,803 | 2,468,777 | 12,830,167 | 105,984,590 |
| Shares redeemed | (2,879,543) | (1,412,722) | (95,344,656) | (48,947,397) |
| Net increase (decrease) | 3,533,880 | 9,106,308 | $120,920,969 | $369,670,862 |
11. Other.
A fund's organizational documents provide former and current trustees and officers with a limited indemnification against liabilities arising in connection with the performance of their duties to the fund. In the normal course of business, a fund may also enter into contracts that provide general indemnifications. A fund's maximum exposure under these arrangements is unknown as this would be dependent on future claims that may be made against a fund. The risk of material loss from such claims is considered remote.
At the end of the period, the following mutual funds managed by the investment adviser or its affiliates were the owners of record of 10% or more of the total outstanding shares.
| | Strategic Advisers Fidelity Emerging Markets Fund |
| Fidelity Emerging Markets Fund | 14% |
Mutual funds managed by the investment adviser or its affiliates, in aggregate, were the owners of record of more than 20% of the total outstanding shares.
| Fund | % of shares held |
| Fidelity Emerging Markets Fund | 32% |
12. Risk and Uncertainties.
Many factors affect a fund's performance. Developments that disrupt global economies and financial markets, such as pandemics, epidemics, outbreaks of infectious diseases, war, terrorism, and environmental disasters, may significantly affect a fund's investment performance. The effects of these developments to a fund will be impacted by the types of securities in which a fund invests, the financial condition, industry, economic sector, and geographic location of an issuer, and a fund's level of investment in the securities of that issuer. Significant concentrations in security types, issuers, industries, sectors, and geographic locations may magnify the factors that affect a fund's performance.
Average annual total return reflects the change in the value of an investment, assuming reinvestment of distributions from dividend income and capital gains (the profits earned upon the sale of securities that have grown in value, if any) and assuming a constant rate of performance each year. The hypothetical investment and the average annual total returns do not reflect the deduction of taxes that a shareholder would pay on fund distributions or the redemption of fund shares. During periods of reimbursement by Fidelity, a fund's total return will be greater than it would be had the reimbursement not occurred. How a fund did yesterday is no guarantee of how it will do tomorrow.
| Average Annual Total Returns |
| | | | |
Periods ended October 31, 2023 | Past 1 year | Past 5 years | Past 10 years |
Class A (incl. 5.75% sales charge) | 4.23% | 1.41% | 1.46% |
Class M (incl. 3.50% sales charge) | 6.45% | 1.59% | 1.41% |
Class C (incl. contingent deferred sales charge) | 8.76% | 1.81% | 1.42% |
| Fidelity® Europe Fund | 10.92% | 2.94% | 2.38% |
| Class I | 10.96% | 2.95% | 2.40% |
| Class Z | 11.10% | 3.07% | 2.46% |
Class A shares bear a 0.25% 12b-1 fee. The initial offering of Class A shares took place on March 18, 2014. Returns prior to March 18, 2014, are those of Fidelity® Europe Fund, the original class of the fund, which has no 12b-1 fee. Had Class A's 12b-1 fee been reflected, returns prior to March 18, 2014, would have been lower.
Class M shares bear a 0.50% 12b-1 fee. The initial offering of Class M shares took place on March 18, 2014. Returns prior to March 18, 2014, are those of Fidelity® Europe Fund, the original class of the fund, which has no 12b-1 fee. Had Class M's 12b-1 fee been reflected, returns prior to March 18, 2014, would have been lower.
Class C shares bear a 1.00% 12b-1 fee. The initial offering of Class C shares took place on March 18, 2014. Returns prior to March 18, 2014, are those of Fidelity® Europe Fund, the original class of the fund, which has no 12b-1 fee. Had Class C's 12b-1 fee been reflected, returns prior to March 18, 2014, would have been lower.
Class C shares' contingent deferred sales charges included in the past one year, past five years and past ten years total return figures are 1%, 0% and 0%, respectively.
The initial offering of Class I shares took place on March 18, 2014. Returns prior to March 18, 2014, are those of Fidelity® Europe Fund, the original class of the fund.
The initial offering of Class Z shares took place on October 2, 2018. Returns between March 18, 2014 and October 2, 2018, are those of Class I. Returns prior to March 18, 2014 are those of Fidelity® Europe Fund, the original class of the fund.
| $10,000 Over 10 Years |
| |
Let's say hypothetically that $10,000 was invested in Fidelity® Europe Fund, a class of the fund, on October 31, 2013. The chart shows how the value of your investment would have changed, and also shows how the MSCI Europe Index performed over the same period. |
|
|
Fidelity® Europe Fund
Market Recap:
International (non-U.S.) equities gained 12.27% for the 12 months ending October 31, 2023, according to the MSCI ACWI (All Country World Index) ex USA Index, as global economic expansion and a slowing in the pace of inflation in some markets provided a favorable backdrop for risk assets. After returning -15.86% in 2022, the index's upturn has been largely driven by a narrow set of companies in the information technology and communication services sectors, in part due to excitement for generative artificial intelligence applications. The index gained 14.07% year to date through July, including strong gains in both June (+4.50%) and July (+4.07%). The rally for international equities sputtered for the next three months (-11.33%) amid a stalling pattern in disinflationary trends, heightened global recession and geopolitical risks, soaring yields on longer-term U.S. government bonds and particularly weak economic conditions in the eurozone and China. The three-month decline left non-U.S. stocks up 1.15% year to date through October. For the full 12 months, nearly all regions advanced, with Europe ex U.K. (+18%) and Japan (+17%) leading, whereas Canada (-0.38%) lagged by the widest margin. Each of the 11 sectors advanced, with information technology (+21%) and consumer discretionary (+19%) leading the way. Energy and industrials each rose about 14%. Conversely, four defensive-oriented sectors lagged by the widest margin: real estate (+4%), health care (+6%), consumer staples (+7%) and utilities (+8%).
Comments from Co-Lead-Managers Allyson Ke and Faris Rahman:
For the fiscal year ending October 31, 2023, the fund's share classes (excluding sales charges, if applicable) gained about 10% to 11%, versus 16.05% for the benchmark MSCI Europe Index (Net MA). From a regional standpoint, stock picks in Europe ex U.K. and in the U.K. detracted from the fund's relative result. By sector, security selection was the primary detractor, especially within financials, where our stock selection in insurance hurt most. Security selection in industrials, primarily within the capital goods industry, also hurt. Also hurting our result were picks in consumer staples and utilities. The biggest individual relative detractor was our stake in Sartorius Stedim Biotech (-26%). Sartorius Stedim Biotech was not held at period end. A non-benchmark stake in Resmed returned approximately -34% and was a second notable relative detractor. Resmed was not held at period end. Not owning HSBC Holdings, a benchmark component that gained roughly 48%, was another notable relative detractor. In contrast, security selection and an overweight in the consumer discretionary sector, primarily within the consumer discretionary distribution & retail industry, notably contributed to the fund's relative performance. An underweight in communication services and materials also modestly boosted the fund's relative result. The top individual relative contributor was an overweight in Novo-Nordisk (+78%). Novo-Nordisk was the fund's top holding as of period end. This period we increased our stake in Novo-Nordisk. Not owning British American Tobacco, a benchmark component that returned roughly -18%, was a second notable relative contributor. A non-benchmark stake in B&M European Value Retail gained approximately 57% and notably helped. This was a position we established this period. Notable changes in positioning include increased exposure to the information technology sector and a lower allocation to materials.
The views expressed above reflect those of the portfolio manager(s) only through the end of the period as stated on the cover of this report and do not necessarily represent the views of Fidelity or any other person in the Fidelity organization. Any such views are subject to change at any time based upon market or other conditions and Fidelity disclaims any responsibility to update such views. These views may not be relied on as investment advice and, because investment decisions for a Fidelity fund are based on numerous factors, may not be relied on as an indication of trading intent on behalf of any Fidelity fund.
Fidelity® Europe Fund
Top Holdings (% of Fund's net assets) |
| |
| Novo Nordisk A/S Series B (Denmark, Pharmaceuticals) | 6.1 | |
| ASML Holding NV (Netherlands) (Netherlands, Semiconductors & Semiconductor Equipment) | 4.5 | |
| Nestle SA (Reg. S) (United States of America, Food Products) | 4.1 | |
| AstraZeneca PLC (United Kingdom) (United Kingdom, Pharmaceuticals) | 4.1 | |
| TotalEnergies SE (France, Oil, Gas & Consumable Fuels) | 3.9 | |
| LVMH Moet Hennessy Louis Vuitton SE (France, Textiles, Apparel & Luxury Goods) | 3.6 | |
| Air Liquide SA (France, Chemicals) | 2.6 | |
| SAP SE (Germany, Software) | 2.5 | |
| RELX PLC (London Stock Exchange) (United Kingdom, Professional Services) | 2.4 | |
| L'Oreal SA (France, Personal Care Products) | 2.4 | |
| | 36.2 | |
| |
| Market Sectors (% of Fund's net assets) |
| |
| Health Care | 17.0 | |
| Financials | 16.6 | |
| Industrials | 14.1 | |
| Consumer Discretionary | 12.2 | |
| Consumer Staples | 11.7 | |
| Information Technology | 10.5 | |
| Energy | 5.6 | |
| Materials | 5.0 | |
| Communication Services | 3.1 | |
| Utilities | 1.1 | |
| Real Estate | 1.0 | |
| |
Asset Allocation (% of Fund's net assets) |
|
|
Geographic Diversification (% of Fund's net assets) |
|
* Includes Short-Term investments and Net Other Assets (Liabilities). Percentages are adjusted for the effect of derivatives, if applicable. |
| |
Fidelity® Europe Fund
Showing Percentage of Net Assets
| Common Stocks - 97.8% |
| | | Shares | Value ($) |
| Australia - 1.3% | | | |
| Glencore PLC | | 1,373,900 | 7,277,316 |
| Belgium - 1.6% | | | |
| Azelis Group NV | | 1,200 | 20,442 |
| KBC Group NV | | 53,000 | 2,910,516 |
| UCB SA | | 75,900 | 5,546,194 |
TOTAL BELGIUM | | | 8,477,152 |
| China - 0.7% | | | |
| Prosus NV | | 129,053 | 3,609,042 |
| Denmark - 8.3% | | | |
| DSV A/S | | 17,300 | 2,580,131 |
| Novo Nordisk A/S Series B | | 345,700 | 33,351,833 |
| Tryg A/S | | 328,400 | 6,408,543 |
| Vestas Wind Systems A/S (a) | | 154,000 | 3,337,917 |
TOTAL DENMARK | | | 45,678,424 |
| Finland - 2.5% | | | |
| Elisa Corp. (A Shares) | | 125,900 | 5,339,249 |
| Nordea Bank Abp | | 768,000 | 8,070,486 |
TOTAL FINLAND | | | 13,409,735 |
| France - 22.7% | | | |
| Air Liquide SA | | 82,880 | 14,201,675 |
| Airbus Group NV | | 62,200 | 8,339,541 |
| AXA SA | | 272,500 | 8,074,291 |
| BNP Paribas SA | | 128,200 | 7,372,016 |
| Capgemini SA | | 40,600 | 7,175,189 |
| Dassault Aviation SA | | 51,300 | 10,177,599 |
| Dassault Systemes SA | | 90,600 | 3,732,119 |
| Edenred SA | | 85,100 | 4,523,826 |
| L'Oreal SA | | 30,800 | 12,946,186 |
| LVMH Moet Hennessy Louis Vuitton SE | | 27,600 | 19,759,684 |
| Pernod Ricard SA | | 37,100 | 6,575,298 |
| TotalEnergies SE | | 324,007 | 21,662,292 |
TOTAL FRANCE | | | 124,539,716 |
| Germany - 10.4% | | | |
| Deutsche Borse AG | | 35,700 | 5,876,094 |
| DHL Group | | 90,300 | 3,512,287 |
| Gerresheimer AG | | 30,300 | 2,818,112 |
| Merck KGaA | | 31,900 | 4,804,795 |
| MTU Aero Engines AG | | 23,100 | 4,326,253 |
| Rheinmetall AG | | 13,900 | 3,976,932 |
| RWE AG | | 162,800 | 6,223,706 |
| SAP SE | | 103,500 | 13,882,696 |
| SCHOTT Pharma AG & Co. KGaA | | 65,000 | 1,884,476 |
| Scout24 AG (b) | | 87,100 | 5,347,153 |
| Siemens Healthineers AG (b) | | 85,600 | 4,195,358 |
TOTAL GERMANY | | | 56,847,862 |
| Hong Kong - 1.0% | | | |
| Prudential PLC | | 514,355 | 5,378,296 |
| Ireland - 1.0% | | | |
| Bank of Ireland Group PLC | | 589,400 | 5,269,793 |
| Italy - 5.8% | | | |
| Coca-Cola HBC AG | | 97,600 | 2,529,147 |
| Davide Campari Milano NV | | 346,200 | 3,820,657 |
| Ferrari NV (Italy) | | 21,900 | 6,615,717 |
| FinecoBank SpA | | 291,635 | 3,429,856 |
| Industrie de Nora SpA | | 120,000 | 1,692,537 |
| Prada SpA | | 587,600 | 3,539,736 |
| Recordati SpA | | 148,000 | 6,827,708 |
| UniCredit SpA | | 140,800 | 3,529,802 |
TOTAL ITALY | | | 31,985,160 |
| Netherlands - 5.2% | | | |
| ASML Holding NV (Netherlands) | | 41,200 | 24,766,161 |
| Heineken NV (Bearer) | | 42,800 | 3,845,300 |
TOTAL NETHERLANDS | | | 28,611,461 |
| Norway - 2.3% | | | |
| Equinor ASA | | 215,800 | 7,234,310 |
| Kongsberg Gruppen ASA | | 72,700 | 2,967,626 |
| TGS ASA | | 176,583 | 2,405,877 |
TOTAL NORWAY | | | 12,607,813 |
| Spain - 0.7% | | | |
| CaixaBank SA | | 985,100 | 4,004,965 |
| Sweden - 6.5% | | | |
| ASSA ABLOY AB (B Shares) | | 186,000 | 3,964,604 |
| Evolution AB (b) | | 38,700 | 3,438,898 |
| Haypp Group (a) | | 399,824 | 1,608,258 |
| Hemnet Group AB | | 336,300 | 5,835,754 |
| HEXPOL AB (B Shares) | | 238,100 | 2,105,315 |
| Indutrade AB | | 203,400 | 3,592,429 |
| Investor AB (B Shares) | | 360,200 | 6,595,763 |
| Kry International AB (a)(c)(d) | | 406 | 14,902 |
| Nordnet AB | | 233,200 | 3,290,407 |
| Sandvik AB | | 294,100 | 5,009,411 |
TOTAL SWEDEN | | | 35,455,741 |
| Switzerland - 2.2% | | | |
| Compagnie Financiere Richemont SA Series A | | 71,470 | 8,431,710 |
| Sika AG | | 16,240 | 3,872,320 |
TOTAL SWITZERLAND | | | 12,304,030 |
| United Kingdom - 18.9% | | | |
| 3i Group PLC | | 152,841 | 3,603,622 |
| AstraZeneca PLC (United Kingdom) | | 177,600 | 22,236,186 |
| B&M European Value Retail SA | | 795,200 | 5,110,989 |
| Beazley PLC | | 351,600 | 2,198,727 |
| Bunzl PLC | | 156,717 | 5,584,923 |
| Compass Group PLC | | 336,313 | 8,478,917 |
| Diageo PLC | | 300,280 | 11,355,396 |
| Direct Line Insurance Group PLC (a) | | 500,250 | 919,948 |
| Games Workshop Group PLC | | 6,900 | 828,177 |
| Grainger Trust PLC | | 875,148 | 2,418,851 |
| Hiscox Ltd. | | 306,417 | 3,493,436 |
| JD Sports Fashion PLC | | 2,768,700 | 4,290,651 |
| Judges Scientific PLC | | 10,868 | 1,077,896 |
| London Stock Exchange Group PLC | | 58,500 | 5,902,363 |
| Londonmetric Properity PLC | | 926,341 | 1,862,274 |
| RELX PLC (London Stock Exchange) | | 382,218 | 13,350,002 |
| Safestore Holdings PLC | | 211,769 | 1,759,292 |
| Sage Group PLC | | 636,200 | 7,505,352 |
| Vistry Group PLC | | 202,300 | 1,738,411 |
TOTAL UNITED KINGDOM | | | 103,715,413 |
| United States of America - 6.7% | | | |
| Experian PLC | | 119,157 | 3,607,700 |
| Nestle SA (Reg. S) | | 209,490 | 22,591,146 |
| Sanofi SA | | 113,300 | 10,288,345 |
TOTAL UNITED STATES OF AMERICA | | | 36,487,191 |
| TOTAL COMMON STOCKS (Cost $505,814,288) | | | 535,659,110 |
| | | | |
| Preferred Stocks - 0.1% |
| | | Shares | Value ($) |
| Convertible Preferred Stocks - 0.1% | | | |
| Estonia - 0.1% | | | |
| Bolt Technology OU Series E (a)(c)(d) | | 3,852 | 454,941 |
| Nonconvertible Preferred Stocks - 0.0% | | | |
| Sweden - 0.0% | | | |
| Kry International AB Series E (a)(c)(d) | | 2,345 | 86,074 |
| TOTAL PREFERRED STOCKS (Cost $2,072,807) | | | 541,015 |
| | | | |
| Money Market Funds - 1.3% |
| | | Shares | Value ($) |
| Fidelity Cash Central Fund 5.40% (e) | | 4,562,325 | 4,563,237 |
| Fidelity Securities Lending Cash Central Fund 5.40% (e)(f) | | 2,636,593 | 2,636,857 |
| TOTAL MONEY MARKET FUNDS (Cost $7,200,094) | | | 7,200,094 |
| | | | |
| TOTAL INVESTMENT IN SECURITIES - 99.2% (Cost $515,087,189) | 543,400,219 |
NET OTHER ASSETS (LIABILITIES) - 0.8% | 4,235,722 |
| NET ASSETS - 100.0% | 547,635,941 |
| | |
Legend
| (b) | Security exempt from registration under Rule 144A of the Securities Act of 1933. These securities may be resold in transactions exempt from registration, normally to qualified institutional buyers. At the end of the period, the value of these securities amounted to $12,981,409 or 2.4% of net assets. |
| (c) | Restricted securities (including private placements) - Investment in securities not registered under the Securities Act of 1933 (excluding 144A issues). At the end of the period, the value of restricted securities (excluding 144A issues) amounted to $555,917 or 0.1% of net assets. |
| (e) | Affiliated fund that is generally available only to investment companies and other accounts managed by Fidelity Investments. The rate quoted is the annualized seven-day yield of the fund at period end. A complete unaudited listing of the fund's holdings as of its most recent quarter end is available upon request. In addition, each Fidelity Central Fund's financial statements, which are not covered by the Fund's Report of Independent Registered Public Accounting Firm, are available on the SEC's website or upon request. |
| (f) | Investment made with cash collateral received from securities on loan. |
| Additional information on each restricted holding is as follows: |
| Security | Acquisition Date | Acquisition Cost ($) |
| Bolt Technology OU Series E | 1/03/22 | 1,000,736 |
| | | |
| Kry International AB | 5/14/21 | 176,328 |
| | | |
| Kry International AB Series E | 5/14/21 | 1,072,071 |
| | | |
Affiliated Central Funds
Fiscal year to date information regarding the Fund's investments in Fidelity Central Funds, including the ownership percentage, is presented below.
| Affiliate | Value, beginning of period ($) | Purchases ($) | Sales Proceeds ($) | Dividend Income ($) | Realized Gain (loss) ($) | Change in Unrealized appreciation (depreciation) ($) | Value, end of period ($) | % ownership, end of period |
| Fidelity Cash Central Fund 5.40% | - | 120,607,794 | 116,044,557 | 263,605 | - | - | 4,563,237 | 0.0% |
| Fidelity Securities Lending Cash Central Fund 5.40% | 3,435,000 | 78,810,746 | 79,608,889 | 87,188 | - | - | 2,636,857 | 0.0% |
| Total | 3,435,000 | 199,418,540 | 195,653,446 | 350,793 | - | - | 7,200,094 | |
| | | | | | | | | |
Amounts in the dividend income column in the above table include any capital gain distributions from underlying funds, which are presented in the corresponding line item in the Statement of Operations, if applicable.
Amounts in the dividend income column for Fidelity Securities Lending Cash Central Fund represents the income earned on investing cash collateral, less rebates paid to borrowers and any lending agent fees associated with the loan, plus any premium payments received for lending certain types of securities.
Amounts included in the purchases and sales proceeds columns may include in-kind transactions, if applicable.
Investment Valuation
The following is a summary of the inputs used, as of October 31, 2023, involving the Fund's assets and liabilities carried at fair value. The inputs or methodology used for valuing securities may not be an indication of the risk associated with investing in those securities. For more information on valuation inputs, and their aggregation into the levels used below, please refer to the Investment Valuation section in the accompanying Notes to Financial Statements.
| Valuation Inputs at Reporting Date: |
| Description | Total ($) | Level 1 ($) | Level 2 ($) | Level 3 ($) |
Investments in Securities: | | | | |
|
| Equities: | | | | |
Communication Services | 16,522,156 | 16,522,156 | - | - |
Consumer Discretionary | 67,450,190 | 27,240,143 | 40,210,047 | - |
Consumer Staples | 63,663,130 | 12,925,102 | 50,738,028 | - |
Energy | 31,302,479 | 2,405,877 | 28,896,602 | - |
Financials | 90,852,750 | 47,111,301 | 43,741,449 | - |
Health Care | 91,953,007 | 26,076,643 | 65,876,364 | - |
Industrials | 77,118,230 | 43,116,755 | 34,001,475 | - |
Information Technology | 57,617,434 | 7,505,352 | 49,556,165 | 555,917 |
Materials | 27,456,626 | 5,977,635 | 21,478,991 | - |
Real Estate | 6,040,417 | 6,040,417 | - | - |
Utilities | 6,223,706 | 6,223,706 | - | - |
|
| Money Market Funds | 7,200,094 | 7,200,094 | - | - |
| Total Investments in Securities: | 543,400,219 | 208,345,181 | 334,499,121 | 555,917 |
Fidelity® Europe Fund
| Statement of Assets and Liabilities |
| | | | October 31, 2023 |
| | | | | |
| Assets | | | | |
| Investment in securities, at value (including securities loaned of $2,683,615) - See accompanying schedule: | | | | |
Unaffiliated issuers (cost $507,887,095) | $ | 536,200,125 | | |
Fidelity Central Funds (cost $7,200,094) | | 7,200,094 | | |
| | | | | |
| | | | | |
| Total Investment in Securities (cost $515,087,189) | | | $ | 543,400,219 |
| Cash | | | | 631,917 |
| Receivable for investments sold | | | | 3,365,165 |
| Receivable for fund shares sold | | | | 24,988 |
| Reclaims receivable | | | | 3,484,850 |
| Distributions receivable from Fidelity Central Funds | | | | 7,173 |
| Prepaid expenses | | | | 866 |
Total assets | | | | 550,915,178 |
| Liabilities | | | | |
| Payable for investments purchased | $ | 15,547 | | |
| Payable for fund shares redeemed | | 258,677 | | |
| Accrued management fee | | 180,501 | | |
| Distribution and service plan fees payable | | 6,781 | | |
| Other affiliated payables | | 105,736 | | |
| Other payables and accrued expenses | | 75,138 | | |
| Collateral on securities loaned | | 2,636,857 | | |
| Total Liabilities | | | | 3,279,237 |
| Net Assets | | | $ | 547,635,941 |
| Net Assets consist of: | | | | |
| Paid in capital | | | $ | 611,327,841 |
| Total accumulated earnings (loss) | | | | (63,691,900) |
| Net Assets | | | $ | 547,635,941 |
| | | | | |
| Net Asset Value and Maximum Offering Price | | | | |
| Class A : | | | | |
Net Asset Value and redemption price per share ($15,324,998 ÷ 502,421 shares)(a) | | | $ | 30.50 |
| Maximum offering price per share (100/94.25 of $30.50) | | | $ | 32.36 |
| Class M : | | | | |
Net Asset Value and redemption price per share ($4,247,575 ÷ 139,270 shares)(a) | | | $ | 30.50 |
| Maximum offering price per share (100/96.50 of $30.50) | | | $ | 31.61 |
| Class C : | | | | |
Net Asset Value and offering price per share ($2,024,633 ÷ 67,425 shares)(a) | | | $ | 30.03 |
| Europe : | | | | |
Net Asset Value, offering price and redemption price per share ($519,010,343 ÷ 16,971,479 shares) | | | $ | 30.58 |
| Class I : | | | | |
Net Asset Value, offering price and redemption price per share ($4,806,367 ÷ 157,148 shares) | | | $ | 30.58 |
| Class Z : | | | | |
Net Asset Value, offering price and redemption price per share ($2,222,025 ÷ 72,782 shares) | | | $ | 30.53 |
(a)Redemption price per share is equal to net asset value less any applicable contingent deferred sales charge. |
| Statement of Operations |
| | | | Year ended October 31, 2023 |
| Investment Income | | | | |
| Dividends | | | $ | 15,776,445 |
| Foreign Tax Reclaims | | | | 1,681,827 |
| Income from Fidelity Central Funds (including $87,188 from security lending) | | | | 350,793 |
| Income before foreign taxes withheld | | | $ | 17,809,065 |
| Less foreign taxes withheld | | | | (2,819,871) |
| Total Income | | | | 14,989,194 |
| Expenses | | | | |
| Management fee | | | | |
| Basic fee | $ | 4,153,398 | | |
| Performance adjustment | | (1,427,604) | | |
| Transfer agent fees | | 1,048,507 | | |
| Distribution and service plan fees | | 91,571 | | |
| Accounting fees | | 294,606 | | |
| Custodian fees and expenses | | 50,095 | | |
| Independent trustees' fees and expenses | | 3,574 | | |
| Registration fees | | 83,267 | | |
| Audit | | 93,823 | | |
| Legal | | 618 | | |
| Miscellaneous | | 3,022 | | |
| Total expenses before reductions | | 4,394,877 | | |
| Expense reductions | | (37,253) | | |
| Total expenses after reductions | | | | 4,357,624 |
| Net Investment income (loss) | | | | 10,631,570 |
| Realized and Unrealized Gain (Loss) | | | | |
| Net realized gain (loss) on: | | | | |
| Investment Securities: | | | | |
| Unaffiliated issuers | | (2,036,144) | | |
| Foreign currency transactions | | 370,023 | | |
| Total net realized gain (loss) | | | | (1,666,121) |
| Change in net unrealized appreciation (depreciation) on: | | | | |
| Investment Securities: | | | | |
| Unaffiliated issuers | | 54,190,120 | | |
| Assets and liabilities in foreign currencies | | 210,531 | | |
| Total change in net unrealized appreciation (depreciation) | | | | 54,400,651 |
| Net gain (loss) | | | | 52,734,530 |
| Net increase (decrease) in net assets resulting from operations | | | $ | 63,366,100 |
| Statement of Changes in Net Assets |
| |
| | Year ended October 31, 2023 | | Year ended October 31, 2022 |
| Increase (Decrease) in Net Assets | | | | |
| Operations | | | | |
| Net investment income (loss) | $ | 10,631,570 | $ | 12,412,102 |
| Net realized gain (loss) | | (1,666,121) | | (97,543,049) |
| Change in net unrealized appreciation (depreciation) | | 54,400,651 | | (184,315,984) |
| Net increase (decrease) in net assets resulting from operations | | 63,366,100 | | (269,446,931) |
| Distributions to shareholders | | - | | (133,487,366) |
| | | | | |
| Share transactions - net increase (decrease) | | (68,214,872) | | (44,868,451) |
| | | | | |
| Total increase (decrease) in net assets | | (4,848,772) | | (447,802,748) |
| | | | | |
| Net Assets | | | | |
| Beginning of period | | 552,484,713 | | 1,000,287,461 |
| End of period | $ | 547,635,941 | $ | 552,484,713 |
| | | | | |
| | | | | |
Financial Highlights
| Fidelity Advisor® Europe Fund Class A |
| |
| Years ended October 31, | | 2023 | | 2022 | | 2021 | | 2020 | | 2019 |
Selected Per-Share Data | | | | | | | | | | |
| Net asset value, beginning of period | $ | 27.58 | $ | 46.12 | $ | 35.37 | $ | 36.30 | $ | 37.61 |
| Income from Investment Operations | | | | | | | | | | |
Net investment income (loss) A,B | | .46 | | .47 | | .41 | | .19 | | 1.41 C |
| Net realized and unrealized gain (loss) | | 2.46 | | (12.91) | | 10.72 | | 1.46 | | .82 |
| Total from investment operations | | 2.92 | | (12.44) | | 11.13 | | 1.65 | | 2.23 |
| Distributions from net investment income | | - | | (.99) | | (.38) | | (1.50) | | (.11) |
| Distributions from net realized gain | | - | | (5.12) | | - | | (1.08) | | (3.43) |
| Total distributions | | - | | (6.10) D | | (.38) | | (2.58) | | (3.54) |
| Net asset value, end of period | $ | 30.50 | $ | 27.58 | $ | 46.12 | $ | 35.37 | $ | 36.30 |
Total Return E,F | | 10.59% | | (30.29)% | | 31.60% | | 4.62% | | 7.21% |
Ratios to Average Net Assets B,G,H | | | | | | | | | | |
| Expenses before reductions | | 1.02% | | 1.18% | | 1.36% | | 1.34% | | 1.09% |
| Expenses net of fee waivers, if any | | 1.01% | | 1.18% | | 1.36% | | 1.34% | | 1.09% |
| Expenses net of all reductions | | 1.01% | | 1.18% | | 1.36% | | 1.33% | | 1.07% |
| Net investment income (loss) | | 1.43% | | 1.42% | | .92% | | .56% | | 4.02% C |
| Supplemental Data | | | | | | | | | | |
| Net assets, end of period (000 omitted) | $ | 15,325 | $ | 16,495 | $ | 32,148 | $ | 23,189 | $ | 20,819 |
Portfolio turnover rate I | | 37% | | 55% | | 52% | | 39% | | 45% |
ACalculated based on average shares outstanding during the period.
BNet investment income (loss) is affected by the timing of the declaration of dividends by any underlying mutual funds or exchange-traded funds (ETFs). Net investment income (loss) of any mutual funds or ETFs is not included in the Fund's net investment income (loss) ratio.
CNet investment income per share reflects one or more large, non-recurring dividend(s) which amounted to $.20 per share. Excluding such non-recurring dividend(s), the ratio of net investment income (loss) to average net assets would have been 3.44%.
DTotal distributions per share do not sum due to rounding.
ETotal returns would have been lower if certain expenses had not been reduced during the applicable periods shown.
FTotal returns do not include the effect of the sales charges.
GFees and expenses of any underlying mutual funds or exchange-traded funds (ETFs) are not included in the Fund's expense ratio. The Fund indirectly bears its proportionate share of these expenses. For additional expense information related to investments in Fidelity Central Funds, please refer to the "Investments in Fidelity Central Funds" note found in the Notes to Financial Statements section of the most recent Annual or Semi-Annual report.
HExpense ratios reflect operating expenses of the class. Expenses before reductions do not reflect amounts reimbursed, waived, or reduced through arrangements with the investment adviser, brokerage services, or other offset arrangements, if applicable, and do not represent the amount paid by the class during periods when reimbursements, waivers or reductions occur.
IAmount does not include the portfolio activity of any underlying mutual funds or exchange-traded funds (ETFs).
| Fidelity Advisor® Europe Fund Class M |
| |
| Years ended October 31, | | 2023 | | 2022 | | 2021 | | 2020 | | 2019 |
Selected Per-Share Data | | | | | | | | | | |
| Net asset value, beginning of period | $ | 27.65 | $ | 46.18 | $ | 35.42 | $ | 36.32 | $ | 37.57 |
| Income from Investment Operations | | | | | | | | | | |
Net investment income (loss) A,B | | .38 | | .37 | | .27 | | .09 | | 1.30 C |
| Net realized and unrealized gain (loss) | | 2.47 | | (12.95) | | 10.75 | | 1.45 | | .83 |
| Total from investment operations | | 2.85 | | (12.58) | | 11.02 | | 1.54 | | 2.13 |
| Distributions from net investment income | | - | | (.83) | | (.26) | | (1.36) | | - |
| Distributions from net realized gain | | - | | (5.12) | | - | | (1.08) | | (3.38) |
| Total distributions | | - | | (5.95) | | (.26) | | (2.44) | | (3.38) |
| Net asset value, end of period | $ | 30.50 | $ | 27.65 | $ | 46.18 | $ | 35.42 | $ | 36.32 |
Total Return D,E | | 10.31% | | (30.51)% | | 31.20% | | 4.30% | | 6.88% |
Ratios to Average Net Assets B,F,G | | | | | | | | | | |
| Expenses before reductions | | 1.29% | | 1.49% | | 1.68% | | 1.65% | | 1.41% |
| Expenses net of fee waivers, if any | | 1.28% | | 1.48% | | 1.68% | | 1.65% | | 1.40% |
| Expenses net of all reductions | | 1.28% | | 1.48% | | 1.68% | | 1.64% | | 1.38% |
| Net investment income (loss) | | 1.16% | | 1.12% | | .59% | | .25% | | 3.70% C |
| Supplemental Data | | | | | | | | | | |
| Net assets, end of period (000 omitted) | $ | 4,248 | $ | 4,066 | $ | 6,937 | $ | 5,204 | $ | 5,782 |
Portfolio turnover rate H | | 37% | | 55% | | 52% | | 39% | | 45% |
ACalculated based on average shares outstanding during the period.
BNet investment income (loss) is affected by the timing of the declaration of dividends by any underlying mutual funds or exchange-traded funds (ETFs). Net investment income (loss) of any mutual funds or ETFs is not included in the Fund's net investment income (loss) ratio.
CNet investment income per share reflects one or more large, non-recurring dividend(s) which amounted to $.20 per share. Excluding such non-recurring dividend(s), the ratio of net investment income (loss) to average net assets would have been 3.12%.
DTotal returns would have been lower if certain expenses had not been reduced during the applicable periods shown.
ETotal returns do not include the effect of the sales charges.
FFees and expenses of any underlying mutual funds or exchange-traded funds (ETFs) are not included in the Fund's expense ratio. The Fund indirectly bears its proportionate share of these expenses. For additional expense information related to investments in Fidelity Central Funds, please refer to the "Investments in Fidelity Central Funds" note found in the Notes to Financial Statements section of the most recent Annual or Semi-Annual report.
GExpense ratios reflect operating expenses of the class. Expenses before reductions do not reflect amounts reimbursed, waived, or reduced through arrangements with the investment adviser, brokerage services, or other offset arrangements, if applicable, and do not represent the amount paid by the class during periods when reimbursements, waivers or reductions occur.
HAmount does not include the portfolio activity of any underlying mutual funds or exchange-traded funds (ETFs).
| Fidelity Advisor® Europe Fund Class C |
| |
| Years ended October 31, | | 2023 | | 2022 | | 2021 | | 2020 | | 2019 |
Selected Per-Share Data | | | | | | | | | | |
| Net asset value, beginning of period | $ | 27.36 | $ | 45.63 | $ | 35.01 | $ | 35.87 | $ | 37.23 |
| Income from Investment Operations | | | | | | | | | | |
Net investment income (loss) A,B | | .21 | | .21 | | .04 | | (.09) | | 1.12 C |
| Net realized and unrealized gain (loss) | | 2.46 | | (12.84) | | 10.64 | | 1.45 | | .82 |
| Total from investment operations | | 2.67 | | (12.63) | | 10.68 | | 1.36 | | 1.94 |
| Distributions from net investment income | | - | | (.52) | | (.06) | | (1.14) | | - |
| Distributions from net realized gain | | - | | (5.12) | | - | | (1.08) | | (3.30) |
| Total distributions | | - | | (5.64) | | (.06) | | (2.22) | | (3.30) |
| Net asset value, end of period | $ | 30.03 | $ | 27.36 | $ | 45.63 | $ | 35.01 | $ | 35.87 |
Total Return D,E | | 9.76% | | (30.85)% | | 30.53% | | 3.81% | | 6.35% |
Ratios to Average Net Assets B,F,G | | | | | | | | | | |
| Expenses before reductions | | 1.79% | | 1.99% | | 2.19% | | 2.15% | | 1.90% |
| Expenses net of fee waivers, if any | | 1.78% | | 1.98% | | 2.18% | | 2.15% | | 1.90% |
| Expenses net of all reductions | | 1.78% | | 1.98% | | 2.18% | | 2.14% | | 1.87% |
| Net investment income (loss) | | .65% | | .62% | | .09% | | (.25)% | | 3.21% C |
| Supplemental Data | | | | | | | | | | |
| Net assets, end of period (000 omitted) | $ | 2,025 | $ | 2,496 | $ | 5,255 | $ | 5,242 | $ | 6,145 |
Portfolio turnover rate H | | 37% | | 55% | | 52% | | 39% | | 45% |
ACalculated based on average shares outstanding during the period.
BNet investment income (loss) is affected by the timing of the declaration of dividends by any underlying mutual funds or exchange-traded funds (ETFs). Net investment income (loss) of any mutual funds or ETFs is not included in the Fund's net investment income (loss) ratio.
CNet investment income per share reflects one or more large, non-recurring dividend(s) which amounted to $.20 per share. Excluding such non-recurring dividend(s), the ratio of net investment income (loss) to average net assets would have been 2.63%.
DTotal returns would have been lower if certain expenses had not been reduced during the applicable periods shown.
ETotal returns do not include the effect of the contingent deferred sales charge.
FFees and expenses of any underlying mutual funds or exchange-traded funds (ETFs) are not included in the Fund's expense ratio. The Fund indirectly bears its proportionate share of these expenses. For additional expense information related to investments in Fidelity Central Funds, please refer to the "Investments in Fidelity Central Funds" note found in the Notes to Financial Statements section of the most recent Annual or Semi-Annual report.
GExpense ratios reflect operating expenses of the class. Expenses before reductions do not reflect amounts reimbursed, waived, or reduced through arrangements with the investment adviser, brokerage services, or other offset arrangements, if applicable, and do not represent the amount paid by the class during periods when reimbursements, waivers or reductions occur.
HAmount does not include the portfolio activity of any underlying mutual funds or exchange-traded funds (ETFs).
| Years ended October 31, | | 2023 | | 2022 | | 2021 | | 2020 | | 2019 |
Selected Per-Share Data | | | | | | | | | | |
| Net asset value, beginning of period | $ | 27.57 | $ | 46.11 | $ | 35.35 | $ | 36.28 | $ | 37.70 |
| Income from Investment Operations | | | | | | | | | | |
Net investment income (loss) A,B | | .57 | | .57 | | .54 | | .30 | | 1.52 C |
| Net realized and unrealized gain (loss) | | 2.44 | | (12.88) | | 10.71 | | 1.46 | | .81 |
| Total from investment operations | | 3.01 | | (12.31) | | 11.25 | | 1.76 | | 2.33 |
| Distributions from net investment income | | - | | (1.11) | | (.49) | | (1.61) | | (.32) |
| Distributions from net realized gain | | - | | (5.12) | | - | | (1.08) | | (3.43) |
| Total distributions | | - | | (6.23) | | (.49) | | (2.69) | | (3.75) |
| Net asset value, end of period | $ | 30.58 | $ | 27.57 | $ | 46.11 | $ | 35.35 | $ | 36.28 |
Total Return D | | 10.92% | | (30.07)% | | 31.99% | | 4.95% | | 7.56% |
Ratios to Average Net Assets B,E,F | | | | | | | | | | |
| Expenses before reductions | | .70% | | .88% | | 1.06% | | 1.03% | | .78% |
| Expenses net of fee waivers, if any | | .69% | | .88% | | 1.06% | | 1.03% | | .77% |
| Expenses net of all reductions | | .69% | | .88% | | 1.06% | | 1.02% | | .75% |
| Net investment income (loss) | | 1.75% | | 1.73% | | 1.21% | | .86% | | 4.33% C |
| Supplemental Data | | | | | | | | | | |
| Net assets, end of period (000 omitted) | $ | 519,010 | $ | 523,685 | $ | 913,296 | $ | 755,125 | $ | 836,373 |
Portfolio turnover rate G | | 37% | | 55% | | 52% | | 39% | | 45% |
ACalculated based on average shares outstanding during the period.
BNet investment income (loss) is affected by the timing of the declaration of dividends by any underlying mutual funds or exchange-traded funds (ETFs). Net investment income (loss) of any mutual funds or ETFs is not included in the Fund's net investment income (loss) ratio.
CNet investment income per share reflects one or more large, non-recurring dividend(s) which amounted to $.20 per share. Excluding such non-recurring dividend(s), the ratio of net investment income (loss) to average net assets would have been 3.75%.
DTotal returns would have been lower if certain expenses had not been reduced during the applicable periods shown.
EFees and expenses of any underlying mutual funds or exchange-traded funds (ETFs) are not included in the Fund's expense ratio. The Fund indirectly bears its proportionate share of these expenses. For additional expense information related to investments in Fidelity Central Funds, please refer to the "Investments in Fidelity Central Funds" note found in the Notes to Financial Statements section of the most recent Annual or Semi-Annual report.
FExpense ratios reflect operating expenses of the class. Expenses before reductions do not reflect amounts reimbursed, waived, or reduced through arrangements with the investment adviser, brokerage services, or other offset arrangements, if applicable, and do not represent the amount paid by the class during periods when reimbursements, waivers or reductions occur.
GAmount does not include the portfolio activity of any underlying mutual funds or exchange-traded funds (ETFs).
| Fidelity Advisor® Europe Fund Class I |
| |
| Years ended October 31, | | 2023 | | 2022 | | 2021 | | 2020 | | 2019 |
Selected Per-Share Data | | | | | | | | | | |
| Net asset value, beginning of period | $ | 27.56 | $ | 46.07 | $ | 35.34 | $ | 36.27 | $ | 37.69 |
| Income from Investment Operations | | | | | | | | | | |
Net investment income (loss) A,B | | .57 | | .60 | | .54 | | .31 | | 1.53 C |
| Net realized and unrealized gain (loss) | | 2.45 | | (12.91) | | 10.70 | | 1.46 | | .80 |
| Total from investment operations | | 3.02 | | (12.31) | | 11.24 | | 1.77 | | 2.33 |
| Distributions from net investment income | | - | | (1.08) | | (.51) | | (1.62) | | (.32) |
| Distributions from net realized gain | | - | | (5.12) | | - | | (1.08) | | (3.43) |
| Total distributions | | - | | (6.20) | | (.51) | | (2.70) | | (3.75) |
| Net asset value, end of period | $ | 30.58 | $ | 27.56 | $ | 46.07 | $ | 35.34 | $ | 36.27 |
Total Return D | | 10.96% | | (30.08)% | | 31.99% | | 4.99% | | 7.58% |
Ratios to Average Net Assets B,E,F | | | | | | | | | | |
| Expenses before reductions | | .68% | | .86% | | 1.06% | | 1.00% | | .75% |
| Expenses net of fee waivers, if any | | .67% | | .86% | | 1.06% | | 1.00% | | .74% |
| Expenses net of all reductions | | .67% | | .86% | | 1.06% | | .99% | | .72% |
| Net investment income (loss) | | 1.77% | | 1.74% | | 1.22% | | .90% | | 4.36% C |
| Supplemental Data | | | | | | | | | | |
| Net assets, end of period (000 omitted) | $ | 4,806 | $ | 4,283 | $ | 14,401 | $ | 14,733 | $ | 6,686 |
Portfolio turnover rate G | | 37% | | 55% | | 52% | | 39% | | 45% |
ACalculated based on average shares outstanding during the period.
BNet investment income (loss) is affected by the timing of the declaration of dividends by any underlying mutual funds or exchange-traded funds (ETFs). Net investment income (loss) of any mutual funds or ETFs is not included in the Fund's net investment income (loss) ratio.
CNet investment income per share reflects one or more large, non-recurring dividend(s) which amounted to $.20 per share. Excluding such non-recurring dividend(s), the ratio of net investment income (loss) to average net assets would have been 3.78%.
DTotal returns would have been lower if certain expenses had not been reduced during the applicable periods shown.
EFees and expenses of any underlying mutual funds or exchange-traded funds (ETFs) are not included in the Fund's expense ratio. The Fund indirectly bears its proportionate share of these expenses. For additional expense information related to investments in Fidelity Central Funds, please refer to the "Investments in Fidelity Central Funds" note found in the Notes to Financial Statements section of the most recent Annual or Semi-Annual report.
FExpense ratios reflect operating expenses of the class. Expenses before reductions do not reflect amounts reimbursed, waived, or reduced through arrangements with the investment adviser, brokerage services, or other offset arrangements, if applicable, and do not represent the amount paid by the class during periods when reimbursements, waivers or reductions occur.
GAmount does not include the portfolio activity of any underlying mutual funds or exchange-traded funds (ETFs).
| Fidelity Advisor® Europe Fund Class Z |
| |
| Years ended October 31, | | 2023 | | 2022 | | 2021 | | 2020 | | 2019 |
Selected Per-Share Data | | | | | | | | | | |
| Net asset value, beginning of period | $ | 27.48 | $ | 46.00 | $ | 35.27 | $ | 36.21 | $ | 37.69 |
| Income from Investment Operations | | | | | | | | | | |
Net investment income (loss) A,B | | .61 | | .62 | | .59 | | .34 | | 1.53 C |
| Net realized and unrealized gain (loss) | | 2.44 | | (12.86) | | 10.67 | | 1.47 | | .82 |
| Total from investment operations | | 3.05 | | (12.24) | | 11.26 | | 1.81 | | 2.35 |
| Distributions from net investment income | | - | | (1.17) | | (.53) | | (1.67) | | (.41) |
| Distributions from net realized gain | | - | | (5.12) | | - | | (1.08) | | (3.43) |
| Total distributions | | - | | (6.28) D | | (.53) | | (2.75) | | (3.83) D |
| Net asset value, end of period | $ | 30.53 | $ | 27.48 | $ | 46.00 | $ | 35.27 | $ | 36.21 |
Total Return E | | 11.10% | | (30.00)% | | 32.13% | | 5.11% | | 7.71% |
Ratios to Average Net Assets B,F,G | | | | | | | | | | |
| Expenses before reductions | | .57% | | .76% | | .95% | | .91% | | .65% |
| Expenses net of fee waivers, if any | | .56% | | .75% | | .95% | | .90% | | .64% |
| Expenses net of all reductions | | .56% | | .75% | | .95% | | .90% | | .62% |
| Net investment income (loss) | | 1.87% | | 1.85% | | 1.33% | | .99% | | 4.46% C |
| Supplemental Data | | | | | | | | | | |
| Net assets, end of period (000 omitted) | $ | 2,222 | $ | 1,461 | $ | 28,249 | $ | 19,479 | $ | 21,838 |
Portfolio turnover rate H | | 37% | | 55% | | 52% | | 39% | | 45% |
ACalculated based on average shares outstanding during the period.
BNet investment income (loss) is affected by the timing of the declaration of dividends by any underlying mutual funds or exchange-traded funds (ETFs). Net investment income (loss) of any mutual funds or ETFs is not included in the Fund's net investment income (loss) ratio.
CNet investment income per share reflects one or more large, non-recurring dividend(s) which amounted to $.20 per share. Excluding such non-recurring dividend(s), the ratio of net investment income (loss) to average net assets would have been 3.88%.
DTotal distributions per share do not sum due to rounding.
ETotal returns would have been lower if certain expenses had not been reduced during the applicable periods shown.
FFees and expenses of any underlying mutual funds or exchange-traded funds (ETFs) are not included in the Fund's expense ratio. The Fund indirectly bears its proportionate share of these expenses. For additional expense information related to investments in Fidelity Central Funds, please refer to the "Investments in Fidelity Central Funds" note found in the Notes to Financial Statements section of the most recent Annual or Semi-Annual report.
GExpense ratios reflect operating expenses of the class. Expenses before reductions do not reflect amounts reimbursed, waived, or reduced through arrangements with the investment adviser, brokerage services, or other offset arrangements, if applicable, and do not represent the amount paid by the class during periods when reimbursements, waivers or reductions occur.
HAmount does not include the portfolio activity of any underlying mutual funds or exchange-traded funds (ETFs).
For the period ended October 31, 2023
1. Organization.
Fidelity Europe Fund (the Fund) is a fund of Fidelity Investment Trust (the Trust) and is authorized to issue an unlimited number of shares. The Trust is registered under the Investment Company Act of 1940, as amended (the 1940 Act), as an open-end management investment company organized as a Massachusetts business trust. The Fund offers Class A, Class M, Class C, Europe, Class I and Class Z shares, each of which has equal rights as to assets and voting privileges. Class A, Class M, Class C, Class I and Class Z are Fidelity Advisor classes. Each class has exclusive voting rights with respect to matters that affect that class. Class C shares will automatically convert to Class A shares after a holding period of eight years from the initial date of purchase, with certain exceptions.
2. Investments in Fidelity Central Funds.
Funds may invest in Fidelity Central Funds, which are open-end investment companies generally available only to other investment companies and accounts managed by the investment adviser and its affiliates. The Schedule of Investments lists any Fidelity Central Funds held as an investment as of period end, but does not include the underlying holdings of each Fidelity Central Fund. An investing fund indirectly bears its proportionate share of the expenses of the underlying Fidelity Central Funds.
Based on its investment objective, each Fidelity Central Fund may invest or participate in various investment vehicles or strategies that are similar to those of the investing fund. These strategies are consistent with the investment objectives of the investing fund and may involve certain economic risks which may cause a decline in value of each of the Fidelity Central Funds and thus a decline in the value of the investing fund.
| Fidelity Central Fund | Investment Manager | Investment Objective | Investment Practices | Expense RatioA |
| Fidelity Money Market Central Funds | Fidelity Management & Research Company LLC (FMR) | Each fund seeks to obtain a high level of current income consistent with the preservation of capital and liquidity. | Short-term Investments | Less than .005% |
A Expenses expressed as a percentage of average net assets and are as of each underlying Central Fund's most recent annual or semi-annual shareholder report.
A complete unaudited list of holdings for each Fidelity Central Fund is available upon request or at the Securities and Exchange Commission website at www.sec.gov. In addition, the financial statements of the Fidelity Central Funds which contain the significant accounting policies (including investment valuation policies) of those funds, and are not covered by the Report of Independent Registered Public Accounting Firm, are available on the Securities and Exchange Commission website or upon request.
3. Significant Accounting Policies.
The Fund is an investment company and applies the accounting and reporting guidance of the Financial Accounting Standards Board (FASB) Accounting Standards Codification Topic 946 Financial Services - Investment Companies. The financial statements have been prepared in conformity with accounting principles generally accepted in the United States of America (GAAP), which require management to make certain estimates and assumptions at the date of the financial statements. Actual results could differ from those estimates. Subsequent events, if any, through the date that the financial statements were issued have been evaluated in the preparation of the financial statements. The Fund's Schedule of Investments lists any underlying mutual funds or exchange-traded funds (ETFs) but does not include the underlying holdings of these funds. The following summarizes the significant accounting policies of the Fund:
Investment Valuation. Investments are valued as of 4:00 p.m. Eastern time on the last calendar day of the period. The Board of Trustees (the Board) has designated the Fund's investment adviser as the valuation designee responsible for the fair valuation function and performing fair value determinations as needed. The investment adviser has established a Fair Value Committee (the Committee) to carry out the day-to-day fair valuation responsibilities and has adopted policies and procedures to govern the fair valuation process and the activities of the Committee. In accordance with these fair valuation policies and procedures, which have been approved by the Board, the Fund attempts to obtain prices from one or more third party pricing services or brokers to value its investments. When current market prices, quotations or currency exchange rates are not readily available or reliable, investments will be fair valued in good faith by the Committee, in accordance with the policies and procedures. Factors used in determining fair value vary by investment type and may include market or investment specific events, transaction data, estimated cash flows, and market observations of comparable investments. The frequency that the fair valuation procedures are used cannot be predicted and they may be utilized to a significant extent. The Committee manages the Fund's fair valuation practices and maintains the fair valuation policies and procedures. The Fund's investment adviser reports to the Board information regarding the fair valuation process and related material matters.
The Fund categorizes the inputs to valuation techniques used to value its investments into a disclosure hierarchy consisting of three levels as shown below:
Level 1 - unadjusted quoted prices in active markets for identical investments
Level 2 - other significant observable inputs (including quoted prices for similar investments, interest rates, prepayment speeds, etc.)
Level 3 - unobservable inputs (including the Fund's own assumptions based on the best information available)
Valuation techniques used to value the Fund's investments by major category are as follows:
Equity securities, including restricted securities, for which market quotations are readily available, are valued at the last reported sale price or official closing price as reported by a third party pricing service on the primary market or exchange on which they are traded and are categorized as Level 1 in the hierarchy. In the event there were no sales during the day or closing prices are not available, securities are valued at the last quoted bid price or may be valued using the last available price and are generally categorized as Level 2 in the hierarchy. For foreign equity securities, when market or security specific events arise, comparisons to the valuation of American Depositary Receipts (ADRs), futures contracts, ETFs and certain indexes as well as quoted prices for similar securities may be used and would be categorized as Level 2 in the hierarchy. For equity securities, including restricted securities, where observable inputs are limited, assumptions about market activity and risk are used and these securities may be categorized as Level 3 in the hierarchy.
Investments in open-end mutual funds, including the Fidelity Central Funds, are valued at their closing net asset value (NAV) each business day and are categorized as Level 1 in the hierarchy.
Changes in valuation techniques may result in transfers in or out of an assigned level within the disclosure hierarchy. The aggregate value of investments by input level as of October 31, 2023 is included at the end of the Fund's Schedule of Investments.
Foreign Currency. Certain Funds may use foreign currency contracts to facilitate transactions in foreign-denominated securities. Gains and losses from these transactions may arise from changes in the value of the foreign currency or if the counterparties do not perform under the contracts' terms.
Foreign-denominated assets, including investment securities, and liabilities are translated into U.S. dollars at the exchange rates at period end. Purchases and sales of investment securities, income and dividends received, and expenses denominated in foreign currencies are translated into U.S. dollars at the exchange rate in effect on the transaction date.
The effects of exchange rate fluctuations on investments are included with the net realized and unrealized gain (loss) on investment securities. Other foreign currency transactions resulting in realized and unrealized gain (loss) are disclosed separately.
Investment Transactions and Income. For financial reporting purposes, the Fund's investment holdings and NAV include trades executed through the end of the last business day of the period. The NAV per share for processing shareholder transactions is calculated as of the close of business of the New York Stock Exchange (NYSE), normally 4:00 p.m. Eastern time and includes trades executed through the end of the prior business day. Gains and losses on securities sold are determined on the basis of identified cost and include proceeds received from litigation. Commissions paid to certain brokers with whom the investment adviser, or its affiliates, places trades on behalf of a fund include an amount in addition to trade execution, which may be rebated back to a fund. Any such rebates are included in net realized gain (loss) on investments in the Statement of Operations. Dividend income is recorded on the ex-dividend date, except for certain dividends from foreign securities where the ex-dividend date may have passed, which are recorded as soon as the Fund is informed of the ex-dividend date. Non-cash dividends included in dividend income, if any, are recorded at the fair market value of the securities received. Income and capital gain distributions from Fidelity Central Funds, if any, are recorded on the ex-dividend date. Investment income is recorded net of foreign taxes withheld where recovery of such taxes is uncertain. Funds may file withholding tax reclaims in certain jurisdictions to recover a portion of amounts previously withheld. Any withholding tax reclaims income is included in the Statement of Operations in foreign tax reclaims. Any receivables for withholding tax reclaims are included in the Statement of Assets and Liabilities in reclaims receivable. The Fund has filed tax reclaims for previously withheld taxes on dividends earned in certain European Union (EU) countries. These additional filings are subject to various administrative proceedings by the local jurisdictions' tax authorities within the EU, as well as a number of related judicial proceedings. Income recognized for EU reclaims is included with other reclaims in the Statement of Operations in foreign taxes reclaims. These reclaims are recorded when the amount is known and there are no significant uncertainties on collectability.
Class Allocations and Expenses. Investment income, realized and unrealized capital gains and losses, common expenses of a fund, and certain fund-level expense reductions, if any, are allocated daily on a pro-rata basis to each class based on the relative net assets of each class to the total net assets of a fund. Each class differs with respect to transfer agent and distribution and service plan fees incurred, as applicable. Certain expense reductions may also differ by class, if applicable. For the reporting period, the allocated portion of income and expenses to each class as a percent of its average net assets may vary due to the timing of recording these transactions in relation to fluctuating net assets of the classes. Expenses directly attributable to a fund are charged to that fund. Expenses attributable to more than one fund are allocated among the respective funds on the basis of relative net assets or other appropriate methods. Expenses included in the accompanying financial statements reflect the expenses of that fund and do not include any expenses associated with any underlying mutual funds or exchange-traded funds (ETFs). Although not included in a fund's expenses, a fund indirectly bears its proportionate share of these expenses through the net asset value of each underlying mutual fund or exchange-traded fund (ETF). Expense estimates are accrued in the period to which they relate and adjustments are made when actual amounts are known.
Income Tax Information and Distributions to Shareholders. Each year, the Fund intends to qualify as a regulated investment company under Subchapter M of the Internal Revenue Code, including distributing substantially all of its taxable income and realized gains. As a result, no provision for U.S. Federal income taxes is required. As of October 31, 2023, the Fund did not have any unrecognized tax benefits in the financial statements; nor is the Fund aware of any tax positions for which it is reasonably possible that the total amounts of unrecognized tax benefits will significantly change in the next twelve months. The Fund files a U.S. federal tax return, in addition to state and local tax returns as required. The Fund's federal income tax returns are subject to examination by the Internal Revenue Service (IRS) for a period of three fiscal years after they are filed. State and local tax returns may be subject to examination for an additional fiscal year depending on the jurisdiction. Foreign taxes are provided for based on the Fund's understanding of the tax rules and rates that exist in the foreign markets in which it invests.
Distributions are declared and recorded on the ex-dividend date. Income and capital gain distributions are declared separately for each class. Income and capital gain distributions are determined in accordance with income tax regulations, which may differ from GAAP.
Capital accounts within the financial statements are adjusted for permanent book-tax differences. These adjustments have no impact on net assets or the results of operations. Capital accounts are not adjusted for temporary book-tax differences which will reverse in a subsequent period.
Book-tax differences are primarily due to foreign currency transactions, passive foreign investment companies (PFIC), capital loss carryforwards and losses deferred due to wash sales and excise tax regulations.
As of period end, the cost and unrealized appreciation (depreciation) in securities, and derivatives if applicable, for federal income tax purposes were as follows:
| Gross unrealized appreciation | $63,078,882 |
| Gross unrealized depreciation | (35,059,719) |
| Net unrealized appreciation (depreciation) | $28,019,163 |
| Tax Cost | $515,381,056 |
The tax-based components of distributable earnings as of period end were as follows:
| Undistributed ordinary income | $9,350,980 |
| Capital loss carryforward | $(100,926,653) |
| Net unrealized appreciation (depreciation) on securities and other investments | $27,883,771 |
Capital loss carryforwards are only available to offset future capital gains of the Fund to the extent provided by regulations and may be limited. The capital loss carryforward information presented below, including any applicable limitation, is estimated as of fiscal period end and is subject to adjustment.
Short-term | $(56,749,290) |
Long-term | (44,177,363) |
| Total capital loss carryforward | $(100,926,653) |
The tax character of distributions paid was as follows:
| | October 31, 2023 | October 31, 2022 |
| Ordinary Income | $- | $58,772,480 |
| Long-term Capital Gains | - | 74,714,886 |
| Total | $- | $133,487,366 |
Restricted Securities (including Private Placements). Funds may invest in securities that are subject to legal or contractual restrictions on resale. These securities generally may be resold in transactions exempt from registration or to the public if the securities are registered. Disposal of these securities may involve time-consuming negotiations and expense, and prompt sale at an acceptable price may be difficult. Information regarding restricted securities held at period end is included at the end of the Schedule of Investments, if applicable.
4. Purchases and Sales of Investments.
Purchases and sales of securities, other than short-term securities and in-kind transactions, as applicable, are noted in the table below.
| | Purchases ($) | Sales ($) |
| Fidelity Europe Fund | 220,059,208 | 275,819,288 |
5. Fees and Other Transactions with Affiliates.
Management Fee. Fidelity Management & Research Company LLC (the investment adviser) and its affiliates provide the Fund with investment management related services for which the Fund pays a monthly management fee. The management fee is the sum of an individual fund fee rate that is based on an annual rate of .45% of the Fund's average net assets and an annualized group fee rate that averaged .23% during the period. The group fee rate is based upon the monthly average net assets of a group of registered investment companies with which the investment adviser has management contracts. The group fee rate decreases as assets under management increase and increases as assets under management decrease. In addition, the management fee is subject to a performance adjustment (up to a maximum of +/- .20% of the Fund's average net assets over a 36 month performance period). The upward or downward adjustment to the management fee is based on the relative investment performance of Europe as compared to its benchmark index, the MSCI Europe Index, over the same 36 month performance period. For the reporting period, the total annual management fee rate, including the performance adjustment, was .44% of the Fund's average net assets. The performance adjustment included in the management fee rate may be higher or lower than the maximum performance adjustment rate due to the difference between the average net assets for the reporting and performance periods.
Distribution and Service Plan Fees. In accordance with Rule 12b-1 of the 1940 Act, the Fund has adopted separate Distribution and Service Plans for each class of shares. Certain classes pay Fidelity Distributors Company LLC (FDC), an affiliate of the investment adviser, separate Distribution and Service Fees, each of which is based on an annual percentage of each class' average net assets. In addition, FDC may pay financial intermediaries for selling shares of the Fund and providing shareholder support services. For the period, the Distribution and Service Fee rates, total fees and amounts retained by FDC were as follows:
| | Distribution Fee | Service Fee | Total Fees | Retained by FDC |
| Class A | - % | .25% | $43,213 | $194 |
| Class M | .25% | .25% | 23,224 | 191 |
| Class C | .75% | .25% | 25,134 | 1,342 |
| | | | $91,571 | $1,727 |
Sales Load. FDC may receive a front-end sales charge of up to 5.75% for selling Class A shares and 3.50% for selling Class M shares, some of which is paid to financial intermediaries for selling shares of the Fund. Depending on the holding period, FDC may receive contingent deferred sales charges levied on Class A, Class M and Class C redemptions. The deferred sales charges are 1.00% for Class C shares, 1.00% for certain purchases of Class A shares and .25% for certain purchases of Class M shares.
For the period, sales charge amounts retained by FDC were as follows:
| | Retained by FDC |
| Class A | $748 |
| Class M | 127 |
Class CA | 58 |
| | $933 |
A When Class C shares are initially sold, FDC pays commissions from its own resources to financial intermediaries through which the sales are made.
Transfer Agent Fees. Fidelity Investments Institutional Operations Company LLC (FIIOC), an affiliate of the investment adviser, is the transfer, dividend disbursing and shareholder servicing agent for each class of the Fund. FIIOC receives account fees and asset-based fees that vary according to the account size and type of account of the shareholders of the respective classes of the Fund, except for Class Z. FIIOC receives an asset-based fee of Class Z's average net assets. FIIOC pays for typesetting, printing and mailing of shareholder reports, except proxy statements.
For the period, transfer agent fees for each class were as follows:
| | Amount | % of Class-Level Average Net Assets |
| Class A | $41,212 | .24 |
| Class M | 11,900 | .26 |
| Class C | 6,494 | .26 |
| Europe | 980,091 | .17 |
| Class I | 7,945 | .15 |
| Class Z | 865 | .04 |
| | $1,048,507 | |
During November 2023, the Board approved a change in the transfer agent fees effective December 1, 2023 to a fixed annual rate of class-level average net assets as follows:
| | % of Class-Level Average Net Assets |
| Class A | 0.2000 |
| Class M | 0.2000 |
| Class C | 0.2000 |
| Europe | 0.1641 |
| Class I | 0.1486 |
Accounting Fees. Fidelity Service Company, Inc. (FSC), an affiliate of the investment adviser, maintains the Fund's accounting records. The accounting fee is based on the level of average net assets for each month. For the period, the fees were equivalent to the following annual rates:
| | % of Average Net Assets |
| Fidelity Europe Fund | .05 |
During November 2023, the Board approved a change in the accounting fees effective December 1, 2023 to a fixed annual rate of average net assets as follows:
| | % of Average Net Assets |
| Fidelity Europe Fund | 0.0476 |
Brokerage Commissions. A portion of portfolio transactions were placed with brokerage firms which are affiliates of the investment adviser. Brokerage commissions are included in net realized gain (loss) and change in net unrealized appreciation (depreciation) in the Statement of Operations. The commissions paid to these affiliated firms were as follows:
| | Amount |
| Fidelity Europe Fund | $7 |
Interfund Trades. Funds may purchase from or sell securities to other Fidelity Funds under procedures adopted by the Board. The procedures have been designed to ensure these interfund trades are executed in accordance with Rule 17a-7 of the 1940 Act. Any interfund trades are included within the respective purchases and sales amounts shown in the Purchases and Sales of Investments note. Interfund trades during the period are noted in the table below.
| | Purchases ($) | Sales ($) | Realized Gain (Loss) ($) |
| Fidelity Europe Fund | 6,267,232 | 7,999,402 | (3,161,025) |
6. Committed Line of Credit.
Certain Funds participate with other funds managed by the investment adviser or an affiliate in a $4.25 billion credit facility (the "line of credit") to be utilized for temporary or emergency purposes to fund shareholder redemptions or for other short-term liquidity purposes. The participating funds have agreed to pay commitment fees on their pro-rata portion of the line of credit, which are reflected in Miscellaneous expenses on the Statement of Operations, and are listed below. During the period, there were no borrowings on this line of credit.
| | Amount |
| Fidelity Europe Fund | $1,118 |
7. Security Lending.
Funds lend portfolio securities from time to time in order to earn additional income. Lending agents are used, including National Financial Services (NFS), an affiliate of the investment adviser. Pursuant to a securities lending agreement, NFS will receive a fee, which is capped at 9.9% of a fund's daily lending revenue, for its services as lending agent. A fund may lend securities to certain qualified borrowers, including NFS. On the settlement date of the loan, a fund receives collateral (in the form of U.S. Treasury obligations, letters of credit and/or cash) against the loaned securities and maintains collateral in an amount not less than 100% of the market value of the loaned securities during the period of the loan. The market value of the loaned securities is determined at the close of business of a fund and any additional required collateral is delivered to a fund on the next business day. A fund or borrower may terminate the loan at any time, and if the borrower defaults on its obligation to return the securities loaned because of insolvency or other reasons, a fund may apply collateral received from the borrower against the obligation. A fund may experience delays and costs in recovering the securities loaned. Any cash collateral received is invested in the Fidelity Securities Lending Cash Central Fund. Any loaned securities are identified as such in the Schedule of Investments, and the value of loaned securities and cash collateral at period end, as applicable, are presented in the Statement of Assets and Liabilities. Security lending income represents the income earned on investing cash collateral, less rebates paid to borrowers and any lending agent fees associated with the loan, plus any premium payments received for lending certain types of securities. Security lending income is presented in the Statement of Operations as a component of income from Fidelity Central Funds. Affiliated security lending activity, if any, was as follows:
| | Total Security Lending Fees Paid to NFS | Security Lending Income From Securities Loaned to NFS | Value of Securities Loaned to NFS at Period End |
| Fidelity Europe Fund | $9,472 | $- | $- |
8. Expense Reductions.
Through arrangements with each class' transfer agent, credits realized as a result of certain uninvested cash balances were used to reduce the Fund's expenses. During the period, transfer agent credits reduced each class' expenses as noted in the table below.
| | Expense reduction |
| Class A | $82 |
| Class M | 196 |
| | $278 |
In addition, during the period the investment adviser or an affiliate reimbursed and/or waived a portion of fund-level operating expenses in the amount of $36,975.
9. Distributions to Shareholders.
Distributions to shareholders of each class were as follows:
| | Year ended October 31, 2023 | Year ended October 31, 2022 |
| Fidelity Europe Fund | | |
| Distributions to shareholders | | |
| Class A | $- | $4,275,681 |
| Class M | - | 898,902 |
| Class C | - | 639,208 |
| Europe | - | 122,299,625 |
| Class I | - | 1,583,837 |
| Class Z | - | 3,790,113 |
Total | $- | $133,487,366 |
10. Share Transactions.
Share transactions for each class were as follows and may contain in-kind transactions, automatic conversions between classes or exchanges between affiliated funds:
| | Shares | Shares | Dollars | Dollars |
| | Year ended October 31, 2023 | Year ended October 31, 2022 | Year ended October 31, 2023 | Year ended October 31, 2022 |
| Fidelity Europe Fund | | | | |
| Class A | | | | |
| Shares sold | 44,425 | 89,634 | $1,464,114 | $3,307,956 |
| Reinvestment of distributions | - | 114,063 | - | 4,203,218 |
| Shares redeemed | (139,999) | (302,699) | (4,536,728) | (9,893,172) |
| Net increase (decrease) | (95,574) | (99,002) | $(3,072,614) | $(2,381,998) |
| Class M | | | | |
| Shares sold | 4,489 | 8,884 | $147,618 | $301,526 |
| Reinvestment of distributions | - | 23,449 | - | 868,563 |
| Shares redeemed | (12,258) | (35,522) | (398,082) | (1,126,542) |
| Net increase (decrease) | (7,769) | (3,189) | $(250,464) | $43,547 |
| Class C | | | | |
| Shares sold | 8,574 | 5,167 | $278,728 | $168,904 |
| Reinvestment of distributions | - | 17,238 | - | 634,712 |
| Shares redeemed | (32,347) | (46,375) | (1,039,195) | (1,573,732) |
| Net increase (decrease) | (23,773) | (23,970) | $(760,467) | $(770,116) |
| Europe | | | | |
| Shares sold | 957,209 | 1,206,003 | $31,285,588 | $40,801,820 |
| Reinvestment of distributions | - | 3,093,089 | - | 113,578,213 |
| Shares redeemed | (2,983,175) | (5,107,735) | (96,260,656) | (176,296,705) |
| Net increase (decrease) | (2,025,966) | (808,643) | $(64,975,068) | $(21,916,672) |
| Class I | | | | |
| Shares sold | 81,291 | 42,946 | $2,703,708 | $1,701,289 |
| Reinvestment of distributions | - | 41,688 | - | 1,530,795 |
| Shares redeemed | (79,518) | (241,861) | (2,541,717) | (8,753,022) |
| Net increase (decrease) | 1,773 | (157,227) | $161,991 | $(5,520,938) |
| Class Z | | | | |
| Shares sold | 49,574 | 91,178 | $1,674,500 | $3,170,475 |
| Reinvestment of distributions | - | 99,611 | - | 3,642,775 |
| Shares redeemed | (29,932) | (751,739) | (992,750) | (21,135,524) |
| Net increase (decrease) | 19,642 | (560,950) | $681,750 | $(14,322,274) |
11. Other.
A fund's organizational documents provide former and current trustees and officers with a limited indemnification against liabilities arising in connection with the performance of their duties to the fund. In the normal course of business, a fund may also enter into contracts that provide general indemnifications. A fund's maximum exposure under these arrangements is unknown as this would be dependent on future claims that may be made against a fund. The risk of material loss from such claims is considered remote.
12. Risk and Uncertainties.
Many factors affect a fund's performance. Developments that disrupt global economies and financial markets, such as pandemics, epidemics, outbreaks of infectious diseases, war, terrorism, and environmental disasters, may significantly affect a fund's investment performance. The effects of these developments to a fund will be impacted by the types of securities in which a fund invests, the financial condition, industry, economic sector, and geographic location of an issuer, and a fund's level of investment in the securities of that issuer. Significant concentrations in security types, issuers, industries, sectors, and geographic locations may magnify the factors that affect a fund's performance.
Average annual total return reflects the change in the value of an investment, assuming reinvestment of distributions from dividend income and capital gains (the profits earned upon the sale of securities that have grown in value, if any) and assuming a constant rate of performance each year. The hypothetical investment and the average annual total returns do not reflect the deduction of taxes that a shareholder would pay on fund distributions or the redemption of fund shares. During periods of reimbursement by Fidelity, a fund's total return will be greater than it would be had the reimbursement not occurred. How a fund did yesterday is no guarantee of how it will do tomorrow.
| Average Annual Total Returns |
| | | | |
Periods ended October 31, 2023 | Past 1 year | Past 5 years | Past 10 years |
Class A (incl. 5.75% sales charge) | 3.49% | 2.08% | 3.03% |
Class M (incl. 3.50% sales charge) | 5.65% | 2.26% | 2.95% |
Class C (incl. contingent deferred sales charge) | 8.00% | 2.57% | 3.06% |
| Fidelity® Japan Fund | 10.04% | 3.60% | 3.95% |
| Class I | 10.11% | 3.63% | 3.99% |
| Class Z | 10.29% | 3.75% | 4.05% |
Class C shares' contingent deferred sales charges included in the past one year, past five years and past ten years total return figures are 1%, 0% and 0%, respectively.
The initial offering of Class Z shares took place on October 2, 2018. Returns prior to October 2, 2018, are those of Class I.
| $10,000 Over 10 Years |
| |
Let's say hypothetically that $10,000 was invested in Fidelity® Japan Fund, a class of the fund, on October 31, 2013. The chart shows how the value of your investment would have changed, and also shows how the Tokyo Stock Price Index (TOPIX) performed over the same period. |
|
|
Fidelity® Japan Fund
Market Recap:
International (non-U.S.) equities gained 12.27% for the 12 months ending October 31, 2023, according to the MSCI ACWI (All Country World Index) ex USA Index, as global economic expansion and a slowing in the pace of inflation in some markets provided a favorable backdrop for risk assets. After returning -15.86% in 2022, the index's upturn has been largely driven by a narrow set of companies in the information technology and communication services sectors, in part due to excitement for generative artificial intelligence applications. The index gained 14.07% year to date through July, including strong gains in both June (+4.50%) and July (+4.07%). The rally for international equities sputtered for the next three months (-11.33%) amid a stalling pattern in disinflationary trends, heightened global recession and geopolitical risks, soaring yields on longer-term U.S. government bonds and particularly weak economic conditions in the eurozone and China. The three-month decline left non-U.S. stocks up 1.15% year to date through October. For the full 12 months, nearly all regions advanced, with Europe ex U.K. (+18%) and Japan (+17%) leading, whereas Canada (-0.38%) lagged by the widest margin. Each of the 11 sectors advanced, with information technology (+21%) and consumer discretionary (+19%) leading the way. Energy and industrials each rose about 14%. Conversely, four defensive-oriented sectors lagged by the widest margin: real estate (+4%), health care (+6%), consumer staples (+7%) and utilities (+8%).
Comments from Portfolio Manager Kirk Neureiter:
For the fiscal year ending October 31, 2023, the fund's share classes (excluding sales charges, if applicable) gained about 9% to 10%, versus 17.58% for the benchmark TOPIX Total Return Index. From a regional standpoint, stock selection in Japan and a modest non-benchmark allocation to emerging markets detracted from the fund's relative result. By sector, security selection was the primary detractor, especially within industrials. Security selection in consumer discretionary and information technology also hurt. The biggest individual relative detractor was an overweight in Persol Holdings (-24%). Not owning Mitsubishi UFJ Financial Group, a benchmark component that gained approximately 83%, was a second notable relative detractor. Another meaningful relative detractor was our stake in Olympus (-36%), which was not held at period end. In contrast, security selection in materials contributed to the fund's performance versus the benchmark, along with positioning in energy. The fund's top individual relative contributor was an overweight in Sumitomo Mitsui Financial Group (+75%), the fund's top holding. A second notable relative contributor was an overweight in Renesas Electronics (+54%). Renesas Electronics was among the fund's largest holdings, though I reduced our holdings. An overweight in Inpex (+47%) also contributed. Inpex was one of the fund's biggest holdings, although I trimmed the fund's stake. By sector, meaningful changes in positioning include decreased exposure to the health care and communication services sectors.
The views expressed above reflect those of the portfolio manager(s) only through the end of the period as stated on the cover of this report and do not necessarily represent the views of Fidelity or any other person in the Fidelity organization. Any such views are subject to change at any time based upon market or other conditions and Fidelity disclaims any responsibility to update such views. These views may not be relied on as investment advice and, because investment decisions for a Fidelity fund are based on numerous factors, may not be relied on as an indication of trading intent on behalf of any Fidelity fund.
Fidelity® Japan Fund
Top Holdings (% of Fund's net assets) |
| |
| Sumitomo Mitsui Financial Group, Inc. (Banks) | 5.7 | |
| Sony Group Corp. (Household Durables) | 4.4 | |
| Hitachi Ltd. (Industrial Conglomerates) | 4.0 | |
| ORIX Corp. (Financial Services) | 3.4 | |
| DENSO Corp. (Automobile Components) | 3.3 | |
| Tokio Marine Holdings, Inc. (Insurance) | 3.2 | |
| Renesas Electronics Corp. (Semiconductors & Semiconductor Equipment) | 3.1 | |
| Hoya Corp. (Health Care Equipment & Supplies) | 3.0 | |
| INPEX Corp. (Oil, Gas & Consumable Fuels) | 2.8 | |
| Shin-Etsu Chemical Co. Ltd. (Chemicals) | 2.6 | |
| | 35.5 | |
| |
| Market Sectors (% of Fund's net assets) |
| |
| Industrials | 21.5 | |
| Consumer Discretionary | 18.7 | |
| Information Technology | 17.1 | |
| Financials | 14.4 | |
| Health Care | 6.7 | |
| Materials | 5.9 | |
| Communication Services | 5.0 | |
| Consumer Staples | 4.0 | |
| Energy | 3.3 | |
| Utilities | 1.5 | |
| Real Estate | 1.0 | |
| |
Asset Allocation (% of Fund's net assets) |
|
|
Geographic Diversification (% of Fund's net assets) |
|
* Includes Short-Term investments and Net Other Assets (Liabilities). Percentages are adjusted for the effect of derivatives, if applicable. |
| |
Fidelity® Japan Fund
Showing Percentage of Net Assets
| Common Stocks - 99.1% |
| | | Shares | Value ($) |
| COMMUNICATION SERVICES - 5.0% | | | |
| Diversified Telecommunication Services - 0.9% | | | |
| JTOWER, Inc. (a)(b) | | 165,600 | 6,026,361 |
| Entertainment - 0.9% | | | |
| Daiichikosho Co. Ltd. | | 369,000 | 5,454,359 |
| Interactive Media & Services - 1.5% | | | |
| Hypebeast Ltd. (a) | | 16,722,500 | 781,361 |
| Kakaku.com, Inc. | | 394,800 | 3,807,646 |
| LY Corp. | | 1,944,000 | 4,956,202 |
| | | | 9,545,209 |
| Media - 0.2% | | | |
| ValueCommerce Co. Ltd. | | 116,800 | 970,938 |
| Wireless Telecommunication Services - 1.5% | | | |
| SoftBank Group Corp. | | 231,700 | 9,489,058 |
TOTAL COMMUNICATION SERVICES | | | 31,485,925 |
| CONSUMER DISCRETIONARY - 18.7% | | | |
| Automobile Components - 3.9% | | | |
| DENSO Corp. | | 1,410,400 | 20,826,437 |
| Koito Manufacturing Co. Ltd. | | 256,800 | 3,847,565 |
| | | | 24,674,002 |
| Automobiles - 2.2% | | | |
| Isuzu Motors Ltd. | | 503,400 | 5,613,238 |
| Suzuki Motor Corp. | | 217,400 | 8,437,731 |
| | | | 14,050,969 |
| Broadline Retail - 0.9% | | | |
| Pan Pacific International Holdings Ltd. | | 293,200 | 5,678,071 |
| Hotels, Restaurants & Leisure - 1.4% | | | |
| Curves Holdings Co. Ltd. | | 714,700 | 3,117,638 |
| Kyoritsu Maintenance Co. Ltd. (b) | | 146,900 | 5,618,336 |
| | | | 8,735,974 |
| Household Durables - 5.9% | | | |
| Chervon Holdings Ltd. | | 1,163,900 | 2,866,744 |
| Open House Group Co. Ltd. | | 190,800 | 6,288,837 |
| Sony Group Corp. | | 337,300 | 28,042,746 |
| | | | 37,198,327 |
| Leisure Products - 2.2% | | | |
| Bandai Namco Holdings, Inc. | | 283,000 | 5,863,340 |
| Roland Corp. | | 147,700 | 4,270,594 |
| YONEX Co. Ltd. (b) | | 350,600 | 3,798,347 |
| | | | 13,932,281 |
| Specialty Retail - 2.2% | | | |
| Fast Retailing Co. Ltd. | | 40,000 | 8,855,856 |
| ZOZO, Inc. | | 271,200 | 5,156,799 |
| | | | 14,012,655 |
TOTAL CONSUMER DISCRETIONARY | | | 118,282,279 |
| CONSUMER STAPLES - 4.0% | | | |
| Consumer Staples Distribution & Retail - 3.2% | | | |
| Seven & i Holdings Co. Ltd. | | 327,100 | 11,984,522 |
| Sugi Holdings Co. Ltd. | | 50,700 | 2,052,253 |
| Tsuruha Holdings, Inc. (b) | | 49,900 | 3,665,490 |
| Welcia Holdings Co. Ltd. | | 142,300 | 2,358,738 |
| | | | 20,061,003 |
| Personal Care Products - 0.8% | | | |
| Shiseido Co. Ltd. | | 165,100 | 5,236,225 |
TOTAL CONSUMER STAPLES | | | 25,297,228 |
| ENERGY - 3.3% | | | |
| Oil, Gas & Consumable Fuels - 3.3% | | | |
| ENEOS Holdings, Inc. | | 840,400 | 3,114,033 |
| INPEX Corp. | | 1,204,800 | 17,482,703 |
| | | | 20,596,736 |
| FINANCIALS - 14.4% | | | |
| Banks - 6.8% | | | |
| Resona Holdings, Inc. | | 1,277,400 | 6,825,560 |
| Sumitomo Mitsui Financial Group, Inc. | | 748,800 | 36,098,135 |
| | | | 42,923,695 |
| Capital Markets - 0.5% | | | |
| SBI Holdings, Inc. Japan | | 155,200 | 3,339,119 |
| Financial Services - 3.4% | | | |
| ORIX Corp. | | 1,178,200 | 21,427,159 |
| Insurance - 3.7% | | | |
| Lifenet Insurance Co. (a) | | 454,100 | 2,901,655 |
| Tokio Marine Holdings, Inc. | | 907,200 | 20,296,093 |
| | | | 23,197,748 |
TOTAL FINANCIALS | | | 90,887,721 |
| HEALTH CARE - 6.7% | | | |
| Biotechnology - 0.1% | | | |
| PeptiDream, Inc. (a) | | 110,100 | 802,611 |
| Health Care Equipment & Supplies - 3.0% | | | |
| Hoya Corp. | | 195,100 | 18,782,008 |
| Health Care Technology - 0.1% | | | |
| Medlive Technology Co. Ltd. (b)(c) | | 832,500 | 831,154 |
| Pharmaceuticals - 3.5% | | | |
| Astellas Pharma, Inc. | | 859,100 | 10,867,508 |
| Daiichi Sankyo Kabushiki Kaisha | | 432,200 | 11,143,929 |
| | | | 22,011,437 |
TOTAL HEALTH CARE | | | 42,427,210 |
| INDUSTRIALS - 21.5% | | | |
| Aerospace & Defense - 0.2% | | | |
| Space Exploration Technologies Corp. Class A (a)(d)(e) | | 18,055 | 1,462,455 |
| Building Products - 0.8% | | | |
| Toto Ltd. | | 198,900 | 4,795,800 |
| Ground Transportation - 0.4% | | | |
| Seibu Holdings, Inc. | | 286,100 | 2,793,615 |
| Industrial Conglomerates - 4.0% | | | |
| Hitachi Ltd. | | 394,900 | 25,031,379 |
| Machinery - 7.0% | | | |
| IHI Corp. | | 412,800 | 7,922,530 |
| Minebea Mitsumi, Inc. | | 407,600 | 6,390,884 |
| Misumi Group, Inc. | | 390,960 | 5,918,612 |
| Mitsubishi Heavy Industries Ltd. | | 135,000 | 6,953,132 |
| Nabtesco Corp. | | 189,900 | 3,363,451 |
| SMC Corp. | | 30,400 | 14,037,599 |
| | | | 44,586,208 |
| Professional Services - 7.5% | | | |
| BayCurrent Consulting, Inc. | | 194,300 | 4,878,242 |
| Dip Corp. | | 81,700 | 1,619,243 |
| Funai Soken Holdings, Inc. | | 272,000 | 4,470,567 |
| Gakujo Co. Ltd. (b) | | 202,100 | 2,254,068 |
| Outsourcing, Inc. | | 737,500 | 5,480,293 |
| Persol Holdings Co. Ltd. | | 7,245,000 | 10,863,268 |
| Qualtec Co. Ltd. | | 8,500 | 108,488 |
| Rise Consulting Group, Inc. | | 59,100 | 335,311 |
| SMS Co., Ltd. | | 241,900 | 3,838,448 |
| TechnoPro Holdings, Inc. | | 675,100 | 13,374,305 |
| | | | 47,222,233 |
| Trading Companies & Distributors - 1.6% | | | |
| Itochu Corp. | | 280,000 | 10,085,889 |
TOTAL INDUSTRIALS | | | 135,977,579 |
| INFORMATION TECHNOLOGY - 17.1% | | | |
| Electronic Equipment, Instruments & Components - 4.5% | | | |
| Dexerials Corp. | | 318,300 | 7,260,525 |
| Hamamatsu Photonics K.K. | | 92,800 | 3,446,872 |
| Iriso Electronics Co. Ltd. | | 106,200 | 2,507,215 |
| Murata Manufacturing Co. Ltd. | | 376,500 | 6,449,211 |
| Shibaura Electronics Co. Ltd. | | 68,000 | 2,541,900 |
| TDK Corp. | | 160,200 | 5,993,918 |
| | | | 28,199,641 |
| IT Services - 5.3% | | | |
| Digital Hearts Holdings Co. Ltd. | | 214,692 | 1,306,837 |
| DTS Corp. | | 187,900 | 3,859,164 |
| ExaWizards, Inc. (a)(b) | | 627,500 | 1,566,930 |
| Fujitsu Ltd. | | 106,000 | 13,732,040 |
| Net One Systems Co. Ltd. | | 213,800 | 3,263,213 |
| NSD Co. Ltd. | | 341,000 | 5,933,022 |
| Techmatrix Corp. | | 413,100 | 4,082,516 |
| | | | 33,743,722 |
| Semiconductors & Semiconductor Equipment - 5.0% | | | |
| Furuya Metal Co. Ltd. | | 5,200 | 336,401 |
| Renesas Electronics Corp. (a) | | 1,473,900 | 19,360,591 |
| ROHM Co. Ltd. | | 340,000 | 5,447,470 |
| Sumco Corp. | | 526,700 | 6,806,098 |
| | | | 31,950,560 |
| Software - 0.6% | | | |
| Appier Group, Inc. (a) | | 76,600 | 630,598 |
| Money Forward, Inc. (a) | | 118,800 | 3,000,654 |
| | | | 3,631,252 |
| Technology Hardware, Storage & Peripherals - 1.7% | | | |
| FUJIFILM Holdings Corp. | | 195,600 | 10,698,891 |
TOTAL INFORMATION TECHNOLOGY | | | 108,224,066 |
| MATERIALS - 5.9% | | | |
| Chemicals - 5.9% | | | |
| Nippon Sanso Holdings Corp. | | 238,000 | 6,002,005 |
| Nissan Chemical Corp. | | 64,500 | 2,630,645 |
| NOF Corp. | | 90,400 | 3,566,365 |
| Resonac Holdings Corp. | | 243,900 | 3,953,921 |
| Shin-Etsu Chemical Co. Ltd. | | 543,300 | 16,246,506 |
| Tokyo Ohka Kogyo Co. Ltd. | | 87,300 | 5,044,265 |
| | | | 37,443,707 |
| REAL ESTATE - 1.0% | | | |
| Real Estate Management & Development - 1.0% | | | |
| Relo Group, Inc. | | 612,000 | 6,067,419 |
| UTILITIES - 1.5% | | | |
| Electric Utilities - 1.5% | | | |
| Kansai Electric Power Co., Inc. | | 760,800 | 9,741,163 |
| TOTAL COMMON STOCKS (Cost $578,262,044) | | | 626,431,033 |
| | | | |
| Money Market Funds - 2.2% |
| | | Shares | Value ($) |
| Fidelity Cash Central Fund 5.40% (f) | | 558,205 | 558,316 |
| Fidelity Securities Lending Cash Central Fund 5.40% (f)(g) | | 13,584,913 | 13,586,272 |
| TOTAL MONEY MARKET FUNDS (Cost $14,144,588) | | | 14,144,588 |
| | | | |
| TOTAL INVESTMENT IN SECURITIES - 101.3% (Cost $592,406,632) | 640,575,621 |
NET OTHER ASSETS (LIABILITIES) - (1.3)% | (8,318,640) |
| NET ASSETS - 100.0% | 632,256,981 |
| | |
Legend
| (b) | Security or a portion of the security is on loan at period end. |
| (c) | Security exempt from registration under Rule 144A of the Securities Act of 1933. These securities may be resold in transactions exempt from registration, normally to qualified institutional buyers. At the end of the period, the value of these securities amounted to $831,154 or 0.1% of net assets. |
| (d) | Restricted securities (including private placements) - Investment in securities not registered under the Securities Act of 1933 (excluding 144A issues). At the end of the period, the value of restricted securities (excluding 144A issues) amounted to $1,462,455 or 0.2% of net assets. |
| (f) | Affiliated fund that is generally available only to investment companies and other accounts managed by Fidelity Investments. The rate quoted is the annualized seven-day yield of the fund at period end. A complete unaudited listing of the fund's holdings as of its most recent quarter end is available upon request. In addition, each Fidelity Central Fund's financial statements, which are not covered by the Fund's Report of Independent Registered Public Accounting Firm, are available on the SEC's website or upon request. |
| (g) | Investment made with cash collateral received from securities on loan. |
| Additional information on each restricted holding is as follows: |
| Security | Acquisition Date | Acquisition Cost ($) |
| Space Exploration Technologies Corp. Class A | 2/16/21 - 5/24/22 | 1,151,846 |
| | | |
Affiliated Central Funds
Fiscal year to date information regarding the Fund's investments in Fidelity Central Funds, including the ownership percentage, is presented below.
| Affiliate | Value, beginning of period ($) | Purchases ($) | Sales Proceeds ($) | Dividend Income ($) | Realized Gain (loss) ($) | Change in Unrealized appreciation (depreciation) ($) | Value, end of period ($) | % ownership, end of period |
| Fidelity Cash Central Fund 5.40% | 1,141,639 | 60,295,698 | 60,879,021 | 53,627 | - | - | 558,316 | 0.0% |
| Fidelity Securities Lending Cash Central Fund 5.40% | 2,829,335 | 138,407,342 | 127,650,405 | 87,746 | - | - | 13,586,272 | 0.1% |
| Total | 3,970,974 | 198,703,040 | 188,529,426 | 141,373 | - | - | 14,144,588 | |
| | | | | | | | | |
Amounts in the dividend income column in the above table include any capital gain distributions from underlying funds, which are presented in the corresponding line item in the Statement of Operations, if applicable.
Amounts in the dividend income column for Fidelity Securities Lending Cash Central Fund represents the income earned on investing cash collateral, less rebates paid to borrowers and any lending agent fees associated with the loan, plus any premium payments received for lending certain types of securities.
Amounts included in the purchases and sales proceeds columns may include in-kind transactions, if applicable.
Investment Valuation
The following is a summary of the inputs used, as of October 31, 2023, involving the Fund's assets and liabilities carried at fair value. The inputs or methodology used for valuing securities may not be an indication of the risk associated with investing in those securities. For more information on valuation inputs, and their aggregation into the levels used below, please refer to the Investment Valuation section in the accompanying Notes to Financial Statements.
| Valuation Inputs at Reporting Date: |
| Description | Total ($) | Level 1 ($) | Level 2 ($) | Level 3 ($) |
Investments in Securities: | | | | |
|
| Equities: | | | | |
Communication Services | 31,485,925 | - | 31,485,925 | - |
Consumer Discretionary | 118,282,279 | - | 118,282,279 | - |
Consumer Staples | 25,297,228 | - | 25,297,228 | - |
Energy | 20,596,736 | - | 20,596,736 | - |
Financials | 90,887,721 | - | 90,887,721 | - |
Health Care | 42,427,210 | - | 42,427,210 | - |
Industrials | 135,977,579 | - | 134,515,124 | 1,462,455 |
Information Technology | 108,224,066 | - | 108,224,066 | - |
Materials | 37,443,707 | - | 37,443,707 | - |
Real Estate | 6,067,419 | - | 6,067,419 | - |
Utilities | 9,741,163 | - | 9,741,163 | - |
|
| Money Market Funds | 14,144,588 | 14,144,588 | - | - |
| Total Investments in Securities: | 640,575,621 | 14,144,588 | 624,968,578 | 1,462,455 |
Fidelity® Japan Fund
| Statement of Assets and Liabilities |
| | | | October 31, 2023 |
| | | | | |
| Assets | | | | |
| Investment in securities, at value (including securities loaned of $12,883,793) - See accompanying schedule: | | | | |
Unaffiliated issuers (cost $578,262,044) | $ | 626,431,033 | | |
Fidelity Central Funds (cost $14,144,588) | | 14,144,588 | | |
| | | | | |
| | | | | |
| Total Investment in Securities (cost $592,406,632) | | | $ | 640,575,621 |
| Cash | | | | 24,191 |
| Foreign currency held at value (cost $241,962) | | | | 237,966 |
| Receivable for investments sold | | | | 905,533 |
| Receivable for fund shares sold | | | | 88,353 |
| Dividends receivable | | | | 4,671,381 |
| Distributions receivable from Fidelity Central Funds | | | | 19,624 |
| Prepaid expenses | | | | 968 |
Total assets | | | | 646,523,637 |
| Liabilities | | | | |
| Payable for investments purchased | $ | 21,643 | | |
| Payable for fund shares redeemed | | 258,471 | | |
| Accrued management fee | | 243,159 | | |
| Distribution and service plan fees payable | | 5,907 | | |
| Other affiliated payables | | 78,224 | | |
| Other payables and accrued expenses | | 72,980 | | |
| Collateral on securities loaned | | 13,586,272 | | |
| Total Liabilities | | | | 14,266,656 |
| Net Assets | | | $ | 632,256,981 |
| Net Assets consist of: | | | | |
| Paid in capital | | | $ | 567,245,214 |
| Total accumulated earnings (loss) | | | | 65,011,767 |
| Net Assets | | | $ | 632,256,981 |
| | | | | |
| Net Asset Value and Maximum Offering Price | | | | |
| Class A : | | | | |
Net Asset Value and redemption price per share ($15,763,511 ÷ 1,082,580 shares)(a) | | | $ | 14.56 |
| Maximum offering price per share (100/94.25 of $14.56) | | | $ | 15.45 |
| Class M : | | | | |
Net Asset Value and redemption price per share ($2,353,812 ÷ 163,038 shares)(a) | | | $ | 14.44 |
| Maximum offering price per share (100/96.50 of $14.44) | | | $ | 14.96 |
| Class C : | | | | |
Net Asset Value and offering price per share ($1,779,199 ÷ 125,558 shares)(a) | | | $ | 14.17 |
| Japan : | | | | |
Net Asset Value, offering price and redemption price per share ($149,990,269 ÷ 10,208,018 shares) | | | $ | 14.69 |
| Class I : | | | | |
Net Asset Value, offering price and redemption price per share ($32,711,593 ÷ 2,208,439 shares) | | | $ | 14.81 |
| Class Z : | | | | |
Net Asset Value, offering price and redemption price per share ($429,658,597 ÷ 29,276,612 shares) | | | $ | 14.68 |
(a)Redemption price per share is equal to net asset value less any applicable contingent deferred sales charge. |
| Statement of Operations |
| | | | Year ended October 31, 2023 |
| Investment Income | | | | |
| Dividends | | | $ | 13,693,609 |
| Income from Fidelity Central Funds (including $87,746 from security lending) | | | | 141,373 |
| Income before foreign taxes withheld | | | $ | 13,834,982 |
| Less foreign taxes withheld | | | | (1,362,602) |
| Total Income | | | | 12,472,380 |
| Expenses | | | | |
| Management fee | | | | |
| Basic fee | $ | 4,411,127 | | |
| Performance adjustment | | (16,357) | | |
| Transfer agent fees | | 595,800 | | |
| Distribution and service plan fees | | 71,976 | | |
| Accounting fees | | 309,728 | | |
| Custodian fees and expenses | | 32,815 | | |
| Independent trustees' fees and expenses | | 3,666 | | |
| Registration fees | | 96,117 | | |
| Audit | | 68,287 | | |
| Legal | | 624 | | |
| Interest | | 15,104 | | |
| Miscellaneous | | 3,107 | | |
| Total expenses before reductions | | 5,591,994 | | |
| Expense reductions | | (41,066) | | |
| Total expenses after reductions | | | | 5,550,928 |
| Net Investment income (loss) | | | | 6,921,452 |
| Realized and Unrealized Gain (Loss) | | | | |
| Net realized gain (loss) on: | | | | |
| Investment Securities: | | | | |
| Unaffiliated issuers | | 32,002,995 | | |
| Foreign currency transactions | | 277,938 | | |
| Total net realized gain (loss) | | | | 32,280,933 |
| Change in net unrealized appreciation (depreciation) on: | | | | |
| Investment Securities: | | | | |
| Unaffiliated issuers | | 14,034,746 | | |
| Assets and liabilities in foreign currencies | | 60,814 | | |
| Total change in net unrealized appreciation (depreciation) | | | | 14,095,560 |
| Net gain (loss) | | | | 46,376,493 |
| Net increase (decrease) in net assets resulting from operations | | | $ | 53,297,945 |
| Statement of Changes in Net Assets |
| |
| | Year ended October 31, 2023 | | Year ended October 31, 2022 |
| Increase (Decrease) in Net Assets | | | | |
| Operations | | | | |
| Net investment income (loss) | $ | 6,921,452 | $ | 4,298,398 |
| Net realized gain (loss) | | 32,280,933 | | (11,275,330) |
| Change in net unrealized appreciation (depreciation) | | 14,095,560 | | (232,721,817) |
| Net increase (decrease) in net assets resulting from operations | | 53,297,945 | | (239,698,749) |
| Distributions to shareholders | | - | | (85,697,627) |
| | | | | |
| Share transactions - net increase (decrease) | | 6,725,873 | | 66,247,709 |
| | | | | |
| Total increase (decrease) in net assets | | 60,023,818 | | (259,148,667) |
| | | | | |
| Net Assets | | | | |
| Beginning of period | | 572,233,163 | | 831,381,830 |
| End of period | $ | 632,256,981 | $ | 572,233,163 |
| | | | | |
| | | | | |
Financial Highlights
| Fidelity Advisor® Japan Fund Class A |
| |
| Years ended October 31, | | 2023 | | 2022 | | 2021 | | 2020 | | 2019 |
Selected Per-Share Data | | | | | | | | | | |
| Net asset value, beginning of period | $ | 13.26 | $ | 20.90 | $ | 17.50 | $ | 15.80 | $ | 14.15 |
| Income from Investment Operations | | | | | | | | | | |
Net investment income (loss) A,B | | .11 | | .04 | | .02 | | .05 | | .07 |
| Net realized and unrealized gain (loss) | | 1.19 | | (5.58) | | 3.71 | | 1.81 | | 1.58 |
| Total from investment operations | | 1.30 | | (5.54) | | 3.73 | | 1.86 | | 1.65 |
| Distributions from net investment income | | - | | (.55) | | (.07) | | (.07) | | - |
| Distributions from net realized gain | | - | | (1.55) | | (.25) | | (.09) | | - |
| Total distributions | | - | | (2.10) | | (.33) C | | (.16) | | - |
| Net asset value, end of period | $ | 14.56 | $ | 13.26 | $ | 20.90 | $ | 17.50 | $ | 15.80 |
Total Return D,E | | 9.80% | | (29.38)% | | 21.42% | | 11.85% | | 11.66% |
Ratios to Average Net Assets B,F,G | | | | | | | | | | |
| Expenses before reductions | | 1.22% | | 1.39% | | 1.38% | | 1.37% | | 1.33% |
| Expenses net of fee waivers, if any | | 1.22% | | 1.39% | | 1.38% | | 1.37% | | 1.32% |
| Expenses net of all reductions | | 1.21% | | 1.39% | | 1.38% | | 1.37% | | 1.32% |
| Net investment income (loss) | | .69% | | .26% | | .08% | | .35% | | .51% |
| Supplemental Data | | | | | | | | | | |
| Net assets, end of period (000 omitted) | $ | 15,764 | $ | 13,004 | $ | 20,357 | $ | 16,181 | $ | 16,069 |
Portfolio turnover rate H | | 25% | | 26% | | 31% | | 22% | | 27% |
ACalculated based on average shares outstanding during the period.
BNet investment income (loss) is affected by the timing of the declaration of dividends by any underlying mutual funds or exchange-traded funds (ETFs). Net investment income (loss) of any mutual funds or ETFs is not included in the Fund's net investment income (loss) ratio.
CTotal distributions per share do not sum due to rounding.
DTotal returns would have been lower if certain expenses had not been reduced during the applicable periods shown.
ETotal returns do not include the effect of the sales charges.
FFees and expenses of any underlying mutual funds or exchange-traded funds (ETFs) are not included in the Fund's expense ratio. The Fund indirectly bears its proportionate share of these expenses. For additional expense information related to investments in Fidelity Central Funds, please refer to the "Investments in Fidelity Central Funds" note found in the Notes to Financial Statements section of the most recent Annual or Semi-Annual report.
GExpense ratios reflect operating expenses of the class. Expenses before reductions do not reflect amounts reimbursed, waived, or reduced through arrangements with the investment adviser, brokerage services, or other offset arrangements, if applicable, and do not represent the amount paid by the class during periods when reimbursements, waivers or reductions occur.
HAmount does not include the portfolio activity of any underlying mutual funds or exchange-traded funds (ETFs).
| Fidelity Advisor® Japan Fund Class M |
| |
| Years ended October 31, | | 2023 | | 2022 | | 2021 | | 2020 | | 2019 |
Selected Per-Share Data | | | | | | | | | | |
| Net asset value, beginning of period | $ | 13.19 | $ | 20.76 | $ | 17.40 | $ | 15.71 | $ | 14.11 |
| Income from Investment Operations | | | | | | | | | | |
Net investment income (loss) A,B | | .06 | | (.01) | | (.05) | | .01 | | .03 |
| Net realized and unrealized gain (loss) | | 1.19 | | (5.55) | | 3.69 | | 1.80 | | 1.57 |
| Total from investment operations | | 1.25 | | (5.56) | | 3.64 | | 1.81 | | 1.60 |
| Distributions from net investment income | | - | | (.46) | | (.02) | | (.03) | | - |
| Distributions from net realized gain | | - | | (1.55) | | (.25) | | (.09) | | - |
| Total distributions | | - | | (2.01) | | (.28) C | | (.12) | | - |
| Net asset value, end of period | $ | 14.44 | $ | 13.19 | $ | 20.76 | $ | 17.40 | $ | 15.71 |
Total Return D,E | | 9.48% | | (29.55)% | | 21.00% | | 11.55% | | 11.34% |
Ratios to Average Net Assets B,F,G | | | | | | | | | | |
| Expenses before reductions | | 1.51% | | 1.69% | | 1.70% | | 1.67% | | 1.64% |
| Expenses net of fee waivers, if any | | 1.50% | | 1.69% | | 1.70% | | 1.67% | | 1.64% |
| Expenses net of all reductions | | 1.49% | | 1.69% | | 1.70% | | 1.67% | | 1.63% |
| Net investment income (loss) | | .42% | | (.04)% | | (.23)% | | .04% | | .19% |
| Supplemental Data | | | | | | | | | | |
| Net assets, end of period (000 omitted) | $ | 2,354 | $ | 2,282 | $ | 3,919 | $ | 3,728 | $ | 3,945 |
Portfolio turnover rate H | | 25% | | 26% | | 31% | | 22% | | 27% |
ACalculated based on average shares outstanding during the period.
BNet investment income (loss) is affected by the timing of the declaration of dividends by any underlying mutual funds or exchange-traded funds (ETFs). Net investment income (loss) of any mutual funds or ETFs is not included in the Fund's net investment income (loss) ratio.
CTotal distributions per share do not sum due to rounding.
DTotal returns would have been lower if certain expenses had not been reduced during the applicable periods shown.
ETotal returns do not include the effect of the sales charges.
FFees and expenses of any underlying mutual funds or exchange-traded funds (ETFs) are not included in the Fund's expense ratio. The Fund indirectly bears its proportionate share of these expenses. For additional expense information related to investments in Fidelity Central Funds, please refer to the "Investments in Fidelity Central Funds" note found in the Notes to Financial Statements section of the most recent Annual or Semi-Annual report.
GExpense ratios reflect operating expenses of the class. Expenses before reductions do not reflect amounts reimbursed, waived, or reduced through arrangements with the investment adviser, brokerage services, or other offset arrangements, if applicable, and do not represent the amount paid by the class during periods when reimbursements, waivers or reductions occur.
HAmount does not include the portfolio activity of any underlying mutual funds or exchange-traded funds (ETFs).
| Fidelity Advisor® Japan Fund Class C |
| |
| Years ended October 31, | | 2023 | | 2022 | | 2021 | | 2020 | | 2019 |
Selected Per-Share Data | | | | | | | | | | |
| Net asset value, beginning of period | $ | 13.00 | $ | 20.43 | $ | 17.17 | $ | 15.49 | $ | 13.97 |
| Income from Investment Operations | | | | | | | | | | |
Net investment income (loss) A,B | | - C | | (.07) | | (.12) | | (.05) | | (.02) |
| Net realized and unrealized gain (loss) | | 1.17 | | (5.49) | | 3.63 | | 1.77 | | 1.54 |
| Total from investment operations | | 1.17 | | (5.56) | | 3.51 | | 1.72 | | 1.52 |
| Distributions from net investment income | | - | | (.33) | | (.01) | | - | | - |
| Distributions from net realized gain | | - | | (1.55) | | (.25) | | (.04) | | - |
| Total distributions | | - | | (1.87) D | | (.25) D | | (.04) | | - |
| Net asset value, end of period | $ | 14.17 | $ | 13.00 | $ | 20.43 | $ | 17.17 | $ | 15.49 |
Total Return E,F | | 9.00% | | (29.85)% | | 20.54% | | 11.09% | | 10.88% |
Ratios to Average Net Assets B,G,H | | | | | | | | | | |
| Expenses before reductions | | 1.94% | | 2.11% | | 2.09% | | 2.06% | | 2.01% |
| Expenses net of fee waivers, if any | | 1.93% | | 2.10% | | 2.09% | | 2.05% | | 2.00% |
| Expenses net of all reductions | | 1.93% | | 2.10% | | 2.09% | | 2.05% | | 2.00% |
| Net investment income (loss) | | (.02)% | | (.46)% | | (.63)% | | (.34)% | | (.17)% |
| Supplemental Data | | | | | | | | | | |
| Net assets, end of period (000 omitted) | $ | 1,779 | $ | 2,179 | $ | 4,778 | $ | 6,167 | $ | 8,829 |
Portfolio turnover rate I | | 25% | | 26% | | 31% | | 22% | | 27% |
ACalculated based on average shares outstanding during the period.
BNet investment income (loss) is affected by the timing of the declaration of dividends by any underlying mutual funds or exchange-traded funds (ETFs). Net investment income (loss) of any mutual funds or ETFs is not included in the Fund's net investment income (loss) ratio.
CAmount represents less than $.005 per share.
DTotal distributions per share do not sum due to rounding.
ETotal returns would have been lower if certain expenses had not been reduced during the applicable periods shown.
FTotal returns do not include the effect of the contingent deferred sales charge.
GFees and expenses of any underlying mutual funds or exchange-traded funds (ETFs) are not included in the Fund's expense ratio. The Fund indirectly bears its proportionate share of these expenses. For additional expense information related to investments in Fidelity Central Funds, please refer to the "Investments in Fidelity Central Funds" note found in the Notes to Financial Statements section of the most recent Annual or Semi-Annual report.
HExpense ratios reflect operating expenses of the class. Expenses before reductions do not reflect amounts reimbursed, waived, or reduced through arrangements with the investment adviser, brokerage services, or other offset arrangements, if applicable, and do not represent the amount paid by the class during periods when reimbursements, waivers or reductions occur.
IAmount does not include the portfolio activity of any underlying mutual funds or exchange-traded funds (ETFs).
| Years ended October 31, | | 2023 | | 2022 | | 2021 | | 2020 | | 2019 |
Selected Per-Share Data | | | | | | | | | | |
| Net asset value, beginning of period | $ | 13.35 | $ | 21.01 | $ | 17.58 | $ | 15.86 | $ | 14.20 |
| Income from Investment Operations | | | | | | | | | | |
Net investment income (loss) A,B | | .15 | | .08 | | .08 | | .10 | | .12 |
| Net realized and unrealized gain (loss) | | 1.19 | | (5.60) | | 3.72 | | 1.81 | | 1.59 |
| Total from investment operations | | 1.34 | | (5.52) | | 3.80 | | 1.91 | | 1.71 |
| Distributions from net investment income | | - | | (.59) | | (.11) | | (.11) | | (.05) |
| Distributions from net realized gain | | - | | (1.55) | | (.25) | | (.09) | | - |
| Total distributions | | - | | (2.14) | | (.37) C | | (.19) C | | (.05) |
| Net asset value, end of period | $ | 14.69 | $ | 13.35 | $ | 21.01 | $ | 17.58 | $ | 15.86 |
Total Return D | | 10.04% | | (29.16)% | | 21.75% | | 12.16% | | 12.10% |
Ratios to Average Net Assets B,E,F | | | | | | | | | | |
| Expenses before reductions | | .96% | | 1.13% | | 1.09% | | 1.06% | | 1.01% |
| Expenses net of fee waivers, if any | | .95% | | 1.12% | | 1.09% | | 1.06% | | 1.01% |
| Expenses net of all reductions | | .95% | | 1.12% | | 1.09% | | 1.06% | | 1.00% |
| Net investment income (loss) | | .96% | | .52% | | .37% | | .65% | | .82% |
| Supplemental Data | | | | | | | | | | |
| Net assets, end of period (000 omitted) | $ | 149,990 | $ | 113,015 | $ | 167,954 | $ | 274,433 | $ | 401,344 |
Portfolio turnover rate G | | 25% | | 26% | | 31% | | 22% | | 27% |
ACalculated based on average shares outstanding during the period.
BNet investment income (loss) is affected by the timing of the declaration of dividends by any underlying mutual funds or exchange-traded funds (ETFs). Net investment income (loss) of any mutual funds or ETFs is not included in the Fund's net investment income (loss) ratio.
CTotal distributions per share do not sum due to rounding.
DTotal returns would have been lower if certain expenses had not been reduced during the applicable periods shown.
EFees and expenses of any underlying mutual funds or exchange-traded funds (ETFs) are not included in the Fund's expense ratio. The Fund indirectly bears its proportionate share of these expenses. For additional expense information related to investments in Fidelity Central Funds, please refer to the "Investments in Fidelity Central Funds" note found in the Notes to Financial Statements section of the most recent Annual or Semi-Annual report.
FExpense ratios reflect operating expenses of the class. Expenses before reductions do not reflect amounts reimbursed, waived, or reduced through arrangements with the investment adviser, brokerage services, or other offset arrangements, if applicable, and do not represent the amount paid by the class during periods when reimbursements, waivers or reductions occur.
GAmount does not include the portfolio activity of any underlying mutual funds or exchange-traded funds (ETFs).
| Fidelity Advisor® Japan Fund Class I |
| |
| Years ended October 31, | | 2023 | | 2022 | | 2021 | | 2020 | | 2019 |
Selected Per-Share Data | | | | | | | | | | |
| Net asset value, beginning of period | $ | 13.45 | $ | 20.97 | $ | 17.56 | $ | 15.85 | $ | 14.18 |
| Income from Investment Operations | | | | | | | | | | |
Net investment income (loss) A,B | | .15 | | .09 | | .09 | | .11 | | .13 |
| Net realized and unrealized gain (loss) | | 1.21 | | (5.65) | | 3.71 | | 1.81 | | 1.58 |
| Total from investment operations | | 1.36 | | (5.56) | | 3.80 | | 1.92 | | 1.71 |
| Distributions from net investment income | | - | | (.41) | | (.14) | | (.12) | | (.04) |
| Distributions from net realized gain | | - | | (1.55) | | (.25) | | (.09) | | - |
| Total distributions | | - | | (1.96) | | (.39) | | (.21) | | (.04) |
| Net asset value, end of period | $ | 14.81 | $ | 13.45 | $ | 20.97 | $ | 17.56 | $ | 15.85 |
Total Return C | | 10.11% | | (29.15)% | | 21.80% | | 12.20% | | 12.12% |
Ratios to Average Net Assets B,D,E | | | | | | | | | | |
| Expenses before reductions | | .94% | | 1.09% | | 1.04% | | 1.01% | | .96% |
| Expenses net of fee waivers, if any | | .94% | | 1.09% | | 1.04% | | 1.01% | | .96% |
| Expenses net of all reductions | | .94% | | 1.09% | | 1.04% | | 1.00% | | .95% |
| Net investment income (loss) | | .97% | | .56% | | .43% | | .71% | | .87% |
| Supplemental Data | | | | | | | | | | |
| Net assets, end of period (000 omitted) | $ | 32,712 | $ | 33,320 | $ | 48,887 | $ | 473,859 | $ | 319,164 |
Portfolio turnover rate F | | 25% | | 26% | | 31% | | 22% | | 27% |
ACalculated based on average shares outstanding during the period.
BNet investment income (loss) is affected by the timing of the declaration of dividends by any underlying mutual funds or exchange-traded funds (ETFs). Net investment income (loss) of any mutual funds or ETFs is not included in the Fund's net investment income (loss) ratio.
CTotal returns would have been lower if certain expenses had not been reduced during the applicable periods shown.
DFees and expenses of any underlying mutual funds or exchange-traded funds (ETFs) are not included in the Fund's expense ratio. The Fund indirectly bears its proportionate share of these expenses. For additional expense information related to investments in Fidelity Central Funds, please refer to the "Investments in Fidelity Central Funds" note found in the Notes to Financial Statements section of the most recent Annual or Semi-Annual report.
EExpense ratios reflect operating expenses of the class. Expenses before reductions do not reflect amounts reimbursed, waived, or reduced through arrangements with the investment adviser, brokerage services, or other offset arrangements, if applicable, and do not represent the amount paid by the class during periods when reimbursements, waivers or reductions occur.
FAmount does not include the portfolio activity of any underlying mutual funds or exchange-traded funds (ETFs).
| Fidelity Advisor® Japan Fund Class Z |
| |
| Years ended October 31, | | 2023 | | 2022 | | 2021 | | 2020 | | 2019 |
Selected Per-Share Data | | | | | | | | | | |
| Net asset value, beginning of period | $ | 13.31 | $ | 20.98 | $ | 17.56 | $ | 15.84 | $ | 14.19 |
| Income from Investment Operations | | | | | | | | | | |
Net investment income (loss) A,B | | .17 | | .11 | | .10 | | .13 | | .14 |
| Net realized and unrealized gain (loss) | | 1.20 | | (5.59) | | 3.72 | | 1.81 | | 1.57 |
| Total from investment operations | | 1.37 | | (5.48) | | 3.82 | | 1.94 | | 1.71 |
| Distributions from net investment income | | - | | (.64) | | (.15) | | (.13) | | (.06) |
| Distributions from net realized gain | | - | | (1.55) | | (.25) | | (.09) | | - |
| Total distributions | | - | | (2.19) | | (.40) | | (.22) | | (.06) |
| Net asset value, end of period | $ | 14.68 | $ | 13.31 | $ | 20.98 | $ | 17.56 | $ | 15.84 |
Total Return C | | 10.29% | | (29.07)% | | 21.93% | | 12.36% | | 12.14% |
Ratios to Average Net Assets B,D,E | | | | | | | | | | |
| Expenses before reductions | | .80% | | .96% | | .96% | | .92% | | .87% |
| Expenses net of fee waivers, if any | | .79% | | .96% | | .96% | | .92% | | .87% |
| Expenses net of all reductions | | .79% | | .96% | | .96% | | .92% | | .86% |
| Net investment income (loss) | | 1.12% | | .69% | | .51% | | .79% | | .96% |
| Supplemental Data | | | | | | | | | | |
| Net assets, end of period (000 omitted) | $ | 429,659 | $ | 408,434 | $ | 585,487 | $ | 8,368 | $ | 8,136 |
Portfolio turnover rate F | | 25% | | 26% | | 31% | | 22% | | 27% |
ACalculated based on average shares outstanding during the period.
BNet investment income (loss) is affected by the timing of the declaration of dividends by any underlying mutual funds or exchange-traded funds (ETFs). Net investment income (loss) of any mutual funds or ETFs is not included in the Fund's net investment income (loss) ratio.
CTotal returns would have been lower if certain expenses had not been reduced during the applicable periods shown.
DFees and expenses of any underlying mutual funds or exchange-traded funds (ETFs) are not included in the Fund's expense ratio. The Fund indirectly bears its proportionate share of these expenses. For additional expense information related to investments in Fidelity Central Funds, please refer to the "Investments in Fidelity Central Funds" note found in the Notes to Financial Statements section of the most recent Annual or Semi-Annual report.
EExpense ratios reflect operating expenses of the class. Expenses before reductions do not reflect amounts reimbursed, waived, or reduced through arrangements with the investment adviser, brokerage services, or other offset arrangements, if applicable, and do not represent the amount paid by the class during periods when reimbursements, waivers or reductions occur.
FAmount does not include the portfolio activity of any underlying mutual funds or exchange-traded funds (ETFs).
For the period ended October 31, 2023
1. Organization.
Fidelity Japan Fund (the Fund) is a fund of Fidelity Investment Trust (the Trust) and is authorized to issue an unlimited number of shares. The Trust is registered under the Investment Company Act of 1940, as amended (the 1940 Act), as an open-end management investment company organized as a Massachusetts business trust. The Fund offers Class A, Class M, Class C, Japan, Class I and Class Z shares, each of which has equal rights as to assets and voting privileges. Class A, Class M, Class C, Class I and Class Z are Fidelity Advisor classes. Each class has exclusive voting rights with respect to matters that affect that class. Class C shares will automatically convert to Class A shares after a holding period of eight years from the initial date of purchase, with certain exceptions.
2. Investments in Fidelity Central Funds.
Funds may invest in Fidelity Central Funds, which are open-end investment companies generally available only to other investment companies and accounts managed by the investment adviser and its affiliates. The Schedule of Investments lists any Fidelity Central Funds held as an investment as of period end, but does not include the underlying holdings of each Fidelity Central Fund. An investing fund indirectly bears its proportionate share of the expenses of the underlying Fidelity Central Funds.
Based on its investment objective, each Fidelity Central Fund may invest or participate in various investment vehicles or strategies that are similar to those of the investing fund. These strategies are consistent with the investment objectives of the investing fund and may involve certain economic risks which may cause a decline in value of each of the Fidelity Central Funds and thus a decline in the value of the investing fund.
| Fidelity Central Fund | Investment Manager | Investment Objective | Investment Practices | Expense RatioA |
| Fidelity Money Market Central Funds | Fidelity Management & Research Company LLC (FMR) | Each fund seeks to obtain a high level of current income consistent with the preservation of capital and liquidity. | Short-term Investments | Less than .005% |
A Expenses expressed as a percentage of average net assets and are as of each underlying Central Fund's most recent annual or semi-annual shareholder report.
A complete unaudited list of holdings for each Fidelity Central Fund is available upon request or at the Securities and Exchange Commission website at www.sec.gov. In addition, the financial statements of the Fidelity Central Funds which contain the significant accounting policies (including investment valuation policies) of those funds, and are not covered by the Report of Independent Registered Public Accounting Firm, are available on the Securities and Exchange Commission website or upon request.
3. Significant Accounting Policies.
The Fund is an investment company and applies the accounting and reporting guidance of the Financial Accounting Standards Board (FASB) Accounting Standards Codification Topic 946 Financial Services - Investment Companies. The financial statements have been prepared in conformity with accounting principles generally accepted in the United States of America (GAAP), which require management to make certain estimates and assumptions at the date of the financial statements. Actual results could differ from those estimates. Subsequent events, if any, through the date that the financial statements were issued have been evaluated in the preparation of the financial statements. The Fund's Schedule of Investments lists any underlying mutual funds or exchange-traded funds (ETFs) but does not include the underlying holdings of these funds. The following summarizes the significant accounting policies of the Fund:
Investment Valuation. Investments are valued as of 4:00 p.m. Eastern time on the last calendar day of the period. The Board of Trustees (the Board) has designated the Fund's investment adviser as the valuation designee responsible for the fair valuation function and performing fair value determinations as needed. The investment adviser has established a Fair Value Committee (the Committee) to carry out the day-to-day fair valuation responsibilities and has adopted policies and procedures to govern the fair valuation process and the activities of the Committee. In accordance with these fair valuation policies and procedures, which have been approved by the Board, the Fund attempts to obtain prices from one or more third party pricing services or brokers to value its investments. When current market prices, quotations or currency exchange rates are not readily available or reliable, investments will be fair valued in good faith by the Committee, in accordance with the policies and procedures. Factors used in determining fair value vary by investment type and may include market or investment specific events, transaction data, estimated cash flows, and market observations of comparable investments. The frequency that the fair valuation procedures are used cannot be predicted and they may be utilized to a significant extent. The Committee manages the Fund's fair valuation practices and maintains the fair valuation policies and procedures. The Fund's investment adviser reports to the Board information regarding the fair valuation process and related material matters.
The Fund categorizes the inputs to valuation techniques used to value its investments into a disclosure hierarchy consisting of three levels as shown below:
Level 1 - unadjusted quoted prices in active markets for identical investments
Level 2 - other significant observable inputs (including quoted prices for similar investments, interest rates, prepayment speeds, etc.)
Level 3 - unobservable inputs (including the Fund's own assumptions based on the best information available)
Valuation techniques used to value the Fund's investments by major category are as follows:
Equity securities, including restricted securities, for which market quotations are readily available, are valued at the last reported sale price or official closing price as reported by a third party pricing service on the primary market or exchange on which they are traded and are categorized as Level 1 in the hierarchy. In the event there were no sales during the day or closing prices are not available, securities are valued at the last quoted bid price or may be valued using the last available price and are generally categorized as Level 2 in the hierarchy. For foreign equity securities, when market or security specific events arise, comparisons to the valuation of American Depositary Receipts (ADRs), futures contracts, ETFs and certain indexes as well as quoted prices for similar securities may be used and would be categorized as Level 2 in the hierarchy. For equity securities, including restricted securities, where observable inputs are limited, assumptions about market activity and risk are used and these securities may be categorized as Level 3 in the hierarchy.
Investments in open-end mutual funds, including the Fidelity Central Funds, are valued at their closing net asset value (NAV) each business day and are categorized as Level 1 in the hierarchy.
Changes in valuation techniques may result in transfers in or out of an assigned level within the disclosure hierarchy. The aggregate value of investments by input level as of October 31, 2023 is included at the end of the Fund's Schedule of Investments.
Foreign Currency. Certain Funds may use foreign currency contracts to facilitate transactions in foreign-denominated securities. Gains and losses from these transactions may arise from changes in the value of the foreign currency or if the counterparties do not perform under the contracts' terms.
Foreign-denominated assets, including investment securities, and liabilities are translated into U.S. dollars at the exchange rates at period end. Purchases and sales of investment securities, income and dividends received, and expenses denominated in foreign currencies are translated into U.S. dollars at the exchange rate in effect on the transaction date.
The effects of exchange rate fluctuations on investments are included with the net realized and unrealized gain (loss) on investment securities. Other foreign currency transactions resulting in realized and unrealized gain (loss) are disclosed separately.
Investment Transactions and Income. For financial reporting purposes, the Fund's investment holdings and NAV include trades executed through the end of the last business day of the period. The NAV per share for processing shareholder transactions is calculated as of the close of business of the New York Stock Exchange (NYSE), normally 4:00 p.m. Eastern time and includes trades executed through the end of the prior business day. Gains and losses on securities sold are determined on the basis of identified cost and include proceeds received from litigation. Commissions paid to certain brokers with whom the investment adviser, or its affiliates, places trades on behalf of a fund include an amount in addition to trade execution, which may be rebated back to a fund. Any such rebates are included in net realized gain (loss) on investments in the Statement of Operations. Dividend income is recorded on the ex-dividend date, except for certain dividends from foreign securities where the ex-dividend date may have passed, which are recorded as soon as the Fund is informed of the ex-dividend date. Non-cash dividends included in dividend income, if any, are recorded at the fair market value of the securities received. Income and capital gain distributions from Fidelity Central Funds, if any, are recorded on the ex-dividend date. Investment income is recorded net of foreign taxes withheld where recovery of such taxes is uncertain.
Class Allocations and Expenses. Investment income, realized and unrealized capital gains and losses, common expenses of a fund, and certain fund-level expense reductions, if any, are allocated daily on a pro-rata basis to each class based on the relative net assets of each class to the total net assets of a fund. Each class differs with respect to transfer agent and distribution and service plan fees incurred, as applicable. Certain expense reductions may also differ by class, if applicable. For the reporting period, the allocated portion of income and expenses to each class as a percent of its average net assets may vary due to the timing of recording these transactions in relation to fluctuating net assets of the classes. Expenses directly attributable to a fund are charged to that fund. Expenses attributable to more than one fund are allocated among the respective funds on the basis of relative net assets or other appropriate methods. Expenses included in the accompanying financial statements reflect the expenses of that fund and do not include any expenses associated with any underlying mutual funds or exchange-traded funds (ETFs). Although not included in a fund's expenses, a fund indirectly bears its proportionate share of these expenses through the net asset value of each underlying mutual fund or exchange-traded fund (ETF). Expense estimates are accrued in the period to which they relate and adjustments are made when actual amounts are known.
Income Tax Information and Distributions to Shareholders. Each year, the Fund intends to qualify as a regulated investment company under Subchapter M of the Internal Revenue Code, including distributing substantially all of its taxable income and realized gains. As a result, no provision for U.S. Federal income taxes is required. As of October 31, 2023, the Fund did not have any unrecognized tax benefits in the financial statements; nor is the Fund aware of any tax positions for which it is reasonably possible that the total amounts of unrecognized tax benefits will significantly change in the next twelve months. The Fund files a U.S. federal tax return, in addition to state and local tax returns as required. The Fund's federal income tax returns are subject to examination by the Internal Revenue Service (IRS) for a period of three fiscal years after they are filed. State and local tax returns may be subject to examination for an additional fiscal year depending on the jurisdiction. Foreign taxes are provided for based on the Fund's understanding of the tax rules and rates that exist in the foreign markets in which it invests.
Distributions are declared and recorded on the ex-dividend date. Income and capital gain distributions are declared separately for each class. Income and capital gain distributions are determined in accordance with income tax regulations, which may differ from GAAP.
Capital accounts within the financial statements are adjusted for permanent book-tax differences. These adjustments have no impact on net assets or the results of operations. Capital accounts are not adjusted for temporary book-tax differences which will reverse in a subsequent period.
Book-tax differences are primarily due to foreign currency transactions, passive foreign investment companies (PFIC), capital loss carryforwards and losses deferred due to wash sales and excise tax regulations.
As of period end, the cost and unrealized appreciation (depreciation) in securities, and derivatives if applicable, for federal income tax purposes were as follows:
| Gross unrealized appreciation | $127,803,896 |
| Gross unrealized depreciation | (86,076,842) |
| Net unrealized appreciation (depreciation) | $41,727,054 |
| Tax Cost | $598,848,567 |
The tax-based components of distributable earnings as of period end were as follows:
| Undistributed ordinary income | $5,400,072 |
| Undistributed long-term capital gain | $17,974,277 |
| Net unrealized appreciation (depreciation) on securities and other investments | $41,637,420 |
The tax character of distributions paid was as follows:
| | October 31, 2023 | October 31, 2022 |
| Ordinary Income | $- | $36,508,917 |
| Long-term Capital Gains | - | 49,188,710 |
| Total | $- | $85,697,627 |
Restricted Securities (including Private Placements). Funds may invest in securities that are subject to legal or contractual restrictions on resale. These securities generally may be resold in transactions exempt from registration or to the public if the securities are registered. Disposal of these securities may involve time-consuming negotiations and expense, and prompt sale at an acceptable price may be difficult. Information regarding restricted securities held at period end is included at the end of the Schedule of Investments, if applicable.
4. Purchases and Sales of Investments.
Purchases and sales of securities, other than short-term securities and in-kind transactions, as applicable, are noted in the table below.
| | Purchases ($) | Sales ($) |
| Fidelity Japan Fund | 179,501,356 | 160,024,582 |
5. Fees and Other Transactions with Affiliates.
Management Fee. Fidelity Management & Research Company LLC (the investment adviser) and its affiliates provide the Fund with investment management related services for which the Fund pays a monthly management fee. The management fee is the sum of an individual fund fee rate that is based on an annual rate of .45% of the Fund's average net assets and an annualized group fee rate that averaged .23% during the period. The group fee rate is based upon the monthly average net assets of a group of registered investment companies with which the investment adviser has management contracts. The group fee rate decreases as assets under management increase and increases as assets under management decrease. In addition, the management fee is subject to a performance adjustment (up to a maximum of +/- .20% of the Fund's average net assets over a 36 month performance period). The upward or downward adjustment to the management fee is based on the relative investment performance of Japan as compared to its benchmark index, the TOPIX, over the same 36 month performance period. For the reporting period, the total annual management fee rate, including the performance adjustment, was .67% of the Fund's average net assets. The performance adjustment included in the management fee rate may be higher or lower than the maximum performance adjustment rate due to the difference between the average net assets for the reporting and performance periods.
Distribution and Service Plan Fees. In accordance with Rule 12b-1 of the 1940 Act, the Fund has adopted separate Distribution and Service Plans for each class of shares. Certain classes pay Fidelity Distributors Company LLC (FDC), an affiliate of the investment adviser, separate Distribution and Service Fees, each of which is based on an annual percentage of each class' average net assets. In addition, FDC may pay financial intermediaries for selling shares of the Fund and providing shareholder support services. For the period, the Distribution and Service Fee rates, total fees and amounts retained by FDC were as follows:
| | Distribution Fee | Service Fee | Total Fees | Retained by FDC |
| Class A | - % | .25% | $38,059 | $1,323 |
| Class M | .25% | .25% | 12,894 | 28 |
| Class C | .75% | .25% | 21,023 | 2,831 |
| | | | $71,976 | $4,182 |
Sales Load. FDC may receive a front-end sales charge of up to 5.75% for selling Class A shares and 3.50% for selling Class M shares, some of which is paid to financial intermediaries for selling shares of the Fund. Depending on the holding period, FDC may receive contingent deferred sales charges levied on Class A, Class M and Class C redemptions. The deferred sales charges are 1.00% for Class C shares, 1.00% for certain purchases of Class A shares and .25% for certain purchases of Class M shares.
For the period, sales charge amounts retained by FDC were as follows:
| | Retained by FDC |
| Class A | $2,149 |
| Class M | 248 |
Class CA | 21 |
| | $2,418 |
A When Class C shares are initially sold, FDC pays commissions from its own resources to financial intermediaries through which the sales are made.
Transfer Agent Fees. Fidelity Investments Institutional Operations Company LLC (FIIOC), an affiliate of the investment adviser, is the transfer, dividend disbursing and shareholder servicing agent for each class of the Fund. FIIOC receives account fees and asset-based fees that vary according to the account size and type of account of the shareholders of the respective classes of the Fund, except for Class Z. FIIOC receives an asset-based fee of Class Z's average net assets. FIIOC pays for typesetting, printing and mailing of shareholder reports, except proxy statements.
For the period, transfer agent fees for each class were as follows:
| | Amount | % of Class-Level Average Net Assets |
| Class A | $33,382 | .22 |
| Class M | 6,630 | .26 |
| Class C | 3,874 | .18 |
| Japan | 295,757 | .20 |
| Class I | 65,784 | .19 |
| Class Z | 190,373 | .04 |
| | $595,800 | |
During November 2023, the Board approved a change in the transfer agent fees effective December 1, 2023 to a fixed annual rate of class-level average net assets as follows:
| | % of Class-Level Average Net Assets |
| Class A | 0.2000 |
| Class M | 0.2000 |
| Class C | 0.1827 |
| Japan | 0.1937 |
| Class I | 0.1893 |
Accounting Fees. Fidelity Service Company, Inc. (FSC), an affiliate of the investment adviser, maintains the Fund's accounting records. The accounting fee is based on the level of average net assets for each month. For the period, the fees were equivalent to the following annual rates:
| | % of Average Net Assets |
| Fidelity Japan Fund | .05 |
During November 2023, the Board approved a change in the accounting fees effective December 1, 2023 to a fixed annual rate of average net assets as follows:
| | % of Average Net Assets |
| Fidelity Japan Fund | 0.0466 |
Interfund Lending Program. Pursuant to an Exemptive Order issued by the Securities and Exchange Commission (the SEC), the Fund, along with other registered investment companies having management contracts with Fidelity Management & Research Company LLC (FMR), or other affiliated entities of FMR, may participate in an interfund lending program. This program provides an alternative credit facility allowing the Fund to borrow from, or lend money to, other participating affiliated funds. At period end, there were no interfund loans outstanding. Activity in this program during the period for which loans were outstanding was as follows:
| | Borrower or Lender | Average Loan Balance | Weighted Average Interest Rate | Interest Expense |
| Fidelity Japan Fund | Borrower | $ 9,038,500 | 4.30% | $15,104 |
Interfund Trades. Funds may purchase from or sell securities to other Fidelity Funds under procedures adopted by the Board. The procedures have been designed to ensure these interfund trades are executed in accordance with Rule 17a-7 of the 1940 Act. Any interfund trades are included within the respective purchases and sales amounts shown in the Purchases and Sales of Investments note. Interfund trades during the period are noted in the table below.
| | Purchases ($) | Sales ($) | Realized Gain (Loss) ($) |
| Fidelity Japan Fund | 4,715,156 | 350,123 | 8,902 |
6. Committed Line of Credit.
Certain Funds participate with other funds managed by the investment adviser or an affiliate in a $4.25 billion credit facility (the "line of credit") to be utilized for temporary or emergency purposes to fund shareholder redemptions or for other short-term liquidity purposes. The participating funds have agreed to pay commitment fees on their pro-rata portion of the line of credit, which are reflected in Miscellaneous expenses on the Statement of Operations, and are listed below. During the period, there were no borrowings on this line of credit.
| | Amount |
| Fidelity Japan Fund | $1,170 |
7. Security Lending.
Funds lend portfolio securities from time to time in order to earn additional income. Lending agents are used, including National Financial Services (NFS), an affiliate of the investment adviser. Pursuant to a securities lending agreement, NFS will receive a fee, which is capped at 9.9% of a fund's daily lending revenue, for its services as lending agent. A fund may lend securities to certain qualified borrowers, including NFS. On the settlement date of the loan, a fund receives collateral (in the form of U.S. Treasury obligations, letters of credit and/or cash) against the loaned securities and maintains collateral in an amount not less than 100% of the market value of the loaned securities during the period of the loan. The market value of the loaned securities is determined at the close of business of a fund and any additional required collateral is delivered to a fund on the next business day. A fund or borrower may terminate the loan at any time, and if the borrower defaults on its obligation to return the securities loaned because of insolvency or other reasons, a fund may apply collateral received from the borrower against the obligation. A fund may experience delays and costs in recovering the securities loaned. Any cash collateral received is invested in the Fidelity Securities Lending Cash Central Fund. Any loaned securities are identified as such in the Schedule of Investments, and the value of loaned securities and cash collateral at period end, as applicable, are presented in the Statement of Assets and Liabilities. Security lending income represents the income earned on investing cash collateral, less rebates paid to borrowers and any lending agent fees associated with the loan, plus any premium payments received for lending certain types of securities. Security lending income is presented in the Statement of Operations as a component of income from Fidelity Central Funds. Affiliated security lending activity, if any, was as follows:
| | Total Security Lending Fees Paid to NFS | Security Lending Income From Securities Loaned to NFS | Value of Securities Loaned to NFS at Period End |
| Fidelity Japan Fund | $9,233 | $- | $- |
8. Expense Reductions.
Through arrangements with each class' transfer agent, credits realized as a result of certain uninvested cash balances were used to reduce the Fund's expenses. During the period, transfer agent credits reduced each class' expenses as noted in the table below.
| | Expense reduction |
| Class A | $256 |
| Class M | 414 |
| Class C | 33 |
| | $703 |
In addition, during the period the investment adviser or an affiliate reimbursed and/or waived a portion of fund-level operating expenses in the amount of $40,363.
9. Distributions to Shareholders.
Distributions to shareholders of each class were as follows:
| | Year ended October 31, 2023 | Year ended October 31, 2022 |
| Fidelity Japan Fund | | |
| Distributions to shareholders | | |
| Class A | $- | $2,019,337 |
| Class M | - | 368,577 |
| Class C | - | 426,706 |
| Japan | - | 17,143,088 |
| Class I | - | 4,520,940 |
| Class Z | - | 61,218,979 |
Total | $- | $85,697,627 |
10. Share Transactions.
Share transactions for each class were as follows and may contain in-kind transactions, automatic conversions between classes or exchanges between affiliated funds:
| | Shares | Shares | Dollars | Dollars |
| | Year ended October 31, 2023 | Year ended October 31, 2022 | Year ended October 31, 2023 | Year ended October 31, 2022 |
| Fidelity Japan Fund | | | | |
| Class A | | | | |
| Shares sold | 253,562 | 117,484 | $4,046,153 | $1,791,821 |
| Reinvestment of distributions | - | 100,623 | - | 1,865,544 |
| Shares redeemed | (151,426) | (211,780) | (2,307,493) | (3,414,360) |
| Net increase (decrease) | 102,136 | 6,327 | $1,738,660 | $243,005 |
| Class M | | | | |
| Shares sold | 12,539 | 13,826 | $196,973 | $202,895 |
| Reinvestment of distributions | - | 19,910 | - | 368,140 |
| Shares redeemed | (22,565) | (49,434) | (338,510) | (787,625) |
| Net increase (decrease) | (10,026) | (15,698) | $(141,537) | $(216,590) |
| Class C | | | | |
| Shares sold | 39,644 | 8,561 | $604,997 | $138,296 |
| Reinvestment of distributions | - | 23,330 | - | 426,706 |
| Shares redeemed | (81,701) | (98,132) | (1,220,282) | (1,544,500) |
| Net increase (decrease) | (42,057) | (66,241) | $(615,285) | $(979,498) |
| Japan | | | | |
| Shares sold | 4,480,372 | 1,808,139 | $70,308,105 | $29,931,437 |
| Reinvestment of distributions | - | 867,250 | - | 16,148,203 |
| Shares redeemed | (2,739,105) | (2,201,846) | (42,188,958) | (35,408,192) |
| Net increase (decrease) | 1,741,267 | 473,543 | $28,119,147 | $10,671,448 |
| Class I | | | | |
| Shares sold | 2,062,944 | 694,437 | $32,061,275 | $11,578,345 |
| Reinvestment of distributions | - | 176,445 | - | 3,310,112 |
| Shares redeemed | (2,330,965) | (725,162) | (34,977,085) | (12,524,199) |
| Net increase (decrease) | (268,021) | 145,720 | $(2,915,810) | $2,364,258 |
| Class Z | | | | |
| Shares sold | 5,627,405 | 833,537 | $89,494,212 | $13,605,712 |
| Reinvestment of distributions | - | 3,263,046 | - | 60,496,866 |
| Shares redeemed | (7,035,462) | (1,323,692) | (108,953,514) | (19,937,492) |
| Net increase (decrease) | (1,408,057) | 2,772,891 | $(19,459,302) | $54,165,086 |
11. Other.
A fund's organizational documents provide former and current trustees and officers with a limited indemnification against liabilities arising in connection with the performance of their duties to the fund. In the normal course of business, a fund may also enter into contracts that provide general indemnifications. A fund's maximum exposure under these arrangements is unknown as this would be dependent on future claims that may be made against a fund. The risk of material loss from such claims is considered remote.
At the end of the period, the following mutual funds managed by the investment adviser or its affiliates were the owners of record of 10% or more of the total outstanding shares.
| | Strategic Advisers Fidelity International Fund | Strategic Advisers International Fund |
| Fidelity Japan Fund | 47% | 19% |
Mutual funds managed by the investment adviser or its affiliates, in aggregate, were the owners of record of more than 20% of the total outstanding shares.
| Fund | % of shares held |
| Fidelity Japan Fund | 67% |
12. Risk and Uncertainties.
Many factors affect a fund's performance. Developments that disrupt global economies and financial markets, such as pandemics, epidemics, outbreaks of infectious diseases, war, terrorism, and environmental disasters, may significantly affect a fund's investment performance. The effects of these developments to a fund will be impacted by the types of securities in which a fund invests, the financial condition, industry, economic sector, and geographic location of an issuer, and a fund's level of investment in the securities of that issuer. Significant concentrations in security types, issuers, industries, sectors, and geographic locations may magnify the factors that affect a fund's performance.
Average annual total return reflects the change in the value of an investment, assuming reinvestment of distributions from dividend income and capital gains (the profits earned upon the sale of securities that have grown in value, if any) and assuming a constant rate of performance each year. The hypothetical investment and the average annual total returns do not reflect the deduction of taxes that a shareholder would pay on fund distributions or the redemption of fund shares. During periods of reimbursement by Fidelity, a fund's total return will be greater than it would be had the reimbursement not occurred. How a fund did yesterday is no guarantee of how it will do tomorrow.
| Average Annual Total Returns |
| | | | |
Periods ended October 31, 2023 | Past 1 year | Past 5 years | Past 10 years |
| Fidelity® Japan Smaller Companies Fund | 9.76% | 0.55% | 3.77% |
| $10,000 Over 10 Years |
| |
Let's say hypothetically that $10,000 was invested in Fidelity® Japan Smaller Companies Fund on October 31, 2013. The chart shows how the value of your investment would have changed, and also shows how the Russell/Nomura Mid-Small Cap™ Index performed over the same period. |
|
|
Fidelity® Japan Smaller Companies Fund
Market Recap:
International (non-U.S.) equities gained 12.27% for the 12 months ending October 31, 2023, according to the MSCI ACWI (All Country World Index) ex USA Index, as global economic expansion and a slowing in the pace of inflation in some markets provided a favorable backdrop for risk assets. After returning -15.86% in 2022, the index's upturn has been largely driven by a narrow set of companies in the information technology and communication services sectors, in part due to excitement for generative artificial intelligence applications. The index gained 14.07% year to date through July, including strong gains in both June (+4.50%) and July (+4.07%). The rally for international equities sputtered the next three months (-11.33%) amid a stalling pattern in disinflationary trends, heightened global recession and geopolitical risks, soaring yields on longer-term U.S. government bonds and particularly weak economic conditions in the eurozone and China. The three-month decline left non-U.S. stocks up 1.15% year to date through October. Currency fluctuation also helped bolster non-U.S. equity performance overall. For the full 12 months, nearly all regions advanced, with Europe ex U.K. (+18%) and Japan (+17%) leading, whereas Canada (-0.38%) lagged by the widest margin. Each of the 11 sectors advanced, with information technology (+21%) and consumer discretionary (+19%) leading the way. Energy and industrials each rose about 14%. Conversely, four defensive-oriented sectors lagged by the widest margin: real estate (+4%), health care (+6%), consumer staples (+7%) and utilities (+8%).
Comments from Portfolio Manager Masaki Nakamura:
For the fiscal year ending October 31, 2023, the fund gained 9.76%, versus 16.18% for both the broad-based Russell/Nomura Mid Small Cap Japan Index (Gross) and the Fidelity Japan Smaller Companies Blend Index. By sector, security selection was the primary detractor, especially within industrials. Stock picking in information technology, primarily within software & services, also hurt, as did selection in real estate and health care. The fund's position in cash further detracted. The biggest individual relative detractor was an overweight in Kakaku.com (-42%), and the second-largest relative detractor was an overweight in Relo Group (-30%). An overweight in Money Forward (-13%) also hurt. In contrast, by sector, the biggest contributor to performance versus the benchmark was an underweight in health care, primarily within the pharmaceuticals, biotechnology & life sciences industry. Stock picks in materials and overall positioning in energy also boosted relative performance. The top individual relative contributor was an overweight in Kansai Electric Power (+71%). The stock was among the fund's biggest holdings. A second notable contributor was an overweight in Renesas Electronics (+54%), the fund's top holding the past 12 months. An overweight in Yamato Kogyo (+70%), another of the fund's largest holdings, also helped. Notable changes in positioning the past 12 months include decreased exposure to cash and information technology stocks, and higher allocations to the energy, materials and consumer staples sectors.
The views expressed above reflect those of the portfolio manager(s) only through the end of the period as stated on the cover of this report and do not necessarily represent the views of Fidelity or any other person in the Fidelity organization. Any such views are subject to change at any time based upon market or other conditions and Fidelity disclaims any responsibility to update such views. These views may not be relied on as investment advice and, because investment decisions for a Fidelity fund are based on numerous factors, may not be relied on as an indication of trading intent on behalf of any Fidelity fund.
Fidelity® Japan Smaller Companies Fund
Top Holdings (% of Fund's net assets) |
| |
| INPEX Corp. (Oil, Gas & Consumable Fuels) | 3.5 | |
| Renesas Electronics Corp. (Semiconductors & Semiconductor Equipment) | 2.8 | |
| Yamato Kogyo Co. Ltd. (Metals & Mining) | 2.3 | |
| T&D Holdings, Inc. (Insurance) | 2.1 | |
| Suzuki Motor Corp. (Automobiles) | 1.9 | |
| Kansai Electric Power Co., Inc. (Electric Utilities) | 1.9 | |
| Central Automotive Products Ltd. (Distributors) | 1.8 | |
| Asahi Group Holdings (Beverages) | 1.8 | |
| Amano Corp. (Electronic Equipment, Instruments & Components) | 1.8 | |
| Kyoto Financial Group, Inc. (Banks) | 1.7 | |
| | 21.6 | |
| |
| Market Sectors (% of Fund's net assets) |
| |
| Industrials | 21.8 | |
| Information Technology | 17.5 | |
| Consumer Discretionary | 15.9 | |
| Financials | 10.3 | |
| Materials | 9.5 | |
| Consumer Staples | 6.2 | |
| Energy | 4.5 | |
| Communication Services | 4.2 | |
| Utilities | 3.2 | |
| Health Care | 2.0 | |
| Real Estate | 1.6 | |
| |
Asset Allocation (% of Fund's net assets) |
|
|
Geographic Diversification (% of Fund's net assets) |
|
* Includes Short-Term investments and Net Other Assets (Liabilities). Percentages are adjusted for the effect of derivatives, if applicable. |
| |
Fidelity® Japan Smaller Companies Fund
Showing Percentage of Net Assets
| Common Stocks - 96.7% |
| | | Shares | Value ($) |
| COMMUNICATION SERVICES - 4.2% | | | |
| Diversified Telecommunication Services - 0.7% | | | |
| JTOWER, Inc. (a)(b) | | 89,100 | 3,242,444 |
| Entertainment - 2.6% | | | |
| Capcom Co. Ltd. | | 207,700 | 6,685,723 |
| Daiichikosho Co. Ltd. | | 301,800 | 4,461,045 |
| | | | 11,146,768 |
| Interactive Media & Services - 0.9% | | | |
| Kakaku.com, Inc. | | 382,700 | 3,690,948 |
TOTAL COMMUNICATION SERVICES | | | 18,080,160 |
| CONSUMER DISCRETIONARY - 15.9% | | | |
| Automobile Components - 1.2% | | | |
| DENSO Corp. | | 175,600 | 2,592,968 |
| Shoei Co. Ltd. | | 215,300 | 2,868,607 |
| | | | 5,461,575 |
| Automobiles - 3.2% | | | |
| Isuzu Motors Ltd. | | 511,200 | 5,700,213 |
| Suzuki Motor Corp. | | 209,900 | 8,146,641 |
| | | | 13,846,854 |
| Broadline Retail - 1.6% | | | |
| Pan Pacific International Holdings Ltd. | | 350,200 | 6,781,925 |
| Distributors - 1.8% | | | |
| Central Automotive Products Ltd. | | 355,300 | 7,957,529 |
| Hotels, Restaurants & Leisure - 1.4% | | | |
| Koshidaka Holdings Co. Ltd. | | 876,800 | 6,238,111 |
| Household Durables - 0.5% | | | |
| Open House Group Co. Ltd. | | 65,200 | 2,149,015 |
| Leisure Products - 2.2% | | | |
| Bandai Namco Holdings, Inc. | | 203,300 | 4,212,074 |
| Roland Corp. | | 136,500 | 3,946,757 |
| YONEX Co. Ltd. | | 140,400 | 1,521,072 |
| | | | 9,679,903 |
| Specialty Retail - 4.0% | | | |
| ABC-MART, Inc. | | 273,000 | 4,228,508 |
| Fast Retailing Co. Ltd. | | 25,400 | 5,623,469 |
| Fuji Corp. (b) | | 655,400 | 7,390,236 |
| | | | 17,242,213 |
TOTAL CONSUMER DISCRETIONARY | | | 69,357,125 |
| CONSUMER STAPLES - 6.2% | | | |
| Beverages - 1.8% | | | |
| Asahi Group Holdings | | 217,700 | 7,874,299 |
| Consumer Staples Distribution & Retail - 1.1% | | | |
| Kobe Bussan Co. Ltd. (b) | | 194,300 | 4,808,546 |
| Food Products - 2.5% | | | |
| Ajinomoto Co., Inc. | | 178,500 | 6,519,299 |
| Kotobuki Spirits Co. Ltd. | | 332,500 | 4,415,263 |
| | | | 10,934,562 |
| Personal Care Products - 0.8% | | | |
| Shiseido Co. Ltd. | | 109,200 | 3,463,330 |
TOTAL CONSUMER STAPLES | | | 27,080,737 |
| ENERGY - 4.5% | | | |
| Oil, Gas & Consumable Fuels - 4.5% | | | |
| ENEOS Holdings, Inc. | | 1,218,700 | 4,515,792 |
| INPEX Corp. | | 1,043,500 | 15,142,098 |
| | | | 19,657,890 |
| FINANCIALS - 10.3% | | | |
| Banks - 4.0% | | | |
| Fukuoka Financial Group, Inc. | | 247,300 | 6,537,064 |
| Hokuhoku Financial Group, Inc. | | 282,100 | 3,293,541 |
| Kyoto Financial Group, Inc. | | 131,100 | 7,432,559 |
| | | | 17,263,164 |
| Consumer Finance - 1.1% | | | |
| Credit Saison Co. Ltd. | | 332,400 | 4,982,613 |
| Financial Services - 0.7% | | | |
| Zenkoku Hosho Co. Ltd. | | 91,800 | 2,935,606 |
| Insurance - 4.5% | | | |
| Lifenet Insurance Co. (a) | | 358,200 | 2,288,863 |
| Sompo Holdings, Inc. | | 76,100 | 3,296,650 |
| T&D Holdings, Inc. | | 519,300 | 9,263,909 |
| Tokio Marine Holdings, Inc. | | 221,200 | 4,948,739 |
| | | | 19,798,161 |
TOTAL FINANCIALS | | | 44,979,544 |
| HEALTH CARE - 2.0% | | | |
| Health Care Providers & Services - 0.5% | | | |
| As One Corp. | | 60,200 | 1,918,568 |
| Pharmaceuticals - 1.5% | | | |
| Eisai Co. Ltd. | | 63,200 | 3,348,232 |
| Santen Pharmaceutical Co. Ltd. | | 387,700 | 3,362,735 |
| | | | 6,710,967 |
TOTAL HEALTH CARE | | | 8,629,535 |
| INDUSTRIALS - 21.8% | | | |
| Construction & Engineering - 0.8% | | | |
| Raito Kogyo Co. Ltd. | | 271,000 | 3,507,791 |
| Electrical Equipment - 2.1% | | | |
| Fuji Electric Co. Ltd. | | 115,200 | 4,386,198 |
| SWCC Showa Holdings Co. Ltd. | | 331,700 | 4,612,060 |
| | | | 8,998,258 |
| Ground Transportation - 1.3% | | | |
| Kyushu Railway Co. | | 285,200 | 5,831,284 |
| Machinery - 3.6% | | | |
| CKD Corp. | | 289,500 | 3,640,621 |
| IHI Corp. | | 209,600 | 4,022,680 |
| Minebea Mitsumi, Inc. | | 310,000 | 4,860,584 |
| Misumi Group, Inc. | | 206,237 | 3,122,153 |
| | | | 15,646,038 |
| Marine Transportation - 1.1% | | | |
| Nippon Concept Corp. | | 397,900 | 4,689,063 |
| Professional Services - 7.0% | | | |
| BayCurrent Consulting, Inc. | | 130,700 | 3,281,453 |
| Funai Soken Holdings, Inc. | | 344,480 | 5,661,842 |
| Open Up Group, Inc. | | 341,200 | 4,232,200 |
| Rise Consulting Group, Inc. | | 329,300 | 1,868,321 |
| TechnoPro Holdings, Inc. | | 243,600 | 4,825,923 |
| TKC Corp. | | 206,900 | 4,826,361 |
| Visional, Inc. (a) | | 117,100 | 5,739,678 |
| | | | 30,435,778 |
| Trading Companies & Distributors - 4.4% | | | |
| Hanwa Co. Ltd. | | 165,850 | 4,999,235 |
| Inaba Denki Sangyo Co. Ltd. | | 202,600 | 4,224,796 |
| Itochu Corp. | | 125,700 | 4,527,844 |
| Mitani Shoji Co. Ltd. | | 290,300 | 2,660,973 |
| Senshu Electric Co. Ltd. (b) | | 147,600 | 3,036,611 |
| | | | 19,449,459 |
| Transportation Infrastructure - 1.5% | | | |
| Kamigumi Co. Ltd. | | 314,700 | 6,384,178 |
TOTAL INDUSTRIALS | | | 94,941,849 |
| INFORMATION TECHNOLOGY - 17.5% | | | |
| Electronic Equipment, Instruments & Components - 7.2% | | | |
| Amano Corp. | | 379,300 | 7,747,705 |
| Azbil Corp. | | 152,000 | 4,491,398 |
| Dexerials Corp. | | 167,000 | 3,809,324 |
| Ibiden Co. Ltd. | | 89,700 | 3,824,490 |
| Kohoku Kogyo Co. Ltd. (b) | | 44,500 | 1,413,596 |
| Maruwa Ceramic Co. Ltd. | | 36,200 | 6,351,779 |
| Shibaura Electronics Co. Ltd. | | 94,300 | 3,525,018 |
| | | | 31,163,310 |
| IT Services - 3.8% | | | |
| Argo Graphics, Inc. | | 244,500 | 5,358,321 |
| GMO Internet, Inc. | | 192,500 | 2,803,720 |
| Net One Systems Co. Ltd. | | 217,000 | 3,312,055 |
| NSD Co. Ltd. | | 303,900 | 5,287,523 |
| | | | 16,761,619 |
| Semiconductors & Semiconductor Equipment - 3.8% | | | |
| Renesas Electronics Corp. (a) | | 907,300 | 11,917,948 |
| Sumco Corp. | | 348,057 | 4,497,646 |
| | | | 16,415,594 |
| Software - 1.7% | | | |
| Jastec Co. Ltd. | | 11,100 | 113,839 |
| Money Forward, Inc. (a) | | 286,000 | 7,223,797 |
| | | | 7,337,636 |
| Technology Hardware, Storage & Peripherals - 1.0% | | | |
| FUJIFILM Holdings Corp. | | 79,800 | 4,364,885 |
TOTAL INFORMATION TECHNOLOGY | | | 76,043,044 |
| MATERIALS - 9.5% | | | |
| Chemicals - 5.1% | | | |
| C. Uyemura & Co. Ltd. | | 98,000 | 5,320,924 |
| Fujimi, Inc. | | 186,600 | 3,724,881 |
| NOF Corp. | | 127,700 | 5,037,886 |
| Osaka Soda Co. Ltd. | | 80,400 | 4,721,941 |
| Tokyo Ohka Kogyo Co. Ltd. | | 61,900 | 3,576,632 |
| | | | 22,382,264 |
| Construction Materials - 0.9% | | | |
| Maeda Kosen Co. Ltd. | | 190,000 | 3,701,513 |
| Metals & Mining - 3.5% | | | |
| Dowa Holdings Co. Ltd. | | 167,700 | 5,126,649 |
| Yamato Kogyo Co. Ltd. | | 215,700 | 10,334,361 |
| | | | 15,461,010 |
TOTAL MATERIALS | | | 41,544,787 |
| REAL ESTATE - 1.6% | | | |
| Equity Real Estate Investment Trusts (REITs) - 0.5% | | | |
| Invincible Investment Corp. | | 6,000 | 2,307,602 |
| Real Estate Management & Development - 1.1% | | | |
| Relo Group, Inc. | | 484,915 | 4,807,487 |
TOTAL REAL ESTATE | | | 7,115,089 |
| UTILITIES - 3.2% | | | |
| Electric Utilities - 1.9% | | | |
| Kansai Electric Power Co., Inc. | | 628,800 | 8,051,056 |
| Gas Utilities - 1.3% | | | |
| Nippon Gas Co. Ltd. | | 387,700 | 5,826,938 |
TOTAL UTILITIES | | | 13,877,994 |
| TOTAL COMMON STOCKS (Cost $387,072,883) | | | 421,307,754 |
| | | | |
| Money Market Funds - 3.0% |
| | | Shares | Value ($) |
| Fidelity Cash Central Fund 5.40% (c) | | 163,509 | 163,542 |
| Fidelity Securities Lending Cash Central Fund 5.40% (c)(d) | | 13,156,777 | 13,158,092 |
| TOTAL MONEY MARKET FUNDS (Cost $13,321,634) | | | 13,321,634 |
| | | | |
| TOTAL INVESTMENT IN SECURITIES - 99.7% (Cost $400,394,517) | 434,629,388 |
NET OTHER ASSETS (LIABILITIES) - 0.3% | 1,240,197 |
| NET ASSETS - 100.0% | 435,869,585 |
| | |
Legend
| (b) | Security or a portion of the security is on loan at period end. |
| (c) | Affiliated fund that is generally available only to investment companies and other accounts managed by Fidelity Investments. The rate quoted is the annualized seven-day yield of the fund at period end. A complete unaudited listing of the fund's holdings as of its most recent quarter end is available upon request. In addition, each Fidelity Central Fund's financial statements, which are not covered by the Fund's Report of Independent Registered Public Accounting Firm, are available on the SEC's website or upon request. |
| (d) | Investment made with cash collateral received from securities on loan. |
Affiliated Central Funds
Fiscal year to date information regarding the Fund's investments in Fidelity Central Funds, including the ownership percentage, is presented below.
| Affiliate | Value, beginning of period ($) | Purchases ($) | Sales Proceeds ($) | Dividend Income ($) | Realized Gain (loss) ($) | Change in Unrealized appreciation (depreciation) ($) | Value, end of period ($) | % ownership, end of period |
| Fidelity Cash Central Fund 5.40% | 14,224,205 | 48,431,718 | 62,492,381 | 211,233 | - | - | 163,542 | 0.0% |
| Fidelity Securities Lending Cash Central Fund 5.40% | 2,325,000 | 185,892,249 | 175,059,157 | 204,416 | - | - | 13,158,092 | 0.1% |
| Total | 16,549,205 | 234,323,967 | 237,551,538 | 415,649 | - | - | 13,321,634 | |
| | | | | | | | | |
Amounts in the dividend income column in the above table include any capital gain distributions from underlying funds, which are presented in the corresponding line item in the Statement of Operations, if applicable.
Amounts in the dividend income column for Fidelity Securities Lending Cash Central Fund represents the income earned on investing cash collateral, less rebates paid to borrowers and any lending agent fees associated with the loan, plus any premium payments received for lending certain types of securities.
Amounts included in the purchases and sales proceeds columns may include in-kind transactions, if applicable.
Investment Valuation
The following is a summary of the inputs used, as of October 31, 2023, involving the Fund's assets and liabilities carried at fair value. The inputs or methodology used for valuing securities may not be an indication of the risk associated with investing in those securities. For more information on valuation inputs, and their aggregation into the levels used below, please refer to the Investment Valuation section in the accompanying Notes to Financial Statements.
| Valuation Inputs at Reporting Date: |
| Description | Total ($) | Level 1 ($) | Level 2 ($) | Level 3 ($) |
Investments in Securities: | | | | |
|
| Equities: | | | | |
Communication Services | 18,080,160 | - | 18,080,160 | - |
Consumer Discretionary | 69,357,125 | - | 69,357,125 | - |
Consumer Staples | 27,080,737 | - | 27,080,737 | - |
Energy | 19,657,890 | - | 19,657,890 | - |
Financials | 44,979,544 | - | 44,979,544 | - |
Health Care | 8,629,535 | - | 8,629,535 | - |
Industrials | 94,941,849 | - | 94,941,849 | - |
Information Technology | 76,043,044 | - | 76,043,044 | - |
Materials | 41,544,787 | - | 41,544,787 | - |
Real Estate | 7,115,089 | - | 7,115,089 | - |
Utilities | 13,877,994 | - | 13,877,994 | - |
|
| Money Market Funds | 13,321,634 | 13,321,634 | - | - |
| Total Investments in Securities: | 434,629,388 | 13,321,634 | 421,307,754 | - |
Fidelity® Japan Smaller Companies Fund
| Statement of Assets and Liabilities |
| | | | October 31, 2023 |
| | | | | |
| Assets | | | | |
| Investment in securities, at value (including securities loaned of $12,464,591) - See accompanying schedule: | | | | |
Unaffiliated issuers (cost $387,072,883) | $ | 421,307,754 | | |
Fidelity Central Funds (cost $13,321,634) | | 13,321,634 | | |
| | | | | |
| | | | | |
| Total Investment in Securities (cost $400,394,517) | | | $ | 434,629,388 |
| Cash | | | | 7,047 |
| Foreign currency held at value (cost $13,005,024) | | | | 12,624,551 |
| Receivable for investments sold | | | | 92,337 |
| Receivable for fund shares sold | | | | 2,407 |
| Dividends receivable | | | | 2,871,899 |
| Distributions receivable from Fidelity Central Funds | | | | 21,838 |
| Prepaid expenses | | | | 559 |
Total assets | | | | 450,250,026 |
| Liabilities | | | | |
| Payable for investments purchased | $ | 570,625 | | |
| Payable for fund shares redeemed | | 261,381 | | |
| Accrued management fee | | 250,118 | | |
| Other affiliated payables | | 79,765 | | |
| Other payables and accrued expenses | | 60,460 | | |
| Collateral on securities loaned | | 13,158,092 | | |
| Total Liabilities | | | | 14,380,441 |
| Net Assets | | | $ | 435,869,585 |
| Net Assets consist of: | | | | |
| Paid in capital | | | $ | 402,979,000 |
| Total accumulated earnings (loss) | | | | 32,890,585 |
| Net Assets | | | $ | 435,869,585 |
Net Asset Value, offering price and redemption price per share ($435,869,585 ÷ 31,858,961 shares) | | | $ | 13.68 |
| Statement of Operations |
| | | | Year ended October 31, 2023 |
| Investment Income | | | | |
| Dividends | | | $ | 9,585,415 |
| Income from Fidelity Central Funds (including $204,416 from security lending) | | | | 415,649 |
| Income before foreign taxes withheld | | | $ | 10,001,064 |
| Less foreign taxes withheld | | | | (961,874) |
| Total Income | | | | 9,039,190 |
| Expenses | | | | |
| Management fee | $ | 2,815,137 | | |
| Transfer agent fees | | 663,405 | | |
| Accounting fees | | 207,781 | | |
| Custodian fees and expenses | | 33,691 | | |
| Independent trustees' fees and expenses | | 2,314 | | |
| Registration fees | | 37,807 | | |
| Audit | | 58,386 | | |
| Legal | | 395 | | |
| Miscellaneous | | 1,626 | | |
| Total expenses before reductions | | 3,820,542 | | |
| Expense reductions | | (25,670) | | |
| Total expenses after reductions | | | | 3,794,872 |
| Net Investment income (loss) | | | | 5,244,318 |
| Realized and Unrealized Gain (Loss) | | | | |
| Net realized gain (loss) on: | | | | |
| Investment Securities: | | | | |
| Unaffiliated issuers | | 18,255,563 | | |
| Foreign currency transactions | | (954,070) | | |
| Total net realized gain (loss) | | | | 17,301,493 |
| Change in net unrealized appreciation (depreciation) on: | | | | |
| Investment Securities: | | | | |
| Unaffiliated issuers | | 7,881,385 | | |
| Assets and liabilities in foreign currencies | | (275,164) | | |
| Total change in net unrealized appreciation (depreciation) | | | | 7,606,221 |
| Net gain (loss) | | | | 24,907,714 |
| Net increase (decrease) in net assets resulting from operations | | | $ | 30,152,032 |
| Statement of Changes in Net Assets |
| |
| | Year ended October 31, 2023 | | Year ended October 31, 2022 |
| Increase (Decrease) in Net Assets | | | | |
| Operations | | | | |
| Net investment income (loss) | $ | 5,244,318 | $ | 5,662,274 |
| Net realized gain (loss) | | 17,301,493 | | (1,219,316) |
| Change in net unrealized appreciation (depreciation) | | 7,606,221 | | (112,241,112) |
| Net increase (decrease) in net assets resulting from operations | | 30,152,032 | | (107,798,154) |
| Distributions to shareholders | | (198,124) | | (52,717,138) |
| | | | | |
| Share transactions | | | | |
| Proceeds from sales of shares | | 104,318,260 | | 11,321,055 |
| Reinvestment of distributions | | 192,250 | | 51,177,635 |
| Cost of shares redeemed | | (63,019,461) | | (38,772,821) |
| | | | | |
Net increase (decrease) in net assets resulting from share transactions | | 41,491,049 | | 23,725,869 |
| Total increase (decrease) in net assets | | 71,444,957 | | (136,789,423) |
| | | | | |
| Net Assets | | | | |
| Beginning of period | | 364,424,628 | | 501,214,051 |
| End of period | $ | 435,869,585 | $ | 364,424,628 |
| | | | | |
| Other Information | | | | |
| Shares | | | | |
| Sold | | 7,080,855 | | 811,228 |
| Issued in reinvestment of distributions | | 14,575 | | 3,289,051 |
| Redeemed | | (4,466,160) | | (2,841,225) |
| Net increase (decrease) | | 2,629,270 | | 1,259,054 |
| | | | | |
Financial Highlights
| Fidelity® Japan Smaller Companies Fund |
| |
| Years ended October 31, | | 2023 | | 2022 | | 2021 | | 2020 | | 2019 |
Selected Per-Share Data | | | | | | | | | | |
| Net asset value, beginning of period | $ | 12.47 | $ | 17.92 | $ | 16.64 | $ | 17.60 | $ | 17.12 |
| Income from Investment Operations | | | | | | | | | | |
Net investment income (loss) A,B | | .18 | | .19 | | .20 | | .16 | | .22 |
| Net realized and unrealized gain (loss) | | 1.04 | | (3.75) | | 1.36 | | .11 | | 1.10 |
| Total from investment operations | | 1.22 | | (3.56) | | 1.56 | | .27 | | 1.32 |
| Distributions from net investment income | | (.01) | | (.51) | | (.19) | | (.23) | | (.11) |
| Distributions from net realized gain | | - | | (1.38) | | (.10) | | (1.00) | | (.73) |
| Total distributions | | (.01) | | (1.89) | | (.28) C | | (1.23) | | (.84) |
| Net asset value, end of period | $ | 13.68 | $ | 12.47 | $ | 17.92 | $ | 16.64 | $ | 17.60 |
Total Return D | | 9.76% | | (21.95)% | | 9.44% | | 1.31% | | 8.22% |
Ratios to Average Net Assets B,E,F | | | | | | | | | | |
| Expenses before reductions | | .92% | | .91% | | .91% | | .92% | | .93% |
| Expenses net of fee waivers, if any | | .91% | | .91% | | .91% | | .92% | | .93% |
| Expenses net of all reductions | | .91% | | .91% | | .91% | | .92% | | .93% |
| Net investment income (loss) | | 1.26% | | 1.33% | | 1.13% | | 1.02% | | 1.31% |
| Supplemental Data | | | | | | | | | | |
| Net assets, end of period (000 omitted) | $ | 435,870 | $ | 364,425 | $ | 501,214 | $ | 523,774 | $ | 685,651 |
Portfolio turnover rate G | | 36% | | 38% | | 23% | | 20% | | 16% |
ACalculated based on average shares outstanding during the period.
BNet investment income (loss) is affected by the timing of the declaration of dividends by any underlying mutual funds or exchange-traded funds (ETFs). Net investment income (loss) of any mutual funds or ETFs is not included in the Fund's net investment income (loss) ratio.
CTotal distributions per share do not sum due to rounding.
DTotal returns would have been lower if certain expenses had not been reduced during the applicable periods shown.
EFees and expenses of any underlying mutual funds or exchange-traded funds (ETFs) are not included in the Fund's expense ratio. The Fund indirectly bears its proportionate share of these expenses. For additional expense information related to investments in Fidelity Central Funds, please refer to the "Investments in Fidelity Central Funds" note found in the Notes to Financial Statements section of the most recent Annual or Semi-Annual report.
FExpense ratios reflect operating expenses of the class. Expenses before reductions do not reflect amounts reimbursed, waived, or reduced through arrangements with the investment adviser, brokerage services, or other offset arrangements, if applicable, and do not represent the amount paid by the class during periods when reimbursements, waivers or reductions occur.
GAmount does not include the portfolio activity of any underlying mutual funds or exchange-traded funds (ETFs).
For the period ended October 31, 2023
1. Organization.
Fidelity Japan Smaller Companies Fund (the Fund) is a fund of Fidelity Investment Trust (the Trust) and is authorized to issue an unlimited number of shares. Share transactions on the Statement of Changes in Net Assets may contain exchanges between affiliated funds. The Trust is registered under the Investment Company Act of 1940, as amended (the 1940 Act), as an open-end management investment company organized as a Massachusetts business trust.
2. Investments in Fidelity Central Funds.
Funds may invest in Fidelity Central Funds, which are open-end investment companies generally available only to other investment companies and accounts managed by the investment adviser and its affiliates. The Schedule of Investments lists any Fidelity Central Funds held as an investment as of period end, but does not include the underlying holdings of each Fidelity Central Fund. An investing fund indirectly bears its proportionate share of the expenses of the underlying Fidelity Central Funds.
Based on its investment objective, each Fidelity Central Fund may invest or participate in various investment vehicles or strategies that are similar to those of the investing fund. These strategies are consistent with the investment objectives of the investing fund and may involve certain economic risks which may cause a decline in value of each of the Fidelity Central Funds and thus a decline in the value of the investing fund.
| Fidelity Central Fund | Investment Manager | Investment Objective | Investment Practices | Expense RatioA |
| Fidelity Money Market Central Funds | Fidelity Management & Research Company LLC (FMR) | Each fund seeks to obtain a high level of current income consistent with the preservation of capital and liquidity. | Short-term Investments | Less than .005% |
A Expenses expressed as a percentage of average net assets and are as of each underlying Central Fund's most recent annual or semi-annual shareholder report.
A complete unaudited list of holdings for each Fidelity Central Fund is available upon request or at the Securities and Exchange Commission website at www.sec.gov. In addition, the financial statements of the Fidelity Central Funds which contain the significant accounting policies (including investment valuation policies) of those funds, and are not covered by the Report of Independent Registered Public Accounting Firm, are available on the Securities and Exchange Commission website or upon request.
3. Significant Accounting Policies.
The Fund is an investment company and applies the accounting and reporting guidance of the Financial Accounting Standards Board (FASB) Accounting Standards Codification Topic 946 Financial Services - Investment Companies. The financial statements have been prepared in conformity with accounting principles generally accepted in the United States of America (GAAP), which require management to make certain estimates and assumptions at the date of the financial statements. Actual results could differ from those estimates. Subsequent events, if any, through the date that the financial statements were issued have been evaluated in the preparation of the financial statements. The Fund's Schedule of Investments lists any underlying mutual funds or exchange-traded funds (ETFs) but does not include the underlying holdings of these funds. The following summarizes the significant accounting policies of the Fund:
Investment Valuation. Investments are valued as of 4:00 p.m. Eastern time on the last calendar day of the period. The Board of Trustees (the Board) has designated the Fund's investment adviser as the valuation designee responsible for the fair valuation function and performing fair value determinations as needed. The investment adviser has established a Fair Value Committee (the Committee) to carry out the day-to-day fair valuation responsibilities and has adopted policies and procedures to govern the fair valuation process and the activities of the Committee. In accordance with these fair valuation policies and procedures, which have been approved by the Board, the Fund attempts to obtain prices from one or more third party pricing services or brokers to value its investments. When current market prices, quotations or currency exchange rates are not readily available or reliable, investments will be fair valued in good faith by the Committee, in accordance with the policies and procedures. Factors used in determining fair value vary by investment type and may include market or investment specific events, transaction data, estimated cash flows, and market observations of comparable investments. The frequency that the fair valuation procedures are used cannot be predicted and they may be utilized to a significant extent. The Committee manages the Fund's fair valuation practices and maintains the fair valuation policies and procedures. The Fund's investment adviser reports to the Board information regarding the fair valuation process and related material matters.
The Fund categorizes the inputs to valuation techniques used to value its investments into a disclosure hierarchy consisting of three levels as shown below:
Level 1 - unadjusted quoted prices in active markets for identical investments
Level 2 - other significant observable inputs (including quoted prices for similar investments, interest rates, prepayment speeds, etc.)
Level 3 - unobservable inputs (including the Fund's own assumptions based on the best information available)
Valuation techniques used to value the Fund's investments by major category are as follows:
Equity securities, including restricted securities, for which market quotations are readily available, are valued at the last reported sale price or official closing price as reported by a third party pricing service on the primary market or exchange on which they are traded and are categorized as Level 1 in the hierarchy. In the event there were no sales during the day or closing prices are not available, securities are valued at the last quoted bid price or may be valued using the last available price and are generally categorized as Level 2 in the hierarchy. For foreign equity securities, when market or security specific events arise, comparisons to the valuation of American Depositary Receipts (ADRs), futures contracts, ETFs and certain indexes as well as quoted prices for similar securities may be used and would be categorized as Level 2 in the hierarchy. For equity securities, including restricted securities, where observable inputs are limited, assumptions about market activity and risk are used and these securities may be categorized as Level 3 in the hierarchy.
Investments in open-end mutual funds, including the Fidelity Central Funds, are valued at their closing net asset value (NAV) each business day and are categorized as Level 1 in the hierarchy.
Changes in valuation techniques may result in transfers in or out of an assigned level within the disclosure hierarchy. The aggregate value of investments by input level as of October 31, 2023 is included at the end of the Fund's Schedule of Investments.
Foreign Currency. Certain Funds may use foreign currency contracts to facilitate transactions in foreign-denominated securities. Gains and losses from these transactions may arise from changes in the value of the foreign currency or if the counterparties do not perform under the contracts' terms.
Foreign-denominated assets, including investment securities, and liabilities are translated into U.S. dollars at the exchange rates at period end. Purchases and sales of investment securities, income and dividends received, and expenses denominated in foreign currencies are translated into U.S. dollars at the exchange rate in effect on the transaction date.
The effects of exchange rate fluctuations on investments are included with the net realized and unrealized gain (loss) on investment securities. Other foreign currency transactions resulting in realized and unrealized gain (loss) are disclosed separately.
Investment Transactions and Income. For financial reporting purposes, the Fund's investment holdings and NAV include trades executed through the end of the last business day of the period. The NAV per share for processing shareholder transactions is calculated as of the close of business of the New York Stock Exchange (NYSE), normally 4:00 p.m. Eastern time and includes trades executed through the end of the prior business day. Gains and losses on securities sold are determined on the basis of identified cost. Commissions paid to certain brokers with whom the investment adviser, or its affiliates, places trades on behalf of a fund include an amount in addition to trade execution, which may be rebated back to a fund. Any such rebates are included in net realized gain (loss) on investments in the Statement of Operations. Dividend income is recorded on the ex-dividend date, except for certain dividends from foreign securities where the ex-dividend date may have passed, which are recorded as soon as the Fund is informed of the ex-dividend date. Non-cash dividends included in dividend income, if any, are recorded at the fair market value of the securities received. Income and capital gain distributions from Fidelity Central Funds, if any, are recorded on the ex-dividend date. Investment income is recorded net of foreign taxes withheld where recovery of such taxes is uncertain. Funds may file withholding tax reclaims in certain jurisdictions to recover a portion of amounts previously withheld. Any withholding tax reclaims income is included in the Statement of Operations in foreign taxes withheld. Any receivables for withholding tax reclaims are included in the Statement of Assets and Liabilities in dividends receivable.
Expenses. Expenses directly attributable to a fund are charged to that fund. Expenses attributable to more than one fund are allocated among the respective funds on the basis of relative net assets or other appropriate methods. Expenses included in the accompanying financial statements reflect the expenses of that fund and do not include any expenses associated with any underlying mutual funds or exchange-traded funds. Although not included in a fund's expenses, a fund indirectly bears its proportionate share of these expenses through the net asset value of each underlying mutual fund or exchange-traded fund. Expense estimates are accrued in the period to which they relate and adjustments are made when actual amounts are known.
Income Tax Information and Distributions to Shareholders. Each year, the Fund intends to qualify as a regulated investment company under Subchapter M of the Internal Revenue Code, including distributing substantially all of its taxable income and realized gains. As a result, no provision for U.S. Federal income taxes is required. As of October 31, 2023, the Fund did not have any unrecognized tax benefits in the financial statements; nor is the Fund aware of any tax positions for which it is reasonably possible that the total amounts of unrecognized tax benefits will significantly change in the next twelve months. The Fund files a U.S. federal tax return, in addition to state and local tax returns as required. The Fund's federal income tax returns are subject to examination by the Internal Revenue Service (IRS) for a period of three fiscal years after they are filed. State and local tax returns may be subject to examination for an additional fiscal year depending on the jurisdiction. Foreign taxes are provided for based on the Fund's understanding of the tax rules and rates that exist in the foreign markets in which it invests.
Distributions are declared and recorded on the ex-dividend date. Income and capital gain distributions are determined in accordance with income tax regulations, which may differ from GAAP. In addition, the Fund claimed a portion of the payment made to redeeming shareholders as a distribution for income tax purposes.
Capital accounts within the financial statements are adjusted for permanent book-tax differences. These adjustments have no impact on net assets or the results of operations. Capital accounts are not adjusted for temporary book-tax differences which will reverse in a subsequent period.
Book-tax differences are primarily due to foreign currency transactions, passive foreign investment companies (PFIC), capital loss carryforwards and losses deferred due to wash sales and excise tax regulations.
As of period end, the cost and unrealized appreciation (depreciation) in securities, and derivatives if applicable, for federal income tax purposes were as follows:
| Gross unrealized appreciation | $63,846,442 |
| Gross unrealized depreciation | (43,408,625) |
| Net unrealized appreciation (depreciation) | $20,437,817 |
| Tax Cost | $414,191,571 |
The tax-based components of distributable earnings as of period end were as follows:
| Undistributed ordinary income | $9,826,055 |
| Undistributed long-term capital gain | $3,046,399 |
| Net unrealized appreciation (depreciation) on securities and other investments | $20,018,132 |
The tax character of distributions paid was as follows:
| | October 31, 2023 | October 31, 2022 |
| Ordinary Income | $198,124 | $16,327,824 |
| Long-term Capital Gains | - | 36,389,314 |
| Total | $198,124 | $ 52,717,138 |
4. Purchases and Sales of Investments.
Purchases and sales of securities, other than short-term securities and in-kind transactions, as applicable, are noted in the table below.
| | Purchases ($) | Sales ($) |
| Fidelity Japan Smaller Companies Fund | 199,961,174 | 146,537,980 |
5. Fees and Other Transactions with Affiliates.
Management Fee. Fidelity Management & Research Company LLC (the investment adviser) and its affiliates provide the Fund with investment management related services for which the Fund pays a monthly management fee. The management fee is the sum of an individual fund fee rate that is based on an annual rate of .45% of the Fund's average net assets and an annualized group fee rate that averaged .23% during the period. The group fee rate is based upon the monthly average net assets of a group of registered investment companies with which the investment adviser has management contracts. The group fee rate decreases as assets under management increase and increases as assets under management decrease. For the reporting period, the total annual management fee rate was .67% of the Fund's average net assets.
Transfer Agent Fees. Fidelity Investments Institutional Operations Company LLC (FIIOC), an affiliate of the investment adviser, is the Fund's transfer, dividend disbursing and shareholder servicing agent. FIIOC receives account fees and asset-based fees that vary according to account size and type of account. FIIOC pays for typesetting, printing and mailing of shareholder reports, except proxy statements. For the period, the transfer agent fees were equivalent to an annual rate of .16% of average net assets.
During November 2023, the Board approved a change in the transfer agent fees effective December 1, 2023 to a fixed annual rate of 0.1535% of average net assets.
Accounting Fees. Fidelity Service Company, Inc. (FSC), an affiliate of the investment adviser, maintains the Fund's accounting records. The accounting fee is based on the level of average net assets for each month. For the period, the fees were equivalent to the following annual rates:
| | % of Average Net Assets |
| Fidelity Japan Smaller Companies Fund | .05 |
During November 2023, the Board approved a change in the accounting fees effective December 1, 2023 to a fixed annual rate of average net assets as follows:
| | % of Average Net Assets |
| Fidelity Japan Smaller Companies Fund | 0.0497 |
Interfund Trades. Funds may purchase from or sell securities to other Fidelity Funds under procedures adopted by the Board. The procedures have been designed to ensure these interfund trades are executed in accordance with Rule 17a-7 of the 1940 Act. Any interfund trades are included within the respective purchases and sales amounts shown in the Purchases and Sales of Investments note. Interfund trades during the period are noted in the table below.
| | Purchases ($) | Sales ($) | Realized Gain (Loss) ($) |
| Fidelity Japan Smaller Companies Fund | 1,845,467 | 5,814,517 | 1,434,309 |
6. Committed Line of Credit.
Certain Funds participate with other funds managed by the investment adviser or an affiliate in a $4.25 billion credit facility (the "line of credit") to be utilized for temporary or emergency purposes to fund shareholder redemptions or for other short-term liquidity purposes. The participating funds have agreed to pay commitment fees on their pro-rata portion of the line of credit, which are reflected in Miscellaneous expenses on the Statement of Operations, and are listed below. During the period, there were no borrowings on this line of credit.
| | Amount |
| Fidelity Japan Smaller Companies Fund | $741 |
7. Security Lending.
Funds lend portfolio securities from time to time in order to earn additional income. Lending agents are used, including National Financial Services (NFS), an affiliate of the investment adviser. Pursuant to a securities lending agreement, NFS will receive a fee, which is capped at 9.9% of a fund's daily lending revenue, for its services as lending agent. A fund may lend securities to certain qualified borrowers, including NFS. On the settlement date of the loan, a fund receives collateral (in the form of U.S. Treasury obligations, letters of credit and/or cash) against the loaned securities and maintains collateral in an amount not less than 100% of the market value of the loaned securities during the period of the loan. The market value of the loaned securities is determined at the close of business of a fund and any additional required collateral is delivered to a fund on the next business day. A fund or borrower may terminate the loan at any time, and if the borrower defaults on its obligation to return the securities loaned because of insolvency or other reasons, a fund may apply collateral received from the borrower against the obligation. A fund may experience delays and costs in recovering the securities loaned. Any cash collateral received is invested in the Fidelity Securities Lending Cash Central Fund. Any loaned securities are identified as such in the Schedule of Investments, and the value of loaned securities and cash collateral at period end, as applicable, are presented in the Statement of Assets and Liabilities. Security lending income represents the income earned on investing cash collateral, less rebates paid to borrowers and any lending agent fees associated with the loan, plus any premium payments received for lending certain types of securities. Security lending income is presented in the Statement of Operations as a component of income from Fidelity Central Funds. Affiliated security lending activity, if any, was as follows:
| | Total Security Lending Fees Paid to NFS | Security Lending Income From Securities Loaned to NFS | Value of Securities Loaned to NFS at Period End |
| Fidelity Japan Smaller Companies Fund | $21,922 | $- | $- |
8. Expense Reductions.
Through arrangements with the Fund's custodian, credits realized as a result of certain uninvested cash balances were used to reduce the Fund's expenses by $146.
In addition, during the period the investment adviser or an affiliate reimbursed and/or waived a portion of operating expenses in the amount of $25,524.
9. Other.
A fund's organizational documents provide former and current trustees and officers with a limited indemnification against liabilities arising in connection with the performance of their duties to the fund. In the normal course of business, a fund may also enter into contracts that provide general indemnifications. A fund's maximum exposure under these arrangements is unknown as this would be dependent on future claims that may be made against a fund. The risk of material loss from such claims is considered remote.
At the end of the period, the following mutual funds managed by the investment adviser or its affiliates were the owners of record of 10% or more of the total outstanding shares.
| | Strategic Advisers International Fund |
| Fidelity Japan Smaller Companies Fund | 17% |
Mutual funds managed by the investment adviser or its affiliates, in aggregate, were the owners of record of more than 20% of the total outstanding shares.
| Fund | % of shares held |
| Fidelity Japan Smaller Companies Fund | 49% |
10. Risk and Uncertainties.
Many factors affect a fund's performance. Developments that disrupt global economies and financial markets, such as pandemics, epidemics, outbreaks of infectious diseases, war, terrorism, and environmental disasters, may significantly affect a fund's investment performance. The effects of these developments to a fund will be impacted by the types of securities in which a fund invests, the financial condition, industry, economic sector, and geographic location of an issuer, and a fund's level of investment in the securities of that issuer. Significant concentrations in security types, issuers, industries, sectors, and geographic locations may magnify the factors that affect a fund's performance.
Average annual total return reflects the change in the value of an investment, assuming reinvestment of distributions from dividend income and capital gains (the profits earned upon the sale of securities that have grown in value, if any) and assuming a constant rate of performance each year. The hypothetical investment and the average annual total returns do not reflect the deduction of taxes that a shareholder would pay on fund distributions or the redemption of fund shares. During periods of reimbursement by Fidelity, a fund's total return will be greater than it would be had the reimbursement not occurred. How a fund did yesterday is no guarantee of how it will do tomorrow.
| Average Annual Total Returns |
| | | | |
Periods ended October 31, 2023 | Past 1 year | Past 5 years | Past 10 years |
Class A (incl. 5.75% sales charge) | -13.36% | -2.25% | -3.79% |
Class M (incl. 3.50% sales charge) | -11.51% | -2.04% | -3.83% |
Class C (incl. contingent deferred sales charge) | -9.62% | -1.83% | -3.80% |
| Fidelity® Latin America Fund | -7.88% | -0.80% | -2.95% |
| Class I | -7.83% | -0.76% | -2.89% |
| Class Z | -7.67% | -0.61% | -2.82% |
Class C shares' contingent deferred sales charges included in the past one year, past five years and past ten years total return figures are 1%, 0% and 0%, respectively.
The initial offering of Class Z shares took place on October 2, 2018. Returns prior to October 2, 2018, are those of Class I.
| $10,000 Over 10 Years |
| |
Let's say hypothetically that $10,000 was invested in Fidelity® Latin America Fund, a class of the fund, on October 31, 2013. The chart shows how the value of your investment would have changed, and also shows how the MSCI EM (Emerging Markets) Latin America Index performed over the same period. |
|
|
Fidelity® Latin America Fund
Market Recap:
International (non-U.S.) equities gained 12.27% for the 12 months ending October 31, 2023, according to the MSCI ACWI (All Country World Index) ex USA Index, as global economic expansion and a slowing in the pace of inflation in some markets provided a favorable backdrop for risk assets. After returning -15.86% in 2022, the index's upturn has been largely driven by a narrow set of companies in the information technology and communication services sectors, in part due to excitement for generative artificial intelligence applications. The index gained 14.07% year to date through July, including strong gains in both June (+4.50%) and July (+4.07%). The rally for international equities sputtered the next three months (-11.33%) amid a stalling pattern in disinflationary trends, heightened global recession and geopolitical risks, soaring yields on longer-term U.S. government bonds and particularly weak economic conditions in the eurozone and China. The three-month decline left non-U.S. stocks up 1.15% year to date through October. Currency fluctuation also helped bolster non-U.S. equity performance overall. For the full 12 months, nearly all regions advanced, with Europe ex U.K. (+18%) and Japan (+17%) leading, whereas Canada (-0.38%) lagged by the widest margin. Each of the 11 sectors advanced, with information technology (+21%) and consumer discretionary (+19%) leading the way. Energy and industrials each rose about 14%. Conversely, four defensive-oriented sectors lagged by the widest margin: real estate (+4%), health care (+6%), consumer staples (+7%) and utilities (+8%).
Comments from Portfolio Manager Will Pruett:
For the fiscal year ending October 31, 2023, the fund's share classes (excluding sales charges, if applicable) returned about -9% to -8%, versus 3.98% for the benchmark MSCI Emerging Markets Latin America Net MA Index. From a regional standpoint, stock picks in Brazil and Peru, and a non-benchmark allocation to Developed Markets detracted from the fund's relative result. By sector, market selection was the primary detractor, with substantial overweight positions in health care and consumer discretionary, the benchmark's two weakest-performing sectors, hurting the fund's relative result. Stock selection in consumer staples, primarily within the consumer staples distribution & retail industry, also hurt, as did stock picking in industrials, primarily within the transportation industry. The fund's non-benchmark stake in Vamos Locacao de Caminhoes Maquinas e Equipamentos, one of our biggest holdings, returned -48% and was the largest individual relative detractor. A second notable relative detractor was an overweight in Hypera Pharma (-38%), which was also among our biggest holdings. An overweight in Atacadao (-52%) also hurt. In contrast, from a regional standpoint, an underweight in Chile contributed to the fund's performance versus the benchmark. By sector, security selection in health care, financials and consumer discretionary all boosted the fund's relative performance. The fund's non-benchmark stake in Qualitas Controladora gained 121% and was the top individual relative contributor. The stock was among the fund's largest holdings this period, though we decreased our investment during the 12 months. A non-benchmark stake in Caixa Seguridade Participacoes gained 44% and was the second-largest relative contributor; the stock was among the fund's biggest holdings at period end. An underweight in Banco Bradesco (-21%) also helped. Notable changes in positioning include a higher allocation to Mexico, increased exposure to the consumer staples sector and a lower allocation to industrials.
The views expressed above reflect those of the portfolio manager(s) only through the end of the period as stated on the cover of this report and do not necessarily represent the views of Fidelity or any other person in the Fidelity organization. Any such views are subject to change at any time based upon market or other conditions and Fidelity disclaims any responsibility to update such views. These views may not be relied on as investment advice and, because investment decisions for a Fidelity fund are based on numerous factors, may not be relied on as an indication of trading intent on behalf of any Fidelity fund.
Fidelity® Latin America Fund
Top Holdings (% of Fund's net assets) |
| |
| Petroleo Brasileiro SA - Petrobras (PN) (non-vtg.) (Brazil, Oil, Gas & Consumable Fuels) | 14.2 | |
| Genomma Lab Internacional SA de CV (Mexico, Pharmaceuticals) | 8.5 | |
| Afya Ltd. (Brazil, Diversified Consumer Services) | 6.4 | |
| Hypera SA (Brazil, Pharmaceuticals) | 4.9 | |
| Vamos Locacao de Caminhoes Maquinas e Equipamentos SA (Brazil, Ground Transportation) | 4.3 | |
| Itausa-Investimentos Itau SA (PN) (Brazil, Banks) | 4.2 | |
| Caixa Seguridade Participacoes (Brazil, Insurance) | 4.2 | |
| Equatorial Energia SA (Brazil, Electric Utilities) | 4.2 | |
| Sendas Distribuidora SA (Brazil, Consumer Staples Distribution & Retail) | 3.8 | |
| XP, Inc. Class A (Brazil, Capital Markets) | 3.8 | |
| | 58.5 | |
| |
| Market Sectors (% of Fund's net assets) |
| |
| Financials | 28.5 | |
| Health Care | 17.5 | |
| Energy | 14.2 | |
| Industrials | 9.4 | |
| Consumer Discretionary | 9.3 | |
| Consumer Staples | 8.8 | |
| Materials | 7.2 | |
| Utilities | 4.2 | |
| |
Market Sectors may include more than one industry category.
The Fund may invest up to 35% of its total assets in any industry that represents more than 20% of the Latin American market. As of October 31, 2023, the Fund did not have more than 25% of its total assets invested in any one industry.
Asset Allocation (% of Fund's net assets) |
|
|
Geographic Diversification (% of Fund's net assets) |
|
* Includes Short-Term investments and Net Other Assets (Liabilities). Percentages are adjusted for the effect of derivatives, if applicable. |
| |
Fidelity® Latin America Fund
Showing Percentage of Net Assets
| Common Stocks - 76.7% |
| | | Shares | Value ($) |
| Brazil - 46.1% | | | |
| Afya Ltd. (a)(b) | | 961,853 | 15,485,833 |
| Atacadao SA | | 4,136,833 | 7,360,022 |
| Caixa Seguridade Participacoes | | 4,721,442 | 10,132,593 |
| CM Hospitalar SA | | 1,282,043 | 3,786,308 |
| Equatorial Energia SA | | 1,607,886 | 10,077,691 |
| Hapvida Participacoes e Investimentos SA (a)(c) | | 8,030,761 | 5,877,623 |
| Hypera SA (a) | | 1,955,962 | 11,751,096 |
| Itausa-Investimentos Itau SA | | 90,365 | 153,782 |
| Localiza Rent a Car SA | | 637,415 | 6,431,358 |
| Localiza Rent a Car SA rights 11/10/23 (a) | | 4,674 | 6,489 |
| PagSeguro Digital Ltd. (a) | | 559,572 | 3,950,578 |
| Sendas Distribuidora SA | | 4,231,165 | 9,181,127 |
| Vamos Locacao de Caminhoes Maquinas e Equipamentos SA | | 6,620,995 | 10,282,618 |
| Vasta Platform Ltd. (a)(b) | | 1,725,714 | 6,971,885 |
| XP, Inc. Class A | | 457,387 | 9,147,740 |
TOTAL BRAZIL | | | 110,596,743 |
| Mexico - 24.8% | | | |
| Banco del Bajio SA (c) | | 2,016,201 | 6,170,834 |
| Becle S.A.B. de CV | | 2,558,104 | 4,510,629 |
| GCC S.A.B. de CV | | 799,714 | 7,120,644 |
| Genomma Lab Internacional SA de CV | | 27,433,769 | 20,572,664 |
| Grupo Aeroportuario Norte S.A.B. de CV | | 760,457 | 5,805,186 |
| Qualitas Controladora S.A.B. de CV | | 991,260 | 8,187,283 |
| Regional S.A.B. de CV | | 948,024 | 7,211,797 |
TOTAL MEXICO | | | 59,579,037 |
| Peru - 3.5% | | | |
| Intercorp Financial Services, Inc. (b) | | 448,354 | 8,420,088 |
| Sweden - 0.9% | | | |
| VEF AB (a) | | 14,010,796 | 2,237,972 |
| Zambia - 1.4% | | | |
| First Quantum Minerals Ltd. | | 289,402 | 3,353,662 |
| TOTAL COMMON STOCKS (Cost $217,840,916) | | | 184,187,502 |
| | | | |
| Nonconvertible Preferred Stocks - 22.4% |
| | | Shares | Value ($) |
| Brazil - 22.4% | | | |
| Banco Bradesco SA (PN) | | 1,058,640 | 2,937,546 |
| Itausa-Investimentos Itau SA (PN) | | 5,940,787 | 10,180,671 |
| Metalurgica Gerdau SA (PN) | | 3,304,769 | 6,771,114 |
| Petroleo Brasileiro SA - Petrobras (PN) (non-vtg.) | | 4,942,204 | 34,054,084 |
| | | | |
| TOTAL NONCONVERTIBLE PREFERRED STOCKS (Cost $38,848,725) | | | 53,943,415 |
| | | | |
| Money Market Funds - 2.0% |
| | | Shares | Value ($) |
Fidelity Securities Lending Cash Central Fund 5.40% (d)(e) (Cost $4,830,855) | | 4,830,372 | 4,830,855 |
| | | | |
| TOTAL INVESTMENT IN SECURITIES - 101.1% (Cost $261,520,496) | 242,961,772 |
NET OTHER ASSETS (LIABILITIES) - (1.1)% | (2,699,696) |
| NET ASSETS - 100.0% | 240,262,076 |
| | |
Legend
| (b) | Security or a portion of the security is on loan at period end. |
| (c) | Security exempt from registration under Rule 144A of the Securities Act of 1933. These securities may be resold in transactions exempt from registration, normally to qualified institutional buyers. At the end of the period, the value of these securities amounted to $12,048,457 or 5.0% of net assets. |
| (d) | Affiliated fund that is generally available only to investment companies and other accounts managed by Fidelity Investments. The rate quoted is the annualized seven-day yield of the fund at period end. A complete unaudited listing of the fund's holdings as of its most recent quarter end is available upon request. In addition, each Fidelity Central Fund's financial statements, which are not covered by the Fund's Report of Independent Registered Public Accounting Firm, are available on the SEC's website or upon request. |
| (e) | Investment made with cash collateral received from securities on loan. |
Affiliated Central Funds
Fiscal year to date information regarding the Fund's investments in Fidelity Central Funds, including the ownership percentage, is presented below.
| Affiliate | Value, beginning of period ($) | Purchases ($) | Sales Proceeds ($) | Dividend Income ($) | Realized Gain (loss) ($) | Change in Unrealized appreciation (depreciation) ($) | Value, end of period ($) | % ownership, end of period |
| Fidelity Cash Central Fund 5.40% | 647,124 | 54,352,571 | 54,999,695 | 42,968 | - | - | - | 0.0% |
| Fidelity Securities Lending Cash Central Fund 5.40% | 1,102,930 | 49,663,018 | 45,935,093 | 19,823 | - | - | 4,830,855 | 0.0% |
| Total | 1,750,054 | 104,015,589 | 100,934,788 | 62,791 | - | - | 4,830,855 | |
| | | | | | | | | |
Amounts in the dividend income column in the above table include any capital gain distributions from underlying funds, which are presented in the corresponding line item in the Statement of Operations, if applicable.
Amounts in the dividend income column for Fidelity Securities Lending Cash Central Fund represents the income earned on investing cash collateral, less rebates paid to borrowers and any lending agent fees associated with the loan, plus any premium payments received for lending certain types of securities.
Amounts included in the purchases and sales proceeds columns may include in-kind transactions, if applicable.
Investment Valuation
The following is a summary of the inputs used, as of October 31, 2023, involving the Fund's assets and liabilities carried at fair value. The inputs or methodology used for valuing securities may not be an indication of the risk associated with investing in those securities. For more information on valuation inputs, and their aggregation into the levels used below, please refer to the Investment Valuation section in the accompanying Notes to Financial Statements.
| Valuation Inputs at Reporting Date: |
| Description | Total ($) | Level 1 ($) | Level 2 ($) | Level 3 ($) |
Investments in Securities: | | | | |
|
| Equities: | | | | |
Consumer Discretionary | 22,457,718 | 22,457,718 | - | - |
Consumer Staples | 21,051,778 | 21,051,778 | - | - |
Energy | 34,054,084 | 34,054,084 | - | - |
Financials | 68,730,884 | 68,730,884 | - | - |
Health Care | 41,987,691 | 41,987,691 | - | - |
Industrials | 22,525,651 | 22,525,651 | - | - |
Materials | 17,245,420 | 17,245,420 | - | - |
Utilities | 10,077,691 | 10,077,691 | - | - |
|
| Money Market Funds | 4,830,855 | 4,830,855 | - | - |
| Total Investments in Securities: | 242,961,772 | 242,961,772 | - | - |
Fidelity® Latin America Fund
| Statement of Assets and Liabilities |
| | | | October 31, 2023 |
| | | | | |
| Assets | | | | |
| Investment in securities, at value (including securities loaned of $4,640,952) - See accompanying schedule: | | | | |
Unaffiliated issuers (cost $256,689,641) | $ | 238,130,917 | | |
Fidelity Central Funds (cost $4,830,855) | | 4,830,855 | | |
| | | | | |
| | | | | |
| Total Investment in Securities (cost $261,520,496) | | | $ | 242,961,772 |
| Foreign currency held at value (cost $29,857) | | | | 29,910 |
| Receivable for investments sold | | | | 700,321 |
| Receivable for fund shares sold | | | | 60,427 |
| Dividends receivable | | | | 2,785,475 |
| Distributions receivable from Fidelity Central Funds | | | | 9,976 |
| Prepaid expenses | | | | 381 |
Total assets | | | | 246,548,262 |
| Liabilities | | | | |
| Payable to custodian bank | $ | 857,074 | | |
| Payable for investments purchased | | 179,908 | | |
| Payable for fund shares redeemed | | 120,760 | | |
| Accrued management fee | | 141,392 | | |
| Distribution and service plan fees payable | | 4,771 | | |
| Other affiliated payables | | 64,889 | | |
| Other payables and accrued expenses | | 89,117 | | |
| Collateral on securities loaned | | 4,828,275 | | |
| Total Liabilities | | | | 6,286,186 |
| Net Assets | | | $ | 240,262,076 |
| Net Assets consist of: | | | | |
| Paid in capital | | | $ | 333,015,666 |
| Total accumulated earnings (loss) | | | | (92,753,590) |
| Net Assets | | | $ | 240,262,076 |
| | | | | |
| Net Asset Value and Maximum Offering Price | | | | |
| Class A : | | | | |
Net Asset Value and redemption price per share ($12,309,038 ÷ 688,223 shares)(a) | | | $ | 17.89 |
| Maximum offering price per share (100/94.25 of $17.89) | | | $ | 18.98 |
| Class M : | | | | |
Net Asset Value and redemption price per share ($2,606,412 ÷ 145,529 shares)(a) | | | $ | 17.91 |
| Maximum offering price per share (100/96.50 of $17.91) | | | $ | 18.56 |
| Class C : | | | | |
Net Asset Value and offering price per share ($1,134,076 ÷ 62,865 shares)(a) | | | $ | 18.04 |
| Latin America : | | | | |
Net Asset Value, offering price and redemption price per share ($217,335,730 ÷ 12,162,674 shares) | | | $ | 17.87 |
| Class I : | | | | |
Net Asset Value, offering price and redemption price per share ($6,213,156 ÷ 348,052 shares) | | | $ | 17.85 |
| Class Z : | | | | |
Net Asset Value, offering price and redemption price per share ($663,664 ÷ 37,030 shares) | | | $ | 17.92 |
(a)Redemption price per share is equal to net asset value less any applicable contingent deferred sales charge. |
| Statement of Operations |
| | | | Year ended October 31, 2023 |
| Investment Income | | | | |
| Dividends | | | $ | 18,176,764 |
| Income from Fidelity Central Funds (including $19,823 from security lending) | | | | 62,791 |
| Income before foreign taxes withheld | | | $ | 18,239,555 |
| Less foreign taxes withheld | | | | (658,269) |
| Total Income | | | | 17,581,286 |
| Expenses | | | | |
| Management fee | $ | 1,795,655 | | |
| Transfer agent fees | | 657,463 | | |
| Distribution and service plan fees | | 56,991 | | |
| Accounting fees | | 132,514 | | |
| Custodian fees and expenses | | 93,337 | | |
| Independent trustees' fees and expenses | | 1,534 | | |
| Registration fees | | 85,862 | | |
| Audit | | 70,732 | | |
| Legal | | 448 | | |
| Miscellaneous | | 1,086 | | |
| Total expenses before reductions | | 2,895,622 | | |
| Expense reductions | | (16,689) | | |
| Total expenses after reductions | | | | 2,878,933 |
| Net Investment income (loss) | | | | 14,702,353 |
| Realized and Unrealized Gain (Loss) | | | | |
| Net realized gain (loss) on: | | | | |
| Investment Securities: | | | | |
| Unaffiliated issuers | | (314,375) | | |
| Foreign currency transactions | | 123,132 | | |
| Total net realized gain (loss) | | | | (191,243) |
| Change in net unrealized appreciation (depreciation) on: | | | | |
| Investment Securities: | | | | |
| Unaffiliated issuers | | (36,843,715) | | |
| Assets and liabilities in foreign currencies | | (47,890) | | |
| Total change in net unrealized appreciation (depreciation) | | | | (36,891,605) |
| Net gain (loss) | | | | (37,082,848) |
| Net increase (decrease) in net assets resulting from operations | | | $ | (22,380,495) |
| Statement of Changes in Net Assets |
| |
| | Year ended October 31, 2023 | | Year ended October 31, 2022 |
| Increase (Decrease) in Net Assets | | | | |
| Operations | | | | |
| Net investment income (loss) | $ | 14,702,353 | $ | 24,063,331 |
| Net realized gain (loss) | | (191,243) | | (14,063,333) |
| Change in net unrealized appreciation (depreciation) | | (36,891,605) | | 19,797,722 |
| Net increase (decrease) in net assets resulting from operations | | (22,380,495) | | 29,797,720 |
| Distributions to shareholders | | (21,810,363) | | (7,964,894) |
| | | | | |
| Share transactions - net increase (decrease) | | (262,025) | | (30,282,037) |
| | | | | |
| Total increase (decrease) in net assets | | (44,452,883) | | (8,449,211) |
| | | | | |
| Net Assets | | | | |
| Beginning of period | | 284,714,959 | | 293,164,170 |
| End of period | $ | 240,262,076 | $ | 284,714,959 |
| | | | | |
| | | | | |
Financial Highlights
| Fidelity Advisor® Latin America Fund Class A |
| |
| Years ended October 31, | | 2023 | | 2022 | | 2021 | | 2020 | | 2019 |
Selected Per-Share Data | | | | | | | | | | |
| Net asset value, beginning of period | $ | 21.18 | $ | 19.37 | $ | 17.40 | $ | 28.36 | $ | 21.98 |
| Income from Investment Operations | | | | | | | | | | |
Net investment income (loss) A,B | | 1.02 | | 1.60 | | .15 | | .04 | | .69 |
| Net realized and unrealized gain (loss) | | (2.73) | | .68 | | 1.82 | | (10.40) | | 6.11 |
| Total from investment operations | | (1.71) | | 2.28 | | 1.97 | | (10.36) | | 6.80 |
| Distributions from net investment income | | (1.58) | | (.47) | | - C | | (.60) | | (.42) |
| Total distributions | | (1.58) | | (.47) | | - C | | (.60) | | (.42) |
| Net asset value, end of period | $ | 17.89 | $ | 21.18 | $ | 19.37 | $ | 17.40 | $ | 28.36 |
Total Return D,E | | (8.07)% | | 12.17% | | 11.34% | | (37.31)% | | 31.60% |
Ratios to Average Net Assets B,F,G | | | | | | | | | | |
| Expenses before reductions | | 1.33% | | 1.32% | | 1.33% | | 1.36% | | 1.36% |
| Expenses net of fee waivers, if any | | 1.32% | | 1.32% | | 1.33% | | 1.35% | | 1.36% |
| Expenses net of all reductions | | 1.32% | | 1.32% | | 1.33% | | 1.33% | | 1.36% |
| Net investment income (loss) | | 5.29% | | 7.98% | | .70% | | .18% | | 2.81% |
| Supplemental Data | | | | | | | | | | |
| Net assets, end of period (000 omitted) | $ | 12,309 | $ | 13,309 | $ | 10,217 | $ | 9,131 | $ | 17,953 |
Portfolio turnover rate H | | 37% | | 48% | | 33% | | 54% | | 48% |
ACalculated based on average shares outstanding during the period.
BNet investment income (loss) is affected by the timing of the declaration of dividends by any underlying mutual funds or exchange-traded funds (ETFs). Net investment income (loss) of any mutual funds or ETFs is not included in the Fund's net investment income (loss) ratio.
CAmount represents less than $.005 per share.
DTotal returns would have been lower if certain expenses had not been reduced during the applicable periods shown.
ETotal returns do not include the effect of the sales charges.
FFees and expenses of any underlying mutual funds or exchange-traded funds (ETFs) are not included in the Fund's expense ratio. The Fund indirectly bears its proportionate share of these expenses. For additional expense information related to investments in Fidelity Central Funds, please refer to the "Investments in Fidelity Central Funds" note found in the Notes to Financial Statements section of the most recent Annual or Semi-Annual report.
GExpense ratios reflect operating expenses of the class. Expenses before reductions do not reflect amounts reimbursed, waived, or reduced through arrangements with the investment adviser, brokerage services, or other offset arrangements, if applicable, and do not represent the amount paid by the class during periods when reimbursements, waivers or reductions occur.
HAmount does not include the portfolio activity of any underlying mutual funds or exchange-traded funds (ETFs).
| Fidelity Advisor® Latin America Fund Class M |
| |
| Years ended October 31, | | 2023 | | 2022 | | 2021 | | 2020 | | 2019 |
Selected Per-Share Data | | | | | | | | | | |
| Net asset value, beginning of period | $ | 21.19 | $ | 19.35 | $ | 17.44 | $ | 28.41 | $ | 22.00 |
| Income from Investment Operations | | | | | | | | | | |
Net investment income (loss) A,B | | .98 | | 1.55 | | .10 | | (.02) | | .63 |
| Net realized and unrealized gain (loss) | | (2.73) | | .69 | | 1.81 | | (10.42) | | 6.13 |
| Total from investment operations | | (1.75) | | 2.24 | | 1.91 | | (10.44) | | 6.76 |
| Distributions from net investment income | | (1.53) | | (.40) | | - | | (.53) | | (.35) |
| Total distributions | | (1.53) | | (.40) | | - | | (.53) | | (.35) |
| Net asset value, end of period | $ | 17.91 | $ | 21.19 | $ | 19.35 | $ | 17.44 | $ | 28.41 |
Total Return C,D | | (8.30)% | | 11.92% | | 10.95% | | (37.45)% | | 31.26% |
Ratios to Average Net Assets B,E,F | | | | | | | | | | |
| Expenses before reductions | | 1.58% | | 1.58% | | 1.59% | | 1.62% | | 1.64% |
| Expenses net of fee waivers, if any | | 1.57% | | 1.58% | | 1.59% | | 1.61% | | 1.63% |
| Expenses net of all reductions | | 1.56% | | 1.58% | | 1.59% | | 1.59% | | 1.63% |
| Net investment income (loss) | | 5.06% | | 7.72% | | .44% | | (.09)% | | 2.54% |
| Supplemental Data | | | | | | | | | | |
| Net assets, end of period (000 omitted) | $ | 2,606 | $ | 3,024 | $ | 2,701 | $ | 2,912 | $ | 6,032 |
Portfolio turnover rate G | | 37% | | 48% | | 33% | | 54% | | 48% |
ACalculated based on average shares outstanding during the period.
BNet investment income (loss) is affected by the timing of the declaration of dividends by any underlying mutual funds or exchange-traded funds (ETFs). Net investment income (loss) of any mutual funds or ETFs is not included in the Fund's net investment income (loss) ratio.
CTotal returns would have been lower if certain expenses had not been reduced during the applicable periods shown.
DTotal returns do not include the effect of the sales charges.
EFees and expenses of any underlying mutual funds or exchange-traded funds (ETFs) are not included in the Fund's expense ratio. The Fund indirectly bears its proportionate share of these expenses. For additional expense information related to investments in Fidelity Central Funds, please refer to the "Investments in Fidelity Central Funds" note found in the Notes to Financial Statements section of the most recent Annual or Semi-Annual report.
FExpense ratios reflect operating expenses of the class. Expenses before reductions do not reflect amounts reimbursed, waived, or reduced through arrangements with the investment adviser, brokerage services, or other offset arrangements, if applicable, and do not represent the amount paid by the class during periods when reimbursements, waivers or reductions occur.
GAmount does not include the portfolio activity of any underlying mutual funds or exchange-traded funds (ETFs).
| Fidelity Advisor® Latin America Fund Class C |
| |
| Years ended October 31, | | 2023 | | 2022 | | 2021 | | 2020 | | 2019 |
Selected Per-Share Data | | | | | | | | | | |
| Net asset value, beginning of period | $ | 21.33 | $ | 19.45 | $ | 17.61 | $ | 28.67 | $ | 22.16 |
| Income from Investment Operations | | | | | | | | | | |
Net investment income (loss) A,B | | .88 | | 1.46 | | (.01) | | (.13) | | .51 |
| Net realized and unrealized gain (loss) | | (2.74) | | .71 | | 1.85 | | (10.56) | | 6.21 |
| Total from investment operations | | (1.86) | | 2.17 | | 1.84 | | (10.69) | | 6.72 |
| Distributions from net investment income | | (1.43) | | (.29) | | - | | (.37) | | (.21) |
| Total distributions | | (1.43) | | (.29) | | - | | (.37) | | (.21) |
| Net asset value, end of period | $ | 18.04 | $ | 21.33 | $ | 19.45 | $ | 17.61 | $ | 28.67 |
Total Return C,D | | (8.77)% | | 11.36% | | 10.45% | | (37.78)% | | 30.62% |
Ratios to Average Net Assets B,E,F | | | | | | | | | | |
| Expenses before reductions | | 2.08% | | 2.08% | | 2.08% | | 2.11% | | 2.12% |
| Expenses net of fee waivers, if any | | 2.07% | | 2.07% | | 2.08% | | 2.11% | | 2.12% |
| Expenses net of all reductions | | 2.07% | | 2.07% | | 2.08% | | 2.09% | | 2.12% |
| Net investment income (loss) | | 4.54% | | 7.22% | | (.05)% | | (.58)% | | 2.06% |
| Supplemental Data | | | | | | | | | | |
| Net assets, end of period (000 omitted) | $ | 1,134 | $ | 946 | $ | 656 | $ | 810 | $ | 3,438 |
Portfolio turnover rate G | | 37% | | 48% | | 33% | | 54% | | 48% |
ACalculated based on average shares outstanding during the period.
BNet investment income (loss) is affected by the timing of the declaration of dividends by any underlying mutual funds or exchange-traded funds (ETFs). Net investment income (loss) of any mutual funds or ETFs is not included in the Fund's net investment income (loss) ratio.
CTotal returns would have been lower if certain expenses had not been reduced during the applicable periods shown.
DTotal returns do not include the effect of the contingent deferred sales charge.
EFees and expenses of any underlying mutual funds or exchange-traded funds (ETFs) are not included in the Fund's expense ratio. The Fund indirectly bears its proportionate share of these expenses. For additional expense information related to investments in Fidelity Central Funds, please refer to the "Investments in Fidelity Central Funds" note found in the Notes to Financial Statements section of the most recent Annual or Semi-Annual report.
FExpense ratios reflect operating expenses of the class. Expenses before reductions do not reflect amounts reimbursed, waived, or reduced through arrangements with the investment adviser, brokerage services, or other offset arrangements, if applicable, and do not represent the amount paid by the class during periods when reimbursements, waivers or reductions occur.
GAmount does not include the portfolio activity of any underlying mutual funds or exchange-traded funds (ETFs).
| Fidelity® Latin America Fund |
| |
| Years ended October 31, | | 2023 | | 2022 | | 2021 | | 2020 | | 2019 |
Selected Per-Share Data | | | | | | | | | | |
| Net asset value, beginning of period | $ | 21.17 | $ | 19.36 | $ | 17.36 | $ | 28.30 | $ | 21.94 |
| Income from Investment Operations | | | | | | | | | | |
Net investment income (loss) A,B | | 1.07 | | 1.65 | | .22 | | .10 | | .77 |
| Net realized and unrealized gain (loss) | | (2.74) | | .69 | | 1.79 | | (10.36) | | 6.09 |
| Total from investment operations | | (1.67) | | 2.34 | | 2.01 | | (10.26) | | 6.86 |
| Distributions from net investment income | | (1.63) | | (.53) | | (.01) | | (.68) | | (.50) |
| Total distributions | | (1.63) | | (.53) | | (.01) | | (.68) | | (.50) |
| Net asset value, end of period | $ | 17.87 | $ | 21.17 | $ | 19.36 | $ | 17.36 | $ | 28.30 |
Total Return C | | (7.88)% | | 12.55% | | 11.58% | | (37.13)% | | 32.06% |
Ratios to Average Net Assets B,D,E | | | | | | | | | | |
| Expenses before reductions | | 1.07% | | 1.06% | | 1.04% | | 1.05% | | 1.05% |
| Expenses net of fee waivers, if any | | 1.06% | | 1.05% | | 1.04% | | 1.05% | | 1.04% |
| Expenses net of all reductions | | 1.06% | | 1.05% | | 1.04% | | 1.03% | | 1.04% |
| Net investment income (loss) | | 5.55% | | 8.24% | | .99% | | .48% | | 3.13% |
| Supplemental Data | | | | | | | | | | |
| Net assets, end of period (000 omitted) | $ | 217,336 | $ | 262,361 | $ | 262,484 | $ | 277,942 | $ | 517,901 |
Portfolio turnover rate F | | 37% | | 48% | | 33% | | 54% | | 48% |
ACalculated based on average shares outstanding during the period.
BNet investment income (loss) is affected by the timing of the declaration of dividends by any underlying mutual funds or exchange-traded funds (ETFs). Net investment income (loss) of any mutual funds or ETFs is not included in the Fund's net investment income (loss) ratio.
CTotal returns would have been lower if certain expenses had not been reduced during the applicable periods shown.
DFees and expenses of any underlying mutual funds or exchange-traded funds (ETFs) are not included in the Fund's expense ratio. The Fund indirectly bears its proportionate share of these expenses. For additional expense information related to investments in Fidelity Central Funds, please refer to the "Investments in Fidelity Central Funds" note found in the Notes to Financial Statements section of the most recent Annual or Semi-Annual report.
EExpense ratios reflect operating expenses of the class. Expenses before reductions do not reflect amounts reimbursed, waived, or reduced through arrangements with the investment adviser, brokerage services, or other offset arrangements, if applicable, and do not represent the amount paid by the class during periods when reimbursements, waivers or reductions occur.
FAmount does not include the portfolio activity of any underlying mutual funds or exchange-traded funds (ETFs).
| Fidelity Advisor® Latin America Fund Class I |
| |
| Years ended October 31, | | 2023 | | 2022 | | 2021 | | 2020 | | 2019 |
Selected Per-Share Data | | | | | | | | | | |
| Net asset value, beginning of period | $ | 21.15 | $ | 19.34 | $ | 17.34 | $ | 28.28 | $ | 21.92 |
| Income from Investment Operations | | | | | | | | | | |
Net investment income (loss) A,B | | 1.07 | | 1.67 | | .23 | | .12 | | .78 |
| Net realized and unrealized gain (loss) | | (2.73) | | .67 | | 1.78 | | (10.34) | | 6.08 |
| Total from investment operations | | (1.66) | | 2.34 | | 2.01 | | (10.22) | | 6.86 |
| Distributions from net investment income | | (1.64) | | (.53) | | (.01) | | (.72) | | (.50) |
| Total distributions | | (1.64) | | (.53) | | (.01) | | (.72) | | (.50) |
| Net asset value, end of period | $ | 17.85 | $ | 21.15 | $ | 19.34 | $ | 17.34 | $ | 28.28 |
Total Return C | | (7.83)% | | 12.57% | | 11.60% | | (37.07)% | | 32.09% |
Ratios to Average Net Assets B,D,E | | | | | | | | | | |
| Expenses before reductions | | 1.02% | | 1.02% | | 1.00% | | .99% | | 1.01% |
| Expenses net of fee waivers, if any | | 1.02% | | 1.02% | | 1.00% | | .99% | | 1.00% |
| Expenses net of all reductions | | 1.02% | | 1.02% | | 1.00% | | .97% | | 1.00% |
| Net investment income (loss) | | 5.60% | | 8.28% | | 1.04% | | .54% | | 3.17% |
| Supplemental Data | | | | | | | | | | |
| Net assets, end of period (000 omitted) | $ | 6,213 | $ | 3,960 | $ | 2,768 | $ | 3,508 | $ | 7,124 |
Portfolio turnover rate F | | 37% | | 48% | | 33% | | 54% | | 48% |
ACalculated based on average shares outstanding during the period.
BNet investment income (loss) is affected by the timing of the declaration of dividends by any underlying mutual funds or exchange-traded funds (ETFs). Net investment income (loss) of any mutual funds or ETFs is not included in the Fund's net investment income (loss) ratio.
CTotal returns would have been lower if certain expenses had not been reduced during the applicable periods shown.
DFees and expenses of any underlying mutual funds or exchange-traded funds (ETFs) are not included in the Fund's expense ratio. The Fund indirectly bears its proportionate share of these expenses. For additional expense information related to investments in Fidelity Central Funds, please refer to the "Investments in Fidelity Central Funds" note found in the Notes to Financial Statements section of the most recent Annual or Semi-Annual report.
EExpense ratios reflect operating expenses of the class. Expenses before reductions do not reflect amounts reimbursed, waived, or reduced through arrangements with the investment adviser, brokerage services, or other offset arrangements, if applicable, and do not represent the amount paid by the class during periods when reimbursements, waivers or reductions occur.
FAmount does not include the portfolio activity of any underlying mutual funds or exchange-traded funds (ETFs).
| Fidelity Advisor® Latin America Fund Class Z |
| |
| Years ended October 31, | | 2023 | | 2022 | | 2021 | | 2020 | | 2019 |
Selected Per-Share Data | | | | | | | | | | |
| Net asset value, beginning of period | $ | 21.14 | $ | 19.35 | $ | 17.32 | $ | 28.24 | $ | 21.92 |
| Income from Investment Operations | | | | | | | | | | |
Net investment income (loss) A,B | | 1.10 | | 1.70 | | .26 | | .14 | | .85 |
| Net realized and unrealized gain (loss) | | (2.72) | | .66 | | 1.79 | | (10.32) | | 6.03 |
| Total from investment operations | | (1.62) | | 2.36 | | 2.05 | | (10.18) | | 6.88 |
| Distributions from net investment income | | (1.60) | | (.57) | | (.02) | | (.74) | | (.56) |
| Total distributions | | (1.60) | | (.57) | | (.02) | | (.74) | | (.56) |
| Net asset value, end of period | $ | 17.92 | $ | 21.14 | $ | 19.35 | $ | 17.32 | $ | 28.24 |
Total Return C | | (7.67)% | | 12.73% | | 11.82% | | (37.00)% | | 32.28% |
Ratios to Average Net Assets B,D,E | | | | | | | | | | |
| Expenses before reductions | | .86% | | .85% | | .85% | | .86% | | .86% |
| Expenses net of fee waivers, if any | | .86% | | .85% | | .85% | | .86% | | .86% |
| Expenses net of all reductions | | .86% | | .85% | | .85% | | .84% | | .86% |
| Net investment income (loss) | | 5.76% | | 8.45% | | 1.19% | | .67% | | 3.31% |
| Supplemental Data | | | | | | | | | | |
| Net assets, end of period (000 omitted) | $ | 664 | $ | 1,115 | $ | 14,338 | $ | 13,520 | $ | 26,605 |
Portfolio turnover rate F | | 37% | | 48% | | 33% | | 54% | | 48% |
ACalculated based on average shares outstanding during the period.
BNet investment income (loss) is affected by the timing of the declaration of dividends by any underlying mutual funds or exchange-traded funds (ETFs). Net investment income (loss) of any mutual funds or ETFs is not included in the Fund's net investment income (loss) ratio.
CTotal returns would have been lower if certain expenses had not been reduced during the applicable periods shown.
DFees and expenses of any underlying mutual funds or exchange-traded funds (ETFs) are not included in the Fund's expense ratio. The Fund indirectly bears its proportionate share of these expenses. For additional expense information related to investments in Fidelity Central Funds, please refer to the "Investments in Fidelity Central Funds" note found in the Notes to Financial Statements section of the most recent Annual or Semi-Annual report.
EExpense ratios reflect operating expenses of the class. Expenses before reductions do not reflect amounts reimbursed, waived, or reduced through arrangements with the investment adviser, brokerage services, or other offset arrangements, if applicable, and do not represent the amount paid by the class during periods when reimbursements, waivers or reductions occur.
FAmount does not include the portfolio activity of any underlying mutual funds or exchange-traded funds (ETFs).
For the period ended October 31, 2023
1. Organization.
Fidelity Latin America Fund (the Fund) is a non-diversified fund of Fidelity Investment Trust (the Trust) and is authorized to issue an unlimited number of shares. The Trust is registered under the Investment Company Act of 1940, as amended (the 1940 Act), as an open-end management investment company organized as a Massachusetts business trust. The Fund offers Class A, Class M, Class C, Latin America, Class I and Class Z shares, each of which has equal rights as to assets and voting privileges. Class A, Class M, Class C, Class I and Class Z are Fidelity Advisor classes. Each class has exclusive voting rights with respect to matters that affect that class. Class C shares will automatically convert to Class A shares after a holding period of eight years from the initial date of purchase, with certain exceptions. The Fund's investments in emerging markets can be subject to social, economic, regulatory, and political uncertainties and can be extremely volatile.
2. Investments in Fidelity Central Funds.
Funds may invest in Fidelity Central Funds, which are open-end investment companies generally available only to other investment companies and accounts managed by the investment adviser and its affiliates. The Schedule of Investments lists any Fidelity Central Funds held as an investment as of period end, but does not include the underlying holdings of each Fidelity Central Fund. An investing fund indirectly bears its proportionate share of the expenses of the underlying Fidelity Central Funds.
Based on its investment objective, each Fidelity Central Fund may invest or participate in various investment vehicles or strategies that are similar to those of the investing fund. These strategies are consistent with the investment objectives of the investing fund and may involve certain economic risks which may cause a decline in value of each of the Fidelity Central Funds and thus a decline in the value of the investing fund.
| Fidelity Central Fund | Investment Manager | Investment Objective | Investment Practices | Expense RatioA |
| Fidelity Money Market Central Funds | Fidelity Management & Research Company LLC (FMR) | Each fund seeks to obtain a high level of current income consistent with the preservation of capital and liquidity. | Short-term Investments | Less than .005% |
A Expenses expressed as a percentage of average net assets and are as of each underlying Central Fund's most recent annual or semi-annual shareholder report.
A complete unaudited list of holdings for each Fidelity Central Fund is available upon request or at the Securities and Exchange Commission website at www.sec.gov. In addition, the financial statements of the Fidelity Central Funds which contain the significant accounting policies (including investment valuation policies) of those funds, and are not covered by the Report of Independent Registered Public Accounting Firm, are available on the Securities and Exchange Commission website or upon request.
3. Significant Accounting Policies.
The Fund is an investment company and applies the accounting and reporting guidance of the Financial Accounting Standards Board (FASB) Accounting Standards Codification Topic 946 Financial Services - Investment Companies. The financial statements have been prepared in conformity with accounting principles generally accepted in the United States of America (GAAP), which require management to make certain estimates and assumptions at the date of the financial statements. Actual results could differ from those estimates. Subsequent events, if any, through the date that the financial statements were issued have been evaluated in the preparation of the financial statements. The Fund's Schedule of Investments lists any underlying mutual funds or exchange-traded funds (ETFs) but does not include the underlying holdings of these funds. The following summarizes the significant accounting policies of the Fund:
Investment Valuation. Investments are valued as of 4:00 p.m. Eastern time on the last calendar day of the period. The Board of Trustees (the Board) has designated the Fund's investment adviser as the valuation designee responsible for the fair valuation function and performing fair value determinations as needed. The investment adviser has established a Fair Value Committee (the Committee) to carry out the day-to-day fair valuation responsibilities and has adopted policies and procedures to govern the fair valuation process and the activities of the Committee. In accordance with these fair valuation policies and procedures, which have been approved by the Board, the Fund attempts to obtain prices from one or more third party pricing services or brokers to value its investments. When current market prices, quotations or currency exchange rates are not readily available or reliable, investments will be fair valued in good faith by the Committee, in accordance with the policies and procedures. Factors used in determining fair value vary by investment type and may include market or investment specific events, transaction data, estimated cash flows, and market observations of comparable investments. The frequency that the fair valuation procedures are used cannot be predicted and they may be utilized to a significant extent. The Committee manages the Fund's fair valuation practices and maintains the fair valuation policies and procedures. The Fund's investment adviser reports to the Board information regarding the fair valuation process and related material matters.
The Fund categorizes the inputs to valuation techniques used to value its investments into a disclosure hierarchy consisting of three levels as shown below:
Level 1 - unadjusted quoted prices in active markets for identical investments
Level 2 - other significant observable inputs (including quoted prices for similar investments, interest rates, prepayment speeds, etc.)
Level 3 - unobservable inputs (including the Fund's own assumptions based on the best information available)
Valuation techniques used to value the Fund's investments by major category are as follows:
Equity securities, including restricted securities, for which market quotations are readily available, are valued at the last reported sale price or official closing price as reported by a third party pricing service on the primary market or exchange on which they are traded and are categorized as Level 1 in the hierarchy. In the event there were no sales during the day or closing prices are not available, securities are valued at the last quoted bid price or may be valued using the last available price and are generally categorized as Level 2 in the hierarchy. For foreign equity securities, when market or security specific events arise, comparisons to the valuation of American Depositary Receipts (ADRs), futures contracts, ETFs and certain indexes as well as quoted prices for similar securities may be used and would be categorized as Level 2 in the hierarchy. For equity securities, including restricted securities, where observable inputs are limited, assumptions about market activity and risk are used and these securities may be categorized as Level 3 in the hierarchy.
Investments in open-end mutual funds, including the Fidelity Central Funds, are valued at their closing net asset value (NAV) each business day and are categorized as Level 1 in the hierarchy.
Changes in valuation techniques may result in transfers in or out of an assigned level within the disclosure hierarchy. The aggregate value of investments by input level as of October 31, 2023 is included at the end of the Fund's Schedule of Investments.
Foreign Currency. Certain Funds may use foreign currency contracts to facilitate transactions in foreign-denominated securities. Gains and losses from these transactions may arise from changes in the value of the foreign currency or if the counterparties do not perform under the contracts' terms.
Foreign-denominated assets, including investment securities, and liabilities are translated into U.S. dollars at the exchange rates at period end. Purchases and sales of investment securities, income and dividends received, and expenses denominated in foreign currencies are translated into U.S. dollars at the exchange rate in effect on the transaction date.
The effects of exchange rate fluctuations on investments are included with the net realized and unrealized gain (loss) on investment securities. Other foreign currency transactions resulting in realized and unrealized gain (loss) are disclosed separately.
Investment Transactions and Income. For financial reporting purposes, the Fund's investment holdings and NAV include trades executed through the end of the last business day of the period. The NAV per share for processing shareholder transactions is calculated as of the close of business of the New York Stock Exchange (NYSE), normally 4:00 p.m. Eastern time and includes trades executed through the end of the prior business day. Gains and losses on securities sold are determined on the basis of identified cost and include proceeds received from litigation. Commissions paid to certain brokers with whom the investment adviser, or its affiliates, places trades on behalf of a fund include an amount in addition to trade execution, which may be rebated back to a fund. Any such rebates are included in net realized gain (loss) on investments in the Statement of Operations. Dividend income is recorded on the ex-dividend date, except for certain dividends from foreign securities where the ex-dividend date may have passed, which are recorded as soon as the Fund is informed of the ex-dividend date. Non-cash dividends included in dividend income, if any, are recorded at the fair market value of the securities received. Income and capital gain distributions from Fidelity Central Funds, if any, are recorded on the ex-dividend date. Investment income is recorded net of foreign taxes withheld where recovery of such taxes is uncertain.
Class Allocations and Expenses. Investment income, realized and unrealized capital gains and losses, common expenses of a fund, and certain fund-level expense reductions, if any, are allocated daily on a pro-rata basis to each class based on the relative net assets of each class to the total net assets of a fund. Each class differs with respect to transfer agent and distribution and service plan fees incurred, as applicable. Certain expense reductions may also differ by class, if applicable. For the reporting period, the allocated portion of income and expenses to each class as a percent of its average net assets may vary due to the timing of recording these transactions in relation to fluctuating net assets of the classes. Expenses directly attributable to a fund are charged to that fund. Expenses attributable to more than one fund are allocated among the respective funds on the basis of relative net assets or other appropriate methods. Expenses included in the accompanying financial statements reflect the expenses of that fund and do not include any expenses associated with any underlying mutual funds or exchange-traded funds (ETFs). Although not included in a fund's expenses, a fund indirectly bears its proportionate share of these expenses through the net asset value of each underlying mutual fund or exchange-traded fund (ETF). Expense estimates are accrued in the period to which they relate and adjustments are made when actual amounts are known.
Income Tax Information and Distributions to Shareholders. Each year, the Fund intends to qualify as a regulated investment company under Subchapter M of the Internal Revenue Code, including distributing substantially all of its taxable income and realized gains. As a result, no provision for U.S. Federal income taxes is required. As of October 31, 2023, the Fund did not have any unrecognized tax benefits in the financial statements; nor is the Fund aware of any tax positions for which it is reasonably possible that the total amounts of unrecognized tax benefits will significantly change in the next twelve months. The Fund files a U.S. federal tax return, in addition to state and local tax returns as required. The Fund's federal income tax returns are subject to examination by the Internal Revenue Service (IRS) for a period of three fiscal years after they are filed. State and local tax returns may be subject to examination for an additional fiscal year depending on the jurisdiction. Foreign taxes are provided for based on the Fund's understanding of the tax rules and rates that exist in the foreign markets in which it invests.
Distributions are declared and recorded on the ex-dividend date. Income and capital gain distributions are declared separately for each class. Income and capital gain distributions are determined in accordance with income tax regulations, which may differ from GAAP. In addition, the Fund claimed a portion of the payment made to redeeming shareholders as a distribution for income tax purposes.
Capital accounts within the financial statements are adjusted for permanent book-tax differences. These adjustments have no impact on net assets or the results of operations. Capital accounts are not adjusted for temporary book-tax differences which will reverse in a subsequent period.
Book-tax differences are primarily due to foreign currency transactions, capital loss carryforwards and losses deferred due to wash sales.
As of period end, the cost and unrealized appreciation (depreciation) in securities, and derivatives if applicable, for federal income tax purposes were as follows:
| Gross unrealized appreciation | $41,096,913 |
| Gross unrealized depreciation | (60,332,015) |
| Net unrealized appreciation (depreciation) | $(19,235,102) |
| Tax Cost | $262,196,874 |
The tax-based components of distributable earnings as of period end were as follows:
| Undistributed ordinary income | $8,352,227 |
| Capital loss carryforward | $(81,820,196) |
| Net unrealized appreciation (depreciation) on securities and other investments | $(19,285,624) |
Capital loss carryforwards are only available to offset future capital gains of the Fund to the extent provided by regulations and may be limited. The capital loss carryforward information presented below, including any applicable limitation, is estimated as of fiscal period end and is subject to adjustment.
Short-term | $(57,484,114) |
Long-term | (24,336,082) |
| Total capital loss carryforward | $(81,820,196) |
The tax character of distributions paid was as follows:
| | October 31, 2023 | October 31, 2022 |
| Ordinary Income | $21,810,363 | $7,964,894 |
Restricted Securities (including Private Placements). Funds may invest in securities that are subject to legal or contractual restrictions on resale. These securities generally may be resold in transactions exempt from registration or to the public if the securities are registered. Disposal of these securities may involve time-consuming negotiations and expense, and prompt sale at an acceptable price may be difficult. Information regarding restricted securities held at period end is included at the end of the Schedule of Investments, if applicable.
4. Purchases and Sales of Investments.
Purchases and sales of securities, other than short-term securities and in-kind transactions, as applicable, are noted in the table below.
| | Purchases ($) | Sales ($) |
| Fidelity Latin America Fund | 98,584,904 | 106,187,108 |
5. Fees and Other Transactions with Affiliates.
Management Fee. Fidelity Management & Research Company LLC (the investment adviser) and its affiliates provide the Fund with investment management related services for which the Fund pays a monthly management fee. The management fee is the sum of an individual fund fee rate that is based on an annual rate of .45% of the Fund's average net assets and an annualized group fee rate that averaged .23% during the period. The group fee rate is based upon the monthly average net assets of a group of registered investment companies with which the investment adviser has management contracts. The group fee rate decreases as assets under management increase and increases as assets under management decrease. For the reporting period, the total annual management fee rate was .68% of the Fund's average net assets.
Distribution and Service Plan Fees. In accordance with Rule 12b-1 of the 1940 Act, the Fund has adopted separate Distribution and Service Plans for each class of shares. Certain classes pay Fidelity Distributors Company LLC (FDC), an affiliate of the investment adviser, separate Distribution and Service Fees, each of which is based on an annual percentage of each class' average net assets. In addition, FDC may pay financial intermediaries for selling shares of the Fund and providing shareholder support services. For the period, the Distribution and Service Fee rates, total fees and amounts retained by FDC were as follows:
| | Distribution Fee | Service Fee | Total Fees | Retained by FDC |
| Class A | - % | .25% | $32,042 | $757 |
| Class M | .25% | .25% | 14,602 | 52 |
| Class C | .75% | .25% | 10,347 | 3,300 |
| | | | $56,991 | $4,109 |
Sales Load. FDC may receive a front-end sales charge of up to 5.75% for selling Class A shares and 3.50% for selling Class M shares, some of which is paid to financial intermediaries for selling shares of the Fund. Depending on the holding period, FDC may receive contingent deferred sales charges levied on Class A, Class M and Class C redemptions. The deferred sales charges are 1.00% for Class C shares, 1.00% for certain purchases of Class A shares and .25% for certain purchases of Class M shares.
For the period, sales charge amounts retained by FDC were as follows:
| | Retained by FDC |
| Class A | $8,740 |
| Class M | 283 |
Class CA | 40 |
| | $9,063 |
A When Class C shares are initially sold, FDC pays commissions from its own resources to financial intermediaries through which the sales are made.
Transfer Agent Fees. Fidelity Investments Institutional Operations Company LLC (FIIOC), an affiliate of the investment adviser, is the transfer, dividend disbursing and shareholder servicing agent for each class of the Fund. FIIOC receives account fees and asset-based fees that vary according to the account size and type of account of the shareholders of the respective classes of the Fund, except for Class Z. FIIOC receives an asset-based fee of Class Z's average net assets. FIIOC pays for typesetting, printing and mailing of shareholder reports, except proxy statements.
For the period, transfer agent fees for each class were as follows:
| | Amount | % of Class-Level Average Net Assets |
| Class A | $33,116 | .26 |
| Class M | 7,553 | .26 |
| Class C | 2,682 | .26 |
| Latin America | 604,850 | .25 |
| Class I | 8,885 | .20 |
| Class Z | 377 | .04 |
| | $657,463 | |
During November 2023, the Board approved a change in the transfer agent fees effective December 1, 2023 to a fixed annual rate of class-level average net assets as follows:
| | % of Class-Level Average Net Assets |
| Class A | 0.2000 |
| Class M | 0.2000 |
| Class C | 0.2000 |
| Latin America | 0.2000 |
| Class I | 0.2000 |
Accounting Fees. Fidelity Service Company, Inc. (FSC), an affiliate of the investment adviser, maintains the Fund's accounting records. The accounting fee is based on the level of average net assets for each month. For the period, the fees were equivalent to the following annual rates:
| | % of Average Net Assets |
| Fidelity Latin America Fund | .05 |
During November 2023, the Board approved a change in the accounting fees effective December 1, 2023 to a fixed annual rate of average net assets as follows:
| | % of Average Net Assets |
| Fidelity Latin America Fund | 0.0498 |
Brokerage Commissions. A portion of portfolio transactions were placed with brokerage firms which are affiliates of the investment adviser. Brokerage commissions are included in net realized gain (loss) and change in net unrealized appreciation (depreciation) in the Statement of Operations. The commissions paid to these affiliated firms were as follows:
| | Amount |
| Fidelity Latin America Fund | $552 |
Interfund Trades. Funds may purchase from or sell securities to other Fidelity Funds under procedures adopted by the Board. The procedures have been designed to ensure these interfund trades are executed in accordance with Rule 17a-7 of the 1940 Act. Any interfund trades are included within the respective purchases and sales amounts shown in the Purchases and Sales of Investments note. Interfund trades during the period are noted in the table below.
| | Purchases ($) | Sales ($) | Realized Gain (Loss) ($) |
| Fidelity Latin America Fund | 617,469 | - | - |
6. Committed Line of Credit.
Certain Funds participate with other funds managed by the investment adviser or an affiliate in a $4.25 billion credit facility (the "line of credit") to be utilized for temporary or emergency purposes to fund shareholder redemptions or for other short-term liquidity purposes. The participating funds have agreed to pay commitment fees on their pro-rata portion of the line of credit, which are reflected in Miscellaneous expenses on the Statement of Operations, and are listed below. During the period, there were no borrowings on this line of credit.
| | Amount |
| Fidelity Latin America Fund | $489 |
7. Security Lending.
Funds lend portfolio securities from time to time in order to earn additional income. Lending agents are used, including National Financial Services (NFS), an affiliate of the investment adviser. Pursuant to a securities lending agreement, NFS will receive a fee, which is capped at 9.9% of a fund's daily lending revenue, for its services as lending agent. A fund may lend securities to certain qualified borrowers, including NFS. On the settlement date of the loan, a fund receives collateral (in the form of U.S. Treasury obligations, letters of credit and/or cash) against the loaned securities and maintains collateral in an amount not less than 100% of the market value of the loaned securities during the period of the loan. The market value of the loaned securities is determined at the close of business of a fund and any additional required collateral is delivered to a fund on the next business day. A fund or borrower may terminate the loan at any time, and if the borrower defaults on its obligation to return the securities loaned because of insolvency or other reasons, a fund may apply collateral received from the borrower against the obligation. A fund may experience delays and costs in recovering the securities loaned. Any cash collateral received is invested in the Fidelity Securities Lending Cash Central Fund. Any loaned securities are identified as such in the Schedule of Investments, and the value of loaned securities and cash collateral at period end, as applicable, are presented in the Statement of Assets and Liabilities. Security lending income represents the income earned on investing cash collateral, less rebates paid to borrowers and any lending agent fees associated with the loan, plus any premium payments received for lending certain types of securities. Security lending income is presented in the Statement of Operations as a component of income from Fidelity Central Funds. Affiliated security lending activity, if any, was as follows:
| | Total Security Lending Fees Paid to NFS | Security Lending Income From Securities Loaned to NFS | Value of Securities Loaned to NFS at Period End |
| Fidelity Latin America Fund | $2,087 | $158 | $- |
8. Expense Reductions.
Through arrangements with each class' transfer agent, credits realized as a result of certain uninvested cash balances were used to reduce the Fund's expenses. During the period, transfer agent credits reduced each class' expenses as noted in the table below.
| | Expense reduction |
| | |
| Class M | $526 |
In addition, during the period the investment adviser or an affiliate reimbursed and/or waived a portion of fund-level operating expenses in the amount of $16,163.
9. Distributions to Shareholders.
Distributions to shareholders of each class were as follows:
| | Year ended October 31, 2023 | Year ended October 31, 2022 |
| Fidelity Latin America Fund | | |
| Distributions to shareholders | | |
| Class A | $1,004,697 | $246,821 |
| Class M | 219,803 | 55,713 |
| Class C | 62,841 | 9,520 |
| Latin America | 20,106,391 | 7,148,489 |
| Class I | 319,001 | 63,267 |
| Class Z | 97,630 | 441,084 |
Total | $21,810,363 | $7,964,894 |
10. Share Transactions.
Share transactions for each class were as follows and may contain in-kind transactions, automatic conversions between classes or exchanges between affiliated funds:
| | Shares | Shares | Dollars | Dollars |
| | Year ended October 31, 2023 | Year ended October 31, 2022 | Year ended October 31, 2023 | Year ended October 31, 2022 |
| Fidelity Latin America Fund | | | | |
| Class A | | | | |
| Shares sold | 134,846 | 193,440 | $2,591,643 | $4,014,725 |
| Reinvestment of distributions | 54,943 | 12,985 | 985,119 | 236,085 |
| Shares redeemed | (129,882) | (105,710) | (2,397,461) | (2,130,953) |
| Net increase (decrease) | 59,907 | 100,715 | $1,179,301 | $2,119,857 |
| Class M | | | | |
| Shares sold | 13,661 | 20,674 | $273,957 | $437,930 |
| Reinvestment of distributions | 12,131 | 3,036 | 218,228 | 55,381 |
| Shares redeemed | (22,967) | (20,590) | (443,213) | (412,047) |
| Net increase (decrease) | 2,825 | 3,120 | $48,972 | $81,264 |
| Class C | | | | |
| Shares sold | 26,302 | 24,221 | $509,122 | $531,782 |
| Reinvestment of distributions | 3,453 | 515 | 62,841 | 9,515 |
| Shares redeemed | (11,221) | (14,126) | (215,686) | (288,523) |
| Net increase (decrease) | 18,534 | 10,610 | $356,277 | $252,774 |
| Latin America | | | | |
| Shares sold | 1,714,595 | 2,584,874 | $33,449,842 | $53,328,636 |
| Reinvestment of distributions | 1,050,900 | 354,926 | 18,779,586 | 6,428,926 |
| Shares redeemed | (2,998,723) | (4,099,646) | (57,166,973) | (80,282,944) |
| Net increase (decrease) | (233,228) | (1,159,846) | $(4,937,545) | $(20,525,382) |
| Class I | | | | |
| Shares sold | 270,444 | 241,168 | $5,353,519 | $5,278,172 |
| Reinvestment of distributions | 17,723 | 3,427 | 316,179 | 61,999 |
| Shares redeemed | (127,375) | (200,417) | (2,335,762) | (3,856,685) |
| Net increase (decrease) | 160,792 | 44,178 | $3,333,936 | $1,483,486 |
| Class Z | | | | |
| Shares sold | 24,093 | 554,422 | $494,949 | $11,379,289 |
| Reinvestment of distributions | 3,612 | 24,364 | 64,625 | 440,031 |
| Shares redeemed | (43,424) | (1,267,021) | (802,540) | (25,513,356) |
| Net increase (decrease) | (15,719) | (688,235) | $(242,966) | $(13,694,036) |
11. Other.
A fund's organizational documents provide former and current trustees and officers with a limited indemnification against liabilities arising in connection with the performance of their duties to the fund. In the normal course of business, a fund may also enter into contracts that provide general indemnifications. A fund's maximum exposure under these arrangements is unknown as this would be dependent on future claims that may be made against a fund. The risk of material loss from such claims is considered remote.
12. Risk and Uncertainties.
Many factors affect a fund's performance. Developments that disrupt global economies and financial markets, such as pandemics, epidemics, outbreaks of infectious diseases, war, terrorism, and environmental disasters, may significantly affect a fund's investment performance. The effects of these developments to a fund will be impacted by the types of securities in which a fund invests, the financial condition, industry, economic sector, and geographic location of an issuer, and a fund's level of investment in the securities of that issuer. Significant concentrations in security types, issuers, industries, sectors, and geographic locations may magnify the factors that affect a fund's performance.
Average annual total return reflects the change in the value of an investment, assuming reinvestment of distributions from dividend income and capital gains (the profits earned upon the sale of securities that have grown in value, if any) and assuming a constant rate of performance each year. The hypothetical investment and the average annual total returns do not reflect the deduction of taxes that a shareholder would pay on fund distributions or the redemption of fund shares. During periods of reimbursement by Fidelity, a fund's total return will be greater than it would be had the reimbursement not occurred. How a fund did yesterday is no guarantee of how it will do tomorrow.
| Average Annual Total Returns |
| | | | |
Periods ended October 31, 2023 | Past 1 year | Past 5 years | Past 10 years |
| Fidelity® Nordic Fund | 16.08% | 8.38% | 6.79% |
| $10,000 Over 10 Years |
| |
Let's say hypothetically that $10,000 was invested in Fidelity® Nordic Fund on October 31, 2013. The chart shows how the value of your investment would have changed, and also shows how the FTSE® Capped Nordic Index performed over the same period. |
|
|
Fidelity® Nordic Fund
Market Recap:
International (non-U.S.) equities gained 12.27% for the 12 months ending October 31, 2023, according to the MSCI ACWI (All Country World Index) ex USA Index, as global economic expansion and a slowing in the pace of inflation in some markets provided a favorable backdrop for risk assets. After returning -15.86% in 2022, the index's upturn has been largely driven by a narrow set of companies in the information technology and communication services sectors, in part due to excitement for generative artificial intelligence applications. The index gained 14.07% year to date through July, including strong gains in both June (+4.50%) and July (+4.07%). The rally for international equities sputtered for the next three months (-11.33%) amid a stalling pattern in disinflationary trends, heightened global recession and geopolitical risks, soaring yields on longer-term U.S. government bonds and particularly weak economic conditions in the eurozone and China. The three-month decline left non-U.S. stocks up 1.15% year to date through October. For the full 12 months, nearly all regions advanced, with Europe ex U.K. (+18%) and Japan (+17%) leading, whereas Canada (-0.38%) lagged by the widest margin. Each of the 11 sectors advanced, with information technology (+21%) and consumer discretionary (+19%) leading the way. Energy and industrials each rose about 14%. Conversely, four defensive-oriented sectors lagged by the widest margin: real estate (+4%), health care (+6%), consumer staples (+7%) and utilities (+8%).
Comments from Co-Lead-Managers Allyson Ke and Faris Rahman:
For the fiscal year ending October 31, 2023, the fund gained 16.08%, versus 15.89% for the benchmark FTSE Capped Nordic Index. From a regional standpoint, an underweight in Europe ex the U.K., primarily in Finland, contributed to the fund's performance versus the benchmark. By sector, sector-and-industry positioning contributed, especially an underweight in information technology. An underweight in utilities also helped. An overweight in health care, primarily within the pharmaceuticals, biotechnology & life sciences industry, also boosted the fund's relative performance. Not owning Nokia, a benchmark component that returned -23%, was the fund's top individual relative contributor. The second-largest relative contributor was an overweight in Novo-Nordisk (+77%). Novo-Nordisk was the fund's largest holding. Not owning Hexagon, a benchmark component that returned -17%, was another notable relative contributor. In contrast, from a regional standpoint, picks in Europe ex the U.K., primarily in Denmark, detracted from the fund's relative result. By sector, the biggest detractor from performance versus the benchmark was an overweight in energy. Stock selection and an overweight in industrials, primarily within the capital goods industry, also hampered the fund's result. Also detracting from our result was stock picking in consumer discretionary. The biggest individual relative detractor was an overweight in Vestas Wind Systems (-31%). Vestas Wind Systems was among the fund's largest holdings at period end. This was a stake we established this period. A second notable relative detractor was an overweight in Elisa (-9%). An overweight in Equinor (-1%) also detracted. Equinor was one of our biggest holdings. Notable changes in positioning include decreased exposure to the consumer staples sector and a higher allocation to health care.
The views expressed above reflect those of the portfolio manager(s) only through the end of the period as stated on the cover of this report and do not necessarily represent the views of Fidelity or any other person in the Fidelity organization. Any such views are subject to change at any time based upon market or other conditions and Fidelity disclaims any responsibility to update such views. These views may not be relied on as investment advice and, because investment decisions for a Fidelity fund are based on numerous factors, may not be relied on as an indication of trading intent on behalf of any Fidelity fund.
Fidelity® Nordic Fund
Top Holdings (% of Fund's net assets) |
| |
| Novo Nordisk A/S Series B (Denmark, Pharmaceuticals) | 27.8 | |
| Nordea Bank Abp (Finland, Banks) | 5.0 | |
| Investor AB (B Shares) (Sweden, Financial Services) | 5.0 | |
| Atlas Copco AB (B Shares) (Sweden, Machinery) | 4.4 | |
| DSV A/S (Denmark, Air Freight & Logistics) | 3.4 | |
| Equinor ASA (Norway, Oil, Gas & Consumable Fuels) | 3.3 | |
| Sandvik AB (Sweden, Machinery) | 2.9 | |
| ASSA ABLOY AB (B Shares) (Sweden, Building Products) | 2.6 | |
| Vestas Wind Systems A/S (Denmark, Electrical Equipment) | 2.6 | |
| Carlsberg A/S Series B (Denmark, Beverages) | 2.4 | |
| | 59.4 | |
| |
| Market Sectors (% of Fund's net assets) |
| |
| Health Care | 31.3 | |
| Industrials | 25.0 | |
| Financials | 16.6 | |
| Energy | 5.2 | |
| Materials | 5.1 | |
| Communication Services | 4.0 | |
| Consumer Discretionary | 3.3 | |
| Consumer Staples | 3.0 | |
| Information Technology | 2.1 | |
| Real Estate | 0.4 | |
| |
The Fund may invest up to 35% of its total assets in any industry that represents more than 20% of the Nordic market. As of October 31, 2023, the Fund did not have more than 25% of its total assets invested in any one industry.
Asset Allocation (% of Fund's net assets) |
|
|
Geographic Diversification (% of Fund's net assets) |
|
* Includes Short-Term investments and Net Other Assets (Liabilities). Percentages are adjusted for the effect of derivatives, if applicable. |
| |
Fidelity® Nordic Fund
Showing Percentage of Net Assets
| Common Stocks - 96.0% |
| | | Shares | Value ($) |
| Denmark - 41.2% | | | |
| Carlsberg A/S Series B | | 57,000 | 6,792,873 |
| Demant A/S (a) | | 64,100 | 2,441,775 |
| DSV A/S | | 66,200 | 9,873,103 |
| Genmab A/S (a) | | 21,600 | 6,105,951 |
| Novo Nordisk A/S Series B | | 827,000 | 79,785,847 |
| Tryg A/S | | 291,383 | 5,686,177 |
| Vestas Wind Systems A/S (a) | | 342,000 | 7,412,776 |
TOTAL DENMARK | | | 118,098,502 |
| Finland - 11.1% | | | |
| Elisa Corp. (A Shares) | | 152,200 | 6,454,596 |
| Neste OYJ | | 131,700 | 4,418,845 |
| Nordea Bank Abp | | 1,374,344 | 14,442,219 |
| Sampo Oyj (A Shares) | | 89,800 | 3,526,095 |
| UPM-Kymmene Corp. (b) | | 89,600 | 3,011,979 |
TOTAL FINLAND | | | 31,853,734 |
| Norway - 7.7% | | | |
| Equinor ASA | | 283,300 | 9,497,127 |
| Kongsberg Gruppen ASA | | 89,200 | 3,641,159 |
| Mowi ASA | | 115,300 | 1,871,272 |
| Norsk Hydro ASA | | 913,300 | 5,208,282 |
| Selvaag Bolig ASA | | 321,200 | 764,834 |
| TGS ASA | | 79,300 | 1,080,433 |
TOTAL NORWAY | | | 22,063,107 |
| Sweden - 36.0% | | | |
| Alfa Laval AB | | 184,900 | 5,973,146 |
| ASSA ABLOY AB (B Shares) | | 349,400 | 7,447,488 |
| Atlas Copco AB (B Shares) | | 1,112,400 | 12,461,925 |
| Autoliv, Inc. | | 16,700 | 1,530,555 |
| Beijer Alma AB (B Shares) | | 86,600 | 1,376,296 |
| Eltel AB (a)(c) | | 1,544,681 | 910,553 |
| Evolution AB (c) | | 67,100 | 5,962,534 |
| Fortnox AB | | 600,600 | 2,374,970 |
| Haypp Group (a) | | 385,600 | 1,551,043 |
| Hemnet Group AB | | 272,500 | 4,728,644 |
| HEXPOL AB (B Shares) | | 304,170 | 2,689,515 |
| Indutrade AB | | 277,600 | 4,902,942 |
| Investor AB (B Shares) | | 774,500 | 14,182,173 |
| Lagercrantz Group AB (B Shares) | | 394,353 | 3,592,912 |
| Nibe Industrier AB (B Shares) | | 301,200 | 1,731,790 |
| Nordnet AB | | 294,900 | 4,160,982 |
| Rusta AB | | 148,900 | 604,273 |
| Saab AB (B Shares) | | 91,900 | 4,709,253 |
| Sandvik AB | | 489,000 | 8,329,146 |
| Surgical Science Sweden AB (a) | | 124,000 | 1,405,247 |
| Svenska Cellulosa AB SCA (B Shares) | | 272,700 | 3,736,587 |
| Swedbank AB (A Shares) | | 338,299 | 5,538,582 |
| Swedish Logistic Property AB (a) | | 131,004 | 305,139 |
| Trelleborg AB (B Shares) | | 118,700 | 2,994,497 |
TOTAL SWEDEN | | | 103,200,192 |
| TOTAL COMMON STOCKS (Cost $234,330,751) | | | 275,215,535 |
| | | | |
| Money Market Funds - 4.5% |
| | | Shares | Value ($) |
| Fidelity Cash Central Fund 5.40% (d) | | 9,210,009 | 9,211,851 |
| Fidelity Securities Lending Cash Central Fund 5.40% (d)(e) | | 3,655,634 | 3,656,000 |
| TOTAL MONEY MARKET FUNDS (Cost $12,867,851) | | | 12,867,851 |
| | | | |
| TOTAL INVESTMENT IN SECURITIES - 100.5% (Cost $247,198,602) | 288,083,386 |
NET OTHER ASSETS (LIABILITIES) - (0.5)% | (1,430,598) |
| NET ASSETS - 100.0% | 286,652,788 |
| | |
Legend
| (b) | Security or a portion of the security is on loan at period end. |
| (c) | Security exempt from registration under Rule 144A of the Securities Act of 1933. These securities may be resold in transactions exempt from registration, normally to qualified institutional buyers. At the end of the period, the value of these securities amounted to $6,873,087 or 2.4% of net assets. |
| (d) | Affiliated fund that is generally available only to investment companies and other accounts managed by Fidelity Investments. The rate quoted is the annualized seven-day yield of the fund at period end. A complete unaudited listing of the fund's holdings as of its most recent quarter end is available upon request. In addition, each Fidelity Central Fund's financial statements, which are not covered by the Fund's Report of Independent Registered Public Accounting Firm, are available on the SEC's website or upon request. |
| (e) | Investment made with cash collateral received from securities on loan. |
Affiliated Central Funds
Fiscal year to date information regarding the Fund's investments in Fidelity Central Funds, including the ownership percentage, is presented below.
| Affiliate | Value, beginning of period ($) | Purchases ($) | Sales Proceeds ($) | Dividend Income ($) | Realized Gain (loss) ($) | Change in Unrealized appreciation (depreciation) ($) | Value, end of period ($) | % ownership, end of period |
| Fidelity Cash Central Fund 5.40% | 2,293,839 | 75,944,107 | 69,026,095 | 364,910 | - | - | 9,211,851 | 0.0% |
| Fidelity Securities Lending Cash Central Fund 5.40% | - | 60,095,153 | 56,439,153 | 40,585 | - | - | 3,656,000 | 0.0% |
| Total | 2,293,839 | 136,039,260 | 125,465,248 | 405,495 | - | - | 12,867,851 | |
| | | | | | | | | |
Amounts in the dividend income column in the above table include any capital gain distributions from underlying funds, which are presented in the corresponding line item in the Statement of Operations, if applicable.
Amounts in the dividend income column for Fidelity Securities Lending Cash Central Fund represents the income earned on investing cash collateral, less rebates paid to borrowers and any lending agent fees associated with the loan, plus any premium payments received for lending certain types of securities.
Amounts included in the purchases and sales proceeds columns may include in-kind transactions, if applicable.
Investment Valuation
The following is a summary of the inputs used, as of October 31, 2023, involving the Fund's assets and liabilities carried at fair value. The inputs or methodology used for valuing securities may not be an indication of the risk associated with investing in those securities. For more information on valuation inputs, and their aggregation into the levels used below, please refer to the Investment Valuation section in the accompanying Notes to Financial Statements.
| Valuation Inputs at Reporting Date: |
| Description | Total ($) | Level 1 ($) | Level 2 ($) | Level 3 ($) |
Investments in Securities: | | | | |
|
| Equities: | | | | |
Communication Services | 11,183,240 | 11,183,240 | - | - |
Consumer Discretionary | 9,648,405 | 9,648,405 | - | - |
Consumer Staples | 8,664,145 | 1,871,272 | 6,792,873 | - |
Energy | 14,996,405 | 5,499,278 | 9,497,127 | - |
Financials | 47,536,228 | 47,536,228 | - | - |
Health Care | 89,738,820 | 3,847,022 | 85,891,798 | - |
Industrials | 71,764,074 | 48,574,664 | 23,189,410 | - |
Information Technology | 5,967,882 | 5,967,882 | - | - |
Materials | 14,646,363 | 9,438,081 | 5,208,282 | - |
Real Estate | 1,069,973 | 1,069,973 | - | - |
|
| Money Market Funds | 12,867,851 | 12,867,851 | - | - |
| Total Investments in Securities: | 288,083,386 | 157,503,896 | 130,579,490 | - |
Fidelity® Nordic Fund
| Statement of Assets and Liabilities |
| | | | October 31, 2023 |
| | | | | |
| Assets | | | | |
| Investment in securities, at value (including securities loaned of $3,476,620) - See accompanying schedule: | | | | |
Unaffiliated issuers (cost $234,330,751) | $ | 275,215,535 | | |
Fidelity Central Funds (cost $12,867,851) | | 12,867,851 | | |
| | | | | |
| | | | | |
| Total Investment in Securities (cost $247,198,602) | | | $ | 288,083,386 |
| Foreign currency held at value (cost $902,295) | | | | 901,980 |
| Receivable for fund shares sold | | | | 16,265 |
| Dividends receivable | | | | 60,439 |
| Reclaims receivable | | | | 1,878,766 |
| Distributions receivable from Fidelity Central Funds | | | | 36,159 |
| Prepaid expenses | | | | 442 |
Total assets | | | | 290,977,437 |
| Liabilities | | | | |
| Payable for investments purchased | $ | 71,061 | | |
| Payable for fund shares redeemed | | 147,074 | | |
| Accrued management fee | | 164,477 | | |
| Other affiliated payables | | 53,740 | | |
| Other payables and accrued expenses | | 232,297 | | |
| Collateral on securities loaned | | 3,656,000 | | |
| Total Liabilities | | | | 4,324,649 |
| Net Assets | | | $ | 286,652,788 |
| Net Assets consist of: | | | | |
| Paid in capital | | | $ | 258,088,664 |
| Total accumulated earnings (loss) | | | | 28,564,124 |
| Net Assets | | | $ | 286,652,788 |
Net Asset Value, offering price and redemption price per share ($286,652,788 ÷ 5,353,244 shares) | | | $ | 53.55 |
| Statement of Operations |
| | | | Year ended October 31, 2023 |
| Investment Income | | | | |
| Dividends | | | $ | 8,189,631 |
| Foreign Tax Reclaims | | | | 1,653,431 |
| Income from Fidelity Central Funds (including $40,585 from security lending) | | | | 405,495 |
| Income before foreign taxes withheld | | | $ | 10,248,557 |
| Less foreign taxes withheld | | | | (2,212,804) |
| Total Income | | | | 8,035,753 |
| Expenses | | | | |
| Management fee | $ | 2,068,185 | | |
| Transfer agent fees | | 504,241 | | |
| Accounting fees | | 152,632 | | |
| Custodian fees and expenses | | 25,434 | | |
| Independent trustees' fees and expenses | | 1,726 | | |
| Registration fees | | 27,557 | | |
| Audit | | 89,482 | | |
| Legal | | 297 | | |
| Miscellaneous | | 1,209 | | |
| Total expenses before reductions | | 2,870,763 | | |
| Expense reductions | | (19,191) | | |
| Total expenses after reductions | | | | 2,851,572 |
| Net Investment income (loss) | | | | 5,184,181 |
| Realized and Unrealized Gain (Loss) | | | | |
| Net realized gain (loss) on: | | | | |
| Investment Securities: | | | | |
| Unaffiliated issuers | | 1,429,492 | | |
| Foreign currency transactions | | 451,178 | | |
| Total net realized gain (loss) | | | | 1,880,670 |
| Change in net unrealized appreciation (depreciation) on: | | | | |
| Investment Securities: | | | | |
| Unaffiliated issuers | | 34,474,964 | | |
| Assets and liabilities in foreign currencies | | 5,676 | | |
| Total change in net unrealized appreciation (depreciation) | | | | 34,480,640 |
| Net gain (loss) | | | | 36,361,310 |
| Net increase (decrease) in net assets resulting from operations | | | $ | 41,545,491 |
| Statement of Changes in Net Assets |
| |
| | Year ended October 31, 2023 | | Year ended October 31, 2022 |
| Increase (Decrease) in Net Assets | | | | |
| Operations | | | | |
| Net investment income (loss) | $ | 5,184,181 | $ | 4,639,612 |
| Net realized gain (loss) | | 1,880,670 | | (8,220,001) |
| Change in net unrealized appreciation (depreciation) | | 34,480,640 | | (114,229,877) |
| Net increase (decrease) in net assets resulting from operations | | 41,545,491 | | (117,810,266) |
| Distributions to shareholders | | - | | (53,400,933) |
| | | | | |
| Share transactions | | | | |
| Proceeds from sales of shares | | 44,092,104 | | 29,607,219 |
| Reinvestment of distributions | | - | | 49,862,949 |
| Cost of shares redeemed | | (56,149,155) | | (73,768,106) |
| | | | | |
Net increase (decrease) in net assets resulting from share transactions | | (12,057,051) | | 5,702,062 |
| Total increase (decrease) in net assets | | 29,488,440 | | (165,509,137) |
| | | | | |
| Net Assets | | | | |
| Beginning of period | | 257,164,348 | | 422,673,485 |
| End of period | $ | 286,652,788 | $ | 257,164,348 |
| | | | | |
| Other Information | | | | |
| Shares | | | | |
| Sold | | 789,514 | | 545,297 |
| Issued in reinvestment of distributions | | - | | 819,642 |
| Redeemed | | (1,011,489) | | (1,383,136) |
| Net increase (decrease) | | (221,975) | | (18,197) |
| | | | | |
Financial Highlights
| Years ended October 31, | | 2023 | | 2022 | | 2021 | | 2020 | | 2019 |
Selected Per-Share Data | | | | | | | | | | |
| Net asset value, beginning of period | $ | 46.13 | $ | 75.57 | $ | 56.51 | $ | 46.69 | $ | 49.64 |
| Income from Investment Operations | | | | | | | | | | |
Net investment income (loss) A,B | | .93 | | .78 | | 1.06 | | .15 | | 1.50 C |
| Net realized and unrealized gain (loss) | | 6.49 | | (20.65) D | | 20.17 | | 11.86 | | .15 |
| Total from investment operations | | 7.42 | | (19.87) | | 21.23 | | 12.01 | | 1.65 |
| Distributions from net investment income | | - | | (3.02) | | (.96) | | (1.60) | | (.05) |
| Distributions from net realized gain | | - | | (6.56) | | (1.21) | | (.59) | | (4.55) |
| Total distributions | | - | | (9.57) E | | (2.17) | | (2.19) | | (4.60) |
| Net asset value, end of period | $ | 53.55 | $ | 46.13 | $ | 75.57 | $ | 56.51 | $ | 46.69 |
Total Return F | | 16.08% | | (29.33)% D | | 38.39% | | 26.73% | | 3.96% |
Ratios to Average Net Assets B,G,H | | | | | | | | | | |
| Expenses before reductions | | .94% | | .93% | | .92% | | .96% | | .98% |
| Expenses net of fee waivers, if any | | .93% | | .92% | | .92% | | .96% | | .98% |
| Expenses net of all reductions | | .93% | | .92% | | .92% | | .96% | | .96% |
| Net investment income (loss) | | 1.69% | | 1.45% | | 1.51% | | .31% | | 3.28% C |
| Supplemental Data | | | | | | | | | | |
| Net assets, end of period (000 omitted) | $ | 286,653 | $ | 257,164 | $ | 422,673 | $ | 301,424 | $ | 261,896 |
Portfolio turnover rate I | | 23% | | 42% | | 34% | | 29% | | 34% |
ACalculated based on average shares outstanding during the period.
BNet investment income (loss) is affected by the timing of the declaration of dividends by any underlying mutual funds or exchange-traded funds (ETFs). Net investment income (loss) of any mutual funds or ETFs is not included in the Fund's net investment income (loss) ratio.
CNet investment income per share reflects one or more large, non-recurring dividend(s) which amounted to $.82 per share. Excluding such non-recurring dividend(s), the ratio of net investment income (loss) to average net assets would have been 1.50%.
DAmount includes a reimbursement from the investment adviser for an operational error which amounted to less than $.01 per share. Excluding this reimbursement, the total return would have been (29.35)%.
ETotal distributions per share do not sum due to rounding.
FTotal returns would have been lower if certain expenses had not been reduced during the applicable periods shown.
GFees and expenses of any underlying mutual funds or exchange-traded funds (ETFs) are not included in the Fund's expense ratio. The Fund indirectly bears its proportionate share of these expenses. For additional expense information related to investments in Fidelity Central Funds, please refer to the "Investments in Fidelity Central Funds" note found in the Notes to Financial Statements section of the most recent Annual or Semi-Annual report.
HExpense ratios reflect operating expenses of the class. Expenses before reductions do not reflect amounts reimbursed, waived, or reduced through arrangements with the investment adviser, brokerage services, or other offset arrangements, if applicable, and do not represent the amount paid by the class during periods when reimbursements, waivers or reductions occur.
IAmount does not include the portfolio activity of any underlying mutual funds or exchange-traded funds (ETFs).
For the period ended October 31, 2023
1. Organization.
Fidelity Nordic Fund (the Fund) is a fund of Fidelity Investment Trust (the Trust) and is authorized to issue an unlimited number of shares. Share transactions on the Statement of Changes in Net Assets may contain exchanges between affiliated funds. The Trust is registered under the Investment Company Act of 1940, as amended (the 1940 Act), as an open-end management investment company organized as a Massachusetts business trust.
2. Investments in Fidelity Central Funds.
Funds may invest in Fidelity Central Funds, which are open-end investment companies generally available only to other investment companies and accounts managed by the investment adviser and its affiliates. The Schedule of Investments lists any Fidelity Central Funds held as an investment as of period end, but does not include the underlying holdings of each Fidelity Central Fund. An investing fund indirectly bears its proportionate share of the expenses of the underlying Fidelity Central Funds.
Based on its investment objective, each Fidelity Central Fund may invest or participate in various investment vehicles or strategies that are similar to those of the investing fund. These strategies are consistent with the investment objectives of the investing fund and may involve certain economic risks which may cause a decline in value of each of the Fidelity Central Funds and thus a decline in the value of the investing fund.
| Fidelity Central Fund | Investment Manager | Investment Objective | Investment Practices | Expense RatioA |
| Fidelity Money Market Central Funds | Fidelity Management & Research Company LLC (FMR) | Each fund seeks to obtain a high level of current income consistent with the preservation of capital and liquidity. | Short-term Investments | Less than .005% |
A Expenses expressed as a percentage of average net assets and are as of each underlying Central Fund's most recent annual or semi-annual shareholder report.
A complete unaudited list of holdings for each Fidelity Central Fund is available upon request or at the Securities and Exchange Commission website at www.sec.gov. In addition, the financial statements of the Fidelity Central Funds which contain the significant accounting policies (including investment valuation policies) of those funds, and are not covered by the Report of Independent Registered Public Accounting Firm, are available on the Securities and Exchange Commission website or upon request.
3. Significant Accounting Policies.
The Fund is an investment company and applies the accounting and reporting guidance of the Financial Accounting Standards Board (FASB) Accounting Standards Codification Topic 946 Financial Services - Investment Companies. The financial statements have been prepared in conformity with accounting principles generally accepted in the United States of America (GAAP), which require management to make certain estimates and assumptions at the date of the financial statements. Actual results could differ from those estimates. Subsequent events, if any, through the date that the financial statements were issued have been evaluated in the preparation of the financial statements. The Fund's Schedule of Investments lists any underlying mutual funds or exchange-traded funds (ETFs) but does not include the underlying holdings of these funds. The following summarizes the significant accounting policies of the Fund:
Investment Valuation. Investments are valued as of 4:00 p.m. Eastern time on the last calendar day of the period. The Board of Trustees (the Board) has designated the Fund's investment adviser as the valuation designee responsible for the fair valuation function and performing fair value determinations as needed. The investment adviser has established a Fair Value Committee (the Committee) to carry out the day-to-day fair valuation responsibilities and has adopted policies and procedures to govern the fair valuation process and the activities of the Committee. In accordance with these fair valuation policies and procedures, which have been approved by the Board, the Fund attempts to obtain prices from one or more third party pricing services or brokers to value its investments. When current market prices, quotations or currency exchange rates are not readily available or reliable, investments will be fair valued in good faith by the Committee, in accordance with the policies and procedures. Factors used in determining fair value vary by investment type and may include market or investment specific events, transaction data, estimated cash flows, and market observations of comparable investments. The frequency that the fair valuation procedures are used cannot be predicted and they may be utilized to a significant extent. The Committee manages the Fund's fair valuation practices and maintains the fair valuation policies and procedures. The Fund's investment adviser reports to the Board information regarding the fair valuation process and related material matters.
The Fund categorizes the inputs to valuation techniques used to value its investments into a disclosure hierarchy consisting of three levels as shown below:
Level 1 - unadjusted quoted prices in active markets for identical investments
Level 2 - other significant observable inputs (including quoted prices for similar investments, interest rates, prepayment speeds, etc.)
Level 3 - unobservable inputs (including the Fund's own assumptions based on the best information available)
Valuation techniques used to value the Fund's investments by major category are as follows:
Equity securities, including restricted securities, for which market quotations are readily available, are valued at the last reported sale price or official closing price as reported by a third party pricing service on the primary market or exchange on which they are traded and are categorized as Level 1 in the hierarchy. In the event there were no sales during the day or closing prices are not available, securities are valued at the last quoted bid price or may be valued using the last available price and are generally categorized as Level 2 in the hierarchy. For foreign equity securities, when market or security specific events arise, comparisons to the valuation of American Depositary Receipts (ADRs), futures contracts, ETFs and certain indexes as well as quoted prices for similar securities may be used and would be categorized as Level 2 in the hierarchy. For equity securities, including restricted securities, where observable inputs are limited, assumptions about market activity and risk are used and these securities may be categorized as Level 3 in the hierarchy.
Investments in open-end mutual funds, including the Fidelity Central Funds, are valued at their closing net asset value (NAV) each business day and are categorized as Level 1 in the hierarchy.
Changes in valuation techniques may result in transfers in or out of an assigned level within the disclosure hierarchy. The aggregate value of investments by input level as of October 31, 2023 is included at the end of the Fund's Schedule of Investments.
Foreign Currency. Certain Funds may use foreign currency contracts to facilitate transactions in foreign-denominated securities. Gains and losses from these transactions may arise from changes in the value of the foreign currency or if the counterparties do not perform under the contracts' terms.
Foreign-denominated assets, including investment securities, and liabilities are translated into U.S. dollars at the exchange rates at period end. Purchases and sales of investment securities, income and dividends received, and expenses denominated in foreign currencies are translated into U.S. dollars at the exchange rate in effect on the transaction date.
The effects of exchange rate fluctuations on investments are included with the net realized and unrealized gain (loss) on investment securities. Other foreign currency transactions resulting in realized and unrealized gain (loss) are disclosed separately.
Investment Transactions and Income. For financial reporting purposes, the Fund's investment holdings and NAV include trades executed through the end of the last business day of the period. The NAV per share for processing shareholder transactions is calculated as of the close of business of the New York Stock Exchange (NYSE), normally 4:00 p.m. Eastern time and includes trades executed through the end of the prior business day. Gains and losses on securities sold are determined on the basis of identified cost. Commissions paid to certain brokers with whom the investment adviser, or its affiliates, places trades on behalf of a fund include an amount in addition to trade execution, which may be rebated back to a fund. Any such rebates are included in net realized gain (loss) on investments in the Statement of Operations. Dividend income is recorded on the ex-dividend date, except for certain dividends from foreign securities where the ex-dividend date may have passed, which are recorded as soon as the Fund is informed of the ex-dividend date. Non-cash dividends included in dividend income, if any, are recorded at the fair market value of the securities received. Income and capital gain distributions from Fidelity Central Funds, if any, are recorded on the ex-dividend date. Investment income is recorded net of foreign taxes withheld where recovery of such taxes is uncertain. Funds may file withholding tax reclaims in certain jurisdictions to recover a portion of amounts previously withheld. Any withholding tax reclaims income is included in the Statement of Operations in foreign taxes reclaims. Any receivables for withholding tax reclaims are included in the Statement of Assets and Liabilities in reclaims receivable. The Fund has filed tax reclaims for previously withheld taxes on dividends earned in certain European Union (EU) countries. These additional filings are subject to various administrative proceedings by the local jurisdictions' tax authorities within the EU, as well as a number of related judicial proceedings. Income recognized for EU reclaims is included with other reclaims in the Statement of Operations in foreign taxes reclaims. These reclaims are recorded when the amount is known and there are no significant uncertainties on collectability. For U.S. income tax purposes, EU reclaims received by a fund reduce the amounts of foreign taxes shareholders can use as tax credits in their individual income tax returns. In the event that EU reclaims received by a fund during the fiscal year exceed foreign withholding taxes paid in that year, and a fund previously passed foreign tax credit on to its shareholders, a fund will enter into a closing agreement with the Internal Revenue Service (IRS) in order to pay the associated tax liability on behalf of shareholders. During the fiscal year ended October 31, 2023, the Fund received EU reclaims in excess of foreign withholding taxes paid. The Fund is seeking a closing agreement with the IRS and has accrued the estimated fees as presented in the Statement of Assets and Liabilities in other payables and accrued expenses, and in the Statement of Operations in foreign taxes withheld. The actual fees may differ from the estimate.
Expenses. Expenses directly attributable to a fund are charged to that fund. Expenses attributable to more than one fund are allocated among the respective funds on the basis of relative net assets or other appropriate methods. Expenses included in the accompanying financial statements reflect the expenses of that fund and do not include any expenses associated with any underlying mutual funds or exchange-traded funds. Although not included in a fund's expenses, a fund indirectly bears its proportionate share of these expenses through the net asset value of each underlying mutual fund or exchange-traded fund. Expense estimates are accrued in the period to which they relate and adjustments are made when actual amounts are known.
Income Tax Information and Distributions to Shareholders. Each year, the Fund intends to qualify as a regulated investment company under Subchapter M of the Internal Revenue Code, including distributing substantially all of its taxable income and realized gains. As a result, no provision for U.S. Federal income taxes is required. As of October 31, 2023, the Fund did not have any unrecognized tax benefits in the financial statements; nor is the Fund aware of any tax positions for which it is reasonably possible that the total amounts of unrecognized tax benefits will significantly change in the next twelve months. The Fund files a U.S. federal tax return, in addition to state and local tax returns as required. The Fund's federal income tax returns are subject to examination by the Internal Revenue Service (IRS) for a period of three fiscal years after they are filed. State and local tax returns may be subject to examination for an additional fiscal year depending on the jurisdiction. Foreign taxes are provided for based on the Fund's understanding of the tax rules and rates that exist in the foreign markets in which it invests.
Distributions are declared and recorded on the ex-dividend date. Income and capital gain distributions are determined in accordance with income tax regulations, which may differ from GAAP.
Capital accounts within the financial statements are adjusted for permanent book-tax differences. These adjustments have no impact on net assets or the results of operations. Capital accounts are not adjusted for temporary book-tax differences which will reverse in a subsequent period.
Book-tax differences are primarily due to foreign currency transactions, passive foreign investment companies (PFIC), net operating losses, capital loss carryforwards and losses deferred due to wash sales and excise tax regulations.
As of period end, the cost and unrealized appreciation (depreciation) in securities, and derivatives if applicable, for federal income tax purposes were as follows:
| Gross unrealized appreciation | $66,962,009 |
| Gross unrealized depreciation | (31,253,679) |
| Net unrealized appreciation (depreciation) | $35,708,330 |
| Tax Cost | $252,375,056 |
The tax-based components of distributable earnings as of period end were as follows:
| Undistributed ordinary income | $- |
| Capital loss carryforward | $(7,039,045) |
| Net unrealized appreciation (depreciation) on securities and other investments | $35,603,171 |
Capital loss carryforwards are only available to offset future capital gains of the Fund to the extent provided by regulations and may be limited. The capital loss carryforward information presented below, including any applicable limitation, is estimated as of fiscal period end and is subject to adjustment.
Short-term | $(7,039,045) |
| Total capital loss carryforward | $(7,039,045) |
The tax character of distributions paid was as follows:
| | October 31, 2023 | October 31, 2022 |
| Ordinary Income | $- | $17,742,045 |
| Long-term Capital Gains | - | 35,658,888 |
| Total | $- | $53,400,933 |
Restricted Securities (including Private Placements). Funds may invest in securities that are subject to legal or contractual restrictions on resale. These securities generally may be resold in transactions exempt from registration or to the public if the securities are registered. Disposal of these securities may involve time-consuming negotiations and expense, and prompt sale at an acceptable price may be difficult. Information regarding restricted securities held at period end is included at the end of the Schedule of Investments, if applicable.
4. Purchases and Sales of Investments.
Purchases and sales of securities, other than short-term securities and in-kind transactions, as applicable, are noted in the table below.
| | Purchases ($) | Sales ($) |
| Fidelity Nordic Fund | 67,112,332 | 78,782,312 |
5. Fees and Other Transactions with Affiliates.
Management Fee. Fidelity Management & Research Company LLC (the investment adviser) and its affiliates provide the Fund with investment management related services for which the Fund pays a monthly management fee. The management fee is the sum of an individual fund fee rate that is based on an annual rate of .45% of the Fund's average net assets and an annualized group fee rate that averaged .23% during the period. The group fee rate is based upon the monthly average net assets of a group of registered investment companies with which the investment adviser has management contracts. The group fee rate decreases as assets under management increase and increases as assets under management decrease. For the reporting period, the total annual management fee rate was .68% of the Fund's average net assets.
Transfer Agent Fees. Fidelity Investments Institutional Operations Company LLC (FIIOC), an affiliate of the investment adviser, is the Fund's transfer, dividend disbursing and shareholder servicing agent. FIIOC receives account fees and asset-based fees that vary according to account size and type of account. FIIOC pays for typesetting, printing and mailing of shareholder reports, except proxy statements. For the period, the transfer agent fees were equivalent to an annual rate of .16% of average net assets.
During November 2023, the Board approved a change in the transfer agent fees effective December 1, 2023 to a fixed annual rate of 0.1637% of average net assets.
Accounting Fees. Fidelity Service Company, Inc. (FSC), an affiliate of the investment adviser, maintains the Fund's accounting records. The accounting fee is based on the level of average net assets for each month. For the period, the fees were equivalent to the following annual rates:
| | % of Average Net Assets |
| Fidelity Nordic Fund | .05 |
During November 2023, the Board approved a change in the accounting fees effective December 1, 2023 to a fixed annual rate of average net assets as follows:
| | % of Average Net Assets |
| Fidelity Nordic Fund | 0.0498 |
Interfund Trades. Funds may purchase from or sell securities to other Fidelity Funds under procedures adopted by the Board. The procedures have been designed to ensure these interfund trades are executed in accordance with Rule 17a-7 of the 1940 Act. Any interfund trades are included within the respective purchases and sales amounts shown in the Purchases and Sales of Investments note. Interfund trades during the period are noted in the table below.
| | Purchases ($) | Sales ($) | Realized Gain (Loss) ($) |
| Fidelity Nordic Fund | 1,713,922 | 626,733 | 41,582 |
Other. During the period, the investment adviser reimbursed the Fund for certain losses as follows:
| | Amount ($) |
| Fidelity Nordic Fund | 1,474 |
6. Committed Line of Credit.
Certain Funds participate with other funds managed by the investment adviser or an affiliate in a $4.25 billion credit facility (the "line of credit") to be utilized for temporary or emergency purposes to fund shareholder redemptions or for other short-term liquidity purposes. The participating funds have agreed to pay commitment fees on their pro-rata portion of the line of credit, which are reflected in Miscellaneous expenses on the Statement of Operations, and are listed below. During the period, there were no borrowings on this line of credit.
| | Amount |
| Fidelity Nordic Fund | $549 |
7. Security Lending.
Funds lend portfolio securities from time to time in order to earn additional income. Lending agents are used, including National Financial Services (NFS), an affiliate of the investment adviser. Pursuant to a securities lending agreement, NFS will receive a fee, which is capped at 9.9% of a fund's daily lending revenue, for its services as lending agent. A fund may lend securities to certain qualified borrowers, including NFS. On the settlement date of the loan, a fund receives collateral (in the form of U.S. Treasury obligations, letters of credit and/or cash) against the loaned securities and maintains collateral in an amount not less than 100% of the market value of the loaned securities during the period of the loan. The market value of the loaned securities is determined at the close of business of a fund and any additional required collateral is delivered to a fund on the next business day. A fund or borrower may terminate the loan at any time, and if the borrower defaults on its obligation to return the securities loaned because of insolvency or other reasons, a fund may apply collateral received from the borrower against the obligation. A fund may experience delays and costs in recovering the securities loaned. Any cash collateral received is invested in the Fidelity Securities Lending Cash Central Fund. Any loaned securities are identified as such in the Schedule of Investments, and the value of loaned securities and cash collateral at period end, as applicable, are presented in the Statement of Assets and Liabilities. Security lending income represents the income earned on investing cash collateral, less rebates paid to borrowers and any lending agent fees associated with the loan, plus any premium payments received for lending certain types of securities. Security lending income is presented in the Statement of Operations as a component of income from Fidelity Central Funds. Affiliated security lending activity, if any, was as follows:
| | Total Security Lending Fees Paid to NFS | Security Lending Income From Securities Loaned to NFS | Value of Securities Loaned to NFS at Period End |
| Fidelity Nordic Fund | $4,303 | $- | $- |
8. Expense Reductions.
Through arrangements with the Fund's custodian, credits realized as a result of certain uninvested cash balances were used to reduce the Fund's expenses by $615.
In addition, during the period the investment adviser or an affiliate reimbursed and/or waived a portion of operating expenses in the amount of $18,576.
9. Other.
A fund's organizational documents provide former and current trustees and officers with a limited indemnification against liabilities arising in connection with the performance of their duties to the fund. In the normal course of business, a fund may also enter into contracts that provide general indemnifications. A fund's maximum exposure under these arrangements is unknown as this would be dependent on future claims that may be made against a fund. The risk of material loss from such claims is considered remote.
10. Risk and Uncertainties.
Many factors affect a fund's performance. Developments that disrupt global economies and financial markets, such as pandemics, epidemics, outbreaks of infectious diseases, war, terrorism, and environmental disasters, may significantly affect a fund's investment performance. The effects of these developments to a fund will be impacted by the types of securities in which a fund invests, the financial condition, industry, economic sector, and geographic location of an issuer, and a fund's level of investment in the securities of that issuer. Significant concentrations in security types, issuers, industries, sectors, and geographic locations may magnify the factors that affect a fund's performance.
Average annual total return reflects the change in the value of an investment, assuming reinvestment of distributions from dividend income and capital gains (the profits earned upon the sale of securities that have grown in value, if any) and assuming a constant rate of performance each year. The hypothetical investment and the average annual total returns do not reflect the deduction of taxes that a shareholder would pay on fund distributions or the redemption of fund shares. During periods of reimbursement by Fidelity, a fund's total return will be greater than it would be had the reimbursement not occurred. How a fund did yesterday is no guarantee of how it will do tomorrow.
| Average Annual Total Returns |
| | | | |
Periods ended October 31, 2023 | Past 1 year | Past 5 years | Past 10 years |
| Fidelity® Pacific Basin Fund | 16.06% | 6.53% | 5.90% |
| $10,000 Over 10 Years |
| |
Let's say hypothetically that $10,000 was invested in Fidelity® Pacific Basin Fund on October 31, 2013. The chart shows how the value of your investment would have changed, and also shows how the MSCI AC (All Country) Pacific Index performed over the same period. |
|
|
Fidelity® Pacific Basin Fund
Market Recap:
International (non-U.S.) equities gained 12.27% for the 12 months ending October 31, 2023, according to the MSCI ACWI (All Country World Index) ex USA Index, as global economic expansion and a slowing in the pace of inflation in some markets provided a favorable backdrop for risk assets. After returning -15.86% in 2022, the index's upturn has been largely driven by a narrow set of companies in the information technology and communication services sectors, in part due to excitement for generative artificial intelligence applications. The index gained 14.07% year to date through July, including strong gains in both June (+4.50%) and July (+4.07%). The rally for international equities sputtered for the next three months (-11.33%) amid a stalling pattern in disinflationary trends, heightened global recession and geopolitical risks, soaring yields on longer-term U.S. government bonds and particularly weak economic conditions in the eurozone and China. The three-month decline left non-U.S. stocks up 1.15% year to date through October. For the full 12 months, nearly all regions advanced, with Europe ex U.K. (+18%) and Japan (+17%) leading, whereas Canada (-0.38%) lagged by the widest margin. Each of the 11 sectors advanced, with information technology (+21%) and consumer discretionary (+19%) leading the way. Energy and industrials each rose about 14%. Conversely, four defensive-oriented sectors lagged by the widest margin: real estate (+4%), health care (+6%), consumer staples (+7%) and utilities (+8%).
Comments from Co-Managers Kirk Neureiter and Stephen Lieu:
For the fiscal year ending October 31, 2023, the fund gained 16.06%, versus 14.51% for the benchmark MS All Country Pacific Free (Net of MA Tax) Index. From a regional standpoint, stock picks in emerging markets, especially China, and positioning in Asia-Pacific ex-Japan contributed to the fund's performance versus the benchmark. By sector, security selection was the primary contributor, especially within communication services and consumer discretionary. Picks and an overweight in information technology, primarily within the semiconductors & semiconductor equipment industry, also boosted relative performance. The top individual relative contributor was an overweight in PDD Holdings (+150%). This period we decreased our investment in PDD. A second notable relative contributor was an overweight in Renesas Electronics (+54%), and we reduced our holdings. An overweight in Kansai Electric Power (+48%) also contributed. This was a stake we established this period. In contrast, from a regional standpoint, stock selection in Japan and non-benchmark allocations to the U.S. and the U.K. detracted from the fund's relative result. By sector, the biggest detractor from performance versus the benchmark was security selection in financials. Picks in industrials and an overweight in health care also hampered the fund's result. The fund's non-benchmark stake in Resmed returned approximately -33% and was the biggest individual relative detractor. Resmed was not held at period end. A non-benchmark stake in Chervon Holdings returned -24% and was the second-largest relative detractor. This period we increased our investment in Chervon Holdings. Another notable relative detractor was our stake in Olympus (-13%). Olympus was not held at period end. Notable changes in positioning include increased exposure to the consumer discretionary sector and a lower allocation to health care.
The views expressed above reflect those of the portfolio manager(s) only through the end of the period as stated on the cover of this report and do not necessarily represent the views of Fidelity or any other person in the Fidelity organization. Any such views are subject to change at any time based upon market or other conditions and Fidelity disclaims any responsibility to update such views. These views may not be relied on as investment advice and, because investment decisions for a Fidelity fund are based on numerous factors, may not be relied on as an indication of trading intent on behalf of any Fidelity fund.
Fidelity® Pacific Basin Fund
Top Holdings (% of Fund's net assets) |
| |
| Taiwan Semiconductor Manufacturing Co. Ltd. (Taiwan, Semiconductors & Semiconductor Equipment) | 7.3 | |
| Samsung Electronics Co. Ltd. (Korea (South), Technology Hardware, Storage & Peripherals) | 5.3 | |
| Alibaba Group Holding Ltd. (China, Broadline Retail) | 5.3 | |
| Tencent Holdings Ltd. (China, Interactive Media & Services) | 4.2 | |
| AIA Group Ltd. (Hong Kong, Insurance) | 3.0 | |
| Sony Group Corp. (Japan, Household Durables) | 2.6 | |
| ORIX Corp. (Japan, Financial Services) | 2.5 | |
| Shin-Etsu Chemical Co. Ltd. (Japan, Chemicals) | 2.4 | |
| DENSO Corp. (Japan, Automobile Components) | 2.3 | |
| Hitachi Ltd. (Japan, Industrial Conglomerates) | 2.0 | |
| | 36.9 | |
| |
| Market Sectors (% of Fund's net assets) |
| |
| Consumer Discretionary | 21.2 | |
| Information Technology | 19.8 | |
| Financials | 16.9 | |
| Industrials | 11.0 | |
| Communication Services | 10.3 | |
| Health Care | 7.9 | |
| Materials | 3.2 | |
| Real Estate | 3.0 | |
| Energy | 2.5 | |
| Consumer Staples | 2.0 | |
| Utilities | 1.7 | |
| |
Asset Allocation (% of Fund's net assets) |
|
|
Geographic Diversification (% of Fund's net assets) |
|
* Includes Short-Term investments and Net Other Assets (Liabilities). Percentages are adjusted for the effect of derivatives, if applicable. |
| |
Fidelity® Pacific Basin Fund
Showing Percentage of Net Assets
| Common Stocks - 94.1% |
| | | Shares | Value ($) |
| Australia - 7.8% | | | |
| Aristocrat Leisure Ltd. | | 196,979 | 4,841,765 |
| CAR Group Ltd. | | 243,614 | 4,294,248 |
| Cogstate Ltd. (a) | | 1,950,314 | 1,835,025 |
| Flight Centre Travel Group Ltd. (b) | | 270,111 | 3,210,902 |
| HUB24 Ltd. | | 247,352 | 4,775,801 |
| Macquarie Group Ltd. | | 91,015 | 9,355,430 |
| National Australia Bank Ltd. | | 439,197 | 7,867,887 |
| National Storage REIT unit | | 3,358,160 | 4,281,603 |
| Newcrest Mining Ltd. | | 332,402 | 5,095,202 |
| Santos Ltd. | | 1,050,151 | 5,124,169 |
TOTAL AUSTRALIA | | | 50,682,032 |
| China - 21.9% | | | |
| Alibaba Group Holding Ltd. (a) | | 2,298,300 | 23,661,180 |
| Alibaba Group Holding Ltd. sponsored ADR (a) | | 127,400 | 10,515,596 |
| Antengene Corp. (a)(c) | | 8,904,211 | 1,764,224 |
| Centre Testing International Group Co. Ltd. (A Shares) | | 1,916,909 | 3,967,044 |
| Chervon Holdings Ltd. | | 1,894,700 | 4,666,740 |
| HUYA, Inc. ADR (a) | | 710,157 | 2,222,791 |
| JOYY, Inc. ADR | | 197,600 | 7,690,592 |
| Kweichow Moutai Co. Ltd. (A Shares) | | 33,200 | 7,647,761 |
| Li Ning Co. Ltd. | | 746,000 | 2,286,045 |
| Medlive Technology Co. Ltd. (b)(c) | | 4,890,500 | 4,882,592 |
| Meituan Class B (a)(c) | | 394,000 | 5,584,956 |
| PDD Holdings, Inc. ADR (a) | | 79,200 | 8,032,464 |
| Shangri-La Asia Ltd. (a) | | 5,218,000 | 3,328,967 |
| Shenzhen Mindray Bio-Medical Electronics Co. Ltd. (A Shares) (a) | | 130,399 | 5,097,744 |
| Tencent Holdings Ltd. | | 738,900 | 27,345,770 |
| Trip.com Group Ltd. ADR (a) | | 178,900 | 6,082,600 |
| Zai Lab Ltd. (a)(b) | | 2,452,600 | 6,259,173 |
| Zhejiang Hechuan Technology Co. Ltd. | | 663,500 | 3,714,840 |
| ZTO Express, Inc. sponsored ADR | | 175,300 | 4,131,821 |
| Zylox-Tonbridge Medical Technology Co. Ltd. (a)(c) | | 2,525,000 | 3,412,358 |
TOTAL CHINA | | | 142,295,258 |
| Hong Kong - 4.1% | | | |
| AIA Group Ltd. | | 2,210,400 | 19,194,689 |
| China Metal Recycling (Holdings) Ltd. (a)(d) | | 2,572,200 | 3 |
| Oriental Watch Holdings Ltd. | | 2,381,424 | 1,148,113 |
| Prudential PLC | | 569,885 | 5,958,939 |
TOTAL HONG KONG | | | 26,301,744 |
| India - 4.8% | | | |
| Delhivery Private Ltd. (a) | | 785,400 | 3,897,731 |
| HDFC Bank Ltd. | | 493,053 | 8,746,398 |
| HDFC Standard Life Insurance Co. Ltd. (c) | | 887,000 | 6,587,274 |
| One97 Communications Ltd. (a) | | 718,900 | 7,953,755 |
| Zomato Ltd. (a) | | 3,380,400 | 4,274,344 |
TOTAL INDIA | | | 31,459,502 |
| Japan - 40.3% | | | |
| Astellas Pharma, Inc. | | 415,800 | 5,259,818 |
| BayCurrent Consulting, Inc. | | 121,300 | 3,045,449 |
| Daiichikosho Co. Ltd. | | 232,600 | 3,438,168 |
| DENSO Corp. | | 997,600 | 14,730,894 |
| ENEOS Holdings, Inc. | | 741,900 | 2,749,049 |
| Fast Retailing Co. Ltd. | | 30,300 | 6,708,311 |
| FUJIFILM Holdings Corp. | | 85,600 | 4,682,132 |
| Fujitsu Ltd. | | 39,200 | 5,078,264 |
| Funai Soken Holdings, Inc. | | 257,200 | 4,227,316 |
| Hitachi Ltd. | | 200,800 | 12,728,035 |
| Hoya Corp. | | 125,100 | 12,043,204 |
| IHI Corp. | | 166,100 | 3,187,820 |
| INPEX Corp. | | 601,700 | 8,731,194 |
| Iriso Electronics Co. Ltd. | | 128,900 | 3,043,127 |
| JTOWER, Inc. (a)(b) | | 129,700 | 4,719,921 |
| Kakaku.com, Inc. | | 161,600 | 1,558,550 |
| Kansai Electric Power Co., Inc. | | 874,500 | 11,196,960 |
| Lifenet Insurance Co. (a) | | 370,100 | 2,364,903 |
| LY Corp. | | 3,041,400 | 7,754,009 |
| Minebea Mitsumi, Inc. | | 401,500 | 6,295,240 |
| Misumi Group, Inc. | | 262,100 | 3,967,844 |
| Mitsubishi Heavy Industries Ltd. | | 101,300 | 5,217,424 |
| Money Forward, Inc. (a) | | 122,200 | 3,086,531 |
| Murata Manufacturing Co. Ltd. | | 227,200 | 3,891,795 |
| NSD Co. Ltd. | | 228,200 | 3,970,427 |
| Open House Group Co. Ltd. | | 177,300 | 5,843,872 |
| ORIX Corp. | | 880,000 | 16,003,989 |
| Outsourcing, Inc. | | 541,100 | 4,020,863 |
| Pan Pacific International Holdings Ltd. | | 299,500 | 5,800,076 |
| Renesas Electronics Corp. (a) | | 785,400 | 10,316,716 |
| Resona Holdings, Inc. | | 1,154,800 | 6,170,469 |
| Shin-Etsu Chemical Co. Ltd. | | 513,900 | 15,367,346 |
| SMS Co., Ltd. | | 272,600 | 4,325,593 |
| Sony Group Corp. | | 204,100 | 16,968,647 |
| Square Enix Holdings Co. Ltd. | | 150,700 | 5,006,522 |
| TechnoPro Holdings, Inc. | | 325,300 | 6,444,469 |
| Tokio Marine Holdings, Inc. | | 491,300 | 10,991,480 |
| Tsuruha Holdings, Inc. (b) | | 51,300 | 3,768,329 |
| ZOZO, Inc. | | 376,300 | 7,155,248 |
TOTAL JAPAN | | | 261,860,004 |
| Korea (South) - 0.8% | | | |
| AMOREPACIFIC Corp. | | 16,557 | 1,551,837 |
| LG Corp. | | 64,290 | 3,674,441 |
TOTAL KOREA (SOUTH) | | | 5,226,278 |
| Malaysia - 0.5% | | | |
| MR DIY Group M Sdn Bhd (c) | | 10,785,800 | 3,350,971 |
| New Zealand - 0.7% | | | |
| Ryman Healthcare Ltd. | | 1,276,611 | 4,232,362 |
| Philippines - 2.3% | | | |
| Ayala Land, Inc. | | 12,153,200 | 5,965,806 |
| Robinsons Land Corp. | | 36,857,400 | 9,039,246 |
TOTAL PHILIPPINES | | | 15,005,052 |
| Singapore - 1.2% | | | |
| Sea Ltd. ADR (a) | | 84,600 | 3,527,820 |
| United Overseas Bank Ltd. | | 226,100 | 4,459,755 |
TOTAL SINGAPORE | | | 7,987,575 |
| Taiwan - 8.6% | | | |
| eMemory Technology, Inc. | | 134,000 | 8,388,828 |
| Taiwan Semiconductor Manufacturing Co. Ltd. | | 2,914,000 | 47,556,307 |
TOTAL TAIWAN | | | 55,945,135 |
| United States of America - 1.1% | | | |
| GI Dynamics, Inc. (a)(d) | | 111,225 | 1 |
| Legend Biotech Corp. ADR (a) | | 79,500 | 5,252,565 |
| Space Exploration Technologies Corp. Class A (a)(d)(e) | | 22,539 | 1,825,659 |
TOTAL UNITED STATES OF AMERICA | | | 7,078,225 |
| TOTAL COMMON STOCKS (Cost $561,614,827) | | | 611,424,138 |
| | | | |
| Preferred Stocks - 5.4% |
| | | Shares | Value ($) |
| Convertible Preferred Stocks - 0.1% | | | |
| China - 0.1% | | | |
| dMed Biopharmaceutical Co. Ltd. Series C (a)(d)(e) | | 87,773 | 516,983 |
| United States of America - 0.0% | | | |
| Canva, Inc.: | | | |
| Series A (d)(e) | | 85 | 90,711 |
| Series A2 (d)(e) | | 15 | 16,008 |
| | | | 106,719 |
TOTAL CONVERTIBLE PREFERRED STOCKS | | | 623,702 |
| Nonconvertible Preferred Stocks - 5.3% | | | |
| Korea (South) - 5.3% | | | |
| Samsung Electronics Co. Ltd. | | 867,100 | 34,567,413 |
| TOTAL PREFERRED STOCKS (Cost $44,562,406) | | | 35,191,115 |
| | | | |
| Money Market Funds - 2.1% |
| | | Shares | Value ($) |
| Fidelity Cash Central Fund 5.40% (f) | | 2,803,061 | 2,803,622 |
| Fidelity Securities Lending Cash Central Fund 5.40% (f)(g) | | 10,706,729 | 10,707,799 |
| TOTAL MONEY MARKET FUNDS (Cost $13,511,421) | | | 13,511,421 |
| | | | |
| TOTAL INVESTMENT IN SECURITIES - 101.6% (Cost $619,688,654) | 660,126,674 |
NET OTHER ASSETS (LIABILITIES) - (1.6)% | (10,161,626) |
| NET ASSETS - 100.0% | 649,965,048 |
| | |
Legend
| (b) | Security or a portion of the security is on loan at period end. |
| (c) | Security exempt from registration under Rule 144A of the Securities Act of 1933. These securities may be resold in transactions exempt from registration, normally to qualified institutional buyers. At the end of the period, the value of these securities amounted to $25,582,375 or 3.9% of net assets. |
| (e) | Restricted securities (including private placements) - Investment in securities not registered under the Securities Act of 1933 (excluding 144A issues). At the end of the period, the value of restricted securities (excluding 144A issues) amounted to $2,449,361 or 0.4% of net assets. |
| (f) | Affiliated fund that is generally available only to investment companies and other accounts managed by Fidelity Investments. The rate quoted is the annualized seven-day yield of the fund at period end. A complete unaudited listing of the fund's holdings as of its most recent quarter end is available upon request. In addition, each Fidelity Central Fund's financial statements, which are not covered by the Fund's Report of Independent Registered Public Accounting Firm, are available on the SEC's website or upon request. |
| (g) | Investment made with cash collateral received from securities on loan. |
| Additional information on each restricted holding is as follows: |
| Security | Acquisition Date | Acquisition Cost ($) |
| Canva, Inc. Series A | 9/22/23 | 90,666 |
| | | |
| Canva, Inc. Series A2 | 9/22/23 | 16,000 |
| | | |
| dMed Biopharmaceutical Co. Ltd. Series C | 12/01/20 | 1,246,653 |
| | | |
| Space Exploration Technologies Corp. Class A | 2/16/21 - 5/24/22 | 1,437,725 |
| | | |
Affiliated Central Funds
Fiscal year to date information regarding the Fund's investments in Fidelity Central Funds, including the ownership percentage, is presented below.
| Affiliate | Value, beginning of period ($) | Purchases ($) | Sales Proceeds ($) | Dividend Income ($) | Realized Gain (loss) ($) | Change in Unrealized appreciation (depreciation) ($) | Value, end of period ($) | % ownership, end of period |
| Fidelity Cash Central Fund 5.40% | 15,775,672 | 239,794,038 | 252,766,088 | 445,311 | - | - | 2,803,622 | 0.0% |
| Fidelity Securities Lending Cash Central Fund 5.40% | 9,708,475 | 171,309,119 | 170,309,795 | 63,236 | - | - | 10,707,799 | 0.0% |
| Total | 25,484,147 | 411,103,157 | 423,075,883 | 508,547 | - | - | 13,511,421 | |
| | | | | | | | | |
Amounts in the dividend income column in the above table include any capital gain distributions from underlying funds, which are presented in the corresponding line item in the Statement of Operations, if applicable.
Amounts in the dividend income column for Fidelity Securities Lending Cash Central Fund represents the income earned on investing cash collateral, less rebates paid to borrowers and any lending agent fees associated with the loan, plus any premium payments received for lending certain types of securities.
Amounts included in the purchases and sales proceeds columns may include in-kind transactions, if applicable.
Investment Valuation
The following is a summary of the inputs used, as of October 31, 2023, involving the Fund's assets and liabilities carried at fair value. The inputs or methodology used for valuing securities may not be an indication of the risk associated with investing in those securities. For more information on valuation inputs, and their aggregation into the levels used below, please refer to the Investment Valuation section in the accompanying Notes to Financial Statements.
| Valuation Inputs at Reporting Date: |
| Description | Total ($) | Level 1 ($) | Level 2 ($) | Level 3 ($) |
Investments in Securities: | | | | |
|
| Equities: | | | | |
Communication Services | 67,558,391 | 13,441,203 | 54,117,188 | - |
Consumer Discretionary | 138,298,410 | 24,630,660 | 113,561,031 | 106,719 |
Consumer Staples | 12,967,927 | - | 12,967,927 | - |
Energy | 16,604,412 | - | 16,604,412 | - |
Financials | 110,430,769 | - | 110,430,769 | - |
Health Care | 50,556,049 | 5,252,565 | 44,786,500 | 516,984 |
Industrials | 70,956,749 | 4,131,821 | 64,999,269 | 1,825,659 |
Information Technology | 128,296,380 | - | 128,296,380 | - |
Materials | 20,462,551 | 5,095,202 | 15,367,346 | 3 |
Real Estate | 19,286,655 | - | 19,286,655 | - |
Utilities | 11,196,960 | - | 11,196,960 | - |
|
| Money Market Funds | 13,511,421 | 13,511,421 | - | - |
| Total Investments in Securities: | 660,126,674 | 66,062,872 | 591,614,437 | 2,449,365 |
Fidelity® Pacific Basin Fund
| Statement of Assets and Liabilities |
| | | | October 31, 2023 |
| | | | | |
| Assets | | | | |
| Investment in securities, at value (including securities loaned of $10,126,909) - See accompanying schedule: | | | | |
Unaffiliated issuers (cost $606,177,233) | $ | 646,615,253 | | |
Fidelity Central Funds (cost $13,511,421) | | 13,511,421 | | |
| | | | | |
| | | | | |
| Total Investment in Securities (cost $619,688,654) | | | $ | 660,126,674 |
| Receivable for investments sold | | | | 484,218 |
| Receivable for fund shares sold | | | | 75,808 |
| Dividends receivable | | | | 2,017,950 |
| Distributions receivable from Fidelity Central Funds | | | | 39,855 |
| Prepaid expenses | | | | 1,023 |
| Other receivables | | | | 23,664 |
Total assets | | | | 662,769,192 |
| Liabilities | | | | |
| Payable to custodian bank | $ | 1,940 | | |
| Payable for investments purchased | | 327,282 | | |
| Payable for fund shares redeemed | | 166,495 | | |
| Accrued management fee | | 358,237 | | |
| Other affiliated payables | | 115,987 | | |
| Deferred taxes | | 1,033,234 | | |
| Other payables and accrued expenses | | 93,170 | | |
| Collateral on securities loaned | | 10,707,799 | | |
| Total Liabilities | | | | 12,804,144 |
| Net Assets | | | $ | 649,965,048 |
| Net Assets consist of: | | | | |
| Paid in capital | | | $ | 586,997,486 |
| Total accumulated earnings (loss) | | | | 62,967,562 |
| Net Assets | | | $ | 649,965,048 |
Net Asset Value, offering price and redemption price per share ($649,965,048 ÷ 23,391,140 shares) | | | $ | 27.79 |
| Statement of Operations |
| | | | Year ended October 31, 2023 |
| Investment Income | | | | |
| Dividends | | | $ | 15,063,047 |
| Non-Cash dividends | | | | 1,785,153 |
| Income from Fidelity Central Funds (including $63,236 from security lending) | | | | 508,547 |
| Income before foreign taxes withheld | | | $ | 17,356,747 |
| Less foreign taxes withheld | | | | (1,487,245) |
| Total Income | | | | 15,869,502 |
| Expenses | | | | |
| Management fee | | | | |
| Basic fee | $ | 4,991,846 | | |
| Performance adjustment | | 1,222,503 | | |
| Transfer agent fees | | 1,128,091 | | |
| Accounting fees | | 343,674 | | |
| Custodian fees and expenses | | 109,831 | | |
| Independent trustees' fees and expenses | | 4,312 | | |
| Registration fees | | 29,696 | | |
| Audit | | 88,357 | | |
| Legal | | 793 | | |
| Interest | | 9,815 | | |
| Miscellaneous | | 3,674 | | |
| Total expenses before reductions | | 7,932,592 | | |
| Expense reductions | | (44,750) | | |
| Total expenses after reductions | | | | 7,887,842 |
| Net Investment income (loss) | | | | 7,981,660 |
| Realized and Unrealized Gain (Loss) | | | | |
| Net realized gain (loss) on: | | | | |
| Investment Securities: | | | | |
| Unaffiliated issuers (net of foreign taxes of $816,567) | | 44,643,512 | | |
| Foreign currency transactions | | (253,769) | | |
| Total net realized gain (loss) | | | | 44,389,743 |
| Change in net unrealized appreciation (depreciation) on: | | | | |
| Investment Securities: | | | | |
| Unaffiliated issuers(net of increase in deferred foreign taxes of $223,176) | | 56,057,085 | | |
| Assets and liabilities in foreign currencies | | 28,616 | | |
| Total change in net unrealized appreciation (depreciation) | | | | 56,085,701 |
| Net gain (loss) | | | | 100,475,444 |
| Net increase (decrease) in net assets resulting from operations | | | $ | 108,457,104 |
| Statement of Changes in Net Assets |
| |
| | Year ended October 31, 2023 | | Year ended October 31, 2022 |
| Increase (Decrease) in Net Assets | | | | |
| Operations | | | | |
| Net investment income (loss) | $ | 7,981,660 | $ | 5,715,472 |
| Net realized gain (loss) | | 44,389,743 | | 71,701,080 |
| Change in net unrealized appreciation (depreciation) | | 56,085,701 | | (457,726,586) |
| Net increase (decrease) in net assets resulting from operations | | 108,457,104 | | (380,310,034) |
| Distributions to shareholders | | (59,141,027) | | (153,392,663) |
| | | | | |
| Share transactions | | | | |
| Proceeds from sales of shares | | 84,533,936 | | 97,680,092 |
| Reinvestment of distributions | | 44,008,733 | | 112,623,785 |
| Cost of shares redeemed | | (185,451,402) | | (233,769,363) |
| | | | | |
Net increase (decrease) in net assets resulting from share transactions | | (56,908,733) | | (23,465,486) |
| Total increase (decrease) in net assets | | (7,592,656) | | (557,168,183) |
| | | | | |
| Net Assets | | | | |
| Beginning of period | | 657,557,704 | | 1,214,725,887 |
| End of period | $ | 649,965,048 | $ | 657,557,704 |
| | | | | |
| Other Information | | | | |
| Shares | | | | |
| Sold | | 2,854,991 | | 2,944,154 |
| Issued in reinvestment of distributions | | 1,565,033 | | 2,912,433 |
| Redeemed | | (6,326,367) | | (6,908,065) |
| Net increase (decrease) | | (1,906,343) | | (1,051,478) |
| | | | | |
Financial Highlights
| Fidelity® Pacific Basin Fund |
| |
| Years ended October 31, | | 2023 | | 2022 | | 2021 | | 2020 | | 2019 |
Selected Per-Share Data | | | | | | | | | | |
| Net asset value, beginning of period | $ | 25.99 | $ | 46.10 | $ | 40.16 | $ | 32.65 | $ | 29.51 |
| Income from Investment Operations | | | | | | | | | | |
Net investment income (loss) A,B | | .32 C | | .22 | | .15 | | .16 | | .26 |
| Net realized and unrealized gain (loss) | | 3.88 | | (14.49) | | 7.74 | | 7.61 | | 5.74 |
| Total from investment operations | | 4.20 | | (14.27) | | 7.89 | | 7.77 | | 6.00 |
| Distributions from net investment income | | - | | (1.17) D | | (.10) | | (.26) | | (.20) |
| Distributions from net realized gain | | (2.40) | | (4.67) D | | (1.85) | | - | | (2.67) |
| Total distributions | | (2.40) | | (5.84) | | (1.95) | | (.26) | | (2.86) E |
| Net asset value, end of period | $ | 27.79 | $ | 25.99 | $ | 46.10 | $ | 40.16 | $ | 32.65 |
Total Return F | | 16.06% | | (35.11)% | | 20.08% | | 23.95% | | 22.37% |
Ratios to Average Net Assets B,G,H | | | | | | | | | | |
| Expenses before reductions | | 1.07% | | 1.12% | | 1.04% | | 1.11% | | .97% |
| Expenses net of fee waivers, if any | | 1.07% | | 1.12% | | 1.04% | | 1.11% | | .97% |
| Expenses net of all reductions | | 1.07% | | 1.12% | | 1.04% | | 1.10% | | .97% |
| Net investment income (loss) | | 1.08% C | | .64% | | .32% | | .47% | | .88% |
| Supplemental Data | | | | | | | | | | |
| Net assets, end of period (000 omitted) | $ | 649,965 | $ | 657,558 | $ | 1,214,726 | $ | 1,084,673 | $ | 891,154 |
Portfolio turnover rate I | | 46% | | 29% | | 40% | | 27% | | 32% |
ACalculated based on average shares outstanding during the period.
BNet investment income (loss) is affected by the timing of the declaration of dividends by any underlying mutual funds or exchange-traded funds (ETFs). Net investment income (loss) of any mutual funds or ETFs is not included in the Fund's net investment income (loss) ratio.
CNet investment income per share reflects one or more large, non-recurring dividend(s) which amounted to $.07 per share. Excluding such non-recurring dividend(s), the ratio of net investment income (loss) to average net assets would have been .84%.
DThe amount shown reflects reclassifications related to book to tax differences that were made in the year shown.
ETotal distributions per share do not sum due to rounding.
FTotal returns would have been lower if certain expenses had not been reduced during the applicable periods shown.
GFees and expenses of any underlying mutual funds or exchange-traded funds (ETFs) are not included in the Fund's expense ratio. The Fund indirectly bears its proportionate share of these expenses. For additional expense information related to investments in Fidelity Central Funds, please refer to the "Investments in Fidelity Central Funds" note found in the Notes to Financial Statements section of the most recent Annual or Semi-Annual report.
HExpense ratios reflect operating expenses of the class. Expenses before reductions do not reflect amounts reimbursed, waived, or reduced through arrangements with the investment adviser, brokerage services, or other offset arrangements, if applicable, and do not represent the amount paid by the class during periods when reimbursements, waivers or reductions occur.
IAmount does not include the portfolio activity of any underlying mutual funds or exchange-traded funds (ETFs).
For the period ended October 31, 2023
1. Organization.
Fidelity Pacific Basin Fund (the Fund) is a fund of Fidelity Investment Trust (the Trust) and is authorized to issue an unlimited number of shares. Share transactions on the Statement of Changes in Net Assets may contain exchanges between affiliated funds. The Trust is registered under the Investment Company Act of 1940, as amended (the 1940 Act), as an open-end management investment company organized as a Massachusetts business trust. The Fund's investments in emerging markets can be subject to social, economic, regulatory, and political uncertainties and can be extremely volatile.
2. Investments in Fidelity Central Funds.
Funds may invest in Fidelity Central Funds, which are open-end investment companies generally available only to other investment companies and accounts managed by the investment adviser and its affiliates. The Schedule of Investments lists any Fidelity Central Funds held as an investment as of period end, but does not include the underlying holdings of each Fidelity Central Fund. An investing fund indirectly bears its proportionate share of the expenses of the underlying Fidelity Central Funds.
Based on its investment objective, each Fidelity Central Fund may invest or participate in various investment vehicles or strategies that are similar to those of the investing fund. These strategies are consistent with the investment objectives of the investing fund and may involve certain economic risks which may cause a decline in value of each of the Fidelity Central Funds and thus a decline in the value of the investing fund.
| Fidelity Central Fund | Investment Manager | Investment Objective | Investment Practices | Expense RatioA |
| Fidelity Money Market Central Funds | Fidelity Management & Research Company LLC (FMR) | Each fund seeks to obtain a high level of current income consistent with the preservation of capital and liquidity. | Short-term Investments | Less than .005% |
A Expenses expressed as a percentage of average net assets and are as of each underlying Central Fund's most recent annual or semi-annual shareholder report.
A complete unaudited list of holdings for each Fidelity Central Fund is available upon request or at the Securities and Exchange Commission website at www.sec.gov. In addition, the financial statements of the Fidelity Central Funds which contain the significant accounting policies (including investment valuation policies) of those funds, and are not covered by the Report of Independent Registered Public Accounting Firm, are available on the Securities and Exchange Commission website or upon request.
3. Significant Accounting Policies.
The Fund is an investment company and applies the accounting and reporting guidance of the Financial Accounting Standards Board (FASB) Accounting Standards Codification Topic 946 Financial Services - Investment Companies. The financial statements have been prepared in conformity with accounting principles generally accepted in the United States of America (GAAP), which require management to make certain estimates and assumptions at the date of the financial statements. Actual results could differ from those estimates. Subsequent events, if any, through the date that the financial statements were issued have been evaluated in the preparation of the financial statements. The Fund's Schedule of Investments lists any underlying mutual funds or exchange-traded funds (ETFs) but does not include the underlying holdings of these funds. The following summarizes the significant accounting policies of the Fund:
Investment Valuation. Investments are valued as of 4:00 p.m. Eastern time on the last calendar day of the period. The Board of Trustees (the Board) has designated the Fund's investment adviser as the valuation designee responsible for the fair valuation function and performing fair value determinations as needed. The investment adviser has established a Fair Value Committee (the Committee) to carry out the day-to-day fair valuation responsibilities and has adopted policies and procedures to govern the fair valuation process and the activities of the Committee. In accordance with these fair valuation policies and procedures, which have been approved by the Board, the Fund attempts to obtain prices from one or more third party pricing services or brokers to value its investments. When current market prices, quotations or currency exchange rates are not readily available or reliable, investments will be fair valued in good faith by the Committee, in accordance with the policies and procedures. Factors used in determining fair value vary by investment type and may include market or investment specific events, transaction data, estimated cash flows, and market observations of comparable investments. The frequency that the fair valuation procedures are used cannot be predicted and they may be utilized to a significant extent. The Committee manages the Fund's fair valuation practices and maintains the fair valuation policies and procedures. The Fund's investment adviser reports to the Board information regarding the fair valuation process and related material matters.
The Fund categorizes the inputs to valuation techniques used to value its investments into a disclosure hierarchy consisting of three levels as shown below:
Level 1 - unadjusted quoted prices in active markets for identical investments
Level 2 - other significant observable inputs (including quoted prices for similar investments, interest rates, prepayment speeds, etc.)
Level 3 - unobservable inputs (including the Fund's own assumptions based on the best information available)
Valuation techniques used to value the Fund's investments by major category are as follows:
Equity securities, including restricted securities, for which market quotations are readily available, are valued at the last reported sale price or official closing price as reported by a third party pricing service on the primary market or exchange on which they are traded and are categorized as Level 1 in the hierarchy. In the event there were no sales during the day or closing prices are not available, securities are valued at the last quoted bid price or may be valued using the last available price and are generally categorized as Level 2 in the hierarchy. For foreign equity securities, when market or security specific events arise, comparisons to the valuation of American Depositary Receipts (ADRs), futures contracts, ETFs and certain indexes as well as quoted prices for similar securities may be used and would be categorized as Level 2 in the hierarchy. For equity securities, including restricted securities, where observable inputs are limited, assumptions about market activity and risk are used and these securities may be categorized as Level 3 in the hierarchy.
Investments in open-end mutual funds, including Fidelity Central Funds, are valued at their closing net asset value (NAV) each business day and are categorized as Level 1 in the hierarchy.
Changes in valuation techniques may result in transfers in or out of an assigned level within the disclosure hierarchy. The aggregate value of investments by input level as of October 31, 2023 is included at the end of the Fund's Schedule of Investments.
Foreign Currency. Certain Funds may use foreign currency contracts to facilitate transactions in foreign-denominated securities. Gains and losses from these transactions may arise from changes in the value of the foreign currency or if the counterparties do not perform under the contracts' terms.
Foreign-denominated assets, including investment securities, and liabilities are translated into U.S. dollars at the exchange rates at period end. Purchases and sales of investment securities, income and dividends received, and expenses denominated in foreign currencies are translated into U.S. dollars at the exchange rate in effect on the transaction date.
The effects of exchange rate fluctuations on investments are included with the net realized and unrealized gain (loss) on investment securities. Other foreign currency transactions resulting in realized and unrealized gain (loss) are disclosed separately.
Investment Transactions and Income. For financial reporting purposes, the Fund's investment holdings and NAV include trades executed through the end of the last business day of the period. The NAV per share for processing shareholder transactions is calculated as of the close of business of the New York Stock Exchange (NYSE), normally 4:00 p.m. Eastern time and includes trades executed through the end of the prior business day. Gains and losses on securities sold are determined on the basis of identified cost and include proceeds received from litigation. Commissions paid to certain brokers with whom the investment adviser, or its affiliates, places trades on behalf of a fund include an amount in addition to trade execution, which may be rebated back to a fund. Any such rebates are included in net realized gain (loss) on investments in the Statement of Operations. Dividend income is recorded on the ex-dividend date, except for certain dividends from foreign securities where the ex-dividend date may have passed, which are recorded as soon as the Fund is informed of the ex-dividend date. Non-cash dividends included in dividend income, if any, are recorded at the fair market value of the securities received. Income and capital gain distributions from Fidelity Central Funds, if any, are recorded on the ex-dividend date. Large, non-recurring dividends recognized by the Fund are presented separately on the Statement of Operations in "Non-cash dividends" and the impact of these dividends is presented in the Financial Highlights. Investment income is recorded net of foreign taxes withheld where recovery of such taxes is uncertain. Funds may file withholding tax reclaims in certain jurisdictions to recover a portion of amounts previously withheld. Any withholding tax reclaims income is included in the Statement of Operations in foreign taxes withheld. Any receivables for withholding tax reclaims are included in the Statement of Assets and Liabilities in dividends receivable.
Expenses. Expenses directly attributable to a fund are charged to that fund. Expenses attributable to more than one fund are allocated among the respective funds on the basis of relative net assets or other appropriate methods. Expenses included in the accompanying financial statements reflect the expenses of that fund and do not include any expenses associated with any underlying mutual funds or exchange-traded funds. Although not included in a fund's expenses, a fund indirectly bears its proportionate share of these expenses through the net asset value of each underlying mutual fund or exchange-traded fund. Expense estimates are accrued in the period to which they relate and adjustments are made when actual amounts are known.
Income Tax Information and Distributions to Shareholders. Each year, the Fund intends to qualify as a regulated investment company under Subchapter M of the Internal Revenue Code, including distributing substantially all of its taxable income and realized gains. As a result, no provision for U.S. Federal income taxes is required. As of October 31, 2023, the Fund did not have any unrecognized tax benefits in the financial statements; nor is the Fund aware of any tax positions for which it is reasonably possible that the total amounts of unrecognized tax benefits will significantly change in the next twelve months. The Fund files a U.S. federal tax return, in addition to state and local tax returns as required. The Fund's federal income tax returns are subject to examination by the Internal Revenue Service (IRS) for a period of three fiscal years after they are filed. State and local tax returns may be subject to examination for an additional fiscal year depending on the jurisdiction. Foreign taxes are provided for based on the Fund's understanding of the tax rules and rates that exist in the foreign markets in which it invests. The Fund is subject to a tax imposed on capital gains by certain countries in which it invests. An estimated deferred tax liability for net unrealized appreciation on the applicable securities is included in Deferred taxes on the Statement of Assets & Liabilities.
Distributions are declared and recorded on the ex-dividend date. Income and capital gain distributions are determined in accordance with income tax regulations, which may differ from GAAP. In addition, the Fund claimed a portion of the payment made to redeeming shareholders as a distribution for income tax purposes.
Capital accounts within the financial statements are adjusted for permanent book-tax differences. These adjustments have no impact on net assets or the results of operations. Capital accounts are not adjusted for temporary book-tax differences which will reverse in a subsequent period.
Book-tax differences are primarily due to foreign currency transactions, certain foreign taxes, passive foreign investment companies (PFIC) and losses deferred due to wash sales and excise tax regulations.
As of period end, the cost and unrealized appreciation (depreciation) in securities, and derivatives if applicable, for federal income tax purposes were as follows:
| Gross unrealized appreciation | $118,043,399 |
| Gross unrealized depreciation | (89,445,234) |
| Net unrealized appreciation (depreciation) | $28,598,165 |
| Tax Cost | $631,528,509 |
The tax-based components of distributable earnings as of period end were as follows:
| Undistributed ordinary income | $16,510,820 |
| Undistributed long-term capital gain | $18,945,629 |
| Net unrealized appreciation (depreciation) on securities and other investments | $28,544,349 |
The tax character of distributions paid was as follows:
| | October 31, 2023 | October 31, 2022 |
| Ordinary Income | $- | $30,731,746 |
| Long-term Capital Gains | 59,141,027 | 122,660,917 |
| Total | $59,141,027 | $153,392,663 |
Restricted Securities (including Private Placements). Funds may invest in securities that are subject to legal or contractual restrictions on resale. These securities generally may be resold in transactions exempt from registration or to the public if the securities are registered. Disposal of these securities may involve time-consuming negotiations and expense, and prompt sale at an acceptable price may be difficult. Information regarding restricted securities held at period end is included at the end of the Schedule of Investments, if applicable.
New Accounting Pronouncement. In June 2022, the Financial Accounting Standards Board (FASB) issued Accounting Standards Update (ASU) 2022-03 Fair Value Measurement (Topic 820): Fair Value Measurement of Equity Securities Subject to Contractual Sale Restrictions. The amendments in this ASU clarify that a contractual restriction on the sale of an equity security is not considered part of the unit of account of the equity security and, therefore, is not considered in measuring fair value. They also clarify that an entity cannot, as a separate unit of account, recognize and measure a contractual sale restriction. They also require additional disclosures for equity securities subject to contractual sale restrictions. ASU 2022-03 will be effective for fiscal years, including interim periods within those fiscal years, beginning after December 15, 2023, and allows for early adoption. ASU 2022-03 will only be applicable to an equity security in which the contractual arrangement that restricts its sale is executed or modified on or after the adoption date. Management is currently evaluating the potential impact of ASU 2022-03 to the financial statements.
4. Purchases and Sales of Investments.
Purchases and sales of securities, other than short-term securities and in-kind transactions, as applicable, are noted in the table below.
| | Purchases ($) | Sales ($) |
| Fidelity Pacific Basin Fund | 333,829,394 | 429,711,718 |
5. Fees and Other Transactions with Affiliates.
Management Fee. Fidelity Management & Research Company LLC (the investment adviser) and its affiliates provide the Fund with investment management related services for which the Fund pays a monthly management fee. The management fee is the sum of an individual fund fee rate that is based on an annual rate of .45% of the Fund's average net assets and an annualized group fee rate that averaged .23% during the period. The group fee rate is based upon the monthly average net assets of a group of registered investment companies with which the investment adviser has management contracts. The group fee rate decreases as assets under management increase and increases as assets under management decrease. In addition, the management fee is subject to a performance adjustment (up to a maximum of +/- .20% of the Fund's average net assets over a 36 month performance period). The upward or downward adjustment to the management fee is based on the Fund's relative investment performance as compared to its benchmark index, the MSCI All Country Pacific Index, over the same 36 month performance period. For the reporting period, the total annual management fee rate, including the performance adjustment, was .84% of the Fund's average net assets. The performance adjustment included in the management fee rate may be higher or lower than the maximum performance adjustment rate due to the difference between the average net assets for the reporting and performance periods.
Transfer Agent Fees. Fidelity Investments Institutional Operations Company LLC (FIIOC), an affiliate of the investment adviser, is the Fund's transfer, dividend disbursing and shareholder servicing agent. FIIOC receives account fees and asset-based fees that vary according to account size and type of account. FIIOC pays for typesetting, printing and mailing of shareholder reports, except proxy statements. For the period, the transfer agent fees were equivalent to an annual rate of .15% of average net assets.
During November 2023, the Board approved a change in the transfer agent fees effective December 1, 2023 to a fixed annual rate of 0.1515% of average net assets.
Accounting Fees. Fidelity Service Company, Inc. (FSC), an affiliate of the investment adviser, maintains the Fund's accounting records. The accounting fee is based on the level of average net assets for each month. For the period, the fees were equivalent to the following annual rates:
| | % of Average Net Assets |
| Fidelity Pacific Basin Fund | .05 |
During November 2023, the Board approved a change in the accounting fees effective December 1, 2023 to a fixed annual rate of average net assets as follows:
| | % of Average Net Assets |
| Fidelity Pacific Basin Fund | 0.0464 |
Brokerage Commissions. A portion of portfolio transactions were placed with brokerage firms which are affiliates of the investment adviser. Brokerage commissions are included in net realized gain (loss) and change in net unrealized appreciation (depreciation) in the Statement of Operations. The commissions paid to these affiliated firms were as follows:
| | Amount |
| Fidelity Pacific Basin Fund | $3,603 |
Interfund Lending Program. Pursuant to an Exemptive Order issued by the Securities and Exchange Commission (the SEC), the Fund, along with other registered investment companies having management contracts with Fidelity Management & Research Company LLC (FMR), or other affiliated entities of FMR, may participate in an interfund lending program. This program provides an alternative credit facility allowing the Fund to borrow from, or lend money to, other participating affiliated funds. At period end, there were no interfund loans outstanding. Activity in this program during the period for which loans were outstanding was as follows:
| | Borrower or Lender | Average Loan Balance | Weighted Average Interest Rate | Interest Expense |
| Fidelity Pacific Basin Fund | Borrower | $8,414,111 | 4.67% | $9,815 |
Interfund Trades. Funds may purchase from or sell securities to other Fidelity Funds under procedures adopted by the Board. The procedures have been designed to ensure these interfund trades are executed in accordance with Rule 17a-7 of the 1940 Act. Any interfund trades are included within the respective purchases and sales amounts shown in the Purchases and Sales of Investments note. Interfund trades during the period are noted in the table below.
| | Purchases ($) | Sales ($) | Realized Gain (Loss) ($) |
| Fidelity Pacific Basin Fund | 8,012,458 | 793,335 | (16,516) |
6. Committed Line of Credit.
Certain Funds participate with other funds managed by the investment adviser or an affiliate in a $4.25 billion credit facility (the "line of credit") to be utilized for temporary or emergency purposes to fund shareholder redemptions or for other short-term liquidity purposes. The participating funds have agreed to pay commitment fees on their pro-rata portion of the line of credit, which are reflected in Miscellaneous expenses on the Statement of Operations, and are listed below. During the period, there were no borrowings on this line of credit.
| | Amount |
| Fidelity Pacific Basin Fund | $1,349 |
7. Security Lending.
Funds lend portfolio securities from time to time in order to earn additional income. Lending agents are used, including National Financial Services (NFS), an affiliate of the investment adviser. Pursuant to a securities lending agreement, NFS will receive a fee, which is capped at 9.9% of a fund's daily lending revenue, for its services as lending agent. A fund may lend securities to certain qualified borrowers, including NFS. On the settlement date of the loan, a fund receives collateral (in the form of U.S. Treasury obligations, letters of credit and/or cash) against the loaned securities and maintains collateral in an amount not less than 100% of the market value of the loaned securities during the period of the loan. The market value of the loaned securities is determined at the close of business of a fund and any additional required collateral is delivered to a fund on the next business day. A fund or borrower may terminate the loan at any time, and if the borrower defaults on its obligation to return the securities loaned because of insolvency or other reasons, a fund may apply collateral received from the borrower against the obligation. A fund may experience delays and costs in recovering the securities loaned. Any cash collateral received is invested in the Fidelity Securities Lending Cash Central Fund. Any loaned securities are identified as such in the Schedule of Investments, and the value of loaned securities and cash collateral at period end, as applicable, are presented in the Statement of Assets and Liabilities. Security lending income represents the income earned on investing cash collateral, less rebates paid to borrowers and any lending agent fees associated with the loan, plus any premium payments received for lending certain types of securities. Security lending income is presented in the Statement of Operations as a component of income from Fidelity Central Funds. Affiliated security lending activity, if any, was as follows:
| | Total Security Lending Fees Paid to NFS | Security Lending Income From Securities Loaned to NFS | Value of Securities Loaned to NFS at Period End |
| Fidelity Pacific Basin Fund | $6,665 | $- | $- |
8. Expense Reductions.
Through arrangements with the Fund's custodian, credits realized as a result of certain uninvested cash balances were used to reduce the Fund's expenses by $311.
In addition, during the period the investment adviser or an affiliate reimbursed and/or waived a portion of operating expenses in the amount of $44,439.
9. Other.
A fund's organizational documents provide former and current trustees and officers with a limited indemnification against liabilities arising in connection with the performance of their duties to the fund. In the normal course of business, a fund may also enter into contracts that provide general indemnifications. A fund's maximum exposure under these arrangements is unknown as this would be dependent on future claims that may be made against a fund. The risk of material loss from such claims is considered remote.
At the end of the period, the following mutual funds managed by the investment adviser or its affiliates were the owners of record of 10% or more of the total outstanding shares.
| | Strategic Advisers Fidelity International Fund |
| Fidelity Pacific Basin Fund | 16% |
10. Risk and Uncertainties.
Many factors affect a fund's performance. Developments that disrupt global economies and financial markets, such as pandemics, epidemics, outbreaks of infectious diseases, war, terrorism, and environmental disasters, may significantly affect a fund's investment performance. The effects of these developments to a fund will be impacted by the types of securities in which a fund invests, the financial condition, industry, economic sector, and geographic location of an issuer, and a fund's level of investment in the securities of that issuer. Significant concentrations in security types, issuers, industries, sectors, and geographic locations may magnify the factors that affect a fund's performance.
Report of Independent Registered Public Accounting Firm
To the Board of Trustees of Fidelity Investment Trust and Shareholders of Fidelity Canada Fund, Fidelity China Region Fund, Fidelity Emerging Asia Fund, Fidelity Emerging Markets Fund, Fidelity Europe Fund, Fidelity Japan Fund, Fidelity Japan Smaller Companies Fund, Fidelity Latin America Fund, Fidelity Nordic Fund, and Fidelity Pacific Basin Fund
Opinions on the Financial Statements
We have audited the accompanying statements of assets and liabilities, including the schedules of investments, of Fidelity Canada Fund, Fidelity China Region Fund, Fidelity Emerging Asia Fund, Fidelity Emerging Markets Fund, Fidelity Europe Fund, Fidelity Japan Fund, Fidelity Japan Smaller Companies Fund, Fidelity Latin America Fund, Fidelity Nordic Fund, and Fidelity Pacific Basin Fund (ten of the funds constituting Fidelity Investment Trust, hereafter collectively referred to as the "Funds") as of October 31, 2023, the related statements of operations for the year ended October 31, 2023, the statements of changes in net assets for each of the two years in the period ended October 31, 2023, including the related notes, and the financial highlights for each of the periods indicated therein (collectively referred to as the "financial statements"). In our opinion, the financial statements present fairly, in all material respects, the financial position of each of the Funds as of October 31, 2023, the results of each of their operations for the year then ended, the changes in each of their net assets for each of the two years in the period ended October 31, 2023 and each of the financial highlights for each of the periods indicated therein in conformity with accounting principles generally accepted in the United States of America.
Basis for Opinions
These financial statements are the responsibility of the Funds' management. Our responsibility is to express an opinion on the Funds' financial statements based on our audits. We are a public accounting firm registered with the Public Company Accounting Oversight Board (United States) (PCAOB) and are required to be independent with respect to the Funds in accordance with the U.S. federal securities laws and the applicable rules and regulations of the Securities and Exchange Commission and the PCAOB.
We conducted our audits of these financial statements in accordance with the standards of the PCAOB. Those standards require that we plan and perform the audits to obtain reasonable assurance about whether the financial statements are free of material misstatement, whether due to error or fraud.
Our audits included performing procedures to assess the risks of material misstatement of the financial statements, whether due to error or fraud, and performing procedures that respond to those risks. Such procedures included examining, on a test basis, evidence regarding the amounts and disclosures in the financial statements. Our audits also included evaluating the accounting principles used and significant estimates made by management, as well as evaluating the overall presentation of the financial statements. Our procedures included confirmation of securities owned as of October 31, 2023 by correspondence with the custodians, issuers of privately offered securities and brokers; when replies were not received from brokers, we performed other auditing procedures. We believe that our audits provide a reasonable basis for our opinions.
/s/PricewaterhouseCoopers LLP
Boston, Massachusetts
December 15, 2023
We have served as the auditor of one or more investment companies in the Fidelity group of funds since 1932.
The Trustees, Members of the Advisory Board (if any), and officers of the trust and funds, as applicable, are listed below. The Board of Trustees governs each fund and is responsible for protecting the interests of shareholders. The Trustees are experienced executives who meet periodically throughout the year to oversee each fund's activities, review contractual arrangements with companies that provide services to each fund, oversee management of the risks associated with such activities and contractual arrangements, and review each fund's performance. Except for Jonathan Chiel, each of the Trustees oversees 322 funds. Mr. Chiel oversees 191 funds.
The Trustees hold office without limit in time except that (a) any Trustee may resign; (b) any Trustee may be removed by written instrument, signed by at least two-thirds of the number of Trustees prior to such removal; (c) any Trustee who requests to be retired or who has become incapacitated by illness or injury may be retired by written instrument signed by a majority of the other Trustees; and (d) any Trustee may be removed at any special meeting of shareholders by a two-thirds vote of the outstanding voting securities of the trust. Each Trustee who is not an interested person (as defined in the 1940 Act) of the trust and the funds is referred to herein as an Independent Trustee. Each Independent Trustee shall retire not later than the last day of the calendar year in which his or her 75th birthday occurs. The Independent Trustees may waive this mandatory retirement age policy with respect to individual Trustees. Officers and Advisory Board Members hold office without limit in time, except that any officer or Advisory Board Member may resign or may be removed by a vote of a majority of the Trustees at any regular meeting or any special meeting of the Trustees. Except as indicated, each individual has held the office shown or other offices in the same company for the past five years.
The funds' Statement of Additional Information (SAI) includes more information about the Trustees. To request a free copy, call Fidelity at 1-800-544-8544 if you're an individual investing directly with Fidelity, call 1-800-835-5092 if you're a plan sponsor or participant with Fidelity as your recordkeeper or call 1-877-208-0098 on institutional accounts or if you're an advisor or invest through one.
Experience, Skills, Attributes, and Qualifications of the Trustees. The Governance and Nominating Committee has adopted a statement of policy that describes the experience, qualifications, attributes, and skills that are necessary and desirable for potential Independent Trustee candidates (Statement of Policy). The Board believes that each Trustee satisfied at the time he or she was initially elected or appointed a Trustee, and continues to satisfy, the standards contemplated by the Statement of Policy. The Governance and Nominating Committee also engages professional search firms to help identify potential Independent Trustee candidates who have the experience, qualifications, attributes, and skills consistent with the Statement of Policy. From time to time, additional criteria based on the composition and skills of the current Independent Trustees, as well as experience or skills that may be appropriate in light of future changes to board composition, business conditions, and regulatory or other developments, have also been considered by the professional search firms and the Governance and Nominating Committee. In addition, the Board takes into account the Trustees' commitment and participation in Board and committee meetings, as well as their leadership of standing and ad hoc committees throughout their tenure.
In determining that a particular Trustee was and continues to be qualified to serve as a Trustee, the Board has considered a variety of criteria, none of which, in isolation, was controlling. The Board believes that, collectively, the Trustees have balanced and diverse experience, qualifications, attributes, and skills, which allow the Board to operate effectively in governing each fund and protecting the interests of shareholders. Information about the specific experience, skills, attributes, and qualifications of each Trustee, which in each case led to the Board's conclusion that the Trustee should serve (or continue to serve) as a trustee of the funds, is provided below.
Board Structure and Oversight Function. Robert A. Lawrence is an interested person and currently serves as Chair. The Trustees have determined that an interested Chair is appropriate and benefits shareholders because an interested Chair has a personal and professional stake in the quality and continuity of services provided to the funds. Independent Trustees exercise their informed business judgment to appoint an individual of their choosing to serve as Chair, regardless of whether the Trustee happens to be independent or a member of management. The Independent Trustees have determined that they can act independently and effectively without having an Independent Trustee serve as Chair and that a key structural component for assuring that they are in a position to do so is for the Independent Trustees to constitute a substantial majority for the Board. The Independent Trustees also regularly meet in executive session. David M. Thomas serves as Lead Independent Trustee and as such (i) acts as a liaison between the Independent Trustees and management with respect to matters important to the Independent Trustees and (ii) with management prepares agendas for Board meetings.
Fidelity® funds are overseen by different Boards of Trustees. The funds' Board oversees Fidelity's high income and certain equity funds, and other Boards oversee Fidelity's alternative investment, investment-grade bond, money market, asset allocation, and other equity funds. The asset allocation funds may invest in Fidelity® funds overseen by the funds' Board. The use of separate Boards, each with its own committee structure, allows the Trustees of each group of Fidelity® funds to focus on the unique issues of the funds they oversee, including common research, investment, and operational issues. On occasion, the separate Boards establish joint committees to address issues of overlapping consequences for the Fidelity® funds overseen by each Board.
The Trustees operate using a system of committees to facilitate the timely and efficient consideration of all matters of importance to the Trustees, each fund, and fund shareholders and to facilitate compliance with legal and regulatory requirements and oversight of the funds' activities and associated risks. The Board, acting through its committees, has charged FMR and its affiliates with (i) identifying events or circumstances the occurrence of which could have demonstrably adverse effects on the funds' business and/or reputation; (ii) implementing processes and controls to lessen the possibility that such events or circumstances occur or to mitigate the effects of such events or circumstances if they do occur; and (iii) creating and maintaining a system designed to evaluate continuously business and market conditions in order to facilitate the identification and implementation processes described in (i) and (ii) above. Because the day-to-day operations and activities of the funds are carried out by or through FMR, its affiliates, and other service providers, the funds' exposure to risks is mitigated but not eliminated by the processes overseen by the Trustees. While each of the Board's committees has responsibility for overseeing different aspects of the funds' activities, oversight is exercised primarily through the Operations, Audit, and Compliance Committees. Appropriate personnel, including but not limited to the funds' Chief Compliance Officer (CCO), FMR's internal auditor, the independent accountants, the funds' Treasurer and portfolio management personnel, make periodic reports to the Board's committees, as appropriate, including an annual review of Fidelity's risk management program for the Fidelity® funds. The responsibilities of each standing committee, including their oversight responsibilities, are described further under "Standing Committees of the Trustees."
Interested Trustees*:
Correspondence intended for a Trustee who is an interested person may be sent to Fidelity Investments, 245 Summer Street, Boston, Massachusetts 02210.
Name, Year of Birth; Principal Occupations and Other Relevant Experience+
Jonathan Chiel (1957)
Year of Election or Appointment: 2016
Trustee
Mr. Chiel also serves as Trustee of other Fidelity® funds. Mr. Chiel is General Counsel (2012-present) and Head of Legal, Risk and Compliance (2022-present). Mr Chiel serves as Executive Vice President and General Counsel for FMR LLC (diversified financial services company, 2012-present) and Director and President for OH Company LLC (holding company, 2018-present). Previously, Mr. Chiel served as general counsel (2004-2012) and senior vice president and deputy general counsel (2000-2004) for John Hancock Financial Services; a partner with Choate, Hall & Stewart (1996-2000) (law firm); and an Assistant United States Attorney for the United States Attorney's Office of the District of Massachusetts (1986-95), including Chief of the Criminal Division (1993-1995). Mr. Chiel is a director on the boards of the Boston Bar Foundation and the Maimonides School.
Bettina Doulton (1964)
Year of Election or Appointment: 2021
Trustee
Ms. Doulton also serves as Trustee of other Fidelity® funds. Prior to her retirement, Ms. Doulton served in a variety of positions at Fidelity Investments, including as a managing director of research (2006-2007), portfolio manager to certain Fidelity® funds (1993-2005), equity analyst and portfolio assistant (1990-1993), and research assistant (1987-1990). Ms. Doulton currently owns and operates Phi Builders + Architects and Cellardoor Winery. Previously, Ms. Doulton served as a member of the Board of Brown Capital Management, LLC (2014-2018).
Robert A. Lawrence (1952)
Year of Election or Appointment: 2020
Trustee
Chair of the Board of Trustees
Mr. Lawrence also serves as Trustee of other funds. Previously, Mr. Lawrence served as a Trustee and Member of the Advisory Board of certain funds. Prior to his retirement in 2008, Mr. Lawrence served as Vice President of certain Fidelity® funds (2006-2008), Senior Vice President, Head of High Income Division of Fidelity Management & Research Company (investment adviser firm, 2006-2008), and President of Fidelity Strategic Investments (investment adviser firm, 2002-2005).
* Determined to be an "Interested Trustee" by virtue of, among other things, his or her affiliation with the trust or various entities under common control with FMR.
+ The information includes the Trustee's principal occupation during the last five years and other information relating to the experience, attributes, and skills relevant to the Trustee's qualifications to serve as a Trustee, which led to the conclusion that the Trustee should serve as a Trustee for each fund.
Independent Trustees:
Correspondence intended for an Independent Trustee may be sent to Fidelity Investments, P.O. Box 55235, Boston, Massachusetts 02205-5235.
Name, Year of Birth; Principal Occupations and Other Relevant Experience+
Thomas P. Bostick (1956)
Year of Election or Appointment: 2021
Trustee
Lieutenant General Bostick also serves as Trustee of other Fidelity® funds. Prior to his retirement, General Bostick (United States Army, Retired) held a variety of positions within the U.S. Army, including Commanding General and Chief of Engineers, U.S. Army Corps of Engineers (2012-2016) and Deputy Chief of Staff and Director of Human Resources, U.S. Army (2009-2012). General Bostick currently serves as a member of the Board and Finance and Governance & Sustainability Committees of CSX Corporation (transportation, 2020-present) and a member of the Board and Corporate Governance and Nominating Committee of Perma-Fix Environmental Services, Inc. (nuclear waste management, 2020-present). General Bostick serves as Chief Executive Officer of Bostick Global Strategies, LLC (consulting, 2016-present), as a member of the Board of HireVue, Inc. (video interview and assessment, 2020-present), as a member of the Board of Allonnia (biotechnology and engineering solutions, 2022-present) and on the Advisory Board of Solugen, Inc. (specialty bio-based chemicals manufacturer, 2022-present). Previously, General Bostick served as a Member of the Advisory Board of certain Fidelity® funds (2021), President, Intrexon Bioengineering (2018-2020) and Chief Operating Officer (2017-2020) and Senior Vice President of the Environment Sector (2016-2017) of Intrexon Corporation (biopharmaceutical company).
Dennis J. Dirks (1948)
Year of Election or Appointment: 2005
Trustee
Mr. Dirks also serves as Trustee of other Fidelity® funds. Prior to his retirement in May 2003, Mr. Dirks served as Chief Operating Officer and as a member of the Board of The Depository Trust & Clearing Corporation (financial markets infrastructure), President, Chief Operating Officer and a member of the Board of The Depository Trust Company (DTC), President and a member of the Board of the National Securities Clearing Corporation (NSCC), Chief Executive Officer and a member of the Board of the Government Securities Clearing Corporation and Chief Executive Officer and a member of the Board of the Mortgage-Backed Securities Clearing Corporation. Mr. Dirks currently serves as a member of the Finance Committee (2016-present) and Board (2017-present) and is Treasurer (2018-present) of the Asolo Repertory Theatre.
Donald F. Donahue (1950)
Year of Election or Appointment: 2018
Trustee
Mr. Donahue also serves as Trustee of other Fidelity® funds. Mr. Donahue serves as President and Chief Executive Officer of Miranda Partners, LLC (risk consulting for the financial services industry, 2012-present). Previously, Mr. Donahue served as Chief Executive Officer (2006-2012), Chief Operating Officer (2003-2006) and Managing Director, Customer Marketing and Development (1999-2003) of The Depository Trust & Clearing Corporation (financial markets infrastructure). Mr. Donahue currently serves as a member (2007-present) and Co-Chairman (2016-present) of the Board of United Way of New York. Mr. Donahue previously served as a member of the Advisory Board of certain Fidelity® funds (2015-2018) and as a member of the Board of The Leadership Academy (previously NYC Leadership Academy) (2012-2022).
Vicki L. Fuller (1957)
Year of Election or Appointment: 2020
Trustee
Ms. Fuller also serves as Trustee of other Fidelity® funds. Previously, Ms. Fuller served as a member of the Advisory Board of certain Fidelity® funds (2018-2020), Chief Investment Officer of the New York State Common Retirement Fund (2012-2018) and held a variety of positions at AllianceBernstein L.P. (global asset management, 1985-2012), including Managing Director (2006-2012) and Senior Vice President and Senior Portfolio Manager (2001-2006). Ms. Fuller currently serves as a member of the Board, Audit Committee and Nominating and Governance Committee of two Blackstone business development companies (2020-present), as a member of the Board of Treliant, LLC (consulting, 2019-present), as a member of the Board of Ariel Alternatives, LLC (private equity, 2022-present) and as a member of the Board and Chair of the Audit Committee of Gusto, Inc. (software, 2021-present). In addition, Ms. Fuller currently serves as a member of the Board of Roosevelt University (2019-present) and as a member of the Executive Board of New York University's Stern School of Business. Ms. Fuller previously served as a member of the Board, Audit Committee and Nominating and Governance Committee of The Williams Companies, Inc. (natural gas infrastructure, 2018-2021).
Patricia L. Kampling (1959)
Year of Election or Appointment: 2020
Trustee
Ms. Kampling also serves as Trustee of other Fidelity® funds. Prior to her retirement, Ms. Kampling served as Chairman of the Board and Chief Executive Officer (2012-2019), President and Chief Operating Officer (2011-2012) and Executive Vice President and Chief Financial Officer (2010-2011) of Alliant Energy Corporation. Ms. Kampling currently serves as a member of the Board, Finance Committee and Governance, Compensation and Nominating Committee of Xcel Energy Inc. (utilities company, 2020-present) and as a member of the Board, Audit, Finance and Risk Committee and Safety, Environmental, Technology and Operations Committee and Chair of the Executive Development and Compensation Committee of American Water Works Company, Inc. (utilities company, 2019-present). In addition, Ms. Kampling currently serves as a member of the Board of the Nature Conservancy, Wisconsin Chapter (2019-present). Previously, Ms. Kampling served as a Member of the Advisory Board of certain Fidelity® funds (2020), a member of the Board, Compensation Committee and Executive Committee and Chair of the Audit Committee of Briggs & Stratton Corporation (manufacturing, 2011-2021), a member of the Board of Interstate Power and Light Company (2012-2019) and Wisconsin Power and Light Company (2012-2019) (each a subsidiary of Alliant Energy Corporation) and as a member of the Board and Workforce Development Committee of the Business Roundtable (2018-2019).
Thomas A. Kennedy (1955)
Year of Election or Appointment: 2021
Trustee
Mr. Kennedy also serves as Trustee of other Fidelity® funds. Previously, Mr. Kennedy served as a Member of the Advisory Board of certain Fidelity® funds (2020) and held a variety of positions at Raytheon Company (aerospace and defense, 1983-2020), including Chairman and Chief Executive Officer (2014-2020) and Executive Vice President and Chief Operating Officer (2013-2014). Mr. Kennedy served as Executive Chairman of the Board of Directors of Raytheon Technologies Corporation (aerospace and defense, 2020-2021). Mr. Kennedy serves as a Director of the Board of Directors of Textron Inc. (aerospace and defense, 2023-present).
Oscar Munoz (1959)
Year of Election or Appointment: 2021
Trustee
Mr. Munoz also serves as Trustee of other Fidelity® funds. Prior to his retirement, Mr. Munoz served as Executive Chairman (2020-2021), Chief Executive Officer (2015-2020), President (2015-2016) and a member of the Board (2010-2021) of United Airlines Holdings, Inc. Mr. Munoz currently serves as a member of the Board of CBRE Group, Inc. (commercial real estate, 2020-present), a member of the Board of Univision Communications, Inc. (Hispanic media, 2020-present), a member of the Board of Archer Aviation Inc. (2021-present), a member of the Defense Business Board of the United States Department of Defense (2021-present) and a member of the Board of Salesforce.com, Inc. (cloud-based software, 2022-present). Previously, Mr. Munoz served as a Member of the Advisory Board of certain Fidelity® funds (2021).
David M. Thomas (1949)
Year of Election or Appointment: 2008
Trustee
Lead Independent Trustee
Mr. Thomas also serves as Trustee of other Fidelity® funds. Previously, Mr. Thomas served as Executive Chairman (2005-2006) and Chairman and Chief Executive Officer (2000-2005) of IMS Health, Inc. (pharmaceutical and healthcare information solutions). Mr. Thomas currently serves as a member of the Board of Fortune Brands Home and Security (home and security products, 2004-present) and as Director (2013-present) and Non-Executive Chairman of the Board (2022-present) of Interpublic Group of Companies, Inc. (marketing communication).
Susan Tomasky (1953)
Year of Election or Appointment: 2020
Trustee
Ms. Tomasky also serves as Trustee of other Fidelity® funds. Prior to her retirement, Ms. Tomasky served in various executive officer positions at American Electric Power Company, Inc. (1998-2011), including most recently as President of AEP Transmission (2007-2011). Ms. Tomasky currently serves as a member of the Board and Sustainability Committee and as Chair of the Audit Committee of Marathon Petroleum Corporation (2018-present) and as a member of the Board, Executive Committee, Corporate Governance Committee and Organization and Compensation Committee and as Lead Director of the Board of Public Service Enterprise Group, Inc. (utilities company, 2012-present) and as a member of the Board of its subsidiary company, Public Service Electric and Gas Co. (2021-present). In addition, Ms. Tomasky currently serves as a member (2009-present) and President (2020-present) of the Board of the Royal Shakespeare Company - America (2009-present), as a member of the Board of the Columbus Association for the Performing Arts (2011-present) and as a member of the Board and Kenyon in the World Committee of Kenyon College (2016-present). Previously, Ms. Tomasky served as a Member of the Advisory Board of certain Fidelity® funds (2020), as a member of the Board of the Columbus Regional Airport Authority (2007-2020), as a member of the Board (2011-2018) and Lead Independent Director (2015-2018) of Andeavor Corporation (previously Tesoro Corporation) (independent oil refiner and marketer) and as a member of the Board of Summit Midstream Partners LP (energy, 2012-2018).
Michael E. Wiley (1950)
Year of Election or Appointment: 2020
Trustee
Mr. Wiley also serves as Trustee of other Fidelity® funds. Previously, Mr. Wiley served as a member of the Advisory Board of certain Fidelity® funds (2018-2020), Chairman, President and CEO of Baker Hughes, Inc. (oilfield services, 2000-2004). Mr. Wiley also previously served as a member of the Board of Andeavor Corporation (independent oil refiner and marketer, 2005-2018), a member of the Board of Andeavor Logistics LP (natural resources logistics, 2015-2018) and a member of the Board of High Point Resources (exploration and production, 2005-2020).
+ The information includes the Trustee's principal occupation during the last five years and other information relating to the experience, attributes, and skills relevant to the Trustee's qualifications to serve as a Trustee, which led to the conclusion that the Trustee should serve as a Trustee for each fund.
Advisory Board Members and Officers:
Correspondence intended for a Member of the Advisory Board (if any) may be sent to Fidelity Investments, P.O. Box 55235, Boston, Massachusetts 02205-5235. Correspondence intended for an officer or Peter S. Lynch may be sent to Fidelity Investments, 245 Summer Street, Boston, Massachusetts 02210.
Name, Year of Birth; Principal Occupation
Vijay C. Advani (1960)
Year of Election or Appointment: 2023
Member of the Advisory Board
Mr. Advani also serves as Trustee or Member of the Advisory Board of other funds. Previously, Mr. Advani served as Executive Chairman (2020-2022), Chief Executive Officer (2017-2020) and Chief Operating Officer (2016-2017) of Nuveen (global investment manager). He also served in various capacities at Franklin Resources (global investment manager), including Co-President (2015-2016), Executive Vice President, Global Advisory Services (2008-2015), Head of Global Retail Distribution (2005-2008), Executive Managing Director, International Retail Development (2002-2005), Managing Director, Product Developments, Sales & Marketing, Asia, Eastern Europe and Africa (2000-2002) and President, Templeton Asset Management India (1995-2000). Mr. Advani also served as Senior Investment Officer of International Finance Corporation (private equity and venture capital arm of The World Bank, 1984-1995). Mr. Advani is Chairman Emeritus of the U.S. India Business Council (2018-present), a Director of The Global Impact Investing Network (2019-present), a Director of LOK Capital (Mauritius) (2022-present), a member of the Advisory Council of LOK Capital (2022-present), a Senior Advisor of Neuberger Berman (2021-present), a Senior Advisor of Seviora Holdings Pte. Ltd (Temasek-Singapore) (2021-present), a Director of Seviora Capital (Singapore) (2021-present) and an Advisor of EQUIAM (2021-present). Mr. Advani formerly served as a member of the Board of BowX Acquisition Corp. (special purpose acquisition company, 2020-2021), a member of the Board of Intellecap (advisory arm of The Aavishkaar Group, 2018-2020), a member of the Board of Nuveen Investments, Inc. (2017-2020) and a member of the Board of Docusign (software, 2016-2019).
Peter S. Lynch (1944)
Year of Election or Appointment: 2003
Member of the Advisory Board
Mr. Lynch also serves as a Member of the Advisory Board of other Fidelity® funds. Mr. Lynch is Vice Chairman and a Director of Fidelity Management & Research Company LLC (investment adviser firm). In addition, Mr. Lynch serves as a Trustee of Boston College and as the Chairman of the Inner-City Scholarship Fund. Previously, Mr. Lynch served as Vice Chairman and a Director of FMR Co., Inc. (investment adviser firm) and on the Special Olympics International Board of Directors (1997-2006).
Karen B. Peetz (1955)
Year of Election or Appointment: 2023
Member of the Advisory Board
Ms. Peetz also serves as a Member of the Advisory Board of other funds. Previously, Ms. Peetz served as Chief Administration Officer (2020-2023) of Citigroup Inc. (a diversified financial service company). She also served in various capacities at Bank of New York Mellon Corporation, including President (2013-2016), Vice Chairman, Senior Executive Vice President and Chief Executive Officer of Financial Markets & Treasury Services (2010-2013), Senior Executive Vice President and Chief Executive Officer of Global Corporate Trust (2003-2008), Senior Vice President and Division Manager of Global Payments & Trade Services (2002-2003) and Senior Vice President and Division Manager of Domestic Corporate Trust (1998-2002). Ms. Peetz also served in various capacities at Chase Manhattan Corporation (1982-1998), including Senior Vice President and Manager of Corporate Trust International Business (1996-1998), Managing Director and Manager of Corporate Trust Services (1994-1996) and Managing Director and Group Manager of Financial Institution Sales (1990-1993). Ms. Peetz currently serves as Chair of Amherst Holdings Advisory Council (2018-present), Trustee of Johns Hopkins University (2016-present), Chair of the Carey Business School Advisory Council, Member of the Johns Hopkins Medicine Board and Finance Committee and Chair of the Lyme and Tick Related Disease Institute Advisory Council. Ms. Peetz previously served as a member of the Board of Guardian Life Insurance Company of America (2019-2023), a member of the Board of Trane Technologies (2018-2022), a member of the Board of Wells Fargo Corp. (2017-2019), a member of the Board of SunCoke Energy Inc. (2012-2016), a member of the Board of Private Export Funding Corporation (2010-2016) and as a Trustee of Penn State University (2010-2014) and the United Way of New York City (2008-2010).
Heather Bonner (1977)
Year of Election or Appointment: 2023
Assistant Treasurer
Ms. Bonner also serves as an officer of other funds. Ms. Bonner is a Senior Vice President (2022-present) and is an employee of Fidelity Investments (2022-present). Ms. Bonner serves as Vice President, Treasurer, or Assistant Treasurer of certain Fidelity entities. Prior to joining Fidelity, Ms. Bonner served as Managing Director at AQR Capital Management (2013-2022) and was the Treasurer and Principal Financial Officer of the AQR Funds (2013-2022).
Craig S. Brown (1977)
Year of Election or Appointment: 2022
Deputy Treasurer
Mr. Brown also serves as an officer of other funds. Mr. Brown is a Vice President (2015-present) and is an employee of Fidelity Investments. Mr. Brown serves as Assistant Treasurer of FIMM, LLC (2021-present). Previously, Mr. Brown served as Assistant Treasurer of certain Fidelity® funds (2019-2022).
John J. Burke III (1964)
Year of Election or Appointment: 2018
Chief Financial Officer
Mr. Burke also serves as Chief Financial Officer of other funds. Mr. Burke is Head of Fidelity Fund and Investment Operations (2018-present) and is an employee of Fidelity Investments. Mr. Burke serves as President, Executive Vice President, or Director of certain Fidelity entities. Previously Mr. Burke served as head of Asset Management Investment Operations (2012-2018).
Margaret Carey (1973)
Year of Election or Appointment: 2023
Secretary and Chief Legal Officer (CLO)
Ms. Carey also serves as an officer of other funds and as CLO of certain Fidelity entities. Ms. Carey is a Senior Vice President, Deputy General Counsel (2019-present) and is an employee of Fidelity Investments.
William C. Coffey (1969)
Year of Election or Appointment: 2019
Assistant Secretary
Mr. Coffey also serves as Assistant Secretary of other funds. Mr. Coffey is a Senior Vice President, Deputy General Counsel (2010-present) and is an employee of Fidelity Investments. Previously, Mr. Coffey served as Secretary and CLO of certain funds (2018-2019); CLO, Secretary, or Senior Vice President of certain Fidelity entities and Assistant Secretary of certain funds (2009-2018).
Timothy M. Cohen (1969)
Year of Election or Appointment: 2018
Vice President
Mr. Cohen also serves as Vice President of other funds. Mr. Cohen is Co-Head of Equity (2018-present) and is an employee of Fidelity Investments. Mr. Cohen serves a Director of Fidelity Management & Research (Japan) Limited (investment adviser firm, 2016-present). Previously, Mr. Cohen served as Executive Vice President of Fidelity SelectCo, LLC (2019) and Head of Global Equity Research (2016-2018).
Jonathan Davis (1968)
Year of Election or Appointment: 2010
Assistant Treasurer
Mr. Davis also serves as an officer of other funds. Mr. Davis is a Vice President (2006-present) and is an employee of Fidelity Investments. Mr. Davis serves as Assistant Treasurer of certain Fidelity entities.
Laura M. Del Prato (1964)
Year of Election or Appointment: 2018
Assistant Treasurer
Ms. Del Prato also serves as an officer of other funds. Ms. Del Prato is a Senior Vice President (2017-present) and is an employee of Fidelity Investments. Ms. Del Prato serves as Vice President or Assistant Treasurer of certain Fidelity entities. Previously, Ms. Del Prato served as President and Treasurer of The North Carolina Capital Management Trust: Cash Portfolio and Term Portfolio (2018-2020).
Colm A. Hogan (1973)
Year of Election or Appointment: 2020
Assistant Treasurer
Mr. Hogan also serves as an officer of other funds. Mr. Hogan is a Vice President (2016-present) and is an employee of Fidelity Investments. Mr. Hogan serves as Assistant Treasurer of certain Fidelity entities. Previously, Mr. Hogan served as Deputy Treasurer of certain Fidelity® funds (2016-2020) and Assistant Treasurer of certain Fidelity® funds (2016-2018).
Pamela R. Holding (1964)
Year of Election or Appointment: 2018
Vice President
Ms. Holding also serves as Vice President of other funds. Ms. Holding is Co-Head of Equity (2018-present) and is an employee of Fidelity Investments. Previously, Ms. Holding served as Executive Vice President of Fidelity SelectCo, LLC (2019) and as Chief Investment Officer of Fidelity Institutional Asset Management (2013-2018).
Chris Maher (1972)
Year of Election or Appointment: 2020
Deputy Treasurer
Mr. Maher also serves as an officer of other funds. Mr. Maher is a Vice President (2008-present) and is an employee of Fidelity Investments. Mr. Maher serves as Assistant Treasurer of certain Fidelity entities. Previously, Mr. Maher served as Assistant Treasurer of certain funds (2013-2020).
Jason P. Pogorelec (1975)
Year of Election or Appointment: 2020
Chief Compliance Officer
Mr. Pogorelec also serves as Chief Compliance Officer of other funds. Mr. Pogorelec is a Senior Vice President of Asset Management Compliance (2020-present) and is an employee of Fidelity Investments. Mr. Pogorelec serves as Compliance Officer of Fidelity Management & Research Company LLC (investment adviser firm, 2023-present) and Ballyrock Investment Advisors LLC (2023-present). Previously, Mr. Pogorelec served as a Vice President, Associate General Counsel for Fidelity Investments (2010-2020) and Assistant Secretary of certain Fidelity® funds (2015-2020).
Brett Segaloff (1972)
Year of Election or Appointment: 2021
Anti-Money Laundering (AML) Officer
Mr. Segaloff also serves as AML Officer of other funds. Mr. Segaloff is a Vice President (2022-present) and is an employee of Fidelity Investments. Mr. Segaloff serves as Anti Money Laundering Compliance Officer or Anti Money Laundering/Bank Secrecy Act Compliance Officer of certain Fidelity entities.
Stacie M. Smith (1974)
Year of Election or Appointment: 2016
President and Treasurer
Ms. Smith also serves as an officer of other funds. Ms. Smith is a Senior Vice President (2016-present) and is an employee of Fidelity Investments. Ms. Smith serves as Assistant Treasurer of certain Fidelity entities and has served in other fund officer roles.
Jim Wegmann (1979)
Year of Election or Appointment: 2019
Assistant Treasurer
Mr. Wegmann also serves as an officer of other funds. Mr. Wegmann is a Vice President (2016-present) and is an employee of Fidelity Investments. Mr. Wegmann serves as Assistant Treasurer of FIMM, LLC (2021-present). Previously, Mr. Wegmann served as Assistant Treasurer of certain Fidelity® funds (2019-2021).
As a shareholder, you incur two types of costs: (1) transaction costs, which may include sales charges (loads) on purchase payments or redemption proceeds, as applicable and (2) ongoing costs, which generally include management fees, distribution and/or service (12b-1) fees and other Fund expenses. This Example is intended to help you understand your ongoing costs (in dollars) of investing in a fund and to compare these costs with the ongoing costs of investing in other mutual funds.
| The Example is based on an investment of $1,000 invested at the beginning of the period and held for the entire period (May 1, 2023 to October 31, 2023). |
Actual Expenses
The first line of the accompanying table provides information about actual account values and actual expenses. You may use the information in this line, together with the amount you invested, to estimate the expenses that you paid over the period. Simply divide your account value by $1,000.00 (for example, an $8,600 account value divided by $1,000.00 = 8.6), then multiply the result by the number in the first line for a class/Fund under the heading entitled "Expenses Paid During Period" to estimate the expenses you paid on your account during this period. If any fund is a shareholder of any underlying mutual funds or exchange-traded funds (ETFs) (the Underlying Funds), such fund indirectly bears its proportional share of the expenses of the Underlying Funds in addition to the direct expenses incurred presented in the table. These fees and expenses are not included in the annualized expense ratio used to calculate the expense estimate in the table below.
Hypothetical Example for Comparison Purposes
The second line of the accompanying table provides information about hypothetical account values and hypothetical expenses based on the actual expense ratio and an assumed rate of return of 5% per year before expenses, which is not the actual return. The hypothetical account values and expenses may not be used to estimate the actual ending account balance or expenses you paid for the period. You may use this information to compare the ongoing costs of investing in the Fund and other funds. To do so, compare this 5% hypothetical example with the 5% hypothetical examples that appear in the shareholder reports of the other funds. If any fund is a shareholder of any Underlying Funds, such fund indirectly bears its proportional share of the expenses of the Underlying Funds in addition to the direct expenses as presented in the table. These fees and expenses are not included in the annualized expense ratio used to calculate the expense estimate in the table below.
Please note that the expenses shown in the table are meant to highlight your ongoing costs only and do not reflect any transaction costs. Therefore, the second line of the table is useful in comparing ongoing costs only, and will not help you determine the relative total costs of owning different funds. In addition, if these transactional costs were included, your costs would have been higher.
| | | | | Annualized Expense Ratio- A | | Beginning Account Value May 1, 2023 | | Ending Account Value October 31, 2023 | | Expenses Paid During Period- C May 1, 2023 to October 31, 2023 |
| Fidelity® Canada Fund | | | | | | | | | | |
| Class A | | | | 1.39% | | | | | | |
| Actual | | | | | | $ 1,000 | | $ 930.80 | | $ 6.76 |
Hypothetical-B | | | | | | $ 1,000 | | $ 1,018.20 | | $ 7.07 |
| Class M | | | | 1.66% | | | | | | |
| Actual | | | | | | $ 1,000 | | $ 929.70 | | $ 8.07 |
Hypothetical-B | | | | | | $ 1,000 | | $ 1,016.84 | | $ 8.44 |
| Class C | | | | 2.17% | | | | | | |
| Actual | | | | | | $ 1,000 | | $ 927.00 | | $ 10.54 |
Hypothetical-B | | | | | | $ 1,000 | | $ 1,014.27 | | $ 11.02 |
| Fidelity® Canada Fund | | | | 1.08% | | | | | | |
| Actual | | | | | | $ 1,000 | | $ 932.20 | | $ 5.26 |
Hypothetical-B | | | | | | $ 1,000 | | $ 1,019.76 | | $ 5.50 |
| Class I | | | | 1.07% | | | | | | |
| Actual | | | | | | $ 1,000 | | $ 932.20 | | $ 5.21 |
Hypothetical-B | | | | | | $ 1,000 | | $ 1,019.81 | | $ 5.45 |
| Class Z | | | | .96% | | | | | | |
| Actual | | | | | | $ 1,000 | | $ 932.80 | | $ 4.68 |
Hypothetical-B | | | | | | $ 1,000 | | $ 1,020.37 | | $ 4.89 |
| Fidelity® China Region Fund | | | | | | | | | | |
| Class A | | | | 1.25% | | | | | | |
| Actual | | | | | | $ 1,000 | | $ 928.20 | | $ 6.08 |
Hypothetical-B | | | | | | $ 1,000 | | $ 1,018.90 | | $ 6.36 |
| Class M | | | | 1.51% | | | | | | |
| Actual | | | | | | $ 1,000 | | $ 927.00 | | $ 7.33 |
Hypothetical-B | | | | | | $ 1,000 | | $ 1,017.59 | | $ 7.68 |
| Class C | | | | 1.96% | | | | | | |
| Actual | | | | | | $ 1,000 | | $ 924.80 | | $ 9.51 |
Hypothetical-B | | | | | | $ 1,000 | | $ 1,015.32 | | $ 9.96 |
| Fidelity® China Region Fund | | | | .95% | | | | | | |
| Actual | | | | | | $ 1,000 | | $ 929.80 | | $ 4.62 |
Hypothetical-B | | | | | | $ 1,000 | | $ 1,020.42 | | $ 4.84 |
| Class I | | | | .94% | | | | | | |
| Actual | | | | | | $ 1,000 | | $ 929.80 | | $ 4.57 |
Hypothetical-B | | | | | | $ 1,000 | | $ 1,020.47 | | $ 4.79 |
| Class Z | | | | .81% | | | | | | |
| Actual | | | | | | $ 1,000 | | $ 930.40 | | $ 3.94 |
Hypothetical-B | | | | | | $ 1,000 | | $ 1,021.12 | | $ 4.13 |
| | | | | | | | | | |
| Fidelity® Emerging Asia Fund | | | | .62% | | | | | | |
| Actual | | | | | | $ 1,000 | | $ 988.50 | | $ 3.11 |
Hypothetical-B | | | | | | $ 1,000 | | $ 1,022.08 | | $ 3.16 |
| Fidelity® Emerging Markets Fund | | | | | | | | | | |
| Class A | | | | 1.20% | | | | | | |
| Actual | | | | | | $ 1,000 | | $ 950.70 | | $ 5.90 |
Hypothetical-B | | | | | | $ 1,000 | | $ 1,019.16 | | $ 6.11 |
| Class M | | | | 1.48% | | | | | | |
| Actual | | | | | | $ 1,000 | | $ 949.50 | | $ 7.27 |
Hypothetical-B | | | | | | $ 1,000 | | $ 1,017.74 | | $ 7.53 |
| Class C | | | | 1.98% | | | | | | |
| Actual | | | | | | $ 1,000 | | $ 947.10 | | $ 9.72 |
Hypothetical-B | | | | | | $ 1,000 | | $ 1,015.22 | | $ 10.06 |
| Fidelity® Emerging Markets Fund | | | | .89% | | | | | | |
| Actual | | | | | | $ 1,000 | | $ 952.30 | | $ 4.38 |
Hypothetical-B | | | | | | $ 1,000 | | $ 1,020.72 | | $ 4.53 |
| Class K | | | | .76% | | | | | | |
| Actual | | | | | | $ 1,000 | | $ 952.70 | | $ 3.74 |
Hypothetical-B | | | | | | $ 1,000 | | $ 1,021.37 | | $ 3.87 |
| Class I | | | | .92% | | | | | | |
| Actual | | | | | | $ 1,000 | | $ 952.20 | | $ 4.53 |
Hypothetical-B | | | | | | $ 1,000 | | $ 1,020.57 | | $ 4.69 |
| Class Z | | | | .76% | | | | | | |
| Actual | | | | | | $ 1,000 | | $ 952.90 | | $ 3.74 |
Hypothetical-B | | | | | | $ 1,000 | | $ 1,021.37 | | $ 3.87 |
| Fidelity® Europe Fund | | | | | | | | | | |
| Class A | | | | .97% | | | | | | |
| Actual | | | | | | $ 1,000 | | $ 887.90 | | $ 4.62 |
Hypothetical-B | | | | | | $ 1,000 | | $ 1,020.32 | | $ 4.94 |
| Class M | | | | 1.23% | | | | | | |
| Actual | | | | | | $ 1,000 | | $ 886.90 | | $ 5.85 |
Hypothetical-B | | | | | | $ 1,000 | | $ 1,019.00 | | $ 6.26 |
| Class C | | | | 1.73% | | | | | | |
| Actual | | | | | | $ 1,000 | | $ 884.80 | | $ 8.22 |
Hypothetical-B | | | | | | $ 1,000 | | $ 1,016.48 | | $ 8.79 |
| Fidelity® Europe Fund | | | | .64% | | | | | | |
| Actual | | | | | | $ 1,000 | | $ 889.50 | | $ 3.05 |
Hypothetical-B | | | | | | $ 1,000 | | $ 1,021.98 | | $ 3.26 |
| Class I | | | | .63% | | | | | | |
| Actual | | | | | | $ 1,000 | | $ 889.50 | | $ 3.00 |
Hypothetical-B | | | | | | $ 1,000 | | $ 1,022.03 | | $ 3.21 |
| Class Z | | | | .53% | | | | | | |
| Actual | | | | | | $ 1,000 | | $ 890.10 | | $ 2.52 |
Hypothetical-B | | | | | | $ 1,000 | | $ 1,022.53 | | $ 2.70 |
| Fidelity® Japan Fund | | | | | | | | | | |
| Class A | | | | 1.09% | | | | | | |
| Actual | | | | | | $ 1,000 | | $ 951.60 | | $ 5.36 |
Hypothetical-B | | | | | | $ 1,000 | | $ 1,019.71 | | $ 5.55 |
| Class M | | | | 1.37% | | | | | | |
| Actual | | | | | | $ 1,000 | | $ 950.60 | | $ 6.74 |
Hypothetical-B | | | | | | $ 1,000 | | $ 1,018.30 | | $ 6.97 |
| Class C | | | | 1.77% | | | | | | |
| Actual | | | | | | $ 1,000 | | $ 948.50 | | $ 8.69 |
Hypothetical-B | | | | | | $ 1,000 | | $ 1,016.28 | | $ 9.00 |
| Fidelity® Japan Fund | | | | .84% | | | | | | |
| Actual | | | | | | $ 1,000 | | $ 952.70 | | $ 4.13 |
Hypothetical-B | | | | | | $ 1,000 | | $ 1,020.97 | | $ 4.28 |
| Class I | | | | .84% | | | | | | |
| Actual | | | | | | $ 1,000 | | $ 953.00 | | $ 4.14 |
Hypothetical-B | | | | | | $ 1,000 | | $ 1,020.97 | | $ 4.28 |
| Class Z | | | | .66% | | | | | | |
| Actual | | | | | | $ 1,000 | | $ 953.90 | | $ 3.25 |
Hypothetical-B | | | | | | $ 1,000 | | $ 1,021.88 | | $ 3.36 |
| | | | | | | | | | |
| Fidelity® Japan Smaller Companies Fund | | | | .91% | | | | | | |
| Actual | | | | | | $ 1,000 | | $ 955.30 | | $ 4.48 |
Hypothetical-B | | | | | | $ 1,000 | | $ 1,020.62 | | $ 4.63 |
| Fidelity® Latin America Fund | | | | | | | | | | |
| Class A | | | | 1.32% | | | | | | |
| Actual | | | | | | $ 1,000 | | $ 991.70 | | $ 6.63 |
Hypothetical-B | | | | | | $ 1,000 | | $ 1,018.55 | | $ 6.72 |
| Class M | | | | 1.57% | | | | | | |
| Actual | | | | | | $ 1,000 | | $ 990.60 | | $ 7.88 |
Hypothetical-B | | | | | | $ 1,000 | | $ 1,017.29 | | $ 7.98 |
| Class C | | | | 2.07% | | | | | | |
| Actual | | | | | | $ 1,000 | | $ 988.00 | | $ 10.37 |
Hypothetical-B | | | | | | $ 1,000 | | $ 1,014.77 | | $ 10.51 |
| Fidelity® Latin America Fund | | | | 1.05% | | | | | | |
| Actual | | | | | | $ 1,000 | | $ 992.80 | | $ 5.27 |
Hypothetical-B | | | | | | $ 1,000 | | $ 1,019.91 | | $ 5.35 |
| Class I | | | | .99% | | | | | | |
| Actual | | | | | | $ 1,000 | | $ 993.30 | | $ 4.97 |
Hypothetical-B | | | | | | $ 1,000 | | $ 1,020.21 | | $ 5.04 |
| Class Z | | | | .84% | | | | | | |
| Actual | | | | | | $ 1,000 | | $ 993.90 | | $ 4.22 |
Hypothetical-B | | | | | | $ 1,000 | | $ 1,020.97 | | $ 4.28 |
| | | | | | | | | | |
| Fidelity® Nordic Fund | | | | .92% | | | | | | |
| Actual | | | | | | $ 1,000 | | $ 905.00 | | $ 4.42 |
Hypothetical-B | | | | | | $ 1,000 | | $ 1,020.57 | | $ 4.69 |
| | | | | | | | | | |
| Fidelity® Pacific Basin Fund | | | | .97% | | | | | | |
| Actual | | | | | | $ 1,000 | | $ 939.50 | | $ 4.74 |
Hypothetical-B | | | | | | $ 1,000 | | $ 1,020.32 | | $ 4.94 |
| |
A Annualized expense ratio reflects expenses net of applicable fee waivers.
B 5% return per year before expenses
C Expenses are equal to the annualized expense ratio, multiplied by the average account value over the period, multiplied by 184/ 365 (to reflect the one-half year period). The fees and expenses of any Underlying Funds are not included in each annualized expense ratio.
The dividend and capital gains distributions for the fund(s) are available on Fidelity.com or Institutional.Fidelity.com.
The funds hereby designate as capital gain dividend the amounts noted below for the taxable year ended October 31, 2023, or, if subsequently determined to be different, the net capital gain of such year.
| Fidelity Canada Fund | $20,218,534 |
| Fidelity Japan Fund | $17,974,277 |
| Fidelity Japan Smaller Companies Fund | $3,389,454 |
| Fidelity Pacific Basin Fund | $18,994,072 |
| | |
The funds hereby designate the amounts noted below as distributions paid during the fiscal year ended 2023 as qualifying to be taxed as section 163(j) interest dividends:
| Fidelity Canada Fund | $66,388 |
| Fidelity Emerging Markets Fund | $465,950 |
| | |
A percentage of the dividends distributed during the fiscal year for the following funds may be taken into account as a dividend for purposes of the maximum rate under section 1(h)(11) of the Internal Revenue Code.
| | Class A | Class M | Class C | Retail | Class K | Class I | Class Z |
| Fidelity Canada Fund | | | | | | | |
| December, 2022 | 100% | 100% | 100% | 100% | - | 100% | 100% |
| Fidelity China Region Fund | | | | | | | |
| December, 2022 | 100% | 100% | - | 68.34% | - | 69.31% | 80.51% |
| Fidelity Emerging Markets Fund | | | | | | | |
| December 9, 2022 | 100% | 100% | - | 100% | 100% | 100% | 100% |
| December 28, 2022 | 100% | 100% | - | 100% | 100% | 100% | 100% |
| Fidelity Japan Smaller Companies Fund | | | | | | | |
| December, 2022 | - | - | - | 53.51% | - | - | - |
| Fidelity Latin America Fund | | | | | | | |
| December, 2022 | 28.44% | 29.45% | 31.34% | 27.63% | - | 27.44% | 28.23% |
| | | | | | | | |
The amounts per share which represent income derived from sources within, and taxes paid to, foreign countries or possessions of the United States are as follows:
| | Pay Date | Income | Taxes |
| Fidelity Canada Fund | | | |
| Class A | 12/12/2022 | $0.8224 | $0.1464 |
| Class M | 12/12/2022 | $0.6314 | $0.1464 |
| Class C | 12/12/2022 | $0.1994 | $0.1464 |
| Canada | 12/12/2022 | $1.0164 | $0.1464 |
| Class I | 12/12/2022 | $1.0234 | $0.1464 |
| Class Z | 12/12/2022 | $0.9854 | $0.1464 |
| Fidelity China Region Fund | | | |
| Class A | 12/05/2022 | $0.2780 | $0.0870 |
| Class M | 12/05/2022 | $0.1810 | $0.0870 |
| Class C | 12/05/2022 | $0.0000 | $0.0000 |
| China Region | 12/05/2022 | $0.4300 | $0.0870 |
| Class I | 12/05/2022 | $0.4240 | $0.0870 |
| Class Z | 12/05/2022 | $0.3650 | $0.0870 |
| Fidelity Emerging Markets Fund | | | |
| Class A | 12/12/2022 | $0.2320 | $0.0970 |
| | 12/29/2022 | $0.0070 | $0.0000 |
| Class M | 12/12/2022 | $0.1280 | $0.0970 |
| | 12/29/2022 | $0.0070 | $0.0000 |
| Class C | 12/12/2022 | $0.0000 | $0.0000 |
| | 12/29/2022 | $0.0000 | $0.0000 |
| Emerging Markets | 12/12/2022 | $0.3310 | $0.0970 |
| | 12/29/2022 | $0.0070 | $0.0000 |
| Class K | 12/12/2022 | $0.3700 | $0.0970 |
| | 12/29/2022 | $0.0070 | $0.0000 |
| Class I | 12/12/2022 | $0.3580 | $0.0970 |
| | 12/29/2022 | $0.0070 | $0.0000 |
| Class Z | 12/12/2022 | $0.3720 | $0.0970 |
| | 12/29/2022 | $0.0070 | $0.0000 |
| Fidelity Japan Smaller Companies Fund | | | |
| Japan Smaller Companies | 12/29/2022 | $0.0405 | $0.0335 |
| Fidelity Latin America Fund | | | |
| Class A | 12/12/2022 | $1.6541 | $0.0701 |
| Class M | 12/12/2022 | $1.5971 | $0.0701 |
| Class C | 12/12/2022 | $1.5011 | $0.0701 |
| Latin America | 12/12/2022 | $1.7021 | $0.0701 |
| Class I | 12/12/2022 | $1.7141 | $0.0701 |
| Class Z | 12/12/2022 | $1.6661 | $0.0701 |
| | | | |
The funds will notify shareholders in January 2024 of amounts for use in preparing 2023 income tax returns.
Board Approval of Investment Advisory Contracts and Management Fees
Fidelity Canada Fund
Fidelity China Region Fund
Fidelity Emerging Asia Fund
Fidelity Emerging Markets Fund
Fidelity Europe Fund
Fidelity Japan Fund
Fidelity Japan Smaller Companies Fund
Fidelity Latin America Fund
Fidelity Nordic Fund
Fidelity Pacific Basin Fund
Each year, the Board of Trustees, including the Independent Trustees (together, the Board), considers the renewal of each fund's management contract with Fidelity Management & Research Company LLC (FMR) and the sub-advisory agreements (together, the Advisory Contracts) for each fund. FMR and the sub-advisers are referred to herein as the Investment Advisers. The Board, assisted by the advice of fund counsel and Independent Trustees' counsel, requests and considers a broad range of information relevant to the renewal of the Advisory Contracts throughout the year.
The Board meets regularly and, at each of its meetings, covers an extensive agenda of topics and materials and considers factors that are relevant to its annual consideration of the renewal of each fund's Advisory Contracts, including the services and support provided to each fund and its shareholders. The Board, acting directly and through its Committees (each of which is composed of and chaired by Independent Trustees), requests and receives information concerning the annual consideration of the renewal of each fund's Advisory Contracts. The Board also meets as needed to review matters specifically related to the Board's annual consideration of the renewal of the Advisory Contracts. Members of the Board may also meet with trustees of other Fidelity funds through joint ad hoc committees to discuss certain matters relevant to all of the Fidelity funds.
Approval of Stub Period Continuation. At its May 2023 meeting, the Board of Trustees voted to continue each fund's management contract with FMR, and the sub-advisory agreements and sub-sub-advisory agreements, in each case, where applicable (together, the Advisory Contracts), without modification, for two months from June 1, 2023 through July 31, 2023. The Board considered that the approval of each fund's Advisory Contracts will not result in any changes in (i) the investment process or strategies employed in the management of each fund's assets; (ii) the fees and expenses paid by shareholders; (iii) the nature, extent or quality of services provided under each fund's Advisory Contracts; or (iv) the day-to-day management of each fund or the persons primarily responsible for such management. The Board also considered that since its last approval of each fund's Advisory Contracts, FMR had provided additional information on each fund in support of the annual contract renewal process, including competitive analyses on total expenses and management fees and in-depth reviews of fund performance and fund profitability information. The Board concluded that each fund's Advisory Contracts are fair and reasonable, and that each fund's Advisory Contracts should be renewed, without modification, through July 31, 2023, with the understanding that the Board would consider the annual renewal for a full one year period in July 2023.
At its July 2023 meeting, the Board unanimously determined to renew each fund's Advisory Contracts. In reaching its determination, the Board considered all factors it believed relevant, including (i) the nature, extent, and quality of the services provided to each fund and its shareholders (including the investment performance of each fund); (ii) the competitiveness relative to peer funds of each funds management fee and the total expense ratio of each fund or representative class, as applicable; (iii) the total costs of the services provided by and the profits realized by FMR and its affiliates (Fidelity) from its relationships with each fund; and (iv) the extent to which, if any, economies of scale exist and are realized as each fund grows, and whether any economies of scale are appropriately shared with fund shareholders. The Board also considered the broad range of investment choices available to shareholders from FMR's competitors and that each fund's shareholders have chosen to invest in the fund, which is part of the Fidelity family of funds. The Board's decision to renew the Advisory Contracts was not based on any single factor.
The Board reached a determination, with the assistance of fund counsel and Independent Trustees' counsel and through the exercise of its business judgment, that the renewal of the Advisory Contracts was in the best interests of each fund and its shareholders and that the compensation payable under the Advisory Contracts was fair and reasonable in light of all of the surrounding circumstances.
Nature, Extent, and Quality of Services Provided. The Board considered staffing as it relates to the funds, including the backgrounds and experience of investment personnel of the Investment Advisers, and also considered the Investment Advisers' implementation of each fund's investment program. The Independent Trustees also had discussions with senior management of Fidelity's investment operations and investment groups. The Board considered the structure of the investment personnel compensation program and whether this structure provides appropriate incentives to act in the best interests of each fund. Additionally, the Board considered the portfolio managers' investments, if any, in the funds that they manage.
Resources Dedicated to Investment Management and Support Services. The Board and the Fund Oversight and Research Committees reviewed the general qualifications and capabilities of Fidelity's investment staff, including its size, education, experience, and resources, as well as Fidelity's approach to recruiting, training, managing, and compensating investment personnel. The Board noted the resources devoted to expansion of Fidelity's global investment organization, and that Fidelity's analysts have extensive resources, tools and capabilities that allow them to conduct sophisticated quantitative and fundamental analysis, as well as credit analysis of issuers, counterparties, and guarantors. Further, the Board considered that Fidelity's investment professionals have sufficient access to global information and data so as to provide competitive investment results over time, and that those professionals also have access to sophisticated tools that permit them to assess portfolio construction and risk and performance attribution characteristics continuously, as well as to transmit new information and research conclusions rapidly around the world. Additionally, in its deliberations, the Board considered Fidelity's trading, risk management, compliance, and technology and operations capabilities and resources, which are integral parts of the investment management process.
Shareholder and Administrative Services. The Board considered (i) the nature, extent, quality, and cost of advisory, administrative, and shareholder services performed by the Investment Advisers and their affiliates under the Advisory Contracts and under separate agreements covering transfer agency, pricing and bookkeeping, and securities lending services for each fund; (ii) the nature and extent of Fidelity's supervision of third party service providers, principally custodians, subcustodians, and pricing vendors; and (iii) the resources devoted by Fidelity to, and the record of compliance with, each fund's compliance policies and procedures. The Board also reviewed the allocation of fund brokerage, including allocations to brokers affiliated with the Investment Advisers, the use of brokerage commissions to pay fund expenses, and the use of "soft" commission dollars to pay for research services. The Board also considered each fund's securities lending activities and any payments made to Fidelity relating to securities lending.
The Board noted that the growth of fund assets over time across the complex allows Fidelity to reinvest in the development of services designed to enhance the value and convenience of the Fidelity funds as investment vehicles. These services include 24-hour access to account information and market information over the Internet and through telephone representatives, investor education materials, and asset allocation tools. The Board also considered that it reviews customer service metrics such as telephone response times, continuity of services on the website and metrics addressing services at Fidelity Investor Centers.
Investment in a Large Fund Family. The Board considered the benefits to shareholders of investing in a fund that is part of a large family of funds offering a variety of investment disciplines and providing a large variety of fund investor services. The Board noted that Fidelity had taken, or had made recommendations that resulted in the Fidelity funds taking, a number of actions over the previous year that benefited particular funds and/or the Fidelity funds in general.
Investment Performance. The Board took into account discussions that occur with representatives of the Investment Advisers, and reports that it receives, at Board meetings throughout the year, relating to fund investment performance. In this regard the Board noted that as part of regularly scheduled fund reviews and other reports to the Board on fund performance, the Board considered annualized return information for each fund for different time periods, measured against an appropriate securities market index (benchmark index) and, for Fidelity Emerging Markets Fund, Fidelity Europe Fund, and Fidelity Japan Fund, an appropriate peer group of funds with similar objectives (peer group). The Board also considered information about performance attribution. In its ongoing evaluation of fund investment performance, the Board gives particular attention to information indicating changes in performance of the funds over different time periods and discussed with the Investment Advisers the reasons for any overperformance or underperformance. Fidelity Europe Fund underperformed its benchmark and peers for the one- and three-year periods ended February 28, 2023 and Fidelity Latin America Fund underperformed its benchmark for the one-, three- and five-year periods ended February 28, 2023. As a result, the Board continues to engage in discussions with FMR about the steps it is taking to address the fund's performance.
In addition to reviewing absolute and relative fund performance, the Independent Trustees periodically consider the appropriateness of fund performance metrics in evaluating the results achieved. The Independent Trustees generally give greater weight to fund performance over longer time periods than over shorter time periods. Depending on the circumstances, the Independent Trustees may be satisfied with a fund's performance notwithstanding that it lags its benchmark index or peer group for certain periods.
Based on its review, the Board concluded that the nature, extent, and quality of services provided to each fund under the Advisory Contracts should continue to benefit the shareholders of each fund.
Competitiveness of Management Fee and Total Expense Ratio. The Board was provided with information regarding industry trends in management fees and expenses. In its review of each fund's management fee and total expense ratio of the fund or the retail class (for Fidelity Canada Fund, Fidelity China Region Fund, Fidelity Emerging Markets Fund, Fidelity Europe Fund, Fidelity Japan Fund and Fidelity Latin America Fund), the Board considered each fund's management fee rate as well as other fund or class expenses, as applicable, such as transfer agent fees, pricing and bookkeeping fees, fund-paid 12b-1 fees (in the case of Fidelity Canada Fund, Fidelity China Region Fund, Fidelity Emerging Markets Fund, Fidelity Europe Fund, Fidelity Japan Fund and Fidelity Latin America Fund), and custodial, legal, and audit fees. The Board noted that Fidelity may agree to waive fees or reimburse expenses from time to time, and the extent to which, if any, it has done so for each fund. For Fidelity Canada Fund, Fidelity Emerging Asia Fund, Fidelity Emerging Markets Fund, Fidelity Europe Fund, Fidelity Japan Fund and Fidelity Pacific Basin Fund, the Board also considered information about the impact of each fund's performance adjustment.
Comparisons of Management Fees and Total Expense Ratios. Among other things, the Board reviewed data for selected groups of competitive funds and classes (referred to as "mapped groups") that were compiled by Fidelity based on combining similar investment objective categories (as classified by Lipper) that have comparable investment mandates. The data reviewed by the Board included (i) gross management fee comparisons (before taking into account expense reimbursements or caps and without taking into account a fund's performance adjustment, if applicable) relative to the total universe of funds within the mapped group; (ii) gross management fee comparisons relative to a subset of non-Fidelity funds in the mapped group that are similar in size and management fee structure to each fund (referred to as the "asset size peer group"); (iii) total expense comparisons of the fund or the retail class, as applicable, relative to funds and classes in the mapped group that have a similar sales load structure to the fund or representative class, as applicable (referred to as the "similar sales load structure group"); and (iv) total expense comparisons of the fund or the retail class, as applicable relative to funds and classes in the similar sales load structure group that are similar in size and management fee structure to the fund or class, as applicable (referred to as the "total expense asset size peer group"). The total expense asset size peer group comparison excludes performance adjustments and fund-paid 12b-1 fees to eliminate variability in fee structures.
The information provided to the Board indicated that each fund's management fee rate ranked below the competitive median of the mapped group for the 12-month period ended September 30, 2022 and below the competitive median of the asset size peer group for the 12-month period ended September 30, 2022.
For each of Fidelity China Region Fund, Fidelity Emerging Asia Fund, Fidelity Emerging Markets Fund, Fidelity Japan Smaller Companies Fund, Fidelity Latin America Fund and Fidelity Nordic Fund, the information provided to the Board indicated that the total expense ratio of the fund or the retail class of the fund, as applicable, ranked below the competitive median of the similar sales load structure group for the 12-month period ended September 30, 2022 and below the competitive median of the asset size peer group for the 12-month period ended September 30, 2022.
For each of Fidelity Canada Fund and Fidelity Europe Fund, the information provided to the Board indicated that the total expense ratio of the retail class of the fund ranked below the competitive median of the similar sales load structure group for the 12-month period ended September 30, 2022 and above the competitive median of the asset size peer group for the 12-month period ended September 30, 2022. When excluding quantitative fund competitors in the total expense asset size peer group, the total expense ratio for the retail class of Fidelity Canada Fund would rank below the competitive median.
For Fidelity Japan Fund, the information provided to the Board indicated that the total expense ratio of the retail class of the fund ranked above the competitive median of the similar sales load structure group for the 12-month period ended September 30, 2022 and above the competitive median of the asset size peer group for the 12-month period ended September 30, 2022. When excluding the effect of the fund's positive performance adjustment, the total expense ratio for the retail class of the fund would rank below the similar sales load structure group median.
For Fidelity Pacific Basin Fund, the information provided to the Board indicated that the total expense ratio of the fund ranked above the competitive median of the similar sales load structure group for the 12-month period ended September 30, 2022 and below the competitive median of the asset size peer group for the 12-month period ended September 30, 2022. When excluding the effect of the fund's positive performance adjustment, the total expense ratio for the fund would rank below the similar sales load structure group median.
The Board noted that certain funds offer multiple classes, each of which has a different sales load and 12b-1 fee structure, and that the multiple structures are intended to offer a range of pricing options for the intermediary market. The Board also noted that the total expense ratios of the classes of each fund vary primarily by the level of their 12b-1 fees, although differences in transfer agent fees may also cause expenses to vary from class to class.
The Board also considered that, for funds subject to the group fee, FMR agreed to voluntarily waive fees over a specified period of time in amounts designed to account for assets converted from certain funds to certain collective investment trusts.
For Fidelity Canada Fund, Fidelity Emerging Asia Fund, Fidelity Europe Fund, Fidelity Japan Fund and Fidelity Pacific Basin Fund, the Board also considered that each fund's management fee is subject to upward or downward adjustment depending upon whether, and to what extent, each fund's investment performance for the performance period (a rolling 36-month period) exceeds, or is exceeded by, a securities index, thus leading to a performance adjustment for the same period. The Board noted that the performance adjustment provides FMR with a strong economic incentive to seek to achieve superior long-term performance for each fund's shareholders and helps to more closely align the interests of FMR and the shareholders of each fund.
For Fidelity Canada Fund, Fidelity Europe Fund and Fidelity Japan Fund, in connection with its consideration of each fund's performance adjustment, the Board noted that the performance of the retail class is used for purposes of determining the performance adjustment. The Board noted that to the extent the performance adjustment was based on the performance of a share class with higher total annual operating expenses, the fund would be subject to a smaller positive and larger negative performance adjustment. The Board considered the appropriateness of the use of the retail class as the basis for the performance adjustment. The Board noted that the retail class is typically the largest class (reflecting the actual investment experience for the plurality of shareholders), employs a standard expense structure, and does not include fund-paid 12b-1 fees, which Fidelity believes makes it a more appropriate measurement of Fidelity's investment skill.
Fees Charged to Other Fidelity Clients. The Board also considered Fidelity fee structures and other information with respect to clients of Fidelity, such as other funds advised or subadvised by Fidelity, pension plan clients, and other institutional clients with similar mandates. The Board noted that a joint ad hoc committee created by it and the boards of other Fidelity funds periodically reviews and compares Fidelity's institutional investment advisory business with its business of providing services to the Fidelity funds and also noted the most recent findings of the committee. The Board noted that the committee's review included a consideration of the differences in services provided, fees charged, and costs incurred, as well as competition in the markets serving the different categories of clients.
Based on its review, the Board concluded that each fund's management fee, including the use of the retail class as the basis for the performance adjustment (for Fidelity Canada Fund, Fidelity Emerging Markets Fund, Fidelity Europe Fund and Fidelity Japan Fund), is fair and reasonable in light of the services that each fund receives and the other factors considered. Further, based on its review of total expense ratios and fees charged to other Fidelity clients, the Board concluded that the total expense ratio of each fund or each class of each fund, as applicable, was reasonable in light of the services that the fund and its shareholders receive and the other factors considered.
Costs of the Services and Profitability. The Board considered the revenues earned and the expenses incurred by Fidelity in conducting the business of developing, marketing, distributing, managing, administering and servicing each fund and servicing each fund's shareholders. The Board also considered the level of Fidelity's profits in respect of all the Fidelity funds.
On an annual basis, Fidelity presents to the Board information about the profitability of its relationships with each fund. Fidelity calculates profitability information for each fund, as well as aggregate profitability information for groups of Fidelity funds and all Fidelity funds, using a series of detailed revenue and cost allocation methodologies which originate with the books and records of Fidelity on which Fidelity's audited financial statements are based. The Audit Committee of the Board reviews any significant changes from the prior year's methodologies and the full Board approves such changes.
A public accounting firm has been engaged annually by the Board as part of the Board's assessment of Fidelity's profitability analysis. The engagement includes the review and assessment of the methodologies used by Fidelity in determining the revenues and expenses attributable to Fidelity's fund business, and completion of agreed-upon procedures in respect of the mathematical accuracy of certain fund profitability information and its conformity to established allocation methodologies. After considering the reports issued under the engagement and information provided by Fidelity, the Board concluded that while other allocation methods may also be reasonable, Fidelity's profitability methodologies are reasonable in all material respects.
The Board also reviewed Fidelity's non-fund businesses and potential indirect benefits such businesses may have received as a result of their association with Fidelity's fund business (i.e., fall-out benefits) as well as cases where Fidelity's affiliates may benefit from the funds' business. The Board considered areas where potential indirect benefits to the Fidelity funds from their relationships with Fidelity may exist. The Board's consideration of these matters was informed by the findings of a joint ad hoc committee created by it and the boards of other Fidelity funds to evaluate potential fall-out benefits.
The Board considered the costs of the services provided by and the profits realized by Fidelity in connection with the operation of each fund and was satisfied that the profitability was not excessive.
Economies of Scale. The Board considered whether there have been economies of scale in respect of the management of the Fidelity funds, whether the Fidelity funds (including each fund) have appropriately benefited from any such economies of scale, and whether there is potential for realization of any further economies of scale. The Board considered the extent to which each fund will benefit from economies of scale as assets grow through increased services to the fund, through waivers or reimbursements, or through fee or expense ratio reductions. The Board also noted that a committee (the Economies of Scale Committee) created by it and the boards of other Fidelity funds periodically analyzes whether Fidelity attains economies of scale in respect of the management and servicing of the Fidelity funds, whether the Fidelity funds have appropriately benefited from such economies of scale, and whether there is potential for realization of any further economies of scale.
The Board recognized that each fund's management contract incorporates a "group fee" structure, which provides for lower group fee rates as total "group assets" increase, and for higher group fee rates as total "group assets" decrease ("group assets" as defined in the management contracts). FMR calculates the group fee rates based on a tiered asset "breakpoint" schedule that varies based on asset class. The Board considered that the group fee is designed to deliver the benefits of economies of scale to fund shareholders when total Fidelity fund assets increase, even if assets of any particular fund are unchanged or have declined, because some portion of Fidelity's costs are attributable to services provided to all Fidelity funds, and all funds benefit if those costs can be allocated among more assets. The Board further considered that Fidelity agreed to impose a temporary fee waiver in the form of additional breakpoints to the current breakpoint schedule. The Board concluded that, given the group fee structure, fund shareholders will benefit from lower management fees as "group assets" increase at the fund complex level, regardless of whether Fidelity achieves any such economies of scale.
The Board concluded, taking into account the analysis of the Economies of Scale Committee, that economies of scale, if any, are being appropriately shared between fund shareholders and Fidelity.
Additional Information Requested by the Board. In order to develop fully the factual basis for consideration of the Fidelity funds' advisory contracts, the Board requested and received additional information on certain topics, including: (i) fund flow and performance trends, in particular the underperformance of certain funds and strategies, and Fidelity's long-term strategies for certain funds, including any consideration of fund liquidations or mergers; (ii) the operation of performance fees and competitor use of performance fees; (iii) Fidelity's pricing philosophy compared to competitors; (iv) fund profitability methodology and data; (v) evaluation of competitive fund data and peer group classifications and fee and expense comparisons; (vi) the management fee and expense structures for different funds and classes and information about the differences between various fee and expense structures; (vii) group fee breakpoints and related voluntary fee waivers; and (viii) information regarding other accounts managed by Fidelity and the funds' sub-advisory arrangements.
Conclusion. Based on its evaluation of all of the conclusions noted above, and after considering all factors it believed relevant, the Board, including the Independent Trustees, concluded that the advisory and sub-advisory fee arrangements are fair and reasonable in light of all of the surrounding circumstances and that each fund's Advisory Contracts should be renewed through July 31, 2024.
1.754542.123
TIF-ANN-1223
Fidelity® Infrastructure Fund
Annual Report
October 31, 2023
Contents
To view a fund's proxy voting guidelines and proxy voting record for the 12-month period ended June 30, visit http://www.fidelity.com/proxyvotingresults or visit the Securities and Exchange Commission's (SEC) web site at http://www.sec.gov.
You may also call 1-800-544-8544 to request a free copy of the proxy voting guidelines.
Standard & Poor's, S&P and S&P 500 are registered service marks of The McGraw-Hill Companies, Inc. and have been licensed for use by Fidelity Distributors Corporation.
Other third-party marks appearing herein are the property of their respective owners.
All other marks appearing herein are registered or unregistered trademarks or service marks of FMR LLC or an affiliated company. © 2023 FMR LLC. All rights reserved.
This report and the financial statements contained herein are submitted for the general information of the shareholders of the Fund. This report is not authorized for distribution to prospective investors in the Fund unless preceded or accompanied by an effective prospectus.
A fund files its complete schedule of portfolio holdings with the SEC for the first and third quarters of each fiscal year on Form N-PORT. Forms N-PORT are available on the SEC's web site at http://www.sec.gov. A fund's Forms N-PORT may be reviewed and copied at the SEC's Public Reference Room in Washington, DC. Information regarding the operation of the SEC's Public Reference Room may be obtained by calling 1-800-SEC-0330.
For a complete list of a fund's portfolio holdings, view the most recent holdings listing, semiannual report, or annual report on Fidelity's web site at http://www.fidelity.com, http://www.institutional.fidelity.com, or http://www.401k.com, as applicable.
NOT FDIC INSURED •MAY LOSE VALUE •NO BANK GUARANTEE
Neither the Fund nor Fidelity Distributors Corporation is a bank.
Average annual total return reflects the change in the value of an investment, assuming reinvestment of distributions from dividend income and capital gains (the profits earned upon the sale of securities that have grown in value, if any) and assuming a constant rate of performance each year. The hypothetical investment and the average annual total returns do not reflect the deduction of taxes that a shareholder would pay on fund distributions or the redemption of fund shares. During periods of reimbursement by Fidelity, a fund's total return will be greater than it would be had the reimbursement not occurred. How a fund did yesterday is no guarantee of how it will do tomorrow.
| Average Annual Total Returns |
| | | | |
Periods ended October 31, 2023 | Past 1 year | Life of Fund A |
| Fidelity® Infrastructure Fund | -2.43% | 2.95% |
A From November 5, 2019
| $10,000 Over Life of Fund |
| |
Let's say hypothetically that $10,000 was invested in Fidelity® Infrastructure Fund, on November 5, 2019, when the fund started. The chart shows how the value of your investment would have changed, and also shows how the MSCI ACWI (All Country World Index) Index performed over the same period. |
|
|
Market Recap:
Global equities gained 10.91% for the 12 months ending October 31, 2023, according to the MSCI ACWI (All Country World Index) Index, as global economic expansion and a slowing in the pace of inflation in some markets provided a favorable backdrop for risk assets. After returning -18.07% in 2022, the index's upturn has been largely driven by a narrow set of companies in the information technology and communication services sectors, in part due to excitement for generative artificial intelligence applications. The index gained 18.36% year to date through July, including gains in June (+5.83%) and July (+3.68%). The rally for international equities sputtered for the next three months (-9.54%) amid a stalling pattern in disinflationary trends, heightened global recession and geopolitical risks, soaring yields on longer-term U.S. government bonds, and particularly weak economic conditions in the eurozone and China. Even still, the three-month decline left global stocks up 7.07% year to date through October. Currency fluctuation also bolstered non-U.S. equity performance overall. For the full 12 months, nearly all regions advanced, with Europe ex U.K. (+18%) and Japan (+17%) leading, whereas Canada (-0.38%) lagged by the widest margin, while the U.S. middled (+10%). All but three of 11 sectors advanced, with information technology (+29%) and communication services (+27%) leading. Conversely, the real estate sector (-3%) lagged most, followed by health care and utilities (-1% each).
Comments from Portfolio Manager Pranay Kirpalani:
For the fiscal year ending October 31, 2023, the fund returned -2.43%, versus -1.31% for the S&P Global Infrastructure Index and 10.91% for the broad-based MSCI All Country World Index (Net MA). From a sector standpoint, sector-and-industry positioning was the primary detractor from the fund's performance relative to the S&P index, especially an underweight in energy. Stock picking in communication services also hurt. Also hurting our result were stock selection in real estate and utilities. The fund's largest individual relative detractor was an overweight in NextEra Energy (-23%). NextEra Energy was among the fund's top holdings the past 12 months. A second notable relative detractor was an underweight in ONEOK (+16%). ONEOK was not held at period end. Another notable relative detractor was our non-index stake in Nextera Energy Partners (-19%). Nextera Energy Partners was not held at period end. In contrast, the biggest contributor to the fund's performance versus the benchmark was stock selection in industrials. Stock picking in energy also boosted fund's relative performance. Also bolstering our relative result was an underweight in utilities. Lastly, the fund's position in cash was a notable contributor. Not owning Dominion Energy, a benchmark component that returned roughly -39%, was the fund's top individual relative contributor. A non-benchmark stake in Kansai Electric Power gained 45% and was the second-largest relative contributor. This was a position we established the past year. Another notable relative contributor was our non-benchmark stake in Equinix (+31%). Notable changes in positioning include decreased exposure to the communication services sector and a higher allocation to real estate.
The views expressed above reflect those of the portfolio manager(s) only through the end of the period as stated on the cover of this report and do not necessarily represent the views of Fidelity or any other person in the Fidelity organization. Any such views are subject to change at any time based upon market or other conditions and Fidelity disclaims any responsibility to update such views. These views may not be relied on as investment advice and, because investment decisions for a Fidelity fund are based on numerous factors, may not be relied on as an indication of trading intent on behalf of any Fidelity fund.
Top Holdings (% of Fund's net assets) |
| |
| Aena SME SA | 7.7 | |
| Southern Co. | 6.8 | |
| NextEra Energy, Inc. | 6.4 | |
| Cheniere Energy, Inc. | 6.0 | |
| GFL Environmental, Inc. | 4.6 | |
| National Grid PLC | 4.4 | |
| The Williams Companies, Inc. | 4.4 | |
| Iberdrola SA | 4.4 | |
| Republic Services, Inc. | 4.3 | |
| Targa Resources Corp. | 3.7 | |
| | 52.7 | |
| |
| Market Sectors (% of Fund's net assets) |
| |
| Utilities | 39.1 | |
| Industrials | 28.1 | |
| Energy | 15.0 | |
| Real Estate | 10.4 | |
| Communication Services | 3.4 | |
| |
Asset Allocation (% of Fund's net assets) |
|
|
Geographic Diversification (% of Fund's net assets) |
|
* Includes Short-Term investments and Net Other Assets (Liabilities). Percentages are adjusted for the effect of derivatives, if applicable. |
| |
Showing Percentage of Net Assets
| Common Stocks - 96.0% |
| | | Shares | Value ($) |
| COMMUNICATION SERVICES - 3.4% | | | |
| Diversified Telecommunication Services - 3.4% | | | |
| Cellnex Telecom SA (a) | | 41,238 | 1,212,237 |
| Helios Towers PLC (b) | | 281,462 | 207,143 |
| | | | 1,419,380 |
| ENERGY - 15.0% | | | |
| Oil, Gas & Consumable Fuels - 15.0% | | | |
| Cheniere Energy, Inc. | | 15,002 | 2,496,633 |
| Enterprise Products Partners LP | | 14,996 | 390,496 |
| Targa Resources Corp. | | 18,709 | 1,564,259 |
| The Williams Companies, Inc. | | 53,837 | 1,851,993 |
| | | | 6,303,381 |
| INDUSTRIALS - 28.1% | | | |
| Commercial Services & Supplies - 11.9% | | | |
| GFL Environmental, Inc. | | 66,225 | 1,908,605 |
| Republic Services, Inc. | | 12,280 | 1,823,457 |
| Waste Connections, Inc. (United States) | | 9,558 | 1,237,761 |
| | | | 4,969,823 |
| Construction & Engineering - 2.7% | | | |
| Ferrovial SE | | 29,164 | 877,614 |
| Ferrovial SE rights (b)(c)(d) | | 29,164 | 13,195 |
| VINCI SA | | 2,170 | 239,946 |
| | | | 1,130,755 |
| Ground Transportation - 3.7% | | | |
| Canadian Pacific Kansas City Ltd. | | 3,394 | 240,872 |
| CSX Corp. | | 17,779 | 530,703 |
| Norfolk Southern Corp. | | 1,200 | 228,948 |
| Union Pacific Corp. | | 2,760 | 573,004 |
| | | | 1,573,527 |
| Transportation Infrastructure - 9.8% | | | |
| Aena SME SA (a) | | 22,399 | 3,241,026 |
| Grupo Aeroportuario Norte S.A.B. de CV ADR | | 14,158 | 866,045 |
| | | | 4,107,071 |
TOTAL INDUSTRIALS | | | 11,781,176 |
| REAL ESTATE - 10.4% | | | |
| Equity Real Estate Investment Trusts (REITs) - 10.4% | | | |
| American Tower Corp. | | 7,077 | 1,261,051 |
| Crown Castle International Corp. | | 4,068 | 378,243 |
| Equinix, Inc. | | 1,696 | 1,237,469 |
| Londonmetric Properity PLC | | 145,028 | 291,558 |
| Prologis (REIT), Inc. | | 6,905 | 695,679 |
| Segro PLC | | 54,551 | 472,615 |
| Urban Logistics REIT PLC | | 8,164 | 10,340 |
| | | | 4,346,955 |
| UTILITIES - 39.1% | | | |
| Electric Utilities - 24.8% | | | |
| Constellation Energy Corp. | | 9,270 | 1,046,768 |
| Exelon Corp. | | 27,706 | 1,078,872 |
| Iberdrola SA | | 164,890 | 1,833,909 |
| Kansai Electric Power Co., Inc. | | 72,361 | 926,499 |
| NextEra Energy, Inc. | | 45,845 | 2,672,764 |
| Southern Co. | | 42,200 | 2,840,060 |
| | | | 10,398,872 |
| Independent Power and Renewable Electricity Producers - 3.7% | | | |
| EDP Renovaveis SA | | 29,323 | 471,295 |
| RWE AG | | 27,816 | 1,063,382 |
| | | | 1,534,677 |
| Multi-Utilities - 10.6% | | | |
| National Grid PLC | | 157,100 | 1,873,100 |
| Sempra | | 20,400 | 1,428,612 |
| WEC Energy Group, Inc. | | 14,259 | 1,160,540 |
| | | | 4,462,252 |
TOTAL UTILITIES | | | 16,395,801 |
| TOTAL COMMON STOCKS (Cost $39,159,995) | | | 40,246,693 |
| | | | |
| Money Market Funds - 4.2% |
| | | Shares | Value ($) |
Fidelity Cash Central Fund 5.40% (e) (Cost $1,745,398) | | 1,745,049 | 1,745,398 |
| | | | |
| TOTAL INVESTMENT IN SECURITIES - 100.2% (Cost $40,905,393) | 41,992,091 |
NET OTHER ASSETS (LIABILITIES) - (0.2)% | (68,256) |
| NET ASSETS - 100.0% | 41,923,835 |
| | |
Legend
| (a) | Security exempt from registration under Rule 144A of the Securities Act of 1933. These securities may be resold in transactions exempt from registration, normally to qualified institutional buyers. At the end of the period, the value of these securities amounted to $4,453,263 or 10.6% of net assets. |
| (c) | Security or a portion of the security is on loan at period end. |
| (d) | Security or a portion of the security purchased on a delayed delivery or when-issued basis. |
| (e) | Affiliated fund that is generally available only to investment companies and other accounts managed by Fidelity Investments. The rate quoted is the annualized seven-day yield of the fund at period end. A complete unaudited listing of the fund's holdings as of its most recent quarter end is available upon request. In addition, each Fidelity Central Fund's financial statements, which are not covered by the Fund's Report of Independent Registered Public Accounting Firm, are available on the SEC's website or upon request. |
Affiliated Central Funds
Fiscal year to date information regarding the Fund's investments in Fidelity Central Funds, including the ownership percentage, is presented below.
| Affiliate | Value, beginning of period ($) | Purchases ($) | Sales Proceeds ($) | Dividend Income ($) | Realized Gain (loss) ($) | Change in Unrealized appreciation (depreciation) ($) | Value, end of period ($) | % ownership, end of period |
| Fidelity Cash Central Fund 5.40% | 1,292,455 | 16,217,571 | 15,764,628 | 92,819 | - | - | 1,745,398 | 0.0% |
| Fidelity Securities Lending Cash Central Fund 5.40% | 377,175 | 13,104,398 | 13,481,573 | 3,126 | - | - | - | 0.0% |
| Total | 1,669,630 | 29,321,969 | 29,246,201 | 95,945 | - | - | 1,745,398 | |
| | | | | | | | | |
Amounts in the dividend income column in the above table include any capital gain distributions from underlying funds, which are presented in the corresponding line item in the Statement of Operations, if applicable.
Amounts in the dividend income column for Fidelity Securities Lending Cash Central Fund represents the income earned on investing cash collateral, less rebates paid to borrowers and any lending agent fees associated with the loan, plus any premium payments received for lending certain types of securities.
Amounts included in the purchases and sales proceeds columns may include in-kind transactions, if applicable.
Investment Valuation
The following is a summary of the inputs used, as of October 31, 2023, involving the Fund's assets and liabilities carried at fair value. The inputs or methodology used for valuing securities may not be an indication of the risk associated with investing in those securities. For more information on valuation inputs, and their aggregation into the levels used below, please refer to the Investment Valuation section in the accompanying Notes to Financial Statements.
| Valuation Inputs at Reporting Date: |
| Description | Total ($) | Level 1 ($) | Level 2 ($) | Level 3 ($) |
Investments in Securities: | | | | |
|
| Equities: | | | | |
Communication Services | 1,419,380 | 207,143 | 1,212,237 | - |
Energy | 6,303,381 | 6,303,381 | - | - |
Industrials | 11,781,176 | 11,528,035 | 253,141 | - |
Real Estate | 4,346,955 | 4,346,955 | - | - |
Utilities | 16,395,801 | 11,762,293 | 4,633,508 | - |
|
| Money Market Funds | 1,745,398 | 1,745,398 | - | - |
| Total Investments in Securities: | 41,992,091 | 35,893,205 | 6,098,886 | - |
| Statement of Assets and Liabilities |
| | | | October 31, 2023 |
| | | | | |
| Assets | | | | |
| Investment in securities, at value - See accompanying schedule: | | | | |
Unaffiliated issuers (cost $39,159,995) | $ | 40,246,693 | | |
Fidelity Central Funds (cost $1,745,398) | | 1,745,398 | | |
| | | | | |
| | | | | |
| Total Investment in Securities (cost $40,905,393) | | | $ | 41,992,091 |
| Foreign currency held at value (cost $11,654) | | | | 11,653 |
| Receivable for investments sold | | | | 64,775 |
| Receivable for fund shares sold | | | | 3,437 |
| Dividends receivable | | | | 40,264 |
| Reclaims receivable | | | | 26,034 |
| Distributions receivable from Fidelity Central Funds | | | | 9,398 |
| Prepaid expenses | | | | 69 |
| Receivable from investment adviser for expense reductions | | | | 20,252 |
Total assets | | | | 42,167,973 |
| Liabilities | | | | |
| Payable for investments purchased | | | | |
Regular delivery | $ | 140,526 | | |
Delayed delivery | | 13,195 | | |
| Payable for fund shares redeemed | | 13,126 | | |
| Accrued management fee | | 23,797 | | |
| Other affiliated payables | | 10,919 | | |
| Audit fee payable | | 41,575 | | |
| Other payables and accrued expenses | | 1,000 | | |
| Total Liabilities | | | | 244,138 |
| Net Assets | | | $ | 41,923,835 |
| Net Assets consist of: | | | | |
| Paid in capital | | | $ | 46,950,380 |
| Total accumulated earnings (loss) | | | | (5,026,545) |
| Net Assets | | | $ | 41,923,835 |
Net Asset Value, offering price and redemption price per share ($41,923,835 ÷ 3,909,894 shares) | | | $ | 10.72 |
| Statement of Operations |
| | | | Year ended October 31, 2023 |
| Investment Income | | | | |
| Dividends | | | $ | 1,187,565 |
| Non-Cash dividends | | | | 110,860 |
| Income from Fidelity Central Funds (including $3,126 from security lending) | | | | 95,945 |
| Income before foreign taxes withheld | | | $ | 1,394,370 |
| Less foreign taxes withheld | | | | (59,000) |
| Total Income | | | | 1,335,370 |
| Expenses | | | | |
| Management fee | $ | 319,181 | | |
| Transfer agent fees | | 120,496 | | |
| Accounting fees | | 16,745 | | |
| Custodian fees and expenses | | 8,527 | | |
| Independent trustees' fees and expenses | | 271 | | |
| Registration fees | | 24,957 | | |
| Audit | | 53,907 | | |
| Legal | | 43 | | |
| Miscellaneous | | 195 | | |
| Total expenses before reductions | | 544,322 | | |
| Expense reductions | | (98,014) | | |
| Total expenses after reductions | | | | 446,308 |
| Net Investment income (loss) | | | | 889,062 |
| Realized and Unrealized Gain (Loss) | | | | |
| Net realized gain (loss) on: | | | | |
| Investment Securities: | | | | |
| Unaffiliated issuers | | (2,473,551) | | |
| Foreign currency transactions | | 9,702 | | |
| Total net realized gain (loss) | | | | (2,463,849) |
| Change in net unrealized appreciation (depreciation) on: | | | | |
| Investment Securities: | | | | |
| Unaffiliated issuers | | (51,886) | | |
| Assets and liabilities in foreign currencies | | 903 | | |
| Total change in net unrealized appreciation (depreciation) | | | | (50,983) |
| Net gain (loss) | | | | (2,514,832) |
| Net increase (decrease) in net assets resulting from operations | | | $ | (1,625,770) |
| Statement of Changes in Net Assets |
| |
| | Year ended October 31, 2023 | | Year ended October 31, 2022 |
| Increase (Decrease) in Net Assets | | | | |
| Operations | | | | |
| Net investment income (loss) | $ | 889,062 | $ | 548,089 |
| Net realized gain (loss) | | (2,463,849) | | (2,117,443) |
| Change in net unrealized appreciation (depreciation) | | (50,983) | | (4,462,414) |
| Net increase (decrease) in net assets resulting from operations | | (1,625,770) | | (6,031,768) |
| Distributions to shareholders | | (954,622) | | (639,029) |
| | | | | |
| Share transactions | | | | |
| Proceeds from sales of shares | | 20,419,990 | | 27,766,378 |
| Reinvestment of distributions | | 885,226 | | 598,670 |
| Cost of shares redeemed | | (14,157,019) | | (30,384,461) |
| | | | | |
Net increase (decrease) in net assets resulting from share transactions | | 7,148,197 | | (2,019,413) |
| Total increase (decrease) in net assets | | 4,567,805 | | (8,690,210) |
| | | | | |
| Net Assets | | | | |
| Beginning of period | | 37,356,030 | | 46,046,240 |
| End of period | $ | 41,923,835 | $ | 37,356,030 |
| | | | | |
| Other Information | | | | |
| Shares | | | | |
| Sold | | 1,707,795 | | 2,232,445 |
| Issued in reinvestment of distributions | | 75,822 | | 51,607 |
| Redeemed | | (1,203,495) | | (2,600,860) |
| Net increase (decrease) | | 580,122 | | (316,808) |
| | | | | |
Financial Highlights
| Fidelity® Infrastructure Fund |
| |
| Years ended October 31, | | 2023 | | 2022 | | 2021 | | 2020 A |
Selected Per-Share Data | | | | | | | | |
| Net asset value, beginning of period | $ | 11.22 | $ | 12.63 | $ | 10.44 | $ | 10.00 |
| Income from Investment Operations | | | | | | | | |
Net investment income (loss) B,C | | .22 | | .13 D | | .07 | | .17 |
| Net realized and unrealized gain (loss) | | (.47) | | (1.38) | | 2.21 | | .31 |
| Total from investment operations | | (.25) | | (1.25) | | 2.28 | | .48 |
| Distributions from net investment income | | (.25) | | (.16) | | (.09) | | (.04) |
| Total distributions | | (.25) | | (.16) | | (.09) | | (.04) |
| Net asset value, end of period | $ | 10.72 | $ | 11.22 | $ | 12.63 | $ | 10.44 |
Total Return E,F | | (2.43)% | | (9.95)% | | 21.96% | | 4.79% |
Ratios to Average Net Assets C,G,H | | | | | | | | |
| Expenses before reductions | | 1.15% | | 1.13% | | 1.24% | | 2.24% I |
| Expenses net of fee waivers, if any | | .94% | | .98% | | 1.00% | | 1.00% I |
| Expenses net of all reductions | | .94% | | .98% | | 1.00% | | .98% I |
| Net investment income (loss) | | 1.88% | | 1.08% D | | .61% | | 1.67% I |
| Supplemental Data | | | | | | | | |
| Net assets, end of period (000 omitted) | $ | 41,924 | $ | 37,356 | $ | 46,046 | $ | 12,762 |
Portfolio turnover rate J | | 55% | | 91% | | 46% | | 50% I |
AFor the period November 5, 2019 (commencement of operations) through October 31, 2020.
BCalculated based on average shares outstanding during the period.
CNet investment income (loss) is affected by the timing of the declaration of dividends by any underlying mutual funds or exchange-traded funds (ETFs). Net investment income (loss) of any mutual funds or ETFs is not included in the Fund's net investment income (loss) ratio.
DNet investment income per share reflects one or more large, non-recurring dividend(s) which amounted to $.03 per share. Excluding such non-recurring dividend(s), the ratio of net investment income (loss) to average net assets would have been .86%.
ETotal returns for periods of less than one year are not annualized.
FTotal returns would have been lower if certain expenses had not been reduced during the applicable periods shown.
GExpense ratios reflect operating expenses of the class. Expenses before reductions do not reflect amounts reimbursed, waived, or reduced through arrangements with the investment adviser, brokerage services, or other offset arrangements, if applicable, and do not represent the amount paid by the class during periods when reimbursements, waivers or reductions occur.
HFees and expenses of any underlying mutual funds or exchange-traded funds (ETFs) are not included in the Fund's expense ratio. The Fund indirectly bears its proportionate share of these expenses. For additional expense information related to investments in Fidelity Central Funds, please refer to the "Investments in Fidelity Central Funds" note found in the Notes to Financial Statements section of the most recent Annual or Semi-Annual report.
IAnnualized.
JAmount does not include the portfolio activity of any underlying mutual funds or exchange-traded funds (ETFs).
For the period ended October 31, 2023
1. Organization.
Fidelity Infrastructure Fund (the Fund) is a non-diversified fund of Fidelity Investment Trust (the Trust) and is authorized to issue an unlimited number of shares. Share transactions on the Statement of Changes in Net Assets may contain exchanges between affiliated funds. The Trust is registered under the Investment Company Act of 1940, as amended (the 1940 Act), as an open-end management investment company organized as a Massachusetts business trust.
2. Investments in Fidelity Central Funds.
Funds may invest in Fidelity Central Funds, which are open-end investment companies generally available only to other investment companies and accounts managed by the investment adviser and its affiliates. The Schedule of Investments lists any Fidelity Central Funds held as an investment as of period end, but does not include the underlying holdings of each Fidelity Central Fund. An investing fund indirectly bears its proportionate share of the expenses of the underlying Fidelity Central Funds.
Based on its investment objective, each Fidelity Central Fund may invest or participate in various investment vehicles or strategies that are similar to those of the investing fund. These strategies are consistent with the investment objectives of the investing fund and may involve certain economic risks which may cause a decline in value of each of the Fidelity Central Funds and thus a decline in the value of the investing fund.
| Fidelity Central Fund | Investment Manager | Investment Objective | Investment Practices | Expense RatioA |
| Fidelity Money Market Central Funds | Fidelity Management & Research Company LLC (FMR) | Each fund seeks to obtain a high level of current income consistent with the preservation of capital and liquidity. | Short-term Investments | Less than .005% |
A Expenses expressed as a percentage of average net assets and are as of each underlying Central Fund's most recent annual or semi-annual shareholder report.
A complete unaudited list of holdings for each Fidelity Central Fund is available upon request or at the Securities and Exchange Commission website at www.sec.gov. In addition, the financial statements of the Fidelity Central Funds which contain the significant accounting policies (including investment valuation policies) of those funds, and are not covered by the Report of Independent Registered Public Accounting Firm, are available on the Securities and Exchange Commission website or upon request.
3. Significant Accounting Policies.
The Fund is an investment company and applies the accounting and reporting guidance of the Financial Accounting Standards Board (FASB) Accounting Standards Codification Topic 946 Financial Services - Investment Companies. The financial statements have been prepared in conformity with accounting principles generally accepted in the United States of America (GAAP), which require management to make certain estimates and assumptions at the date of the financial statements. Actual results could differ from those estimates. Subsequent events, if any, through the date that the financial statements were issued have been evaluated in the preparation of the financial statements. The Fund's Schedule of Investments lists any underlying mutual funds or exchange-traded funds (ETFs) but does not include the underlying holdings of these funds. The following summarizes the significant accounting policies of the Fund:
Investment Valuation. Investments are valued as of 4:00 p.m. Eastern time on the last calendar day of the period. The Board of Trustees (the Board) has designated the Fund's investment adviser as the valuation designee responsible for the fair valuation function and performing fair value determinations as needed. The investment adviser has established a Fair Value Committee (the Committee) to carry out the day-to-day fair valuation responsibilities and has adopted policies and procedures to govern the fair valuation process and the activities of the Committee. In accordance with these fair valuation policies and procedures, which have been approved by the Board, the Fund attempts to obtain prices from one or more third party pricing services or brokers to value its investments. When current market prices, quotations or currency exchange rates are not readily available or reliable, investments will be fair valued in good faith by the Committee, in accordance with the policies and procedures. Factors used in determining fair value vary by investment type and may include market or investment specific events, transaction data, estimated cash flows, and market observations of comparable investments. The frequency that the fair valuation procedures are used cannot be predicted and they may be utilized to a significant extent. The Committee manages the Fund's fair valuation practices and maintains the fair valuation policies and procedures. The Fund's investment adviser reports to the Board information regarding the fair valuation process and related material matters.
The Fund categorizes the inputs to valuation techniques used to value its investments into a disclosure hierarchy consisting of three levels as shown below:
Level 1 - unadjusted quoted prices in active markets for identical investments
Level 2 - other significant observable inputs (including quoted prices for similar investments, interest rates, prepayment speeds, etc.)
Level 3 - unobservable inputs (including the Fund's own assumptions based on the best information available)
Valuation techniques used to value the Fund's investments by major category are as follows:
Equity securities, including restricted securities, for which market quotations are readily available, are valued at the last reported sale price or official closing price as reported by a third party pricing service on the primary market or exchange on which they are traded and are categorized as Level 1 in the hierarchy. In the event there were no sales during the day or closing prices are not available, securities are valued at the last quoted bid price or may be valued using the last available price and are generally categorized as Level 2 in the hierarchy. For foreign equity securities, when market or security specific events arise, comparisons to the valuation of American Depositary Receipts (ADRs), futures contracts, ETFs and certain indexes as well as quoted prices for similar securities may be used and would be categorized as Level 2 in the hierarchy. For equity securities, including restricted securities, where observable inputs are limited, assumptions about market activity and risk are used and these securities may be categorized as Level 3 in the hierarchy.
Investments in open-end mutual funds, including the Fidelity Central Funds, are valued at their closing net asset value (NAV) each business day and are categorized as Level 1 in the hierarchy.
Changes in valuation techniques may result in transfers in or out of an assigned level within the disclosure hierarchy. The aggregate value of investments by input level as of October 31, 2023 is included at the end of the Fund's Schedule of Investments.
Foreign Currency. Certain Funds may use foreign currency contracts to facilitate transactions in foreign-denominated securities. Gains and losses from these transactions may arise from changes in the value of the foreign currency or if the counterparties do not perform under the contracts' terms.
Foreign-denominated assets, including investment securities, and liabilities are translated into U.S. dollars at the exchange rates at period end. Purchases and sales of investment securities, income and dividends received, and expenses denominated in foreign currencies are translated into U.S. dollars at the exchange rate in effect on the transaction date.
The effects of exchange rate fluctuations on investments are included with the net realized and unrealized gain (loss) on investment securities. Other foreign currency transactions resulting in realized and unrealized gain (loss) are disclosed separately.
Investment Transactions and Income. For financial reporting purposes, the Fund's investment holdings and NAV include trades executed through the end of the last business day of the period. The NAV per share for processing shareholder transactions is calculated as of the close of business of the New York Stock Exchange (NYSE), normally 4:00 p.m. Eastern time and includes trades executed through the end of the prior business day. Gains and losses on securities sold are determined on the basis of identified cost. Commissions paid to certain brokers with whom the investment adviser, or its affiliates, places trades on behalf of a fund include an amount in addition to trade execution, which may be rebated back to a fund. Any such rebates are included in net realized gain (loss) on investments in the Statement of Operations. Dividend income is recorded on the ex-dividend date, except for certain dividends from foreign securities where the ex-dividend date may have passed, which are recorded as soon as the Fund is informed of the ex-dividend date. Non-cash dividends included in dividend income, if any, are recorded at the fair market value of the securities received. Income and capital gain distributions from Fidelity Central Funds, if any, are recorded on the ex-dividend date. Certain distributions received by the Fund represent a return of capital or capital gain. The Fund determines the components of these distributions subsequent to the ex-dividend date, based upon receipt of tax filings or other correspondence relating to the underlying investment. These distributions are recorded as a reduction of cost of investments and/or as a realized gain. Investment income is recorded net of foreign taxes withheld where recovery of such taxes is uncertain. Funds may file withholding tax reclaims in certain jurisdictions to recover a portion of amounts previously withheld. Any withholding tax reclaims income is included in the Statement of Operations in foreign taxes withheld. Any receivables for withholding tax reclaims are included in the Statement of Assets and Liabilities in reclaims receivable.
Expenses. Expenses directly attributable to a fund are charged to that fund. Expenses attributable to more than one fund are allocated among the respective funds on the basis of relative net assets or other appropriate methods. Expenses included in the accompanying financial statements reflect the expenses of that fund and do not include any expenses associated with any underlying mutual funds or exchange-traded funds. Although not included in a fund's expenses, a fund indirectly bears its proportionate share of these expenses through the net asset value of each underlying mutual fund or exchange-traded fund. Expense estimates are accrued in the period to which they relate and adjustments are made when actual amounts are known.
Income Tax Information and Distributions to Shareholders. Each year, the Fund intends to qualify as a regulated investment company under Subchapter M of the Internal Revenue Code, including distributing substantially all of its taxable income and realized gains. As a result, no provision for U.S. Federal income taxes is required. As of October 31, 2023, the Fund did not have any unrecognized tax benefits in the financial statements; nor is the Fund aware of any tax positions for which it is reasonably possible that the total amounts of unrecognized tax benefits will significantly change in the next twelve months. The Fund files a U.S. federal tax return, in addition to state and local tax returns as required. The Fund's federal income tax returns are subject to examination by the Internal Revenue Service (IRS) for a period of three fiscal years after they are filed. State and local tax returns may be subject to examination for an additional fiscal year depending on the jurisdiction. Foreign taxes are provided for based on the Fund's understanding of the tax rules and rates that exist in the foreign markets in which it invests.
Distributions are declared and recorded on the ex-dividend date. Income and capital gain distributions are determined in accordance with income tax regulations, which may differ from GAAP.
Capital accounts within the financial statements are adjusted for permanent book-tax differences. These adjustments have no impact on net assets or the results of operations. Capital accounts are not adjusted for temporary book-tax differences which will reverse in a subsequent period.
Book-tax differences are primarily due to foreign currency transactions, partnerships, capital loss carryforwards and losses deferred due to wash sales.
As of period end, the cost and unrealized appreciation (depreciation) in securities, and derivatives if applicable, for federal income tax purposes were as follows:
| Gross unrealized appreciation | $4,421,497 |
| Gross unrealized depreciation | (3,614,930) |
| Net unrealized appreciation (depreciation) | $806,567 |
| Tax Cost | $41,185,524 |
The tax-based components of distributable earnings as of period end were as follows:
| Undistributed ordinary income | $30,931 |
| Capital loss carryforward | $(5,776,793) |
| Net unrealized appreciation (depreciation) on securities and other investments | $719,315 |
Capital loss carryforwards are only available to offset future capital gains of the Fund to the extent provided by regulations and may be limited. The capital loss carryforward information presented below, including any applicable limitation, is estimated as of fiscal period end and is subject to adjustment.
Short-term | $(4,974,147) |
Long-term | (802,646) |
| Total capital loss carryforward | $(5,776,793) |
The tax character of distributions paid was as follows:
| | October 31, 2023 | October 31, 2022 |
| Ordinary Income | $954,622 | $639,029 |
Delayed Delivery Transactions and When-Issued Securities. During the period, certain Funds transacted in securities on a delayed delivery or when-issued basis. Payment and delivery may take place after the customary settlement period for that security. The price of the underlying securities and the date when the securities will be delivered and paid for are fixed at the time the transaction is negotiated. Securities purchased on a delayed delivery or when-issued basis are identified as such in the Schedule of Investments. Compensation for interest forgone in the purchase of a delayed delivery or when-issued debt security may be received. With respect to purchase commitments, each applicable Fund identifies securities as segregated in its records with a value at least equal to the amount of the commitment. Payables and receivables associated with the purchases and sales of delayed delivery securities having the same coupon, settlement date and broker are offset. Delayed delivery or when-issued securities that have been purchased from and sold to different brokers are reflected as both payables and receivables in the Statement of Assets and Liabilities under the caption "Delayed delivery", as applicable. Losses may arise due to changes in the value of the underlying securities or if the counterparty does not perform under the contract's terms, or if the issuer does not issue the securities due to political, economic, or other factors.
Restricted Securities (including Private Placements). Funds may invest in securities that are subject to legal or contractual restrictions on resale. These securities generally may be resold in transactions exempt from registration or to the public if the securities are registered. Disposal of these securities may involve time-consuming negotiations and expense, and prompt sale at an acceptable price may be difficult. Information regarding restricted securities held at period end is included at the end of the Schedule of Investments, if applicable.
4. Purchases and Sales of Investments.
Purchases and sales of securities, other than short-term securities and in-kind transactions, as applicable, are noted in the table below.
| | Purchases ($) | Sales ($) |
| Fidelity Infrastructure Fund | 31,275,697 | 24,636,910 |
5. Fees and Other Transactions with Affiliates.
Management Fee. Fidelity Management & Research Company LLC (the investment adviser) and its affiliates provide the Fund with investment management related services for which the Fund pays a monthly management fee. The management fee is the sum of an individual fund fee rate that is based on an annual rate of .45% of the Fund's average net assets and an annualized group fee rate that averaged .23% during the period. The group fee rate is based upon the monthly average net assets of a group of registered investment companies with which the investment adviser has management contracts. The group fee rate decreases as assets under management increase and increases as assets under management decrease. For the reporting period, the total annual management fee rate was .68% of the Fund's average net assets.
Transfer Agent Fees. Fidelity Investments Institutional Operations Company LLC (FIIOC), an affiliate of the investment adviser, is the Fund's transfer, dividend disbursing and shareholder servicing agent. FIIOC receives account fees and asset-based fees that vary according to account size and type of account. FIIOC pays for typesetting, printing and mailing of shareholder reports, except proxy statements. For the period, the transfer agent fees were equivalent to an annual rate of .26% of average net assets.
During November 2023, the Board approved a change in the transfer agent fees effective December 1, 2023 to a fixed annual rate of 0.2000% of average net assets.
Accounting Fees. Fidelity Service Company, Inc. (FSC), an affiliate of the investment adviser, maintains the Fund's accounting records. The accounting fee is based on the level of average net assets for each month. For the period, the fees were equivalent to the following annual rates:
| | % of Average Net Assets |
| Fidelity Infrastructure Fund | .04 |
During November 2023, the Board approved a change in the accounting fees effective December 1, 2023 to a fixed annual rate of average net assets as follows:
| | % of Average Net Assets |
| Fidelity Infrastructure Fund | 0.0354% |
Brokerage Commissions. A portion of portfolio transactions were placed with brokerage firms which are affiliates of the investment adviser. Brokerage commissions are included in net realized gain (loss) and change in net unrealized appreciation (depreciation) in the Statement of Operations. The commissions paid to these affiliated firms were as follows:
| | Amount |
| Fidelity Infrastructure Fund | $ 198 |
Interfund Trades. Funds may purchase from or sell securities to other Fidelity Funds under procedures adopted by the Board. The procedures have been designed to ensure these interfund trades are executed in accordance with Rule 17a-7 of the 1940 Act. Any interfund trades are included within the respective purchases and sales amounts shown in the Purchases and Sales of Investments note. Interfund trades during the period are noted in the table below.
| | Purchases ($) | Sales ($) | Realized Gain (Loss) ($) |
| Fidelity Infrastructure Fund | 646,130 | 292,818 | (126,669) |
6. Committed Line of Credit.
Certain Funds participate with other funds managed by the investment adviser or an affiliate in a $4.25 billion credit facility (the "line of credit") to be utilized for temporary or emergency purposes to fund shareholder redemptions or for other short-term liquidity purposes. The participating funds have agreed to pay commitment fees on their pro-rata portion of the line of credit, which are reflected in Miscellaneous expenses on the Statement of Operations, and are listed below. During the period, there were no borrowings on this line of credit.
| | Amount |
| Fidelity Infrastructure Fund | $85 |
7. Security Lending.
Funds lend portfolio securities from time to time in order to earn additional income. Lending agents are used, including National Financial Services (NFS), an affiliate of the investment adviser. Pursuant to a securities lending agreement, NFS will receive a fee, which is capped at 9.9% of a fund's daily lending revenue, for its services as lending agent. A fund may lend securities to certain qualified borrowers, including NFS. On the settlement date of the loan, a fund receives collateral (in the form of U.S. Treasury obligations, letters of credit and/or cash) against the loaned securities and maintains collateral in an amount not less than 100% of the market value of the loaned securities during the period of the loan. The market value of the loaned securities is determined at the close of business of a fund and any additional required collateral is delivered to a fund on the next business day. A fund or borrower may terminate the loan at any time, and if the borrower defaults on its obligation to return the securities loaned because of insolvency or other reasons, a fund may apply collateral received from the borrower against the obligation. A fund may experience delays and costs in recovering the securities loaned. Any cash collateral received is invested in the Fidelity Securities Lending Cash Central Fund. Any loaned securities are identified as such in the Schedule of Investments, and the value of loaned securities and cash collateral at period end, as applicable, are presented in the Statement of Assets and Liabilities. Security lending income represents the income earned on investing cash collateral, less rebates paid to borrowers and any lending agent fees associated with the loan, plus any premium payments received for lending certain types of securities. Security lending income is presented in the Statement of Operations as a component of income from Fidelity Central Funds. Affiliated security lending activity, if any, was as follows:
| | Total Security Lending Fees Paid to NFS | Security Lending Income From Securities Loaned to NFS | Value of Securities Loaned to NFS at Period End |
| Fidelity Infrastructure Fund | $330 | $- | $- |
8. Expense Reductions.
The investment adviser contractually agreed to reimburse the Fund to the extent annual operating expenses exceeded .95% of average net assets. This reimbursement will remain in place through February 28, 2025. Some expenses, for example the compensation of the independent Trustees, and certain miscellaneous expenses such as proxy and shareholder meeting expenses, are excluded from this reimbursement. During the period this reimbursement reduced the Fund's expenses by $94,984.
Through arrangements with the Fund's custodian, credits realized as a result of certain uninvested cash balances were used to reduce the Fund's expenses by $191.
In addition, during the period the investment adviser or an affiliate reimbursed and/or waived a portion of operating expenses in the amount of $2,839.
9. Other.
A fund's organizational documents provide former and current trustees and officers with a limited indemnification against liabilities arising in connection with the performance of their duties to the fund. In the normal course of business, a fund may also enter into contracts that provide general indemnifications. A fund's maximum exposure under these arrangements is unknown as this would be dependent on future claims that may be made against a fund. The risk of material loss from such claims is considered remote.
At the end of the period, the following mutual funds managed by the investment adviser or its affiliates were the owners of record of 10% or more of the total outstanding shares.
| | VIP FundsManager 60% Portfolio |
| Fidelity Infrastructure Fund | 13% |
Mutual funds managed by the investment adviser or its affiliates, in aggregate, were the owners of record of more than 20% of the total outstanding shares.
| Fund | % of shares held |
| Fidelity Infrastructure Fund | 29% |
10. Risk and Uncertainties.
Many factors affect a fund's performance. Developments that disrupt global economies and financial markets, such as pandemics, epidemics, outbreaks of infectious diseases, war, terrorism, and environmental disasters, may significantly affect a fund's investment performance. The effects of these developments to a fund will be impacted by the types of securities in which a fund invests, the financial condition, industry, economic sector, and geographic location of an issuer, and a fund's level of investment in the securities of that issuer. Significant concentrations in security types, issuers, industries, sectors, and geographic locations may magnify the factors that affect a fund's performance.
To the Board of Trustees of Fidelity Investment Trust and Shareholders of Fidelity Infrastructure Fund
Opinion on the Financial Statements
We have audited the accompanying statement of assets and liabilities, including the schedule of investments, of Fidelity Infrastructure Fund (one of the funds constituting Fidelity Investment Trust, referred to hereafter as the "Fund") as of October 31, 2023, the related statement of operations for the year ended October 31, 2023, the statement of changes in net assets for each of the two years in the period ended October 31, 2023, including the related notes, and the financial highlights for each of the three years in the period ended October 31, 2023 and for the period November 5, 2019 (commencement of operations) through October 31, 2020 (collectively referred to as the "financial statements"). In our opinion, the financial statements present fairly, in all material respects, the financial position of the Fund as of October 31, 2023, the results of its operations for the year then ended, the changes in its net assets for each of the two years in the period ended October 31, 2023 and the financial highlights for each of the three years in the period ended October 31, 2023 and for the period November 5, 2019 (commencement of operations) through October 31, 2020 in conformity with accounting principles generally accepted in the United States of America.
Basis for Opinion
These financial statements are the responsibility of the Fund's management. Our responsibility is to express an opinion on the Fund's financial statements based on our audits. We are a public accounting firm registered with the Public Company Accounting Oversight Board (United States) (PCAOB) and are required to be independent with respect to the Fund in accordance with the U.S. federal securities laws and the applicable rules and regulations of the Securities and Exchange Commission and the PCAOB.
We conducted our audits of these financial statements in accordance with the standards of the PCAOB. Those standards require that we plan and perform the audit to obtain reasonable assurance about whether the financial statements are free of material misstatement, whether due to error or fraud.
Our audits included performing procedures to assess the risks of material misstatement of the financial statements, whether due to error or fraud, and performing procedures that respond to those risks. Such procedures included examining, on a test basis, evidence regarding the amounts and disclosures in the financial statements. Our audits also included evaluating the accounting principles used and significant estimates made by management, as well as evaluating the overall presentation of the financial statements. Our procedures included confirmation of securities owned as of October 31, 2023 by correspondence with the custodian and brokers; when replies were not received from brokers, we performed other auditing procedures. We believe that our audits provide a reasonable basis for our opinion.
/s/ PricewaterhouseCoopers LLP
Boston, Massachusetts
December 13, 2023
We have served as the auditor of one or more investment companies in the Fidelity group of funds since 1932.
The Trustees, Members of the Advisory Board (if any), and officers of the trust and fund, as applicable, are listed below. The Board of Trustees governs the fund and is responsible for protecting the interests of shareholders. The Trustees are experienced executives who meet periodically throughout the year to oversee the fund's activities, review contractual arrangements with companies that provide services to the fund, oversee management of the risks associated with such activities and contractual arrangements, and review the fund's performance. Except for Jonathan Chiel, each of the Trustees oversees 322 funds. Mr. Chiel oversees 191 funds.
The Trustees hold office without limit in time except that (a) any Trustee may resign; (b) any Trustee may be removed by written instrument, signed by at least two-thirds of the number of Trustees prior to such removal; (c) any Trustee who requests to be retired or who has become incapacitated by illness or injury may be retired by written instrument signed by a majority of the other Trustees; and (d) any Trustee may be removed at any special meeting of shareholders by a two-thirds vote of the outstanding voting securities of the trust. Each Trustee who is not an interested person (as defined in the 1940 Act) of the trust and the fund is referred to herein as an Independent Trustee. Each Independent Trustee shall retire not later than the last day of the calendar year in which his or her 75th birthday occurs. The Independent Trustees may waive this mandatory retirement age policy with respect to individual Trustees. Officers and Advisory Board Members hold office without limit in time, except that any officer or Advisory Board Member may resign or may be removed by a vote of a majority of the Trustees at any regular meeting or any special meeting of the Trustees. Except as indicated, each individual has held the office shown or other offices in the same company for the past five years.
The fund's Statement of Additional Information (SAI) includes more information about the Trustees. To request a free copy, call Fidelity at 1-800-544-8544.
Experience, Skills, Attributes, and Qualifications of the Trustees. The Governance and Nominating Committee has adopted a statement of policy that describes the experience, qualifications, attributes, and skills that are necessary and desirable for potential Independent Trustee candidates (Statement of Policy). The Board believes that each Trustee satisfied at the time he or she was initially elected or appointed a Trustee, and continues to satisfy, the standards contemplated by the Statement of Policy. The Governance and Nominating Committee also engages professional search firms to help identify potential Independent Trustee candidates who have the experience, qualifications, attributes, and skills consistent with the Statement of Policy. From time to time, additional criteria based on the composition and skills of the current Independent Trustees, as well as experience or skills that may be appropriate in light of future changes to board composition, business conditions, and regulatory or other developments, have also been considered by the professional search firms and the Governance and Nominating Committee. In addition, the Board takes into account the Trustees' commitment and participation in Board and committee meetings, as well as their leadership of standing and ad hoc committees throughout their tenure.
In determining that a particular Trustee was and continues to be qualified to serve as a Trustee, the Board has considered a variety of criteria, none of which, in isolation, was controlling. The Board believes that, collectively, the Trustees have balanced and diverse experience, qualifications, attributes, and skills, which allow the Board to operate effectively in governing the fund and protecting the interests of shareholders. Information about the specific experience, skills, attributes, and qualifications of each Trustee, which in each case led to the Board's conclusion that the Trustee should serve (or continue to serve) as a trustee of the fund, is provided below.
Board Structure and Oversight Function. Robert A. Lawrence is an interested person and currently serves as Chair. The Trustees have determined that an interested Chair is appropriate and benefits shareholders because an interested Chair has a personal and professional stake in the quality and continuity of services provided to the fund. Independent Trustees exercise their informed business judgment to appoint an individual of their choosing to serve as Chair, regardless of whether the Trustee happens to be independent or a member of management. The Independent Trustees have determined that they can act independently and effectively without having an Independent Trustee serve as Chair and that a key structural component for assuring that they are in a position to do so is for the Independent Trustees to constitute a substantial majority for the Board. The Independent Trustees also regularly meet in executive session. David M. Thomas serves as Lead Independent Trustee and as such (i) acts as a liaison between the Independent Trustees and management with respect to matters important to the Independent Trustees and (ii) with management prepares agendas for Board meetings.
Fidelity® funds are overseen by different Boards of Trustees. The fund's Board oversees Fidelity's high income and certain equity funds, and other Boards oversee Fidelity's alternative investment, investment-grade bond, money market, asset allocation, and other equity funds. The asset allocation funds may invest in Fidelity® funds overseen by the fund's Board. The use of separate Boards, each with its own committee structure, allows the Trustees of each group of Fidelity® funds to focus on the unique issues of the funds they oversee, including common research, investment, and operational issues. On occasion, the separate Boards establish joint committees to address issues of overlapping consequences for the Fidelity® funds overseen by each Board.
The Trustees operate using a system of committees to facilitate the timely and efficient consideration of all matters of importance to the Trustees, the fund, and fund shareholders and to facilitate compliance with legal and regulatory requirements and oversight of the fund's activities and associated risks. The Board, acting through its committees, has charged FMR and its affiliates with (i) identifying events or circumstances the occurrence of which could have demonstrably adverse effects on the fund's business and/or reputation; (ii) implementing processes and controls to lessen the possibility that such events or circumstances occur or to mitigate the effects of such events or circumstances if they do occur; and (iii) creating and maintaining a system designed to evaluate continuously business and market conditions in order to facilitate the identification and implementation processes described in (i) and (ii) above. Because the day-to-day operations and activities of the fund are carried out by or through FMR, its affiliates, and other service providers, the fund's exposure to risks is mitigated but not eliminated by the processes overseen by the Trustees. While each of the Board's committees has responsibility for overseeing different aspects of the fund's activities, oversight is exercised primarily through the Operations, Audit, and Compliance Committees. Appropriate personnel, including but not limited to the fund's Chief Compliance Officer (CCO), FMR's internal auditor, the independent accountants, the fund's Treasurer and portfolio management personnel, make periodic reports to the Board's committees, as appropriate, including an annual review of Fidelity's risk management program for the Fidelity® funds. The responsibilities of each standing committee, including their oversight responsibilities, are described further under "Standing Committees of the Trustees."
Interested Trustees*:
Correspondence intended for a Trustee who is an interested person may be sent to Fidelity Investments, 245 Summer Street, Boston, Massachusetts 02210.
Name, Year of Birth; Principal Occupations and Other Relevant Experience+
Jonathan Chiel (1957)
Year of Election or Appointment: 2016
Trustee
Mr. Chiel also serves as Trustee of other Fidelity® funds. Mr. Chiel is General Counsel (2012-present) and Head of Legal, Risk and Compliance (2022-present). Mr Chiel serves as Executive Vice President and General Counsel for FMR LLC (diversified financial services company, 2012-present) and Director and President for OH Company LLC (holding company, 2018-present). Previously, Mr. Chiel served as general counsel (2004-2012) and senior vice president and deputy general counsel (2000-2004) for John Hancock Financial Services; a partner with Choate, Hall & Stewart (1996-2000) (law firm); and an Assistant United States Attorney for the United States Attorney's Office of the District of Massachusetts (1986-95), including Chief of the Criminal Division (1993-1995). Mr. Chiel is a director on the boards of the Boston Bar Foundation and the Maimonides School.
Bettina Doulton (1964)
Year of Election or Appointment: 2021
Trustee
Ms. Doulton also serves as Trustee of other Fidelity® funds. Prior to her retirement, Ms. Doulton served in a variety of positions at Fidelity Investments, including as a managing director of research (2006-2007), portfolio manager to certain Fidelity® funds (1993-2005), equity analyst and portfolio assistant (1990-1993), and research assistant (1987-1990). Ms. Doulton currently owns and operates Phi Builders + Architects and Cellardoor Winery. Previously, Ms. Doulton served as a member of the Board of Brown Capital Management, LLC (2014-2018).
Robert A. Lawrence (1952)
Year of Election or Appointment: 2020
Trustee
Chair of the Board of Trustees
Mr. Lawrence also serves as Trustee of other funds. Previously, Mr. Lawrence served as a Trustee and Member of the Advisory Board of certain funds. Prior to his retirement in 2008, Mr. Lawrence served as Vice President of certain Fidelity® funds (2006-2008), Senior Vice President, Head of High Income Division of Fidelity Management & Research Company (investment adviser firm, 2006-2008), and President of Fidelity Strategic Investments (investment adviser firm, 2002-2005).
* Determined to be an "Interested Trustee" by virtue of, among other things, his or her affiliation with the trust or various entities under common control with FMR.
+ The information includes the Trustee's principal occupation during the last five years and other information relating to the experience, attributes, and skills relevant to the Trustee's qualifications to serve as a Trustee, which led to the conclusion that the Trustee should serve as a Trustee for the fund.
Independent Trustees:
Correspondence intended for an Independent Trustee may be sent to Fidelity Investments, P.O. Box 55235, Boston, Massachusetts 02205-5235.
Name, Year of Birth; Principal Occupations and Other Relevant Experience+
Thomas P. Bostick (1956)
Year of Election or Appointment: 2021
Trustee
Lieutenant General Bostick also serves as Trustee of other Fidelity® funds. Prior to his retirement, General Bostick (United States Army, Retired) held a variety of positions within the U.S. Army, including Commanding General and Chief of Engineers, U.S. Army Corps of Engineers (2012-2016) and Deputy Chief of Staff and Director of Human Resources, U.S. Army (2009-2012). General Bostick currently serves as a member of the Board and Finance and Governance & Sustainability Committees of CSX Corporation (transportation, 2020-present) and a member of the Board and Corporate Governance and Nominating Committee of Perma-Fix Environmental Services, Inc. (nuclear waste management, 2020-present). General Bostick serves as Chief Executive Officer of Bostick Global Strategies, LLC (consulting, 2016-present), as a member of the Board of HireVue, Inc. (video interview and assessment, 2020-present), as a member of the Board of Allonnia (biotechnology and engineering solutions, 2022-present) and on the Advisory Board of Solugen, Inc. (specialty bio-based chemicals manufacturer, 2022-present). Previously, General Bostick served as a Member of the Advisory Board of certain Fidelity® funds (2021), President, Intrexon Bioengineering (2018-2020) and Chief Operating Officer (2017-2020) and Senior Vice President of the Environment Sector (2016-2017) of Intrexon Corporation (biopharmaceutical company).
Dennis J. Dirks (1948)
Year of Election or Appointment: 2005
Trustee
Mr. Dirks also serves as Trustee of other Fidelity® funds. Prior to his retirement in May 2003, Mr. Dirks served as Chief Operating Officer and as a member of the Board of The Depository Trust & Clearing Corporation (financial markets infrastructure), President, Chief Operating Officer and a member of the Board of The Depository Trust Company (DTC), President and a member of the Board of the National Securities Clearing Corporation (NSCC), Chief Executive Officer and a member of the Board of the Government Securities Clearing Corporation and Chief Executive Officer and a member of the Board of the Mortgage-Backed Securities Clearing Corporation. Mr. Dirks currently serves as a member of the Finance Committee (2016-present) and Board (2017-present) and is Treasurer (2018-present) of the Asolo Repertory Theatre.
Donald F. Donahue (1950)
Year of Election or Appointment: 2018
Trustee
Mr. Donahue also serves as Trustee of other Fidelity® funds. Mr. Donahue serves as President and Chief Executive Officer of Miranda Partners, LLC (risk consulting for the financial services industry, 2012-present). Previously, Mr. Donahue served as Chief Executive Officer (2006-2012), Chief Operating Officer (2003-2006) and Managing Director, Customer Marketing and Development (1999-2003) of The Depository Trust & Clearing Corporation (financial markets infrastructure). Mr. Donahue currently serves as a member (2007-present) and Co-Chairman (2016-present) of the Board of United Way of New York. Mr. Donahue previously served as a member of the Advisory Board of certain Fidelity® funds (2015-2018) and as a member of the Board of The Leadership Academy (previously NYC Leadership Academy) (2012-2022).
Vicki L. Fuller (1957)
Year of Election or Appointment: 2020
Trustee
Ms. Fuller also serves as Trustee of other Fidelity® funds. Previously, Ms. Fuller served as a member of the Advisory Board of certain Fidelity® funds (2018-2020), Chief Investment Officer of the New York State Common Retirement Fund (2012-2018) and held a variety of positions at AllianceBernstein L.P. (global asset management, 1985-2012), including Managing Director (2006-2012) and Senior Vice President and Senior Portfolio Manager (2001-2006). Ms. Fuller currently serves as a member of the Board, Audit Committee and Nominating and Governance Committee of two Blackstone business development companies (2020-present), as a member of the Board of Treliant, LLC (consulting, 2019-present), as a member of the Board of Ariel Alternatives, LLC (private equity, 2022-present) and as a member of the Board and Chair of the Audit Committee of Gusto, Inc. (software, 2021-present). In addition, Ms. Fuller currently serves as a member of the Board of Roosevelt University (2019-present) and as a member of the Executive Board of New York University's Stern School of Business. Ms. Fuller previously served as a member of the Board, Audit Committee and Nominating and Governance Committee of The Williams Companies, Inc. (natural gas infrastructure, 2018-2021).
Patricia L. Kampling (1959)
Year of Election or Appointment: 2020
Trustee
Ms. Kampling also serves as Trustee of other Fidelity® funds. Prior to her retirement, Ms. Kampling served as Chairman of the Board and Chief Executive Officer (2012-2019), President and Chief Operating Officer (2011-2012) and Executive Vice President and Chief Financial Officer (2010-2011) of Alliant Energy Corporation. Ms. Kampling currently serves as a member of the Board, Finance Committee and Governance, Compensation and Nominating Committee of Xcel Energy Inc. (utilities company, 2020-present) and as a member of the Board, Audit, Finance and Risk Committee and Safety, Environmental, Technology and Operations Committee and Chair of the Executive Development and Compensation Committee of American Water Works Company, Inc. (utilities company, 2019-present). In addition, Ms. Kampling currently serves as a member of the Board of the Nature Conservancy, Wisconsin Chapter (2019-present). Previously, Ms. Kampling served as a Member of the Advisory Board of certain Fidelity® funds (2020), a member of the Board, Compensation Committee and Executive Committee and Chair of the Audit Committee of Briggs & Stratton Corporation (manufacturing, 2011-2021), a member of the Board of Interstate Power and Light Company (2012-2019) and Wisconsin Power and Light Company (2012-2019) (each a subsidiary of Alliant Energy Corporation) and as a member of the Board and Workforce Development Committee of the Business Roundtable (2018-2019).
Thomas A. Kennedy (1955)
Year of Election or Appointment: 2021
Trustee
Mr. Kennedy also serves as Trustee of other Fidelity® funds. Previously, Mr. Kennedy served as a Member of the Advisory Board of certain Fidelity® funds (2020) and held a variety of positions at Raytheon Company (aerospace and defense, 1983-2020), including Chairman and Chief Executive Officer (2014-2020) and Executive Vice President and Chief Operating Officer (2013-2014). Mr. Kennedy served as Executive Chairman of the Board of Directors of Raytheon Technologies Corporation (aerospace and defense, 2020-2021). Mr. Kennedy serves as a Director of the Board of Directors of Textron Inc. (aerospace and defense, 2023-present).
Oscar Munoz (1959)
Year of Election or Appointment: 2021
Trustee
Mr. Munoz also serves as Trustee of other Fidelity® funds. Prior to his retirement, Mr. Munoz served as Executive Chairman (2020-2021), Chief Executive Officer (2015-2020), President (2015-2016) and a member of the Board (2010-2021) of United Airlines Holdings, Inc. Mr. Munoz currently serves as a member of the Board of CBRE Group, Inc. (commercial real estate, 2020-present), a member of the Board of Univision Communications, Inc. (Hispanic media, 2020-present), a member of the Board of Archer Aviation Inc. (2021-present), a member of the Defense Business Board of the United States Department of Defense (2021-present) and a member of the Board of Salesforce.com, Inc. (cloud-based software, 2022-present). Previously, Mr. Munoz served as a Member of the Advisory Board of certain Fidelity® funds (2021).
David M. Thomas (1949)
Year of Election or Appointment: 2008
Trustee
Lead Independent Trustee
Mr. Thomas also serves as Trustee of other Fidelity® funds. Previously, Mr. Thomas served as Executive Chairman (2005-2006) and Chairman and Chief Executive Officer (2000-2005) of IMS Health, Inc. (pharmaceutical and healthcare information solutions). Mr. Thomas currently serves as a member of the Board of Fortune Brands Home and Security (home and security products, 2004-present) and as Director (2013-present) and Non-Executive Chairman of the Board (2022-present) of Interpublic Group of Companies, Inc. (marketing communication).
Susan Tomasky (1953)
Year of Election or Appointment: 2020
Trustee
Ms. Tomasky also serves as Trustee of other Fidelity® funds. Prior to her retirement, Ms. Tomasky served in various executive officer positions at American Electric Power Company, Inc. (1998-2011), including most recently as President of AEP Transmission (2007-2011). Ms. Tomasky currently serves as a member of the Board and Sustainability Committee and as Chair of the Audit Committee of Marathon Petroleum Corporation (2018-present) and as a member of the Board, Executive Committee, Corporate Governance Committee and Organization and Compensation Committee and as Lead Director of the Board of Public Service Enterprise Group, Inc. (utilities company, 2012-present) and as a member of the Board of its subsidiary company, Public Service Electric and Gas Co. (2021-present). In addition, Ms. Tomasky currently serves as a member (2009-present) and President (2020-present) of the Board of the Royal Shakespeare Company - America (2009-present), as a member of the Board of the Columbus Association for the Performing Arts (2011-present) and as a member of the Board and Kenyon in the World Committee of Kenyon College (2016-present). Previously, Ms. Tomasky served as a Member of the Advisory Board of certain Fidelity® funds (2020), as a member of the Board of the Columbus Regional Airport Authority (2007-2020), as a member of the Board (2011-2018) and Lead Independent Director (2015-2018) of Andeavor Corporation (previously Tesoro Corporation) (independent oil refiner and marketer) and as a member of the Board of Summit Midstream Partners LP (energy, 2012-2018).
Michael E. Wiley (1950)
Year of Election or Appointment: 2020
Trustee
Mr. Wiley also serves as Trustee of other Fidelity® funds. Previously, Mr. Wiley served as a member of the Advisory Board of certain Fidelity® funds (2018-2020), Chairman, President and CEO of Baker Hughes, Inc. (oilfield services, 2000-2004). Mr. Wiley also previously served as a member of the Board of Andeavor Corporation (independent oil refiner and marketer, 2005-2018), a member of the Board of Andeavor Logistics LP (natural resources logistics, 2015-2018) and a member of the Board of High Point Resources (exploration and production, 2005-2020).
+ The information includes the Trustee's principal occupation during the last five years and other information relating to the experience, attributes, and skills relevant to the Trustee's qualifications to serve as a Trustee, which led to the conclusion that the Trustee should serve as a Trustee for the fund.
Advisory Board Members and Officers:
Correspondence intended for a Member of the Advisory Board (if any) may be sent to Fidelity Investments, P.O. Box 55235, Boston, Massachusetts 02205-5235. Correspondence intended for an officer or Peter S. Lynch may be sent to Fidelity Investments, 245 Summer Street, Boston, Massachusetts 02210.
Name, Year of Birth; Principal Occupation
Vijay C. Advani (1960)
Year of Election or Appointment: 2023
Member of the Advisory Board
Mr. Advani also serves as Trustee or Member of the Advisory Board of other funds. Previously, Mr. Advani served as Executive Chairman (2020-2022), Chief Executive Officer (2017-2020) and Chief Operating Officer (2016-2017) of Nuveen (global investment manager). He also served in various capacities at Franklin Resources (global investment manager), including Co-President (2015-2016), Executive Vice President, Global Advisory Services (2008-2015), Head of Global Retail Distribution (2005-2008), Executive Managing Director, International Retail Development (2002-2005), Managing Director, Product Developments, Sales & Marketing, Asia, Eastern Europe and Africa (2000-2002) and President, Templeton Asset Management India (1995-2000). Mr. Advani also served as Senior Investment Officer of International Finance Corporation (private equity and venture capital arm of The World Bank, 1984-1995). Mr. Advani is Chairman Emeritus of the U.S. India Business Council (2018-present), a Director of The Global Impact Investing Network (2019-present), a Director of LOK Capital (Mauritius) (2022-present), a member of the Advisory Council of LOK Capital (2022-present), a Senior Advisor of Neuberger Berman (2021-present), a Senior Advisor of Seviora Holdings Pte. Ltd (Temasek-Singapore) (2021-present), a Director of Seviora Capital (Singapore) (2021-present) and an Advisor of EQUIAM (2021-present). Mr. Advani formerly served as a member of the Board of BowX Acquisition Corp. (special purpose acquisition company, 2020-2021), a member of the Board of Intellecap (advisory arm of The Aavishkaar Group, 2018-2020), a member of the Board of Nuveen Investments, Inc. (2017-2020) and a member of the Board of Docusign (software, 2016-2019).
Peter S. Lynch (1944)
Year of Election or Appointment: 2003
Member of the Advisory Board
Mr. Lynch also serves as a Member of the Advisory Board of other Fidelity® funds. Mr. Lynch is Vice Chairman and a Director of Fidelity Management & Research Company LLC (investment adviser firm). In addition, Mr. Lynch serves as a Trustee of Boston College and as the Chairman of the Inner-City Scholarship Fund. Previously, Mr. Lynch served as Vice Chairman and a Director of FMR Co., Inc. (investment adviser firm) and on the Special Olympics International Board of Directors (1997-2006).
Karen B. Peetz (1955)
Year of Election or Appointment: 2023
Member of the Advisory Board
Ms. Peetz also serves as a Member of the Advisory Board of other funds. Previously, Ms. Peetz served as Chief Administration Officer (2020-2023) of Citigroup Inc. (a diversified financial service company). She also served in various capacities at Bank of New York Mellon Corporation, including President (2013-2016), Vice Chairman, Senior Executive Vice President and Chief Executive Officer of Financial Markets & Treasury Services (2010-2013), Senior Executive Vice President and Chief Executive Officer of Global Corporate Trust (2003-2008), Senior Vice President and Division Manager of Global Payments & Trade Services (2002-2003) and Senior Vice President and Division Manager of Domestic Corporate Trust (1998-2002). Ms. Peetz also served in various capacities at Chase Manhattan Corporation (1982-1998), including Senior Vice President and Manager of Corporate Trust International Business (1996-1998), Managing Director and Manager of Corporate Trust Services (1994-1996) and Managing Director and Group Manager of Financial Institution Sales (1990-1993). Ms. Peetz currently serves as Chair of Amherst Holdings Advisory Council (2018-present), Trustee of Johns Hopkins University (2016-present), Chair of the Carey Business School Advisory Council, Member of the Johns Hopkins Medicine Board and Finance Committee and Chair of the Lyme and Tick Related Disease Institute Advisory Council. Ms. Peetz previously served as a member of the Board of Guardian Life Insurance Company of America (2019-2023), a member of the Board of Trane Technologies (2018-2022), a member of the Board of Wells Fargo Corp. (2017-2019), a member of the Board of SunCoke Energy Inc. (2012-2016), a member of the Board of Private Export Funding Corporation (2010-2016) and as a Trustee of Penn State University (2010-2014) and the United Way of New York City (2008-2010).
Heather Bonner (1977)
Year of Election or Appointment: 2023
Assistant Treasurer
Ms. Bonner also serves as an officer of other funds. Ms. Bonner is a Senior Vice President (2022-present) and is an employee of Fidelity Investments (2022-present). Ms. Bonner serves as Vice President, Treasurer, or Assistant Treasurer of certain Fidelity entities. Prior to joining Fidelity, Ms. Bonner served as Managing Director at AQR Capital Management (2013-2022) and was the Treasurer and Principal Financial Officer of the AQR Funds (2013-2022).
Craig S. Brown (1977)
Year of Election or Appointment: 2022
Deputy Treasurer
Mr. Brown also serves as an officer of other funds. Mr. Brown is a Vice President (2015-present) and is an employee of Fidelity Investments. Mr. Brown serves as Assistant Treasurer of FIMM, LLC (2021-present). Previously, Mr. Brown served as Assistant Treasurer of certain Fidelity® funds (2019-2022).
John J. Burke III (1964)
Year of Election or Appointment: 2018
Chief Financial Officer
Mr. Burke also serves as Chief Financial Officer of other funds. Mr. Burke is Head of Fidelity Fund and Investment Operations (2018-present) and is an employee of Fidelity Investments. Mr. Burke serves as President, Executive Vice President, or Director of certain Fidelity entities. Previously Mr. Burke served as head of Asset Management Investment Operations (2012-2018).
Margaret Carey (1973)
Year of Election or Appointment: 2023
Secretary and Chief Legal Officer (CLO)
Ms. Carey also serves as an officer of other funds and as CLO of certain Fidelity entities. Ms. Carey is a Senior Vice President, Deputy General Counsel (2019-present) and is an employee of Fidelity Investments.
William C. Coffey (1969)
Year of Election or Appointment: 2019
Assistant Secretary
Mr. Coffey also serves as Assistant Secretary of other funds. Mr. Coffey is a Senior Vice President, Deputy General Counsel (2010-present) and is an employee of Fidelity Investments. Previously, Mr. Coffey served as Secretary and CLO of certain funds (2018-2019); CLO, Secretary, or Senior Vice President of certain Fidelity entities and Assistant Secretary of certain funds (2009-2018).
Timothy M. Cohen (1969)
Year of Election or Appointment: 2018
Vice President
Mr. Cohen also serves as Vice President of other funds. Mr. Cohen is Co-Head of Equity (2018-present) and is an employee of Fidelity Investments. Mr. Cohen serves a Director of Fidelity Management & Research (Japan) Limited (investment adviser firm, 2016-present). Previously, Mr. Cohen served as Executive Vice President of Fidelity SelectCo, LLC (2019) and Head of Global Equity Research (2016-2018).
Jonathan Davis (1968)
Year of Election or Appointment: 2010
Assistant Treasurer
Mr. Davis also serves as an officer of other funds. Mr. Davis is a Vice President (2006-present) and is an employee of Fidelity Investments. Mr. Davis serves as Assistant Treasurer of certain Fidelity entities.
Laura M. Del Prato (1964)
Year of Election or Appointment: 2018
Assistant Treasurer
Ms. Del Prato also serves as an officer of other funds. Ms. Del Prato is a Senior Vice President (2017-present) and is an employee of Fidelity Investments. Ms. Del Prato serves as Vice President or Assistant Treasurer of certain Fidelity entities. Previously, Ms. Del Prato served as President and Treasurer of The North Carolina Capital Management Trust: Cash Portfolio and Term Portfolio (2018-2020).
Colm A. Hogan (1973)
Year of Election or Appointment: 2020
Assistant Treasurer
Mr. Hogan also serves as an officer of other funds. Mr. Hogan is a Vice President (2016-present) and is an employee of Fidelity Investments. Mr. Hogan serves as Assistant Treasurer of certain Fidelity entities. Previously, Mr. Hogan served as Deputy Treasurer of certain Fidelity® funds (2016-2020) and Assistant Treasurer of certain Fidelity® funds (2016-2018).
Pamela R. Holding (1964)
Year of Election or Appointment: 2018
Vice President
Ms. Holding also serves as Vice President of other funds. Ms. Holding is Co-Head of Equity (2018-present) and is an employee of Fidelity Investments. Previously, Ms. Holding served as Executive Vice President of Fidelity SelectCo, LLC (2019) and as Chief Investment Officer of Fidelity Institutional Asset Management (2013-2018).
Chris Maher (1972)
Year of Election or Appointment: 2020
Deputy Treasurer
Mr. Maher also serves as an officer of other funds. Mr. Maher is a Vice President (2008-present) and is an employee of Fidelity Investments. Mr. Maher serves as Assistant Treasurer of certain Fidelity entities. Previously, Mr. Maher served as Assistant Treasurer of certain funds (2013-2020).
Jason P. Pogorelec (1975)
Year of Election or Appointment: 2020
Chief Compliance Officer
Mr. Pogorelec also serves as Chief Compliance Officer of other funds. Mr. Pogorelec is a Senior Vice President of Asset Management Compliance (2020-present) and is an employee of Fidelity Investments. Mr. Pogorelec serves as Compliance Officer of Fidelity Management & Research Company LLC (investment adviser firm, 2023-present) and Ballyrock Investment Advisors LLC (2023-present). Previously, Mr. Pogorelec served as a Vice President, Associate General Counsel for Fidelity Investments (2010-2020) and Assistant Secretary of certain Fidelity® funds (2015-2020).
Brett Segaloff (1972)
Year of Election or Appointment: 2021
Anti-Money Laundering (AML) Officer
Mr. Segaloff also serves as AML Officer of other funds. Mr. Segaloff is a Vice President (2022-present) and is an employee of Fidelity Investments. Mr. Segaloff serves as Anti Money Laundering Compliance Officer or Anti Money Laundering/Bank Secrecy Act Compliance Officer of certain Fidelity entities.
Stacie M. Smith (1974)
Year of Election or Appointment: 2016
President and Treasurer
Ms. Smith also serves as an officer of other funds. Ms. Smith is a Senior Vice President (2016-present) and is an employee of Fidelity Investments. Ms. Smith serves as Assistant Treasurer of certain Fidelity entities and has served in other fund officer roles.
Jim Wegmann (1979)
Year of Election or Appointment: 2019
Assistant Treasurer
Mr. Wegmann also serves as an officer of other funds. Mr. Wegmann is a Vice President (2016-present) and is an employee of Fidelity Investments. Mr. Wegmann serves as Assistant Treasurer of FIMM, LLC (2021-present). Previously, Mr. Wegmann served as Assistant Treasurer of certain Fidelity® funds (2019-2021).
As a shareholder, you incur two types of costs: (1) transaction costs, which may include sales charges (loads) on purchase payments or redemption proceeds, as applicable and (2) ongoing costs, which generally include management fees, distribution and/or service (12b-1) fees and other Fund expenses. This Example is intended to help you understand your ongoing costs (in dollars) of investing in a fund and to compare these costs with the ongoing costs of investing in other mutual funds.
| The Example is based on an investment of $1,000 invested at the beginning of the period and held for the entire period (May 1, 2023 to October 31, 2023). |
Actual Expenses
The first line of the accompanying table provides information about actual account values and actual expenses. You may use the information in this line, together with the amount you invested, to estimate the expenses that you paid over the period. Simply divide your account value by $1,000.00 (for example, an $8,600 account value divided by $1,000.00 = 8.6), then multiply the result by the number in the first line for a class/Fund under the heading entitled "Expenses Paid During Period" to estimate the expenses you paid on your account during this period. If any fund is a shareholder of any underlying mutual funds or exchange-traded funds (ETFs) (the Underlying Funds), such fund indirectly bears its proportional share of the expenses of the Underlying Funds in addition to the direct expenses incurred presented in the table. These fees and expenses are not included in the annualized expense ratio used to calculate the expense estimate in the table below.
Hypothetical Example for Comparison Purposes
The second line of the accompanying table provides information about hypothetical account values and hypothetical expenses based on the actual expense ratio and an assumed rate of return of 5% per year before expenses, which is not the actual return. The hypothetical account values and expenses may not be used to estimate the actual ending account balance or expenses you paid for the period. You may use this information to compare the ongoing costs of investing in the Fund and other funds. To do so, compare this 5% hypothetical example with the 5% hypothetical examples that appear in the shareholder reports of the other funds. If any fund is a shareholder of any Underlying Funds, such fund indirectly bears its proportional share of the expenses of the Underlying Funds in addition to the direct expenses as presented in the table. These fees and expenses are not included in the annualized expense ratio used to calculate the expense estimate in the table below.
Please note that the expenses shown in the table are meant to highlight your ongoing costs only and do not reflect any transaction costs. Therefore, the second line of the table is useful in comparing ongoing costs only, and will not help you determine the relative total costs of owning different funds. In addition, if these transactional costs were included, your costs would have been higher.
| | | | | Annualized Expense Ratio- A | | Beginning Account Value May 1, 2023 | | Ending Account Value October 31, 2023 | | Expenses Paid During Period- C May 1, 2023 to October 31, 2023 |
| | | | | | | | | | |
Fidelity® Infrastructure Fund ** | | | | .95% | | | | | | |
| Actual | | | | | | $ 1,000 | | $ 886.80 | | $ 4.52 |
Hypothetical-B | | | | | | $ 1,000 | | $ 1,020.42 | | $ 4.84 |
| |
A Annualized expense ratio reflects expenses net of applicable fee waivers.
B 5% return per year before expenses
C Expenses are equal to the annualized expense ratio, multiplied by the average account value over the period, multiplied by 184/ 365 (to reflect the one-half year period). The fees and expenses of any Underlying Funds are not included in each annualized expense ratio.
** If fees and changes to the expense contract and/or expense cap, effective December 1, 2023, had been in effect during the current period, the restated annualized expense ratio and the expenses paid in the actual and hypothetical examples above would have been as shown in table below:
| | | | | Annualized Expense Ratio- A | | Expenses Paid |
| | | | | | |
| Fidelity® Infrastructure Fund | | | | .89% | | |
| Actual | | | | | | $ 4.23 |
Hypothetical- B | | | | | | $ 4.53 |
| | | | | | | |
| A Annualized expense ratio reflects expenses net of applicable fee waivers. | | | | | | |
| B 5% return per year before expenses | | | | | | |
The dividend and capital gains distributions for the fund(s) are available on Fidelity.com or Institutional.Fidelity.com.
A total of 0.21% of the dividends distributed during the fiscal year was derived from interest on U.S. Government securities which is generally exempt from state income tax.
The fund designates $40,277 of distributions paid during the fiscal year ended 2023 as qualifying to be taxed as section 163(j) interest dividends.
The fund designates 38%, 56%, 56%, and 56% of the dividends distributed in December, April, July, and October, respectively during the fiscal year as qualifying for the dividends-received deduction for corporate shareholders.
The fund designates 100% of the dividends distributed during the fiscal year as amounts which may be taken into account as a dividend for the purposes of the maximum rate under section 1(h)(11) of the Internal Revenue Code.
The fund will notify shareholders in January 2024 of amounts for use in preparing 2023 income tax returns.
Board Approval of Investment Advisory Contracts and Management Fees
Fidelity Infrastructure Fund
Each year, the Board of Trustees, including the Independent Trustees (together, the Board), considers the renewal of the fund's management contract with Fidelity Management & Research Company LLC (FMR) and the sub-advisory agreements (together, the Advisory Contracts) for the fund. FMR and the sub-advisers are referred to herein as the Investment Advisers. The Board, assisted by the advice of fund counsel and Independent Trustees' counsel, requests and considers a broad range of information relevant to the renewal of the Advisory Contracts throughout the year.
The Board meets regularly and, at each of its meetings, covers an extensive agenda of topics and materials and considers factors that are relevant to its annual consideration of the renewal of the fund's Advisory Contracts, including the services and support provided to the fund and its shareholders. The Board, acting directly and through its Committees (each of which is composed of and chaired by Independent Trustees), requests and receives information concerning the annual consideration of the renewal of the fund's Advisory Contracts. The Board also meets as needed to review matters specifically related to the Board's annual consideration of the renewal of the Advisory Contracts. Members of the Board may also meet with trustees of other Fidelity funds through joint ad hoc committees to discuss certain matters relevant to all of the Fidelity funds.
Approval of Stub Period Continuation. At its May 2023 meeting, the Board of Trustees voted to continue the fund's management contract with FMR, and the sub-advisory agreements and sub-sub-advisory agreements, in each case, where applicable (together, the Advisory Contracts), without modification, for two months from June 1, 2023 through July 31, 2023. The Board considered that the approval of the fund's Advisory Contracts will not result in any changes in (i) the investment process or strategies employed in the management of the fund's assets; (ii) the fees and expenses paid by shareholders; (iii) the nature, extent or quality of services provided under the fund's Advisory Contracts; or (iv) the day-to-day management of the fund or the persons primarily responsible for such management. The Board also considered that since its last approval of the fund's Advisory Contracts, FMR had provided additional information on the fund in support of the annual contract renewal process, including competitive analyses on total expenses and management fees and in-depth reviews of fund performance and fund profitability information. The Board concluded that the fund's Advisory Contracts are fair and reasonable, and that the fund's Advisory Contracts should be renewed, without modification, through July 31, 2023, with the understanding that the Board would consider the annual renewal for a full one year period in July 2023.
At its July 2023 meeting, the Board unanimously determined to renew the fund's Advisory Contracts. In reaching its determination, the Board considered all factors it believed relevant, including (i) the nature, extent, and quality of the services provided to the fund and its shareholders (including the investment performance of the fund); (ii) the competitiveness relative to peer funds of the fund's management fee and total expense ratio; (iii) the total costs of the services provided by and the profits realized by FMR and its affiliates (Fidelity) from its relationships with the fund; and (iv) the extent to which, if any, economies of scale exist and are realized as the fund grows, and whether any economies of scale are appropriately shared with fund shareholders. The Board also considered the broad range of investment choices available to shareholders from FMR's competitors and that the fund's shareholders have chosen to invest in the fund, which is part of the Fidelity family of funds. The Board's decision to renew the Advisory Contracts was not based on any single factor.
The Board reached a determination, with the assistance of fund counsel and Independent Trustees' counsel and through the exercise of its business judgment, that the renewal of the Advisory Contracts was in the best interests of the fund and its shareholders and that the compensation payable under the Advisory Contracts was fair and reasonable in light of all of the surrounding circumstances.
Nature, Extent, and Quality of Services Provided. The Board considered staffing as it relates to the fund, including the backgrounds and experience of investment personnel of the Investment Advisers, and also considered the Investment Advisers' implementation of the fund's investment program. The Independent Trustees also had discussions with senior management of Fidelity's investment operations and investment groups. The Board considered the structure of the investment personnel compensation program and whether this structure provides appropriate incentives to act in the best interests of the fund. Additionally, the Board considered the portfolio managers' investments, if any, in the funds that they manage.
Resources Dedicated to Investment Management and Support Services. The Board and the Fund Oversight and Research Committees reviewed the general qualifications and capabilities of Fidelity's investment staff, including its size, education, experience, and resources, as well as Fidelity's approach to recruiting, training, managing, and compensating investment personnel. The Board noted the resources devoted to expansion of Fidelity's global investment organization, and that Fidelity's analysts have extensive resources, tools, and capabilities that allow them to conduct sophisticated quantitative and fundamental analysis, as well as credit analysis of issuers, counterparties, and guarantors. Further, the Board considered that Fidelity's investment professionals have sufficient access to global information and data so as to provide competitive investment results over time, and that those professionals also have access to sophisticated tools that permit them to assess portfolio construction and risk and performance attribution characteristics continuously, as well as to transmit new information and research conclusions rapidly around the world. Additionally, in its deliberations, the Board considered Fidelity's trading, risk management, compliance, and technology and operations capabilities and resources, which are integral parts of the investment management process.
Shareholder and Administrative Services. The Board considered (i) the nature, extent, quality, and cost of advisory, administrative, and shareholder services performed by the Investment Advisers and their affiliates under the Advisory Contracts and under separate agreements covering transfer agency, pricing and bookkeeping, and securities lending services for the fund; (ii) the nature and extent of Fidelity's supervision of third party service providers, principally custodians, subcustodians, and pricing vendors; and (iii) the resources devoted by Fidelity to, and the record of compliance with, the fund's compliance policies and procedures. The Board also reviewed the allocation of fund brokerage, including allocations to brokers affiliated with the Investment Advisers, the use of brokerage commissions to pay fund expenses, and the use of "soft" commission dollars to pay for research services. The Board also considered the fund's securities lending activities and any payments made to Fidelity relating to securities lending.
The Board noted that the growth of fund assets over time across the complex allows Fidelity to reinvest in the development of services designed to enhance the value and convenience of the Fidelity funds as investment vehicles. These services include 24-hour access to account information and market information over the Internet and through telephone representatives, investor education materials, and asset allocation tools. The Board also considered that it reviews customer service metrics such as telephone response times, continuity of services on the website and metrics addressing services at Fidelity Investor Centers.
Investment in a Large Fund Family. The Board considered the benefits to shareholders of investing in a fund that is part of a large family of funds offering a variety of investment disciplines and providing a large variety of fund investor services. The Board noted that Fidelity had taken, or had made recommendations that resulted in the Fidelity funds taking, a number of actions over the previous year that benefited particular funds and/or the Fidelity funds in general.
Investment Performance. The Board took into account discussions that occur with representatives of the Investment Advisers, and reports that it receives, at Board meetings throughout the year, relating to fund investment performance. In this regard the Board noted that as part of regularly scheduled fund reviews and other reports to the Board on fund performance, the Board considered annualized return information for the fund for different time periods, measured against an appropriate securities market index (benchmark index). The Board also considered information about performance attribution. In its ongoing evaluation of fund investment performance, the Board gives particular attention to information indicating changes in performance of the funds over different time periods and discussed with the Investment Advisers the reasons for any overperformance or underperformance.
In addition to reviewing absolute and relative fund performance, the Independent Trustees periodically consider the appropriateness of fund performance metrics in evaluating the results achieved. The Independent Trustees generally give greater weight to fund performance over longer time periods than over shorter time periods. Depending on the circumstances, the Independent Trustees may be satisfied with a fund's performance notwithstanding that it lags its benchmark index for certain periods.
Based on its review, the Board concluded that the nature, extent, and quality of services provided to the fund under the Advisory Contracts should continue to benefit the shareholders of the fund.
Competitiveness of Management Fee and Total Expense Ratio. The Board was provided with information regarding industry trends in management fees and expenses. In its review of the fund's management fee and total expense ratio, the Board considered the fund's management fee rate as well as other fund expenses, such as transfer agent fees, pricing and bookkeeping fees, and custodial, legal, and audit fees. The Board noted that Fidelity may agree to waive fees or reimburse expenses from time to time, and the extent to which, if any, it has done so for the fund.
Comparisons of Management Fees and Total Expense Ratios. Among other things, the Board reviewed data for selected groups of competitive funds and classes (referred to as "mapped groups") that were compiled by Fidelity based on combining similar investment objective categories (as classified by Lipper) that have comparable investment mandates. The data reviewed by the Board included (i) gross management fee comparisons (before taking into account expense reimbursements or caps) relative to the total universe of funds within the mapped group; (ii) gross management fee comparisons relative to a subset of non-Fidelity funds in the mapped group that are similar in size and management fee structure to the fund (referred to as the "asset size peer group"); (iii) total expense comparisons of the fund relative to funds and classes in the mapped group that have a similar sales load structure to the fund (referred to as the "similar sales load structure group"); and (iv) total expense comparisons of the fund relative to funds and classes in the similar sales load structure group that are similar in size and management fee structure to the fund (referred to as the "total expense asset size peer group"). The total expense asset size peer group comparison excludes performance adjustments and fund-paid 12b-1 fees to eliminate variability in fee structures.
The information provided to the Board indicated that the fund's management fee rate ranked below the competitive median of the mapped group for the 12-month period ended September 30, 2022 and below the competitive median of the asset size peer group for the 12-month period ended September 30, 2022. Further, the information provided to the Board indicated that the total expense ratio of the fund ranked below the competitive median of the similar sales load structure group for the 12-month period ended September 30, 2022 and below the competitive median of the total expense asset size peer group for the 12-month period ended September 30, 2022.
The Board also considered that, for funds subject to the group fee, FMR agreed to voluntarily waive fees over a specified period of time in amounts designed to account for assets converted from certain funds to certain collective investment trusts.
Fees Charged to Other Fidelity Clients. The Board also considered Fidelity fee structures and other information with respect to clients of Fidelity, such as other funds advised or subadvised by Fidelity, pension plan clients, and other institutional clients with similar mandates. The Board noted that a joint ad hoc committee created by it and the boards of other Fidelity funds periodically reviews and compares Fidelity's institutional investment advisory business with its business of providing services to the Fidelity funds and also noted the most recent findings of the committee. The Board noted that the committee's review included a consideration of the differences in services provided, fees charged, and costs incurred, as well as competition in the markets serving the different categories of clients.
Based on its review, the Board concluded that the fund's management fee is fair and reasonable in light of the services that the fund receives and the other factors considered. Further, based on its review of total expense ratios and fees charged to other Fidelity clients, the Board concluded that the fund's total expense ratio was reasonable in light of the services that the fund and its shareholders receive and the other factors considered.
Costs of the Services and Profitability. The Board considered the revenues earned and the expenses incurred by Fidelity in conducting the business of developing, marketing, distributing, managing, administering and servicing the fund and servicing the fund's shareholders. The Board also considered the level of Fidelity's profits in respect of all the Fidelity funds.
On an annual basis, Fidelity presents to the Board information about the profitability of its relationships with the fund. Fidelity calculates profitability information for each fund, as well as aggregate profitability information for groups of Fidelity funds and all Fidelity funds, using a series of detailed revenue and cost allocation methodologies which originate with the books and records of Fidelity on which Fidelity's audited financial statements are based. The Audit Committee of the Board reviews any significant changes from the prior year's methodologies and the full Board approves such changes.
A public accounting firm has been engaged annually by the Board as part of the Board's assessment of Fidelity's profitability analysis. The engagement includes the review and assessment of the methodologies used by Fidelity in determining the revenues and expenses attributable to Fidelity's fund business, and completion of agreed-upon procedures in respect of the mathematical accuracy of certain fund profitability information and its conformity to established allocation methodologies. After considering the reports issued under the engagement and information provided by Fidelity, the Board concluded that while other allocation methods may also be reasonable, Fidelity's profitability methodologies are reasonable in all material respects.
The Board also reviewed Fidelity's non-fund businesses and potential indirect benefits such businesses may have received as a result of their association with Fidelity's fund business (i.e., fall-out benefits) as well as cases where Fidelity's affiliates may benefit from the funds' business. The Board considered areas where potential indirect benefits to the Fidelity funds from their relationships with Fidelity may exist. The Board's consideration of these matters was informed by the findings of a joint ad hoc committee created by it and the boards of other Fidelity funds to evaluate potential fall-out benefits.
The Board considered the costs of the services provided by and the profits realized by Fidelity in connection with the operation of the fund and was satisfied that the profitability was not excessive.
Economies of Scale. The Board considered whether there have been economies of scale in respect of the management of the Fidelity funds, whether the Fidelity funds (including the fund) have appropriately benefited from any such economies of scale, and whether there is potential for realization of any further economies of scale. The Board considered the extent to which the fund will benefit from economies of scale as assets grow through increased services to the fund, through waivers or reimbursements, or through fee or expense ratio reductions. The Board also noted that a committee (the Economies of Scale Committee) created by it and the boards of other Fidelity funds periodically analyzes whether Fidelity attains economies of scale in respect of the management and servicing of the Fidelity funds, whether the Fidelity funds have appropriately benefited from such economies of scale, and whether there is potential for realization of any further economies of scale.
The Board recognized that the fund's management contract incorporates a "group fee" structure, which provides for lower group fee rates as total "group assets" increase, and for higher group fee rates as total "group assets" decrease ("group assets" as defined in the management contract). FMR calculates the group fee rates based on a tiered asset "breakpoint" schedule that varies based on asset class. The Board considered that the group fee is designed to deliver the benefits of economies of scale to fund shareholders when total Fidelity fund assets increase, even if assets of any particular fund are unchanged or have declined, because some portion of Fidelity's costs are attributable to services provided to all Fidelity funds, and all funds benefit if those costs can be allocated among more assets. The Board further considered that Fidelity agreed to impose a temporary fee waiver in the form of additional breakpoints to the current breakpoint schedule. The Board concluded that, given the group fee structure, fund shareholders will benefit from lower management fees as "group assets" increase at the fund complex level, regardless of whether Fidelity achieves any such economies of scale.
The Board concluded, taking into account the analysis of the Economies of Scale Committee, that economies of scale, if any, are being appropriately shared between fund shareholders and Fidelity.
Additional Information Requested by the Board. In order to develop fully the factual basis for consideration of the Fidelity funds' advisory contracts, the Board requested and received additional information on certain topics, including: (i) fund flow and performance trends, in particular the underperformance of certain funds and strategies, and Fidelity's long-term strategies for certain funds, including any consideration of fund liquidations or mergers; (ii) the operation of performance fees and competitor use of performance fees; (iii) Fidelity's pricing philosophy compared to competitors; (iv) fund profitability methodology and data; (v) evaluation of competitive fund data and peer group classifications and fee and expense comparisons; (vi) the management fee and expense structures for different funds and classes and information about the differences between various fee and expense structures; (vii) group fee breakpoints and related voluntary fee waivers; and (viii) information regarding other accounts managed by Fidelity and the funds' sub-advisory arrangements.
Conclusion. Based on its evaluation of all of the conclusions noted above, and after considering all factors it believed relevant, the Board, including the Independent Trustees, concluded that the advisory and sub-advisory fee arrangements are fair and reasonable in light of all of the surrounding circumstances and that the fund's Advisory Contracts should be renewed through July 31, 2024.
1.9896235.103
ISF-ANN-1223
Fidelity® Total International Equity Fund
Annual Report
October 31, 2023
Includes Fidelity and Fidelity Advisor share classes
Contents
To view a fund's proxy voting guidelines and proxy voting record for the 12-month period ended June 30, visit http://www.fidelity.com/proxyvotingresults or visit the Securities and Exchange Commission's (SEC) web site at http://www.sec.gov.
You may also call 1-800-544-8544 if you're an individual investing directly with Fidelity, call 1-800-835-5092 if you're a plan sponsor or participant with Fidelity as your recordkeeper or call 1-877-208-0098 on institutional accounts or if you're an advisor or invest through one to request a free copy of the proxy voting guidelines.
Standard & Poor's, S&P and S&P 500 are registered service marks of The McGraw-Hill Companies, Inc. and have been licensed for use by Fidelity Distributors Corporation.
Other third-party marks appearing herein are the property of their respective owners.
All other marks appearing herein are registered or unregistered trademarks or service marks of FMR LLC or an affiliated company. © 2023 FMR LLC. All rights reserved.
This report and the financial statements contained herein are submitted for the general information of the shareholders of the Fund. This report is not authorized for distribution to prospective investors in the Fund unless preceded or accompanied by an effective prospectus.
A fund files its complete schedule of portfolio holdings with the SEC for the first and third quarters of each fiscal year on Form N-PORT. Forms N-PORT are available on the SEC's web site at http://www.sec.gov. A fund's Forms N-PORT may be reviewed and copied at the SEC's Public Reference Room in Washington, DC. Information regarding the operation of the SEC's Public Reference Room may be obtained by calling 1-800-SEC-0330.
For a complete list of a fund's portfolio holdings, view the most recent holdings listing, semiannual report, or annual report on Fidelity's web site at http://www.fidelity.com, http://www.institutional.fidelity.com, or http://www.401k.com, as applicable.
NOT FDIC INSURED •MAY LOSE VALUE •NO BANK GUARANTEE
Neither the Fund nor Fidelity Distributors Corporation is a bank.
Average annual total return reflects the change in the value of an investment, assuming reinvestment of distributions from dividend income and capital gains (the profits earned upon the sale of securities that have grown in value, if any) and assuming a constant rate of performance each year. The hypothetical investment and the average annual total returns do not reflect the deduction of taxes that a shareholder would pay on fund distributions or the redemption of fund shares. During periods of reimbursement by Fidelity, a fund's total return will be greater than it would be had the reimbursement not occurred. How a fund did yesterday is no guarantee of how it will do tomorrow.
| Average Annual Total Returns |
| | | | |
Periods ended October 31, 2023 | Past 1 year | Past 5 years | Past 10 years |
Class A (incl. 5.75% sales charge) | 6.19% | 4.72% | 3.40% |
Class M (incl. 3.50% sales charge) | 8.41% | 4.97% | 3.39% |
Class C (incl. contingent deferred sales charge) | 10.82% | 5.19% | 3.39% |
| Fidelity® Total International Equity Fund | 12.80% | 6.23% | 4.30% |
| Class I | 12.86% | 6.24% | 4.27% |
| Class Z | 13.04% | 6.40% | 4.39% |
Class C shares' contingent deferred sales charges included in the past one year, past five years and past ten years total return figures are 1%, 0% and 0%, respectively.
The initial offering of Class Z shares took place on February 1, 2017. Returns prior to February 1, 2017, are those of Class I.
| $10,000 Over 10 Years |
| |
Let's say hypothetically that $10,000 was invested in Fidelity® Total International Equity Fund, a class of the fund, on October 31, 2013. The chart shows how the value of your investment would have changed, and also shows how the MSCI ACWI (All Country World Index) ex USA Index performed over the same period. |
|
|
Market Recap:
International (non-U.S.) equities gained 12.27% for the 12 months ending October 31, 2023, according to the MSCI ACWI (All Country World Index) ex USA Index, as global economic expansion and a slowing in the pace of inflation in some markets provided a favorable backdrop for risk assets. After returning -15.86% in 2022, the index's upturn has been largely driven by a narrow set of companies in the information technology and communication services sectors, in part due to excitement for generative artificial intelligence applications. The index gained 14.07% year to date through July, including strong gains in both June (+4.50%) and July (+4.07%). The rally for international equities sputtered for the next three months (-11.33%) amid a stalling pattern in disinflationary trends, heightened global recession and geopolitical risks, soaring yields on longer-term U.S. government bonds and particularly weak economic conditions in the eurozone and China. The three-month decline left non-U.S. stocks up 1.15% year to date through October. Currency fluctuation also helped bolster non-U.S. equity performance overall. For the full 12 months, nearly all regions advanced, with Europe ex U.K. (+18%) and Japan (+17%) leading, whereas Canada (-0.38%) lagged by the widest margin. Each of the 11 sectors advanced, with information technology (+21%) and consumer discretionary (+19%) leading the way. Energy and industrials each rose about 14%. Conversely, four defensive-oriented sectors lagged by the widest margin: real estate (+4%), health care (+6%), consumer staples (+7%) and utilities (+8%).
Comments from Co-Managers Sam Polyak, Jed Weiss and Alex Zavratsky:
For the fiscal year ending October 31, 2023, the fund's share classes (excluding sales charges, if applicable) gained about 12% to 13%, versus 12.27% for the benchmark MSCI All Country World ex US Index (Net MA). From a regional standpoint, an overweight in emerging markets and security selection in Canada contributed to the fund's performance versus the benchmark. By sector, an underweight in consumer staples helped most, especially smaller-than-benchmark exposure to food, beverage & tobacco companies. Picks in financials, primarily among banks, also proved beneficial. Investment choices the in energy and communication services sectors further bolstered the portfolio's relative result this period. The top individual relative contributor was an overweight in Tencent Holdings (+50%), one of the fund's biggest holdings on October 31. A second notable relative contributor was our outsized stake in CRH (+52%). A position in POSCO gained 129% and notably helped as well though the stock was no longer held at period end. In contrast, on a regional basis, security selection in emerging markets, especially South Africa, along with stock picks and an underweight in Japan, detracted from the fund's relative return the past 12 months. By sector, unfavorable stock picks and an overweight in consumer discretionary were the biggest performance hurdles. Also pressuring the portfolio's return were security selection in health care and industrials. The fund's non-benchmark stake in ResMed returned approximately -36% and was the largest individual relative detractor, followed by an overweight in Impala Platinum Holdings (-58%). Larger-than-benchmark exposure to Nutrien (-35%) also proved detrimental. Noteworthy changes in positioning include decreased exposure to equity markets in Switzerland and South Korea. By sector, meaningful shifts include increased exposure to the consumer discretionary sector and a lower allocation to health care stocks.
The views expressed above reflect those of the portfolio manager(s) only through the end of the period as stated on the cover of this report and do not necessarily represent the views of Fidelity or any other person in the Fidelity organization. Any such views are subject to change at any time based upon market or other conditions and Fidelity disclaims any responsibility to update such views. These views may not be relied on as investment advice and, because investment decisions for a Fidelity fund are based on numerous factors, may not be relied on as an indication of trading intent on behalf of any Fidelity fund.
Top Holdings (% of Fund's net assets) |
| |
| Taiwan Semiconductor Manufacturing Co. Ltd. (Taiwan, Semiconductors & Semiconductor Equipment) | 3.1 | |
| Tencent Holdings Ltd. (China, Interactive Media & Services) | 2.4 | |
| Samsung Electronics Co. Ltd. (Korea (South), Technology Hardware, Storage & Peripherals) | 2.3 | |
| Linde PLC (United States of America, Chemicals) | 1.7 | |
| ASML Holding NV (Netherlands) (Netherlands, Semiconductors & Semiconductor Equipment) | 1.7 | |
| Canadian Pacific Kansas City Ltd. (Canada, Ground Transportation) | 1.6 | |
| Novo Nordisk A/S Series B (Denmark, Pharmaceuticals) | 1.6 | |
| LVMH Moet Hennessy Louis Vuitton SE (France, Textiles, Apparel & Luxury Goods) | 1.6 | |
| HDFC Bank Ltd. (India, Banks) | 1.6 | |
| Shell PLC ADR (Netherlands, Oil, Gas & Consumable Fuels) | 1.5 | |
| | 19.1 | |
| |
| Market Sectors (% of Fund's net assets) |
| |
| Financials | 22.4 | |
| Industrials | 18.8 | |
| Information Technology | 13.3 | |
| Consumer Discretionary | 12.4 | |
| Materials | 10.8 | |
| Energy | 6.3 | |
| Health Care | 5.6 | |
| Communication Services | 4.3 | |
| Consumer Staples | 3.2 | |
| Utilities | 0.3 | |
| Real Estate | 0.3 | |
| |
Asset Allocation (% of Fund's net assets) |
|
|
Geographic Diversification (% of Fund's net assets) |
|
* Includes Short-Term investments and Net Other Assets (Liabilities). Percentages are adjusted for the effect of derivatives, if applicable. |
| |
Showing Percentage of Net Assets
| Common Stocks - 96.0% |
| | | Shares | Value ($) |
| Australia - 2.5% | | | |
| BHP Group Ltd. | | 86,693 | 2,454,060 |
| Flutter Entertainment PLC (a) | | 1,590 | 249,398 |
| Glencore PLC | | 260,958 | 1,382,250 |
| Imdex Ltd. | | 43,461 | 45,587 |
| Macquarie Group Ltd. | | 7,594 | 780,587 |
| Steadfast Group Ltd. | | 17,941 | 61,695 |
| Woodside Energy Group Ltd. | | 30,739 | 669,489 |
TOTAL AUSTRALIA | | | 5,643,066 |
| Belgium - 0.5% | | | |
| Azelis Group NV | | 15,744 | 268,205 |
| KBC Ancora | | 2,919 | 110,263 |
| KBC Group NV | | 10,402 | 571,230 |
| UCB SA | | 3,088 | 225,648 |
TOTAL BELGIUM | | | 1,175,346 |
| Brazil - 1.2% | | | |
| Localiza Rent a Car SA | | 67,184 | 677,870 |
| Localiza Rent a Car SA rights 11/10/23 (a) | | 603 | 837 |
| Raia Drogasil SA | | 119,246 | 610,214 |
| Suzano Papel e Celulose SA | | 88,289 | 903,072 |
| XP, Inc. Class A | | 28,576 | 571,520 |
TOTAL BRAZIL | | | 2,763,513 |
| Canada - 7.5% | | | |
| Barrick Gold Corp. | | 103,109 | 1,647,682 |
| CAE, Inc. (a) | | 59,665 | 1,246,006 |
| Cameco Corp. | | 23,170 | 947,852 |
| Canadian Natural Resources Ltd. | | 15,965 | 1,013,793 |
| Canadian Pacific Kansas City Ltd. | | 49,815 | 3,536,892 |
| Constellation Software, Inc. | | 821 | 1,645,854 |
| Constellation Software, Inc. warrants 8/22/28 (a)(b) | | 921 | 0 |
| Franco-Nevada Corp. | | 11,449 | 1,392,786 |
| McCoy Global, Inc. | | 7,000 | 7,622 |
| Nutrien Ltd. | | 17,492 | 939,466 |
| Osisko Gold Royalties Ltd. | | 3,688 | 45,078 |
| Pason Systems, Inc. | | 5,503 | 52,738 |
| Richelieu Hardware Ltd. | | 29,867 | 893,372 |
| Suncor Energy, Inc. | | 41,159 | 1,332,937 |
| The Toronto-Dominion Bank | | 35,467 | 1,981,088 |
TOTAL CANADA | | | 16,683,166 |
| Chile - 0.5% | | | |
| Antofagasta PLC | | 63,746 | 1,042,107 |
| China - 9.6% | | | |
| Alibaba Group Holding Ltd. (a) | | 191,043 | 1,966,803 |
| China Life Insurance Co. Ltd. (H Shares) | | 1,306,902 | 1,770,067 |
| Chlitina Holding Ltd. | | 9,200 | 55,362 |
| Haier Smart Home Co. Ltd. (A Shares) | | 615,500 | 1,870,501 |
| Hansoh Pharmaceutical Group Co. Ltd. (c) | | 617,007 | 1,160,895 |
| Industrial & Commercial Bank of China Ltd. (H Shares) | | 2,248,643 | 1,077,650 |
| Kweichow Moutai Co. Ltd. (A Shares) | | 5,400 | 1,243,913 |
| Meituan Class B (a)(c) | | 150,955 | 2,139,789 |
| New Oriental Education & Technology Group, Inc. (a) | | 142,768 | 930,853 |
| PDD Holdings, Inc. ADR (a) | | 12,420 | 1,259,636 |
| Shangri-La Asia Ltd. (a) | | 817,621 | 521,624 |
| Shenzhen Inovance Technology Co. Ltd. (A Shares) | | 138,600 | 1,145,919 |
| Tencent Holdings Ltd. | | 145,276 | 5,376,484 |
| Tsingtao Brewery Co. Ltd. (H Shares) | | 104,841 | 795,065 |
TOTAL CHINA | | | 21,314,561 |
| Denmark - 1.9% | | | |
| DSV A/S | | 2,126 | 317,073 |
| Novo Nordisk A/S Series B | | 36,386 | 3,510,384 |
| Spar Nord Bank A/S | | 3,579 | 54,189 |
| Vestas Wind Systems A/S (a) | | 17,065 | 369,880 |
TOTAL DENMARK | | | 4,251,526 |
| Egypt - 0.0% | | | |
| Integrated Diagnostics Holdings PLC (a)(c) | | 60,949 | 23,222 |
| Finland - 0.5% | | | |
| Kone OYJ (B Shares) | | 7,972 | 344,914 |
| Mandatum Holding OY | | 15,224 | 58,828 |
| Musti Group OYJ | | 4,187 | 82,447 |
| Sampo Oyj (A Shares) | | 16,351 | 642,040 |
TOTAL FINLAND | | | 1,128,229 |
| France - 8.4% | | | |
| Air Liquide SA | | 5,207 | 892,231 |
| Airbus Group NV | | 17,230 | 2,310,133 |
| ALTEN | | 2,489 | 293,121 |
| AXA SA | | 51,320 | 1,520,633 |
| BNP Paribas SA | | 16,581 | 953,474 |
| Capgemini SA | | 3,197 | 565,002 |
| Edenred SA | | 16,961 | 901,629 |
| Laurent-Perrier Group SA | | 269 | 33,586 |
| Lectra | | 8,953 | 226,409 |
| Legrand SA | | 12,547 | 1,085,396 |
| LISI | | 1,147 | 26,518 |
| LVMH Moet Hennessy Louis Vuitton SE | | 4,856 | 3,476,559 |
| Safran SA | | 15,600 | 2,437,025 |
| Teleperformance | | 628 | 71,864 |
| TotalEnergies SE | | 41,046 | 2,744,232 |
| Vetoquinol SA | | 1,238 | 104,401 |
| VINCI SA | | 6,728 | 743,945 |
| Vivendi SA | | 46,951 | 420,084 |
TOTAL FRANCE | | | 18,806,242 |
| Germany - 3.9% | | | |
| Bayer AG | | 11,683 | 504,806 |
| Covestro AG (a)(c) | | 4,267 | 215,361 |
| CTS Eventim AG | | 5,036 | 303,996 |
| Deutsche Borse AG | | 4,746 | 781,175 |
| DHL Group | | 16,696 | 649,404 |
| Fresenius SE & Co. KGaA | | 12,831 | 329,094 |
| Hannover Reuck SE | | 4,054 | 893,511 |
| Infineon Technologies AG | | 8,068 | 235,668 |
| Muenchener Rueckversicherungs-Gesellschaft AG in Muenchen | | 2,339 | 936,748 |
| Nexus AG | | 1,420 | 69,190 |
| Rheinmetall AG | | 3,960 | 1,132,997 |
| RWE AG | | 19,300 | 737,823 |
| Scout24 AG (c) | | 1,301 | 79,870 |
| Siemens AG | | 10,057 | 1,334,552 |
| Stabilus Se | | 831 | 52,669 |
| Vonovia SE | | 14,534 | 334,603 |
TOTAL GERMANY | | | 8,591,467 |
| Greece - 0.5% | | | |
| National Bank of Greece SA (a) | | 189,452 | 1,082,479 |
| Hong Kong - 1.1% | | | |
| AIA Group Ltd. | | 140,700 | 1,221,812 |
| Pacific Basin Shipping Ltd. | | 2,103,339 | 608,651 |
| Prudential PLC | | 62,340 | 651,851 |
TOTAL HONG KONG | | | 2,482,314 |
| Hungary - 0.5% | | | |
| Richter Gedeon PLC | | 49,772 | 1,167,016 |
| India - 4.4% | | | |
| Axis Bank Ltd. | | 76,909 | 907,242 |
| Bharat Heavy Electricals Ltd. | | 598,571 | 869,200 |
| Embassy Office Parks (REIT) | | 6,800 | 25,439 |
| HDFC Bank Ltd. | | 195,626 | 3,470,262 |
| Jio Financial Services Ltd. | | 2,800 | 7,429 |
| Kotak Mahindra Bank Ltd. | | 15,203 | 317,722 |
| Larsen & Toubro Ltd. | | 22,435 | 789,273 |
| Reliance Industries Ltd. | | 2,800 | 76,971 |
| Reliance Industries Ltd. GDR (c) | | 13,176 | 719,410 |
| Shree Cement Ltd. | | 3,059 | 942,543 |
| Solar Industries India Ltd. | | 15,478 | 1,022,155 |
| Zomato Ltd. (a) | | 526,300 | 665,480 |
TOTAL INDIA | | | 9,813,126 |
| Indonesia - 0.2% | | | |
| PT Bank Rakyat Indonesia (Persero) Tbk | | 1,256,388 | 392,852 |
| Ireland - 0.6% | | | |
| AerCap Holdings NV (a) | | 1,652 | 102,622 |
| Bank of Ireland Group PLC | | 65,742 | 587,796 |
| Cairn Homes PLC | | 47,204 | 55,366 |
| Irish Residential Properties REIT PLC | | 39,729 | 38,254 |
| Ryanair Holdings PLC sponsored ADR (a) | | 5,660 | 496,382 |
TOTAL IRELAND | | | 1,280,420 |
| Israel - 0.3% | | | |
| Ituran Location & Control Ltd. | | 3,915 | 96,818 |
| NICE Ltd. sponsored ADR (a) | | 4,117 | 635,459 |
| Tel Aviv Stock Exchange Ltd. (a) | | 7,200 | 32,063 |
TOTAL ISRAEL | | | 764,340 |
| Italy - 1.7% | | | |
| Eni SpA | | 77,307 | 1,263,789 |
| Interpump Group SpA | | 14,603 | 608,787 |
| Mediobanca SpA | | 57,552 | 686,295 |
| Prada SpA | | 82,900 | 499,394 |
| Prysmian SpA | | 8,517 | 318,028 |
| UniCredit SpA | | 17,440 | 437,214 |
TOTAL ITALY | | | 3,813,507 |
| Japan - 12.4% | | | |
| Ai Holdings Corp. | | 1,450 | 22,447 |
| Aoki Super Co. Ltd. | | 1,900 | 32,379 |
| Artnature, Inc. | | 5,300 | 28,307 |
| Aucnet, Inc. | | 3,400 | 39,586 |
| Azbil Corp. | | 39,800 | 1,176,037 |
| Broadleaf Co. Ltd. | | 27,600 | 97,544 |
| Central Automotive Products Ltd. | | 1,100 | 24,636 |
| Curves Holdings Co. Ltd. | | 24,300 | 106,001 |
| Daiichi Sankyo Kabushiki Kaisha | | 3,901 | 100,584 |
| Daiichikosho Co. Ltd. | | 7,200 | 106,427 |
| Daikokutenbussan Co. Ltd. | | 700 | 29,665 |
| DENSO Corp. | | 57,955 | 855,783 |
| Digital Hearts Holdings Co. Ltd. | | 4,900 | 29,826 |
| Eisai Co. Ltd. | | 3,706 | 196,338 |
| Fast Retailing Co. Ltd. | | 1,644 | 363,976 |
| FUJIFILM Holdings Corp. | | 8,212 | 449,178 |
| Fujitec Co. Ltd. | | 2,200 | 47,762 |
| Fujitsu Ltd. | | 3,932 | 509,381 |
| Funai Soken Holdings, Inc. | | 3,250 | 53,417 |
| Goldcrest Co. Ltd. | | 6,560 | 93,548 |
| Hitachi Ltd. | | 26,557 | 1,683,359 |
| Hoya Corp. | | 12,341 | 1,188,051 |
| Ibiden Co. Ltd. | | 6,912 | 294,703 |
| INPEX Corp. | | 35,442 | 514,294 |
| Itochu Corp. | | 27,959 | 1,007,112 |
| Keyence Corp. | | 5,384 | 2,084,247 |
| Kobayashi Pharmaceutical Co. Ltd. | | 1,600 | 66,053 |
| Koshidaka Holdings Co. Ltd. | | 15,300 | 108,854 |
| Kusuri No Aoki Holdings Co. Ltd. | | 800 | 52,414 |
| Lasertec Corp. | | 5,750 | 949,786 |
| LY Corp. | | 67,344 | 171,693 |
| Medikit Co. Ltd. | | 3,300 | 58,298 |
| Minebea Mitsumi, Inc. | | 17,657 | 276,849 |
| Miroku Jyoho Service Co., Ltd. | | 2,400 | 24,580 |
| Misumi Group, Inc. | | 43,624 | 660,409 |
| Mitsubishi UFJ Financial Group, Inc. | | 183,769 | 1,541,665 |
| Mitsuboshi Belting Ltd. | | 900 | 25,982 |
| Nagaileben Co. Ltd. | | 7,400 | 102,119 |
| Nihon Parkerizing Co. Ltd. | | 17,800 | 129,185 |
| NOF Corp. | | 3,465 | 136,698 |
| NS Tool Co. Ltd. | | 5,600 | 40,161 |
| NSD Co. Ltd. | | 5,200 | 90,474 |
| OBIC Co. Ltd. | | 1,450 | 214,334 |
| ORIX Corp. | | 44,172 | 803,328 |
| OSG Corp. | | 21,080 | 240,535 |
| Paramount Bed Holdings Co. Ltd. | | 2,400 | 40,890 |
| ProNexus, Inc. | | 5,100 | 39,720 |
| Recruit Holdings Co. Ltd. | | 34,800 | 997,810 |
| Renesas Electronics Corp. (a) | | 48,057 | 631,259 |
| San-Ai Obbli Co. Ltd. | | 6,300 | 68,024 |
| Shin-Etsu Chemical Co. Ltd. | | 32,435 | 969,916 |
| SHO-BOND Holdings Co. Ltd. | | 17,880 | 704,169 |
| Shoei Co. Ltd. | | 5,500 | 73,281 |
| SK Kaken Co. Ltd. | | 2,100 | 98,154 |
| SoftBank Group Corp. | | 7,821 | 320,302 |
| Software Service, Inc. | | 800 | 45,583 |
| Sony Group Corp. | | 5,999 | 498,750 |
| Sumitomo Mitsui Financial Group, Inc. | | 26,440 | 1,274,619 |
| Suzuki Motor Corp. | | 18,187 | 705,874 |
| Techno Medica Co. Ltd. | | 500 | 7,556 |
| The Monogatari Corp. | | 3,160 | 85,575 |
| TIS, Inc. | | 12,774 | 273,553 |
| Tocalo Co. Ltd. | | 4,600 | 41,578 |
| Tokio Marine Holdings, Inc. | | 47,465 | 1,061,898 |
| Toyota Motor Corp. | | 128,312 | 2,244,658 |
| USS Co. Ltd. | | 26,200 | 457,947 |
| YAKUODO Holdings Co. Ltd. | | 2,800 | 51,574 |
| YONEX Co. Ltd. | | 4,500 | 48,752 |
TOTAL JAPAN | | | 27,569,447 |
| Kenya - 0.0% | | | |
| Safaricom Ltd. | | 142,245 | 11,763 |
| Korea (South) - 3.7% | | | |
| BGF Retail Co. Ltd. | | 491 | 50,136 |
| Hyundai Mipo Dockyard Co. Ltd. (a) | | 13,407 | 689,871 |
| Hyundai Motor Co. Ltd. | | 8,558 | 1,076,574 |
| Korea Aerospace Industries Ltd. | | 36,797 | 1,209,000 |
| Samsung Electronics Co. Ltd. | | 104,169 | 5,177,313 |
TOTAL KOREA (SOUTH) | | | 8,202,894 |
| Luxembourg - 0.1% | | | |
| ArcelorMittal SA (Netherlands) | | 9,412 | 207,941 |
| Mexico - 0.6% | | | |
| Grupo Financiero Banorte S.A.B. de CV Series O | | 90,709 | 736,177 |
| Wal-Mart de Mexico SA de CV Series V | | 189,533 | 678,383 |
TOTAL MEXICO | | | 1,414,560 |
| Netherlands - 3.8% | | | |
| Aalberts Industries NV | | 13,075 | 407,016 |
| ASML Holding NV (Netherlands) | | 6,127 | 3,683,065 |
| BE Semiconductor Industries NV | | 1,144 | 117,778 |
| IMCD NV | | 3,942 | 473,412 |
| Shell PLC ADR | | 52,459 | 3,417,179 |
| Universal Music Group NV | | 10,768 | 263,696 |
TOTAL NETHERLANDS | | | 8,362,146 |
| Norway - 0.2% | | | |
| Kongsberg Gruppen ASA | | 4,525 | 184,711 |
| Medistim ASA | | 1,929 | 33,414 |
| Schibsted ASA (B Shares) | | 8,710 | 161,398 |
| Volue A/S (a) | | 10,613 | 17,804 |
TOTAL NORWAY | | | 397,327 |
| Peru - 0.4% | | | |
| Credicorp Ltd. (United States) | | 8,061 | 1,007,303 |
| Russia - 0.1% | | | |
| LUKOIL PJSC sponsored ADR (a)(b) | | 15,040 | 4,255 |
| Sberbank of Russia sponsored ADR (a)(b) | | 62,556 | 1,114 |
| Yandex NV Series A (a)(b) | | 15,421 | 168,089 |
TOTAL RUSSIA | | | 173,458 |
| Singapore - 0.3% | | | |
| United Overseas Bank Ltd. | | 38,255 | 754,568 |
| South Africa - 1.4% | | | |
| Absa Group Ltd. | | 109,918 | 1,002,134 |
| Anglo American PLC (United Kingdom) | | 25,210 | 642,341 |
| Impala Platinum Holdings Ltd. | | 132,395 | 551,504 |
| MTN Group Ltd. | | 178,892 | 873,271 |
| Thungela Resources Ltd. (d) | | 4,647 | 41,096 |
TOTAL SOUTH AFRICA | | | 3,110,346 |
| Spain - 1.4% | | | |
| Amadeus IT Holding SA Class A | | 22,876 | 1,302,718 |
| Banco Santander SA (Spain) | | 378,893 | 1,389,543 |
| Cellnex Telecom SA (c) | | 7,378 | 216,884 |
| Fluidra SA | | 1,601 | 28,155 |
| Unicaja Banco SA (c) | | 147,836 | 153,610 |
TOTAL SPAIN | | | 3,090,910 |
| Sweden - 3.1% | | | |
| Addlife AB | | 4,952 | 32,252 |
| AddTech AB (B Shares) | | 24,909 | 364,627 |
| ASSA ABLOY AB (B Shares) | | 35,792 | 762,909 |
| Atlas Copco AB (A Shares) | | 151,993 | 1,968,161 |
| Autoliv, Inc. | | 8,355 | 765,736 |
| Bergman & Beving AB (B Shares) | | 5,200 | 69,691 |
| Epiroc AB (A Shares) | | 56,837 | 936,374 |
| Hemnet Group AB | | 6,082 | 105,540 |
| Investor AB (B Shares) | | 60,573 | 1,109,176 |
| INVISIO AB | | 4,673 | 70,163 |
| John Mattson Fastighetsforetag (a) | | 4,823 | 23,073 |
| Lagercrantz Group AB (B Shares) | | 53,594 | 488,290 |
| Sandvik AB | | 8,455 | 144,014 |
| Teqnion AB (a) | | 500 | 9,205 |
TOTAL SWEDEN | | | 6,849,211 |
| Switzerland - 1.8% | | | |
| Schindler Holding AG: | | | |
| (participation certificate) | | 1,868 | 376,208 |
| (Reg.) | | 107 | 20,761 |
| Swiss Life Holding AG | | 867 | 554,522 |
| Tecan Group AG | | 366 | 104,773 |
| UBS Group AG | | 15,290 | 356,680 |
| UBS Group AG | | 64,075 | 1,503,200 |
| Zurich Insurance Group Ltd. | | 2,129 | 1,007,802 |
TOTAL SWITZERLAND | | | 3,923,946 |
| Taiwan - 4.3% | | | |
| Addcn Technology Co. Ltd. | | 10,354 | 63,282 |
| ECLAT Textile Co. Ltd. | | 67,873 | 1,079,451 |
| HIWIN Technologies Corp. | | 108,888 | 659,369 |
| Taiwan Semiconductor Manufacturing Co. Ltd. | | 427,821 | 6,982,008 |
| Yageo Corp. | | 51,171 | 833,626 |
TOTAL TAIWAN | | | 9,617,736 |
| United Kingdom - 5.5% | | | |
| AstraZeneca PLC (United Kingdom) | | 7,478 | 936,274 |
| B&M European Value Retail SA | | 53,725 | 345,307 |
| BAE Systems PLC | | 183,898 | 2,472,763 |
| Barratt Developments PLC | | 98,961 | 497,848 |
| Beazley PLC | | 44,530 | 278,468 |
| Bodycote PLC | | 21,381 | 149,168 |
| Clarkson PLC | | 1,903 | 61,179 |
| Compass Group PLC | | 60,669 | 1,529,550 |
| Dechra Pharmaceuticals PLC | | 1,176 | 54,430 |
| Howden Joinery Group PLC | | 16,094 | 124,724 |
| HSBC Holdings PLC (United Kingdom) | | 48,422 | 349,627 |
| Imperial Brands PLC | | 15,920 | 339,163 |
| InterContinental Hotel Group PLC ADR | | 15,667 | 1,130,061 |
| Lloyds Banking Group PLC | | 1,314,033 | 639,540 |
| NatWest Group PLC | | 73,764 | 160,497 |
| Rightmove PLC | | 54,726 | 314,624 |
| Rolls-Royce Holdings PLC (a) | | 97,312 | 256,147 |
| Sage Group PLC | | 38,500 | 454,191 |
| Spectris PLC | | 26,761 | 1,008,326 |
| Spirax-Sarco Engineering PLC | | 715 | 71,192 |
| Standard Chartered PLC (United Kingdom) | | 137,807 | 1,055,234 |
| Unite Group PLC | | 4,000 | 42,225 |
TOTAL UNITED KINGDOM | | | 12,270,538 |
| United States of America - 11.1% | | | |
| CRH PLC | | 19,516 | 1,048,693 |
| CRH PLC | | 29,993 | 1,606,725 |
| Experian PLC | | 38,939 | 1,178,951 |
| Ferguson PLC | | 2,970 | 445,099 |
| Linde PLC | | 9,770 | 3,733,703 |
| Marsh & McLennan Companies, Inc. | | 10,325 | 1,958,136 |
| MasterCard, Inc. Class A | | 3,370 | 1,268,300 |
| Microsoft Corp. | | 1,200 | 405,732 |
| Moody's Corp. | | 3,437 | 1,058,596 |
| Morningstar, Inc. | | 958 | 242,604 |
| MSCI, Inc. | | 2,121 | 1,000,158 |
| Nestle SA (Reg. S) | | 29,628 | 3,195,047 |
| NOV, Inc. | | 21,616 | 431,455 |
| Otis Worldwide Corp. | | 5,124 | 395,624 |
| PriceSmart, Inc. | | 3,322 | 207,592 |
| ResMed, Inc. | | 4,381 | 618,685 |
| Roche Holding AG (participation certificate) | | 3,183 | 820,290 |
| S&P Global, Inc. | | 3,028 | 1,057,711 |
| Sanofi SA | | 14,932 | 1,355,918 |
| Sherwin-Williams Co. | | 4,383 | 1,044,074 |
| Synopsys, Inc. (a) | | 700 | 328,608 |
| Visa, Inc. Class A | | 5,402 | 1,270,010 |
TOTAL UNITED STATES OF AMERICA | | | 24,671,711 |
| TOTAL COMMON STOCKS (Cost $200,116,994) | | | 213,854,304 |
| | | | |
| Preferred Stocks - 1.7% |
| | | Shares | Value ($) |
| Convertible Preferred Stocks - 0.1% | | | |
| China - 0.1% | | | |
| ByteDance Ltd. Series E1 (a)(b)(e) | | 577 | 134,816 |
| Nonconvertible Preferred Stocks - 1.6% | | | |
| Brazil - 1.4% | | | |
| Gerdau SA sponsored ADR | | 163,566 | 709,876 |
| Itau Unibanco Holding SA | | 247,683 | 1,317,570 |
| Petroleo Brasileiro SA - Petrobras sponsored ADR | | 69,628 | 1,044,420 |
| | | | 3,071,866 |
| Germany - 0.2% | | | |
| Porsche Automobil Holding SE (Germany) | | 10,376 | 464,410 |
TOTAL NONCONVERTIBLE PREFERRED STOCKS | | | 3,536,276 |
| TOTAL PREFERRED STOCKS (Cost $3,425,512) | | | 3,671,092 |
| | | | |
| Money Market Funds - 2.3% |
| | | Shares | Value ($) |
| Fidelity Cash Central Fund 5.40% (f) | | 5,161,253 | 5,162,285 |
| Fidelity Securities Lending Cash Central Fund 5.40% (f)(g) | | 21,695 | 21,697 |
| TOTAL MONEY MARKET FUNDS (Cost $5,183,979) | | | 5,183,982 |
| | | | |
| TOTAL INVESTMENT IN SECURITIES - 100.0% (Cost $208,726,485) | 222,709,378 |
NET OTHER ASSETS (LIABILITIES) - 0.0% | (7,825) |
| NET ASSETS - 100.0% | 222,701,553 |
| | |
Legend
| (c) | Security exempt from registration under Rule 144A of the Securities Act of 1933. These securities may be resold in transactions exempt from registration, normally to qualified institutional buyers. At the end of the period, the value of these securities amounted to $4,709,041 or 2.1% of net assets. |
| (d) | Security or a portion of the security is on loan at period end. |
| (e) | Restricted securities (including private placements) - Investment in securities not registered under the Securities Act of 1933 (excluding 144A issues). At the end of the period, the value of restricted securities (excluding 144A issues) amounted to $134,816 or 0.1% of net assets. |
| (f) | Affiliated fund that is generally available only to investment companies and other accounts managed by Fidelity Investments. The rate quoted is the annualized seven-day yield of the fund at period end. A complete unaudited listing of the fund's holdings as of its most recent quarter end is available upon request. In addition, each Fidelity Central Fund's financial statements, which are not covered by the Fund's Report of Independent Registered Public Accounting Firm, are available on the SEC's website or upon request. |
| (g) | Investment made with cash collateral received from securities on loan. |
| Additional information on each restricted holding is as follows: |
| Security | Acquisition Date | Acquisition Cost ($) |
| ByteDance Ltd. Series E1 | 11/18/20 | 63,224 |
| | | |
Affiliated Central Funds
Fiscal year to date information regarding the Fund's investments in Fidelity Central Funds, including the ownership percentage, is presented below.
| Affiliate | Value, beginning of period ($) | Purchases ($) | Sales Proceeds ($) | Dividend Income ($) | Realized Gain (loss) ($) | Change in Unrealized appreciation (depreciation) ($) | Value, end of period ($) | % ownership, end of period |
| Fidelity Cash Central Fund 5.40% | 5,394,098 | 127,837,341 | 128,069,153 | 278,420 | - | (1) | 5,162,285 | 0.0% |
| Fidelity Securities Lending Cash Central Fund 5.40% | 2,836,886 | 34,348,464 | 37,163,653 | 16,776 | - | - | 21,697 | 0.0% |
| Total | 8,230,984 | 162,185,805 | 165,232,806 | 295,196 | - | (1) | 5,183,982 | |
| | | | | | | | | |
Amounts in the dividend income column in the above table include any capital gain distributions from underlying funds, which are presented in the corresponding line item in the Statement of Operations, if applicable.
Amounts in the dividend income column for Fidelity Securities Lending Cash Central Fund represents the income earned on investing cash collateral, less rebates paid to borrowers and any lending agent fees associated with the loan, plus any premium payments received for lending certain types of securities.
Amounts included in the purchases and sales proceeds columns may include in-kind transactions, if applicable.
Investment Valuation
The following is a summary of the inputs used, as of October 31, 2023, involving the Fund's assets and liabilities carried at fair value. The inputs or methodology used for valuing securities may not be an indication of the risk associated with investing in those securities. For more information on valuation inputs, and their aggregation into the levels used below, please refer to the Investment Valuation section in the accompanying Notes to Financial Statements.
| Valuation Inputs at Reporting Date: |
| Description | Total ($) | Level 1 ($) | Level 2 ($) | Level 3 ($) |
Investments in Securities: | | | | |
|
| Equities: | | | | |
Communication Services | 9,092,219 | 2,270,546 | 6,518,768 | 302,905 |
Consumer Discretionary | 27,523,178 | 5,688,517 | 21,834,661 | - |
Consumer Staples | 7,468,853 | 1,529,775 | 5,939,078 | - |
Energy | 14,349,556 | 9,008,502 | 5,336,799 | 4,255 |
Financials | 49,375,134 | 28,436,613 | 20,937,407 | 1,114 |
Health Care | 12,790,111 | 2,762,125 | 10,027,986 | - |
Industrials | 41,785,771 | 15,174,326 | 26,611,445 | - |
Information Technology | 30,042,421 | 5,718,390 | 24,324,031 | - |
Materials | 23,803,188 | 14,536,564 | 9,266,624 | - |
Real Estate | 557,142 | 103,552 | 453,590 | - |
Utilities | 737,823 | 737,823 | - | - |
|
| Money Market Funds | 5,183,982 | 5,183,982 | - | - |
| Total Investments in Securities: | 222,709,378 | 91,150,715 | 131,250,389 | 308,274 |
| Statement of Assets and Liabilities |
| | | | October 31, 2023 |
| | | | | |
| Assets | | | | |
| Investment in securities, at value (including securities loaned of $19,548) - See accompanying schedule: | | | | |
Unaffiliated issuers (cost $203,542,506) | $ | 217,525,396 | | |
Fidelity Central Funds (cost $5,183,979) | | 5,183,982 | | |
| | | | | |
| | | | | |
| Total Investment in Securities (cost $208,726,485) | | | $ | 222,709,378 |
| Foreign currency held at value (cost $49,686) | | | | 49,589 |
| Receivable for investments sold | | | | 666,552 |
| Receivable for fund shares sold | | | | 212,961 |
| Dividends receivable | | | | 450,177 |
| Reclaims receivable | | | | 241,688 |
| Interest receivable | | | | 220 |
| Distributions receivable from Fidelity Central Funds | | | | 23,130 |
| Prepaid expenses | | | | 332 |
| Receivable from investment adviser for expense reductions | | | | 29,889 |
| Other receivables | | | | 18,671 |
Total assets | | | | 224,402,587 |
| Liabilities | | | | |
| Payable to custodian bank | $ | 349,535 | | |
| Payable for investments purchased | | 639,387 | | |
| Payable for fund shares redeemed | | 262,659 | | |
| Accrued management fee | | 133,632 | | |
| Distribution and service plan fees payable | | 10,528 | | |
| Other affiliated payables | | 40,283 | | |
| Deferred taxes | | 163,089 | | |
| Other payables and accrued expenses | | 80,224 | | |
| Collateral on securities loaned | | 21,697 | | |
| Total Liabilities | | | | 1,701,034 |
| Net Assets | | | $ | 222,701,553 |
| Net Assets consist of: | | | | |
| Paid in capital | | | $ | 217,254,808 |
| Total accumulated earnings (loss) | | | | 5,446,745 |
| Net Assets | | | $ | 222,701,553 |
| | | | | |
| Net Asset Value and Maximum Offering Price | | | | |
| Class A : | | | | |
Net Asset Value and redemption price per share ($17,342,850 ÷ 1,814,623 shares)(a) | | | $ | 9.56 |
| Maximum offering price per share (100/94.25 of $9.56) | | | $ | 10.14 |
| Class M : | | | | |
Net Asset Value and redemption price per share ($10,624,256 ÷ 1,104,868 shares)(a) | | | $ | 9.62 |
| Maximum offering price per share (100/96.50 of $9.62) | | | $ | 9.97 |
| Class C : | | | | |
Net Asset Value and offering price per share ($2,474,799 ÷ 259,720 shares)(a) | | | $ | 9.53 |
| Total International Equity : | | | | |
Net Asset Value, offering price and redemption price per share ($108,560,514 ÷ 11,303,597 shares) | | | $ | 9.60 |
| Class I : | | | | |
Net Asset Value, offering price and redemption price per share ($57,298,511 ÷ 5,990,936 shares) | | | $ | 9.56 |
| Class Z : | | | | |
Net Asset Value, offering price and redemption price per share ($26,400,623 ÷ 2,742,410 shares) | | | $ | 9.63 |
(a)Redemption price per share is equal to net asset value less any applicable contingent deferred sales charge. |
| Statement of Operations |
| | | | Year ended October 31, 2023 |
| Investment Income | | | | |
| Dividends | | | $ | 5,782,107 |
| Non-Cash dividends | | | | 290,960 |
| Interest | | | | 336 |
| Income from Fidelity Central Funds (including $16,776 from security lending) | | | | 295,196 |
| Income before foreign taxes withheld | | | $ | 6,368,599 |
| Less foreign taxes withheld | | | | (552,583) |
| Total Income | | | | 5,816,016 |
| Expenses | | | | |
| Management fee | | | | |
| Basic fee | $ | 1,491,966 | | |
| Performance adjustment | | 146,708 | | |
| Transfer agent fees | | 377,468 | | |
| Distribution and service plan fees | | 127,139 | | |
| Accounting fees | | 110,127 | | |
| Custodian fees and expenses | | 103,713 | | |
| Independent trustees' fees and expenses | | 1,141 | | |
| Registration fees | | 91,641 | | |
| Audit | | 94,776 | | |
| Legal | | 1,801 | | |
| Miscellaneous | | 785 | | |
| Total expenses before reductions | | 2,547,265 | | |
| Expense reductions | | (140,538) | | |
| Total expenses after reductions | | | | 2,406,727 |
| Net Investment income (loss) | | | | 3,409,289 |
| Realized and Unrealized Gain (Loss) | | | | |
| Net realized gain (loss) on: | | | | |
| Investment Securities: | | | | |
| Unaffiliated issuers (net of foreign taxes of $134,221) | | (5,183,625) | | |
| Foreign currency transactions | | (52,665) | | |
| Total net realized gain (loss) | | | | (5,236,290) |
| Change in net unrealized appreciation (depreciation) on: | | | | |
| Investment Securities: | | | | |
| Unaffiliated issuers(net of increase in deferred foreign taxes of $7,031) | | 20,067,579 | | |
| Fidelity Central Funds | | (1) | | |
| Assets and liabilities in foreign currencies | | 13,226 | | |
| Total change in net unrealized appreciation (depreciation) | | | | 20,080,804 |
| Net gain (loss) | | | | 14,844,514 |
| Net increase (decrease) in net assets resulting from operations | | | $ | 18,253,803 |
| Statement of Changes in Net Assets |
| |
| | Year ended October 31, 2023 | | Year ended October 31, 2022 |
| Increase (Decrease) in Net Assets | | | | |
| Operations | | | | |
| Net investment income (loss) | $ | 3,409,289 | $ | 2,446,814 |
| Net realized gain (loss) | | (5,236,290) | | (5,086,496) |
| Change in net unrealized appreciation (depreciation) | | 20,080,804 | | (39,932,764) |
| Net increase (decrease) in net assets resulting from operations | | 18,253,803 | | (42,572,446) |
| Distributions to shareholders | | (1,806,040) | | (9,629,532) |
| | | | | |
| Share transactions - net increase (decrease) | | 52,136,162 | | 88,690,287 |
| Total increase (decrease) in net assets | | 68,583,925 | | 36,488,309 |
| | | | | |
| Net Assets | | | | |
| Beginning of period | | 154,117,628 | | 117,629,319 |
| End of period | $ | 222,701,553 | $ | 154,117,628 |
| | | | | |
| | | | | |
Financial Highlights
| Fidelity Advisor® Total International Equity Fund Class A |
| |
| Years ended October 31, | | 2023 | | 2022 | | 2021 | | 2020 | | 2019 |
Selected Per-Share Data | | | | | | | | | | |
| Net asset value, beginning of period | $ | 8.56 | $ | 12.48 | $ | 9.60 | $ | 9.34 | $ | 8.20 |
| Income from Investment Operations | | | | | | | | | | |
Net investment income (loss) A,B | | .13 | | .15 | | .11 C | | .05 | | .14 |
| Net realized and unrealized gain (loss) | | .95 | | (3.10) | | 3.03 | | .35 | | 1.05 |
| Total from investment operations | | 1.08 | | (2.95) | | 3.14 | | .40 | | 1.19 |
| Distributions from net investment income | | (.08) | | (.19) | | (.06) | | (.14) | | (.05) |
| Distributions from net realized gain | | - | | (.77) | | (.20) | | - | | - |
| Total distributions | | (.08) | | (.97) D | | (.26) | | (.14) | | (.05) |
| Net asset value, end of period | $ | 9.56 | $ | 8.56 | $ | 12.48 | $ | 9.60 | $ | 9.34 |
Total Return E,F | | 12.66% | | (25.44)% | | 33.04% | | 4.31% | | 14.63% |
Ratios to Average Net Assets A,G,H | | | | | | | | | | |
| Expenses before reductions | | 1.39% | | 1.56% | | 1.60% | | 1.66% | | 1.51% |
| Expenses net of fee waivers, if any | | 1.29% | | 1.30% | | 1.34% | | 1.39% | | 1.45% |
| Expenses net of all reductions | | 1.29% | | 1.30% | | 1.34% | | 1.37% | | 1.44% |
| Net investment income (loss) | | 1.33% | | 1.55% | | .91% C | | .58% | | 1.55% |
| Supplemental Data | | | | | | | | | | |
| Net assets, end of period (000 omitted) | $ | 17,343 | $ | 12,786 | $ | 8,642 | $ | 6,091 | $ | 7,249 |
Portfolio turnover rate I | | 28% | | 31% | | 39% | | 37% | | 69% |
ANet investment income (loss) is affected by the timing of the declaration of dividends by any underlying mutual funds or exchange-traded funds (ETFs). Net investment income (loss) of any mutual funds or ETFs is not included in the Fund's net investment income (loss) ratio.
BCalculated based on average shares outstanding during the period.
CNet investment income per share reflects one or more large, non-recurring dividend(s) which amounted to $.03 per share. Excluding such non-recurring dividend(s), the ratio of net investment income (loss) to average net assets would have been .64%.
DTotal distributions per share do not sum due to rounding.
ETotal returns would have been lower if certain expenses had not been reduced during the applicable periods shown.
FTotal returns do not include the effect of the sales charges.
GFees and expenses of any underlying mutual funds or exchange-traded funds (ETFs) are not included in the Fund's expense ratio. The Fund indirectly bears its proportionate share of these expenses. For additional expense information related to investments in Fidelity Central Funds, please refer to the "Investments in Fidelity Central Funds" note found in the Notes to Financial Statements section of the most recent Annual or Semi-Annual report.
HExpense ratios reflect operating expenses of the class. Expenses before reductions do not reflect amounts reimbursed, waived, or reduced through arrangements with the investment adviser, brokerage services, or other offset arrangements, if applicable, and do not represent the amount paid by the class during periods when reimbursements, waivers or reductions occur.
IAmount does not include the portfolio activity of any underlying mutual funds or exchange-traded funds (ETFs).
| Fidelity Advisor® Total International Equity Fund Class M |
| |
| Years ended October 31, | | 2023 | | 2022 | | 2021 | | 2020 | | 2019 |
Selected Per-Share Data | | | | | | | | | | |
| Net asset value, beginning of period | $ | 8.61 | $ | 12.53 | $ | 9.65 | $ | 9.38 | $ | 8.22 |
| Income from Investment Operations | | | | | | | | | | |
Net investment income (loss) A,B | | .11 | | .13 | | .08 C | | .03 | | .11 |
| Net realized and unrealized gain (loss) | | .95 | | (3.12) | | 3.04 | | .36 | | 1.07 |
| Total from investment operations | | 1.06 | | (2.99) | | 3.12 | | .39 | | 1.18 |
| Distributions from net investment income | | (.05) | | (.15) | | (.04) | | (.12) | | (.02) |
| Distributions from net realized gain | | - | | (.77) | | (.20) | | - | | - |
| Total distributions | | (.05) | | (.93) D | | (.24) | | (.12) | | (.02) |
| Net asset value, end of period | $ | 9.62 | $ | 8.61 | $ | 12.53 | $ | 9.65 | $ | 9.38 |
Total Return E,F | | 12.34% | | (25.59)% | | 32.63% | | 4.13% | | 14.38% |
Ratios to Average Net Assets B,G,H | | | | | | | | | | |
| Expenses before reductions | | 1.66% | | 1.80% | | 1.83% | | 1.90% | | 1.76% |
| Expenses net of fee waivers, if any | | 1.54% | | 1.55% | | 1.59% | | 1.64% | | 1.70% |
| Expenses net of all reductions | | 1.54% | | 1.55% | | 1.59% | | 1.62% | | 1.69% |
| Net investment income (loss) | | 1.09% | | 1.29% | | .65% C | | .33% | | 1.30% |
| Supplemental Data | | | | | | | | | | |
| Net assets, end of period (000 omitted) | $ | 10,624 | $ | 9,876 | $ | 12,936 | $ | 10,620 | $ | 11,733 |
Portfolio turnover rate I | | 28% | | 31% | | 39% | | 37% | | 69% |
ACalculated based on average shares outstanding during the period.
BNet investment income (loss) is affected by the timing of the declaration of dividends by any underlying mutual funds or exchange-traded funds (ETFs). Net investment income (loss) of any mutual funds or ETFs is not included in the Fund's net investment income (loss) ratio.
CNet investment income per share reflects one or more large, non-recurring dividend(s) which amounted to $.03 per share. Excluding such non-recurring dividend(s), the ratio of net investment income (loss) to average net assets would have been .38%.
DTotal distributions per share do not sum due to rounding.
ETotal returns would have been lower if certain expenses had not been reduced during the applicable periods shown.
FTotal returns do not include the effect of the sales charges.
GFees and expenses of any underlying mutual funds or exchange-traded funds (ETFs) are not included in the Fund's expense ratio. The Fund indirectly bears its proportionate share of these expenses. For additional expense information related to investments in Fidelity Central Funds, please refer to the "Investments in Fidelity Central Funds" note found in the Notes to Financial Statements section of the most recent Annual or Semi-Annual report.
HExpense ratios reflect operating expenses of the class. Expenses before reductions do not reflect amounts reimbursed, waived, or reduced through arrangements with the investment adviser, brokerage services, or other offset arrangements, if applicable, and do not represent the amount paid by the class during periods when reimbursements, waivers or reductions occur.
IAmount does not include the portfolio activity of any underlying mutual funds or exchange-traded funds (ETFs).
| Fidelity Advisor® Total International Equity Fund Class C |
| |
| Years ended October 31, | | 2023 | | 2022 | | 2021 | | 2020 | | 2019 |
Selected Per-Share Data | | | | | | | | | | |
| Net asset value, beginning of period | $ | 8.53 | $ | 12.41 | $ | 9.57 | $ | 9.30 | $ | 8.17 |
| Income from Investment Operations | | | | | | | | | | |
Net investment income (loss) A,B | | .06 | | .08 | | .02 C | | (.02) | | .07 |
| Net realized and unrealized gain (loss) | | .95 | | (3.11) | | 3.02 | | .36 | | 1.06 |
| Total from investment operations | | 1.01 | | (3.03) | | 3.04 | | .34 | | 1.13 |
| Distributions from net investment income | | (.01) | | (.07) | | - | | (.07) | | - |
| Distributions from net realized gain | | - | | (.77) | | (.20) | | - | | - |
| Total distributions | | (.01) | | (.85) D | | (.20) | | (.07) | | - |
| Net asset value, end of period | $ | 9.53 | $ | 8.53 | $ | 12.41 | $ | 9.57 | $ | 9.30 |
Total Return E,F | | 11.82% | | (26.04)% | | 32.00% | | 3.62% | | 13.83% |
Ratios to Average Net Assets B,G,H | | | | | | | | | | |
| Expenses before reductions | | 2.18% | | 2.34% | | 2.40% | | 2.46% | | 2.33% |
| Expenses net of fee waivers, if any | | 2.04% | | 2.05% | | 2.10% | | 2.14% | | 2.20% |
| Expenses net of all reductions | | 2.04% | | 2.05% | | 2.10% | | 2.12% | | 2.19% |
| Net investment income (loss) | | .58% | | .79% | | .15% C | | (.17)% | | .80% |
| Supplemental Data | | | | | | | | | | |
| Net assets, end of period (000 omitted) | $ | 2,475 | $ | 1,893 | $ | 1,982 | $ | 1,827 | $ | 2,203 |
Portfolio turnover rate I | | 28% | | 31% | | 39% | | 37% | | 69% |
ACalculated based on average shares outstanding during the period.
BNet investment income (loss) is affected by the timing of the declaration of dividends by any underlying mutual funds or exchange-traded funds (ETFs). Net investment income (loss) of any mutual funds or ETFs is not included in the Fund's net investment income (loss) ratio.
CNet investment income per share reflects one or more large, non-recurring dividend(s) which amounted to $.03 per share. Excluding such non-recurring dividend(s), the ratio of net investment income (loss) to average net assets would have been (.12)%.
DTotal distributions per share do not sum due to rounding.
ETotal returns would have been lower if certain expenses had not been reduced during the applicable periods shown.
FTotal returns do not include the effect of the contingent deferred sales charge.
GFees and expenses of any underlying mutual funds or exchange-traded funds (ETFs) are not included in the Fund's expense ratio. The Fund indirectly bears its proportionate share of these expenses. For additional expense information related to investments in Fidelity Central Funds, please refer to the "Investments in Fidelity Central Funds" note found in the Notes to Financial Statements section of the most recent Annual or Semi-Annual report.
HExpense ratios reflect operating expenses of the class. Expenses before reductions do not reflect amounts reimbursed, waived, or reduced through arrangements with the investment adviser, brokerage services, or other offset arrangements, if applicable, and do not represent the amount paid by the class during periods when reimbursements, waivers or reductions occur.
IAmount does not include the portfolio activity of any underlying mutual funds or exchange-traded funds (ETFs).
| Fidelity® Total International Equity Fund |
| |
| Years ended October 31, | | 2023 | | 2022 | | 2021 | | 2020 | | 2019 |
Selected Per-Share Data | | | | | | | | | | |
| Net asset value, beginning of period | $ | 8.60 | $ | 12.54 | $ | 9.64 | $ | 9.37 | $ | 8.23 |
| Income from Investment Operations | | | | | | | | | | |
Net investment income (loss) A,B | | .16 | | .18 | | .14 C | | .08 | | .16 |
| Net realized and unrealized gain (loss) | | .94 | | (3.12) | | 3.04 | | .35 | | 1.06 |
| Total from investment operations | | 1.10 | | (2.94) | | 3.18 | | .43 | | 1.22 |
| Distributions from net investment income | | (.10) | | (.23) | | (.08) | | (.16) | | (.08) |
| Distributions from net realized gain | | - | | (.77) | | (.20) | | - | | - |
| Total distributions | | (.10) | | (1.00) | | (.28) | | (.16) | | (.08) |
| Net asset value, end of period | $ | 9.60 | $ | 8.60 | $ | 12.54 | $ | 9.64 | $ | 9.37 |
Total Return D | | 12.80% | | (25.25)% | | 33.37% | | 4.65% | | 14.97% |
Ratios to Average Net Assets B,E,F | | | | | | | | | | |
| Expenses before reductions | | 1.11% | | 1.23% | | 1.27% | | 1.34% | | 1.20% |
| Expenses net of fee waivers, if any | | 1.04% | | 1.05% | | 1.09% | | 1.14% | | 1.20% |
| Expenses net of all reductions | | 1.04% | | 1.05% | | 1.09% | | 1.12% | | 1.19% |
| Net investment income (loss) | | 1.58% | | 1.79% | | 1.16% C | | .83% | | 1.81% |
| Supplemental Data | | | | | | | | | | |
| Net assets, end of period (000 omitted) | $ | 108,561 | $ | 86,458 | $ | 82,604 | $ | 61,362 | $ | 70,251 |
Portfolio turnover rate G | | 28% | | 31% | | 39% | | 37% | | 69% |
ACalculated based on average shares outstanding during the period.
BNet investment income (loss) is affected by the timing of the declaration of dividends by any underlying mutual funds or exchange-traded funds (ETFs). Net investment income (loss) of any mutual funds or ETFs is not included in the Fund's net investment income (loss) ratio.
CNet investment income per share reflects one or more large, non-recurring dividend(s) which amounted to $.03 per share. Excluding such non-recurring dividend(s), the ratio of net investment income (loss) to average net assets would have been .89%.
DTotal returns would have been lower if certain expenses had not been reduced during the applicable periods shown.
EFees and expenses of any underlying mutual funds or exchange-traded funds (ETFs) are not included in the Fund's expense ratio. The Fund indirectly bears its proportionate share of these expenses. For additional expense information related to investments in Fidelity Central Funds, please refer to the "Investments in Fidelity Central Funds" note found in the Notes to Financial Statements section of the most recent Annual or Semi-Annual report.
FExpense ratios reflect operating expenses of the class. Expenses before reductions do not reflect amounts reimbursed, waived, or reduced through arrangements with the investment adviser, brokerage services, or other offset arrangements, if applicable, and do not represent the amount paid by the class during periods when reimbursements, waivers or reductions occur.
GAmount does not include the portfolio activity of any underlying mutual funds or exchange-traded funds (ETFs).
| Fidelity Advisor® Total International Equity Fund Class I |
| |
| Years ended October 31, | | 2023 | | 2022 | | 2021 | | 2020 | | 2019 |
Selected Per-Share Data | | | | | | | | | | |
| Net asset value, beginning of period | $ | 8.56 | $ | 12.49 | $ | 9.60 | $ | 9.35 | $ | 8.19 |
| Income from Investment Operations | | | | | | | | | | |
Net investment income (loss) A,B | | .16 | | .17 | | .14 C | | .08 | | .16 |
| Net realized and unrealized gain (loss) | | .94 | | (3.10) | | 3.03 | | .34 | | 1.07 |
| Total from investment operations | | 1.10 | | (2.93) | | 3.17 | | .42 | | 1.23 |
| Distributions from net investment income | | (.10) | | (.23) | | (.08) | | (.17) | | (.07) |
| Distributions from net realized gain | | - | | (.77) | | (.20) | | - | | - |
| Total distributions | | (.10) | | (1.00) | | (.28) | | (.17) | | (.07) |
| Net asset value, end of period | $ | 9.56 | $ | 8.56 | $ | 12.49 | $ | 9.60 | $ | 9.35 |
Total Return D | | 12.86% | | (25.28)% | | 33.40% | | 4.50% | | 15.11% |
Ratios to Average Net Assets B,E,F | | | | | | | | | | |
| Expenses before reductions | | 1.09% | | 1.22% | | 1.26% | | 1.33% | | 1.18% |
| Expenses net of fee waivers, if any | | 1.04% | | 1.04% | | 1.06% | | 1.14% | | 1.18% |
| Expenses net of all reductions | | 1.04% | | 1.04% | | 1.06% | | 1.13% | | 1.17% |
| Net investment income (loss) | | 1.58% | | 1.80% | | 1.18% C | | .82% | | 1.82% |
| Supplemental Data | | | | | | | | | | |
| Net assets, end of period (000 omitted) | $ | 57,299 | $ | 35,423 | $ | 5,714 | $ | 2,073 | $ | 3,086 |
Portfolio turnover rate G | | 28% | | 31% | | 39% | | 37% | | 69% |
ACalculated based on average shares outstanding during the period.
BNet investment income (loss) is affected by the timing of the declaration of dividends by any underlying mutual funds or exchange-traded funds (ETFs). Net investment income (loss) of any mutual funds or ETFs is not included in the Fund's net investment income (loss) ratio.
CNet investment income per share reflects one or more large, non-recurring dividend(s) which amounted to $.03 per share. Excluding such non-recurring dividend(s), the ratio of net investment income (loss) to average net assets would have been .91%.
DTotal returns would have been lower if certain expenses had not been reduced during the applicable periods shown.
EFees and expenses of any underlying mutual funds or exchange-traded funds (ETFs) are not included in the Fund's expense ratio. The Fund indirectly bears its proportionate share of these expenses. For additional expense information related to investments in Fidelity Central Funds, please refer to the "Investments in Fidelity Central Funds" note found in the Notes to Financial Statements section of the most recent Annual or Semi-Annual report.
FExpense ratios reflect operating expenses of the class. Expenses before reductions do not reflect amounts reimbursed, waived, or reduced through arrangements with the investment adviser, brokerage services, or other offset arrangements, if applicable, and do not represent the amount paid by the class during periods when reimbursements, waivers or reductions occur.
GAmount does not include the portfolio activity of any underlying mutual funds or exchange-traded funds (ETFs).
| Fidelity Advisor® Total International Equity Fund Class Z |
| |
| Years ended October 31, | | 2023 | | 2022 | | 2021 | | 2020 | | 2019 |
Selected Per-Share Data | | | | | | | | | | |
| Net asset value, beginning of period | $ | 8.61 | $ | 12.53 | $ | 9.62 | $ | 9.36 | $ | 8.22 |
| Income from Investment Operations | | | | | | | | | | |
Net investment income (loss) A,B | | .17 | | .19 | | .16 C | | .09 | | .18 |
| Net realized and unrealized gain (loss) | | .95 | | (3.11) | | 3.03 | | .35 | | 1.05 |
| Total from investment operations | | 1.12 | | (2.92) | | 3.19 | | .44 | | 1.23 |
| Distributions from net investment income | | (.10) | | (.23) | | (.08) | | (.18) | | (.09) |
| Distributions from net realized gain | | - | | (.77) | | (.20) | | - | | - |
| Total distributions | | (.10) | | (1.00) | | (.28) | | (.18) | | (.09) |
| Net asset value, end of period | $ | 9.63 | $ | 8.61 | $ | 12.53 | $ | 9.62 | $ | 9.36 |
Total Return D | | 13.04% | | (25.09)% | | 33.54% | | 4.74% | | 15.13% |
Ratios to Average Net Assets B,E,F | | | | | | | | | | |
| Expenses before reductions | | .95% | | 1.10% | | 1.16% | | 1.22% | | 1.09% |
| Expenses net of fee waivers, if any | | .89% | | .90% | | .94% | | .98% | | 1.04% |
| Expenses net of all reductions | | .89% | | .90% | | .94% | | .97% | | 1.03% |
| Net investment income (loss) | | 1.74% | | 1.94% | | 1.31% C | | .99% | | 1.97% |
| Supplemental Data | | | | | | | | | | |
| Net assets, end of period (000 omitted) | $ | 26,401 | $ | 7,681 | $ | 5,752 | $ | 3,422 | $ | 3,815 |
Portfolio turnover rate G | | 28% | | 31% | | 39% | | 37% | | 69% |
ACalculated based on average shares outstanding during the period.
BNet investment income (loss) is affected by the timing of the declaration of dividends by any underlying mutual funds or exchange-traded funds (ETFs). Net investment income (loss) of any mutual funds or ETFs is not included in the Fund's net investment income (loss) ratio.
CNet investment income per share reflects one or more large, non-recurring dividend(s) which amounted to $.03 per share. Excluding such non-recurring dividend(s), the ratio of net investment income (loss) to average net assets would have been 1.04%.
DTotal returns would have been lower if certain expenses had not been reduced during the applicable periods shown.
EFees and expenses of any underlying mutual funds or exchange-traded funds (ETFs) are not included in the Fund's expense ratio. The Fund indirectly bears its proportionate share of these expenses. For additional expense information related to investments in Fidelity Central Funds, please refer to the "Investments in Fidelity Central Funds" note found in the Notes to Financial Statements section of the most recent Annual or Semi-Annual report.
FExpense ratios reflect operating expenses of the class. Expenses before reductions do not reflect amounts reimbursed, waived, or reduced through arrangements with the investment adviser, brokerage services, or other offset arrangements, if applicable, and do not represent the amount paid by the class during periods when reimbursements, waivers or reductions occur.
GAmount does not include the portfolio activity of any underlying mutual funds or exchange-traded funds (ETFs).
For the period ended October 31, 2023
1. Organization.
Fidelity Total International Equity Fund (the Fund) is a fund of Fidelity Investment Trust (the Trust) and is authorized to issue an unlimited number of shares. The Trust is registered under the Investment Company Act of 1940, as amended (the 1940 Act), as an open-end management investment company organized as a Massachusetts business trust. The Fund offers Class A, Class M, Class C, Total International Equity, Class I and Class Z shares, each of which has equal rights as to assets and voting privileges. Class A, Class M, Class C, Class I and Class Z are Fidelity Advisor classes. Each class has exclusive voting rights with respect to matters that affect that class. Class C shares will automatically convert to Class A shares after a holding period of eight years from the initial date of purchase, with certain exceptions. The Fund's investments in emerging markets can be subject to social, economic, regulatory, and political uncertainties and can be extremely volatile.
2. Investments in Fidelity Central Funds.
Funds may invest in Fidelity Central Funds, which are open-end investment companies generally available only to other investment companies and accounts managed by the investment adviser and its affiliates. The Schedule of Investments lists any Fidelity Central Funds held as an investment as of period end, but does not include the underlying holdings of each Fidelity Central Fund. An investing fund indirectly bears its proportionate share of the expenses of the underlying Fidelity Central Funds.
Based on its investment objective, each Fidelity Central Fund may invest or participate in various investment vehicles or strategies that are similar to those of the investing fund. These strategies are consistent with the investment objectives of the investing fund and may involve certain economic risks which may cause a decline in value of each of the Fidelity Central Funds and thus a decline in the value of the investing fund.
| Fidelity Central Fund | Investment Manager | Investment Objective | Investment Practices | Expense RatioA |
| Fidelity Money Market Central Funds | Fidelity Management & Research Company LLC (FMR) | Each fund seeks to obtain a high level of current income consistent with the preservation of capital and liquidity. | Short-term Investments | Less than .005% |
A Expenses expressed as a percentage of average net assets and are as of each underlying Central Fund's most recent annual or semi-annual shareholder report.
A complete unaudited list of holdings for each Fidelity Central Fund is available upon request or at the Securities and Exchange Commission website at www.sec.gov. In addition, the financial statements of the Fidelity Central Funds which contain the significant accounting policies (including investment valuation policies) of those funds, and are not covered by the Report of Independent Registered Public Accounting Firm, are available on the Securities and Exchange Commission website or upon request.
3. Significant Accounting Policies.
The Fund is an investment company and applies the accounting and reporting guidance of the Financial Accounting Standards Board (FASB) Accounting Standards Codification Topic 946 Financial Services - Investment Companies. The financial statements have been prepared in conformity with accounting principles generally accepted in the United States of America (GAAP), which require management to make certain estimates and assumptions at the date of the financial statements. Actual results could differ from those estimates. Subsequent events, if any, through the date that the financial statements were issued have been evaluated in the preparation of the financial statements. The Fund's Schedule of Investments lists any underlying mutual funds or exchange-traded funds (ETFs) but does not include the underlying holdings of these funds. The following summarizes the significant accounting policies of the Fund:
Investment Valuation. Investments are valued as of 4:00 p.m. Eastern time on the last calendar day of the period. The Board of Trustees (the Board) has designated the Fund's investment adviser as the valuation designee responsible for the fair valuation function and performing fair value determinations as needed. The investment adviser has established a Fair Value Committee (the Committee) to carry out the day-to-day fair valuation responsibilities and has adopted policies and procedures to govern the fair valuation process and the activities of the Committee. In accordance with these fair valuation policies and procedures, which have been approved by the Board, the Fund attempts to obtain prices from one or more third party pricing services or brokers to value its investments. When current market prices, quotations or currency exchange rates are not readily available or reliable, investments will be fair valued in good faith by the Committee, in accordance with the policies and procedures. Factors used in determining fair value vary by investment type and may include market or investment specific events, transaction data, estimated cash flows, and market observations of comparable investments. The frequency that the fair valuation procedures are used cannot be predicted and they may be utilized to a significant extent. The Committee manages the Fund's fair valuation practices and maintains the fair valuation policies and procedures. The Fund's investment adviser reports to the Board information regarding the fair valuation process and related material matters.
The Fund categorizes the inputs to valuation techniques used to value its investments into a disclosure hierarchy consisting of three levels as shown below:
Level 1 - unadjusted quoted prices in active markets for identical investments
Level 2 - other significant observable inputs (including quoted prices for similar investments, interest rates, prepayment speeds, etc.)
Level 3 - unobservable inputs (including the Fund's own assumptions based on the best information available)
Valuation techniques used to value the Fund's investments by major category are as follows:
Equity securities, including restricted securities, for which market quotations are readily available, are valued at the last reported sale price or official closing price as reported by a third party pricing service on the primary market or exchange on which they are traded and are categorized as Level 1 in the hierarchy. In the event there were no sales during the day or closing prices are not available, securities are valued at the last quoted bid price or may be valued using the last available price and are generally categorized as Level 2 in the hierarchy. For foreign equity securities, when market or security specific events arise, comparisons to the valuation of American Depositary Receipts (ADRs), futures contracts, ETFs and certain indexes as well as quoted prices for similar securities may be used and would be categorized as Level 2 in the hierarchy. For equity securities, including restricted securities, where observable inputs are limited, assumptions about market activity and risk are used and these securities may be categorized as Level 3 in the hierarchy.
Investments in open-end mutual funds ,including the Fidelity Central Funds, are valued at their closing net asset value (NAV) each business day and are categorized as Level 1 in the hierarchy.
Changes in valuation techniques may result in transfers in or out of an assigned level within the disclosure hierarchy. The aggregate value of investments by input level as of October 31, 2023 is included at the end of the Fund's Schedule of Investments.
Foreign Currency. Certain Funds may use foreign currency contracts to facilitate transactions in foreign-denominated securities. Gains and losses from these transactions may arise from changes in the value of the foreign currency or if the counterparties do not perform under the contracts' terms.
Foreign-denominated assets, including investment securities, and liabilities are translated into U.S. dollars at the exchange rates at period end. Purchases and sales of investment securities, income and dividends received, and expenses denominated in foreign currencies are translated into U.S. dollars at the exchange rate in effect on the transaction date.
The effects of exchange rate fluctuations on investments are included with the net realized and unrealized gain (loss) on investment securities. Other foreign currency transactions resulting in realized and unrealized gain (loss) are disclosed separately.
Investment Transactions and Income. For financial reporting purposes, the Fund's investment holdings and NAV include trades executed through the end of the last business day of the period. The NAV per share for processing shareholder transactions is calculated as of the close of business of the New York Stock Exchange (NYSE), normally 4:00 p.m. Eastern time and includes trades executed through the end of the prior business day. Gains and losses on securities sold are determined on the basis of identified cost and include proceeds received from litigation. Commissions paid to certain brokers with whom the investment adviser, or its affiliates, places trades on behalf of a fund include an amount in addition to trade execution, which may be rebated back to a fund. Any such rebates are included in net realized gain (loss) on investments in the Statement of Operations. Dividend income is recorded on the ex-dividend date, except for certain dividends from foreign securities where the ex-dividend date may have passed, which are recorded as soon as the Fund is informed of the ex-dividend date. Non-cash dividends included in dividend income, if any, are recorded at the fair market value of the securities received. Income and capital gain distributions from Fidelity Central Funds, if any, are recorded on the ex-dividend date. Certain distributions received by the Fund represent a return of capital or capital gain. The Fund determines the components of these distributions subsequent to the ex-dividend date, based upon receipt of tax filings or other correspondence relating to the underlying investment. These distributions are recorded as a reduction of cost of investments and/or as a realized gain. Interest income is accrued as earned and includes coupon interest and amortization of premium and accretion of discount on debt securities as applicable. Investment income is recorded net of foreign taxes withheld where recovery of such taxes is uncertain. Funds may file withholding tax reclaims in certain jurisdictions to recover a portion of amounts previously withheld. Any withholding tax reclaims income is included in the Statement of Operations in foreign taxes withheld. Any receivables for withholding tax reclaims are included in the Statement of Assets and Liabilities in reclaims receivable.
Class Allocations and Expenses. Investment income, realized and unrealized capital gains and losses, common expenses of a fund, and certain fund-level expense reductions, if any, are allocated daily on a pro-rata basis to each class based on the relative net assets of each class to the total net assets of a fund. Each class differs with respect to transfer agent and distribution and service plan fees incurred, as applicable. Certain expense reductions may also differ by class, if applicable. For the reporting period, the allocated portion of income and expenses to each class as a percent of its average net assets may vary due to the timing of recording these transactions in relation to fluctuating net assets of the classes. Expenses directly attributable to a fund are charged to that fund. Expenses attributable to more than one fund are allocated among the respective funds on the basis of relative net assets or other appropriate methods. Expenses included in the accompanying financial statements reflect the expenses of that fund and do not include any expenses associated with any underlying mutual funds or exchange-traded funds (ETFs). Although not included in a fund's expenses, a fund indirectly bears its proportionate share of these expenses through the net asset value of each underlying mutual fund or exchange-traded fund (ETF). Expense estimates are accrued in the period to which they relate and adjustments are made when actual amounts are known.
Income Tax Information and Distributions to Shareholders. Each year, the Fund intends to qualify as a regulated investment company under Subchapter M of the Internal Revenue Code, including distributing substantially all of its taxable income and realized gains. As a result, no provision for U.S. Federal income taxes is required. As of October 31, 2023, the Fund did not have any unrecognized tax benefits in the financial statements; nor is the Fund aware of any tax positions for which it is reasonably possible that the total amounts of unrecognized tax benefits will significantly change in the next twelve months. The Fund files a U.S. federal tax return, in addition to state and local tax returns as required. The Fund's federal income tax returns are subject to examination by the Internal Revenue Service (IRS) for a period of three fiscal years after they are filed. State and local tax returns may be subject to examination for an additional fiscal year depending on the jurisdiction. Foreign taxes are provided for based on the Fund's understanding of the tax rules and rates that exist in the foreign markets in which it invests. The Fund is subject to a tax imposed on capital gains by certain countries in which it invests. An estimated deferred tax liability for net unrealized appreciation on the applicable securities is included in Deferred taxes on the Statement of Assets & Liabilities.
Distributions are declared and recorded on the ex-dividend date. Income and capital gain distributions are declared separately for each class. Income and capital gain distributions are determined in accordance with income tax regulations, which may differ from GAAP. In addition, the Fund claimed a portion of the payment made to redeeming shareholders as a distribution for income tax purposes.
Capital accounts within the financial statements are adjusted for permanent book-tax differences. These adjustments have no impact on net assets or the results of operations. Capital accounts are not adjusted for temporary book-tax differences which will reverse in a subsequent period.
Book-tax differences are primarily due to foreign currency transactions, certain foreign taxes, passive foreign investment companies (PFIC), capital loss carryforwards and losses deferred due to wash sales.
As of period end, the cost and unrealized appreciation (depreciation) in securities, and derivatives if applicable, for federal income tax purposes were as follows:
| Gross unrealized appreciation | $32,352,636 |
| Gross unrealized depreciation | (21,223,267) |
| Net unrealized appreciation (depreciation) | $11,129,369 |
| Tax Cost | $211,580,009 |
The tax-based components of distributable earnings as of period end were as follows:
| Undistributed ordinary income | $2,966,779 |
| Capital loss carryforward | $(8,472,046) |
| Net unrealized appreciation (depreciation) on securities and other investments | $11,115,101 |
Capital loss carryforwards are only available to offset future capital gains of the Fund to the extent provided by regulations and may be limited. The capital loss carryforward information presented below, including any applicable limitation, is estimated as of fiscal period end and is subject to adjustment.
Short-term | $(4,386,318) |
Long-term | (4,085,728) |
| Total capital loss carryforward | $(8,472,046) |
The tax character of distributions paid was as follows:
| | October 31, 2023 | October 31, 2022 |
| Ordinary Income | $1,806,040 | $2,799,884 |
| Long-term Capital Gains | - | 6,829,648 |
| Total | $1,806,040 | $9,629,532 |
Restricted Securities (including Private Placements). Funds may invest in securities that are subject to legal or contractual restrictions on resale. These securities generally may be resold in transactions exempt from registration or to the public if the securities are registered. Disposal of these securities may involve time-consuming negotiations and expense, and prompt sale at an acceptable price may be difficult. Information regarding restricted securities held at period end is included at the end of the Schedule of Investments, if applicable.
4. Purchases and Sales of Investments.
Purchases and sales of securities, other than short-term securities and in-kind transactions, as applicable, are noted in the table below.
| | Purchases ($) | Sales ($) |
| Fidelity Total International Equity Fund | 113,724,355 | 59,312,362 |
5. Fees and Other Transactions with Affiliates.
Management Fee. Fidelity Management & Research Company LLC (the investment adviser) and its affiliates provide the Fund with investment management related services for which the Fund pays a monthly management fee. The management fee is the sum of an individual fund fee rate that is based on an annual rate of .45% of the Fund's average net assets and an annualized group fee rate that averaged .23% during the period. The group fee rate is based upon the monthly average net assets of a group of registered investment companies with which the investment adviser has management contracts. The group fee rate decreases as assets under management increase and increases as assets under management decrease. In addition, the management fee is subject to a performance adjustment (up to a maximum of +/- .20% of the Fund's average net assets over a 36 month performance period). The upward or downward adjustment to the management fee is based on the relative investment performance of Total International Equity as compared to its benchmark index, the MSCI All Country World ex USA Index, over the same 36 month performance period. For the reporting period, the total annual management fee rate, including the performance adjustment, was .74% of the Fund's average net assets. The performance adjustment included in the management fee rate may be higher or lower than the maximum performance adjustment rate due to the difference between the average net assets for the reporting and performance periods.
Distribution and Service Plan Fees. In accordance with Rule 12b-1 of the 1940 Act, the Fund has adopted separate Distribution and Service Plans for each class of shares. Certain classes pay Fidelity Distributors Company LLC (FDC), an affiliate of the investment adviser, separate Distribution and Service Fees, each of which is based on an annual percentage of each class' average net assets. In addition, FDC may pay financial intermediaries for selling shares of the Fund and providing shareholder support services. For the period, the Distribution and Service Fee rates, total fees and amounts retained by FDC were as follows:
| | Distribution Fee | Service Fee | Total Fees | Retained by FDC |
| Class A | -% | .25% | $45,677 | $2,148 |
| Class M | .25% | .25% | 56,338 | 161 |
| Class C | .75% | .25% | 25,124 | 7,279 |
| | | | $127,139 | $9,588 |
Sales Load. FDC may receive a front-end sales charge of up to 5.75% for selling Class A shares and 3.50% for selling Class M shares, some of which is paid to financial intermediaries for selling shares of the Fund. Depending on the holding period, FDC may receive contingent deferred sales charges levied on Class A, Class M and Class C redemptions. The deferred sales charges are 1.00% for Class C shares, 1.00% for certain purchases of Class A shares and .25% for certain purchases of Class M shares.
For the period, sales charge amounts retained by FDC were as follows:
| | Retained by FDC |
| Class A | $7,879 |
| Class M | 493 |
Class CA | 151 |
| | $8,523 |
A When Class C shares are initially sold, FDC pays commissions from its own resources to financial intermediaries through which the sales are made.
Transfer Agent Fees. Fidelity Investments Institutional Operations Company LLC (FIIOC), an affiliate of the investment adviser, is the transfer, dividend disbursing and shareholder servicing agent for each class of the Fund. FIIOC receives account fees and asset-based fees that vary according to the account size and type of account of the shareholders of the respective classes of the Fund, except for Class Z. FIIOC receives an asset-based fee of Class Z's average net assets. FIIOC pays for typesetting, printing and mailing of shareholder reports, except proxy statements.
For the period, transfer agent fees for each class were as follows:
| | Amount | % of Class-Level Average Net Assets |
| Class A | $39,741 | .22 |
| Class M | 25,921 | .23 |
| Class C | 6,431 | .26 |
| Total International Equity | 201,785 | .18 |
| Class I | 95,141 | .17 |
| Class Z | 8,449 | .04 |
| | $377,468 | |
During November 2023, the Board approved a change in the transfer agent fees effective December 1, 2023 to a fixed annual rate of class-level average net assets as follows:
| | % of Class-Level Average Net Assets |
| Class A | 0.2000% |
| Class M | 0.2000% |
| Class C | 0.2000% |
| Total International Equity | 0.1875% |
| Class I | 0.1643% |
Accounting Fees. Fidelity Service Company, Inc. (FSC), an affiliate of the investment adviser, maintains the Fund's accounting records. The accounting fee is based on the level of average net assets for each month. For the period, the fees were equivalent to the following annual rates:
| | % of Average Net Assets |
| Fidelity Total International Equity Fund | .05 |
During November 2023, the Board approved a change in the accounting fees effective December 1, 2023 to a fixed annual rate of average net assets as follows:
| | % of Average Net Assets |
| Fidelity Total International Equity Fund | 0.0497% |
Brokerage Commissions. A portion of portfolio transactions were placed with brokerage firms which are affiliates of the investment adviser. Brokerage commissions are included in net realized gain (loss) and change in net unrealized appreciation (depreciation) in the Statement of Operations. The commissions paid to these affiliated firms were as follows:
| | Amount |
| Fidelity Total International Equity Fund | $263 |
Interfund Trades. Funds may purchase from or sell securities to other Fidelity Funds under procedures adopted by the Board. The procedures have been designed to ensure these interfund trades are executed in accordance with Rule 17a-7 of the 1940 Act. Any interfund trades are included within the respective purchases and sales amounts shown in the Purchases and Sales of Investments note. Interfund trades during the period are noted in the table below.
| | Purchases ($) | Sales ($) | Realized Gain (Loss) ($) |
| Fidelity Total International Equity Fund | 9,121,561 | 1,657,333 | (286,531) |
6. Committed Line of Credit.
Certain Funds participate with other funds managed by the investment adviser or an affiliate in a $4.25 billion credit facility (the "line of credit") to be utilized for temporary or emergency purposes to fund shareholder redemptions or for other short-term liquidity purposes. The participating funds have agreed to pay commitment fees on their pro-rata portion of the line of credit, which are reflected in Miscellaneous expenses on the Statement of Operations, and are listed below. During the period, there were no borrowings on this line of credit.
| | Amount |
| Fidelity Total International Equity Fund | $387 |
7. Security Lending.
Funds lend portfolio securities from time to time in order to earn additional income. Lending agents are used, including National Financial Services (NFS), an affiliate of the investment adviser. Pursuant to a securities lending agreement, NFS will receive a fee, which is capped at 9.9% of a fund's daily lending revenue, for its services as lending agent. A fund may lend securities to certain qualified borrowers, including NFS. On the settlement date of the loan, a fund receives collateral (in the form of U.S. Treasury obligations, letters of credit and/or cash) against the loaned securities and maintains collateral in an amount not less than 100% of the market value of the loaned securities during the period of the loan. The market value of the loaned securities is determined at the close of business of a fund and any additional required collateral is delivered to a fund on the next business day. A fund or borrower may terminate the loan at any time, and if the borrower defaults on its obligation to return the securities loaned because of insolvency or other reasons, a fund may apply collateral received from the borrower against the obligation. A fund may experience delays and costs in recovering the securities loaned. Any cash collateral received is invested in the Fidelity Securities Lending Cash Central Fund. Any loaned securities are identified as such in the Schedule of Investments, and the value of loaned securities and cash collateral at period end, as applicable, are presented in the Statement of Assets and Liabilities. Security lending income represents the income earned on investing cash collateral, less rebates paid to borrowers and any lending agent fees associated with the loan, plus any premium payments received for lending certain types of securities. Security lending income is presented in the Statement of Operations as a component of income from Fidelity Central Funds. Affiliated security lending activity, if any, was as follows:
| | Total Security Lending Fees Paid to NFS | Security Lending Income From Securities Loaned to NFS | Value of Securities Loaned to NFS at Period End |
| Fidelity Total International Equity Fund | $1,792 | $- | $- |
8. Expense Reductions.
The investment adviser contractually agreed to reimburse expenses of each class to the extent annual operating expenses exceeded certain levels of class-level average net assets as noted in the table below. This reimbursement will remain in place through February 28, 2025. Some expenses, for example the compensation of the independent Trustees, and certain miscellaneous expenses such as proxy and shareholder meeting expenses, are excluded from this reimbursement.
The following classes were in reimbursement during the period:
| | Expense Limitations | Reimbursement |
| Class A | 1.30% | $16,919 |
| Class M | 1.55% | 12,450 |
| Class C | 2.05% | 3,277 |
| Total International Equity | 1.05% | 62,187 |
| Class I | 1.05% | 20,688 |
| Class Z | .90% | 11,137 |
| | | $126,658 |
Through arrangements with the Fund's custodian and each class' transfer agent, credits realized as a result of certain uninvested cash balances were used to reduce the Fund's expenses. During the period, transfer agent credits reduced each class' expenses as noted in the table below.
| | Expense reduction |
| Class A | $88 |
| Class M | 233 |
| | $321 |
In addition, during the period the investment adviser or an affiliate reimbursed and/or waived a portion of fund-level operating expenses in the amount of $13,559.
9. Distributions to Shareholders.
Distributions to shareholders of each class were as follows:
| | Year ended October 31, 2023 | Year ended October 31, 2022 |
| Fidelity Total International Equity Fund | | |
| Distributions to shareholders | | |
| Class A | $136,043 | $682,772 |
| Class M | 60,649 | 954,432 |
| Class C | 1,760 | 136,202 |
| Total International Equity | 1,034,854 | 6,786,798 |
| Class I | 451,131 | 530,168 |
| Class Z | 121,603 | 539,160 |
Total | $1,806,040 | $9,629,532 |
10. Share Transactions.
Share transactions for each class were as follows and may contain in-kind transactions, automatic conversions between classes or exchanges between affiliated funds:
| | Shares | Shares | Dollars | Dollars |
| | Year ended October 31, 2023 | Year ended October 31, 2022 | Year ended October 31, 2023 | Year ended October 31, 2022 |
| Fidelity Total International Equity Fund | | | | |
| Class A | | | | |
| Shares sold | 883,201 | 888,736 | $8,694,442 | $8,539,920 |
| Reinvestment of distributions | 14,206 | 60,242 | 135,808 | 667,482 |
| Shares redeemed | (575,856) | (148,110) | (5,858,395) | (1,522,197) |
| Net increase (decrease) | 321,551 | 800,868 | $2,971,855 | $7,685,205 |
| Class M | | | | |
| Shares sold | 117,155 | 208,686 | $1,168,097 | $2,095,684 |
| Reinvestment of distributions | 6,291 | 85,446 | 60,649 | 954,432 |
| Shares redeemed | (165,757) | (179,080) | (1,635,862) | (1,802,328) |
| Net increase (decrease) | (42,311) | 115,052 | $(407,116) | $1,247,788 |
| Class C | | | | |
| Shares sold | 113,803 | 104,691 | $1,148,641 | $1,089,289 |
| Reinvestment of distributions | 183 | 12,220 | 1,757 | 135,883 |
| Shares redeemed | (76,111) | (54,762) | (745,659) | (553,236) |
| Net increase (decrease) | 37,875 | 62,149 | $404,739 | $671,936 |
| Total International Equity | | | | |
| Shares sold | 4,599,531 | 4,897,322 | $45,831,869 | $50,896,948 |
| Reinvestment of distributions | 97,973 | 561,002 | 939,562 | 6,227,120 |
| Shares redeemed | (3,448,548) | (1,992,599) | (34,371,636) | (19,350,338) |
| Net increase (decrease) | 1,248,956 | 3,465,725 | $12,399,795 | $37,773,730 |
| Class I | | | | |
| Shares sold | 3,922,899 | 4,463,099 | $39,216,121 | $43,483,713 |
| Reinvestment of distributions | 46,910 | 47,315 | 447,992 | 523,303 |
| Shares redeemed | (2,115,326) | (831,499) | (21,232,217) | (8,050,707) |
| Net increase (decrease) | 1,854,483 | 3,678,915 | $18,431,896 | $35,956,309 |
| Class Z | | | | |
| Shares sold | 2,772,393 | 1,300,267 | $27,649,951 | $12,980,304 |
| Reinvestment of distributions | 10,898 | 45,956 | 104,625 | 510,116 |
| Shares redeemed | (933,308) | (912,726) | (9,419,583) | (8,135,101) |
| Net increase (decrease) | 1,849,983 | 433,497 | $18,334,993 | $5,355,319 |
11. Other.
A fund's organizational documents provide former and current trustees and officers with a limited indemnification against liabilities arising in connection with the performance of their duties to the fund. In the normal course of business, a fund may also enter into contracts that provide general indemnifications. A fund's maximum exposure under these arrangements is unknown as this would be dependent on future claims that may be made against a fund. The risk of material loss from such claims is considered remote.
12. Risk and Uncertainties.
Many factors affect a fund's performance. Developments that disrupt global economies and financial markets, such as pandemics, epidemics, outbreaks of infectious diseases, war, terrorism, and environmental disasters, may significantly affect a fund's investment performance. The effects of these developments to a fund will be impacted by the types of securities in which a fund invests, the financial condition, industry, economic sector, and geographic location of an issuer, and a fund's level of investment in the securities of that issuer. Significant concentrations in security types, issuers, industries, sectors, and geographic locations may magnify the factors that affect a fund's performance.
To the Board of Trustees of Fidelity Investment Trust and the Shareholders of Fidelity Total International Equity Fund:
Opinion on the Financial Statements and Financial Highlights
We have audited the accompanying statement of assets and liabilities of Fidelity Total International Equity Fund (the "Fund"), a fund of Fidelity Investment Trust, including the schedule of investments, as of October 31, 2023, the related statement of operations for the year then ended, the statement of changes in net assets for each of the two years in the period then ended, the financial highlights for each of the five years in the period then ended, and the related notes. In our opinion, the financial statements and financial highlights present fairly, in all material respects, the financial position of the Fund as of October 31, 2023, and the results of its operations for the year then ended, the changes in its net assets for each of the two years in the period then ended, and the financial highlights for each of the five years in the period then ended in conformity with accounting principles generally accepted in the United States of America.
Basis for Opinion
These financial statements and financial highlights are the responsibility of the Fund's management. Our responsibility is to express an opinion on the Fund's financial statements and financial highlights based on our audits. We are a public accounting firm registered with the Public Company Accounting Oversight Board (United States) (PCAOB) and are required to be independent with respect to the Fund in accordance with the U.S. federal securities laws and the applicable rules and regulations of the Securities and Exchange Commission and the PCAOB.
We conducted our audits in accordance with the standards of the PCAOB. Those standards require that we plan and perform the audit to obtain reasonable assurance about whether the financial statements and financial highlights are free of material misstatement, whether due to error or fraud. The Fund is not required to have, nor were we engaged to perform, an audit of its internal control over financial reporting. As part of our audits we are required to obtain an understanding of internal control over financial reporting but not for the purpose of expressing an opinion on the effectiveness of the Fund's internal control over financial reporting. Accordingly, we express no such opinion.
Our audits included performing procedures to assess the risks of material misstatement of the financial statements and financial highlights, whether due to error or fraud, and performing procedures that respond to those risks. Such procedures included examining, on a test basis, evidence regarding the amounts and disclosures in the financial statements and financial highlights. Our audits also included evaluating the accounting principles used and significant estimates made by management, as well as evaluating the overall presentation of the financial statements and financial highlights. Our procedures included confirmation of securities owned as of October 31, 2023, by correspondence with the custodian and brokers; when replies were not received from brokers, we performed other auditing procedures. We believe that our audits provide a reasonable basis for our opinion.
/s/ Deloitte & Touche LLP
Boston, Massachusetts
December 14, 2023
We have served as the auditor of one or more of the Fidelity investment companies since 1999.
The Trustees, Members of the Advisory Board (if any), and officers of the trust and fund, as applicable, are listed below. The Board of Trustees governs the fund and is responsible for protecting the interests of shareholders. The Trustees are experienced executives who meet periodically throughout the year to oversee the fund's activities, review contractual arrangements with companies that provide services to the fund, oversee management of the risks associated with such activities and contractual arrangements, and review the fund's performance. Except for Jonathan Chiel, each of the Trustees oversees 322 funds. Mr. Chiel oversees 191 funds.
The Trustees hold office without limit in time except that (a) any Trustee may resign; (b) any Trustee may be removed by written instrument, signed by at least two-thirds of the number of Trustees prior to such removal; (c) any Trustee who requests to be retired or who has become incapacitated by illness or injury may be retired by written instrument signed by a majority of the other Trustees; and (d) any Trustee may be removed at any special meeting of shareholders by a two-thirds vote of the outstanding voting securities of the trust. Each Trustee who is not an interested person (as defined in the 1940 Act) of the trust and the fund is referred to herein as an Independent Trustee. Each Independent Trustee shall retire not later than the last day of the calendar year in which his or her 75th birthday occurs. The Independent Trustees may waive this mandatory retirement age policy with respect to individual Trustees. Officers and Advisory Board Members hold office without limit in time, except that any officer or Advisory Board Member may resign or may be removed by a vote of a majority of the Trustees at any regular meeting or any special meeting of the Trustees. Except as indicated, each individual has held the office shown or other offices in the same company for the past five years.
The fund's Statement of Additional Information (SAI) includes more information about the Trustees. To request a free copy, call Fidelity at 1-800-544-8544 if you're an individual investing directly with Fidelity, call 1-800-835-5092 if you're a plan sponsor or participant with Fidelity as your recordkeeper or call 1-877-208-0098 on institutional accounts or if you're an advisor or invest through one.
Experience, Skills, Attributes, and Qualifications of the Trustees. The Governance and Nominating Committee has adopted a statement of policy that describes the experience, qualifications, attributes, and skills that are necessary and desirable for potential Independent Trustee candidates (Statement of Policy). The Board believes that each Trustee satisfied at the time he or she was initially elected or appointed a Trustee, and continues to satisfy, the standards contemplated by the Statement of Policy. The Governance and Nominating Committee also engages professional search firms to help identify potential Independent Trustee candidates who have the experience, qualifications, attributes, and skills consistent with the Statement of Policy. From time to time, additional criteria based on the composition and skills of the current Independent Trustees, as well as experience or skills that may be appropriate in light of future changes to board composition, business conditions, and regulatory or other developments, have also been considered by the professional search firms and the Governance and Nominating Committee. In addition, the Board takes into account the Trustees' commitment and participation in Board and committee meetings, as well as their leadership of standing and ad hoc committees throughout their tenure.
In determining that a particular Trustee was and continues to be qualified to serve as a Trustee, the Board has considered a variety of criteria, none of which, in isolation, was controlling. The Board believes that, collectively, the Trustees have balanced and diverse experience, qualifications, attributes, and skills, which allow the Board to operate effectively in governing the fund and protecting the interests of shareholders. Information about the specific experience, skills, attributes, and qualifications of each Trustee, which in each case led to the Board's conclusion that the Trustee should serve (or continue to serve) as a trustee of the fund, is provided below.
Board Structure and Oversight Function. Robert A. Lawrence is an interested person and currently serves as Chair. The Trustees have determined that an interested Chair is appropriate and benefits shareholders because an interested Chair has a personal and professional stake in the quality and continuity of services provided to the fund. Independent Trustees exercise their informed business judgment to appoint an individual of their choosing to serve as Chair, regardless of whether the Trustee happens to be independent or a member of management. The Independent Trustees have determined that they can act independently and effectively without having an Independent Trustee serve as Chair and that a key structural component for assuring that they are in a position to do so is for the Independent Trustees to constitute a substantial majority for the Board. The Independent Trustees also regularly meet in executive session. David M. Thomas serves as Lead Independent Trustee and as such (i) acts as a liaison between the Independent Trustees and management with respect to matters important to the Independent Trustees and (ii) with management prepares agendas for Board meetings.
Fidelity® funds are overseen by different Boards of Trustees. The fund's Board oversees Fidelity's high income and certain equity funds, and other Boards oversee Fidelity's alternative investment, investment-grade bond, money market, asset allocation, and other equity funds. The asset allocation funds may invest in Fidelity® funds overseen by the fund's Board. The use of separate Boards, each with its own committee structure, allows the Trustees of each group of Fidelity® funds to focus on the unique issues of the funds they oversee, including common research, investment, and operational issues. On occasion, the separate Boards establish joint committees to address issues of overlapping consequences for the Fidelity® funds overseen by each Board.
The Trustees operate using a system of committees to facilitate the timely and efficient consideration of all matters of importance to the Trustees, the fund, and fund shareholders and to facilitate compliance with legal and regulatory requirements and oversight of the fund's activities and associated risks. The Board, acting through its committees, has charged FMR and its affiliates with (i) identifying events or circumstances the occurrence of which could have demonstrably adverse effects on the fund's business and/or reputation; (ii) implementing processes and controls to lessen the possibility that such events or circumstances occur or to mitigate the effects of such events or circumstances if they do occur; and (iii) creating and maintaining a system designed to evaluate continuously business and market conditions in order to facilitate the identification and implementation processes described in (i) and (ii) above. Because the day-to-day operations and activities of the fund are carried out by or through FMR, its affiliates, and other service providers, the fund's exposure to risks is mitigated but not eliminated by the processes overseen by the Trustees. While each of the Board's committees has responsibility for overseeing different aspects of the fund's activities, oversight is exercised primarily through the Operations, Audit, and Compliance Committees. Appropriate personnel, including but not limited to the fund's Chief Compliance Officer (CCO), FMR's internal auditor, the independent accountants, the fund's Treasurer and portfolio management personnel, make periodic reports to the Board's committees, as appropriate, including an annual review of Fidelity's risk management program for the Fidelity® funds. The responsibilities of each standing committee, including their oversight responsibilities, are described further under "Standing Committees of the Trustees."
Interested Trustees*:
Correspondence intended for a Trustee who is an interested person may be sent to Fidelity Investments, 245 Summer Street, Boston, Massachusetts 02210.
Name, Year of Birth; Principal Occupations and Other Relevant Experience+
Jonathan Chiel (1957)
Year of Election or Appointment: 2016
Trustee
Mr. Chiel also serves as Trustee of other Fidelity® funds. Mr. Chiel is General Counsel (2012-present) and Head of Legal, Risk and Compliance (2022-present). Mr Chiel serves as Executive Vice President and General Counsel for FMR LLC (diversified financial services company, 2012-present) and Director and President for OH Company LLC (holding company, 2018-present). Previously, Mr. Chiel served as general counsel (2004-2012) and senior vice president and deputy general counsel (2000-2004) for John Hancock Financial Services; a partner with Choate, Hall & Stewart (1996-2000) (law firm); and an Assistant United States Attorney for the United States Attorney's Office of the District of Massachusetts (1986-95), including Chief of the Criminal Division (1993-1995). Mr. Chiel is a director on the boards of the Boston Bar Foundation and the Maimonides School.
Bettina Doulton (1964)
Year of Election or Appointment: 2021
Trustee
Ms. Doulton also serves as Trustee of other Fidelity® funds. Prior to her retirement, Ms. Doulton served in a variety of positions at Fidelity Investments, including as a managing director of research (2006-2007), portfolio manager to certain Fidelity® funds (1993-2005), equity analyst and portfolio assistant (1990-1993), and research assistant (1987-1990). Ms. Doulton currently owns and operates Phi Builders + Architects and Cellardoor Winery. Previously, Ms. Doulton served as a member of the Board of Brown Capital Management, LLC (2014-2018).
Robert A. Lawrence (1952)
Year of Election or Appointment: 2020
Trustee
Chair of the Board of Trustees
Mr. Lawrence also serves as Trustee of other funds. Previously, Mr. Lawrence served as a Trustee and Member of the Advisory Board of certain funds. Prior to his retirement in 2008, Mr. Lawrence served as Vice President of certain Fidelity® funds (2006-2008), Senior Vice President, Head of High Income Division of Fidelity Management & Research Company (investment adviser firm, 2006-2008), and President of Fidelity Strategic Investments (investment adviser firm, 2002-2005).
* Determined to be an "Interested Trustee" by virtue of, among other things, his or her affiliation with the trust or various entities under common control with FMR.
+ The information includes the Trustee's principal occupation during the last five years and other information relating to the experience, attributes, and skills relevant to the Trustee's qualifications to serve as a Trustee, which led to the conclusion that the Trustee should serve as a Trustee for the fund.
Independent Trustees:
Correspondence intended for an Independent Trustee may be sent to Fidelity Investments, P.O. Box 55235, Boston, Massachusetts 02205-5235.
Name, Year of Birth; Principal Occupations and Other Relevant Experience+
Thomas P. Bostick (1956)
Year of Election or Appointment: 2021
Trustee
Lieutenant General Bostick also serves as Trustee of other Fidelity® funds. Prior to his retirement, General Bostick (United States Army, Retired) held a variety of positions within the U.S. Army, including Commanding General and Chief of Engineers, U.S. Army Corps of Engineers (2012-2016) and Deputy Chief of Staff and Director of Human Resources, U.S. Army (2009-2012). General Bostick currently serves as a member of the Board and Finance and Governance & Sustainability Committees of CSX Corporation (transportation, 2020-present) and a member of the Board and Corporate Governance and Nominating Committee of Perma-Fix Environmental Services, Inc. (nuclear waste management, 2020-present). General Bostick serves as Chief Executive Officer of Bostick Global Strategies, LLC (consulting, 2016-present), as a member of the Board of HireVue, Inc. (video interview and assessment, 2020-present), as a member of the Board of Allonnia (biotechnology and engineering solutions, 2022-present) and on the Advisory Board of Solugen, Inc. (specialty bio-based chemicals manufacturer, 2022-present). Previously, General Bostick served as a Member of the Advisory Board of certain Fidelity® funds (2021), President, Intrexon Bioengineering (2018-2020) and Chief Operating Officer (2017-2020) and Senior Vice President of the Environment Sector (2016-2017) of Intrexon Corporation (biopharmaceutical company).
Dennis J. Dirks (1948)
Year of Election or Appointment: 2005
Trustee
Mr. Dirks also serves as Trustee of other Fidelity® funds. Prior to his retirement in May 2003, Mr. Dirks served as Chief Operating Officer and as a member of the Board of The Depository Trust & Clearing Corporation (financial markets infrastructure), President, Chief Operating Officer and a member of the Board of The Depository Trust Company (DTC), President and a member of the Board of the National Securities Clearing Corporation (NSCC), Chief Executive Officer and a member of the Board of the Government Securities Clearing Corporation and Chief Executive Officer and a member of the Board of the Mortgage-Backed Securities Clearing Corporation. Mr. Dirks currently serves as a member of the Finance Committee (2016-present) and Board (2017-present) and is Treasurer (2018-present) of the Asolo Repertory Theatre.
Donald F. Donahue (1950)
Year of Election or Appointment: 2018
Trustee
Mr. Donahue also serves as Trustee of other Fidelity® funds. Mr. Donahue serves as President and Chief Executive Officer of Miranda Partners, LLC (risk consulting for the financial services industry, 2012-present). Previously, Mr. Donahue served as Chief Executive Officer (2006-2012), Chief Operating Officer (2003-2006) and Managing Director, Customer Marketing and Development (1999-2003) of The Depository Trust & Clearing Corporation (financial markets infrastructure). Mr. Donahue currently serves as a member (2007-present) and Co-Chairman (2016-present) of the Board of United Way of New York. Mr. Donahue previously served as a member of the Advisory Board of certain Fidelity® funds (2015-2018) and as a member of the Board of The Leadership Academy (previously NYC Leadership Academy) (2012-2022).
Vicki L. Fuller (1957)
Year of Election or Appointment: 2020
Trustee
Ms. Fuller also serves as Trustee of other Fidelity® funds. Previously, Ms. Fuller served as a member of the Advisory Board of certain Fidelity® funds (2018-2020), Chief Investment Officer of the New York State Common Retirement Fund (2012-2018) and held a variety of positions at AllianceBernstein L.P. (global asset management, 1985-2012), including Managing Director (2006-2012) and Senior Vice President and Senior Portfolio Manager (2001-2006). Ms. Fuller currently serves as a member of the Board, Audit Committee and Nominating and Governance Committee of two Blackstone business development companies (2020-present), as a member of the Board of Treliant, LLC (consulting, 2019-present), as a member of the Board of Ariel Alternatives, LLC (private equity, 2022-present) and as a member of the Board and Chair of the Audit Committee of Gusto, Inc. (software, 2021-present). In addition, Ms. Fuller currently serves as a member of the Board of Roosevelt University (2019-present) and as a member of the Executive Board of New York University's Stern School of Business. Ms. Fuller previously served as a member of the Board, Audit Committee and Nominating and Governance Committee of The Williams Companies, Inc. (natural gas infrastructure, 2018-2021).
Patricia L. Kampling (1959)
Year of Election or Appointment: 2020
Trustee
Ms. Kampling also serves as Trustee of other Fidelity® funds. Prior to her retirement, Ms. Kampling served as Chairman of the Board and Chief Executive Officer (2012-2019), President and Chief Operating Officer (2011-2012) and Executive Vice President and Chief Financial Officer (2010-2011) of Alliant Energy Corporation. Ms. Kampling currently serves as a member of the Board, Finance Committee and Governance, Compensation and Nominating Committee of Xcel Energy Inc. (utilities company, 2020-present) and as a member of the Board, Audit, Finance and Risk Committee and Safety, Environmental, Technology and Operations Committee and Chair of the Executive Development and Compensation Committee of American Water Works Company, Inc. (utilities company, 2019-present). In addition, Ms. Kampling currently serves as a member of the Board of the Nature Conservancy, Wisconsin Chapter (2019-present). Previously, Ms. Kampling served as a Member of the Advisory Board of certain Fidelity® funds (2020), a member of the Board, Compensation Committee and Executive Committee and Chair of the Audit Committee of Briggs & Stratton Corporation (manufacturing, 2011-2021), a member of the Board of Interstate Power and Light Company (2012-2019) and Wisconsin Power and Light Company (2012-2019) (each a subsidiary of Alliant Energy Corporation) and as a member of the Board and Workforce Development Committee of the Business Roundtable (2018-2019).
Thomas A. Kennedy (1955)
Year of Election or Appointment: 2021
Trustee
Mr. Kennedy also serves as Trustee of other Fidelity® funds. Previously, Mr. Kennedy served as a Member of the Advisory Board of certain Fidelity® funds (2020) and held a variety of positions at Raytheon Company (aerospace and defense, 1983-2020), including Chairman and Chief Executive Officer (2014-2020) and Executive Vice President and Chief Operating Officer (2013-2014). Mr. Kennedy served as Executive Chairman of the Board of Directors of Raytheon Technologies Corporation (aerospace and defense, 2020-2021). Mr. Kennedy serves as a Director of the Board of Directors of Textron Inc. (aerospace and defense, 2023-present).
Oscar Munoz (1959)
Year of Election or Appointment: 2021
Trustee
Mr. Munoz also serves as Trustee of other Fidelity® funds. Prior to his retirement, Mr. Munoz served as Executive Chairman (2020-2021), Chief Executive Officer (2015-2020), President (2015-2016) and a member of the Board (2010-2021) of United Airlines Holdings, Inc. Mr. Munoz currently serves as a member of the Board of CBRE Group, Inc. (commercial real estate, 2020-present), a member of the Board of Univision Communications, Inc. (Hispanic media, 2020-present), a member of the Board of Archer Aviation Inc. (2021-present), a member of the Defense Business Board of the United States Department of Defense (2021-present) and a member of the Board of Salesforce.com, Inc. (cloud-based software, 2022-present). Previously, Mr. Munoz served as a Member of the Advisory Board of certain Fidelity® funds (2021).
David M. Thomas (1949)
Year of Election or Appointment: 2008
Trustee
Lead Independent Trustee
Mr. Thomas also serves as Trustee of other Fidelity® funds. Previously, Mr. Thomas served as Executive Chairman (2005-2006) and Chairman and Chief Executive Officer (2000-2005) of IMS Health, Inc. (pharmaceutical and healthcare information solutions). Mr. Thomas currently serves as a member of the Board of Fortune Brands Home and Security (home and security products, 2004-present) and as Director (2013-present) and Non-Executive Chairman of the Board (2022-present) of Interpublic Group of Companies, Inc. (marketing communication).
Susan Tomasky (1953)
Year of Election or Appointment: 2020
Trustee
Ms. Tomasky also serves as Trustee of other Fidelity® funds. Prior to her retirement, Ms. Tomasky served in various executive officer positions at American Electric Power Company, Inc. (1998-2011), including most recently as President of AEP Transmission (2007-2011). Ms. Tomasky currently serves as a member of the Board and Sustainability Committee and as Chair of the Audit Committee of Marathon Petroleum Corporation (2018-present) and as a member of the Board, Executive Committee, Corporate Governance Committee and Organization and Compensation Committee and as Lead Director of the Board of Public Service Enterprise Group, Inc. (utilities company, 2012-present) and as a member of the Board of its subsidiary company, Public Service Electric and Gas Co. (2021-present). In addition, Ms. Tomasky currently serves as a member (2009-present) and President (2020-present) of the Board of the Royal Shakespeare Company - America (2009-present), as a member of the Board of the Columbus Association for the Performing Arts (2011-present) and as a member of the Board and Kenyon in the World Committee of Kenyon College (2016-present). Previously, Ms. Tomasky served as a Member of the Advisory Board of certain Fidelity® funds (2020), as a member of the Board of the Columbus Regional Airport Authority (2007-2020), as a member of the Board (2011-2018) and Lead Independent Director (2015-2018) of Andeavor Corporation (previously Tesoro Corporation) (independent oil refiner and marketer) and as a member of the Board of Summit Midstream Partners LP (energy, 2012-2018).
Michael E. Wiley (1950)
Year of Election or Appointment: 2020
Trustee
Mr. Wiley also serves as Trustee of other Fidelity® funds. Previously, Mr. Wiley served as a member of the Advisory Board of certain Fidelity® funds (2018-2020), Chairman, President and CEO of Baker Hughes, Inc. (oilfield services, 2000-2004). Mr. Wiley also previously served as a member of the Board of Andeavor Corporation (independent oil refiner and marketer, 2005-2018), a member of the Board of Andeavor Logistics LP (natural resources logistics, 2015-2018) and a member of the Board of High Point Resources (exploration and production, 2005-2020).
+ The information includes the Trustee's principal occupation during the last five years and other information relating to the experience, attributes, and skills relevant to the Trustee's qualifications to serve as a Trustee, which led to the conclusion that the Trustee should serve as a Trustee for the fund.
Advisory Board Members and Officers:
Correspondence intended for a Member of the Advisory Board (if any) may be sent to Fidelity Investments, P.O. Box 55235, Boston, Massachusetts 02205-5235. Correspondence intended for an officer or Peter S. Lynch may be sent to Fidelity Investments, 245 Summer Street, Boston, Massachusetts 02210.
Name, Year of Birth; Principal Occupation
Vijay C. Advani (1960)
Year of Election or Appointment: 2023
Member of the Advisory Board
Mr. Advani also serves as Trustee or Member of the Advisory Board of other funds. Previously, Mr. Advani served as Executive Chairman (2020-2022), Chief Executive Officer (2017-2020) and Chief Operating Officer (2016-2017) of Nuveen (global investment manager). He also served in various capacities at Franklin Resources (global investment manager), including Co-President (2015-2016), Executive Vice President, Global Advisory Services (2008-2015), Head of Global Retail Distribution (2005-2008), Executive Managing Director, International Retail Development (2002-2005), Managing Director, Product Developments, Sales & Marketing, Asia, Eastern Europe and Africa (2000-2002) and President, Templeton Asset Management India (1995-2000). Mr. Advani also served as Senior Investment Officer of International Finance Corporation (private equity and venture capital arm of The World Bank, 1984-1995). Mr. Advani is Chairman Emeritus of the U.S. India Business Council (2018-present), a Director of The Global Impact Investing Network (2019-present), a Director of LOK Capital (Mauritius) (2022-present), a member of the Advisory Council of LOK Capital (2022-present), a Senior Advisor of Neuberger Berman (2021-present), a Senior Advisor of Seviora Holdings Pte. Ltd (Temasek-Singapore) (2021-present), a Director of Seviora Capital (Singapore) (2021-present) and an Advisor of EQUIAM (2021-present). Mr. Advani formerly served as a member of the Board of BowX Acquisition Corp. (special purpose acquisition company, 2020-2021), a member of the Board of Intellecap (advisory arm of The Aavishkaar Group, 2018-2020), a member of the Board of Nuveen Investments, Inc. (2017-2020) and a member of the Board of Docusign (software, 2016-2019).
Peter S. Lynch (1944)
Year of Election or Appointment: 2003
Member of the Advisory Board
Mr. Lynch also serves as a Member of the Advisory Board of other Fidelity® funds. Mr. Lynch is Vice Chairman and a Director of Fidelity Management & Research Company LLC (investment adviser firm). In addition, Mr. Lynch serves as a Trustee of Boston College and as the Chairman of the Inner-City Scholarship Fund. Previously, Mr. Lynch served as Vice Chairman and a Director of FMR Co., Inc. (investment adviser firm) and on the Special Olympics International Board of Directors (1997-2006).
Karen B. Peetz (1955)
Year of Election or Appointment: 2023
Member of the Advisory Board
Ms. Peetz also serves as a Member of the Advisory Board of other funds. Previously, Ms. Peetz served as Chief Administration Officer (2020-2023) of Citigroup Inc. (a diversified financial service company). She also served in various capacities at Bank of New York Mellon Corporation, including President (2013-2016), Vice Chairman, Senior Executive Vice President and Chief Executive Officer of Financial Markets & Treasury Services (2010-2013), Senior Executive Vice President and Chief Executive Officer of Global Corporate Trust (2003-2008), Senior Vice President and Division Manager of Global Payments & Trade Services (2002-2003) and Senior Vice President and Division Manager of Domestic Corporate Trust (1998-2002). Ms. Peetz also served in various capacities at Chase Manhattan Corporation (1982-1998), including Senior Vice President and Manager of Corporate Trust International Business (1996-1998), Managing Director and Manager of Corporate Trust Services (1994-1996) and Managing Director and Group Manager of Financial Institution Sales (1990-1993). Ms. Peetz currently serves as Chair of Amherst Holdings Advisory Council (2018-present), Trustee of Johns Hopkins University (2016-present), Chair of the Carey Business School Advisory Council, Member of the Johns Hopkins Medicine Board and Finance Committee and Chair of the Lyme and Tick Related Disease Institute Advisory Council. Ms. Peetz previously served as a member of the Board of Guardian Life Insurance Company of America (2019-2023), a member of the Board of Trane Technologies (2018-2022), a member of the Board of Wells Fargo Corp. (2017-2019), a member of the Board of SunCoke Energy Inc. (2012-2016), a member of the Board of Private Export Funding Corporation (2010-2016) and as a Trustee of Penn State University (2010-2014) and the United Way of New York City (2008-2010).
Heather Bonner (1977)
Year of Election or Appointment: 2023
Assistant Treasurer
Ms. Bonner also serves as an officer of other funds. Ms. Bonner is a Senior Vice President (2022-present) and is an employee of Fidelity Investments (2022-present). Ms. Bonner serves as Vice President, Treasurer, or Assistant Treasurer of certain Fidelity entities. Prior to joining Fidelity, Ms. Bonner served as Managing Director at AQR Capital Management (2013-2022) and was the Treasurer and Principal Financial Officer of the AQR Funds (2013-2022).
Craig S. Brown (1977)
Year of Election or Appointment: 2022
Deputy Treasurer
Mr. Brown also serves as an officer of other funds. Mr. Brown is a Vice President (2015-present) and is an employee of Fidelity Investments. Mr. Brown serves as Assistant Treasurer of FIMM, LLC (2021-present). Previously, Mr. Brown served as Assistant Treasurer of certain Fidelity® funds (2019-2022).
John J. Burke III (1964)
Year of Election or Appointment: 2018
Chief Financial Officer
Mr. Burke also serves as Chief Financial Officer of other funds. Mr. Burke is Head of Fidelity Fund and Investment Operations (2018-present) and is an employee of Fidelity Investments. Mr. Burke serves as President, Executive Vice President, or Director of certain Fidelity entities. Previously Mr. Burke served as head of Asset Management Investment Operations (2012-2018).
Margaret Carey (1973)
Year of Election or Appointment: 2023
Secretary and Chief Legal Officer (CLO)
Ms. Carey also serves as an officer of other funds and as CLO of certain Fidelity entities. Ms. Carey is a Senior Vice President, Deputy General Counsel (2019-present) and is an employee of Fidelity Investments.
William C. Coffey (1969)
Year of Election or Appointment: 2019
Assistant Secretary
Mr. Coffey also serves as Assistant Secretary of other funds. Mr. Coffey is a Senior Vice President, Deputy General Counsel (2010-present) and is an employee of Fidelity Investments. Previously, Mr. Coffey served as Secretary and CLO of certain funds (2018-2019); CLO, Secretary, or Senior Vice President of certain Fidelity entities and Assistant Secretary of certain funds (2009-2018).
Timothy M. Cohen (1969)
Year of Election or Appointment: 2018
Vice President
Mr. Cohen also serves as Vice President of other funds. Mr. Cohen is Co-Head of Equity (2018-present) and is an employee of Fidelity Investments. Mr. Cohen serves a Director of Fidelity Management & Research (Japan) Limited (investment adviser firm, 2016-present). Previously, Mr. Cohen served as Executive Vice President of Fidelity SelectCo, LLC (2019) and Head of Global Equity Research (2016-2018).
Jonathan Davis (1968)
Year of Election or Appointment: 2010
Assistant Treasurer
Mr. Davis also serves as an officer of other funds. Mr. Davis is a Vice President (2006-present) and is an employee of Fidelity Investments. Mr. Davis serves as Assistant Treasurer of certain Fidelity entities.
Laura M. Del Prato (1964)
Year of Election or Appointment: 2018
Assistant Treasurer
Ms. Del Prato also serves as an officer of other funds. Ms. Del Prato is a Senior Vice President (2017-present) and is an employee of Fidelity Investments. Ms. Del Prato serves as Vice President or Assistant Treasurer of certain Fidelity entities. Previously, Ms. Del Prato served as President and Treasurer of The North Carolina Capital Management Trust: Cash Portfolio and Term Portfolio (2018-2020).
Colm A. Hogan (1973)
Year of Election or Appointment: 2020
Assistant Treasurer
Mr. Hogan also serves as an officer of other funds. Mr. Hogan is a Vice President (2016-present) and is an employee of Fidelity Investments. Mr. Hogan serves as Assistant Treasurer of certain Fidelity entities. Previously, Mr. Hogan served as Deputy Treasurer of certain Fidelity® funds (2016-2020) and Assistant Treasurer of certain Fidelity® funds (2016-2018).
Pamela R. Holding (1964)
Year of Election or Appointment: 2018
Vice President
Ms. Holding also serves as Vice President of other funds. Ms. Holding is Co-Head of Equity (2018-present) and is an employee of Fidelity Investments. Previously, Ms. Holding served as Executive Vice President of Fidelity SelectCo, LLC (2019) and as Chief Investment Officer of Fidelity Institutional Asset Management (2013-2018).
Chris Maher (1972)
Year of Election or Appointment: 2020
Deputy Treasurer
Mr. Maher also serves as an officer of other funds. Mr. Maher is a Vice President (2008-present) and is an employee of Fidelity Investments. Mr. Maher serves as Assistant Treasurer of certain Fidelity entities. Previously, Mr. Maher served as Assistant Treasurer of certain funds (2013-2020).
Jason P. Pogorelec (1975)
Year of Election or Appointment: 2020
Chief Compliance Officer
Mr. Pogorelec also serves as Chief Compliance Officer of other funds. Mr. Pogorelec is a Senior Vice President of Asset Management Compliance (2020-present) and is an employee of Fidelity Investments. Mr. Pogorelec serves as Compliance Officer of Fidelity Management & Research Company LLC (investment adviser firm, 2023-present) and Ballyrock Investment Advisors LLC (2023-present). Previously, Mr. Pogorelec served as a Vice President, Associate General Counsel for Fidelity Investments (2010-2020) and Assistant Secretary of certain Fidelity® funds (2015-2020).
Brett Segaloff (1972)
Year of Election or Appointment: 2021
Anti-Money Laundering (AML) Officer
Mr. Segaloff also serves as AML Officer of other funds. Mr. Segaloff is a Vice President (2022-present) and is an employee of Fidelity Investments. Mr. Segaloff serves as Anti Money Laundering Compliance Officer or Anti Money Laundering/Bank Secrecy Act Compliance Officer of certain Fidelity entities.
Stacie M. Smith (1974)
Year of Election or Appointment: 2016
President and Treasurer
Ms. Smith also serves as an officer of other funds. Ms. Smith is a Senior Vice President (2016-present) and is an employee of Fidelity Investments. Ms. Smith serves as Assistant Treasurer of certain Fidelity entities and has served in other fund officer roles.
Jim Wegmann (1979)
Year of Election or Appointment: 2019
Assistant Treasurer
Mr. Wegmann also serves as an officer of other funds. Mr. Wegmann is a Vice President (2016-present) and is an employee of Fidelity Investments. Mr. Wegmann serves as Assistant Treasurer of FIMM, LLC (2021-present). Previously, Mr. Wegmann served as Assistant Treasurer of certain Fidelity® funds (2019-2021).
As a shareholder, you incur two types of costs: (1) transaction costs, which may include sales charges (loads) on purchase payments or redemption proceeds, as applicable and (2) ongoing costs, which generally include management fees, distribution and/or service (12b-1) fees and other Fund expenses. This Example is intended to help you understand your ongoing costs (in dollars) of investing in a fund and to compare these costs with the ongoing costs of investing in other mutual funds.
| The Example is based on an investment of $1,000 invested at the beginning of the period and held for the entire period (May 1, 2023 to October 31, 2023). |
Actual Expenses
The first line of the accompanying table provides information about actual account values and actual expenses. You may use the information in this line, together with the amount you invested, to estimate the expenses that you paid over the period. Simply divide your account value by $1,000.00 (for example, an $8,600 account value divided by $1,000.00 = 8.6), then multiply the result by the number in the first line for a class/Fund under the heading entitled "Expenses Paid During Period" to estimate the expenses you paid on your account during this period. If any fund is a shareholder of any underlying mutual funds or exchange-traded funds (ETFs) (the Underlying Funds), such fund indirectly bears its proportional share of the expenses of the Underlying Funds in addition to the direct expenses incurred presented in the table. These fees and expenses are not included in the annualized expense ratio used to calculate the expense estimate in the table below.
Hypothetical Example for Comparison Purposes
The second line of the accompanying table provides information about hypothetical account values and hypothetical expenses based on the actual expense ratio and an assumed rate of return of 5% per year before expenses, which is not the actual return. The hypothetical account values and expenses may not be used to estimate the actual ending account balance or expenses you paid for the period. You may use this information to compare the ongoing costs of investing in the Fund and other funds. To do so, compare this 5% hypothetical example with the 5% hypothetical examples that appear in the shareholder reports of the other funds. If any fund is a shareholder of any Underlying Funds, such fund indirectly bears its proportional share of the expenses of the Underlying Funds in addition to the direct expenses as presented in the table. These fees and expenses are not included in the annualized expense ratio used to calculate the expense estimate in the table below.
Please note that the expenses shown in the table are meant to highlight your ongoing costs only and do not reflect any transaction costs. Therefore, the second line of the table is useful in comparing ongoing costs only, and will not help you determine the relative total costs of owning different funds. In addition, if these transactional costs were included, your costs would have been higher.
| | | | | Annualized Expense Ratio- A | | Beginning Account Value May 1, 2023 | | Ending Account Value October 31, 2023 | | Expenses Paid During Period- C May 1, 2023 to October 31, 2023 |
| Fidelity® Total International Equity Fund | | | | | | | | | | |
| Class A | | | | 1.30% | | | | | | |
| Actual | | | | | | $ 1,000 | | $ 940.90 | | $ 6.36 |
Hypothetical-B | | | | | | $ 1,000 | | $ 1,018.65 | | $ 6.61 |
| Class M | | | | 1.54% | | | | | | |
| Actual | | | | | | $ 1,000 | | $ 939.50 | | $ 7.53 |
Hypothetical-B | | | | | | $ 1,000 | | $ 1,017.44 | | $ 7.83 |
| Class C | | | | 2.05% | | | | | | |
| Actual | | | | | | $ 1,000 | | $ 937.10 | | $ 10.01 |
Hypothetical-B | | | | | | $ 1,000 | | $ 1,014.87 | | $ 10.41 |
| Fidelity® Total International Equity Fund | | | | 1.05% | | | | | | |
| Actual | | | | | | $ 1,000 | | $ 941.20 | | $ 5.14 |
Hypothetical-B | | | | | | $ 1,000 | | $ 1,019.91 | | $ 5.35 |
| Class I | | | | 1.05% | | | | | | |
| Actual | | | | | | $ 1,000 | | $ 940.90 | | $ 5.14 |
Hypothetical-B | | | | | | $ 1,000 | | $ 1,019.91 | | $ 5.35 |
| Class Z | | | | .90% | | | | | | |
| Actual | | | | | | $ 1,000 | | $ 942.30 | | $ 4.41 |
Hypothetical-B | | | | | | $ 1,000 | | $ 1,020.67 | | $ 4.58 |
| |
A Annualized expense ratio reflects expenses net of applicable fee waivers.
B 5% return per year before expenses
C Expenses are equal to the annualized expense ratio, multiplied by the average account value over the period, multiplied by 184/ 365 (to reflect the one-half year period). The fees and expenses of any Underlying Funds are not included in each annualized expense ratio.
The dividend and capital gains distributions for the fund(s) are available on Fidelity.com or Institutional.Fidelity.com.
The fund designates $9,929 of distributions paid during the fiscal year ended 2023 as qualifying to be taxed as section 163(j) interest dividends.
Class A designates 4%; Class M designates 6%; Class C designates 16%; Total International Equity designates 4%; Class I designates 4%; and Class Z designates 4% of the dividends distributed during the fiscal year as qualifying for the dividends-received deduction for corporate shareholders.
Class A, Class M, Class C, Total International Equity, Class I and Class Z designates 100% of each dividend distributed during the fiscal year as amounts which may be taken into account as a dividend for purposes of the maximum rate under section 1(h)(11) of the Internal Revenue Code.
The amounts per share which represent income derived from sources within, and taxes paid to, foreign countries or possessions of the United States are as follows:
| | Pay Date | Income | Taxes |
| Fidelity Total International Equity Fund | | | |
| Class A | 12/12/2022 | $0.1036 | $0.0196 |
| Class M | 12/12/2022 | $0.0726 | $0.0196 |
| Class C | 12/12/2022 | $0.0276 | $0.0196 |
| Total International Equity | 12/12/2022 | $0.1206 | $0.0196 |
| Class I | 12/12/2022 | $0.1206 | $0.0196 |
| Class Z | 12/12/2022 | 0.1216 | $0.0196 |
The fund will notify shareholders in January 2024 of amounts for use in preparing 2023 income tax returns.
Board Approval of Investment Advisory Contracts and Management Fees
Fidelity Total International Equity Fund
Each year, the Board of Trustees, including the Independent Trustees (together, the Board), considers the renewal of the fund's management contract with Fidelity Management & Research Company LLC (FMR) and the sub-advisory agreements (together, the Advisory Contracts) for the fund. FMR and the sub-advisers are referred to herein as the Investment Advisers. The Board, assisted by the advice of fund counsel and Independent Trustees' counsel, requests and considers a broad range of information relevant to the renewal of the Advisory Contracts throughout the year.
The Board meets regularly and, at each of its meetings, covers an extensive agenda of topics and materials and considers factors that are relevant to its annual consideration of the renewal of the fund's Advisory Contracts, including the services and support provided to the fund and its shareholders. The Board, acting directly and through its Committees (each of which is composed of and chaired by Independent Trustees), requests and receives information concerning the annual consideration of the renewal of the fund's Advisory Contracts. The Board also meets as needed to review matters specifically related to the Board's annual consideration of the renewal of the Advisory Contracts. Members of the Board may also meet with trustees of other Fidelity funds through joint ad hoc committees to discuss certain matters relevant to all of the Fidelity funds.
Approval of Stub Period Continuation. At its May 2023 meeting, the Board of Trustees voted to continue the fund's management contract with FMR, and the sub-advisory agreements and sub-sub-advisory agreements, in each case, where applicable (together, the Advisory Contracts), without modification, for two months from June 1, 2023 through July 31, 2023. The Board considered that the approval of the fund's Advisory Contracts will not result in any changes in (i) the investment process or strategies employed in the management of the fund's assets; (ii) the fees and expenses paid by shareholders; (iii) the nature, extent or quality of services provided under the fund's Advisory Contracts; or (iv) the day-to-day management of the fund or the persons primarily responsible for such management. The Board also considered that since its last approval of the fund's Advisory Contracts, FMR had provided additional information on the fund in support of the annual contract renewal process, including competitive analyses on total expenses and management fees and in-depth reviews of fund performance and fund profitability information. The Board concluded that the fund's Advisory Contracts are fair and reasonable, and that the fund's Advisory Contracts should be renewed, without modification, through July 31, 2023, with the understanding that the Board would consider the annual renewal for a full one year period in July 2023.
At its July 2023 meeting, the Board unanimously determined to renew the fund's Advisory Contracts. In reaching its determination, the Board considered all factors it believed relevant, including (i) the nature, extent, and quality of the services provided to the fund and its shareholders (including the investment performance of the fund); (ii) the competitiveness relative to peer funds of the fund's management fee and the total expense ratio of a representative class (the retail class, which was selected because it was the largest class without 12b-1 fees); (iii) the total costs of the services provided by and the profits realized by FMR and its affiliates (Fidelity) from its relationships with the fund; and (iv) the extent to which, if any, economies of scale exist and are realized as the fund grows, and whether any economies of scale are appropriately shared with fund shareholders. The Board also considered the broad range of investment choices available to shareholders from FMR's competitors and that the fund's shareholders have chosen to invest in the fund, which is part of the Fidelity family of funds. The Board's decision to renew the Advisory Contracts was not based on any single factor.
The Board reached a determination, with the assistance of fund counsel and Independent Trustees' counsel and through the exercise of its business judgment, that the renewal of the Advisory Contracts was in the best interests of the fund and its shareholders and that the compensation payable under the Advisory Contracts was fair and reasonable in light of all of the surrounding circumstances.
Nature, Extent, and Quality of Services Provided. The Board considered staffing as it relates to the fund, including the backgrounds and experience of investment personnel of the Investment Advisers, and also considered the Investments Advisers' implementation of the fund's investment program. The Independent Trustees also had discussions with senior management of Fidelity's investment operations and investment groups. The Board considered the structure of the investment personnel compensation program and whether this structure provides appropriate incentives to act in the best interests of the fund. Additionally, the Board considered the portfolio managers' investments, if any, in the funds that they manage.
Resources Dedicated to Investment Management and Support Services. The Board and the Fund Oversight and Research Committees reviewed the general qualifications and capabilities of Fidelity's investment staff, including its size, education, experience, and resources, as well as Fidelity's approach to recruiting, training, managing, and compensating investment personnel. The Board noted the resources devoted to expansion of Fidelity's global investment organization, and that Fidelity's analysts have extensive resources, tools and capabilities that allow them to conduct sophisticated quantitative and fundamental analysis, as well as credit analysis of issuers, counterparties and guarantors. Further, the Board considered that Fidelity's investment professionals have sufficient access to global information and data so as to provide competitive investment results over time, and that those professionals also have access to sophisticated tools that permit them to assess portfolio construction and risk and performance attribution characteristics continuously, as well as to transmit new information and research conclusions rapidly around the world. Additionally, in its deliberations, the Board considered Fidelity's trading, risk management, compliance, and technology and operations capabilities and resources, which are integral parts of the investment management process.
Shareholder and Administrative Services. The Board considered (i) the nature, extent, quality, and cost of advisory, administrative, and shareholder services performed by the Investment Advisers and their affiliates under the Advisory Contracts and under separate agreements covering transfer agency, pricing and bookkeeping, and securities lending services for the fund; (ii) the nature and extent of Fidelity's supervision of third party service providers, principally custodians, subcustodians, and pricing vendors; and (iii) the resources devoted by Fidelity to, and the record of compliance with, the fund's compliance policies and procedures. The Board also reviewed the allocation of fund brokerage, including allocations to brokers affiliated with the Investment Advisers, the use of brokerage commissions to pay fund expenses, and the use of "soft" commission dollars to pay for research services. The Board also considered the fund's securities lending activities and any payments made to Fidelity relating to securities lending.
The Board noted that the growth of fund assets over time across the complex allows Fidelity to reinvest in the development of services designed to enhance the value and convenience of the Fidelity funds as investment vehicles. These services include 24-hour access to account information and market information over the Internet and through telephone representatives, investor education materials and asset allocation tools. The Board also considered that it reviews customer service metrics such as telephone response times, continuity of services on the website and metrics addressing services at Fidelity Investor Centers.
Investment in a Large Fund Family. The Board considered the benefits to shareholders of investing in a fund that is part of a large family of funds offering a variety of investment disciplines and providing a large variety of fund investor services. The Board noted that Fidelity had taken, or had made recommendations that resulted in the Fidelity funds taking, a number of actions over the previous year that benefited particular funds and/or the Fidelity funds in general.
Investment Performance. The Board took into account discussions that occur with representatives of the Investment Advisers, and reports that it receives, at Board meetings throughout the year, relating to fund investment performance. In this regard the Board noted that as part of regularly scheduled fund reviews and other reports to the Board on fund performance, the Board considered annualized return information for the fund for different time periods, measured against an appropriate securities market index (benchmark index) and an appropriate peer group of funds with similar objectives (peer group). The Board also considered information about performance attribution. In its ongoing evaluation of fund investment performance, the Board gives particular attention to information indicating changes in performance of the funds over different time periods and discussed with the Investment Advisers the reasons for any overperformance or underperformance.
In addition to reviewing absolute and relative fund performance, the Independent Trustees periodically consider the appropriateness of fund performance metrics in evaluating the results achieved. The Independent Trustees generally give greater weight to fund performance over longer time periods than over shorter time periods. Depending on the circumstances, the Independent Trustees may be satisfied with a fund's performance notwithstanding that it lags its benchmark index or peer group for certain periods.
Based on its review, the Board concluded that the nature, extent, and quality of services provided to the fund under the Advisory Contracts should continue to benefit the shareholders of the fund.
Competitiveness of Management Fee and Total Expense Ratio. The Board was provided with information regarding industry trends in management fees and expenses. In its review of the fund's management fee and the total expense ratio of the retail class, the Board considered the fund's management fee rate as well as other fund or class expenses, as applicable, such as transfer agent fees, pricing and bookkeeping fees, fund-paid 12b-1 fees, and custodial, legal, and audit fees. The Board noted that Fidelity may agree to waive fees or reimburse expenses from time to time, and the extent to which, if any, it has done so for the fund. The Board also considered information about the impact of the fund's performance adjustment.
Comparisons of Management Fees and Total Expense Ratios. Among other things, the Board reviewed data for selected groups of competitive funds and classes (referred to as "mapped groups") that were compiled by Fidelity based on combining similar investment objective categories (as classified by Lipper) that have comparable investment mandates. The data reviewed by the Board included (i) gross management fee comparisons (before taking into account expense reimbursements or caps and without taking into account the fund's performance adjustment) relative to the total universe of funds within the mapped group; (ii) gross management fee comparisons relative to a subset of non-Fidelity funds in the mapped group that are similar in size and management fee structure to the fund (referred to as the "asset size peer group"); (iii) total expense comparisons of the retail class of the fund relative to funds and classes in the mapped group that have a similar sales load structure to the retail class of the fund (referred to as the "similar sales load structure group"); and (iv) total expense comparisons of the retail class of the fund relative to funds and classes in the similar sales load structure group that are similar in size and management fee structure to the fund (referred to as the "total expense asset size peer group"). The total expense asset size peer group comparison excludes performance adjustments and fund-paid 12b-1 fees to eliminate variability in fee structures.
The information provided to the Board indicated that the fund's management fee rate ranked below the competitive median of the mapped group for the 12-month period ended September 30, 2022 and below the competitive median of the asset size peer group for the 12-month period ended September 30, 2022. Further, the information provided to the Board indicated that the total expense ratio of the retail class of the fund ranked below the competitive median of the similar sales load structure group for the 12-month period ended September 30, 2022 and below the competitive median of the total expense asset size peer group for the 12-month period ended September 30, 2022.
The Board also considered that, for funds subject to the group fee, FMR agreed to voluntarily waive fees over a specified period of time in amounts designed to account for assets converted from certain funds to certain collective investment trusts.
The Board also considered that the fund's management fee is subject to upward or downward adjustment depending upon whether, and to what extent, the fund's investment performance for the performance period (a rolling 36-month period) exceeds, or is exceeded by, a securities index, thus leading to a performance adjustment for the same period. The Board noted that the performance adjustment provides FMR with a strong economic incentive to seek to achieve superior long-term performance for the fund's shareholders and helps to more closely align the interests of FMR and the shareholders of the fund.
In connection with its consideration of the fund's performance adjustment, the Board noted that the performance of the retail class is used for purposes of determining the performance adjustment. The Board noted that to the extent the performance adjustment was based on the performance of a share class with higher total annual operating expenses, the fund would be subject to a smaller positive and larger negative performance adjustment. The Board considered the appropriateness of the use of the retail class as the basis for the performance adjustment. The Board noted that the retail class is typically the largest class (reflecting the actual investment experience for the plurality of shareholders), employs a standard expense structure, and does not include fund-paid 12b-1 fees, which Fidelity believes makes it a more appropriate measurement of Fidelity's investment skill.
Other Contractual Arrangements. The Board further considered that FMR has contractually agreed to reimburse Class A, Class M, Class C, Class I, Class Z, and the retail class of the fund to the extent that total operating expenses, with certain exceptions, as a percentage of their respective average net assets, exceed 1.30%, 1.55%, 2.05%, 1.05%, 0.90%, and 1.05% through February 29, 2024.
Fees Charged to Other Fidelity Clients. The Board also considered Fidelity fee structures and other information with respect to clients of Fidelity, such as other funds advised or subadvised by Fidelity, pension plan clients, and other institutional clients with similar mandates. The Board noted that a joint ad hoc committee created by it and the boards of other Fidelity funds periodically reviews and compares Fidelity's institutional investment advisory business with its business of providing services to the Fidelity funds and also noted the most recent findings of the committee. The Board noted that the committee's review included a consideration of the differences in services provided, fees charged, and costs incurred, as well as competition in the markets serving the different categories of clients.
Based on its review, the Board concluded that the fund's management fee, including the use of the retail class as the basis for the performance adjustment, is fair and reasonable in light of the services that the fund receives and the other factors considered. Further, based on its review of total expense ratios and fees charged to other Fidelity clients, the Board concluded that the total expense ratio of each class of the fund was reasonable in light of the services that the fund and its shareholders receive and the other factors considered.
Costs of the Services and Profitability. The Board considered the revenues earned and the expenses incurred by Fidelity in conducting the business of developing, marketing, distributing, managing, administering and servicing the fund and servicing the fund's shareholders. The Board also considered the level of Fidelity's profits in respect of all the Fidelity funds.
On an annual basis, Fidelity presents to the Board information about the profitability of its relationships with the fund. Fidelity calculates profitability information for each fund, as well as aggregate profitability information for groups of Fidelity funds and all Fidelity funds, using a series of detailed revenue and cost allocation methodologies which originate with the books and records of Fidelity on which Fidelity's audited financial statements are based. The Audit Committee of the Board reviews any significant changes from the prior year's methodologies and the full Board approves such changes.
A public accounting firm has been engaged annually by the Board as part of the Board's assessment of Fidelity's profitability analysis. The engagement includes the review and assessment of the methodologies used by Fidelity in determining the revenues and expenses attributable to Fidelity's fund business, and completion of agreed-upon procedures in respect of the mathematical accuracy of certain fund profitability information and its conformity to established allocation methodologies. After considering the reports issued under the engagement and information provided by Fidelity, the Board concluded that while other allocation methods may also be reasonable, Fidelity's profitability methodologies are reasonable in all material respects.
The Board also reviewed Fidelity's non-fund businesses and potential indirect benefits such businesses may have received as a result of their association with Fidelity's fund business (i.e., fall-out benefits) as well as cases where Fidelity's affiliates may benefit from the funds' business. The Board considered areas where potential indirect benefits to the Fidelity funds from their relationships with Fidelity may exist. The Board's consideration of these matters was informed by the findings of a joint ad hoc committee created by it and the boards of other Fidelity funds to evaluate potential fall-out benefits.
The Board considered the costs of the services provided by and the profits realized by Fidelity in connection with the operation of the fund and was satisfied that the profitability was not excessive.
Economies of Scale. The Board considered whether there have been economies of scale in respect of the management of the Fidelity funds, whether the Fidelity funds (including the fund) have appropriately benefited from any such economies of scale, and whether there is potential for realization of any further economies of scale. The Board considered the extent to which the fund will benefit from economies of scale as assets grow through increased services to the fund, through waivers or reimbursements, or through fee or expense ratio reductions. The Board also noted that a committee (the Economies of Scale Committee) created by it and the boards of other Fidelity funds periodically analyzes whether Fidelity attains economies of scale in respect of the management and servicing of the Fidelity funds, whether the Fidelity funds have appropriately benefited from such economies of scale, and whether there is potential for realization of any further economies of scale.
The Board recognized that the fund's management contract incorporates a "group fee" structure, which provides for lower group fee rates as total "group assets" increase, and for higher group fee rates as total "group assets" decrease ("group assets" as defined in the management contract). FMR calculates the group fee rates based on a tiered asset "breakpoint" schedule that varies based on asset class. The Board considered that the group fee is designed to deliver the benefits of economies of scale to fund shareholders when total Fidelity fund assets increase, even if assets of any particular fund are unchanged or have declined, because some portion of Fidelity's costs are attributable to services provided to all Fidelity funds, and all funds benefit if those costs can be allocated among more assets. The Board further considered that Fidelity agreed to impose a temporary fee waiver in the form of additional breakpoints to the current breakpoint schedule. The Board concluded that, given the group fee structure, fund shareholders will benefit from lower management fees as "group assets" increase at the fund complex level, regardless of whether Fidelity achieves any such economies of scale.
The Board concluded, taking into account the analysis of the Economies of Scale Committee, that economies of scale, if any, are being appropriately shared between fund shareholders and Fidelity.
Additional Information Requested by the Board. In order to develop fully the factual basis for consideration of the Fidelity funds' advisory contracts, the Board requested and received additional information on certain topics, including: (i) fund flow and performance trends, in particular the underperformance of certain funds and strategies, and Fidelity's long-term strategies for certain funds, including any consideration of fund liquidations or mergers; (ii) the operation of performance fees and competitor use of performance fees; (iii) Fidelity's pricing philosophy compared to competitors; (iv) fund profitability methodology and data; (v) evaluation of competitive fund data and peer group classifications and fee and expense comparisons; (vi) the management fee and expense structures for different funds and classes and information about the differences between various fee and expense structures; (vii) group fee breakpoints and related voluntary fee waivers; and (viii) information regarding other accounts managed by Fidelity and the funds' sub-advisory arrangements.
Conclusion. Based on its evaluation of all of the conclusions noted above, and after considering all factors it believed relevant, the Board, including the Independent Trustees concluded that the advisory and sub-advisory fee arrangements are fair and reasonable in light of all of the surrounding circumstances and that the fund's Advisory Contracts should be renewed through July 31, 2024.
1.912358.113
TIE-ANN-1223
Fidelity® International Value Fund
Annual Report
October 31, 2023
Includes Fidelity and Fidelity Advisor share classes
Contents
To view a fund's proxy voting guidelines and proxy voting record for the 12-month period ended June 30, visit http://www.fidelity.com/proxyvotingresults or visit the Securities and Exchange Commission's (SEC) web site at http://www.sec.gov.
You may also call 1-800-544-8544 if you're an individual investing directly with Fidelity, call 1-800-835-5092 if you're a plan sponsor or participant with Fidelity as your recordkeeper or call 1-877-208-0098 on institutional accounts or if you're an advisor or invest through one to request a free copy of the proxy voting guidelines.
Standard & Poor's, S&P and S&P 500 are registered service marks of The McGraw-Hill Companies, Inc. and have been licensed for use by Fidelity Distributors Corporation.
Other third-party marks appearing herein are the property of their respective owners.
All other marks appearing herein are registered or unregistered trademarks or service marks of FMR LLC or an affiliated company. © 2023 FMR LLC. All rights reserved.
This report and the financial statements contained herein are submitted for the general information of the shareholders of the Fund. This report is not authorized for distribution to prospective investors in the Fund unless preceded or accompanied by an effective prospectus.
A fund files its complete schedule of portfolio holdings with the SEC for the first and third quarters of each fiscal year on Form N-PORT. Forms N-PORT are available on the SEC's web site at http://www.sec.gov. A fund's Forms N-PORT may be reviewed and copied at the SEC's Public Reference Room in Washington, DC. Information regarding the operation of the SEC's Public Reference Room may be obtained by calling 1-800-SEC-0330.
For a complete list of a fund's portfolio holdings, view the most recent holdings listing, semiannual report, or annual report on Fidelity's web site at http://www.fidelity.com, http://www.institutional.fidelity.com, or http://www.401k.com, as applicable.
NOT FDIC INSURED •MAY LOSE VALUE •NO BANK GUARANTEE
Neither the Fund nor Fidelity Distributors Corporation is a bank.
Average annual total return reflects the change in the value of an investment, assuming reinvestment of distributions from dividend income and capital gains (the profits earned upon the sale of securities that have grown in value, if any) and assuming a constant rate of performance each year. The hypothetical investment and the average annual total returns do not reflect the deduction of taxes that a shareholder would pay on fund distributions or the redemption of fund shares. During periods of reimbursement by Fidelity, a fund's total return will be greater than it would be had the reimbursement not occurred. How a fund did yesterday is no guarantee of how it will do tomorrow.
| Average Annual Total Returns |
| | | | |
Periods ended October 31, 2023 | Past 1 year | Past 5 years | Past 10 years |
Class A (incl. 5.75% sales charge) | 10.95% | 3.23% | 1.63% |
Class M (incl. 3.50% sales charge) | 13.34% | 3.44% | 1.59% |
Class C (incl. contingent deferred sales charge) | 15.74% | 3.64% | 1.60% |
| Fidelity® International Value Fund | 17.96% | 4.77% | 2.58% |
| Class I | 17.97% | 4.73% | 2.50% |
| Class Z | 18.20% | 4.93% | 2.59% |
Class C shares' contingent deferred sales charges included in the past one year, past five years and past ten years total return figures are 1%, 0% and 0%, respectively.
The initial offering of Class Z shares took place on October 2, 2018. Returns prior to October 2, 2018, are those of Class I.
| $10,000 Over 10 Years |
| |
Let's say hypothetically that $10,000 was invested in Fidelity® International Value Fund, a class of the fund, on October 31, 2013. The chart shows how the value of your investment would have changed, and also shows how the MSCI EAFE Value Index performed over the same period. |
|
|
Market Recap:
International (non-U.S.) equities gained 12.27% for the 12 months ending October 31, 2023, according to the MSCI ACWI (All Country World Index) ex USA Index, as global economic expansion and a slowing in the pace of inflation in some markets provided a favorable backdrop for risk assets. After returning -15.86% in 2022, the index's upturn has been largely driven by a narrow set of companies in the information technology and communication services sectors, in part due to excitement for generative artificial intelligence applications. The index gained 14.07% year to date through July, including strong gains in both June (+4.50%) and July (+4.07%). The rally for international equities sputtered for the next three months (-11.33%) amid a stalling pattern in disinflationary trends, heightened global recession and geopolitical risks, soaring yields on longer-term U.S. government bonds and particularly weak economic conditions in the eurozone and China. The three-month decline left non-U.S. stocks up 1.15% year to date through October. Currency fluctuation also helped bolster non-U.S. equity performance overall. For the full 12 months, nearly all regions advanced, with Europe ex U.K. (+18%) and Japan (+17%) leading, whereas Canada (-0.38%) lagged by the widest margin. Each of the 11 sectors advanced, with information technology (+21%) and consumer discretionary (+19%) leading the way. Energy and industrials each rose about 14%. Conversely, four defensive-oriented sectors lagged by the widest margin: real estate (+4%), health care (+6%), consumer staples (+7%) and utilities (+8%).
Comments from Portfolio Manager Alex Zavratsky:
For the fiscal year ending October 31, 2023, the fund's share classes (excluding sales charges, if applicable) gained about 17% to 18%, versus 18.45% for the benchmark MSCI EAFE Value Index (Net MA). From a regional standpoint, security selection and an underweight in Europe ex the U.K., primarily France, along with stock picks in the U.K., detracted from the fund's relative result. By sector, security selection was the primary detractor, especially within health care, where our investment choices among pharmaceuticals, biotechnology & life sciences firm hurt most. Security selection in financials, particularly among insurance companies, pressured performance as well. An overweight in information technology, namely within the semiconductors & semiconductor equipment industry, also hampered the fund's result. Further detracting from the portfolio's return was stock picking in consumer discretionary, primarily in the automobiles & components industry. In addition, the fund's position in cash was a notable detractor. The biggest individual relative detractor was our stake in Prudential (-35%), an investment we established the past 12 months. A second notable relative detractor was an underweight in HSBC (+48%), another holding initiated this period. A non-benchmark stake in Teleperformance returned roughly -57% and notably hurt as well. In contrast, on a regional basis, an underweight in Asia Pacific ex Japan, especially Hong Kong, plus stock selection and an overweight in Japan, contributed to the fund's performance versus the benchmark. By sector, the biggest contributor to the portfolio's relative return was an underweight in consumer staples, especially among food, beverage & tobacco stocks. An underweight in real estate and communication services also boosted the fund's relative performance. The top individual relative contributor was our non-benchmark stake in Rheinmetall (+78%). Not owning British American Tobacco, a benchmark component that returned approximately -18%, was the second-largest relative contributor. An overweight in BAE Systems (+47%) also helped. The stock was among our largest holdings these past 12 months. Notable changes in positioning include lower allocations to Switzerland and Australia. By sector, meaningful shifts include increased exposure to the consumer discretionary sector and a lower allocation to health care firms.
The views expressed above reflect those of the portfolio manager(s) only through the end of the period as stated on the cover of this report and do not necessarily represent the views of Fidelity or any other person in the Fidelity organization. Any such views are subject to change at any time based upon market or other conditions and Fidelity disclaims any responsibility to update such views. These views may not be relied on as investment advice and, because investment decisions for a Fidelity fund are based on numerous factors, may not be relied on as an indication of trading intent on behalf of any Fidelity fund.
Top Holdings (% of Fund's net assets) |
| |
| Shell PLC ADR (Netherlands, Oil, Gas & Consumable Fuels) | 4.9 | |
| TotalEnergies SE (France, Oil, Gas & Consumable Fuels) | 3.9 | |
| BHP Group Ltd. (Australia, Metals & Mining) | 3.5 | |
| Toyota Motor Corp. (Japan, Automobiles) | 3.2 | |
| Hitachi Ltd. (Japan, Industrial Conglomerates) | 2.4 | |
| BAE Systems PLC (United Kingdom, Aerospace & Defense) | 2.3 | |
| Mitsubishi UFJ Financial Group, Inc. (Japan, Banks) | 2.2 | |
| AXA SA (France, Insurance) | 2.2 | |
| UBS Group AG (Switzerland, Capital Markets) | 2.1 | |
| Banco Santander SA (Spain) (Spain, Banks) | 2.0 | |
| | 28.7 | |
| |
| Market Sectors (% of Fund's net assets) |
| |
| Financials | 32.3 | |
| Industrials | 15.5 | |
| Energy | 13.0 | |
| Materials | 12.8 | |
| Consumer Discretionary | 8.9 | |
| Health Care | 5.4 | |
| Information Technology | 5.2 | |
| Communication Services | 2.1 | |
| Utilities | 1.0 | |
| Consumer Staples | 0.5 | |
| Real Estate | 0.5 | |
| |
Asset Allocation (% of Fund's net assets) |
|
|
Geographic Diversification (% of Fund's net assets) |
|
* Includes Short-Term investments and Net Other Assets (Liabilities). Percentages are adjusted for the effect of derivatives, if applicable. |
| |
Showing Percentage of Net Assets
| Common Stocks - 96.5% |
| | | Shares | Value ($) |
| Australia - 7.9% | | | |
| BHP Group Ltd. | | 880,167 | 24,915,307 |
| Flutter Entertainment PLC (a) | | 16,600 | 2,603,773 |
| Glencore PLC | | 2,676,500 | 14,176,968 |
| Macquarie Group Ltd. | | 76,944 | 7,909,072 |
| Woodside Energy Group Ltd. | | 312,261 | 6,800,983 |
TOTAL AUSTRALIA | | | 56,406,103 |
| Belgium - 0.9% | | | |
| KBC Group NV | | 75,616 | 4,152,482 |
| UCB SA | | 31,900 | 2,331,009 |
TOTAL BELGIUM | | | 6,483,491 |
| Canada - 0.1% | | | |
| Nutrien Ltd. | | 9,100 | 488,746 |
| Denmark - 0.5% | | | |
| DSV A/S | | 22,500 | 3,355,662 |
| Finland - 1.0% | | | |
| Mandatum Holding OY | | 150,534 | 581,691 |
| Sampo Oyj (A Shares) | | 167,034 | 6,558,772 |
TOTAL FINLAND | | | 7,140,463 |
| France - 12.2% | | | |
| Air Liquide SA | | 53,270 | 9,127,934 |
| Airbus Group NV | | 29,900 | 4,008,879 |
| ALTEN | | 25,600 | 3,014,823 |
| AXA SA | | 530,405 | 15,716,126 |
| BNP Paribas SA | | 170,300 | 9,792,936 |
| Capgemini SA | | 32,693 | 5,777,794 |
| Teleperformance | | 5,600 | 640,828 |
| TotalEnergies SE | | 416,505 | 27,846,476 |
| VINCI SA | | 68,500 | 7,574,346 |
| Vivendi SA | | 483,392 | 4,325,050 |
TOTAL FRANCE | | | 87,825,192 |
| Germany - 10.3% | | | |
| Bayer AG | | 117,100 | 5,059,723 |
| Covestro AG (a)(b) | | 43,800 | 2,210,646 |
| DHL Group | | 169,000 | 6,573,383 |
| Fresenius SE & Co. KGaA | | 131,200 | 3,365,063 |
| Hannover Reuck SE | | 42,100 | 9,278,934 |
| Infineon Technologies AG | | 82,100 | 2,398,159 |
| Muenchener Rueckversicherungs-Gesellschaft AG in Muenchen | | 24,200 | 9,691,879 |
| Rheinmetall AG | | 36,950 | 10,571,773 |
| RWE AG | | 196,800 | 7,523,497 |
| Siemens AG | | 103,339 | 13,712,968 |
| Vonovia SE | | 148,429 | 3,417,145 |
TOTAL GERMANY | | | 73,803,170 |
| Hong Kong - 0.9% | | | |
| Prudential PLC | | 629,066 | 6,577,759 |
| India - 0.7% | | | |
| Reliance Industries Ltd. GDR (b) | | 89,800 | 4,903,080 |
| Indonesia - 0.6% | | | |
| PT Bank Rakyat Indonesia (Persero) Tbk | | 12,914,594 | 4,038,186 |
| Ireland - 1.5% | | | |
| Bank of Ireland Group PLC | | 673,400 | 6,020,832 |
| Ryanair Holdings PLC sponsored ADR (a) | | 58,000 | 5,086,600 |
TOTAL IRELAND | | | 11,107,432 |
| Italy - 3.9% | | | |
| Eni SpA | | 788,000 | 12,881,957 |
| Mediobanca SpA | | 591,225 | 7,050,232 |
| Prysmian SpA | | 87,400 | 3,263,546 |
| UniCredit SpA | | 183,900 | 4,610,302 |
TOTAL ITALY | | | 27,806,037 |
| Japan - 24.3% | | | |
| Daiichi Sankyo Kabushiki Kaisha | | 38,400 | 990,113 |
| DENSO Corp. | | 598,400 | 8,836,174 |
| Eisai Co. Ltd. | | 40,300 | 2,135,028 |
| Fast Retailing Co. Ltd. | | 16,800 | 3,719,460 |
| FUJIFILM Holdings Corp. | | 84,300 | 4,611,025 |
| Fujitsu Ltd. | | 39,400 | 5,104,173 |
| Hitachi Ltd. | | 272,200 | 17,253,840 |
| Hoya Corp. | | 22,200 | 2,137,163 |
| Ibiden Co. Ltd. | | 70,900 | 3,022,925 |
| INPEX Corp. | | 363,500 | 5,274,703 |
| Itochu Corp. | | 287,600 | 10,359,649 |
| LY Corp. | | 683,400 | 1,742,319 |
| Minebea Mitsumi, Inc. | | 168,770 | 2,646,196 |
| Mitsubishi UFJ Financial Group, Inc. | | 1,892,361 | 15,875,295 |
| NOF Corp. | | 35,900 | 1,416,289 |
| ORIX Corp. | | 454,900 | 8,272,971 |
| Renesas Electronics Corp. (a) | | 487,688 | 6,406,084 |
| Shin-Etsu Chemical Co. Ltd. | | 335,100 | 10,020,622 |
| SoftBank Group Corp. | | 80,700 | 3,304,994 |
| Sony Group Corp. | | 61,800 | 5,137,983 |
| Sumitomo Mitsui Financial Group, Inc. | | 268,800 | 12,958,305 |
| Suzuki Motor Corp. | | 186,530 | 7,239,605 |
| TIS, Inc. | | 107,401 | 2,299,977 |
| Tokio Marine Holdings, Inc. | | 486,344 | 10,880,603 |
| Toyota Motor Corp. | | 1,302,425 | 22,784,297 |
TOTAL JAPAN | | | 174,429,793 |
| Korea (South) - 0.8% | | | |
| Samsung Electronics Co. Ltd. | | 120,710 | 5,999,419 |
| Luxembourg - 0.3% | | | |
| ArcelorMittal SA (Netherlands) | | 98,232 | 2,170,252 |
| Netherlands - 5.3% | | | |
| Shell PLC ADR | | 546,000 | 35,566,438 |
| Universal Music Group NV | | 110,238 | 2,699,600 |
TOTAL NETHERLANDS | | | 38,266,038 |
| Singapore - 1.1% | | | |
| United Overseas Bank Ltd. | | 387,505 | 7,643,420 |
| South Africa - 1.0% | | | |
| Anglo American PLC (United Kingdom) | | 256,940 | 6,546,731 |
| Thungela Resources Ltd. | | 43,581 | 385,414 |
TOTAL SOUTH AFRICA | | | 6,932,145 |
| Spain - 2.5% | | | |
| Banco Santander SA (Spain) | | 3,964,182 | 14,538,140 |
| Cellnex Telecom SA (b) | | 76,000 | 2,234,104 |
| Unicaja Banco SA (b) | | 1,511,200 | 1,570,219 |
TOTAL SPAIN | | | 18,342,463 |
| Sweden - 1.8% | | | |
| Alleima AB | | 3,256 | 19,806 |
| Investor AB (B Shares) | | 613,760 | 11,238,800 |
| Sandvik AB | | 86,700 | 1,476,763 |
TOTAL SWEDEN | | | 12,735,369 |
| Switzerland - 4.4% | | | |
| Swiss Life Holding AG | | 8,893 | 5,687,844 |
| UBS Group AG | | 653,958 | 15,341,855 |
| Zurich Insurance Group Ltd. | | 21,971 | 10,400,388 |
TOTAL SWITZERLAND | | | 31,430,087 |
| United Kingdom - 9.1% | | | |
| AstraZeneca PLC (United Kingdom) | | 76,912 | 9,629,671 |
| B&M European Value Retail SA | | 569,000 | 3,657,133 |
| BAE Systems PLC | | 1,218,696 | 16,387,052 |
| Barratt Developments PLC | | 1,030,225 | 5,182,802 |
| Beazley PLC | | 454,800 | 2,844,087 |
| HSBC Holdings PLC (United Kingdom) | | 497,000 | 3,588,551 |
| Imperial Brands PLC | | 163,752 | 3,488,604 |
| Lloyds Banking Group PLC | | 11,568,954 | 5,630,610 |
| NatWest Group PLC | | 793,944 | 1,727,477 |
| Rolls-Royce Holdings PLC (a) | | 1,006,300 | 2,648,810 |
| Standard Chartered PLC (United Kingdom) | | 1,411,049 | 10,804,875 |
TOTAL UNITED KINGDOM | | | 65,589,672 |
| United States of America - 5.4% | | | |
| CRH PLC | | 199,502 | 10,720,249 |
| Ferguson PLC | | 30,816 | 4,618,239 |
| Linde PLC | | 25,114 | 9,597,566 |
| Sanofi SA | | 151,479 | 13,755,235 |
TOTAL UNITED STATES OF AMERICA | | | 38,691,289 |
| TOTAL COMMON STOCKS (Cost $635,960,788) | | | 692,165,268 |
| | | | |
| Nonconvertible Preferred Stocks - 0.7% |
| | | Shares | Value ($) |
| Germany - 0.7% | | | |
Porsche Automobil Holding SE (Germany) (Cost $7,360,495) | | 107,200 | 4,798,069 |
| | | | |
| Money Market Funds - 2.5% |
| | | Shares | Value ($) |
Fidelity Cash Central Fund 5.40% (c) (Cost $17,765,904) | | 17,762,351 | 17,765,904 |
| | | | |
| TOTAL INVESTMENT IN SECURITIES - 99.7% (Cost $661,087,187) | 714,729,241 |
NET OTHER ASSETS (LIABILITIES) - 0.3% | 2,454,505 |
| NET ASSETS - 100.0% | 717,183,746 |
| | |
Legend
| (b) | Security exempt from registration under Rule 144A of the Securities Act of 1933. These securities may be resold in transactions exempt from registration, normally to qualified institutional buyers. At the end of the period, the value of these securities amounted to $10,918,049 or 1.5% of net assets. |
| (c) | Affiliated fund that is generally available only to investment companies and other accounts managed by Fidelity Investments. The rate quoted is the annualized seven-day yield of the fund at period end. A complete unaudited listing of the fund's holdings as of its most recent quarter end is available upon request. In addition, each Fidelity Central Fund's financial statements, which are not covered by the Fund's Report of Independent Registered Public Accounting Firm, are available on the SEC's website or upon request. |
Affiliated Central Funds
Fiscal year to date information regarding the Fund's investments in Fidelity Central Funds, including the ownership percentage, is presented below.
| Affiliate | Value, beginning of period ($) | Purchases ($) | Sales Proceeds ($) | Dividend Income ($) | Realized Gain (loss) ($) | Change in Unrealized appreciation (depreciation) ($) | Value, end of period ($) | % ownership, end of period |
| Fidelity Cash Central Fund 5.40% | 19,026,705 | 159,307,491 | 160,568,292 | 992,800 | - | - | 17,765,904 | 0.0% |
| Fidelity Securities Lending Cash Central Fund 5.40% | 12,898,750 | 148,579,517 | 161,478,267 | 165,579 | - | - | - | 0.0% |
| Total | 31,925,455 | 307,887,008 | 322,046,559 | 1,158,379 | - | - | 17,765,904 | |
| | | | | | | | | |
Amounts in the dividend income column in the above table include any capital gain distributions from underlying funds, which are presented in the corresponding line item in the Statement of Operations, if applicable.
Amounts in the dividend income column for Fidelity Securities Lending Cash Central Fund represents the income earned on investing cash collateral, less rebates paid to borrowers and any lending agent fees associated with the loan, plus any premium payments received for lending certain types of securities.
Amounts included in the purchases and sales proceeds columns may include in-kind transactions, if applicable.
Investment Valuation
The following is a summary of the inputs used, as of October 31, 2023, involving the Fund's assets and liabilities carried at fair value. The inputs or methodology used for valuing securities may not be an indication of the risk associated with investing in those securities. For more information on valuation inputs, and their aggregation into the levels used below, please refer to the Investment Valuation section in the accompanying Notes to Financial Statements.
| Valuation Inputs at Reporting Date: |
| Description | Total ($) | Level 1 ($) | Level 2 ($) | Level 3 ($) |
Investments in Securities: | | | | |
|
| Equities: | | | | |
Communication Services | 14,306,067 | 4,325,050 | 9,981,017 | - |
Consumer Discretionary | 63,959,296 | 11,443,708 | 52,515,588 | - |
Consumer Staples | 3,488,604 | - | 3,488,604 | - |
Energy | 93,659,051 | 40,854,932 | 52,804,119 | - |
Financials | 230,982,643 | 115,761,030 | 115,221,613 | - |
Health Care | 39,403,005 | 5,696,072 | 33,706,933 | - |
Industrials | 110,178,534 | 34,110,031 | 76,068,503 | - |
Information Technology | 38,634,379 | 3,014,823 | 35,619,556 | - |
Materials | 91,411,116 | 25,207,265 | 66,203,851 | - |
Real Estate | 3,417,145 | - | 3,417,145 | - |
Utilities | 7,523,497 | 7,523,497 | - | - |
|
| Money Market Funds | 17,765,904 | 17,765,904 | - | - |
| Total Investments in Securities: | 714,729,241 | 265,702,312 | 449,026,929 | - |
| Statement of Assets and Liabilities |
| | | | October 31, 2023 |
| | | | | |
| Assets | | | | |
| Investment in securities, at value - See accompanying schedule: | | | | |
Unaffiliated issuers (cost $643,321,283) | $ | 696,963,337 | | |
Fidelity Central Funds (cost $17,765,904) | | 17,765,904 | | |
| | | | | |
| | | | | |
| Total Investment in Securities (cost $661,087,187) | | | $ | 714,729,241 |
| Cash | | | | 1 |
| Foreign currency held at value (cost $38) | | | | 38 |
| Receivable for investments sold | | | | 2,799,993 |
| Receivable for fund shares sold | | | | 850,423 |
| Dividends receivable | | | | 2,457,184 |
| Reclaims receivable | | | | 2,215,830 |
| Distributions receivable from Fidelity Central Funds | | | | 111,191 |
| Prepaid expenses | | | | 1,066 |
Total assets | | | | 723,164,967 |
| Liabilities | | | | |
| Payable for investments purchased | $ | 4,717,902 | | |
| Payable for fund shares redeemed | | 640,072 | | |
| Accrued management fee | | 424,378 | | |
| Distribution and service plan fees payable | | 7,380 | | |
| Other affiliated payables | | 126,917 | | |
| Other payables and accrued expenses | | 64,572 | | |
| Total Liabilities | | | | 5,981,221 |
| Net Assets | | | $ | 717,183,746 |
| Net Assets consist of: | | | | |
| Paid in capital | | | $ | 745,207,553 |
| Total accumulated earnings (loss) | | | | (28,023,807) |
| Net Assets | | | $ | 717,183,746 |
| | | | | |
| Net Asset Value and Maximum Offering Price | | | | |
| Class A : | | | | |
Net Asset Value and redemption price per share ($17,133,464 ÷ 1,936,902 shares)(a) | | | $ | 8.85 |
| Maximum offering price per share (100/94.25 of $8.85) | | | $ | 9.39 |
| Class M : | | | | |
Net Asset Value and redemption price per share ($4,196,217 ÷ 474,820 shares)(a) | | | $ | 8.84 |
| Maximum offering price per share (100/96.50 of $8.84) | | | $ | 9.16 |
| Class C : | | | | |
Net Asset Value and offering price per share ($2,365,868 ÷ 267,209 shares)(a) | | | $ | 8.85 |
| International Value : | | | | |
Net Asset Value, offering price and redemption price per share ($443,835,751 ÷ 50,094,107 shares) | | | $ | 8.86 |
| Class I : | | | | |
Net Asset Value, offering price and redemption price per share ($91,051,913 ÷ 10,262,253 shares) | | | $ | 8.87 |
| Class Z : | | | | |
Net Asset Value, offering price and redemption price per share ($158,600,533 ÷ 17,867,260 shares) | | | $ | 8.88 |
(a)Redemption price per share is equal to net asset value less any applicable contingent deferred sales charge. |
| Statement of Operations |
| | | | Year ended October 31, 2023 |
| Investment Income | | | | |
| Dividends | | | $ | 26,194,606 |
| Income from Fidelity Central Funds (including $165,579 from security lending) | | | | 1,158,379 |
| Income before foreign taxes withheld | | | $ | 27,352,985 |
| Less foreign taxes withheld | | | | (2,070,881) |
| Total Income | | | | 25,282,104 |
| Expenses | | | | |
| Management fee | | | | |
| Basic fee | $ | 4,863,331 | | |
| Performance adjustment | | 482,273 | | |
| Transfer agent fees | | 1,132,438 | | |
| Distribution and service plan fees | | 86,590 | | |
| Accounting fees | | 336,198 | | |
| Custodian fees and expenses | | 63,360 | | |
| Independent trustees' fees and expenses | | 3,807 | | |
| Registration fees | | 145,284 | | |
| Audit | | 67,087 | | |
| Legal | | 1,314 | | |
| Interest | | 1,097 | | |
| Miscellaneous | | 3,063 | | |
| Total expenses before reductions | | 7,185,842 | | |
| Expense reductions | | (51,067) | | |
| Total expenses after reductions | | | | 7,134,775 |
| Net Investment income (loss) | | | | 18,147,329 |
| Realized and Unrealized Gain (Loss) | | | | |
| Net realized gain (loss) on: | | | | |
| Investment Securities: | | | | |
| Unaffiliated issuers | | (17,295,075) | | |
| Foreign currency transactions | | (17,894) | | |
| Total net realized gain (loss) | | | | (17,312,969) |
| Change in net unrealized appreciation (depreciation) on: | | | | |
| Investment Securities: | | | | |
| Unaffiliated issuers | | 104,467,776 | | |
| Assets and liabilities in foreign currencies | | 144,725 | | |
| Total change in net unrealized appreciation (depreciation) | | | | 104,612,501 |
| Net gain (loss) | | | | 87,299,532 |
| Net increase (decrease) in net assets resulting from operations | | | $ | 105,446,861 |
| Statement of Changes in Net Assets |
| |
| | Year ended October 31, 2023 | | Year ended October 31, 2022 |
| Increase (Decrease) in Net Assets | | | | |
| Operations | | | | |
| Net investment income (loss) | $ | 18,147,329 | $ | 16,126,115 |
| Net realized gain (loss) | | (17,312,969) | | (28,616,362) |
| Change in net unrealized appreciation (depreciation) | | 104,612,501 | | (92,203,078) |
| Net increase (decrease) in net assets resulting from operations | | 105,446,861 | | (104,693,325) |
| Distributions to shareholders | | (11,902,522) | | (17,928,873) |
| | | | | |
| Share transactions - net increase (decrease) | | 45,467,490 | | 291,627,947 |
| Total increase (decrease) in net assets | | 139,011,829 | | 169,005,749 |
| | | | | |
| Net Assets | | | | |
| Beginning of period | | 578,171,917 | | 409,166,168 |
| End of period | $ | 717,183,746 | $ | 578,171,917 |
| | | | | |
| | | | | |
Financial Highlights
| Fidelity Advisor® International Value Fund Class A |
| |
| Years ended October 31, | | 2023 | | 2022 | | 2021 | | 2020 | | 2019 |
Selected Per-Share Data | | | | | | | | | | |
| Net asset value, beginning of period | $ | 7.64 | $ | 9.65 | $ | 6.87 | $ | 8.25 | $ | 8.13 |
| Income from Investment Operations | | | | | | | | | | |
Net investment income (loss) A,B | | .20 | | .24 | | .25 C | | .13 | | .25 |
| Net realized and unrealized gain (loss) | | 1.15 | | (1.87) | | 2.66 | | (1.24) | | .08 |
| Total from investment operations | | 1.35 | | (1.63) | | 2.91 | | (1.11) | | .33 |
| Distributions from net investment income | | (.14) | | (.38) | | (.13) | | (.24) | | (.21) |
| Distributions from net realized gain | | - | | - | | - | | (.03) | | - |
| Total distributions | | (.14) | | (.38) | | (.13) | | (.27) | | (.21) |
| Net asset value, end of period | $ | 8.85 | $ | 7.64 | $ | 9.65 | $ | 6.87 | $ | 8.25 |
Total Return D,E | | 17.72% | | (17.43)% | | 42.56% | | (14.01)% | | 4.38% |
Ratios to Average Net Assets B,F,G | | | | | | | | | | |
| Expenses before reductions | | 1.33% | | 1.46% | | 1.37% | | 1.30% | | 1.14% |
| Expenses net of fee waivers, if any | | 1.29% | | 1.30% | | 1.33% | | 1.30% | | 1.13% |
| Expenses net of all reductions | | 1.29% | | 1.30% | | 1.33% | | 1.28% | | 1.12% |
| Net investment income (loss) | | 2.21% | | 2.85% | | 2.77% C | | 1.71% | | 3.19% |
| Supplemental Data | | | | | | | | | | |
| Net assets, end of period (000 omitted) | $ | 17,133 | $ | 12,080 | $ | 10,566 | $ | 5,947 | $ | 7,806 |
Portfolio turnover rate H | | 29% | | 25% | | 29% I | | 36% | | 47% |
ACalculated based on average shares outstanding during the period.
BNet investment income (loss) is affected by the timing of the declaration of dividends by any underlying mutual funds or exchange-traded funds (ETFs). Net investment income (loss) of any mutual funds or ETFs is not included in the Fund's net investment income (loss) ratio.
CNet investment income per share reflects one or more large, non-recurring dividend(s) which amounted to $.09 per share. Excluding such non-recurring dividend(s), the ratio of net investment income (loss) to average net assets would have been 1.73%.
DTotal returns would have been lower if certain expenses had not been reduced during the applicable periods shown.
ETotal returns do not include the effect of the sales charges.
FFees and expenses of any underlying mutual funds or exchange-traded funds (ETFs) are not included in the Fund's expense ratio. The Fund indirectly bears its proportionate share of these expenses. For additional expense information related to investments in Fidelity Central Funds, please refer to the "Investments in Fidelity Central Funds" note found in the Notes to Financial Statements section of the most recent Annual or Semi-Annual report.
GExpense ratios reflect operating expenses of the class. Expenses before reductions do not reflect amounts reimbursed, waived, or reduced through arrangements with the investment adviser, brokerage services, or other offset arrangements, if applicable, and do not represent the amount paid by the class during periods when reimbursements, waivers or reductions occur.
HAmount does not include the portfolio activity of any underlying mutual funds or exchange-traded funds (ETFs).
IPortfolio turnover rate excludes securities received or delivered in-kind.
| Fidelity Advisor® International Value Fund Class M |
| |
| Years ended October 31, | | 2023 | | 2022 | | 2021 | | 2020 | | 2019 |
Selected Per-Share Data | | | | | | | | | | |
| Net asset value, beginning of period | $ | 7.63 | $ | 9.63 | $ | 6.86 | $ | 8.24 | $ | 8.11 |
| Income from Investment Operations | | | | | | | | | | |
Net investment income (loss) A,B | | .18 | | .22 | | .23 C | | .11 | | .23 |
| Net realized and unrealized gain (loss) | | 1.15 | | (1.87) | | 2.65 | | (1.25) | | .08 |
| Total from investment operations | | 1.33 | | (1.65) | | 2.88 | | (1.14) | | .31 |
| Distributions from net investment income | | (.12) | | (.35) | | (.11) | | (.21) | | (.18) |
| Distributions from net realized gain | | - | | - | | - | | (.03) | | - |
| Total distributions | | (.12) | | (.35) | | (.11) | | (.24) | | (.18) |
| Net asset value, end of period | $ | 8.84 | $ | 7.63 | $ | 9.63 | $ | 6.86 | $ | 8.24 |
Total Return D,E | | 17.45% | | (17.65)% | | 42.20% | | (14.29)% | | 4.11% |
Ratios to Average Net Assets B,F,G | | | | | | | | | | |
| Expenses before reductions | | 1.59% | | 1.72% | | 1.62% | | 1.57% | | 1.44% |
| Expenses net of fee waivers, if any | | 1.54% | | 1.55% | | 1.58% | | 1.57% | | 1.43% |
| Expenses net of all reductions | | 1.54% | | 1.55% | | 1.58% | | 1.55% | | 1.42% |
| Net investment income (loss) | | 1.97% | | 2.60% | | 2.51% C | | 1.44% | | 2.89% |
| Supplemental Data | | | | | | | | | | |
| Net assets, end of period (000 omitted) | $ | 4,196 | $ | 3,498 | $ | 4,375 | $ | 2,884 | $ | 3,756 |
Portfolio turnover rate H | | 29% | | 25% | | 29% I | | 36% | | 47% |
ACalculated based on average shares outstanding during the period.
BNet investment income (loss) is affected by the timing of the declaration of dividends by any underlying mutual funds or exchange-traded funds (ETFs). Net investment income (loss) of any mutual funds or ETFs is not included in the Fund's net investment income (loss) ratio.
CNet investment income per share reflects one or more large, non-recurring dividend(s) which amounted to $.09 per share. Excluding such non-recurring dividend(s), the ratio of net investment income (loss) to average net assets would have been 1.48%.
DTotal returns would have been lower if certain expenses had not been reduced during the applicable periods shown.
ETotal returns do not include the effect of the sales charges.
FFees and expenses of any underlying mutual funds or exchange-traded funds (ETFs) are not included in the Fund's expense ratio. The Fund indirectly bears its proportionate share of these expenses. For additional expense information related to investments in Fidelity Central Funds, please refer to the "Investments in Fidelity Central Funds" note found in the Notes to Financial Statements section of the most recent Annual or Semi-Annual report.
GExpense ratios reflect operating expenses of the class. Expenses before reductions do not reflect amounts reimbursed, waived, or reduced through arrangements with the investment adviser, brokerage services, or other offset arrangements, if applicable, and do not represent the amount paid by the class during periods when reimbursements, waivers or reductions occur.
HAmount does not include the portfolio activity of any underlying mutual funds or exchange-traded funds (ETFs).
IPortfolio turnover rate excludes securities received or delivered in-kind.
| Fidelity Advisor® International Value Fund Class C |
| |
| Years ended October 31, | | 2023 | | 2022 | | 2021 | | 2020 | | 2019 |
Selected Per-Share Data | | | | | | | | | | |
| Net asset value, beginning of period | $ | 7.64 | $ | 9.60 | $ | 6.85 | $ | 8.22 | $ | 8.08 |
| Income from Investment Operations | | | | | | | | | | |
Net investment income (loss) A,B | | .13 | | .18 | | .18 C | | .07 | | .19 |
| Net realized and unrealized gain (loss) | | 1.15 | | (1.87) | | 2.65 | | (1.24) | | .08 |
| Total from investment operations | | 1.28 | | (1.69) | | 2.83 | | (1.17) | | .27 |
| Distributions from net investment income | | (.07) | | (.27) | | (.08) | | (.17) | | (.13) |
| Distributions from net realized gain | | - | | - | | - | | (.03) | | - |
| Total distributions | | (.07) | | (.27) | | (.08) | | (.20) | | (.13) |
| Net asset value, end of period | $ | 8.85 | $ | 7.64 | $ | 9.60 | $ | 6.85 | $ | 8.22 |
Total Return D,E | | 16.74% | | (18.01)% | | 41.45% | | (14.67)% | | 3.53% |
Ratios to Average Net Assets B,F,G | | | | | | | | | | |
| Expenses before reductions | | 2.09% | | 2.23% | | 2.12% | | 2.07% | | 1.93% |
| Expenses net of fee waivers, if any | | 2.05% | | 2.05% | | 2.09% | | 2.07% | | 1.92% |
| Expenses net of all reductions | | 2.05% | | 2.05% | | 2.09% | | 2.05% | | 1.91% |
| Net investment income (loss) | | 1.46% | | 2.09% | | 2.00% C | | .94% | | 2.40% |
| Supplemental Data | | | | | | | | | | |
| Net assets, end of period (000 omitted) | $ | 2,366 | $ | 2,190 | $ | 3,177 | $ | 2,947 | $ | 3,839 |
Portfolio turnover rate H | | 29% | | 25% | | 29% I | | 36% | | 47% |
ACalculated based on average shares outstanding during the period.
BNet investment income (loss) is affected by the timing of the declaration of dividends by any underlying mutual funds or exchange-traded funds (ETFs). Net investment income (loss) of any mutual funds or ETFs is not included in the Fund's net investment income (loss) ratio.
CNet investment income per share reflects one or more large, non-recurring dividend(s) which amounted to $.09 per share. Excluding such non-recurring dividend(s), the ratio of net investment income (loss) to average net assets would have been .97%.
DTotal returns would have been lower if certain expenses had not been reduced during the applicable periods shown.
ETotal returns do not include the effect of the contingent deferred sales charge.
FFees and expenses of any underlying mutual funds or exchange-traded funds (ETFs) are not included in the Fund's expense ratio. The Fund indirectly bears its proportionate share of these expenses. For additional expense information related to investments in Fidelity Central Funds, please refer to the "Investments in Fidelity Central Funds" note found in the Notes to Financial Statements section of the most recent Annual or Semi-Annual report.
GExpense ratios reflect operating expenses of the class. Expenses before reductions do not reflect amounts reimbursed, waived, or reduced through arrangements with the investment adviser, brokerage services, or other offset arrangements, if applicable, and do not represent the amount paid by the class during periods when reimbursements, waivers or reductions occur.
HAmount does not include the portfolio activity of any underlying mutual funds or exchange-traded funds (ETFs).
IPortfolio turnover rate excludes securities received or delivered in-kind.
| Fidelity® International Value Fund |
| |
| Years ended October 31, | | 2023 | | 2022 | | 2021 | | 2020 | | 2019 |
Selected Per-Share Data | | | | | | | | | | |
| Net asset value, beginning of period | $ | 7.65 | $ | 9.66 | $ | 6.87 | $ | 8.25 | $ | 8.14 |
| Income from Investment Operations | | | | | | | | | | |
Net investment income (loss) A,B | | .22 | | .26 | | .28 C | | .15 | | .28 |
| Net realized and unrealized gain (loss) | | 1.15 | | (1.86) | | 2.66 | | (1.23) | | .07 |
| Total from investment operations | | 1.37 | | (1.60) | | 2.94 | | (1.08) | | .35 |
| Distributions from net investment income | | (.16) | | (.41) | | (.15) | | (.27) | | (.24) |
| Distributions from net realized gain | | - | | - | | - | | (.03) | | - |
| Total distributions | | (.16) | | (.41) | | (.15) | | (.30) | | (.24) |
| Net asset value, end of period | $ | 8.86 | $ | 7.65 | $ | 9.66 | $ | 6.87 | $ | 8.25 |
Total Return D | | 17.96% | | (17.20)% | | 43.08% | | (13.70)% | | 4.65% |
Ratios to Average Net Assets B,E,F | | | | | | | | | | |
| Expenses before reductions | | 1.01% | | 1.13% | | 1.01% | | .94% | | .79% |
| Expenses net of fee waivers, if any | | 1.01% | | 1.05% | | 1.01% | | .94% | | .78% |
| Expenses net of all reductions | | 1.01% | | 1.05% | | 1.01% | | .92% | | .78% |
| Net investment income (loss) | | 2.50% | | 3.10% | | 3.09% C | | 2.07% | | 3.54% |
| Supplemental Data | | | | | | | | | | |
| Net assets, end of period (000 omitted) | $ | 443,836 | $ | 367,478 | $ | 372,441 | $ | 406,661 | $ | 442,816 |
Portfolio turnover rate G | | 29% | | 25% | | 29% H | | 36% | | 47% |
ACalculated based on average shares outstanding during the period.
BNet investment income (loss) is affected by the timing of the declaration of dividends by any underlying mutual funds or exchange-traded funds (ETFs). Net investment income (loss) of any mutual funds or ETFs is not included in the Fund's net investment income (loss) ratio.
CNet investment income per share reflects one or more large, non-recurring dividend(s) which amounted to $.09 per share. Excluding such non-recurring dividend(s), the ratio of net investment income (loss) to average net assets would have been 2.05%.
DTotal returns would have been lower if certain expenses had not been reduced during the applicable periods shown.
EFees and expenses of any underlying mutual funds or exchange-traded funds (ETFs) are not included in the Fund's expense ratio. The Fund indirectly bears its proportionate share of these expenses. For additional expense information related to investments in Fidelity Central Funds, please refer to the "Investments in Fidelity Central Funds" note found in the Notes to Financial Statements section of the most recent Annual or Semi-Annual report.
FExpense ratios reflect operating expenses of the class. Expenses before reductions do not reflect amounts reimbursed, waived, or reduced through arrangements with the investment adviser, brokerage services, or other offset arrangements, if applicable, and do not represent the amount paid by the class during periods when reimbursements, waivers or reductions occur.
GAmount does not include the portfolio activity of any underlying mutual funds or exchange-traded funds (ETFs).
HPortfolio turnover rate excludes securities received or delivered in-kind.
| Fidelity Advisor® International Value Fund Class I |
| |
| Years ended October 31, | | 2023 | | 2022 | | 2021 | | 2020 | | 2019 |
Selected Per-Share Data | | | | | | | | | | |
| Net asset value, beginning of period | $ | 7.66 | $ | 9.67 | $ | 6.88 | $ | 8.26 | $ | 8.15 |
| Income from Investment Operations | | | | | | | | | | |
Net investment income (loss) A,B | | .22 | | .25 | | .28 C | | .15 | | .27 |
| Net realized and unrealized gain (loss) | | 1.15 | | (1.86) | | 2.66 | | (1.24) | | .08 |
| Total from investment operations | | 1.37 | | (1.61) | | 2.94 | | (1.09) | | .35 |
| Distributions from net investment income | | (.16) | | (.40) | | (.15) | | (.26) | | (.24) |
| Distributions from net realized gain | | - | | - | | - | | (.03) | | - |
| Total distributions | | (.16) | | (.40) | | (.15) | | (.29) | | (.24) |
| Net asset value, end of period | $ | 8.87 | $ | 7.66 | $ | 9.67 | $ | 6.88 | $ | 8.26 |
Total Return D | | 17.97% | | (17.23)% | | 43.05% | | (13.75)% | | 4.57% |
Ratios to Average Net Assets B,E,F | | | | | | | | | | |
| Expenses before reductions | | 1.02% | | 1.09% | | 1.07% | | .98% | | .86% |
| Expenses net of fee waivers, if any | | 1.01% | | 1.04% | | 1.05% | | .98% | | .85% |
| Expenses net of all reductions | | 1.01% | | 1.04% | | 1.05% | | .97% | | .85% |
| Net investment income (loss) | | 2.50% | | 3.10% | | 3.05% C | | 2.03% | | 3.47% |
| Supplemental Data | | | | | | | | | | |
| Net assets, end of period (000 omitted) | $ | 91,052 | $ | 74,751 | $ | 6,661 | $ | 10,406 | $ | 8,495 |
Portfolio turnover rate G | | 29% | | 25% | | 29% H | | 36% | | 47% |
ACalculated based on average shares outstanding during the period.
BNet investment income (loss) is affected by the timing of the declaration of dividends by any underlying mutual funds or exchange-traded funds (ETFs). Net investment income (loss) of any mutual funds or ETFs is not included in the Fund's net investment income (loss) ratio.
CNet investment income per share reflects one or more large, non-recurring dividend(s) which amounted to $.10 per share. Excluding such non-recurring dividend(s), the ratio of net investment income (loss) to average net assets would have been 2.01%.
DTotal returns would have been lower if certain expenses had not been reduced during the applicable periods shown.
EFees and expenses of any underlying mutual funds or exchange-traded funds (ETFs) are not included in the Fund's expense ratio. The Fund indirectly bears its proportionate share of these expenses. For additional expense information related to investments in Fidelity Central Funds, please refer to the "Investments in Fidelity Central Funds" note found in the Notes to Financial Statements section of the most recent Annual or Semi-Annual report.
FExpense ratios reflect operating expenses of the class. Expenses before reductions do not reflect amounts reimbursed, waived, or reduced through arrangements with the investment adviser, brokerage services, or other offset arrangements, if applicable, and do not represent the amount paid by the class during periods when reimbursements, waivers or reductions occur.
GAmount does not include the portfolio activity of any underlying mutual funds or exchange-traded funds (ETFs).
HPortfolio turnover rate excludes securities received or delivered in-kind.
| Fidelity Advisor® International Value Fund Class Z |
| |
| Years ended October 31, | | 2023 | | 2022 | | 2021 | | 2020 | | 2019 |
Selected Per-Share Data | | | | | | | | | | |
| Net asset value, beginning of period | $ | 7.66 | $ | 9.67 | $ | 6.87 | $ | 8.25 | $ | 8.14 |
| Income from Investment Operations | | | | | | | | | | |
Net investment income (loss) A,B | | .24 | | .26 | | .30 C | | .16 | | .29 |
| Net realized and unrealized gain (loss) | | 1.15 | | (1.86) | | 2.65 | | (1.23) | | .08 |
| Total from investment operations | | 1.39 | | (1.60) | | 2.95 | | (1.07) | | .37 |
| Distributions from net investment income | | (.17) | | (.41) | | (.15) | | (.28) | | (.26) |
| Distributions from net realized gain | | - | | - | | - | | (.03) | | - |
| Total distributions | | (.17) | | (.41) | | (.15) | | (.31) | | (.26) |
| Net asset value, end of period | $ | 8.88 | $ | 7.66 | $ | 9.67 | $ | 6.87 | $ | 8.25 |
Total Return D | | 18.20% | | (17.13)% | | 43.35% | | (13.58)% | | 4.84% |
Ratios to Average Net Assets B,E,F | | | | | | | | | | |
| Expenses before reductions | | .87% | | .94% | | .89% | | .82% | | .67% |
| Expenses net of fee waivers, if any | | .86% | | .89% | | .89% | | .82% | | .67% |
| Expenses net of all reductions | | .86% | | .89% | | .89% | | .81% | | .66% |
| Net investment income (loss) | | 2.65% | | 3.25% | | 3.21% C | | 2.19% | | 3.66% |
| Supplemental Data | | | | | | | | | | |
| Net assets, end of period (000 omitted) | $ | 158,601 | $ | 118,176 | $ | 11,946 | $ | 2,549 | $ | 2,249 |
Portfolio turnover rate G | | 29% | | 25% | | 29% H | | 36% | | 47% |
ACalculated based on average shares outstanding during the period.
BNet investment income (loss) is affected by the timing of the declaration of dividends by any underlying mutual funds or exchange-traded funds (ETFs). Net investment income (loss) of any mutual funds or ETFs is not included in the Fund's net investment income (loss) ratio.
CNet investment income per share reflects one or more large, non-recurring dividend(s) which amounted to $.10 per share. Excluding such non-recurring dividend(s), the ratio of net investment income (loss) to average net assets would have been 2.17%.
DTotal returns would have been lower if certain expenses had not been reduced during the applicable periods shown.
EFees and expenses of any underlying mutual funds or exchange-traded funds (ETFs) are not included in the Fund's expense ratio. The Fund indirectly bears its proportionate share of these expenses. For additional expense information related to investments in Fidelity Central Funds, please refer to the "Investments in Fidelity Central Funds" note found in the Notes to Financial Statements section of the most recent Annual or Semi-Annual report.
FExpense ratios reflect operating expenses of the class. Expenses before reductions do not reflect amounts reimbursed, waived, or reduced through arrangements with the investment adviser, brokerage services, or other offset arrangements, if applicable, and do not represent the amount paid by the class during periods when reimbursements, waivers or reductions occur.
GAmount does not include the portfolio activity of any underlying mutual funds or exchange-traded funds (ETFs).
HPortfolio turnover rate excludes securities received or delivered in-kind.
For the period ended October 31, 2023
1. Organization.
Fidelity International Value Fund (the Fund) is a fund of Fidelity Investment Trust (the Trust) and is authorized to issue an unlimited number of shares. The Trust is registered under the Investment Company Act of 1940, as amended (the 1940 Act), as an open-end management investment company organized as a Massachusetts business trust. The Fund offers Class A, Class M, Class C, International Value, Class I and Class Z shares, each of which has equal rights as to assets and voting privileges. Class A, Class M, Class C, Class I and Class Z are Fidelity Advisor classes. Each class has exclusive voting rights with respect to matters that affect that class. Class C shares will automatically convert to Class A shares after a holding period of eight years from the initial date of purchase, with certain exceptions.
2. Investments in Fidelity Central Funds.
Funds may invest in Fidelity Central Funds, which are open-end investment companies generally available only to other investment companies and accounts managed by the investment adviser and its affiliates. The Schedule of Investments lists any Fidelity Central Funds held as an investment as of period end, but does not include the underlying holdings of each Fidelity Central Fund. An investing fund indirectly bears its proportionate share of the expenses of the underlying Fidelity Central Funds.
Based on its investment objective, each Fidelity Central Fund may invest or participate in various investment vehicles or strategies that are similar to those of the investing fund. These strategies are consistent with the investment objectives of the investing fund and may involve certain economic risks which may cause a decline in value of each of the Fidelity Central Funds and thus a decline in the value of the investing fund.
| Fidelity Central Fund | Investment Manager | Investment Objective | Investment Practices | Expense RatioA |
| Fidelity Money Market Central Funds | Fidelity Management & Research Company LLC (FMR) | Each fund seeks to obtain a high level of current income consistent with the preservation of capital and liquidity. | Short-term Investments | Less than .005% |
A Expenses expressed as a percentage of average net assets and are as of each underlying Central Fund's most recent annual or semi-annual shareholder report.
A complete unaudited list of holdings for each Fidelity Central Fund is available upon request or at the Securities and Exchange Commission website at www.sec.gov. In addition, the financial statements of the Fidelity Central Funds which contain the significant accounting policies (including investment valuation policies) of those funds, and are not covered by the Report of Independent Registered Public Accounting Firm, are available on the Securities and Exchange Commission website or upon request.
3. Significant Accounting Policies.
The Fund is an investment company and applies the accounting and reporting guidance of the Financial Accounting Standards Board (FASB) Accounting Standards Codification Topic 946 Financial Services - Investment Companies. The financial statements have been prepared in conformity with accounting principles generally accepted in the United States of America (GAAP), which require management to make certain estimates and assumptions at the date of the financial statements. Actual results could differ from those estimates. Subsequent events, if any, through the date that the financial statements were issued have been evaluated in the preparation of the financial statements. The Fund's Schedule of Investments lists any underlying mutual funds or exchange-traded funds (ETFs) but does not include the underlying holdings of these funds. The following summarizes the significant accounting policies of the Fund:
Investment Valuation. Investments are valued as of 4:00 p.m. Eastern time on the last calendar day of the period. The Board of Trustees (the Board) has designated the Fund's investment adviser as the valuation designee responsible for the fair valuation function and performing fair value determinations as needed. The investment adviser has established a Fair Value Committee (the Committee) to carry out the day-to-day fair valuation responsibilities and has adopted policies and procedures to govern the fair valuation process and the activities of the Committee. In accordance with these fair valuation policies and procedures, which have been approved by the Board, the Fund attempts to obtain prices from one or more third party pricing services or brokers to value its investments. When current market prices, quotations or currency exchange rates are not readily available or reliable, investments will be fair valued in good faith by the Committee, in accordance with the policies and procedures. Factors used in determining fair value vary by investment type and may include market or investment specific events, transaction data, estimated cash flows, and market observations of comparable investments. The frequency that the fair valuation procedures are used cannot be predicted and they may be utilized to a significant extent. The Committee manages the Fund's fair valuation practices and maintains the fair valuation policies and procedures. The Fund's investment adviser reports to the Board information regarding the fair valuation process and related material matters.
The Fund categorizes the inputs to valuation techniques used to value its investments into a disclosure hierarchy consisting of three levels as shown below:
Level 1 - unadjusted quoted prices in active markets for identical investments
Level 2 - other significant observable inputs (including quoted prices for similar investments, interest rates, prepayment speeds, etc.)
Level 3 - unobservable inputs (including the Fund's own assumptions based on the best information available)
Valuation techniques used to value the Fund's investments by major category are as follows:
Equity securities, including restricted securities, for which market quotations are readily available, are valued at the last reported sale price or official closing price as reported by a third party pricing service on the primary market or exchange on which they are traded and are categorized as Level 1 in the hierarchy. In the event there were no sales during the day or closing prices are not available, securities are valued at the last quoted bid price or may be valued using the last available price and are generally categorized as Level 2 in the hierarchy. For foreign equity securities, when market or security specific events arise, comparisons to the valuation of American Depositary Receipts (ADRs), futures contracts, Exchange-Traded Funds (ETFs) and certain indexes as well as quoted prices for similar securities may be used and would be categorized as Level 2 in the hierarchy. For equity securities, including restricted securities, where observable inputs are limited, assumptions about market activity and risk are used and these securities may be categorized as Level 3 in the hierarchy.
Investments in open-end mutual funds, including the Fidelity Central Funds, are valued at their closing net asset value (NAV) each business day and are categorized as Level 1 in the hierarchy.
Changes in valuation techniques may result in transfers in or out of an assigned level within the disclosure hierarchy. The aggregate value of investments by input level as of October 31, 2023 is included at the end of the Fund's Schedule of Investments.
Foreign Currency. Certain Funds may use foreign currency contracts to facilitate transactions in foreign-denominated securities. Gains and losses from these transactions may arise from changes in the value of the foreign currency or if the counterparties do not perform under the contracts' terms.
Foreign-denominated assets, including investment securities, and liabilities are translated into U.S. dollars at the exchange rates at period end. Purchases and sales of investment securities, income and dividends received, and expenses denominated in foreign currencies are translated into U.S. dollars at the exchange rate in effect on the transaction date.
The effects of exchange rate fluctuations on investments are included with the net realized and unrealized gain (loss) on investment securities. Other foreign currency transactions resulting in realized and unrealized gain (loss) are disclosed separately.
Investment Transactions and Income. For financial reporting purposes, the Fund's investment holdings and NAV include trades executed through the end of the last business day of the period. The NAV per share for processing shareholder transactions is calculated as of the close of business of the New York Stock Exchange (NYSE), normally 4:00 p.m. Eastern time and includes trades executed through the end of the prior business day. Gains and losses on securities sold are determined on the basis of identified cost and include proceeds received from litigation. Commissions paid to certain brokers with whom the investment adviser, or its affiliates, places trades on behalf of a fund include an amount in addition to trade execution, which may be rebated back to a fund. Any such rebates are included in net realized gain (loss) on investments in the Statement of Operations. Dividend income is recorded on the ex-dividend date, except for certain dividends from foreign securities where the ex-dividend date may have passed, which are recorded as soon as the Fund is informed of the ex-dividend date. Non-cash dividends included in dividend income, if any, are recorded at the fair market value of the securities received. Income and capital gain distributions from Fidelity Central Funds, if any, are recorded on the ex-dividend date. Investment income is recorded net of foreign taxes withheld where recovery of such taxes is uncertain. Funds may file withholding tax reclaims in certain jurisdictions to recover a portion of amounts previously withheld. Any withholding tax reclaims income is included in the Statement of Operations in foreign taxes withheld. Any receivables for withholding tax reclaims are included in the Statement of Assets and Liabilities in reclaims receivable.
Class Allocations and Expenses. Investment income, realized and unrealized capital gains and losses, common expenses of a fund, and certain fund-level expense reductions, if any, are allocated daily on a pro-rata basis to each class based on the relative net assets of each class to the total net assets of a fund. Each class differs with respect to transfer agent and distribution and service plan fees incurred, as applicable. Certain expense reductions may also differ by class, if applicable. For the reporting period, the allocated portion of income and expenses to each class as a percent of its average net assets may vary due to the timing of recording these transactions in relation to fluctuating net assets of the classes. Expenses directly attributable to a fund are charged to that fund. Expenses attributable to more than one fund are allocated among the respective funds on the basis of relative net assets or other appropriate methods. Expenses included in the accompanying financial statements reflect the expenses of that fund and do not include any expenses associated with any underlying mutual funds or exchange-traded funds (ETFs). Although not included in a fund's expenses, a fund indirectly bears its proportionate share of these expenses through the net asset value of each underlying mutual fund or exchange-traded fund (ETF). Expense estimates are accrued in the period to which they relate and adjustments are made when actual amounts are known.
Income Tax Information and Distributions to Shareholders. Each year, the Fund intends to qualify as a regulated investment company under Subchapter M of the Internal Revenue Code, including distributing substantially all of its taxable income and realized gains. As a result, no provision for U.S. Federal income taxes is required. As of October 31, 2023, the Fund did not have any unrecognized tax benefits in the financial statements; nor is the Fund aware of any tax positions for which it is reasonably possible that the total amounts of unrecognized tax benefits will significantly change in the next twelve months. The Fund files a U.S. federal tax return, in addition to state and local tax returns as required. The Fund's federal income tax returns are subject to examination by the Internal Revenue Service (IRS) for a period of three fiscal years after they are filed. State and local tax returns may be subject to examination for an additional fiscal year depending on the jurisdiction. Foreign taxes are provided for based on the Fund's understanding of the tax rules and rates that exist in the foreign markets in which it invests.
Distributions are declared and recorded on the ex-dividend date. Income and capital gain distributions are declared separately for each class. Income and capital gain distributions are determined in accordance with income tax regulations, which may differ from GAAP. In addition, the Fund claimed a portion of the payment made to redeeming shareholders as a distribution for income tax purposes.
Capital accounts within the financial statements are adjusted for permanent book-tax differences. These adjustments have no impact on net assets or the results of operations. Capital accounts are not adjusted for temporary book-tax differences which will reverse in a subsequent period.
Book-tax differences are primarily due to foreign currency transactions, passive foreign investment companies (PFIC), capital loss carryforwards and losses deferred due to wash sales.
As of period end, the cost and unrealized appreciation (depreciation) in securities, and derivatives if applicable, for federal income tax purposes were as follows:
| Gross unrealized appreciation | $91,798,658 |
| Gross unrealized depreciation | (45,377,564) |
| Net unrealized appreciation (depreciation) | $46,421,094 |
| Tax Cost | $668,308,147 |
The tax-based components of distributable earnings as of period end were as follows:
| Undistributed ordinary income | $15,303,650 |
| Capital loss carryforward | $(89,644,217) |
| Net unrealized appreciation (depreciation) on securities and other investments | $46,316,760 |
Capital loss carryforwards are only available to offset future capital gains of the Fund to the extent provided by regulations and may be limited. The capital loss carryforward information presented below, including any applicable limitation, is estimated as of fiscal period end and is subject to adjustment.
Short-term | $(32,623,835) |
Long-term | (57,020,382) |
| Total capital loss carryforward | $(89,644,217) |
| |
Due to large redemptions in a prior period, approximately $32,806,036 of the Fund's realized capital losses are subject to limitation. Due to this limitation, the Fund will only be permitted to use approximately $5,836,972 of those capital losses per year to offset capital gains.
The tax character of distributions paid was as follows:
| | October 31, 2023 | October 31, 2022 |
| Ordinary Income | $11,902,522 | $ 17,928,873 |
| Total | $11,902,522 | $ 17,928,873 |
Restricted Securities (including Private Placements). Funds may invest in securities that are subject to legal or contractual restrictions on resale. These securities generally may be resold in transactions exempt from registration or to the public if the securities are registered. Disposal of these securities may involve time-consuming negotiations and expense, and prompt sale at an acceptable price may be difficult. Information regarding restricted securities held at period end is included at the end of the Schedule of Investments, if applicable.
4. Purchases and Sales of Investments.
Purchases and sales of securities, other than short-term securities and in-kind transactions, as applicable, are noted in the table below.
| | Purchases ($) | Sales ($) |
| Fidelity International Value Fund | 252,528,519 | 198,061,823 |
5. Fees and Other Transactions with Affiliates.
Management Fee. Fidelity Management & Research Company LLC (the investment adviser) and its affiliates provide the Fund with investment management related services for which the Fund pays a monthly management fee. The management fee is the sum of an individual fund fee rate that is based on an annual rate of .45% of the Fund's average net assets and an annualized group fee rate that averaged .23% during the period. The group fee rate is based upon the monthly average net assets of a group of registered investment companies with which the investment adviser has management contracts. The group fee rate decreases as assets under management increase and increases as assets under management decrease. In addition, the management fee is subject to a performance adjustment (up to a maximum of +/- .20% of the Fund's average net assets over a 36 month performance period). The upward or downward adjustment to the management fee is based on the relative investment performance of International Value as compared to its benchmark index, the MSCI EAFE Value Index, over the same 36 month performance period. For the reporting period, the total annual management fee rate, including the performance adjustment, was .74% of the Fund's average net assets. The performance adjustment included in the management fee rate may be higher or lower than the maximum performance adjustment rate due to the difference between the average net assets for the reporting and performance periods.
Distribution and Service Plan Fees. In accordance with Rule 12b-1 of the 1940 Act, the Fund has adopted separate Distribution and Service Plans for each class of shares. Certain classes pay Fidelity Distributors Company LLC (FDC), an affiliate of the investment adviser, separate Distribution and Service Fees, each of which is based on an annual percentage of each class' average net assets. In addition, FDC may pay financial intermediaries for selling shares of the Fund and providing shareholder support services. For the period, the Distribution and Service Fee rates, total fees and amounts retained by FDC were as follows:
| | Distribution Fee | Service Fee | Total Fees | Retained by FDC |
| Class A | - % | .25% | $39,797 | $4,051 |
| Class M | .25% | .25% | 21,510 | 16 |
| Class C | .75% | .25% | 25,283 | 3,254 |
| | | | $86,590 | $7,321 |
Sales Load. FDC may receive a front-end sales charge of up to 5.75% for selling Class A shares and 3.50% for selling Class M shares, some of which is paid to financial intermediaries for selling shares of the Fund. Depending on the holding period, FDC may receive contingent deferred sales charges levied on Class A, Class M and Class C redemptions. The deferred sales charges are 1.00% for Class C shares, 1.00% for certain purchases of Class A shares and .25% for certain purchases of Class M shares.
For the period, sales charge amounts retained by FDC were as follows:
| | Retained by FDC |
| Class A | $ 7,660 |
| Class M | 376 |
Class CA | 155 |
| | $8,191 |
A When Class C shares are initially sold, FDC pays commissions from its own resources to financial intermediaries through which the sales are made.
Transfer Agent Fees. Fidelity Investments Institutional Operations Company LLC (FIIOC), an affiliate of the investment adviser, is the transfer, dividend disbursing and shareholder servicing agent for each class of the Fund. FIIOC receives account fees and asset-based fees that vary according to the account size and type of account of the shareholders of the respective classes of the Fund, except for Class Z. FIIOC receives an asset-based fee of Class Z's average net assets. FIIOC pays for typesetting, printing and mailing of shareholder reports, except proxy statements.
For the period, transfer agent fees for each class were as follows:
| | Amount | % of Class-Level Average Net Assets |
| Class A | $ 40,039 | .25 |
| Class M | 11,011 | .26 |
| Class C | 6,501 | .26 |
| International Value | 828,361 | .19 |
| Class I | 180,764 | .19 |
| Class Z | 65,762 | .04 |
| | $1,132,438 | |
During November 2023, the Board approved a change in the transfer agent fees effective December 1, 2023 to a fixed annual rate of class-level average net assets as follows:
| | % of Class-Level Average Net Assets |
| Class A | 0.2000% |
| Class M | 0.2000% |
| Class C | 0.2000% |
| International Value | 0.1862% |
| Class I | 0.1887% |
Accounting Fees. Fidelity Service Company, Inc. (FSC), an affiliate of the investment adviser, maintains the Fund's accounting records. The accounting fee is based on the level of average net assets for each month. For the period, the fees were equivalent to the following annual rates:
| | % of Average Net Assets |
| Fidelity International Value Fund | .05 |
During November 2023, the Board approved a change in the accounting fees effective December 1, 2023 to a fixed annual rate of average net assets as follows:
| | % of Average Net Assets |
| Fidelity International Value Fund | 0.0464% |
Brokerage Commissions. A portion of portfolio transactions were placed with brokerage firms which are affiliates of the investment adviser. Brokerage commissions are included in net realized gain (loss) and change in net unrealized appreciation (depreciation) in the Statement of Operations. The commissions paid to these affiliated firms were as follows:
| | Amount |
| Fidelity International Value Fund | $ 155 |
Interfund Lending Program. Pursuant to an Exemptive Order issued by the Securities and Exchange Commission (the SEC), the Fund, along with other registered investment companies having management contracts with Fidelity Management & Research Company LLC (FMR), or other affiliated entities of FMR, may participate in an interfund lending program. This program provides an alternative credit facility allowing the Fund to borrow from, or lend money to, other participating affiliated funds. At period end, no interfund loans outstanding. Activity in this program during the period for which loans were outstanding was as follows:
| | Borrower or Lender | Average Loan Balance | Weighted Average Interest Rate | Interest Expense |
| Fidelity International Value Fund | Borrower | $ 1,485,200 | 5.32% | $1,097 |
Interfund Trades. Funds may purchase from or sell securities to other Fidelity Funds under procedures adopted by the Board. The procedures have been designed to ensure these interfund trades are executed in accordance with Rule 17a-7 of the 1940 Act. Any interfund trades are included within the respective purchases and sales amounts shown in the Purchases and Sales of Investments note. Interfund trades during the period are noted in the table below.
| | Purchases ($) | Sales ($) | Realized Gain (Loss) ($) |
| Fidelity International Value Fund | 21,568,564 | 2,257,633 | 29,117 |
6. Committed Line of Credit.
Certain Funds participate with other funds managed by the investment adviser or an affiliate in a $4.25 billion credit facility (the "line of credit") to be utilized for temporary or emergency purposes to fund shareholder redemptions or for other short-term liquidity purposes. The participating funds have agreed to pay commitment fees on their pro-rata portion of the line of credit, which are reflected in Miscellaneous expenses on the Statement of Operations, and are listed below. During the period, there were no borrowings on this line of credit.
| | Amount |
| Fidelity International Value Fund | $1,281 |
7. Security Lending.
Funds lend portfolio securities from time to time in order to earn additional income. Lending agents are used, including National Financial Services (NFS), an affiliate of the investment adviser. Pursuant to a securities lending agreement, NFS will receive a fee, which is capped at 9.9% of a fund's daily lending revenue, for its services as lending agent. A fund may lend securities to certain qualified borrowers, including NFS. On the settlement date of the loan, a fund receives collateral (in the form of U.S. Treasury obligations, letters of credit and/or cash) against the loaned securities and maintains collateral in an amount not less than 100% of the market value of the loaned securities during the period of the loan. The market value of the loaned securities is determined at the close of business of a fund and any additional required collateral is delivered to a fund on the next business day. A fund or borrower may terminate the loan at any time, and if the borrower defaults on its obligation to return the securities loaned because of insolvency or other reasons, a fund may apply collateral received from the borrower against the obligation. A fund may experience delays and costs in recovering the securities loaned. Any cash collateral received is invested in the Fidelity Securities Lending Cash Central Fund. Any loaned securities are identified as such in the Schedule of Investments, and the value of loaned securities and cash collateral at period end, as applicable, are presented in the Statement of Assets and Liabilities. Security lending income represents the income earned on investing cash collateral, less rebates paid to borrowers and any lending agent fees associated with the loan, plus any premium payments received for lending certain types of securities. Security lending income is presented in the Statement of Operations as a component of income from Fidelity Central Funds. Affiliated security lending activity, if any, was as follows:
| | Total Security Lending Fees Paid to NFS | Security Lending Income From Securities Loaned to NFS | Value of Securities Loaned to NFS at Period End |
| Fidelity International Value Fund | $17,890 | $ - | $- |
8. Expense Reductions.
The investment adviser contractually agreed to reimburse expenses of each class to the extent annual operating expenses exceeded certain levels of class-level average net assets as noted in the table below. This reimbursement will remain in place through February 28, 2025. Some expenses, for example the compensation of the independent Trustees, and certain miscellaneous expenses such as proxy and shareholder meeting expenses, are excluded from this reimbursement.
The following classes were in reimbursement during the period:
| | Expense Limitations | Reimbursement |
| Class A | 1.30% | $ 4,181 |
| Class M | 1.55% | 1,483 |
| Class C | 2.05% | 974 |
| | | $6,638 |
Through arrangements with the Fund's custodian and each class' transfer agent, credits realized as a result of certain uninvested cash balances were used to reduce the Fund's expenses. During the period, custodian credits reduced the Fund's expenses by $59. During the period, transfer agent credits reduced each class' expenses as noted in the table below.
| | Expense reduction |
| | |
| Class M | 133 |
| | $133 |
In addition, during the period the investment adviser or an affiliate reimbursed and/or waived a portion of fund-level operating expenses in the amount of $44,237.
9. Distributions to Shareholders.
Distributions to shareholders of each class were as follows:
| | Year ended October 31, 2023 | Year ended October 31, 2022 |
| Fidelity International Value Fund | | |
| Distributions to shareholders | | |
| Class A | $ 221,998 | $431,993 |
| Class M | 54,560 | 159,041 |
| Class C | 19,445 | 89,688 |
| International Value | 7,434,045 | 16,448,559 |
| Class I | 1,572,298 | 270,723 |
| Class Z | 2,600,176 | 528,869 |
Total | $11,902,522 | $17,928,873 |
10. Share Transactions.
Share transactions for each class were as follows and may contain in-kind transactions, automatic conversions between classes or exchanges between affiliated funds:
| | Shares | Shares | Dollars | Dollars |
| | Year ended October 31, 2023 | Year ended October 31, 2022 | Year ended October 31, 2023 | Year ended October 31, 2022 |
| Fidelity International Value Fund | | | | |
| Class A | | | | |
| Shares sold | 623,112 | 816,905 | $5,518,527 | $7,279,150 |
| Reinvestment of distributions | 26,113 | 47,745 | 219,873 | 425,405 |
| Shares redeemed | (293,310) | (378,549) | (2,616,908) | (3,283,758) |
| Net increase (decrease) | 355,915 | 486,101 | $3,121,492 | $4,420,797 |
| Class M | | | | |
| Shares sold | 71,877 | 71,311 | $625,739 | $629,674 |
| Reinvestment of distributions | 6,304 | 17,121 | 53,141 | 152,718 |
| Shares redeemed | (61,576) | (84,453) | (547,185) | (750,679) |
| Net increase (decrease) | 16,605 | 3,979 | $131,695 | $31,713 |
| Class C | | | | |
| Shares sold | 71,043 | 59,969 | $632,329 | $543,223 |
| Reinvestment of distributions | 2,290 | 9,999 | 19,445 | 89,688 |
| Shares redeemed | (92,669) | (114,149) | (826,342) | (968,490) |
| Net increase (decrease) | (19,336) | (44,181) | $(174,568) | $(335,579) |
| International Value | | | | |
| Shares sold | 14,718,149 | 32,895,367 | $131,108,890 | $280,320,847 |
| Reinvestment of distributions | 764,993 | 1,569,596 | 6,441,242 | 13,969,404 |
| Shares redeemed | (13,435,468) | (24,973,804) | (119,112,195) | (203,231,278) |
| Net increase (decrease) | 2,047,674 | 9,491,159 | $18,437,937 | $91,058,973 |
| Class I | | | | |
| Shares sold | 6,837,587 | 11,031,616 | $61,109,496 | $92,417,643 |
| Reinvestment of distributions | 184,152 | 29,506 | 1,552,405 | 263,195 |
| Shares redeemed | (6,517,142) | (1,992,300) | (59,256,457) | (15,704,798) |
| Net increase (decrease) | 504,597 | 9,068,822 | $3,405,444 | $76,976,040 |
| Class Z | | | | |
| Shares sold | 10,634,134 | 17,947,816 | $95,268,462 | $150,148,371 |
| Reinvestment of distributions | 273,689 | 56,409 | 2,304,458 | 502,041 |
| Shares redeemed | (8,469,262) | (3,811,522) | (77,027,430) | (31,174,409) |
| Net increase (decrease) | 2,438,561 | 14,192,703 | $20,545,490 | $119,476,003 |
11. Other.
A fund's organizational documents provide former and current trustees and officers with a limited indemnification against liabilities arising in connection with the performance of their duties to the fund. In the normal course of business, a fund may also enter into contracts that provide general indemnifications. A fund's maximum exposure under these arrangements is unknown as this would be dependent on future claims that may be made against a fund. The risk of material loss from such claims is considered remote.
Mutual funds managed by the investment adviser or its affiliates, in aggregate, were the owners of record of more than 20% of the total outstanding shares.
| Fund | % of shares held |
| Fidelity International Value Fund | 22% |
12. Risk and Uncertainties.
Many factors affect a fund's performance. Developments that disrupt global economies and financial markets, such as pandemics, epidemics, outbreaks of infectious diseases, war, terrorism, and environmental disasters, may significantly affect a fund's investment performance. The effects of these developments to a fund will be impacted by the types of securities in which a fund invests, the financial condition, industry, economic sector, and geographic location of an issuer, and a fund's level of investment in the securities of that issuer. Significant concentrations in security types, issuers, industries, sectors, and geographic locations may magnify the factors that affect a fund's performance.
To the Board of Trustees of Fidelity Investment Trust and the Shareholders of Fidelity International Value Fund:
Opinion on the Financial Statements and Financial Highlights
We have audited the accompanying statement of assets and liabilities of Fidelity International Value Fund (the "Fund"), a fund of Fidelity Investment Trust, including the schedule of investments, as of October 31, 2023, the related statement of operations for the year then ended, the statement of changes in net assets for each of the two years in the period then ended, the financial highlights for each of the five years in the period then ended, and the related notes. In our opinion, the financial statements and financial highlights present fairly, in all material respects, the financial position of the Fund as of October 31, 2023, and the results of its operations for the year then ended, the changes in its net assets for each of the two years in the period then ended, and the financial highlights for each of the five years in the period then ended in conformity with accounting principles generally accepted in the United States of America.
Basis for Opinion
These financial statements and financial highlights are the responsibility of the Fund's management. Our responsibility is to express an opinion on the Fund's financial statements and financial highlights based on our audits. We are a public accounting firm registered with the Public Company Accounting Oversight Board (United States) (PCAOB) and are required to be independent with respect to the Fund in accordance with the U.S. federal securities laws and the applicable rules and regulations of the Securities and Exchange Commission and the PCAOB.
We conducted our audits in accordance with the standards of the PCAOB. Those standards require that we plan and perform the audit to obtain reasonable assurance about whether the financial statements and financial highlights are free of material misstatement, whether due to error or fraud. The Fund is not required to have, nor were we engaged to perform, an audit of its internal control over financial reporting. As part of our audits we are required to obtain an understanding of internal control over financial reporting but not for the purpose of expressing an opinion on the effectiveness of the Fund's internal control over financial reporting. Accordingly, we express no such opinion.
Our audits included performing procedures to assess the risks of material misstatement of the financial statements and financial highlights, whether due to error or fraud, and performing procedures that respond to those risks. Such procedures included examining, on a test basis, evidence regarding the amounts and disclosures in the financial statements and financial highlights. Our audits also included evaluating the accounting principles used and significant estimates made by management, as well as evaluating the overall presentation of the financial statements and financial highlights. Our procedures included confirmation of securities owned as of October 31, 2023, by correspondence with the custodian and brokers; when replies were not received from brokers, we performed other auditing procedures. We believe that our audits provide a reasonable basis for our opinion.
/s/ Deloitte & Touche LLP
Boston, Massachusetts
December 14, 2023
We have served as the auditor of one or more of the Fidelity investment companies since 1999.
The Trustees, Members of the Advisory Board (if any), and officers of the trust and fund, as applicable, are listed below. The Board of Trustees governs the fund and is responsible for protecting the interests of shareholders. The Trustees are experienced executives who meet periodically throughout the year to oversee the fund's activities, review contractual arrangements with companies that provide services to the fund, oversee management of the risks associated with such activities and contractual arrangements, and review the fund's performance. Except for Jonathan Chiel, each of the Trustees oversees 322 funds. Mr. Chiel oversees 191 funds.
The Trustees hold office without limit in time except that (a) any Trustee may resign; (b) any Trustee may be removed by written instrument, signed by at least two-thirds of the number of Trustees prior to such removal; (c) any Trustee who requests to be retired or who has become incapacitated by illness or injury may be retired by written instrument signed by a majority of the other Trustees; and (d) any Trustee may be removed at any special meeting of shareholders by a two-thirds vote of the outstanding voting securities of the trust. Each Trustee who is not an interested person (as defined in the 1940 Act) of the trust and the fund is referred to herein as an Independent Trustee. Each Independent Trustee shall retire not later than the last day of the calendar year in which his or her 75th birthday occurs. The Independent Trustees may waive this mandatory retirement age policy with respect to individual Trustees. Officers and Advisory Board Members hold office without limit in time, except that any officer or Advisory Board Member may resign or may be removed by a vote of a majority of the Trustees at any regular meeting or any special meeting of the Trustees. Except as indicated, each individual has held the office shown or other offices in the same company for the past five years.
The fund's Statement of Additional Information (SAI) includes more information about the Trustees. To request a free copy, call Fidelity at 1-800-544-8544 if you're an individual investing directly with Fidelity, call 1-800-835-5092 if you're a plan sponsor or participant with Fidelity as your recordkeeper or call 1-877-208-0098 on institutional accounts or if you're an advisor or invest through one.
Experience, Skills, Attributes, and Qualifications of the Trustees. The Governance and Nominating Committee has adopted a statement of policy that describes the experience, qualifications, attributes, and skills that are necessary and desirable for potential Independent Trustee candidates (Statement of Policy). The Board believes that each Trustee satisfied at the time he or she was initially elected or appointed a Trustee, and continues to satisfy, the standards contemplated by the Statement of Policy. The Governance and Nominating Committee also engages professional search firms to help identify potential Independent Trustee candidates who have the experience, qualifications, attributes, and skills consistent with the Statement of Policy. From time to time, additional criteria based on the composition and skills of the current Independent Trustees, as well as experience or skills that may be appropriate in light of future changes to board composition, business conditions, and regulatory or other developments, have also been considered by the professional search firms and the Governance and Nominating Committee. In addition, the Board takes into account the Trustees' commitment and participation in Board and committee meetings, as well as their leadership of standing and ad hoc committees throughout their tenure.
In determining that a particular Trustee was and continues to be qualified to serve as a Trustee, the Board has considered a variety of criteria, none of which, in isolation, was controlling. The Board believes that, collectively, the Trustees have balanced and diverse experience, qualifications, attributes, and skills, which allow the Board to operate effectively in governing the fund and protecting the interests of shareholders. Information about the specific experience, skills, attributes, and qualifications of each Trustee, which in each case led to the Board's conclusion that the Trustee should serve (or continue to serve) as a trustee of the fund, is provided below.
Board Structure and Oversight Function. Robert A. Lawrence is an interested person and currently serves as Chair. The Trustees have determined that an interested Chair is appropriate and benefits shareholders because an interested Chair has a personal and professional stake in the quality and continuity of services provided to the fund. Independent Trustees exercise their informed business judgment to appoint an individual of their choosing to serve as Chair, regardless of whether the Trustee happens to be independent or a member of management. The Independent Trustees have determined that they can act independently and effectively without having an Independent Trustee serve as Chair and that a key structural component for assuring that they are in a position to do so is for the Independent Trustees to constitute a substantial majority for the Board. The Independent Trustees also regularly meet in executive session. David M. Thomas serves as Lead Independent Trustee and as such (i) acts as a liaison between the Independent Trustees and management with respect to matters important to the Independent Trustees and (ii) with management prepares agendas for Board meetings.
Fidelity® funds are overseen by different Boards of Trustees. The fund's Board oversees Fidelity's high income and certain equity funds, and other Boards oversee Fidelity's alternative investment, investment-grade bond, money market, asset allocation, and other equity funds. The asset allocation funds may invest in Fidelity® funds overseen by the fund's Board. The use of separate Boards, each with its own committee structure, allows the Trustees of each group of Fidelity® funds to focus on the unique issues of the funds they oversee, including common research, investment, and operational issues. On occasion, the separate Boards establish joint committees to address issues of overlapping consequences for the Fidelity® funds overseen by each Board.
The Trustees operate using a system of committees to facilitate the timely and efficient consideration of all matters of importance to the Trustees, the fund, and fund shareholders and to facilitate compliance with legal and regulatory requirements and oversight of the fund's activities and associated risks. The Board, acting through its committees, has charged FMR and its affiliates with (i) identifying events or circumstances the occurrence of which could have demonstrably adverse effects on the fund's business and/or reputation; (ii) implementing processes and controls to lessen the possibility that such events or circumstances occur or to mitigate the effects of such events or circumstances if they do occur; and (iii) creating and maintaining a system designed to evaluate continuously business and market conditions in order to facilitate the identification and implementation processes described in (i) and (ii) above. Because the day-to-day operations and activities of the fund are carried out by or through FMR, its affiliates, and other service providers, the fund's exposure to risks is mitigated but not eliminated by the processes overseen by the Trustees. While each of the Board's committees has responsibility for overseeing different aspects of the fund's activities, oversight is exercised primarily through the Operations, Audit, and Compliance Committees. Appropriate personnel, including but not limited to the fund's Chief Compliance Officer (CCO), FMR's internal auditor, the independent accountants, the fund's Treasurer and portfolio management personnel, make periodic reports to the Board's committees, as appropriate, including an annual review of Fidelity's risk management program for the Fidelity® funds. The responsibilities of each standing committee, including their oversight responsibilities, are described further under "Standing Committees of the Trustees."
Interested Trustees*:
Correspondence intended for a Trustee who is an interested person may be sent to Fidelity Investments, 245 Summer Street, Boston, Massachusetts 02210.
Name, Year of Birth; Principal Occupations and Other Relevant Experience+
Jonathan Chiel (1957)
Year of Election or Appointment: 2016
Trustee
Mr. Chiel also serves as Trustee of other Fidelity® funds. Mr. Chiel is General Counsel (2012-present) and Head of Legal, Risk and Compliance (2022-present). Mr Chiel serves as Executive Vice President and General Counsel for FMR LLC (diversified financial services company, 2012-present) and Director and President for OH Company LLC (holding company, 2018-present). Previously, Mr. Chiel served as general counsel (2004-2012) and senior vice president and deputy general counsel (2000-2004) for John Hancock Financial Services; a partner with Choate, Hall & Stewart (1996-2000) (law firm); and an Assistant United States Attorney for the United States Attorney's Office of the District of Massachusetts (1986-95), including Chief of the Criminal Division (1993-1995). Mr. Chiel is a director on the boards of the Boston Bar Foundation and the Maimonides School.
Bettina Doulton (1964)
Year of Election or Appointment: 2021
Trustee
Ms. Doulton also serves as Trustee of other Fidelity® funds. Prior to her retirement, Ms. Doulton served in a variety of positions at Fidelity Investments, including as a managing director of research (2006-2007), portfolio manager to certain Fidelity® funds (1993-2005), equity analyst and portfolio assistant (1990-1993), and research assistant (1987-1990). Ms. Doulton currently owns and operates Phi Builders + Architects and Cellardoor Winery. Previously, Ms. Doulton served as a member of the Board of Brown Capital Management, LLC (2014-2018).
Robert A. Lawrence (1952)
Year of Election or Appointment: 2020
Trustee
Chair of the Board of Trustees
Mr. Lawrence also serves as Trustee of other funds. Previously, Mr. Lawrence served as a Trustee and Member of the Advisory Board of certain funds. Prior to his retirement in 2008, Mr. Lawrence served as Vice President of certain Fidelity® funds (2006-2008), Senior Vice President, Head of High Income Division of Fidelity Management & Research Company (investment adviser firm, 2006-2008), and President of Fidelity Strategic Investments (investment adviser firm, 2002-2005).
* Determined to be an "Interested Trustee" by virtue of, among other things, his or her affiliation with the trust or various entities under common control with FMR.
+ The information includes the Trustee's principal occupation during the last five years and other information relating to the experience, attributes, and skills relevant to the Trustee's qualifications to serve as a Trustee, which led to the conclusion that the Trustee should serve as a Trustee for the fund.
Independent Trustees:
Correspondence intended for an Independent Trustee may be sent to Fidelity Investments, P.O. Box 55235, Boston, Massachusetts 02205-5235.
Name, Year of Birth; Principal Occupations and Other Relevant Experience+
Thomas P. Bostick (1956)
Year of Election or Appointment: 2021
Trustee
Lieutenant General Bostick also serves as Trustee of other Fidelity® funds. Prior to his retirement, General Bostick (United States Army, Retired) held a variety of positions within the U.S. Army, including Commanding General and Chief of Engineers, U.S. Army Corps of Engineers (2012-2016) and Deputy Chief of Staff and Director of Human Resources, U.S. Army (2009-2012). General Bostick currently serves as a member of the Board and Finance and Governance & Sustainability Committees of CSX Corporation (transportation, 2020-present) and a member of the Board and Corporate Governance and Nominating Committee of Perma-Fix Environmental Services, Inc. (nuclear waste management, 2020-present). General Bostick serves as Chief Executive Officer of Bostick Global Strategies, LLC (consulting, 2016-present), as a member of the Board of HireVue, Inc. (video interview and assessment, 2020-present), as a member of the Board of Allonnia (biotechnology and engineering solutions, 2022-present) and on the Advisory Board of Solugen, Inc. (specialty bio-based chemicals manufacturer, 2022-present). Previously, General Bostick served as a Member of the Advisory Board of certain Fidelity® funds (2021), President, Intrexon Bioengineering (2018-2020) and Chief Operating Officer (2017-2020) and Senior Vice President of the Environment Sector (2016-2017) of Intrexon Corporation (biopharmaceutical company).
Dennis J. Dirks (1948)
Year of Election or Appointment: 2005
Trustee
Mr. Dirks also serves as Trustee of other Fidelity® funds. Prior to his retirement in May 2003, Mr. Dirks served as Chief Operating Officer and as a member of the Board of The Depository Trust & Clearing Corporation (financial markets infrastructure), President, Chief Operating Officer and a member of the Board of The Depository Trust Company (DTC), President and a member of the Board of the National Securities Clearing Corporation (NSCC), Chief Executive Officer and a member of the Board of the Government Securities Clearing Corporation and Chief Executive Officer and a member of the Board of the Mortgage-Backed Securities Clearing Corporation. Mr. Dirks currently serves as a member of the Finance Committee (2016-present) and Board (2017-present) and is Treasurer (2018-present) of the Asolo Repertory Theatre.
Donald F. Donahue (1950)
Year of Election or Appointment: 2018
Trustee
Mr. Donahue also serves as Trustee of other Fidelity® funds. Mr. Donahue serves as President and Chief Executive Officer of Miranda Partners, LLC (risk consulting for the financial services industry, 2012-present). Previously, Mr. Donahue served as Chief Executive Officer (2006-2012), Chief Operating Officer (2003-2006) and Managing Director, Customer Marketing and Development (1999-2003) of The Depository Trust & Clearing Corporation (financial markets infrastructure). Mr. Donahue currently serves as a member (2007-present) and Co-Chairman (2016-present) of the Board of United Way of New York. Mr. Donahue previously served as a member of the Advisory Board of certain Fidelity® funds (2015-2018) and as a member of the Board of The Leadership Academy (previously NYC Leadership Academy) (2012-2022).
Vicki L. Fuller (1957)
Year of Election or Appointment: 2020
Trustee
Ms. Fuller also serves as Trustee of other Fidelity® funds. Previously, Ms. Fuller served as a member of the Advisory Board of certain Fidelity® funds (2018-2020), Chief Investment Officer of the New York State Common Retirement Fund (2012-2018) and held a variety of positions at AllianceBernstein L.P. (global asset management, 1985-2012), including Managing Director (2006-2012) and Senior Vice President and Senior Portfolio Manager (2001-2006). Ms. Fuller currently serves as a member of the Board, Audit Committee and Nominating and Governance Committee of two Blackstone business development companies (2020-present), as a member of the Board of Treliant, LLC (consulting, 2019-present), as a member of the Board of Ariel Alternatives, LLC (private equity, 2022-present) and as a member of the Board and Chair of the Audit Committee of Gusto, Inc. (software, 2021-present). In addition, Ms. Fuller currently serves as a member of the Board of Roosevelt University (2019-present) and as a member of the Executive Board of New York University's Stern School of Business. Ms. Fuller previously served as a member of the Board, Audit Committee and Nominating and Governance Committee of The Williams Companies, Inc. (natural gas infrastructure, 2018-2021).
Patricia L. Kampling (1959)
Year of Election or Appointment: 2020
Trustee
Ms. Kampling also serves as Trustee of other Fidelity® funds. Prior to her retirement, Ms. Kampling served as Chairman of the Board and Chief Executive Officer (2012-2019), President and Chief Operating Officer (2011-2012) and Executive Vice President and Chief Financial Officer (2010-2011) of Alliant Energy Corporation. Ms. Kampling currently serves as a member of the Board, Finance Committee and Governance, Compensation and Nominating Committee of Xcel Energy Inc. (utilities company, 2020-present) and as a member of the Board, Audit, Finance and Risk Committee and Safety, Environmental, Technology and Operations Committee and Chair of the Executive Development and Compensation Committee of American Water Works Company, Inc. (utilities company, 2019-present). In addition, Ms. Kampling currently serves as a member of the Board of the Nature Conservancy, Wisconsin Chapter (2019-present). Previously, Ms. Kampling served as a Member of the Advisory Board of certain Fidelity® funds (2020), a member of the Board, Compensation Committee and Executive Committee and Chair of the Audit Committee of Briggs & Stratton Corporation (manufacturing, 2011-2021), a member of the Board of Interstate Power and Light Company (2012-2019) and Wisconsin Power and Light Company (2012-2019) (each a subsidiary of Alliant Energy Corporation) and as a member of the Board and Workforce Development Committee of the Business Roundtable (2018-2019).
Thomas A. Kennedy (1955)
Year of Election or Appointment: 2021
Trustee
Mr. Kennedy also serves as Trustee of other Fidelity® funds. Previously, Mr. Kennedy served as a Member of the Advisory Board of certain Fidelity® funds (2020) and held a variety of positions at Raytheon Company (aerospace and defense, 1983-2020), including Chairman and Chief Executive Officer (2014-2020) and Executive Vice President and Chief Operating Officer (2013-2014). Mr. Kennedy served as Executive Chairman of the Board of Directors of Raytheon Technologies Corporation (aerospace and defense, 2020-2021). Mr. Kennedy serves as a Director of the Board of Directors of Textron Inc. (aerospace and defense, 2023-present).
Oscar Munoz (1959)
Year of Election or Appointment: 2021
Trustee
Mr. Munoz also serves as Trustee of other Fidelity® funds. Prior to his retirement, Mr. Munoz served as Executive Chairman (2020-2021), Chief Executive Officer (2015-2020), President (2015-2016) and a member of the Board (2010-2021) of United Airlines Holdings, Inc. Mr. Munoz currently serves as a member of the Board of CBRE Group, Inc. (commercial real estate, 2020-present), a member of the Board of Univision Communications, Inc. (Hispanic media, 2020-present), a member of the Board of Archer Aviation Inc. (2021-present), a member of the Defense Business Board of the United States Department of Defense (2021-present) and a member of the Board of Salesforce.com, Inc. (cloud-based software, 2022-present). Previously, Mr. Munoz served as a Member of the Advisory Board of certain Fidelity® funds (2021).
David M. Thomas (1949)
Year of Election or Appointment: 2008
Trustee
Lead Independent Trustee
Mr. Thomas also serves as Trustee of other Fidelity® funds. Previously, Mr. Thomas served as Executive Chairman (2005-2006) and Chairman and Chief Executive Officer (2000-2005) of IMS Health, Inc. (pharmaceutical and healthcare information solutions). Mr. Thomas currently serves as a member of the Board of Fortune Brands Home and Security (home and security products, 2004-present) and as Director (2013-present) and Non-Executive Chairman of the Board (2022-present) of Interpublic Group of Companies, Inc. (marketing communication).
Susan Tomasky (1953)
Year of Election or Appointment: 2020
Trustee
Ms. Tomasky also serves as Trustee of other Fidelity® funds. Prior to her retirement, Ms. Tomasky served in various executive officer positions at American Electric Power Company, Inc. (1998-2011), including most recently as President of AEP Transmission (2007-2011). Ms. Tomasky currently serves as a member of the Board and Sustainability Committee and as Chair of the Audit Committee of Marathon Petroleum Corporation (2018-present) and as a member of the Board, Executive Committee, Corporate Governance Committee and Organization and Compensation Committee and as Lead Director of the Board of Public Service Enterprise Group, Inc. (utilities company, 2012-present) and as a member of the Board of its subsidiary company, Public Service Electric and Gas Co. (2021-present). In addition, Ms. Tomasky currently serves as a member (2009-present) and President (2020-present) of the Board of the Royal Shakespeare Company - America (2009-present), as a member of the Board of the Columbus Association for the Performing Arts (2011-present) and as a member of the Board and Kenyon in the World Committee of Kenyon College (2016-present). Previously, Ms. Tomasky served as a Member of the Advisory Board of certain Fidelity® funds (2020), as a member of the Board of the Columbus Regional Airport Authority (2007-2020), as a member of the Board (2011-2018) and Lead Independent Director (2015-2018) of Andeavor Corporation (previously Tesoro Corporation) (independent oil refiner and marketer) and as a member of the Board of Summit Midstream Partners LP (energy, 2012-2018).
Michael E. Wiley (1950)
Year of Election or Appointment: 2020
Trustee
Mr. Wiley also serves as Trustee of other Fidelity® funds. Previously, Mr. Wiley served as a member of the Advisory Board of certain Fidelity® funds (2018-2020), Chairman, President and CEO of Baker Hughes, Inc. (oilfield services, 2000-2004). Mr. Wiley also previously served as a member of the Board of Andeavor Corporation (independent oil refiner and marketer, 2005-2018), a member of the Board of Andeavor Logistics LP (natural resources logistics, 2015-2018) and a member of the Board of High Point Resources (exploration and production, 2005-2020).
+ The information includes the Trustee's principal occupation during the last five years and other information relating to the experience, attributes, and skills relevant to the Trustee's qualifications to serve as a Trustee, which led to the conclusion that the Trustee should serve as a Trustee for the fund.
Advisory Board Members and Officers:
Correspondence intended for a Member of the Advisory Board (if any) may be sent to Fidelity Investments, P.O. Box 55235, Boston, Massachusetts 02205-5235. Correspondence intended for an officer or Peter S. Lynch may be sent to Fidelity Investments, 245 Summer Street, Boston, Massachusetts 02210.
Name, Year of Birth; Principal Occupation
Vijay C. Advani (1960)
Year of Election or Appointment: 2023
Member of the Advisory Board
Mr. Advani also serves as Trustee or Member of the Advisory Board of other funds. Previously, Mr. Advani served as Executive Chairman (2020-2022), Chief Executive Officer (2017-2020) and Chief Operating Officer (2016-2017) of Nuveen (global investment manager). He also served in various capacities at Franklin Resources (global investment manager), including Co-President (2015-2016), Executive Vice President, Global Advisory Services (2008-2015), Head of Global Retail Distribution (2005-2008), Executive Managing Director, International Retail Development (2002-2005), Managing Director, Product Developments, Sales & Marketing, Asia, Eastern Europe and Africa (2000-2002) and President, Templeton Asset Management India (1995-2000). Mr. Advani also served as Senior Investment Officer of International Finance Corporation (private equity and venture capital arm of The World Bank, 1984-1995). Mr. Advani is Chairman Emeritus of the U.S. India Business Council (2018-present), a Director of The Global Impact Investing Network (2019-present), a Director of LOK Capital (Mauritius) (2022-present), a member of the Advisory Council of LOK Capital (2022-present), a Senior Advisor of Neuberger Berman (2021-present), a Senior Advisor of Seviora Holdings Pte. Ltd (Temasek-Singapore) (2021-present), a Director of Seviora Capital (Singapore) (2021-present) and an Advisor of EQUIAM (2021-present). Mr. Advani formerly served as a member of the Board of BowX Acquisition Corp. (special purpose acquisition company, 2020-2021), a member of the Board of Intellecap (advisory arm of The Aavishkaar Group, 2018-2020), a member of the Board of Nuveen Investments, Inc. (2017-2020) and a member of the Board of Docusign (software, 2016-2019).
Peter S. Lynch (1944)
Year of Election or Appointment: 2003
Member of the Advisory Board
Mr. Lynch also serves as a Member of the Advisory Board of other Fidelity® funds. Mr. Lynch is Vice Chairman and a Director of Fidelity Management & Research Company LLC (investment adviser firm). In addition, Mr. Lynch serves as a Trustee of Boston College and as the Chairman of the Inner-City Scholarship Fund. Previously, Mr. Lynch served as Vice Chairman and a Director of FMR Co., Inc. (investment adviser firm) and on the Special Olympics International Board of Directors (1997-2006).
Karen B. Peetz (1955)
Year of Election or Appointment: 2023
Member of the Advisory Board
Ms. Peetz also serves as a Member of the Advisory Board of other funds. Previously, Ms. Peetz served as Chief Administration Officer (2020-2023) of Citigroup Inc. (a diversified financial service company). She also served in various capacities at Bank of New York Mellon Corporation, including President (2013-2016), Vice Chairman, Senior Executive Vice President and Chief Executive Officer of Financial Markets & Treasury Services (2010-2013), Senior Executive Vice President and Chief Executive Officer of Global Corporate Trust (2003-2008), Senior Vice President and Division Manager of Global Payments & Trade Services (2002-2003) and Senior Vice President and Division Manager of Domestic Corporate Trust (1998-2002). Ms. Peetz also served in various capacities at Chase Manhattan Corporation (1982-1998), including Senior Vice President and Manager of Corporate Trust International Business (1996-1998), Managing Director and Manager of Corporate Trust Services (1994-1996) and Managing Director and Group Manager of Financial Institution Sales (1990-1993). Ms. Peetz currently serves as Chair of Amherst Holdings Advisory Council (2018-present), Trustee of Johns Hopkins University (2016-present), Chair of the Carey Business School Advisory Council, Member of the Johns Hopkins Medicine Board and Finance Committee and Chair of the Lyme and Tick Related Disease Institute Advisory Council. Ms. Peetz previously served as a member of the Board of Guardian Life Insurance Company of America (2019-2023), a member of the Board of Trane Technologies (2018-2022), a member of the Board of Wells Fargo Corp. (2017-2019), a member of the Board of SunCoke Energy Inc. (2012-2016), a member of the Board of Private Export Funding Corporation (2010-2016) and as a Trustee of Penn State University (2010-2014) and the United Way of New York City (2008-2010).
Heather Bonner (1977)
Year of Election or Appointment: 2023
Assistant Treasurer
Ms. Bonner also serves as an officer of other funds. Ms. Bonner is a Senior Vice President (2022-present) and is an employee of Fidelity Investments (2022-present). Ms. Bonner serves as Vice President, Treasurer, or Assistant Treasurer of certain Fidelity entities. Prior to joining Fidelity, Ms. Bonner served as Managing Director at AQR Capital Management (2013-2022) and was the Treasurer and Principal Financial Officer of the AQR Funds (2013-2022).
Craig S. Brown (1977)
Year of Election or Appointment: 2022
Deputy Treasurer
Mr. Brown also serves as an officer of other funds. Mr. Brown is a Vice President (2015-present) and is an employee of Fidelity Investments. Mr. Brown serves as Assistant Treasurer of FIMM, LLC (2021-present). Previously, Mr. Brown served as Assistant Treasurer of certain Fidelity® funds (2019-2022).
John J. Burke III (1964)
Year of Election or Appointment: 2018
Chief Financial Officer
Mr. Burke also serves as Chief Financial Officer of other funds. Mr. Burke is Head of Fidelity Fund and Investment Operations (2018-present) and is an employee of Fidelity Investments. Mr. Burke serves as President, Executive Vice President, or Director of certain Fidelity entities. Previously Mr. Burke served as head of Asset Management Investment Operations (2012-2018).
Margaret Carey (1973)
Year of Election or Appointment: 2023
Secretary and Chief Legal Officer (CLO)
Ms. Carey also serves as an officer of other funds and as CLO of certain Fidelity entities. Ms. Carey is a Senior Vice President, Deputy General Counsel (2019-present) and is an employee of Fidelity Investments.
William C. Coffey (1969)
Year of Election or Appointment: 2019
Assistant Secretary
Mr. Coffey also serves as Assistant Secretary of other funds. Mr. Coffey is a Senior Vice President, Deputy General Counsel (2010-present) and is an employee of Fidelity Investments. Previously, Mr. Coffey served as Secretary and CLO of certain funds (2018-2019); CLO, Secretary, or Senior Vice President of certain Fidelity entities and Assistant Secretary of certain funds (2009-2018).
Timothy M. Cohen (1969)
Year of Election or Appointment: 2018
Vice President
Mr. Cohen also serves as Vice President of other funds. Mr. Cohen is Co-Head of Equity (2018-present) and is an employee of Fidelity Investments. Mr. Cohen serves a Director of Fidelity Management & Research (Japan) Limited (investment adviser firm, 2016-present). Previously, Mr. Cohen served as Executive Vice President of Fidelity SelectCo, LLC (2019) and Head of Global Equity Research (2016-2018).
Jonathan Davis (1968)
Year of Election or Appointment: 2010
Assistant Treasurer
Mr. Davis also serves as an officer of other funds. Mr. Davis is a Vice President (2006-present) and is an employee of Fidelity Investments. Mr. Davis serves as Assistant Treasurer of certain Fidelity entities.
Laura M. Del Prato (1964)
Year of Election or Appointment: 2018
Assistant Treasurer
Ms. Del Prato also serves as an officer of other funds. Ms. Del Prato is a Senior Vice President (2017-present) and is an employee of Fidelity Investments. Ms. Del Prato serves as Vice President or Assistant Treasurer of certain Fidelity entities. Previously, Ms. Del Prato served as President and Treasurer of The North Carolina Capital Management Trust: Cash Portfolio and Term Portfolio (2018-2020).
Colm A. Hogan (1973)
Year of Election or Appointment: 2020
Assistant Treasurer
Mr. Hogan also serves as an officer of other funds. Mr. Hogan is a Vice President (2016-present) and is an employee of Fidelity Investments. Mr. Hogan serves as Assistant Treasurer of certain Fidelity entities. Previously, Mr. Hogan served as Deputy Treasurer of certain Fidelity® funds (2016-2020) and Assistant Treasurer of certain Fidelity® funds (2016-2018).
Pamela R. Holding (1964)
Year of Election or Appointment: 2018
Vice President
Ms. Holding also serves as Vice President of other funds. Ms. Holding is Co-Head of Equity (2018-present) and is an employee of Fidelity Investments. Previously, Ms. Holding served as Executive Vice President of Fidelity SelectCo, LLC (2019) and as Chief Investment Officer of Fidelity Institutional Asset Management (2013-2018).
Chris Maher (1972)
Year of Election or Appointment: 2020
Deputy Treasurer
Mr. Maher also serves as an officer of other funds. Mr. Maher is a Vice President (2008-present) and is an employee of Fidelity Investments. Mr. Maher serves as Assistant Treasurer of certain Fidelity entities. Previously, Mr. Maher served as Assistant Treasurer of certain funds (2013-2020).
Jason P. Pogorelec (1975)
Year of Election or Appointment: 2020
Chief Compliance Officer
Mr. Pogorelec also serves as Chief Compliance Officer of other funds. Mr. Pogorelec is a Senior Vice President of Asset Management Compliance (2020-present) and is an employee of Fidelity Investments. Mr. Pogorelec serves as Compliance Officer of Fidelity Management & Research Company LLC (investment adviser firm, 2023-present) and Ballyrock Investment Advisors LLC (2023-present). Previously, Mr. Pogorelec served as a Vice President, Associate General Counsel for Fidelity Investments (2010-2020) and Assistant Secretary of certain Fidelity® funds (2015-2020).
Brett Segaloff (1972)
Year of Election or Appointment: 2021
Anti-Money Laundering (AML) Officer
Mr. Segaloff also serves as AML Officer of other funds. Mr. Segaloff is a Vice President (2022-present) and is an employee of Fidelity Investments. Mr. Segaloff serves as Anti Money Laundering Compliance Officer or Anti Money Laundering/Bank Secrecy Act Compliance Officer of certain Fidelity entities.
Stacie M. Smith (1974)
Year of Election or Appointment: 2016
President and Treasurer
Ms. Smith also serves as an officer of other funds. Ms. Smith is a Senior Vice President (2016-present) and is an employee of Fidelity Investments. Ms. Smith serves as Assistant Treasurer of certain Fidelity entities and has served in other fund officer roles.
Jim Wegmann (1979)
Year of Election or Appointment: 2019
Assistant Treasurer
Mr. Wegmann also serves as an officer of other funds. Mr. Wegmann is a Vice President (2016-present) and is an employee of Fidelity Investments. Mr. Wegmann serves as Assistant Treasurer of FIMM, LLC (2021-present). Previously, Mr. Wegmann served as Assistant Treasurer of certain Fidelity® funds (2019-2021).
As a shareholder, you incur two types of costs: (1) transaction costs, which may include sales charges (loads) on purchase payments or redemption proceeds, as applicable and (2) ongoing costs, which generally include management fees, distribution and/or service (12b-1) fees and other Fund expenses. This Example is intended to help you understand your ongoing costs (in dollars) of investing in a fund and to compare these costs with the ongoing costs of investing in other mutual funds.
| The Example is based on an investment of $1,000 invested at the beginning of the period and held for the entire period (May 1, 2023 to October 31, 2023). |
Actual Expenses
The first line of the accompanying table provides information about actual account values and actual expenses. You may use the information in this line, together with the amount you invested, to estimate the expenses that you paid over the period. Simply divide your account value by $1,000.00 (for example, an $8,600 account value divided by $1,000.00 = 8.6), then multiply the result by the number in the first line for a class/Fund under the heading entitled "Expenses Paid During Period" to estimate the expenses you paid on your account during this period. If any fund is a shareholder of any underlying mutual funds or exchange-traded funds (ETFs) (the Underlying Funds), such fund indirectly bears its proportional share of the expenses of the Underlying Funds in addition to the direct expenses incurred presented in the table. These fees and expenses are not included in the annualized expense ratio used to calculate the expense estimate in the table below.
Hypothetical Example for Comparison Purposes
The second line of the accompanying table provides information about hypothetical account values and hypothetical expenses based on the actual expense ratio and an assumed rate of return of 5% per year before expenses, which is not the actual return. The hypothetical account values and expenses may not be used to estimate the actual ending account balance or expenses you paid for the period. You may use this information to compare the ongoing costs of investing in the Fund and other funds. To do so, compare this 5% hypothetical example with the 5% hypothetical examples that appear in the shareholder reports of the other funds. If any fund is a shareholder of any Underlying Funds, such fund indirectly bears its proportional share of the expenses of the Underlying Funds in addition to the direct expenses as presented in the table. These fees and expenses are not included in the annualized expense ratio used to calculate the expense estimate in the table below.
Please note that the expenses shown in the table are meant to highlight your ongoing costs only and do not reflect any transaction costs. Therefore, the second line of the table is useful in comparing ongoing costs only, and will not help you determine the relative total costs of owning different funds. In addition, if these transactional costs were included, your costs would have been higher.
| | | | | Annualized Expense Ratio- A | | Beginning Account Value May 1, 2023 | | Ending Account Value October 31, 2023 | | Expenses Paid During Period- C May 1, 2023 to October 31, 2023 |
| Fidelity® International Value Fund | | | | | | | | | | |
| Class A | | | | 1.30% | | | | | | |
| Actual | | | | | | $ 1,000 | | $ 976.80 | | $ 6.48 |
Hypothetical-B | | | | | | $ 1,000 | | $ 1,018.65 | | $ 6.61 |
| Class M | | | | 1.55% | | | | | | |
| Actual | | | | | | $ 1,000 | | $ 975.70 | | $ 7.72 |
Hypothetical-B | | | | | | $ 1,000 | | $ 1,017.39 | | $ 7.88 |
| Class C | | | | 2.04% | | | | | | |
| Actual | | | | | | $ 1,000 | | $ 972.50 | | $ 10.14 |
Hypothetical-B | | | | | | $ 1,000 | | $ 1,014.92 | | $ 10.36 |
| Fidelity® International Value Fund | | | | .97% | | | | | | |
| Actual | | | | | | $ 1,000 | | $ 977.90 | | $ 4.84 |
Hypothetical-B | | | | | | $ 1,000 | | $ 1,020.32 | | $ 4.94 |
| Class I | | | | .98% | | | | | | |
| Actual | | | | | | $ 1,000 | | $ 976.90 | | $ 4.88 |
Hypothetical-B | | | | | | $ 1,000 | | $ 1,020.27 | | $ 4.99 |
| Class Z | | | | .84% | | | | | | |
| Actual | | | | | | $ 1,000 | | $ 979.10 | | $ 4.19 |
Hypothetical-B | | | | | | $ 1,000 | | $ 1,020.97 | | $ 4.28 |
| |
A Annualized expense ratio reflects expenses net of applicable fee waivers.
B 5% return per year before expenses
C Expenses are equal to the annualized expense ratio, multiplied by the average account value over the period, multiplied by 184/ 365 (to reflect the one-half year period). The fees and expenses of any Underlying Funds are not included in each annualized expense ratio.
The dividend and capital gains distributions for the fund(s) are available on Fidelity.com or Institutional.Fidelity.com.
The fund designates $129,229 of distributions paid during the fiscal year ended 2023 as qualifying to be taxed as section 163(j) interest dividends.
Class A, Class M, Class C, International Value, Class I and Class Z designate 100% of the dividend distributed during the fiscal year as amounts which may be taken into account as a dividend for purposes of the maximum rate under section 1(h)(11) of the Internal Revenue Code.
The amounts per share which represent income derived from sources within, and taxes paid to, foreign countries or possessions of the United States are as follows:
| | Pay Date | Income | Taxes |
| Fidelity International Value Fund | | | |
| Class A | 12/12/2022 | $0.1557 | $0.0187 |
| Class M | 12/12/2022 | $0.1347 | $0.0187 |
| Class C | 12/12/2022 | $0.0847 | $0.0187 |
| International Value | 12/12/2022 | $0.1747 | $0.0187 |
| Class I | 12/12/2022 | $0.1767 | $0.0187 |
| Class Z | 12/12/2022 | $0.1837 | $0.0187 |
The fund will notify shareholders in January 2024 of amounts for use in preparing 2023 income tax returns.
Board Approval of Investment Advisory Contracts and Management Fees
Fidelity International Value Fund
Each year, the Board of Trustees, including the Independent Trustees (together, the Board), considers the renewal of the fund's management contract with Fidelity Management & Research Company LLC (FMR) and the sub-advisory agreements (together, the Advisory Contracts) for the fund. FMR and the sub-advisers are referred to herein as the Investment Advisers. The Board, assisted by the advice of fund counsel and Independent Trustees' counsel, requests and considers a broad range of information relevant to the renewal of the Advisory Contracts throughout the year.
The Board meets regularly and, at each of its meetings, covers an extensive agenda of topics and materials and considers factors that are relevant to its annual consideration of the renewal of the fund's Advisory Contracts, including the services and support provided to the fund and its shareholders. The Board, acting directly and through its Committees (each of which is composed of and chaired by Independent Trustees), requests and receives information concerning the annual consideration of the renewal of the fund's Advisory Contracts. The Board also meets as needed to review matters specifically related to the Board's annual consideration of the renewal of the Advisory Contracts. Members of the Board may also meet with trustees of other Fidelity funds through joint ad hoc committees to discuss certain matters relevant to all of the Fidelity funds.
Approval of Stub Period Continuation. At its May 2023 meeting, the Board of Trustees voted to continue the fund's management contract with FMR, and the sub-advisory agreements and sub-sub-advisory agreements, in each case, where applicable (together, the Advisory Contracts), without modification, for two months from June 1, 2023 through July 31, 2023. The Board considered that the approval of the fund's Advisory Contracts will not result in any changes in (i) the investment process or strategies employed in the management of the fund's assets; (ii) the fees and expenses paid by shareholders; (iii) the nature, extent or quality of services provided under the fund's Advisory Contracts; or (iv) the day-to-day management of the fund or the persons primarily responsible for such management. The Board also considered that since its last approval of the fund's Advisory Contracts, FMR had provided additional information on the fund in support of the annual contract renewal process, including competitive analyses on total expenses and management fees and in-depth reviews of fund performance and fund profitability information. The Board concluded that the fund's Advisory Contracts are fair and reasonable, and that the fund's Advisory Contracts should be renewed, without modification, through July 31, 2023, with the understanding that the Board would consider the annual renewal for a full one year period in July 2023.
At its July 2023 meeting, the Board unanimously determined to renew the fund's Advisory Contracts. In reaching its determination, the Board considered all factors it believed relevant, including (i) the nature, extent, and quality of the services provided to the fund and its shareholders (including the investment performance of the fund); (ii) the competitiveness relative to peer funds of the fund's management fee and the total expense ratio of a representative class (the retail class, which was selected because it was the largest class without 12b-1 fees); (iii) the total costs of the services provided by and the profits realized by FMR and its affiliates (Fidelity) from its relationships with the fund; and (iv) the extent to which, if any, economies of scale exist and are realized as the fund grows, and whether any economies of scale are appropriately shared with fund shareholders. The Board also considered the broad range of investment choices available to shareholders from FMR's competitors and that the fund's shareholders have chosen to invest in the fund, which is part of the Fidelity family of funds. The Board's decision to renew the Advisory Contracts was not based on any single factor.
The Board reached a determination, with the assistance of fund counsel and Independent Trustees' counsel and through the exercise of its business judgment, that the renewal of the Advisory Contracts was in the best interests of the fund and its shareholders and that the compensation payable under the Advisory Contracts was fair and reasonable in light of all of the surrounding circumstances.
Nature, Extent, and Quality of Services Provided. The Board considered staffing as it relates to the fund, including the backgrounds and experience of investment personnel of the Investment Advisers, and also considered the Investment Advisers' implementation of the fund's investment program. The Independent Trustees also had discussions with senior management of Fidelity's investment operations and investment groups. The Board considered the structure of the investment personnel compensation program and whether this structure provides appropriate incentives to act in the best interests of the fund. Additionally, the Board considered the portfolio managers' investments, if any, in the funds that they manage.
Resources Dedicated to Investment Management and Support Services. The Board and the Fund Oversight and Research Committees reviewed the general qualifications and capabilities of Fidelity's investment staff, including its size, education, experience, and resources, as well as Fidelity's approach to recruiting, training, managing, and compensating investment personnel. The Board noted the resources devoted to expansion of Fidelity's global investment organization, and that Fidelity's analysts have extensive resources, tools, and capabilities that allow them to conduct sophisticated quantitative and fundamental analysis, as well as credit analysis of issuers, counterparties, and guarantors. Further, the Board considered that Fidelity's investment professionals have sufficient access to global information and data so as to provide competitive investment results over time, and that those professionals also have access to sophisticated tools that permit them to assess portfolio construction and risk and performance attribution characteristics continuously, as well as to transmit new information and research conclusions rapidly around the world. Additionally, in its deliberations, the Board considered Fidelity's trading, risk management, compliance, and technology and operations capabilities and resources, which are integral parts of the investment management process.
Shareholder and Administrative Services. The Board considered (i) the nature, extent, quality, and cost of advisory, administrative, and shareholder services performed by the Investment Advisers and their affiliates under the Advisory Contracts and under separate agreements covering transfer agency, pricing and bookkeeping, and securities lending services for the fund; (ii) the nature and extent of Fidelity's supervision of third party service providers, principally custodians, subcustodians, and pricing vendors; and (iii) the resources devoted by Fidelity to, and the record of compliance with, the fund's compliance policies and procedures. The Board also reviewed the allocation of fund brokerage, including allocations to brokers affiliated with the Investment Advisers, the use of brokerage commissions to pay fund expenses, and the use of "soft" commission dollars to pay for research services. The Board also considered the fund's securities lending activities and any payments made to Fidelity relating to securities lending.
The Board noted that the growth of fund assets over time across the complex allows Fidelity to reinvest in the development of services designed to enhance the value and convenience of the Fidelity funds as investment vehicles. These services include 24-hour access to account information and market information over the Internet and through telephone representatives, investor education materials, and asset allocation tools. The Board also considered that it reviews customer service metrics such as telephone response times, continuity of services on the website and metrics addressing services at Fidelity Investor Centers.
Investment in a Large Fund Family. The Board considered the benefits to shareholders of investing in a fund that is part of a large family of funds offering a variety of investment disciplines and providing a large variety of fund investor services. The Board noted that Fidelity had taken, or had made recommendations that resulted in the Fidelity funds taking, a number of actions over the previous year that benefited particular funds and/or the Fidelity funds in general.
Investment Performance. The Board took into account discussions that occur with representatives of the Investment Advisers, and reports that it receives, at Board meetings throughout the year, relating to fund investment performance. In this regard the Board noted that as part of regularly scheduled fund reviews and other reports to the Board on fund performance, the Board considered annualized return information for the fund for different time periods, measured against an appropriate securities market index (benchmark index) and an appropriate peer group of funds with similar objectives (peer group). The Board also considered information about performance attribution. In its ongoing evaluation of fund investment performance, the Board gives particular attention to information indicating changes in performance of the funds over different time periods and discussed with the Investment Advisers the reasons for any overperformance or underperformance.
In addition to reviewing absolute and relative fund performance, the Independent Trustees periodically consider the appropriateness of fund performance metrics in evaluating the results achieved. The Independent Trustees generally give greater weight to fund performance over longer time periods than over shorter time periods. Depending on the circumstances, the Independent Trustees may be satisfied with a fund's performance notwithstanding that it lags its benchmark index or peer group for certain periods.
Based on its review, the Board concluded that the nature, extent, and quality of services provided to the fund under the Advisory Contracts should continue to benefit the shareholders of the fund.
Competitiveness of Management Fee and Total Expense Ratio. The Board was provided with information regarding industry trends in management fees and expenses. In its review of the fund's management fee and the total expense ratio of the retail class, the Board considered the fund's management fee rate as well as other fund or class expenses, as applicable, such as transfer agent fees, pricing and bookkeeping fees, fund-paid 12b-1 fees, and custodial, legal, and audit fees. The Board noted that Fidelity may agree to waive fees or reimburse expenses from time to time, and the extent to which, if any, it has done so for the fund. The Board also considered information about the impact of the fund's performance adjustment.
Comparisons of Management Fees and Total Expense Ratios. Among other things, the Board reviewed data for selected groups of competitive funds and classes (referred to as "mapped groups") that were compiled by Fidelity based on combining similar investment objective categories (as classified by Lipper) that have comparable investment mandates. The data reviewed by the Board included (i) gross management fee comparisons (before taking into account expense reimbursements or caps and without taking into account the fund's performance adjustment) relative to the total universe of funds within the mapped group; (ii) gross management fee comparisons relative to a subset of non-Fidelity funds in the mapped group that are similar in size and management fee structure to the fund (referred to as the "asset size peer group"); (iii) total expense comparisons of the retail class of the fund relative to funds and classes in the mapped group that have a similar sales load structure to the retail class of the fund (referred to as the "similar sales load structure group"); and (iv) total expense comparisons of the retail class of the fund relative to funds and classes in the similar sales load structure group that are similar in size and management fee structure to the fund (referred to as the "total expense asset size peer group"). The total expense asset size peer group comparison excludes performance adjustments and fund-paid 12b-1 fees to eliminate variability in fee structures.
The information provided to the Board indicated that the fund's management fee rate ranked below the competitive median of the mapped group for the 12-month period ended September 30, 2022 and below the competitive median of the asset size peer group for the 12-month period ended September 30, 2022. Further, the information provided to the Board indicated that the total expense ratio of the retail class of the fund ranked equal to the competitive median of the similar sales load structure group for the 12-month period ended September 30, 2022 and below the competitive median of the total expense asset size peer group for the 12-month period ended September 30, 2022.
The Board also considered that, for funds subject to the group fee, FMR agreed to voluntarily waive fees over a specified period of time in amounts designed to account for assets converted from certain funds to certain collective investment trusts.
The Board also considered that the fund's management fee is subject to upward or downward adjustment depending upon whether, and to what extent, the fund's investment performance for the performance period (a rolling 36-month period) exceeds, or is exceeded by, a securities index, thus leading to a performance adjustment for the same period. The Board noted that the performance adjustment provides FMR with a strong economic incentive to seek to achieve superior long-term performance for the fund's shareholders and helps to more closely align the interests of FMR and the shareholders of the fund.
In connection with its consideration of the fund's performance adjustment, the Board noted that the performance of the retail class is used for purposes of determining the performance adjustment. The Board noted that to the extent the performance adjustment was based on the performance of a share class with higher total annual operating expenses, the fund would be subject to a smaller positive and larger negative performance adjustment. The Board considered the appropriateness of the use of the retail class as the basis for the performance adjustment. The Board noted that the retail class is typically the largest class (reflecting the actual investment experience for the plurality of shareholders), employs a standard expense structure, and does not include fund-paid 12b-1 fees, which Fidelity believes makes it a more appropriate measurement of Fidelity's investment skill.
Other Contractual Arrangements. The Board further considered that FMR has contractually agreed to reimburse Class A, Class M, Class C, Class I, Class Z, and the retail class of the fund to the extent that total operating expenses, with certain exceptions, as a percentage of their respective average net assets, exceed 1.30%, 1.55%, 2.05%, 1.05%, 0.90%, and 1.05% through February 29, 2024.
Fees Charged to Other Fidelity Clients. The Board also considered Fidelity fee structures and other information with respect to clients of Fidelity, such as other funds advised or subadvised by Fidelity, pension plan clients, and other institutional clients with similar mandates. The Board noted that a joint ad hoc committee created by it and the boards of other Fidelity funds periodically reviews and compares Fidelity's institutional investment advisory business with its business of providing services to the Fidelity funds and also noted the most recent findings of the committee. The Board noted that the committee's review included a consideration of the differences in services provided, fees charged, and costs incurred, as well as competition in the markets serving the different categories of clients.
Based on its review, the Board concluded that the fund's management fee, including the use of the retail class as the basis for the performance adjustment, is fair and reasonable in light of the services that the fund receives and the other factors considered. Further, based on its review of total expense ratios and fees charged to other Fidelity clients, the Board concluded that the total expense ratio of each class of the fund was reasonable in light of the services that the fund and its shareholders receive and the other factors considered.
Costs of the Services and Profitability. The Board considered the revenues earned and the expenses incurred by Fidelity in conducting the business of developing, marketing, distributing, managing, administering and servicing the fund and servicing the fund's shareholders. The Board also considered the level of Fidelity's profits in respect of all the Fidelity funds.
On an annual basis, Fidelity presents to the Board information about the profitability of its relationships with the fund. Fidelity calculates profitability information for each fund, as well as aggregate profitability information for groups of Fidelity funds and all Fidelity funds, using a series of detailed revenue and cost allocation methodologies which originate with the books and records of Fidelity on which Fidelity's audited financial statements are based. The Audit Committee of the Board reviews any significant changes from the prior year's methodologies and the full Board approves such changes.
A public accounting firm has been engaged annually by the Board as part of the Board's assessment of Fidelity's profitability analysis. The engagement includes the review and assessment of the methodologies used by Fidelity in determining the revenues and expenses attributable to Fidelity's fund business, and completion of agreed-upon procedures in respect of the mathematical accuracy of certain fund profitability information and its conformity to established allocation methodologies. After considering the reports issued under the engagement and information provided by Fidelity, the Board concluded that while other allocation methods may also be reasonable, Fidelity's profitability methodologies are reasonable in all material respects.
The Board also reviewed Fidelity's non-fund businesses and potential indirect benefits such businesses may have received as a result of their association with Fidelity's fund business (i.e., fall-out benefits) as well as cases where Fidelity's affiliates may benefit from the funds' business. The Board considered areas where potential indirect benefits to the Fidelity funds from their relationships with Fidelity may exist. The Board's consideration of these matters was informed by the findings of a joint ad hoc committee created by it and the boards of other Fidelity funds to evaluate potential fall-out benefits.
The Board considered the costs of the services provided by and the profits realized by Fidelity in connection with the operation of the fund and was satisfied that the profitability was not excessive.
Economies of Scale. The Board considered whether there have been economies of scale in respect of the management of the Fidelity funds, whether the Fidelity funds (including the fund) have appropriately benefited from any such economies of scale, and whether there is potential for realization of any further economies of scale. The Board considered the extent to which the fund will benefit from economies of scale as assets grow through increased services to the fund, through waivers or reimbursements, or through fee or expense ratio reductions. The Board also noted that a committee (the Economies of Scale Committee) created by it and the boards of other Fidelity funds periodically analyzes whether Fidelity attains economies of scale in respect of the management and servicing of the Fidelity funds, whether the Fidelity funds have appropriately benefited from such economies of scale, and whether there is potential for realization of any further economies of scale.
The Board recognized that the fund's management contract incorporates a "group fee" structure, which provides for lower group fee rates as total "group assets" increase, and for higher group fee rates as total "group assets" decrease ("group assets" as defined in the management contract). FMR calculates the group fee rates based on a tiered asset "breakpoint" schedule that varies based on asset class. The Board considered that the group fee is designed to deliver the benefits of economies of scale to fund shareholders when total Fidelity fund assets increase, even if assets of any particular fund are unchanged or have declined, because some portion of Fidelity's costs are attributable to services provided to all Fidelity funds, and all funds benefit if those costs can be allocated among more assets. The Board further considered that Fidelity agreed to impose a temporary fee waiver in the form of additional breakpoints to the current breakpoint schedule. The Board concluded that, given the group fee structure, fund shareholders will benefit from lower management fees as "group assets" increase at the fund complex level, regardless of whether Fidelity achieves any such economies of scale.
The Board concluded, taking into account the analysis of the Economies of Scale Committee, that economies of scale, if any, are being appropriately shared between fund shareholders and Fidelity.
Additional Information Requested by the Board. In order to develop fully the factual basis for consideration of the Fidelity funds' advisory contracts, the Board requested and received additional information on certain topics, including: (i) fund flow and performance trends, in particular the underperformance of certain funds and strategies, and Fidelity's long-term strategies for certain funds, including any consideration of fund liquidations or mergers; (ii) the operation of performance fees and competitor use of performance fees; (iii) Fidelity's pricing philosophy compared to competitors; (iv) fund profitability methodology and data; (v) evaluation of competitive fund data and peer group classifications and fee and expense comparisons; (vi) the management fee and expense structures for different funds and classes and information about the differences between various fee and expense structures; (vii) group fee breakpoints and related voluntary fee waivers; and (viii) information regarding other accounts managed by Fidelity and the funds' sub-advisory arrangements.
Conclusion. Based on its evaluation of all of the conclusions noted above, and after considering all factors it believed relevant, the Board, including the Independent Trustees, concluded that the advisory and sub-advisory fee arrangements are fair and reasonable in light of all of the surrounding circumstances and that the fund's Advisory Contracts should be renewed through July 31, 2024.
1.827482.117
FIV-ANN-1223
Fidelity® Emerging Markets Discovery Fund
Fidelity® Total Emerging Markets Fund
Annual Report
October 31, 2023
Includes Fidelity and Fidelity Advisor share classes
Contents
To view a fund's proxy voting guidelines and proxy voting record for the 12-month period ended June 30, visit http://www.fidelity.com/proxyvotingresults or visit the Securities and Exchange Commission's (SEC) web site at http://www.sec.gov.
You may also call 1-800-544-8544 if you're an individual investing directly with Fidelity, call 1-800-835-5092 if you're a plan sponsor or participant with Fidelity as your recordkeeper or call 1-877-208-0098 on institutional accounts or if you're an advisor or invest through one to request a free copy of the proxy voting guidelines.
Standard & Poor's, S&P and S&P 500 are registered service marks of The McGraw-Hill Companies, Inc. and have been licensed for use by Fidelity Distributors Corporation.
Other third-party marks appearing herein are the property of their respective owners.
All other marks appearing herein are registered or unregistered trademarks or service marks of FMR LLC or an affiliated company. © 2023 FMR LLC. All rights reserved.
This report and the financial statements contained herein are submitted for the general information of the shareholders of the Funds. This report is not authorized for distribution to prospective investors in the Funds unless preceded or accompanied by an effective prospectus.
A fund files its complete schedule of portfolio holdings with the SEC for the first and third quarters of each fiscal year on Form N-PORT. Forms N-PORT are available on the SEC's web site at http://www.sec.gov. A fund's Forms N-PORT may be reviewed and copied at the SEC's Public Reference Room in Washington, DC. Information regarding the operation of the SEC's Public Reference Room may be obtained by calling 1-800-SEC-0330.
For a complete list of a fund's portfolio holdings, view the most recent holdings listing, semiannual report, or annual report on Fidelity's web site at http://www.fidelity.com, http://www.institutional.fidelity.com, or http://www.401k.com, as applicable.
NOT FDIC INSURED •MAY LOSE VALUE •NO BANK GUARANTEE
Neither the Funds nor Fidelity Distributors Corporation is a bank.
Average annual total return reflects the change in the value of an investment, assuming reinvestment of distributions from dividend income and capital gains (the profits earned upon the sale of securities that have grown in value, if any) and assuming a constant rate of performance each year. The hypothetical investment and the average annual total returns do not reflect the deduction of taxes that a shareholder would pay on fund distributions or the redemption of fund shares. During periods of reimbursement by Fidelity, a fund's total return will be greater than it would be had the reimbursement not occurred. How a fund did yesterday is no guarantee of how it will do tomorrow.
| Average Annual Total Returns |
| | | | |
Periods ended October 31, 2023 | Past 1 year | Past 5 years | Past 10 years |
Class A (incl. 5.75% sales charge) | 8.91% | 6.03% | 3.25% |
Class M (incl. 3.50% sales charge) | 11.22% | 6.22% | 3.22% |
Class C (incl. contingent deferred sales charge) | 13.76% | 6.47% | 3.24% |
| Fidelity® Emerging Markets Discovery Fund | 15.94% | 7.61% | 4.17% |
| Class I | 15.99% | 7.62% | 4.17% |
| Class Z | 16.10% | 7.77% | 4.25% |
Class C shares' contingent deferred sales charges included in the past one year, past five years and past ten years total return figures are 1%, 0% and 0%, respectively.
The initial offering of Class Z shares took place on October 2, 2018. Returns prior to October 2, 2018, are those of Class I.
| $10,000 Over 10 Years |
| |
Let's say hypothetically that $10,000 was invested in Fidelity® Emerging Markets Discovery Fund, a class of the fund, on October 31, 2013. The chart shows how the value of your investment would have changed, and also shows how the MSCI Emerging Markets SMID Cap Index performed over the same period. |
|
|
Fidelity® Emerging Markets Discovery Fund
Market Recap:
International (non-U.S.) equities gained 12.27% for the 12 months ending October 31, 2023, according to the MSCI ACWI (All Country World Index) ex USA Index, as global economic expansion and a slowing in the pace of inflation in some markets provided a favorable backdrop for risk assets. After returning -15.86% in 2022, the index's upturn has been largely driven by a narrow set of companies in the information technology and communication services sectors, in part due to excitement for generative artificial intelligence applications. The index gained 14.07% year to date through July, including strong gains in both June (+4.50%) and July (+4.07%). The rally for international equities sputtered for the next three months (-11.33%) amid a stalling pattern in disinflationary trends, heightened global recession and geopolitical risks, soaring yields on longer-term U.S. government bonds and particularly weak economic conditions in the eurozone and China. The three-month decline left non-U.S. stocks up 1.15% year to date through October. For the full 12 months, nearly all regions advanced, with Europe ex U.K. (+18%) and Japan (+17%) leading, whereas Canada (-0.38%) lagged by the widest margin. Each of the 11 sectors advanced, with information technology (+21%) and consumer discretionary (+19%) leading the way. Energy and industrials each rose about 14%. Conversely, four defensive-oriented sectors lagged by the widest margin: real estate (+4%), health care (+6%), consumer staples (+7%) and utilities (+8%).
Comments from Portfolio Manager Gregory Lee:
For the fiscal year, the fund's share classes (excluding sales charges, if applicable) gained about 15% to 16%, versus 13.56% for the benchmark MSCI Emerging Markets SMID Index (Net MA). From a regional standpoint, stock picking in Emerging Asia, primarily in Taiwan, and Latin America, especially Mexico, contributed to the fund's performance versus the benchmark. By sector, security selection was the primary contributor, led by information technology, where our picks in technology hardware & equipment helped most. Stock picking in financials, primarily within the insurance industry, also helped. Stock selection in consumer staples and real estate also boosted the fund's relative performance. The top individual relative contributor was our stake in King Slide Works (+108%). A second notable relative contributor was an overweight in Cyient (+109%). A stake in Wiwynn gained about 96% and notably helped. In contrast, from a regional standpoint, an overweight in Latin America, primarily in Mexico, and an underweight in Emerging Europe, especially in Turkey, detracted from the fund's relative result. By sector, the biggest detractor from performance versus the benchmark was an underweight in information technology. Stock picks in materials also hampered the fund's result. Lastly, the fund's position in cash was a notable detractor. The fund's non-benchmark stake in Impala Platinum Holdings returned -58% and was the biggest individual relative detractor. This period we increased our investment in Impala Platinum Holdings. Not owning EcoPro, a benchmark component that gained 887%, was the second-largest relative detractor. Notable changes in positioning include decreased exposure to Indonesia and Mexico. By sector, meaningful changes in positioning include increased exposure to the information technology and consumer staples sectors.
The views expressed above reflect those of the portfolio manager(s) only through the end of the period as stated on the cover of this report and do not necessarily represent the views of Fidelity or any other person in the Fidelity organization. Any such views are subject to change at any time based upon market or other conditions and Fidelity disclaims any responsibility to update such views. These views may not be relied on as investment advice and, because investment decisions for a Fidelity fund are based on numerous factors, may not be relied on as an indication of trading intent on behalf of any Fidelity fund.
Fidelity® Emerging Markets Discovery Fund
Top Holdings (% of Fund's net assets) |
| |
| Innovent Biologics, Inc. (China, Biotechnology) | 1.5 | |
| Hansoh Pharmaceutical Group Co. Ltd. (China, Pharmaceuticals) | 1.4 | |
| Solar Industries India Ltd. (India, Chemicals) | 1.4 | |
| Rumo SA (Brazil, Ground Transportation) | 1.4 | |
| Equatorial Energia SA (Brazil, Electric Utilities) | 1.3 | |
| Makalot Industrial Co. Ltd. (Taiwan, Textiles, Apparel & Luxury Goods) | 1.3 | |
| Yageo Corp. (Taiwan, Electronic Equipment, Instruments & Components) | 1.3 | |
| Catrion Catering Holding Co. (Saudi Arabia, Commercial Services & Supplies) | 1.3 | |
| Shriram Transport Finance Co. Ltd. (India, Consumer Finance) | 1.3 | |
| Db Insurance Co. Ltd. (Korea (South), Insurance) | 1.2 | |
| | 13.4 | |
| |
| Market Sectors (% of Fund's net assets) |
| |
| Industrials | 17.3 | |
| Financials | 15.9 | |
| Consumer Discretionary | 14.6 | |
| Information Technology | 10.0 | |
| Consumer Staples | 8.6 | |
| Health Care | 8.1 | |
| Real Estate | 6.5 | |
| Utilities | 5.7 | |
| Materials | 4.4 | |
| Energy | 2.6 | |
| Communication Services | 1.8 | |
| |
Asset Allocation (% of Fund's net assets) |
|
|
Geographic Diversification (% of Fund's net assets) |
|
* Includes Short-Term investments and Net Other Assets (Liabilities). Percentages are adjusted for the effect of derivatives, if applicable. |
| |
Fidelity® Emerging Markets Discovery Fund
Showing Percentage of Net Assets
| Common Stocks - 95.5% |
| | | Shares | Value ($) |
| Brazil - 13.2% | | | |
| Afya Ltd. (a) | | 710,759 | 11,443,220 |
| Atacadao SA | | 5,422,894 | 9,648,110 |
| Caixa Seguridade Participacoes | | 4,254,890 | 9,131,335 |
| Enauta Participacoes SA | | 3,048,548 | 10,539,236 |
| Equatorial Energia SA | | 1,978,677 | 12,401,685 |
| Hypera SA (a) | | 1,571,069 | 9,438,723 |
| Localiza Rent a Car SA | | 739,203 | 7,458,374 |
| Localiza Rent a Car SA rights 11/10/23 (a) | | 5,420 | 7,525 |
| LOG Commercial Properties e Participacoes SA | | 2,518,856 | 10,351,703 |
| Lojas Renner SA (a) | | 4,152,226 | 10,096,949 |
| Orizon Valorizacao de Residuos SA (a) | | 1,354,510 | 9,263,352 |
| Rumo SA | | 2,894,036 | 12,806,256 |
| XP, Inc. Class A | | 492,732 | 9,854,640 |
TOTAL BRAZIL | | | 122,441,108 |
| Chile - 1.1% | | | |
| Banco de Chile sponsored ADR | | 489,179 | 10,018,386 |
| China - 19.4% | | | |
| China Communications Services Corp. Ltd. (H Shares) | | 21,661,754 | 8,860,227 |
| China Resources Beer Holdings Co. Ltd. | | 1,711,463 | 9,056,493 |
| Far East Horizon Ltd. | | 13,590,164 | 9,562,537 |
| Flat Glass Group Co. Ltd. (b) | | 3,644,610 | 6,545,281 |
| Fu Shou Yuan International Group Ltd. | | 13,889,386 | 9,324,847 |
| Guangdong Investment Ltd. | | 13,024,370 | 8,887,597 |
| Haier Smart Home Co. Ltd. (A Shares) | | 3,037,611 | 9,231,281 |
| Haitian International Holdings Ltd. | | 3,094,997 | 7,383,375 |
| Hansoh Pharmaceutical Group Co. Ltd. (c) | | 6,960,308 | 13,095,773 |
| Innovent Biologics, Inc. (a)(c) | | 2,377,107 | 14,008,679 |
| Li Ning Co. Ltd. | | 2,288,240 | 7,012,092 |
| Pharmaron Beijing Co. Ltd. (H Shares) (c) | | 3,884,902 | 9,273,765 |
| Shenzhen Expressway Co. Ltd. (H Shares) | | 11,545,465 | 9,519,212 |
| Sinopec Engineering Group Co. Ltd. (H Shares) | | 20,980,632 | 10,485,347 |
| Sinopharm Group Co. Ltd. (H Shares) | | 1,718,643 | 4,109,762 |
| Sinotruk Hong Kong Ltd. | | 5,733,335 | 10,798,754 |
| Tongdao Liepin Group (a) | | 8,574,797 | 6,300,140 |
| TravelSky Technology Ltd. (H Shares) | | 6,210,689 | 9,811,232 |
| Tsingtao Brewery Co. Ltd. (H Shares) | | 1,158,266 | 8,783,744 |
| Zai Lab Ltd. (a) | | 3,388,750 | 8,648,280 |
TOTAL CHINA | | | 180,698,418 |
| Georgia - 1.0% | | | |
| Bank of Georgia Group PLC | | 227,726 | 9,217,093 |
| Hong Kong - 2.1% | | | |
| ASMPT Ltd. | | 1,028,453 | 8,710,535 |
| WH Group Ltd. (c) | | 17,573,743 | 10,495,622 |
TOTAL HONG KONG | | | 19,206,157 |
| Hungary - 0.9% | | | |
| Richter Gedeon PLC | | 367,685 | 8,621,198 |
| India - 15.4% | | | |
| Bharat Electronics Ltd. | | 6,250,893 | 10,011,530 |
| Computer Age Management Services Private Ltd. | | 329,920 | 8,902,895 |
| Cyient Ltd. | | 491,542 | 9,374,364 |
| Deccan Cements Ltd. | | 699,739 | 4,283,550 |
| Eicher Motors Ltd. | | 226,273 | 8,952,777 |
| Embassy Office Parks (REIT) | | 2,453,687 | 9,179,171 |
| Hindustan Aeronautics Ltd. | | 430,330 | 9,414,867 |
| Indraprastha Gas Ltd. | | 1,432,153 | 6,576,734 |
| ITC Ltd. | | 1,759,645 | 9,055,152 |
| Mahanagar Gas Ltd. | | 575,400 | 7,132,351 |
| Manappuram General Finance & Leasing Ltd. | | 882,173 | 1,456,681 |
| Oberoi Realty Ltd. | | 601,791 | 8,222,530 |
| Petronet LNG Ltd. | | 3,036,521 | 7,276,260 |
| Power Grid Corp. of India Ltd. | | 3,502,154 | 8,503,285 |
| Shriram Transport Finance Co. Ltd. | | 540,307 | 12,188,491 |
| Solar Industries India Ltd. | | 197,220 | 13,024,258 |
| Torrent Pharmaceuticals Ltd. | | 406,398 | 9,391,261 |
TOTAL INDIA | | | 142,946,157 |
| Indonesia - 0.8% | | | |
| First Resources Ltd. | | 7,164,981 | 7,911,034 |
| Korea (South) - 8.6% | | | |
| Coway Co. Ltd. | | 320,739 | 10,248,687 |
| Db Insurance Co. Ltd. | | 179,965 | 11,690,972 |
| Fila Holdings Corp. | | 316,775 | 8,375,520 |
| Hanon Systems | | 1,607,022 | 8,188,045 |
| Hansol Chemical Co. Ltd. | | 82,138 | 9,152,642 |
| Hyundai Marine & Fire Insurance Co. Ltd. | | 344,049 | 8,013,725 |
| LG Corp. | | 112,131 | 6,408,754 |
| SFA Engineering Corp. | | 418,530 | 8,645,573 |
| Soulbrain Co. Ltd. | | 55,267 | 9,529,543 |
TOTAL KOREA (SOUTH) | | | 80,253,461 |
| Malaysia - 0.0% | | | |
| Scientex Bhd warrants 1/14/26 (a) | | 130,640 | 15,631 |
| Mexico - 5.2% | | | |
| Becle S.A.B. de CV | | 1,308,099 | 2,306,532 |
| FIBRA Macquarie Mexican (REIT) (c) | | 3,727,733 | 5,776,963 |
| Fibra Uno Administracion SA de CV | | 4,376,486 | 6,643,986 |
| Grupo Comercial Chedraui S.A.B. de CV | | 1,960,073 | 11,379,491 |
| Qualitas Controladora S.A.B. de CV | | 1,362,463 | 11,253,223 |
| Regional S.A.B. de CV | | 1,384,662 | 10,533,385 |
TOTAL MEXICO | | | 47,893,580 |
| Peru - 0.1% | | | |
| Intercorp Financial Services, Inc. | | 46,568 | 874,547 |
| Philippines - 1.0% | | | |
| Robinsons Land Corp. | | 36,176,629 | 8,872,287 |
| Poland - 1.1% | | | |
| Dino Polska SA (a)(b)(c) | | 112,810 | 10,672,899 |
| Romania - 1.0% | | | |
| Societatea de Producere A Energiei Electrice in Hidrocentrale Hidroelectrica SA | | 379,360 | 9,431,569 |
| Russia - 0.1% | | | |
| Etalon Group PLC GDR (Reg. S) (a)(d) | | 167,549 | 13,330 |
| LSR Group OJSC (d) | | 67,346 | 67,761 |
| TCS Group Holding PLC GDR (a)(d) | | 59,253 | 75,469 |
| X5 Retail Group NV GDR (Reg. S) (a)(d) | | 101,790 | 1,026,043 |
TOTAL RUSSIA | | | 1,182,603 |
| Saudi Arabia - 2.5% | | | |
| Bupa Arabia for Cooperative Insurance Co. | | 194,211 | 11,026,480 |
| Catrion Catering Holding Co. | | 439,860 | 12,240,480 |
TOTAL SAUDI ARABIA | | | 23,266,960 |
| South Africa - 3.9% | | | |
| Bidvest Group Ltd./The | | 773,317 | 10,946,144 |
| FirstRand Ltd. (b) | | 2,948,036 | 9,718,435 |
| Impala Platinum Holdings Ltd. | | 1,213,330 | 5,054,238 |
| Mr Price Group Ltd. | | 1,441,908 | 10,421,968 |
TOTAL SOUTH AFRICA | | | 36,140,785 |
| Taiwan - 12.7% | | | |
| BizLink Holding, Inc. | | 1,239,828 | 9,654,032 |
| Chailease Holding Co. Ltd. | | 2,014,682 | 10,920,326 |
| Cleanaway Co. Ltd. | | 1,568,475 | 8,372,996 |
| E Ink Holdings, Inc. | | 2,059,860 | 10,709,456 |
| International Games Systems Co. Ltd. | | 543,195 | 10,461,979 |
| Makalot Industrial Co. Ltd. | | 1,103,727 | 12,343,893 |
| Nanya Technology Corp. | | 5,253,340 | 10,523,679 |
| Poya International Co. Ltd. | | 657,621 | 10,101,465 |
| Realtek Semiconductor Corp. | | 916,642 | 11,415,194 |
| Unimicron Technology Corp. | | 2,427,394 | 10,817,632 |
| Yageo Corp. | | 756,504 | 12,324,198 |
TOTAL TAIWAN | | | 117,644,850 |
| Turkey - 1.0% | | | |
| Mavi Jeans Class B (c) | | 2,639,876 | 8,902,360 |
| United Arab Emirates - 1.2% | | | |
| Aldar Properties PJSC | | 7,987,761 | 11,308,564 |
| United States of America - 3.1% | | | |
| FirstCash Holdings, Inc. | | 100,040 | 10,896,357 |
| Parade Technologies Ltd. | | 341,755 | 11,196,453 |
| Tenaris SA sponsored ADR | | 228,680 | 7,162,258 |
TOTAL UNITED STATES OF AMERICA | | | 29,255,068 |
| Vietnam - 0.1% | | | |
| FPT Corp. | | 225,647 | 763,191 |
| TOTAL COMMON STOCKS (Cost $876,092,753) | | | 887,537,906 |
| | | | |
| Money Market Funds - 5.7% |
| | | Shares | Value ($) |
| Fidelity Cash Central Fund 5.40% (e) | | 41,341,153 | 41,349,421 |
| Fidelity Securities Lending Cash Central Fund 5.40% (e)(f) | | 11,125,384 | 11,126,496 |
| TOTAL MONEY MARKET FUNDS (Cost $52,475,917) | | | 52,475,917 |
| | | | |
| TOTAL INVESTMENT IN SECURITIES - 101.2% (Cost $928,568,670) | 940,013,823 |
NET OTHER ASSETS (LIABILITIES) - (1.2)% | (10,812,445) |
| NET ASSETS - 100.0% | 929,201,378 |
| | |
Legend
| (b) | Security or a portion of the security is on loan at period end. |
| (c) | Security exempt from registration under Rule 144A of the Securities Act of 1933. These securities may be resold in transactions exempt from registration, normally to qualified institutional buyers. At the end of the period, the value of these securities amounted to $72,226,061 or 7.8% of net assets. |
| (e) | Affiliated fund that is generally available only to investment companies and other accounts managed by Fidelity Investments. The rate quoted is the annualized seven-day yield of the fund at period end. A complete unaudited listing of the fund's holdings as of its most recent quarter end is available upon request. In addition, each Fidelity Central Fund's financial statements, which are not covered by the Fund's Report of Independent Registered Public Accounting Firm, are available on the SEC's website or upon request. |
| (f) | Investment made with cash collateral received from securities on loan. |
Affiliated Central Funds
Fiscal year to date information regarding the Fund's investments in Fidelity Central Funds, including the ownership percentage, is presented below.
| Affiliate | Value, beginning of period ($) | Purchases ($) | Sales Proceeds ($) | Dividend Income ($) | Realized Gain (loss) ($) | Change in Unrealized appreciation (depreciation) ($) | Value, end of period ($) | % ownership, end of period |
| Fidelity Cash Central Fund 5.40% | 16,540,486 | 446,002,702 | 421,193,767 | 1,603,062 | - | - | 41,349,421 | 0.1% |
| Fidelity Securities Lending Cash Central Fund 5.40% | 1,598,400 | 128,570,965 | 119,042,869 | 155,573 | - | - | 11,126,496 | 0.0% |
| Total | 18,138,886 | 574,573,667 | 540,236,636 | 1,758,635 | - | - | 52,475,917 | |
| | | | | | | | | |
Amounts in the dividend income column in the above table include any capital gain distributions from underlying funds, which are presented in the corresponding line item in the Statement of Operations, if applicable.
Amounts in the dividend income column for Fidelity Securities Lending Cash Central Fund represents the income earned on investing cash collateral, less rebates paid to borrowers and any lending agent fees associated with the loan, plus any premium payments received for lending certain types of securities.
Amounts included in the purchases and sales proceeds columns may include in-kind transactions, if applicable.
Investment Valuation
The following is a summary of the inputs used, as of October 31, 2023, involving the Fund's assets and liabilities carried at fair value. The inputs or methodology used for valuing securities may not be an indication of the risk associated with investing in those securities. For more information on valuation inputs, and their aggregation into the levels used below, please refer to the Investment Valuation section in the accompanying Notes to Financial Statements.
| Valuation Inputs at Reporting Date: |
| Description | Total ($) | Level 1 ($) | Level 2 ($) | Level 3 ($) |
Investments in Securities: | | | | |
|
| Equities: | | | | |
Communication Services | 16,762,119 | - | 16,762,119 | - |
Consumer Discretionary | 134,454,336 | 40,864,497 | 93,589,839 | - |
Consumer Staples | 80,335,120 | 34,007,032 | 45,302,045 | 1,026,043 |
Energy | 24,977,754 | 17,701,494 | 7,276,260 | - |
Financials | 146,432,082 | 92,523,881 | 53,832,732 | 75,469 |
Health Care | 76,587,441 | 18,059,921 | 58,527,520 | - |
Industrials | 161,179,693 | 52,722,131 | 108,457,562 | - |
Information Technology | 92,379,983 | - | 92,379,983 | - |
Materials | 41,059,862 | - | 41,059,862 | - |
Real Estate | 60,436,295 | 34,081,216 | 26,273,988 | 81,091 |
Utilities | 52,933,221 | 21,833,254 | 31,099,967 | - |
|
| Money Market Funds | 52,475,917 | 52,475,917 | - | - |
| Total Investments in Securities: | 940,013,823 | 364,269,343 | 574,561,877 | 1,182,603 |
Fidelity® Emerging Markets Discovery Fund
| Statement of Assets and Liabilities |
| | | | October 31, 2023 |
| | | | | |
| Assets | | | | |
| Investment in securities, at value (including securities loaned of $10,606,194) - See accompanying schedule: | | | | |
Unaffiliated issuers (cost $876,092,753) | $ | 887,537,906 | | |
Fidelity Central Funds (cost $52,475,917) | | 52,475,917 | | |
| | | | | |
| | | | | |
| Total Investment in Securities (cost $928,568,670) | | | $ | 940,013,823 |
| Foreign currency held at value (cost $144,541) | | | | 142,821 |
| Receivable for investments sold | | | | 2,541,963 |
| Receivable for fund shares sold | | | | 1,811,639 |
| Dividends receivable | | | | 1,050,686 |
| Distributions receivable from Fidelity Central Funds | | | | 221,086 |
| Prepaid expenses | | | | 1,083 |
| Other receivables | | | | 113,652 |
Total assets | | | | 945,896,753 |
| Liabilities | | | | |
| Payable for fund shares redeemed | $ | 597,916 | | |
| Accrued management fee | | 640,050 | | |
| Distribution and service plan fees payable | | 10,234 | | |
| Other affiliated payables | | 168,321 | | |
| Deferred taxes | | 4,015,060 | | |
| Other payables and accrued expenses | | 137,298 | | |
| Collateral on securities loaned | | 11,126,496 | | |
| Total Liabilities | | | | 16,695,375 |
| Net Assets | | | $ | 929,201,378 |
| Net Assets consist of: | | | | |
| Paid in capital | | | $ | 922,059,871 |
| Total accumulated earnings (loss) | | | | 7,141,507 |
| Net Assets | | | $ | 929,201,378 |
| | | | | |
| Net Asset Value and Maximum Offering Price | | | | |
| Class A : | | | | |
Net Asset Value and redemption price per share ($23,373,494 ÷ 1,590,986 shares)(a) | | | $ | 14.69 |
| Maximum offering price per share (100/94.25 of $14.69) | | | $ | 15.59 |
| Class M : | | | | |
Net Asset Value and redemption price per share ($6,559,726 ÷ 447,743 shares)(a) | | | $ | 14.65 |
| Maximum offering price per share (100/96.50 of $14.65) | | | $ | 15.18 |
| Class C : | | | | |
Net Asset Value and offering price per share ($3,299,903 ÷ 231,946 shares)(a) | | | $ | 14.23 |
| Emerging Markets Discovery : | | | | |
Net Asset Value, offering price and redemption price per share ($368,811,476 ÷ 24,922,485 shares) | | | $ | 14.80 |
| Class I : | | | | |
Net Asset Value, offering price and redemption price per share ($404,844,409 ÷ 27,270,733 shares) | | | $ | 14.85 |
| Class Z : | | | | |
Net Asset Value, offering price and redemption price per share ($122,312,370 ÷ 8,252,738 shares) | | | $ | 14.82 |
(a)Redemption price per share is equal to net asset value less any applicable contingent deferred sales charge. |
| Statement of Operations |
| �� | | | Year ended October 31, 2023 |
| Investment Income | | | | |
| Dividends | | | $ | 25,962,417 |
| Interest | | | | 2,544 |
| Income from Fidelity Central Funds (including $155,573 from security lending) | | | | 1,758,635 |
| Income before foreign taxes withheld | | | $ | 27,723,596 |
| Less foreign taxes withheld | | | | (2,926,407) |
| Total Income | | | | 24,797,189 |
| Expenses | | | | |
| Management fee | $ | 5,852,572 | | |
| Transfer agent fees | | 1,253,882 | | |
| Distribution and service plan fees | | 114,931 | | |
| Accounting fees | | 331,691 | | |
| Custodian fees and expenses | | 247,322 | | |
| Independent trustees' fees and expenses | | 3,422 | | |
| Registration fees | | 184,523 | | |
| Audit | | 108,193 | | |
| Legal | | 1,380 | | |
| Miscellaneous | | 2,314 | | |
| Total expenses before reductions | | 8,100,230 | | |
| Expense reductions | | (45,435) | | |
| Total expenses after reductions | | | | 8,054,795 |
| Net Investment income (loss) | | | | 16,742,394 |
| Realized and Unrealized Gain (Loss) | | | | |
| Net realized gain (loss) on: | | | | |
| Investment Securities: | | | | |
| Unaffiliated issuers (net of foreign taxes of $177,054) | | (3,481,594) | | |
| Foreign currency transactions | | (295,930) | | |
| Total net realized gain (loss) | | | | (3,777,524) |
| Change in net unrealized appreciation (depreciation) on: | | | | |
| Investment Securities: | | | | |
| Unaffiliated issuers(net of increase in deferred foreign taxes of $2,267,786) | | 49,060,219 | | |
| Assets and liabilities in foreign currencies | | 8,996 | | |
| Total change in net unrealized appreciation (depreciation) | | | | 49,069,215 |
| Net gain (loss) | | | | 45,291,691 |
| Net increase (decrease) in net assets resulting from operations | | | $ | 62,034,085 |
| Statement of Changes in Net Assets |
| |
| | Year ended October 31, 2023 | | Year ended October 31, 2022 |
| Increase (Decrease) in Net Assets | | | | |
| Operations | | | | |
| Net investment income (loss) | $ | 16,742,394 | $ | 8,469,843 |
| Net realized gain (loss) | | (3,777,524) | | (5,961,108) |
| Change in net unrealized appreciation (depreciation) | | 49,069,215 | | (86,323,295) |
| Net increase (decrease) in net assets resulting from operations | | 62,034,085 | | (83,814,560) |
| Distributions to shareholders | | (8,639,871) | | (35,200,802) |
| | | | | |
| Share transactions - net increase (decrease) | | 444,710,316 | | 193,227,559 |
| Total increase (decrease) in net assets | | 498,104,530 | | 74,212,197 |
| | | | | |
| Net Assets | | | | |
| Beginning of period | | 431,096,848 | | 356,884,651 |
| End of period | $ | 929,201,378 | $ | 431,096,848 |
| | | | | |
| | | | | |
Financial Highlights
| Fidelity Advisor® Emerging Markets Discovery Fund Class A |
| |
| Years ended October 31, | | 2023 | | 2022 | | 2021 | | 2020 | | 2019 |
Selected Per-Share Data | | | | | | | | | | |
| Net asset value, beginning of period | $ | 12.89 | $ | 18.36 | $ | 13.93 | $ | 13.66 | $ | 12.01 |
| Income from Investment Operations | | | | | | | | | | |
Net investment income (loss) A,B | | .31 | | .31 | | .11 | | .04 | | .13 |
| Net realized and unrealized gain (loss) | | 1.69 | | (3.92) | | 4.37 | | .34 | | 1.71 |
| Total from investment operations | | 2.00 | | (3.61) | | 4.48 | | .38 | | 1.84 |
| Distributions from net investment income | | (.20) | | (.37) | | (.05) | | (.11) | | (.18) |
| Distributions from net realized gain | | - | | (1.49) | | - | | - | | (.01) |
| Total distributions | | (.20) | | (1.86) | | (.05) | | (.11) | | (.19) |
| Net asset value, end of period | $ | 14.69 | $ | 12.89 | $ | 18.36 | $ | 13.93 | $ | 13.66 |
Total Return C,D | | 15.56% | | (21.58)% | | 32.23% | | 2.76% | | 15.50% |
Ratios to Average Net Assets B,E,F | | | | | | | | | | |
| Expenses before reductions | | 1.43% | | 1.49% | | 1.49% | | 1.54% | | 1.55% |
| Expenses net of fee waivers, if any | | 1.42% | | 1.49% | | 1.49% | | 1.53% | | 1.54% |
| Expenses net of all reductions | | 1.42% | | 1.49% | | 1.49% | | 1.51% | | 1.54% |
| Net investment income (loss) | | 2.07% | | 2.11% | | .60% | | .33% | | .96% |
| Supplemental Data | | | | | | | | | | |
| Net assets, end of period (000 omitted) | $ | 23,373 | $ | 16,063 | $ | 18,900 | $ | 11,745 | $ | 15,323 |
Portfolio turnover rate G | | 30% | | 33% | | 64% | | 43% | | 80% |
ACalculated based on average shares outstanding during the period.
BNet investment income (loss) is affected by the timing of the declaration of dividends by any underlying mutual funds or exchange-traded funds (ETFs). Net investment income (loss) of any mutual funds or ETFs is not included in the Fund's net investment income (loss) ratio.
CTotal returns would have been lower if certain expenses had not been reduced during the applicable periods shown.
DTotal returns do not include the effect of the sales charges.
EFees and expenses of any underlying mutual funds or exchange-traded funds (ETFs) are not included in the Fund's expense ratio. The Fund indirectly bears its proportionate share of these expenses. For additional expense information related to investments in Fidelity Central Funds, please refer to the "Investments in Fidelity Central Funds" note found in the Notes to Financial Statements section of the most recent Annual or Semi-Annual report.
FExpense ratios reflect operating expenses of the class. Expenses before reductions do not reflect amounts reimbursed, waived, or reduced through arrangements with the investment adviser, brokerage services, or other offset arrangements, if applicable, and do not represent the amount paid by the class during periods when reimbursements, waivers or reductions occur.
GAmount does not include the portfolio activity of any underlying mutual funds or exchange-traded funds (ETFs).
| Fidelity Advisor® Emerging Markets Discovery Fund Class M |
| |
| Years ended October 31, | | 2023 | | 2022 | | 2021 | | 2020 | | 2019 |
Selected Per-Share Data | | | | | | | | | | |
| Net asset value, beginning of period | $ | 12.85 | $ | 18.30 | $ | 13.89 | $ | 13.62 | $ | 11.94 |
| Income from Investment Operations | | | | | | | | | | |
Net investment income (loss) A,B | | .27 | | .27 | | .06 | | - C | | .08 |
| Net realized and unrealized gain (loss) | | 1.68 | | (3.91) | | 4.36 | | .34 | | 1.71 |
| Total from investment operations | | 1.95 | | (3.64) | | 4.42 | | .34 | | 1.79 |
| Distributions from net investment income | | (.15) | | (.32) | | (.01) | | (.07) | | (.10) |
| Distributions from net realized gain | | - | | (1.49) | | - | | - | | (.01) |
| Total distributions | | (.15) | | (1.81) | | (.01) | | (.07) | | (.11) |
| Net asset value, end of period | $ | 14.65 | $ | 12.85 | $ | 18.30 | $ | 13.89 | $ | 13.62 |
Total Return D,E | | 15.25% | | (21.77)% | | 31.82% | | 2.49% | | 15.06% |
Ratios to Average Net Assets B,F,G | | | | | | | | | | |
| Expenses before reductions | | 1.69% | | 1.75% | | 1.76% | | 1.83% | | 1.86% |
| Expenses net of fee waivers, if any | | 1.69% | | 1.75% | | 1.76% | | 1.83% | | 1.86% |
| Expenses net of all reductions | | 1.68% | | 1.75% | | 1.76% | | 1.80% | | 1.86% |
| Net investment income (loss) | | 1.80% | | 1.85% | | .33% | | .03% | | .64% |
| Supplemental Data | | | | | | | | | | |
| Net assets, end of period (000 omitted) | $ | 6,560 | $ | 4,355 | $ | 6,095 | $ | 4,552 | $ | 5,773 |
Portfolio turnover rate H | | 30% | | 33% | | 64% | | 43% | | 80% |
ACalculated based on average shares outstanding during the period.
BNet investment income (loss) is affected by the timing of the declaration of dividends by any underlying mutual funds or exchange-traded funds (ETFs). Net investment income (loss) of any mutual funds or ETFs is not included in the Fund's net investment income (loss) ratio.
CAmount represents less than $.005 per share.
DTotal returns would have been lower if certain expenses had not been reduced during the applicable periods shown.
ETotal returns do not include the effect of the sales charges.
FFees and expenses of any underlying mutual funds or exchange-traded funds (ETFs) are not included in the Fund's expense ratio. The Fund indirectly bears its proportionate share of these expenses. For additional expense information related to investments in Fidelity Central Funds, please refer to the "Investments in Fidelity Central Funds" note found in the Notes to Financial Statements section of the most recent Annual or Semi-Annual report.
GExpense ratios reflect operating expenses of the class. Expenses before reductions do not reflect amounts reimbursed, waived, or reduced through arrangements with the investment adviser, brokerage services, or other offset arrangements, if applicable, and do not represent the amount paid by the class during periods when reimbursements, waivers or reductions occur.
HAmount does not include the portfolio activity of any underlying mutual funds or exchange-traded funds (ETFs).
| Fidelity Advisor® Emerging Markets Discovery Fund Class C |
| |
| Years ended October 31, | | 2023 | | 2022 | | 2021 | | 2020 | | 2019 |
Selected Per-Share Data | | | | | | | | | | |
| Net asset value, beginning of period | $ | 12.47 | $ | 17.78 | $ | 13.55 | $ | 13.29 | $ | 11.66 |
| Income from Investment Operations | | | | | | | | | | |
Net investment income (loss) A,B | | .19 | | .19 | | (.03) | | (.06) | | .02 |
| Net realized and unrealized gain (loss) | | 1.65 | | (3.81) | | 4.26 | | .32 | | 1.67 |
| Total from investment operations | | 1.84 | | (3.62) | | 4.23 | | .26 | | 1.69 |
| Distributions from net investment income | | (.08) | | (.20) | | - | | - | | (.05) |
| Distributions from net realized gain | | - | | (1.49) | | - | | - | | (.01) |
| Total distributions | | (.08) | | (1.69) | | - | | - | | (.06) |
| Net asset value, end of period | $ | 14.23 | $ | 12.47 | $ | 17.78 | $ | 13.55 | $ | 13.29 |
Total Return C,D | | 14.76% | | (22.21)% | | 31.22% | | 1.96% | | 14.54% |
Ratios to Average Net Assets B,E,F | | | | | | | | | | |
| Expenses before reductions | | 2.20% | | 2.25% | | 2.25% | | 2.32% | | 2.36% |
| Expenses net of fee waivers, if any | | 2.19% | | 2.25% | | 2.25% | | 2.31% | | 2.35% |
| Expenses net of all reductions | | 2.19% | | 2.25% | | 2.25% | | 2.29% | | 2.35% |
| Net investment income (loss) | | 1.29% | | 1.35% | | (.16)% | | (.45)% | | .14% |
| Supplemental Data | | | | | | | | | | |
| Net assets, end of period (000 omitted) | $ | 3,300 | $ | 3,079 | $ | 4,995 | $ | 5,080 | $ | 7,562 |
Portfolio turnover rate G | | 30% | | 33% | | 64% | | 43% | | 80% |
ACalculated based on average shares outstanding during the period.
BNet investment income (loss) is affected by the timing of the declaration of dividends by any underlying mutual funds or exchange-traded funds (ETFs). Net investment income (loss) of any mutual funds or ETFs is not included in the Fund's net investment income (loss) ratio.
CTotal returns would have been lower if certain expenses had not been reduced during the applicable periods shown.
DTotal returns do not include the effect of the contingent deferred sales charge.
EFees and expenses of any underlying mutual funds or exchange-traded funds (ETFs) are not included in the Fund's expense ratio. The Fund indirectly bears its proportionate share of these expenses. For additional expense information related to investments in Fidelity Central Funds, please refer to the "Investments in Fidelity Central Funds" note found in the Notes to Financial Statements section of the most recent Annual or Semi-Annual report.
FExpense ratios reflect operating expenses of the class. Expenses before reductions do not reflect amounts reimbursed, waived, or reduced through arrangements with the investment adviser, brokerage services, or other offset arrangements, if applicable, and do not represent the amount paid by the class during periods when reimbursements, waivers or reductions occur.
GAmount does not include the portfolio activity of any underlying mutual funds or exchange-traded funds (ETFs).
| Fidelity® Emerging Markets Discovery Fund |
| |
| Years ended October 31, | | 2023 | | 2022 | | 2021 | | 2020 | | 2019 |
Selected Per-Share Data | | | | | | | | | | |
| Net asset value, beginning of period | $ | 12.98 | $ | 18.48 | $ | 14.02 | $ | 13.75 | $ | 12.10 |
| Income from Investment Operations | | | | | | | | | | |
Net investment income (loss) A,B | | .35 | | .36 | | .16 | | .08 | | .16 |
| Net realized and unrealized gain (loss) | | 1.71 | | (3.95) | | 4.40 | | .34 | | 1.72 |
| Total from investment operations | | 2.06 | | (3.59) | | 4.56 | | .42 | | 1.88 |
| Distributions from net investment income | | (.24) | | (.42) | | (.10) | | (.15) | | (.22) |
| Distributions from net realized gain | | - | | (1.49) | | - | | - | | (.01) |
| Total distributions | | (.24) | | (1.91) | | (.10) | | (.15) | | (.23) |
| Net asset value, end of period | $ | 14.80 | $ | 12.98 | $ | 18.48 | $ | 14.02 | $ | 13.75 |
Total Return C | | 15.94% | | (21.37)% | | 32.63% | | 3.07% | | 15.78% |
Ratios to Average Net Assets B,D,E | | | | | | | | | | |
| Expenses before reductions | | 1.15% | | 1.19% | | 1.19% | | 1.23% | | 1.25% |
| Expenses net of fee waivers, if any | | 1.15% | | 1.19% | | 1.18% | | 1.23% | | 1.25% |
| Expenses net of all reductions | | 1.15% | | 1.19% | | 1.18% | | 1.20% | | 1.25% |
| Net investment income (loss) | | 2.34% | | 2.41% | | .90% | | .63% | | 1.25% |
| Supplemental Data | | | | | | | | | | |
| Net assets, end of period (000 omitted) | $ | 368,811 | $ | 248,805 | $ | 283,133 | $ | 189,784 | $ | 208,657 |
Portfolio turnover rate F | | 30% | | 33% | | 64% | | 43% | | 80% |
ACalculated based on average shares outstanding during the period.
BNet investment income (loss) is affected by the timing of the declaration of dividends by any underlying mutual funds or exchange-traded funds (ETFs). Net investment income (loss) of any mutual funds or ETFs is not included in the Fund's net investment income (loss) ratio.
CTotal returns would have been lower if certain expenses had not been reduced during the applicable periods shown.
DFees and expenses of any underlying mutual funds or exchange-traded funds (ETFs) are not included in the Fund's expense ratio. The Fund indirectly bears its proportionate share of these expenses. For additional expense information related to investments in Fidelity Central Funds, please refer to the "Investments in Fidelity Central Funds" note found in the Notes to Financial Statements section of the most recent Annual or Semi-Annual report.
EExpense ratios reflect operating expenses of the class. Expenses before reductions do not reflect amounts reimbursed, waived, or reduced through arrangements with the investment adviser, brokerage services, or other offset arrangements, if applicable, and do not represent the amount paid by the class during periods when reimbursements, waivers or reductions occur.
FAmount does not include the portfolio activity of any underlying mutual funds or exchange-traded funds (ETFs).
| Fidelity Advisor® Emerging Markets Discovery Fund Class I |
| |
| Years ended October 31, | | 2023 | | 2022 | | 2021 | | 2020 | | 2019 |
Selected Per-Share Data | | | | | | | | | | |
| Net asset value, beginning of period | $ | 13.03 | $ | 18.54 | $ | 14.06 | $ | 13.79 | $ | 12.13 |
| Income from Investment Operations | | | | | | | | | | |
Net investment income (loss) A,B | | .36 | | .34 | | .16 | | .08 | | .17 |
| Net realized and unrealized gain (loss) | | 1.71 | | (3.95) | | 4.41 | | .34 | | 1.72 |
| Total from investment operations | | 2.07 | | (3.61) | | 4.57 | | .42 | | 1.89 |
| Distributions from net investment income | | (.25) | | (.41) | | (.09) | | (.15) | | (.22) |
| Distributions from net realized gain | | - | | (1.49) | | - | | - | | (.01) |
| Total distributions | | (.25) | | (1.90) | | (.09) | | (.15) | | (.23) |
| Net asset value, end of period | $ | 14.85 | $ | 13.03 | $ | 18.54 | $ | 14.06 | $ | 13.79 |
Total Return C | | 15.99% | | (21.37)% | | 32.62% | | 3.07% | | 15.78% |
Ratios to Average Net Assets B,D,E | | | | | | | | | | |
| Expenses before reductions | | 1.12% | | 1.17% | | 1.19% | | 1.24% | | 1.25% |
| Expenses net of fee waivers, if any | | 1.11% | | 1.16% | | 1.19% | | 1.23% | | 1.24% |
| Expenses net of all reductions | | 1.11% | | 1.16% | | 1.19% | | 1.21% | | 1.24% |
| Net investment income (loss) | | 2.37% | | 2.44% | | .90% | | .63% | | 1.26% |
| Supplemental Data | | | | | | | | | | |
| Net assets, end of period (000 omitted) | $ | 404,844 | $ | 129,250 | $ | 27,397 | $ | 28,034 | $ | 51,081 |
Portfolio turnover rate F | | 30% | | 33% | | 64% | | 43% | | 80% |
ACalculated based on average shares outstanding during the period.
BNet investment income (loss) is affected by the timing of the declaration of dividends by any underlying mutual funds or exchange-traded funds (ETFs). Net investment income (loss) of any mutual funds or ETFs is not included in the Fund's net investment income (loss) ratio.
CTotal returns would have been lower if certain expenses had not been reduced during the applicable periods shown.
DFees and expenses of any underlying mutual funds or exchange-traded funds (ETFs) are not included in the Fund's expense ratio. The Fund indirectly bears its proportionate share of these expenses. For additional expense information related to investments in Fidelity Central Funds, please refer to the "Investments in Fidelity Central Funds" note found in the Notes to Financial Statements section of the most recent Annual or Semi-Annual report.
EExpense ratios reflect operating expenses of the class. Expenses before reductions do not reflect amounts reimbursed, waived, or reduced through arrangements with the investment adviser, brokerage services, or other offset arrangements, if applicable, and do not represent the amount paid by the class during periods when reimbursements, waivers or reductions occur.
FAmount does not include the portfolio activity of any underlying mutual funds or exchange-traded funds (ETFs).
| Fidelity Advisor® Emerging Markets Discovery Fund Class Z |
| |
| Years ended October 31, | | 2023 | | 2022 | | 2021 | | 2020 | | 2019 |
Selected Per-Share Data | | | | | | | | | | |
| Net asset value, beginning of period | $ | 13.00 | $ | 18.51 | $ | 14.04 | $ | 13.77 | $ | 12.13 |
| Income from Investment Operations | | | | | | | | | | |
Net investment income (loss) A,B | | .38 | | .37 | | .19 | | .10 | | .18 |
| Net realized and unrealized gain (loss) | | 1.70 | | (3.95) | | 4.40 | | .35 | | 1.72 |
| Total from investment operations | | 2.08 | | (3.58) | | 4.59 | | .45 | | 1.90 |
| Distributions from net investment income | | (.26) | | (.44) | | (.12) | | (.18) | | (.26) |
| Distributions from net realized gain | | - | | (1.49) | | - | | - | | (.01) |
| Total distributions | | (.26) | | (1.93) | | (.12) | | (.18) | | (.26) C |
| Net asset value, end of period | $ | 14.82 | $ | 13.00 | $ | 18.51 | $ | 14.04 | $ | 13.77 |
Total Return D | | 16.10% | | (21.27)% | | 32.82% | | 3.24% | | 15.97% |
Ratios to Average Net Assets B,E,F | | | | | | | | | | |
| Expenses before reductions | | .99% | | 1.03% | | 1.05% | | 1.09% | | 1.10% |
| Expenses net of fee waivers, if any | | .98% | | 1.03% | | 1.05% | | 1.08% | | 1.10% |
| Expenses net of all reductions | | .98% | | 1.03% | | 1.05% | | 1.06% | | 1.10% |
| Net investment income (loss) | | 2.50% | | 2.57% | | 1.04% | | .78% | | 1.40% |
| Supplemental Data | | | | | | | | | | |
| Net assets, end of period (000 omitted) | $ | 122,312 | $ | 29,546 | $ | 16,365 | $ | 11,561 | $ | 18,267 |
Portfolio turnover rate G | | 30% | | 33% | | 64% | | 43% | | 80% |
ACalculated based on average shares outstanding during the period.
BNet investment income (loss) is affected by the timing of the declaration of dividends by any underlying mutual funds or exchange-traded funds (ETFs). Net investment income (loss) of any mutual funds or ETFs is not included in the Fund's net investment income (loss) ratio.
CTotal distributions per share do not sum due to rounding.
DTotal returns would have been lower if certain expenses had not been reduced during the applicable periods shown.
EFees and expenses of any underlying mutual funds or exchange-traded funds (ETFs) are not included in the Fund's expense ratio. The Fund indirectly bears its proportionate share of these expenses. For additional expense information related to investments in Fidelity Central Funds, please refer to the "Investments in Fidelity Central Funds" note found in the Notes to Financial Statements section of the most recent Annual or Semi-Annual report.
FExpense ratios reflect operating expenses of the class. Expenses before reductions do not reflect amounts reimbursed, waived, or reduced through arrangements with the investment adviser, brokerage services, or other offset arrangements, if applicable, and do not represent the amount paid by the class during periods when reimbursements, waivers or reductions occur.
GAmount does not include the portfolio activity of any underlying mutual funds or exchange-traded funds (ETFs).
For the period ended October 31, 2023
1. Organization.
Fidelity Emerging Markets Discovery Fund (the Fund) is a fund of Fidelity Investment Trust (the Trust) and is authorized to issue an unlimited number of shares. The Trust is registered under the Investment Company Act of 1940, as amended (the 1940 Act), as an open-end management investment company organized as a Massachusetts business trust. The Fund offers Class A, Class M, Class C, Emerging Markets Discovery, Class I and Class Z shares, each of which has equal rights as to assets and voting privileges. Class A, Class M, Class C, Class I and Class Z are Fidelity Advisor classes. Each class has exclusive voting rights with respect to matters that affect that class. Class C shares will automatically convert to Class A shares after a holding period of eight years from the initial date of purchase, with certain exceptions. The Fund's investments in emerging markets can be subject to social, economic, regulatory, and political uncertainties and can be extremely volatile.
2. Investments in Fidelity Central Funds.
Funds may invest in Fidelity Central Funds, which are open-end investment companies generally available only to other investment companies and accounts managed by the investment adviser and its affiliates. The Schedule of Investments lists any Fidelity Central Funds held as an investment as of period end, but does not include the underlying holdings of each Fidelity Central Fund. An investing fund indirectly bears its proportionate share of the expenses of the underlying Fidelity Central Funds.
Based on its investment objective, each Fidelity Central Fund may invest or participate in various investment vehicles or strategies that are similar to those of the investing fund. These strategies are consistent with the investment objectives of the investing fund and may involve certain economic risks which may cause a decline in value of each of the Fidelity Central Funds and thus a decline in the value of the investing fund.
| Fidelity Central Fund | Investment Manager | Investment Objective | Investment Practices | Expense RatioA |
| Fidelity Money Market Central Funds | Fidelity Management & Research Company LLC (FMR) | Each fund seeks to obtain a high level of current income consistent with the preservation of capital and liquidity. | Short-term Investments | Less than .005% |
A Expenses expressed as a percentage of average net assets and are as of each underlying Central Fund's most recent annual or semi-annual shareholder report.
A complete unaudited list of holdings for each Fidelity Central Fund is available upon request or at the Securities and Exchange Commission website at www.sec.gov. In addition, the financial statements of the Fidelity Central Funds which contain the significant accounting policies (including investment valuation policies) of those funds, and are not covered by the Report of Independent Registered Public Accounting Firm, are available on the Securities and Exchange Commission website or upon request.
3. Significant Accounting Policies.
The Fund is an investment company and applies the accounting and reporting guidance of the Financial Accounting Standards Board (FASB) Accounting Standards Codification Topic 946 Financial Services - Investment Companies. The financial statements have been prepared in conformity with accounting principles generally accepted in the United States of America (GAAP), which require management to make certain estimates and assumptions at the date of the financial statements. Actual results could differ from those estimates. Subsequent events, if any, through the date that the financial statements were issued have been evaluated in the preparation of the financial statements. The Fund's Schedule of Investments lists any underlying mutual funds or exchange-traded funds (ETFs) but does not include the underlying holdings of these funds. The following summarizes the significant accounting policies of the Fund:
Investment Valuation. Investments are valued as of 4:00 p.m. Eastern time on the last calendar day of the period. The Board of Trustees (the Board) has designated the Fund's investment adviser as the valuation designee responsible for the fair valuation function and performing fair value determinations as needed. The investment adviser has established a Fair Value Committee (the Committee) to carry out the day-to-day fair valuation responsibilities and has adopted policies and procedures to govern the fair valuation process and the activities of the Committee. In accordance with these fair valuation policies and procedures, which have been approved by the Board, the Fund attempts to obtain prices from one or more third party pricing services or brokers to value its investments. When current market prices, quotations or currency exchange rates are not readily available or reliable, investments will be fair valued in good faith by the Committee, in accordance with the policies and procedures. Factors used in determining fair value vary by investment type and may include market or investment specific events, transaction data, estimated cash flows, and market observations of comparable investments. The frequency that the fair valuation procedures are used cannot be predicted and they may be utilized to a significant extent. The Committee manages the Fund's fair valuation practices and maintains the fair valuation policies and procedures. The Fund's investment adviser reports to the Board information regarding the fair valuation process and related material matters.
The Fund categorizes the inputs to valuation techniques used to value its investments into a disclosure hierarchy consisting of three levels as shown below:
Level 1 - unadjusted quoted prices in active markets for identical investments
Level 2 - other significant observable inputs (including quoted prices for similar investments, interest rates, prepayment speeds, etc.)
Level 3 - unobservable inputs (including the Fund's own assumptions based on the best information available)
Valuation techniques used to value the Fund's investments by major category are as follows:
Equity securities, including restricted securities, for which market quotations are readily available, are valued at the last reported sale price or official closing price as reported by a third party pricing service on the primary market or exchange on which they are traded and are categorized as Level 1 in the hierarchy. In the event there were no sales during the day or closing prices are not available, securities are valued at the last quoted bid price or may be valued using the last available price and are generally categorized as Level 2 in the hierarchy. For foreign equity securities, when market or security specific events arise, comparisons to the valuation of American Depositary Receipts (ADRs), futures contracts, ETFs and certain indexes as well as quoted prices for similar securities may be used and would be categorized as Level 2 in the hierarchy. For equity securities, including restricted securities, where observable inputs are limited, assumptions about market activity and risk are used and these securities may be categorized as Level 3 in the hierarchy.
Investments in open-end mutual funds, including the Fidelity Central Funds, are valued at their closing net asset value (NAV) each business day and are categorized as Level 1 in the hierarchy.
Changes in valuation techniques may result in transfers in or out of an assigned level within the disclosure hierarchy. The aggregate value of investments by input level as of October 31, 2023 is included at the end of the Fund's Schedule of Investments.
Foreign Currency. Certain Funds may use foreign currency contracts to facilitate transactions in foreign-denominated securities. Gains and losses from these transactions may arise from changes in the value of the foreign currency or if the counterparties do not perform under the contracts' terms.
Foreign-denominated assets, including investment securities, and liabilities are translated into U.S. dollars at the exchange rates at period end. Purchases and sales of investment securities, income and dividends received, and expenses denominated in foreign currencies are translated into U.S. dollars at the exchange rate in effect on the transaction date.
The effects of exchange rate fluctuations on investments are included with the net realized and unrealized gain (loss) on investment securities. Other foreign currency transactions resulting in realized and unrealized gain (loss) are disclosed separately.
Investment Transactions and Income. For financial reporting purposes, the Fund's investment holdings and NAV include trades executed through the end of the last business day of the period. The NAV per share for processing shareholder transactions is calculated as of the close of business of the New York Stock Exchange (NYSE), normally 4:00 p.m. Eastern time and includes trades executed through the end of the prior business day. Gains and losses on securities sold are determined on the basis of identified cost and include proceeds received from litigation. Commissions paid to certain brokers with whom the investment adviser, or its affiliates, places trades on behalf of a fund include an amount in addition to trade execution, which may be rebated back to a fund. Any such rebates are included in net realized gain (loss) on investments in the Statement of Operations. Dividend income is recorded on the ex-dividend date, except for certain dividends from foreign securities where the ex-dividend date may have passed, which are recorded as soon as the Fund is informed of the ex-dividend date. Non-cash dividends included in dividend income, if any, are recorded at the fair market value of the securities received. Income and capital gain distributions from Fidelity Central Funds, if any, are recorded on the ex-dividend date. Interest income is accrued as earned and includes coupon interest and amortization of premium and accretion of discount on debt securities as applicable. Investment income is recorded net of foreign taxes withheld where recovery of such taxes is uncertain. Funds may file withholding tax reclaims in certain jurisdictions to recover a portion of amounts previously withheld. Any withholding tax reclaims income is included in the Statement of Operations in foreign taxes withheld. Any receivables for withholding tax reclaims are included in the Statement of Assets and Liabilities in dividends receivable.
Class Allocations and Expenses. Investment income, realized and unrealized capital gains and losses, common expenses of a fund, and certain fund-level expense reductions, if any, are allocated daily on a pro-rata basis to each class based on the relative net assets of each class to the total net assets of a fund. Each class differs with respect to transfer agent and distribution and service plan fees incurred, as applicable. Certain expense reductions may also differ by class, if applicable. For the reporting period, the allocated portion of income and expenses to each class as a percent of its average net assets may vary due to the timing of recording these transactions in relation to fluctuating net assets of the classes. Expenses directly attributable to a fund are charged to that fund. Expenses attributable to more than one fund are allocated among the respective funds on the basis of relative net assets or other appropriate methods. Expenses included in the accompanying financial statements reflect the expenses of that fund and do not include any expenses associated with any underlying mutual funds or exchange-traded funds (ETFs). Although not included in a fund's expenses, a fund indirectly bears its proportionate share of these expenses through the net asset value of each underlying mutual fund or exchange-traded fund (ETF). Expense estimates are accrued in the period to which they relate and adjustments are made when actual amounts are known.
Income Tax Information and Distributions to Shareholders. Each year, the Fund intends to qualify as a regulated investment company under Subchapter M of the Internal Revenue Code, including distributing substantially all of its taxable income and realized gains. As a result, no provision for U.S. Federal income taxes is required. As of October 31, 2023, the Fund did not have any unrecognized tax benefits in the financial statements; nor is the Fund aware of any tax positions for which it is reasonably possible that the total amounts of unrecognized tax benefits will significantly change in the next twelve months. The Fund files a U.S. federal tax return, in addition to state and local tax returns as required. The Fund's federal income tax returns are subject to examination by the Internal Revenue Service (IRS) for a period of three fiscal years after they are filed. State and local tax returns may be subject to examination for an additional fiscal year depending on the jurisdiction. Foreign taxes are provided for based on the Fund's understanding of the tax rules and rates that exist in the foreign markets in which it invests. The Fund is subject to a tax imposed on capital gains by certain countries in which it invests. An estimated deferred tax liability for net unrealized appreciation on the applicable securities is included in Deferred taxes on the Statement of Assets & Liabilities.
Distributions are declared and recorded on the ex-dividend date. Income and capital gain distributions are declared separately for each class. Income and capital gain distributions are determined in accordance with income tax regulations, which may differ from GAAP. In addition, the Fund claimed a portion of the payment made to redeeming shareholders as a distribution for income tax purposes.
Capital accounts within the financial statements are adjusted for permanent book-tax differences. These adjustments have no impact on net assets or the results of operations. Capital accounts are not adjusted for temporary book-tax differences which will reverse in a subsequent period.
Book-tax differences are primarily due to foreign currency transactions, certain foreign taxes, passive foreign investment companies (PFIC), capital loss carryforwards and losses deferred due to wash sales.
As of period end, the cost and unrealized appreciation (depreciation) in securities, and derivatives if applicable, for federal income tax purposes were as follows:
| Gross unrealized appreciation | $109,777,125 |
| Gross unrealized depreciation | (107,588,704) |
| Net unrealized appreciation (depreciation) | $2,188,421 |
| Tax Cost | $937,825,402 |
The tax-based components of distributable earnings as of period end were as follows:
| Undistributed ordinary income | $19,250,265 |
| Capital loss carryforward | $(10,250,300) |
| Net unrealized appreciation (depreciation) on securities and other investments | $2,156,600 |
Capital loss carryforwards are only available to offset future capital gains of the Fund to the extent provided by regulations and may be limited. The capital loss carryforward information presented below, including any applicable limitation, is estimated as of fiscal period end and is subject to adjustment.
| Short-term | $(2,477,383) |
| Long-term | (7,772,917) |
Total capital loss carryforward | $(10,250,300) |
The tax character of distributions paid was as follows:
| | October 31, 2023 | October 31, 2022 |
| Ordinary Income | $8,639,871 | $7,555,455 |
| Long-term Capital Gains | - | 27,645,347 |
| Total | $8,639,871 | $35,200,802 |
Restricted Securities (including Private Placements). Funds may invest in securities that are subject to legal or contractual restrictions on resale. These securities generally may be resold in transactions exempt from registration or to the public if the securities are registered. Disposal of these securities may involve time-consuming negotiations and expense, and prompt sale at an acceptable price may be difficult. Information regarding restricted securities held at period end is included at the end of the Schedule of Investments, if applicable.
4. Purchases and Sales of Investments.
Purchases and sales of securities, other than short-term securities and in-kind transactions, as applicable, are noted in the table below.
| | Purchases ($) | Sales ($) |
| Fidelity Emerging Markets Discovery Fund | 635,424,985 | 205,437,979 |
5. Fees and Other Transactions with Affiliates.
Management Fee. Fidelity Management & Research Company LLC (the investment adviser) and its affiliates provide the Fund with investment management related services for which the Fund pays a monthly management fee. The management fee is the sum of an individual fund fee rate that is based on an annual rate of .60% of the Fund's average net assets and an annualized group fee rate that averaged .23% during the period. The group fee rate is based upon the monthly average net assets of a group of registered investment companies with which the investment adviser has management contracts. The group fee rate decreases as assets under management increase and increases as assets under management decrease. For the reporting period, the total annual management fee rate was .82% of the Fund's average net assets.
Distribution and Service Plan Fees. In accordance with Rule 12b-1 of the 1940 Act, the Fund has adopted separate Distribution and Service Plans for each class of shares. Certain classes pay Fidelity Distributors Company LLC (FDC), an affiliate of the investment adviser, separate Distribution and Service Fees, each of which is based on an annual percentage of each class' average net assets. In addition, FDC may pay financial intermediaries for selling shares of the Fund and providing shareholder support services. For the period, the Distribution and Service Fee rates, total fees and amounts retained by FDC were as follows:
| | Distribution Fee | Service Fee | Total Fees | Retained by FDC |
| Class A | - % | .25% | $51,964 | $1,225 |
| Class M | .25% | .25% | 27,740 | 17 |
| Class C | .75% | .25% | 35,227 | 4,418 |
| | | | $114,931 | $5,660 |
Sales Load. FDC may receive a front-end sales charge of up to 5.75% for selling Class A shares and 3.50% for selling Class M shares, some of which is paid to financial intermediaries for selling shares of the Fund. Depending on the holding period, FDC may receive contingent deferred sales charges levied on Class A, Class M and Class C redemptions. The deferred sales charges are 1.00% for Class C shares, 1.00% for certain purchases of Class A shares and .25% for certain purchases of Class M shares.
For the period, sales charge amounts retained by FDC were as follows:
| | Retained by FDC |
| Class A | $10,520 |
| Class M | 934 |
Class CA | 227 |
| | $11,681 |
A When Class C shares are initially sold, FDC pays commissions from its own resources to financial intermediaries through which the sales are made.
Transfer Agent Fees. Fidelity Investments Institutional Operations Company LLC (FIIOC), an affiliate of the investment adviser, is the transfer, dividend disbursing and shareholder servicing agent for each class of the Fund. FIIOC receives account fees and asset-based fees that vary according to the account size and type of account of the shareholders of the respective classes of the Fund, except for Class Z. FIIOC receives an asset-based fee of Class Z's average net assets. FIIOC pays for typesetting, printing and mailing of shareholder reports, except proxy statements.
For the period, transfer agent fees for each class were as follows:
| | Amount | % of Class-Level Average Net Assets |
| Class A | $47,856 | .23 |
| Class M | 13,709 | .25 |
| Class C | 8,938 | .25 |
| Emerging Markets Discovery | 687,685 | .21 |
| Class I | 460,986 | .17 |
| Class Z | 34,708 | .04 |
| | $1,253,882 | |
During November 2023, the Board approved a change in the transfer agent fees effective December 1, 2023 to a fixed annual rate of class-level average net assets as follows:
| | % of Class-Level Average Net Assets |
| Class A | 0.2000% |
| Class M | 0.2000% |
| Class C | 0.2000% |
| Emerging Markets Discovery | 0.2000% |
| Class I | 0.1752% |
Accounting Fees. Fidelity Service Company, Inc. (FSC), an affiliate of the investment adviser, maintains the Fund's accounting records. The accounting fee is based on the level of average net assets for each month. For the period, the fees were equivalent to the following annual rates:
| | % of Average Net Assets |
| Fidelity Emerging Markets Discovery Fund | .05 |
During November 2023, the Board approved a change in the accounting fees effective December 1, 2023 to a fixed annual rate of average net assets as follows:
| | % of Average Net Assets |
| Fidelity Emerging Markets Discovery Fund | 0.0455% |
Brokerage Commissions. A portion of portfolio transactions were placed with brokerage firms which are affiliates of the investment adviser. Brokerage commissions are included in net realized gain (loss) and change in net unrealized appreciation (depreciation) in the Statement of Operations. The commissions paid to these affiliated firms were as follows:
| | Amount |
| Fidelity Emerging Markets Discovery Fund | $ 470 |
Interfund Trades. Funds may purchase from or sell securities to other Fidelity Funds under procedures adopted by the Board. The procedures have been designed to ensure these interfund trades are executed in accordance with Rule 17a-7 of the 1940 Act. Any interfund trades are included within the respective purchases and sales amounts shown in the Purchases and Sales of Investments note. Interfund trades during the period are noted in the table below.
| | Purchases ($) | Sales ($) | Realized Gain (Loss) ($) |
| Fidelity Emerging Markets Discovery Fund | 5,265,657 | - | - |
6. Committed Line of Credit.
Certain Funds participate with other funds managed by the investment adviser or an affiliate in a $4.25 billion credit facility (the "line of credit") to be utilized for temporary or emergency purposes to fund shareholder redemptions or for other short-term liquidity purposes. The participating funds have agreed to pay commitment fees on their pro-rata portion of the line of credit, which are reflected in Miscellaneous expenses on the Statement of Operations, and are listed below. During the period, there were no borrowings on this line of credit.
| | Amount |
| Fidelity Emerging Markets Discovery Fund | $1,188 |
7. Security Lending.
Funds lend portfolio securities from time to time in order to earn additional income. Lending agents are used, including National Financial Services (NFS), an affiliate of the investment adviser. Pursuant to a securities lending agreement, NFS will receive a fee, which is capped at 9.9% of a fund's daily lending revenue, for its services as lending agent. A fund may lend securities to certain qualified borrowers, including NFS. On the settlement date of the loan, a fund receives collateral (in the form of U.S. Treasury obligations, letters of credit and/or cash) against the loaned securities and maintains collateral in an amount not less than 100% of the market value of the loaned securities during the period of the loan. The market value of the loaned securities is determined at the close of business of a fund and any additional required collateral is delivered to a fund on the next business day. A fund or borrower may terminate the loan at any time, and if the borrower defaults on its obligation to return the securities loaned because of insolvency or other reasons, a fund may apply collateral received from the borrower against the obligation. A fund may experience delays and costs in recovering the securities loaned. Any cash collateral received is invested in the Fidelity Securities Lending Cash Central Fund. Any loaned securities are identified as such in the Schedule of Investments, and the value of loaned securities and cash collateral at period end, as applicable, are presented in the Statement of Assets and Liabilities. Security lending income represents the income earned on investing cash collateral, less rebates paid to borrowers and any lending agent fees associated with the loan, plus any premium payments received for lending certain types of securities. Security lending income is presented in the Statement of Operations as a component of income from Fidelity Central Funds. Affiliated security lending activity, if any, was as follows:
| | Total Security Lending Fees Paid to NFS | Security Lending Income From Securities Loaned to NFS | Value of Securities Loaned to NFS at Period End |
| Fidelity Emerging Markets Discovery Fund | $16,293 | $- | $- |
8. Expense Reductions.
Through arrangements with the Fund's custodian and each class' transfer agent, credits realized as a result of certain uninvested cash balances were used to reduce the Fund's expenses. During the period, custodian credits reduced the Fund's expenses by $480. During the period, transfer agent credits reduced each class' expenses as noted in the table below.
| | Expense reduction |
| Class A | $27 |
| Class M | 264 |
| | $291 |
In addition, during the period the investment adviser or an affiliate reimbursed and/or waived a portion of fund-level operating expenses in the amount of $44,664.
9. Distributions to Shareholders.
Distributions to shareholders of each class were as follows:
| | Year ended October 31, 2023 | Year ended October 31, 2022 |
| Fidelity Emerging Markets Discovery Fund | | |
| Distributions to shareholders | | |
| Class A | $244,475 | $1,910,190 |
| Class M | 51,851 | 606,383 |
| Class C | 19,009 | 467,124 |
| Emerging Markets Discovery | 4,513,320 | 27,737,464 |
| Class I | 3,021,352 | 2,782,285 |
| Class Z | 789,864 | 1,697,356 |
Total | $8,639,871 | $35,200,802 |
10. Share Transactions.
Share transactions for each class were as follows and may contain in-kind transactions, automatic conversions between classes or exchanges between affiliated funds:
| | Shares | Shares | Dollars | Dollars |
| | Year ended October 31, 2023 | Year ended October 31, 2022 | Year ended October 31, 2023 | Year ended October 31, 2022 |
| Fidelity Emerging Markets Discovery Fund | | | | |
| Class A | | | | |
| Shares sold | 510,197 | 314,404 | $7,644,504 | $4,478,487 |
| Reinvestment of distributions | 17,518 | 120,206 | 244,303 | 1,910,075 |
| Shares redeemed | (183,067) | (217,629) | (2,708,612) | (3,180,396) |
| Net increase (decrease) | 344,648 | 216,981 | $5,180,195 | $3,208,166 |
| Class M | | | | |
| Shares sold | 154,343 | 36,386 | $2,297,021 | $551,246 |
| Reinvestment of distributions | 3,721 | 38,167 | 51,851 | 606,098 |
| Shares redeemed | (49,285) | (68,600) | (724,267) | (1,005,289) |
| Net increase (decrease) | 108,779 | 5,953 | $1,624,605 | $152,055 |
| Class C | | | | |
| Shares sold | 67,155 | 28,436 | $954,938 | $399,577 |
| Reinvestment of distributions | 1,399 | 30,156 | 19,009 | 467,124 |
| Shares redeemed | (83,426) | (92,682) | (1,201,723) | (1,325,981) |
| Net increase (decrease) | (14,872) | (34,090) | $(227,776) | $(459,280) |
| Emerging Markets Discovery | | | | |
| Shares sold | 10,451,564 | 10,307,936 | $157,422,112 | $148,982,256 |
| Reinvestment of distributions | 291,173 | 1,414,497 | 4,078,445 | 22,589,516 |
| Shares redeemed | (4,985,788) | (7,875,882) | (74,007,673) | (118,180,120) |
| Net increase (decrease) | 5,756,949 | 3,846,551 | $87,492,884 | $53,391,652 |
| Class I | | | | |
| Shares sold | 21,737,486 | 9,283,493 | $328,505,575 | $129,714,339 |
| Reinvestment of distributions | 205,837 | 170,907 | 2,893,435 | 2,737,935 |
| Shares redeemed | (4,589,758) | (1,015,195) | (69,325,801) | (14,790,592) |
| Net increase (decrease) | 17,353,565 | 8,439,205 | $262,073,209 | $117,661,682 |
| Class Z | | | | |
| Shares sold | 7,691,312 | 1,609,828 | $114,184,599 | $22,578,984 |
| Reinvestment of distributions | 55,484 | 104,684 | 777,160 | 1,671,802 |
| Shares redeemed | (1,766,483) | (326,408) | (26,394,560) | (4,977,502) |
| Net increase (decrease) | 5,980,313 | 1,388,104 | $88,567,199 | $19,273,284 |
11. Other.
A fund's organizational documents provide former and current trustees and officers with a limited indemnification against liabilities arising in connection with the performance of their duties to the fund. In the normal course of business, a fund may also enter into contracts that provide general indemnifications. A fund's maximum exposure under these arrangements is unknown as this would be dependent on future claims that may be made against a fund. The risk of material loss from such claims is considered remote.
12. Risk and Uncertainties.
Many factors affect a fund's performance. Developments that disrupt global economies and financial markets, such as pandemics, epidemics, outbreaks of infectious diseases, war, terrorism, and environmental disasters, may significantly affect a fund's investment performance. The effects of these developments to a fund will be impacted by the types of securities in which a fund invests, the financial condition, industry, economic sector, and geographic location of an issuer, and a fund's level of investment in the securities of that issuer. Significant concentrations in security types, issuers, industries, sectors, and geographic locations may magnify the factors that affect a fund's performance.
Average annual total return reflects the change in the value of an investment, assuming reinvestment of distributions from dividend income and capital gains (the profits earned upon the sale of securities that have grown in value, if any) and assuming a constant rate of performance each year. The hypothetical investment and the average annual total returns do not reflect the deduction of taxes that a shareholder would pay on fund distributions or the redemption of fund shares. During periods of reimbursement by Fidelity, a fund's total return will be greater than it would be had the reimbursement not occurred. How a fund did yesterday is no guarantee of how it will do tomorrow.
| Average Annual Total Returns |
| | | | |
Periods ended October 31, 2023 | Past 1 year | Past 5 years | Past 10 years |
Class A (incl. 5.75% sales charge) | 6.10% | 0.00% | 1.09% |
Class M (incl. 3.50% sales charge) | 8.33% | 0.17% | 1.03% |
Class C (incl. contingent deferred sales charge) | 10.68% | 0.45% | 1.09% |
| Fidelity® Total Emerging Markets Fund | 12.86% | 1.46% | 1.95% |
| Class I | 12.96% | 1.50% | 1.98% |
| Class Z | 13.04% | 1.61% | 2.03% |
Class C shares' contingent deferred sales charges included in the past one year, past five years and past ten years total return figures are 1%, 0% and 0%, respectively.
The initial offering of Class Z shares took place on October 2, 2018. Returns prior to October 2, 2018, are those of Class I.
| $10,000 Over 10 Years |
| |
Let's say hypothetically that $10,000 was invested in Fidelity® Total Emerging Markets Fund, a class of the fund, on October 31, 2013. The chart shows how the value of your investment would have changed, and also shows how the MSCI Emerging Markets Index performed over the same period. |
|
|
Fidelity® Total Emerging Markets Fund
Market Recap:
For the 12 months ending October 31, 2023, the Fidelity Total Emerging Markets Composite IndexSM - consisting of 60% equities and 40% debt - gained 10.03%. Separately, emerging-markets equities advanced 10.84%, as measured by the MSCI Emerging Markets Index, and emerging-markets debt gained 8.36%, according to the J.P. Morgan Emerging Markets Bond Index Global Diversified. Global asset prices rose this period, driven by optimism about inflation and monetary policy easing in some markets. These tailwinds persisted until August, when rising U.S. Treasury yields, another interest rate hike by the U.S. Federal Reserve and a lackluster economic recovery in China caused the Composite index to tumble. Among emerging-markets stocks, Taiwan (+27%) and China (+21%) were standouts. Taiwan was helped by its exposure to technology, which rallied amid exuberance for artificial intelligence. Meanwhile, China was fueled by excitement about its economic reopening. In contrast, falling oil prices weighed on Qatar (-21%), United Arab Emirates (-12%) and Saudi Arabia (-11%). Within the emerging-markets debt index, idiosyncratic factors were at play. For instance, two fairly small index components, Sri Lanka (+128%) and El Salvador (+120%), led. Sri Lanka benefited from fiscal reform, debt restructuring and a bailout from the International Monetary Fund, while El Salvador's president reported the country's repayment of 2023 bonds and a deal to reprofile its debt.
Comments from Co-Portfolio Manager Gregory Lee:
For the fiscal year, the fund's share classes (excluding sales charges, if applicable) gained about 12% to 13%, versus 10.03% for the Fidelity Total Emerging Markets Composite IndexSM. Security selection among emerging-markets equities and debt each contributed to the fund's performance versus the Composite, as did an underweight in equities and overweight in debt. Among stocks, our choices in consumer discretionary, communication services and materials helped most. Non-Composite holdings in Russian tech company Yandex and X5 Retail Group, a Russia-based food retailer, were the top individual relative contributors. Meanwhile, it hurt to own a non-Composite investment in PagSeguro Digital, a Brazilian financial services company, and to overweight South African mining company Impala Platinum Holdings (-58%). Within the debt subportfolio, security selection in Venezuela, a country that has not been part of the J.P. Morgan index since its removal in late 2019, significantly contributed to relative performance. Positioning in Ukraine and China also boosted the fund's relative result. Conversely, a non-Composite stake in U.S. Treasuries detracted most this period, followed by positioning in Qatar.
Note to shareholders:
On December 27, 2022, Lewis Chung assumed co-management responsibilities for the fund's real estate sleeve. On July 1, 2023, Guillermo de las Casas came off of the fund.
The views expressed above reflect those of the portfolio manager(s) only through the end of the period as stated on the cover of this report and do not necessarily represent the views of Fidelity or any other person in the Fidelity organization. Any such views are subject to change at any time based upon market or other conditions and Fidelity disclaims any responsibility to update such views. These views may not be relied on as investment advice and, because investment decisions for a Fidelity fund are based on numerous factors, may not be relied on as an indication of trading intent on behalf of any Fidelity fund.
Fidelity® Total Emerging Markets Fund
Top Holdings (% of Fund's net assets) |
| |
| Taiwan Semiconductor Manufacturing Co. Ltd. (Taiwan, Semiconductors & Semiconductor Equipment) | 4.4 | |
| Samsung Electronics Co. Ltd. (Korea (South), Technology Hardware, Storage & Peripherals) | 2.6 | |
| Tencent Holdings Ltd. (China, Interactive Media & Services) | 2.4 | |
| Alibaba Group Holding Ltd. (China, Broadline Retail) | 1.7 | |
| HDFC Bank Ltd. (India, Banks) | 1.3 | |
| PDD Holdings, Inc. ADR (China, Broadline Retail) | 1.1 | |
| Reliance Industries Ltd. (India, Oil, Gas & Consumable Fuels) | 1.0 | |
| SK Hynix, Inc. (Korea (South), Semiconductors & Semiconductor Equipment) | 0.9 | |
| Infosys Ltd. (India, IT Services) | 0.9 | |
| China Construction Bank Corp. (H Shares) (China, Banks) | 0.8 | |
| | 17.1 | |
| |
| Market Sectors (% of Fund's net assets) |
| |
| Financials | 14.7 | |
| Information Technology | 11.4 | |
| Energy | 10.7 | |
| Consumer Discretionary | 9.5 | |
| Materials | 6.9 | |
| Communication Services | 6.2 | |
| Industrials | 4.0 | |
| Consumer Staples | 4.0 | |
| Utilities | 3.5 | |
| Health Care | 2.2 | |
| Real Estate | 0.6 | |
| |
Asset Allocation (% of Fund's net assets) |
|
Futures - 0.2% |
|
Geographic Diversification (% of Fund's net assets) |
|
* Includes Short-Term investments and Net Other Assets (Liabilities). Percentages are adjusted for the effect of derivatives, if applicable. |
| |
Fidelity® Total Emerging Markets Fund
Showing Percentage of Net Assets
| Common Stocks - 54.9% |
| | | Shares | Value ($) |
| Brazil - 3.6% | | | |
| Cury Construtora e Incorporado SA | | 19,200 | 56,133 |
| Cyrela Brazil Realty SA | | 11,300 | 40,321 |
| Dexco SA | | 212,643 | 289,330 |
| ENGIE Brasil Energia SA | | 27,400 | 213,581 |
| Equatorial Energia SA | | 54,715 | 342,935 |
| Hapvida Participacoes e Investimentos SA (a)(b) | | 350,828 | 256,767 |
| Hypera SA (a) | | 20,437 | 122,782 |
| Localiza Rent a Car SA | | 52,326 | 527,956 |
| Localiza Rent a Car SA rights 11/10/23 (a) | | 389 | 540 |
| LOG Commercial Properties e Participacoes SA | | 15,700 | 64,522 |
| MercadoLibre, Inc. (a) | | 329 | 408,203 |
| Multiplan Empreendimentos Imobiliarios SA (a) | | 2,700 | 13,249 |
| PagSeguro Digital Ltd. (a) | | 79,280 | 559,717 |
| Raia Drogasil SA | | 133,908 | 685,244 |
| Rede D'Oregon Sao Luiz SA (b) | | 4,700 | 20,155 |
| Rumo SA | | 126,400 | 559,326 |
| StoneCo Ltd. Class A (a) | | 32,705 | 324,270 |
| Suzano Papel e Celulose SA | | 39,800 | 407,098 |
| Transmissora Alianca de Energia Eletrica SA | | 26,900 | 180,285 |
| Vale SA sponsored ADR | | 86,568 | 1,186,847 |
| XP, Inc. Class A | | 51,435 | 1,028,700 |
| YDUQS Participacoes SA | | 20,151 | 70,864 |
TOTAL BRAZIL | | | 7,358,825 |
| Canada - 0.5% | | | |
| Barrick Gold Corp. | | 58,500 | 934,830 |
| Chile - 0.6% | | | |
| Antofagasta PLC | | 37,058 | 605,817 |
| Banco de Chile | | 6,343,200 | 651,684 |
TOTAL CHILE | | | 1,257,501 |
| China - 15.6% | | | |
| Advanced Micro-Fabrication Equipment, Inc., China (A Shares) | | 8,600 | 201,476 |
| Akeso, Inc. (a)(b) | | 20,410 | 114,614 |
| Alibaba Group Holding Ltd. (a) | | 315,954 | 3,252,771 |
| Alibaba Group Holding Ltd. sponsored ADR (a) | | 2,334 | 192,648 |
| Angelalign Technology, Inc. (b)(c) | | 4,847 | 33,417 |
| Anta Sports Products Ltd. | | 16,943 | 191,617 |
| Asymchem Laboratories Tianjin Co. Ltd. (H Shares) (b) | | 4,816 | 62,629 |
| Baidu, Inc.: | | | |
| Class A (a) | | 11,570 | 151,900 |
| sponsored ADR (a) | | 783 | 82,215 |
| BeiGene Ltd. ADR (a) | | 1,243 | 231,546 |
| Beijing Enlight Media Co. Ltd. (A Shares) | | 86,800 | 92,838 |
| Bilibili, Inc. ADR (a)(c) | | 6,475 | 86,959 |
| BYD Co. Ltd. (H Shares) | | 32,960 | 1,002,318 |
| C&S Paper Co. Ltd. (A Shares) | | 123,900 | 183,978 |
| China Communications Services Corp. Ltd. (H Shares) | | 464,000 | 189,788 |
| China Construction Bank Corp. (H Shares) | | 2,889,000 | 1,633,897 |
| China Gas Holdings Ltd. | | 203,944 | 183,347 |
| China Jushi Co. Ltd. (A Shares) | | 265,200 | 419,802 |
| China Life Insurance Co. Ltd. (H Shares) | | 544,000 | 736,793 |
| China Merchants Shekou Industrial Zone Holdings Co. Ltd. (A Shares) | | 27,100 | 40,886 |
| China Overseas Land and Investment Ltd. | | 90,040 | 169,915 |
| China Petroleum & Chemical Corp. (H Shares) | | 1,080,000 | 552,353 |
| China Resources Beer Holdings Co. Ltd. | | 76,666 | 405,691 |
| China Resources Land Ltd. | | 80,510 | 301,358 |
| China Tower Corp. Ltd. (H Shares) (b) | | 688,950 | 64,245 |
| Daqin Railway Co. Ltd. (A Shares) | | 498,600 | 491,528 |
| Daqo New Energy Corp. ADR (a) | | 1,013 | 25,791 |
| ENN Energy Holdings Ltd. | | 42,600 | 322,701 |
| ESR Group Ltd. (b) | | 32,200 | 41,374 |
| Greentown China Holdings Ltd. | | 66,500 | 64,514 |
| Guangdong Investment Ltd. | | 260,000 | 177,419 |
| Haier Smart Home Co. Ltd. | | 163,000 | 464,930 |
| Haier Smart Home Co. Ltd. (A Shares) | | 12,560 | 38,170 |
| Haitian International Holdings Ltd. | | 105,000 | 250,486 |
| Innovent Biologics, Inc. (a)(b) | | 45,426 | 267,703 |
| JD.com, Inc. Class A | | 30,488 | 387,599 |
| JOYY, Inc. ADR | | 3,200 | 124,544 |
| KE Holdings, Inc. ADR | | 13,867 | 203,984 |
| Kingdee International Software Group Co. Ltd. (a) | | 25,000 | 33,172 |
| Kunlun Energy Co. Ltd. | | 318,040 | 264,960 |
| Kweichow Moutai Co. Ltd. (A Shares) | | 2,500 | 575,886 |
| Lenovo Group Ltd. | | 389,008 | 452,701 |
| Li Auto, Inc.: | | | |
| ADR (a) | | 20,411 | 690,096 |
| Class A (a) | | 3,125 | 52,855 |
| Longfor Properties Co. Ltd. (b) | | 15,980 | 23,263 |
| Maxscend Microelectronics Co. Ltd. (A Shares) | | 3,800 | 78,414 |
| Medlive Technology Co. Ltd. (b) | | 74,611 | 74,490 |
| Meituan Class B (a)(b) | | 111,958 | 1,587,006 |
| NetEase, Inc. ADR | | 4,345 | 464,567 |
| New Oriental Education & Technology Group, Inc. (a) | | 6,877 | 44,838 |
| New Oriental Education & Technology Group, Inc. sponsored ADR (a) | | 10,429 | 682,995 |
| PDD Holdings, Inc. ADR (a) | | 22,142 | 2,245,642 |
| Ping An Insurance Group Co. of China Ltd. (H Shares) | | 270,500 | 1,372,105 |
| Proya Cosmetics Co. Ltd. (A Shares) | | 37,956 | 539,043 |
| Shangri-La Asia Ltd. (a) | | 46,000 | 29,347 |
| Shenzhen Mindray Bio-Medical Electronics Co. Ltd. (A Shares) (a) | | 9,112 | 356,219 |
| Sinopec Engineering Group Co. Ltd. (H Shares) | | 307,000 | 153,427 |
| Sinopharm Group Co. Ltd. (H Shares) | | 65,375 | 156,330 |
| Sinotruk Hong Kong Ltd. | | 101,000 | 190,234 |
| Sunny Optical Technology Group Co. Ltd. | | 24,100 | 201,908 |
| Tencent Holdings Ltd. | | 132,085 | 4,888,302 |
| Tofflon Science & Technology Group Co. Ltd. (A Shares) | | 8,871 | 23,004 |
| Tongdao Liepin Group (a) | | 38,232 | 28,090 |
| TravelSky Technology Ltd. (H Shares) | | 140,000 | 221,163 |
| Trip.com Group Ltd. ADR (a) | | 22,869 | 777,546 |
| Tsingtao Brewery Co. Ltd. (H Shares) | | 62,000 | 470,179 |
| Uni-President China Holdings Ltd. | | 211,600 | 144,013 |
| WuXi AppTec Co. Ltd. (H Shares) (b)(c) | | 18,206 | 218,773 |
| Wuxi Biologics (Cayman), Inc. (a)(b) | | 96,683 | 601,150 |
| Xinyi Solar Holdings Ltd. | | 193,528 | 113,893 |
| XPeng, Inc. ADR (a)(c) | | 14,715 | 213,073 |
| Zai Lab Ltd. (a) | | 60,276 | 153,828 |
| Zhuzhou CRRC Times Electric Co. Ltd. (H Shares) | | 300 | 968 |
| ZTO Express, Inc. sponsored ADR | | 28,690 | 676,223 |
TOTAL CHINA | | | 32,239,447 |
| Greece - 0.6% | | | |
| Alpha Bank SA (a) | | 556,800 | 830,702 |
| Piraeus Financial Holdings SA (a) | | 132,600 | 391,448 |
TOTAL GREECE | | | 1,222,150 |
| Hong Kong - 0.5% | | | |
| ASMPT Ltd. | | 26,748 | 226,544 |
| Gushengtang Holdings Ltd. | | 3,751 | 22,470 |
| Huanxi Media Group Ltd. (a) | | 761,081 | 69,991 |
| Kerry Properties Ltd. | | 38,000 | 63,946 |
| Prudential PLC | | 70,356 | 735,670 |
TOTAL HONG KONG | | | 1,118,621 |
| Hungary - 0.1% | | | |
| Richter Gedeon PLC | | 11,203 | 262,679 |
| India - 10.7% | | | |
| Apollo Hospitals Enterprise Ltd. | | 6,483 | 375,274 |
| Bajaj Auto Ltd. | | 6,946 | 442,960 |
| Bajaj Finance Ltd. | | 12,464 | 1,121,669 |
| Bharat Electronics Ltd. | | 313,600 | 502,267 |
| Bharti Airtel Ltd. | | 99,680 | 1,094,422 |
| Coal India Ltd. | | 123,600 | 466,419 |
| Divi's Laboratories Ltd. | | 4,122 | 167,701 |
| Eicher Motors Ltd. | | 8,011 | 316,965 |
| Embassy Office Parks (REIT) | | 22,400 | 83,798 |
| HDFC Bank Ltd. | | 155,796 | 2,763,707 |
| HDFC Standard Life Insurance Co. Ltd. (b) | | 117,000 | 868,896 |
| Hindustan Aeronautics Ltd. | | 15,800 | 345,676 |
| ICICI Bank Ltd. | | 76,600 | 842,488 |
| Indraprastha Gas Ltd. | | 53,293 | 244,732 |
| Infosys Ltd. | | 18,060 | 296,922 |
| Infosys Ltd. sponsored ADR | | 94,049 | 1,544,285 |
| ITC Ltd. | | 143,113 | 736,461 |
| JK Cement Ltd. | | 17,774 | 673,602 |
| Larsen & Toubro Ltd. | | 25,658 | 902,660 |
| Ltimindtree Ltd. (b) | | 1,500 | 91,234 |
| Mahanagar Gas Ltd. | | 18,225 | 225,907 |
| Mahindra & Mahindra Ltd. | | 8,079 | 141,545 |
| MakeMyTrip Ltd. (a) | | 9,610 | 372,195 |
| Mankind Pharma Ltd. | | 14,252 | 298,496 |
| Maruti Suzuki India Ltd. | | 2,664 | 332,573 |
| NTPC Ltd. | | 168,638 | 477,635 |
| One97 Communications Ltd. (a) | | 39,022 | 431,731 |
| Persistent Systems Ltd. | | 700 | 51,833 |
| Petronet LNG Ltd. | | 59,406 | 142,352 |
| Power Grid Corp. of India Ltd. | | 193,616 | 470,103 |
| Reliance Industries Ltd. | | 73,213 | 2,012,597 |
| Shree Cement Ltd. | | 1,451 | 447,084 |
| Sona Blw Precision Forgings Ltd. (b) | | 32,166 | 209,273 |
| SRF Ltd. | | 12,700 | 334,783 |
| Star Health & Allied Insurance Co. Ltd. (a) | | 72,800 | 507,032 |
| Tata Motors Ltd. | | 16,397 | 123,810 |
| Tata Steel Ltd. | | 457,800 | 653,080 |
| Torrent Pharmaceuticals Ltd. | | 5,310 | 122,706 |
| Zomato Ltd. (a) | | 729,603 | 922,546 |
TOTAL INDIA | | | 22,159,419 |
| Indonesia - 1.5% | | | |
| First Resources Ltd. | | 295,000 | 325,717 |
| PT Bank Central Asia Tbk | | 2,047,800 | 1,128,175 |
| PT Bank Rakyat Indonesia (Persero) Tbk | | 3,665,179 | 1,146,042 |
| PT Sumber Alfaria Trijaya Tbk | | 1,740,500 | 316,765 |
| PT Telkom Indonesia Persero Tbk | | 600,900 | 131,727 |
TOTAL INDONESIA | | | 3,048,426 |
| Korea (South) - 5.8% | | | |
| AMOREPACIFIC Corp. | | 4,690 | 439,579 |
| ASICLAND Co. Ltd. (d) | | 300 | 5,545 |
| Coway Co. Ltd. | | 6,590 | 210,573 |
| Delivery Hero AG (a)(b) | | 4,615 | 117,049 |
| Hyundai Motor Co. Ltd. | | 1,046 | 131,584 |
| Jeisys Medical, Inc. (a) | | 5,739 | 44,735 |
| Kakao Corp. | | 6,654 | 187,271 |
| Kakao Pay Corp. (a) | | 2,641 | 67,229 |
| Kia Corp. | | 14,431 | 823,242 |
| LG Chemical Ltd. | | 523 | 171,155 |
| LG Corp. | | 6,320 | 361,214 |
| LS Electric Co. Ltd. | | 2,370 | 112,575 |
| NAVER Corp. | | 5,578 | 778,666 |
| POSCO | | 1,122 | 342,963 |
| Samsung Biologics Co. Ltd. (a)(b) | | 833 | 437,265 |
| Samsung Electronics Co. Ltd. | | 109,784 | 5,456,385 |
| Samsung SDI Co. Ltd. | | 1,744 | 551,393 |
| SK Hynix, Inc. | | 21,515 | 1,865,639 |
TOTAL KOREA (SOUTH) | | | 12,104,062 |
| Mauritius - 0.0% | | | |
| Jumo World Holding Ltd. (e)(f) | | 30,055 | 44,181 |
| Jumo World Ltd. (a)(f) | | 30 | 0 |
TOTAL MAURITIUS | | | 44,181 |
| Mexico - 1.3% | | | |
| CEMEX S.A.B. de CV sponsored ADR (a) | | 72,000 | 429,840 |
| Corporacion Inmobiliaria Vesta S.A.B. de CV | | 33,555 | 105,212 |
| Fibra Uno Administracion SA de CV | | 63,800 | 96,855 |
| Grupo Aeroportuario del Pacifico S.A.B. de CV Series B | | 9,600 | 111,985 |
| Grupo Aeroportuario Norte S.A.B. de CV | | 18,200 | 138,935 |
| Grupo Financiero Banorte S.A.B. de CV Series O | | 162,521 | 1,318,990 |
| Wal-Mart de Mexico SA de CV Series V | | 157,800 | 564,803 |
TOTAL MEXICO | | | 2,766,620 |
| Netherlands - 0.0% | | | |
| CTP BV (b) | | 5,352 | 77,922 |
| Panama - 0.2% | | | |
| Copa Holdings SA Class A | | 4,631 | 378,121 |
| Peru - 0.3% | | | |
| Credicorp Ltd. (United States) | | 4,279 | 534,704 |
| Philippines - 0.2% | | | |
| Ayala Land, Inc. | | 375,600 | 184,376 |
| SM Investments Corp. | | 15,000 | 211,496 |
| SM Prime Holdings, Inc. | | 127,700 | 67,403 |
TOTAL PHILIPPINES | | | 463,275 |
| Poland - 0.2% | | | |
| CD Projekt RED SA | | 6,636 | 165,425 |
| Dino Polska SA (a)(b) | | 2,600 | 245,985 |
TOTAL POLAND | | | 411,410 |
| Romania - 0.0% | | | |
| Societatea de Producere A Energiei Electrice in Hidrocentrale Hidroelectrica SA | | 2,700 | 67,127 |
| Russia - 1.4% | | | |
| Fix Price Group Ltd. GDR (Reg. S) (a)(f) | | 68,238 | 25,202 |
| Gazprom OAO sponsored ADR (Reg. S) (a)(f) | | 155,600 | 35,545 |
| LSR Group OJSC (f) | | 755 | 760 |
| LUKOIL PJSC sponsored ADR (a)(f) | | 35,200 | 9,958 |
| Novatek PJSC GDR (Reg. S) (a)(f) | | 9,100 | 473,200 |
| Sberbank of Russia (f) | | 30 | 0 |
| Sberbank of Russia sponsored ADR (a)(f) | | 324,104 | 5,769 |
| Severstal PAO GDR (Reg. S) (a)(f) | | 83,700 | 1,976 |
| TCS Group Holding PLC GDR (a)(f) | | 56,395 | 654,182 |
| X5 Retail Group NV GDR (Reg. S) (a)(f) | | 77,500 | 781,200 |
| Yandex NV Series A (a)(f) | | 88,218 | 961,576 |
TOTAL RUSSIA | | | 2,949,368 |
| Saudi Arabia - 1.9% | | | |
| Al Rajhi Bank | | 51,214 | 915,998 |
| Alinma Bank | | 81,400 | 713,845 |
| Bupa Arabia for Cooperative Insurance Co. | | 15,675 | 889,960 |
| Saudi Arabian Oil Co. (b) | | 27,500 | 244,096 |
| The Saudi National Bank | | 130,967 | 1,171,218 |
TOTAL SAUDI ARABIA | | | 3,935,117 |
| Singapore - 0.6% | | | |
| Sea Ltd. ADR (a) | | 27,795 | 1,159,052 |
| South Africa - 1.6% | | | |
| Capitec Bank Holdings Ltd. | | 10,150 | 901,255 |
| Discovery Ltd. | | 86,000 | 593,313 |
| Impala Platinum Holdings Ltd. | | 116,300 | 484,458 |
| Naspers Ltd. Class N | | 3,646 | 569,144 |
| Pick 'n Pay Stores Ltd. | | 132,900 | 178,270 |
| Shoprite Holdings Ltd. | | 38,700 | 495,921 |
TOTAL SOUTH AFRICA | | | 3,222,361 |
| Taiwan - 6.4% | | | |
| Accton Technology Corp. | | 6,729 | 104,181 |
| Alchip Technologies Ltd. | | 8,404 | 688,735 |
| ASE Technology Holding Co. Ltd. | | 17,859 | 62,476 |
| BizLink Holding, Inc. | | 30,027 | 233,808 |
| Chailease Holding Co. Ltd. | | 182,626 | 989,901 |
| Chroma ATE, Inc. | | 25,357 | 171,221 |
| Delta Electronics, Inc. | | 28,873 | 260,000 |
| E Ink Holdings, Inc. | | 4,000 | 20,796 |
| eMemory Technology, Inc. | | 4,808 | 300,996 |
| Formosa Plastics Corp. | | 165,000 | 392,096 |
| Global Unichip Corp. | | 3,000 | 133,976 |
| Hon Hai Precision Industry Co. Ltd. (Foxconn) | | 15,373 | 45,849 |
| King Yuan Electronics Co. Ltd. | | 107,004 | 253,319 |
| Lite-On Technology Corp. | | 25,427 | 79,106 |
| Taiwan Semiconductor Manufacturing Co. Ltd. | | 540,215 | 8,816,259 |
| Taiwan Semiconductor Manufacturing Co. Ltd. sponsored ADR | | 1,438 | 124,114 |
| Uni-President Enterprises Corp. | | 207,000 | 433,941 |
| Unimicron Technology Corp. | | 24,781 | 110,436 |
TOTAL TAIWAN | | | 13,221,210 |
| Tanzania - 0.0% | | | |
| Helios Towers PLC (a) | | 54,000 | 39,742 |
| Thailand - 0.3% | | | |
| Carabao Group PCL (For. Reg.) | | 78,500 | 146,647 |
| Land & House PCL (For. Reg.) | | 316,900 | 66,201 |
| PTT Global Chemical PCL (For. Reg.) | | 469,200 | 448,138 |
| Supalai PCL (For. Reg.) | | 82,500 | 42,028 |
TOTAL THAILAND | | | 703,014 |
| United Arab Emirates - 0.1% | | | |
| Emaar Properties PJSC | | 56,700 | 103,273 |
| United States of America - 0.9% | | | |
| FirstCash Holdings, Inc. | | 9,401 | 1,023,957 |
| Legend Biotech Corp. ADR (a) | | 2,277 | 150,441 |
| Tenaris SA sponsored ADR | | 9,400 | 294,408 |
| Titan Cement International Trading SA | | 25,800 | 488,106 |
TOTAL UNITED STATES OF AMERICA | | | 1,956,912 |
| TOTAL COMMON STOCKS (Cost $111,216,334) | | | 113,739,369 |
| | | | |
| Preferred Stocks - 1.8% |
| | | Shares | Value ($) |
| Convertible Preferred Stocks - 0.2% | | | |
| China - 0.0% | | | |
| dMed Biopharmaceutical Co. Ltd. Series C (a)(e)(f) | | 11,962 | 70,456 |
| India - 0.2% | | | |
| Meesho Series F (a)(e)(f) | | 7,108 | 462,233 |
TOTAL CONVERTIBLE PREFERRED STOCKS | | | 532,689 |
| Nonconvertible Preferred Stocks - 1.6% | | | |
| Brazil - 1.1% | | | |
| Companhia de Transmissao de Energia Eletrica Paulista (PN) | | 35,700 | 150,044 |
| Metalurgica Gerdau SA (PN) | | 290,170 | 594,527 |
| Petroleo Brasileiro SA - Petrobras: | | | |
| (PN) sponsored ADR (non-vtg.) | | 55,106 | 762,116 |
| sponsored ADR | | 46,500 | 697,500 |
| | | | 2,204,187 |
| Korea (South) - 0.4% | | | |
| Hyundai Motor Co. Ltd. Series 2 | | 5,123 | 380,034 |
| Samsung Electronics Co. Ltd. | | 13,795 | 549,945 |
| | | | 929,979 |
| United States of America - 0.1% | | | |
| Gupshup, Inc. (a)(e)(f) | | 8,409 | 105,113 |
TOTAL NONCONVERTIBLE PREFERRED STOCKS | | | 3,239,279 |
| TOTAL PREFERRED STOCKS (Cost $2,871,724) | | | 3,771,968 |
| | | | |
| Corporate Bonds - 16.3% |
| | | Principal Amount (g) | Value ($) |
| Convertible Bonds - 0.2% | | | |
| Brazil - 0.2% | | | |
| Creditas Financial Solutions Ltd. 5% 7/28/27 (e)(f) | | 506,964 | 506,711 |
| Nonconvertible Bonds - 16.1% | | | |
| Azerbaijan - 0.3% | | | |
| Southern Gas Corridor CJSC 6.875% 3/24/26 (b) | | 695,000 | 683,956 |
| Bahrain - 0.5% | | | |
| The Oil and Gas Holding Co. 7.5% 10/25/27 (b) | | 1,085,000 | 1,089,069 |
| Brazil - 0.7% | | | |
| Adecoagro SA 6% 9/21/27 (b) | | 275,000 | 254,174 |
| Aegea Finance SARL 9% 1/20/31 (b) | | 200,000 | 199,500 |
| Azul Secured Finance LLP 11.93% 8/28/28 (b) | | 200,000 | 193,460 |
| Braskem Netherlands BV 7.25% 2/13/33 (b) | | 115,000 | 99,331 |
| Embraer Netherlands Finance BV: | | | |
| 5.4% 2/1/27 | | 90,000 | 86,570 |
| 7% 7/28/30 (b) | | 240,000 | 233,460 |
| MARB BondCo PLC 3.95% 1/29/31 (b) | | 145,000 | 105,488 |
| MC Brazil Downstream Trading SARL 7.25% 6/30/31 (b) | | 372,007 | 264,683 |
| | | | 1,436,666 |
| Burkina Faso - 0.1% | | | |
| Endeavour Mining PLC 5% 10/14/26 (b) | | 285,000 | 249,691 |
| Cambodia - 0.1% | | | |
| NagaCorp Ltd. 7.95% 7/6/24 (Reg. S) | | 200,000 | 195,304 |
| Chile - 0.8% | | | |
| Antofagasta PLC 2.375% 10/14/30 (b) | | 450,000 | 339,075 |
| Corporacion Nacional del Cobre de Chile (Codelco): | | | |
| 3.7% 1/30/50 (b) | | 300,000 | 176,100 |
| 4.5% 8/1/47 (b) | | 250,000 | 171,750 |
| 5.125% 2/2/33 (b) | | 200,000 | 176,056 |
| 5.95% 1/8/34 (b) | | 200,000 | 185,800 |
| Sable International Finance Ltd. 5.75% 9/7/27 (b) | | 600,000 | 537,084 |
| VTR Comunicaciones SpA 5.125% 1/15/28 (b) | | 400,000 | 175,000 |
| | | | 1,760,865 |
| China - 0.8% | | | |
| Ant International Co. Ltd. 3.55% 8/14/24 (e)(f) | | 585,256 | 582,330 |
| ENN Clean Energy International Investment Ltd. 3.375% 5/12/26 (b) | | 395,000 | 359,983 |
| Meituan 2.125% 10/28/25 (b) | | 365,000 | 336,139 |
| Prosus NV: | | | |
| 3.832% 2/8/51 (b) | | 425,000 | 221,000 |
| 4.193% 1/19/32 (b) | | 245,000 | 188,466 |
| | | | 1,687,918 |
| Colombia - 0.8% | | | |
| EnfraGen Energia Sur SA 5.375% 12/30/30 (b) | | 690,000 | 456,690 |
| Gcm Mining Corp. 6.875% 8/9/26 (b) | | 400,000 | 328,000 |
| GeoPark Ltd. 5.5% 1/17/27 (b) | | 500,000 | 418,625 |
| Termocandelaria Power Ltd. 7.875% 1/30/29 (b) | | 414,625 | 388,732 |
| | | | 1,592,047 |
| Egypt - 0.1% | | | |
| Energean PLC 6.5% 4/30/27 (b) | | 160,000 | 133,100 |
| Ghana - 0.6% | | | |
| Kosmos Energy Ltd. 7.125% 4/4/26 (b) | | 700,000 | 643,503 |
| Tullow Oil PLC: | | | |
| 7% 3/1/25 (b) | | 450,000 | 350,438 |
| 10.25% 5/15/26 (b) | | 411,000 | 352,176 |
| | | | 1,346,117 |
| Guatemala - 0.4% | | | |
| CT Trust 5.125% 2/3/32 (b) | | 440,000 | 336,600 |
| Investment Energy Resources Ltd. 6.25% 4/26/29 (b) | | 510,000 | 443,700 |
| | | | 780,300 |
| Hungary - 0.1% | | | |
| Magyar Export-Import Bank 6.125% 12/4/27 (b) | | 200,000 | 195,480 |
| India - 0.2% | | | |
| CA Magnum Holdings 5.375% 10/31/26 (b) | | 400,000 | 348,344 |
| Indonesia - 1.2% | | | |
| Medco Bell Pte Ltd. 6.375% 1/30/27 (b) | | 560,000 | 524,306 |
| PT Adaro Indonesia 4.25% 10/31/24 (b) | | 250,000 | 240,238 |
| PT Freeport Indonesia: | | | |
| 5.315% 4/14/32 (b) | | 250,000 | 222,065 |
| 6.2% 4/14/52 (b) | | 200,000 | 164,040 |
| PT Hutama Karya Persero 3.75% 5/11/30 (b) | | 300,000 | 259,860 |
| PT Indonesia Asahan Aluminium 5.45% 5/15/30 (b) | | 690,000 | 637,705 |
| PT Pertamina Persero: | | | |
| 4.15% 2/25/60 (b) | | 365,000 | 229,078 |
| 4.175% 1/21/50 (b) | | 450,000 | 299,358 |
| | | | 2,576,650 |
| Israel - 0.1% | | | |
| Energean Israel Finance Ltd. 8.5% 9/30/33 (Reg. S) (b) | | 250,000 | 217,813 |
| Kazakhstan - 0.3% | | | |
| KazMunaiGaz National Co. 3.5% 4/14/33 (b) | | 400,000 | 291,000 |
| Tengizchevroil Finance Co. International Ltd. 3.25% 8/15/30 (b) | | 350,000 | 260,225 |
| | | | 551,225 |
| Malaysia - 0.6% | | | |
| MISC Capital Two (Labuan) Ltd. 3.75% 4/6/27 (b) | | 380,000 | 349,361 |
| Petronas Capital Ltd.: | | | |
| 3.404% 4/28/61 (b) | | 500,000 | 289,205 |
| 3.5% 4/21/30 (b) | | 450,000 | 391,127 |
| 4.55% 4/21/50 (b) | | 400,000 | 306,824 |
| | | | 1,336,517 |
| Mauritius - 0.1% | | | |
| AXIAN Telecom 7.375% 2/16/27 (b) | | 355,000 | 314,574 |
| Mexico - 2.0% | | | |
| Bimbo Bakeries U.S.A., Inc. 6.4% 1/15/34 (b)(f) | | 200,000 | 200,020 |
| Braskem Idesa SAPI: | | | |
| 6.99% 2/20/32 (b) | | 160,000 | 93,352 |
| 7.45% 11/15/29 (b) | | 135,000 | 85,482 |
| Comision Federal de Electricidad 3.348% 2/9/31 (b) | | 450,000 | 340,875 |
| Petroleos Mexicanos: | | | |
| 5.35% 2/12/28 | | 320,000 | 257,072 |
| 6.49% 1/23/27 | | 315,000 | 278,189 |
| 6.5% 6/2/41 | | 820,000 | 479,987 |
| 6.625% 6/15/35 | | 410,000 | 269,575 |
| 6.7% 2/16/32 | | 415,000 | 302,950 |
| 6.75% 9/21/47 | | 960,000 | 543,360 |
| 6.84% 1/23/30 | | 380,000 | 295,070 |
| 6.95% 1/28/60 | | 1,075,000 | 608,719 |
| 7.69% 1/23/50 | | 589,000 | 363,708 |
| | | | 4,118,359 |
| Morocco - 0.2% | | | |
| OCP SA: | | | |
| 3.75% 6/23/31 (b) | | 395,000 | 309,257 |
| 5.125% 6/23/51 (b) | | 200,000 | 128,000 |
| | | | 437,257 |
| Nigeria - 0.1% | | | |
| IHS Netherlands Holdco BV 8% 9/18/27 (b) | | 315,000 | 256,961 |
| Panama - 0.3% | | | |
| Aeropuerto Internacional de Tocumen SA 5.125% 8/11/61 (b) | | 200,000 | 133,556 |
| Cable Onda SA 4.5% 1/30/30 (b) | | 580,000 | 453,125 |
| | | | 586,681 |
| Paraguay - 0.1% | | | |
| Telefonica Celular del Paraguay SA 5.875% 4/15/27 (b) | | 250,000 | 225,375 |
| Peru - 0.2% | | | |
| Camposol SA 6% 2/3/27 (b) | | 500,000 | 293,135 |
| Compania de Minas Buenaventura SAA 5.5% 7/23/26 (b) | | 165,000 | 143,750 |
| | | | 436,885 |
| Qatar - 0.7% | | | |
| Qatar Petroleum: | | | |
| 2.25% 7/12/31 (b) | | 755,000 | 589,372 |
| 3.125% 7/12/41 (b) | | 650,000 | 426,563 |
| 3.3% 7/12/51 (b) | | 580,000 | 353,256 |
| | | | 1,369,191 |
| Saudi Arabia - 1.3% | | | |
| EIG Pearl Holdings SARL 3.545% 8/31/36 (b) | | 720,000 | 559,800 |
| Greensaif Pipelines Bidco SARL: | | | |
| 6.129% 2/23/38 (b) | | 200,000 | 186,000 |
| 6.51% 2/23/42 (b) | | 200,000 | 185,750 |
| Saudi Arabian Oil Co.: | | | |
| 3.25% 11/24/50 (b) | | 260,000 | 153,725 |
| 4.25% 4/16/39 (b) | | 1,680,000 | 1,312,500 |
| 4.375% 4/16/49 (b) | | 275,000 | 201,094 |
| | | | 2,598,869 |
| South Africa - 1.0% | | | |
| Eskom Holdings SOC Ltd.: | | | |
| 6.35% 8/10/28 (b) | | 315,000 | 285,075 |
| 7.125% 2/11/25 (b) | | 860,000 | 842,800 |
| 8.45% 8/10/28 (b) | | 235,000 | 222,016 |
| Liquid Telecommunications Financing PLC 5.5% 9/4/26 (b) | | 470,000 | 285,426 |
| Stillwater Mining Co.: | | | |
| 4% 11/16/26 (b) | | 235,000 | 202,100 |
| 4.5% 11/16/29 (b) | | 220,000 | 166,650 |
| | | | 2,004,067 |
| Tanzania - 0.1% | | | |
| HTA Group Ltd. 7% 12/18/25 (b) | | 190,000 | 183,002 |
| Thailand - 0.1% | | | |
| PTT Treasury Center Co. Ltd. 3.7% 7/16/70 (b) | | 350,000 | 201,516 |
| Ukraine - 0.1% | | | |
| NAK Naftogaz Ukraine 7.65% (Reg. S) (h) | | 380,000 | 252,700 |
| United Arab Emirates - 1.0% | | | |
| Abu Dhabi National Energy Co. PJSC: | | | |
| 4% 10/3/49 (b) | | 390,000 | 280,800 |
| 4.696% 4/24/33 (b) | | 165,000 | 151,388 |
| 4.875% 4/23/30 (b) | | 50,000 | 47,854 |
| Galaxy Pipeline Assets BidCo Ltd.: | | | |
| 2.16% 3/31/34 (b) | | 382,248 | 308,187 |
| 2.625% 3/31/36 (b) | | 570,000 | 426,075 |
| GEMS MENASA Cayman Ltd. 7.125% 7/31/26 (b) | | 250,000 | 239,375 |
| MDGH GMTN RSC Ltd.: | | | |
| 4.375% 11/22/33 (b) | | 200,000 | 177,000 |
| 5.084% 5/22/53 (b) | | 265,000 | 219,619 |
| 5.5% 4/28/33 (b) | | 200,000 | 193,500 |
| | | | 2,043,798 |
| Uzbekistan - 0.1% | | | |
| Uzbekneftegaz JSC 4.75% 11/16/28 (b) | | 180,000 | 141,300 |
| Venezuela - 0.8% | | | |
| Petroleos de Venezuela SA: | | | |
| 6% (b)(h) | | 5,700,000 | 723,900 |
| 6% (Reg. S) (h) | | 6,800,000 | 846,600 |
| | | | 1,570,500 |
| Vietnam - 0.2% | | | |
| Mong Duong Finance Holdings BV 5.125% 5/7/29 (b) | | 440,000 | 396,229 |
TOTAL NONCONVERTIBLE BONDS | | | 33,318,326 |
| TOTAL CORPORATE BONDS (Cost $42,304,825) | | | 33,825,037 |
| | | | |
| Government Obligations - 24.0% |
| | | Principal Amount (g) | Value ($) |
| Angola - 0.7% | �� | | |
| Angola Republic: | | | |
| 8.25% 5/9/28 (b) | | 720,000 | 611,100 |
| 8.75% 4/14/32 (b) | | 200,000 | 156,500 |
| 9.125% 11/26/49 (b) | | 225,000 | 158,063 |
| 9.375% 5/8/48 (b) | | 290,000 | 206,625 |
| 9.5% 11/12/25 (b) | | 365,000 | 350,058 |
TOTAL ANGOLA | | | 1,482,346 |
| Argentina - 0.7% | | | |
| Argentine Republic: | | | |
| 0.75% 7/9/30 (i) | | 1,400,365 | 389,301 |
| 1% 7/9/29 | | 498,666 | 133,393 |
| 3.625% 7/9/35 (i) | | 1,537,734 | 378,283 |
| 4.25% 1/9/38 (i) | | 1,186,834 | 357,237 |
| Buenos Aires Province 6.375% 9/1/37 (b)(i) | | 380,000 | 121,801 |
TOTAL ARGENTINA | | | 1,380,015 |
| Armenia - 0.1% | | | |
| Republic of Armenia 3.6% 2/2/31 (b) | | 300,000 | 220,500 |
| Barbados - 0.1% | | | |
| Barbados Government 6.5% 10/1/29 (b) | | 290,000 | 269,471 |
| Benin - 0.0% | | | |
| Republic of Benin 4.875% 1/19/32 (b) | EUR | 140,000 | 110,532 |
| Brazil - 0.6% | | | |
| Brazilian Federative Republic: | | | |
| 3.875% 6/12/30 | | 775,000 | 665,113 |
| 4.75% 1/14/50 | | 505,000 | 337,088 |
| 6% 10/20/33 | | 295,000 | 272,875 |
TOTAL BRAZIL | | | 1,275,076 |
| Chile - 0.6% | | | |
| Chilean Republic: | | | |
| 2.45% 1/31/31 | | 535,000 | 429,605 |
| 3.1% 1/22/61 | | 340,000 | 181,730 |
| 3.5% 1/31/34 | | 280,000 | 224,280 |
| 4% 1/31/52 | | 200,000 | 137,500 |
| 4.34% 3/7/42 | | 200,000 | 154,500 |
| 5.33% 1/5/54 | | 230,000 | 194,350 |
TOTAL CHILE | | | 1,321,965 |
| Colombia - 1.1% | | | |
| Colombian Republic: | | | |
| 3% 1/30/30 | | 715,000 | 549,120 |
| 3.125% 4/15/31 | | 548,000 | 403,602 |
| 5% 6/15/45 | | 515,000 | 327,025 |
| 5.2% 5/15/49 | | 185,000 | 117,753 |
| 6.125% 1/18/41 | | 200,000 | 152,000 |
| 7.375% 9/18/37 | | 425,000 | 381,438 |
| 7.5% 2/2/34 | | 200,000 | 186,500 |
| 8% 4/20/33 | | 160,000 | 155,760 |
TOTAL COLOMBIA | | | 2,273,198 |
| Costa Rica - 0.5% | | | |
| Costa Rican Republic: | | | |
| 5.625% 4/30/43 (b) | | 425,000 | 337,875 |
| 6.125% 2/19/31 (b) | | 315,000 | 299,250 |
| 6.55% 4/3/34 (b) | | 245,000 | 232,873 |
| 7% 4/4/44 (b) | | 105,000 | 96,128 |
TOTAL COSTA RICA | | | 966,126 |
| Dominican Republic - 1.5% | | | |
| Dominican Republic: | | | |
| 4.5% 1/30/30 (b) | | 515,000 | 435,433 |
| 4.875% 9/23/32 (b) | | 870,000 | 703,395 |
| 5.3% 1/21/41 (b) | | 200,000 | 145,200 |
| 5.875% 1/30/60 (b) | | 900,000 | 638,100 |
| 6% 7/19/28 (b) | | 250,000 | 236,250 |
| 6% 2/22/33 (b) | | 425,000 | 373,788 |
| 6.5% 2/15/48 (b) | | 200,000 | 158,800 |
| 6.85% 1/27/45 (b) | | 350,000 | 291,375 |
| 7.05% 2/3/31 (b) | | 150,000 | 143,700 |
TOTAL DOMINICAN REPUBLIC | | | 3,126,041 |
| Ecuador - 0.5% | | | |
| Ecuador Republic: | | | |
| 2.5% 7/31/40 (b)(i) | | 250,000 | 83,625 |
| 3.5% 7/31/35 (b)(i) | | 1,280,256 | 485,217 |
| 6% 7/31/30 (b)(i) | | 925,630 | 468,832 |
TOTAL ECUADOR | | | 1,037,674 |
| Egypt - 0.8% | | | |
| Arab Republic of Egypt: | | | |
| 7.0529% 1/15/32 (b) | | 665,000 | 375,725 |
| 7.5% 2/16/61 (b) | | 395,000 | 194,538 |
| 7.903% 2/21/48 (b) | | 865,000 | 437,906 |
| 8.5% 1/31/47 (b) | | 1,160,000 | 601,518 |
TOTAL EGYPT | | | 1,609,687 |
| El Salvador - 0.2% | | | |
| El Salvador Republic 7.1246% 1/20/50 (b) | | 560,000 | 348,320 |
| Gabon - 0.2% | | | |
| Gabonese Republic: | | | |
| 6.95% 6/16/25 (b) | | 200,000 | 173,500 |
| 7% 11/24/31 (b) | | 390,000 | 273,975 |
TOTAL GABON | | | 447,475 |
| Ghana - 0.4% | | | |
| Ghana Republic: | | | |
| 8.125% (b)(h) | | 500,000 | 219,375 |
| 8.627% (b)(h) | | 615,000 | 256,763 |
| 10.75% 10/14/30 (b) | | 475,000 | 295,688 |
TOTAL GHANA | | | 771,826 |
| Guatemala - 0.2% | | | |
| Guatemalan Republic: | | | |
| 6.125% 6/1/50 (b) | | 350,000 | 278,250 |
| 6.6% 6/13/36 (b) | | 200,000 | 184,800 |
TOTAL GUATEMALA | | | 463,050 |
| Hungary - 0.4% | | | |
| Hungarian Republic: | | | |
| 2.125% 9/22/31 (b) | | 300,000 | 215,819 |
| 3.125% 9/21/51 (b) | | 560,000 | 295,714 |
| 5.5% 6/16/34 (b) | | 95,000 | 84,540 |
| 6.25% 9/22/32 (b) | | 200,000 | 192,122 |
TOTAL HUNGARY | | | 788,195 |
| Indonesia - 0.6% | | | |
| Indonesian Republic: | | | |
| 3.35% 3/12/71 | | 470,000 | 269,254 |
| 3.5% 2/14/50 | | 380,000 | 246,723 |
| 4.2% 10/15/50 | | 600,000 | 439,350 |
| 8.5% 10/12/35 (b) | | 300,000 | 357,900 |
TOTAL INDONESIA | | | 1,313,227 |
| Ivory Coast - 0.4% | | | |
| Ivory Coast: | | | |
| 5.875% 10/17/31 (b) | EUR | 255,000 | 217,539 |
| 6.375% 3/3/28 (b) | | 635,000 | 588,963 |
TOTAL IVORY COAST | | | 806,502 |
| Jordan - 0.2% | | | |
| Jordanian Kingdom: | | | |
| 5.85% 7/7/30 (b) | | 200,000 | 168,750 |
| 7.375% 10/10/47 (b) | | 280,000 | 211,050 |
TOTAL JORDAN | | | 379,800 |
| Kenya - 0.4% | | | |
| Republic of Kenya: | | | |
| 6.3% 1/23/34 (b) | | 480,000 | 328,800 |
| 6.875% 6/24/24 (b) | | 275,000 | 263,656 |
| 7% 5/22/27 (b) | | 315,000 | 274,050 |
TOTAL KENYA | | | 866,506 |
| Lebanon - 0.2% | | | |
| Lebanese Republic 6.375% (h) | | 7,090,000 | 426,534 |
| Mexico - 0.9% | | | |
| United Mexican States: | | | |
| 2.659% 5/24/31 | | 400,000 | 311,400 |
| 3.25% 4/16/30 | | 400,000 | 336,800 |
| 4.35% 1/15/47 | | 850,000 | 573,325 |
| 4.75% 3/8/44 | | 450,000 | 331,776 |
| 6.338% 5/4/53 | | 200,000 | 173,300 |
| 6.35% 2/9/35 | | 220,000 | 209,660 |
TOTAL MEXICO | | | 1,936,261 |
| Nigeria - 1.0% | | | |
| Republic of Nigeria: | | | |
| 6.125% 9/28/28 (b) | | 325,000 | 264,063 |
| 6.5% 11/28/27 (b) | | 705,000 | 606,300 |
| 7.143% 2/23/30 (b) | | 850,000 | 681,063 |
| 7.625% 11/28/47 (b) | | 300,000 | 201,750 |
| 8.25% 9/28/51 (b) | | 200,000 | 139,750 |
| 8.375% 3/24/29 (b) | | 190,000 | 166,013 |
TOTAL NIGERIA | | | 2,058,939 |
| Oman - 1.2% | | | |
| Sultanate of Oman: | | | |
| 5.625% 1/17/28 (b) | | 420,000 | 404,779 |
| 6% 8/1/29 (b) | | 285,000 | 276,450 |
| 6.25% 1/25/31 (b) | | 575,000 | 558,469 |
| 6.5% 3/8/47 (b) | | 1,275,000 | 1,106,063 |
| 7% 1/25/51 (b) | | 115,000 | 105,513 |
TOTAL OMAN | | | 2,451,274 |
| Pakistan - 0.3% | | | |
| Islamic Republic of Pakistan: | | | |
| 6% 4/8/26 (b) | | 695,000 | 377,107 |
| 6.875% 12/5/27 (b) | | 560,000 | 292,432 |
TOTAL PAKISTAN | | | 669,539 |
| Panama - 0.8% | | | |
| Panamanian Republic: | | | |
| 2.252% 9/29/32 | | 485,000 | 327,860 |
| 3.16% 1/23/30 | | 385,000 | 308,770 |
| 3.298% 1/19/33 | | 190,000 | 139,460 |
| 3.87% 7/23/60 | | 510,000 | 266,220 |
| 4.5% 5/15/47 | | 405,000 | 260,213 |
| 6.4% 2/14/35 | | 250,000 | 227,250 |
| 6.853% 3/28/54 | | 200,000 | 170,600 |
TOTAL PANAMA | | | 1,700,373 |
| Paraguay - 0.3% | | | |
| Republic of Paraguay: | | | |
| 2.739% 1/29/33 (b) | | 415,000 | 308,138 |
| 5.4% 3/30/50 (b) | | 415,000 | 310,213 |
| 5.6% 3/13/48 (b) | | 65,000 | 49,920 |
TOTAL PARAGUAY | | | 668,271 |
| Peru - 0.5% | | | |
| Peruvian Republic: | | | |
| 2.783% 1/23/31 | | 435,000 | 348,435 |
| 3% 1/15/34 | | 260,000 | 196,170 |
| 3.3% 3/11/41 | | 635,000 | 419,418 |
TOTAL PERU | | | 964,023 |
| Philippines - 0.4% | | | |
| Philippine Republic: | | | |
| 2.65% 12/10/45 | | 430,000 | 248,983 |
| 2.95% 5/5/45 | | 320,000 | 196,058 |
| 5.5% 1/17/48 | | 200,000 | 179,202 |
| 5.95% 10/13/47 | | 225,000 | 214,040 |
TOTAL PHILIPPINES | | | 838,283 |
| Poland - 0.3% | | | |
| Bank Gospodarstwa Krajowego: | | | |
| 5.375% 5/22/33 (b) | | 200,000 | 186,000 |
| 6.25% 10/31/28 (b) | | 200,000 | 202,250 |
| Polish Government 5.5% 4/4/53 | | 170,000 | 149,340 |
TOTAL POLAND | | | 537,590 |
| Qatar - 1.0% | | | |
| State of Qatar: | | | |
| 4.4% 4/16/50 (b) | | 1,125,000 | 866,953 |
| 4.625% 6/2/46 (b) | | 600,000 | 488,438 |
| 4.817% 3/14/49 (b) | | 855,000 | 698,695 |
TOTAL QATAR | | | 2,054,086 |
| Romania - 0.5% | | | |
| Romanian Republic: | | | |
| 3% 2/27/27 (b) | | 334,000 | 302,143 |
| 3.624% 5/26/30 (b) | EUR | 135,000 | 122,930 |
| 3.625% 3/27/32 (b) | | 334,000 | 263,700 |
| 6.125% 1/22/44 (b) | | 400,000 | 344,120 |
TOTAL ROMANIA | | | 1,032,893 |
| Rwanda - 0.2% | | | |
| Rwanda Republic 5.5% 8/9/31 (b) | | 470,000 | 354,850 |
| Saudi Arabia - 0.3% | | | |
| Kingdom of Saudi Arabia: | | | |
| 2.25% 2/2/33 (b) | | 445,000 | 334,306 |
| 3.45% 2/2/61 (b) | | 570,000 | 330,600 |
TOTAL SAUDI ARABIA | | | 664,906 |
| Senegal - 0.2% | | | |
| Republic of Senegal: | | | |
| 6.25% 5/23/33 (b) | | 235,000 | 185,944 |
| 6.75% 3/13/48 (b) | | 200,000 | 132,500 |
TOTAL SENEGAL | | | 318,444 |
| Serbia - 0.3% | | | |
| Republic of Serbia: | | | |
| 2.125% 12/1/30 (b) | | 620,000 | 453,728 |
| 6.25% 5/26/28 (b) | | 105,000 | 101,844 |
TOTAL SERBIA | | | 555,572 |
| South Africa - 0.6% | | | |
| South African Republic: | | | |
| 4.85% 9/27/27 | | 400,000 | 368,500 |
| 5% 10/12/46 | | 155,000 | 93,775 |
| 5.65% 9/27/47 | | 325,000 | 211,250 |
| 5.75% 9/30/49 | | 795,000 | 516,750 |
TOTAL SOUTH AFRICA | | | 1,190,275 |
| Sri Lanka - 0.4% | | | |
| Democratic Socialist Republic of Sri Lanka: | | | |
| 6.2% (b)(h) | | 735,000 | 363,891 |
| 6.85% (b)(h) | | 695,000 | 355,903 |
| 7.55% (b)(h) | | 150,000 | 74,465 |
| 7.85% (b)(h) | | 210,000 | 103,895 |
TOTAL SRI LANKA | | | 898,154 |
| Turkey - 1.3% | | | |
| Export Credit Bank of Turkey 9% 1/28/27 (b) | | 200,000 | 200,500 |
| Turkish Republic: | | | |
| 4.875% 10/9/26 | | 520,000 | 478,400 |
| 4.875% 4/16/43 | | 1,055,000 | 639,594 |
| 5.125% 2/17/28 | | 245,000 | 216,825 |
| 5.75% 5/11/47 | | 405,000 | 263,756 |
| 6.125% 10/24/28 | | 220,000 | 199,375 |
| 6.625% 2/17/45 | | 15,000 | 11,063 |
| 9.125% 7/13/30 | | 220,000 | 219,450 |
| 9.375% 3/14/29 | | 495,000 | 503,663 |
TOTAL TURKEY | | | 2,732,626 |
| Ukraine - 0.7% | | | |
| Ukraine Government: | | | |
| 6.876% 5/21/31 (b) | | 200,000 | 49,300 |
| 7.253% 3/15/35 (b) | | 380,000 | 95,570 |
| 7.375% 9/25/34 (b) | | 200,000 | 50,300 |
| 7.75% 9/1/25 (b) | | 830,000 | 253,150 |
| 7.75% 9/1/26 (b) | | 830,000 | 236,434 |
| 7.75% 9/1/27 (b) | | 345,000 | 97,980 |
| 7.75% 9/1/28 (b) | | 560,000 | 156,800 |
| 7.75% 9/1/29 (b) | | 400,000 | 111,200 |
| 7.75% 8/1/41 (b)(j) | | 775,000 | 319,416 |
TOTAL UKRAINE | | | 1,370,150 |
| United Arab Emirates - 0.4% | | | |
| Emirate of Abu Dhabi 3.125% 9/30/49 (b) | | 410,000 | 250,869 |
| Emirate of Dubai: | | | |
| 3.9% 9/9/50 (Reg. S) | | 650,000 | 416,000 |
| 5.25% 1/30/43 (Reg. S) | | 295,000 | 250,013 |
TOTAL UNITED ARAB EMIRATES | | | 916,882 |
| United States of America - 0.8% | | | |
| U.S. Treasury Bills, yield at date of purchase 5.42% 1/11/24 (k) | | 40,000 | 39,582 |
| U.S. Treasury Bonds: | | | |
| 2.875% 5/15/52 | | 1,533,000 | 1,022,978 |
| 3.625% 2/15/53 | | 399,000 | 310,908 |
| U.S. Treasury Notes: | | | |
| 3.625% 3/31/30 | | 147,000 | 136,515 |
| 4% 2/28/30 | | 252,000 | 239,341 |
TOTAL UNITED STATES OF AMERICA | | | 1,749,324 |
| Uruguay - 0.3% | | | |
| Uruguay Republic 5.1% 6/18/50 | | 730,000 | 629,260 |
| Uzbekistan - 0.2% | | | |
| Republic of Uzbekistan: | | | |
| 3.7% 11/25/30 (b) | | 200,000 | 152,400 |
| 3.9% 10/19/31 (b) | | 240,000 | 180,120 |
TOTAL UZBEKISTAN | | | 332,520 |
| Venezuela - 0.6% | | | |
| Venezuelan Republic 9.25% (h) | | 6,200,000 | 1,148,240 |
| Zambia - 0.1% | | | |
| Republic of Zambia: | | | |
| 8.5% (b)(h) | | 50,000 | 30,516 |
| 8.97% (b)(h) | | 370,000 | 224,428 |
TOTAL ZAMBIA | | | 254,944 |
| TOTAL GOVERNMENT OBLIGATIONS (Cost $67,424,317) | | | 49,711,745 |
| | | | |
| Preferred Securities - 1.0% |
| | | Principal Amount (g) | Value ($) |
| Georgia - 0.3% | | | |
| Georgia Bank Joint Stock Co. 11.125% (Reg. S) (j)(l) | | 700,000 | 719,228 |
| Mexico - 0.4% | | | |
| Banco Mercantil del Norte SA: | | | |
| 6.75% (b)(j)(l) | | 370,000 | 360,861 |
| 7.625% (b)(j)(l) | | 125,000 | 113,330 |
| CEMEX S.A.B. de CV 5.125% (b)(j)(l) | | 400,000 | 371,185 |
TOTAL MEXICO | | | 845,376 |
| United Arab Emirates - 0.3% | | | |
| DP World Salaam 6% (Reg. S) (j)(l) | | 600,000 | 597,592 |
| TOTAL PREFERRED SECURITIES (Cost $2,358,078) | | | 2,162,196 |
| | | | |
| Money Market Funds - 1.4% |
| | | Shares | Value ($) |
| Fidelity Cash Central Fund 5.40% (m) | | 2,631,726 | 2,632,253 |
| Fidelity Securities Lending Cash Central Fund 5.40% (m)(n) | | 255,408 | 255,433 |
| TOTAL MONEY MARKET FUNDS (Cost $2,887,389) | | | 2,887,686 |
| | | | |
| TOTAL INVESTMENT IN SECURITIES - 99.4% (Cost $229,062,667) | 206,098,001 |
NET OTHER ASSETS (LIABILITIES) - 0.6% | 1,148,143 |
| NET ASSETS - 100.0% | 207,246,144 |
| | |
| Futures Contracts |
| | Number of contracts | Expiration Date | Notional Amount ($) | Value ($) | Unrealized Appreciation/ (Depreciation) ($) |
| Purchased | | | | | |
| | | | | | |
| Equity Index Contracts | | | | | |
| ICE MSCI Emerging Markets Index Contracts (United States) | 7 | Dec 2023 | 321,720 | 1,153 | 1,153 |
| | | | | | |
| The notional amount of futures purchased as a percentage of Net Assets is 0.2% |
Currency Abbreviations
| EUR | - | European Monetary Unit |
Legend
| (b) | Security exempt from registration under Rule 144A of the Securities Act of 1933. These securities may be resold in transactions exempt from registration, normally to qualified institutional buyers. At the end of the period, the value of these securities amounted to $63,156,787 or 30.5% of net assets. |
| (c) | Security or a portion of the security is on loan at period end. |
| (d) | Security or a portion of the security purchased on a delayed delivery or when-issued basis. |
| (e) | Restricted securities (including private placements) - Investment in securities not registered under the Securities Act of 1933 (excluding 144A issues). At the end of the period, the value of restricted securities (excluding 144A issues) amounted to $1,771,024 or 0.9% of net assets. |
| (g) | Amount is stated in United States dollars unless otherwise noted. |
| (h) | Non-income producing - Security is in default. |
| (i) | Security initially issued at one coupon which converts to a higher coupon at a specified date. The rate shown is the rate at period end. |
| (j) | Coupon rates for floating and adjustable rate securities reflect the rates in effect at period end. |
| (k) | Security or a portion of the security was pledged to cover margin requirements for futures contracts. At period end, the value of securities pledged amounted to $34,634. |
| (l) | Security is perpetual in nature with no stated maturity date. |
| (m) | Affiliated fund that is generally available only to investment companies and other accounts managed by Fidelity Investments. The rate quoted is the annualized seven-day yield of the fund at period end. A complete unaudited listing of the fund's holdings as of its most recent quarter end is available upon request. In addition, each Fidelity Central Fund's financial statements, which are not covered by the Fund's Report of Independent Registered Public Accounting Firm, are available on the SEC's website or upon request. |
| (n) | Investment made with cash collateral received from securities on loan. |
| Additional information on each restricted holding is as follows: |
| Security | Acquisition Date | Acquisition Cost ($) |
| Ant International Co. Ltd. 3.55% 8/14/24 | 8/14/23 | 585,256 |
| | | |
| Creditas Financial Solutions Ltd. 5% 7/28/27 | 1/28/22 - 7/28/23 | 506,964 |
| | | |
| dMed Biopharmaceutical Co. Ltd. Series C | 12/01/20 | 169,898 |
| | | |
| Gupshup, Inc. | 6/08/21 | 192,273 |
| | | |
| Jumo World Holding Ltd. | 9/06/23 | 30,055 |
| | | |
| Meesho Series F | 9/21/21 | 544,986 |
| | | |
Affiliated Central Funds
Fiscal year to date information regarding the Fund's investments in Fidelity Central Funds, including the ownership percentage, is presented below.
| Affiliate | Value, beginning of period ($) | Purchases ($) | Sales Proceeds ($) | Dividend Income ($) | Realized Gain (loss) ($) | Change in Unrealized appreciation (depreciation) ($) | Value, end of period ($) | % ownership, end of period |
| Fidelity Cash Central Fund 5.40% | 8,147,400 | 118,099,822 | 123,614,969 | 281,146 | - | - | 2,632,253 | 0.0% |
| Fidelity Securities Lending Cash Central Fund 5.40% | 421,999 | 7,480,353 | 7,646,919 | 3,815 | - | - | 255,433 | 0.0% |
| Total | 8,569,399 | 125,580,175 | 131,261,888 | 284,961 | - | - | 2,887,686 | |
| | | | | | | | | |
Amounts in the dividend income column in the above table include any capital gain distributions from underlying funds, which are presented in the corresponding line item in the Statement of Operations, if applicable.
Amounts in the dividend income column for Fidelity Securities Lending Cash Central Fund represents the income earned on investing cash collateral, less rebates paid to borrowers and any lending agent fees associated with the loan, plus any premium payments received for lending certain types of securities.
Amounts included in the purchases and sales proceeds columns may include in-kind transactions, if applicable.
Investment Valuation
The following is a summary of the inputs used, as of October 31, 2023, involving the Fund's assets and liabilities carried at fair value. The inputs or methodology used for valuing securities may not be an indication of the risk associated with investing in those securities. For more information on valuation inputs, and their aggregation into the levels used below, please refer to the Investment Valuation section in the accompanying Notes to Financial Statements.
| Valuation Inputs at Reporting Date: |
| Description | Total ($) | Level 1 ($) | Level 2 ($) | Level 3 ($) |
Investments in Securities: | | | | |
|
| Equities: | | | | |
Communication Services | 10,571,532 | 2,122,504 | 7,487,452 | 961,576 |
Consumer Discretionary | 18,205,861 | 6,435,909 | 11,307,719 | 462,233 |
Consumer Staples | 7,694,525 | 2,170,223 | 4,717,900 | 806,402 |
Energy | 5,690,544 | 1,998,120 | 3,173,721 | 518,703 |
Financials | 26,899,228 | 11,849,761 | 14,345,335 | 704,132 |
Health Care | 4,645,630 | 1,044,370 | 3,530,804 | 70,456 |
Industrials | 6,339,213 | 2,393,086 | 3,946,127 | - |
Information Technology | 23,023,657 | 1,694,190 | 21,224,354 | 105,113 |
Materials | 9,305,532 | 4,936,395 | 4,367,161 | 1,976 |
Real Estate | 1,814,839 | 665,017 | 1,149,062 | 760 |
Utilities | 3,320,776 | 953,972 | 2,366,804 | - |
|
| Corporate Bonds | 33,825,037 | - | 32,535,976 | 1,289,061 |
|
| Government Obligations | 49,711,745 | - | 49,711,745 | - |
|
| Preferred Securities | 2,162,196 | - | 2,162,196 | - |
|
| Money Market Funds | 2,887,686 | 2,887,686 | - | - |
| Total Investments in Securities: | 206,098,001 | 39,151,233 | 162,026,356 | 4,920,412 |
Derivative Instruments: Assets | | | | |
Futures Contracts | 1,153 | 1,153 | - | - |
| Total Assets | 1,153 | 1,153 | - | - |
| Total Derivative Instruments: | 1,153 | 1,153 | - | - |
The following is a reconciliation of Investments in Securities for which Level 3 inputs were used in determining value:
| |
| Investments in Securities: | |
| Beginning Balance | $ | 2,348,844 | |
| Net Realized Gain (Loss) on Investment Securities | | (791,838) | |
| Net Unrealized Gain (Loss) on Investment Securities | | 3,447,478 | |
| Cost of Purchases | | 1,321,791 | |
| Proceeds of Sales | | (1,405,863) | |
| Amortization/Accretion | | - | |
| Transfers into Level 3 | | - | |
| Transfers out of Level 3 | | - | |
| Ending Balance | $ | 4,920,412 | |
| The change in unrealized gain (loss) for the period attributable to Level 3 securities held at October 31, 2023 | $ | 2,494,526 | |
| The information used in the above reconciliation represents fiscal year to date activity for any Investments in Securities identified as using Level 3 inputs at either the beginning or the end of the current fiscal period. Cost of purchases and proceeds of sales may include securities received and/or delivered through in-kind transactions, corporate actions or exchanges. Transfers into Level 3 were attributable to a lack of observable market data resulting from decreases in market activity, decreases in liquidity, security restructurings or corporate actions. Transfers out of Level 3 were attributable to observable market data becoming available for those securities. Transfers in or out of Level 3 represent the beginning value of any Security or Instrument where a change in the pricing level occurred from the beginning to the end of the period. Realized and unrealized gains (losses) disclosed in the reconciliation are included in Net Gain (Loss) on the Fund's Statement of Operations. | |
Value of Derivative Instruments
The following table is a summary of the Fund's value of derivative instruments by primary risk exposure as of October 31, 2023. For additional information on derivative instruments, please refer to the Derivative Instruments section in the accompanying Notes to Financial Statements.
Primary Risk Exposure / Derivative Type | Value |
| Asset ($) | Liability ($) |
| Equity Risk | | |
Futures Contracts (a) | 1,153 | 0 |
| Total Equity Risk | 1,153 | 0 |
| Total Value of Derivatives | 1,153 | 0 |
(a)Reflects gross cumulative appreciation (depreciation) on futures contracts as presented in the Schedule of Investments. In the Statement of Assets and Liabilities, the period end daily variation margin is included in receivable or payable for daily variation margin on futures contracts, and the net cumulative appreciation (depreciation) is included in Total accumulated earnings (loss).
Fidelity® Total Emerging Markets Fund
| Statement of Assets and Liabilities |
| | | | October 31, 2023 |
| | | | | |
| Assets | | | | |
| Investment in securities, at value (including securities loaned of $242,416) - See accompanying schedule: | | | | |
Unaffiliated issuers (cost $226,175,278) | $ | 203,210,315 | | |
Fidelity Central Funds (cost $2,887,389) | | 2,887,686 | | |
| | | | | |
| | | | | |
| Total Investment in Securities (cost $229,062,667) | | | $ | 206,098,001 |
| Cash | | | | 365,880 |
| Foreign currency held at value (cost $701) | | | | 701 |
| Receivable for investments sold | | | | 914,278 |
| Receivable for fund shares sold | | | | 32,638 |
| Dividends receivable | | | | 173,077 |
| Interest receivable | | | | 1,706,519 |
| Distributions receivable from Fidelity Central Funds | | | | 14,421 |
| Prepaid expenses | | | | 324 |
| Other receivables | | | | 102,607 |
Total assets | | | | 209,408,446 |
| Liabilities | | | | |
| Payable for investments purchased | | | | |
Regular delivery | $ | 762,034 | | |
Delayed delivery | | 5,601 | | |
| Payable for fund shares redeemed | | 456,230 | | |
| Accrued management fee | | 136,048 | | |
| Distribution and service plan fees payable | | 18,847 | | |
| Payable for daily variation margin on futures contracts | | 4,566 | | |
| Other affiliated payables | | 43,449 | | |
| Deferred taxes | | 365,449 | | |
| Other payables and accrued expenses | | 114,645 | | |
| Collateral on securities loaned | | 255,433 | | |
| Total Liabilities | | | | 2,162,302 |
| Net Assets | | | $ | 207,246,144 |
| Net Assets consist of: | | | | |
| Paid in capital | | | $ | 260,843,262 |
| Total accumulated earnings (loss) | | | | (53,597,118) |
| Net Assets | | | $ | 207,246,144 |
| | | | | |
| Net Asset Value and Maximum Offering Price | | | | |
| Class A : | | | | |
Net Asset Value and redemption price per share ($29,937,806 ÷ 2,703,770 shares)(a) | | | $ | 11.07 |
| Maximum offering price per share (100/94.25 of $11.07) | | | $ | 11.75 |
| Class M : | | | | |
Net Asset Value and redemption price per share ($6,477,044 ÷ 586,133 shares)(a) | | | $ | 11.05 |
| Maximum offering price per share (100/96.50 of $11.05) | | | $ | 11.45 |
| Class C : | | | | |
Net Asset Value and offering price per share ($11,349,410 ÷ 1,032,637 shares)(a) | | | $ | 10.99 |
| Total Emerging Markets : | | | | |
Net Asset Value, offering price and redemption price per share ($79,639,732 ÷ 7,169,339 shares) | | | $ | 11.11 |
| Class I : | | | | |
Net Asset Value, offering price and redemption price per share ($68,873,588 ÷ 6,207,553 shares) | | | $ | 11.10 |
| Class Z : | | | | |
Net Asset Value, offering price and redemption price per share ($10,968,564 ÷ 990,760 shares) | | | $ | 11.07 |
(a)Redemption price per share is equal to net asset value less any applicable contingent deferred sales charge. |
| Statement of Operations |
| | | | Year ended October 31, 2023 |
| Investment Income | | | | |
| Dividends | | | $ | 4,489,730 |
| Interest | | | | 6,738,114 |
| Income from Fidelity Central Funds (including $3,815 from security lending) | | | | 284,961 |
| Income before foreign taxes withheld | | | $ | 11,512,805 |
| Less foreign taxes withheld | | | | (389,101) |
| Total Income | | | | 11,123,704 |
| Expenses | | | | |
| Management fee | $ | 1,875,906 | | |
| Transfer agent fees | | 459,265 | | |
| Distribution and service plan fees | | 248,485 | | |
| Accounting fees | | 114,259 | | |
| Custodian fees and expenses | | 169,833 | | |
| Independent trustees' fees and expenses | | 1,592 | | |
| Registration fees | | 87,794 | | |
| Audit | | 130,440 | | |
| Legal | | 1,749 | | |
| Miscellaneous | | 1,125 | | |
| Total expenses before reductions | | 3,090,448 | | |
| Expense reductions | | (12,815) | | |
| Total expenses after reductions | | | | 3,077,633 |
| Net Investment income (loss) | | | | 8,046,071 |
| Realized and Unrealized Gain (Loss) | | | | |
| Net realized gain (loss) on: | | | | |
| Investment Securities: | | | | |
| Unaffiliated issuers (net of foreign taxes of $272,577) | | (2,454,137) | | |
| Foreign currency transactions | | (275,005) | | |
| Futures contracts | | (56,530) | | |
| Total net realized gain (loss) | | | | (2,785,672) |
| Change in net unrealized appreciation (depreciation) on: | | | | |
| Investment Securities: | | | | |
| Unaffiliated issuers(net of increase in deferred foreign taxes of $62,265) | | 27,079,539 | | |
| Assets and liabilities in foreign currencies | | 56,734 | | |
| Futures contracts | | 1,153 | | |
| Total change in net unrealized appreciation (depreciation) | | | | 27,137,426 |
| Net gain (loss) | | | | 24,351,754 |
| Net increase (decrease) in net assets resulting from operations | | | $ | 32,397,825 |
| Statement of Changes in Net Assets |
| |
| | Year ended October 31, 2023 | | Year ended October 31, 2022 |
| Increase (Decrease) in Net Assets | | | | |
| Operations | | | | |
| Net investment income (loss) | $ | 8,046,071 | $ | 10,825,203 |
| Net realized gain (loss) | | (2,785,672) | | (12,640,549) |
| Change in net unrealized appreciation (depreciation) | | 27,137,426 | | (173,003,840) |
| Net increase (decrease) in net assets resulting from operations | | 32,397,825 | | (174,819,186) |
| Distributions to shareholders | | (7,044,986) | | (11,768,448) |
| | | | | |
| Share transactions - net increase (decrease) | | (70,365,479) | | (182,422,186) |
| Total increase (decrease) in net assets | | (45,012,640) | | (369,009,820) |
| | | | | |
| Net Assets | | | | |
| Beginning of period | | 252,258,784 | | 621,268,604 |
| End of period | $ | 207,246,144 | $ | 252,258,784 |
| | | | | |
| | | | | |
Financial Highlights
| Fidelity Advisor® Total Emerging Markets Fund Class A |
| |
| Years ended October 31, | | 2023 | | 2022 | | 2021 | | 2020 | | 2019 |
Selected Per-Share Data | | | | | | | | | | |
| Net asset value, beginning of period | $ | 10.09 | $ | 15.26 | $ | 13.55 | $ | 12.80 | $ | 11.53 |
| Income from Investment Operations | | | | | | | | | | |
Net investment income (loss) A,B | | .36 | | .28 | | .20 | | .19 | | .37 C |
| Net realized and unrealized gain (loss) | | .91 | | (5.19) | | 1.67 | | .89 | | 1.14 |
| Total from investment operations | | 1.27 | | (4.91) | | 1.87 | | 1.08 | | 1.51 |
| Distributions from net investment income | | (.29) | | (.26) | | (.16) | | (.33) | | (.24) |
| Total distributions | | (.29) | | (.26) | | (.16) | | (.33) | | (.24) |
| Net asset value, end of period | $ | 11.07 | $ | 10.09 | $ | 15.26 | $ | 13.55 | $ | 12.80 |
Total Return D,E | | 12.57% | | (32.69)% | | 13.78% | | 8.54% | | 13.38% |
Ratios to Average Net Assets B,F,G | | | | | | | | | | |
| Expenses before reductions | | 1.45% | | 1.39% | | 1.36% | | 1.40% | | 1.39% |
| Expenses net of fee waivers, if any | | 1.44% | | 1.39% | | 1.36% | | 1.39% | | 1.39% |
| Expenses net of all reductions | | 1.44% | | 1.39% | | 1.36% | | 1.37% | | 1.39% |
| Net investment income (loss) | | 3.16% | | 2.21% | | 1.26% | | 1.49% | | 3.02% C |
| Supplemental Data | | | | | | | | | | |
| Net assets, end of period (000 omitted) | $ | 29,938 | $ | 28,302 | $ | 46,981 | $ | 37,022 | $ | 39,958 |
Portfolio turnover rate H | | 33% | | 67% | | 58% | | 58% | | 75% |
ACalculated based on average shares outstanding during the period.
BNet investment income (loss) is affected by the timing of the declaration of dividends by any underlying mutual funds or exchange-traded funds (ETFs). Net investment income (loss) of any mutual funds or ETFs is not included in the Fund's net investment income (loss) ratio.
CNet investment income per share reflects one or more large, non-recurring dividend(s) which amounted to $.08 per share. Excluding such non-recurring dividend(s), the ratio of net investment income (loss) to average net assets would have been 2.37%.
DTotal returns would have been lower if certain expenses had not been reduced during the applicable periods shown.
ETotal returns do not include the effect of the sales charges.
FFees and expenses of any underlying mutual funds or exchange-traded funds (ETFs) are not included in the Fund's expense ratio. The Fund indirectly bears its proportionate share of these expenses. For additional expense information related to investments in Fidelity Central Funds, please refer to the "Investments in Fidelity Central Funds" note found in the Notes to Financial Statements section of the most recent Annual or Semi-Annual report.
GExpense ratios reflect operating expenses of the class. Expenses before reductions do not reflect amounts reimbursed, waived, or reduced through arrangements with the investment adviser, brokerage services, or other offset arrangements, if applicable, and do not represent the amount paid by the class during periods when reimbursements, waivers or reductions occur.
HAmount does not include the portfolio activity of any underlying mutual funds or exchange-traded funds (ETFs).
| Fidelity Advisor® Total Emerging Markets Fund Class M |
| |
| Years ended October 31, | | 2023 | | 2022 | | 2021 | | 2020 | | 2019 |
Selected Per-Share Data | | | | | | | | | | |
| Net asset value, beginning of period | $ | 10.07 | $ | 15.23 | $ | 13.52 | $ | 12.78 | $ | 11.51 |
| Income from Investment Operations | | | | | | | | | | |
Net investment income (loss) A,B | | .33 | | .24 | | .15 | | .15 | | .33 C |
| Net realized and unrealized gain (loss) | | .91 | | (5.19) | | 1.67 | | .88 | | 1.15 |
| Total from investment operations | | 1.24 | | (4.95) | | 1.82 | | 1.03 | | 1.48 |
| Distributions from net investment income | | (.26) | | (.21) | | (.11) | | (.29) | | (.21) |
| Total distributions | | (.26) | | (.21) | | (.11) | | (.29) | | (.21) |
| Net asset value, end of period | $ | 11.05 | $ | 10.07 | $ | 15.23 | $ | 13.52 | $ | 12.78 |
Total Return D,E | | 12.26% | | (32.92)% | | 13.47% | | 8.16% | | 13.05% |
Ratios to Average Net Assets B,F,G | | | | | | | | | | |
| Expenses before reductions | | 1.74% | | 1.69% | | 1.66% | | 1.71% | | 1.72% |
| Expenses net of fee waivers, if any | | 1.74% | | 1.69% | | 1.66% | | 1.71% | | 1.71% |
| Expenses net of all reductions | | 1.73% | | 1.69% | | 1.66% | | 1.69% | | 1.71% |
| Net investment income (loss) | | 2.87% | | 1.90% | | .96% | | 1.17% | | 2.69% C |
| Supplemental Data | | | | | | | | | | |
| Net assets, end of period (000 omitted) | $ | 6,477 | $ | 6,237 | $ | 9,530 | $ | 7,885 | $ | 8,841 |
Portfolio turnover rate H | | 33% | | 67% | | 58% | | 58% | | 75% |
ACalculated based on average shares outstanding during the period.
BNet investment income (loss) is affected by the timing of the declaration of dividends by any underlying mutual funds or exchange-traded funds (ETFs). Net investment income (loss) of any mutual funds or ETFs is not included in the Fund's net investment income (loss) ratio.
CNet investment income per share reflects one or more large, non-recurring dividend(s) which amounted to $.08 per share. Excluding such non-recurring dividend(s), the ratio of net investment income (loss) to average net assets would have been 2.04%.
DTotal returns would have been lower if certain expenses had not been reduced during the applicable periods shown.
ETotal returns do not include the effect of the sales charges.
FFees and expenses of any underlying mutual funds or exchange-traded funds (ETFs) are not included in the Fund's expense ratio. The Fund indirectly bears its proportionate share of these expenses. For additional expense information related to investments in Fidelity Central Funds, please refer to the "Investments in Fidelity Central Funds" note found in the Notes to Financial Statements section of the most recent Annual or Semi-Annual report.
GExpense ratios reflect operating expenses of the class. Expenses before reductions do not reflect amounts reimbursed, waived, or reduced through arrangements with the investment adviser, brokerage services, or other offset arrangements, if applicable, and do not represent the amount paid by the class during periods when reimbursements, waivers or reductions occur.
HAmount does not include the portfolio activity of any underlying mutual funds or exchange-traded funds (ETFs).
| Fidelity Advisor® Total Emerging Markets Fund Class C |
| |
| Years ended October 31, | | 2023 | | 2022 | | 2021 | | 2020 | | 2019 |
Selected Per-Share Data | | | | | | | | | | |
| Net asset value, beginning of period | $ | 10.00 | $ | 15.09 | $ | 13.41 | $ | 12.66 | $ | 11.40 |
| Income from Investment Operations | | | | | | | | | | |
Net investment income (loss) A,B | | .27 | | .18 | | .08 | | .09 | | .28 C |
| Net realized and unrealized gain (loss) | | .90 | | (5.15) | | 1.65 | | .89 | | 1.13 |
| Total from investment operations | | 1.17 | | (4.97) | | 1.73 | | .98 | | 1.41 |
| Distributions from net investment income | | (.18) | | (.12) | | (.05) | | (.23) | | (.15) |
| Total distributions | | (.18) | | (.12) | | (.05) | | (.23) | | (.15) |
| Net asset value, end of period | $ | 10.99 | $ | 10.00 | $ | 15.09 | $ | 13.41 | $ | 12.66 |
Total Return D,E | | 11.68% | | (33.17)% | | 12.89% | | 7.83% | | 12.54% |
Ratios to Average Net Assets B,F,G | | | | | | | | | | |
| Expenses before reductions | | 2.19% | | 2.14% | | 2.11% | | 2.14% | | 2.14% |
| Expenses net of fee waivers, if any | | 2.19% | | 2.13% | | 2.11% | | 2.14% | | 2.14% |
| Expenses net of all reductions | | 2.19% | | 2.13% | | 2.11% | | 2.12% | | 2.13% |
| Net investment income (loss) | | 2.41% | | 1.46% | | .51% | | .74% | | 2.27% C |
| Supplemental Data | | | | | | | | | | |
| Net assets, end of period (000 omitted) | $ | 11,349 | $ | 13,469 | $ | 27,673 | $ | 28,884 | $ | 35,545 |
Portfolio turnover rate H | | 33% | | 67% | | 58% | | 58% | | 75% |
ACalculated based on average shares outstanding during the period.
BNet investment income (loss) is affected by the timing of the declaration of dividends by any underlying mutual funds or exchange-traded funds (ETFs). Net investment income (loss) of any mutual funds or ETFs is not included in the Fund's net investment income (loss) ratio.
CNet investment income per share reflects one or more large, non-recurring dividend(s) which amounted to $.08 per share. Excluding such non-recurring dividend(s), the ratio of net investment income (loss) to average net assets would have been 1.62%.
DTotal returns would have been lower if certain expenses had not been reduced during the applicable periods shown.
ETotal returns do not include the effect of the contingent deferred sales charge.
FFees and expenses of any underlying mutual funds or exchange-traded funds (ETFs) are not included in the Fund's expense ratio. The Fund indirectly bears its proportionate share of these expenses. For additional expense information related to investments in Fidelity Central Funds, please refer to the "Investments in Fidelity Central Funds" note found in the Notes to Financial Statements section of the most recent Annual or Semi-Annual report.
GExpense ratios reflect operating expenses of the class. Expenses before reductions do not reflect amounts reimbursed, waived, or reduced through arrangements with the investment adviser, brokerage services, or other offset arrangements, if applicable, and do not represent the amount paid by the class during periods when reimbursements, waivers or reductions occur.
HAmount does not include the portfolio activity of any underlying mutual funds or exchange-traded funds (ETFs).
| Fidelity® Total Emerging Markets Fund |
| |
| Years ended October 31, | | 2023 | | 2022 | | 2021 | | 2020 | | 2019 |
Selected Per-Share Data | | | | | | | | | | |
| Net asset value, beginning of period | $ | 10.12 | $ | 15.31 | $ | 13.59 | $ | 12.84 | $ | 11.56 |
| Income from Investment Operations | | | | | | | | | | |
Net investment income (loss) A,B | | .39 | | .32 | | .24 | | .22 | | .40 C |
| Net realized and unrealized gain (loss) | | .91 | | (5.21) | | 1.67 | | .90 | | 1.16 |
| Total from investment operations | | 1.30 | | (4.89) | | 1.91 | | 1.12 | | 1.56 |
| Distributions from net investment income | | (.31) | | (.30) | | (.19) | | (.37) | | (.28) |
| Total distributions | | (.31) | | (.30) | | (.19) | | (.37) | | (.28) |
| Net asset value, end of period | $ | 11.11 | $ | 10.12 | $ | 15.31 | $ | 13.59 | $ | 12.84 |
Total Return D | | 12.86% | | (32.52)% | | 14.06% | | 8.79% | | 13.80% |
Ratios to Average Net Assets B,E,F | | | | | | | | | | |
| Expenses before reductions | | 1.20% | | 1.12% | | 1.11% | | 1.16% | | 1.14% |
| Expenses net of fee waivers, if any | | 1.19% | | 1.11% | | 1.11% | | 1.15% | | 1.14% |
| Expenses net of all reductions | | 1.19% | | 1.11% | | 1.11% | | 1.14% | | 1.14% |
| Net investment income (loss) | | 3.41% | | 2.48% | | 1.51% | | 1.73% | | 3.27% C |
| Supplemental Data | | | | | | | | | | |
| Net assets, end of period (000 omitted) | $ | 79,640 | $ | 91,615 | $ | 259,331 | $ | 205,009 | $ | 199,708 |
Portfolio turnover rate G | | 33% | | 67% | | 58% | | 58% | | 75% |
ACalculated based on average shares outstanding during the period.
BNet investment income (loss) is affected by the timing of the declaration of dividends by any underlying mutual funds or exchange-traded funds (ETFs). Net investment income (loss) of any mutual funds or ETFs is not included in the Fund's net investment income (loss) ratio.
CNet investment income per share reflects one or more large, non-recurring dividend(s) which amounted to $.08 per share. Excluding such non-recurring dividend(s), the ratio of net investment income (loss) to average net assets would have been 2.62%.
DTotal returns would have been lower if certain expenses had not been reduced during the applicable periods shown.
EFees and expenses of any underlying mutual funds or exchange-traded funds (ETFs) are not included in the Fund's expense ratio. The Fund indirectly bears its proportionate share of these expenses. For additional expense information related to investments in Fidelity Central Funds, please refer to the "Investments in Fidelity Central Funds" note found in the Notes to Financial Statements section of the most recent Annual or Semi-Annual report.
FExpense ratios reflect operating expenses of the class. Expenses before reductions do not reflect amounts reimbursed, waived, or reduced through arrangements with the investment adviser, brokerage services, or other offset arrangements, if applicable, and do not represent the amount paid by the class during periods when reimbursements, waivers or reductions occur.
GAmount does not include the portfolio activity of any underlying mutual funds or exchange-traded funds (ETFs).
| Fidelity Advisor® Total Emerging Markets Fund Class I |
| |
| Years ended October 31, | | 2023 | | 2022 | | 2021 | | 2020 | | 2019 |
Selected Per-Share Data | | | | | | | | | | |
| Net asset value, beginning of period | $ | 10.11 | $ | 15.29 | $ | 13.57 | $ | 12.82 | $ | 11.55 |
| Income from Investment Operations | | | | | | | | | | |
Net investment income (loss) A,B | | .39 | | .32 | | .24 | | .22 | | .41 C |
| Net realized and unrealized gain (loss) | | .92 | | (5.20) | | 1.67 | | .90 | | 1.14 |
| Total from investment operations | | 1.31 | | (4.88) | | 1.91 | | 1.12 | | 1.55 |
| Distributions from net investment income | | (.32) | | (.30) | | (.19) | | (.37) | | (.28) |
| Total distributions | | (.32) | | (.30) | | (.19) | | (.37) | | (.28) |
| Net asset value, end of period | $ | 11.10 | $ | 10.11 | $ | 15.29 | $ | 13.57 | $ | 12.82 |
Total Return D | | 12.96% | | (32.50)% | | 14.10% | | 8.85% | | 13.77% |
Ratios to Average Net Assets B,E,F | | | | | | | | | | |
| Expenses before reductions | | 1.16% | | 1.10% | | 1.09% | | 1.11% | | 1.11% |
| Expenses net of fee waivers, if any | | 1.15% | | 1.10% | | 1.08% | | 1.10% | | 1.10% |
| Expenses net of all reductions | | 1.15% | | 1.10% | | 1.08% | | 1.09% | | 1.10% |
| Net investment income (loss) | | 3.45% | | 2.49% | | 1.54% | | 1.78% | | 3.30% C |
| Supplemental Data | | | | | | | | | | |
| Net assets, end of period (000 omitted) | $ | 68,874 | $ | 98,727 | $ | 209,635 | $ | 232,450 | $ | 372,286 |
Portfolio turnover rate G | | 33% | | 67% | | 58% | | 58% | | 75% |
ACalculated based on average shares outstanding during the period.
BNet investment income (loss) is affected by the timing of the declaration of dividends by any underlying mutual funds or exchange-traded funds (ETFs). Net investment income (loss) of any mutual funds or ETFs is not included in the Fund's net investment income (loss) ratio.
CNet investment income per share reflects one or more large, non-recurring dividend(s) which amounted to $.08 per share. Excluding such non-recurring dividend(s), the ratio of net investment income (loss) to average net assets would have been 2.65%.
DTotal returns would have been lower if certain expenses had not been reduced during the applicable periods shown.
EFees and expenses of any underlying mutual funds or exchange-traded funds (ETFs) are not included in the Fund's expense ratio. The Fund indirectly bears its proportionate share of these expenses. For additional expense information related to investments in Fidelity Central Funds, please refer to the "Investments in Fidelity Central Funds" note found in the Notes to Financial Statements section of the most recent Annual or Semi-Annual report.
FExpense ratios reflect operating expenses of the class. Expenses before reductions do not reflect amounts reimbursed, waived, or reduced through arrangements with the investment adviser, brokerage services, or other offset arrangements, if applicable, and do not represent the amount paid by the class during periods when reimbursements, waivers or reductions occur.
GAmount does not include the portfolio activity of any underlying mutual funds or exchange-traded funds (ETFs).
| Fidelity Advisor® Total Emerging Markets Fund Class Z |
| |
| Years ended October 31, | | 2023 | | 2022 | | 2021 | | 2020 | | 2019 |
Selected Per-Share Data | | | | | | | | | | |
| Net asset value, beginning of period | $ | 10.09 | $ | 15.26 | $ | 13.55 | $ | 12.80 | $ | 11.55 |
| Income from Investment Operations | | | | | | | | | | |
Net investment income (loss) A,B | | .41 | | .34 | | .26 | | .24 | | .43 C |
| Net realized and unrealized gain (loss) | | .91 | | (5.19) | | 1.66 | | .90 | | 1.13 |
| Total from investment operations | | 1.32 | | (4.85) | | 1.92 | | 1.14 | | 1.56 |
| Distributions from net investment income | | (.34) | | (.32) | | (.21) | | (.39) | | (.31) |
| Total distributions | | (.34) | | (.32) | | (.21) | | (.39) | | (.31) |
| Net asset value, end of period | $ | 11.07 | $ | 10.09 | $ | 15.26 | $ | 13.55 | $ | 12.80 |
Total Return D | | 13.04% | | (32.40)% | | 14.21% | | 9.03% | | 13.85% |
Ratios to Average Net Assets B,E,F | | | | | | | | | | |
| Expenses before reductions | | 1.03% | | .97% | | .96% | | .98% | | .98% |
| Expenses net of fee waivers, if any | | 1.02% | | .97% | | .96% | | .98% | | .97% |
| Expenses net of all reductions | | 1.02% | | .97% | | .96% | | .96% | | .97% |
| Net investment income (loss) | | 3.58% | | 2.62% | | 1.66% | | 1.91% | | 3.43% C |
| Supplemental Data | | | | | | | | | | |
| Net assets, end of period (000 omitted) | $ | 10,969 | $ | 13,909 | $ | 68,119 | $ | 56,395 | $ | 61,175 |
Portfolio turnover rate G | | 33% | | 67% | | 58% | | 58% | | 75% |
ACalculated based on average shares outstanding during the period.
BNet investment income (loss) is affected by the timing of the declaration of dividends by any underlying mutual funds or exchange-traded funds (ETFs). Net investment income (loss) of any mutual funds or ETFs is not included in the Fund's net investment income (loss) ratio.
CNet investment income per share reflects one or more large, non-recurring dividend(s) which amounted to $.08 per share. Excluding such non-recurring dividend(s), the ratio of net investment income (loss) to average net assets would have been 2.79%.
DTotal returns would have been lower if certain expenses had not been reduced during the applicable periods shown.
EFees and expenses of any underlying mutual funds or exchange-traded funds (ETFs) are not included in the Fund's expense ratio. The Fund indirectly bears its proportionate share of these expenses. For additional expense information related to investments in Fidelity Central Funds, please refer to the "Investments in Fidelity Central Funds" note found in the Notes to Financial Statements section of the most recent Annual or Semi-Annual report.
FExpense ratios reflect operating expenses of the class. Expenses before reductions do not reflect amounts reimbursed, waived, or reduced through arrangements with the investment adviser, brokerage services, or other offset arrangements, if applicable, and do not represent the amount paid by the class during periods when reimbursements, waivers or reductions occur.
GAmount does not include the portfolio activity of any underlying mutual funds or exchange-traded funds (ETFs).
For the period ended October 31, 2023
1. Organization.
Fidelity Total Emerging Markets Fund (the Fund) is a fund of Fidelity Investment Trust (the Trust) and is authorized to issue an unlimited number of shares. The Trust is registered under the Investment Company Act of 1940, as amended (the 1940 Act), as an open-end management investment company organized as a Massachusetts business trust. The Fund offers Class A, Class M, Class C, Total Emerging Markets, Class I and Class Z shares, each of which has equal rights as to assets and voting privileges. Class A, Class M, Class C, Class I and Class Z are Fidelity Advisor classes. Each class has exclusive voting rights with respect to matters that affect that class. Class C shares will automatically convert to Class A shares after a holding period of eight years from the initial date of purchase, with certain exceptions. The Fund's investments in emerging markets can be subject to social, economic, regulatory, and political uncertainties and can be extremely volatile.
2. Investments in Fidelity Central Funds.
Funds may invest in Fidelity Central Funds, which are open-end investment companies generally available only to other investment companies and accounts managed by the investment adviser and its affiliates. The Schedule of Investments lists any Fidelity Central Funds held as an investment as of period end, but does not include the underlying holdings of each Fidelity Central Fund. An investing fund indirectly bears its proportionate share of the expenses of the underlying Fidelity Central Funds.
Based on its investment objective, each Fidelity Central Fund may invest or participate in various investment vehicles or strategies that are similar to those of the investing fund. These strategies are consistent with the investment objectives of the investing fund and may involve certain economic risks which may cause a decline in value of each of the Fidelity Central Funds and thus a decline in the value of the investing fund.
| Fidelity Central Fund | Investment Manager | Investment Objective | Investment Practices | Expense RatioA |
| Fidelity Money Market Central Funds | Fidelity Management & Research Company LLC (FMR) | Each fund seeks to obtain a high level of current income consistent with the preservation of capital and liquidity. | Short-term Investments | Less than .005% |
A Expenses expressed as a percentage of average net assets and are as of each underlying Central Fund's most recent annual or semi-annual shareholder report.
A complete unaudited list of holdings for each Fidelity Central Fund is available upon request or at the Securities and Exchange Commission website at www.sec.gov. In addition, the financial statements of the Fidelity Central Funds which contain the significant accounting policies (including investment valuation policies) of those funds, and are not covered by the Report of Independent Registered Public Accounting Firm, are available on the Securities and Exchange Commission website or upon request.
3. Significant Accounting Policies.
The Fund is an investment company and applies the accounting and reporting guidance of the Financial Accounting Standards Board (FASB) Accounting Standards Codification Topic 946 Financial Services - Investment Companies. The financial statements have been prepared in conformity with accounting principles generally accepted in the United States of America (GAAP), which require management to make certain estimates and assumptions at the date of the financial statements. Actual results could differ from those estimates. Subsequent events, if any, through the date that the financial statements were issued have been evaluated in the preparation of the financial statements. The Fund's Schedule of Investments lists any underlying mutual funds or exchange-traded funds (ETFs) but does not include the underlying holdings of these funds. The following summarizes the significant accounting policies of the Fund:
Investment Valuation. Investments are valued as of 4:00 p.m. Eastern time on the last calendar day of the period. The Board of Trustees (the Board) has designated the Fund's investment adviser as the valuation designee responsible for the fair valuation function and performing fair value determinations as needed. The investment adviser has established a Fair Value Committee (the Committee) to carry out the day-to-day fair valuation responsibilities and has adopted policies and procedures to govern the fair valuation process and the activities of the Committee. In accordance with these fair valuation policies and procedures, which have been approved by the Board, the Fund attempts to obtain prices from one or more third party pricing services or brokers to value its investments. When current market prices, quotations or currency exchange rates are not readily available or reliable, investments will be fair valued in good faith by the Committee, in accordance with the policies and procedures. Factors used in determining fair value vary by investment type and may include market or investment specific events, transaction data, estimated cash flows, and market observations of comparable investments. The frequency that the fair valuation procedures are used cannot be predicted and they may be utilized to a significant extent. The Committee manages the Fund's fair valuation practices and maintains the fair valuation policies and procedures. The Fund's investment adviser reports to the Board information regarding the fair valuation process and related material matters.
The Fund categorizes the inputs to valuation techniques used to value its investments into a disclosure hierarchy consisting of three levels as shown below:
Level 1 - unadjusted quoted prices in active markets for identical investments
Level 2 - other significant observable inputs (including quoted prices for similar investments, interest rates, prepayment speeds, etc.)
Level 3 - unobservable inputs (including the Fund's own assumptions based on the best information available)
Valuation techniques used to value the Fund's investments by major category are as follows:
Equity securities, including restricted securities, for which market quotations are readily available, are valued at the last reported sale price or official closing price as reported by a third party pricing service on the primary market or exchange on which they are traded and are categorized as Level 1 in the hierarchy. In the event there were no sales during the day or closing prices are not available, securities are valued at the last quoted bid price or may be valued using the last available price and are generally categorized as Level 2 in the hierarchy. For foreign equity securities, when market or security specific events arise, comparisons to the valuation of American Depositary Receipts (ADRs), futures contracts, ETFs and certain indexes as well as quoted prices for similar securities may be used and would be categorized as Level 2 in the hierarchy. For equity securities, including restricted securities, where observable inputs are limited, assumptions about market activity and risk are used and these securities may be categorized as Level 3 in the hierarchy.
Debt securities, including restricted securities, are valued based on evaluated prices received from third party pricing services or from brokers who make markets in such securities. Corporate bonds, foreign government and government agency, preferred securities, and U.S. government and government agency obligations are valued by pricing services who utilize matrix pricing which considers yield or price of bonds of comparable quality, coupon, maturity and type or by broker-supplied prices. When independent prices are unavailable or unreliable, debt securities may be valued utilizing pricing methodologies which consider similar factors that would be used by third party pricing services. Debt securities are generally categorized as Level 2 in the hierarchy but may be Level 3 depending on the circumstances.
Futures contracts are valued at the settlement price established each day by the board of trade or exchange on which they are traded and are categorized as Level 1 in the hierarchy. Investments in open-end mutual funds, including the Fidelity Central Funds, are valued at their closing net asset value (NAV) each business day and are categorized as Level 1 in the hierarchy.
The following provides information on Level 3 securities held by the Fund that were valued at period end based on unobservable inputs. These amounts exclude valuations provided by a broker.
| Asset Type | Fair Value | Valuation Technique(s) | Unobservable Input | Amount or Range/Weighted Average | Impact to Valuation from an Increase in InputA |
| Equities | $3,631,351 | Market comparable | Enterprise value/Revenue multiple (EV/R) | 2.5 - 3.3 / 3.1 | Increase |
| | | Market approach | Transaction price | $13.75 - $15.25 / $14.50 | Increase |
| | | | Discount rate | 20.0% - 50.0% / 20.8% | Decrease |
| | | Indicative market price | Bid price | $65.00 | Increase |
| | | Recovery value | Recovery value | $0.00 | Increase |
| | | Black scholes | Discount rate | 4.9% | Increase |
| | | | Volatility | 60.0% | Increase |
| | | | Term | 3.0 | Increase |
| Corporate Bonds | $1,289,061 | Market comparable | Enterprise value/Revenue multiple (EV/R) | 6.0 | Increase |
| | | Indicative market price | Evaluated bid | $100.01 | Increase |
| | | Discounted cash flow | Discount rate | 4.3% | Decrease |
| | | | | | |
A Represents the directional change in the fair value of the Level 3 investments that could have resulted from an increase in the corresponding input as of period end. A decrease to the unobservable input would have had the opposite effect. Significant changes in these inputs may have resulted in a significantly higher or lower fair value measurement at period end.
Changes in valuation techniques may result in transfers in or out of an assigned level within the disclosure hierarchy. The aggregate value of investments by input level as of October 31, 2023, as well as a roll forward of Level 3 investments, is included at the end of the Fund's Schedule of Investments.
Foreign Currency. Certain Funds may use foreign currency contracts to facilitate transactions in foreign-denominated securities. Gains and losses from these transactions may arise from changes in the value of the foreign currency or if the counterparties do not perform under the contracts' terms.
Foreign-denominated assets, including investment securities, and liabilities are translated into U.S. dollars at the exchange rates at period end. Purchases and sales of investment securities, income and dividends received, and expenses denominated in foreign currencies are translated into U.S. dollars at the exchange rate in effect on the transaction date.
The effects of exchange rate fluctuations on investments are included with the net realized and unrealized gain (loss) on investment securities. Other foreign currency transactions resulting in realized and unrealized gain (loss) are disclosed separately.
Investment Transactions and Income. For financial reporting purposes, the Fund's investment holdings and NAV include trades executed through the end of the last business day of the period. The NAV per share for processing shareholder transactions is calculated as of the close of business of the New York Stock Exchange (NYSE), normally 4:00 p.m. Eastern time and includes trades executed through the end of the prior business day. Gains and losses on securities sold are determined on the basis of identified cost and include proceeds received from litigation. Commissions paid to certain brokers with whom the investment adviser, or its affiliates, places trades on behalf of a fund include an amount in addition to trade execution, which may be rebated back to a fund. Any such rebates are included in net realized gain (loss) on investments in the Statement of Operations. Dividend income is recorded on the ex-dividend date, except for certain dividends from foreign securities where the ex-dividend date may have passed, which are recorded as soon as the Fund is informed of the ex-dividend date. Non-cash dividends included in dividend income, if any, are recorded at the fair market value of the securities received. Income and capital gain distributions from Fidelity Central Funds, if any, are recorded on the ex-dividend date. Interest income is accrued as earned and includes coupon interest and amortization of premium and accretion of discount on debt securities as applicable. Investment income is recorded net of foreign taxes withheld where recovery of such taxes is uncertain. Funds may file withholding tax reclaims in certain jurisdictions to recover a portion of amounts previously withheld. Any withholding tax reclaims income is included in the Statement of Operations in foreign taxes withheld. Any receivables for withholding tax reclaims are included in the Statement of Assets and Liabilities in dividends receivable.
Class Allocations and Expenses. Investment income, realized and unrealized capital gains and losses, common expenses of a fund, and certain fund-level expense reductions, if any, are allocated daily on a pro-rata basis to each class based on the relative net assets of each class to the total net assets of a fund. Each class differs with respect to transfer agent and distribution and service plan fees incurred, as applicable. Certain expense reductions may also differ by class, if applicable. For the reporting period, the allocated portion of income and expenses to each class as a percent of its average net assets may vary due to the timing of recording these transactions in relation to fluctuating net assets of the classes. Expenses directly attributable to a fund are charged to that fund. Expenses attributable to more than one fund are allocated among the respective funds on the basis of relative net assets or other appropriate methods. Expenses included in the accompanying financial statements reflect the expenses of that fund and do not include any expenses associated with any underlying mutual funds or exchange-traded funds (ETFs). Although not included in a fund's expenses, a fund indirectly bears its proportionate share of these expenses through the net asset value of each underlying mutual fund or exchange-traded fund (ETF). Expense estimates are accrued in the period to which they relate and adjustments are made when actual amounts are known.
Income Tax Information and Distributions to Shareholders. Each year, the Fund intends to qualify as a regulated investment company under Subchapter M of the Internal Revenue Code, including distributing substantially all of its taxable income and realized gains. As a result, no provision for U.S. Federal income taxes is required. As of October 31, 2023, the Fund did not have any unrecognized tax benefits in the financial statements; nor is the Fund aware of any tax positions for which it is reasonably possible that the total amounts of unrecognized tax benefits will significantly change in the next twelve months. The Fund files a U.S. federal tax return, in addition to state and local tax returns as required. The Fund's federal income tax returns are subject to examination by the Internal Revenue Service (IRS) for a period of three fiscal years after they are filed. State and local tax returns may be subject to examination for an additional fiscal year depending on the jurisdiction. Foreign taxes are provided for based on the Fund's understanding of the tax rules and rates that exist in the foreign markets in which it invests. The Fund is subject to a tax imposed on capital gains by certain countries in which it invests. An estimated deferred tax liability for net unrealized appreciation on the applicable securities is included in Deferred taxes on the Statement of Assets & Liabilities.
Distributions are declared and recorded on the ex-dividend date. Income and capital gain distributions are declared separately for each class. Income and capital gain distributions are determined in accordance with income tax regulations, which may differ from GAAP. In addition, the Fund claimed a portion of the payment made to redeeming shareholders as a distribution for income tax purposes.
Capital accounts within the financial statements are adjusted for permanent book-tax differences. These adjustments have no impact on net assets or the results of operations. Capital accounts are not adjusted for temporary book-tax differences which will reverse in a subsequent period.
Book-tax differences are primarily due to futures contracts, foreign currency transactions, certain foreign taxes, passive foreign investment companies (PFIC), market discount, capital loss carryforwards and losses deferred due to wash sales.
As of period end, the cost and unrealized appreciation (depreciation) in securities, and derivatives if applicable, for federal income tax purposes were as follows:
| Gross unrealized appreciation | $31,012,531 |
| Gross unrealized depreciation | (56,312,184) |
| Net unrealized appreciation (depreciation) | $(25,299,653) |
| Tax Cost | $231,397,654 |
The tax-based components of distributable earnings as of period end were as follows:
| Undistributed ordinary income | $5,369,562 |
| Capital loss carryforward | $(33,275,951) |
| Net unrealized appreciation (depreciation) on securities and other investments | $(25,325,282) |
Capital loss carryforwards are only available to offset future capital gains of the Fund to the extent provided by regulations and may be limited. The capital loss carryforward information presented below, including any applicable limitation, is estimated as of fiscal period end and is subject to adjustment.
| Short-term | $(32,318,283) |
| Long-term | (957,668) |
Total capital loss carryforward | $(33,275,951) |
The tax character of distributions paid was as follows:
| | October 31, 2023 | October 31, 2022 |
| Ordinary Income | $7,044,986 | $ 11,768,448 |
Delayed Delivery Transactions and When-Issued Securities. During the period, certain Funds transacted in securities on a delayed delivery or when-issued basis. Payment and delivery may take place after the customary settlement period for that security. The price of the underlying securities and the date when the securities will be delivered and paid for are fixed at the time the transaction is negotiated. Securities purchased on a delayed delivery or when-issued basis are identified as such in the Schedule of Investments. Compensation for interest forgone in the purchase of a delayed delivery or when-issued debt security may be received. With respect to purchase commitments, each applicable Fund identifies securities as segregated in its records with a value at least equal to the amount of the commitment. Payables and receivables associated with the purchases and sales of delayed delivery securities having the same coupon, settlement date and broker are offset. Delayed delivery or when-issued securities that have been purchased from and sold to different brokers are reflected as both payables and receivables in the Statement of Assets and Liabilities under the caption "Delayed delivery", as applicable. Losses may arise due to changes in the value of the underlying securities or if the counterparty does not perform under the contract's terms, or if the issuer does not issue the securities due to political, economic, or other factors.
Restricted Securities (including Private Placements). Funds may invest in securities that are subject to legal or contractual restrictions on resale. These securities generally may be resold in transactions exempt from registration or to the public if the securities are registered. Disposal of these securities may involve time-consuming negotiations and expense, and prompt sale at an acceptable price may be difficult. Information regarding restricted securities held at period end is included at the end of the Schedule of Investments, if applicable.
New Accounting Pronouncement. In June 2022, the Financial Accounting Standards Board (FASB) issued Accounting Standards Update (ASU) 2022-03 Fair Value Measurement (Topic 820): Fair Value Measurement of Equity Securities Subject to Contractual Sale Restrictions. The amendments in this ASU clarify that a contractual restriction on the sale of an equity security is not considered part of the unit of account of the equity security and, therefore, is not considered in measuring fair value. They also clarify that an entity cannot, as a separate unit of account, recognize and measure a contractual sale restriction. They also require additional disclosures for equity securities subject to contractual sale restrictions. ASU 2022-03 will be effective for fiscal years, including interim periods within those fiscal years, beginning after December 15, 2023, and allows for early adoption. ASU 2022-03 will only be applicable to an equity security in which the contractual arrangement that restricts its sale is executed or modified on or after the adoption date. Management is currently evaluating the potential impact of ASU 2022-03 to the financial statements.
4. Derivative Instruments.
Risk Exposures and the Use of Derivative Instruments. The Fund's investment objectives allow for various types of derivative instruments, including futures contracts. Derivatives are investments whose value is primarily derived from underlying assets, indices or reference rates and may be transacted on an exchange or over-the-counter (OTC). Derivatives may involve a future commitment to buy or sell a specified asset based on specified terms, to exchange future cash flows at periodic intervals based on a notional principal amount, or for one party to make one or more payments upon the occurrence of specified events in exchange for periodic payments from the other party.
Derivatives were used to increase returns and to manage exposure to certain risks as defined below. The success of any strategy involving derivatives depends on analysis of numerous economic factors, and if the strategies for investment do not work as intended, the objectives may not be achieved.
Derivatives were used to increase or decrease exposure to the following risk(s):
| | |
| Equity Risk | Equity risk relates to the fluctuations in the value of financial instruments as a result of changes in market prices (other than those arising from interest rate risk or foreign exchange risk), whether caused by factors specific to an individual investment, its issuer, or all factors affecting all instruments traded in a market or market segment. |
Funds are also exposed to additional risks from investing in derivatives, such as liquidity risk and counterparty credit risk. Liquidity risk is the risk that a fund will be unable to close out the derivative in the open market in a timely manner. Counterparty credit risk is the risk that the counterparty will not be able to fulfill its obligation to a fund. Counterparty credit risk related to exchange-traded contracts may be mitigated by the protection provided by the exchange on which they trade.
Investing in derivatives may involve greater risks than investing in the underlying assets directly and, to varying degrees, may involve risk of loss in excess of any initial investment and collateral received and amounts recognized in the Statement of Assets and Liabilities. In addition, there may be the risk that the change in value of the derivative contract does not correspond to the change in value of the underlying instrument.
Futures Contracts. A futures contract is an agreement between two parties to buy or sell a specified underlying instrument for a fixed price at a specified future date. Futures contracts were used to manage exposure to the stock market.
Upon entering into a futures contract, a fund is required to deposit either cash or securities (initial margin) with a clearing broker in an amount equal to a certain percentage of the face value of the contract. Futures contracts are marked-to-market daily and subsequent daily payments are made or received by a fund depending on the daily fluctuations in the value of the futures contracts and are recorded as unrealized appreciation or (depreciation). This receivable and/or payable, if any, is included in daily variation margin on futures contracts in the Statement of Assets and Liabilities. Realized gain or (loss) is recorded upon the expiration or closing of a futures contract. The net realized gain (loss) and change in net unrealized appreciation (depreciation) on futures contracts during the period is presented in the Statement of Operations.
Any open futures contracts at period end are presented in the Schedule of Investments under the caption "Futures Contracts". The notional amount at value reflects each contract's exposure to the underlying instrument or index at period end, and is representative of volume of activity during the period unless an average notional amount is presented. Any securities deposited to meet initial margin requirements are identified in the Schedule of Investments. Any cash deposited to meet initial margin requirements is presented as segregated cash with brokers for derivative instruments in the Statement of Assets and Liabilities.
5. Purchases and Sales of Investments.
Purchases and sales of securities, other than short-term securities, U.S. government securities and in-kind transactions, as applicable, are noted in the table below.
| | Purchases ($) | Sales ($) |
| Fidelity Total Emerging Markets Fund | 75,439,968 | 141,133,766 |
6. Fees and Other Transactions with Affiliates.
Management Fee. Fidelity Management & Research Company LLC (the investment adviser) and its affiliates provide the Fund with investment management related services for which the Fund pays a monthly management fee. The management fee is the sum of an individual fund fee rate that is based on an annual rate of .55% of the Fund's average net assets and an annualized group fee rate that averaged .23% during the period. The group fee rate is based upon the monthly average net assets of a group of registered investment companies with which the investment adviser has management contracts. The group fee rate decreases as assets under management increase and increases as assets under management decrease. For the reporting period, the total annual management fee rate was .78% of the Fund's average net assets.
Distribution and Service Plan Fees. In accordance with Rule 12b-1 of the 1940 Act, the Fund has adopted separate Distribution and Service Plans for each class of shares. Certain classes pay Fidelity Distributors Company LLC (FDC), an affiliate of the investment adviser, separate Distribution and Service Fees, each of which is based on an annual percentage of each class' average net assets. In addition, FDC may pay financial intermediaries for selling shares of the Fund and providing shareholder support services. For the period, the Distribution and Service Fee rates, total fees and amounts retained by FDC were as follows:
| | Distribution Fee | Service Fee | Total Fees | Retained by FDC |
| Class A | - % | .25% | $78,482 | $911 |
| Class M | .25% | .25% | 34,362 | 104 |
| Class C | .75% | .25% | 135,641 | 10,256 |
| | | | $248,485 | $11,271 |
Sales Load. FDC may receive a front-end sales charge of up to 5.75% for selling Class A shares and 3.50% for selling Class M shares, some of which is paid to financial intermediaries for selling shares of the Fund. Depending on the holding period, FDC may receive contingent deferred sales charges levied on Class A, Class M and Class C redemptions. The deferred sales charges are 1.00% for Class C shares, 1.00% for certain purchases of Class A shares and .25% for certain purchases of Class M shares.
For the period, sales charge amounts retained by FDC were as follows:
| | Retained by FDC |
| Class A | $11,521 |
| Class M | 817 |
Class CA | 147 |
| | $12,485 |
A When Class C shares are initially sold, FDC pays commissions from its own resources to financial intermediaries through which the sales are made.
Transfer Agent Fees. Fidelity Investments Institutional Operations Company LLC (FIIOC), an affiliate of the investment adviser, is the transfer, dividend disbursing and shareholder servicing agent for each class of the Fund. FIIOC receives account fees and asset-based fees that vary according to the account size and type of account of the shareholders of the respective classes of the Fund, except for Class Z. FIIOC receives an asset-based fee of Class Z's average net assets. FIIOC pays for typesetting, printing and mailing of shareholder reports, except proxy statements.
For the period, transfer agent fees for each class were as follows:
| | Amount | % of Class-Level Average Net Assets |
| Class A | $67,260 | .21 |
| Class M | 17,543 | .26 |
| Class C | 27,759 | .20 |
| Total Emerging Markets | 196,801 | .21 |
| Class I | 144,375 | .17 |
| Class Z | 5,527 | .04 |
| | $459,265 | |
During November 2023, the Board approved a change in the transfer agent fees effective December 1, 2023 to a fixed annual rate of class-level average net assets as follows:
| | % of Class-Level Average Net Assets |
| Class A | 0.2000% |
| Class M | 0.2000% |
| Class C | 0.2000% |
| Total Emerging Markets | 0.2000% |
| Class I | 0.1693% |
Accounting Fees. Fidelity Service Company, Inc. (FSC), an affiliate of the investment adviser, maintains the Fund's accounting records. The accounting fee is based on the level of average net assets for each month. For the period, the fees were equivalent to the following annual rates:
| | % of Average Net Assets |
| Fidelity Total Emerging Markets Fund | .05 |
During November 2023, the Board approved a change in the accounting fees effective December 1, 2023 to a fixed annual rate of average net assets as follows:
| | % of Average Net Assets |
| Fidelity Total Emerging Markets Fund | 0.0471% |
Brokerage Commissions. A portion of portfolio transactions were placed with brokerage firms which are affiliates of the investment adviser. Brokerage commissions are included in net realized gain (loss) and change in net unrealized appreciation (depreciation) in the Statement of Operations. The commissions paid to these affiliated firms were as follows:
| | Amount |
| Fidelity Total Emerging Markets Fund | $630 |
Interfund Trades. Funds may purchase from or sell securities to other Fidelity Funds under procedures adopted by the Board. The procedures have been designed to ensure these interfund trades are executed in accordance with Rule 17a-7 of the 1940 Act. Any interfund trades are included within the respective purchases and sales amounts shown in the Purchases and Sales of Investments note. Interfund trades during the period are noted in the table below. During the period, there were no interfund trades.
| | Purchases ($) | Sales ($) | Realized Gain (Loss) ($) |
| Fidelity Total Emerging Markets Fund | 854,041 | 3,320,149 | (168,243) |
7. Committed Line of Credit.
Certain Funds participate with other funds managed by the investment adviser or an affiliate in a $4.25 billion credit facility (the "line of credit") to be utilized for temporary or emergency purposes to fund shareholder redemptions or for other short-term liquidity purposes. The participating funds have agreed to pay commitment fees on their pro-rata portion of the line of credit, which are reflected in Miscellaneous expenses on the Statement of Operations, and are listed below. During the period, there were no borrowings on this line of credit.
| | Amount |
| Fidelity Total Emerging Markets Fund | $452 |
8. Security Lending.
Funds lend portfolio securities from time to time in order to earn additional income. Lending agents are used, including National Financial Services (NFS), an affiliate of the investment adviser. Pursuant to a securities lending agreement, NFS will receive a fee, which is capped at 9.9% of a fund's daily lending revenue, for its services as lending agent. A fund may lend securities to certain qualified borrowers, including NFS. On the settlement date of the loan, a fund receives collateral (in the form of U.S. Treasury obligations, letters of credit and/or cash) against the loaned securities and maintains collateral in an amount not less than 100% of the market value of the loaned securities during the period of the loan. The market value of the loaned securities is determined at the close of business of a fund and any additional required collateral is delivered to a fund on the next business day. A fund or borrower may terminate the loan at any time, and if the borrower defaults on its obligation to return the securities loaned because of insolvency or other reasons, a fund may apply collateral received from the borrower against the obligation. A fund may experience delays and costs in recovering the securities loaned. Any cash collateral received is invested in the Fidelity Securities Lending Cash Central Fund. Any loaned securities are identified as such in the Schedule of Investments, and the value of loaned securities and cash collateral at period end, as applicable, are presented in the Statement of Assets and Liabilities. Security lending income represents the income earned on investing cash collateral, less rebates paid to borrowers and any lending agent fees associated with the loan, plus any premium payments received for lending certain types of securities. Security lending income is presented in the Statement of Operations as a component of income from Fidelity Central Funds. Affiliated security lending activity, if any, was as follows:
| | Total Security Lending Fees Paid to NFS | Security Lending Income From Securities Loaned to NFS | Value of Securities Loaned to NFS at Period End |
| Fidelity Total Emerging Markets Fund | $398 | $- | $- |
9. Expense Reductions.
Through arrangements with the Fund's custodian and each class' transfer agent, credits realized as a result of certain uninvested cash balances were used to reduce the Fund's expenses. During the period, transfer agent credits reduced each class' expenses as noted in the table below.
| | Expense reduction |
| | |
| Class M | $287 |
In addition, during the period the investment adviser or an affiliate reimbursed and/or waived a portion of fund-level operating expenses in the amount of $12,528.
10. Distributions to Shareholders.
Distributions to shareholders of each class were as follows:
| | Year ended October 31, 2023 | Year ended October 31, 2022 |
| Fidelity Total Emerging Markets Fund | | |
| Distributions to shareholders | | |
| Class A | $794,178 | $783,324 |
| Class M | 155,913 | 128,984 |
| Class C | 234,768 | 226,893 |
| Total Emerging Markets | 2,687,846 | 5,176,420 |
| Class I | 2,776,747 | 4,027,359 |
| Class Z | 395,534 | 1,425,468 |
Total | $7,044,986 | $11,768,448 |
11. Share Transactions.
Share transactions for each class were as follows and may contain in-kind transactions, automatic conversions between classes or exchanges between affiliated funds:
| | Shares | Shares | Dollars | Dollars |
| | Year ended October 31, 2023 | Year ended October 31, 2022 | Year ended October 31, 2023 | Year ended October 31, 2022 |
| Fidelity Total Emerging Markets Fund | | | | |
| Class A | | | | |
| Shares sold | 451,041 | 539,278 | $5,132,208 | $6,972,605 |
| Reinvestment of distributions | 71,386 | 54,325 | 792,381 | 781,197 |
| Shares redeemed | (623,211) | (867,088) | (7,049,102) | (10,923,910) |
| Net increase (decrease) | (100,784) | (273,485) | $(1,124,513) | $(3,170,108) |
| Class M | | | | |
| Shares sold | 28,227 | 68,332 | $321,892 | $870,856 |
| Reinvestment of distributions | 14,022 | 8,958 | 155,787 | 128,908 |
| Shares redeemed | (75,454) | (83,685) | (856,020) | (1,103,957) |
| Net increase (decrease) | (33,205) | (6,395) | $(378,341) | $(104,193) |
| Class C | | | | |
| Shares sold | 104,348 | 172,996 | $1,182,359 | $2,372,908 |
| Reinvestment of distributions | 21,155 | 15,806 | 234,608 | 226,656 |
| Shares redeemed | (440,401) | (675,110) | (4,961,807) | (8,531,245) |
| Net increase (decrease) | (314,898) | (486,308) | $(3,544,840) | $(5,931,681) |
| Total Emerging Markets | | | | |
| Shares sold | 563,824 | 20,327,420 | $6,430,664 | $276,182,533 |
| Reinvestment of distributions | 206,717 | 196,824 | 2,296,623 | 2,832,302 |
| Shares redeemed | (2,655,457) | (28,410,344) | (30,066,472) | (367,959,039) |
| Net increase (decrease) | (1,884,916) | (7,886,100) | $(21,339,185) | $(88,944,204) |
| Class I | | | | |
| Shares sold | 918,341 | 1,916,908 | $10,406,208 | $24,629,924 |
| Reinvestment of distributions | 246,056 | 276,622 | 2,728,758 | 3,975,058 |
| Shares redeemed | (4,721,988) | (6,138,529) | (53,094,986) | (76,056,229) |
| Net increase (decrease) | (3,557,591) | (3,944,999) | $(39,960,020) | $(47,451,247) |
| Class Z | | | | |
| Shares sold | 923,752 | 486,703 | $10,820,507 | $6,448,746 |
| Reinvestment of distributions | 25,674 | 72,407 | 283,693 | 1,036,865 |
| Shares redeemed | (1,337,270) | (3,644,178) | (15,122,780) | (44,306,364) |
| Net increase (decrease) | (387,844) | (3,085,068) | $(4,018,580) | $(36,820,753) |
12. Other.
A fund's organizational documents provide former and current trustees and officers with a limited indemnification against liabilities arising in connection with the performance of their duties to the fund. In the normal course of business, a fund may also enter into contracts that provide general indemnifications. A fund's maximum exposure under these arrangements is unknown as this would be dependent on future claims that may be made against a fund. The risk of material loss from such claims is considered remote.
13. Risk and Uncertainties.
Many factors affect a fund's performance. Developments that disrupt global economies and financial markets, such as pandemics, epidemics, outbreaks of infectious diseases, war, terrorism, and environmental disasters, may significantly affect a fund's investment performance. The effects of these developments to a fund will be impacted by the types of securities in which a fund invests, the financial condition, industry, economic sector, and geographic location of an issuer, and a fund's level of investment in the securities of that issuer. Significant concentrations in security types, issuers, industries, sectors, and geographic locations may magnify the factors that affect a fund's performance.
To the Board of Trustees of Fidelity Investment Trust and Shareholders of Fidelity Emerging Markets Discovery Fund and Fidelity Total Emerging Markets Fund
Opinions on the Financial Statements
We have audited the accompanying statements of assets and liabilities, including the schedules of investments, of Fidelity Emerging Markets Discovery Fund and Fidelity Total Emerging Markets Fund (two of the funds constituting Fidelity Investment Trust, referred to hereafter as the "Funds") as of October 31, 2023, the related statements of operations for the year ended October 31, 2023, the statements of changes in net assets for each of the two years in the period ended October 31, 2023, including the related notes, and the financial highlights for each of the five years in the period ended October 31, 2023 (collectively referred to as the "financial statements"). In our opinion, the financial statements present fairly, in all material respects, the financial position of each of the Funds as of October 31, 2023, the results of each of their operations for the year then ended, the changes in each of their net assets for each of the two years in the period ended October 31, 2023 and the financial highlights for each of the five years in the period ended October 31, 2023 in conformity with accounting principles generally accepted in the United States of America.
Basis for Opinions
These financial statements are the responsibility of the Fund's management. Our responsibility is to express an opinion on the Fund's financial statements based on our audits. We are a public accounting firm registered with the Public Company Accounting Oversight Board (United States) (PCAOB) and are required to be independent with respect to the Funds in accordance with the U.S. federal securities laws and the applicable rules and regulations of the Securities and Exchange Commission and the PCAOB.
We conducted our audits of these financial statements in accordance with the standards of the PCAOB. Those standards require that we plan and perform the audit to obtain reasonable assurance about whether the financial statements are free of material misstatement, whether due to error or fraud.
Our audits included performing procedures to assess the risks of material misstatement of the financial statements, whether due to error or fraud, and performing procedures that respond to those risks. Such procedures included examining, on a test basis, evidence regarding the amounts and disclosures in the financial statements. Our audits also included evaluating the accounting principles used and significant estimates made by management, as well as evaluating the overall presentation of the financial statements. Our procedures included confirmation of securities owned as of October 31, 2023 by correspondence with the custodian, issuers of privately offered securities and brokers; when replies were not received from brokers, we performed other auditing procedures. We believe that our audits provide a reasonable basis for our opinion.
/s/ PricewaterhouseCoopers LLP
Boston, Massachusetts
December 13, 2023
We have served as the auditor of one or more investment companies in the Fidelity group of funds since 1932.
The Trustees, Members of the Advisory Board (if any), and officers of the trust and funds, as applicable, are listed below. The Board of Trustees governs each fund and is responsible for protecting the interests of shareholders. The Trustees are experienced executives who meet periodically throughout the year to oversee each fund's activities, review contractual arrangements with companies that provide services to each fund, oversee management of the risks associated with such activities and contractual arrangements, and review each fund's performance. Except for Jonathan Chiel, each of the Trustees oversees 322 funds. Mr. Chiel oversees 191 funds.
The Trustees hold office without limit in time except that (a) any Trustee may resign; (b) any Trustee may be removed by written instrument, signed by at least two-thirds of the number of Trustees prior to such removal; (c) any Trustee who requests to be retired or who has become incapacitated by illness or injury may be retired by written instrument signed by a majority of the other Trustees; and (d) any Trustee may be removed at any special meeting of shareholders by a two-thirds vote of the outstanding voting securities of the trust. Each Trustee who is not an interested person (as defined in the 1940 Act) of the trust and the funds is referred to herein as an Independent Trustee. Each Independent Trustee shall retire not later than the last day of the calendar year in which his or her 75th birthday occurs. The Independent Trustees may waive this mandatory retirement age policy with respect to individual Trustees. Officers and Advisory Board Members hold office without limit in time, except that any officer or Advisory Board Member may resign or may be removed by a vote of a majority of the Trustees at any regular meeting or any special meeting of the Trustees. Except as indicated, each individual has held the office shown or other offices in the same company for the past five years.
The funds' Statement of Additional Information (SAI) includes more information about the Trustees. To request a free copy, call Fidelity at 1-800-544-8544 if you're an individual investing directly with Fidelity, call 1-800-835-5092 if you're a plan sponsor or participant with Fidelity as your recordkeeper or call 1-877-208-0098 on institutional accounts or if you're an advisor or invest through one.
Experience, Skills, Attributes, and Qualifications of the Trustees. The Governance and Nominating Committee has adopted a statement of policy that describes the experience, qualifications, attributes, and skills that are necessary and desirable for potential Independent Trustee candidates (Statement of Policy). The Board believes that each Trustee satisfied at the time he or she was initially elected or appointed a Trustee, and continues to satisfy, the standards contemplated by the Statement of Policy. The Governance and Nominating Committee also engages professional search firms to help identify potential Independent Trustee candidates who have the experience, qualifications, attributes, and skills consistent with the Statement of Policy. From time to time, additional criteria based on the composition and skills of the current Independent Trustees, as well as experience or skills that may be appropriate in light of future changes to board composition, business conditions, and regulatory or other developments, have also been considered by the professional search firms and the Governance and Nominating Committee. In addition, the Board takes into account the Trustees' commitment and participation in Board and committee meetings, as well as their leadership of standing and ad hoc committees throughout their tenure.
In determining that a particular Trustee was and continues to be qualified to serve as a Trustee, the Board has considered a variety of criteria, none of which, in isolation, was controlling. The Board believes that, collectively, the Trustees have balanced and diverse experience, qualifications, attributes, and skills, which allow the Board to operate effectively in governing each fund and protecting the interests of shareholders. Information about the specific experience, skills, attributes, and qualifications of each Trustee, which in each case led to the Board's conclusion that the Trustee should serve (or continue to serve) as a trustee of the funds, is provided below.
Board Structure and Oversight Function. Robert A. Lawrence is an interested person and currently serves as Chair. The Trustees have determined that an interested Chair is appropriate and benefits shareholders because an interested Chair has a personal and professional stake in the quality and continuity of services provided to the funds. Independent Trustees exercise their informed business judgment to appoint an individual of their choosing to serve as Chair, regardless of whether the Trustee happens to be independent or a member of management. The Independent Trustees have determined that they can act independently and effectively without having an Independent Trustee serve as Chair and that a key structural component for assuring that they are in a position to do so is for the Independent Trustees to constitute a substantial majority for the Board. The Independent Trustees also regularly meet in executive session. David M. Thomas serves as Lead Independent Trustee and as such (i) acts as a liaison between the Independent Trustees and management with respect to matters important to the Independent Trustees and (ii) with management prepares agendas for Board meetings.
Fidelity® funds are overseen by different Boards of Trustees. The funds' Board oversees Fidelity's high income and certain equity funds, and other Boards oversee Fidelity's alternative investment, investment-grade bond, money market, asset allocation, and other equity funds. The asset allocation funds may invest in Fidelity® funds overseen by the funds' Board. The use of separate Boards, each with its own committee structure, allows the Trustees of each group of Fidelity® funds to focus on the unique issues of the funds they oversee, including common research, investment, and operational issues. On occasion, the separate Boards establish joint committees to address issues of overlapping consequences for the Fidelity® funds overseen by each Board.
The Trustees operate using a system of committees to facilitate the timely and efficient consideration of all matters of importance to the Trustees, each fund, and fund shareholders and to facilitate compliance with legal and regulatory requirements and oversight of the funds' activities and associated risks. The Board, acting through its committees, has charged FMR and its affiliates with (i) identifying events or circumstances the occurrence of which could have demonstrably adverse effects on the funds' business and/or reputation; (ii) implementing processes and controls to lessen the possibility that such events or circumstances occur or to mitigate the effects of such events or circumstances if they do occur; and (iii) creating and maintaining a system designed to evaluate continuously business and market conditions in order to facilitate the identification and implementation processes described in (i) and (ii) above. Because the day-to-day operations and activities of the funds are carried out by or through FMR, its affiliates, and other service providers, the funds' exposure to risks is mitigated but not eliminated by the processes overseen by the Trustees. While each of the Board's committees has responsibility for overseeing different aspects of the funds' activities, oversight is exercised primarily through the Operations, Audit, and Compliance Committees. Appropriate personnel, including but not limited to the funds' Chief Compliance Officer (CCO), FMR's internal auditor, the independent accountants, the funds' Treasurer and portfolio management personnel, make periodic reports to the Board's committees, as appropriate, including an annual review of Fidelity's risk management program for the Fidelity® funds. The responsibilities of each standing committee, including their oversight responsibilities, are described further under "Standing Committees of the Trustees."
Interested Trustees*:
Correspondence intended for a Trustee who is an interested person may be sent to Fidelity Investments, 245 Summer Street, Boston, Massachusetts 02210.
Name, Year of Birth; Principal Occupations and Other Relevant Experience+
Jonathan Chiel (1957)
Year of Election or Appointment: 2016
Trustee
Mr. Chiel also serves as Trustee of other Fidelity® funds. Mr. Chiel is General Counsel (2012-present) and Head of Legal, Risk and Compliance (2022-present). Mr Chiel serves as Executive Vice President and General Counsel for FMR LLC (diversified financial services company, 2012-present) and Director and President for OH Company LLC (holding company, 2018-present). Previously, Mr. Chiel served as general counsel (2004-2012) and senior vice president and deputy general counsel (2000-2004) for John Hancock Financial Services; a partner with Choate, Hall & Stewart (1996-2000) (law firm); and an Assistant United States Attorney for the United States Attorney's Office of the District of Massachusetts (1986-95), including Chief of the Criminal Division (1993-1995). Mr. Chiel is a director on the boards of the Boston Bar Foundation and the Maimonides School.
Bettina Doulton (1964)
Year of Election or Appointment: 2021
Trustee
Ms. Doulton also serves as Trustee of other Fidelity® funds. Prior to her retirement, Ms. Doulton served in a variety of positions at Fidelity Investments, including as a managing director of research (2006-2007), portfolio manager to certain Fidelity® funds (1993-2005), equity analyst and portfolio assistant (1990-1993), and research assistant (1987-1990). Ms. Doulton currently owns and operates Phi Builders + Architects and Cellardoor Winery. Previously, Ms. Doulton served as a member of the Board of Brown Capital Management, LLC (2014-2018).
Robert A. Lawrence (1952)
Year of Election or Appointment: 2020
Trustee
Chair of the Board of Trustees
Mr. Lawrence also serves as Trustee of other funds. Previously, Mr. Lawrence served as a Trustee and Member of the Advisory Board of certain funds. Prior to his retirement in 2008, Mr. Lawrence served as Vice President of certain Fidelity® funds (2006-2008), Senior Vice President, Head of High Income Division of Fidelity Management & Research Company (investment adviser firm, 2006-2008), and President of Fidelity Strategic Investments (investment adviser firm, 2002-2005).
* Determined to be an "Interested Trustee" by virtue of, among other things, his or her affiliation with the trust or various entities under common control with FMR.
+ The information includes the Trustee's principal occupation during the last five years and other information relating to the experience, attributes, and skills relevant to the Trustee's qualifications to serve as a Trustee, which led to the conclusion that the Trustee should serve as a Trustee for each fund.
Independent Trustees:
Correspondence intended for an Independent Trustee may be sent to Fidelity Investments, P.O. Box 55235, Boston, Massachusetts 02205-5235.
Name, Year of Birth; Principal Occupations and Other Relevant Experience+
Thomas P. Bostick (1956)
Year of Election or Appointment: 2021
Trustee
Lieutenant General Bostick also serves as Trustee of other Fidelity® funds. Prior to his retirement, General Bostick (United States Army, Retired) held a variety of positions within the U.S. Army, including Commanding General and Chief of Engineers, U.S. Army Corps of Engineers (2012-2016) and Deputy Chief of Staff and Director of Human Resources, U.S. Army (2009-2012). General Bostick currently serves as a member of the Board and Finance and Governance & Sustainability Committees of CSX Corporation (transportation, 2020-present) and a member of the Board and Corporate Governance and Nominating Committee of Perma-Fix Environmental Services, Inc. (nuclear waste management, 2020-present). General Bostick serves as Chief Executive Officer of Bostick Global Strategies, LLC (consulting, 2016-present), as a member of the Board of HireVue, Inc. (video interview and assessment, 2020-present), as a member of the Board of Allonnia (biotechnology and engineering solutions, 2022-present) and on the Advisory Board of Solugen, Inc. (specialty bio-based chemicals manufacturer, 2022-present). Previously, General Bostick served as a Member of the Advisory Board of certain Fidelity® funds (2021), President, Intrexon Bioengineering (2018-2020) and Chief Operating Officer (2017-2020) and Senior Vice President of the Environment Sector (2016-2017) of Intrexon Corporation (biopharmaceutical company).
Dennis J. Dirks (1948)
Year of Election or Appointment: 2005
Trustee
Mr. Dirks also serves as Trustee of other Fidelity® funds. Prior to his retirement in May 2003, Mr. Dirks served as Chief Operating Officer and as a member of the Board of The Depository Trust & Clearing Corporation (financial markets infrastructure), President, Chief Operating Officer and a member of the Board of The Depository Trust Company (DTC), President and a member of the Board of the National Securities Clearing Corporation (NSCC), Chief Executive Officer and a member of the Board of the Government Securities Clearing Corporation and Chief Executive Officer and a member of the Board of the Mortgage-Backed Securities Clearing Corporation. Mr. Dirks currently serves as a member of the Finance Committee (2016-present) and Board (2017-present) and is Treasurer (2018-present) of the Asolo Repertory Theatre.
Donald F. Donahue (1950)
Year of Election or Appointment: 2018
Trustee
Mr. Donahue also serves as Trustee of other Fidelity® funds. Mr. Donahue serves as President and Chief Executive Officer of Miranda Partners, LLC (risk consulting for the financial services industry, 2012-present). Previously, Mr. Donahue served as Chief Executive Officer (2006-2012), Chief Operating Officer (2003-2006) and Managing Director, Customer Marketing and Development (1999-2003) of The Depository Trust & Clearing Corporation (financial markets infrastructure). Mr. Donahue currently serves as a member (2007-present) and Co-Chairman (2016-present) of the Board of United Way of New York. Mr. Donahue previously served as a member of the Advisory Board of certain Fidelity® funds (2015-2018) and as a member of the Board of The Leadership Academy (previously NYC Leadership Academy) (2012-2022).
Vicki L. Fuller (1957)
Year of Election or Appointment: 2020
Trustee
Ms. Fuller also serves as Trustee of other Fidelity® funds. Previously, Ms. Fuller served as a member of the Advisory Board of certain Fidelity® funds (2018-2020), Chief Investment Officer of the New York State Common Retirement Fund (2012-2018) and held a variety of positions at AllianceBernstein L.P. (global asset management, 1985-2012), including Managing Director (2006-2012) and Senior Vice President and Senior Portfolio Manager (2001-2006). Ms. Fuller currently serves as a member of the Board, Audit Committee and Nominating and Governance Committee of two Blackstone business development companies (2020-present), as a member of the Board of Treliant, LLC (consulting, 2019-present), as a member of the Board of Ariel Alternatives, LLC (private equity, 2022-present) and as a member of the Board and Chair of the Audit Committee of Gusto, Inc. (software, 2021-present). In addition, Ms. Fuller currently serves as a member of the Board of Roosevelt University (2019-present) and as a member of the Executive Board of New York University's Stern School of Business. Ms. Fuller previously served as a member of the Board, Audit Committee and Nominating and Governance Committee of The Williams Companies, Inc. (natural gas infrastructure, 2018-2021).
Patricia L. Kampling (1959)
Year of Election or Appointment: 2020
Trustee
Ms. Kampling also serves as Trustee of other Fidelity® funds. Prior to her retirement, Ms. Kampling served as Chairman of the Board and Chief Executive Officer (2012-2019), President and Chief Operating Officer (2011-2012) and Executive Vice President and Chief Financial Officer (2010-2011) of Alliant Energy Corporation. Ms. Kampling currently serves as a member of the Board, Finance Committee and Governance, Compensation and Nominating Committee of Xcel Energy Inc. (utilities company, 2020-present) and as a member of the Board, Audit, Finance and Risk Committee and Safety, Environmental, Technology and Operations Committee and Chair of the Executive Development and Compensation Committee of American Water Works Company, Inc. (utilities company, 2019-present). In addition, Ms. Kampling currently serves as a member of the Board of the Nature Conservancy, Wisconsin Chapter (2019-present). Previously, Ms. Kampling served as a Member of the Advisory Board of certain Fidelity® funds (2020), a member of the Board, Compensation Committee and Executive Committee and Chair of the Audit Committee of Briggs & Stratton Corporation (manufacturing, 2011-2021), a member of the Board of Interstate Power and Light Company (2012-2019) and Wisconsin Power and Light Company (2012-2019) (each a subsidiary of Alliant Energy Corporation) and as a member of the Board and Workforce Development Committee of the Business Roundtable (2018-2019).
Thomas A. Kennedy (1955)
Year of Election or Appointment: 2021
Trustee
Mr. Kennedy also serves as Trustee of other Fidelity® funds. Previously, Mr. Kennedy served as a Member of the Advisory Board of certain Fidelity® funds (2020) and held a variety of positions at Raytheon Company (aerospace and defense, 1983-2020), including Chairman and Chief Executive Officer (2014-2020) and Executive Vice President and Chief Operating Officer (2013-2014). Mr. Kennedy served as Executive Chairman of the Board of Directors of Raytheon Technologies Corporation (aerospace and defense, 2020-2021). Mr. Kennedy serves as a Director of the Board of Directors of Textron Inc. (aerospace and defense, 2023-present).
Oscar Munoz (1959)
Year of Election or Appointment: 2021
Trustee
Mr. Munoz also serves as Trustee of other Fidelity® funds. Prior to his retirement, Mr. Munoz served as Executive Chairman (2020-2021), Chief Executive Officer (2015-2020), President (2015-2016) and a member of the Board (2010-2021) of United Airlines Holdings, Inc. Mr. Munoz currently serves as a member of the Board of CBRE Group, Inc. (commercial real estate, 2020-present), a member of the Board of Univision Communications, Inc. (Hispanic media, 2020-present), a member of the Board of Archer Aviation Inc. (2021-present), a member of the Defense Business Board of the United States Department of Defense (2021-present) and a member of the Board of Salesforce.com, Inc. (cloud-based software, 2022-present). Previously, Mr. Munoz served as a Member of the Advisory Board of certain Fidelity® funds (2021).
David M. Thomas (1949)
Year of Election or Appointment: 2008
Trustee
Lead Independent Trustee
Mr. Thomas also serves as Trustee of other Fidelity® funds. Previously, Mr. Thomas served as Executive Chairman (2005-2006) and Chairman and Chief Executive Officer (2000-2005) of IMS Health, Inc. (pharmaceutical and healthcare information solutions). Mr. Thomas currently serves as a member of the Board of Fortune Brands Home and Security (home and security products, 2004-present) and as Director (2013-present) and Non-Executive Chairman of the Board (2022-present) of Interpublic Group of Companies, Inc. (marketing communication).
Susan Tomasky (1953)
Year of Election or Appointment: 2020
Trustee
Ms. Tomasky also serves as Trustee of other Fidelity® funds. Prior to her retirement, Ms. Tomasky served in various executive officer positions at American Electric Power Company, Inc. (1998-2011), including most recently as President of AEP Transmission (2007-2011). Ms. Tomasky currently serves as a member of the Board and Sustainability Committee and as Chair of the Audit Committee of Marathon Petroleum Corporation (2018-present) and as a member of the Board, Executive Committee, Corporate Governance Committee and Organization and Compensation Committee and as Lead Director of the Board of Public Service Enterprise Group, Inc. (utilities company, 2012-present) and as a member of the Board of its subsidiary company, Public Service Electric and Gas Co. (2021-present). In addition, Ms. Tomasky currently serves as a member (2009-present) and President (2020-present) of the Board of the Royal Shakespeare Company - America (2009-present), as a member of the Board of the Columbus Association for the Performing Arts (2011-present) and as a member of the Board and Kenyon in the World Committee of Kenyon College (2016-present). Previously, Ms. Tomasky served as a Member of the Advisory Board of certain Fidelity® funds (2020), as a member of the Board of the Columbus Regional Airport Authority (2007-2020), as a member of the Board (2011-2018) and Lead Independent Director (2015-2018) of Andeavor Corporation (previously Tesoro Corporation) (independent oil refiner and marketer) and as a member of the Board of Summit Midstream Partners LP (energy, 2012-2018).
Michael E. Wiley (1950)
Year of Election or Appointment: 2020
Trustee
Mr. Wiley also serves as Trustee of other Fidelity® funds. Previously, Mr. Wiley served as a member of the Advisory Board of certain Fidelity® funds (2018-2020), Chairman, President and CEO of Baker Hughes, Inc. (oilfield services, 2000-2004). Mr. Wiley also previously served as a member of the Board of Andeavor Corporation (independent oil refiner and marketer, 2005-2018), a member of the Board of Andeavor Logistics LP (natural resources logistics, 2015-2018) and a member of the Board of High Point Resources (exploration and production, 2005-2020).
+ The information includes the Trustee's principal occupation during the last five years and other information relating to the experience, attributes, and skills relevant to the Trustee's qualifications to serve as a Trustee, which led to the conclusion that the Trustee should serve as a Trustee for each fund.
Advisory Board Members and Officers:
Correspondence intended for a Member of the Advisory Board (if any) may be sent to Fidelity Investments, P.O. Box 55235, Boston, Massachusetts 02205-5235. Correspondence intended for an officer or Peter S. Lynch may be sent to Fidelity Investments, 245 Summer Street, Boston, Massachusetts 02210.
Name, Year of Birth; Principal Occupation
Vijay C. Advani (1960)
Year of Election or Appointment: 2023
Member of the Advisory Board
Mr. Advani also serves as Trustee or Member of the Advisory Board of other funds. Previously, Mr. Advani served as Executive Chairman (2020-2022), Chief Executive Officer (2017-2020) and Chief Operating Officer (2016-2017) of Nuveen (global investment manager). He also served in various capacities at Franklin Resources (global investment manager), including Co-President (2015-2016), Executive Vice President, Global Advisory Services (2008-2015), Head of Global Retail Distribution (2005-2008), Executive Managing Director, International Retail Development (2002-2005), Managing Director, Product Developments, Sales & Marketing, Asia, Eastern Europe and Africa (2000-2002) and President, Templeton Asset Management India (1995-2000). Mr. Advani also served as Senior Investment Officer of International Finance Corporation (private equity and venture capital arm of The World Bank, 1984-1995). Mr. Advani is Chairman Emeritus of the U.S. India Business Council (2018-present), a Director of The Global Impact Investing Network (2019-present), a Director of LOK Capital (Mauritius) (2022-present), a member of the Advisory Council of LOK Capital (2022-present), a Senior Advisor of Neuberger Berman (2021-present), a Senior Advisor of Seviora Holdings Pte. Ltd (Temasek-Singapore) (2021-present), a Director of Seviora Capital (Singapore) (2021-present) and an Advisor of EQUIAM (2021-present). Mr. Advani formerly served as a member of the Board of BowX Acquisition Corp. (special purpose acquisition company, 2020-2021), a member of the Board of Intellecap (advisory arm of The Aavishkaar Group, 2018-2020), a member of the Board of Nuveen Investments, Inc. (2017-2020) and a member of the Board of Docusign (software, 2016-2019).
Peter S. Lynch (1944)
Year of Election or Appointment: 2003
Member of the Advisory Board
Mr. Lynch also serves as a Member of the Advisory Board of other Fidelity® funds. Mr. Lynch is Vice Chairman and a Director of Fidelity Management & Research Company LLC (investment adviser firm). In addition, Mr. Lynch serves as a Trustee of Boston College and as the Chairman of the Inner-City Scholarship Fund. Previously, Mr. Lynch served as Vice Chairman and a Director of FMR Co., Inc. (investment adviser firm) and on the Special Olympics International Board of Directors (1997-2006).
Karen B. Peetz (1955)
Year of Election or Appointment: 2023
Member of the Advisory Board
Ms. Peetz also serves as a Member of the Advisory Board of other funds. Previously, Ms. Peetz served as Chief Administration Officer (2020-2023) of Citigroup Inc. (a diversified financial service company). She also served in various capacities at Bank of New York Mellon Corporation, including President (2013-2016), Vice Chairman, Senior Executive Vice President and Chief Executive Officer of Financial Markets & Treasury Services (2010-2013), Senior Executive Vice President and Chief Executive Officer of Global Corporate Trust (2003-2008), Senior Vice President and Division Manager of Global Payments & Trade Services (2002-2003) and Senior Vice President and Division Manager of Domestic Corporate Trust (1998-2002). Ms. Peetz also served in various capacities at Chase Manhattan Corporation (1982-1998), including Senior Vice President and Manager of Corporate Trust International Business (1996-1998), Managing Director and Manager of Corporate Trust Services (1994-1996) and Managing Director and Group Manager of Financial Institution Sales (1990-1993). Ms. Peetz currently serves as Chair of Amherst Holdings Advisory Council (2018-present), Trustee of Johns Hopkins University (2016-present), Chair of the Carey Business School Advisory Council, Member of the Johns Hopkins Medicine Board and Finance Committee and Chair of the Lyme and Tick Related Disease Institute Advisory Council. Ms. Peetz previously served as a member of the Board of Guardian Life Insurance Company of America (2019-2023), a member of the Board of Trane Technologies (2018-2022), a member of the Board of Wells Fargo Corp. (2017-2019), a member of the Board of SunCoke Energy Inc. (2012-2016), a member of the Board of Private Export Funding Corporation (2010-2016) and as a Trustee of Penn State University (2010-2014) and the United Way of New York City (2008-2010).
Heather Bonner (1977)
Year of Election or Appointment: 2023
Assistant Treasurer
Ms. Bonner also serves as an officer of other funds. Ms. Bonner is a Senior Vice President (2022-present) and is an employee of Fidelity Investments (2022-present). Ms. Bonner serves as Vice President, Treasurer, or Assistant Treasurer of certain Fidelity entities. Prior to joining Fidelity, Ms. Bonner served as Managing Director at AQR Capital Management (2013-2022) and was the Treasurer and Principal Financial Officer of the AQR Funds (2013-2022).
Craig S. Brown (1977)
Year of Election or Appointment: 2022
Deputy Treasurer
Mr. Brown also serves as an officer of other funds. Mr. Brown is a Vice President (2015-present) and is an employee of Fidelity Investments. Mr. Brown serves as Assistant Treasurer of FIMM, LLC (2021-present). Previously, Mr. Brown served as Assistant Treasurer of certain Fidelity® funds (2019-2022).
John J. Burke III (1964)
Year of Election or Appointment: 2018
Chief Financial Officer
Mr. Burke also serves as Chief Financial Officer of other funds. Mr. Burke is Head of Fidelity Fund and Investment Operations (2018-present) and is an employee of Fidelity Investments. Mr. Burke serves as President, Executive Vice President, or Director of certain Fidelity entities. Previously Mr. Burke served as head of Asset Management Investment Operations (2012-2018).
Margaret Carey (1973)
Year of Election or Appointment: 2023
Secretary and Chief Legal Officer (CLO)
Ms. Carey also serves as an officer of other funds and as CLO of certain Fidelity entities. Ms. Carey is a Senior Vice President, Deputy General Counsel (2019-present) and is an employee of Fidelity Investments.
William C. Coffey (1969)
Year of Election or Appointment: 2019
Assistant Secretary
Mr. Coffey also serves as Assistant Secretary of other funds. Mr. Coffey is a Senior Vice President, Deputy General Counsel (2010-present) and is an employee of Fidelity Investments. Previously, Mr. Coffey served as Secretary and CLO of certain funds (2018-2019); CLO, Secretary, or Senior Vice President of certain Fidelity entities and Assistant Secretary of certain funds (2009-2018).
Timothy M. Cohen (1969)
Year of Election or Appointment: 2018
Vice President
Mr. Cohen also serves as Vice President of other funds. Mr. Cohen is Co-Head of Equity (2018-present) and is an employee of Fidelity Investments. Mr. Cohen serves a Director of Fidelity Management & Research (Japan) Limited (investment adviser firm, 2016-present). Previously, Mr. Cohen served as Executive Vice President of Fidelity SelectCo, LLC (2019) and Head of Global Equity Research (2016-2018).
Jonathan Davis (1968)
Year of Election or Appointment: 2010
Assistant Treasurer
Mr. Davis also serves as an officer of other funds. Mr. Davis is a Vice President (2006-present) and is an employee of Fidelity Investments. Mr. Davis serves as Assistant Treasurer of certain Fidelity entities.
Laura M. Del Prato (1964)
Year of Election or Appointment: 2018
Assistant Treasurer
Ms. Del Prato also serves as an officer of other funds. Ms. Del Prato is a Senior Vice President (2017-present) and is an employee of Fidelity Investments. Ms. Del Prato serves as Vice President or Assistant Treasurer of certain Fidelity entities. Previously, Ms. Del Prato served as President and Treasurer of The North Carolina Capital Management Trust: Cash Portfolio and Term Portfolio (2018-2020).
Colm A. Hogan (1973)
Year of Election or Appointment: 2020
Assistant Treasurer
Mr. Hogan also serves as an officer of other funds. Mr. Hogan is a Vice President (2016-present) and is an employee of Fidelity Investments. Mr. Hogan serves as Assistant Treasurer of certain Fidelity entities. Previously, Mr. Hogan served as Deputy Treasurer of certain Fidelity® funds (2016-2020) and Assistant Treasurer of certain Fidelity® funds (2016-2018).
Pamela R. Holding (1964)
Year of Election or Appointment: 2018
Vice President
Ms. Holding also serves as Vice President of other funds. Ms. Holding is Co-Head of Equity (2018-present) and is an employee of Fidelity Investments. Previously, Ms. Holding served as Executive Vice President of Fidelity SelectCo, LLC (2019) and as Chief Investment Officer of Fidelity Institutional Asset Management (2013-2018).
Chris Maher (1972)
Year of Election or Appointment: 2020
Deputy Treasurer
Mr. Maher also serves as an officer of other funds. Mr. Maher is a Vice President (2008-present) and is an employee of Fidelity Investments. Mr. Maher serves as Assistant Treasurer of certain Fidelity entities. Previously, Mr. Maher served as Assistant Treasurer of certain funds (2013-2020).
Jason P. Pogorelec (1975)
Year of Election or Appointment: 2020
Chief Compliance Officer
Mr. Pogorelec also serves as Chief Compliance Officer of other funds. Mr. Pogorelec is a Senior Vice President of Asset Management Compliance (2020-present) and is an employee of Fidelity Investments. Mr. Pogorelec serves as Compliance Officer of Fidelity Management & Research Company LLC (investment adviser firm, 2023-present) and Ballyrock Investment Advisors LLC (2023-present). Previously, Mr. Pogorelec served as a Vice President, Associate General Counsel for Fidelity Investments (2010-2020) and Assistant Secretary of certain Fidelity® funds (2015-2020).
Brett Segaloff (1972)
Year of Election or Appointment: 2021
Anti-Money Laundering (AML) Officer
Mr. Segaloff also serves as AML Officer of other funds. Mr. Segaloff is a Vice President (2022-present) and is an employee of Fidelity Investments. Mr. Segaloff serves as Anti Money Laundering Compliance Officer or Anti Money Laundering/Bank Secrecy Act Compliance Officer of certain Fidelity entities.
Stacie M. Smith (1974)
Year of Election or Appointment: 2016
President and Treasurer
Ms. Smith also serves as an officer of other funds. Ms. Smith is a Senior Vice President (2016-present) and is an employee of Fidelity Investments. Ms. Smith serves as Assistant Treasurer of certain Fidelity entities and has served in other fund officer roles.
Jim Wegmann (1979)
Year of Election or Appointment: 2019
Assistant Treasurer
Mr. Wegmann also serves as an officer of other funds. Mr. Wegmann is a Vice President (2016-present) and is an employee of Fidelity Investments. Mr. Wegmann serves as Assistant Treasurer of FIMM, LLC (2021-present). Previously, Mr. Wegmann served as Assistant Treasurer of certain Fidelity® funds (2019-2021).
As a shareholder, you incur two types of costs: (1) transaction costs, which may include sales charges (loads) on purchase payments or redemption proceeds, as applicable and (2) ongoing costs, which generally include management fees, distribution and/or service (12b-1) fees and other Fund expenses. This Example is intended to help you understand your ongoing costs (in dollars) of investing in a fund and to compare these costs with the ongoing costs of investing in other mutual funds.
| The Example is based on an investment of $1,000 invested at the beginning of the period and held for the entire period (May 1, 2023 to October 31, 2023). |
Actual Expenses
The first line of the accompanying table provides information about actual account values and actual expenses. You may use the information in this line, together with the amount you invested, to estimate the expenses that you paid over the period. Simply divide your account value by $1,000.00 (for example, an $8,600 account value divided by $1,000.00 = 8.6), then multiply the result by the number in the first line for a class/Fund under the heading entitled "Expenses Paid During Period" to estimate the expenses you paid on your account during this period. If any fund is a shareholder of any underlying mutual funds or exchange-traded funds (ETFs) (the Underlying Funds), such fund indirectly bears its proportional share of the expenses of the Underlying Funds in addition to the direct expenses incurred presented in the table. These fees and expenses are not included in the annualized expense ratio used to calculate the expense estimate in the table below.
Hypothetical Example for Comparison Purposes
The second line of the accompanying table provides information about hypothetical account values and hypothetical expenses based on the actual expense ratio and an assumed rate of return of 5% per year before expenses, which is not the actual return. The hypothetical account values and expenses may not be used to estimate the actual ending account balance or expenses you paid for the period. You may use this information to compare the ongoing costs of investing in the Fund and other funds. To do so, compare this 5% hypothetical example with the 5% hypothetical examples that appear in the shareholder reports of the other funds. If any fund is a shareholder of any Underlying Funds, such fund indirectly bears its proportional share of the expenses of the Underlying Funds in addition to the direct expenses as presented in the table. These fees and expenses are not included in the annualized expense ratio used to calculate the expense estimate in the table below.
Please note that the expenses shown in the table are meant to highlight your ongoing costs only and do not reflect any transaction costs. Therefore, the second line of the table is useful in comparing ongoing costs only, and will not help you determine the relative total costs of owning different funds. In addition, if these transactional costs were included, your costs would have been higher.
| | | | | Annualized Expense Ratio- A | | Beginning Account Value May 1, 2023 | | Ending Account Value October 31, 2023 | | Expenses Paid During Period- C May 1, 2023 to October 31, 2023 |
| Fidelity® Emerging Markets Discovery Fund | | | | | | | | | | |
| Class A | | | | 1.42% | | | | | | |
| Actual | | | | | | $ 1,000 | | $ 987.20 | | $ 7.11 |
Hypothetical-B | | | | | | $ 1,000 | | $ 1,018.05 | | $ 7.22 |
| Class M | | | | 1.68% | | | | | | |
| Actual | | | | | | $ 1,000 | | $ 985.90 | | $ 8.41 |
Hypothetical-B | | | | | | $ 1,000 | | $ 1,016.74 | | $ 8.54 |
| Class C | | | | 2.19% | | | | | | |
| Actual | | | | | | $ 1,000 | | $ 983.40 | | $ 10.95 |
Hypothetical-B | | | | | | $ 1,000 | | $ 1,014.17 | | $ 11.12 |
| Fidelity® Emerging Markets Discovery Fund | | | | 1.15% | | | | | | |
| Actual | | | | | | $ 1,000 | | $ 988.60 | | $ 5.76 |
Hypothetical-B | | | | | | $ 1,000 | | $ 1,019.41 | | $ 5.85 |
| Class I | | | | 1.12% | | | | | | |
| Actual | | | | | | $ 1,000 | | $ 988.70 | | $ 5.61 |
Hypothetical-B | | | | | | $ 1,000 | | $ 1,019.56 | | $ 5.70 |
| Class Z | | | | .99% | | | | | | |
| Actual | | | | | | $ 1,000 | | $ 989.30 | | $ 4.96 |
Hypothetical-B | | | | | | $ 1,000 | | $ 1,020.21 | | $ 5.04 |
| Fidelity® Total Emerging Markets Fund | | | | | | | | | | |
| Class A | | | | 1.45% | | | | | | |
| Actual | | | | | | $ 1,000 | | $ 977.10 | | $ 7.23 |
Hypothetical-B | | | | | | $ 1,000 | | $ 1,017.90 | | $ 7.38 |
| Class M | | | | 1.74% | | | | | | |
| Actual | | | | | | $ 1,000 | | $ 975.30 | | $ 8.66 |
Hypothetical-B | | | | | | $ 1,000 | | $ 1,016.43 | | $ 8.84 |
| Class C | | | | 2.19% | | | | | | |
| Actual | | | | | | $ 1,000 | | $ 973.40 | | $ 10.89 |
Hypothetical-B | | | | | | $ 1,000 | | $ 1,014.17 | | $ 11.12 |
| Fidelity® Total Emerging Markets Fund | | | | 1.20% | | | | | | |
| Actual | | | | | | $ 1,000 | | $ 978.00 | | $ 5.98 |
Hypothetical-B | | | | | | $ 1,000 | | $ 1,019.16 | | $ 6.11 |
| Class I | | | | 1.16% | | | | | | |
| Actual | | | | | | $ 1,000 | | $ 978.80 | | $ 5.79 |
Hypothetical-B | | | | | | $ 1,000 | | $ 1,019.36 | | $ 5.90 |
| Class Z | | | | 1.03% | | | | | | |
| Actual | | | | | | $ 1,000 | | $ 978.80 | | $ 5.14 |
Hypothetical-B | | | | | | $ 1,000 | | $ 1,020.01 | | $ 5.24 |
| |
A Annualized expense ratio reflects expenses net of applicable fee waivers.
B 5% return per year before expenses
C Expenses are equal to the annualized expense ratio, multiplied by the average account value over the period, multiplied by 184/ 365 (to reflect the one-half year period). The fees and expenses of any Underlying Funds are not included in each annualized expense ratio.
The dividend and capital gains distributions for the fund(s) are available on Fidelity.com or Institutional.Fidelity.com.
The funds hereby designate the amounts noted below as distributions paid during the fiscal year ended 2023 as qualifying to be taxed as section 163(j) interest dividends:
| Fidelity Emerging Markets Discovery Fund | $179,038 |
| Fidelity Total Emerging Markets Fund | $2,925,102 |
A percentage of the dividends distributed during the fiscal year for the following funds may be taken into account as a dividend for purposes of the maximum rate under section 1(h)(11) of the Internal Revenue Code.
| | Class A | Class M | Class C | Retail | Class I | Class Z |
| Fidelity Emerging Markets Discovery Fund | | | | | | |
| December 09, 2022 | 96.87% | 100.00% | 100.00% | 83.51% | 79.67% | 77.38% |
| December 28, 2022 | 89.79% | 89.79% | 89.79% | 89.79% | 89.79% | 89.79% |
| Fidelity Total Emerging Markets Fund | | | | | | |
| December 2022 | 57.06% | 62.94% | 82.53% | 53.72% | 52.46% | 50.48% |
The amounts per share which represent income derived from sources within, and taxes paid to, foreign countries or possessions of the United States are as follows:
| | Pay Date | Income | Taxes |
| Fidelity Emerging Markets Discovery Fund | | | |
| Class A | 12/12/2022 | $0.2490 | $0.0602 |
| Class A | 12/29/2022 | $0.0000 | $0.0000 |
| Class M | 12/12/2022 | $0.2062 | $0.0602 |
| Class M | 12/29/2022 | $0.0000 | $0.0000 |
| Class C | 12/12/2022 | $0.1316 | $0.0602 |
| Class C | 12/29/2022 | $0.0000 | $0.0000 |
| Emerging Markets Discovery | 12/12/2022 | $0.2888 | $0.0602 |
| Emerging Markets Discovery | 12/29/2022 | $0.0000 | $0.0000 |
| Class I | 12/12/2022 | $0.3028 | $0.0602 |
| Class I | 12/29/2022 | $0.0000 | $0.0000 |
| Class Z | 12/12/2022 | $0.3117 | $0.0602 |
| Class Z | 12/29/2022 | $0.0000 | $0.0000 |
| Fidelity Total Emerging Markets Fund | | | |
| Class A | 12/12/2022 | $0.3532 | $0.0642 |
| Class M | 12/12/2022 | $0.3202 | $0.0642 |
| Class C | 12/12/2022 | $0.2442 | $0.0642 |
| Total Emerging Markets | 12/12/2022 | $0.3752 | $0.0642 |
| Class I | 12/12/2022 | $0.3842 | $0.0642 |
| Class Z | 12/12/2022 | $0.3992 | $0.0642 |
The funds will notify shareholders in January 2024 of amounts for use in preparing 2023 income tax returns.
Board Approval of Investment Advisory Contracts and Management Fees
Fidelity Emerging Markets Discovery Fund
Fidelity Total Emerging Markets Fund
Each year, the Board of Trustees, including the Independent Trustees (together, the Board), considers the renewal of each fund's management contract with Fidelity Management & Research Company LLC (FMR) and the sub-advisory agreements (together, the Advisory Contracts) for each fund. FMR and the sub-advisers are referred to herein as the Investment Advisers. The Board, assisted by the advice of fund counsel and Independent Trustees' counsel, requests and considers a broad range of information relevant to the renewal of the Advisory Contracts throughout the year.
The Board meets regularly and, at each of its meetings, covers an extensive agenda of topics and materials and considers factors that are relevant to its annual consideration of the renewal of each fund's Advisory Contracts, including the services and support provided to each fund and its shareholders. The Board, acting directly and through its Committees (each of which is composed of and chaired by Independent Trustees), requests and receives information concerning the annual consideration of the renewal of each fund's Advisory Contracts. The Board also meets as needed to review matters specifically related to the Board's annual consideration of the renewal of the Advisory Contracts. Members of the Board may also meet with trustees of other Fidelity funds through joint ad hoc committees to discuss certain matters relevant to all of the Fidelity funds.
Approval of Stub Period Continuation. At its May 2023 meeting, the Board of Trustees voted to continue each fund's management contract with FMR, and the sub-advisory agreements and sub-sub-advisory agreements, in each case, where applicable (together, the Advisory Contracts), without modification, for two months from June 1, 2023 through July 31, 2023. The Board considered that the approval of each fund's Advisory Contracts will not result in any changes in (i) the investment process or strategies employed in the management of each fund's assets; (ii) the fees and expenses paid by shareholders; (iii) the nature, extent or quality of services provided under each fund's Advisory Contracts; or (iv) the day-to-day management of each fund or the persons primarily responsible for such management. The Board also considered that since its last approval of each fund's Advisory Contracts, FMR had provided additional information on each fund in support of the annual contract renewal process, including competitive analyses on total expenses and management fees and in-depth reviews of fund performance and fund profitability information. The Board concluded that each fund's Advisory Contracts are fair and reasonable, and that each fund's Advisory Contracts should be renewed, without modification, through July 31, 2023, with the understanding that the Board would consider the annual renewal for a full one year period in July 2023.
At its July 2023 meeting, the Board unanimously determined to renew each fund's Advisory Contracts. In reaching its determination, the Board considered all factors it believed relevant, including (i) the nature, extent, and quality of the services provided to each fund and its shareholders (including the investment performance of each fund); (ii) the competitiveness relative to peer funds of each fund's management fee and the total expense ratio of a representative class (the retail class, which was selected because it was the largest class without 12b-1 fees) of each fund; (iii) the total costs of the services provided by and the profits realized by FMR and its affiliates (Fidelity) from its relationships with each fund; and (iv) the extent to which, if any, economies of scale exist and are realized as each fund grows, and whether any economies of scale are appropriately shared with fund shareholders. The Board also considered the broad range of investment choices available to shareholders from FMR's competitors and that each fund's shareholders have chosen to invest in the fund, which is part of the Fidelity family of funds. The Board's decision to renew the Advisory Contracts was not based on any single factor.
The Board reached a determination, with the assistance of fund counsel and Independent Trustees' counsel and through the exercise of its business judgment, that the renewal of the Advisory Contracts was in the best interests of each fund and its shareholders and that the compensation payable under the Advisory Contracts was fair and reasonable in light of all of the surrounding circumstances.
Nature, Extent, and Quality of Services Provided. The Board considered staffing as it relates to the funds, including the backgrounds and experience of investment personnel of the Investment Advisers, and also considered the Investment Advisers' implementation of each fund's investment program. The Independent Trustees also had discussions with senior management of Fidelity's investment operations and investment groups. The Board considered the structure of the investment personnel compensation program and whether this structure provides appropriate incentives to act in the best interests of each fund. Additionally, the Board considered the portfolio managers' investments, if any, in the funds that they manage.
Resources Dedicated to Investment Management and Support Services. The Board and the Fund Oversight and Research Committees reviewed the general qualifications and capabilities of Fidelity's investment staff, including its size, education, experience, and resources, as well as Fidelity's approach to recruiting, training, managing, and compensating investment personnel. The Board noted the resources devoted to expansion of Fidelity's global investment organization, and that Fidelity's analysts have extensive resources, tools, and capabilities that allow them to conduct sophisticated quantitative and fundamental analysis, as well as credit analysis of issuers, counterparties, and guarantors. Further, the Board considered that Fidelity's investment professionals have sufficient access to global information and data so as to provide competitive investment results over time, and that those professionals also have access to sophisticated tools that permit them to assess portfolio construction and risk and performance attribution characteristics continuously, as well as to transmit new information and research conclusions rapidly around the world. Additionally, in its deliberations, the Board considered Fidelity's trading, risk management, compliance, and technology and operations capabilities and resources, which are integral parts of the investment management process.
Shareholder and Administrative Services. The Board considered (i) the nature, extent, quality, and cost of advisory, administrative, and shareholder services performed by the Investment Advisers and their affiliates under the Advisory Contracts and under separate agreements covering transfer agency, pricing and bookkeeping, and securities lending services for each fund; (ii) the nature and extent of Fidelity's supervision of third party service providers, principally custodians, subcustodians, and pricing vendors; and (iii) the resources devoted by Fidelity to, and the record of compliance with, each fund's compliance policies and procedures. The Board also reviewed the allocation of fund brokerage, including allocations to brokers affiliated with the Investment Advisers, the use of brokerage commissions to pay fund expenses, and the use of "soft" commission dollars to pay for research services. The Board also considered each fund's securities lending activities and any payments made to Fidelity relating to securities lending.
The Board noted that the growth of fund assets over time across the complex allows Fidelity to reinvest in the development of services designed to enhance the value and convenience of the Fidelity funds as investment vehicles. These services include 24-hour access to account information and market information over the Internet and through telephone representatives, investor education materials, and asset allocation tools. The Board also considered that it reviews customer service metrics such as telephone response times, continuity of services on the website and metrics addressing services at Fidelity Investor Centers.
Investment in a Large Fund Family. The Board considered the benefits to shareholders of investing in a fund that is part of a large family of funds offering a variety of investment disciplines and providing a large variety of fund investor services. The Board noted that Fidelity had taken, or had made recommendations that resulted in the Fidelity funds taking, a number of actions over the previous year that benefited particular funds and/or the Fidelity funds in general.
Investment Performance. The Board took into account discussions that occur with representatives of the Investment Advisers, and reports that it receives, at Board meetings throughout the year, relating to fund investment performance. In this regard the Board noted that as part of regularly scheduled fund reviews and other reports to the Board on fund performance, the Board considered annualized return information for each fund for different time periods, measured against an appropriate securities market index (benchmark index) and an appropriate peer group of funds with similar objectives (peer group), as applicable. The Board also considered information about performance attribution. In its ongoing evaluation of fund investment performance, the Board gives particular attention to information indicating changes in performance of the funds over different time periods and discussed with the Investment Advisers the reasons for any overperformance or underperformance. The Fidelity Total Emerging Markets Fund underperformed its benchmark for the one-, three- and five-year periods ended February 28, 2023, and as a result, the Board continues to engage in discussions with FMR about the steps it is taking to address the fund's performance.
In addition to reviewing absolute and relative fund performance, the Independent Trustees periodically consider the appropriateness of fund performance metrics in evaluating the results achieved. The Independent Trustees generally give greater weight to fund performance over longer time periods than over shorter time periods. Depending on the circumstances, the Independent Trustees may be satisfied with a fund's performance notwithstanding that it lags its benchmark index or peer group for certain periods.
Based on its review, the Board concluded that the nature, extent, and quality of services provided to each fund under the Advisory Contracts should continue to benefit the shareholders of each fund.
Competitiveness of Management Fee and Total Expense Ratio. The Board was provided with information regarding industry trends in management fees and expenses. In its review of each fund's management fee and total expense ratio of the retail class, the Board considered each fund's management fee rate as well as other fund or class expenses, such as transfer agent fees, pricing and bookkeeping fees, fund-paid 12b-1 fees and custodial, legal, and audit fees. The Board noted that Fidelity may agree to waive fees or reimburse expenses from time to time, and the extent to which, if any, it has done so for each fund.
Comparisons of Management Fees and Total Expense Ratios. Among other things, the Board reviewed data for selected groups of competitive funds and classes (referred to as "mapped groups") that were compiled by Fidelity based on combining similar investment objective categories (as classified by Lipper) that have comparable investment mandates. The data reviewed by the Board included (i) gross management fee comparisons (before taking into account expense reimbursements or caps ) relative to the total universe of funds within the mapped group; (ii) gross management fee comparisons relative to a subset of non-Fidelity funds in the mapped group that are similar in size and management fee structure to each fund (referred to as the "asset size peer group"); (iii) total expense comparisons of the retail class of each fund relative to funds and classes in the mapped group that have a similar sales load structure of each fund or representative class, as applicable (referred to as the "similar sales load structure group"); and (iv) total expense comparisons of the retail class of each fund relative to funds and classes in the similar sales load structure group that are similar in size and management fee structure to the fund or class, as applicable (referred to as the "total expense asset size peer group). The total expense asset size peer group comparison excludes performance adjustments and fund-paid 12b-1 fees to eliminate variability in fee structures.
The information provided to the Board indicated that each fund's management fee rate ranked below the competitive median of the mapped group for the 12-month period ended September 30, 2022 and below the competitive median of the asset size peer group for the 12-month period ended September 30, 2022. Further, the information provided to the Board indicated that the total expense ratio of the retail class of each fund ranked below the competitive median of the similar sales load structure group for the 12-month period ended September 30, 2022 and below the competitive median of the total expense asset size peer group for the 12-month period ended September 30, 2022.
The Board also considered that, for funds subject to the group fee, FMR agreed to voluntarily waive fees over a specified period of time in amounts designed to account for assets converted from certain funds to certain collective investment trusts.
Other Contractual Arrangements. The Board further considered that FMR has contractually agreed to reimburse Class A, Class M, Class C, Class I, Class Z, and the retail class of Fidelity Emerging Markets Discovery Fund to the extent that total operating expenses, with certain exceptions, as a percentage of their respective average net assets, exceed 1.60%, 1.85%, 2.35%, 1.35%, 1.20%, and 1.35% through February 29, 2024.
The Board further considered that FMR has contractually agreed to reimburse Class A, Class M, Class C, Class I, Class Z, and the retail class of Fidelity Total Emerging Markets Fund to the extent that total operating expenses, with certain exceptions, as a percentage of their respective average net assets, exceed 1.55%, 1.80%, 2.30%, 1.30%, 1.15%, and 1.30% through February 29, 2024.
Fees Charged to Other Fidelity Clients. The Board also considered Fidelity fee structures and other information with respect to clients of Fidelity, such as other funds advised or subadvised by Fidelity, pension plan clients, and other institutional clients with similar mandates. The Board noted that a joint ad hoc committee created by it and the boards of other Fidelity funds periodically reviews and compares Fidelity's institutional investment advisory business with its business of providing services to the Fidelity funds and also noted the most recent findings of the committee. The Board noted that the committee's review included a consideration of the differences in services provided, fees charged, and costs incurred, as well as competition in the markets serving the different categories of clients.
Based on its review, the Board concluded that each fund's management fee is fair and reasonable in light of the services that each fund receives and the other factors considered. Further, based on its review of total expense ratios and fees charged to other Fidelity clients, the Board concluded that the total expense ratio of each class of each fund was reasonable in light of the services that the fund and its shareholders receive and the other factors considered.
Costs of the Services and Profitability. The Board considered the revenues earned and the expenses incurred by Fidelity in conducting the business of developing, marketing, distributing, managing, administering and servicing each fund and servicing each fund's shareholders. The Board also considered the level of Fidelity's profits in respect of all the Fidelity funds.
On an annual basis, Fidelity presents to the Board information about the profitability of its relationships with each fund. Fidelity calculates profitability information for each fund, as well as aggregate profitability information for groups of Fidelity funds and all Fidelity funds, using a series of detailed revenue and cost allocation methodologies which originate with the books and records of Fidelity on which Fidelity's audited financial statements are based. The Audit Committee of the Board reviews any significant changes from the prior year's methodologies and the full Board approves such changes.
A public accounting firm has been engaged annually by the Board as part of the Board's assessment of Fidelity's profitability analysis. The engagement includes the review and assessment of the methodologies used by Fidelity in determining the revenues and expenses attributable to Fidelity's fund business, and completion of agreed-upon procedures in respect of the mathematical accuracy of certain fund profitability information and its conformity to established allocation methodologies. After considering the reports issued under the engagement and information provided by Fidelity, the Board concluded that while other allocation methods may also be reasonable, Fidelity's profitability methodologies are reasonable in all material respects.
The Board also reviewed Fidelity's non-fund businesses and potential indirect benefits such businesses may have received as a result of their association with Fidelity's fund business (i.e., fall-out benefits) as well as cases where Fidelity's affiliates may benefit from the funds' business. The Board considered areas where potential indirect benefits to the Fidelity funds from their relationships with Fidelity may exist. The Board's consideration of these matters was informed by the findings of a joint ad hoc committee created by it and the boards of other Fidelity funds to evaluate potential fall-out benefits.
The Board considered the costs of the services provided by and the profits realized by Fidelity in connection with the operation of each fund and was satisfied that the profitability was not excessive.
Economies of Scale. The Board considered whether there have been economies of scale in respect of the management of the Fidelity funds, whether the Fidelity funds (including each fund) have appropriately benefited from any such economies of scale, and whether there is potential for realization of any further economies of scale. The Board considered the extent to which each fund will benefit from economies of scale as assets grow through increased services to the fund, through waivers or reimbursements, or through fee or expense ratio reductions. The Board also noted that a committee (the Economies of Scale Committee) created by it and the boards of other Fidelity funds periodically analyzes whether Fidelity attains economies of scale in respect of the management and servicing of the Fidelity funds, whether the Fidelity funds have appropriately benefited from such economies of scale, and whether there is potential for realization of any further economies of scale.
The Board recognized that each fund's management contract incorporates a "group fee" structure, which provides for lower group fee rates as total "group assets" increase, and for higher group fee rates as total "group assets" decrease ("group assets" as defined in the management contracts). FMR calculates the group fee rates based on a tiered asset "breakpoint" schedule that varies based on asset class. The Board considered that the group fee is designed to deliver the benefits of economies of scale to fund shareholders when total Fidelity fund assets increase, even if assets of any particular fund are unchanged or have declined, because some portion of Fidelity's costs are attributable to services provided to all Fidelity funds, and all funds benefit if those costs can be allocated among more assets. The Board further considered that Fidelity agreed to impose a temporary fee waiver in the form of additional breakpoints to the current breakpoint schedule. The Board concluded that, given the group fee structure, fund shareholders will benefit from lower management fees as "group assets" increase at the fund complex level, regardless of whether Fidelity achieves any such economies of scale.
The Board concluded, taking into account the analysis of the Economies of Scale Committee, that economies of scale, if any, are being appropriately shared between fund shareholders and Fidelity.
Additional Information Requested by the Board. In order to develop fully the factual basis for consideration of the Fidelity funds' advisory contracts, the Board requested and received additional information on certain topics, including: (i) fund flow and performance trends, in particular the underperformance of certain funds and strategies, and Fidelity's long-term strategies for certain funds, including any consideration of fund liquidations or mergers; (ii) the operation of performance fees and competitor use of performance fees; (iii) Fidelity's pricing philosophy compared to competitors; (iv) fund profitability methodology and data; (v) evaluation of competitive fund data and peer group classifications and fee and expense comparisons; (vi) the management fee and expense structures for different funds and classes and information about the differences between various fee and expense structures; (vii) group fee breakpoints and related voluntary fee waivers; and (viii) information regarding other accounts managed by Fidelity and the funds' sub-advisory arrangements.
Conclusion. Based on its evaluation of all of the conclusions noted above, and after considering all factors it believed relevant, the Board, including the Independent Trustees, concluded that the advisory and sub-advisory fee arrangements are fair and reasonable in light of all of the surrounding circumstances, and that each fund's Advisory Contracts should be renewed through July 31, 2024.
1.931237.111
EMD-TEK-ANN-1223
Fidelity® Sustainable Emerging Markets Equity Fund
Annual Report
October 31, 2023
Includes Fidelity and Fidelity Advisor share classes
Contents
To view a fund's proxy voting guidelines and proxy voting record for the 12-month period ended June 30, visit http://www.fidelity.com/proxyvotingresults or visit the Securities and Exchange Commission's (SEC) web site at http://www.sec.gov.
You may also call 1-800-544-8544 if you're an individual investing directly with Fidelity, call 1-800-835-5092 if you're a plan sponsor or participant with Fidelity as your recordkeeper or call 1-877-208-0098 on institutional accounts or if you're an advisor or invest through one to request a free copy of the proxy voting guidelines.
Standard & Poor's, S&P and S&P 500 are registered service marks of The McGraw-Hill Companies, Inc. and have been licensed for use by Fidelity Distributors Corporation.
Other third-party marks appearing herein are the property of their respective owners.
All other marks appearing herein are registered or unregistered trademarks or service marks of FMR LLC or an affiliated company. © 2023 FMR LLC. All rights reserved.
This report and the financial statements contained herein are submitted for the general information of the shareholders of the Fund. This report is not authorized for distribution to prospective investors in the Fund unless preceded or accompanied by an effective prospectus.
A fund files its complete schedule of portfolio holdings with the SEC for the first and third quarters of each fiscal year on Form N-PORT. Forms N-PORT are available on the SEC's web site at http://www.sec.gov. A fund's Forms N-PORT may be reviewed and copied at the SEC's Public Reference Room in Washington, DC. Information regarding the operation of the SEC's Public Reference Room may be obtained by calling 1-800-SEC-0330.
For a complete list of a fund's portfolio holdings, view the most recent holdings listing, semiannual report, or annual report on Fidelity's web site at http://www.fidelity.com, http://www.institutional.fidelity.com, or http://www.401k.com, as applicable.
NOT FDIC INSURED •MAY LOSE VALUE •NO BANK GUARANTEE
Neither the Fund nor Fidelity Distributors Corporation is a bank.
Average annual total return reflects the change in the value of an investment, assuming reinvestment of distributions from dividend income and capital gains (the profits earned upon the sale of securities that have grown in value, if any) and assuming a constant rate of performance each year. The hypothetical investment and the average annual total returns do not reflect the deduction of taxes that a shareholder would pay on fund distributions or the redemption of fund shares. During periods of reimbursement by Fidelity, a fund's total return will be greater than it would be had the reimbursement not occurred. How a fund did yesterday is no guarantee of how it will do tomorrow.
| Average Annual Total Returns |
| | | | |
Periods ended October 31, 2023 | Past 1 year | Life of Fund A |
Class A (incl. 5.75% sales charge) | 6.44% | -18.91% |
Class M (incl. 3.50% sales charge) | 8.71% | -17.99% |
Class C (incl. contingent deferred sales charge) | 10.96% | -16.72% |
| Fidelity® Sustainable Emerging Markets Equity Fund | 13.11% | -15.85% |
| Class I | 13.11% | -15.85% |
| Class Z | 13.42% | -15.72% |
A From February 10, 2022
Class C shares' contingent deferred sales charges included in the past one year and life of fund total return figures are 1% and 0%, respectively.
| $10,000 Over Life of Fund |
| |
Let's say hypothetically that $10,000 was invested in Fidelity® Sustainable Emerging Markets Equity Fund, a class of the fund, on February 10, 2022, when the fund started. The chart shows how the value of your investment would have changed, and also shows how the MSCI Emerging Markets Index performed over the same period. |
|
|
Market Recap:
International (non-U.S.) equities gained 12.27% for the 12 months ending October 31, 2023, according to the MSCI ACWI (All Country World Index) ex USA Index, as global economic expansion and a slowing in the pace of inflation in some markets provided a favorable backdrop for risk assets. After returning -15.86% in 2022, the index's upturn has been largely driven by a narrow set of companies in the information technology and communication services sectors, in part due to excitement for generative artificial intelligence applications. The index gained 14.07% year to date through July, including strong gains in both June (+4.50%) and July (+4.07%). The rally for international equities sputtered for the next three months (-11.33%) amid a stalling pattern in disinflationary trends, heightened global recession and geopolitical risks, soaring yields on longer-term U.S. government bonds and particularly weak economic conditions in the eurozone and China. The three-month decline left non-U.S. stocks up 1.15% year to date through October. Currency fluctuation also helped bolster non-U.S. equity performance overall. For the full 12 months, nearly all regions advanced, with Europe ex U.K. (+18%) and Japan (+17%) leading, whereas Canada (-0.38%) lagged by the widest margin. Each of the 11 sectors advanced, with information technology (+21%) and consumer discretionary (+19%) leading the way. Energy and industrials each rose about 14%. Conversely, four defensive-oriented sectors lagged by the widest margin: real estate (+4%), health care (+6%), consumer staples (+7%) and utilities (+8%).
Comments from Portfolio Manager John Chow:
For the fiscal year ending October 31, 2023, the fund's share classes (excluding sales charges, if applicable) gained about 12% to 13%, versus 10.84% for the benchmark MSCI Emerging Markets (Net MA) Index. From a regional standpoint, stock picks in Emerging Asia and an underweight in emerging Europe, the Middle East & Africa - Saudi Arabia in particular - contributed to the fund's performance versus the benchmark. By sector, the biggest relative contributor was security selection in consumer discretionary. Stock picks and an underweight among industrials firms, primarily within the capital goods industry, also boosted relative performance. Further contributing to the portfolio's relative result was smaller-than-benchmark exposure to utilities. The top individual relative contributor was an overweight in Taiwan Semiconductor Manufacturing (+43%), the fund's top holding on October 31. A second notable relative contributor was an outsized stake in NetEase (+94%), one of the portfolio's largest holdings this period. An overweight in PDD (+81%) also helped. The stock was another of the fund's more sizable holdings at period end. In contrast, on a regional basis, security selection in Latin America, primarily in Brazil, in addition to Asia Pacific ex Japan, detracted from the portfolio's relative return. By sector, the biggest detractor from performance versus the benchmark was picks among financials companies, especially banks. Investment choices in the multi-sector category and energy further pressured performance. The largest individual relative detractor was an overweight in Localiza Rent A Car (-25%), followed by our non-benchmark stake in Sea Limited (-45%). A stake in Impala Platinum Holdings returned -58% and notably hurt as well. The stock was not held at period end. Notable changes in positioning include lower allocations to equity markets in Indonesia and South Africa. By sector, meaningful shifts include decreased exposure to the multi-sector category and materials stocks.
Note to shareholders:
Application of FMR's environmental, social, and governance (ESG) ratings process and/or its sustainable investing exclusion criteria may affect the Fund's exposure to certain issuers, sectors, regions, and countries and may affect the Fund's performance.
The views expressed above reflect those of the portfolio manager(s) only through the end of the period as stated on the cover of this report and do not necessarily represent the views of Fidelity or any other person in the Fidelity organization. Any such views are subject to change at any time based upon market or other conditions and Fidelity disclaims any responsibility to update such views. These views may not be relied on as investment advice and, because investment decisions for a Fidelity fund are based on numerous factors, may not be relied on as an indication of trading intent on behalf of any Fidelity fund.
Top Holdings (% of Fund's net assets) |
| |
| Taiwan Semiconductor Manufacturing Co. Ltd. sponsored ADR (Taiwan, Semiconductors & Semiconductor Equipment) | 8.4 | |
| Samsung Electronics Co. Ltd. (Korea (South), Technology Hardware, Storage & Peripherals) | 6.3 | |
| Tencent Holdings Ltd. (China, Interactive Media & Services) | 5.3 | |
| Alibaba Group Holding Ltd. (China, Broadline Retail) | 4.4 | |
| PDD Holdings, Inc. ADR (China, Broadline Retail) | 2.9 | |
| SK Hynix, Inc. (Korea (South), Semiconductors & Semiconductor Equipment) | 2.0 | |
| New Oriental Education & Technology Group, Inc. sponsored ADR (China, Diversified Consumer Services) | 1.9 | |
| Grupo Financiero Banorte S.A.B. de CV Series O (Mexico, Banks) | 1.8 | |
| China Construction Bank Corp. (H Shares) (China, Banks) | 1.8 | |
| NetEase, Inc. ADR (China, Entertainment) | 1.6 | |
| | 36.4 | |
| |
| Market Sectors (% of Fund's net assets) |
| |
| Information Technology | 23.5 | |
| Financials | 22.6 | |
| Consumer Discretionary | 17.8 | |
| Communication Services | 11.3 | |
| Industrials | 4.8 | |
| Consumer Staples | 4.7 | |
| Health Care | 4.6 | |
| Materials | 3.6 | |
| Energy | 2.2 | |
| Utilities | 1.4 | |
| Real Estate | 0.8 | |
| |
Asset Allocation (% of Fund's net assets) |
|
Futures - 1.1% |
|
Geographic Diversification (% of Fund's net assets) |
|
* Includes Short-Term investments and Net Other Assets (Liabilities). Percentages are adjusted for the effect of derivatives, if applicable. |
| |
Showing Percentage of Net Assets
| Common Stocks - 95.9% |
| | | Shares | Value ($) |
| Brazil - 4.3% | | | |
| Banco BTG Pactual SA unit | | 7,843 | 46,046 |
| Banco do Brasil SA | | 2,923 | 28,031 |
| Hapvida Participacoes e Investimentos SA (a)(b) | | 49,351 | 36,119 |
| Localiza Rent a Car SA | | 3,277 | 33,064 |
| Localiza Rent a Car SA rights 11/10/23 (a) | | 23 | 32 |
| Raia Drogasil SA | | 6,765 | 34,618 |
TOTAL BRAZIL | | | 177,910 |
| China - 32.9% | | | |
| Alibaba Group Holding Ltd. (a) | | 15,141 | 155,878 |
| Alibaba Group Holding Ltd. sponsored ADR (a) | | 299 | 24,679 |
| Baidu, Inc. sponsored ADR (a) | | 120 | 12,600 |
| BeiGene Ltd. ADR (a) | | 54 | 10,059 |
| BYD Co. Ltd. (H Shares) | | 1,141 | 34,698 |
| China Construction Bank Corp. (H Shares) | | 127,867 | 72,316 |
| China Life Insurance Co. Ltd. (H Shares) | | 25,332 | 34,310 |
| China Merchants Bank Co. Ltd. (H Shares) | | 1,859 | 7,052 |
| ENN Energy Holdings Ltd. | | 1,424 | 10,787 |
| Flat Glass Group Co. Ltd. | | 9,453 | 16,976 |
| Haier Smart Home Co. Ltd. | | 7,462 | 21,284 |
| Innovent Biologics, Inc. (a)(b) | | 3,789 | 22,329 |
| JD.com, Inc. sponsored ADR | | 1,107 | 28,140 |
| Kweichow Moutai Co. Ltd. (A Shares) | | 94 | 21,653 |
| Li Auto, Inc. ADR (a) | | 718 | 24,276 |
| Meituan Class B (a)(b) | | 4,521 | 64,085 |
| NetEase, Inc. ADR | | 602 | 64,366 |
| New Oriental Education & Technology Group, Inc. sponsored ADR (a) | | 1,226 | 80,291 |
| PDD Holdings, Inc. ADR (a) | | 1,193 | 120,994 |
| Ping An Insurance Group Co. of China Ltd. (H Shares) | | 9,685 | 49,127 |
| Qingdao Port International Co. Ltd. (H Shares) (b) | | 15,963 | 7,974 |
| Shenzhen Mindray Bio-Medical Electronics Co. Ltd. (A Shares) (a) | | 1,439 | 56,255 |
| Shenzhou International Group Holdings Ltd. | | 1,032 | 10,137 |
| Sinotruk Hong Kong Ltd. | | 27,293 | 51,406 |
| Tencent Holdings Ltd. | | 5,924 | 219,240 |
| Trip.com Group Ltd. ADR (a) | | 1,629 | 55,386 |
| Will Semiconductor Ltd. | | 700 | 10,563 |
| Wuliangye Yibin Co. Ltd. (A Shares) | | 615 | 13,112 |
| WuXi AppTec Co. Ltd. (H Shares) (b) | | 1,178 | 14,155 |
| Wuxi Biologics (Cayman), Inc. (a)(b) | | 4,154 | 25,829 |
| Zijin Mining Group Co. Ltd. (H Shares) | | 12,243 | 18,939 |
TOTAL CHINA | | | 1,358,896 |
| Greece - 0.5% | | | |
| OPAP SA | | 1,239 | 20,976 |
| Hungary - 0.7% | | | |
| Richter Gedeon PLC | | 1,273 | 29,848 |
| India - 14.2% | | | |
| Axis Bank Ltd. | | 3,696 | 43,599 |
| Bharti Airtel Ltd. | | 3,969 | 43,577 |
| HDFC Bank Ltd. | | 2,280 | 40,446 |
| HDFC Bank Ltd. sponsored ADR | | 720 | 40,716 |
| HDFC Standard Life Insurance Co. Ltd. (b) | | 6,063 | 45,027 |
| Hindustan Unilever Ltd. | | 576 | 17,185 |
| ICICI Bank Ltd. | | 4,291 | 47,195 |
| Infosys Ltd. sponsored ADR | | 1,672 | 27,454 |
| Larsen & Toubro Ltd. | | 1,711 | 60,194 |
| NTPC Ltd. | | 15,474 | 43,827 |
| Reliance Industries Ltd. | | 793 | 21,799 |
| Reliance Industries Ltd. GDR (b) | | 813 | 44,390 |
| SRF Ltd. | | 1,249 | 32,925 |
| Tata Consultancy Services Ltd. | | 311 | 12,587 |
| Tata Steel Ltd. | | 10,888 | 15,532 |
| Ultratech Cement Ltd. | | 506 | 51,194 |
TOTAL INDIA | | | 587,647 |
| Indonesia - 3.0% | | | |
| PT Bank Central Asia Tbk | | 94,417 | 52,016 |
| PT Bank Mandiri (Persero) Tbk | | 62,630 | 22,375 |
| PT Bank Negara Indonesia (Persero) Tbk | | 36,353 | 10,971 |
| PT Bank Rakyat Indonesia (Persero) Tbk | | 79,085 | 24,729 |
| PT Telkom Indonesia Persero Tbk | | 61,336 | 13,446 |
TOTAL INDONESIA | | | 123,537 |
| Korea (South) - 13.5% | | | |
| AMOREPACIFIC Corp. | | 233 | 21,838 |
| Hansol Chemical Co. Ltd. | | 73 | 8,134 |
| Hyundai Marine & Fire Insurance Co. Ltd. | | 322 | 7,500 |
| Hyundai Mipo Dockyard Co. Ltd. (a) | | 40 | 2,058 |
| Hyundai Motor Co. Ltd. | | 478 | 60,131 |
| JYP Entertainment Corp. | | 315 | 23,942 |
| KB Financial Group, Inc. | | 659 | 25,083 |
| LG Chemical Ltd. | | 23 | 7,527 |
| LG Corp. | | 170 | 9,716 |
| LG Innotek Co. Ltd. | | 53 | 8,784 |
| NAVER Corp. | | 292 | 40,762 |
| Samsung Electronics Co. Ltd. | | 5,255 | 261,179 |
| SK Hynix, Inc. | | 931 | 80,730 |
TOTAL KOREA (SOUTH) | | | 557,384 |
| Mexico - 4.2% | | | |
| Corporacion Inmobiliaria Vesta S.A.B. de CV ADR | | 834 | 26,221 |
| Fomento Economico Mexicano S.A.B. de CV sponsored ADR | | 180 | 20,414 |
| Grupo Aeroportuario Norte S.A.B. de CV | | 1,142 | 8,718 |
| Grupo Financiero Banorte S.A.B. de CV Series O | | 9,076 | 73,659 |
| Wal-Mart de Mexico SA de CV Series V | | 12,360 | 44,239 |
TOTAL MEXICO | | | 173,251 |
| Peru - 0.4% | | | |
| Credicorp Ltd. (United States) | | 140 | 17,494 |
| Philippines - 0.2% | | | |
| Ayala Land, Inc. | | 18,490 | 9,076 |
| Saudi Arabia - 1.5% | | | |
| Al Rajhi Bank | | 1,861 | 33,285 |
| The Saudi National Bank | | 3,123 | 27,929 |
TOTAL SAUDI ARABIA | | | 61,214 |
| Singapore - 0.3% | | | |
| Sea Ltd. ADR (a) | | 261 | 10,884 |
| South Africa - 3.1% | | | |
| Absa Group Ltd. | | 2,836 | 25,856 |
| Bid Corp. Ltd. | | 1,081 | 22,933 |
| Capitec Bank Holdings Ltd. | | 165 | 14,651 |
| FirstRand Ltd. | | 2,494 | 8,222 |
| MTN Group Ltd. | | 1,211 | 5,912 |
| Naspers Ltd. Class N | | 214 | 33,406 |
| Standard Bank Group Ltd. | | 1,837 | 18,027 |
TOTAL SOUTH AFRICA | | | 129,007 |
| Taiwan - 16.0% | | | |
| Alchip Technologies Ltd. | | 654 | 53,597 |
| Chailease Holding Co. Ltd. | | 7,753 | 42,024 |
| E Ink Holdings, Inc. | | 1,333 | 6,930 |
| E.SUN Financial Holdings Co. Ltd. | | 13,271 | 9,771 |
| eMemory Technology, Inc. | | 616 | 38,564 |
| HIWIN Technologies Corp. | | 4,400 | 26,644 |
| International Games Systems Co. Ltd. | | 1,589 | 30,604 |
| King Yuan Electronics Co. Ltd. | | 9,916 | 23,475 |
| MediaTek, Inc. | | 1,038 | 27,070 |
| Realtek Semiconductor Corp. | | 757 | 9,427 |
| Taiwan Semiconductor Manufacturing Co. Ltd. sponsored ADR | | 4,031 | 347,918 |
| Unimicron Technology Corp. | | 2,941 | 13,107 |
| Yageo Corp. | | 1,870 | 30,464 |
TOTAL TAIWAN | | | 659,595 |
| Thailand - 1.1% | | | |
| Bangkok Bank PCL (For. Reg.) | | 2,640 | 11,505 |
| PTT Exploration and Production PCL (For. Reg.) | | 5,514 | 25,042 |
| SCB X PCL (For. Reg.) | | 3,661 | 9,982 |
TOTAL THAILAND | | | 46,529 |
| TOTAL COMMON STOCKS (Cost $4,082,755) | | | 3,963,248 |
| | | | |
| Nonconvertible Preferred Stocks - 1.4% |
| | | Shares | Value ($) |
| Brazil - 1.4% | | | |
| Banco Bradesco SA (PN) | | 2,888 | 8,014 |
| Gerdau SA | | 2,613 | 11,283 |
| Itau Unibanco Holding SA | | 7,214 | 38,375 |
| | | | |
| TOTAL NONCONVERTIBLE PREFERRED STOCKS (Cost $58,247) | | | 57,672 |
| | | | |
| Money Market Funds - 3.7% |
| | | Shares | Value ($) |
Fidelity Cash Central Fund 5.40% (c) (Cost $151,488) | | 151,458 | 151,488 |
| | | | |
| TOTAL INVESTMENT IN SECURITIES - 101.0% (Cost $4,292,490) | 4,172,408 |
NET OTHER ASSETS (LIABILITIES) - (1.0)% | (40,902) |
| NET ASSETS - 100.0% | 4,131,506 |
| | |
| Futures Contracts |
| | Number of contracts | Expiration Date | Notional Amount ($) | Value ($) | Unrealized Appreciation/ (Depreciation) ($) |
| Purchased | | | | | |
| | | | | | |
| Equity Index Contracts | | | | | |
| ICE MSCI Emerging Markets Index Contracts (United States) | 1 | Dec 2023 | 45,960 | (167) | (167) |
| | | | | | |
| The notional amount of futures purchased as a percentage of Net Assets is 1.1% |
Legend
| (b) | Security exempt from registration under Rule 144A of the Securities Act of 1933. These securities may be resold in transactions exempt from registration, normally to qualified institutional buyers. At the end of the period, the value of these securities amounted to $259,908 or 6.3% of net assets. |
| (c) | Affiliated fund that is generally available only to investment companies and other accounts managed by Fidelity Investments. The rate quoted is the annualized seven-day yield of the fund at period end. A complete unaudited listing of the fund's holdings as of its most recent quarter end is available upon request. In addition, each Fidelity Central Fund's financial statements, which are not covered by the Fund's Report of Independent Registered Public Accounting Firm, are available on the SEC's website or upon request. |
Affiliated Central Funds
Fiscal year to date information regarding the Fund's investments in Fidelity Central Funds, including the ownership percentage, is presented below.
| Affiliate | Value, beginning of period ($) | Purchases ($) | Sales Proceeds ($) | Dividend Income ($) | Realized Gain (loss) ($) | Change in Unrealized appreciation (depreciation) ($) | Value, end of period ($) | % ownership, end of period |
| Fidelity Cash Central Fund 5.40% | 102,935 | 3,304,336 | 3,255,783 | 12,165 | - | - | 151,488 | 0.0% |
| Total | 102,935 | 3,304,336 | 3,255,783 | 12,165 | - | - | 151,488 | |
| | | | | | | | | |
Amounts in the dividend income column in the above table include any capital gain distributions from underlying funds, which are presented in the corresponding line item in the Statement of Operations, if applicable.
Amounts included in the purchases and sales proceeds columns may include in-kind transactions, if applicable.
Investment Valuation
The following is a summary of the inputs used, as of October 31, 2023, involving the Fund's assets and liabilities carried at fair value. The inputs or methodology used for valuing securities may not be an indication of the risk associated with investing in those securities. For more information on valuation inputs, and their aggregation into the levels used below, please refer to the Investment Valuation section in the accompanying Notes to Financial Statements.
| Valuation Inputs at Reporting Date: |
| Description | Total ($) | Level 1 ($) | Level 2 ($) | Level 3 ($) |
Investments in Securities: | | | | |
|
| Equities: | | | | |
Communication Services | 465,333 | 93,762 | 371,571 | - |
Consumer Discretionary | 734,361 | 388,148 | 346,213 | - |
Consumer Staples | 195,992 | 122,204 | 73,788 | - |
Energy | 91,231 | 44,390 | 46,841 | - |
Financials | 935,333 | 380,305 | 555,028 | - |
Health Care | 194,594 | 76,026 | 118,568 | - |
Industrials | 199,806 | 41,814 | 157,992 | - |
Information Technology | 968,825 | 375,372 | 593,453 | - |
Materials | 145,534 | 11,283 | 134,251 | - |
Real Estate | 35,297 | 26,221 | 9,076 | - |
Utilities | 54,614 | - | 54,614 | - |
|
| Money Market Funds | 151,488 | 151,488 | - | - |
| Total Investments in Securities: | 4,172,408 | 1,711,013 | 2,461,395 | - |
Derivative Instruments: Liabilities | | | | |
Futures Contracts | (167) | (167) | - | - |
| Total Liabilities | (167) | (167) | - | - |
| Total Derivative Instruments: | (167) | (167) | - | - |
Value of Derivative Instruments
The following table is a summary of the Fund's value of derivative instruments by primary risk exposure as of October 31, 2023. For additional information on derivative instruments, please refer to the Derivative Instruments section in the accompanying Notes to Financial Statements.
Primary Risk Exposure / Derivative Type | Value |
| Asset ($) | Liability ($) |
| Equity Risk | | |
Futures Contracts (a) | 0 | (167) |
| Total Equity Risk | 0 | (167) |
| Total Value of Derivatives | 0 | (167) |
(a)Reflects gross cumulative appreciation (depreciation) on futures contracts as presented in the Schedule of Investments. In the Statement of Assets and Liabilities, the period end daily variation margin is included in receivable or payable for daily variation margin on futures contracts, and the net cumulative appreciation (depreciation) is included in Total accumulated earnings (loss).
| Statement of Assets and Liabilities |
| | | | October 31, 2023 |
| | | | | |
| Assets | | | | |
| Investment in securities, at value - See accompanying schedule: | | | | |
Unaffiliated issuers (cost $4,141,002) | $ | 4,020,920 | | |
Fidelity Central Funds (cost $151,488) | | 151,488 | | |
| | | | | |
| | | | | |
| Total Investment in Securities (cost $4,292,490) | | | $ | 4,172,408 |
| Segregated cash with brokers for derivative instruments | | | | 3,494 |
| Foreign currency held at value (cost $4,872) | | | | 4,870 |
| Receivable for investments sold | | | | 48,681 |
| Receivable for fund shares sold | | | | 171 |
| Dividends receivable | | | | 3,447 |
| Distributions receivable from Fidelity Central Funds | | | | 842 |
| Prepaid expenses | | | | 6 |
| Receivable from investment adviser for expense reductions | | | | 10,097 |
| Other receivables | | | | 151 |
Total assets | | | | 4,244,167 |
| Liabilities | | | | |
| Payable for investments purchased | $ | 33,427 | | |
| Payable for fund shares redeemed | | 3 | | |
| Accrued management fee | | 2,797 | | |
| Distribution and service plan fees payable | | 283 | | |
| Payable for daily variation margin on futures contracts | | 305 | | |
| Other affiliated payables | | 986 | | |
| Audit fee payable | | 57,247 | | |
| Custody fee payable | | 11,319 | | |
| Other payables and accrued expenses | | 6,294 | | |
| Total Liabilities | | | | 112,661 |
| Net Assets | | | $ | 4,131,506 |
| Net Assets consist of: | | | | |
| Paid in capital | | | $ | 5,034,256 |
| Total accumulated earnings (loss) | | | | (902,750) |
| Net Assets | | | $ | 4,131,506 |
| | | | | |
| Net Asset Value and Maximum Offering Price | | | | |
| Class A : | | | | |
Net Asset Value and redemption price per share ($223,871 ÷ 30,420 shares)(a) | | | $ | 7.36 |
| Maximum offering price per share (100/94.25 of $7.36) | | | $ | 7.81 |
| Class M : | | | | |
Net Asset Value and redemption price per share ($184,236 ÷ 25,070 shares)(a) | | | $ | 7.35 |
| Maximum offering price per share (100/96.50 of $7.35) | | | $ | 7.62 |
| Class C : | | | | |
Net Asset Value and offering price per share ($184,901 ÷ 25,316 shares)(a) | | | $ | 7.30 |
| Fidelity Sustainable Emerging Markets Equity Fund : | | | | |
Net Asset Value, offering price and redemption price per share ($2,946,852 ÷ 399,452 shares) | | | $ | 7.38 |
| Class I : | | | | |
Net Asset Value, offering price and redemption price per share ($201,256 ÷ 27,276 shares) | | | $ | 7.38 |
| Class Z : | | | | |
Net Asset Value, offering price and redemption price per share ($390,390 ÷ 52,768 shares) | | | $ | 7.40 |
(a)Redemption price per share is equal to net asset value less any applicable contingent deferred sales charge. |
| Statement of Operations |
| | | | Year ended October 31, 2023 |
| Investment Income | | | | |
| Dividends | | | $ | 102,850 |
| Non-Cash dividends | | | | 11,645 |
| Income from Fidelity Central Funds | | | | 12,165 |
| Income before foreign taxes withheld | | | $ | 126,660 |
| Less foreign taxes withheld | | | | (13,314) |
| Total Income | | | | 113,346 |
| Expenses | | | | |
| Management fee | | | | |
| Basic fee | $ | 34,611 | | |
| Performance adjustment | | (137) | | |
| Transfer agent fees | | 9,420 | | |
| Distribution and service plan fees | | 3,545 | | |
| Accounting fees and expenses | | 2,225 | | |
| Custodian fees and expenses | | 42,671 | | |
| Independent trustees' fees and expenses | | 22 | | |
| Registration fees | | 102,388 | | |
| Audit | | 81,881 | | |
| Legal | | 4 | | |
| Miscellaneous | | 16 | | |
| Total expenses before reductions | | 276,646 | | |
| Expense reductions | | (218,552) | | |
| Total expenses after reductions | | | | 58,094 |
| Net Investment income (loss) | | | | 55,252 |
| Realized and Unrealized Gain (Loss) | | | | |
| Net realized gain (loss) on: | | | | |
| Investment Securities: | | | | |
| Unaffiliated issuers (net of foreign taxes of $1,487) | | (405,000) | | |
| Foreign currency transactions | | (4,604) | | |
| Futures contracts | | (5,550) | | |
| Total net realized gain (loss) | | | | (415,154) |
| Change in net unrealized appreciation (depreciation) on: | | | | |
| Investment Securities: | | | | |
| Unaffiliated issuers(net of increase in deferred foreign taxes of $4,672) | | 636,522 | | |
| Assets and liabilities in foreign currencies | | (14) | | |
| Futures contracts | | (167) | | |
| Total change in net unrealized appreciation (depreciation) | | | | 636,341 |
| Net gain (loss) | | | | 221,187 |
| Net increase (decrease) in net assets resulting from operations | | | $ | 276,439 |
| Statement of Changes in Net Assets |
| |
| | Year ended October 31, 2023 | | For the period February 10, 2022 (commencement of operations) through October 31, 2022 |
| Increase (Decrease) in Net Assets | | | | |
| Operations | | | | |
| Net investment income (loss) | $ | 55,252 | $ | 14,880 |
| Net realized gain (loss) | | (415,154) | | (409,178) |
| Change in net unrealized appreciation (depreciation) | | 636,341 | | (761,262) |
| Net increase (decrease) in net assets resulting from operations | | 276,439 | | (1,155,560) |
| Distributions to shareholders | | (23,630) | | - |
| | | | | |
| Share transactions - net increase (decrease) | | 866,372 | | 4,167,885 |
| Total increase (decrease) in net assets | | 1,119,181 | | 3,012,325 |
| | | | | |
| Net Assets | | | | |
| Beginning of period | | 3,012,325 | | - |
| End of period | $ | 4,131,506 | $ | 3,012,325 |
| | | | | |
| | | | | |
Financial Highlights
| Fidelity Advisor® Sustainable Emerging Markets Equity Fund Class A |
| |
| Years ended October 31, | | 2023 | | 2022 A |
Selected Per-Share Data | | | | |
| Net asset value, beginning of period | $ | 6.55 | $ | 10.00 |
| Income from Investment Operations | | | | |
Net investment income (loss) B,C | | .08 | | .03 |
| Net realized and unrealized gain (loss) | | .77 | | (3.48) |
| Total from investment operations | | .85 | | (3.45) |
| Distributions from net investment income | | (.04) | | - |
| Total distributions | | (.04) | | - |
| Net asset value, end of period | $ | 7.36 | $ | 6.55 |
Total Return D,E,F | | 12.93% | | (34.50)% |
Ratios to Average Net Assets C,G,H | | | | |
| Expenses before reductions | | 6.44% | | 8.77% I,J |
| Expenses net of fee waivers, if any | | 1.49% | | 1.57% I |
| Expenses net of all reductions | | 1.48% | | 1.56% I |
| Net investment income (loss) | | 1.06% | | .51% I |
| Supplemental Data | | | | |
| Net assets, end of period (000 omitted) | $ | 224 | $ | 164 |
Portfolio turnover rate K | | 119% | | 84% I |
AFor the period February 10, 2022 (commencement of operations) through October 31, 2022
BCalculated based on average shares outstanding during the period.
CNet investment income (loss) is affected by the timing of the declaration of dividends by any underlying mutual funds or exchange-traded funds (ETFs). Net investment income (loss) of any mutual funds or ETFs is not included in the Fund's net investment income (loss) ratio.
DTotal returns for periods of less than one year are not annualized.
ETotal returns would have been lower if certain expenses had not been reduced during the applicable periods shown.
FTotal returns do not include the effect of the sales charges.
GFees and expenses of any underlying mutual funds or exchange-traded funds (ETFs) are not included in the Fund's expense ratio. The Fund indirectly bears its proportionate share of these expenses. For additional expense information related to investments in Fidelity Central Funds, please refer to the "Investments in Fidelity Central Funds" note found in the Notes to Financial Statements section of the most recent Annual or Semi-Annual report.
HExpense ratios reflect operating expenses of the class. Expenses before reductions do not reflect amounts reimbursed, waived, or reduced through arrangements with the investment adviser, brokerage services, or other offset arrangements, if applicable, and do not represent the amount paid by the class during periods when reimbursements, waivers or reductions occur.
IAnnualized.
JAudit fees are not annualized.
KAmount does not include the portfolio activity of any underlying mutual funds or exchange-traded funds (ETFs).
| Fidelity Advisor® Sustainable Emerging Markets Equity Fund Class M |
| |
| Years ended October 31, | | 2023 | | 2022 A |
Selected Per-Share Data | | | | |
| Net asset value, beginning of period | $ | 6.54 | $ | 10.00 |
| Income from Investment Operations | | | | |
Net investment income (loss) B,C | | .06 | | .01 |
| Net realized and unrealized gain (loss) | | .77 | | (3.47) |
| Total from investment operations | | .83 | | (3.46) |
| Distributions from net investment income | | (.02) | | - |
| Total distributions | | (.02) | | - |
| Net asset value, end of period | $ | 7.35 | $ | 6.54 |
Total Return D,E,F | | 12.65% | | (34.60)% |
Ratios to Average Net Assets C,G,H | | | | |
| Expenses before reductions | | 6.57% | | 9.01% I,J |
| Expenses net of fee waivers, if any | | 1.74% | | 1.82% J |
| Expenses net of all reductions | | 1.73% | | 1.82% J |
| Net investment income (loss) | | .81% | | .26% J |
| Supplemental Data | | | | |
| Net assets, end of period (000 omitted) | $ | 184 | $ | 164 |
Portfolio turnover rate K | | 119% | | 84% J |
AFor the period February 10, 2022 (commencement of operations) through October 31, 2022
BCalculated based on average shares outstanding during the period.
CNet investment income (loss) is affected by the timing of the declaration of dividends by any underlying mutual funds or exchange-traded funds (ETFs). Net investment income (loss) of any mutual funds or ETFs is not included in the Fund's net investment income (loss) ratio.
DTotal returns for periods of less than one year are not annualized.
ETotal returns would have been lower if certain expenses had not been reduced during the applicable periods shown.
FTotal returns do not include the effect of the sales charges.
GFees and expenses of any underlying mutual funds or exchange-traded funds (ETFs) are not included in the Fund's expense ratio. The Fund indirectly bears its proportionate share of these expenses. For additional expense information related to investments in Fidelity Central Funds, please refer to the "Investments in Fidelity Central Funds" note found in the Notes to Financial Statements section of the most recent Annual or Semi-Annual report.
HExpense ratios reflect operating expenses of the class. Expenses before reductions do not reflect amounts reimbursed, waived, or reduced through arrangements with the investment adviser, brokerage services, or other offset arrangements, if applicable, and do not represent the amount paid by the class during periods when reimbursements, waivers or reductions occur.
IAudit fees are not annualized.
JAnnualized.
KAmount does not include the portfolio activity of any underlying mutual funds or exchange-traded funds (ETFs).
| Fidelity Advisor® Sustainable Emerging Markets Equity Fund Class C |
| |
| Years ended October 31, | | 2023 | | 2022 A |
Selected Per-Share Data | | | | |
| Net asset value, beginning of period | $ | 6.52 | $ | 10.00 |
| Income from Investment Operations | | | | |
Net investment income (loss) B,C | | .02 | | (.01) |
| Net realized and unrealized gain (loss) | | .76 | | (3.47) |
| Total from investment operations | | .78 | | (3.48) |
| Net asset value, end of period | $ | 7.30 | $ | 6.52 |
Total Return D,E,F | | 11.96% | | (34.80)% |
Ratios to Average Net Assets C,G,H | | | | |
| Expenses before reductions | | 7.07% | | 9.51% I,J |
| Expenses net of fee waivers, if any | | 2.25% | | 2.32% J |
| Expenses net of all reductions | | 2.24% | | 2.32% J |
| Net investment income (loss) | | .31% | | (.24)% J |
| Supplemental Data | | | | |
| Net assets, end of period (000 omitted) | $ | 185 | $ | 163 |
Portfolio turnover rate K | | 119% | | 84% J |
AFor the period February 10, 2022 (commencement of operations) through October 31, 2022
BCalculated based on average shares outstanding during the period.
CNet investment income (loss) is affected by the timing of the declaration of dividends by any underlying mutual funds or exchange-traded funds (ETFs). Net investment income (loss) of any mutual funds or ETFs is not included in the Fund's net investment income (loss) ratio.
DTotal returns for periods of less than one year are not annualized.
ETotal returns would have been lower if certain expenses had not been reduced during the applicable periods shown.
FTotal returns do not include the effect of the contingent deferred sales charge.
GFees and expenses of any underlying mutual funds or exchange-traded funds (ETFs) are not included in the Fund's expense ratio. The Fund indirectly bears its proportionate share of these expenses. For additional expense information related to investments in Fidelity Central Funds, please refer to the "Investments in Fidelity Central Funds" note found in the Notes to Financial Statements section of the most recent Annual or Semi-Annual report.
HExpense ratios reflect operating expenses of the class. Expenses before reductions do not reflect amounts reimbursed, waived, or reduced through arrangements with the investment adviser, brokerage services, or other offset arrangements, if applicable, and do not represent the amount paid by the class during periods when reimbursements, waivers or reductions occur.
IAudit fees are not annualized.
JAnnualized.
KAmount does not include the portfolio activity of any underlying mutual funds or exchange-traded funds (ETFs).
| Fidelity® Sustainable Emerging Markets Equity Fund |
| |
| Years ended October 31, | | 2023 | | 2022 A |
Selected Per-Share Data | | | | |
| Net asset value, beginning of period | $ | 6.57 | $ | 10.00 |
| Income from Investment Operations | | | | |
Net investment income (loss) B,C | | .10 | | .05 |
| Net realized and unrealized gain (loss) | | .76 | | (3.48) |
| Total from investment operations | | .86 | | (3.43) |
| Distributions from net investment income | | (.05) | | - |
| Total distributions | | (.05) | | - |
| Net asset value, end of period | $ | 7.38 | $ | 6.57 |
Total Return D,E | | 13.11% | | (34.30)% |
Ratios to Average Net Assets C,F,G | | | | |
| Expenses before reductions | | 6.16% | | 8.07% H,I |
| Expenses net of fee waivers, if any | | 1.25% | | 1.25% I |
| Expenses net of all reductions | | 1.24% | | 1.25% I |
| Net investment income (loss) | | 1.31% | | .83% I |
| Supplemental Data | | | | |
| Net assets, end of period (000 omitted) | $ | 2,947 | $ | 2,082 |
Portfolio turnover rate J | | 119% | | 84% I |
AFor the period February 10, 2022 (commencement of operations) through October 31, 2022
BCalculated based on average shares outstanding during the period.
CNet investment income (loss) is affected by the timing of the declaration of dividends by any underlying mutual funds or exchange-traded funds (ETFs). Net investment income (loss) of any mutual funds or ETFs is not included in the Fund's net investment income (loss) ratio.
DTotal returns for periods of less than one year are not annualized.
ETotal returns would have been lower if certain expenses had not been reduced during the applicable periods shown.
FFees and expenses of any underlying mutual funds or exchange-traded funds (ETFs) are not included in the Fund's expense ratio. The Fund indirectly bears its proportionate share of these expenses. For additional expense information related to investments in Fidelity Central Funds, please refer to the "Investments in Fidelity Central Funds" note found in the Notes to Financial Statements section of the most recent Annual or Semi-Annual report.
GExpense ratios reflect operating expenses of the class. Expenses before reductions do not reflect amounts reimbursed, waived, or reduced through arrangements with the investment adviser, brokerage services, or other offset arrangements, if applicable, and do not represent the amount paid by the class during periods when reimbursements, waivers or reductions occur.
HAudit fees are not annualized.
IAnnualized.
JAmount does not include the portfolio activity of any underlying mutual funds or exchange-traded funds (ETFs).
| Fidelity Advisor® Sustainable Emerging Markets Equity Fund Class I |
| |
| Years ended October 31, | | 2023 | | 2022 A |
Selected Per-Share Data | | | | |
| Net asset value, beginning of period | $ | 6.57 | $ | 10.00 |
| Income from Investment Operations | | | | |
Net investment income (loss) B,C | | .10 | | .04 |
| Net realized and unrealized gain (loss) | | .76 | | (3.47) |
| Total from investment operations | | .86 | | (3.43) |
| Distributions from net investment income | | (.05) | | - |
| Total distributions | | (.05) | | - |
| Net asset value, end of period | $ | 7.38 | $ | 6.57 |
Total Return D,E | | 13.11% | | (34.30)% |
Ratios to Average Net Assets C,F,G | | | | |
| Expenses before reductions | | 6.00% | | 8.50% H,I |
| Expenses net of fee waivers, if any | | 1.24% | | 1.31% I |
| Expenses net of all reductions | | 1.23% | | 1.31% I |
| Net investment income (loss) | | 1.31% | | .76% I |
| Supplemental Data | | | | |
| Net assets, end of period (000 omitted) | $ | 201 | $ | 164 |
Portfolio turnover rate J | | 119% | | 84% I |
AFor the period February 10, 2022 (commencement of operations) through October 31, 2022
BCalculated based on average shares outstanding during the period.
CNet investment income (loss) is affected by the timing of the declaration of dividends by any underlying mutual funds or exchange-traded funds (ETFs). Net investment income (loss) of any mutual funds or ETFs is not included in the Fund's net investment income (loss) ratio.
DTotal returns for periods of less than one year are not annualized.
ETotal returns would have been lower if certain expenses had not been reduced during the applicable periods shown.
FFees and expenses of any underlying mutual funds or exchange-traded funds (ETFs) are not included in the Fund's expense ratio. The Fund indirectly bears its proportionate share of these expenses. For additional expense information related to investments in Fidelity Central Funds, please refer to the "Investments in Fidelity Central Funds" note found in the Notes to Financial Statements section of the most recent Annual or Semi-Annual report.
GExpense ratios reflect operating expenses of the class. Expenses before reductions do not reflect amounts reimbursed, waived, or reduced through arrangements with the investment adviser, brokerage services, or other offset arrangements, if applicable, and do not represent the amount paid by the class during periods when reimbursements, waivers or reductions occur.
HAudit fees are not annualized.
IAnnualized.
JAmount does not include the portfolio activity of any underlying mutual funds or exchange-traded funds (ETFs).
| Fidelity Advisor® Sustainable Emerging Markets Equity Fund Class Z |
| |
| Years ended October 31, | | 2023 | | 2022 A |
Selected Per-Share Data | | | | |
| Net asset value, beginning of period | $ | 6.57 | $ | 10.00 |
| Income from Investment Operations | | | | |
Net investment income (loss) B,C | | .11 | | .05 |
| Net realized and unrealized gain (loss) | | .77 | | (3.48) |
| Total from investment operations | | .88 | | (3.43) |
| Distributions from net investment income | | (.05) | | - |
| Total distributions | | (.05) | | - |
| Net asset value, end of period | $ | 7.40 | $ | 6.57 |
Total Return D,E | | 13.42% | | (34.30)% |
Ratios to Average Net Assets C,F,G | | | | |
| Expenses before reductions | | 5.87% | | 8.23% H,I |
| Expenses net of fee waivers, if any | | 1.09% | | 1.15% I |
| Expenses net of all reductions | | 1.09% | | 1.15% I |
| Net investment income (loss) | | 1.46% | | .93% I |
| Supplemental Data | | | | |
| Net assets, end of period (000 omitted) | $ | 390 | $ | 276 |
Portfolio turnover rate J | | 119% | | 84% I |
AFor the period February 10, 2022 (commencement of operations) through October 31, 2022
BCalculated based on average shares outstanding during the period.
CNet investment income (loss) is affected by the timing of the declaration of dividends by any underlying mutual funds or exchange-traded funds (ETFs). Net investment income (loss) of any mutual funds or ETFs is not included in the Fund's net investment income (loss) ratio.
DTotal returns for periods of less than one year are not annualized.
ETotal returns would have been lower if certain expenses had not been reduced during the applicable periods shown.
FFees and expenses of any underlying mutual funds or exchange-traded funds (ETFs) are not included in the Fund's expense ratio. The Fund indirectly bears its proportionate share of these expenses. For additional expense information related to investments in Fidelity Central Funds, please refer to the "Investments in Fidelity Central Funds" note found in the Notes to Financial Statements section of the most recent Annual or Semi-Annual report.
GExpense ratios reflect operating expenses of the class. Expenses before reductions do not reflect amounts reimbursed, waived, or reduced through arrangements with the investment adviser, brokerage services, or other offset arrangements, if applicable, and do not represent the amount paid by the class during periods when reimbursements, waivers or reductions occur.
HAudit fees are not annualized.
IAnnualized.
JAmount does not include the portfolio activity of any underlying mutual funds or exchange-traded funds (ETFs).
For the period ended October 31, 2023
1. Organization.
Fidelity Sustainable Emerging Markets Equity Fund (the Fund) is a fund of Fidelity Investment Trust (the Trust) and is authorized to issue an unlimited number of shares. The Trust is registered under the Investment Company Act of 1940, as amended (the 1940 Act), as an open-end management investment company organized as a Massachusetts business trust. The Fund offers Class A, Class M, Class C, Fidelity Sustainable Emerging Markets Equity Fund, Class I and Class Z shares, each of which has equal rights as to assets and voting privileges. Class A, Class M, Class C, Class I and Class Z are Fidelity Advisor classes. Each class has exclusive voting rights with respect to matters that affect that class. Class C shares will automatically convert to Class A shares after a holding period of eight years from the initial date of purchase, with certain exceptions. The Fund's investments in emerging markets can be subject to social, economic, regulatory, and political uncertainties and can be extremely volatile.
2. Investments in Fidelity Central Funds.
Funds may invest in Fidelity Central Funds, which are open-end investment companies generally available only to other investment companies and accounts managed by the investment adviser and its affiliates. The Schedule of Investments lists any Fidelity Central Funds held as an investment as of period end, but does not include the underlying holdings of each Fidelity Central Fund. An investing fund indirectly bears its proportionate share of the expenses of the underlying Fidelity Central Funds.
Based on its investment objective, each Fidelity Central Fund may invest or participate in various investment vehicles or strategies that are similar to those of the investing fund. These strategies are consistent with the investment objectives of the investing fund and may involve certain economic risks which may cause a decline in value of each of the Fidelity Central Funds and thus a decline in the value of the investing fund.
| Fidelity Central Fund | Investment Manager | Investment Objective | Investment Practices | Expense RatioA |
| Fidelity Money Market Central Funds | Fidelity Management & Research Company LLC (FMR) | Each fund seeks to obtain a high level of current income consistent with the preservation of capital and liquidity. | Short-term Investments | Less than .005% |
A Expenses expressed as a percentage of average net assets and are as of each underlying Central Fund's most recent annual or semi-annual shareholder report.
A complete unaudited list of holdings for each Fidelity Central Fund is available upon request or at the Securities and Exchange Commission website at www.sec.gov. In addition, the financial statements of the Fidelity Central Funds which contain the significant accounting policies (including investment valuation policies) of those funds, and are not covered by the Report of Independent Registered Public Accounting Firm, are available on the Securities and Exchange Commission website or upon request.
3. Significant Accounting Policies.
The Fund is an investment company and applies the accounting and reporting guidance of the Financial Accounting Standards Board (FASB) Accounting Standards Codification Topic 946 Financial Services - Investment Companies. The financial statements have been prepared in conformity with accounting principles generally accepted in the United States of America (GAAP), which require management to make certain estimates and assumptions at the date of the financial statements. Actual results could differ from those estimates. Subsequent events, if any, through the date that the financial statements were issued have been evaluated in the preparation of the financial statements. The Fund's Schedule of Investments lists any underlying mutual funds or exchange-traded funds (ETFs) but does not include the underlying holdings of these funds. The following summarizes the significant accounting policies of the Fund:
Investment Valuation. Investments are valued as of 4:00 p.m. Eastern time on the last calendar day of the period. The Board of Trustees (the Board) has designated the Fund's investment adviser as the valuation designee responsible for the fair valuation function and performing fair value determinations as needed. The investment adviser has established a Fair Value Committee (the Committee) to carry out the day-to-day fair valuation responsibilities and has adopted policies and procedures to govern the fair valuation process and the activities of the Committee. In accordance with these fair valuation policies and procedures, which have been approved by the Board, the Fund attempts to obtain prices from one or more third party pricing services or brokers to value its investments. When current market prices, quotations or currency exchange rates are not readily available or reliable, investments will be fair valued in good faith by the Committee, in accordance with the policies and procedures. Factors used in determining fair value vary by investment type and may include market or investment specific events, transaction data, estimated cash flows, and market observations of comparable investments. The frequency that the fair valuation procedures are used cannot be predicted and they may be utilized to a significant extent. The Committee manages the Fund's fair valuation practices and maintains the fair valuation policies and procedures. The Fund's investment adviser reports to the Board information regarding the fair valuation process and related material matters.
The Fund categorizes the inputs to valuation techniques used to value its investments into a disclosure hierarchy consisting of three levels as shown below:
Level 1 - unadjusted quoted prices in active markets for identical investments
Level 2 - other significant observable inputs (including quoted prices for similar investments, interest rates, prepayment speeds, etc.)
Level 3 - unobservable inputs (including the Fund's own assumptions based on the best information available)
Valuation techniques used to value the Fund's investments by major category are as follows:
Equity securities, including restricted securities, for which market quotations are readily available, are valued at the last reported sale price or official closing price as reported by a third party pricing service on the primary market or exchange on which they are traded and are categorized as Level 1 in the hierarchy. In the event there were no sales during the day or closing prices are not available, securities are valued at the last quoted bid price or may be valued using the last available price and are generally categorized as Level 2 in the hierarchy. For foreign equity securities, when market or security specific events arise, comparisons to the valuation of American Depositary Receipts (ADRs), futures contracts, ETFs and certain indexes as well as quoted prices for similar securities may be used and would be categorized as Level 2 in the hierarchy. For equity securities, including restricted securities, where observable inputs are limited, assumptions about market activity and risk are used and these securities may be categorized as Level 3 in the hierarchy.
Futures contracts are valued at the settlement price established each day by the board of trade or exchange on which they are traded and are categorized as Level 1 in the hierarchy. Investments in open-end mutual funds, including the Fidelity Central Funds, are valued at their closing net asset value (NAV) each business day and are categorized as Level 1 in the hierarchy.
Changes in valuation techniques may result in transfers in or out of an assigned level within the disclosure hierarchy. The aggregate value of investments by input level as of October 31, 2023 is included at the end of the Fund's Schedule of Investments.
Foreign Currency. Certain Funds may use foreign currency contracts to facilitate transactions in foreign-denominated securities. Gains and losses from these transactions may arise from changes in the value of the foreign currency or if the counterparties do not perform under the contracts' terms.
Foreign-denominated assets, including investment securities, and liabilities are translated into U.S. dollars at the exchange rates at period end. Purchases and sales of investment securities, income and dividends received, and expenses denominated in foreign currencies are translated into U.S. dollars at the exchange rate in effect on the transaction date.
The effects of exchange rate fluctuations on investments are included with the net realized and unrealized gain (loss) on investment securities. Other foreign currency transactions resulting in realized and unrealized gain (loss) are disclosed separately.
Investment Transactions and Income. For financial reporting purposes, the Fund's investment holdings and NAV include trades executed through the end of the last business day of the period. The NAV per share for processing shareholder transactions is calculated as of the close of business of the New York Stock Exchange (NYSE), normally 4:00 p.m. Eastern time and includes trades executed through the end of the prior business day. Gains and losses on securities sold are determined on the basis of identified cost. Commissions paid to certain brokers with whom the investment adviser, or its affiliates, places trades on behalf of a fund include an amount in addition to trade execution, which may be rebated back to a fund. Any such rebates are included in net realized gain (loss) on investments in the Statement of Operations. Dividend income is recorded on the ex-dividend date, except for certain dividends from foreign securities where the ex-dividend date may have passed, which are recorded as soon as the Fund is informed of the ex-dividend date. Non-cash dividends included in dividend income, if any, are recorded at the fair market value of the securities received. Income and capital gain distributions from Fidelity Central Funds, if any, are recorded on the ex-dividend date. Investment income is recorded net of foreign taxes withheld where recovery of such taxes is uncertain.
Class Allocations and Expenses. Investment income, realized and unrealized capital gains and losses, common expenses of a fund, and certain fund-level expense reductions, if any, are allocated daily on a pro-rata basis to each class based on the relative net assets of each class to the total net assets of a fund. Each class differs with respect to transfer agent and distribution and service plan fees incurred, as applicable. Certain expense reductions may also differ by class, if applicable. For the reporting period, the allocated portion of income and expenses to each class as a percent of its average net assets may vary due to the timing of recording these transactions in relation to fluctuating net assets of the classes. Expenses directly attributable to a fund are charged to that fund. Expenses attributable to more than one fund are allocated among the respective funds on the basis of relative net assets or other appropriate methods. Expenses included in the accompanying financial statements reflect the expenses of that fund and do not include any expenses associated with any underlying mutual funds or exchange-traded funds (ETFs). Although not included in a fund's expenses, a fund indirectly bears its proportionate share of these expenses through the net asset value of each underlying mutual fund or exchange-traded fund (ETF). Expense estimates are accrued in the period to which they relate and adjustments are made when actual amounts are known.
Income Tax Information and Distributions to Shareholders. Each year, the Fund intends to qualify as a regulated investment company under Subchapter M of the Internal Revenue Code, including distributing substantially all of its taxable income and realized gains. As a result, no provision for U.S. Federal income taxes is required. As of October 31, 2023, the Fund did not have any unrecognized tax benefits in the financial statements; nor is the Fund aware of any tax positions for which it is reasonably possible that the total amounts of unrecognized tax benefits will significantly change in the next twelve months. The Fund files a U.S. federal tax return, in addition to state and local tax returns as required. The Fund's federal income tax returns are subject to examination by the Internal Revenue Service (IRS) for a period of three fiscal years after they are filed. State and local tax returns may be subject to examination for an additional fiscal year depending on the jurisdiction. Foreign taxes are provided for based on the Fund's understanding of the tax rules and rates that exist in the foreign markets in which it invests. The Fund is subject to a tax imposed on capital gains by certain countries in which it invests. An estimated deferred tax liability for net unrealized appreciation on the applicable securities is included in Other payables and accrued expenses on the Statement of Assets & Liabilities.
Distributions are declared and recorded on the ex-dividend date. Income and capital gain distributions are declared separately for each class. Income and capital gain distributions are determined in accordance with income tax regulations, which may differ from GAAP.
Capital accounts within the financial statements are adjusted for permanent book-tax differences. These adjustments have no impact on net assets or the results of operations. Capital accounts are not adjusted for temporary book-tax differences which will reverse in a subsequent period.
Book-tax differences are primarily due to futures contracts, foreign currency transactions, certain foreign taxes, passive foreign investment companies (PFIC), capital loss carryforwards and losses deferred due to wash sales.
As of period end, the cost and unrealized appreciation (depreciation) in securities, and derivatives if applicable, for federal income tax purposes were as follows:
| Gross unrealized appreciation | $237,569 |
| Gross unrealized depreciation | (457,610) |
| Net unrealized appreciation (depreciation) | $(220,041) |
| Tax Cost | $4,392,449 |
The tax-based components of distributable earnings as of period end were as follows:
| Undistributed ordinary income | $65,068 |
| Capital loss carryforward | $(743,105) |
| Net unrealized appreciation (depreciation) on securities and other investments | $(220,041) |
Capital loss carryforwards are only available to offset future capital gains of the Fund to the extent provided by regulations and may be limited. The capital loss carryforward information presented below, including any applicable limitation, is estimated as of fiscal period end and is subject to adjustment.
Short-term | $(574,011) |
Long-term | (169,094) |
| Total capital loss carryforward | $(743,105) |
The tax character of distributions paid was as follows:
| | October 31, 2023 | October 31, 2022A |
| Ordinary Income | $23,630 | $- |
| Total | $23,630 | $- |
A For the period February 10, 2022 (commencement of operations) through October 31, 2022.
Restricted Securities (including Private Placements). Funds may invest in securities that are subject to legal or contractual restrictions on resale. These securities generally may be resold in transactions exempt from registration or to the public if the securities are registered. Disposal of these securities may involve time-consuming negotiations and expense, and prompt sale at an acceptable price may be difficult. Information regarding restricted securities held at period end is included at the end of the Schedule of Investments, if applicable.
4. Derivative Instruments.
Risk Exposures and the Use of Derivative Instruments. The Fund's investment objectives allow for various types of derivative instruments, including futures contracts. Derivatives are investments whose value is primarily derived from underlying assets, indices or reference rates and may be transacted on an exchange or over-the-counter (OTC). Derivatives may involve a future commitment to buy or sell a specified asset based on specified terms, to exchange future cash flows at periodic intervals based on a notional principal amount, or for one party to make one or more payments upon the occurrence of specified events in exchange for periodic payments from the other party.
Derivatives were used to increase returns and to manage exposure to certain risks as defined below. The success of any strategy involving derivatives depends on analysis of numerous economic factors, and if the strategies for investment do not work as intended, the objectives may not be achieved.
Derivatives were used to increase or decrease exposure to the following risk(s):
| Equity Risk | Equity risk relates to the fluctuations in the value of financial instruments as a result of changes in market prices (other than those arising from interest rate risk or foreign exchange risk), whether caused by factors specific to an individual investment, its issuer, or all factors affecting all instruments traded in a market or market segment. |
Funds are also exposed to additional risks from investing in derivatives, such as liquidity risk and counterparty credit risk. Liquidity risk is the risk that a fund will be unable to close out the derivative in the open market in a timely manner. Counterparty credit risk is the risk that the counterparty will not be able to fulfill its obligation to a fund. Counterparty credit risk related to exchange-traded contracts may be mitigated by the protection provided by the exchange on which they trade.
Investing in derivatives may involve greater risks than investing in the underlying assets directly and, to varying degrees, may involve risk of loss in excess of any initial investment and collateral received and amounts recognized in the Statement of Assets and Liabilities. In addition, there may be the risk that the change in value of the derivative contract does not correspond to the change in value of the underlying instrument.
Futures Contracts. A futures contract is an agreement between two parties to buy or sell a specified underlying instrument for a fixed price at a specified future date. Futures contracts were used to manage exposure to the stock market.
Upon entering into a futures contract, a fund is required to deposit either cash or securities (initial margin) with a clearing broker in an amount equal to a certain percentage of the face value of the contract. Futures contracts are marked-to-market daily and subsequent daily payments are made or received by a fund depending on the daily fluctuations in the value of the futures contracts and are recorded as unrealized appreciation or (depreciation). This receivable and/or payable, if any, is included in daily variation margin on futures contracts in the Statement of Assets and Liabilities. Realized gain or (loss) is recorded upon the expiration or closing of a futures contract. The net realized gain (loss) and change in net unrealized appreciation (depreciation) on futures contracts during the period is presented in the Statement of Operations.
Any open futures contracts at period end are presented in the Schedule of Investments under the caption "Futures Contracts". The notional amount at value reflects each contract's exposure to the underlying instrument or index at period end, and is representative of volume of activity during the period unless an average notional amount is presented. Any securities deposited to meet initial margin requirements are identified in the Schedule of Investments. Any cash deposited to meet initial margin requirements is presented as segregated cash with brokers for derivative instruments in the Statement of Assets and Liabilities.
5. Purchases and Sales of Investments.
Purchases and sales of securities, other than short-term securities and in-kind transactions, as applicable, are noted in the table below.
| | Purchases ($) | Sales ($) |
| Fidelity Sustainable Emerging Markets Equity Fund | 5,862,588 | 4,962,109 |
6. Fees and Other Transactions with Affiliates.
Management Fee. Fidelity Management & Research Company LLC (the investment adviser) and its affiliates provide the Fund with investment management related services for which the Fund pays a monthly management fee. The management fee is the sum of an individual fund fee rate that is based on an annual rate of .55% of the Fund's average net assets and an annualized group fee rate that averaged .23% during the period. The group fee rate is based upon the monthly average net assets of a group of registered investment companies with which the investment adviser has management contracts. The group fee rate decreases as assets under management increase and increases as assets under management decrease. In addition, the management fee is subject to a performance adjustment (up to a maximum of +/- .10% of the Fund's average net assets over a 36 month performance period). The upward or downward adjustment to the management fee is based on the relative investment performance of the Fund as compared to its benchmark index, the MSCI Emerging Markets Index, over the same 36 month performance period. The Fund's performance adjustment took effect on December 1, 2023. Subsequent months will be added until the performance period includes 36 months. For the reporting period, the total annual management fee rate, including the performance adjustment, was .77% of the Fund's average net assets. The performance adjustment included in the management fee rate may be higher or lower than the maximum performance adjustment rate due to the difference between the average net assets for the reporting and performance periods.
Distribution and Service Plan Fees. In accordance with Rule 12b-1 of the 1940 Act, the Fund has adopted separate Distribution and Service Plans for each class of shares. Certain classes pay Fidelity Distributors Company LLC (FDC), an affiliate of the investment adviser, separate Distribution and Service Fees, each of which is based on an annual percentage of each class' average net assets. In addition, FDC may pay financial intermediaries for selling shares of the Fund and providing shareholder support services. For the period, the Distribution and Service Fee rates, total fees and amounts retained by FDC were as follows:
| | Distribution Fee | Service Fee | Total Fees | Retained by FDC |
| Class A | -% | .25% | $589 | $492 |
| Class M | .25% | .25% | 980 | 980 |
| Class C | .75% | .25% | 1,976 | 1,949 |
| | | | $3,545 | $3,421 |
Sales Load. FDC may receive a front-end sales charge of up to 5.75% for selling Class A shares and 3.50% for selling Class M shares, some of which is paid to financial intermediaries for selling shares of the Fund. Depending on the holding period, FDC may receive contingent deferred sales charges levied on Class A, Class M and Class C redemptions. The deferred sales charges are 1.00% for Class C shares, 1.00% for certain purchases of Class A shares and .25% for certain purchases of Class M shares. For the period, there were no sales charge amounts retained by FDC.
Transfer Agent Fees. Fidelity Investments Institutional Operations Company LLC (FIIOC), an affiliate of the investment adviser, is the transfer, dividend disbursing and shareholder servicing agent for each class of the Fund. FIIOC receives account fees and asset-based fees that vary according to the account size and type of account of the shareholders of the respective classes of the Fund, except for Class Z. FIIOC receives an asset-based fee of Class Z's average net assets. FIIOC pays for typesetting, printing and mailing of shareholder reports, except proxy statements.
For the period, transfer agent fees for each class were as follows:
| | Amount | % of Class-Level Average Net Assets |
| Class A | $515 | .22 |
| Class M | 233 | .12 |
| Class C | 233 | .12 |
| Fidelity Sustainable Emerging Markets Equity Fund | 8,031 | .25 |
| Class I | 257 | .12 |
| Class Z | 151 | .04 |
| | $9,420 | |
During November 2023, the Board approved a change in the transfer agent fees effective December 1, 2023 to a fixed annual rate of class-level average net assets as follows:
| | % of Class-Level Average Net Assets |
| Class A | 0.1963% |
| Class M | 0.1153% |
| Class C | 0.1151% |
| Fidelity Sustainable Emerging Markets Equity Fund | 0.2000% |
| Class I | 0.1217% |
Accounting Fees. Fidelity Service Company, Inc. (FSC), an affiliate of the investment adviser, maintains the Fund's accounting records. The accounting fee is based on the level of average net assets for each month. For the period, the fees were equivalent to the following annual rates:
| | % of Average Net Assets |
| Fidelity Sustainable Emerging Markets Equity Fund | .05 |
During November 2023, the Board approved a change in the accounting fees effective December 1, 2023 to a fixed annual rate of average net assets as follows:
| | % of Average Net Assets |
| Fidelity Sustainable Emerging Markets Equity Fund | 0.0498% |
Brokerage Commissions. A portion of portfolio transactions were placed with brokerage firms which are affiliates of the investment adviser. Brokerage commissions are included in net realized gain (loss) and change in net unrealized appreciation (depreciation) in the Statement of Operations. The commissions paid to these affiliated firms were as follows:
| | Amount |
| Fidelity Sustainable Emerging Markets Equity Fund | $20 |
Interfund Trades. Funds may purchase from or sell securities to other Fidelity Funds under procedures adopted by the Board. The procedures have been designed to ensure these interfund trades are executed in accordance with Rule 17a-7 of the 1940 Act. Any interfund trades are included within the respective purchases and sales amounts shown in the Purchases and Sales of Investments note. Interfund trades during the period are noted in the table below.
| | Purchases ($) | Sales ($) | Realized Gain (Loss) ($) |
| Fidelity Sustainable Emerging Markets Equity Fund | 51,220 | 136,924 | (24,057) |
7. Committed Line of Credit.
Certain Funds participate with other funds managed by the investment adviser or an affiliate in a $4.25 billion credit facility (the "line of credit") to be utilized for temporary or emergency purposes to fund shareholder redemptions or for other short-term liquidity purposes. The participating funds have agreed to pay commitment fees on their pro-rata portion of the line of credit, which are reflected in Miscellaneous expenses on the Statement of Operations, and are listed below. During the period, there were no borrowings on this line of credit.
| | Amount |
| Fidelity Sustainable Emerging Markets Equity Fund | $8 |
8. Expense Reductions.
The investment adviser contractually agreed to reimburse expenses of each class to the extent annual operating expenses exceeded certain levels of class-level average net assets as noted in the table below. This reimbursement will remain in place through February 28, 2025. Some expenses, for example the compensation of the independent Trustees, and certain miscellaneous expenses such as proxy and shareholder meeting expenses, are excluded from this reimbursement.
The following classes were in reimbursement during the period:
| | Expense Limitations | Reimbursement |
| Class A | 1.50% | $11,620 |
| Class M | 1.75% | 9,453 |
| Class C | 2.25% | 9,518 |
| Fidelity Sustainable Emerging Markets Equity Fund | 1.25% | 160,230 |
| Class I | 1.25% | 9,941 |
| Class Z | 1.10% | 17,115 |
| | | $217,877 |
Through arrangements with the Fund's custodian, credits realized as a result of certain uninvested cash balances were used to reduce the Fund's expenses. During the period, custodian credits reduced the Fund's expenses by $407.
In addition, during the period the investment adviser or an affiliate reimbursed and/or waived a portion of fund-level operating expenses in the amount of $268.
9. Distributions to Shareholders.
Distributions to shareholders of each class were as follows:
| | Year ended October 31, 2023 | Year ended October 31, 2022A |
| Fidelity Sustainable Emerging Markets Equity Fund | | |
| Distributions to shareholders | | |
| Class A | $1,114 | $- |
| Class M | 450 | - |
| Fidelity Sustainable Emerging Markets Equity Fund | 18,515 | - |
| Class I | 1,326 | - |
| Class Z | 2,225 | - |
Total | $23,630 | $- |
A For the period February 10, 2022 (commencement of operations) through October 31, 2022.
10. Share Transactions.
Share transactions for each class were as follows and may contain in-kind transactions, automatic conversions between classes or exchanges between affiliated funds:
| | Shares | Shares | Dollars | Dollars |
| | Year ended October 31, 2023 | Year ended October 31, 2022A | Year ended October 31, 2023 | Year ended October 31, 2022A |
| Fidelity Sustainable Emerging Markets Equity Fund | | | | |
| Class A | | | | |
| Shares sold | 8,323 | 25,041 | $64,307 | $250,393 |
| Reinvestment of distributions | 147 | - | 1,114 | - |
| Shares redeemed | (3,050) | (41) | (25,227) | (320) |
| Net increase (decrease) | 5,420 | 25,000 | $40,194 | $250,073 |
| Class M | | | | |
| Shares sold | 11 | 25,000 | $89 | $250,003 |
| Reinvestment of distributions | 59 | - | 450 | - |
| Net increase (decrease) | 70 | 25,000 | $539 | $250,003 |
| Class C | | | | |
| Shares sold | 848 | 25,000 | $6,892 | $250,000 |
| Shares redeemed | (532) | - | (4,129) | - |
| Net increase (decrease) | 316 | 25,000 | $2,763 | $250,000 |
| Fidelity Sustainable Emerging Markets Equity Fund | | | | |
| Shares sold | 371,692 | 382,605 | $2,989,168 | $3,306,578 |
| Reinvestment of distributions | 2,252 | - | 17,120 | - |
| Shares redeemed | (291,557) | (65,540) | (2,290,199) | (507,726) |
| Net increase (decrease) | 82,387 | 317,065 | $716,089 | $2,798,852 |
| Class I | | | | |
| Shares sold | 2,102 | 25,000 | $17,000 | $250,000 |
| Reinvestment of distributions | 174 | - | 1,326 | - |
| Net increase (decrease) | 2,276 | 25,000 | $18,326 | $250,000 |
| Class Z | | | | |
| Shares sold | 14,147 | 42,008 | $113,210 | $369,361 |
| Reinvestment of distributions | 174 | - | 1,326 | - |
| Shares redeemed | (3,509) | (52) | (26,075) | (404) |
| Net increase (decrease) | 10,812 | 41,956 | $88,461 | $368,957 |
A For the period February 10, 2022 (commencement of operations) through October 31, 2022.
11. Other.
A fund's organizational documents provide former and current trustees and officers with a limited indemnification against liabilities arising in connection with the performance of their duties to the fund. In the normal course of business, a fund may also enter into contracts that provide general indemnifications. A fund's maximum exposure under these arrangements is unknown as this would be dependent on future claims that may be made against a fund. The risk of material loss from such claims is considered remote.
At the end of the period, the investment adviser or its affiliates were owners of record of more than 10% of the outstanding shares as follows:
| | Affiliated % |
| Fidelity Sustainable Emerging Markets Equity Fund | 32% |
In addition, at the end of the period, the following mutual funds managed by the investment adviser or its affiliates were the owners of record of 10% or more of the total outstanding shares.
| | Fidelity Sustainable Multi-Asset Fund |
| Fidelity Sustainable Emerging Markets Equity Fund | 18% |
12. Risk and Uncertainties.
Many factors affect a fund's performance. Developments that disrupt global economies and financial markets, such as pandemics, epidemics, outbreaks of infectious diseases, war, terrorism, and environmental disasters, may significantly affect a fund's investment performance. The effects of these developments to a fund will be impacted by the types of securities in which a fund invests, the financial condition, industry, economic sector, and geographic location of an issuer, and a fund's level of investment in the securities of that issuer. Significant concentrations in security types, issuers, industries, sectors, and geographic locations may magnify the factors that affect a fund's performance.
To the Board of Trustees of Fidelity Investment Trust and Shareholders of Fidelity Sustainable Emerging Markets Equity Fund
Opinion on the Financial Statements
We have audited the accompanying statement of assets and liabilities, including the schedule of investments, of Fidelity Sustainable Emerging Markets Equity Fund (one of the funds constituting Fidelity Investment Trust, referred to hereafter as the "Fund") as of October 31, 2023, the related statement of operations for the year ended October 31, 2023, and the statement of changes in net assets and the financial highlights for the year ended October 31, 2023 and for the period February 10, 2022 (commencement of operations) through October 31, 2022, including the related notes (collectively referred to as the "financial statements"). In our opinion, the financial statements present fairly, in all material respects, the financial position of the Fund as of October 31, 2023, the results of its operations for the year ended October 31, 2023, and the changes in its net assets and the financial highlights for the year ended October 31, 2023 and for the period February 10, 2022 (commencement of operations) through October 31, 2022 in conformity with accounting principles generally accepted in the United States of America.
Basis for Opinion
These financial statements are the responsibility of the Fund's management. Our responsibility is to express an opinion on the Fund's financial statements based on our audits. We are a public accounting firm registered with the Public Company Accounting Oversight Board (United States) (PCAOB) and are required to be independent with respect to the Fund in accordance with the U.S. federal securities laws and the applicable rules and regulations of the Securities and Exchange Commission and the PCAOB.
We conducted our audits of these financial statements in accordance with the standards of the PCAOB. Those standards require that we plan and perform the audit to obtain reasonable assurance about whether the financial statements are free of material misstatement, whether due to error or fraud.
Our audits included performing procedures to assess the risks of material misstatement of the financial statements, whether due to error or fraud, and performing procedures that respond to those risks. Such procedures included examining, on a test basis, evidence regarding the amounts and disclosures in the financial statements. Our audits also included evaluating the accounting principles used and significant estimates made by management, as well as evaluating the overall presentation of the financial statements. Our procedures included confirmation of securities owned as of October 31, 2023 by correspondence with the custodian and brokers; when replies were not received from brokers, we performed other auditing procedures. We believe that our audits provide a reasonable basis for our opinion.
/s/ PricewaterhouseCoopers LLP
Boston, Massachusetts
December 14, 2023
We have served as the auditor of one or more investment companies in the Fidelity group of funds since 1932.
The Trustees, Members of the Advisory Board (if any), and officers of the trust and fund, as applicable, are listed below. The Board of Trustees governs the fund and is responsible for protecting the interests of shareholders. The Trustees are experienced executives who meet periodically throughout the year to oversee the fund's activities, review contractual arrangements with companies that provide services to the fund, oversee management of the risks associated with such activities and contractual arrangements, and review the fund's performance. Except for Jonathan Chiel, each of the Trustees oversees 322 funds. Mr. Chiel oversees 191 funds.
The Trustees hold office without limit in time except that (a) any Trustee may resign; (b) any Trustee may be removed by written instrument, signed by at least two-thirds of the number of Trustees prior to such removal; (c) any Trustee who requests to be retired or who has become incapacitated by illness or injury may be retired by written instrument signed by a majority of the other Trustees; and (d) any Trustee may be removed at any special meeting of shareholders by a two-thirds vote of the outstanding voting securities of the trust. Each Trustee who is not an interested person (as defined in the 1940 Act) of the trust and the fund is referred to herein as an Independent Trustee. Each Independent Trustee shall retire not later than the last day of the calendar year in which his or her 75th birthday occurs. The Independent Trustees may waive this mandatory retirement age policy with respect to individual Trustees. Officers and Advisory Board Members hold office without limit in time, except that any officer or Advisory Board Member may resign or may be removed by a vote of a majority of the Trustees at any regular meeting or any special meeting of the Trustees. Except as indicated, each individual has held the office shown or other offices in the same company for the past five years.
The fund's Statement of Additional Information (SAI) includes more information about the Trustees. To request a free copy, call Fidelity at 1-800-544-8544 if you're an individual investing directly with Fidelity, call 1-800-835-5092 if you're a plan sponsor or participant with Fidelity as your recordkeeper or call 1-877-208-0098 on institutional accounts or if you're an advisor or invest through one.
Experience, Skills, Attributes, and Qualifications of the Trustees. The Governance and Nominating Committee has adopted a statement of policy that describes the experience, qualifications, attributes, and skills that are necessary and desirable for potential Independent Trustee candidates (Statement of Policy). The Board believes that each Trustee satisfied at the time he or she was initially elected or appointed a Trustee, and continues to satisfy, the standards contemplated by the Statement of Policy. The Governance and Nominating Committee also engages professional search firms to help identify potential Independent Trustee candidates who have the experience, qualifications, attributes, and skills consistent with the Statement of Policy. From time to time, additional criteria based on the composition and skills of the current Independent Trustees, as well as experience or skills that may be appropriate in light of future changes to board composition, business conditions, and regulatory or other developments, have also been considered by the professional search firms and the Governance and Nominating Committee. In addition, the Board takes into account the Trustees' commitment and participation in Board and committee meetings, as well as their leadership of standing and ad hoc committees throughout their tenure.
In determining that a particular Trustee was and continues to be qualified to serve as a Trustee, the Board has considered a variety of criteria, none of which, in isolation, was controlling. The Board believes that, collectively, the Trustees have balanced and diverse experience, qualifications, attributes, and skills, which allow the Board to operate effectively in governing the fund and protecting the interests of shareholders. Information about the specific experience, skills, attributes, and qualifications of each Trustee, which in each case led to the Board's conclusion that the Trustee should serve (or continue to serve) as a trustee of the fund, is provided below.
Board Structure and Oversight Function. Robert A. Lawrence is an interested person and currently serves as Chair. The Trustees have determined that an interested Chair is appropriate and benefits shareholders because an interested Chair has a personal and professional stake in the quality and continuity of services provided to the fund. Independent Trustees exercise their informed business judgment to appoint an individual of their choosing to serve as Chair, regardless of whether the Trustee happens to be independent or a member of management. The Independent Trustees have determined that they can act independently and effectively without having an Independent Trustee serve as Chair and that a key structural component for assuring that they are in a position to do so is for the Independent Trustees to constitute a substantial majority for the Board. The Independent Trustees also regularly meet in executive session. David M. Thomas serves as Lead Independent Trustee and as such (i) acts as a liaison between the Independent Trustees and management with respect to matters important to the Independent Trustees and (ii) with management prepares agendas for Board meetings.
Fidelity® funds are overseen by different Boards of Trustees. The fund's Board oversees Fidelity's high income and certain equity funds, and other Boards oversee Fidelity's alternative investment, investment-grade bond, money market, asset allocation, and other equity funds. The asset allocation funds may invest in Fidelity® funds overseen by the fund's Board. The use of separate Boards, each with its own committee structure, allows the Trustees of each group of Fidelity® funds to focus on the unique issues of the funds they oversee, including common research, investment, and operational issues. On occasion, the separate Boards establish joint committees to address issues of overlapping consequences for the Fidelity® funds overseen by each Board.
The Trustees operate using a system of committees to facilitate the timely and efficient consideration of all matters of importance to the Trustees, the fund, and fund shareholders and to facilitate compliance with legal and regulatory requirements and oversight of the fund's activities and associated risks. The Board, acting through its committees, has charged FMR and its affiliates with (i) identifying events or circumstances the occurrence of which could have demonstrably adverse effects on the fund's business and/or reputation; (ii) implementing processes and controls to lessen the possibility that such events or circumstances occur or to mitigate the effects of such events or circumstances if they do occur; and (iii) creating and maintaining a system designed to evaluate continuously business and market conditions in order to facilitate the identification and implementation processes described in (i) and (ii) above. Because the day-to-day operations and activities of the fund are carried out by or through FMR, its affiliates, and other service providers, the fund's exposure to risks is mitigated but not eliminated by the processes overseen by the Trustees. While each of the Board's committees has responsibility for overseeing different aspects of the fund's activities, oversight is exercised primarily through the Operations, Audit, and Compliance Committees. Appropriate personnel, including but not limited to the fund's Chief Compliance Officer (CCO), FMR's internal auditor, the independent accountants, the fund's Treasurer and portfolio management personnel, make periodic reports to the Board's committees, as appropriate, including an annual review of Fidelity's risk management program for the Fidelity® funds. The responsibilities of each standing committee, including their oversight responsibilities, are described further under "Standing Committees of the Trustees."
Interested Trustees*:
Correspondence intended for a Trustee who is an interested person may be sent to Fidelity Investments, 245 Summer Street, Boston, Massachusetts 02210.
Name, Year of Birth; Principal Occupations and Other Relevant Experience+
Jonathan Chiel (1957)
Year of Election or Appointment: 2016
Trustee
Mr. Chiel also serves as Trustee of other Fidelity® funds. Mr. Chiel is General Counsel (2012-present) and Head of Legal, Risk and Compliance (2022-present). Mr Chiel serves as Executive Vice President and General Counsel for FMR LLC (diversified financial services company, 2012-present) and Director and President for OH Company LLC (holding company, 2018-present). Previously, Mr. Chiel served as general counsel (2004-2012) and senior vice president and deputy general counsel (2000-2004) for John Hancock Financial Services; a partner with Choate, Hall & Stewart (1996-2000) (law firm); and an Assistant United States Attorney for the United States Attorney's Office of the District of Massachusetts (1986-95), including Chief of the Criminal Division (1993-1995). Mr. Chiel is a director on the boards of the Boston Bar Foundation and the Maimonides School.
Bettina Doulton (1964)
Year of Election or Appointment: 2021
Trustee
Ms. Doulton also serves as Trustee of other Fidelity® funds. Prior to her retirement, Ms. Doulton served in a variety of positions at Fidelity Investments, including as a managing director of research (2006-2007), portfolio manager to certain Fidelity® funds (1993-2005), equity analyst and portfolio assistant (1990-1993), and research assistant (1987-1990). Ms. Doulton currently owns and operates Phi Builders + Architects and Cellardoor Winery. Previously, Ms. Doulton served as a member of the Board of Brown Capital Management, LLC (2014-2018).
Robert A. Lawrence (1952)
Year of Election or Appointment: 2020
Trustee
Chair of the Board of Trustees
Mr. Lawrence also serves as Trustee of other funds. Previously, Mr. Lawrence served as a Trustee and Member of the Advisory Board of certain funds. Prior to his retirement in 2008, Mr. Lawrence served as Vice President of certain Fidelity® funds (2006-2008), Senior Vice President, Head of High Income Division of Fidelity Management & Research Company (investment adviser firm, 2006-2008), and President of Fidelity Strategic Investments (investment adviser firm, 2002-2005).
* Determined to be an "Interested Trustee" by virtue of, among other things, his or her affiliation with the trust or various entities under common control with FMR.
+ The information includes the Trustee's principal occupation during the last five years and other information relating to the experience, attributes, and skills relevant to the Trustee's qualifications to serve as a Trustee, which led to the conclusion that the Trustee should serve as a Trustee for the fund.
Independent Trustees:
Correspondence intended for an Independent Trustee may be sent to Fidelity Investments, P.O. Box 55235, Boston, Massachusetts 02205-5235.
Name, Year of Birth; Principal Occupations and Other Relevant Experience+
Thomas P. Bostick (1956)
Year of Election or Appointment: 2021
Trustee
Lieutenant General Bostick also serves as Trustee of other Fidelity® funds. Prior to his retirement, General Bostick (United States Army, Retired) held a variety of positions within the U.S. Army, including Commanding General and Chief of Engineers, U.S. Army Corps of Engineers (2012-2016) and Deputy Chief of Staff and Director of Human Resources, U.S. Army (2009-2012). General Bostick currently serves as a member of the Board and Finance and Governance & Sustainability Committees of CSX Corporation (transportation, 2020-present) and a member of the Board and Corporate Governance and Nominating Committee of Perma-Fix Environmental Services, Inc. (nuclear waste management, 2020-present). General Bostick serves as Chief Executive Officer of Bostick Global Strategies, LLC (consulting, 2016-present), as a member of the Board of HireVue, Inc. (video interview and assessment, 2020-present), as a member of the Board of Allonnia (biotechnology and engineering solutions, 2022-present) and on the Advisory Board of Solugen, Inc. (specialty bio-based chemicals manufacturer, 2022-present). Previously, General Bostick served as a Member of the Advisory Board of certain Fidelity® funds (2021), President, Intrexon Bioengineering (2018-2020) and Chief Operating Officer (2017-2020) and Senior Vice President of the Environment Sector (2016-2017) of Intrexon Corporation (biopharmaceutical company).
Dennis J. Dirks (1948)
Year of Election or Appointment: 2005
Trustee
Mr. Dirks also serves as Trustee of other Fidelity® funds. Prior to his retirement in May 2003, Mr. Dirks served as Chief Operating Officer and as a member of the Board of The Depository Trust & Clearing Corporation (financial markets infrastructure), President, Chief Operating Officer and a member of the Board of The Depository Trust Company (DTC), President and a member of the Board of the National Securities Clearing Corporation (NSCC), Chief Executive Officer and a member of the Board of the Government Securities Clearing Corporation and Chief Executive Officer and a member of the Board of the Mortgage-Backed Securities Clearing Corporation. Mr. Dirks currently serves as a member of the Finance Committee (2016-present) and Board (2017-present) and is Treasurer (2018-present) of the Asolo Repertory Theatre.
Donald F. Donahue (1950)
Year of Election or Appointment: 2018
Trustee
Mr. Donahue also serves as Trustee of other Fidelity® funds. Mr. Donahue serves as President and Chief Executive Officer of Miranda Partners, LLC (risk consulting for the financial services industry, 2012-present). Previously, Mr. Donahue served as Chief Executive Officer (2006-2012), Chief Operating Officer (2003-2006) and Managing Director, Customer Marketing and Development (1999-2003) of The Depository Trust & Clearing Corporation (financial markets infrastructure). Mr. Donahue currently serves as a member (2007-present) and Co-Chairman (2016-present) of the Board of United Way of New York. Mr. Donahue previously served as a member of the Advisory Board of certain Fidelity® funds (2015-2018) and as a member of the Board of The Leadership Academy (previously NYC Leadership Academy) (2012-2022).
Vicki L. Fuller (1957)
Year of Election or Appointment: 2020
Trustee
Ms. Fuller also serves as Trustee of other Fidelity® funds. Previously, Ms. Fuller served as a member of the Advisory Board of certain Fidelity® funds (2018-2020), Chief Investment Officer of the New York State Common Retirement Fund (2012-2018) and held a variety of positions at AllianceBernstein L.P. (global asset management, 1985-2012), including Managing Director (2006-2012) and Senior Vice President and Senior Portfolio Manager (2001-2006). Ms. Fuller currently serves as a member of the Board, Audit Committee and Nominating and Governance Committee of two Blackstone business development companies (2020-present), as a member of the Board of Treliant, LLC (consulting, 2019-present), as a member of the Board of Ariel Alternatives, LLC (private equity, 2022-present) and as a member of the Board and Chair of the Audit Committee of Gusto, Inc. (software, 2021-present). In addition, Ms. Fuller currently serves as a member of the Board of Roosevelt University (2019-present) and as a member of the Executive Board of New York University's Stern School of Business. Ms. Fuller previously served as a member of the Board, Audit Committee and Nominating and Governance Committee of The Williams Companies, Inc. (natural gas infrastructure, 2018-2021).
Patricia L. Kampling (1959)
Year of Election or Appointment: 2020
Trustee
Ms. Kampling also serves as Trustee of other Fidelity® funds. Prior to her retirement, Ms. Kampling served as Chairman of the Board and Chief Executive Officer (2012-2019), President and Chief Operating Officer (2011-2012) and Executive Vice President and Chief Financial Officer (2010-2011) of Alliant Energy Corporation. Ms. Kampling currently serves as a member of the Board, Finance Committee and Governance, Compensation and Nominating Committee of Xcel Energy Inc. (utilities company, 2020-present) and as a member of the Board, Audit, Finance and Risk Committee and Safety, Environmental, Technology and Operations Committee and Chair of the Executive Development and Compensation Committee of American Water Works Company, Inc. (utilities company, 2019-present). In addition, Ms. Kampling currently serves as a member of the Board of the Nature Conservancy, Wisconsin Chapter (2019-present). Previously, Ms. Kampling served as a Member of the Advisory Board of certain Fidelity® funds (2020), a member of the Board, Compensation Committee and Executive Committee and Chair of the Audit Committee of Briggs & Stratton Corporation (manufacturing, 2011-2021), a member of the Board of Interstate Power and Light Company (2012-2019) and Wisconsin Power and Light Company (2012-2019) (each a subsidiary of Alliant Energy Corporation) and as a member of the Board and Workforce Development Committee of the Business Roundtable (2018-2019).
Thomas A. Kennedy (1955)
Year of Election or Appointment: 2021
Trustee
Mr. Kennedy also serves as Trustee of other Fidelity® funds. Previously, Mr. Kennedy served as a Member of the Advisory Board of certain Fidelity® funds (2020) and held a variety of positions at Raytheon Company (aerospace and defense, 1983-2020), including Chairman and Chief Executive Officer (2014-2020) and Executive Vice President and Chief Operating Officer (2013-2014). Mr. Kennedy served as Executive Chairman of the Board of Directors of Raytheon Technologies Corporation (aerospace and defense, 2020-2021). Mr. Kennedy serves as a Director of the Board of Directors of Textron Inc. (aerospace and defense, 2023-present).
Oscar Munoz (1959)
Year of Election or Appointment: 2021
Trustee
Mr. Munoz also serves as Trustee of other Fidelity® funds. Prior to his retirement, Mr. Munoz served as Executive Chairman (2020-2021), Chief Executive Officer (2015-2020), President (2015-2016) and a member of the Board (2010-2021) of United Airlines Holdings, Inc. Mr. Munoz currently serves as a member of the Board of CBRE Group, Inc. (commercial real estate, 2020-present), a member of the Board of Univision Communications, Inc. (Hispanic media, 2020-present), a member of the Board of Archer Aviation Inc. (2021-present), a member of the Defense Business Board of the United States Department of Defense (2021-present) and a member of the Board of Salesforce.com, Inc. (cloud-based software, 2022-present). Previously, Mr. Munoz served as a Member of the Advisory Board of certain Fidelity® funds (2021).
David M. Thomas (1949)
Year of Election or Appointment: 2008
Trustee
Lead Independent Trustee
Mr. Thomas also serves as Trustee of other Fidelity® funds. Previously, Mr. Thomas served as Executive Chairman (2005-2006) and Chairman and Chief Executive Officer (2000-2005) of IMS Health, Inc. (pharmaceutical and healthcare information solutions). Mr. Thomas currently serves as a member of the Board of Fortune Brands Home and Security (home and security products, 2004-present) and as Director (2013-present) and Non-Executive Chairman of the Board (2022-present) of Interpublic Group of Companies, Inc. (marketing communication).
Susan Tomasky (1953)
Year of Election or Appointment: 2020
Trustee
Ms. Tomasky also serves as Trustee of other Fidelity® funds. Prior to her retirement, Ms. Tomasky served in various executive officer positions at American Electric Power Company, Inc. (1998-2011), including most recently as President of AEP Transmission (2007-2011). Ms. Tomasky currently serves as a member of the Board and Sustainability Committee and as Chair of the Audit Committee of Marathon Petroleum Corporation (2018-present) and as a member of the Board, Executive Committee, Corporate Governance Committee and Organization and Compensation Committee and as Lead Director of the Board of Public Service Enterprise Group, Inc. (utilities company, 2012-present) and as a member of the Board of its subsidiary company, Public Service Electric and Gas Co. (2021-present). In addition, Ms. Tomasky currently serves as a member (2009-present) and President (2020-present) of the Board of the Royal Shakespeare Company - America (2009-present), as a member of the Board of the Columbus Association for the Performing Arts (2011-present) and as a member of the Board and Kenyon in the World Committee of Kenyon College (2016-present). Previously, Ms. Tomasky served as a Member of the Advisory Board of certain Fidelity® funds (2020), as a member of the Board of the Columbus Regional Airport Authority (2007-2020), as a member of the Board (2011-2018) and Lead Independent Director (2015-2018) of Andeavor Corporation (previously Tesoro Corporation) (independent oil refiner and marketer) and as a member of the Board of Summit Midstream Partners LP (energy, 2012-2018).
Michael E. Wiley (1950)
Year of Election or Appointment: 2020
Trustee
Mr. Wiley also serves as Trustee of other Fidelity® funds. Previously, Mr. Wiley served as a member of the Advisory Board of certain Fidelity® funds (2018-2020), Chairman, President and CEO of Baker Hughes, Inc. (oilfield services, 2000-2004). Mr. Wiley also previously served as a member of the Board of Andeavor Corporation (independent oil refiner and marketer, 2005-2018), a member of the Board of Andeavor Logistics LP (natural resources logistics, 2015-2018) and a member of the Board of High Point Resources (exploration and production, 2005-2020).
+ The information includes the Trustee's principal occupation during the last five years and other information relating to the experience, attributes, and skills relevant to the Trustee's qualifications to serve as a Trustee, which led to the conclusion that the Trustee should serve as a Trustee for the fund.
Advisory Board Members and Officers:
Correspondence intended for a Member of the Advisory Board (if any) may be sent to Fidelity Investments, P.O. Box 55235, Boston, Massachusetts 02205-5235. Correspondence intended for an officer or Peter S. Lynch may be sent to Fidelity Investments, 245 Summer Street, Boston, Massachusetts 02210.
Name, Year of Birth; Principal Occupation
Vijay C. Advani (1960)
Year of Election or Appointment: 2023
Member of the Advisory Board
Mr. Advani also serves as Trustee or Member of the Advisory Board of other funds. Previously, Mr. Advani served as Executive Chairman (2020-2022), Chief Executive Officer (2017-2020) and Chief Operating Officer (2016-2017) of Nuveen (global investment manager). He also served in various capacities at Franklin Resources (global investment manager), including Co-President (2015-2016), Executive Vice President, Global Advisory Services (2008-2015), Head of Global Retail Distribution (2005-2008), Executive Managing Director, International Retail Development (2002-2005), Managing Director, Product Developments, Sales & Marketing, Asia, Eastern Europe and Africa (2000-2002) and President, Templeton Asset Management India (1995-2000). Mr. Advani also served as Senior Investment Officer of International Finance Corporation (private equity and venture capital arm of The World Bank, 1984-1995). Mr. Advani is Chairman Emeritus of the U.S. India Business Council (2018-present), a Director of The Global Impact Investing Network (2019-present), a Director of LOK Capital (Mauritius) (2022-present), a member of the Advisory Council of LOK Capital (2022-present), a Senior Advisor of Neuberger Berman (2021-present), a Senior Advisor of Seviora Holdings Pte. Ltd (Temasek-Singapore) (2021-present), a Director of Seviora Capital (Singapore) (2021-present) and an Advisor of EQUIAM (2021-present). Mr. Advani formerly served as a member of the Board of BowX Acquisition Corp. (special purpose acquisition company, 2020-2021), a member of the Board of Intellecap (advisory arm of The Aavishkaar Group, 2018-2020), a member of the Board of Nuveen Investments, Inc. (2017-2020) and a member of the Board of Docusign (software, 2016-2019).
Peter S. Lynch (1944)
Year of Election or Appointment: 2003
Member of the Advisory Board
Mr. Lynch also serves as a Member of the Advisory Board of other Fidelity® funds. Mr. Lynch is Vice Chairman and a Director of Fidelity Management & Research Company LLC (investment adviser firm). In addition, Mr. Lynch serves as a Trustee of Boston College and as the Chairman of the Inner-City Scholarship Fund. Previously, Mr. Lynch served as Vice Chairman and a Director of FMR Co., Inc. (investment adviser firm) and on the Special Olympics International Board of Directors (1997-2006).
Karen B. Peetz (1955)
Year of Election or Appointment: 2023
Member of the Advisory Board
Ms. Peetz also serves as a Member of the Advisory Board of other funds. Previously, Ms. Peetz served as Chief Administration Officer (2020-2023) of Citigroup Inc. (a diversified financial service company). She also served in various capacities at Bank of New York Mellon Corporation, including President (2013-2016), Vice Chairman, Senior Executive Vice President and Chief Executive Officer of Financial Markets & Treasury Services (2010-2013), Senior Executive Vice President and Chief Executive Officer of Global Corporate Trust (2003-2008), Senior Vice President and Division Manager of Global Payments & Trade Services (2002-2003) and Senior Vice President and Division Manager of Domestic Corporate Trust (1998-2002). Ms. Peetz also served in various capacities at Chase Manhattan Corporation (1982-1998), including Senior Vice President and Manager of Corporate Trust International Business (1996-1998), Managing Director and Manager of Corporate Trust Services (1994-1996) and Managing Director and Group Manager of Financial Institution Sales (1990-1993). Ms. Peetz currently serves as Chair of Amherst Holdings Advisory Council (2018-present), Trustee of Johns Hopkins University (2016-present), Chair of the Carey Business School Advisory Council, Member of the Johns Hopkins Medicine Board and Finance Committee and Chair of the Lyme and Tick Related Disease Institute Advisory Council. Ms. Peetz previously served as a member of the Board of Guardian Life Insurance Company of America (2019-2023), a member of the Board of Trane Technologies (2018-2022), a member of the Board of Wells Fargo Corp. (2017-2019), a member of the Board of SunCoke Energy Inc. (2012-2016), a member of the Board of Private Export Funding Corporation (2010-2016) and as a Trustee of Penn State University (2010-2014) and the United Way of New York City (2008-2010).
Heather Bonner (1977)
Year of Election or Appointment: 2023
Assistant Treasurer
Ms. Bonner also serves as an officer of other funds. Ms. Bonner is a Senior Vice President (2022-present) and is an employee of Fidelity Investments (2022-present). Ms. Bonner serves as Vice President, Treasurer, or Assistant Treasurer of certain Fidelity entities. Prior to joining Fidelity, Ms. Bonner served as Managing Director at AQR Capital Management (2013-2022) and was the Treasurer and Principal Financial Officer of the AQR Funds (2013-2022).
Craig S. Brown (1977)
Year of Election or Appointment: 2022
Deputy Treasurer
Mr. Brown also serves as an officer of other funds. Mr. Brown is a Vice President (2015-present) and is an employee of Fidelity Investments. Mr. Brown serves as Assistant Treasurer of FIMM, LLC (2021-present). Previously, Mr. Brown served as Assistant Treasurer of certain Fidelity® funds (2019-2022).
John J. Burke III (1964)
Year of Election or Appointment: 2018
Chief Financial Officer
Mr. Burke also serves as Chief Financial Officer of other funds. Mr. Burke is Head of Fidelity Fund and Investment Operations (2018-present) and is an employee of Fidelity Investments. Mr. Burke serves as President, Executive Vice President, or Director of certain Fidelity entities. Previously Mr. Burke served as head of Asset Management Investment Operations (2012-2018).
Margaret Carey (1973)
Year of Election or Appointment: 2023
Secretary and Chief Legal Officer (CLO)
Ms. Carey also serves as an officer of other funds and as CLO of certain Fidelity entities. Ms. Carey is a Senior Vice President, Deputy General Counsel (2019-present) and is an employee of Fidelity Investments.
William C. Coffey (1969)
Year of Election or Appointment: 2019
Assistant Secretary
Mr. Coffey also serves as Assistant Secretary of other funds. Mr. Coffey is a Senior Vice President, Deputy General Counsel (2010-present) and is an employee of Fidelity Investments. Previously, Mr. Coffey served as Secretary and CLO of certain funds (2018-2019); CLO, Secretary, or Senior Vice President of certain Fidelity entities and Assistant Secretary of certain funds (2009-2018).
Timothy M. Cohen (1969)
Year of Election or Appointment: 2018
Vice President
Mr. Cohen also serves as Vice President of other funds. Mr. Cohen is Co-Head of Equity (2018-present) and is an employee of Fidelity Investments. Mr. Cohen serves a Director of Fidelity Management & Research (Japan) Limited (investment adviser firm, 2016-present). Previously, Mr. Cohen served as Executive Vice President of Fidelity SelectCo, LLC (2019) and Head of Global Equity Research (2016-2018).
Jonathan Davis (1968)
Year of Election or Appointment: 2010
Assistant Treasurer
Mr. Davis also serves as an officer of other funds. Mr. Davis is a Vice President (2006-present) and is an employee of Fidelity Investments. Mr. Davis serves as Assistant Treasurer of certain Fidelity entities.
Laura M. Del Prato (1964)
Year of Election or Appointment: 2018
Assistant Treasurer
Ms. Del Prato also serves as an officer of other funds. Ms. Del Prato is a Senior Vice President (2017-present) and is an employee of Fidelity Investments. Ms. Del Prato serves as Vice President or Assistant Treasurer of certain Fidelity entities. Previously, Ms. Del Prato served as President and Treasurer of The North Carolina Capital Management Trust: Cash Portfolio and Term Portfolio (2018-2020).
Colm A. Hogan (1973)
Year of Election or Appointment: 2020
Assistant Treasurer
Mr. Hogan also serves as an officer of other funds. Mr. Hogan is a Vice President (2016-present) and is an employee of Fidelity Investments. Mr. Hogan serves as Assistant Treasurer of certain Fidelity entities. Previously, Mr. Hogan served as Deputy Treasurer of certain Fidelity® funds (2016-2020) and Assistant Treasurer of certain Fidelity® funds (2016-2018).
Pamela R. Holding (1964)
Year of Election or Appointment: 2018
Vice President
Ms. Holding also serves as Vice President of other funds. Ms. Holding is Co-Head of Equity (2018-present) and is an employee of Fidelity Investments. Previously, Ms. Holding served as Executive Vice President of Fidelity SelectCo, LLC (2019) and as Chief Investment Officer of Fidelity Institutional Asset Management (2013-2018).
Chris Maher (1972)
Year of Election or Appointment: 2020
Deputy Treasurer
Mr. Maher also serves as an officer of other funds. Mr. Maher is a Vice President (2008-present) and is an employee of Fidelity Investments. Mr. Maher serves as Assistant Treasurer of certain Fidelity entities. Previously, Mr. Maher served as Assistant Treasurer of certain funds (2013-2020).
Jason P. Pogorelec (1975)
Year of Election or Appointment: 2020
Chief Compliance Officer
Mr. Pogorelec also serves as Chief Compliance Officer of other funds. Mr. Pogorelec is a Senior Vice President of Asset Management Compliance (2020-present) and is an employee of Fidelity Investments. Mr. Pogorelec serves as Compliance Officer of Fidelity Management & Research Company LLC (investment adviser firm, 2023-present) and Ballyrock Investment Advisors LLC (2023-present). Previously, Mr. Pogorelec served as a Vice President, Associate General Counsel for Fidelity Investments (2010-2020) and Assistant Secretary of certain Fidelity® funds (2015-2020).
Brett Segaloff (1972)
Year of Election or Appointment: 2021
Anti-Money Laundering (AML) Officer
Mr. Segaloff also serves as AML Officer of other funds. Mr. Segaloff is a Vice President (2022-present) and is an employee of Fidelity Investments. Mr. Segaloff serves as Anti Money Laundering Compliance Officer or Anti Money Laundering/Bank Secrecy Act Compliance Officer of certain Fidelity entities.
Stacie M. Smith (1974)
Year of Election or Appointment: 2016
President and Treasurer
Ms. Smith also serves as an officer of other funds. Ms. Smith is a Senior Vice President (2016-present) and is an employee of Fidelity Investments. Ms. Smith serves as Assistant Treasurer of certain Fidelity entities and has served in other fund officer roles.
Jim Wegmann (1979)
Year of Election or Appointment: 2019
Assistant Treasurer
Mr. Wegmann also serves as an officer of other funds. Mr. Wegmann is a Vice President (2016-present) and is an employee of Fidelity Investments. Mr. Wegmann serves as Assistant Treasurer of FIMM, LLC (2021-present). Previously, Mr. Wegmann served as Assistant Treasurer of certain Fidelity® funds (2019-2021).
As a shareholder, you incur two types of costs: (1) transaction costs, which may include sales charges (loads) on purchase payments or redemption proceeds, as applicable and (2) ongoing costs, which generally include management fees, distribution and/or service (12b-1) fees and other Fund expenses. This Example is intended to help you understand your ongoing costs (in dollars) of investing in a fund and to compare these costs with the ongoing costs of investing in other mutual funds.
| The Example is based on an investment of $1,000 invested at the beginning of the period and held for the entire period (May 1, 2023 to October 31, 2023). |
Actual Expenses
The first line of the accompanying table provides information about actual account values and actual expenses. You may use the information in this line, together with the amount you invested, to estimate the expenses that you paid over the period. Simply divide your account value by $1,000.00 (for example, an $8,600 account value divided by $1,000.00 = 8.6), then multiply the result by the number in the first line for a class/Fund under the heading entitled "Expenses Paid During Period" to estimate the expenses you paid on your account during this period. If any fund is a shareholder of any underlying mutual funds or exchange-traded funds (ETFs) (the Underlying Funds), such fund indirectly bears its proportional share of the expenses of the Underlying Funds in addition to the direct expenses incurred presented in the table. These fees and expenses are not included in the annualized expense ratio used to calculate the expense estimate in the table below.
Hypothetical Example for Comparison Purposes
The second line of the accompanying table provides information about hypothetical account values and hypothetical expenses based on the actual expense ratio and an assumed rate of return of 5% per year before expenses, which is not the actual return. The hypothetical account values and expenses may not be used to estimate the actual ending account balance or expenses you paid for the period. You may use this information to compare the ongoing costs of investing in the Fund and other funds. To do so, compare this 5% hypothetical example with the 5% hypothetical examples that appear in the shareholder reports of the other funds. If any fund is a shareholder of any Underlying Funds, such fund indirectly bears its proportional share of the expenses of the Underlying Funds in addition to the direct expenses as presented in the table. These fees and expenses are not included in the annualized expense ratio used to calculate the expense estimate in the table below.
Please note that the expenses shown in the table are meant to highlight your ongoing costs only and do not reflect any transaction costs. Therefore, the second line of the table is useful in comparing ongoing costs only, and will not help you determine the relative total costs of owning different funds. In addition, if these transactional costs were included, your costs would have been higher.
| | | | | Annualized Expense Ratio- A | | Beginning Account Value May 1, 2023 | | Ending Account Value October 31, 2023 | | Expenses Paid During Period- C May 1, 2023 to October 31, 2023 |
| Fidelity® Sustainable Emerging Markets Equity Fund | | | | | | | | | | |
| Class A | | | | 1.49% | | | | | | |
| Actual | | | | | | $ 1,000 | | $ 946.00 | | $ 7.31 |
Hypothetical-B | | | | | | $ 1,000 | | $ 1,017.69 | | $ 7.58 |
| Class M | | | | 1.74% | | | | | | |
| Actual | | | | | | $ 1,000 | | $ 944.70 | | $ 8.53 |
Hypothetical-B | | | | | | $ 1,000 | | $ 1,016.43 | | $ 8.84 |
| Class C | | | | 2.24% | | | | | | |
| Actual | | | | | | $ 1,000 | | $ 941.90 | | $ 10.96 |
Hypothetical-B | | | | | | $ 1,000 | | $ 1,013.91 | | $ 11.37 |
| Fidelity® Sustainable Emerging Markets Equity Fund | | | | 1.25% | | | | | | |
| Actual | | | | | | $ 1,000 | | $ 947.40 | | $ 6.14 |
Hypothetical-B | | | | | | $ 1,000 | | $ 1,018.90 | | $ 6.36 |
| Class I | | | | 1.24% | | | | | | |
| Actual | | | | | | $ 1,000 | | $ 947.40 | | $ 6.09 |
Hypothetical-B | | | | | | $ 1,000 | | $ 1,018.95 | | $ 6.31 |
| Class Z | | | | 1.10% | | | | | | |
| Actual | | | | | | $ 1,000 | | $ 948.70 | | $ 5.40 |
Hypothetical-B | | | | | | $ 1,000 | | $ 1,019.66 | | $ 5.60 |
| |
A Annualized expense ratio reflects expenses net of applicable fee waivers.
B 5% return per year before expenses
C Expenses are equal to the annualized expense ratio, multiplied by the average account value over the period, multiplied by 184/ 365 (to reflect the one-half year period). The fees and expenses of any Underlying Funds are not included in each annualized expense ratio.
The dividend and capital gains distributions for the fund(s) are available on Fidelity.com or Institutional.Fidelity.com.
The fund designates $218 of distributions paid during the fiscal year ended 2023 as qualifying to be taxed as section 163(j) interest dividends.
Class A, Class M, Sustainable Emerging Markets Equity Fund, Class I and Class Z designate 100% of each dividend distributed during the fiscal year as amounts which may be taken into account as a dividend for purposes of the maximum rate under section 1(h)(11) of the Internal Revenue Code.
The amounts per share which represent income derived from sources within, and taxes paid to, foreign countries or possessions of the United States are as follows:
| | Pay Date | Income | Taxes |
| Fidelity Sustainable Emerging Markets Equity Fund | | | |
| Class A | 12/12/2022 | $0.0458 | $0.0138 |
| | 12/29/2022 | $0.0060 | $0.0000 |
| Class M | 12/12/2022 | $0.0258 | $0.0138 |
| | 12/29/2022 | $0.0060 | $0.0000 |
| Class C | 12/12/2022 | $0.0000 | $0.0000 |
| | 12/29/2022 | $0.0000 | $0.0000 |
| Sustainable Emerging Markets Equity Fund | 12/12/2022 | $0.0608 | $0.0138 |
| | 12/29/2022 | $0.0060 | $0.0000 |
| Class I | 12/12/2022 | $0.0608 | $0.0138 |
| | 12/29/2022 | $0.0060 | $0.0000 |
| Class Z | 12/12/2022 | $0.0608 | $0.0138 |
| | 12/29/2022 | $0.0060 | $0.0000 |
The fund will notify shareholders in January 2024 of amounts for use in preparing 2023 income tax returns.
Board Approval of Investment Advisory Contracts and Management Fees
Fidelity Sustainable Emerging Markets Equity Fund
Each year, the Board of Trustees, including the Independent Trustees (together, the Board), considers the renewal of the fund's management contract with Fidelity Management & Research Company LLC (FMR) and the sub-advisory agreements (together, the Advisory Contracts) for the fund. FMR and the sub-advisers are referred to herein as the Investment Advisers. The Board, assisted by the advice of fund counsel and Independent Trustees' counsel, requests and considers a broad range of information relevant to the renewal of the Advisory Contracts throughout the year.
The Board meets regularly and, at each of its meetings, covers an extensive agenda of topics and materials and considers factors that are relevant to its annual consideration of the renewal of the fund's Advisory Contracts, including the services and support provided to the fund and its shareholders. The Board, acting directly and through its Committees (each of which is composed of and chaired by Independent Trustees), requests and receives information concerning the annual consideration of the renewal of the fund's Advisory Contracts. The Board also meets as needed to review matters specifically related to the Board's annual consideration of the renewal of the Advisory Contracts. Members of the Board may also meet with trustees of other Fidelity funds through joint ad hoc committees to discuss certain matters relevant to all of the Fidelity funds.
Approval of Stub Period Continuation. At its May 2023 meeting, the Board of Trustees voted to continue the fund's management contract with FMR, and the sub-advisory agreements and sub-sub-advisory agreements, in each case, where applicable (together, the Advisory Contracts), without modification, for two months from June 1, 2023 through July 31, 2023. The Board considered that the approval of the fund's Advisory Contracts will not result in any changes in (i) the investment process or strategies employed in the management of the fund's assets; (ii) the fees and expenses paid by shareholders; (iii) the nature, extent or quality of services provided under the fund's Advisory Contracts; or (iv) the day-to-day management of the fund or the persons primarily responsible for such management. The Board also considered that since its last approval of the fund's Advisory Contracts, FMR had provided additional information on the fund in support of the annual contract renewal process, including competitive analyses on total expenses and management fees and in-depth reviews of fund performance and fund profitability information. The Board concluded that the fund's Advisory Contracts are fair and reasonable, and that the fund's Advisory Contracts should be renewed, without modification, through July 31, 2023, with the understanding that the Board would consider the annual renewal for a full one year period in July 2023.
At its July 2023 meeting, the Board unanimously determined to renew the fund's Advisory Contracts. In reaching its determination, the Board considered all factors it believed relevant, including (i) the nature, extent, and quality of the services provided to the fund and its shareholders (including the investment performance of the fund); (ii) the competitiveness relative to peer funds of the fund's management fee and the total expense ratio of a representative class (the retail class, which was selected because it was the largest class without 12b-1 fees); (iii) the total costs of the services provided by and the profits realized by FMR and its affiliates (Fidelity) from its relationships with the fund; and (iv) the extent to which, if any, economies of scale exist and are realized as the fund grows, and whether any economies of scale are appropriately shared with fund shareholders. The Board also considered the broad range of investment choices available to shareholders from FMR's competitors and that the fund's shareholders have chosen to invest in the fund, which is part of the Fidelity family of funds. The Board's decision to renew the Advisory Contracts was not based on any single factor.
The Board reached a determination, with the assistance of fund counsel and Independent Trustees' counsel and through the exercise of its business judgment, that the renewal of the Advisory Contracts was in the best interests of the fund and its shareholders and that the compensation payable under the Advisory Contracts was fair and reasonable in light of all of the surrounding circumstances.
Nature, Extent, and Quality of Services Provided. The Board considered staffing as it relates to the fund, including the backgrounds and experience of investment personnel of the Investment Advisers, and also considered the Investment Advisers' implementation of the fund's investment program. The Independent Trustees also had discussions with senior management of Fidelity's investment operations and investment groups. The Board considered the structure of the investment personnel compensation program and whether this structure provides appropriate incentives to act in the best interests of the fund. Additionally, the Board considered the portfolio managers' investments, if any, in the funds that they manage.
Resources Dedicated to Investment Management and Support Services. The Board and the Fund Oversight and Research Committees reviewed the general qualifications and capabilities of Fidelity's investment staff, including its size, education, experience, and resources, as well as Fidelity's approach to recruiting, training, managing, and compensating investment personnel. The Board noted the resources devoted to expansion of Fidelity's global investment organization, and that Fidelity's analysts have extensive resources, tools, and capabilities that allow them to conduct sophisticated quantitative and fundamental analysis, as well as credit analysis of issuers, counterparties, and guarantors. Further, the Board considered that Fidelity's investment professionals have sufficient access to global information and data so as to provide competitive investment results over time, and that those professionals also have access to sophisticated tools that permit them to assess portfolio construction and risk and performance attribution characteristics continuously, as well as to transmit new information and research conclusions rapidly around the world. Additionally, in its deliberations, the Board considered Fidelity's trading, risk management, compliance, and technology and operations capabilities and resources, which are integral parts of the investment management process.
Shareholder and Administrative Services. The Board considered (i) the nature, extent, quality, and cost of advisory, administrative, and shareholder services performed by the Investment Advisers and their affiliates under the Advisory Contracts and under separate agreements covering transfer agency, pricing and bookkeeping, and securities lending services for the fund; (ii) the nature and extent of Fidelity's supervision of third party service providers, principally custodians, subcustodians, and pricing vendors; and (iii) the resources devoted by Fidelity to, and the record of compliance with, the fund's compliance policies and procedures. The Board also reviewed the allocation of fund brokerage, including allocations to brokers affiliated with the Investment Advisers, the use of brokerage commissions to pay fund expenses, and the use of "soft" commission dollars to pay for research services. The Board also considered the fund's securities lending activities and any payments made to Fidelity relating to securities lending.
The Board noted that the growth of fund assets over time across the complex allows Fidelity to reinvest in the development of services designed to enhance the value and convenience of the Fidelity funds as investment vehicles. These services include 24-hour access to account information and market information over the Internet and through telephone representatives, investor education materials, and asset allocation tools. The Board also considered that it reviews customer service metrics such as telephone response times, continuity of services on the website and metrics addressing services at Fidelity Investor Centers.
Investment in a Large Fund Family. The Board considered the benefits to shareholders of investing in a fund that is part of a large family of funds offering a variety of investment disciplines and providing a large variety of fund investor services. The Board noted that Fidelity had taken, or had made recommendations that resulted in the Fidelity funds taking, a number of actions over the previous year that benefited particular funds and/or the Fidelity funds in general.
Investment Performance. The Board took into account discussions that occur with representatives of the Investment Advisers, and reports that it receives, at Board meetings throughout the year, relating to fund investment performance. In this regard the Board noted that as part of regularly scheduled fund reviews and other reports to the Board on fund performance, the Board considered annualized return information for the fund for different time periods, measured against an appropriate securities market index (benchmark index) and an appropriate peer group of funds with similar objectives (peer group). The Board also considered information about performance attribution. In its ongoing evaluation of fund investment performance, the Board gives particular attention to information indicating changes in performance of the funds over different time periods and discussed with the Investment Advisers the reasons for any overperformance or underperformance.
In addition to reviewing absolute and relative fund performance, the Independent Trustees periodically consider the appropriateness of fund performance metrics in evaluating the results achieved. The Independent Trustees generally give greater weight to fund performance over longer time periods than over shorter time periods. Depending on the circumstances, the Independent Trustees may be satisfied with a fund's performance notwithstanding that it lags its benchmark index or peer group for certain periods.
Based on its review, the Board concluded that the nature, extent, and quality of services provided to the fund under the Advisory Contracts should continue to benefit the shareholders of the fund.
Competitiveness of Management Fee and Total Expense Ratio. The Board was provided with information regarding industry trends in management fees and expenses. In its review of the fund's management fee and the total expense ratio of the retail class, the Board considered the fund's management fee rate as well as other fund or class expenses, as applicable, such as transfer agent fees, pricing and bookkeeping fees, fund-paid 12b-1 fees, and custodial, legal, and audit fees. The Board noted that Fidelity may agree to waive fees or reimburse expenses from time to time, and the extent to which, if any, it has done so for the fund. The Board also considered information about the impact of the fund's performance adjustment.
Comparisons of Management Fees and Total Expense Ratios. Among other things, the Board reviewed data for selected groups of competitive funds and classes (referred to as "mapped groups") that were compiled by Fidelity based on combining similar investment objective categories (as classified by Lipper) that have comparable investment mandates. The data reviewed by the Board included (i) gross management fee comparisons (before taking into account expense reimbursements or caps and without taking into account the fund's performance adjustment) relative to the total universe of funds within the mapped group; (ii) gross management fee comparisons relative to a subset of non-Fidelity funds in the mapped group that are similar in size and management fee structure to the fund (referred to as the "asset size peer group"); (iii) total expense comparisons of the retail class of the fund relative to funds and classes in the mapped group that have a similar sales load structure to the retail class of the fund (referred to as the "similar sales load structure group"); and (iv) total expense comparisons of the retail class of the fund relative to funds and classes in the similar sales load structure group that are similar in size and management fee structure to the fund (referred to as the "total expense asset size peer group"). The total expense asset size peer group comparison excludes performance adjustments and fund-paid 12b-1 fees to eliminate variability in fee structures.
The information provided to the Board indicated that the fund's management fee rate ranked below the competitive median of the mapped group for the period ended September 30, 2022 and below the competitive median of the asset size peer group for the period ended September 30, 2022. Further, the information provided to the Board indicated that the total expense ratio of the retail class of the fund ranked below the competitive median of the similar sales load structure group for the period ended September 30, 2022 and below the competitive median of the total expense asset size peer group for the period ended September 30, 2022.
The Board also considered that, for funds subject to the group fee, FMR agreed to voluntarily waive fees over a specified period of time in amounts designed to account for assets converted from certain funds to certain collective investment trusts.
The Board also considered that the fund's management fee is subject to upward or downward adjustment depending upon whether, and to what extent, the fund's investment performance for the performance period (a rolling 36-month period) exceeds, or is exceeded by, a securities index, thus leading to a performance adjustment for the same period. The Board noted that the performance adjustment provides FMR with a strong economic incentive to seek to achieve superior long-term performance for the fund's shareholders and helps to more closely align the interests of FMR and the shareholders of the fund.
In connection with its consideration of the fund's performance adjustment, the Board noted that the performance of the retail class is used for purposes of determining the performance adjustment. The Board noted that to the extent the performance adjustment was based on the performance of a share class with higher total annual operating expenses, the fund would be subject to a smaller positive and larger negative performance adjustment. The Board considered the appropriateness of the use of the retail class as the basis for the performance adjustment. The Board noted that the retail class is typically the largest class (reflecting the actual investment experience for the plurality of shareholders), employs a standard expense structure, and does not include fund-paid 12b-1 fees, which Fidelity believes makes it a more appropriate measurement of Fidelity's investment skill.
Fees Charged to Other Fidelity Clients. The Board also considered Fidelity fee structures and other information with respect to clients of Fidelity, such as other funds advised or subadvised by Fidelity, pension plan clients, and other institutional clients with similar mandates. The Board noted that a joint ad hoc committee created by it and the boards of other Fidelity funds periodically reviews and compares Fidelity's institutional investment advisory business with its business of providing services to the Fidelity funds and also noted the most recent findings of the committee. The Board noted that the committee's review included a consideration of the differences in services provided, fees charged, and costs incurred, as well as competition in the markets serving the different categories of clients.
Based on its review, the Board concluded that the fund's management fee, including the use of the retail class as the basis for the performance adjustment, is fair and reasonable in light of the services that the fund receives and the other factors considered. Further, based on its review of total expense ratios and fees charged to other Fidelity clients, the Board concluded that the total expense ratio of each class of the fund was reasonable in light of the services that the fund and its shareholders receive and the other factors considered.
Costs of the Services and Profitability. The Board considered the revenues earned and the expenses incurred by Fidelity in conducting the business of developing, marketing, distributing, managing, administering and servicing the fund and servicing the fund's shareholders. The Board also considered the level of Fidelity's profits in respect of all the Fidelity funds.
On an annual basis, Fidelity presents to the Board information about the profitability of its relationships with the fund. Fidelity calculates profitability information for each fund, as well as aggregate profitability information for groups of Fidelity funds and all Fidelity funds, using a series of detailed revenue and cost allocation methodologies which originate with the books and records of Fidelity on which Fidelity's audited financial statements are based. The Audit Committee of the Board reviews any significant changes from the prior year's methodologies and the full Board approves such changes.
A public accounting firm has been engaged annually by the Board as part of the Board's assessment of Fidelity's profitability analysis. The engagement includes the review and assessment of the methodologies used by Fidelity in determining the revenues and expenses attributable to Fidelity's fund business, and completion of agreed-upon procedures in respect of the mathematical accuracy of certain fund profitability information and its conformity to established allocation methodologies. After considering the reports issued under the engagement and information provided by Fidelity, the Board concluded that while other allocation methods may also be reasonable, Fidelity's profitability methodologies are reasonable in all material respects.
The Board also reviewed Fidelity's non-fund businesses and potential indirect benefits such businesses may have received as a result of their association with Fidelity's fund business (i.e., fall-out benefits) as well as cases where Fidelity's affiliates may benefit from the funds' business. The Board considered areas where potential indirect benefits to the Fidelity funds from their relationships with Fidelity may exist. The Board's consideration of these matters was informed by the findings of a joint ad hoc committee created by it and the boards of other Fidelity funds to evaluate potential fall-out benefits.
The Board considered the costs of the services provided by and the profits realized by Fidelity in connection with the operation of the fund and was satisfied that the profitability was not excessive.
Economies of Scale. The Board considered whether there have been economies of scale in respect of the management of the Fidelity funds, whether the Fidelity funds (including the fund) have appropriately benefited from any such economies of scale, and whether there is potential for realization of any further economies of scale. The Board considered the extent to which the fund will benefit from economies of scale as assets grow through increased services to the fund, through waivers or reimbursements, or through fee or expense ratio reductions. The Board also noted that a committee (the Economies of Scale Committee) created by it and the boards of other Fidelity funds periodically analyzes whether Fidelity attains economies of scale in respect of the management and servicing of the Fidelity funds, whether the Fidelity funds have appropriately benefited from such economies of scale, and whether there is potential for realization of any further economies of scale.
The Board recognized that the fund's management contract incorporates a "group fee" structure, which provides for lower group fee rates as total "group assets" increase, and for higher group fee rates as total "group assets" decrease ("group assets" as defined in the management contract). FMR calculates the group fee rates based on a tiered asset "breakpoint" schedule that varies based on asset class. The Board considered that the group fee is designed to deliver the benefits of economies of scale to fund shareholders when total Fidelity fund assets increase, even if assets of any particular fund are unchanged or have declined, because some portion of Fidelity's costs are attributable to services provided to all Fidelity funds, and all funds benefit if those costs can be allocated among more assets. The Board further considered that Fidelity agreed to impose a temporary fee waiver in the form of additional breakpoints to the current breakpoint schedule. The Board concluded that, given the group fee structure, fund shareholders will benefit from lower management fees as "group assets" increase at the fund complex level, regardless of whether Fidelity achieves any such economies of scale.
The Board concluded, taking into account the analysis of the Economies of Scale Committee, that economies of scale, if any, are being appropriately shared between fund shareholders and Fidelity.
Additional Information Requested by the Board. In order to develop fully the factual basis for consideration of the Fidelity funds' advisory contracts, the Board requested and received additional information on certain topics, including: (i) fund flow and performance trends, in particular the underperformance of certain funds and strategies, and Fidelity's long-term strategies for certain funds, including any consideration of fund liquidations or mergers; (ii) the operation of performance fees and competitor use of performance fees; (iii) Fidelity's pricing philosophy compared to competitors; (iv) fund profitability methodology and data; (v) evaluation of competitive fund data and peer group classifications and fee and expense comparisons; (vi) the management fee and expense structures for different funds and classes and information about the differences between various fee and expense structures; (vii) group fee breakpoints and related voluntary fee waivers; and (viii) information regarding other accounts managed by Fidelity and the funds' sub-advisory arrangements.
Conclusion. Based on its evaluation of all of the conclusions noted above, and after considering all factors it believed relevant, the Board, including the Independent Trustees, concluded that the advisory and sub-advisory fee arrangements are fair and reasonable in light of all of the surrounding circumstances and that the fund's Advisory Contracts should be renewed through July 31, 2024.
1.9905243.101
MAR-ANN-1223
Fidelity® Global Commodity Stock Fund
Annual Report
October 31, 2023
Includes Fidelity and Fidelity Advisor share classes
Contents
To view a fund's proxy voting guidelines and proxy voting record for the 12-month period ended June 30, visit http://www.fidelity.com/proxyvotingresults or visit the Securities and Exchange Commission's (SEC) web site at http://www.sec.gov.
You may also call 1-800-544-8544 if you're an individual investing directly with Fidelity, call 1-800-835-5092 if you're a plan sponsor or participant with Fidelity as your recordkeeper or call 1-877-208-0098 on institutional accounts or if you're an advisor or invest through one to request a free copy of the proxy voting guidelines.
Standard & Poor's, S&P and S&P 500 are registered service marks of The McGraw-Hill Companies, Inc. and have been licensed for use by Fidelity Distributors Corporation.
Other third-party marks appearing herein are the property of their respective owners.
All other marks appearing herein are registered or unregistered trademarks or service marks of FMR LLC or an affiliated company. © 2023 FMR LLC. All rights reserved.
This report and the financial statements contained herein are submitted for the general information of the shareholders of the Fund. This report is not authorized for distribution to prospective investors in the Fund unless preceded or accompanied by an effective prospectus.
A fund files its complete schedule of portfolio holdings with the SEC for the first and third quarters of each fiscal year on Form N-PORT. Forms N-PORT are available on the SEC's web site at http://www.sec.gov. A fund's Forms N-PORT may be reviewed and copied at the SEC's Public Reference Room in Washington, DC. Information regarding the operation of the SEC's Public Reference Room may be obtained by calling 1-800-SEC-0330.
For a complete list of a fund's portfolio holdings, view the most recent holdings listing, semiannual report, or annual report on Fidelity's web site at http://www.fidelity.com, http://www.institutional.fidelity.com, or http://www.401k.com, as applicable.
NOT FDIC INSURED •MAY LOSE VALUE •NO BANK GUARANTEE
Neither the Fund nor Fidelity Distributors Corporation is a bank.
Average annual total return reflects the change in the value of an investment, assuming reinvestment of distributions from dividend income and capital gains (the profits earned upon the sale of securities that have grown in value, if any) and assuming a constant rate of performance each year. The hypothetical investment and the average annual total returns do not reflect the deduction of taxes that a shareholder would pay on fund distributions or the redemption of fund shares. During periods of reimbursement by Fidelity, a fund's total return will be greater than it would be had the reimbursement not occurred. How a fund did yesterday is no guarantee of how it will do tomorrow.
| Average Annual Total Returns |
| | | | |
Periods ended October 31, 2023 | Past 1 year | Past 5 years | Past 10 years |
Class A (incl. 5.75% sales charge) | -14.84% | 7.99% | 3.29% |
Class M (incl. 3.50% sales charge) | -13.06% | 8.19% | 3.24% |
Class C (incl. contingent deferred sales charge) | -11.23% | 8.46% | 3.29% |
| Fidelity® Global Commodity Stock Fund | -9.47% | 9.55% | 4.16% |
| Class I | -9.42% | 9.62% | 4.23% |
| Class Z | -9.30% | 9.74% | 4.30% |
Class C shares' contingent deferred sales charges included in the past one year, past five years and past ten years total return figures are 1%, 0% and 0%, respectively.
The initial offering of Class Z shares took place on October 2, 2018. Returns prior to October 2, 2018, are those of Class I.
| $10,000 Over 10 Years |
| |
Let's say hypothetically that $10,000 was invested in Fidelity® Global Commodity Stock Fund, a class of the fund, on October 31, 2013. The chart shows how the value of your investment would have changed, and also shows how the MSCI ACWI (All Country World Index) Index performed over the same period. |
|
|
Market Recap:
Global equities gained 10.91% for the 12 months ending October 31, 2023, according to the MSCI ACWI (All Country World Index) Index, as global economic expansion and a slowing in the pace of inflation in some markets provided a favorable backdrop for risk assets. After returning -18.07% in 2022, the index's upturn has been largely driven by a narrow set of companies in the information technology and communication services sectors, in part due to excitement for generative artificial intelligence applications. The index gained 18.36% year to date through July, including gains in June (+5.83%) and July (+3.68%). The rally for international equities sputtered for the next three months (-9.54%) amid a stalling pattern in disinflationary trends, heightened global recession and geopolitical risks, soaring yields on longer-term U.S. government bonds, and particularly weak economic conditions in the eurozone and China. Even still, the three-month decline left global stocks up 7.07% year to date through October. For the full 12 months, nearly all regions advanced, with Europe ex U.K. (+18%) and Japan (+17%) leading, whereas Canada (-0.38%) lagged by the widest margin, while the U.S. middled (+10%). All but three of 11 sectors advanced, with information technology (+29%) and communication services (+27%) leading. Conversely, the real estate sector (-3%) lagged most, followed by health care and utilities (-1% each).
Comments from Portfolio Manager Peter Belisle:
For the fiscal year ending October 31, 2023, the fund's share classes (excluding sales charges, if applicable) returned about -10% to -9%, versus -2.68% for the MSCI AC World Commodity Producers Sector Capped Index (Net) and 10.91% for the broad-based MSCI All Country World Index (Net MA). From a regional standpoint, an overweight in the United States and positioning in Asia Pacific ex Japan, primarily in Australia, detracted from the fund's relative result. By industry, security selection was the primary detractor, especially within integrated oil & gas. Security selection in fertilizers & agricultural chemicals also hurt. Picks in copper further hampered the fund's relative result. Also detracting from the fund's relative performance were stock selection and an underweight in diversified metals & mining. Not owning BHP Group, a benchmark component that gained 25%, was the fund's biggest individual relative detractor. The second-largest relative detractor was untimely positioning CF Industries Holdings (-37%). This period we decreased our stake in CF Industries Holdings. An overweight in First Quantum Minerals (-32%) also hurt. First Quantum Minerals was among the fund's biggest holdings this period. In contrast, from a regional standpoint, security selection in the United States contributed to the fund's performance versus the benchmark. By industry, the biggest contributor to performance versus the benchmark was stock selection in oil & gas exploration & production. An underweight in fertilizers & agricultural chemicals also boosted relative performance. Also contributing to the fund's relative result was security selection in oil & gas equipment & services. The fund's non-benchmark stake in Weatherford International gained 61% and was the fund's top individual relative contributor. A second notable relative contributor was an overweight in ARC Resources (+24%). This was a position we established the past year. Another notable relative contributor was our non-benchmark stake in Range Resources (+50%). This period we decreased our investment in Range Resources. Notable changes in positioning include increased exposure to the diversified metals & mining sector and a lower allocation to agricultural products & services.
Note to shareholders: After nearly 30 years with Fidelity, Jody Simes retired on January 1, 2023, leaving Peter Belisle as sole portfolio manager.
The views expressed above reflect those of the portfolio manager(s) only through the end of the period as stated on the cover of this report and do not necessarily represent the views of Fidelity or any other person in the Fidelity organization. Any such views are subject to change at any time based upon market or other conditions and Fidelity disclaims any responsibility to update such views. These views may not be relied on as investment advice and, because investment decisions for a Fidelity fund are based on numerous factors, may not be relied on as an indication of trading intent on behalf of any Fidelity fund.
Top Holdings (% of Fund's net assets) |
| |
| Exxon Mobil Corp. | 8.3 | |
| Shell PLC (London) | 6.1 | |
| Teck Resources Ltd. Class B (sub. vtg.) | 4.4 | |
| Canadian Natural Resources Ltd. | 3.9 | |
| Reliance Steel & Aluminum Co. | 3.7 | |
| Antero Resources Corp. | 3.7 | |
| UPM-Kymmene Corp. | 3.6 | |
| Wheaton Precious Metals Corp. | 3.4 | |
| Corteva, Inc. | 3.4 | |
| Glencore PLC | 3.3 | |
| | 43.8 | |
| |
| Industries (% of Fund's net assets) |
| |
| Oil, Gas & Consumable Fuels | 41.7 | |
| Metals & Mining | 30.8 | |
| Paper & Forest Products | 9.6 | |
| Chemicals | 7.4 | |
| Energy Equipment & Services | 3.7 | |
| Food Products | 3.1 | |
| Containers & Packaging | 1.1 | |
| Machinery | 0.7 | |
| Pharmaceuticals | 0.7 | |
| Electrical Equipment | 0.2 | |
| |
Geographic Diversification (% of Fund's net assets) |
|
* Includes Short-Term investments and Net Other Assets (Liabilities). Percentages are adjusted for the effect of derivatives, if applicable. |
| |
Showing Percentage of Net Assets
| Common Stocks - 99.0% |
| | | Shares | Value ($) |
| Chemicals - 7.4% | | | |
| Fertilizers & Agricultural Chemicals - 7.4% | | | |
| CF Industries Holdings, Inc. | | 97,100 | 7,746,638 |
| Corteva, Inc. | | 781,700 | 37,631,038 |
| FMC Corp. | | 206,600 | 10,991,120 |
| Nutrien Ltd. | | 482,083 | 25,891,864 |
| | | | 82,260,660 |
| Containers & Packaging - 1.1% | | | |
| Paper & Plastic Packaging Products & Materials - 1.1% | | | |
| Billerud AB | | 344,000 | 3,189,622 |
| Smurfit Kappa Group PLC | | 281,200 | 9,146,309 |
| | | | 12,335,931 |
| Electrical Equipment - 0.2% | | | |
| Electrical Components & Equipment - 0.2% | | | |
| GrafTech International Ltd. | | 528,200 | 1,822,290 |
| Energy Equipment & Services - 3.7% | | | |
| Oil & Gas Drilling - 3.7% | | | |
| Diamond Offshore Drilling, Inc. (a) | | 814,000 | 10,101,740 |
| Noble Corp. PLC | | 455,100 | 21,248,619 |
| Valaris Ltd. (a) | | 145,100 | 9,582,404 |
| | | | 40,932,763 |
| Food Products - 3.1% | | | |
| Agricultural Products & Services - 2.8% | | | |
| Bunge Ltd. | | 106,200 | 11,255,076 |
| Darling Ingredients, Inc. (a) | | 287,400 | 12,728,946 |
| Wilmar International Ltd. | | 2,658,100 | 6,910,490 |
| | | | 30,894,512 |
| Packaged Foods & Meats - 0.3% | | | |
| Pilgrim's Pride Corp. (a)(b) | | 141,100 | 3,598,050 |
TOTAL FOOD PRODUCTS | | | 34,492,562 |
| Machinery - 0.7% | | | |
| Construction Machinery & Heavy Transportation Equipment - 0.4% | | | |
| Epiroc AB (A Shares) | | 253,000 | 4,168,104 |
| Industrial Machinery & Supplies & Components - 0.3% | | | |
| Sandvik AB | | 241,100 | 4,106,661 |
TOTAL MACHINERY | | | 8,274,765 |
| Metals & Mining - 30.8% | | | |
| Copper - 2.3% | | | |
| ERO Copper Corp. (a) | | 472,500 | 6,412,439 |
| First Quantum Minerals Ltd. | | 1,637,571 | 18,976,575 |
| | | | 25,389,014 |
| Diversified Metals & Mining - 13.3% | | | |
| Anglo American PLC (United Kingdom) | | 242,500 | 6,178,806 |
| BHP Group Ltd. (London) | | 1,055,397 | 29,991,450 |
| Glencore PLC | | 6,873,300 | 36,406,708 |
| Ivanhoe Mines Ltd. (a) | | 1,016,000 | 7,487,665 |
| Rio Tinto PLC | | 160,781 | 10,257,912 |
| Sigma Lithium Corp. (a)(b) | | 194,400 | 4,753,080 |
| Sumitomo Metal Mining Co. Ltd. | | 106,300 | 2,986,175 |
| Teck Resources Ltd. Class B (sub. vtg.) | | 1,388,700 | 49,068,902 |
| | | | 147,130,698 |
| Gold - 7.2% | | | |
| Agnico Eagle Mines Ltd. (Canada) | | 394,317 | 18,493,872 |
| Alamos Gold, Inc. | | 1,147,500 | 14,207,734 |
| Franco-Nevada Corp. | | 72,971 | 8,877,020 |
| Wheaton Precious Metals Corp. | | 900,900 | 38,049,910 |
| | | | 79,628,536 |
| Precious Metals & Minerals - 1.1% | | | |
| Impala Platinum Holdings Ltd. | | 1,140,600 | 4,751,274 |
| Northam Platinum Holdings Ltd. | | 1,189,100 | 7,177,028 |
| | | | 11,928,302 |
| Steel - 6.9% | | | |
| Champion Iron Ltd. (b) | | 5,564,600 | 25,239,830 |
| Reliance Steel & Aluminum Co. | | 161,200 | 41,006,056 |
| Vale SA | | 700,400 | 9,585,481 |
| | | | 75,831,367 |
TOTAL METALS & MINING | | | 339,907,917 |
| Oil, Gas & Consumable Fuels - 41.7% | | | |
| Integrated Oil & Gas - 21.1% | | | |
| Cenovus Energy, Inc. (Canada) | | 1,827,800 | 34,822,770 |
| Exxon Mobil Corp. | | 861,300 | 91,168,608 |
| Petroleo Brasileiro SA - Petrobras (ON) | | 2,086,100 | 15,656,870 |
| Shell PLC (London) | | 2,082,928 | 67,126,214 |
| TotalEnergies SE | | 368,900 | 24,663,725 |
| | | | 233,438,187 |
| Oil & Gas Exploration & Production - 16.4% | | | |
| Antero Resources Corp. (a) | | 1,390,312 | 40,930,785 |
| ARC Resources Ltd. (b) | | 1,741,700 | 28,020,427 |
| Canadian Natural Resources Ltd. | | 674,100 | 42,806,018 |
| Hess Corp. | | 36,600 | 5,285,040 |
| MEG Energy Corp. (a) | | 1,129,600 | 22,319,120 |
| Ovintiv, Inc. | | 220,700 | 10,593,600 |
| Range Resources Corp. | | 625,800 | 22,428,672 |
| Southwestern Energy Co. (a) | | 1,155,500 | 8,238,715 |
| | | | 180,622,377 |
| Oil & Gas Storage & Transportation - 4.2% | | | |
| Energy Transfer LP | | 2,579,600 | 33,921,740 |
| Enterprise Products Partners LP | | 492,400 | 12,822,096 |
| | | | 46,743,836 |
TOTAL OIL, GAS & CONSUMABLE FUELS | | | 460,804,400 |
| Paper & Forest Products - 9.6% | | | |
| Forest Products - 3.6% | | | |
| Interfor Corp. (a) | | 557,500 | 6,878,547 |
| Svenska Cellulosa AB SCA (B Shares) | | 1,134,700 | 15,547,874 |
| West Fraser Timber Co. Ltd. | | 258,800 | 17,466,084 |
| | | | 39,892,505 |
| Paper Products - 6.0% | | | |
| Mondi PLC | | 195 | 3,150 |
| Stora Enso Oyj (R Shares) | | 1,203,700 | 14,423,916 |
| Suzano Papel e Celulose SA | | 1,133,700 | 11,596,154 |
| UPM-Kymmene Corp. | | 1,185,700 | 39,858,298 |
| | | | 65,881,518 |
TOTAL PAPER & FOREST PRODUCTS | | | 105,774,023 |
| Pharmaceuticals - 0.7% | | | |
| Pharmaceuticals - 0.7% | | | |
| Bayer AG | | 175,200 | 7,570,140 |
| TOTAL COMMON STOCKS (Cost $1,025,198,239) | | | 1,094,175,451 |
| | | | |
| Money Market Funds - 2.4% |
| | | Shares | Value ($) |
| Fidelity Cash Central Fund 5.40% (c) | | 9,508,220 | 9,510,122 |
| Fidelity Securities Lending Cash Central Fund 5.40% (c)(d) | | 16,676,889 | 16,678,557 |
| TOTAL MONEY MARKET FUNDS (Cost $26,188,679) | | | 26,188,679 |
| | | | |
| TOTAL INVESTMENT IN SECURITIES - 101.4% (Cost $1,051,386,918) | 1,120,364,130 |
NET OTHER ASSETS (LIABILITIES) - (1.4)% | (15,582,891) |
| NET ASSETS - 100.0% | 1,104,781,239 |
| | |
Legend
| (b) | Security or a portion of the security is on loan at period end. |
| (c) | Affiliated fund that is generally available only to investment companies and other accounts managed by Fidelity Investments. The rate quoted is the annualized seven-day yield of the fund at period end. A complete unaudited listing of the fund's holdings as of its most recent quarter end is available upon request. In addition, each Fidelity Central Fund's financial statements, which are not covered by the Fund's Report of Independent Registered Public Accounting Firm, are available on the SEC's website or upon request. |
| (d) | Investment made with cash collateral received from securities on loan. |
Affiliated Central Funds
Fiscal year to date information regarding the Fund's investments in Fidelity Central Funds, including the ownership percentage, is presented below.
| Affiliate | Value, beginning of period ($) | Purchases ($) | Sales Proceeds ($) | Dividend Income ($) | Realized Gain (loss) ($) | Change in Unrealized appreciation (depreciation) ($) | Value, end of period ($) | % ownership, end of period |
| Fidelity Cash Central Fund 5.40% | 32,028,909 | 666,637,242 | 689,156,029 | 740,144 | - | - | 9,510,122 | 0.0% |
| Fidelity Securities Lending Cash Central Fund 5.40% | 20,391,450 | 1,052,251,998 | 1,055,964,891 | 325,324 | - | - | 16,678,557 | 0.1% |
| Total | 52,420,359 | 1,718,889,240 | 1,745,120,920 | 1,065,468 | - | - | 26,188,679 | |
| | | | | | | | | |
Amounts in the dividend income column in the above table include any capital gain distributions from underlying funds, which are presented in the corresponding line item in the Statement of Operations, if applicable.
Amounts in the dividend income column for Fidelity Securities Lending Cash Central Fund represents the income earned on investing cash collateral, less rebates paid to borrowers and any lending agent fees associated with the loan, plus any premium payments received for lending certain types of securities.
Amounts included in the purchases and sales proceeds columns may include in-kind transactions, if applicable.
Investment Valuation
The following is a summary of the inputs used, as of October 31, 2023, involving the Fund's assets and liabilities carried at fair value. The inputs or methodology used for valuing securities may not be an indication of the risk associated with investing in those securities. For more information on valuation inputs, and their aggregation into the levels used below, please refer to the Investment Valuation section in the accompanying Notes to Financial Statements.
| Valuation Inputs at Reporting Date: |
| Description | Total ($) | Level 1 ($) | Level 2 ($) | Level 3 ($) |
Investments in Securities: | | | | |
|
| Common Stocks | 1,094,175,451 | 919,049,242 | 175,126,209 | - |
|
| Money Market Funds | 26,188,679 | 26,188,679 | - | - |
| Total Investments in Securities: | 1,120,364,130 | 945,237,921 | 175,126,209 | - |
| Statement of Assets and Liabilities |
| | | | October 31, 2023 |
| | | | | |
| Assets | | | | |
| Investment in securities, at value (including securities loaned of $15,933,883) - See accompanying schedule: | | | | |
Unaffiliated issuers (cost $1,025,198,239) | $ | 1,094,175,451 | | |
Fidelity Central Funds (cost $26,188,679) | | 26,188,679 | | |
| | | | | |
| | | | | |
| Total Investment in Securities (cost $1,051,386,918) | | | $ | 1,120,364,130 |
| Foreign currency held at value (cost $6,224) | | | | 6,220 |
| Receivable for investments sold | | | | 17,053,463 |
| Receivable for fund shares sold | | | | 3,567,213 |
| Dividends receivable | | | | 2,754,633 |
| Distributions receivable from Fidelity Central Funds | | | | 61,555 |
| Prepaid expenses | | | | 1,906 |
| Receivable from investment adviser for expense reductions | | | | 24,078 |
| Other receivables | | | | 3,183 |
Total assets | | | | 1,143,836,381 |
| Liabilities | | | | |
| Payable for investments purchased | $ | 19,098,416 | | |
| Payable for fund shares redeemed | | 2,285,110 | | |
| Accrued management fee | | 654,702 | | |
| Distribution and service plan fees payable | | 49,492 | | |
| Other affiliated payables | | 231,514 | | |
| Other payables and accrued expenses | | 57,351 | | |
| Collateral on securities loaned | | 16,678,557 | | |
| Total Liabilities | | | | 39,055,142 |
| Net Assets | | | $ | 1,104,781,239 |
| Net Assets consist of: | | | | |
| Paid in capital | | | $ | 1,233,355,409 |
| Total accumulated earnings (loss) | | | | (128,574,170) |
| Net Assets | | | $ | 1,104,781,239 |
| | | | | |
| Net Asset Value and Maximum Offering Price | | | | |
| Class A : | | | | |
Net Asset Value and redemption price per share ($95,289,996 ÷ 5,499,378 shares)(a) | | | $ | 17.33 |
| Maximum offering price per share (100/94.25 of $17.33) | | | $ | 18.39 |
| Class M : | | | | |
Net Asset Value and redemption price per share ($17,927,930 ÷ 1,037,607 shares)(a) | | | $ | 17.28 |
| Maximum offering price per share (100/96.50 of $17.28) | | | $ | 17.91 |
| Class C : | | | | |
Net Asset Value and offering price per share ($23,853,033 ÷ 1,393,922 shares)(a) | | | $ | 17.11 |
| Global Commodity Stock : | | | | |
Net Asset Value, offering price and redemption price per share ($428,911,594 ÷ 24,680,192 shares) | | | $ | 17.38 |
| Class I : | | | | |
Net Asset Value, offering price and redemption price per share ($351,709,037 ÷ 20,247,555 shares) | | | $ | 17.37 |
| Class Z : | | | | |
Net Asset Value, offering price and redemption price per share ($187,089,649 ÷ 10,770,998 shares) | | | $ | 17.37 |
(a)Redemption price per share is equal to net asset value less any applicable contingent deferred sales charge. |
| Statement of Operations |
| | | | Year ended October 31, 2023 |
| Investment Income | | | | |
| Dividends | | | $ | 50,192,489 |
| Income from Fidelity Central Funds (including $325,324 from security lending) | | | | 1,065,468 |
| Income before foreign taxes withheld | | | $ | 51,257,957 |
| Less foreign taxes withheld | | | | (3,035,098) |
| Total Income | | | | 48,222,859 |
| Expenses | | | | |
| Management fee | $ | 10,665,143 | | |
| Transfer agent fees | | 2,826,947 | | |
| Distribution and service plan fees | | 732,083 | | |
| Accounting fees | | 675,488 | | |
| Custodian fees and expenses | | 75,117 | | |
| Independent trustees' fees and expenses | | 8,968 | | |
| Registration fees | | 189,034 | | |
| Audit | | 50,360 | | |
| Legal | | 1,812 | | |
| Interest | | 22,855 | | |
| Miscellaneous | | 7,327 | | |
| Total expenses before reductions | | 15,255,134 | | |
| Expense reductions | | (200,038) | | |
| Total expenses after reductions | | | | 15,055,096 |
| Net Investment income (loss) | | | | 33,167,763 |
| Realized and Unrealized Gain (Loss) | | | | |
| Net realized gain (loss) on: | | | | |
| Investment Securities: | | | | |
| Unaffiliated issuers | | (8,792,663) | | |
| Foreign currency transactions | | (99,338) | | |
| Total net realized gain (loss) | | | | (8,892,001) |
| Change in net unrealized appreciation (depreciation) on: | | | | |
| Investment Securities: | | | | |
| Unaffiliated issuers | | (190,373,437) | | |
| Assets and liabilities in foreign currencies | | 22,972 | | |
| Total change in net unrealized appreciation (depreciation) | | | | (190,350,465) |
| Net gain (loss) | | | | (199,242,466) |
| Net increase (decrease) in net assets resulting from operations | | | $ | (166,074,703) |
| Statement of Changes in Net Assets |
| |
| | Year ended October 31, 2023 | | Year ended October 31, 2022 |
| Increase (Decrease) in Net Assets | | | | |
| Operations | | | | |
| Net investment income (loss) | $ | 33,167,763 | $ | 36,916,447 |
| Net realized gain (loss) | | (8,892,001) | | (11,614,714) |
| Change in net unrealized appreciation (depreciation) | | (190,350,465) | | 103,859,568 |
| Net increase (decrease) in net assets resulting from operations | | (166,074,703) | | 129,161,301 |
| Distributions to shareholders | | (34,691,564) | | (25,407,967) |
| | | | | |
| Share transactions - net increase (decrease) | | (509,569,294) | | 953,160,143 |
| Total increase (decrease) in net assets | | (710,335,561) | | 1,056,913,477 |
| | | | | |
| Net Assets | | | | |
| Beginning of period | | 1,815,116,800 | | 758,203,323 |
| End of period | $ | 1,104,781,239 | $ | 1,815,116,800 |
| | | | | |
| | | | | |
Financial Highlights
| Fidelity Advisor® Global Commodity Stock Fund Class A |
| |
| Years ended October 31, | | 2023 | | 2022 | | 2021 | | 2020 | | 2019 |
Selected Per-Share Data | | | | | | | | | | |
| Net asset value, beginning of period | $ | 19.50 | $ | 16.35 | $ | 10.80 | $ | 12.14 | $ | 12.42 |
| Income from Investment Operations | | | | | | | | | | |
Net investment income (loss) A,B | | .35 | | .47 | | .48 | | .28 | | .35 |
| Net realized and unrealized gain (loss) | | (2.20) | | 3.19 | | 5.24 | | (1.26) | | (.41) |
| Total from investment operations | | (1.85) | | 3.66 | | 5.72 | | (.98) | | (.06) |
| Distributions from net investment income | | (.32) | | (.51) | | (.17) | | (.36) | | (.20) |
| Distributions from net realized gain | | - | | - | | - | | - | | (.02) |
| Total distributions | | (.32) | | (.51) | | (.17) | | (.36) | | (.22) |
| Net asset value, end of period | $ | 17.33 | $ | 19.50 | $ | 16.35 | $ | 10.80 | $ | 12.14 |
Total Return C,D | | (9.64)% | | 23.27% | | 53.37% | | (8.39)% | | (.44)% |
Ratios to Average Net Assets B,E,F | | | | | | | | | | |
| Expenses before reductions | | 1.19% | | 1.19% | | 1.23% | | 1.31% | | 1.29% |
| Expenses net of fee waivers, if any | | 1.18% | | 1.19% | | 1.22% | | 1.31% | | 1.28% |
| Expenses net of all reductions | | 1.18% | | 1.19% | | 1.22% | | 1.29% | | 1.28% |
| Net investment income (loss) | | 1.88% | | 2.53% | | 3.18% | | 2.53% | | 2.86% |
| Supplemental Data | | | | | | | | | | |
| Net assets, end of period (000 omitted) | $ | 95,290 | $ | 128,363 | $ | 45,343 | $ | 20,453 | $ | 25,779 |
Portfolio turnover rate G | | 113% | | 42% | | 37% | | 40% | | 55% |
ACalculated based on average shares outstanding during the period.
BNet investment income (loss) is affected by the timing of the declaration of dividends by any underlying mutual funds or exchange-traded funds (ETFs). Net investment income (loss) of any mutual funds or ETFs is not included in the Fund's net investment income (loss) ratio.
CTotal returns would have been lower if certain expenses had not been reduced during the applicable periods shown.
DTotal returns do not include the effect of the sales charges.
EFees and expenses of any underlying mutual funds or exchange-traded funds (ETFs) are not included in the Fund's expense ratio. The Fund indirectly bears its proportionate share of these expenses. For additional expense information related to investments in Fidelity Central Funds, please refer to the "Investments in Fidelity Central Funds" note found in the Notes to Financial Statements section of the most recent Annual or Semi-Annual report.
FExpense ratios reflect operating expenses of the class. Expenses before reductions do not reflect amounts reimbursed, waived, or reduced through arrangements with the investment adviser, brokerage services, or other offset arrangements, if applicable, and do not represent the amount paid by the class during periods when reimbursements, waivers or reductions occur.
GAmount does not include the portfolio activity of any underlying mutual funds or exchange-traded funds (ETFs).
| Fidelity Advisor® Global Commodity Stock Fund Class M |
| |
| Years ended October 31, | | 2023 | | 2022 | | 2021 | | 2020 | | 2019 |
Selected Per-Share Data | | | | | | | | | | |
| Net asset value, beginning of period | $ | 19.46 | $ | 16.32 | $ | 10.78 | $ | 12.12 | $ | 12.39 |
| Income from Investment Operations | | | | | | | | | | |
Net investment income (loss) A,B | | .30 | | .42 | | .44 | | .25 | | .31 |
| Net realized and unrealized gain (loss) | | (2.20) | | 3.19 | | 5.24 | | (1.27) | | (.40) |
| Total from investment operations | | (1.90) | | 3.61 | | 5.68 | | (1.02) | | (.09) |
| Distributions from net investment income | | (.28) | | (.47) | | (.14) | | (.32) | | (.16) |
| Distributions from net realized gain | | - | | - | | - | | - | | (.02) |
| Total distributions | | (.28) | | (.47) | | (.14) | | (.32) | | (.18) |
| Net asset value, end of period | $ | 17.28 | $ | 19.46 | $ | 16.32 | $ | 10.78 | $ | 12.12 |
Total Return C,D | | (9.90)% | | 22.93% | | 52.97% | | (8.72)% | | (.70)% |
Ratios to Average Net Assets B,E,F | | | | | | | | | | |
| Expenses before reductions | | 1.47% | | 1.46% | | 1.52% | | 1.59% | | 1.59% |
| Expenses net of fee waivers, if any | | 1.45% | | 1.46% | | 1.52% | | 1.59% | | 1.59% |
| Expenses net of all reductions | | 1.45% | | 1.46% | | 1.52% | | 1.58% | | 1.59% |
| Net investment income (loss) | | 1.62% | | 2.26% | | 2.88% | | 2.24% | | 2.55% |
| Supplemental Data | | | | | | | | | | |
| Net assets, end of period (000 omitted) | $ | 17,928 | $ | 24,513 | $ | 8,888 | $ | 4,378 | $ | 5,416 |
Portfolio turnover rate G | | 113% | | 42% | | 37% | | 40% | | 55% |
ACalculated based on average shares outstanding during the period.
BNet investment income (loss) is affected by the timing of the declaration of dividends by any underlying mutual funds or exchange-traded funds (ETFs). Net investment income (loss) of any mutual funds or ETFs is not included in the Fund's net investment income (loss) ratio.
CTotal returns would have been lower if certain expenses had not been reduced during the applicable periods shown.
DTotal returns do not include the effect of the sales charges.
EFees and expenses of any underlying mutual funds or exchange-traded funds (ETFs) are not included in the Fund's expense ratio. The Fund indirectly bears its proportionate share of these expenses. For additional expense information related to investments in Fidelity Central Funds, please refer to the "Investments in Fidelity Central Funds" note found in the Notes to Financial Statements section of the most recent Annual or Semi-Annual report.
FExpense ratios reflect operating expenses of the class. Expenses before reductions do not reflect amounts reimbursed, waived, or reduced through arrangements with the investment adviser, brokerage services, or other offset arrangements, if applicable, and do not represent the amount paid by the class during periods when reimbursements, waivers or reductions occur.
GAmount does not include the portfolio activity of any underlying mutual funds or exchange-traded funds (ETFs).
| Fidelity Advisor® Global Commodity Stock Fund Class C |
| |
| Years ended October 31, | | 2023 | | 2022 | | 2021 | | 2020 | | 2019 |
Selected Per-Share Data | | | | | | | | | | |
| Net asset value, beginning of period | $ | 19.29 | $ | 16.17 | $ | 10.68 | $ | 11.99 | $ | 12.26 |
| Income from Investment Operations | | | | | | | | | | |
Net investment income (loss) A,B | | .21 | | .33 | | .37 | | .20 | | .26 |
| Net realized and unrealized gain (loss) | | (2.18) | | 3.18 | | 5.20 | | (1.26) | | (.41) |
| Total from investment operations | | (1.97) | | 3.51 | | 5.57 | | (1.06) | | (.15) |
| Distributions from net investment income | | (.21) | | (.39) | | (.08) | | (.25) | | (.11) |
| Distributions from net realized gain | | - | | - | | - | | - | | (.02) |
| Total distributions | | (.21) | | (.39) | | (.08) | | (.25) | | (.12) C |
| Net asset value, end of period | $ | 17.11 | $ | 19.29 | $ | 16.17 | $ | 10.68 | $ | 11.99 |
Total Return D,E | | (10.34)% | | 22.34% | | 52.30% | | (9.11)% | | (1.16)% |
Ratios to Average Net Assets B,F,G | | | | | | | | | | |
| Expenses before reductions | | 1.94% | | 1.94% | | 1.97% | | 2.05% | | 2.02% |
| Expenses net of fee waivers, if any | | 1.93% | | 1.93% | | 1.96% | | 2.04% | | 2.02% |
| Expenses net of all reductions | | 1.93% | | 1.93% | | 1.96% | | 2.03% | | 2.01% |
| Net investment income (loss) | | 1.13% | | 1.78% | | 2.44% | | 1.79% | | 2.13% |
| Supplemental Data | | | | | | | | | | |
| Net assets, end of period (000 omitted) | $ | 23,853 | $ | 34,984 | $ | 11,020 | $ | 7,871 | $ | 11,294 |
Portfolio turnover rate H | | 113% | | 42% | | 37% | | 40% | | 55% |
ACalculated based on average shares outstanding during the period.
BNet investment income (loss) is affected by the timing of the declaration of dividends by any underlying mutual funds or exchange-traded funds (ETFs). Net investment income (loss) of any mutual funds or ETFs is not included in the Fund's net investment income (loss) ratio.
CTotal distributions per share do not sum due to rounding.
DTotal returns would have been lower if certain expenses had not been reduced during the applicable periods shown.
ETotal returns do not include the effect of the contingent deferred sales charge.
FFees and expenses of any underlying mutual funds or exchange-traded funds (ETFs) are not included in the Fund's expense ratio. The Fund indirectly bears its proportionate share of these expenses. For additional expense information related to investments in Fidelity Central Funds, please refer to the "Investments in Fidelity Central Funds" note found in the Notes to Financial Statements section of the most recent Annual or Semi-Annual report.
GExpense ratios reflect operating expenses of the class. Expenses before reductions do not reflect amounts reimbursed, waived, or reduced through arrangements with the investment adviser, brokerage services, or other offset arrangements, if applicable, and do not represent the amount paid by the class during periods when reimbursements, waivers or reductions occur.
HAmount does not include the portfolio activity of any underlying mutual funds or exchange-traded funds (ETFs).
| Fidelity® Global Commodity Stock Fund |
| |
| Years ended October 31, | | 2023 | | 2022 | | 2021 | | 2020 | | 2019 |
Selected Per-Share Data | | | | | | | | | | |
| Net asset value, beginning of period | $ | 19.55 | $ | 16.39 | $ | 10.82 | $ | 12.15 | $ | 12.44 |
| Income from Investment Operations | | | | | | | | | | |
Net investment income (loss) A,B | | .40 | | .52 | | .53 | | .31 | | .37 |
| Net realized and unrealized gain (loss) | | (2.21) | | 3.19 | | 5.26 | | (1.26) | | (.41) |
| Total from investment operations | | (1.81) | | 3.71 | | 5.79 | | (.95) | | (.04) |
| Distributions from net investment income | | (.36) | | (.55) | | (.22) | | (.38) | | (.23) |
| Distributions from net realized gain | | - | | - | | - | | - | | (.02) |
| Total distributions | | (.36) | | (.55) | | (.22) | | (.38) | | (.25) |
| Net asset value, end of period | $ | 17.38 | $ | 19.55 | $ | 16.39 | $ | 10.82 | $ | 12.15 |
Total Return C | | (9.47)% | | 23.57% | | 53.95% | | (8.16)% | | (.23)% |
Ratios to Average Net Assets B,D,E | | | | | | | | | | |
| Expenses before reductions | | .97% | | .94% | | .94% | | 1.02% | | 1.06% |
| Expenses net of fee waivers, if any | | .95% | | .94% | | .94% | | 1.02% | | 1.06% |
| Expenses net of all reductions | | .95% | | .94% | | .94% | | 1.00% | | 1.06% |
| Net investment income (loss) | | 2.12% | | 2.78% | | 3.46% | | 2.82% | | 3.08% |
| Supplemental Data | | | | | | | | | | |
| Net assets, end of period (000 omitted) | $ | 428,912 | $ | 893,636 | $ | 546,863 | $ | 176,718 | $ | 257,011 |
Portfolio turnover rate F | | 113% | | 42% | | 37% | | 40% | | 55% |
ACalculated based on average shares outstanding during the period.
BNet investment income (loss) is affected by the timing of the declaration of dividends by any underlying mutual funds or exchange-traded funds (ETFs). Net investment income (loss) of any mutual funds or ETFs is not included in the Fund's net investment income (loss) ratio.
CTotal returns would have been lower if certain expenses had not been reduced during the applicable periods shown.
DFees and expenses of any underlying mutual funds or exchange-traded funds (ETFs) are not included in the Fund's expense ratio. The Fund indirectly bears its proportionate share of these expenses. For additional expense information related to investments in Fidelity Central Funds, please refer to the "Investments in Fidelity Central Funds" note found in the Notes to Financial Statements section of the most recent Annual or Semi-Annual report.
EExpense ratios reflect operating expenses of the class. Expenses before reductions do not reflect amounts reimbursed, waived, or reduced through arrangements with the investment adviser, brokerage services, or other offset arrangements, if applicable, and do not represent the amount paid by the class during periods when reimbursements, waivers or reductions occur.
FAmount does not include the portfolio activity of any underlying mutual funds or exchange-traded funds (ETFs).
| Fidelity Advisor® Global Commodity Stock Fund Class I |
| |
| Years ended October 31, | | 2023 | | 2022 | | 2021 | | 2020 | | 2019 |
Selected Per-Share Data | | | | | | | | | | |
| Net asset value, beginning of period | $ | 19.54 | $ | 16.39 | $ | 10.81 | $ | 12.16 | $ | 12.45 |
| Income from Investment Operations | | | | | | | | | | |
Net investment income (loss) A,B | | .40 | | .52 | | .53 | | .32 | | .39 |
| Net realized and unrealized gain (loss) | | (2.20) | | 3.19 | | 5.25 | | (1.26) | | (.41) |
| Total from investment operations | | (1.80) | | 3.71 | | 5.78 | | (.94) | | (.02) |
| Distributions from net investment income | | (.37) | | (.56) | | (.20) | | (.41) | | (.25) |
| Distributions from net realized gain | | - | | - | | - | | - | | (.02) |
| Total distributions | | (.37) | | (.56) | | (.20) | | (.41) | | (.27) |
| Net asset value, end of period | $ | 17.37 | $ | 19.54 | $ | 16.39 | $ | 10.81 | $ | 12.16 |
Total Return C | | (9.42)% | | 23.56% | | 53.97% | | (8.11)% | | (.06)% |
Ratios to Average Net Assets B,D,E | | | | | | | | | | |
| Expenses before reductions | | .92% | | .92% | | .93% | | .95% | | .92% |
| Expenses net of fee waivers, if any | | .91% | | .92% | | .93% | | .95% | | .92% |
| Expenses net of all reductions | | .91% | | .92% | | .93% | | .93% | | .91% |
| Net investment income (loss) | | 2.15% | | 2.80% | | 3.48% | | 2.88% | | 3.23% |
| Supplemental Data | | | | | | | | | | |
| Net assets, end of period (000 omitted) | $ | 351,709 | $ | 499,191 | $ | 85,252 | $ | 33,185 | $ | 102,633 |
Portfolio turnover rate F | | 113% | | 42% | | 37% | | 40% | | 55% |
ACalculated based on average shares outstanding during the period.
BNet investment income (loss) is affected by the timing of the declaration of dividends by any underlying mutual funds or exchange-traded funds (ETFs). Net investment income (loss) of any mutual funds or ETFs is not included in the Fund's net investment income (loss) ratio.
CTotal returns would have been lower if certain expenses had not been reduced during the applicable periods shown.
DFees and expenses of any underlying mutual funds or exchange-traded funds (ETFs) are not included in the Fund's expense ratio. The Fund indirectly bears its proportionate share of these expenses. For additional expense information related to investments in Fidelity Central Funds, please refer to the "Investments in Fidelity Central Funds" note found in the Notes to Financial Statements section of the most recent Annual or Semi-Annual report.
EExpense ratios reflect operating expenses of the class. Expenses before reductions do not reflect amounts reimbursed, waived, or reduced through arrangements with the investment adviser, brokerage services, or other offset arrangements, if applicable, and do not represent the amount paid by the class during periods when reimbursements, waivers or reductions occur.
FAmount does not include the portfolio activity of any underlying mutual funds or exchange-traded funds (ETFs).
| Fidelity Advisor® Global Commodity Stock Fund Class Z |
| |
| Years ended October 31, | | 2023 | | 2022 | | 2021 | | 2020 | | 2019 |
Selected Per-Share Data | | | | | | | | | | |
| Net asset value, beginning of period | $ | 19.53 | $ | 16.38 | $ | 10.81 | $ | 12.16 | $ | 12.46 |
| Income from Investment Operations | | | | | | | | | | |
Net investment income (loss) A,B | | .43 | | .54 | | .56 | | .34 | | .39 |
| Net realized and unrealized gain (loss) | | (2.21) | | 3.19 | | 5.23 | | (1.26) | | (.40) |
| Total from investment operations | | (1.78) | | 3.73 | | 5.79 | | (.92) | | (.01) |
| Distributions from net investment income | | (.38) | | (.58) | | (.22) | | (.43) | | (.27) |
| Distributions from net realized gain | | - | | - | | - | | - | | (.02) |
| Total distributions | | (.38) | | (.58) | | (.22) | | (.43) | | (.29) |
| Net asset value, end of period | $ | 17.37 | $ | 19.53 | $ | 16.38 | $ | 10.81 | $ | 12.16 |
Total Return C,D | | (9.30)% | | 23.72% | | 54.07% | | (7.99)% | | .03% |
Ratios to Average Net Assets B,E,F | | | | | | | | | | |
| Expenses before reductions | | .79% | | .79% | | .80% | | .85% | | .83% |
| Expenses net of fee waivers, if any | | .78% | | .79% | | .80% | | .84% | | .83% |
| Expenses net of all reductions | | .78% | | .79% | | .80% | | .83% | | .82% |
| Net investment income (loss) | | 2.29% | | 2.93% | | 3.60% | | 2.99% | | 3.32% |
| Supplemental Data | | | | | | | | | | |
| Net assets, end of period (000 omitted) | $ | 187,090 | $ | 234,430 | $ | 60,837 | $ | 16,505 | $ | 104,489 |
Portfolio turnover rate G | | 113% | | 42% | | 37% | | 40% | | 55% |
ACalculated based on average shares outstanding during the period.
BNet investment income (loss) is affected by the timing of the declaration of dividends by any underlying mutual funds or exchange-traded funds (ETFs). Net investment income (loss) of any mutual funds or ETFs is not included in the Fund's net investment income (loss) ratio.
CTotal returns for periods of less than one year are not annualized.
DTotal returns would have been lower if certain expenses had not been reduced during the applicable periods shown.
EFees and expenses of any underlying mutual funds or exchange-traded funds (ETFs) are not included in the Fund's expense ratio. The Fund indirectly bears its proportionate share of these expenses. For additional expense information related to investments in Fidelity Central Funds, please refer to the "Investments in Fidelity Central Funds" note found in the Notes to Financial Statements section of the most recent Annual or Semi-Annual report.
FExpense ratios reflect operating expenses of the class. Expenses before reductions do not reflect amounts reimbursed, waived, or reduced through arrangements with the investment adviser, brokerage services, or other offset arrangements, if applicable, and do not represent the amount paid by the class during periods when reimbursements, waivers or reductions occur.
GAmount does not include the portfolio activity of any underlying mutual funds or exchange-traded funds (ETFs).
For the period ended October 31, 2023
1. Organization.
Fidelity Global Commodity Stock Fund (the Fund) is a non-diversified fund of Fidelity Investment Trust (the Trust) and is authorized to issue an unlimited number of shares. The Trust is registered under the Investment Company Act of 1940, as amended (the 1940 Act), as an open-end management investment company organized as a Massachusetts business trust. The Fund offers Class A, Class M, Class C, Global Commodity Stock, Class I and Class Z shares, each of which has equal rights as to assets and voting privileges. Class A, Class M, Class C, Class I and Class Z are Fidelity Advisor classes. Each class has exclusive voting rights with respect to matters that affect that class. Class C shares will automatically convert to Class A shares after a holding period of eight years from the initial date of purchase, with certain exceptions.
2. Investments in Fidelity Central Funds.
Funds may invest in Fidelity Central Funds, which are open-end investment companies generally available only to other investment companies and accounts managed by the investment adviser and its affiliates. The Schedule of Investments lists any Fidelity Central Funds held as an investment as of period end, but does not include the underlying holdings of each Fidelity Central Fund. An investing fund indirectly bears its proportionate share of the expenses of the underlying Fidelity Central Funds.
Based on its investment objective, each Fidelity Central Fund may invest or participate in various investment vehicles or strategies that are similar to those of the investing fund. These strategies are consistent with the investment objectives of the investing fund and may involve certain economic risks which may cause a decline in value of each of the Fidelity Central Funds and thus a decline in the value of the investing fund.
| Fidelity Central Fund | Investment Manager | Investment Objective | Investment Practices | Expense RatioA |
| Fidelity Money Market Central Funds | Fidelity Management & Research Company LLC (FMR) | Each fund seeks to obtain a high level of current income consistent with the preservation of capital and liquidity. | Short-term Investments | Less than .005% |
A Expenses expressed as a percentage of average net assets and are as of each underlying Central Fund's most recent annual or semi-annual shareholder report.
A complete unaudited list of holdings for each Fidelity Central Fund is available upon request or at the Securities and Exchange Commission website at www.sec.gov. In addition, the financial statements of the Fidelity Central Funds which contain the significant accounting policies (including investment valuation policies) of those funds, and are not covered by the Report of Independent Registered Public Accounting Firm, are available on the Securities and Exchange Commission website or upon request.
3. Significant Accounting Policies.
The Fund is an investment company and applies the accounting and reporting guidance of the Financial Accounting Standards Board (FASB) Accounting Standards Codification Topic 946 Financial Services - Investment Companies. The financial statements have been prepared in conformity with accounting principles generally accepted in the United States of America (GAAP), which require management to make certain estimates and assumptions at the date of the financial statements. Actual results could differ from those estimates. Subsequent events, if any, through the date that the financial statements were issued have been evaluated in the preparation of the financial statements. The Fund's Schedule of Investments lists any underlying mutual funds or exchange-traded funds (ETFs) but does not include the underlying holdings of these funds. The following summarizes the significant accounting policies of the Fund:
Investment Valuation. Investments are valued as of 4:00 p.m. Eastern time on the last calendar day of the period. The Board of Trustees (the Board) has designated the Fund's investment adviser as the valuation designee responsible for the fair valuation function and performing fair value determinations as needed. The investment adviser has established a Fair Value Committee (the Committee) to carry out the day-to-day fair valuation responsibilities and has adopted policies and procedures to govern the fair valuation process and the activities of the Committee. In accordance with these fair valuation policies and procedures, which have been approved by the Board, the Fund attempts to obtain prices from one or more third party pricing services or brokers to value its investments. When current market prices, quotations or currency exchange rates are not readily available or reliable, investments will be fair valued in good faith by the Committee, in accordance with the policies and procedures. Factors used in determining fair value vary by investment type and may include market or investment specific events, transaction data, estimated cash flows, and market observations of comparable investments. The frequency that the fair valuation procedures are used cannot be predicted and they may be utilized to a significant extent. The Committee manages the Fund's fair valuation practices and maintains the fair valuation policies and procedures. The Fund's investment adviser reports to the Board information regarding the fair valuation process and related material matters.
The Fund categorizes the inputs to valuation techniques used to value its investments into a disclosure hierarchy consisting of three levels as shown below:
Level 1 - unadjusted quoted prices in active markets for identical investments
Level 2 - other significant observable inputs (including quoted prices for similar investments, interest rates, prepayment speeds, etc.)
Level 3 - unobservable inputs (including the Fund's own assumptions based on the best information available)
Valuation techniques used to value the Fund's investments by major category are as follows:
Equity securities, including restricted securities, for which market quotations are readily available, are valued at the last reported sale price or official closing price as reported by a third party pricing service on the primary market or exchange on which they are traded and are categorized as Level 1 in the hierarchy. In the event there were no sales during the day or closing prices are not available, securities are valued at the last quoted bid price or may be valued using the last available price and are generally categorized as Level 2 in the hierarchy. For foreign equity securities, when market or security specific events arise, comparisons to the valuation of American Depositary Receipts (ADRs), futures contracts, ETFs and certain indexes as well as quoted prices for similar securities may be used and would be categorized as Level 2 in the hierarchy. For equity securities, including restricted securities, where observable inputs are limited, assumptions about market activity and risk are used and these securities may be categorized as Level 3 in the hierarchy.
Investments in open-end mutual funds, including the Fidelity Central Funds, are valued at their closing net asset value (NAV) each business day and are categorized as Level 1 in the hierarchy.
Changes in valuation techniques may result in transfers in or out of an assigned level within the disclosure hierarchy. The aggregate value of investments by input level as of October 31, 2023 is included at the end of the Fund's Schedule of Investments.
Foreign Currency. Certain Funds may use foreign currency contracts to facilitate transactions in foreign-denominated securities. Gains and losses from these transactions may arise from changes in the value of the foreign currency or if the counterparties do not perform under the contracts' terms.
Foreign-denominated assets, including investment securities, and liabilities are translated into U.S. dollars at the exchange rates at period end. Purchases and sales of investment securities, income and dividends received, and expenses denominated in foreign currencies are translated into U.S. dollars at the exchange rate in effect on the transaction date.
The effects of exchange rate fluctuations on investments are included with the net realized and unrealized gain (loss) on investment securities. Other foreign currency transactions resulting in realized and unrealized gain (loss) are disclosed separately.
Investment Transactions and Income. For financial reporting purposes, the Fund's investment holdings and NAV include trades executed through the end of the last business day of the period. The NAV per share for processing shareholder transactions is calculated as of the close of business of the New York Stock Exchange (NYSE), normally 4:00 p.m. Eastern time and includes trades executed through the end of the prior business day. Gains and losses on securities sold are determined on the basis of identified cost and include proceeds received from litigation. Commissions paid to certain brokers with whom the investment adviser, or its affiliates, places trades on behalf of a fund include an amount in addition to trade execution, which may be rebated back to a fund. Any such rebates are included in net realized gain (loss) on investments in the Statement of Operations. Dividend income is recorded on the ex-dividend date, except for certain dividends from foreign securities where the ex-dividend date may have passed, which are recorded as soon as the Fund is informed of the ex-dividend date. Non-cash dividends included in dividend income, if any, are recorded at the fair market value of the securities received. Income and capital gain distributions from Fidelity Central Funds, if any, are recorded on the ex-dividend date. Certain distributions received by the Fund represent a return of capital or capital gain. The Fund determines the components of these distributions subsequent to the ex-dividend date, based upon receipt of tax filings or other correspondence relating to the underlying investment. These distributions are recorded as a reduction of cost of investments and/or as a realized gain. Investment income is recorded net of foreign taxes withheld where recovery of such taxes is uncertain. Funds may file withholding tax reclaims in certain jurisdictions to recover a portion of amounts previously withheld. Any withholding tax reclaims income is included in the Statement of Operations in foreign taxes withheld. Any receivables for withholding tax reclaims are included in the Statement of Assets and Liabilities in dividends receivable.
Class Allocations and Expenses. Investment income, realized and unrealized capital gains and losses, common expenses of a fund, and certain fund-level expense reductions, if any, are allocated daily on a pro-rata basis to each class based on the relative net assets of each class to the total net assets of a fund. Each class differs with respect to transfer agent and distribution and service plan fees incurred, as applicable. Certain expense reductions may also differ by class, if applicable. For the reporting period, the allocated portion of income and expenses to each class as a percent of its average net assets may vary due to the timing of recording these transactions in relation to fluctuating net assets of the classes. Expenses directly attributable to a fund are charged to that fund. Expenses attributable to more than one fund are allocated among the respective funds on the basis of relative net assets or other appropriate methods. Expenses included in the accompanying financial statements reflect the expenses of that fund and do not include any expenses associated with any underlying mutual funds or exchange-traded funds (ETFs). Although not included in a fund's expenses, a fund indirectly bears its proportionate share of these expenses through the net asset value of each underlying mutual fund or exchange-traded fund (ETF). Expense estimates are accrued in the period to which they relate and adjustments are made when actual amounts are known.
Income Tax Information and Distributions to Shareholders. Each year, the Fund intends to qualify as a regulated investment company under Subchapter M of the Internal Revenue Code, including distributing substantially all of its taxable income and realized gains. As a result, no provision for U.S. Federal income taxes is required. As of October 31, 2023, the Fund did not have any unrecognized tax benefits in the financial statements; nor is the Fund aware of any tax positions for which it is reasonably possible that the total amounts of unrecognized tax benefits will significantly change in the next twelve months. The Fund files a U.S. federal tax return, in addition to state and local tax returns as required. The Fund's federal income tax returns are subject to examination by the Internal Revenue Service (IRS) for a period of three fiscal years after they are filed. State and local tax returns may be subject to examination for an additional fiscal year depending on the jurisdiction. Foreign taxes are provided for based on the Fund's understanding of the tax rules and rates that exist in the foreign markets in which it invests.
Distributions are declared and recorded on the ex-dividend date. Income and capital gain distributions are declared separately for each class. Income and capital gain distributions are determined in accordance with income tax regulations, which may differ from GAAP. In addition, the Fund claimed a portion of the payment made to redeeming shareholders as a distribution for income tax purposes.
Capital accounts within the financial statements are adjusted for permanent book-tax differences. These adjustments have no impact on net assets or the results of operations. Capital accounts are not adjusted for temporary book-tax differences which will reverse in a subsequent period.
Book-tax differences are primarily due to foreign currency transactions, passive foreign investment companies (PFIC), partnerships, capital loss carryforwards and losses deferred due to wash sales.
As of period end, the cost and unrealized appreciation (depreciation) in securities, and derivatives if applicable, for federal income tax purposes were as follows:
| Gross unrealized appreciation | $120,408,406 |
| Gross unrealized depreciation | (60,730,052) |
| Net unrealized appreciation (depreciation) | $59,678,354 |
| Tax Cost | $1,060,685,776 |
The tax-based components of distributable earnings as of period end were as follows:
| Undistributed ordinary income | $18,331,139 |
| Capital loss carryforward | $(206,580,792) |
| Net unrealized appreciation (depreciation) on securities and other investments | $59,675,481 |
| | |
Capital loss carryforwards are only available to offset future capital gains of the Fund to the extent provided by regulations and may be limited. The capital loss carryforward information presented below, including any applicable limitation, is estimated as of fiscal period end and is subject to adjustment.
Short-term | $(206,499,261) |
Long-term | (81,531) |
| Total capital loss carryforward | $(206,580,792) |
The tax character of distributions paid was as follows:
| | October 31, 2023 | October 31, 2022 |
| Ordinary Income | $34,691,564 | $25,407,967 |
4. Purchases and Sales of Investments.
Purchases and sales of securities, other than short-term securities and in-kind transactions, as applicable, are noted in the table below.
| | Purchases ($) | Sales ($) |
| Fidelity Global Commodity Stock Fund | 1,754,696,874 | 2,252,305,884 |
5. Fees and Other Transactions with Affiliates.
Management Fee. Fidelity Management & Research Company LLC (the investment adviser) and its affiliates provide the Fund with investment management related services for which the Fund pays a monthly management fee. The management fee is the sum of an individual fund fee rate that is based on an annual rate of .45% of the Fund's average net assets and an annualized group fee rate that averaged .23% during the period. The group fee rate is based upon the monthly average net assets of a group of registered investment companies with which the investment adviser has management contracts. The group fee rate decreases as assets under management increase and increases as assets under management decrease. For the reporting period, the total annual management fee rate was .68% of the Fund's average net assets.
Distribution and Service Plan Fees. In accordance with Rule 12b-1 of the 1940 Act, the Fund has adopted separate Distribution and Service Plans for each class of shares. Certain classes pay Fidelity Distributors Company LLC (FDC), an affiliate of the investment adviser, separate Distribution and Service Fees, each of which is based on an annual percentage of each class' average net assets. In addition, FDC may pay financial intermediaries for selling shares of the Fund and providing shareholder support services. For the period, the Distribution and Service Fee rates, total fees and amounts retained by FDC were as follows:
| | Distribution Fee | Service Fee | Total Fees | Retained by FDC |
| Class A | - % | .25% | $302,066 | $19,168 |
| Class M | .25% | .25% | 114,376 | 429 |
| Class C | .75% | .25% | 315,641 | 103,381 |
| | | | $732,083 | $122,978 |
Sales Load. FDC may receive a front-end sales charge of up to 5.75% for selling Class A shares and 3.50% for selling Class M shares, some of which is paid to financial intermediaries for selling shares of the Fund. Depending on the holding period, FDC may receive contingent deferred sales charges levied on Class A, Class M and Class C redemptions. The deferred sales charges are 1.00% for Class C shares, 1.00% for certain purchases of Class A shares and .25% for certain purchases of Class M shares.
For the period, sales charge amounts retained by FDC were as follows:
| | Retained by FDC |
| Class A | $86,075 |
| Class M | 3,944 |
Class CA | 230 |
| | $90,249 |
A When Class C shares are initially sold, FDC pays commissions from its own resources to financial intermediaries through which the sales are made.
Transfer Agent Fees. Fidelity Investments Institutional Operations Company LLC (FIIOC), an affiliate of the investment adviser, is the transfer, dividend disbursing and shareholder servicing agent for each class of the Fund. FIIOC receives account fees and asset-based fees that vary according to the account size and type of account of the shareholders of the respective classes of the Fund, except for Class Z. FIIOC receives an asset-based fee of Class Z's average net assets. FIIOC pays for typesetting, printing and mailing of shareholder reports, except proxy statements.
For the period, transfer agent fees for each class were as follows:
| | Amount | % of Class-Level Average Net Assets |
| Class A | $233,649 | .19 |
| Class M | 50,792 | .22 |
| Class C | 60,561 | .19 |
| Global Commodity Stock | 1,546,673 | .22 |
| Class I | 838,378 | .18 |
| Class Z | 96,894 | .04 |
| | $2,826,947 | |
During November 2023, the Board approved a change in the transfer agent fees effective December 1, 2023 to a fixed annual rate of class-level average net assets as follows:
| | % of Class-Level Average Net Assets |
| Class A | 0.1937% |
| Class M | 0.2000% |
| Class C | 0.1930% |
| Global Commodity Stock | 0.2000% |
| Class I | 0.1745% |
Accounting Fees. Fidelity Service Company, Inc. (FSC), an affiliate of the investment adviser, maintains the Fund's accounting records. The accounting fee is based on the level of average net assets for each month. For the period, the fees were equivalent to the following annual rates:
| | % of Average Net Assets |
| Fidelity Global Commodity Stock Fund | .04 |
During November 2023, the Board approved a change in the accounting fees effective December 1, 2023 to a fixed annual rate of average net assets as follows:
| | % of Average Net Assets |
| Fidelity Global Commodity Stock Fund | 0.0435% |
Brokerage Commissions. A portion of portfolio transactions were placed with brokerage firms which are affiliates of the investment adviser. Brokerage commissions are included in net realized gain (loss) and change in net unrealized appreciation (depreciation) in the Statement of Operations. The commissions paid to these affiliated firms were as follows:
| Amount |
| Fidelity Global Commodity Stock Fund | $33,117 |
Interfund Lending Program. Pursuant to an Exemptive Order issued by the Securities and Exchange Commission (the SEC), the Fund, along with other registered investment companies having management contracts with Fidelity Management & Research Company LLC (FMR), or other affiliated entities of FMR, may participate in an interfund lending program. This program provides an alternative credit facility allowing the Fund to borrow from, or lend money to, other participating affiliated funds. At period end, there were no interfund loans outstanding. Activity in this program during the period for which loans were outstanding was as follows:
| | Borrower or Lender | Average Loan Balance | Weighted Average Interest Rate | Interest Expense |
| Fidelity Global Commodity Stock Fund | Borrower | $ 7,355,409 | 5.08% | $22,855 |
Interfund Trades. Funds may purchase from or sell securities to other Fidelity Funds under procedures adopted by the Board. The procedures have been designed to ensure these interfund trades are executed in accordance with Rule 17a-7 of the 1940 Act. Any interfund trades are included within the respective purchases and sales amounts shown in the Purchases and Sales of Investments note. Interfund trades during the period are noted in the table below.
| | Purchases ($) | Sales ($) | Realized Gain (Loss) ($) |
| Fidelity Global Commodity Stock Fund | 67,801,549 | 70,114,528 | (4,666,177) |
6. Committed Line of Credit.
Certain Funds participate with other funds managed by the investment adviser or an affiliate in a $4.25 billion credit facility (the "line of credit") to be utilized for temporary or emergency purposes to fund shareholder redemptions or for other short-term liquidity purposes. The participating funds have agreed to pay commitment fees on their pro-rata portion of the line of credit, which are reflected in Miscellaneous expenses on the Statement of Operations, and are listed below. During the period, there were no borrowings on this line of credit.
| | Amount |
| Fidelity Global Commodity Stock Fund | $3,012 |
7. Security Lending.
Funds lend portfolio securities from time to time in order to earn additional income. Lending agents are used, including National Financial Services (NFS), an affiliate of the investment adviser. Pursuant to a securities lending agreement, NFS will receive a fee, which is capped at 9.9% of a fund's daily lending revenue, for its services as lending agent. A fund may lend securities to certain qualified borrowers, including NFS. On the settlement date of the loan, a fund receives collateral (in the form of U.S. Treasury obligations, letters of credit and/or cash) against the loaned securities and maintains collateral in an amount not less than 100% of the market value of the loaned securities during the period of the loan. The market value of the loaned securities is determined at the close of business of a fund and any additional required collateral is delivered to a fund on the next business day. A fund or borrower may terminate the loan at any time, and if the borrower defaults on its obligation to return the securities loaned because of insolvency or other reasons, a fund may apply collateral received from the borrower against the obligation. A fund may experience delays and costs in recovering the securities loaned. Any cash collateral received is invested in the Fidelity Securities Lending Cash Central Fund. Any loaned securities are identified as such in the Schedule of Investments, and the value of loaned securities and cash collateral at period end, as applicable, are presented in the Statement of Assets and Liabilities. Security lending income represents the income earned on investing cash collateral, less rebates paid to borrowers and any lending agent fees associated with the loan, plus any premium payments received for lending certain types of securities. Security lending income is presented in the Statement of Operations as a component of income from Fidelity Central Funds. Affiliated security lending activity, if any, was as follows:
| | Total Security Lending Fees Paid to NFS | Security Lending Income From Securities Loaned to NFS | Value of Securities Loaned to NFS at Period End |
| Fidelity Global Commodity Stock Fund | $35,196 | $668 | $134,475 |
8. Expense Reductions.
The investment adviser contractually agreed to reimburse expenses of each class to the extent annual operating expenses exceeded certain levels of class-level average net assets as noted in the table below. This reimbursement will remain in place through February 28, 2025. Some expenses, for example the compensation of the independent Trustees, are excluded from this reimbursement.
The following classes were in reimbursement during the period:
| | Expense Limitations | Reimbursement |
| Class M | 1.45% | $2,934 |
| Global Commodity Stock | .95% | 104,602 |
| | | $107,536 |
Through arrangements with each class' transfer agent, credits realized as a result of certain uninvested cash balances were used to reduce the Fund's expenses. During the period, transfer agent credits reduced each class' expenses as noted in the table below.
| | Expense reduction |
| | |
| Class M | $135 |
| | |
In addition, during the period the investment adviser or an affiliate reimbursed and/or waived a portion of fund-level operating expenses in the amount of $92,367.
9. Distributions to Shareholders.
Distributions to shareholders of each class were as follows:
| | Year ended October 31, 2023 | Year ended October 31, 2022 |
| Fidelity Global Commodity Stock Fund | | |
| Distributions to shareholders | | |
| Class A | $ 2,247,696 | $1,448,690 |
| Class M | 366,393 | 259,454 |
| Class C | 382,649 | 264,183 |
| Global Commodity Stock | 16,441,380 | 18,171,488 |
| Class I | 10,386,346 | 3,064,346 |
| Class Z | 4,867,100 | 2,199,806 |
Total | $34,691,564 | $25,407,967 |
10. Share Transactions.
Share transactions for each class were as follows and may contain in-kind transactions, automatic conversions between classes or exchanges between affiliated funds:
| | Shares | Shares | Dollars | Dollars |
| | Year ended October 31, 2023 | Year ended October 31, 2022 | Year ended October 31, 2023 | Year ended October 31, 2022 |
| Fidelity Global Commodity Stock Fund | | | | |
| Class A | | | | |
| Shares sold | 1,706,240 | 5,245,104 | $32,590,913 | $102,330,553 |
| Reinvestment of distributions | 115,956 | 93,881 | 2,236,781 | 1,435,437 |
| Shares redeemed | (2,904,311) | (1,530,075) | (53,206,144) | (28,265,460) |
| Net increase (decrease) | (1,082,115) | 3,808,910 | $(18,378,450) | $75,500,530 |
| Class M | | | | |
| Shares sold | 226,865 | 994,128 | $4,326,151 | $18,969,401 |
| Reinvestment of distributions | 18,802 | 16,878 | 362,695 | 258,240 |
| Shares redeemed | (467,728) | (295,956) | (8,507,986) | (5,535,121) |
| Net increase (decrease) | (222,061) | 715,050 | $(3,819,140) | $13,692,520 |
| Class C | | | | |
| Shares sold | 305,614 | 1,526,059 | $5,884,407 | $29,910,914 |
| Reinvestment of distributions | 19,865 | 17,324 | 381,017 | 263,849 |
| Shares redeemed | (744,797) | (411,550) | (13,548,223) | (7,532,050) |
| Net increase (decrease) | (419,318) | 1,131,833 | $(7,282,799) | $22,642,713 |
| Global Commodity Stock | | | | |
| Shares sold | 13,188,745 | 37,700,647 | $254,817,434 | $735,708,594 |
| Reinvestment of distributions | 741,996 | 1,053,837 | 14,327,947 | 16,113,170 |
| Shares redeemed | (34,967,438) | (26,409,632) | (645,744,516) | (482,758,151) |
| Net increase (decrease) | (21,036,697) | 12,344,852 | $(376,599,135) | $269,063,613 |
| Class I | | | | |
| Shares sold | 16,503,819 | 29,119,851 | $315,987,478 | $566,732,834 |
| Reinvestment of distributions | 528,030 | 198,222 | 10,190,979 | 3,028,836 |
| Shares redeemed | (22,329,926) | (8,975,269) | (410,703,798) | (163,585,245) |
| Net increase (decrease) | (5,298,077) | 20,342,804 | $(84,525,341) | $406,176,425 |
| Class Z | | | | |
| Shares sold | 5,798,355 | 12,915,308 | $110,033,314 | $249,174,298 |
| Reinvestment of distributions | 213,545 | 129,470 | 4,115,012 | 1,975,709 |
| Shares redeemed | (7,243,382) | (4,757,037) | (133,112,755) | (85,065,665) |
| Net increase (decrease) | (1,231,482) | 8,287,741 | $(18,964,429) | $166,084,342 |
11. Other.
A fund's organizational documents provide former and current trustees and officers with a limited indemnification against liabilities arising in connection with the performance of their duties to the fund. In the normal course of business, a fund may also enter into contracts that provide general indemnifications. A fund's maximum exposure under these arrangements is unknown as this would be dependent on future claims that may be made against a fund. The risk of material loss from such claims is considered remote.
12. Risk and Uncertainties.
Many factors affect a fund's performance. Developments that disrupt global economies and financial markets, such as pandemics, epidemics, outbreaks of infectious diseases, war, terrorism, and environmental disasters, may significantly affect a fund's investment performance. The effects of these developments to a fund will be impacted by the types of securities in which a fund invests, the financial condition, industry, economic sector, and geographic location of an issuer, and a fund's level of investment in the securities of that issuer. Significant concentrations in security types, issuers, industries, sectors, and geographic locations may magnify the factors that affect a fund's performance.
To the Board of Trustees of Fidelity Investment Trust and Shareholders of Fidelity Global Commodity Stock Fund
Opinion on the Financial Statements
We have audited the accompanying statement of assets and liabilities, including the schedule of investments, of Fidelity Global Commodity Stock Fund (one of the funds constituting Fidelity Investment Trust, referred to hereafter as the "Fund") as of October 31, 2023, the related statement of operations for the year ended October 31, 2023, the statement of changes in net assets for each of the two years in the period ended October 31, 2023, including the related notes, and the financial highlights for each of the five years in the period ended October 31, 2023 (collectively referred to as the "financial statements"). In our opinion, the financial statements present fairly, in all material respects, the financial position of the Fund as of October 31, 2023, the results of its operations for the year then ended, the changes in its net assets for each of the two years in the period ended October 31, 2023 and the financial highlights for each of the five years in the period ended October 31, 2023 in conformity with accounting principles generally accepted in the United States of America.
Basis for Opinion
These financial statements are the responsibility of the Fund's management. Our responsibility is to express an opinion on the Fund's financial statements based on our audits. We are a public accounting firm registered with the Public Company Accounting Oversight Board (United States) (PCAOB) and are required to be independent with respect to the Fund in accordance with the U.S. federal securities laws and the applicable rules and regulations of the Securities and Exchange Commission and the PCAOB.
We conducted our audits of these financial statements in accordance with the standards of the PCAOB. Those standards require that we plan and perform the audit to obtain reasonable assurance about whether the financial statements are free of material misstatement, whether due to error or fraud.
Our audits included performing procedures to assess the risks of material misstatement of the financial statements, whether due to error or fraud, and performing procedures that respond to those risks. Such procedures included examining, on a test basis, evidence regarding the amounts and disclosures in the financial statements. Our audits also included evaluating the accounting principles used and significant estimates made by management, as well as evaluating the overall presentation of the financial statements. Our procedures included confirmation of securities owned as of October 31, 2023 by correspondence with the custodian and brokers; when replies were not received from brokers, we performed other auditing procedures. We believe that our audits provide a reasonable basis for our opinion.
/s/ PricewaterhouseCoopers LLP
Boston, Massachusetts
December 13, 2023
We have served as the auditor of one or more investment companies in the Fidelity group of funds since 1932.
The Trustees, Members of the Advisory Board (if any), and officers of the trust and fund, as applicable, are listed below. The Board of Trustees governs the fund and is responsible for protecting the interests of shareholders. The Trustees are experienced executives who meet periodically throughout the year to oversee the fund's activities, review contractual arrangements with companies that provide services to the fund, oversee management of the risks associated with such activities and contractual arrangements, and review the fund's performance. Except for Jonathan Chiel, each of the Trustees oversees 322 funds. Mr. Chiel oversees 191 funds.
The Trustees hold office without limit in time except that (a) any Trustee may resign; (b) any Trustee may be removed by written instrument, signed by at least two-thirds of the number of Trustees prior to such removal; (c) any Trustee who requests to be retired or who has become incapacitated by illness or injury may be retired by written instrument signed by a majority of the other Trustees; and (d) any Trustee may be removed at any special meeting of shareholders by a two-thirds vote of the outstanding voting securities of the trust. Each Trustee who is not an interested person (as defined in the 1940 Act) of the trust and the fund is referred to herein as an Independent Trustee. Each Independent Trustee shall retire not later than the last day of the calendar year in which his or her 75th birthday occurs. The Independent Trustees may waive this mandatory retirement age policy with respect to individual Trustees. Officers and Advisory Board Members hold office without limit in time, except that any officer or Advisory Board Member may resign or may be removed by a vote of a majority of the Trustees at any regular meeting or any special meeting of the Trustees. Except as indicated, each individual has held the office shown or other offices in the same company for the past five years.
The fund's Statement of Additional Information (SAI) includes more information about the Trustees. To request a free copy, call Fidelity at 1-800-544-8544 if you're an individual investing directly with Fidelity, call 1-800-835-5092 if you're a plan sponsor or participant with Fidelity as your recordkeeper or call 1-877-208-0098 on institutional accounts or if you're an advisor or invest through one.
Experience, Skills, Attributes, and Qualifications of the Trustees. The Governance and Nominating Committee has adopted a statement of policy that describes the experience, qualifications, attributes, and skills that are necessary and desirable for potential Independent Trustee candidates (Statement of Policy). The Board believes that each Trustee satisfied at the time he or she was initially elected or appointed a Trustee, and continues to satisfy, the standards contemplated by the Statement of Policy. The Governance and Nominating Committee also engages professional search firms to help identify potential Independent Trustee candidates who have the experience, qualifications, attributes, and skills consistent with the Statement of Policy. From time to time, additional criteria based on the composition and skills of the current Independent Trustees, as well as experience or skills that may be appropriate in light of future changes to board composition, business conditions, and regulatory or other developments, have also been considered by the professional search firms and the Governance and Nominating Committee. In addition, the Board takes into account the Trustees' commitment and participation in Board and committee meetings, as well as their leadership of standing and ad hoc committees throughout their tenure.
In determining that a particular Trustee was and continues to be qualified to serve as a Trustee, the Board has considered a variety of criteria, none of which, in isolation, was controlling. The Board believes that, collectively, the Trustees have balanced and diverse experience, qualifications, attributes, and skills, which allow the Board to operate effectively in governing the fund and protecting the interests of shareholders. Information about the specific experience, skills, attributes, and qualifications of each Trustee, which in each case led to the Board's conclusion that the Trustee should serve (or continue to serve) as a trustee of the fund, is provided below.
Board Structure and Oversight Function. Robert A. Lawrence is an interested person and currently serves as Chair. The Trustees have determined that an interested Chair is appropriate and benefits shareholders because an interested Chair has a personal and professional stake in the quality and continuity of services provided to the fund. Independent Trustees exercise their informed business judgment to appoint an individual of their choosing to serve as Chair, regardless of whether the Trustee happens to be independent or a member of management. The Independent Trustees have determined that they can act independently and effectively without having an Independent Trustee serve as Chair and that a key structural component for assuring that they are in a position to do so is for the Independent Trustees to constitute a substantial majority for the Board. The Independent Trustees also regularly meet in executive session. David M. Thomas serves as Lead Independent Trustee and as such (i) acts as a liaison between the Independent Trustees and management with respect to matters important to the Independent Trustees and (ii) with management prepares agendas for Board meetings.
Fidelity® funds are overseen by different Boards of Trustees. The fund's Board oversees Fidelity's high income and certain equity funds, and other Boards oversee Fidelity's alternative investment, investment-grade bond, money market, asset allocation, and other equity funds. The asset allocation funds may invest in Fidelity® funds overseen by the fund's Board. The use of separate Boards, each with its own committee structure, allows the Trustees of each group of Fidelity® funds to focus on the unique issues of the funds they oversee, including common research, investment, and operational issues. On occasion, the separate Boards establish joint committees to address issues of overlapping consequences for the Fidelity® funds overseen by each Board.
The Trustees operate using a system of committees to facilitate the timely and efficient consideration of all matters of importance to the Trustees, the fund, and fund shareholders and to facilitate compliance with legal and regulatory requirements and oversight of the fund's activities and associated risks. The Board, acting through its committees, has charged FMR and its affiliates with (i) identifying events or circumstances the occurrence of which could have demonstrably adverse effects on the fund's business and/or reputation; (ii) implementing processes and controls to lessen the possibility that such events or circumstances occur or to mitigate the effects of such events or circumstances if they do occur; and (iii) creating and maintaining a system designed to evaluate continuously business and market conditions in order to facilitate the identification and implementation processes described in (i) and (ii) above. Because the day-to-day operations and activities of the fund are carried out by or through FMR, its affiliates, and other service providers, the fund's exposure to risks is mitigated but not eliminated by the processes overseen by the Trustees. While each of the Board's committees has responsibility for overseeing different aspects of the fund's activities, oversight is exercised primarily through the Operations, Audit, and Compliance Committees. Appropriate personnel, including but not limited to the fund's Chief Compliance Officer (CCO), FMR's internal auditor, the independent accountants, the fund's Treasurer and portfolio management personnel, make periodic reports to the Board's committees, as appropriate, including an annual review of Fidelity's risk management program for the Fidelity® funds. The responsibilities of each standing committee, including their oversight responsibilities, are described further under "Standing Committees of the Trustees."
Interested Trustees*:
Correspondence intended for a Trustee who is an interested person may be sent to Fidelity Investments, 245 Summer Street, Boston, Massachusetts 02210.
Name, Year of Birth; Principal Occupations and Other Relevant Experience+
Jonathan Chiel (1957)
Year of Election or Appointment: 2016
Trustee
Mr. Chiel also serves as Trustee of other Fidelity® funds. Mr. Chiel is General Counsel (2012-present) and Head of Legal, Risk and Compliance (2022-present). Mr Chiel serves as Executive Vice President and General Counsel for FMR LLC (diversified financial services company, 2012-present) and Director and President for OH Company LLC (holding company, 2018-present). Previously, Mr. Chiel served as general counsel (2004-2012) and senior vice president and deputy general counsel (2000-2004) for John Hancock Financial Services; a partner with Choate, Hall & Stewart (1996-2000) (law firm); and an Assistant United States Attorney for the United States Attorney's Office of the District of Massachusetts (1986-95), including Chief of the Criminal Division (1993-1995). Mr. Chiel is a director on the boards of the Boston Bar Foundation and the Maimonides School.
Bettina Doulton (1964)
Year of Election or Appointment: 2021
Trustee
Ms. Doulton also serves as Trustee of other Fidelity® funds. Prior to her retirement, Ms. Doulton served in a variety of positions at Fidelity Investments, including as a managing director of research (2006-2007), portfolio manager to certain Fidelity® funds (1993-2005), equity analyst and portfolio assistant (1990-1993), and research assistant (1987-1990). Ms. Doulton currently owns and operates Phi Builders + Architects and Cellardoor Winery. Previously, Ms. Doulton served as a member of the Board of Brown Capital Management, LLC (2014-2018).
Robert A. Lawrence (1952)
Year of Election or Appointment: 2020
Trustee
Chair of the Board of Trustees
Mr. Lawrence also serves as Trustee of other funds. Previously, Mr. Lawrence served as a Trustee and Member of the Advisory Board of certain funds. Prior to his retirement in 2008, Mr. Lawrence served as Vice President of certain Fidelity® funds (2006-2008), Senior Vice President, Head of High Income Division of Fidelity Management & Research Company (investment adviser firm, 2006-2008), and President of Fidelity Strategic Investments (investment adviser firm, 2002-2005).
* Determined to be an "Interested Trustee" by virtue of, among other things, his or her affiliation with the trust or various entities under common control with FMR.
+ The information includes the Trustee's principal occupation during the last five years and other information relating to the experience, attributes, and skills relevant to the Trustee's qualifications to serve as a Trustee, which led to the conclusion that the Trustee should serve as a Trustee for the fund.
Independent Trustees:
Correspondence intended for an Independent Trustee may be sent to Fidelity Investments, P.O. Box 55235, Boston, Massachusetts 02205-5235.
Name, Year of Birth; Principal Occupations and Other Relevant Experience+
Thomas P. Bostick (1956)
Year of Election or Appointment: 2021
Trustee
Lieutenant General Bostick also serves as Trustee of other Fidelity® funds. Prior to his retirement, General Bostick (United States Army, Retired) held a variety of positions within the U.S. Army, including Commanding General and Chief of Engineers, U.S. Army Corps of Engineers (2012-2016) and Deputy Chief of Staff and Director of Human Resources, U.S. Army (2009-2012). General Bostick currently serves as a member of the Board and Finance and Governance & Sustainability Committees of CSX Corporation (transportation, 2020-present) and a member of the Board and Corporate Governance and Nominating Committee of Perma-Fix Environmental Services, Inc. (nuclear waste management, 2020-present). General Bostick serves as Chief Executive Officer of Bostick Global Strategies, LLC (consulting, 2016-present), as a member of the Board of HireVue, Inc. (video interview and assessment, 2020-present), as a member of the Board of Allonnia (biotechnology and engineering solutions, 2022-present) and on the Advisory Board of Solugen, Inc. (specialty bio-based chemicals manufacturer, 2022-present). Previously, General Bostick served as a Member of the Advisory Board of certain Fidelity® funds (2021), President, Intrexon Bioengineering (2018-2020) and Chief Operating Officer (2017-2020) and Senior Vice President of the Environment Sector (2016-2017) of Intrexon Corporation (biopharmaceutical company).
Dennis J. Dirks (1948)
Year of Election or Appointment: 2005
Trustee
Mr. Dirks also serves as Trustee of other Fidelity® funds. Prior to his retirement in May 2003, Mr. Dirks served as Chief Operating Officer and as a member of the Board of The Depository Trust & Clearing Corporation (financial markets infrastructure), President, Chief Operating Officer and a member of the Board of The Depository Trust Company (DTC), President and a member of the Board of the National Securities Clearing Corporation (NSCC), Chief Executive Officer and a member of the Board of the Government Securities Clearing Corporation and Chief Executive Officer and a member of the Board of the Mortgage-Backed Securities Clearing Corporation. Mr. Dirks currently serves as a member of the Finance Committee (2016-present) and Board (2017-present) and is Treasurer (2018-present) of the Asolo Repertory Theatre.
Donald F. Donahue (1950)
Year of Election or Appointment: 2018
Trustee
Mr. Donahue also serves as Trustee of other Fidelity® funds. Mr. Donahue serves as President and Chief Executive Officer of Miranda Partners, LLC (risk consulting for the financial services industry, 2012-present). Previously, Mr. Donahue served as Chief Executive Officer (2006-2012), Chief Operating Officer (2003-2006) and Managing Director, Customer Marketing and Development (1999-2003) of The Depository Trust & Clearing Corporation (financial markets infrastructure). Mr. Donahue currently serves as a member (2007-present) and Co-Chairman (2016-present) of the Board of United Way of New York. Mr. Donahue previously served as a member of the Advisory Board of certain Fidelity® funds (2015-2018) and as a member of the Board of The Leadership Academy (previously NYC Leadership Academy) (2012-2022).
Vicki L. Fuller (1957)
Year of Election or Appointment: 2020
Trustee
Ms. Fuller also serves as Trustee of other Fidelity® funds. Previously, Ms. Fuller served as a member of the Advisory Board of certain Fidelity® funds (2018-2020), Chief Investment Officer of the New York State Common Retirement Fund (2012-2018) and held a variety of positions at AllianceBernstein L.P. (global asset management, 1985-2012), including Managing Director (2006-2012) and Senior Vice President and Senior Portfolio Manager (2001-2006). Ms. Fuller currently serves as a member of the Board, Audit Committee and Nominating and Governance Committee of two Blackstone business development companies (2020-present), as a member of the Board of Treliant, LLC (consulting, 2019-present), as a member of the Board of Ariel Alternatives, LLC (private equity, 2022-present) and as a member of the Board and Chair of the Audit Committee of Gusto, Inc. (software, 2021-present). In addition, Ms. Fuller currently serves as a member of the Board of Roosevelt University (2019-present) and as a member of the Executive Board of New York University's Stern School of Business. Ms. Fuller previously served as a member of the Board, Audit Committee and Nominating and Governance Committee of The Williams Companies, Inc. (natural gas infrastructure, 2018-2021).
Patricia L. Kampling (1959)
Year of Election or Appointment: 2020
Trustee
Ms. Kampling also serves as Trustee of other Fidelity® funds. Prior to her retirement, Ms. Kampling served as Chairman of the Board and Chief Executive Officer (2012-2019), President and Chief Operating Officer (2011-2012) and Executive Vice President and Chief Financial Officer (2010-2011) of Alliant Energy Corporation. Ms. Kampling currently serves as a member of the Board, Finance Committee and Governance, Compensation and Nominating Committee of Xcel Energy Inc. (utilities company, 2020-present) and as a member of the Board, Audit, Finance and Risk Committee and Safety, Environmental, Technology and Operations Committee and Chair of the Executive Development and Compensation Committee of American Water Works Company, Inc. (utilities company, 2019-present). In addition, Ms. Kampling currently serves as a member of the Board of the Nature Conservancy, Wisconsin Chapter (2019-present). Previously, Ms. Kampling served as a Member of the Advisory Board of certain Fidelity® funds (2020), a member of the Board, Compensation Committee and Executive Committee and Chair of the Audit Committee of Briggs & Stratton Corporation (manufacturing, 2011-2021), a member of the Board of Interstate Power and Light Company (2012-2019) and Wisconsin Power and Light Company (2012-2019) (each a subsidiary of Alliant Energy Corporation) and as a member of the Board and Workforce Development Committee of the Business Roundtable (2018-2019).
Thomas A. Kennedy (1955)
Year of Election or Appointment: 2021
Trustee
Mr. Kennedy also serves as Trustee of other Fidelity® funds. Previously, Mr. Kennedy served as a Member of the Advisory Board of certain Fidelity® funds (2020) and held a variety of positions at Raytheon Company (aerospace and defense, 1983-2020), including Chairman and Chief Executive Officer (2014-2020) and Executive Vice President and Chief Operating Officer (2013-2014). Mr. Kennedy served as Executive Chairman of the Board of Directors of Raytheon Technologies Corporation (aerospace and defense, 2020-2021). Mr. Kennedy serves as a Director of the Board of Directors of Textron Inc. (aerospace and defense, 2023-present).
Oscar Munoz (1959)
Year of Election or Appointment: 2021
Trustee
Mr. Munoz also serves as Trustee of other Fidelity® funds. Prior to his retirement, Mr. Munoz served as Executive Chairman (2020-2021), Chief Executive Officer (2015-2020), President (2015-2016) and a member of the Board (2010-2021) of United Airlines Holdings, Inc. Mr. Munoz currently serves as a member of the Board of CBRE Group, Inc. (commercial real estate, 2020-present), a member of the Board of Univision Communications, Inc. (Hispanic media, 2020-present), a member of the Board of Archer Aviation Inc. (2021-present), a member of the Defense Business Board of the United States Department of Defense (2021-present) and a member of the Board of Salesforce.com, Inc. (cloud-based software, 2022-present). Previously, Mr. Munoz served as a Member of the Advisory Board of certain Fidelity® funds (2021).
David M. Thomas (1949)
Year of Election or Appointment: 2008
Trustee
Lead Independent Trustee
Mr. Thomas also serves as Trustee of other Fidelity® funds. Previously, Mr. Thomas served as Executive Chairman (2005-2006) and Chairman and Chief Executive Officer (2000-2005) of IMS Health, Inc. (pharmaceutical and healthcare information solutions). Mr. Thomas currently serves as a member of the Board of Fortune Brands Home and Security (home and security products, 2004-present) and as Director (2013-present) and Non-Executive Chairman of the Board (2022-present) of Interpublic Group of Companies, Inc. (marketing communication).
Susan Tomasky (1953)
Year of Election or Appointment: 2020
Trustee
Ms. Tomasky also serves as Trustee of other Fidelity® funds. Prior to her retirement, Ms. Tomasky served in various executive officer positions at American Electric Power Company, Inc. (1998-2011), including most recently as President of AEP Transmission (2007-2011). Ms. Tomasky currently serves as a member of the Board and Sustainability Committee and as Chair of the Audit Committee of Marathon Petroleum Corporation (2018-present) and as a member of the Board, Executive Committee, Corporate Governance Committee and Organization and Compensation Committee and as Lead Director of the Board of Public Service Enterprise Group, Inc. (utilities company, 2012-present) and as a member of the Board of its subsidiary company, Public Service Electric and Gas Co. (2021-present). In addition, Ms. Tomasky currently serves as a member (2009-present) and President (2020-present) of the Board of the Royal Shakespeare Company - America (2009-present), as a member of the Board of the Columbus Association for the Performing Arts (2011-present) and as a member of the Board and Kenyon in the World Committee of Kenyon College (2016-present). Previously, Ms. Tomasky served as a Member of the Advisory Board of certain Fidelity® funds (2020), as a member of the Board of the Columbus Regional Airport Authority (2007-2020), as a member of the Board (2011-2018) and Lead Independent Director (2015-2018) of Andeavor Corporation (previously Tesoro Corporation) (independent oil refiner and marketer) and as a member of the Board of Summit Midstream Partners LP (energy, 2012-2018).
Michael E. Wiley (1950)
Year of Election or Appointment: 2020
Trustee
Mr. Wiley also serves as Trustee of other Fidelity® funds. Previously, Mr. Wiley served as a member of the Advisory Board of certain Fidelity® funds (2018-2020), Chairman, President and CEO of Baker Hughes, Inc. (oilfield services, 2000-2004). Mr. Wiley also previously served as a member of the Board of Andeavor Corporation (independent oil refiner and marketer, 2005-2018), a member of the Board of Andeavor Logistics LP (natural resources logistics, 2015-2018) and a member of the Board of High Point Resources (exploration and production, 2005-2020).
+ The information includes the Trustee's principal occupation during the last five years and other information relating to the experience, attributes, and skills relevant to the Trustee's qualifications to serve as a Trustee, which led to the conclusion that the Trustee should serve as a Trustee for the fund.
Advisory Board Members and Officers:
Correspondence intended for a Member of the Advisory Board (if any) may be sent to Fidelity Investments, P.O. Box 55235, Boston, Massachusetts 02205-5235. Correspondence intended for an officer or Peter S. Lynch may be sent to Fidelity Investments, 245 Summer Street, Boston, Massachusetts 02210.
Name, Year of Birth; Principal Occupation
Vijay C. Advani (1960)
Year of Election or Appointment: 2023
Member of the Advisory Board
Mr. Advani also serves as Trustee or Member of the Advisory Board of other funds. Previously, Mr. Advani served as Executive Chairman (2020-2022), Chief Executive Officer (2017-2020) and Chief Operating Officer (2016-2017) of Nuveen (global investment manager). He also served in various capacities at Franklin Resources (global investment manager), including Co-President (2015-2016), Executive Vice President, Global Advisory Services (2008-2015), Head of Global Retail Distribution (2005-2008), Executive Managing Director, International Retail Development (2002-2005), Managing Director, Product Developments, Sales & Marketing, Asia, Eastern Europe and Africa (2000-2002) and President, Templeton Asset Management India (1995-2000). Mr. Advani also served as Senior Investment Officer of International Finance Corporation (private equity and venture capital arm of The World Bank, 1984-1995). Mr. Advani is Chairman Emeritus of the U.S. India Business Council (2018-present), a Director of The Global Impact Investing Network (2019-present), a Director of LOK Capital (Mauritius) (2022-present), a member of the Advisory Council of LOK Capital (2022-present), a Senior Advisor of Neuberger Berman (2021-present), a Senior Advisor of Seviora Holdings Pte. Ltd (Temasek-Singapore) (2021-present), a Director of Seviora Capital (Singapore) (2021-present) and an Advisor of EQUIAM (2021-present). Mr. Advani formerly served as a member of the Board of BowX Acquisition Corp. (special purpose acquisition company, 2020-2021), a member of the Board of Intellecap (advisory arm of The Aavishkaar Group, 2018-2020), a member of the Board of Nuveen Investments, Inc. (2017-2020) and a member of the Board of Docusign (software, 2016-2019).
Peter S. Lynch (1944)
Year of Election or Appointment: 2003
Member of the Advisory Board
Mr. Lynch also serves as a Member of the Advisory Board of other Fidelity® funds. Mr. Lynch is Vice Chairman and a Director of Fidelity Management & Research Company LLC (investment adviser firm). In addition, Mr. Lynch serves as a Trustee of Boston College and as the Chairman of the Inner-City Scholarship Fund. Previously, Mr. Lynch served as Vice Chairman and a Director of FMR Co., Inc. (investment adviser firm) and on the Special Olympics International Board of Directors (1997-2006).
Karen B. Peetz (1955)
Year of Election or Appointment: 2023
Member of the Advisory Board
Ms. Peetz also serves as a Member of the Advisory Board of other funds. Previously, Ms. Peetz served as Chief Administration Officer (2020-2023) of Citigroup Inc. (a diversified financial service company). She also served in various capacities at Bank of New York Mellon Corporation, including President (2013-2016), Vice Chairman, Senior Executive Vice President and Chief Executive Officer of Financial Markets & Treasury Services (2010-2013), Senior Executive Vice President and Chief Executive Officer of Global Corporate Trust (2003-2008), Senior Vice President and Division Manager of Global Payments & Trade Services (2002-2003) and Senior Vice President and Division Manager of Domestic Corporate Trust (1998-2002). Ms. Peetz also served in various capacities at Chase Manhattan Corporation (1982-1998), including Senior Vice President and Manager of Corporate Trust International Business (1996-1998), Managing Director and Manager of Corporate Trust Services (1994-1996) and Managing Director and Group Manager of Financial Institution Sales (1990-1993). Ms. Peetz currently serves as Chair of Amherst Holdings Advisory Council (2018-present), Trustee of Johns Hopkins University (2016-present), Chair of the Carey Business School Advisory Council, Member of the Johns Hopkins Medicine Board and Finance Committee and Chair of the Lyme and Tick Related Disease Institute Advisory Council. Ms. Peetz previously served as a member of the Board of Guardian Life Insurance Company of America (2019-2023), a member of the Board of Trane Technologies (2018-2022), a member of the Board of Wells Fargo Corp. (2017-2019), a member of the Board of SunCoke Energy Inc. (2012-2016), a member of the Board of Private Export Funding Corporation (2010-2016) and as a Trustee of Penn State University (2010-2014) and the United Way of New York City (2008-2010).
Heather Bonner (1977)
Year of Election or Appointment: 2023
Assistant Treasurer
Ms. Bonner also serves as an officer of other funds. Ms. Bonner is a Senior Vice President (2022-present) and is an employee of Fidelity Investments (2022-present). Ms. Bonner serves as Vice President, Treasurer, or Assistant Treasurer of certain Fidelity entities. Prior to joining Fidelity, Ms. Bonner served as Managing Director at AQR Capital Management (2013-2022) and was the Treasurer and Principal Financial Officer of the AQR Funds (2013-2022).
Craig S. Brown (1977)
Year of Election or Appointment: 2022
Deputy Treasurer
Mr. Brown also serves as an officer of other funds. Mr. Brown is a Vice President (2015-present) and is an employee of Fidelity Investments. Mr. Brown serves as Assistant Treasurer of FIMM, LLC (2021-present). Previously, Mr. Brown served as Assistant Treasurer of certain Fidelity® funds (2019-2022).
John J. Burke III (1964)
Year of Election or Appointment: 2018
Chief Financial Officer
Mr. Burke also serves as Chief Financial Officer of other funds. Mr. Burke is Head of Fidelity Fund and Investment Operations (2018-present) and is an employee of Fidelity Investments. Mr. Burke serves as President, Executive Vice President, or Director of certain Fidelity entities. Previously Mr. Burke served as head of Asset Management Investment Operations (2012-2018).
Margaret Carey (1973)
Year of Election or Appointment: 2023
Secretary and Chief Legal Officer (CLO)
Ms. Carey also serves as an officer of other funds and as CLO of certain Fidelity entities. Ms. Carey is a Senior Vice President, Deputy General Counsel (2019-present) and is an employee of Fidelity Investments.
William C. Coffey (1969)
Year of Election or Appointment: 2019
Assistant Secretary
Mr. Coffey also serves as Assistant Secretary of other funds. Mr. Coffey is a Senior Vice President, Deputy General Counsel (2010-present) and is an employee of Fidelity Investments. Previously, Mr. Coffey served as Secretary and CLO of certain funds (2018-2019); CLO, Secretary, or Senior Vice President of certain Fidelity entities and Assistant Secretary of certain funds (2009-2018).
Timothy M. Cohen (1969)
Year of Election or Appointment: 2018
Vice President
Mr. Cohen also serves as Vice President of other funds. Mr. Cohen is Co-Head of Equity (2018-present) and is an employee of Fidelity Investments. Mr. Cohen serves a Director of Fidelity Management & Research (Japan) Limited (investment adviser firm, 2016-present). Previously, Mr. Cohen served as Executive Vice President of Fidelity SelectCo, LLC (2019) and Head of Global Equity Research (2016-2018).
Jonathan Davis (1968)
Year of Election or Appointment: 2010
Assistant Treasurer
Mr. Davis also serves as an officer of other funds. Mr. Davis is a Vice President (2006-present) and is an employee of Fidelity Investments. Mr. Davis serves as Assistant Treasurer of certain Fidelity entities.
Laura M. Del Prato (1964)
Year of Election or Appointment: 2018
Assistant Treasurer
Ms. Del Prato also serves as an officer of other funds. Ms. Del Prato is a Senior Vice President (2017-present) and is an employee of Fidelity Investments. Ms. Del Prato serves as Vice President or Assistant Treasurer of certain Fidelity entities. Previously, Ms. Del Prato served as President and Treasurer of The North Carolina Capital Management Trust: Cash Portfolio and Term Portfolio (2018-2020).
Colm A. Hogan (1973)
Year of Election or Appointment: 2020
Assistant Treasurer
Mr. Hogan also serves as an officer of other funds. Mr. Hogan is a Vice President (2016-present) and is an employee of Fidelity Investments. Mr. Hogan serves as Assistant Treasurer of certain Fidelity entities. Previously, Mr. Hogan served as Deputy Treasurer of certain Fidelity® funds (2016-2020) and Assistant Treasurer of certain Fidelity® funds (2016-2018).
Pamela R. Holding (1964)
Year of Election or Appointment: 2018
Vice President
Ms. Holding also serves as Vice President of other funds. Ms. Holding is Co-Head of Equity (2018-present) and is an employee of Fidelity Investments. Previously, Ms. Holding served as Executive Vice President of Fidelity SelectCo, LLC (2019) and as Chief Investment Officer of Fidelity Institutional Asset Management (2013-2018).
Chris Maher (1972)
Year of Election or Appointment: 2020
Deputy Treasurer
Mr. Maher also serves as an officer of other funds. Mr. Maher is a Vice President (2008-present) and is an employee of Fidelity Investments. Mr. Maher serves as Assistant Treasurer of certain Fidelity entities. Previously, Mr. Maher served as Assistant Treasurer of certain funds (2013-2020).
Jason P. Pogorelec (1975)
Year of Election or Appointment: 2020
Chief Compliance Officer
Mr. Pogorelec also serves as Chief Compliance Officer of other funds. Mr. Pogorelec is a Senior Vice President of Asset Management Compliance (2020-present) and is an employee of Fidelity Investments. Mr. Pogorelec serves as Compliance Officer of Fidelity Management & Research Company LLC (investment adviser firm, 2023-present) and Ballyrock Investment Advisors LLC (2023-present). Previously, Mr. Pogorelec served as a Vice President, Associate General Counsel for Fidelity Investments (2010-2020) and Assistant Secretary of certain Fidelity® funds (2015-2020).
Brett Segaloff (1972)
Year of Election or Appointment: 2021
Anti-Money Laundering (AML) Officer
Mr. Segaloff also serves as AML Officer of other funds. Mr. Segaloff is a Vice President (2022-present) and is an employee of Fidelity Investments. Mr. Segaloff serves as Anti Money Laundering Compliance Officer or Anti Money Laundering/Bank Secrecy Act Compliance Officer of certain Fidelity entities.
Stacie M. Smith (1974)
Year of Election or Appointment: 2016
President and Treasurer
Ms. Smith also serves as an officer of other funds. Ms. Smith is a Senior Vice President (2016-present) and is an employee of Fidelity Investments. Ms. Smith serves as Assistant Treasurer of certain Fidelity entities and has served in other fund officer roles.
Jim Wegmann (1979)
Year of Election or Appointment: 2019
Assistant Treasurer
Mr. Wegmann also serves as an officer of other funds. Mr. Wegmann is a Vice President (2016-present) and is an employee of Fidelity Investments. Mr. Wegmann serves as Assistant Treasurer of FIMM, LLC (2021-present). Previously, Mr. Wegmann served as Assistant Treasurer of certain Fidelity® funds (2019-2021).
As a shareholder, you incur two types of costs: (1) transaction costs, which may include sales charges (loads) on purchase payments or redemption proceeds, as applicable and (2) ongoing costs, which generally include management fees, distribution and/or service (12b-1) fees and other Fund expenses. This Example is intended to help you understand your ongoing costs (in dollars) of investing in a fund and to compare these costs with the ongoing costs of investing in other mutual funds.
| The Example is based on an investment of $1,000 invested at the beginning of the period and held for the entire period (May 1, 2023 to October 31, 2023). |
Actual Expenses
The first line of the accompanying table provides information about actual account values and actual expenses. You may use the information in this line, together with the amount you invested, to estimate the expenses that you paid over the period. Simply divide your account value by $1,000.00 (for example, an $8,600 account value divided by $1,000.00 = 8.6), then multiply the result by the number in the first line for a class/Fund under the heading entitled "Expenses Paid During Period" to estimate the expenses you paid on your account during this period. If any fund is a shareholder of any underlying mutual funds or exchange-traded funds (ETFs) (the Underlying Funds), such fund indirectly bears its proportional share of the expenses of the Underlying Funds in addition to the direct expenses incurred presented in the table. These fees and expenses are not included in the annualized expense ratio used to calculate the expense estimate in the table below.
Hypothetical Example for Comparison Purposes
The second line of the accompanying table provides information about hypothetical account values and hypothetical expenses based on the actual expense ratio and an assumed rate of return of 5% per year before expenses, which is not the actual return. The hypothetical account values and expenses may not be used to estimate the actual ending account balance or expenses you paid for the period. You may use this information to compare the ongoing costs of investing in the Fund and other funds. To do so, compare this 5% hypothetical example with the 5% hypothetical examples that appear in the shareholder reports of the other funds. If any fund is a shareholder of any Underlying Funds, such fund indirectly bears its proportional share of the expenses of the Underlying Funds in addition to the direct expenses as presented in the table. These fees and expenses are not included in the annualized expense ratio used to calculate the expense estimate in the table below.
Please note that the expenses shown in the table are meant to highlight your ongoing costs only and do not reflect any transaction costs. Therefore, the second line of the table is useful in comparing ongoing costs only, and will not help you determine the relative total costs of owning different funds. In addition, if these transactional costs were included, your costs would have been higher.
| | | | | Annualized Expense Ratio- A | | Beginning Account Value May 1, 2023 | | Ending Account Value October 31, 2023 | | Expenses Paid During Period- C May 1, 2023 to October 31, 2023 |
| Fidelity® Global Commodity Stock Fund | | | | | | | | | | |
| Class A | | | | 1.17% | | | | | | |
| Actual | | | | | | $ 1,000 | | $ 937.30 | | $ 5.71 |
Hypothetical-B | | | | | | $ 1,000 | | $ 1,019.31 | | $ 5.96 |
| Class M | | | | 1.45% | | | | | | |
| Actual | | | | | | $ 1,000 | | $ 936.10 | | $ 7.08 |
Hypothetical-B | | | | | | $ 1,000 | | $ 1,017.90 | | $ 7.38 |
| Class C | | | | 1.92% | | | | | | |
| Actual | | | | | | $ 1,000 | | $ 934.00 | | $ 9.36 |
Hypothetical-B | | | | | | $ 1,000 | | $ 1,015.53 | | $ 9.75 |
| Fidelity® Global Commodity Stock Fund | | | | .95% | | | | | | |
| Actual | | | | | | $ 1,000 | | $ 938.40 | | $ 4.64 |
Hypothetical-B | | | | | | $ 1,000 | | $ 1,020.42 | | $ 4.84 |
| Class I | | | | .90% | | | | | | |
| Actual | | | | | | $ 1,000 | | $ 938.40 | | $ 4.40 |
Hypothetical-B | | | | | | $ 1,000 | | $ 1,020.67 | | $ 4.58 |
| Class Z | | | | .77% | | | | | | |
| Actual | | | | | | $ 1,000 | | $ 939.40 | | $ 3.76 |
Hypothetical-B | | | | | | $ 1,000 | | $ 1,021.32 | | $ 3.92 |
| |
A Annualized expense ratio reflects expenses net of applicable fee waivers.
B 5% return per year before expenses
C Expenses are equal to the annualized expense ratio, multiplied by the average account value over the period, multiplied by 184/ 365 (to reflect the one-half year period). The fees and expenses of any Underlying Funds are not included in each annualized expense ratio.
The dividend and capital gains distributions for the fund(s) are available on Fidelity.com or Institutional.Fidelity.com.
The fund designates $271,571 of distributions paid during the fiscal year ended 2023 as qualifying to be taxed as section 163(j) interest dividends.
Class A designates 68%; Class M designates 78%; Class C designates 100%; Global Commodity Stock designates 62%; Class I designates 60% and Class Z designates 58% of the dividends distributed in December during the fiscal year as qualifying for the dividends-received deduction for corporate shareholders.
Class A, Class M, Class C, Global Commodity Stock, Class I and Class Z designate 100% of dividends distributed during the fiscal year as amounts which may be taken into account as a dividend for purposes of the maximum rate under section 1(h)(11) of the Internal Revenue Code.
The fund will notify shareholders in January 2024 of amounts for use in preparing 2023 income tax returns.
Board Approval of Investment Advisory Contracts and Management Fees
Fidelity Global Commodity Stock Fund
Each year, the Board of Trustees, including the Independent Trustees (together, the Board), considers the renewal of the fund's management contract with Fidelity Management & Research Company LLC (FMR) and the sub-advisory agreements (together, the Advisory Contracts) for the fund. FMR and the sub-advisers are referred to herein as the Investment Advisers. The Board, assisted by the advice of fund counsel and Independent Trustees' counsel, requests and considers a broad range of information relevant to the renewal of the Advisory Contracts throughout the year.
The Board meets regularly and, at each of its meetings, covers an extensive agenda of topics and materials and considers factors that are relevant to its annual consideration of the renewal of the fund's Advisory Contracts, including the services and support provided to the fund and its shareholders. The Board, acting directly and through its Committees (each of which is composed of and chaired by Independent Trustees), requests and receives information concerning the annual consideration of the renewal of the fund's Advisory Contracts. The Board also meets as needed to review matters specifically related to the Board's annual consideration of the renewal of the Advisory Contracts. Members of the Board may also meet with trustees of other Fidelity funds through joint ad hoc committees to discuss certain matters relevant to all of the Fidelity funds.
Approval of Stub Period Continuation. At its May 2023 meeting, the Board of Trustees voted to continue the fund's management contract with FMR, and the sub-advisory agreements and sub-sub-advisory agreements, in each case, where applicable (together, the Advisory Contracts), without modification, for two months from June 1, 2023 through July 31, 2023. The Board considered that the approval of the fund's Advisory Contracts will not result in any changes in (i) the investment process or strategies employed in the management of the fund's assets; (ii) the fees and expenses paid by shareholders; (iii) the nature, extent or quality of services provided under the fund's Advisory Contracts; or (iv) the day-to-day management of the fund or the persons primarily responsible for such management. The Board also considered that since its last approval of the fund's Advisory Contracts, FMR had provided additional information on the fund in support of the annual contract renewal process, including competitive analyses on total expenses and management fees and in-depth reviews of fund performance and fund profitability information. The Board concluded that the fund's Advisory Contracts are fair and reasonable, and that the fund's Advisory Contracts should be renewed, without modification, through July 31, 2023, with the understanding that the Board would consider the annual renewal for a full one year period in July 2023.
At its July 2023 meeting, the Board unanimously determined to renew the fund's Advisory Contracts. In reaching its determination, the Board considered all factors it believed relevant, including (i) the nature, extent, and quality of the services provided to the fund and its shareholders (including the investment performance of the fund); (ii) the competitiveness relative to peer funds of the fund's management fee and the total expense ratio of a representative class (the retail class, which was selected because it was the largest class without 12b-1 fees); (iii) the total costs of the services provided by and the profits realized by FMR and its affiliates (Fidelity) from its relationships with the fund; and (iv) the extent to which, if any, economies of scale exist and are realized as the fund grows, and whether any economies of scale are appropriately shared with fund shareholders. The Board also considered the broad range of investment choices available to shareholders from FMR's competitors and that the fund's shareholders have chosen to invest in the fund, which is part of the Fidelity family of funds. The Board's decision to renew the Advisory Contracts was not based on any single factor.
The Board reached a determination, with the assistance of fund counsel and Independent Trustees' counsel and through the exercise of its business judgment, that the renewal of the Advisory Contracts was in the best interests of the fund and its shareholders and that the compensation payable under the Advisory Contracts was fair and reasonable in light of all of the surrounding circumstances.
Nature, Extent, and Quality of Services Provided. The Board considered staffing as it relates to the fund, including the backgrounds and experience of investment personnel of the Investment Advisers, and also considered the Investment Advisers' implementation of the fund's investment program. The Independent Trustees also had discussions with senior management of Fidelity's investment operations and investment groups. The Board considered the structure of the investment personnel compensation program and whether this structure provides appropriate incentives to act in the best interests of the fund. Additionally, the Board considered the portfolio managers' investments, if any, in the funds that they manage.
Resources Dedicated to Investment Management and Support Services. The Board and the Fund Oversight and Research Committees reviewed the general qualifications and capabilities of Fidelity's investment staff, including its size, education, experience, and resources, as well as Fidelity's approach to recruiting, training, managing, and compensating investment personnel. The Board noted the resources devoted to expansion of Fidelity's global investment organization, and that Fidelity's analysts have extensive resources, tools, and capabilities that allow them to conduct sophisticated quantitative and fundamental analysis, as well as credit analysis of issuers, counterparties, and guarantors. Further, the Board considered that Fidelity's investment professionals have sufficient access to global information and data so as to provide competitive investment results over time, and that those professionals also have access to sophisticated tools that permit them to assess portfolio construction and risk and performance attribution characteristics continuously, as well as to transmit new information and research conclusions rapidly around the world. Additionally, in its deliberations, the Board considered Fidelity's trading, risk management, compliance, and technology and operations capabilities and resources, which are integral parts of the investment management process.
Shareholder and Administrative Services. The Board considered (i) the nature, extent, quality, and cost of advisory, administrative, and shareholder services performed by the Investment Advisers and their affiliates under the Advisory Contracts and under separate agreements covering transfer agency, pricing and bookkeeping, and securities lending services for the fund; (ii) the nature and extent of Fidelity's supervision of third party service providers, principally custodians, subcustodians, and pricing vendors; and (iii) the resources devoted by Fidelity to, and the record of compliance with, the fund's compliance policies and procedures. The Board also reviewed the allocation of fund brokerage, including allocations to brokers affiliated with the Investment Advisers, the use of brokerage commissions to pay fund expenses, and the use of "soft" commission dollars to pay for research services. The Board also considered the fund's securities lending activities and any payments made to Fidelity relating to securities lending.
The Board noted that the growth of fund assets over time across the complex allows Fidelity to reinvest in the development of services designed to enhance the value and convenience of the Fidelity funds as investment vehicles. These services include 24-hour access to account information and market information over the Internet and through telephone representatives, investor education materials, and asset allocation tools. The Board also considered that it reviews customer service metrics such as telephone response times, continuity of services on the website and metrics addressing services at Fidelity Investor Centers.
Investment in a Large Fund Family. The Board considered the benefits to shareholders of investing in a fund that is part of a large family of funds offering a variety of investment disciplines and providing a large variety of fund investor services. The Board noted that Fidelity had taken, or had made recommendations that resulted in the Fidelity funds taking, a number of actions over the previous year that benefited particular funds and/or the Fidelity funds in general.
Investment Performance. The Board took into account discussions that occur with representatives of the Investment Advisers, and reports that it receives, at Board meetings throughout the year, relating to fund investment performance. In this regard the Board noted that as part of regularly scheduled fund reviews and other reports to the Board on fund performance, the Board considered annualized return information for the fund for different time periods, measured against an appropriate securities market index (benchmark index) and an appropriate peer group of funds with similar objectives (peer group). The Board also considered information about performance attribution. In its ongoing evaluation of fund investment performance, the Board gives particular attention to information indicating changes in performance of the funds over different time periods and discussed with the Investment Advisers the reasons for any overperformance or underperformance.
In addition to reviewing absolute and relative fund performance, the Independent Trustees periodically consider the appropriateness of fund performance metrics in evaluating the results achieved. The Independent Trustees generally give greater weight to fund performance over longer time periods than over shorter time periods. Depending on the circumstances, the Independent Trustees may be satisfied with a fund's performance notwithstanding that it lags its benchmark index or peer group for certain periods.
Based on its review, the Board concluded that the nature, extent, and quality of services provided to the fund under the Advisory Contracts should continue to benefit the shareholders of the fund.
Competitiveness of Management Fee and Total Expense Ratio. The Board was provided with information regarding industry trends in management fees and expenses. In its review of the fund's management fee and the total expense ratio of the retail class, the Board considered the fund's management fee rate as well as other fund or class expenses, as applicable, such as transfer agent fees, pricing and bookkeeping fees, fund-paid 12b-1 fees, and custodial, legal, and audit fees. The Board noted that Fidelity may agree to waive fees or reimburse expenses from time to time, and the extent to which, if any, it has done so for the fund.
Comparisons of Management Fees and Total Expense Ratios. Among other things, the Board reviewed data for selected groups of competitive funds and classes (referred to as "mapped groups") that were compiled by Fidelity based on combining similar investment objective categories (as classified by Lipper) that have comparable investment mandates. The data reviewed by the Board included (i) gross management fee comparisons (before taking into account expense reimbursements or caps ) relative to the total universe of funds within the mapped group; (ii) gross management fee comparisons relative to a subset of non-Fidelity funds in the mapped group that are similar in size and management fee structure to the fund (referred to as the "asset size peer group"); (iii) total expense comparisons of the retail class of the fund relative to funds and classes in the mapped group that have a similar sales load structure to the retail class of the fund (referred to as the "similar sales load structure group"); and (iv) total expense comparisons of the retail class of the fund relative to funds and classes in the similar sales load structure group that are similar in size and management fee structure to the fund (referred to as the "total expense asset size peer group"). The total expense asset size peer group comparison excludes performance adjustments and fund-paid 12b-1 fees to eliminate variability in fee structures.
The information provided to the Board indicated that the fund's management fee rate ranked below the competitive median of the mapped group for the 12-month period ended September 30, 2022 and below the competitive median of the asset size peer group for the 12-month period ended September 30, 2022. Further, the information provided to the Board indicated that the total expense ratio of the retail class of the fund ranked below the competitive median of the similar sales load structure group for the 12-month period ended September 30, 2022 and above the competitive median of the total expense asset size peer group for the 12-month period ended September 30, 2022. The Board also noted that if funds in a fund complex with a unique at-cost service model were excluded from the total expense asset size peer group, the total expense ratio for the retail class of the fund was below the total expense asset size peer group for 2022.
The Board also considered that, for funds subject to the group fee, FMR agreed to voluntarily waive fees over a specified period of time in amounts designed to account for assets converted from certain funds to certain collective investment trusts.
Fees Charged to Other Fidelity Clients. The Board also considered Fidelity fee structures and other information with respect to clients of Fidelity, such as other funds advised or subadvised by Fidelity, pension plan clients, and other institutional clients with similar mandates. The Board noted that a joint ad hoc committee created by it and the boards of other Fidelity funds periodically reviews and compares Fidelity's institutional investment advisory business with its business of providing services to the Fidelity funds and also noted the most recent findings of the committee. The Board noted that the committee's review included a consideration of the differences in services provided, fees charged, and costs incurred, as well as competition in the markets serving the different categories of clients.
Based on its review, the Board concluded that the fund's management fee is fair and reasonable in light of the services that the fund receives and the other factors considered. Further, based on its review of total expense ratios and fees charged to other Fidelity clients, the Board concluded that the total expense ratio of each class of the fund was reasonable in light of the services that the fund and its shareholders receive and the other factors considered.
Costs of the Services and Profitability. The Board considered the revenues earned and the expenses incurred by Fidelity in conducting the business of developing, marketing, distributing, managing, administering and servicing the fund and servicing the fund's shareholders. The Board also considered the level of Fidelity's profits in respect of all the Fidelity funds.
On an annual basis, Fidelity presents to the Board information about the profitability of its relationships with the fund. Fidelity calculates profitability information for each fund, as well as aggregate profitability information for groups of Fidelity funds and all Fidelity funds, using a series of detailed revenue and cost allocation methodologies which originate with the books and records of Fidelity on which Fidelity's audited financial statements are based. The Audit Committee of the Board reviews any significant changes from the prior year's methodologies and the full Board approves such changes.
A public accounting firm has been engaged annually by the Board as part of the Board's assessment of Fidelity's profitability analysis. The engagement includes the review and assessment of the methodologies used by Fidelity in determining the revenues and expenses attributable to Fidelity's fund business, and completion of agreed-upon procedures in respect of the mathematical accuracy of certain fund profitability information and its conformity to established allocation methodologies. After considering the reports issued under the engagement and information provided by Fidelity, the Board concluded that while other allocation methods may also be reasonable, Fidelity's profitability methodologies are reasonable in all material respects.
The Board also reviewed Fidelity's non-fund businesses and potential indirect benefits such businesses may have received as a result of their association with Fidelity's fund business (i.e., fall-out benefits) as well as cases where Fidelity's affiliates may benefit from the funds' business. The Board considered areas where potential indirect benefits to the Fidelity funds from their relationships with Fidelity may exist. The Board's consideration of these matters was informed by the findings of a joint ad hoc committee created by it and the boards of other Fidelity funds to evaluate potential fall-out benefits.
The Board considered the costs of the services provided by and the profits realized by Fidelity in connection with the operation of the fund and was satisfied that the profitability was not excessive.
Economies of Scale. The Board considered whether there have been economies of scale in respect of the management of the Fidelity funds, whether the Fidelity funds (including the fund) have appropriately benefited from any such economies of scale, and whether there is potential for realization of any further economies of scale. The Board considered the extent to which the fund will benefit from economies of scale as assets grow through increased services to the fund, through waivers or reimbursements, or through fee or expense ratio reductions. The Board also noted that a committee (the Economies of Scale Committee) created by it and the boards of other Fidelity funds periodically analyzes whether Fidelity attains economies of scale in respect of the management and servicing of the Fidelity funds, whether the Fidelity funds have appropriately benefited from such economies of scale, and whether there is potential for realization of any further economies of scale.
The Board recognized that the fund's management contract incorporates a "group fee" structure, which provides for lower group fee rates as total "group assets" increase, and for higher group fee rates as total "group assets" decrease ("group assets" as defined in the management contract). FMR calculates the group fee rates based on a tiered asset "breakpoint" schedule that varies based on asset class. The Board considered that the group fee is designed to deliver the benefits of economies of scale to fund shareholders when total Fidelity fund assets increase, even if assets of any particular fund are unchanged or have declined, because some portion of Fidelity's costs are attributable to services provided to all Fidelity funds, and all funds benefit if those costs can be allocated among more assets. The Board further considered that Fidelity agreed to impose a temporary fee waiver in the form of additional breakpoints to the current breakpoint schedule. The Board concluded that, given the group fee structure, fund shareholders will benefit from lower management fees as "group assets" increase at the fund complex level, regardless of whether Fidelity achieves any such economies of scale.
The Board concluded, taking into account the analysis of the Economies of Scale Committee, that economies of scale, if any, are being appropriately shared between fund shareholders and Fidelity.
Additional Information Requested by the Board. In order to develop fully the factual basis for consideration of the Fidelity funds' advisory contracts, the Board requested and received additional information on certain topics, including: (i) fund flow and performance trends, in particular the underperformance of certain funds and strategies, and Fidelity's long-term strategies for certain funds, including any consideration of fund liquidations or mergers; (ii) the operation of performance fees and competitor use of performance fees; (iii) Fidelity's pricing philosophy compared to competitors; (iv) fund profitability methodology and data; (v) evaluation of competitive fund data and peer group classifications and fee and expense comparisons; (vi) the management fee and expense structures for different funds and classes and information about the differences between various fee and expense structures; (vii) group fee breakpoints and related voluntary fee waivers; and (viii) information regarding other accounts managed by Fidelity and the funds' sub-advisory arrangements.
Conclusion. Based on its evaluation of all of the conclusions noted above, and after considering all factors it believed relevant, the Board, including the Independent Trustees, concluded that the advisory and sub-advisory fee arrangements are fair and reasonable in light of all of the surrounding circumstances and that the fund's Advisory Contracts should be renewed through July 31, 2024.
1.879380.114
GCS-ANN-1223
Fidelity® International Growth Fund
Annual Report
October 31, 2023
Includes Fidelity and Fidelity Advisor share classes
Contents
To view a fund's proxy voting guidelines and proxy voting record for the 12-month period ended June 30, visit http://www.fidelity.com/proxyvotingresults or visit the Securities and Exchange Commission's (SEC) web site at http://www.sec.gov.
You may also call 1-800-544-8544 if you're an individual investing directly with Fidelity, call 1-800-835-5092 if you're a plan sponsor or participant with Fidelity as your recordkeeper or call 1-877-208-0098 on institutional accounts or if you're an advisor or invest through one to request a free copy of the proxy voting guidelines.
Standard & Poor's, S&P and S&P 500 are registered service marks of The McGraw-Hill Companies, Inc. and have been licensed for use by Fidelity Distributors Corporation.
Other third-party marks appearing herein are the property of their respective owners.
All other marks appearing herein are registered or unregistered trademarks or service marks of FMR LLC or an affiliated company. © 2023 FMR LLC. All rights reserved.
This report and the financial statements contained herein are submitted for the general information of the shareholders of the Fund. This report is not authorized for distribution to prospective investors in the Fund unless preceded or accompanied by an effective prospectus.
A fund files its complete schedule of portfolio holdings with the SEC for the first and third quarters of each fiscal year on Form N-PORT. Forms N-PORT are available on the SEC's web site at http://www.sec.gov. A fund's Forms N-PORT may be reviewed and copied at the SEC's Public Reference Room in Washington, DC. Information regarding the operation of the SEC's Public Reference Room may be obtained by calling 1-800-SEC-0330.
For a complete list of a fund's portfolio holdings, view the most recent holdings listing, semiannual report, or annual report on Fidelity's web site at http://www.fidelity.com, http://www.institutional.fidelity.com, or http://www.401k.com, as applicable.
NOT FDIC INSURED •MAY LOSE VALUE •NO BANK GUARANTEE
Neither the Fund nor Fidelity Distributors Corporation is a bank.
Average annual total return reflects the change in the value of an investment, assuming reinvestment of distributions from dividend income and capital gains (the profits earned upon the sale of securities that have grown in value, if any) and assuming a constant rate of performance each year. The hypothetical investment and the average annual total returns do not reflect the deduction of taxes that a shareholder would pay on fund distributions or the redemption of fund shares. During periods of reimbursement by Fidelity, a fund's total return will be greater than it would be had the reimbursement not occurred. How a fund did yesterday is no guarantee of how it will do tomorrow.
| Average Annual Total Returns |
| | | | |
Periods ended October 31, 2023 | Past 1 year | Past 5 years | Past 10 years |
Class A (incl. 5.75% sales charge) | 3.92% | 5.05% | 4.30% |
Class M (incl. 3.50% sales charge) | 6.14% | 5.26% | 4.23% |
Class C (incl. contingent deferred sales charge) | 8.47% | 5.49% | 4.27% |
| Fidelity® International Growth Fund | 10.59% | 6.62% | 5.22% |
| Class I | 10.59% | 6.61% | 5.22% |
| Class Z | 10.74% | 6.75% | 5.37% |
Class C shares' contingent deferred sales charges included in the past one year, past five years and past ten years total return figures are 1%, 0% and 0%, respectively.
| $10,000 Over 10 Years |
| |
Let's say hypothetically that $10,000 was invested in Fidelity® International Growth Fund, a class of the fund, on October 31, 2013. The chart shows how the value of your investment would have changed, and also shows how the MSCI EAFE Growth Index performed over the same period. |
|
|
Market Recap:
International (non-U.S.) equities gained 12.27% for the 12 months ending October 31, 2023, according to the MSCI ACWI (All Country World Index) ex USA Index, as global economic expansion and a slowing in the pace of inflation in some markets provided a favorable backdrop for risk assets. After returning -15.86% in 2022, the index's upturn has been largely driven by a narrow set of companies in the information technology and communication services sectors, in part due to excitement for generative artificial intelligence applications. The index gained 14.07% year to date through July, including strong gains in both June (+4.50%) and July (+4.07%). The rally for international equities sputtered for the next three months (-11.33%) amid a stalling pattern in disinflationary trends, heightened global recession and geopolitical risks, soaring yields on longer-term U.S. government bonds and particularly weak economic conditions in the eurozone and China. The three-month decline left non-U.S. stocks up 1.15% year to date through October. Currency fluctuation also helped bolster non-U.S. equity performance overall. For the full 12 months, nearly all regions advanced, with Europe ex U.K. (+18%) and Japan (+17%) leading, whereas Canada (-0.38%) lagged by the widest margin. Each of the 11 sectors advanced, with information technology (+21%) and consumer discretionary (+19%) leading the way. Energy and industrials each rose about 14%. Conversely, four defensive-oriented sectors lagged by the widest margin: real estate (+4%), health care (+6%), consumer staples (+7%) and utilities (+8%).
Comments from Portfolio Manager Jed Weiss:
For the fiscal year ending October 31, 2023, the fund's share classes (excluding sales charges, if applicable) gained about 9% to 11%, versus 10.95% for the benchmark MSCI EAFE Growth Index (Net MA). From a regional standpoint, stock picking in Europe ex the U.K., primarily Ireland, along with an underweight in Asia Pacific ex Japan - Australia in particular - contributed to the fund's performance versus the benchmark. By sector, an underweight in health care proved beneficial, especially in the pharmaceuticals, biotechnology & life sciences industry. Picks among materials stocks also helped, as did financials, especially in the financial services category. Further bolstering the portfolio's relative result was an underweight in consumer staples, namely among food, beverage & tobacco companies. The top individual relative contributor was our non-benchmark stake in CRH (+52%). Outsized exposure to Safran (+41%), one of our largest holdings, helped as well. A non-benchmark stake in Linde gained 10% and further aided relative performance the past 12 months. The stock was among our biggest holdings on October 31. In contrast, on a regional basis, stock picking and an underweight in Japan, in addition to non-benchmark exposure to emerging markets, primarily Kenya, detracted from the fund's relative result. Sector-wise, the biggest relative detractor was security selection in information technology, especially software & services firms. Investment choices in industrials and consumer staples also pressured the portfolio's return. The fund's non-benchmark stake in ResMed returned about -37% and was the largest individual relative detractor. An outsized allocation to Misumi Group (-30%) and a smaller-than-benchmark position in Novo Nordisk (+79%) also hurt. The latter was among the portfolio's largest holdings at period end. Notable changes in positioning include increased exposure to equity markets in Denmark and a lower allocation to Switzerland. By sector, meaningful shifts include increased exposure to the materials sector and a smaller allocation to consumer staples stocks.
The views expressed above reflect those of the portfolio manager(s) only through the end of the period as stated on the cover of this report and do not necessarily represent the views of Fidelity or any other person in the Fidelity organization. Any such views are subject to change at any time based upon market or other conditions and Fidelity disclaims any responsibility to update such views. These views may not be relied on as investment advice and, because investment decisions for a Fidelity fund are based on numerous factors, may not be relied on as an indication of trading intent on behalf of any Fidelity fund.
Top Holdings (% of Fund's net assets) |
| |
| ASML Holding NV (Netherlands) (Netherlands, Semiconductors & Semiconductor Equipment) | 5.3 | |
| Novo Nordisk A/S Series B (Denmark, Pharmaceuticals) | 5.2 | |
| LVMH Moet Hennessy Louis Vuitton SE (France, Textiles, Apparel & Luxury Goods) | 5.1 | |
| Nestle SA (Reg. S) (United States of America, Food Products) | 4.7 | |
| Linde PLC (United States of America, Chemicals) | 4.1 | |
| Safran SA (France, Aerospace & Defense) | 3.6 | |
| Keyence Corp. (Japan, Electronic Equipment, Instruments & Components) | 3.1 | |
| Atlas Copco AB (A Shares) (Sweden, Machinery) | 3.0 | |
| Marsh & McLennan Companies, Inc. (United States of America, Insurance) | 2.8 | |
| Airbus Group NV (France, Aerospace & Defense) | 2.8 | |
| | 39.7 | |
| |
| Market Sectors (% of Fund's net assets) |
| |
| Industrials | 26.3 | |
| Financials | 18.0 | |
| Information Technology | 16.8 | |
| Consumer Discretionary | 12.7 | |
| Materials | 8.8 | |
| Health Care | 8.7 | |
| Consumer Staples | 4.9 | |
| Energy | 1.0 | |
| Communication Services | 0.8 | |
| |
Asset Allocation (% of Fund's net assets) |
|
|
Geographic Diversification (% of Fund's net assets) |
|
* Includes Short-Term investments and Net Other Assets (Liabilities). Percentages are adjusted for the effect of derivatives, if applicable. |
| |
Showing Percentage of Net Assets
| Common Stocks - 97.7% |
| | | Shares | Value ($) |
| Belgium - 0.6% | | | |
| Azelis Group NV | | 803,305 | 13,684,630 |
| KBC Group NV | | 200,000 | 10,983,078 |
TOTAL BELGIUM | | | 24,667,708 |
| Canada - 3.5% | | | |
| CAE, Inc. (a) | | 1,385,611 | 28,936,214 |
| Canadian Pacific Kansas City Ltd. | | 1,195,500 | 84,881,147 |
| Franco-Nevada Corp. | | 309,780 | 37,685,153 |
TOTAL CANADA | | | 151,502,514 |
| Denmark - 5.8% | | | |
| Novo Nordisk A/S Series B | | 2,346,200 | 226,352,545 |
| Vestas Wind Systems A/S (a) | | 1,087,700 | 23,575,661 |
TOTAL DENMARK | | | 249,928,206 |
| Finland - 0.5% | | | |
| Kone OYJ (B Shares) | | 514,200 | 22,247,227 |
| France - 14.7% | | | |
| Airbus Group NV | | 901,700 | 120,896,524 |
| Edenred SA | | 1,102,722 | 58,619,537 |
| Lectra | | 336,961 | 8,521,269 |
| Legrand SA | | 815,000 | 70,502,702 |
| LVMH Moet Hennessy Louis Vuitton SE | | 310,200 | 222,081,663 |
| Safran SA | | 1,003,400 | 156,750,692 |
TOTAL FRANCE | | | 637,372,387 |
| Germany - 1.2% | | | |
| Deutsche Borse AG | | 310,800 | 51,156,580 |
| Hong Kong - 1.8% | | | |
| AIA Group Ltd. | | 8,995,600 | 78,116,064 |
| India - 2.1% | | | |
| HDFC Bank Ltd. | | 2,798,091 | 49,636,079 |
| Jio Financial Services Ltd. | | 410,000 | 1,087,828 |
| Kotak Mahindra Bank Ltd. | | 995,400 | 20,802,483 |
| Reliance Industries Ltd. | | 410,000 | 11,270,743 |
| Reliance Industries Ltd. GDR (b) | | 177,500 | 9,691,500 |
TOTAL INDIA | | | 92,488,633 |
| Israel - 0.9% | | | |
| NICE Ltd. sponsored ADR (a) | | 245,000 | 37,815,750 |
| Italy - 1.3% | | | |
| Interpump Group SpA | | 625,126 | 26,060,965 |
| Prada SpA | | 5,289,400 | 31,863,649 |
TOTAL ITALY | | | 57,924,614 |
| Japan - 10.5% | | | |
| Azbil Corp. | | 1,552,670 | 45,879,331 |
| Hoya Corp. | | 656,400 | 63,190,723 |
| Keyence Corp. | | 351,948 | 136,245,658 |
| Lasertec Corp. | | 306,700 | 50,660,775 |
| Misumi Group, Inc. | | 2,323,985 | 35,182,027 |
| OSG Corp. | | 797,600 | 9,101,088 |
| Recruit Holdings Co. Ltd. | | 2,226,700 | 63,845,519 |
| SHO-BOND Holdings Co. Ltd. | | 695,400 | 27,386,981 |
| USS Co. Ltd. | | 1,310,000 | 22,897,356 |
TOTAL JAPAN | | | 454,389,458 |
| Kenya - 0.0% | | | |
| Safaricom Ltd. | | 21,284,000 | 1,760,118 |
| Netherlands - 6.1% | | | |
| Aalberts Industries NV | | 226,400 | 7,047,674 |
| ASML Holding NV (Netherlands) | | 383,600 | 230,589,789 |
| IMCD NV | | 228,900 | 27,489,597 |
TOTAL NETHERLANDS | | | 265,127,060 |
| Norway - 0.2% | | | |
| Schibsted ASA (B Shares) | | 554,500 | 10,274,999 |
| Spain - 1.9% | | | |
| Amadeus IT Holding SA Class A | | 1,455,300 | 82,874,884 |
| Sweden - 6.5% | | | |
| ASSA ABLOY AB (B Shares) | | 2,334,410 | 49,758,127 |
| Atlas Copco AB (A Shares) | | 9,958,800 | 128,956,717 |
| Autoliv, Inc. | | 440,469 | 40,368,984 |
| Epiroc AB (A Shares) | | 3,596,517 | 59,251,614 |
| Lagercrantz Group AB (B Shares) | | 548,100 | 4,993,686 |
TOTAL SWEDEN | | | 283,329,128 |
| Switzerland - 1.2% | | | |
| Schindler Holding AG: | | | |
| (participation certificate) | | 111,938 | 22,543,881 |
| (Reg.) | | 18,350 | 3,560,463 |
| UBS Group AG | | 1,003,420 | 23,407,434 |
TOTAL SWITZERLAND | | | 49,511,778 |
| Taiwan - 2.2% | | | |
| Taiwan Semiconductor Manufacturing Co. Ltd. | | 5,788,000 | 94,459,813 |
| United Kingdom - 6.8% | | | |
| BAE Systems PLC | | 4,147,200 | 55,764,835 |
| Compass Group PLC | | 3,858,600 | 97,280,655 |
| InterContinental Hotel Group PLC ADR (c) | | 872,670 | 62,945,687 |
| Rightmove PLC | | 2,565,494 | 14,749,226 |
| Sage Group PLC | | 2,085,000 | 24,597,074 |
| Spectris PLC | | 1,096,957 | 41,332,188 |
TOTAL UNITED KINGDOM | | | 296,669,665 |
| United States of America - 29.9% | | | |
| CRH PLC | | 1,898,466 | 101,700,824 |
| Experian PLC | | 2,516,100 | 76,179,606 |
| Linde PLC | | 463,679 | 177,199,567 |
| Marsh & McLennan Companies, Inc. | | 648,751 | 123,035,627 |
| MasterCard, Inc. Class A | | 208,300 | 78,393,705 |
| Microsoft Corp. | | 71,000 | 24,005,810 |
| Moody's Corp. | | 224,500 | 69,146,000 |
| MSCI, Inc. | | 134,500 | 63,423,475 |
| Nestle SA (Reg. S) | | 1,910,099 | 205,982,747 |
| NOV, Inc. | | 1,134,700 | 22,648,612 |
| Otis Worldwide Corp. | | 324,600 | 25,062,366 |
| PriceSmart, Inc. | | 124,098 | 7,754,884 |
| ResMed, Inc. | | 249,600 | 35,248,512 |
| Roche Holding AG (participation certificate) | | 204,693 | 52,751,360 |
| S&P Global, Inc. | | 189,700 | 66,264,107 |
| Sherwin-Williams Co. | | 275,600 | 65,650,676 |
| Synopsys, Inc. (a) | | 46,000 | 21,594,240 |
| Visa, Inc. Class A | | 348,560 | 81,946,456 |
TOTAL UNITED STATES OF AMERICA | | | 1,297,988,574 |
| TOTAL COMMON STOCKS (Cost $3,171,410,531) | | | 4,239,605,160 |
| | | | |
| Convertible Preferred Stocks - 0.3% |
| | | Shares | Value ($) |
| China - 0.3% | | | |
ByteDance Ltd. Series E1 (a)(d)(e) (Cost $6,992,915) | | 63,819 | 14,911,309 |
| | | | |
| Money Market Funds - 2.0% |
| | | Shares | Value ($) |
| Fidelity Cash Central Fund 5.40% (f) | | 71,825,670 | 71,840,035 |
| Fidelity Securities Lending Cash Central Fund 5.40% (f)(g) | | 12,774,026 | 12,775,303 |
| TOTAL MONEY MARKET FUNDS (Cost $84,615,338) | | | 84,615,338 |
| | | | |
| TOTAL INVESTMENT IN SECURITIES - 100.0% (Cost $3,263,018,784) | 4,339,131,807 |
NET OTHER ASSETS (LIABILITIES) - 0.0% | 1,105,545 |
| NET ASSETS - 100.0% | 4,340,237,352 |
| | |
Legend
| (b) | Security exempt from registration under Rule 144A of the Securities Act of 1933. These securities may be resold in transactions exempt from registration, normally to qualified institutional buyers. At the end of the period, the value of these securities amounted to $9,691,500 or 0.2% of net assets. |
| (c) | Security or a portion of the security is on loan at period end. |
| (d) | Restricted securities (including private placements) - Investment in securities not registered under the Securities Act of 1933 (excluding 144A issues). At the end of the period, the value of restricted securities (excluding 144A issues) amounted to $14,911,309 or 0.3% of net assets. |
| (f) | Affiliated fund that is generally available only to investment companies and other accounts managed by Fidelity Investments. The rate quoted is the annualized seven-day yield of the fund at period end. A complete unaudited listing of the fund's holdings as of its most recent quarter end is available upon request. In addition, each Fidelity Central Fund's financial statements, which are not covered by the Fund's Report of Independent Registered Public Accounting Firm, are available on the SEC's website or upon request. |
| (g) | Investment made with cash collateral received from securities on loan. |
| Additional information on each restricted holding is as follows: |
| Security | Acquisition Date | Acquisition Cost ($) |
| ByteDance Ltd. Series E1 | 11/18/20 | 6,992,915 |
| | | |
Affiliated Central Funds
Fiscal year to date information regarding the Fund's investments in Fidelity Central Funds, including the ownership percentage, is presented below.
| Affiliate | Value, beginning of period ($) | Purchases ($) | Sales Proceeds ($) | Dividend Income ($) | Realized Gain (loss) ($) | Change in Unrealized appreciation (depreciation) ($) | Value, end of period ($) | % ownership, end of period |
| Fidelity Cash Central Fund 5.40% | 21,706,800 | 1,082,485,083 | 1,032,351,848 | 4,868,858 | 713 | (713) | 71,840,035 | 0.2% |
| Fidelity Securities Lending Cash Central Fund 5.40% | 34,813,698 | 1,401,630,797 | 1,423,669,192 | 512,442 | - | - | 12,775,303 | 0.1% |
| Total | 56,520,498 | 2,484,115,880 | 2,456,021,040 | 5,381,300 | 713 | (713) | 84,615,338 | |
| | | | | | | | | |
Amounts in the dividend income column in the above table include any capital gain distributions from underlying funds, which are presented in the corresponding line item in the Statement of Operations, if applicable.
Amounts in the dividend income column for Fidelity Securities Lending Cash Central Fund represents the income earned on investing cash collateral, less rebates paid to borrowers and any lending agent fees associated with the loan, plus any premium payments received for lending certain types of securities.
Amounts included in the purchases and sales proceeds columns may include in-kind transactions, if applicable.
Investment Valuation
The following is a summary of the inputs used, as of October 31, 2023, involving the Fund's assets and liabilities carried at fair value. The inputs or methodology used for valuing securities may not be an indication of the risk associated with investing in those securities. For more information on valuation inputs, and their aggregation into the levels used below, please refer to the Investment Valuation section in the accompanying Notes to Financial Statements.
| Valuation Inputs at Reporting Date: |
| Description | Total ($) | Level 1 ($) | Level 2 ($) | Level 3 ($) |
Investments in Securities: | | | | |
|
| Equities: | | | | |
Communication Services | 41,695,652 | 26,784,343 | - | 14,911,309 |
Consumer Discretionary | 560,312,878 | 186,189,555 | 374,123,323 | - |
Consumer Staples | 213,737,631 | 7,754,884 | 205,982,747 | - |
Energy | 43,610,855 | 32,340,112 | 11,270,743 | - |
Financials | 776,018,453 | 575,219,419 | 200,799,034 | - |
Health Care | 377,543,140 | 35,248,512 | 342,294,628 | - |
Industrials | 1,138,666,257 | 337,693,770 | 800,972,487 | - |
Information Technology | 720,695,383 | 162,860,017 | 557,835,366 | - |
Materials | 382,236,220 | 382,236,220 | - | - |
|
| Money Market Funds | 84,615,338 | 84,615,338 | - | - |
| Total Investments in Securities: | 4,339,131,807 | 1,830,942,170 | 2,493,278,328 | 14,911,309 |
| Statement of Assets and Liabilities |
| | | | October 31, 2023 |
| | | | | |
| Assets | | | | |
| Investment in securities, at value (including securities loaned of $12,204,396) - See accompanying schedule: | | | | |
Unaffiliated issuers (cost $3,178,403,446) | $ | 4,254,516,469 | | |
Fidelity Central Funds (cost $84,615,338) | | 84,615,338 | | |
| | | | | |
| | | | | |
| Total Investment in Securities (cost $3,263,018,784) | | | $ | 4,339,131,807 |
| Foreign currency held at value (cost $156,247) | | | | 155,181 |
| Receivable for investments sold | | | | 11,250,804 |
| Receivable for fund shares sold | | | | 4,620,391 |
| Dividends receivable | | | | 3,400,145 |
| Reclaims receivable | | | | 9,580,974 |
| Distributions receivable from Fidelity Central Funds | | | | 263,706 |
| Prepaid expenses | | | | 6,545 |
Total assets | | | | 4,368,409,553 |
| Liabilities | | | | |
| Payable for investments purchased | $ | 3,320,644 | | |
| Payable for fund shares redeemed | | 8,354,978 | | |
| Accrued management fee | | 2,692,271 | | |
| Distribution and service plan fees payable | | 71,031 | | |
| Other affiliated payables | | 639,147 | | |
| Other payables and accrued expenses | | 319,530 | | |
| Collateral on securities loaned | | 12,774,600 | | |
| Total Liabilities | | | | 28,172,201 |
| Net Assets | | | $ | 4,340,237,352 |
| Net Assets consist of: | | | | |
| Paid in capital | | | $ | 3,337,757,395 |
| Total accumulated earnings (loss) | | | | 1,002,479,957 |
| Net Assets | | | $ | 4,340,237,352 |
| | | | | |
| Net Asset Value and Maximum Offering Price | | | | |
| Class A : | | | | |
Net Asset Value and redemption price per share ($171,656,226 ÷ 10,601,838 shares)(a) | | | $ | 16.19 |
| Maximum offering price per share (100/94.25 of $16.19) | | | $ | 17.18 |
| Class M : | | | | |
Net Asset Value and redemption price per share ($27,016,082 ÷ 1,684,703 shares)(a) | | | $ | 16.04 |
| Maximum offering price per share (100/96.50 of $16.04) | | | $ | 16.62 |
| Class C : | | | | |
Net Asset Value and offering price per share ($27,270,007 ÷ 1,763,804 shares)(a) | | | $ | 15.46 |
| International Growth : | | | | |
Net Asset Value, offering price and redemption price per share ($1,277,883,677 ÷ 78,016,626 shares) | | | $ | 16.38 |
| Class I : | | | | |
Net Asset Value, offering price and redemption price per share ($1,441,605,316 ÷ 88,243,151 shares) | | | $ | 16.34 |
| Class Z : | | | | |
Net Asset Value, offering price and redemption price per share ($1,394,806,044 ÷ 85,154,166 shares) | | | $ | 16.38 |
(a)Redemption price per share is equal to net asset value less any applicable contingent deferred sales charge. |
| Statement of Operations |
| | | | Year ended October 31, 2023 |
| Investment Income | | | | |
| Dividends | | | $ | 65,475,972 |
| Interest | | | | 2,636 |
| Income from Fidelity Central Funds (including $512,442 from security lending) | | | | 5,381,300 |
| Income before foreign taxes withheld | | | $ | 70,859,908 |
| Less foreign taxes withheld | | | | (6,548,064) |
| Total Income | | | | 64,311,844 |
| Expenses | | | | |
| Management fee | | | | |
| Basic fee | $ | 30,081,647 | | |
| Performance adjustment | | 1,541,140 | | |
| Transfer agent fees | | 6,142,434 | | |
| Distribution and service plan fees | | 932,696 | | |
| Accounting fees | | 1,473,290 | | |
| Custodian fees and expenses | | 292,314 | | |
| Independent trustees' fees and expenses | | 24,963 | | |
| Registration fees | | 192,679 | | |
| Audit | | 82,828 | | |
| Legal | | 4,892 | | |
| Interest | | 23,665 | | |
| Miscellaneous | | 20,523 | | |
| Total expenses before reductions | | 40,813,071 | | |
| Expense reductions | | (271,880) | | |
| Total expenses after reductions | | | | 40,541,191 |
| Net Investment income (loss) | | | | 23,770,653 |
| Realized and Unrealized Gain (Loss) | | | | |
| Net realized gain (loss) on: | | | | |
| Investment Securities: | | | | |
| Unaffiliated issuers (net of foreign taxes of $1,955) | | (80,824,167) | | |
| Fidelity Central Funds | | 713 | | |
| Foreign currency transactions | | (264,620) | | |
| Total net realized gain (loss) | | | | (81,088,074) |
| Change in net unrealized appreciation (depreciation) on: | | | | |
| Investment Securities: | | | | |
| Unaffiliated issuers(net of decrease in deferred foreign taxes of $481,602) | | 419,659,027 | | |
| Fidelity Central Funds | | (713) | | |
| Assets and liabilities in foreign currencies | | 678,596 | | |
| Total change in net unrealized appreciation (depreciation) | | | | 420,336,910 |
| Net gain (loss) | | | | 339,248,836 |
| Net increase (decrease) in net assets resulting from operations | | | $ | 363,019,489 |
| Statement of Changes in Net Assets |
| |
| | Year ended October 31, 2023 | | Year ended October 31, 2022 |
| Increase (Decrease) in Net Assets | | | | |
| Operations | | | | |
| Net investment income (loss) | $ | 23,770,653 | $ | 14,250,128 |
| Net realized gain (loss) | | (81,088,074) | | 85,832,715 |
| Change in net unrealized appreciation (depreciation) | | 420,336,910 | | (1,635,676,492) |
| Net increase (decrease) in net assets resulting from operations | | 363,019,489 | | (1,535,593,649) |
| Distributions to shareholders | | (63,050,595) | | (105,083,685) |
| | | | | |
| Share transactions - net increase (decrease) | | 265,402,755 | | (1,611,089) |
| Total increase (decrease) in net assets | | 565,371,649 | | (1,642,288,423) |
| | | | | |
| Net Assets | | | | |
| Beginning of period | | 3,774,865,703 | | 5,417,154,126 |
| End of period | $ | 4,340,237,352 | $ | 3,774,865,703 |
| | | | | |
| | | | | |
Financial Highlights
| Fidelity Advisor® International Growth Fund Class A |
| |
| Years ended October 31, | | 2023 | | 2022 | | 2021 | | 2020 | | 2019 |
Selected Per-Share Data | | | | | | | | | | |
| Net asset value, beginning of period | $ | 14.89 | $ | 21.04 | $ | 16.06 | $ | 15.03 | $ | 12.47 |
| Income from Investment Operations | | | | | | | | | | |
Net investment income (loss) A,B | | .04 | | - C | | (.04) | | (.01) | | .15 D |
| Net realized and unrealized gain (loss) | | 1.49 | | (5.80) | | 5.02 | | 1.16 | | 2.48 |
| Total from investment operations | | 1.53 | | (5.80) | | 4.98 | | 1.15 | | 2.63 |
| Distributions from net investment income | | - | | (.03) | | - | | (.12) | | (.07) |
| Distributions from net realized gain | | (.23) | | (.32) | | - | | - | | - |
| Total distributions | | (.23) | | (.35) | | - | | (.12) | | (.07) |
| Net asset value, end of period | $ | 16.19 | $ | 14.89 | $ | 21.04 | $ | 16.06 | $ | 15.03 |
Total Return E,F | | 10.26% | | (28.00)% | | 31.01% | | 7.66% | | 21.25% |
Ratios to Average Net Assets B,G,H | | | | | | | | | | |
| Expenses before reductions | | 1.21% | | 1.30% | | 1.28% | | 1.30% | | 1.28% |
| Expenses net of fee waivers, if any | | 1.21% | | 1.30% | | 1.28% | | 1.30% | | 1.28% |
| Expenses net of all reductions | | 1.21% | | 1.30% | | 1.28% | | 1.29% | | 1.27% |
| Net investment income (loss) | | .23% | | .02% | | (.20)% | | (.08)% | | 1.14% D |
| Supplemental Data | | | | | | | | | | |
| Net assets, end of period (000 omitted) | $ | 171,656 | $ | 157,490 | $ | 232,527 | $ | 174,561 | $ | 164,247 |
Portfolio turnover rate I | | 22% | | 22% | | 21% | | 23% | | 21% |
ACalculated based on average shares outstanding during the period.
BNet investment income (loss) is affected by the timing of the declaration of dividends by any underlying mutual funds or exchange-traded funds (ETFs). Net investment income (loss) of any mutual funds or ETFs is not included in the Fund's net investment income (loss) ratio.
CAmount represents less than $.005 per share.
DNet investment income per share reflects one or more large, non-recurring dividend(s) which amounted to $.07 per share. Excluding such non-recurring dividend(s), the ratio of net investment income (loss) to average net assets would have been .65%.
ETotal returns would have been lower if certain expenses had not been reduced during the applicable periods shown.
FTotal returns do not include the effect of the sales charges.
GFees and expenses of any underlying mutual funds or exchange-traded funds (ETFs) are not included in the Fund's expense ratio. The Fund indirectly bears its proportionate share of these expenses. For additional expense information related to investments in Fidelity Central Funds, please refer to the "Investments in Fidelity Central Funds" note found in the Notes to Financial Statements section of the most recent Annual or Semi-Annual report.
HExpense ratios reflect operating expenses of the class. Expenses before reductions do not reflect amounts reimbursed, waived, or reduced through arrangements with the investment adviser, brokerage services, or other offset arrangements, if applicable, and do not represent the amount paid by the class during periods when reimbursements, waivers or reductions occur.
IAmount does not include the portfolio activity of any underlying mutual funds or exchange-traded funds (ETFs).
| Fidelity Advisor® International Growth Fund Class M |
| |
| Years ended October 31, | | 2023 | | 2022 | | 2021 | | 2020 | | 2019 |
Selected Per-Share Data | | | | | | | | | | |
| Net asset value, beginning of period | $ | 14.79 | $ | 20.92 | $ | 16.01 | $ | 14.99 | $ | 12.43 |
| Income from Investment Operations | | | | | | | | | | |
Net investment income (loss) A,B | | (.01) | | (.04) | | (.09) | | (.06) | | .11 C |
| Net realized and unrealized gain (loss) | | 1.49 | | (5.77) | | 5.00 | | 1.15 | | 2.48 |
| Total from investment operations | | 1.48 | | (5.81) | | 4.91 | | 1.09 | | 2.59 |
| Distributions from net investment income | | - | | - | | - | | (.07) | | (.03) |
| Distributions from net realized gain | | (.23) | | (.32) | | - | | - | | - |
| Total distributions | | (.23) | | (.32) | | - | | (.07) | | (.03) |
| Net asset value, end of period | $ | 16.04 | $ | 14.79 | $ | 20.92 | $ | 16.01 | $ | 14.99 |
Total Return D,E | | 9.99% | | (28.18)% | | 30.67% | | 7.27% | | 20.92% |
Ratios to Average Net Assets B,F,G | | | | | | | | | | |
| Expenses before reductions | | 1.48% | | 1.57% | | 1.55% | | 1.59% | | 1.58% |
| Expenses net of fee waivers, if any | | 1.48% | | 1.57% | | 1.55% | | 1.59% | | 1.58% |
| Expenses net of all reductions | | 1.47% | | 1.57% | | 1.55% | | 1.58% | | 1.58% |
| Net investment income (loss) | | (.03)% | | (.25)% | | (.48)% | | (.37)% | | .83% C |
| Supplemental Data | | | | | | | | | | |
| Net assets, end of period (000 omitted) | $ | 27,016 | $ | 26,250 | $ | 38,761 | $ | 30,353 | $ | 28,534 |
Portfolio turnover rate H | | 22% | | 22% | | 21% | | 23% | | 21% |
ACalculated based on average shares outstanding during the period.
BNet investment income (loss) is affected by the timing of the declaration of dividends by any underlying mutual funds or exchange-traded funds (ETFs). Net investment income (loss) of any mutual funds or ETFs is not included in the Fund's net investment income (loss) ratio.
CNet investment income per share reflects one or more large, non-recurring dividend(s) which amounted to $.07 per share. Excluding such non-recurring dividend(s), the ratio of net investment income (loss) to average net assets would have been .34%.
DTotal returns would have been lower if certain expenses had not been reduced during the applicable periods shown.
ETotal returns do not include the effect of the sales charges.
FFees and expenses of any underlying mutual funds or exchange-traded funds (ETFs) are not included in the Fund's expense ratio. The Fund indirectly bears its proportionate share of these expenses. For additional expense information related to investments in Fidelity Central Funds, please refer to the "Investments in Fidelity Central Funds" note found in the Notes to Financial Statements section of the most recent Annual or Semi-Annual report.
GExpense ratios reflect operating expenses of the class. Expenses before reductions do not reflect amounts reimbursed, waived, or reduced through arrangements with the investment adviser, brokerage services, or other offset arrangements, if applicable, and do not represent the amount paid by the class during periods when reimbursements, waivers or reductions occur.
HAmount does not include the portfolio activity of any underlying mutual funds or exchange-traded funds (ETFs).
| Fidelity Advisor® International Growth Fund Class C |
| |
| Years ended October 31, | | 2023 | | 2022 | | 2021 | | 2020 | | 2019 |
Selected Per-Share Data | | | | | | | | | | |
| Net asset value, beginning of period | $ | 14.33 | $ | 20.39 | $ | 15.68 | $ | 14.68 | $ | 12.20 |
| Income from Investment Operations | | | | | | | | | | |
Net investment income (loss) A,B | | (.09) | | (.13) | | (.18) | | (.13) | | .05 C |
| Net realized and unrealized gain (loss) | | 1.45 | | (5.61) | | 4.89 | | 1.13 | | 2.43 |
| Total from investment operations | | 1.36 | | (5.74) | | 4.71 | | 1.00 | | 2.48 |
| Distributions from net realized gain | | (.23) | | (.32) | | - | | - | | - |
| Total distributions | | (.23) | | (.32) | | - | | - | | - |
| Net asset value, end of period | $ | 15.46 | $ | 14.33 | $ | 20.39 | $ | 15.68 | $ | 14.68 |
Total Return D,E | | 9.47% | | (28.58)% | | 30.04% | | 6.81% | | 20.33% |
Ratios to Average Net Assets B,F,G | | | | | | | | | | |
| Expenses before reductions | | 1.98% | | 2.07% | | 2.05% | | 2.07% | | 2.04% |
| Expenses net of fee waivers, if any | | 1.97% | | 2.06% | | 2.05% | | 2.07% | | 2.04% |
| Expenses net of all reductions | | 1.97% | | 2.06% | | 2.05% | | 2.06% | | 2.03% |
| Net investment income (loss) | | (.53)% | | (.74)% | | (.97)% | | (.85)% | | .38% C |
| Supplemental Data | | | | | | | | | | |
| Net assets, end of period (000 omitted) | $ | 27,270 | $ | 33,575 | $ | 58,867 | $ | 55,013 | $ | 57,291 |
Portfolio turnover rate H | | 22% | | 22% | | 21% | | 23% | | 21% |
ACalculated based on average shares outstanding during the period.
BNet investment income (loss) is affected by the timing of the declaration of dividends by any underlying mutual funds or exchange-traded funds (ETFs). Net investment income (loss) of any mutual funds or ETFs is not included in the Fund's net investment income (loss) ratio.
CNet investment income per share reflects one or more large, non-recurring dividend(s) which amounted to $.06 per share. Excluding such non-recurring dividend(s), the ratio of net investment income (loss) to average net assets would have been (.11)%.
DTotal returns would have been lower if certain expenses had not been reduced during the applicable periods shown.
ETotal returns do not include the effect of the contingent deferred sales charge.
FFees and expenses of any underlying mutual funds or exchange-traded funds (ETFs) are not included in the Fund's expense ratio. The Fund indirectly bears its proportionate share of these expenses. For additional expense information related to investments in Fidelity Central Funds, please refer to the "Investments in Fidelity Central Funds" note found in the Notes to Financial Statements section of the most recent Annual or Semi-Annual report.
GExpense ratios reflect operating expenses of the class. Expenses before reductions do not reflect amounts reimbursed, waived, or reduced through arrangements with the investment adviser, brokerage services, or other offset arrangements, if applicable, and do not represent the amount paid by the class during periods when reimbursements, waivers or reductions occur.
HAmount does not include the portfolio activity of any underlying mutual funds or exchange-traded funds (ETFs).
| Fidelity® International Growth Fund |
| |
| Years ended October 31, | | 2023 | | 2022 | | 2021 | | 2020 | | 2019 |
Selected Per-Share Data | | | | | | | | | | |
| Net asset value, beginning of period | $ | 15.05 | $ | 21.26 | $ | 16.20 | $ | 15.16 | $ | 12.57 |
| Income from Investment Operations | | | | | | | | | | |
Net investment income (loss) A,B | | .09 | | .05 | | .02 | | .03 | | .19 C |
| Net realized and unrealized gain (loss) | | 1.51 | | (5.85) | | 5.06 | | 1.17 | | 2.51 |
| Total from investment operations | | 1.60 | | (5.80) | | 5.08 | | 1.20 | | 2.70 |
| Distributions from net investment income | | (.04) | | (.09) | | (.02) | | (.16) | | (.11) |
| Distributions from net realized gain | | (.23) | | (.32) | | - | | - | | - |
| Total distributions | | (.27) | | (.41) | | (.02) | | (.16) | | (.11) |
| Net asset value, end of period | $ | 16.38 | $ | 15.05 | $ | 21.26 | $ | 16.20 | $ | 15.16 |
Total Return D | | 10.59% | | (27.79)% | | 31.38% | | 7.93% | | 21.66% |
Ratios to Average Net Assets B,E,F | | | | | | | | | | |
| Expenses before reductions | | .93% | | 1.01% | | .99% | | 1.01% | | .99% |
| Expenses net of fee waivers, if any | | .92% | | 1.01% | | .99% | | 1.01% | | .99% |
| Expenses net of all reductions | | .92% | | 1.01% | | .99% | | 1.00% | | .99% |
| Net investment income (loss) | | .52% | | .31% | | .09% | | .21% | | 1.42% C |
| Supplemental Data | | | | | | | | | | |
| Net assets, end of period (000 omitted) | $ | 1,277,884 | $ | 1,194,442 | $ | 1,773,433 | $ | 1,292,392 | $ | 1,040,532 |
Portfolio turnover rate G | | 22% | | 22% | | 21% | | 23% | | 21% |
ACalculated based on average shares outstanding during the period.
BNet investment income (loss) is affected by the timing of the declaration of dividends by any underlying mutual funds or exchange-traded funds (ETFs). Net investment income (loss) of any mutual funds or ETFs is not included in the Fund's net investment income (loss) ratio.
CNet investment income per share reflects one or more large, non-recurring dividend(s) which amounted to $.07 per share. Excluding such non-recurring dividend(s), the ratio of net investment income (loss) to average net assets would have been .93%.
DTotal returns would have been lower if certain expenses had not been reduced during the applicable periods shown.
EFees and expenses of any underlying mutual funds or exchange-traded funds (ETFs) are not included in the Fund's expense ratio. The Fund indirectly bears its proportionate share of these expenses. For additional expense information related to investments in Fidelity Central Funds, please refer to the "Investments in Fidelity Central Funds" note found in the Notes to Financial Statements section of the most recent Annual or Semi-Annual report.
FExpense ratios reflect operating expenses of the class. Expenses before reductions do not reflect amounts reimbursed, waived, or reduced through arrangements with the investment adviser, brokerage services, or other offset arrangements, if applicable, and do not represent the amount paid by the class during periods when reimbursements, waivers or reductions occur.
GAmount does not include the portfolio activity of any underlying mutual funds or exchange-traded funds (ETFs).
| Fidelity Advisor® International Growth Fund Class I |
| |
| Years ended October 31, | | 2023 | | 2022 | | 2021 | | 2020 | | 2019 |
Selected Per-Share Data | | | | | | | | | | |
| Net asset value, beginning of period | $ | 15.01 | $ | 21.20 | $ | 16.16 | $ | 15.13 | $ | 12.55 |
| Income from Investment Operations | | | | | | | | | | |
Net investment income (loss) A,B | | .09 | | .05 | | .01 | | .03 | | .20 C |
| Net realized and unrealized gain (loss) | | 1.50 | | (5.83) | | 5.05 | | 1.16 | | 2.49 |
| Total from investment operations | | 1.59 | | (5.78) | | 5.06 | | 1.19 | | 2.69 |
| Distributions from net investment income | | (.03) | | (.09) | | (.02) | | (.16) | | (.11) |
| Distributions from net realized gain | | (.23) | | (.32) | | - | | - | | - |
| Total distributions | | (.26) | | (.41) | | (.02) | | (.16) | | (.11) |
| Net asset value, end of period | $ | 16.34 | $ | 15.01 | $ | 21.20 | $ | 16.16 | $ | 15.13 |
Total Return D | | 10.59% | | (27.78)% | | 31.36% | | 7.90% | | 21.64% |
Ratios to Average Net Assets B,E,F | | | | | | | | | | |
| Expenses before reductions | | .94% | | 1.02% | | 1.00% | | 1.01% | | .97% |
| Expenses net of fee waivers, if any | | .93% | | 1.02% | | 1.00% | | 1.01% | | .97% |
| Expenses net of all reductions | | .93% | | 1.02% | | 1.00% | | 1.00% | | .97% |
| Net investment income (loss) | | .51% | | .30% | | .07% | | .21% | | 1.44% C |
| Supplemental Data | | | | | | | | | | |
| Net assets, end of period (000 omitted) | $ | 1,441,605 | $ | 1,373,850 | $ | 2,035,690 | $ | 1,382,837 | $ | 953,360 |
Portfolio turnover rate G | | 22% | | 22% | | 21% | | 23% | | 21% |
ACalculated based on average shares outstanding during the period.
BNet investment income (loss) is affected by the timing of the declaration of dividends by any underlying mutual funds or exchange-traded funds (ETFs). Net investment income (loss) of any mutual funds or ETFs is not included in the Fund's net investment income (loss) ratio.
CNet investment income per share reflects one or more large, non-recurring dividend(s) which amounted to $.07 per share. Excluding such non-recurring dividend(s), the ratio of net investment income (loss) to average net assets would have been .96%.
DTotal returns would have been lower if certain expenses had not been reduced during the applicable periods shown.
EFees and expenses of any underlying mutual funds or exchange-traded funds (ETFs) are not included in the Fund's expense ratio. The Fund indirectly bears its proportionate share of these expenses. For additional expense information related to investments in Fidelity Central Funds, please refer to the "Investments in Fidelity Central Funds" note found in the Notes to Financial Statements section of the most recent Annual or Semi-Annual report.
FExpense ratios reflect operating expenses of the class. Expenses before reductions do not reflect amounts reimbursed, waived, or reduced through arrangements with the investment adviser, brokerage services, or other offset arrangements, if applicable, and do not represent the amount paid by the class during periods when reimbursements, waivers or reductions occur.
GAmount does not include the portfolio activity of any underlying mutual funds or exchange-traded funds (ETFs).
| Fidelity Advisor® International Growth Fund Class Z |
| |
| Years ended October 31, | | 2023 | | 2022 | | 2021 | | 2020 | | 2019 |
Selected Per-Share Data | | | | | | | | | | |
| Net asset value, beginning of period | $ | 15.05 | $ | 21.25 | $ | 16.19 | $ | 15.16 | $ | 12.57 |
| Income from Investment Operations | | | | | | | | | | |
Net investment income (loss) A,B | | .11 | | .08 | | .04 | | .05 | | .22 C |
| Net realized and unrealized gain (loss) | | 1.51 | | (5.85) | | 5.06 | | 1.16 | | 2.50 |
| Total from investment operations | | 1.62 | | (5.77) | | 5.10 | | 1.21 | | 2.72 |
| Distributions from net investment income | | (.06) | | (.11) | | (.04) | | (.18) | | (.13) |
| Distributions from net realized gain | | (.23) | | (.32) | | - | | - | | - |
| Total distributions | | (.29) | | (.43) | | (.04) | | (.18) | | (.13) |
| Net asset value, end of period | $ | 16.38 | $ | 15.05 | $ | 21.25 | $ | 16.19 | $ | 15.16 |
Total Return D | | 10.74% | | (27.68)% | | 31.55% | | 8.01% | | 21.85% |
Ratios to Average Net Assets B,E,F | | | | | | | | | | |
| Expenses before reductions | | .80% | | .89% | | .87% | | .88% | | .84% |
| Expenses net of fee waivers, if any | | .79% | | .89% | | .87% | | .88% | | .84% |
| Expenses net of all reductions | | .79% | | .89% | | .87% | | .87% | | .84% |
| Net investment income (loss) | | .65% | | .43% | | .20% | | .34% | | 1.57% C |
| Supplemental Data | | | | | | | | | | |
| Net assets, end of period (000 omitted) | $ | 1,394,806 | $ | 989,259 | $ | 1,277,877 | $ | 1,350,267 | $ | 1,082,899 |
Portfolio turnover rate G | | 22% | | 22% | | 21% | | 23% | | 21% |
ACalculated based on average shares outstanding during the period.
BNet investment income (loss) is affected by the timing of the declaration of dividends by any underlying mutual funds or exchange-traded funds (ETFs). Net investment income (loss) of any mutual funds or ETFs is not included in the Fund's net investment income (loss) ratio.
CNet investment income per share reflects one or more large, non-recurring dividend(s) which amounted to $.07 per share. Excluding such non-recurring dividend(s), the ratio of net investment income (loss) to average net assets would have been 1.08%.
DTotal returns would have been lower if certain expenses had not been reduced during the applicable periods shown.
EFees and expenses of any underlying mutual funds or exchange-traded funds (ETFs) are not included in the Fund's expense ratio. The Fund indirectly bears its proportionate share of these expenses. For additional expense information related to investments in Fidelity Central Funds, please refer to the "Investments in Fidelity Central Funds" note found in the Notes to Financial Statements section of the most recent Annual or Semi-Annual report.
FExpense ratios reflect operating expenses of the class. Expenses before reductions do not reflect amounts reimbursed, waived, or reduced through arrangements with the investment adviser, brokerage services, or other offset arrangements, if applicable, and do not represent the amount paid by the class during periods when reimbursements, waivers or reductions occur.
GAmount does not include the portfolio activity of any underlying mutual funds or exchange-traded funds (ETFs).
For the period ended October 31, 2023
1. Organization.
Fidelity International Growth Fund (the Fund) is a fund of Fidelity Investment Trust (the Trust) and is authorized to issue an unlimited number of shares. The Trust is registered under the Investment Company Act of 1940, as amended (the 1940 Act), as an open-end management investment company organized as a Massachusetts business trust. The Fund offers Class A, Class M, Class C, International Growth, Class I and Class Z shares, each of which has equal rights as to assets and voting privileges. Class A, Class M, Class C, Class I and Class Z are Fidelity Advisor classes. Each class has exclusive voting rights with respect to matters that affect that class. Class C shares will automatically convert to Class A shares after a holding period of eight years from the initial date of purchase, with certain exceptions.
2. Investments in Fidelity Central Funds.
Funds may invest in Fidelity Central Funds, which are open-end investment companies generally available only to other investment companies and accounts managed by the investment adviser and its affiliates. The Schedule of Investments lists any Fidelity Central Funds held as an investment as of period end, but does not include the underlying holdings of each Fidelity Central Fund. An investing fund indirectly bears its proportionate share of the expenses of the underlying Fidelity Central Funds.
Based on its investment objective, each Fidelity Central Fund may invest or participate in various investment vehicles or strategies that are similar to those of the investing fund. These strategies are consistent with the investment objectives of the investing fund and may involve certain economic risks which may cause a decline in value of each of the Fidelity Central Funds and thus a decline in the value of the investing fund.
| Fidelity Central Fund | Investment Manager | Investment Objective | Investment Practices | Expense RatioA |
| Fidelity Money Market Central Funds | Fidelity Management & Research Company LLC (FMR) | Each fund seeks to obtain a high level of current income consistent with the preservation of capital and liquidity. | Short-term Investments | Less than .005% |
A Expenses expressed as a percentage of average net assets and are as of each underlying Central Fund's most recent annual or semi-annual shareholder report.
A complete unaudited list of holdings for each Fidelity Central Fund is available upon request or at the Securities and Exchange Commission website at www.sec.gov. In addition, the financial statements of the Fidelity Central Funds which contain the significant accounting policies (including investment valuation policies) of those funds, and are not covered by the Report of Independent Registered Public Accounting Firm, are available on the Securities and Exchange Commission website or upon request.
3. Significant Accounting Policies.
The Fund is an investment company and applies the accounting and reporting guidance of the Financial Accounting Standards Board (FASB) Accounting Standards Codification Topic 946 Financial Services - Investment Companies. The financial statements have been prepared in conformity with accounting principles generally accepted in the United States of America (GAAP), which require management to make certain estimates and assumptions at the date of the financial statements. Actual results could differ from those estimates. Subsequent events, if any, through the date that the financial statements were issued have been evaluated in the preparation of the financial statements. The Fund's Schedule of Investments lists any underlying mutual funds or exchange-traded funds (ETFs) but does not include the underlying holdings of these funds. The following summarizes the significant accounting policies of the Fund:
Investment Valuation. Investments are valued as of 4:00 p.m. Eastern time on the last calendar day of the period. The Board of Trustees (the Board) has designated the Fund's investment adviser as the valuation designee responsible for the fair valuation function and performing fair value determinations as needed. The investment adviser has established a Fair Value Committee (the Committee) to carry out the day-to-day fair valuation responsibilities and has adopted policies and procedures to govern the fair valuation process and the activities of the Committee. In accordance with these fair valuation policies and procedures, which have been approved by the Board, the Fund attempts to obtain prices from one or more third party pricing services or brokers to value its investments. When current market prices, quotations or currency exchange rates are not readily available or reliable, investments will be fair valued in good faith by the Committee, in accordance with the policies and procedures. Factors used in determining fair value vary by investment type and may include market or investment specific events, transaction data, estimated cash flows, and market observations of comparable investments. The frequency that the fair valuation procedures are used cannot be predicted and they may be utilized to a significant extent. The Committee manages the Fund's fair valuation practices and maintains the fair valuation policies and procedures. The Fund's investment adviser reports to the Board information regarding the fair valuation process and related material matters.
The Fund categorizes the inputs to valuation techniques used to value its investments into a disclosure hierarchy consisting of three levels as shown below:
Level 1 - unadjusted quoted prices in active markets for identical investments
Level 2 - other significant observable inputs (including quoted prices for similar investments, interest rates, prepayment speeds, etc.)
Level 3 - unobservable inputs (including the Fund's own assumptions based on the best information available)
Valuation techniques used to value the Fund's investments by major category are as follows:
Equity securities, including restricted securities, for which market quotations are readily available, are valued at the last reported sale price or official closing price as reported by a third party pricing service on the primary market or exchange on which they are traded and are categorized as Level 1 in the hierarchy. In the event there were no sales during the day or closing prices are not available, securities are valued at the last quoted bid price or may be valued using the last available price and are generally categorized as Level 2 in the hierarchy. For foreign equity securities, when market or security specific events arise, comparisons to the valuation of American Depositary Receipts (ADRs), futures contracts, ETFs and certain indexes as well as quoted prices for similar securities may be used and would be categorized as Level 2 in the hierarchy. For equity securities, including restricted securities, where observable inputs are limited, assumptions about market activity and risk are used and these securities may be categorized as Level 3 in the hierarchy.
Investments in open-end mutual funds, including the Fidelity Central Funds, are valued at their closing net asset value (NAV) each business day and are categorized as Level 1 in the hierarchy.
Changes in valuation techniques may result in transfers in or out of an assigned level within the disclosure hierarchy. The aggregate value of investments by input level as of October 31, 2023 is included at the end of the Fund's Schedule of Investments.
Foreign Currency. Certain Funds may use foreign currency contracts to facilitate transactions in foreign-denominated securities. Gains and losses from these transactions may arise from changes in the value of the foreign currency or if the counterparties do not perform under the contracts' terms.
Foreign-denominated assets, including investment securities, and liabilities are translated into U.S. dollars at the exchange rates at period end. Purchases and sales of investment securities, income and dividends received, and expenses denominated in foreign currencies are translated into U.S. dollars at the exchange rate in effect on the transaction date.
The effects of exchange rate fluctuations on investments are included with the net realized and unrealized gain (loss) on investment securities. Other foreign currency transactions resulting in realized and unrealized gain (loss) are disclosed separately.
Investment Transactions and Income. For financial reporting purposes, the Fund's investment holdings and NAV include trades executed through the end of the last business day of the period. The NAV per share for processing shareholder transactions is calculated as of the close of business of the New York Stock Exchange (NYSE), normally 4:00 p.m. Eastern time and includes trades executed through the end of the prior business day. Gains and losses on securities sold are determined on the basis of identified cost and include proceeds received from litigation. Commissions paid to certain brokers with whom the investment adviser, or its affiliates, places trades on behalf of a fund include an amount in addition to trade execution, which may be rebated back to a fund. Any such rebates are included in net realized gain (loss) on investments in the Statement of Operations. Dividend income is recorded on the ex-dividend date, except for certain dividends from foreign securities where the ex-dividend date may have passed, which are recorded as soon as the Fund is informed of the ex-dividend date. Non-cash dividends included in dividend income, if any, are recorded at the fair market value of the securities received. Income and capital gain distributions from Fidelity Central Funds, if any, are recorded on the ex-dividend date. Certain distributions received by the Fund represent a return of capital or capital gain. The Fund determines the components of these distributions subsequent to the ex-dividend date, based upon receipt of tax filings or other correspondence relating to the underlying investment. These distributions are recorded as a reduction of cost of investments and/or as a realized gain. Interest income is accrued as earned and includes coupon interest and amortization of premium and accretion of discount on debt securities as applicable. Investment income is recorded net of foreign taxes withheld where recovery of such taxes is uncertain. Funds may file withholding tax reclaims in certain jurisdictions to recover a portion of amounts previously withheld. Any withholding tax reclaims income is included in the Statement of Operations in foreign taxes withheld. Any receivables for withholding tax reclaims are included in the Statement of Assets and Liabilities in reclaims receivable.
Class Allocations and Expenses. Investment income, realized and unrealized capital gains and losses, common expenses of a fund, and certain fund-level expense reductions, if any, are allocated daily on a pro-rata basis to each class based on the relative net assets of each class to the total net assets of a fund. Each class differs with respect to transfer agent and distribution and service plan fees incurred, as applicable. Certain expense reductions may also differ by class, if applicable. For the reporting period, the allocated portion of income and expenses to each class as a percent of its average net assets may vary due to the timing of recording these transactions in relation to fluctuating net assets of the classes. Expenses directly attributable to a fund are charged to that fund. Expenses attributable to more than one fund are allocated among the respective funds on the basis of relative net assets or other appropriate methods. Expenses included in the accompanying financial statements reflect the expenses of that fund and do not include any expenses associated with any underlying mutual funds or exchange-traded funds (ETFs). Although not included in a fund's expenses, a fund indirectly bears its proportionate share of these expenses through the net asset value of each underlying mutual fund or exchange-traded fund (ETF). Expense estimates are accrued in the period to which they relate and adjustments are made when actual amounts are known.
Income Tax Information and Distributions to Shareholders. Each year, the Fund intends to qualify as a regulated investment company under Subchapter M of the Internal Revenue Code, including distributing substantially all of its taxable income and realized gains. As a result, no provision for U.S. Federal income taxes is required. As of October 31, 2023, the Fund did not have any unrecognized tax benefits in the financial statements; nor is the Fund aware of any tax positions for which it is reasonably possible that the total amounts of unrecognized tax benefits will significantly change in the next twelve months. The Fund files a U.S. federal tax return, in addition to state and local tax returns as required. The Fund's federal income tax returns are subject to examination by the Internal Revenue Service (IRS) for a period of three fiscal years after they are filed. State and local tax returns may be subject to examination for an additional fiscal year depending on the jurisdiction. Foreign taxes are provided for based on the Fund's understanding of the tax rules and rates that exist in the foreign markets in which it invests. The Fund is subject to a tax imposed on capital gains by certain countries in which it invests. An estimated deferred tax liability for net unrealized appreciation on the applicable securities is included in Other payables and accrued expenses on the Statement of Assets & Liabilities.
Distributions are declared and recorded on the ex-dividend date. Income and capital gain distributions are declared separately for each class. Income and capital gain distributions are determined in accordance with income tax regulations, which may differ from GAAP. In addition, the Fund claimed a portion of the payment made to redeeming shareholders as a distribution for income tax purposes.
Capital accounts within the financial statements are adjusted for permanent book-tax differences. These adjustments have no impact on net assets or the results of operations. Capital accounts are not adjusted for temporary book-tax differences which will reverse in a subsequent period.
Book-tax differences are primarily due to foreign currency transactions, certain foreign taxes, passive foreign investment companies (PFIC), capital loss carryforwards and losses deferred due to wash sales.
As of period end, the cost and unrealized appreciation (depreciation) in securities, and derivatives if applicable, for federal income tax purposes were as follows:
| Gross unrealized appreciation | $1,242,559,771 |
| Gross unrealized depreciation | (181,466,705) |
| Net unrealized appreciation (depreciation) | $1,061,093,066 |
| Tax Cost | $3,278,038,741 |
The tax-based components of distributable earnings as of period end were as follows:
| Undistributed ordinary income | $20,796,642 |
| Capital loss carryforward | $(79,045,408) |
| Net unrealized appreciation (depreciation) on securites and other investments | $1,060,899,720 |
Capital loss carryforwards are only available to offset future capital gains of the Fund to the extent provided by regulations and may be limited. The capital loss carryforward information presented below, including any applicable limitation, is estimated as of fiscal period end and is subject to adjustment.
Short-term | $(19,969,920) |
Long-term | (59,075,488) |
| Total capital loss carryforward | $(79,045,408) |
The tax character of distributions paid was as follows:
| | October 31, 2023 | October 31, 2022 |
| Ordinary Income | $8,821,103 | $23,472,059 |
| Long-term Capital Gains | 54,229,492 | 81,611,626 |
| Total | $63,050,595 | $105,083,685 |
Restricted Securities (including Private Placements). Funds may invest in securities that are subject to legal or contractual restrictions on resale. These securities generally may be resold in transactions exempt from registration or to the public if the securities are registered. Disposal of these securities may involve time-consuming negotiations and expense, and prompt sale at an acceptable price may be difficult. Information regarding restricted securities held at period end is included at the end of the Schedule of Investments, if applicable.
4. Purchases and Sales of Investments.
Purchases and sales of securities, other than short-term securities and in-kind transactions, as applicable, are noted in the table below.
| | Purchases ($) | Sales ($) |
| Fidelity International Growth Fund | 1,156,782,587 | 958,996,707 |
5. Fees and Other Transactions with Affiliates.
Management Fee. Fidelity Management & Research Company LLC (the investment adviser) and its affiliates provide the Fund with investment management related services for which the Fund pays a monthly management fee. The management fee is the sum of an individual fund fee rate that is based on an annual rate of .45% of the Fund's average net assets and an annualized group fee rate that averaged .23% during the period. The group fee rate is based upon the monthly average net assets of a group of registered investment companies with which the investment adviser has management contracts. The group fee rate decreases as assets under management increase and increases as assets under management decrease. In addition, the management fee is subject to a performance adjustment (up to a maximum of +/- .20% of the Fund's average net assets over a 36 month performance period). The upward or downward adjustment to the management fee is based on the relative investment performance of International Growth as compared to its benchmark index, the MSCI EAFE Growth Index, over the same 36 month performance period. For the reporting period, the total annual management fee rate, including the performance adjustment, was .71% of the Fund's average net assets. The performance adjustment included in the management fee rate may be higher or lower than the maximum performance adjustment rate due to the difference between the average net assets for the reporting and performance periods.
Distribution and Service Plan Fees. In accordance with Rule 12b-1 of the 1940 Act, the Fund has adopted separate Distribution and Service Plans for each class of shares. Certain classes pay Fidelity Distributors Company LLC (FDC), an affiliate of the investment adviser, separate Distribution and Service Fees, each of which is based on an annual percentage of each class' average net assets. In addition, FDC may pay financial intermediaries for selling shares of the Fund and providing shareholder support services. For the period, the Distribution and Service Fee rates, total fees and amounts retained by FDC were as follows:
| | Distribution Fee | Service Fee | Total Fees | Retained by FDC |
| Class A | -% | .25% | $450,910 | $4,238 |
| Class M | .25% | .25% | 146,796 | 536 |
| Class C | .75% | .25% | 334,990 | 22,385 |
| | | | $932,696 | $27,159 |
Sales Load. FDC may receive a front-end sales charge of up to 5.75% for selling Class A shares and 3.50% for selling Class M shares, some of which is paid to financial intermediaries for selling shares of the Fund. Depending on the holding period, FDC may receive contingent deferred sales charges levied on Class A, Class M and Class C redemptions. The deferred sales charges are 1.00% for Class C shares, 1.00% for certain purchases of Class A shares and .25% for certain purchases of Class M shares.
For the period, sales charge amounts retained by FDC were as follows:
| | Retained by FDC |
| Class A | $41,447 |
| Class M | 2,116 |
Class CA | 653 |
| | $44,216 |
A When Class C shares are initially sold, FDC pays commissions from its own resources to financial intermediaries through which the sales are made.
Transfer Agent Fees. Fidelity Investments Institutional Operations Company LLC (FIIOC), an affiliate of the investment adviser, is the transfer, dividend disbursing and shareholder servicing agent for each class of the Fund. FIIOC receives account fees and asset-based fees that vary according to the account size and type of account of the shareholders of the respective classes of the Fund, except for Class Z. FIIOC receives an asset-based fee of Class Z's average net assets. FIIOC pays for typesetting, printing and mailing of shareholder reports, except proxy statements.
For the period, transfer agent fees for each class were as follows:
| | Amount | % of Class-Level Average Net Assets |
| Class A | $373,369 | .21 |
| Class M | 66,360 | .23 |
| Class C | 73,753 | .22 |
| International Growth | 2,343,640 | .17 |
| Class I | 2,736,887 | .18 |
| Class Z | 548,425 | .04 |
| | $6,142,434 | |
During November 2023, the Board approved a change in the transfer agent fees effective December 1, 2023 to a fixed annual rate of class-level average net assets as follows:
| | % of Class-Level Average Net Assets |
| Class A | 0.2000% |
| Class M | 0.2000% |
| Class C | 0.2000% |
| International Growth | 0.1672% |
| Class I | 0.1771% |
Accounting Fees. Fidelity Service Company, Inc. (FSC), an affiliate of the investment adviser, maintains the Fund's accounting records. The accounting fee is based on the level of average net assets for each month. For the period, the fees were equivalent to the following annual rates:
| | % of Average Net Assets |
| Fidelity International Growth Fund | .03 |
During November 2023, the Board approved a change in the accounting fees effective December 1, 2023 to a fixed annual rate of average net assets as follows:
| | % of Average Net Assets |
| Fidelity International Growth Fund | 0.0302% |
Brokerage Commissions. A portion of portfolio transactions were placed with brokerage firms which are affiliates of the investment adviser. Brokerage commissions are included in net realized gain (loss) and change in net unrealized appreciation (depreciation) in the Statement of Operations. The commissions paid to these affiliated firms were as follows:
| | Amount |
| Fidelity International Growth Fund | $1,332 |
Interfund Lending Program. Pursuant to an Exemptive Order issued by the Securities and Exchange Commission (the SEC), the Fund, along with other registered investment companies having management contracts with Fidelity Management & Research Company LLC (FMR), or other affiliated entities of FMR, may participate in an interfund lending program. This program provides an alternative credit facility allowing the Fund to borrow from, or lend money to, other participating affiliated funds. At period end, there were no interfund loans outstanding. Activity in this program during the period for which loans were outstanding was as follows:
| | Borrower or Lender | Average Loan Balance | Weighted Average Interest Rate | Interest Expense |
| Fidelity International Growth Fund | Borrower | $ 10,479,050 | 4.07% | $23,665 |
Interfund Trades. Funds may purchase from or sell securities to other Fidelity Funds under procedures adopted by the Board. The procedures have been designed to ensure these interfund trades are executed in accordance with Rule 17a-7 of the 1940 Act. Any interfund trades are included within the respective purchases and sales amounts shown in the Purchases and Sales of Investments note. Interfund trades during the period are noted in the table below.
| | Purchases ($) | Sales ($) | Realized Gain (Loss) ($) |
| Fidelity International Growth Fund | 78,879,257 | 23,313,324 | (5,554,504) |
6. Committed Line of Credit.
Certain Funds participate with other funds managed by the investment adviser or an affiliate in a $4.25 billion credit facility (the "line of credit") to be utilized for temporary or emergency purposes to fund shareholder redemptions or for other short-term liquidity purposes. The participating funds have agreed to pay commitment fees on their pro-rata portion of the line of credit, which are reflected in Miscellaneous expenses on the Statement of Operations, and are listed below. During the period, there were no borrowings on this line of credit.
| | Amount |
| Fidelity International Growth Fund | $7,938 |
7. Security Lending.
Funds lend portfolio securities from time to time in order to earn additional income. Lending agents are used, including National Financial Services (NFS), an affiliate of the investment adviser. Pursuant to a securities lending agreement, NFS will receive a fee, which is capped at 9.9% of a fund's daily lending revenue, for its services as lending agent. A fund may lend securities to certain qualified borrowers, including NFS. On the settlement date of the loan, a fund receives collateral (in the form of U.S. Treasury obligations, letters of credit and/or cash) against the loaned securities and maintains collateral in an amount not less than 100% of the market value of the loaned securities during the period of the loan. The market value of the loaned securities is determined at the close of business of a fund and any additional required collateral is delivered to a fund on the next business day. A fund or borrower may terminate the loan at any time, and if the borrower defaults on its obligation to return the securities loaned because of insolvency or other reasons, a fund may apply collateral received from the borrower against the obligation. A fund may experience delays and costs in recovering the securities loaned. Any cash collateral received is invested in the Fidelity Securities Lending Cash Central Fund. Any loaned securities are identified as such in the Schedule of Investments, and the value of loaned securities and cash collateral at period end, as applicable, are presented in the Statement of Assets and Liabilities. Security lending income represents the income earned on investing cash collateral, less rebates paid to borrowers and any lending agent fees associated with the loan, plus any premium payments received for lending certain types of securities. Security lending income is presented in the Statement of Operations as a component of income from Fidelity Central Funds. Affiliated security lending activity, if any, was as follows:
| | Total Security Lending Fees Paid to NFS | Security Lending Income From Securities Loaned to NFS | Value of Securities Loaned to NFS at Period End |
| Fidelity International Growth Fund | $55,316 | $- | $- |
8. Expense Reductions.
Through arrangements with the Fund's custodian and each class' transfer agent, credits realized as a result of certain uninvested cash balances were used to reduce the Fund's expenses. During the period, custodian credits reduced the Fund's expenses by $379. During the period, transfer agent credits reduced each class' expenses as noted in the table below.
| | Expense reduction |
| Class M | $893 |
In addition, during the period the investment adviser or an affiliate reimbursed and/or waived a portion of fund-level operating expenses in the amount of $270,608.
9. Distributions to Shareholders.
Distributions to shareholders of each class were as follows:
| | Year ended October 31, 2023 | Year ended October 31, 2022 |
| Fidelity International Growth Fund | | |
| Distributions to shareholders | | |
| Class A | $ 2,422,202 | $3,874,293 |
| Class M | 405,995 | 584,059 |
| Class C | 523,121 | 921,429 |
| International Growth | 20,712,364 | 34,022,956 |
| Class I | 22,283,776 | 39,437,200 |
| Class Z | 16,703,137 | 26,243,748 |
Total | $63,050,595 | $105,083,685 |
10. Share Transactions.
Share transactions for each class were as follows and may contain in-kind transactions, automatic conversions between classes or exchanges between affiliated funds:
| | Shares | Shares | Dollars | Dollars |
| | Year ended October 31, 2023 | Year ended October 31, 2022 | Year ended October 31, 2023 | Year ended October 31, 2022 |
| Fidelity International Growth Fund | | | | |
| Class A | | | | |
| Shares sold | 1,715,103 | 1,571,011 | $29,331,847 | $27,633,662 |
| Reinvestment of distributions | 147,890 | 192,594 | 2,418,006 | 3,867,288 |
| Shares redeemed | (1,838,431) | (2,239,322) | (31,184,405) | (38,758,166) |
| Net increase (decrease) | 24,562 | (475,717) | $565,448 | $(7,257,216) |
| Class M | | | | |
| Shares sold | 132,875 | 182,229 | $2,258,104 | $3,218,457 |
| Reinvestment of distributions | 25,006 | 29,196 | 405,854 | 583,619 |
| Shares redeemed | (248,334) | (289,342) | (4,205,991) | (4,956,089) |
| Net increase (decrease) | (90,453) | (77,917) | $(1,542,033) | $(1,154,013) |
| Class C | | | | |
| Shares sold | 198,976 | 235,265 | $3,272,412 | $4,302,683 |
| Reinvestment of distributions | 33,238 | 47,271 | 522,168 | 919,894 |
| Shares redeemed | (810,575) | (828,106) | (13,278,845) | (13,580,412) |
| Net increase (decrease) | (578,361) | (545,570) | $(9,484,265) | $(8,357,835) |
| International Growth | | | | |
| Shares sold | 14,951,508 | 16,241,408 | $259,687,765 | $290,344,779 |
| Reinvestment of distributions | 1,147,426 | 1,547,748 | 18,921,062 | 31,326,431 |
| Shares redeemed | (17,451,945) | (21,846,639) | (300,038,938) | (372,519,642) |
| Net increase (decrease) | (1,353,011) | (4,057,483) | $(21,430,111) | $(50,848,432) |
| Class I | | | | |
| Shares sold | 26,254,085 | 27,427,945 | $452,275,393 | $483,250,347 |
| Reinvestment of distributions | 1,326,495 | 1,891,163 | 21,820,838 | 38,182,588 |
| Shares redeemed | (30,872,229) | (33,802,275) | (525,218,348) | (571,344,966) |
| Net increase (decrease) | (3,291,649) | (4,483,167) | $(51,122,117) | $(49,912,031) |
| Class Z | | | | |
| Shares sold | 46,420,503 | 45,989,188 | $799,082,627 | $767,374,148 |
| Reinvestment of distributions | 410,878 | 542,351 | 6,767,160 | 10,966,334 |
| Shares redeemed | (27,405,076) | (40,926,928) | (457,433,954) | (662,422,044) |
| Net increase (decrease) | 19,426,305 | 5,604,611 | $348,415,833 | $115,918,438 |
11. Other.
A fund's organizational documents provide former and current trustees and officers with a limited indemnification against liabilities arising in connection with the performance of their duties to the fund. In the normal course of business, a fund may also enter into contracts that provide general indemnifications. A fund's maximum exposure under these arrangements is unknown as this would be dependent on future claims that may be made against a fund. The risk of material loss from such claims is considered remote.
12. Risk and Uncertainties.
Many factors affect a fund's performance. Developments that disrupt global economies and financial markets, such as pandemics, epidemics, outbreaks of infectious diseases, war, terrorism, and environmental disasters, may significantly affect a fund's investment performance. The effects of these developments to a fund will be impacted by the types of securities in which a fund invests, the financial condition, industry, economic sector, and geographic location of an issuer, and a fund's level of investment in the securities of that issuer. Significant concentrations in security types, issuers, industries, sectors, and geographic locations may magnify the factors that affect a fund's performance.
To the Board of Trustees of Fidelity Investment Trust and Shareholders of Fidelity International Growth Fund
Opinion on the Financial Statements
We have audited the accompanying statement of assets and liabilities, including the schedule of investments, of Fidelity International Growth Fund (one of the funds constituting Fidelity Investment Trust, referred to hereafter as the "Fund") as of October 31, 2023, the related statement of operations for the year ended October 31, 2023, the statement of changes in net assets for each of the two years in the period ended October 31, 2023, including the related notes, and the financial highlights for each of the five years in the period ended October 31, 2023 (collectively referred to as the "financial statements"). In our opinion, the financial statements present fairly, in all material respects, the financial position of the Fund as of October 31, 2023, the results of its operations for the year then ended, the changes in its net assets for each of the two years in the period ended October 31, 2023 and the financial highlights for each of the five years in the period ended October 31, 2023 in conformity with accounting principles generally accepted in the United States of America.
Basis for Opinion
These financial statements are the responsibility of the Fund's management. Our responsibility is to express an opinion on the Fund's financial statements based on our audits. We are a public accounting firm registered with the Public Company Accounting Oversight Board (United States) (PCAOB) and are required to be independent with respect to the Fund in accordance with the U.S. federal securities laws and the applicable rules and regulations of the Securities and Exchange Commission and the PCAOB.
We conducted our audits of these financial statements in accordance with the standards of the PCAOB. Those standards require that we plan and perform the audit to obtain reasonable assurance about whether the financial statements are free of material misstatement, whether due to error or fraud.
Our audits included performing procedures to assess the risks of material misstatement of the financial statements, whether due to error or fraud, and performing procedures that respond to those risks. Such procedures included examining, on a test basis, evidence regarding the amounts and disclosures in the financial statements. Our audits also included evaluating the accounting principles used and significant estimates made by management, as well as evaluating the overall presentation of the financial statements. Our procedures included confirmation of securities owned as of October 31, 2023 by correspondence with the custodian, issuers of privately offered securities and brokers; when replies were not received from brokers, we performed other auditing procedures. We believe that our audits provide a reasonable basis for our opinion.
/s/ PricewaterhouseCoopers LLP
Boston, Massachusetts
December 14, 2023
We have served as the auditor of one or more investment companies in the Fidelity group of funds since 1932.
The Trustees, Members of the Advisory Board (if any), and officers of the trust and fund, as applicable, are listed below. The Board of Trustees governs the fund and is responsible for protecting the interests of shareholders. The Trustees are experienced executives who meet periodically throughout the year to oversee the fund's activities, review contractual arrangements with companies that provide services to the fund, oversee management of the risks associated with such activities and contractual arrangements, and review the fund's performance. Except for Jonathan Chiel, each of the Trustees oversees 322 funds. Mr. Chiel oversees 191 funds.
The Trustees hold office without limit in time except that (a) any Trustee may resign; (b) any Trustee may be removed by written instrument, signed by at least two-thirds of the number of Trustees prior to such removal; (c) any Trustee who requests to be retired or who has become incapacitated by illness or injury may be retired by written instrument signed by a majority of the other Trustees; and (d) any Trustee may be removed at any special meeting of shareholders by a two-thirds vote of the outstanding voting securities of the trust. Each Trustee who is not an interested person (as defined in the 1940 Act) of the trust and the fund is referred to herein as an Independent Trustee. Each Independent Trustee shall retire not later than the last day of the calendar year in which his or her 75th birthday occurs. The Independent Trustees may waive this mandatory retirement age policy with respect to individual Trustees. Officers and Advisory Board Members hold office without limit in time, except that any officer or Advisory Board Member may resign or may be removed by a vote of a majority of the Trustees at any regular meeting or any special meeting of the Trustees. Except as indicated, each individual has held the office shown or other offices in the same company for the past five years.
The fund's Statement of Additional Information (SAI) includes more information about the Trustees. To request a free copy, call Fidelity at 1-800-544-8544 if you're an individual investing directly with Fidelity, call 1-800-835-5092 if you're a plan sponsor or participant with Fidelity as your recordkeeper or call 1-877-208-0098 on institutional accounts or if you're an advisor or invest through one.
Experience, Skills, Attributes, and Qualifications of the Trustees. The Governance and Nominating Committee has adopted a statement of policy that describes the experience, qualifications, attributes, and skills that are necessary and desirable for potential Independent Trustee candidates (Statement of Policy). The Board believes that each Trustee satisfied at the time he or she was initially elected or appointed a Trustee, and continues to satisfy, the standards contemplated by the Statement of Policy. The Governance and Nominating Committee also engages professional search firms to help identify potential Independent Trustee candidates who have the experience, qualifications, attributes, and skills consistent with the Statement of Policy. From time to time, additional criteria based on the composition and skills of the current Independent Trustees, as well as experience or skills that may be appropriate in light of future changes to board composition, business conditions, and regulatory or other developments, have also been considered by the professional search firms and the Governance and Nominating Committee. In addition, the Board takes into account the Trustees' commitment and participation in Board and committee meetings, as well as their leadership of standing and ad hoc committees throughout their tenure.
In determining that a particular Trustee was and continues to be qualified to serve as a Trustee, the Board has considered a variety of criteria, none of which, in isolation, was controlling. The Board believes that, collectively, the Trustees have balanced and diverse experience, qualifications, attributes, and skills, which allow the Board to operate effectively in governing the fund and protecting the interests of shareholders. Information about the specific experience, skills, attributes, and qualifications of each Trustee, which in each case led to the Board's conclusion that the Trustee should serve (or continue to serve) as a trustee of the fund, is provided below.
Board Structure and Oversight Function. Robert A. Lawrence is an interested person and currently serves as Chair. The Trustees have determined that an interested Chair is appropriate and benefits shareholders because an interested Chair has a personal and professional stake in the quality and continuity of services provided to the fund. Independent Trustees exercise their informed business judgment to appoint an individual of their choosing to serve as Chair, regardless of whether the Trustee happens to be independent or a member of management. The Independent Trustees have determined that they can act independently and effectively without having an Independent Trustee serve as Chair and that a key structural component for assuring that they are in a position to do so is for the Independent Trustees to constitute a substantial majority for the Board. The Independent Trustees also regularly meet in executive session. David M. Thomas serves as Lead Independent Trustee and as such (i) acts as a liaison between the Independent Trustees and management with respect to matters important to the Independent Trustees and (ii) with management prepares agendas for Board meetings.
Fidelity® funds are overseen by different Boards of Trustees. The fund's Board oversees Fidelity's high income and certain equity funds, and other Boards oversee Fidelity's alternative investment, investment-grade bond, money market, asset allocation, and other equity funds. The asset allocation funds may invest in Fidelity® funds overseen by the fund's Board. The use of separate Boards, each with its own committee structure, allows the Trustees of each group of Fidelity® funds to focus on the unique issues of the funds they oversee, including common research, investment, and operational issues. On occasion, the separate Boards establish joint committees to address issues of overlapping consequences for the Fidelity® funds overseen by each Board.
The Trustees operate using a system of committees to facilitate the timely and efficient consideration of all matters of importance to the Trustees, the fund, and fund shareholders and to facilitate compliance with legal and regulatory requirements and oversight of the fund's activities and associated risks. The Board, acting through its committees, has charged FMR and its affiliates with (i) identifying events or circumstances the occurrence of which could have demonstrably adverse effects on the fund's business and/or reputation; (ii) implementing processes and controls to lessen the possibility that such events or circumstances occur or to mitigate the effects of such events or circumstances if they do occur; and (iii) creating and maintaining a system designed to evaluate continuously business and market conditions in order to facilitate the identification and implementation processes described in (i) and (ii) above. Because the day-to-day operations and activities of the fund are carried out by or through FMR, its affiliates, and other service providers, the fund's exposure to risks is mitigated but not eliminated by the processes overseen by the Trustees. While each of the Board's committees has responsibility for overseeing different aspects of the fund's activities, oversight is exercised primarily through the Operations, Audit, and Compliance Committees. Appropriate personnel, including but not limited to the fund's Chief Compliance Officer (CCO), FMR's internal auditor, the independent accountants, the fund's Treasurer and portfolio management personnel, make periodic reports to the Board's committees, as appropriate, including an annual review of Fidelity's risk management program for the Fidelity® funds. The responsibilities of each standing committee, including their oversight responsibilities, are described further under "Standing Committees of the Trustees."
Interested Trustees*:
Correspondence intended for a Trustee who is an interested person may be sent to Fidelity Investments, 245 Summer Street, Boston, Massachusetts 02210.
Name, Year of Birth; Principal Occupations and Other Relevant Experience+
Jonathan Chiel (1957)
Year of Election or Appointment: 2016
Trustee
Mr. Chiel also serves as Trustee of other Fidelity® funds. Mr. Chiel is General Counsel (2012-present) and Head of Legal, Risk and Compliance (2022-present). Mr Chiel serves as Executive Vice President and General Counsel for FMR LLC (diversified financial services company, 2012-present) and Director and President for OH Company LLC (holding company, 2018-present). Previously, Mr. Chiel served as general counsel (2004-2012) and senior vice president and deputy general counsel (2000-2004) for John Hancock Financial Services; a partner with Choate, Hall & Stewart (1996-2000) (law firm); and an Assistant United States Attorney for the United States Attorney's Office of the District of Massachusetts (1986-95), including Chief of the Criminal Division (1993-1995). Mr. Chiel is a director on the boards of the Boston Bar Foundation and the Maimonides School.
Bettina Doulton (1964)
Year of Election or Appointment: 2021
Trustee
Ms. Doulton also serves as Trustee of other Fidelity® funds. Prior to her retirement, Ms. Doulton served in a variety of positions at Fidelity Investments, including as a managing director of research (2006-2007), portfolio manager to certain Fidelity® funds (1993-2005), equity analyst and portfolio assistant (1990-1993), and research assistant (1987-1990). Ms. Doulton currently owns and operates Phi Builders + Architects and Cellardoor Winery. Previously, Ms. Doulton served as a member of the Board of Brown Capital Management, LLC (2014-2018).
Robert A. Lawrence (1952)
Year of Election or Appointment: 2020
Trustee
Chair of the Board of Trustees
Mr. Lawrence also serves as Trustee of other funds. Previously, Mr. Lawrence served as a Trustee and Member of the Advisory Board of certain funds. Prior to his retirement in 2008, Mr. Lawrence served as Vice President of certain Fidelity® funds (2006-2008), Senior Vice President, Head of High Income Division of Fidelity Management & Research Company (investment adviser firm, 2006-2008), and President of Fidelity Strategic Investments (investment adviser firm, 2002-2005).
* Determined to be an "Interested Trustee" by virtue of, among other things, his or her affiliation with the trust or various entities under common control with FMR.
+ The information includes the Trustee's principal occupation during the last five years and other information relating to the experience, attributes, and skills relevant to the Trustee's qualifications to serve as a Trustee, which led to the conclusion that the Trustee should serve as a Trustee for the fund.
Independent Trustees:
Correspondence intended for an Independent Trustee may be sent to Fidelity Investments, P.O. Box 55235, Boston, Massachusetts 02205-5235.
Name, Year of Birth; Principal Occupations and Other Relevant Experience+
Thomas P. Bostick (1956)
Year of Election or Appointment: 2021
Trustee
Lieutenant General Bostick also serves as Trustee of other Fidelity® funds. Prior to his retirement, General Bostick (United States Army, Retired) held a variety of positions within the U.S. Army, including Commanding General and Chief of Engineers, U.S. Army Corps of Engineers (2012-2016) and Deputy Chief of Staff and Director of Human Resources, U.S. Army (2009-2012). General Bostick currently serves as a member of the Board and Finance and Governance & Sustainability Committees of CSX Corporation (transportation, 2020-present) and a member of the Board and Corporate Governance and Nominating Committee of Perma-Fix Environmental Services, Inc. (nuclear waste management, 2020-present). General Bostick serves as Chief Executive Officer of Bostick Global Strategies, LLC (consulting, 2016-present), as a member of the Board of HireVue, Inc. (video interview and assessment, 2020-present), as a member of the Board of Allonnia (biotechnology and engineering solutions, 2022-present) and on the Advisory Board of Solugen, Inc. (specialty bio-based chemicals manufacturer, 2022-present). Previously, General Bostick served as a Member of the Advisory Board of certain Fidelity® funds (2021), President, Intrexon Bioengineering (2018-2020) and Chief Operating Officer (2017-2020) and Senior Vice President of the Environment Sector (2016-2017) of Intrexon Corporation (biopharmaceutical company).
Dennis J. Dirks (1948)
Year of Election or Appointment: 2005
Trustee
Mr. Dirks also serves as Trustee of other Fidelity® funds. Prior to his retirement in May 2003, Mr. Dirks served as Chief Operating Officer and as a member of the Board of The Depository Trust & Clearing Corporation (financial markets infrastructure), President, Chief Operating Officer and a member of the Board of The Depository Trust Company (DTC), President and a member of the Board of the National Securities Clearing Corporation (NSCC), Chief Executive Officer and a member of the Board of the Government Securities Clearing Corporation and Chief Executive Officer and a member of the Board of the Mortgage-Backed Securities Clearing Corporation. Mr. Dirks currently serves as a member of the Finance Committee (2016-present) and Board (2017-present) and is Treasurer (2018-present) of the Asolo Repertory Theatre.
Donald F. Donahue (1950)
Year of Election or Appointment: 2018
Trustee
Mr. Donahue also serves as Trustee of other Fidelity® funds. Mr. Donahue serves as President and Chief Executive Officer of Miranda Partners, LLC (risk consulting for the financial services industry, 2012-present). Previously, Mr. Donahue served as Chief Executive Officer (2006-2012), Chief Operating Officer (2003-2006) and Managing Director, Customer Marketing and Development (1999-2003) of The Depository Trust & Clearing Corporation (financial markets infrastructure). Mr. Donahue currently serves as a member (2007-present) and Co-Chairman (2016-present) of the Board of United Way of New York. Mr. Donahue previously served as a member of the Advisory Board of certain Fidelity® funds (2015-2018) and as a member of the Board of The Leadership Academy (previously NYC Leadership Academy) (2012-2022).
Vicki L. Fuller (1957)
Year of Election or Appointment: 2020
Trustee
Ms. Fuller also serves as Trustee of other Fidelity® funds. Previously, Ms. Fuller served as a member of the Advisory Board of certain Fidelity® funds (2018-2020), Chief Investment Officer of the New York State Common Retirement Fund (2012-2018) and held a variety of positions at AllianceBernstein L.P. (global asset management, 1985-2012), including Managing Director (2006-2012) and Senior Vice President and Senior Portfolio Manager (2001-2006). Ms. Fuller currently serves as a member of the Board, Audit Committee and Nominating and Governance Committee of two Blackstone business development companies (2020-present), as a member of the Board of Treliant, LLC (consulting, 2019-present), as a member of the Board of Ariel Alternatives, LLC (private equity, 2022-present) and as a member of the Board and Chair of the Audit Committee of Gusto, Inc. (software, 2021-present). In addition, Ms. Fuller currently serves as a member of the Board of Roosevelt University (2019-present) and as a member of the Executive Board of New York University's Stern School of Business. Ms. Fuller previously served as a member of the Board, Audit Committee and Nominating and Governance Committee of The Williams Companies, Inc. (natural gas infrastructure, 2018-2021).
Patricia L. Kampling (1959)
Year of Election or Appointment: 2020
Trustee
Ms. Kampling also serves as Trustee of other Fidelity® funds. Prior to her retirement, Ms. Kampling served as Chairman of the Board and Chief Executive Officer (2012-2019), President and Chief Operating Officer (2011-2012) and Executive Vice President and Chief Financial Officer (2010-2011) of Alliant Energy Corporation. Ms. Kampling currently serves as a member of the Board, Finance Committee and Governance, Compensation and Nominating Committee of Xcel Energy Inc. (utilities company, 2020-present) and as a member of the Board, Audit, Finance and Risk Committee and Safety, Environmental, Technology and Operations Committee and Chair of the Executive Development and Compensation Committee of American Water Works Company, Inc. (utilities company, 2019-present). In addition, Ms. Kampling currently serves as a member of the Board of the Nature Conservancy, Wisconsin Chapter (2019-present). Previously, Ms. Kampling served as a Member of the Advisory Board of certain Fidelity® funds (2020), a member of the Board, Compensation Committee and Executive Committee and Chair of the Audit Committee of Briggs & Stratton Corporation (manufacturing, 2011-2021), a member of the Board of Interstate Power and Light Company (2012-2019) and Wisconsin Power and Light Company (2012-2019) (each a subsidiary of Alliant Energy Corporation) and as a member of the Board and Workforce Development Committee of the Business Roundtable (2018-2019).
Thomas A. Kennedy (1955)
Year of Election or Appointment: 2021
Trustee
Mr. Kennedy also serves as Trustee of other Fidelity® funds. Previously, Mr. Kennedy served as a Member of the Advisory Board of certain Fidelity® funds (2020) and held a variety of positions at Raytheon Company (aerospace and defense, 1983-2020), including Chairman and Chief Executive Officer (2014-2020) and Executive Vice President and Chief Operating Officer (2013-2014). Mr. Kennedy served as Executive Chairman of the Board of Directors of Raytheon Technologies Corporation (aerospace and defense, 2020-2021). Mr. Kennedy serves as a Director of the Board of Directors of Textron Inc. (aerospace and defense, 2023-present).
Oscar Munoz (1959)
Year of Election or Appointment: 2021
Trustee
Mr. Munoz also serves as Trustee of other Fidelity® funds. Prior to his retirement, Mr. Munoz served as Executive Chairman (2020-2021), Chief Executive Officer (2015-2020), President (2015-2016) and a member of the Board (2010-2021) of United Airlines Holdings, Inc. Mr. Munoz currently serves as a member of the Board of CBRE Group, Inc. (commercial real estate, 2020-present), a member of the Board of Univision Communications, Inc. (Hispanic media, 2020-present), a member of the Board of Archer Aviation Inc. (2021-present), a member of the Defense Business Board of the United States Department of Defense (2021-present) and a member of the Board of Salesforce.com, Inc. (cloud-based software, 2022-present). Previously, Mr. Munoz served as a Member of the Advisory Board of certain Fidelity® funds (2021).
David M. Thomas (1949)
Year of Election or Appointment: 2008
Trustee
Lead Independent Trustee
Mr. Thomas also serves as Trustee of other Fidelity® funds. Previously, Mr. Thomas served as Executive Chairman (2005-2006) and Chairman and Chief Executive Officer (2000-2005) of IMS Health, Inc. (pharmaceutical and healthcare information solutions). Mr. Thomas currently serves as a member of the Board of Fortune Brands Home and Security (home and security products, 2004-present) and as Director (2013-present) and Non-Executive Chairman of the Board (2022-present) of Interpublic Group of Companies, Inc. (marketing communication).
Susan Tomasky (1953)
Year of Election or Appointment: 2020
Trustee
Ms. Tomasky also serves as Trustee of other Fidelity® funds. Prior to her retirement, Ms. Tomasky served in various executive officer positions at American Electric Power Company, Inc. (1998-2011), including most recently as President of AEP Transmission (2007-2011). Ms. Tomasky currently serves as a member of the Board and Sustainability Committee and as Chair of the Audit Committee of Marathon Petroleum Corporation (2018-present) and as a member of the Board, Executive Committee, Corporate Governance Committee and Organization and Compensation Committee and as Lead Director of the Board of Public Service Enterprise Group, Inc. (utilities company, 2012-present) and as a member of the Board of its subsidiary company, Public Service Electric and Gas Co. (2021-present). In addition, Ms. Tomasky currently serves as a member (2009-present) and President (2020-present) of the Board of the Royal Shakespeare Company - America (2009-present), as a member of the Board of the Columbus Association for the Performing Arts (2011-present) and as a member of the Board and Kenyon in the World Committee of Kenyon College (2016-present). Previously, Ms. Tomasky served as a Member of the Advisory Board of certain Fidelity® funds (2020), as a member of the Board of the Columbus Regional Airport Authority (2007-2020), as a member of the Board (2011-2018) and Lead Independent Director (2015-2018) of Andeavor Corporation (previously Tesoro Corporation) (independent oil refiner and marketer) and as a member of the Board of Summit Midstream Partners LP (energy, 2012-2018).
Michael E. Wiley (1950)
Year of Election or Appointment: 2020
Trustee
Mr. Wiley also serves as Trustee of other Fidelity® funds. Previously, Mr. Wiley served as a member of the Advisory Board of certain Fidelity® funds (2018-2020), Chairman, President and CEO of Baker Hughes, Inc. (oilfield services, 2000-2004). Mr. Wiley also previously served as a member of the Board of Andeavor Corporation (independent oil refiner and marketer, 2005-2018), a member of the Board of Andeavor Logistics LP (natural resources logistics, 2015-2018) and a member of the Board of High Point Resources (exploration and production, 2005-2020).
+ The information includes the Trustee's principal occupation during the last five years and other information relating to the experience, attributes, and skills relevant to the Trustee's qualifications to serve as a Trustee, which led to the conclusion that the Trustee should serve as a Trustee for the fund.
Advisory Board Members and Officers:
Correspondence intended for a Member of the Advisory Board (if any) may be sent to Fidelity Investments, P.O. Box 55235, Boston, Massachusetts 02205-5235. Correspondence intended for an officer or Peter S. Lynch may be sent to Fidelity Investments, 245 Summer Street, Boston, Massachusetts 02210.
Name, Year of Birth; Principal Occupation
Vijay C. Advani (1960)
Year of Election or Appointment: 2023
Member of the Advisory Board
Mr. Advani also serves as Trustee or Member of the Advisory Board of other funds. Previously, Mr. Advani served as Executive Chairman (2020-2022), Chief Executive Officer (2017-2020) and Chief Operating Officer (2016-2017) of Nuveen (global investment manager). He also served in various capacities at Franklin Resources (global investment manager), including Co-President (2015-2016), Executive Vice President, Global Advisory Services (2008-2015), Head of Global Retail Distribution (2005-2008), Executive Managing Director, International Retail Development (2002-2005), Managing Director, Product Developments, Sales & Marketing, Asia, Eastern Europe and Africa (2000-2002) and President, Templeton Asset Management India (1995-2000). Mr. Advani also served as Senior Investment Officer of International Finance Corporation (private equity and venture capital arm of The World Bank, 1984-1995). Mr. Advani is Chairman Emeritus of the U.S. India Business Council (2018-present), a Director of The Global Impact Investing Network (2019-present), a Director of LOK Capital (Mauritius) (2022-present), a member of the Advisory Council of LOK Capital (2022-present), a Senior Advisor of Neuberger Berman (2021-present), a Senior Advisor of Seviora Holdings Pte. Ltd (Temasek-Singapore) (2021-present), a Director of Seviora Capital (Singapore) (2021-present) and an Advisor of EQUIAM (2021-present). Mr. Advani formerly served as a member of the Board of BowX Acquisition Corp. (special purpose acquisition company, 2020-2021), a member of the Board of Intellecap (advisory arm of The Aavishkaar Group, 2018-2020), a member of the Board of Nuveen Investments, Inc. (2017-2020) and a member of the Board of Docusign (software, 2016-2019).
Peter S. Lynch (1944)
Year of Election or Appointment: 2003
Member of the Advisory Board
Mr. Lynch also serves as a Member of the Advisory Board of other Fidelity® funds. Mr. Lynch is Vice Chairman and a Director of Fidelity Management & Research Company LLC (investment adviser firm). In addition, Mr. Lynch serves as a Trustee of Boston College and as the Chairman of the Inner-City Scholarship Fund. Previously, Mr. Lynch served as Vice Chairman and a Director of FMR Co., Inc. (investment adviser firm) and on the Special Olympics International Board of Directors (1997-2006).
Karen B. Peetz (1955)
Year of Election or Appointment: 2023
Member of the Advisory Board
Ms. Peetz also serves as a Member of the Advisory Board of other funds. Previously, Ms. Peetz served as Chief Administration Officer (2020-2023) of Citigroup Inc. (a diversified financial service company). She also served in various capacities at Bank of New York Mellon Corporation, including President (2013-2016), Vice Chairman, Senior Executive Vice President and Chief Executive Officer of Financial Markets & Treasury Services (2010-2013), Senior Executive Vice President and Chief Executive Officer of Global Corporate Trust (2003-2008), Senior Vice President and Division Manager of Global Payments & Trade Services (2002-2003) and Senior Vice President and Division Manager of Domestic Corporate Trust (1998-2002). Ms. Peetz also served in various capacities at Chase Manhattan Corporation (1982-1998), including Senior Vice President and Manager of Corporate Trust International Business (1996-1998), Managing Director and Manager of Corporate Trust Services (1994-1996) and Managing Director and Group Manager of Financial Institution Sales (1990-1993). Ms. Peetz currently serves as Chair of Amherst Holdings Advisory Council (2018-present), Trustee of Johns Hopkins University (2016-present), Chair of the Carey Business School Advisory Council, Member of the Johns Hopkins Medicine Board and Finance Committee and Chair of the Lyme and Tick Related Disease Institute Advisory Council. Ms. Peetz previously served as a member of the Board of Guardian Life Insurance Company of America (2019-2023), a member of the Board of Trane Technologies (2018-2022), a member of the Board of Wells Fargo Corp. (2017-2019), a member of the Board of SunCoke Energy Inc. (2012-2016), a member of the Board of Private Export Funding Corporation (2010-2016) and as a Trustee of Penn State University (2010-2014) and the United Way of New York City (2008-2010).
Heather Bonner (1977)
Year of Election or Appointment: 2023
Assistant Treasurer
Ms. Bonner also serves as an officer of other funds. Ms. Bonner is a Senior Vice President (2022-present) and is an employee of Fidelity Investments (2022-present). Ms. Bonner serves as Vice President, Treasurer, or Assistant Treasurer of certain Fidelity entities. Prior to joining Fidelity, Ms. Bonner served as Managing Director at AQR Capital Management (2013-2022) and was the Treasurer and Principal Financial Officer of the AQR Funds (2013-2022).
Craig S. Brown (1977)
Year of Election or Appointment: 2022
Deputy Treasurer
Mr. Brown also serves as an officer of other funds. Mr. Brown is a Vice President (2015-present) and is an employee of Fidelity Investments. Mr. Brown serves as Assistant Treasurer of FIMM, LLC (2021-present). Previously, Mr. Brown served as Assistant Treasurer of certain Fidelity® funds (2019-2022).
John J. Burke III (1964)
Year of Election or Appointment: 2018
Chief Financial Officer
Mr. Burke also serves as Chief Financial Officer of other funds. Mr. Burke is Head of Fidelity Fund and Investment Operations (2018-present) and is an employee of Fidelity Investments. Mr. Burke serves as President, Executive Vice President, or Director of certain Fidelity entities. Previously Mr. Burke served as head of Asset Management Investment Operations (2012-2018).
Margaret Carey (1973)
Year of Election or Appointment: 2023
Secretary and Chief Legal Officer (CLO)
Ms. Carey also serves as an officer of other funds and as CLO of certain Fidelity entities. Ms. Carey is a Senior Vice President, Deputy General Counsel (2019-present) and is an employee of Fidelity Investments.
William C. Coffey (1969)
Year of Election or Appointment: 2019
Assistant Secretary
Mr. Coffey also serves as Assistant Secretary of other funds. Mr. Coffey is a Senior Vice President, Deputy General Counsel (2010-present) and is an employee of Fidelity Investments. Previously, Mr. Coffey served as Secretary and CLO of certain funds (2018-2019); CLO, Secretary, or Senior Vice President of certain Fidelity entities and Assistant Secretary of certain funds (2009-2018).
Timothy M. Cohen (1969)
Year of Election or Appointment: 2018
Vice President
Mr. Cohen also serves as Vice President of other funds. Mr. Cohen is Co-Head of Equity (2018-present) and is an employee of Fidelity Investments. Mr. Cohen serves a Director of Fidelity Management & Research (Japan) Limited (investment adviser firm, 2016-present). Previously, Mr. Cohen served as Executive Vice President of Fidelity SelectCo, LLC (2019) and Head of Global Equity Research (2016-2018).
Jonathan Davis (1968)
Year of Election or Appointment: 2010
Assistant Treasurer
Mr. Davis also serves as an officer of other funds. Mr. Davis is a Vice President (2006-present) and is an employee of Fidelity Investments. Mr. Davis serves as Assistant Treasurer of certain Fidelity entities.
Laura M. Del Prato (1964)
Year of Election or Appointment: 2018
Assistant Treasurer
Ms. Del Prato also serves as an officer of other funds. Ms. Del Prato is a Senior Vice President (2017-present) and is an employee of Fidelity Investments. Ms. Del Prato serves as Vice President or Assistant Treasurer of certain Fidelity entities. Previously, Ms. Del Prato served as President and Treasurer of The North Carolina Capital Management Trust: Cash Portfolio and Term Portfolio (2018-2020).
Colm A. Hogan (1973)
Year of Election or Appointment: 2020
Assistant Treasurer
Mr. Hogan also serves as an officer of other funds. Mr. Hogan is a Vice President (2016-present) and is an employee of Fidelity Investments. Mr. Hogan serves as Assistant Treasurer of certain Fidelity entities. Previously, Mr. Hogan served as Deputy Treasurer of certain Fidelity® funds (2016-2020) and Assistant Treasurer of certain Fidelity® funds (2016-2018).
Pamela R. Holding (1964)
Year of Election or Appointment: 2018
Vice President
Ms. Holding also serves as Vice President of other funds. Ms. Holding is Co-Head of Equity (2018-present) and is an employee of Fidelity Investments. Previously, Ms. Holding served as Executive Vice President of Fidelity SelectCo, LLC (2019) and as Chief Investment Officer of Fidelity Institutional Asset Management (2013-2018).
Chris Maher (1972)
Year of Election or Appointment: 2020
Deputy Treasurer
Mr. Maher also serves as an officer of other funds. Mr. Maher is a Vice President (2008-present) and is an employee of Fidelity Investments. Mr. Maher serves as Assistant Treasurer of certain Fidelity entities. Previously, Mr. Maher served as Assistant Treasurer of certain funds (2013-2020).
Jason P. Pogorelec (1975)
Year of Election or Appointment: 2020
Chief Compliance Officer
Mr. Pogorelec also serves as Chief Compliance Officer of other funds. Mr. Pogorelec is a Senior Vice President of Asset Management Compliance (2020-present) and is an employee of Fidelity Investments. Mr. Pogorelec serves as Compliance Officer of Fidelity Management & Research Company LLC (investment adviser firm, 2023-present) and Ballyrock Investment Advisors LLC (2023-present). Previously, Mr. Pogorelec served as a Vice President, Associate General Counsel for Fidelity Investments (2010-2020) and Assistant Secretary of certain Fidelity® funds (2015-2020).
Brett Segaloff (1972)
Year of Election or Appointment: 2021
Anti-Money Laundering (AML) Officer
Mr. Segaloff also serves as AML Officer of other funds. Mr. Segaloff is a Vice President (2022-present) and is an employee of Fidelity Investments. Mr. Segaloff serves as Anti Money Laundering Compliance Officer or Anti Money Laundering/Bank Secrecy Act Compliance Officer of certain Fidelity entities.
Stacie M. Smith (1974)
Year of Election or Appointment: 2016
President and Treasurer
Ms. Smith also serves as an officer of other funds. Ms. Smith is a Senior Vice President (2016-present) and is an employee of Fidelity Investments. Ms. Smith serves as Assistant Treasurer of certain Fidelity entities and has served in other fund officer roles.
Jim Wegmann (1979)
Year of Election or Appointment: 2019
Assistant Treasurer
Mr. Wegmann also serves as an officer of other funds. Mr. Wegmann is a Vice President (2016-present) and is an employee of Fidelity Investments. Mr. Wegmann serves as Assistant Treasurer of FIMM, LLC (2021-present). Previously, Mr. Wegmann served as Assistant Treasurer of certain Fidelity® funds (2019-2021).
As a shareholder, you incur two types of costs: (1) transaction costs, which may include sales charges (loads) on purchase payments or redemption proceeds, as applicable and (2) ongoing costs, which generally include management fees, distribution and/or service (12b-1) fees and other Fund expenses. This Example is intended to help you understand your ongoing costs (in dollars) of investing in a fund and to compare these costs with the ongoing costs of investing in other mutual funds.
| The Example is based on an investment of $1,000 invested at the beginning of the period and held for the entire period (May 1, 2023 to October 31, 2023). |
Actual Expenses
The first line of the accompanying table provides information about actual account values and actual expenses. You may use the information in this line, together with the amount you invested, to estimate the expenses that you paid over the period. Simply divide your account value by $1,000.00 (for example, an $8,600 account value divided by $1,000.00 = 8.6), then multiply the result by the number in the first line for a class/Fund under the heading entitled "Expenses Paid During Period" to estimate the expenses you paid on your account during this period. If any fund is a shareholder of any underlying mutual funds or exchange-traded funds (ETFs) (the Underlying Funds), such fund indirectly bears its proportional share of the expenses of the Underlying Funds in addition to the direct expenses incurred presented in the table. These fees and expenses are not included in the annualized expense ratio used to calculate the expense estimate in the table below.
Hypothetical Example for Comparison Purposes
The second line of the accompanying table provides information about hypothetical account values and hypothetical expenses based on the actual expense ratio and an assumed rate of return of 5% per year before expenses, which is not the actual return. The hypothetical account values and expenses may not be used to estimate the actual ending account balance or expenses you paid for the period. You may use this information to compare the ongoing costs of investing in the Fund and other funds. To do so, compare this 5% hypothetical example with the 5% hypothetical examples that appear in the shareholder reports of the other funds. If any fund is a shareholder of any Underlying Funds, such fund indirectly bears its proportional share of the expenses of the Underlying Funds in addition to the direct expenses as presented in the table. These fees and expenses are not included in the annualized expense ratio used to calculate the expense estimate in the table below.
Please note that the expenses shown in the table are meant to highlight your ongoing costs only and do not reflect any transaction costs. Therefore, the second line of the table is useful in comparing ongoing costs only, and will not help you determine the relative total costs of owning different funds. In addition, if these transactional costs were included, your costs would have been higher.
| | | | | Annualized Expense Ratio- A | | Beginning Account Value May 1, 2023 | | Ending Account Value October 31, 2023 | | Expenses Paid During Period- C May 1, 2023 to October 31, 2023 |
| Fidelity® International Growth Fund | | | | | | | | | | |
| Class A | | | | 1.19% | | | | | | |
| Actual | | | | | | $ 1,000 | | $ 915.70 | | $ 5.75 |
Hypothetical-B | | | | | | $ 1,000 | | $ 1,019.21 | | $ 6.06 |
| Class M | | | | 1.46% | | | | | | |
| Actual | | | | | | $ 1,000 | | $ 914.50 | | $ 7.05 |
Hypothetical-B | | | | | | $ 1,000 | | $ 1,017.85 | | $ 7.43 |
| Class C | | | | 1.95% | | | | | | |
| Actual | | | | | | $ 1,000 | | $ 912.10 | | $ 9.40 |
Hypothetical-B | | | | | | $ 1,000 | | $ 1,015.38 | | $ 9.91 |
| Fidelity® International Growth Fund | | | | .91% | | | | | | |
| Actual | | | | | | $ 1,000 | | $ 917.10 | | $ 4.40 |
Hypothetical-B | | | | | | $ 1,000 | | $ 1,020.62 | | $ 4.63 |
| Class I | | | | .92% | | | | | | |
| Actual | | | | | | $ 1,000 | | $ 916.90 | | $ 4.45 |
Hypothetical-B | | | | | | $ 1,000 | | $ 1,020.57 | | $ 4.69 |
| Class Z | | | | .78% | | | | | | |
| Actual | | | | | | $ 1,000 | | $ 917.60 | | $ 3.77 |
Hypothetical-B | | | | | | $ 1,000 | | $ 1,021.27 | | $ 3.97 |
| |
A Annualized expense ratio reflects expenses net of applicable fee waivers.
B 5% return per year before expenses
C Expenses are equal to the annualized expense ratio, multiplied by the average account value over the period, multiplied by 184/ 365 (to reflect the one-half year period). The fees and expenses of any Underlying Funds are not included in each annualized expense ratio.
The dividend and capital gains distributions for the fund(s) are available on Fidelity.com or Institutional.Fidelity.com.
The fund designates $102,362 of distributions paid during the fiscal year ended 2023 as qualifying to be taxed as section 163(j) interest dividends.
International Growth designates 58%, Class I designates 61%, and Class Z designates 42% of the dividend distributed during the fiscal year as qualifying for the dividends-received deduction for corporate shareholders.
International Growth, Class name I, and Class Z designate 100% of the dividend distributed during the fiscal year as amounts which may be taken into account as a dividend for purposes of the maximum rate under section 1(h)(11) of the Internal Revenue Code.
The amounts per share which represent income derived from sources within, and taxes paid to, foreign countries or possessions of the United States are as follows:
| | Pay Date | Income | Taxes |
| Fidelity International Growth Fund | | | |
| Class A | 12/12/2022 | $0.0000 | $0.0000 |
| Class M | 12/12/2022 | $0.0000 | $0.0000 |
| Class C | 12/12/2022 | $0.0000 | $0.0000 |
| International Growth | 12/12/2022 | $0.0573 | $0.0223 |
| Class I | 12/12/2022 | $0.0543 | $0.0223 |
| Class Z | 12/12/2022 | $0.0803 | $0.0223 |
The fund will notify shareholders in January 2024 of amounts for use in preparing 2023 income tax returns.
Board Approval of Investment Advisory Contracts and Management Fees
Fidelity International Growth Fund
Each year, the Board of Trustees, including the Independent Trustees (together, the Board), considers the renewal of the fund's management contract with Fidelity Management & Research Company LLC (FMR) and the sub-advisory agreements (together, the Advisory Contracts) for the fund. FMR and the sub-advisers are referred to herein as the Investment Advisers. The Board, assisted by the advice of fund counsel and Independent Trustees' counsel, requests and considers a broad range of information relevant to the renewal of the Advisory Contracts throughout the year.
The Board meets regularly and, at each of its meetings, covers an extensive agenda of topics and materials and considers factors that are relevant to its annual consideration of the renewal of the fund's Advisory Contracts, including the services and support provided to the fund and its shareholders. The Board, acting directly and through its Committees (each of which is composed of and chaired by Independent Trustees), requests and receives information concerning the annual consideration of the renewal of the fund's Advisory Contracts. The Board also meets as needed to review matters specifically related to the Board's annual consideration of the renewal of the Advisory Contracts. Members of the Board may also meet with trustees of other Fidelity funds through joint ad hoc committees to discuss certain matters relevant to all of the Fidelity funds.
Approval of Stub Period Continuation. At its May 2023 meeting, the Board of Trustees voted to continue the fund's management contract with FMR, and the sub-advisory agreements and sub-sub-advisory agreements, in each case, where applicable (together, the Advisory Contracts), without modification, for two months from June 1, 2023 through July 31, 2023. The Board considered that the approval of the fund's Advisory Contracts will not result in any changes in (i) the investment process or strategies employed in the management of the fund's assets; (ii) the fees and expenses paid by shareholders; (iii) the nature, extent or quality of services provided under the fund's Advisory Contracts; or (iv) the day-to-day management of the fund or the persons primarily responsible for such management. The Board also considered that since its last approval of the fund's Advisory Contracts, FMR had provided additional information on the fund in support of the annual contract renewal process, including competitive analyses on total expenses and management fees and in-depth reviews of fund performance and fund profitability information. The Board concluded that the fund's Advisory Contracts are fair and reasonable, and that the fund's Advisory Contracts should be renewed, without modification, through July 31, 2023, with the understanding that the Board would consider the annual renewal for a full one year period in July 2023.
At its July 2023 meeting, the Board unanimously determined to renew the fund's Advisory Contracts. In reaching its determination, the Board considered all factors it believed relevant, including (i) the nature, extent, and quality of the services provided to the fund and its shareholders (including the investment performance of the fund); (ii) the competitiveness relative to peer funds of the fund's management fee and the total expense ratio of a representative class (the retail class, which was selected because it was the largest class without 12b-1 fees); (iii) the total costs of the services provided by and the profits realized by FMR and its affiliates (Fidelity) from its relationships with the fund; and (iv) the extent to which, if any, economies of scale exist and are realized as the fund grows, and whether any economies of scale are appropriately shared with fund shareholders. The Board also considered the broad range of investment choices available to shareholders from FMR's competitors and that the fund's shareholders have chosen to invest in the fund, which is part of the Fidelity family of funds. The Board's decision to renew the Advisory Contracts was not based on any single factor.
The Board reached a determination, with the assistance of fund counsel and Independent Trustees' counsel and through the exercise of its business judgment, that the renewal of the Advisory Contracts was in the best interests of the fund and its shareholders and that the compensation payable under the Advisory Contracts was fair and reasonable in light of all of the surrounding circumstances.
Nature, Extent, and Quality of Services Provided. The Board considered staffing as it relates to the fund, including the backgrounds and experience of investment personnel of the Investment Advisers, and also considered the Investment Advisers' implementation of the fund's investment program. The Independent Trustees also had discussions with senior management of Fidelity's investment operations and investment groups. The Board considered the structure of the investment personnel compensation program and whether this structure provides appropriate incentives to act in the best interests of the fund. Additionally, the Board considered the portfolio managers' investments, if any, in the funds that they manage.
Resources Dedicated to Investment Management and Support Services. The Board and the Fund Oversight and Research Committees reviewed the general qualifications and capabilities of Fidelity's investment staff, including its size, education, experience, and resources, as well as Fidelity's approach to recruiting, training, managing, and compensating investment personnel. The Board noted the resources devoted to expansion of Fidelity's global investment organization, and that Fidelity's analysts have extensive resources, tools, and capabilities that allow them to conduct sophisticated quantitative and fundamental analysis, as well as credit analysis of issuers, counterparties, and guarantors. Further, the Board considered that Fidelity's investment professionals have sufficient access to global information and data so as to provide competitive investment results over time, and that those professionals also have access to sophisticated tools that permit them to assess portfolio construction and risk and performance attribution characteristics continuously, as well as to transmit new information and research conclusions rapidly around the world. Additionally, in its deliberations, the Board considered Fidelity's trading, risk management, compliance, and technology and operations capabilities and resources, which are integral parts of the investment management process.
Shareholder and Administrative Services. The Board considered (i) the nature, extent, quality, and cost of advisory, administrative, and shareholder services performed by the Investment Advisers and their affiliates under the Advisory Contracts and under separate agreements covering transfer agency, pricing and bookkeeping, and securities lending services for the fund; (ii) the nature and extent of Fidelity's supervision of third party service providers, principally custodians, subcustodians, and pricing vendors; and (iii) the resources devoted by Fidelity to, and the record of compliance with, the fund's compliance policies and procedures. The Board also reviewed the allocation of fund brokerage, including allocations to brokers affiliated with the Investment Advisers, the use of brokerage commissions to pay fund expenses, and the use of "soft" commission dollars to pay for research services. The Board also considered the fund's securities lending activities and any payments made to Fidelity relating to securities lending.
The Board noted that the growth of fund assets over time across the complex allows Fidelity to reinvest in the development of services designed to enhance the value and convenience of the Fidelity funds as investment vehicles. These services include 24-hour access to account information and market information over the Internet and through telephone representatives, investor education materials, and asset allocation tools. The Board also considered that it reviews customer service metrics such as telephone response times, continuity of services on the website and metrics addressing services at Fidelity Investor Centers.
Investment in a Large Fund Family. The Board considered the benefits to shareholders of investing in a fund that is part of a large family of funds offering a variety of investment disciplines and providing a large variety of fund investor services. The Board noted that Fidelity had taken, or had made recommendations that resulted in the Fidelity funds taking, a number of actions over the previous year that benefited particular funds and/or the Fidelity funds in general.
Investment Performance. The Board took into account discussions that occur with representatives of the Investment Advisers, and reports that it receives, at Board meetings throughout the year, relating to fund investment performance. In this regard the Board noted that as part of regularly scheduled fund reviews and other reports to the Board on fund performance, the Board considered annualized return information for the fund for different time periods, measured against an appropriate securities market index (benchmark index) and an appropriate peer group of funds with similar objectives (peer group). The Board also considered information about performance attribution. In its ongoing evaluation of fund investment performance, the Board gives particular attention to information indicating changes in performance of the funds over different time periods and discussed with the Investment Advisers the reasons for any overperformance or underperformance.
In addition to reviewing absolute and relative fund performance, the Independent Trustees periodically consider the appropriateness of fund performance metrics in evaluating the results achieved. The Independent Trustees generally give greater weight to fund performance over longer time periods than over shorter time periods. Depending on the circumstances, the Independent Trustees may be satisfied with a fund's performance notwithstanding that it lags its benchmark index or peer group for certain periods.
Based on its review, the Board concluded that the nature, extent, and quality of services provided to the fund under the Advisory Contracts should continue to benefit the shareholders of the fund.
Competitiveness of Management Fee and Total Expense Ratio. The Board was provided with information regarding industry trends in management fees and expenses. In its review of the fund's management fee and the total expense ratio of the retail class, the Board considered the fund's management fee rate as well as other fund or class expenses, as applicable, such as transfer agent fees, pricing and bookkeeping fees, fund-paid 12b-1 fees, and custodial, legal, and audit fees. The Board noted that Fidelity may agree to waive fees or reimburse expenses from time to time, and the extent to which, if any, it has done so for the fund. The Board also considered information about the impact of the fund's performance adjustment.
Comparisons of Management Fees and Total Expense Ratios. Among other things, the Board reviewed data for selected groups of competitive funds and classes (referred to as "mapped groups") that were compiled by Fidelity based on combining similar investment objective categories (as classified by Lipper) that have comparable investment mandates. The data reviewed by the Board included (i) gross management fee comparisons (before taking into account expense reimbursements or caps and without taking into account the fund's performance adjustment) relative to the total universe of funds within the mapped group; (ii) gross management fee comparisons relative to a subset of non-Fidelity funds in the mapped group that are similar in size and management fee structure to the fund (referred to as the "asset size peer group"); (iii) total expense comparisons of the retail class of the fund relative to funds and classes in the mapped group that have a similar sales load structure to the retail class of the fund (referred to as the "similar sales load structure group"); and (iv) total expense comparisons of the retail class of the fund relative to funds and classes in the similar sales load structure group that are similar in size and management fee structure to the fund (referred to as the "total expense asset size peer group"). The total expense asset size peer group comparison excludes performance adjustments and fund-paid 12b-1 fees to eliminate variability in fee structures.
The information provided to the Board indicated that the fund's management fee rate ranked below the competitive median of the mapped group for the 12-month period ended September 30, 2022 and below the competitive median of the asset size peer group for the 12-month period ended September 30, 2022. Further, the information provided to the Board indicated that the total expense ratio of the retail class of the fund ranked below the competitive median of the similar sales load structure group for the 12-month period ended September 30, 2022 and below the competitive median of the total expense asset size peer group for the 12-month period ended September 30, 2022.
The Board also considered that, for funds subject to the group fee, FMR agreed to voluntarily waive fees over a specified period of time in amounts designed to account for assets converted from certain funds to certain collective investment trusts.
The Board also considered that the fund's management fee is subject to upward or downward adjustment depending upon whether, and to what extent, the fund's investment performance for the performance period (a rolling 36-month period) exceeds, or is exceeded by, a securities index, thus leading to a performance adjustment for the same period. The Board noted that the performance adjustment provides FMR with a strong economic incentive to seek to achieve superior long-term performance for the fund's shareholders and helps to more closely align the interests of FMR and the shareholders of the fund.
In connection with its consideration of the fund's performance adjustment, the Board noted that the performance of the retail class is used for purposes of determining the performance adjustment. The Board noted that to the extent the performance adjustment was based on the performance of a share class with higher total annual operating expenses, the fund would be subject to a smaller positive and larger negative performance adjustment. The Board considered the appropriateness of the use of the retail class as the basis for the performance adjustment. The Board noted that the retail class is typically the largest class (reflecting the actual investment experience for the plurality of shareholders), employs a standard expense structure, and does not include fund-paid 12b-1 fees, which Fidelity believes makes it a more appropriate measurement of Fidelity's investment skill.
Fees Charged to Other Fidelity Clients. The Board also considered Fidelity fee structures and other information with respect to clients of Fidelity, such as other funds advised or subadvised by Fidelity, pension plan clients, and other institutional clients with similar mandates. The Board noted that a joint ad hoc committee created by it and the boards of other Fidelity funds periodically reviews and compares Fidelity's institutional investment advisory business with its business of providing services to the Fidelity funds and also noted the most recent findings of the committee. The Board noted that the committee's review included a consideration of the differences in services provided, fees charged, and costs incurred, as well as competition in the markets serving the different categories of clients.
Based on its review, the Board concluded that the fund's management fee, including the use of the retail class as the basis for the performance adjustment, is fair and reasonable in light of the services that the fund receives and the other factors considered. Further, based on its review of total expense ratios and fees charged to other Fidelity clients, the Board concluded that the total expense ratio of each class of the fund was reasonable in light of the services that the fund and its shareholders receive and the other factors considered.
Costs of the Services and Profitability. The Board considered the revenues earned and the expenses incurred by Fidelity in conducting the business of developing, marketing, distributing, managing, administering and servicing the fund and servicing the fund's shareholders. The Board also considered the level of Fidelity's profits in respect of all the Fidelity funds.
On an annual basis, Fidelity presents to the Board information about the profitability of its relationships with the fund. Fidelity calculates profitability information for each fund, as well as aggregate profitability information for groups of Fidelity funds and all Fidelity funds, using a series of detailed revenue and cost allocation methodologies which originate with the books and records of Fidelity on which Fidelity's audited financial statements are based. The Audit Committee of the Board reviews any significant changes from the prior year's methodologies and the full Board approves such changes.
A public accounting firm has been engaged annually by the Board as part of the Board's assessment of Fidelity's profitability analysis. The engagement includes the review and assessment of the methodologies used by Fidelity in determining the revenues and expenses attributable to Fidelity's fund business, and completion of agreed-upon procedures in respect of the mathematical accuracy of certain fund profitability information and its conformity to established allocation methodologies. After considering the reports issued under the engagement and information provided by Fidelity, the Board concluded that while other allocation methods may also be reasonable, Fidelity's profitability methodologies are reasonable in all material respects.
The Board also reviewed Fidelity's non-fund businesses and potential indirect benefits such businesses may have received as a result of their association with Fidelity's fund business (i.e., fall-out benefits) as well as cases where Fidelity's affiliates may benefit from the funds' business. The Board considered areas where potential indirect benefits to the Fidelity funds from their relationships with Fidelity may exist. The Board's consideration of these matters was informed by the findings of a joint ad hoc committee created by it and the boards of other Fidelity funds to evaluate potential fall-out benefits.
The Board considered the costs of the services provided by and the profits realized by Fidelity in connection with the operation of the fund and was satisfied that the profitability was not excessive.
Economies of Scale. The Board considered whether there have been economies of scale in respect of the management of the Fidelity funds, whether the Fidelity funds (including the fund) have appropriately benefited from any such economies of scale, and whether there is potential for realization of any further economies of scale. The Board considered the extent to which the fund will benefit from economies of scale as assets grow through increased services to the fund, through waivers or reimbursements, or through fee or expense ratio reductions. The Board also noted that a committee (the Economies of Scale Committee) created by it and the boards of other Fidelity funds periodically analyzes whether Fidelity attains economies of scale in respect of the management and servicing of the Fidelity funds, whether the Fidelity funds have appropriately benefited from such economies of scale, and whether there is potential for realization of any further economies of scale.
The Board recognized that the fund's management contract incorporates a "group fee" structure, which provides for lower group fee rates as total "group assets" increase, and for higher group fee rates as total "group assets" decrease ("group assets" as defined in the management contract). FMR calculates the group fee rates based on a tiered asset "breakpoint" schedule that varies based on asset class. The Board considered that the group fee is designed to deliver the benefits of economies of scale to fund shareholders when total Fidelity fund assets increase, even if assets of any particular fund are unchanged or have declined, because some portion of Fidelity's costs are attributable to services provided to all Fidelity funds, and all funds benefit if those costs can be allocated among more assets. The Board further considered that Fidelity agreed to impose a temporary fee waiver in the form of additional breakpoints to the current breakpoint schedule. The Board concluded that, given the group fee structure, fund shareholders will benefit from lower management fees as "group assets" increase at the fund complex level, regardless of whether Fidelity achieves any such economies of scale.
The Board concluded, taking into account the analysis of the Economies of Scale Committee, that economies of scale, if any, are being appropriately shared between fund shareholders and Fidelity.
Additional Information Requested by the Board. In order to develop fully the factual basis for consideration of the Fidelity funds' advisory contracts, the Board requested and received additional information on certain topics, including: (i) fund flow and performance trends, in particular the underperformance of certain funds and strategies, and Fidelity's long-term strategies for certain funds, including any consideration of fund liquidations or mergers; (ii) the operation of performance fees and competitor use of performance fees; (iii) Fidelity's pricing philosophy compared to competitors; (iv) fund profitability methodology and data; (v) evaluation of competitive fund data and peer group classifications and fee and expense comparisons; (vi) the management fee and expense structures for different funds and classes and information about the differences between various fee and expense structures; (vii) group fee breakpoints and related voluntary fee waivers; and (viii) information regarding other accounts managed by Fidelity and the funds' sub-advisory arrangements.
Conclusion. Based on its evaluation of all of the conclusions noted above, and after considering all factors it believed relevant, the Board, including the Independent Trustees, concluded that the advisory and sub-advisory fee arrangements are fair and reasonable in light of all of the surrounding circumstances and that the fund's Advisory Contracts should be renewed through July 31, 2024.
1.912350.113
IGF-ANN-1223
Fidelity® Series Emerging Markets Fund
Fidelity® Series Emerging Markets Opportunities Fund
Fidelity® Series International Growth Fund
Fidelity® Series International Small Cap Fund
Fidelity® Series International Value Fund
Annual Report
October 31, 2023
Contents
To view a fund's proxy voting guidelines and proxy voting record for the 12-month period ended June 30, visit http://www.fidelity.com/proxyvotingresults or visit the Securities and Exchange Commission's (SEC) web site at http://www.sec.gov.
You may also call 1-800-544-8544 to request a free copy of the proxy voting guidelines.
Standard & Poor's, S&P and S&P 500 are registered service marks of The McGraw-Hill Companies, Inc. and have been licensed for use by Fidelity Distributors Corporation.
Other third-party marks appearing herein are the property of their respective owners.
All other marks appearing herein are registered or unregistered trademarks or service marks of FMR LLC or an affiliated company. © 2023 FMR LLC. All rights reserved.
This report and the financial statements contained herein are submitted for the general information of the shareholders of the Funds. This report is not authorized for distribution to prospective investors in the Funds unless preceded or accompanied by an effective prospectus.
A fund files its complete schedule of portfolio holdings with the SEC for the first and third quarters of each fiscal year on Form N-PORT. Forms N-PORT are available on the SEC's web site at http://www.sec.gov. A fund's Forms N-PORT may be reviewed and copied at the SEC's Public Reference Room in Washington, DC. Information regarding the operation of the SEC's Public Reference Room may be obtained by calling 1-800-SEC-0330.
For a complete list of a fund's portfolio holdings, view the most recent holdings listing, semiannual report, or annual report on Fidelity's web site at http://www.fidelity.com, http://www.institutional.fidelity.com, or http://www.401k.com, as applicable.
NOT FDIC INSURED •MAY LOSE VALUE •NO BANK GUARANTEE
Neither the Funds nor Fidelity Distributors Corporation is a bank.
Average annual total return reflects the change in the value of an investment, assuming reinvestment of distributions from dividend income and capital gains (the profits earned upon the sale of securities that have grown in value, if any) and assuming a constant rate of performance each year. The hypothetical investment and the average annual total returns do not reflect the deduction of taxes that a shareholder would pay on fund distributions or the redemption of fund shares. During periods of reimbursement by Fidelity, a fund's total return will be greater than it would be had the reimbursement not occurred. How a fund did yesterday is no guarantee of how it will do tomorrow.
| Average Annual Total Returns |
| | | | |
Periods ended October 31, 2023 | Past 1 year | Past 5 years | Life of Fund A |
| Fidelity® Series Emerging Markets Fund | 14.04% | -0.77% | -3.02% |
A From August 29, 2018
| $10,000 Over Life of Fund |
| |
Let's say hypothetically that $10,000 was invested in Fidelity® Series Emerging Markets Fund, on August 29, 2018, when the fund started. The chart shows how the value of your investment would have changed, and also shows how the MSCI Emerging Markets Index performed over the same period. |
|
|
Fidelity® Series Emerging Markets Fund
Market Recap:
International (non-U.S.) equities gained 12.27% for the 12 months ending October 31, 2023, according to the MSCI ACWI (All Country World Index) ex USA Index, as global economic expansion and a slowing in the pace of inflation in some markets provided a favorable backdrop for risk assets. After returning -15.86% in 2022, the index's upturn has been largely driven by a narrow set of companies in the information technology and communication services sectors, in part due to excitement for generative artificial intelligence applications. The index gained 14.07% year to date through July, including strong gains in both June (+4.50%) and July (+4.07%). The rally for international equities sputtered for the next three months (-11.33%) amid a stalling pattern in disinflationary trends, heightened global recession and geopolitical risks, soaring yields on longer-term U.S. government bonds and particularly weak economic conditions in the eurozone and China. The three-month decline left non-U.S. stocks up 1.15% year to date through October. Currency fluctuation also helped bolster non-U.S. equity performance overall. For the full 12 months, nearly all regions advanced, with Europe ex U.K. (+18%) and Japan (+17%) leading, whereas Canada (-0.38%) lagged by the widest margin. Each of the 11 sectors advanced, with information technology (+21%) and consumer discretionary (+19%) leading the way. Energy and industrials each rose about 14%. Conversely, four defensive-oriented sectors lagged by the widest margin: real estate (+4%), health care (+6%), consumer staples (+7%) and utilities (+8%).
Comments from Portfolio Manager John Chow:
For the fiscal year ending October 31, 2023, the fund gained 14.04%, versus 10.84% for the benchmark MSCI Emerging Markets (Net MA) Index. From a regional standpoint, security selection in emerging Asia, especially South Korea and India, contributed to the fund's performance versus the benchmark. By sector, the biggest relative contributor was security selection in consumer staples, especially within the food, beverage & tobacco industry. Investment choices in industrials and consumer discretionary also boosted relative performance. The top individual relative contributor was an overweight in PDD Holdings (+81%), one of the portfolio's largest holdings at period end, having increased our position the past 12 months. A second notable relative contributor was our stake in POSCO (+189%), though the stock was no longer held at period end. An overweight in Trip.com (+51%), another of the portfolio's more sizable holdings, further contributed. In contrast, on a regional basis, security selection in emerging Europe, the Middle East & Africa - South Africa, in particular - detracted from the fund's relative result, as did an underweight in emerging Asia, namely Taiwan. By sector, stock selection in financials pressured performance, especially banks. Subpar investment choices in energy also hampered the fund's result. Positioning in the technology hardware & equipment segment of the information technology sector hurt as well. The largest individual relative detractor was untimely positioning in Alibaba (+28%), one of the portfolio's biggest holdings. A non-benchmark stake in Lukoil returned about -33% and was the second-largest relative detractor. An overweight in Impala Platinum Holdings (-58%) also weighed on relative performance the past 12 months. Notable changes in positioning include decreased exposure to Indonesia and a higher allocation to equity markets in Taiwan. By sector, meaningful shifts include increased exposure to the industrials sector and a lower allocation to materials stocks.
The views expressed above reflect those of the portfolio manager(s) only through the end of the period as stated on the cover of this report and do not necessarily represent the views of Fidelity or any other person in the Fidelity organization. Any such views are subject to change at any time based upon market or other conditions and Fidelity disclaims any responsibility to update such views. These views may not be relied on as investment advice and, because investment decisions for a Fidelity fund are based on numerous factors, may not be relied on as an indication of trading intent on behalf of any Fidelity fund.
Fidelity® Series Emerging Markets Fund
Top Holdings (% of Fund's net assets) |
| |
| Taiwan Semiconductor Manufacturing Co. Ltd. (Taiwan, Semiconductors & Semiconductor Equipment) | 7.7 | |
| Samsung Electronics Co. Ltd. (Korea (South), Technology Hardware, Storage & Peripherals) | 5.5 | |
| Tencent Holdings Ltd. (China, Interactive Media & Services) | 4.4 | |
| Alibaba Group Holding Ltd. (China, Broadline Retail) | 3.9 | |
| PDD Holdings, Inc. ADR (China, Broadline Retail) | 2.4 | |
| HDFC Bank Ltd. (India, Banks) | 2.0 | |
| Meituan Class B (China, Hotels, Restaurants & Leisure) | 1.7 | |
| New Oriental Education & Technology Group, Inc. sponsored ADR (China, Diversified Consumer Services) | 1.6 | |
| ICICI Bank Ltd. (India, Banks) | 1.6 | |
| Trip.com Group Ltd. ADR (China, Hotels, Restaurants & Leisure) | 1.4 | |
| | 32.2 | |
| |
| Market Sectors (% of Fund's net assets) |
| |
| Information Technology | 21.1 | |
| Financials | 20.1 | |
| Consumer Discretionary | 16.2 | |
| Communication Services | 9.5 | |
| Industrials | 5.5 | |
| Consumer Staples | 5.2 | |
| Materials | 4.1 | |
| Health Care | 4.1 | |
| Energy | 3.6 | |
| Utilities | 1.5 | |
| Real Estate | 0.7 | |
| |
Asset Allocation (% of Fund's net assets) |
|
Futures - 4.6% |
|
Geographic Diversification (% of Fund's net assets) |
|
* Includes Short-Term investments and Net Other Assets (Liabilities). Percentages are adjusted for the effect of derivatives, if applicable. |
| |
Fidelity® Series Emerging Markets Fund
Showing Percentage of Net Assets
| Common Stocks - 90.1% |
| | | Shares | Value ($) |
| Brazil - 3.8% | | | |
| Banco BTG Pactual SA unit | | 8,715,773 | 51,170,106 |
| Banco do Brasil SA | | 3,061,931 | 29,363,686 |
| Hapvida Participacoes e Investimentos SA (a)(b) | | 50,640,905 | 37,063,508 |
| Localiza Rent a Car SA | | 1,880,360 | 18,972,363 |
| Localiza Rent a Car SA rights 11/10/23 (a) | | 13,068 | 18,144 |
| Raia Drogasil SA | | 5,967,499 | 30,537,308 |
| Vale SA | | 1,454,479 | 19,905,598 |
TOTAL BRAZIL | | | 187,030,713 |
| China - 31.6% | | | |
| Advanced Micro-Fabrication Equipment, Inc., China (A Shares) | | 1,283,100 | 30,059,742 |
| Airtac International Group | | 1,511,700 | 49,662,782 |
| Alibaba Group Holding Ltd. (a) | | 16,367,262 | 168,502,257 |
| Alibaba Group Holding Ltd. sponsored ADR (a) | | 270,100 | 22,294,054 |
| Anta Sports Products Ltd. | | 982,129 | 11,107,379 |
| Baidu, Inc. sponsored ADR (a) | | 114,588 | 12,031,740 |
| BeiGene Ltd. ADR (a) | | 34,045 | 6,341,903 |
| BYD Co. Ltd. (H Shares) | | 1,173,681 | 35,691,791 |
| China Construction Bank Corp. (H Shares) | | 70,918,005 | 40,108,252 |
| China Life Insurance Co. Ltd. (H Shares) | | 35,141,937 | 47,596,199 |
| ENN Energy Holdings Ltd. | | 1,331,163 | 10,083,755 |
| Flat Glass Group Co. Ltd. (c) | | 8,379,811 | 15,049,133 |
| Haier Smart Home Co. Ltd. | | 7,797,449 | 22,240,891 |
| Industrial & Commercial Bank of China Ltd. (H Shares) | | 53,735,270 | 25,752,347 |
| Innovent Biologics, Inc. (a)(b) | | 3,842,000 | 22,641,535 |
| JD.com, Inc. sponsored ADR | | 964,694 | 24,522,521 |
| Kweichow Moutai Co. Ltd. (A Shares) | | 177,302 | 40,842,266 |
| Li Auto, Inc. ADR (a) | | 727,052 | 24,581,628 |
| Li Ning Co. Ltd. | | 1,713,147 | 5,249,774 |
| Maxscend Microelectronics Co. Ltd. (A Shares) | | 440,800 | 9,096,073 |
| Meituan Class B (a)(b) | | 5,723,775 | 81,134,592 |
| NetEase, Inc. ADR (c) | | 553,758 | 59,207,805 |
| New Oriental Education & Technology Group, Inc. sponsored ADR (a) | | 1,227,837 | 80,411,045 |
| PDD Holdings, Inc. ADR (a) | | 1,143,907 | 116,015,048 |
| PetroChina Co. Ltd. (H Shares) | | 57,944,677 | 37,821,398 |
| Ping An Insurance Group Co. of China Ltd. (H Shares) | | 7,310,418 | 37,081,925 |
| Sany Heavy Industry Co. Ltd. (A Shares) | | 5,802,200 | 11,474,807 |
| Shenzhen Mindray Bio-Medical Electronics Co. Ltd. (A Shares) (a) | | 1,492,619 | 58,351,593 |
| Shenzhou International Group Holdings Ltd. | | 1,141,059 | 11,208,021 |
| Sinotruk Hong Kong Ltd. | | 29,035,192 | 54,687,875 |
| Tencent Holdings Ltd. | | 5,813,181 | 215,138,598 |
| Trip.com Group Ltd. ADR (a) | | 2,035,312 | 69,200,608 |
| Will Semiconductor Ltd. | | 343,700 | 5,186,672 |
| Wuliangye Yibin Co. Ltd. (A Shares) | | 679,168 | 14,480,607 |
| WuXi AppTec Co. Ltd. (H Shares) (b) | | 1,370,900 | 16,473,483 |
| Wuxi Biologics (Cayman), Inc. (a)(b) | | 3,547,033 | 22,054,536 |
| Zijin Mining Group Co. Ltd. (H Shares) | | 22,362,192 | 34,592,341 |
TOTAL CHINA | | | 1,547,976,976 |
| Greece - 0.2% | | | |
| OPAP SA | | 668,600 | 11,319,131 |
| Hungary - 0.5% | | | |
| Richter Gedeon PLC | | 969,648 | 22,735,569 |
| India - 14.7% | | | |
| Axis Bank Ltd. | | 3,331,731 | 39,302,122 |
| Bharti Airtel Ltd. | | 3,176,835 | 34,879,591 |
| HDFC Bank Ltd. | | 5,450,488 | 96,687,654 |
| HDFC Standard Life Insurance Co. Ltd. (b) | | 6,386,817 | 47,431,468 |
| Hindustan Aeronautics Ltd. | | 1,429,324 | 31,271,105 |
| Hindustan Unilever Ltd. | | 585,909 | 17,480,313 |
| ICICI Bank Ltd. | | 7,018,595 | 77,194,249 |
| Infosys Ltd. | | 1,923,151 | 31,618,295 |
| ITC Ltd. | | 5,796,274 | 29,827,688 |
| Larsen & Toubro Ltd. | | 1,842,786 | 64,830,034 |
| Mankind Pharma Ltd. | | 634,711 | 13,293,489 |
| NTPC Ltd. | | 22,874,387 | 64,787,371 |
| Reliance Industries Ltd. | | 2,136,797 | 58,739,731 |
| SRF Ltd. | | 1,090,925 | 28,757,753 |
| Tata Consultancy Services Ltd. | | 345,573 | 13,985,880 |
| Tata Steel Ltd. | | 8,361,034 | 11,927,540 |
| Ultratech Cement Ltd. | | 565,867 | 57,251,012 |
TOTAL INDIA | | | 719,265,295 |
| Indonesia - 2.1% | | | |
| PT Bank Central Asia Tbk | | 62,638,009 | 34,508,573 |
| PT Bank Mandiri (Persero) Tbk | | 52,704,070 | 18,828,641 |
| PT Bank Negara Indonesia (Persero) Tbk | | 40,281,508 | 12,156,419 |
| PT Bank Rakyat Indonesia (Persero) Tbk | | 97,777,894 | 30,573,573 |
| PT Telkom Indonesia Persero Tbk | | 38,783,448 | 8,501,945 |
TOTAL INDONESIA | | | 104,569,151 |
| Korea (South) - 12.4% | | | |
| AMOREPACIFIC Corp. | | 142,360 | 13,342,969 |
| Hansol Chemical Co. Ltd. | | 62,048 | 6,914,012 |
| Hyundai Mipo Dockyard Co. Ltd. (a) | | 217,406 | 11,186,853 |
| Hyundai Motor Co. Ltd. | | 420,463 | 52,893,153 |
| JYP Entertainment Corp. | | 330,941 | 25,153,801 |
| KB Financial Group, Inc. | | 1,015,678 | 38,658,494 |
| Kia Corp. | | 604,672 | 34,494,577 |
| Korea Aerospace Industries Ltd. | | 666,965 | 21,913,760 |
| LG Chemical Ltd. | | 22,689 | 7,425,119 |
| LG Innotek Co. Ltd. | | 54,814 | 9,084,129 |
| NAVER Corp. | | 342,260 | 47,778,104 |
| Samsung Electronics Co. Ltd. | | 5,432,711 | 270,011,673 |
| SK Hynix, Inc. | | 788,459 | 68,369,954 |
TOTAL KOREA (SOUTH) | | | 607,226,598 |
| Mexico - 3.9% | | | |
| America Movil S.A.B. de CV Series L | | 14,108,753 | 11,652,301 |
| CEMEX S.A.B. de CV sponsored ADR (a) | | 1,701,116 | 10,155,663 |
| Corporacion Inmobiliaria Vesta S.A.B. de CV ADR | | 862,878 | 27,128,884 |
| Fomento Economico Mexicano S.A.B. de CV sponsored ADR | | 278,469 | 31,581,169 |
| Gruma S.A.B. de CV Series B | | 2,271,443 | 39,526,308 |
| Grupo Financiero Banorte S.A.B. de CV Series O | | 6,755,914 | 54,829,737 |
| Wal-Mart de Mexico SA de CV Series V | | 4,022,800 | 14,398,540 |
TOTAL MEXICO | | | 189,272,602 |
| Peru - 0.3% | | | |
| Credicorp Ltd. (United States) | | 117,597 | 14,694,921 |
| Philippines - 0.1% | | | |
| Ayala Land, Inc. | | 14,767,100 | 7,248,926 |
| Russia - 0.1% | | | |
| LUKOIL PJSC (d) | | 568,462 | 175,994 |
| Sberbank of Russia (d) | | 5,098,115 | 31,353 |
| Yandex NV Series A (a)(d) | | 273,678 | 2,983,090 |
TOTAL RUSSIA | | | 3,190,437 |
| Saudi Arabia - 2.9% | | | |
| Al Rajhi Bank | | 2,250,962 | 40,260,036 |
| Alinma Bank | | 3,943,308 | 34,581,201 |
| Saudi Arabian Oil Co. (b) | | 1,371,194 | 12,171,010 |
| Saudi Telecom Co. | | 1,365,897 | 13,980,820 |
| The Saudi National Bank | | 4,750,441 | 42,482,486 |
TOTAL SAUDI ARABIA | | | 143,475,553 |
| South Africa - 2.5% | | | |
| Absa Group Ltd. | | 2,477,970 | 22,591,907 |
| Bid Corp. Ltd. | | 925,627 | 19,636,950 |
| Capitec Bank Holdings Ltd. (c) | | 173,418 | 15,398,402 |
| FirstRand Ltd. | | 2,667,973 | 8,795,185 |
| Impala Platinum Holdings Ltd. | | 996,347 | 4,150,375 |
| MTN Group Ltd. | | 1,026,257 | 5,009,731 |
| Naspers Ltd. Class N | | 175,109 | 27,334,668 |
| Standard Bank Group Ltd. | | 2,030,300 | 19,923,357 |
TOTAL SOUTH AFRICA | | | 122,840,575 |
| Taiwan - 13.8% | | | |
| Alchip Technologies Ltd. | | 645,654 | 52,913,419 |
| Chailease Holding Co. Ltd. | | 8,374,599 | 45,393,443 |
| E Ink Holdings, Inc. | | 1,468,716 | 7,636,028 |
| eMemory Technology, Inc. | | 595,605 | 37,286,776 |
| Formosa Plastics Corp. | | 4,114,674 | 9,777,869 |
| HIWIN Technologies Corp. | | 2,873,296 | 17,399,173 |
| International Games Systems Co. Ltd. | | 1,329,365 | 25,603,676 |
| King Yuan Electronics Co. Ltd. | | 10,566,137 | 25,014,027 |
| MediaTek, Inc. | | 907,695 | 23,672,015 |
| Realtek Semiconductor Corp. | | 809,803 | 10,084,699 |
| Taiwan Semiconductor Manufacturing Co. Ltd. | | 23,140,292 | 377,648,176 |
| Unimicron Technology Corp. | | 2,542,150 | 11,329,040 |
| Yageo Corp. | | 2,086,967 | 33,998,755 |
TOTAL TAIWAN | | | 677,757,096 |
| Thailand - 1.0% | | | |
| Bangkok Bank PCL (For. Reg.) | | 4,401,402 | 19,180,667 |
| PTT Exploration and Production PCL (For. Reg.) | | 3,884,318 | 17,640,860 |
| SCB X PCL (For. Reg.) | | 3,943,959 | 10,753,506 |
TOTAL THAILAND | | | 47,575,033 |
| United Arab Emirates - 0.2% | | | |
| Adnoc Gas PLC | | 13,713,574 | 11,984,909 |
| TOTAL COMMON STOCKS (Cost $4,370,890,491) | | | 4,418,163,485 |
| | | | |
| Nonconvertible Preferred Stocks - 1.6% |
| | | Shares | Value ($) |
| Brazil - 1.6% | | | |
| Banco Bradesco SA (PN) | | 2,893,103 | 8,027,869 |
| Gerdau SA | | 2,800,933 | 12,094,275 |
| Itau Unibanco Holding SA | | 3,606,085 | 19,182,863 |
| Petroleo Brasileiro SA - Petrobras sponsored ADR | | 2,633,002 | 39,495,030 |
| | | | |
| TOTAL NONCONVERTIBLE PREFERRED STOCKS (Cost $69,061,242) | | | 78,800,037 |
| | | | |
| Government Obligations - 0.2% |
| | | Principal Amount (e) | Value ($) |
| United States of America - 0.2% | | | |
U.S. Treasury Bills, yield at date of purchase 5.34% to 5.4% 11/2/23 to 12/28/23 (f) (Cost $8,490,264) | | 8,540,000 | 8,490,269 |
| | | | |
| Money Market Funds - 7.4% |
| | | Shares | Value ($) |
| Fidelity Cash Central Fund 5.40% (g) | | 314,965,743 | 315,028,737 |
| Fidelity Securities Lending Cash Central Fund 5.40% (g)(h) | | 48,132,844 | 48,137,657 |
| TOTAL MONEY MARKET FUNDS (Cost $363,166,394) | | | 363,166,394 |
| | | | |
| TOTAL INVESTMENT IN SECURITIES - 99.3% (Cost $4,811,608,391) | 4,868,620,185 |
NET OTHER ASSETS (LIABILITIES) - 0.7% | 36,237,826 |
| NET ASSETS - 100.0% | 4,904,858,011 |
| | |
| Futures Contracts |
| | Number of contracts | Expiration Date | Notional Amount ($) | Value ($) | Unrealized Appreciation/ (Depreciation) ($) |
| Purchased | | | | | |
| | | | | | |
| Equity Index Contracts | | | | | |
| ICE MSCI Emerging Markets Index Contracts (United States) | 4,865 | Dec 2023 | 223,595,400 | (3,742,873) | (3,742,873) |
| | | | | | |
| The notional amount of futures purchased as a percentage of Net Assets is 4.6% |
For the period, the average monthly notional amount at value for futures contracts in the aggregate was $90,455,319.
Legend
| (b) | Security exempt from registration under Rule 144A of the Securities Act of 1933. These securities may be resold in transactions exempt from registration, normally to qualified institutional buyers. At the end of the period, the value of these securities amounted to $238,970,132 or 4.9% of net assets. |
| (c) | Security or a portion of the security is on loan at period end. |
| (e) | Amount is stated in United States dollars unless otherwise noted. |
| (f) | Security or a portion of the security was pledged to cover margin requirements for futures contracts. At period end, the value of securities pledged amounted to $3,939,578. |
| (g) | Affiliated fund that is generally available only to investment companies and other accounts managed by Fidelity Investments. The rate quoted is the annualized seven-day yield of the fund at period end. A complete unaudited listing of the fund's holdings as of its most recent quarter end is available upon request. In addition, each Fidelity Central Fund's financial statements, which are not covered by the Fund's Report of Independent Registered Public Accounting Firm, are available on the SEC's website or upon request. |
| (h) | Investment made with cash collateral received from securities on loan. |
Affiliated Central Funds
Fiscal year to date information regarding the Fund's investments in Fidelity Central Funds, including the ownership percentage, is presented below.
| Affiliate | Value, beginning of period ($) | Purchases ($) | Sales Proceeds ($) | Dividend Income ($) | Realized Gain (loss) ($) | Change in Unrealized appreciation (depreciation) ($) | Value, end of period ($) | % ownership, end of period |
| Fidelity Cash Central Fund 5.40% | 175,911,032 | 2,617,975,624 | 2,478,857,919 | 11,722,077 | - | - | 315,028,737 | 0.7% |
| Fidelity Securities Lending Cash Central Fund 5.40% | 9,725,325 | 454,894,110 | 416,481,778 | 306,094 | - | - | 48,137,657 | 0.2% |
| Total | 185,636,357 | 3,072,869,734 | 2,895,339,697 | 12,028,171 | - | - | 363,166,394 | |
| | | | | | | | | |
Amounts in the dividend income column in the above table include any capital gain distributions from underlying funds, which are presented in the corresponding line item in the Statement of Operations, if applicable.
Amounts in the dividend income column for Fidelity Securities Lending Cash Central Fund represents the income earned on investing cash collateral, less rebates paid to borrowers and any lending agent fees associated with the loan, plus any premium payments received for lending certain types of securities.
Amounts included in the purchases and sales proceeds columns may include in-kind transactions, if applicable.
Investment Valuation
The following is a summary of the inputs used, as of October 31, 2023, involving the Fund's assets and liabilities carried at fair value. The inputs or methodology used for valuing securities may not be an indication of the risk associated with investing in those securities. For more information on valuation inputs, and their aggregation into the levels used below, please refer to the Investment Valuation section in the accompanying Notes to Financial Statements.
| Valuation Inputs at Reporting Date: |
| Description | Total ($) | Level 1 ($) | Level 2 ($) | Level 3 ($) |
Investments in Securities: | | | | |
|
| Equities: | | | | |
Communication Services | 461,921,202 | 101,882,397 | 357,055,715 | 2,983,090 |
Consumer Discretionary | 798,201,138 | 375,678,703 | 422,522,435 | - |
Consumer Staples | 251,654,118 | 135,680,275 | 115,973,843 | - |
Energy | 178,028,932 | 63,650,949 | 114,201,989 | 175,994 |
Financials | 982,540,641 | 361,301,756 | 621,207,532 | 31,353 |
Health Care | 198,955,616 | 66,140,980 | 132,814,636 | - |
Industrials | 281,416,896 | 18,990,507 | 262,426,389 | - |
Information Technology | 1,032,044,486 | - | 1,032,044,486 | - |
Materials | 202,951,557 | 42,155,536 | 160,796,021 | - |
Real Estate | 34,377,810 | 27,128,884 | 7,248,926 | - |
Utilities | 74,871,126 | - | 74,871,126 | - |
|
| Government Obligations | 8,490,269 | - | 8,490,269 | - |
|
| Money Market Funds | 363,166,394 | 363,166,394 | - | - |
| Total Investments in Securities: | 4,868,620,185 | 1,555,776,381 | 3,309,653,367 | 3,190,437 |
Derivative Instruments: Liabilities | | | | |
Futures Contracts | (3,742,873) | (3,742,873) | - | - |
| Total Liabilities | (3,742,873) | (3,742,873) | - | - |
| Total Derivative Instruments: | (3,742,873) | (3,742,873) | - | - |
Value of Derivative Instruments
The following table is a summary of the Fund's value of derivative instruments by primary risk exposure as of October 31, 2023. For additional information on derivative instruments, please refer to the Derivative Instruments section in the accompanying Notes to Financial Statements.
Primary Risk Exposure / Derivative Type | Value |
| Asset ($) | Liability ($) |
| Equity Risk | | |
Futures Contracts (a) | 0 | (3,742,873) |
| Total Equity Risk | 0 | (3,742,873) |
| Total Value of Derivatives | 0 | (3,742,873) |
(a)Reflects gross cumulative appreciation (depreciation) on futures contracts as presented in the Schedule of Investments. In the Statement of Assets and Liabilities, the period end daily variation margin is included in receivable or payable for daily variation margin on futures contracts, and the net cumulative appreciation (depreciation) is included in Total accumulated earnings (loss).
Fidelity® Series Emerging Markets Fund
| Statement of Assets and Liabilities |
| | | | October 31, 2023 |
| | | | | |
| Assets | | | | |
| Investment in securities, at value (including securities loaned of $46,147,237) - See accompanying schedule: | | | | |
Unaffiliated issuers (cost $4,448,441,997) | $ | 4,505,453,791 | | |
Fidelity Central Funds (cost $363,166,394) | | 363,166,394 | | |
| | | | | |
| | | | | |
| Total Investment in Securities (cost $4,811,608,391) | | | $ | 4,868,620,185 |
| Foreign currency held at value (cost $130,793) | | | | 114,643 |
| Receivable for investments sold | | | | 40,869,754 |
| Receivable for fund shares sold | | | | 112,459,012 |
| Dividends receivable | | | | 5,011,562 |
| Distributions receivable from Fidelity Central Funds | | | | 1,545,492 |
| Receivable from investment adviser for expense reductions | | | | 62,895 |
| Other receivables | | | | 1,292,952 |
Total assets | | | | 5,029,976,495 |
| Liabilities | | | | |
| Payable for investments purchased | $ | 40,333,136 | | |
| Payable for fund shares redeemed | | 28,547,057 | | |
| Payable for daily variation margin on futures contracts | | 829,181 | | |
| Deferred taxes | | 6,591,794 | | |
| Other payables and accrued expenses | | 679,659 | | |
| Collateral on securities loaned | | 48,137,657 | | |
| Total Liabilities | | | | 125,118,484 |
| Net Assets | | | $ | 4,904,858,011 |
| Net Assets consist of: | | | | |
| Paid in capital | | | $ | 5,398,310,807 |
| Total accumulated earnings (loss) | | | | (493,452,796) |
| Net Assets | | | $ | 4,904,858,011 |
Net Asset Value, offering price and redemption price per share ($4,904,858,011 ÷ 635,744,143 shares) | | | $ | 7.72 |
| Statement of Operations |
| | | | Year ended October 31, 2023 |
| Investment Income | | | | |
| Dividends | | | $ | 100,133,122 |
| Non-Cash dividends | | | | 7,004,906 |
| Interest | | | | 244,308 |
| Income from Fidelity Central Funds (including $306,094 from security lending) | | | | 12,028,171 |
| Income before foreign taxes withheld | | | $ | 119,410,507 |
| Less foreign taxes withheld | | | | (11,929,259) |
| Total Income | | | | 107,481,248 |
| Expenses | | | | |
| Custodian fees and expenses | $ | 1,042,894 | | |
| Independent trustees' fees and expenses | | 18,413 | | |
| Total expenses before reductions | | 1,061,307 | | |
| Expense reductions | | (584,710) | | |
| Total expenses after reductions | | | | 476,597 |
| Net Investment income (loss) | | | | 107,004,651 |
| Realized and Unrealized Gain (Loss) | | | | |
| Net realized gain (loss) on: | | | | |
| Investment Securities: | | | | |
| Unaffiliated issuers (net of foreign taxes of $7,280,947) | | (255,850,963) | | |
| Foreign currency transactions | | (4,064,321) | | |
| Futures contracts | | (20,807,407) | | |
| Total net realized gain (loss) | | | | (280,722,691) |
| Change in net unrealized appreciation (depreciation) on: | | | | |
| Investment Securities: | | | | |
| Unaffiliated issuers(net of decrease in deferred foreign taxes of $273,004) | | 412,458,220 | | |
| Assets and liabilities in foreign currencies | | (1,429) | | |
| Futures contracts | | 8,062,165 | | |
| Total change in net unrealized appreciation (depreciation) | | | | 420,518,956 |
| Net gain (loss) | | | | 139,796,265 |
| Net increase (decrease) in net assets resulting from operations | | | $ | 246,800,916 |
| Statement of Changes in Net Assets |
| |
| | Year ended October 31, 2023 | | Year ended October 31, 2022 |
| Increase (Decrease) in Net Assets | | | | |
| Operations | | | | |
| Net investment income (loss) | $ | 107,004,651 | $ | 74,510,346 |
| Net realized gain (loss) | | (280,722,691) | | (324,627,707) |
| Change in net unrealized appreciation (depreciation) | | 420,518,956 | | (1,027,426,269) |
| Net increase (decrease) in net assets resulting from operations | | 246,800,916 | | (1,277,543,630) |
| Distributions to shareholders | | (65,273,730) | | (105,313,301) |
| | | | | |
| Share transactions | | | | |
| Proceeds from sales of shares | | 2,785,308,852 | | 739,859,925 |
| Reinvestment of distributions | | 65,273,730 | | 105,313,301 |
| Cost of shares redeemed | | (563,995,467) | | (265,266,031) |
| | | | | |
Net increase (decrease) in net assets resulting from share transactions | | 2,286,587,115 | | 579,907,195 |
| Total increase (decrease) in net assets | | 2,468,114,301 | | (802,949,736) |
| | | | | |
| Net Assets | | | | |
| Beginning of period | | 2,436,743,710 | | 3,239,693,446 |
| End of period | $ | 4,904,858,011 | $ | 2,436,743,710 |
| | | | | |
| Other Information | | | | |
| Shares | | | | |
| Sold | | 345,359,955 | | 84,221,344 |
| Issued in reinvestment of distributions | | 8,304,546 | | 9,925,853 |
| Redeemed | | (69,208,198) | | (29,402,412) |
| Net increase (decrease) | | 284,456,303 | | 64,744,785 |
| | | | | |
Financial Highlights
| Fidelity® Series Emerging Markets Fund |
| |
| Years ended October 31, | | 2023 | | 2022 | | 2021 | | 2020 | | 2019 |
Selected Per-Share Data | | | | | | | | | | |
| Net asset value, beginning of period | $ | 6.94 | $ | 11.31 | $ | 9.65 | $ | 9.48 | $ | 8.87 |
| Income from Investment Operations | | | | | | | | | | |
Net investment income (loss) A,B | | .24 | | .23 | | .20 | | .17 | | .30 C |
| Net realized and unrealized gain (loss) | | .74 | | (4.24) | | 1.62 | | .22 | | .35 |
| Total from investment operations | | .98 | | (4.01) | | 1.82 | | .39 | | .65 |
| Distributions from net investment income | | (.20) | | (.30) | | (.16) | | (.22) | | (.04) |
| Distributions from net realized gain | | - | | (.07) | | - | | - | | - |
| Total distributions | | (.20) | | (.36) D | | (.16) | | (.22) | | (.04) |
| Net asset value, end of period | $ | 7.72 | $ | 6.94 | $ | 11.31 | $ | 9.65 | $ | 9.48 |
Total Return E,F | | 14.04% | | (36.53)% | | 18.88% | | 4.16% | | 7.33% |
Ratios to Average Net Assets B,G,H | | | | | | | | | | |
| Expenses before reductions | | .03% | | .04% | | .04% | | .05% | | .04% |
| Expenses net of fee waivers, if any | | .01% | | .01% | | .01% | | .01% | | .01% |
| Expenses net of all reductions | | .01% | | .01% | | .01% | | .01% | | .01% |
| Net investment income (loss) | | 2.96% | | 2.61% | | 1.70% | | 1.86% | | 3.24% C |
| Supplemental Data | | | | | | | | | | |
| Net assets, end of period (000 omitted) | $ | 4,904,858 | $ | 2,436,744 | $ | 3,239,693 | $ | 2,995,875 | $ | 2,065,165 |
Portfolio turnover rate I | | 90% | | 65% | | 78% | | 117% J | | 47% |
ACalculated based on average shares outstanding during the period.
BNet investment income (loss) is affected by the timing of the declaration of dividends by any underlying mutual funds or exchange-traded funds (ETFs). Net investment income (loss) of any mutual funds or ETFs is not included in the Fund's net investment income (loss) ratio.
CNet investment income per share reflects one or more large, non-recurring dividend(s) which amounted to $.07 per share. Excluding such non-recurring dividend(s), the ratio of net investment income (loss) to average net assets would have been 2.50%.
DTotal distributions per share do not sum due to rounding.
ETotal returns for periods of less than one year are not annualized.
FTotal returns would have been lower if certain expenses had not been reduced during the applicable periods shown.
GFees and expenses of any underlying mutual funds or exchange-traded funds (ETFs) are not included in the Fund's expense ratio. The Fund indirectly bears its proportionate share of these expenses. For additional expense information related to investments in Fidelity Central Funds, please refer to the "Investments in Fidelity Central Funds" note found in the Notes to Financial Statements section of the most recent Annual or Semi-Annual report.
HExpense ratios reflect operating expenses of the class. Expenses before reductions do not reflect amounts reimbursed, waived, or reduced through arrangements with the investment adviser, brokerage services, or other offset arrangements, if applicable, and do not represent the amount paid by the class during periods when reimbursements, waivers or reductions occur.
IAmount does not include the portfolio activity of any underlying mutual funds or exchange-traded funds (ETFs).
JPortfolio turnover rate excludes securities received or delivered in-kind.
Average annual total return reflects the change in the value of an investment, assuming reinvestment of distributions from dividend income and capital gains (the profits earned upon the sale of securities that have grown in value, if any) and assuming a constant rate of performance each year. The hypothetical investment and the average annual total returns do not reflect the deduction of taxes that a shareholder would pay on fund distributions or the redemption of fund shares. During periods of reimbursement by Fidelity, a fund's total return will be greater than it would be had the reimbursement not occurred. How a fund did yesterday is no guarantee of how it will do tomorrow.
| Average Annual Total Returns |
| | | | |
Periods ended October 31, 2023 | Past 1 year | Past 5 years | Past 10 years |
| Fidelity® Series Emerging Markets Opportunities Fund | 14.40% | 3.65% | 2.63% |
| $10,000 Over 10 Years |
| |
Let's say hypothetically that $10,000 was invested in Fidelity® Series Emerging Markets Opportunities Fund on October 31, 2013. The chart shows how the value of your investment would have changed, and also shows how the MSCI Emerging Markets Index performed over the same period. |
|
|
Fidelity® Series Emerging Markets Opportunities Fund
Market Recap:
International (non-U.S.) equities gained 12.27% for the 12 months ending October 31, 2023, according to the MSCI ACWI (All Country World Index) ex USA Index, as global economic expansion and a slowing in the pace of inflation in some markets provided a favorable backdrop for risk assets. After returning -15.86% in 2022, the index's upturn has been largely driven by a narrow set of companies in the information technology and communication services sectors, in part due to excitement for generative artificial intelligence applications. The index gained 14.07% year to date through July, including strong gains in both June (+4.50%) and July (+4.07%). The rally for international equities sputtered for the next three months (-11.33%) amid a stalling pattern in disinflationary trends, heightened global recession and geopolitical risks, soaring yields on longer-term U.S. government bonds and particularly weak economic conditions in the eurozone and China. The three-month decline left non-U.S. stocks up 1.15% year to date through October. For the full 12 months, nearly all regions advanced, with Europe ex U.K. (+18%) and Japan (+17%) leading, whereas Canada (-0.38%) lagged by the widest margin. Each of the 11 sectors advanced, with information technology (+21%) and consumer discretionary (+19%) leading the way. Energy and industrials each rose about 14%. Conversely, four defensive-oriented sectors lagged by the widest margin: real estate (+4%), health care (+6%), consumer staples (+7%) and utilities (+8%).
Comments from Co-Managers Priyanshu Bakshi, Di Chen and Lewis Chung:
For the fiscal year, the fund gained 14.40%, versus 10.84% for the benchmark MSCI Emerging Markets Net MA Index. From a regional standpoint, stock picks in Emerging Asia and an underweight in the Middle East contributed to the fund's performance versus the benchmark. By sector, security selection was the primary contributor, especially within consumer discretionary, where our picks in consumer discretionary distribution & retail contributed most. Security selection in materials also helped. The top individual relative contributor was an overweight in PDD (+83%). PDD was one of our biggest holdings. A second notable relative contributor was Posco Holdings (+71%). This period we decreased our position in Posco Holdings. In contrast, from a regional standpoint, security selection in Africa, primarily in South Africa, and an underweight in Emerging Asia, primarily in Taiwan, detracted from the fund's relative result. By sector, the biggest detractor from performance versus the benchmark was stock selection in financials, primarily within the financial services industry. An underweight in information technology, primarily within the technology hardware & equipment industry, also hampered the fund's result. Lastly, the fund's position in cash detracted. The largest individual relative detractor was an overweight in Impala Platinum Holdings (-58%). A second notable relative detractor was our non-benchmark stake in PagSeguro Digital (-48%). Notable changes in positioning include increased exposure to Taiwan and China. By sector, meaningful changes in positioning include increased exposure to the consumer discretionary sector and a lower allocation to industrials.
Note to shareholders:
On December 27, 2022, Lewis Chung assumed co-management responsibilities for the fund. On July 1, 2023, Guillermo de las Casas came off of the fund.
The views expressed above reflect those of the portfolio manager(s) only through the end of the period as stated on the cover of this report and do not necessarily represent the views of Fidelity or any other person in the Fidelity organization. Any such views are subject to change at any time based upon market or other conditions and Fidelity disclaims any responsibility to update such views. These views may not be relied on as investment advice and, because investment decisions for a Fidelity fund are based on numerous factors, may not be relied on as an indication of trading intent on behalf of any Fidelity fund.
Fidelity® Series Emerging Markets Opportunities Fund
Top Holdings (% of Fund's net assets) |
| |
| Taiwan Semiconductor Manufacturing Co. Ltd. (Taiwan, Semiconductors & Semiconductor Equipment) | 7.4 | |
| Samsung Electronics Co. Ltd. (Korea (South), Technology Hardware, Storage & Peripherals) | 4.6 | |
| Tencent Holdings Ltd. (China, Interactive Media & Services) | 4.1 | |
| Alibaba Group Holding Ltd. (China, Broadline Retail) | 3.0 | |
| HDFC Bank Ltd. (India, Banks) | 2.3 | |
| PDD Holdings, Inc. ADR (China, Broadline Retail) | 2.0 | |
| Reliance Industries Ltd. (India, Oil, Gas & Consumable Fuels) | 1.8 | |
| SK Hynix, Inc. (Korea (South), Semiconductors & Semiconductor Equipment) | 1.6 | |
| Infosys Ltd. (India, IT Consulting & Other Services) | 1.6 | |
| China Construction Bank Corp. (H Shares) (China, Banks) | 1.4 | |
| | 29.8 | |
| |
| Market Sectors (% of Fund's net assets) |
| |
| Financials | 22.5 | |
| Information Technology | 19.5 | |
| Consumer Discretionary | 15.4 | |
| Communication Services | 9.3 | |
| Materials | 7.6 | |
| Consumer Staples | 6.4 | |
| Industrials | 5.3 | |
| Energy | 4.8 | |
| Health Care | 3.6 | |
| Utilities | 2.9 | |
| Real Estate | 1.3 | |
| |
Asset Allocation (% of Fund's net assets) |
|
|
Geographic Diversification (% of Fund's net assets) |
|
* Includes Short-Term investments and Net Other Assets (Liabilities). Percentages are adjusted for the effect of derivatives, if applicable. |
| |
Fidelity® Series Emerging Markets Opportunities Fund
Showing Percentage of Net Assets
| Common Stocks - 94.9% |
| | | Shares | Value ($) |
| Brazil - 6.0% | | | |
| Cury Construtora e Incorporado SA | | 3,143,400 | 9,190,007 |
| Cyrela Brazil Realty SA | | 1,904,800 | 6,796,718 |
| Dexco SA | | 29,311,511 | 39,882,375 |
| ENGIE Brasil Energia SA | | 4,621,800 | 36,026,527 |
| Equatorial Energia SA | | 9,458,334 | 59,281,669 |
| Hapvida Participacoes e Investimentos SA (a)(b) | | 61,245,200 | 44,824,672 |
| Hypera SA (a) | | 3,565,400 | 21,420,333 |
| Localiza Rent a Car SA | | 8,646,150 | 87,237,497 |
| Localiza Rent a Car SA rights 11/10/23 (a) | | 63,400 | 88,025 |
| LOG Commercial Properties e Participacoes SA | | 2,606,151 | 10,710,457 |
| MercadoLibre, Inc. (a) | | 50,847 | 63,087,907 |
| Multiplan Empreendimentos Imobiliarios SA (a) | | 455,600 | 2,235,641 |
| PagSeguro Digital Ltd. (a)(c) | | 13,219,949 | 93,332,840 |
| Raia Drogasil SA | | 24,662,792 | 126,206,185 |
| Rede D'Oregon Sao Luiz SA (b) | | 783,900 | 3,361,515 |
| Rumo SA | | 20,858,500 | 92,299,923 |
| StoneCo Ltd. Class A (a) | | 5,511,848 | 54,649,973 |
| Suzano Papel e Celulose SA | | 6,565,200 | 67,152,747 |
| Transmissora Alianca de Energia Eletrica SA | | 4,534,900 | 30,393,072 |
| Vale SA sponsored ADR (c) | | 13,040,370 | 178,783,473 |
| XP, Inc. Class A | | 8,746,465 | 174,929,300 |
| YDUQS Participacoes SA | | 3,769,779 | 13,256,941 |
TOTAL BRAZIL | | | 1,215,147,797 |
| Canada - 0.8% | | | |
| Barrick Gold Corp. | | 9,976,800 | 159,429,264 |
| Chile - 1.1% | | | |
| Antofagasta PLC | | 6,322,144 | 103,353,161 |
| Banco de Chile | | 1,078,313,300 | 110,783,137 |
TOTAL CHILE | | | 214,136,298 |
| China - 27.5% | | | |
| Advanced Micro-Fabrication Equipment, Inc., China (A Shares) | | 1,436,800 | 33,660,539 |
| Akeso, Inc. (a)(b) | | 3,560,545 | 19,994,441 |
| Alibaba Group Holding Ltd. (a) | | 55,000,176 | 566,231,161 |
| Alibaba Group Holding Ltd. sponsored ADR (a) | | 404,956 | 33,425,068 |
| Angelalign Technology, Inc. (b)(c) | | 845,800 | 5,831,217 |
| Anta Sports Products Ltd. | | 2,925,800 | 33,089,309 |
| Asymchem Laboratories Tianjin Co. Ltd. (H Shares) (b) | | 840,400 | 10,928,837 |
| Baidu, Inc.: | | | |
| Class A (a) | | 2,062,227 | 27,074,584 |
| sponsored ADR (a) | | 139,551 | 14,652,855 |
| BeiGene Ltd. ADR (a) | | 217,000 | 40,422,760 |
| Beijing Enlight Media Co. Ltd. (A Shares) | | 15,476,876 | 16,553,484 |
| Bilibili, Inc. ADR (a)(c) | | 1,154,054 | 15,498,945 |
| BYD Co. Ltd. (H Shares) | | 5,710,007 | 173,642,051 |
| C&S Paper Co. Ltd. (A Shares) | | 22,252,600 | 33,042,672 |
| China Communications Services Corp. Ltd. (H Shares) | | 76,630,000 | 31,343,686 |
| China Construction Bank Corp. (H Shares) | | 491,178,000 | 277,789,694 |
| China Gas Holdings Ltd. | | 36,096,000 | 32,450,554 |
| China Jushi Co. Ltd. (A Shares) | | 44,724,100 | 70,796,620 |
| China Life Insurance Co. Ltd. (H Shares) | | 92,444,690 | 125,206,982 |
| China Merchants Shekou Industrial Zone Holdings Co. Ltd. (A Shares) | | 4,509,628 | 6,803,655 |
| China Overseas Land and Investment Ltd. | | 14,948,900 | 28,210,213 |
| China Petroleum & Chemical Corp. (H Shares) | | 199,038,000 | 101,795,561 |
| China Resources Beer Holdings Co. Ltd. | | 13,834,666 | 73,208,450 |
| China Resources Land Ltd. | | 13,515,720 | 50,590,805 |
| China Tower Corp. Ltd. (H Shares) (b) | | 122,798,824 | 11,451,097 |
| Daqin Railway Co. Ltd. (A Shares) | | 82,255,400 | 81,088,662 |
| Daqo New Energy Corp. ADR (a) | | 181,278 | 4,615,338 |
| ENN Energy Holdings Ltd. | | 7,544,500 | 57,150,697 |
| ESR Group Ltd. (b) | | 5,393,000 | 6,929,443 |
| Greentown China Holdings Ltd. | | 10,694,500 | 10,375,175 |
| Guangdong Investment Ltd. | | 46,124,000 | 31,474,191 |
| Haier Smart Home Co. Ltd. | | 27,845,016 | 79,423,151 |
| Haier Smart Home Co. Ltd. (A Shares) | | 1,171,203 | 3,559,279 |
| Haitian International Holdings Ltd. | | 17,388,306 | 41,481,263 |
| Innovent Biologics, Inc. (a)(b) | | 7,924,862 | 46,702,508 |
| JD.com, Inc. Class A | | 5,263,429 | 66,914,828 |
| JOYY, Inc. ADR | | 363,583 | 14,150,650 |
| KE Holdings, Inc. ADR | | 2,310,700 | 33,990,397 |
| Kingdee International Software Group Co. Ltd. (a) | | 4,210,000 | 5,586,116 |
| Kunlun Energy Co. Ltd. | | 56,298,000 | 46,902,083 |
| Kweichow Moutai Co. Ltd. (A Shares) | | 414,810 | 95,553,239 |
| Lenovo Group Ltd. | | 66,718,000 | 77,641,879 |
| Li Auto, Inc.: | | | |
| ADR (a)(c) | | 3,539,469 | 119,669,447 |
| Class A (a) | | 548,481 | 9,276,804 |
| Longfor Properties Co. Ltd. (b) | | 2,636,435 | 3,838,020 |
| Maxscend Microelectronics Co. Ltd. (A Shares) | | 646,400 | 13,338,706 |
| Medlive Technology Co. Ltd. (b) | | 3,949,965 | 3,943,578 |
| Meituan Class B (a)(b) | | 19,489,239 | 276,260,238 |
| NetEase, Inc. ADR | | 774,375 | 82,796,175 |
| New Oriental Education & Technology Group, Inc. (a) | | 1,197,100 | 7,805,137 |
| New Oriental Education & Technology Group, Inc. sponsored ADR (a) | | 1,815,398 | 118,890,415 |
| PDD Holdings, Inc. ADR (a) | | 3,921,563 | 397,724,919 |
| Ping An Insurance Group Co. of China Ltd. (H Shares) | | 46,004,500 | 233,356,753 |
| Proya Cosmetics Co. Ltd. (A Shares) | | 6,538,322 | 92,855,769 |
| Shangri-La Asia Ltd. (a) | | 7,982,000 | 5,092,337 |
| Shenzhen Mindray Bio-Medical Electronics Co. Ltd. (A Shares) (a) | | 1,584,539 | 61,945,061 |
| Sinopec Engineering Group Co. Ltd. (H Shares) | | 50,696,687 | 25,336,338 |
| Sinopharm Group Co. Ltd. (H Shares) | | 10,756,000 | 25,720,642 |
| Sinotruk Hong Kong Ltd. | | 16,663,661 | 31,386,058 |
| Sunny Optical Technology Group Co. Ltd. | | 4,011,100 | 33,604,730 |
| Tencent Holdings Ltd. | | 22,387,081 | 828,518,021 |
| Tofflon Science & Technology Group Co. Ltd. (A Shares) | | 1,556,821 | 4,037,184 |
| Tongdao Liepin Group (a) | | 6,814,426 | 5,006,747 |
| TravelSky Technology Ltd. (H Shares) | | 23,095,000 | 36,483,938 |
| Trip.com Group Ltd. ADR (a) | | 3,980,916 | 135,351,144 |
| Tsingtao Brewery Co. Ltd. (H Shares) | | 11,249,384 | 85,310,030 |
| Uni-President China Holdings Ltd. | | 38,725,000 | 26,355,883 |
| WuXi AppTec Co. Ltd. (H Shares) (b)(c) | | 3,176,404 | 38,169,405 |
| Wuxi Biologics (Cayman), Inc. (a)(b) | | 16,867,087 | 104,875,193 |
| Xinyi Solar Holdings Ltd. | | 32,552,804 | 19,157,626 |
| XPeng, Inc. ADR (a)(c) | | 2,578,579 | 37,337,824 |
| Zai Lab Ltd. (a) | | 10,515,602 | 26,836,407 |
| Zhuzhou CRRC Times Electric Co. Ltd. (H Shares) | | 5,109,600 | 16,490,560 |
| ZTO Express, Inc. sponsored ADR | | 4,733,400 | 111,566,238 |
TOTAL CHINA | | | 5,555,571,466 |
| Greece - 1.0% | | | |
| Alpha Bank SA (a) | | 86,748,700 | 129,422,207 |
| Piraeus Financial Holdings SA (a) | | 22,339,347 | 65,947,964 |
TOTAL GREECE | | | 195,370,171 |
| Hong Kong - 0.9% | | | |
| ASMPT Ltd. | | 4,494,604 | 38,067,279 |
| Gushengtang Holdings Ltd. | | 654,700 | 3,921,951 |
| Huanxi Media Group Ltd. (a) | | 129,191,425 | 11,880,799 |
| Kerry Properties Ltd. | | 6,340,500 | 10,669,710 |
| Prudential PLC | | 11,961,814 | 125,077,378 |
TOTAL HONG KONG | | | 189,617,117 |
| Hungary - 0.2% | | | |
| Richter Gedeon PLC | | 1,656,600 | 38,842,697 |
| India - 19.0% | | | |
| Apollo Hospitals Enterprise Ltd. | | 1,131,100 | 65,474,739 |
| Bajaj Auto Ltd. | | 1,211,636 | 77,268,328 |
| Bajaj Finance Ltd. | | 2,126,377 | 191,358,478 |
| Bharat Electronics Ltd. | | 51,779,600 | 82,931,032 |
| Bharti Airtel Ltd. | | 17,766,964 | 195,069,760 |
| Coal India Ltd. | | 22,809,400 | 86,073,857 |
| Divi's Laboratories Ltd. | | 719,200 | 29,260,243 |
| Eicher Motors Ltd. | | 1,394,633 | 55,180,415 |
| Embassy Office Parks (REIT) | | 5,472,069 | 20,470,850 |
| HDFC Bank Ltd. | | 26,462,097 | 469,418,163 |
| HDFC Standard Life Insurance Co. Ltd. (b) | | 19,888,241 | 147,699,309 |
| Hindustan Aeronautics Ltd. | | 2,620,200 | 57,325,386 |
| ICICI Bank Ltd. | | 13,023,800 | 143,242,695 |
| Indraprastha Gas Ltd. | | 9,819,494 | 45,093,090 |
| Infosys Ltd. | | 3,034,734 | 49,893,697 |
| Infosys Ltd. sponsored ADR | | 15,803,475 | 259,493,060 |
| ITC Ltd. | | 25,529,254 | 131,373,815 |
| JK Cement Ltd. | | 2,992,821 | 113,422,453 |
| Larsen & Toubro Ltd. | | 4,240,516 | 149,183,245 |
| Ltimindtree Ltd. (b) | | 258,472 | 15,720,966 |
| Mahanagar Gas Ltd. | | 3,221,234 | 39,928,695 |
| Mahindra & Mahindra Ltd. | | 1,406,300 | 24,638,481 |
| MakeMyTrip Ltd. (a) | | 1,662,700 | 64,396,371 |
| Mankind Pharma Ltd. | | 2,518,039 | 52,738,215 |
| Maruti Suzuki India Ltd. | | 463,781 | 57,898,238 |
| NTPC Ltd. | | 29,852,345 | 84,551,116 |
| One97 Communications Ltd. (a) | | 6,185,057 | 68,430,139 |
| Persistent Systems Ltd. | | 118,100 | 8,744,948 |
| Petronet LNG Ltd. | | 10,959,980 | 26,262,841 |
| Pine Labs Private Ltd. (a)(d)(e) | | 9,606 | 3,013,306 |
| Power Grid Corp. of India Ltd. | | 34,271,672 | 83,212,154 |
| Reliance Industries Ltd. | | 13,512,692 | 371,458,728 |
| Shree Cement Ltd. | | 235,468 | 72,552,677 |
| Sona Blw Precision Forgings Ltd. (b) | | 5,599,375 | 36,429,708 |
| SRF Ltd. | | 2,143,800 | 56,512,474 |
| Star Health & Allied Insurance Co. Ltd. (a) | | 12,376,100 | 86,196,187 |
| Tata Motors Ltd. | | 2,854,395 | 21,552,880 |
| Tata Steel Ltd. | | 76,841,000 | 109,618,507 |
| Torrent Pharmaceuticals Ltd. | | 926,472 | 21,409,408 |
| Zomato Ltd. (a) | | 128,549,652 | 162,544,515 |
TOTAL INDIA | | | 3,837,043,169 |
| Indonesia - 2.6% | | | |
| First Resources Ltd. | | 53,989,346 | 59,610,983 |
| PT Bank Central Asia Tbk | | 348,112,760 | 191,782,510 |
| PT Bank Rakyat Indonesia (Persero) Tbk | | 623,075,239 | 194,825,593 |
| PT Sumber Alfaria Trijaya Tbk | | 302,740,300 | 55,097,735 |
| PT Telkom Indonesia Persero Tbk | | 107,116,000 | 23,481,521 |
TOTAL INDONESIA | | | 524,798,342 |
| Korea (South) - 10.1% | | | |
| AMOREPACIFIC Corp. | | 604,969 | 56,701,900 |
| ASICLAND Co. Ltd. (f) | | 17,300 | 319,765 |
| Coway Co. Ltd. | | 1,088,000 | 34,765,251 |
| Delivery Hero AG (a)(b) | | 822,552 | 20,862,104 |
| Hyundai Motor Co. Ltd. | | 190,679 | 23,986,923 |
| Jeisys Medical, Inc. (a)(c) | | 1,003,254 | 7,820,212 |
| Kakao Corp. | | 1,186,016 | 33,379,291 |
| Kakao Pay Corp. (a) | | 470,761 | 11,983,582 |
| Kia Corp. | | 2,512,103 | 143,307,329 |
| LG Chemical Ltd. | | 96,026 | 31,425,118 |
| LG Corp. | | 1,043,328 | 59,630,540 |
| LS Electric Co. Ltd. | | 391,530 | 18,597,677 |
| NAVER Corp. | | 994,253 | 138,793,676 |
| POSCO | | 184,696 | 56,456,285 |
| Samsung Biologics Co. Ltd. (a)(b) | | 145,438 | 76,344,413 |
| Samsung Electronics Co. Ltd. | | 18,542,375 | 921,576,300 |
| Samsung SDI Co. Ltd. | | 286,592 | 90,610,497 |
| SK Hynix, Inc. | | 3,630,234 | 314,789,901 |
TOTAL KOREA (SOUTH) | | | 2,041,350,764 |
| Mauritius - 0.0% | | | |
| Jumo World Holding Ltd. (d)(e) | | 2,024,724 | 2,976,344 |
| Jumo World Ltd. (a)(e) | | 2,021 | 0 |
TOTAL MAURITIUS | | | 2,976,344 |
| Mexico - 2.4% | | | |
| CEMEX S.A.B. de CV sponsored ADR (a) | | 11,881,600 | 70,933,152 |
| Corporacion Inmobiliaria Vesta S.A.B. de CV | | 7,406,684 | 23,223,687 |
| Fibra Uno Administracion SA de CV | | 10,490,300 | 15,925,426 |
| Grupo Aeroportuario del Pacifico S.A.B. de CV Series B | | 1,553,500 | 18,121,725 |
| Grupo Aeroportuario Norte S.A.B. de CV | | 2,815,051 | 21,489,571 |
| Grupo Financiero Banorte S.A.B. de CV Series O | | 27,707,378 | 224,867,910 |
| Wal-Mart de Mexico SA de CV Series V | | 28,330,400 | 101,401,116 |
TOTAL MEXICO | | | 475,962,587 |
| Netherlands - 0.1% | | | |
| CTP BV (b) | | 878,177 | 12,785,779 |
| Panama - 0.3% | | | |
| Copa Holdings SA Class A | | 763,975 | 62,378,559 |
| Peru - 0.5% | | | |
| Credicorp Ltd. (United States) | | 732,422 | 91,523,453 |
| Philippines - 0.4% | | | |
| Ayala Land, Inc. | | 62,047,224 | 30,457,961 |
| SM Investments Corp. | | 2,394,000 | 33,754,806 |
| SM Prime Holdings, Inc. | | 20,721,800 | 10,937,466 |
TOTAL PHILIPPINES | | | 75,150,233 |
| Poland - 0.4% | | | |
| CD Projekt RED SA (c) | | 1,234,658 | 30,778,146 |
| Dino Polska SA (a)(b) | | 454,600 | 43,009,485 |
TOTAL POLAND | | | 73,787,631 |
| Romania - 0.1% | | | |
| Societatea de Producere A Energiei Electrice in Hidrocentrale Hidroelectrica SA | | 468,948 | 11,658,887 |
| Russia - 1.1% | | | |
| Fix Price Group Ltd. GDR (Reg. S) (a)(e) | | 5,084,349 | 1,877,803 |
| Gazprom OAO sponsored ADR (Reg. S) (a)(e) | | 10,986,900 | 2,509,847 |
| LSR Group OJSC (e) | | 98,230 | 98,836 |
| LUKOIL PJSC sponsored ADR (a)(e) | | 2,479,000 | 701,284 |
| Novatek PJSC GDR (Reg. S) (a)(e) | | 648,900 | 33,742,800 |
| Sberbank of Russia (e) | | 12,899,053 | 79,327 |
| Sberbank of Russia sponsored ADR (a)(e) | | 19,633,994 | 349,485 |
| Severstal PAO GDR (Reg. S) (a)(e) | | 6,035,400 | 142,496 |
| TCS Group Holding PLC GDR (a)(e) | | 4,004,379 | 46,450,796 |
| X5 Retail Group NV GDR (Reg. S) (a)(e) | | 6,393,700 | 64,448,496 |
| Yandex NV Series A (a)(c)(e) | | 6,229,522 | 67,901,790 |
TOTAL RUSSIA | | | 218,302,960 |
| Saudi Arabia - 3.3% | | | |
| Al Rajhi Bank | | 8,694,815 | 155,512,871 |
| Alinma Bank | | 13,831,800 | 121,299,238 |
| Bupa Arabia for Cooperative Insurance Co. | | 2,544,832 | 144,484,811 |
| Saudi Arabian Oil Co. (b) | | 5,079,700 | 45,088,498 |
| The Saudi National Bank | | 22,270,216 | 199,159,225 |
TOTAL SAUDI ARABIA | | | 665,544,643 |
| Singapore - 1.0% | | | |
| Sea Ltd. ADR (a) | | 5,012,953 | 209,040,140 |
| South Africa - 2.7% | | | |
| Capitec Bank Holdings Ltd. (c) | | 1,722,061 | 152,907,929 |
| Discovery Ltd. | | 14,623,000 | 100,883,989 |
| Impala Platinum Holdings Ltd. | | 19,362,202 | 80,655,032 |
| Naspers Ltd. Class N | | 619,516 | 96,706,988 |
| Pick 'n Pay Stores Ltd. (c) | | 22,801,884 | 30,586,028 |
| Shoprite Holdings Ltd. | | 6,911,676 | 88,569,582 |
TOTAL SOUTH AFRICA | | | 550,309,548 |
| Taiwan - 11.0% | | | |
| Accton Technology Corp. | | 1,091,037 | 16,891,805 |
| Alchip Technologies Ltd. | | 1,412,095 | 115,725,720 |
| ASE Technology Holding Co. Ltd. | | 2,935,945 | 10,270,771 |
| BizLink Holding, Inc. | | 4,996,327 | 38,904,348 |
| Chailease Holding Co. Ltd. | | 30,547,047 | 165,576,362 |
| Chroma ATE, Inc. | | 4,074,369 | 27,511,754 |
| Delta Electronics, Inc. | | 4,851,561 | 43,688,067 |
| E Ink Holdings, Inc. | | 712,000 | 3,701,772 |
| eMemory Technology, Inc. | | 842,274 | 52,729,043 |
| Formosa Plastics Corp. | | 27,678,000 | 65,772,372 |
| Global Unichip Corp. | | 572,114 | 25,549,816 |
| Hon Hai Precision Industry Co. Ltd. (Foxconn) | | 2,712,000 | 8,088,311 |
| King Yuan Electronics Co. Ltd. | | 17,980,408 | 42,566,400 |
| Lite-On Technology Corp. | | 4,226,242 | 13,148,322 |
| Taiwan Semiconductor Manufacturing Co. Ltd. | | 90,774,984 | 1,481,442,295 |
| Taiwan Semiconductor Manufacturing Co. Ltd. sponsored ADR | | 241,209 | 20,818,749 |
| Uni-President Enterprises Corp. | | 37,004,000 | 77,572,691 |
| Unimicron Technology Corp. | | 4,162,030 | 18,548,002 |
TOTAL TAIWAN | | | 2,228,506,600 |
| Tanzania - 0.0% | | | |
| Helios Towers PLC (a) | | 9,208,600 | 6,777,115 |
| Thailand - 0.6% | | | |
| Carabao Group PCL (For. Reg.) | | 15,745,100 | 29,413,619 |
| Land & House PCL (For. Reg.) | | 32,339,500 | 6,755,824 |
| PTT Global Chemical PCL (For. Reg.) | | 79,234,900 | 75,678,095 |
| Supalai PCL (For. Reg.) | | 13,722,800 | 6,990,830 |
TOTAL THAILAND | | | 118,838,368 |
| United Arab Emirates - 0.1% | | | |
| Emaar Properties PJSC | | 10,526,500 | 19,172,961 |
| United States of America - 1.7% | | | |
| FirstCash Holdings, Inc. | | 1,591,354 | 173,330,278 |
| Globant SA (a) | | 4,479 | 762,729 |
| Legend Biotech Corp. ADR (a) | | 397,300 | 26,249,611 |
| Tenaris SA sponsored ADR | | 1,686,600 | 52,824,312 |
| Titan Cement International Trading SA (g) | | 4,562,736 | 86,321,617 |
TOTAL UNITED STATES OF AMERICA | | | 339,488,547 |
| TOTAL COMMON STOCKS (Cost $18,252,835,410) | | | 19,133,511,440 |
| | | | |
| Preferred Stocks - 3.5% |
| | | Shares | Value ($) |
| Convertible Preferred Stocks - 0.6% | | | |
| China - 0.5% | | | |
| ByteDance Ltd. Series E1 (a)(d)(e) | | 399,541 | 93,352,755 |
| dMed Biopharmaceutical Co. Ltd. Series C (a)(d)(e) | | 769,712 | 4,533,604 |
| | | | 97,886,359 |
| India - 0.1% | | | |
| Meesho Series F (a)(d)(e) | | 431,274 | 28,045,748 |
TOTAL CONVERTIBLE PREFERRED STOCKS | | | 125,932,107 |
| Nonconvertible Preferred Stocks - 2.9% | | | |
| Brazil - 1.9% | | | |
| Companhia de Transmissao de Energia Eletrica Paulista (PN) | | 6,031,800 | 25,351,087 |
| Metalurgica Gerdau SA (PN) | | 49,435,422 | 101,287,828 |
| Petroleo Brasileiro SA - Petrobras: | | | |
| (PN) sponsored ADR (non-vtg.) (c) | | 9,858,100 | 136,337,523 |
| sponsored ADR | | 8,323,635 | 124,854,525 |
| | | | 387,830,963 |
| India - 0.1% | | | |
| Pine Labs Private Ltd.: | | | |
| Series 1 (a)(d)(e) | | 22,959 | 7,202,009 |
| Series A (a)(d)(e) | | 5,737 | 1,799,640 |
| Series B (a)(d)(e) | | 6,242 | 1,958,053 |
| Series B2 (a)(d)(e) | | 5,049 | 1,583,821 |
| Series C (a)(d)(e) | | 9,391 | 2,945,863 |
| Series C1 (a)(d)(e) | | 1,978 | 620,479 |
| Series D (a)(d)(e) | | 2,116 | 663,768 |
| | | | 16,773,633 |
| Korea (South) - 0.8% | | | |
| Hyundai Motor Co. Ltd. Series 2 | | 891,867 | 66,160,445 |
| Samsung Electronics Co. Ltd. | | 2,317,999 | 92,408,290 |
| | | | 158,568,735 |
| United States of America - 0.1% | | | |
| Gupshup, Inc. (a)(d)(e) | | 566,129 | 7,076,613 |
TOTAL NONCONVERTIBLE PREFERRED STOCKS | | | 570,249,944 |
| TOTAL PREFERRED STOCKS (Cost $506,376,297) | | | 696,182,051 |
| | | | |
| Corporate Bonds - 0.2% |
| | | Principal Amount (h) | Value ($) |
| Convertible Bonds - 0.2% | | | |
| Brazil - 0.2% | | | |
| Creditas Financial Solutions Ltd. 5% 7/28/27 (d)(e) | | 33,309,389 | 33,292,734 |
| Nonconvertible Bonds - 0.0% | | | |
| China - 0.0% | | | |
| Ant International Co. Ltd. 3.55% 8/14/24 (d)(e) | | 12,904,612 | 12,840,089 |
| TOTAL CORPORATE BONDS (Cost $46,214,001) | | | 46,132,823 |
| | | | |
| Government Obligations - 0.0% |
| | | Principal Amount (h) | Value ($) |
| United States of America - 0.0% | | | |
U.S. Treasury Bills, yield at date of purchase 5.36% to 5.36% 11/30/23 (i) (Cost $2,270,294) | | 2,280,000 | 2,270,286 |
| | | | |
| Money Market Funds - 3.6% |
| | | Shares | Value ($) |
| Fidelity Cash Central Fund 5.40% (j) | | 355,837,407 | 355,908,574 |
| Fidelity Securities Lending Cash Central Fund 5.40% (j)(k) | | 380,095,191 | 380,133,200 |
| TOTAL MONEY MARKET FUNDS (Cost $736,037,618) | | | 736,041,774 |
| | | | |
| TOTAL INVESTMENT IN SECURITIES - 102.2% (Cost $19,543,733,620) | 20,614,138,374 |
NET OTHER ASSETS (LIABILITIES) - (2.2)% | (448,426,037) |
| NET ASSETS - 100.0% | 20,165,712,337 |
| | |
| Futures Contracts |
| | Number of contracts | Expiration Date | Notional Amount ($) | Value ($) | Unrealized Appreciation/ (Depreciation) ($) |
| Purchased | | | | | |
| | | | | | |
| Equity Index Contracts | | | | | |
| ICE MSCI Emerging Markets Index Contracts (United States) | 3 | Dec 2023 | 137,880 | (10,451) | (10,451) |
| | | | | | |
| The notional amount of futures purchased as a percentage of Net Assets is 0.0% |
Legend
| (b) | Security exempt from registration under Rule 144A of the Securities Act of 1933. These securities may be resold in transactions exempt from registration, normally to qualified institutional buyers. At the end of the period, the value of these securities amounted to $975,050,426 or 4.8% of net assets. |
| (c) | Security or a portion of the security is on loan at period end. |
| (d) | Restricted securities (including private placements) - Investment in securities not registered under the Securities Act of 1933 (excluding 144A issues). At the end of the period, the value of restricted securities (excluding 144A issues) amounted to $201,904,826 or 1.0% of net assets. |
| (f) | Security or a portion of the security purchased on a delayed delivery or when-issued basis. |
| (h) | Amount is stated in United States dollars unless otherwise noted. |
| (i) | Security or a portion of the security was pledged to cover margin requirements for futures contracts. At period end, the value of securities pledged amounted to $14,936. |
| (j) | Affiliated fund that is generally available only to investment companies and other accounts managed by Fidelity Investments. The rate quoted is the annualized seven-day yield of the fund at period end. A complete unaudited listing of the fund's holdings as of its most recent quarter end is available upon request. In addition, each Fidelity Central Fund's financial statements, which are not covered by the Fund's Report of Independent Registered Public Accounting Firm, are available on the SEC's website or upon request. |
| (k) | Investment made with cash collateral received from securities on loan. |
| Additional information on each restricted holding is as follows: |
| Security | Acquisition Date | Acquisition Cost ($) |
| Ant International Co. Ltd. 3.55% 8/14/24 | 8/14/23 | 12,904,612 |
| | | |
| ByteDance Ltd. Series E1 | 11/18/20 | 43,779,377 |
| | | |
| Creditas Financial Solutions Ltd. 5% 7/28/27 | 1/28/22 - 7/28/23 | 33,309,389 |
| | | |
| dMed Biopharmaceutical Co. Ltd. Series C | 12/01/20 | 10,932,333 |
| | | |
| Gupshup, Inc. | 6/08/21 | 12,944,653 |
| | | |
| Jumo World Holding Ltd. | 9/06/23 | 2,024,724 |
| | | |
| Meesho Series F | 9/21/21 | 33,066,770 |
| | | |
| Pine Labs Private Ltd. | 6/30/21 | 3,581,693 |
| | | |
| Pine Labs Private Ltd. Series 1 | 6/30/21 | 8,560,493 |
| | | |
| Pine Labs Private Ltd. Series A | 6/30/21 | 2,139,098 |
| | | |
| Pine Labs Private Ltd. Series B | 6/30/21 | 2,327,392 |
| | | |
| Pine Labs Private Ltd. Series B2 | 6/30/21 | 1,882,570 |
| | | |
| Pine Labs Private Ltd. Series C | 6/30/21 | 3,501,528 |
| | | |
| Pine Labs Private Ltd. Series C1 | 6/30/21 | 737,517 |
| | | |
| Pine Labs Private Ltd. Series D | 6/30/21 | 788,972 |
| | | |
Affiliated Central Funds
Fiscal year to date information regarding the Fund's investments in Fidelity Central Funds, including the ownership percentage, is presented below.
| Affiliate | Value, beginning of period ($) | Purchases ($) | Sales Proceeds ($) | Dividend Income ($) | Realized Gain (loss) ($) | Change in Unrealized appreciation (depreciation) ($) | Value, end of period ($) | % ownership, end of period |
| Fidelity Cash Central Fund 5.40% | 723,008,581 | 11,203,545,308 | 11,570,645,315 | 17,993,301 | 14,324 | (14,324) | 355,908,574 | 0.8% |
| Fidelity Securities Lending Cash Central Fund 5.40% | 429,041,537 | 4,814,632,670 | 4,863,541,007 | 4,202,666 | - | - | 380,133,200 | 1.6% |
| Total | 1,152,050,118 | 16,018,177,978 | 16,434,186,322 | 22,195,967 | 14,324 | (14,324) | 736,041,774 | |
| | | | | | | | | |
Amounts in the dividend income column in the above table include any capital gain distributions from underlying funds, which are presented in the corresponding line item in the Statement of Operations, if applicable.
Amounts in the dividend income column for Fidelity Securities Lending Cash Central Fund represents the income earned on investing cash collateral, less rebates paid to borrowers and any lending agent fees associated with the loan, plus any premium payments received for lending certain types of securities.
Amounts included in the purchases and sales proceeds columns may include in-kind transactions, if applicable.
Other Affiliated Issuers
An affiliated company is a company in which the Fund has ownership of at least 5% of the voting securities. Fiscal year to date transactions with companies which are or were affiliates are presented in the table below. Certain corporate actions, such as mergers, are excluded from the amounts in this table if applicable. A dash in the Value end of period ($) column means either the issuer is no longer held at period end, or the issuer is held at period end but is no longer an affiliate.
| Affiliate | Value, beginning of period ($) | Purchases ($) | Sales Proceeds ($) | Dividend Income ($) | Realized Gain (loss) ($) | Change in Unrealized appreciation (depreciation) ($) | Value, end of period ($) |
| JK Cement Ltd. | 153,502,664 | - | 63,000,916 | 515,411 | 21,641,475 | 1,279,230 | - |
| LOG Commercial Properties e Participacoes SA | 24,979,870 | 1,289,316 | 14,150,887 | 728,098 | (3,905,270) | 2,497,428 | - |
| Pick 'n Pay Stores Ltd. | 119,922,945 | 287,922 | 35,437,696 | 2,204,172 | (29,290,770) | (24,896,373) | - |
| Titan Cement International Trading SA | 65,636,709 | - | 24,607,516 | 3,486,363 | (9,202,457) | 54,494,881 | 86,321,617 |
| Zai Lab Ltd. | 25,948,841 | 3,264,891 | 6,860,083 | - | (13,688,095) | 18,170,853 | - |
| Zai Lab Ltd. ADR | 1,098,404 | - | 1,681,573 | - | (196,203) | 779,372 | - |
| Total | 391,089,433 | 4,842,129 | 145,738,671 | 6,934,044 | (34,641,320) | 52,325,391 | 86,321,617 |
Amounts included in the purchases and sales proceeds columns may include in-kind transactions, if applicable.
Investment Valuation
The following is a summary of the inputs used, as of October 31, 2023, involving the Fund's assets and liabilities carried at fair value. The inputs or methodology used for valuing securities may not be an indication of the risk associated with investing in those securities. For more information on valuation inputs, and their aggregation into the levels used below, please refer to the Investment Valuation section in the accompanying Notes to Financial Statements.
| Valuation Inputs at Reporting Date: |
| Description | Total ($) | Level 1 ($) | Level 2 ($) | Level 3 ($) |
Investments in Securities: | | | | |
|
| Equities: | | | | |
Communication Services | 1,826,157,551 | 373,694,026 | 1,291,208,980 | 161,254,545 |
Consumer Discretionary | 3,106,252,347 | 1,116,695,853 | 1,961,510,746 | 28,045,748 |
Consumer Staples | 1,272,195,481 | 389,772,396 | 816,096,786 | 66,326,299 |
Energy | 981,649,776 | 359,104,858 | 585,590,987 | 36,953,931 |
Financials | 4,474,834,902 | 1,993,035,125 | 2,431,943,825 | 49,855,952 |
Health Care | 785,608,846 | 175,121,588 | 605,953,654 | 4,533,604 |
Industrials | 1,060,635,139 | 393,181,538 | 667,453,601 | - |
Information Technology | 3,887,536,745 | 285,689,876 | 3,574,983,317 | 26,863,552 |
Materials | 1,540,175,746 | 807,143,617 | 732,889,633 | 142,496 |
Real Estate | 311,173,136 | 118,044,348 | 193,029,952 | 98,836 |
Utilities | 583,473,822 | 162,711,242 | 420,762,580 | - |
|
| Corporate Bonds | 46,132,823 | - | - | 46,132,823 |
|
| Government Obligations | 2,270,286 | - | 2,270,286 | - |
|
| Money Market Funds | 736,041,774 | 736,041,774 | - | - |
| Total Investments in Securities: | 20,614,138,374 | 6,910,236,241 | 13,283,694,347 | 420,207,786 |
Derivative Instruments: Liabilities | | | | |
Futures Contracts | (10,451) | (10,451) | - | - |
| Total Liabilities | (10,451) | (10,451) | - | - |
| Total Derivative Instruments: | (10,451) | (10,451) | - | - |
The following is a reconciliation of Investments in Securities for which Level 3 inputs were used in determining value:
| |
| Investments in Securities: | |
| Beginning Balance | $ | 221,119,750 | |
| Net Realized Gain (Loss) on Investment Securities | | (18,817,997) | |
| Net Unrealized Gain (Loss) on Investment Securities | | 227,240,359 | |
| Cost of Purchases | | 26,032,466 | |
| Proceeds of Sales | | (35,366,792) | |
| Amortization/Accretion | | - | |
| Transfers into Level 3 | | - | |
| Transfers out of Level 3 | | - | |
| Ending Balance | $ | 420,207,786 | |
| The change in unrealized gain (loss) for the period attributable to Level 3 securities held at October 31, 2023 | $ | 205,977,743 | |
| The information used in the above reconciliation represents fiscal year to date activity for any Investments in Securities identified as using Level 3 inputs at either the beginning or the end of the current fiscal period. Cost of purchases and proceeds of sales may include securities received and/or delivered through in-kind transactions, corporate actions or exchanges. Transfers into Level 3 were attributable to a lack of observable market data resulting from decreases in market activity, decreases in liquidity, security restructurings or corporate actions. Transfers out of Level 3 were attributable to observable market data becoming available for those securities. Transfers in or out of Level 3 represent the beginning value of any Security or Instrument where a change in the pricing level occurred from the beginning to the end of the period. Realized and unrealized gains (losses) disclosed in the reconciliation are included in Net Gain (Loss) on the Fund's Statement of Operations. | |
Value of Derivative Instruments
The following table is a summary of the Fund's value of derivative instruments by primary risk exposure as of October 31, 2023. For additional information on derivative instruments, please refer to the Derivative Instruments section in the accompanying Notes to Financial Statements.
Primary Risk Exposure / Derivative Type | Value |
| Asset ($) | Liability ($) |
| Equity Risk | | |
Futures Contracts (a) | 0 | (10,451) |
| Total Equity Risk | 0 | (10,451) |
| Total Value of Derivatives | 0 | (10,451) |
(a)Reflects gross cumulative appreciation (depreciation) on futures contracts as presented in the Schedule of Investments. In the Statement of Assets and Liabilities, the period end daily variation margin is included in receivable or payable for daily variation margin on futures contracts, and the net cumulative appreciation (depreciation) is included in Total accumulated earnings (loss).
Fidelity® Series Emerging Markets Opportunities Fund
| Statement of Assets and Liabilities |
| | | | October 31, 2023 |
| | | | | |
| Assets | | | | |
| Investment in securities, at value (including securities loaned of $363,025,568) - See accompanying schedule: | | | | |
Unaffiliated issuers (cost $18,727,061,868) | $ | 19,791,774,983 | | |
Fidelity Central Funds (cost $736,037,618) | | 736,041,774 | | |
Other affiliated issuers (cost $80,634,134) | | 86,321,617 | | |
| | | | | |
| | | | | |
| Total Investment in Securities (cost $19,543,733,620) | | | $ | 20,614,138,374 |
| Foreign currency held at value (cost $26,065) | | | | 26,058 |
| Receivable for investments sold | | | | 252,093,889 |
| Receivable for fund shares sold | | | | 5,974,789 |
| Dividends receivable | | | | 29,023,820 |
| Interest receivable | | | | 532,108 |
| Distributions receivable from Fidelity Central Funds | | | | 1,910,556 |
| Receivable from investment adviser for expense reductions | | | | 375,298 |
| Other receivables | | | | 2,988,603 |
Total assets | | | | 20,907,063,495 |
| Liabilities | | | | |
| Payable for investments purchased | | | | |
Regular delivery | $ | 61,460,707 | | |
Delayed delivery | | 322,963 | | |
| Payable for fund shares redeemed | | 202,397,654 | | |
| Payable for daily variation margin on futures contracts | | 915 | | |
| Deferred taxes | | 95,354,954 | | |
| Other payables and accrued expenses | | 1,685,861 | | |
| Collateral on securities loaned | | 380,128,104 | | |
| Total Liabilities | | | | 741,351,158 |
| Net Assets | | | $ | 20,165,712,337 |
| Net Assets consist of: | | | | |
| Paid in capital | | | $ | 20,895,052,455 |
| Total accumulated earnings (loss) | | | | (729,340,118) |
| Net Assets | | | $ | 20,165,712,337 |
Net Asset Value, offering price and redemption price per share ($20,165,712,337 ÷ 1,272,881,795 shares) | | | $ | 15.84 |
| Statement of Operations |
| | | | Year ended October 31, 2023 |
| Investment Income | | | | |
| Dividends (including $6,934,044 earned from affiliated issuers) | | | $ | 636,964,277 |
| Non-Cash dividends | | | | 59,985,114 |
| Interest | | | | 1,152,433 |
| Income from Fidelity Central Funds (including $4,202,666 from security lending) | | | | 22,195,967 |
| Income before foreign taxes withheld | | | $ | 720,297,791 |
| Less foreign taxes withheld | | | | (68,723,578) |
| Total Income | | | | 651,574,213 |
| Expenses | | | | |
| Custodian fees and expenses | $ | 6,451,475 | | |
| Independent trustees' fees and expenses | | 133,473 | | |
| Interest | | 134,061 | | |
| Total expenses before reductions | | 6,719,009 | | |
| Expense reductions | | (3,467,644) | | |
| Total expenses after reductions | | | | 3,251,365 |
| Net Investment income (loss) | | | | 648,322,848 |
| Realized and Unrealized Gain (Loss) | | | | |
| Net realized gain (loss) on: | | | | |
| Investment Securities: | | | | |
| Unaffiliated issuers (net of foreign taxes of $30,385,994) | | (754,254,217) | | |
| Fidelity Central Funds | | 14,324 | | |
| Other affiliated issuers | | (34,641,320) | | |
| Foreign currency transactions | | (19,936,253) | | |
| Futures contracts | | 27,645,873 | | |
| Total net realized gain (loss) | | | | (781,171,593) |
| Change in net unrealized appreciation (depreciation) on: | | | | |
| Investment Securities: | | | | |
| Unaffiliated issuers(net of increase in deferred foreign taxes of $22,187,594) | | 3,525,814,147 | | |
| Fidelity Central Funds | | (14,324) | | |
| Other affiliated issuers | | 52,325,391 | | |
| Assets and liabilities in foreign currencies | | 3,749,028 | | |
| Futures contracts | | 4,764,598 | | |
| Total change in net unrealized appreciation (depreciation) | | | | 3,586,638,840 |
| Net gain (loss) | | | | 2,805,467,247 |
| Net increase (decrease) in net assets resulting from operations | | | $ | 3,453,790,095 |
| Statement of Changes in Net Assets |
| |
| | Year ended October 31, 2023 | | Year ended October 31, 2022 |
| Increase (Decrease) in Net Assets | | | | |
| Operations | | | | |
| Net investment income (loss) | $ | 648,322,848 | $ | 687,585,060 |
| Net realized gain (loss) | | (781,171,593) | | (1,069,863,359) |
| Change in net unrealized appreciation (depreciation) | | 3,586,638,840 | | (10,801,411,227) |
| Net increase (decrease) in net assets resulting from operations | | 3,453,790,095 | | (11,183,689,526) |
| Distributions to shareholders | | (559,062,771) | | (3,331,305,613) |
| | | | | |
| Share transactions | | | | |
| Proceeds from sales of shares | | 1,881,171,940 | | 7,263,042,676 |
| Reinvestment of distributions | | 559,062,771 | | 3,331,305,613 |
| Cost of shares redeemed | | (7,499,526,249) | | (2,937,614,184) |
| | | | | |
Net increase (decrease) in net assets resulting from share transactions | | (5,059,291,538) | | 7,656,734,105 |
| Total increase (decrease) in net assets | | (2,164,564,214) | | (6,858,261,034) |
| | | | | |
| Net Assets | | | | |
| Beginning of period | | 22,330,276,551 | | 29,188,537,585 |
| End of period | $ | 20,165,712,337 | $ | 22,330,276,551 |
| | | | | |
| Other Information | | | | |
| Shares | | | | |
| Sold | | 114,358,773 | | 398,835,244 |
| Issued in reinvestment of distributions | | 35,117,008 | | 156,693,585 |
| Redeemed | | (452,937,950) | | (161,208,420) |
| Net increase (decrease) | | (303,462,169) | | 394,320,409 |
| | | | | |
Financial Highlights
| Fidelity® Series Emerging Markets Opportunities Fund |
| |
| Years ended October 31, | | 2023 | | 2022 | | 2021 | | 2020 | | 2019 |
Selected Per-Share Data | | | | | | | | | | |
| Net asset value, beginning of period | $ | 14.17 | $ | 24.69 | $ | 21.49 | $ | 19.39 | $ | 17.66 |
| Income from Investment Operations | | | | | | | | | | |
Net investment income (loss) A,B | | .46 | | .48 | | .47 | | .35 | | .57 C |
| Net realized and unrealized gain (loss) | | 1.58 | | (8.30) | | 3.48 | | 2.26 | | 2.71 |
| Total from investment operations | | 2.04 | | (7.82) | | 3.95 | | 2.61 | | 3.28 |
| Distributions from net investment income | | (.37) | | (.68) | | (.33) | | (.50) | | (.41) |
| Distributions from net realized gain | | - | | (2.01) | | (.41) | | (.02) | | (1.14) |
| Total distributions | | (.37) | | (2.70) D | | (.75) D | | (.51) D | | (1.55) |
| Net asset value, end of period | $ | 15.84 | $ | 14.17 | $ | 24.69 | $ | 21.49 | $ | 19.39 |
Total Return E | | 14.40% | | (35.33)% | | 18.44% | | 13.66% | | 20.13% |
Ratios to Average Net Assets B,F,G | | | | | | | | | | |
| Expenses before reductions | | .03% | | .03% | | .03% | | .04% | | .04% |
| Expenses net of fee waivers, if any | | .01% | | .01% | | .01% | | .01% | | .01% |
| Expenses net of all reductions | | .01% | | .01% | | .01% | | .01% | | .01% |
| Net investment income (loss) | | 2.82% | | 2.64% | | 1.82% | | 1.78% | | 3.12% C |
| Supplemental Data | | | | | | | | | | |
| Net assets, end of period (000 omitted) | $ | 20,165,712 | $ | 22,330,277 | $ | 29,188,538 | $ | 26,829,783 | $ | 18,675,048 |
Portfolio turnover rate H | | 41% | | 37% | | 69% | | 42% I | | 54% |
ACalculated based on average shares outstanding during the period.
BNet investment income (loss) is affected by the timing of the declaration of dividends by any underlying mutual funds or exchange-traded funds (ETFs). Net investment income (loss) of any mutual funds or ETFs is not included in the Fund's net investment income (loss) ratio.
CNet investment income per share reflects one or more large, non-recurring dividend(s) which amounted to $.15 per share. Excluding such non-recurring dividend(s), the ratio of net investment income (loss) to average net assets would have been 2.29%.
DTotal distributions per share do not sum due to rounding.
ETotal returns would have been lower if certain expenses had not been reduced during the applicable periods shown.
FFees and expenses of any underlying mutual funds or exchange-traded funds (ETFs) are not included in the Fund's expense ratio. The Fund indirectly bears its proportionate share of these expenses. For additional expense information related to investments in Fidelity Central Funds, please refer to the "Investments in Fidelity Central Funds" note found in the Notes to Financial Statements section of the most recent Annual or Semi-Annual report.
GExpense ratios reflect operating expenses of the class. Expenses before reductions do not reflect amounts reimbursed, waived, or reduced through arrangements with the investment adviser, brokerage services, or other offset arrangements, if applicable, and do not represent the amount paid by the class during periods when reimbursements, waivers or reductions occur.
HAmount does not include the portfolio activity of any underlying mutual funds or exchange-traded funds (ETFs).
IPortfolio turnover rate excludes securities received or delivered in-kind.
Average annual total return reflects the change in the value of an investment, assuming reinvestment of distributions from dividend income and capital gains (the profits earned upon the sale of securities that have grown in value, if any) and assuming a constant rate of performance each year. The hypothetical investment and the average annual total returns do not reflect the deduction of taxes that a shareholder would pay on fund distributions or the redemption of fund shares. During periods of reimbursement by Fidelity, a fund's total return will be greater than it would be had the reimbursement not occurred. How a fund did yesterday is no guarantee of how it will do tomorrow.
| Average Annual Total Returns |
| | | | |
Periods ended October 31, 2023 | Past 1 year | Past 5 years | Past 10 years |
| Fidelity® Series International Growth Fund | 11.31% | 7.63% | 5.84% |
| $10,000 Over 10 Years |
| |
Let's say hypothetically that $10,000 was invested in Fidelity® Series International Growth Fund on October 31, 2013. The chart shows how the value of your investment would have changed, and also shows how the MSCI EAFE Growth Index performed over the same period. |
|
|
Fidelity® Series International Growth Fund
Market Recap:
International (non-U.S.) equities gained 12.27% for the 12 months ending October 31, 2023, according to the MSCI ACWI (All Country World Index) ex USA Index, as global economic expansion and a slowing in the pace of inflation in some markets provided a favorable backdrop for risk assets. After returning -15.86% in 2022, the index's upturn has been largely driven by a narrow set of companies in the information technology and communication services sectors, in part due to excitement for generative artificial intelligence applications. The index gained 14.07% year to date through July, including strong gains in both June (+4.50%) and July (+4.07%). The rally for international equities sputtered for the next three months (-11.33%) amid a stalling pattern in disinflationary trends, heightened global recession and geopolitical risks, soaring yields on longer-term U.S. government bonds and particularly weak economic conditions in the eurozone and China. The three-month decline left non-U.S. stocks up 1.15% year to date through October. Currency fluctuation also helped bolster non-U.S. equity performance overall. For the full 12 months, nearly all regions advanced, with Europe ex U.K. (+18%) and Japan (+17%) leading, whereas Canada (-0.38%) lagged by the widest margin. Each of the 11 sectors advanced, with information technology (+21%) and consumer discretionary (+19%) leading the way. Energy and industrials each rose about 14%. Conversely, four defensive-oriented sectors lagged by the widest margin: real estate (+4%), health care (+6%), consumer staples (+7%) and utilities (+8%).
Comments from Portfolio Manager Jed Weiss:
For the fiscal year ending October 31, 2023, the fund gained 11.31%, versus 10.95% for the benchmark MSCI EAFE Growth Index (Net MA). From a regional standpoint, stock picking in Europe ex the U.K., primarily Ireland, along with an underweight in Asia Pacific ex Japan - Australia in particular - contributed to the fund's performance versus the benchmark. By sector, an underweight in health care proved beneficial, especially in the pharmaceuticals, biotechnology & life sciences industry. Picks and an overweight among materials stocks also helped, as did financials, especially in the financial services category. Further bolstering the portfolio's relative result was an underweight in consumer staples, namely among food, beverage & tobacco companies. The fund's non-benchmark stake in CRH gained about 51% and was the top individual relative contributor. Out-of-benchmark exposure to Linde (+10%), one of the portfolio's largest holdings added value compared with the benchmark as well. Outsized exposure to Safran (+41%), another of our more sizable positions, also helped the past 12 months. In contrast, on a regional basis, stock picking and an underweight in Japan, in addition to non-benchmark exposure to emerging markets, primarily Kenya, detracted from relative performance. Sector-wise, the biggest relative detractor was security selection in information technology, especially software & services firms. Investment choices in industrials and health care also pressured the portfolio's return. The fund's non-benchmark stake in ResMed returned about -36% and was the largest individual relative detractor. An outsized allocation to Misumi Group (-30%) and a smaller-than-benchmark position in Novo Nordisk (+79%) also hurt. The latter was among the portfolio's largest holdings at period end. Notable changes in positioning include increased exposure to equity markets in Denmark and a smaller cash allocation. By sector, meaningful shifts include increased exposure to materials sector and a lower allocation to consumer staples stocks.
The views expressed above reflect those of the portfolio manager(s) only through the end of the period as stated on the cover of this report and do not necessarily represent the views of Fidelity or any other person in the Fidelity organization. Any such views are subject to change at any time based upon market or other conditions and Fidelity disclaims any responsibility to update such views. These views may not be relied on as investment advice and, because investment decisions for a Fidelity fund are based on numerous factors, may not be relied on as an indication of trading intent on behalf of any Fidelity fund.
Fidelity® Series International Growth Fund
Top Holdings (% of Fund's net assets) |
| |
| ASML Holding NV (Netherlands) (Netherlands, Semiconductors & Semiconductor Equipment) | 5.3 | |
| Novo Nordisk A/S Series B (Denmark, Pharmaceuticals) | 5.2 | |
| LVMH Moet Hennessy Louis Vuitton SE (France, Textiles, Apparel & Luxury Goods) | 5.1 | |
| Nestle SA (Reg. S) (United States of America, Food Products) | 4.7 | |
| Linde PLC (United States of America, Chemicals) | 4.1 | |
| Safran SA (France, Aerospace & Defense) | 3.6 | |
| Keyence Corp. (Japan, Electronic Equipment, Instruments & Components) | 3.1 | |
| Atlas Copco AB (A Shares) (Sweden, Machinery) | 3.0 | |
| Marsh & McLennan Companies, Inc. (United States of America, Insurance) | 2.8 | |
| Airbus Group NV (France, Aerospace & Defense) | 2.8 | |
| | 39.7 | |
| |
| Market Sectors (% of Fund's net assets) |
| |
| Industrials | 26.1 | |
| Financials | 17.7 | |
| Information Technology | 16.7 | |
| Consumer Discretionary | 12.8 | |
| Materials | 8.8 | |
| Health Care | 8.6 | |
| Consumer Staples | 4.9 | |
| Energy | 1.0 | |
| Communication Services | 0.8 | |
| |
Asset Allocation (% of Fund's net assets) |
|
|
Geographic Diversification (% of Fund's net assets) |
|
* Includes Short-Term investments and Net Other Assets (Liabilities). Percentages are adjusted for the effect of derivatives, if applicable. |
| |
Fidelity® Series International Growth Fund
Showing Percentage of Net Assets
| Common Stocks - 97.1% |
| | | Shares | Value ($) |
| Belgium - 0.6% | | | |
| Azelis Group NV | | 2,354,310 | 40,106,636 |
| KBC Group NV | | 588,800 | 32,334,182 |
TOTAL BELGIUM | | | 72,440,818 |
| Canada - 3.5% | | | |
| CAE, Inc. (a) | | 4,077,400 | 85,149,814 |
| Canadian Pacific Kansas City Ltd. | | 3,517,240 | 249,725,942 |
| Franco-Nevada Corp. | | 921,528 | 112,105,119 |
TOTAL CANADA | | | 446,980,875 |
| Denmark - 5.7% | | | |
| Novo Nordisk A/S Series B | | 6,936,000 | 669,159,172 |
| Vestas Wind Systems A/S (a) | | 3,183,300 | 68,997,336 |
TOTAL DENMARK | | | 738,156,508 |
| Finland - 0.5% | | | |
| Kone OYJ (B Shares) | | 1,513,400 | 65,478,324 |
| France - 14.6% | | | |
| Airbus Group NV | | 2,650,100 | 355,315,379 |
| Edenred SA | | 3,180,555 | 169,074,944 |
| Lectra | | 1,040,088 | 26,302,359 |
| Legrand SA | | 2,421,444 | 209,470,361 |
| LVMH Moet Hennessy Louis Vuitton SE | | 913,596 | 654,071,306 |
| Safran SA | | 2,951,800 | 461,128,855 |
TOTAL FRANCE | | | 1,875,363,204 |
| Germany - 1.2% | | | |
| Deutsche Borse AG | | 914,445 | 150,514,411 |
| Hong Kong - 1.8% | | | |
| AIA Group Ltd. | | 26,453,501 | 229,717,126 |
| India - 2.1% | | | |
| HDFC Bank Ltd. | | 8,246,596 | 146,288,556 |
| Jio Financial Services Ltd. | | 1,075,000 | 2,852,232 |
| Kotak Mahindra Bank Ltd. | | 2,933,600 | 61,308,181 |
| Reliance Industries Ltd. | | 1,075,000 | 29,551,338 |
| Reliance Industries Ltd. GDR (b) | | 588,500 | 32,132,100 |
TOTAL INDIA | | | 272,132,407 |
| Israel - 0.9% | | | |
| NICE Ltd. sponsored ADR (a)(c) | | 724,254 | 111,788,605 |
| Italy - 1.3% | | | |
| Interpump Group SpA | | 1,689,520 | 70,434,636 |
| Prada SpA | | 15,688,300 | 94,507,218 |
TOTAL ITALY | | | 164,941,854 |
| Japan - 10.4% | | | |
| Azbil Corp. | | 4,801,505 | 141,878,080 |
| Hoya Corp. | | 1,931,200 | 185,913,960 |
| Keyence Corp. | | 1,035,387 | 400,817,686 |
| Lasertec Corp. | | 902,400 | 149,058,635 |
| Misumi Group, Inc. | | 6,682,606 | 101,165,723 |
| OSG Corp. | | 2,238,146 | 25,538,571 |
| Recruit Holdings Co. Ltd. | | 6,556,705 | 187,998,488 |
| SHO-BOND Holdings Co. Ltd. | | 2,041,100 | 80,384,768 |
| USS Co. Ltd. | | 3,820,900 | 66,785,121 |
TOTAL JAPAN | | | 1,339,541,032 |
| Kenya - 0.0% | | | |
| Safaricom Ltd. | | 66,992,800 | 5,540,089 |
| Netherlands - 6.1% | | | |
| Aalberts Industries NV | | 677,263 | 21,082,724 |
| ASML Holding NV (Netherlands) | | 1,136,646 | 683,261,109 |
| IMCD NV | | 685,854 | 82,367,190 |
TOTAL NETHERLANDS | | | 786,711,023 |
| Norway - 0.2% | | | |
| Schibsted ASA (B Shares) | | 1,583,854 | 29,349,140 |
| Spain - 1.9% | | | |
| Amadeus IT Holding SA Class A | | 4,326,064 | 246,356,115 |
| Sweden - 6.5% | | | |
| ASSA ABLOY AB (B Shares) | | 6,868,537 | 146,403,390 |
| Atlas Copco AB (A Shares) (c) | | 29,298,144 | 379,382,301 |
| Autoliv, Inc. | | 1,235,034 | 113,190,866 |
| Epiroc AB (A Shares) | | 10,628,555 | 175,102,479 |
| Lagercrantz Group AB (B Shares) | | 1,558,306 | 14,197,575 |
TOTAL SWEDEN | | | 828,276,611 |
| Switzerland - 1.1% | | | |
| Schindler Holding AG: | | | |
| (participation certificate) | | 235,881 | 47,505,523 |
| (Reg.) | | 150,852 | 29,269,915 |
| UBS Group AG | | 2,953,020 | 68,887,027 |
TOTAL SWITZERLAND | | | 145,662,465 |
| Taiwan - 2.2% | | | |
| Taiwan Semiconductor Manufacturing Co. Ltd. | | 17,050,885 | 278,269,422 |
| United Kingdom - 6.8% | | | |
| BAE Systems PLC | | 12,202,400 | 164,078,132 |
| Compass Group PLC | | 11,441,200 | 288,448,511 |
| InterContinental Hotel Group PLC ADR | | 2,581,030 | 186,169,694 |
| Rightmove PLC | | 7,445,561 | 42,805,115 |
| Sage Group PLC | | 6,141,900 | 72,456,963 |
| Spectris PLC | | 3,127,178 | 117,828,783 |
TOTAL UNITED KINGDOM | | | 871,787,198 |
| United States of America - 29.7% | | | |
| CRH PLC | | 5,586,740 | 299,281,662 |
| Experian PLC | | 7,402,589 | 224,127,147 |
| Linde PLC | | 1,364,101 | 521,304,838 |
| Marsh & McLennan Companies, Inc. | | 1,917,131 | 363,583,894 |
| MasterCard, Inc. Class A | | 616,331 | 231,956,172 |
| Microsoft Corp. | | 210,400 | 71,138,344 |
| Moody's Corp. | | 660,459 | 203,421,372 |
| MSCI, Inc. | | 395,727 | 186,605,067 |
| Nestle SA (Reg. S) | | 5,619,210 | 605,968,754 |
| NOV, Inc. | | 3,339,400 | 66,654,424 |
| Otis Worldwide Corp. | | 962,700 | 74,330,067 |
| PriceSmart, Inc. | | 352,427 | 22,023,163 |
| ResMed, Inc. | | 733,818 | 103,629,778 |
| Roche Holding AG (participation certificate) | | 602,254 | 155,206,662 |
| S&P Global, Inc. | | 563,080 | 196,689,475 |
| Sherwin-Williams Co. | | 810,841 | 193,150,435 |
| Synopsys, Inc. (a) | | 135,400 | 63,562,176 |
| Visa, Inc. Class A | | 1,001,070 | 235,351,557 |
TOTAL UNITED STATES OF AMERICA | | | 3,817,984,987 |
| TOTAL COMMON STOCKS (Cost $8,657,895,760) | | | 12,476,992,214 |
| | | | |
| Convertible Preferred Stocks - 0.3% |
| | | Shares | Value ($) |
| China - 0.3% | | | |
ByteDance Ltd. Series E1 (a)(d)(e) (Cost $18,859,141) | | 172,113 | 40,214,202 |
| | | | |
| Money Market Funds - 2.7% |
| | | Shares | Value ($) |
| Fidelity Cash Central Fund 5.40% (f) | | 270,554,764 | 270,608,875 |
| Fidelity Securities Lending Cash Central Fund 5.40% (f)(g) | | 67,857,999 | 67,864,785 |
| TOTAL MONEY MARKET FUNDS (Cost $338,473,660) | | | 338,473,660 |
| | | | |
| TOTAL INVESTMENT IN SECURITIES - 100.1% (Cost $9,015,228,561) | 12,855,680,076 |
NET OTHER ASSETS (LIABILITIES) - (0.1)% | (7,593,438) |
| NET ASSETS - 100.0% | 12,848,086,638 |
| | |
Legend
| (b) | Security exempt from registration under Rule 144A of the Securities Act of 1933. These securities may be resold in transactions exempt from registration, normally to qualified institutional buyers. At the end of the period, the value of these securities amounted to $32,132,100 or 0.3% of net assets. |
| (c) | Security or a portion of the security is on loan at period end. |
| (d) | Restricted securities (including private placements) - Investment in securities not registered under the Securities Act of 1933 (excluding 144A issues). At the end of the period, the value of restricted securities (excluding 144A issues) amounted to $40,214,202 or 0.3% of net assets. |
| (f) | Affiliated fund that is generally available only to investment companies and other accounts managed by Fidelity Investments. The rate quoted is the annualized seven-day yield of the fund at period end. A complete unaudited listing of the fund's holdings as of its most recent quarter end is available upon request. In addition, each Fidelity Central Fund's financial statements, which are not covered by the Fund's Report of Independent Registered Public Accounting Firm, are available on the SEC's website or upon request. |
| (g) | Investment made with cash collateral received from securities on loan. |
| Additional information on each restricted holding is as follows: |
| Security | Acquisition Date | Acquisition Cost ($) |
| ByteDance Ltd. Series E1 | 11/18/20 | 18,859,141 |
| | | |
Affiliated Central Funds
Fiscal year to date information regarding the Fund's investments in Fidelity Central Funds, including the ownership percentage, is presented below.
| Affiliate | Value, beginning of period ($) | Purchases ($) | Sales Proceeds ($) | Dividend Income ($) | Realized Gain (loss) ($) | Change in Unrealized appreciation (depreciation) ($) | Value, end of period ($) | % ownership, end of period |
| Fidelity Cash Central Fund 5.40% | 350,149,852 | 2,613,163,565 | 2,692,704,542 | 12,522,712 | - | - | 270,608,875 | 0.6% |
| Fidelity Securities Lending Cash Central Fund 5.40% | 459,204,500 | 3,159,324,013 | 3,550,663,728 | 1,181,327 | - | - | 67,864,785 | 0.3% |
| Total | 809,354,352 | 5,772,487,578 | 6,243,368,270 | 13,704,039 | - | - | 338,473,660 | |
| | | | | | | | | |
Amounts in the dividend income column in the above table include any capital gain distributions from underlying funds, which are presented in the corresponding line item in the Statement of Operations, if applicable.
Amounts in the dividend income column for Fidelity Securities Lending Cash Central Fund represents the income earned on investing cash collateral, less rebates paid to borrowers and any lending agent fees associated with the loan, plus any premium payments received for lending certain types of securities.
Amounts included in the purchases and sales proceeds columns may include in-kind transactions, if applicable.
Investment Valuation
The following is a summary of the inputs used, as of October 31, 2023, involving the Fund's assets and liabilities carried at fair value. The inputs or methodology used for valuing securities may not be an indication of the risk associated with investing in those securities. For more information on valuation inputs, and their aggregation into the levels used below, please refer to the Investment Valuation section in the accompanying Notes to Financial Statements.
| Valuation Inputs at Reporting Date: |
| Description | Total ($) | Level 1 ($) | Level 2 ($) | Level 3 ($) |
Investments in Securities: | | | | |
|
| Equities: | | | | |
Communication Services | 117,908,546 | 77,694,344 | - | 40,214,202 |
Consumer Discretionary | 1,649,528,831 | 545,716,675 | 1,103,812,156 | - |
Consumer Staples | 627,991,917 | 22,023,163 | 605,968,754 | - |
Energy | 128,337,862 | 98,786,524 | 29,551,338 | - |
Financials | 2,278,584,196 | 1,687,903,690 | 590,680,506 | - |
Health Care | 1,113,909,572 | 103,629,778 | 1,010,279,794 | - |
Industrials | 3,344,543,701 | 989,577,918 | 2,354,965,783 | - |
Information Technology | 2,130,559,737 | 477,274,805 | 1,653,284,932 | - |
Materials | 1,125,842,054 | 1,125,842,054 | - | - |
|
| Money Market Funds | 338,473,660 | 338,473,660 | - | - |
| Total Investments in Securities: | 12,855,680,076 | 5,466,922,611 | 7,348,543,263 | 40,214,202 |
Fidelity® Series International Growth Fund
| Statement of Assets and Liabilities |
| | | | October 31, 2023 |
| | | | | |
| Assets | | | | |
| Investment in securities, at value (including securities loaned of $65,969,581) - See accompanying schedule: | | | | |
Unaffiliated issuers (cost $8,676,754,901) | $ | 12,517,206,416 | | |
Fidelity Central Funds (cost $338,473,660) | | 338,473,660 | | |
| | | | | |
| | | | | |
| Total Investment in Securities (cost $9,015,228,561) | | | $ | 12,855,680,076 |
| Foreign currency held at value (cost $517,366) | | | | 513,981 |
| Receivable for investments sold | | | | 34,302,763 |
| Receivable for fund shares sold | | | | 71,674,764 |
| Dividends receivable | | | | 9,877,167 |
| Reclaims receivable | | | | 30,521,137 |
| Distributions receivable from Fidelity Central Funds | | | | 1,158,320 |
Total assets | | | | 13,003,728,208 |
| Liabilities | | | | |
| Payable for investments purchased | $ | 10,126,222 | | |
| Payable for fund shares redeemed | | 76,778,248 | | |
| Other payables and accrued expenses | | 872,315 | | |
| Collateral on securities loaned | | 67,864,785 | | |
| Total Liabilities | | | | 155,641,570 |
| Net Assets | | | $ | 12,848,086,638 |
| Net Assets consist of: | | | | |
| Paid in capital | | | $ | 9,079,719,579 |
| Total accumulated earnings (loss) | | | | 3,768,367,059 |
| Net Assets | | | $ | 12,848,086,638 |
Net Asset Value, offering price and redemption price per share ($12,848,086,638 ÷ 867,904,472 shares) | | | $ | 14.80 |
| Statement of Operations |
| | | | Year ended October 31, 2023 |
| Investment Income | | | | |
| Dividends | | | $ | 197,228,280 |
| Interest | | | | 16,376 |
| Income from Fidelity Central Funds (including $1,181,327 from security lending) | | | | 13,704,039 |
| Income before foreign taxes withheld | | | $ | 210,948,695 |
| Less foreign taxes withheld | | | | (19,513,294) |
| Total Income | | | | 191,435,401 |
| Expenses | | | | |
| Custodian fees and expenses | $ | 853,395 | | |
| Independent trustees' fees and expenses | | 75,709 | | |
| Interest | | 20,320 | | |
| Total expenses before reductions | | 949,424 | | |
| Expense reductions | | (798) | | |
| Total expenses after reductions | | | | 948,626 |
| Net Investment income (loss) | | | | 190,486,775 |
| Realized and Unrealized Gain (Loss) | | | | |
| Net realized gain (loss) on: | | | | |
| Investment Securities: | | | | |
| Unaffiliated issuers (net of foreign taxes of $147) | | (167,138,437) | | |
| Redemptions in-kind | | 187,812,495 | | |
| Foreign currency transactions | | (1,764,205) | | |
| Total net realized gain (loss) | | | | 18,909,853 |
| Change in net unrealized appreciation (depreciation) on: | | | | |
| Investment Securities: | | | | |
| Unaffiliated issuers(net of decrease in deferred foreign taxes of $2,129,671) | | 1,206,208,732 | | |
| Assets and liabilities in foreign currencies | | 2,114,452 | | |
| Total change in net unrealized appreciation (depreciation) | | | | 1,208,323,184 |
| Net gain (loss) | | | | 1,227,233,037 |
| Net increase (decrease) in net assets resulting from operations | | | $ | 1,417,719,812 |
| Statement of Changes in Net Assets |
| |
| | Year ended October 31, 2023 | | Year ended October 31, 2022 |
| Increase (Decrease) in Net Assets | | | | |
| Operations | | | | |
| Net investment income (loss) | $ | 190,486,775 | $ | 182,935,807 |
| Net realized gain (loss) | | 18,909,853 | | 316,466,877 |
| Change in net unrealized appreciation (depreciation) | | 1,208,323,184 | | (4,983,117,038) |
| Net increase (decrease) in net assets resulting from operations | | 1,417,719,812 | | (4,483,714,354) |
| Distributions to shareholders | | (434,836,481) | | (1,228,456,975) |
| | | | | |
| Share transactions | | | | |
| Proceeds from sales of shares | | 2,142,973,065 | | 3,357,019,808 |
| Reinvestment of distributions | | 434,836,481 | | 1,228,456,975 |
| Cost of shares redeemed | | (3,104,776,773) | | (1,948,259,376) |
| | | | | |
Net increase (decrease) in net assets resulting from share transactions | | (526,967,227) | | 2,637,217,407 |
| Total increase (decrease) in net assets | | 455,916,104 | | (3,074,953,922) |
| | | | | |
| Net Assets | | | | |
| Beginning of period | | 12,392,170,534 | | 15,467,124,456 |
| End of period | $ | 12,848,086,638 | $ | 12,392,170,534 |
| | | | | |
| Other Information | | | | |
| Shares | | | | |
| Sold | | 138,038,506 | | 205,948,049 |
| Issued in reinvestment of distributions | | 29,420,601 | | 65,032,132 |
| Redeemed | | (200,541,435) | | (124,061,175) |
| Net increase (decrease) | | (33,082,328) | | 146,919,006 |
| | | | | |
Financial Highlights
| Fidelity® Series International Growth Fund |
| |
| Years ended October 31, | | 2023 | | 2022 | | 2021 | | 2020 | | 2019 |
Selected Per-Share Data | | | | | | | | | | |
| Net asset value, beginning of period | $ | 13.75 | $ | 20.51 | $ | 18.01 | $ | 17.07 | $ | 14.96 |
| Income from Investment Operations | | | | | | | | | | |
Net investment income (loss) A,B | | .22 | | .21 | | .20 | | .20 | | .37 C |
| Net realized and unrealized gain (loss) | | 1.33 | | (5.38) | | 5.19 | | 1.38 | | 2.74 |
| Total from investment operations | | 1.55 | | (5.17) | | 5.39 | | 1.58 | | 3.11 |
| Distributions from net investment income | | (.20) | | (.28) | | (.24) | | (.37) | | (.28) |
| Distributions from net realized gain | | (.30) | | (1.31) | | (2.65) | | (.27) | | (.72) |
| Total distributions | | (.50) | | (1.59) | | (2.89) | | (.64) | | (1.00) |
| Net asset value, end of period | $ | 14.80 | $ | 13.75 | $ | 20.51 | $ | 18.01 | $ | 17.07 |
Total Return D | | 11.31% | | (27.31)% | | 33.10% | | 9.39% | | 22.58% |
Ratios to Average Net Assets B,E,F | | | | | | | | | | |
| Expenses before reductions | | .01% | | .01% | | .01% | | .01% | | .01% |
| Expenses net of fee waivers, if any | | .01% | | .01% | | .01% | | .01% | | .01% |
| Expenses net of all reductions | | .01% | | .01% | | .01% | | .01% | | .01% |
| Net investment income (loss) | | 1.42% | | 1.32% | | 1.06% | | 1.18% | | 2.38% C |
| Supplemental Data | | | | | | | | | | |
| Net assets, end of period (000 omitted) | $ | 12,848,087 | $ | 12,392,171 | $ | 15,467,124 | $ | 11,557,995 | $ | 16,501,791 |
Portfolio turnover rate G | | 19% H | | 22% H | | 24% | | 16% H | | 24% |
ACalculated based on average shares outstanding during the period.
BNet investment income (loss) is affected by the timing of the declaration of dividends by any underlying mutual funds or exchange-traded funds (ETFs). Net investment income (loss) of any mutual funds or ETFs is not included in the Fund's net investment income (loss) ratio.
CNet investment income per share reflects one or more large, non-recurring dividend(s) which amounted to $.07 per share. Excluding such non-recurring dividend(s), the ratio of net investment income (loss) to average net assets would have been 1.92%.
DTotal returns would have been lower if certain expenses had not been reduced during the applicable periods shown.
EFees and expenses of any underlying mutual funds or exchange-traded funds (ETFs) are not included in the Fund's expense ratio. The Fund indirectly bears its proportionate share of these expenses. For additional expense information related to investments in Fidelity Central Funds, please refer to the "Investments in Fidelity Central Funds" note found in the Notes to Financial Statements section of the most recent Annual or Semi-Annual report.
FExpense ratios reflect operating expenses of the class. Expenses before reductions do not reflect amounts reimbursed, waived, or reduced through arrangements with the investment adviser, brokerage services, or other offset arrangements, if applicable, and do not represent the amount paid by the class during periods when reimbursements, waivers or reductions occur.
GAmount does not include the portfolio activity of any underlying mutual funds or exchange-traded funds (ETFs).
HPortfolio turnover rate excludes securities received or delivered in-kind.
Average annual total return reflects the change in the value of an investment, assuming reinvestment of distributions from dividend income and capital gains (the profits earned upon the sale of securities that have grown in value, if any) and assuming a constant rate of performance each year. The hypothetical investment and the average annual total returns do not reflect the deduction of taxes that a shareholder would pay on fund distributions or the redemption of fund shares. During periods of reimbursement by Fidelity, a fund's total return will be greater than it would be had the reimbursement not occurred. How a fund did yesterday is no guarantee of how it will do tomorrow.
| Average Annual Total Returns |
| | | | |
Periods ended October 31, 2023 | Past 1 year | Past 5 years | Past 10 years |
| Fidelity® Series International Small Cap Fund | 6.57% | 4.48% | 5.06% |
| $10,000 Over 10 Years |
| |
Let's say hypothetically that $10,000 was invested in Fidelity® Series International Small Cap Fund on October 31, 2013. The chart shows how the value of your investment would have changed, and also shows how the MSCI EAFE Small Cap Index performed over the same period. |
|
|
Fidelity® Series International Small Cap Fund
Market Recap:
International (non-U.S.) equities gained 12.27% for the 12 months ending October 31, 2023, according to the MSCI ACWI (All Country World Index) ex USA Index, as global economic expansion and a slowing in the pace of inflation in some markets provided a favorable backdrop for risk assets. After returning -15.86% in 2022, the index's upturn has been largely driven by a narrow set of companies in the information technology and communication services sectors, in part due to excitement for generative artificial intelligence applications. The index gained 14.07% year to date through July, including strong gains in both June (+4.50%) and July (+4.07%). The rally for international equities sputtered for the next three months (-11.33%) amid a stalling pattern in disinflationary trends, heightened global recession and geopolitical risks, soaring yields on longer-term U.S. government bonds and particularly weak economic conditions in the eurozone and China. The three-month decline left non-U.S. stocks up 1.15% year to date through October. Currency fluctuation also helped bolster non-U.S. equity performance overall. For the full 12 months, nearly all regions advanced, with Europe ex U.K. (+18%) and Japan (+17%) leading, whereas Canada (-0.38%) lagged by the widest margin. Each of the 11 sectors advanced, with information technology (+21%) and consumer discretionary (+19%) leading the way. Energy and industrials each rose about 14%. Conversely, four defensive-oriented sectors lagged by the widest margin: real estate (+4%), health care (+6%), consumer staples (+7%) and utilities (+8%).
Comments from Lead Manager Jed Weiss, Co-Manager Patrick Drouot and Co-Manager Preeti Sayana:
For the fiscal year ending October 31, 2023, the fund gained 6.50%, versus 6.67% for the benchmark MSCI EAFE Small Cap Index (Net MA). From a regional standpoint, an underweight in Asia Pacific ex Japan, primarily Australia, along with stock picks in Europe ex the U.K. - Sweden in particular - contributed to the fund's performance versus the benchmark. By sector, the biggest relative contributors were investment choices and an underweight in real estate, especially real estate investment trusts. Picks among communication services and industrials stocks also proved beneficial. The top individual relative contributor was our non-benchmark stake in Rheinmetall (+79%). Outsized exposure to Addtech (+22%), which was among the fund's largest holdings on October 31, also helped. An overweight in CTS Eventim (+28%) was another plus. The stock was one of the portfolio's more sizable positions at period end. In contrast, on a regional basis, security selection in Japan and picks in emerging markets detracted from the fund's relative result. Sector-wise, investment choices and an overweight in health care, primarily within the health care equipment & services industry, hurt most. Stock picks and smaller-than-benchmark exposure to consumer staples companies, primarily within the consumer staples distribution & retail category, further hampered the portfolio's result. Security selection in information technology, especially software & services firms, was detrimental to performance as well. The biggest individual relative detractor was our stake in ResMed (-36%), followed by Misumi Group (-30%) and Digital Hearts Holdings (-56%). All of these stocks were non-benchmark positions. Notable changes in positioning these past 12 months include a higher allocation to equity markets in the Netherlands. By sector, meaningful shifts include decreased exposure to health care and a higher allocation to financials.
The views expressed above reflect those of the portfolio manager(s) only through the end of the period as stated on the cover of this report and do not necessarily represent the views of Fidelity or any other person in the Fidelity organization. Any such views are subject to change at any time based upon market or other conditions and Fidelity disclaims any responsibility to update such views. These views may not be relied on as investment advice and, because investment decisions for a Fidelity fund are based on numerous factors, may not be relied on as an indication of trading intent on behalf of any Fidelity fund.
Fidelity® Series International Small Cap Fund
Top Holdings (% of Fund's net assets) |
| |
| Azbil Corp. (Japan, Electronic Equipment, Instruments & Components) | 3.0 | |
| Spectris PLC (United Kingdom, Electronic Equipment, Instruments & Components) | 3.0 | |
| Lagercrantz Group AB (B Shares) (Sweden, Electronic Equipment, Instruments & Components) | 2.8 | |
| AddTech AB (B Shares) (Sweden, Trading Companies & Distributors) | 2.7 | |
| CTS Eventim AG (Germany, Entertainment) | 2.4 | |
| Aalberts Industries NV (Netherlands, Machinery) | 2.0 | |
| Interpump Group SpA (Italy, Machinery) | 2.0 | |
| Morningstar, Inc. (United States of America, Capital Markets) | 1.7 | |
| SHO-BOND Holdings Co. Ltd. (Japan, Construction & Engineering) | 1.6 | |
| OBIC Co. Ltd. (Japan, IT Services) | 1.6 | |
| | 22.8 | |
| |
| Market Sectors (% of Fund's net assets) |
| |
| Industrials | 28.8 | |
| Information Technology | 18.9 | |
| Consumer Discretionary | 10.8 | |
| Health Care | 6.9 | |
| Financials | 6.7 | |
| Communication Services | 6.5 | |
| Consumer Staples | 4.9 | |
| Materials | 4.4 | |
| Real Estate | 3.2 | |
| Energy | 2.4 | |
| Utilities | 0.5 | |
| |
Asset Allocation (% of Fund's net assets) |
|
|
Geographic Diversification (% of Fund's net assets) |
|
* Includes Short-Term investments and Net Other Assets (Liabilities). Percentages are adjusted for the effect of derivatives, if applicable. |
| |
Fidelity® Series International Small Cap Fund
Showing Percentage of Net Assets
| Common Stocks - 94.0% |
| | | Shares | Value ($) |
| Australia - 1.0% | | | |
| Imdex Ltd. | | 11,094,033 | 11,636,630 |
| Steadfast Group Ltd. | | 6,116,015 | 21,031,411 |
TOTAL AUSTRALIA | | | 32,668,041 |
| Austria - 0.1% | | | |
| AT&S Austria Technologie & Systemtechnik AG | | 150,000 | 3,758,371 |
| Belgium - 1.4% | | | |
| Azelis Group NV | | 807,072 | 13,748,802 |
| Fagron NV | | 227,500 | 3,991,100 |
| Galapagos NV (a) | | 85,000 | 2,828,058 |
| KBC Ancora | | 722,579 | 27,294,822 |
TOTAL BELGIUM | | | 47,862,782 |
| Brazil - 0.1% | | | |
| LOG Commercial Properties e Participacoes SA | | 562,700 | 2,312,519 |
| Vamos Locacao de Caminhoes Maquinas e Equipamentos SA | | 1,000,000 | 1,553,032 |
TOTAL BRAZIL | | | 3,865,551 |
| Canada - 4.1% | | | |
| CAE, Inc. (a) | | 1,185,900 | 24,765,577 |
| Cameco Corp. | | 80,000 | 3,272,800 |
| ECN Capital Corp. | | 533,950 | 739,271 |
| Lumine Group, Inc. | | 364,900 | 4,589,043 |
| McCoy Global, Inc. | | 1,106,750 | 1,205,114 |
| MTY Food Group, Inc. | | 93,600 | 3,521,938 |
| North West Co., Inc. | | 200,000 | 5,099,694 |
| Onex Corp. (sub. vtg.) | | 80,000 | 4,483,577 |
| Osisko Gold Royalties Ltd. | | 974,700 | 11,913,586 |
| Parkland Corp. | | 182,500 | 5,523,364 |
| Pason Systems, Inc. | | 1,270,700 | 12,177,828 |
| Quebecor, Inc. Class B (sub. vtg.) | | 160,000 | 3,300,955 |
| Real Matters, Inc. (a) | | 950,000 | 3,349,919 |
| Richelieu Hardware Ltd. | | 1,775,620 | 53,111,749 |
| Total Energy Services, Inc. | | 319,700 | 1,908,863 |
TOTAL CANADA | | | 138,963,278 |
| China - 0.5% | | | |
| Chlitina Holding Ltd. | | 2,142,000 | 12,889,650 |
| JOYY, Inc. ADR | | 79,300 | 3,086,356 |
TOTAL CHINA | | | 15,976,006 |
| Denmark - 0.4% | | | |
| Spar Nord Bank A/S | | 936,553 | 14,180,239 |
| Egypt - 0.2% | | | |
| Integrated Diagnostics Holdings PLC (a)(b) | | 16,028,734 | 6,106,948 |
| Finland - 0.7% | | | |
| Huhtamaki Oyj | | 136,689 | 4,687,479 |
| Musti Group OYJ | | 908,878 | 17,896,936 |
| Nanoform Finland PLC (a) | | 450,000 | 757,071 |
| Olvi Oyj (A Shares) | | 74,900 | 2,215,085 |
TOTAL FINLAND | | | 25,556,571 |
| France - 3.4% | | | |
| Altarea SCA | | 33,495 | 2,381,639 |
| ARGAN SA | | 75,600 | 5,167,506 |
| Elis SA | | 430,000 | 7,038,587 |
| Exail Technologies SA (a)(c) | | 190,000 | 3,393,538 |
| Exclusive Networks SA (a) | | 480,000 | 7,628,478 |
| Laurent-Perrier Group SA | | 104,531 | 13,051,302 |
| Lectra | | 1,060,210 | 26,811,216 |
| LISI | | 304,288 | 7,034,982 |
| Maisons du Monde SA (b) | | 270,700 | 1,359,386 |
| Stef SA | | 75,000 | 8,062,722 |
| Thermador Groupe SA | | 77,100 | 5,473,985 |
| Vallourec SA (a) | | 250,000 | 2,995,746 |
| Vetoquinol SA | | 298,648 | 25,185,156 |
| Worldline SA (a)(b) | | 180,000 | 2,281,687 |
TOTAL FRANCE | | | 117,865,930 |
| Germany - 6.0% | | | |
| CTS Eventim AG | | 1,354,770 | 81,780,156 |
| Gerresheimer AG | | 58,503 | 5,441,188 |
| Instone Real Estate Group BV (b) | | 500,000 | 2,846,289 |
| Nexus AG | | 618,016 | 30,113,142 |
| NORMA Group AG | | 107,000 | 1,881,662 |
| Rheinmetall AG | | 120,000 | 34,333,229 |
| Scout24 AG (b) | | 330,500 | 20,289,713 |
| Stabilus Se | | 454,629 | 28,814,472 |
| Talanx AG | | 1,791 | 112,661 |
TOTAL GERMANY | | | 205,612,512 |
| Greece - 0.2% | | | |
| Mytilineos SA | | 154,600 | 5,722,107 |
| Hungary - 0.2% | | | |
| Richter Gedeon PLC | | 363,700 | 8,527,761 |
| India - 0.3% | | | |
| Embassy Office Parks (REIT) | | 1,772,219 | 6,629,820 |
| Mahanagar Gas Ltd. | | 318,200 | 3,944,237 |
TOTAL INDIA | | | 10,574,057 |
| Indonesia - 0.2% | | | |
| PT Selamat Sempurna Tbk | | 55,532,360 | 7,582,864 |
| Ireland - 1.8% | | | |
| AerCap Holdings NV (a) | | 411,000 | 25,531,320 |
| Cairn Homes PLC | | 11,314,234 | 13,270,570 |
| Cairn Homes PLC | | 5,395,900 | 6,360,274 |
| Greencore Group PLC (a) | | 2,250,000 | 2,457,184 |
| Irish Residential Properties REIT PLC | | 10,274,300 | 9,892,825 |
| Mincon Group PLC | | 4,031,318 | 2,474,012 |
TOTAL IRELAND | | | 59,986,185 |
| Israel - 1.3% | | | |
| Ituran Location & Control Ltd. | | 943,735 | 23,338,567 |
| Maytronics Ltd. | | 334,000 | 3,106,977 |
| NICE Ltd. sponsored ADR (a) | | 70,000 | 10,804,500 |
| Tel Aviv Stock Exchange Ltd. (a) | | 1,620,557 | 7,216,731 |
TOTAL ISRAEL | | | 44,466,775 |
| Italy - 2.5% | | | |
| Banca Generali SpA | | 140,000 | 4,535,863 |
| BFF Bank SpA (b) | | 529,000 | 5,079,594 |
| Industrie de Nora SpA | | 198,400 | 2,798,327 |
| Intercos SpA | | 269,000 | 3,836,798 |
| Interpump Group SpA | | 1,633,037 | 68,079,908 |
| MARR SpA | | 131,400 | 1,557,185 |
TOTAL ITALY | | | 85,887,675 |
| Japan - 31.6% | | | |
| ABC-MART, Inc. | | 204,900 | 3,173,705 |
| Ai Holdings Corp. | | 416,292 | 6,444,357 |
| Aoki Super Co. Ltd. | | 309,187 | 5,269,080 |
| Arcland Sakamoto Co. Ltd. | | 193,700 | 2,074,832 |
| Artnature, Inc. | | 1,214,900 | 6,488,808 |
| As One Corp. | | 115,100 | 3,668,225 |
| ASKUL Corp. | | 620,000 | 8,093,721 |
| Aucnet, Inc. | | 757,060 | 8,814,367 |
| Azbil Corp. | | 3,466,390 | 102,427,201 |
| BayCurrent Consulting, Inc. | | 139,300 | 3,497,371 |
| Broadleaf Co. Ltd. (d) | | 6,232,673 | 22,027,448 |
| Central Automotive Products Ltd. | | 186,579 | 4,178,744 |
| Chiba Bank Ltd. | | 831,900 | 6,196,446 |
| CKD Corp. | | 267,000 | 3,357,672 |
| Curves Holdings Co. Ltd. (d) | | 5,887,359 | 25,681,624 |
| Daiichikosho Co. Ltd. | | 1,831,428 | 27,071,180 |
| Daikokutenbussan Co. Ltd. | | 179,300 | 7,598,549 |
| Dexerials Corp. | | 308,300 | 7,032,422 |
| Digital Hearts Holdings Co. Ltd. (d) | | 1,280,850 | 7,796,576 |
| Dowa Holdings Co. Ltd. | | 90,000 | 2,751,332 |
| Elan Corp. | | 588,200 | 2,907,448 |
| Fujitec Co. Ltd. | | 475,300 | 10,318,820 |
| Fukuoka Financial Group, Inc. | | 290,000 | 7,665,785 |
| Funai Soken Holdings, Inc. | | 1,021,757 | 16,793,506 |
| Fuyo General Lease Co. Ltd. | | 28,800 | 2,341,461 |
| Goldcrest Co. Ltd. | | 1,537,300 | 21,922,400 |
| Inaba Denki Sangyo Co. Ltd. | | 396,300 | 8,264,001 |
| Iwatani Corp. | | 100,000 | 4,782,852 |
| Iwatsuka Confectionary Co. Ltd. | | 105,800 | 3,563,654 |
| JINS Holdings, Inc. | | 123,200 | 3,400,912 |
| JTOWER, Inc. (a) | | 260,300 | 9,472,595 |
| Justsystems Corp. | | 150,000 | 2,673,067 |
| Kamigumi Co. Ltd. | | 450,800 | 9,145,177 |
| Kansai Electric Power Co., Inc. | | 740,000 | 9,474,843 |
| Katitas Co. Ltd. | | 150,000 | 2,002,116 |
| Kobayashi Pharmaceutical Co. Ltd. | | 416,800 | 17,206,868 |
| Kobe Bussan Co. Ltd. (c) | | 82,300 | 2,036,765 |
| Koshidaka Holdings Co. Ltd. (d) | | 4,447,659 | 31,643,463 |
| Kusuri No Aoki Holdings Co. Ltd. | | 205,658 | 13,474,231 |
| Kyoritsu Maintenance Co. Ltd. (c) | | 118,800 | 4,543,624 |
| Kyoto Financial Group, Inc. | | 88,153 | 4,997,730 |
| Lasertec Corp. | | 213,360 | 35,242,853 |
| Maeda Kosen Co. Ltd. | | 167,300 | 3,259,280 |
| Maruwa Ceramic Co. Ltd. | | 50,600 | 8,878,453 |
| MCJ Co. Ltd. | | 850,000 | 6,115,220 |
| Medikit Co. Ltd. | | 695,300 | 12,283,224 |
| Meitec Group Holdings, Inc. | | 201,000 | 3,537,619 |
| Miroku Jyoho Service Co., Ltd. (c) | | 618,891 | 6,338,416 |
| Misumi Group, Inc. | | 1,731,300 | 26,209,568 |
| Mitsuboshi Belting Ltd. | | 242,952 | 7,013,762 |
| Miura Co. Ltd. | | 147,900 | 2,867,634 |
| Nagaileben Co. Ltd. | | 1,528,000 | 21,086,174 |
| Net One Systems Co. Ltd. | | 179,400 | 2,738,169 |
| Nihon Parkerizing Co. Ltd. | | 5,690,468 | 41,299,031 |
| Nippon Concept Corp. | | 135,000 | 1,590,911 |
| Nippon Gas Co. Ltd. | | 303,700 | 4,564,460 |
| Nitto Kohki Co. Ltd. | | 270,000 | 3,386,899 |
| NOF Corp. | | 261,900 | 10,332,202 |
| NS Tool Co. Ltd. (d) | | 1,434,000 | 10,284,096 |
| NSD Co. Ltd. | | 1,697,080 | 29,527,310 |
| OBIC Co. Ltd. | | 359,600 | 53,154,761 |
| Osaka Soda Co. Ltd. | | 77,700 | 4,563,369 |
| OSG Corp. | | 2,120,875 | 24,200,440 |
| Outsourcing, Inc. | | 400,000 | 2,972,362 |
| PALTAC Corp. | | 135,000 | 4,376,225 |
| Paramount Bed Holdings Co. Ltd. | | 616,612 | 10,505,624 |
| Pilot Corp. | | 129,800 | 4,404,829 |
| Prestige International, Inc. | | 600,000 | 2,435,461 |
| ProNexus, Inc. | | 1,284,577 | 10,004,513 |
| Qol Holdings Co. Ltd. | | 300,000 | 3,462,928 |
| Relo Group, Inc. | | 603,600 | 5,984,140 |
| Renesas Electronics Corp. (a) | | 150,000 | 1,970,343 |
| Roland Corp. | | 140,000 | 4,047,956 |
| San-Ai Obbli Co. Ltd. | | 1,576,710 | 17,024,522 |
| Sekisui Jushi Corp. | | 180,000 | 2,935,356 |
| SHO-BOND Holdings Co. Ltd. | | 1,372,000 | 54,033,561 |
| Shoei Co. Ltd. | | 1,380,000 | 18,386,800 |
| SK Kaken Co. Ltd. | | 526,920 | 24,628,143 |
| Software Service, Inc. | | 181,500 | 10,341,598 |
| Sumco Corp. | | 491,400 | 6,349,946 |
| SWCC Showa Holdings Co. Ltd. | | 293,500 | 4,080,915 |
| Techno Medica Co. Ltd. | | 283,000 | 4,276,958 |
| The Monogatari Corp. | | 735,288 | 19,912,009 |
| TIS, Inc. | | 702,836 | 15,051,130 |
| Tocalo Co. Ltd. | | 1,467,849 | 13,267,543 |
| Toyo Suisan Kaisha Ltd. | | 145,000 | 6,688,988 |
| Tsuruha Holdings, Inc. | | 64,635 | 4,747,874 |
| USS Co. Ltd. | | 1,693,300 | 29,597,018 |
| YAKUODO Holdings Co. Ltd. | | 821,800 | 15,137,096 |
| Yamato Holdings Co. Ltd. | | 215,000 | 3,581,044 |
| YONEX Co. Ltd. | | 975,000 | 10,563,002 |
TOTAL JAPAN | | | 1,081,516,713 |
| Kenya - 0.0% | | | |
| Safaricom Ltd. | | 2,593,346 | 214,461 |
| Korea (South) - 0.5% | | | |
| BGF Retail Co. Ltd. | | 110,318 | 11,264,576 |
| Hansol Chemical Co. Ltd. | | 18,660 | 2,079,285 |
| Soulbrain Co. Ltd. | | 18,000 | 3,103,693 |
TOTAL KOREA (SOUTH) | | | 16,447,554 |
| Luxembourg - 0.1% | | | |
| L'Occitane Ltd. | | 1,150,000 | 2,955,766 |
| Novem Group SA | | 255,000 | 1,608,100 |
TOTAL LUXEMBOURG | | | 4,563,866 |
| Mexico - 0.1% | | | |
| Bolsa Mexicana de Valores S.A.B. de CV | | 1,156,900 | 1,803,786 |
| Netherlands - 4.5% | | | |
| Aalberts Industries NV | | 2,236,135 | 69,609,321 |
| BE Semiconductor Industries NV | | 290,000 | 29,856,408 |
| IMCD NV | | 310,129 | 37,244,741 |
| Koninklijke Heijmans NV (Certificaten Van Aandelen) | | 300,000 | 3,440,941 |
| TKH Group NV (bearer) (depositary receipt) | | 142,800 | 5,209,814 |
| Van Lanschot Kempen NV (Bearer) | | 305,761 | 8,201,377 |
TOTAL NETHERLANDS | | | 153,562,602 |
| Norway - 2.4% | | | |
| Europris ASA (b) | | 674,800 | 3,820,723 |
| Kongsberg Gruppen ASA | | 1,231,008 | 50,249,947 |
| Medistim ASA | | 440,375 | 7,628,050 |
| Selvaag Bolig ASA | | 840,200 | 2,000,664 |
| Sparebanken Midt-Norge | | 721,800 | 8,748,738 |
| TGS ASA | | 340,000 | 4,632,372 |
| Volue A/S (a) | | 3,247,442 | 5,447,797 |
TOTAL NORWAY | | | 82,528,291 |
| Philippines - 0.1% | | | |
| Robinsons Land Corp. | | 11,000,000 | 2,697,741 |
| Singapore - 0.2% | | | |
| Boustead Singapore Ltd. | | 9,000,000 | 5,356,684 |
| Spain - 0.9% | | | |
| Cie Automotive SA | | 248,200 | 6,318,647 |
| Compania de Distribucion Integral Logista Holdings SA | | 457,000 | 11,208,728 |
| Fluidra SA (c) | | 619,020 | 10,885,852 |
| Grupo Catalana Occidente SA | | 28,477 | 911,478 |
TOTAL SPAIN | | | 29,324,705 |
| Sweden - 10.3% | | | |
| AAK AB | | 246,700 | 4,685,387 |
| Addlife AB | | 1,585,326 | 10,325,081 |
| AddTech AB (B Shares) | | 6,246,065 | 91,432,170 |
| Alligo AB (B Shares) | | 745,270 | 5,848,685 |
| Arjo AB | | 370,000 | 1,235,051 |
| Autoliv, Inc. | | 408,900 | 37,475,685 |
| Bergman & Beving AB (B Shares) | | 1,406,054 | 18,844,042 |
| Betsson AB (B Shares) | | 540,000 | 5,427,841 |
| BHG Group AB (a)(c) | | 1,203,200 | 1,061,731 |
| Dometic Group AB (b) | | 491,200 | 3,023,121 |
| Hemnet Group AB | | 1,810,100 | 31,410,342 |
| HEXPOL AB (B Shares) | | 375,500 | 3,320,225 |
| INVISIO AB | | 1,240,047 | 18,618,841 |
| JM AB (B Shares) | | 615,600 | 6,551,723 |
| John Mattson Fastighetsforetag (a)(c) | | 1,242,353 | 5,943,288 |
| Lagercrantz Group AB (B Shares) | | 10,360,623 | 94,394,632 |
| Rusta AB | | 1,100,000 | 4,464,074 |
| Swedish Logistic Property AB (a) | | 2,500,000 | 5,823,094 |
| Teqnion AB (a) | | 182,939 | 3,367,895 |
TOTAL SWEDEN | | | 353,252,908 |
| Switzerland - 1.2% | | | |
| Kardex AG | | 14,990 | 2,890,393 |
| Tecan Group AG | | 104,285 | 29,853,036 |
| VZ Holding AG | | 81,662 | 8,007,751 |
TOTAL SWITZERLAND | | | 40,751,180 |
| Taiwan - 0.5% | | | |
| Addcn Technology Co. Ltd. | | 2,264,641 | 13,841,044 |
| International Games Systems Co. Ltd. | | 248,000 | 4,776,500 |
TOTAL TAIWAN | | | 18,617,544 |
| United Kingdom - 13.5% | | | |
| Allfunds Group PLC (c) | | 375,000 | 1,911,722 |
| B&M European Value Retail SA | | 871,031 | 5,598,377 |
| Baltic Classifieds Group PLC | | 3,487,200 | 8,366,833 |
| Beazley PLC | | 77,429 | 484,202 |
| Bodycote PLC | | 5,788,808 | 40,386,678 |
| Cab Payments Holdings Ltd. (c) | | 3,670,900 | 2,730,619 |
| Clarkson PLC | | 588,634 | 18,923,790 |
| Close Brothers Group PLC | | 1,429 | 13,843 |
| DCC PLC (United Kingdom) | | 165,000 | 9,155,073 |
| Dechra Pharmaceuticals PLC | | 283,013 | 13,099,069 |
| Direct Line Insurance Group PLC (a) | | 4,000,000 | 7,355,903 |
| Domino's Pizza UK & IRL PLC | | 1,209,100 | 5,040,730 |
| DP Poland PLC (a) | | 32,210,430 | 3,132,013 |
| Dr. Martens Ltd. | | 2,800,000 | 3,961,395 |
| Endava PLC ADR (a) | | 65,000 | 3,260,400 |
| Games Workshop Group PLC | | 30,000 | 3,600,771 |
| GlobalData PLC | | 1,000,000 | 1,823,175 |
| Grainger Trust PLC | | 1,156,700 | 3,197,042 |
| H&T Group PLC | | 580,000 | 3,440,210 |
| Harbour Energy PLC | | 875,800 | 2,701,678 |
| Hill & Smith Holdings PLC | | 465,514 | 9,324,532 |
| Howden Joinery Group PLC | | 3,987,682 | 30,903,376 |
| Inchcape PLC | | 474,500 | 3,841,029 |
| Indivior PLC (a) | | 512,800 | 9,816,703 |
| InterContinental Hotel Group PLC ADR | | 456,000 | 32,891,280 |
| J.D. Wetherspoon PLC (a) | | 333,500 | 2,561,828 |
| John Wood Group PLC (a) | | 2,200,000 | 3,794,392 |
| Lancashire Holdings Ltd. | | 1,632,633 | 11,271,300 |
| Londonmetric Properity PLC | | 1,000,000 | 2,010,354 |
| LSL Property Services PLC | | 694,900 | 1,993,294 |
| Mears Group PLC | | 854,908 | 2,675,677 |
| On The Beach Group PLC (a)(b) | | 2,387,000 | 2,756,215 |
| Petershill Partners PLC (b) | | 1,600,000 | 2,870,407 |
| Pets At Home Group PLC | | 1,201,500 | 4,100,700 |
| Premier Foods PLC | | 2,885,600 | 4,110,559 |
| Rightmove PLC | | 3,664,463 | 21,067,285 |
| RS GROUP PLC | | 500,000 | 4,115,514 |
| Sabre Insurance Group PLC (b) | | 5,832,581 | 10,421,140 |
| Sage Group PLC | | 895,000 | 10,558,456 |
| Softcat PLC | | 280,945 | 4,319,654 |
| Spectris PLC | | 2,712,228 | 102,193,903 |
| Spirax-Sarco Engineering PLC | | 179,897 | 17,912,284 |
| Synthomer PLC (a)(c) | | 973,595 | 2,242,460 |
| Tate & Lyle PLC | | 514,700 | 3,944,358 |
| Ten Entertainment Group PLC | | 887,600 | 3,182,559 |
| Unite Group PLC | | 969,074 | 10,229,723 |
| Urban Logistics REIT PLC | | 3,600,000 | 4,559,396 |
| Vistry Group PLC | | 400,000 | 3,437,293 |
TOTAL UNITED KINGDOM | | | 461,289,194 |
| United States of America - 3.7% | | | |
| Eneti, Inc. | | 400,000 | 4,060,000 |
| Morningstar, Inc. (c) | | 231,100 | 58,523,764 |
| NOV, Inc. | | 1,071,900 | 21,395,124 |
| PriceSmart, Inc. | | 234,112 | 14,629,659 |
| Ramaco Resources, Inc. (c) | | 320,000 | 3,769,600 |
| Ramaco Resources, Inc. Class B (c) | | 50,018 | 625,725 |
| ResMed, Inc. | | 111,300 | 15,717,786 |
| WestRock Co. | | 230,000 | 8,263,900 |
TOTAL UNITED STATES OF AMERICA | | | 126,985,558 |
| TOTAL COMMON STOCKS (Cost $2,812,821,260) | | | 3,214,076,440 |
| | | | |
| Investment Companies - 1.6% |
| | | Shares | Value ($) |
| United States of America - 1.6% | | | |
iShares MSCI EAFE Small-Cap ETF (Cost $55,861,020) | | 985,000 | 53,002,850 |
| | | | |
| Money Market Funds - 4.6% |
| | | Shares | Value ($) |
| Fidelity Cash Central Fund 5.40% (e) | | 133,216,669 | 133,243,313 |
| Fidelity Securities Lending Cash Central Fund 5.40% (e)(f) | | 25,434,438 | 25,436,981 |
| TOTAL MONEY MARKET FUNDS (Cost $158,679,333) | | | 158,680,294 |
| | | | |
| TOTAL INVESTMENT IN SECURITIES - 100.2% (Cost $3,027,361,613) | 3,425,759,584 |
NET OTHER ASSETS (LIABILITIES) - (0.2)% | (7,456,127) |
| NET ASSETS - 100.0% | 3,418,303,457 |
| | |
Security Type Abbreviations
Legend
| (b) | Security exempt from registration under Rule 144A of the Securities Act of 1933. These securities may be resold in transactions exempt from registration, normally to qualified institutional buyers. At the end of the period, the value of these securities amounted to $60,855,223 or 1.8% of net assets. |
| (c) | Security or a portion of the security is on loan at period end. |
| (e) | Affiliated fund that is generally available only to investment companies and other accounts managed by Fidelity Investments. The rate quoted is the annualized seven-day yield of the fund at period end. A complete unaudited listing of the fund's holdings as of its most recent quarter end is available upon request. In addition, each Fidelity Central Fund's financial statements, which are not covered by the Fund's Report of Independent Registered Public Accounting Firm, are available on the SEC's website or upon request. |
| (f) | Investment made with cash collateral received from securities on loan. |
Affiliated Central Funds
Fiscal year to date information regarding the Fund's investments in Fidelity Central Funds, including the ownership percentage, is presented below.
| Affiliate | Value, beginning of period ($) | Purchases ($) | Sales Proceeds ($) | Dividend Income ($) | Realized Gain (loss) ($) | Change in Unrealized appreciation (depreciation) ($) | Value, end of period ($) | % ownership, end of period |
| Fidelity Cash Central Fund 5.40% | 121,291,715 | 867,593,027 | 855,641,430 | 7,356,399 | - | 1 | 133,243,313 | 0.3% |
| Fidelity Securities Lending Cash Central Fund 5.40% | 18,451,075 | 285,323,528 | 278,337,622 | 224,679 | - | - | 25,436,981 | 0.1% |
| Total | 139,742,790 | 1,152,916,555 | 1,133,979,052 | 7,581,078 | - | 1 | 158,680,294 | |
| | | | | | | | | |
Amounts in the dividend income column in the above table include any capital gain distributions from underlying funds, which are presented in the corresponding line item in the Statement of Operations, if applicable.
Amounts in the dividend income column for Fidelity Securities Lending Cash Central Fund represents the income earned on investing cash collateral, less rebates paid to borrowers and any lending agent fees associated with the loan, plus any premium payments received for lending certain types of securities.
Amounts included in the purchases and sales proceeds columns may include in-kind transactions, if applicable.
Other Affiliated Issuers
An affiliated company is a company in which the Fund has ownership of at least 5% of the voting securities. Fiscal year to date transactions with companies which are or were affiliates are presented in the table below. Certain corporate actions, such as mergers, are excluded from the amounts in this table if applicable. A dash in the Value end of period ($) column means either the issuer is no longer held at period end, or the issuer is held at period end but is no longer an affiliate.
| Affiliate | Value, beginning of period ($) | Purchases ($) | Sales Proceeds ($) | Dividend Income ($) | Realized Gain (loss) ($) | Change in Unrealized appreciation (depreciation) ($) | Value, end of period ($) |
| Broadleaf Co. Ltd. | 21,927,817 | 815,563 | - | 40,486 | - | (715,932) | 22,027,448 |
| Curves Holdings Co. Ltd. | 29,217,035 | 4,806,316 | - | 343,096 | - | (8,341,727) | 25,681,624 |
| Digital Hearts Holdings Co. Ltd. | 18,366,423 | 161,395 | 597,559 | 175,885 | (605,049) | (9,528,634) | 7,796,576 |
| Goldcrest Co. Ltd. | 20,638,219 | 1,026,768 | 3,860,470 | 868,169 | (3,136,230) | 7,254,113 | - |
| Koshidaka Holdings Co. Ltd. | 26,779,211 | 10,857,211 | 4,540,285 | 322,044 | 142,729 | (1,595,403) | 31,643,463 |
| NS Tool Co. Ltd. | 10,526,821 | 630,552 | - | 251,352 | - | (873,277) | 10,284,096 |
| Total | 127,455,526 | 18,297,805 | 8,998,314 | 2,001,032 | (3,598,550) | (13,800,860) | 97,433,207 |
Amounts included in the purchases and sales proceeds columns may include in-kind transactions, if applicable.
Investment Valuation
The following is a summary of the inputs used, as of October 31, 2023, involving the Fund's assets and liabilities carried at fair value. The inputs or methodology used for valuing securities may not be an indication of the risk associated with investing in those securities. For more information on valuation inputs, and their aggregation into the levels used below, please refer to the Investment Valuation section in the accompanying Notes to Financial Statements.
| Valuation Inputs at Reporting Date: |
| Description | Total ($) | Level 1 ($) | Level 2 ($) | Level 3 ($) |
Investments in Securities: | | | | |
|
| Equities: | | | | |
Communication Services | 224,677,420 | 169,516,101 | 55,161,319 | - |
Consumer Discretionary | 375,442,782 | 189,371,916 | 186,070,866 | - |
Consumer Staples | 168,372,044 | 55,587,211 | 112,784,833 | - |
Energy | 81,414,655 | 59,607,281 | 21,807,374 | - |
Financials | 234,853,518 | 192,620,685 | 42,232,833 | - |
Health Care | 235,694,451 | 167,797,142 | 67,897,309 | - |
Industrials | 986,164,692 | 752,624,948 | 233,539,744 | - |
Information Technology | 640,729,097 | 326,961,425 | 313,767,672 | - |
Materials | 147,800,472 | 44,147,507 | 103,652,965 | - |
Real Estate | 100,943,769 | 61,707,552 | 39,236,217 | - |
Utilities | 17,983,540 | - | 17,983,540 | - |
|
| Investment Companies | 53,002,850 | 53,002,850 | - | - |
|
| Money Market Funds | 158,680,294 | 158,680,294 | - | - |
| Total Investments in Securities: | 3,425,759,584 | 2,231,624,912 | 1,194,134,672 | - |
Fidelity® Series International Small Cap Fund
| Statement of Assets and Liabilities |
| | | | October 31, 2023 |
| | | | | |
| Assets | | | | |
| Investment in securities, at value (including securities loaned of $24,513,146) - See accompanying schedule: | | | | |
Unaffiliated issuers (cost $2,754,735,962) | $ | 3,169,646,083 | | |
Fidelity Central Funds (cost $158,679,333) | | 158,680,294 | | |
Other affiliated issuers (cost $113,946,318) | | 97,433,207 | | |
| | | | | |
| | | | | |
| Total Investment in Securities (cost $3,027,361,613) | | | $ | 3,425,759,584 |
| Cash | | | | 185,221 |
| Foreign currency held at value (cost $9,685) | | | | 9,683 |
| Receivable for investments sold | | | | 3,622,673 |
| Receivable for fund shares sold | | | | 394,338,879 |
| Dividends receivable | | | | 9,517,507 |
| Reclaims receivable | | | | 5,115,264 |
| Distributions receivable from Fidelity Central Funds | | | | 647,371 |
| Other receivables | | | | 161,627 |
Total assets | | | | 3,839,357,809 |
| Liabilities | | | | |
| Payable for investments purchased | $ | 1,906,249 | | |
| Payable for fund shares redeemed | | 393,637,658 | | |
| Other payables and accrued expenses | | 73,464 | | |
| Collateral on securities loaned | | 25,436,981 | | |
| Total Liabilities | | | | 421,054,352 |
| Net Assets | | | $ | 3,418,303,457 |
| Net Assets consist of: | | | | |
| Paid in capital | | | $ | 2,925,047,400 |
| Total accumulated earnings (loss) | | | | 493,256,057 |
| Net Assets | | | $ | 3,418,303,457 |
Net Asset Value, offering price and redemption price per share ($3,418,303,457 ÷ 235,361,219 shares) | | | $ | 14.52 |
| Statement of Operations |
| | | | Year ended October 31, 2023 |
| Investment Income | | | | |
| Dividends (including $2,001,032 earned from affiliated issuers) | | | $ | 77,214,629 |
| Interest | | | | 7,534 |
| Income from Fidelity Central Funds (including $224,679 from security lending) | | | | 7,581,078 |
| Income before foreign taxes withheld | | | $ | 84,803,241 |
| Less foreign taxes withheld | | | | (9,598,979) |
| Total Income | | | | 75,204,262 |
| Expenses | | | | |
| Custodian fees and expenses | $ | 303,876 | | |
| Independent trustees' fees and expenses | | 20,934 | | |
| Total expenses before reductions | | 324,810 | | |
| Expense reductions | | (5,497) | | |
| Total expenses after reductions | | | | 319,313 |
| Net Investment income (loss) | | | | 74,884,949 |
| Realized and Unrealized Gain (Loss) | | | | |
| Net realized gain (loss) on: | | | | |
| Investment Securities: | | | | |
| Unaffiliated issuers (net of foreign taxes of $926,453) | | 51,385,067 | | |
| Affiliated issuers | | (3,598,550) | | |
| Foreign currency transactions | | (486,483) | | |
| Total net realized gain (loss) | | | | 47,300,034 |
| Change in net unrealized appreciation (depreciation) on: | | | | |
| Investment Securities: | | | | |
| Unaffiliated issuers(net of decrease in deferred foreign taxes of $1,565,129) | | 106,928,848 | | |
| Fidelity Central Funds | | 1 | | |
| Other affiliated issuers | | (13,800,860) | | |
| Assets and liabilities in foreign currencies | | 509,897 | | |
| Total change in net unrealized appreciation (depreciation) | | | | 93,637,886 |
| Net gain (loss) | | | | 140,937,920 |
| Net increase (decrease) in net assets resulting from operations | | | $ | 215,822,869 |
| Statement of Changes in Net Assets |
| |
| | Year ended October 31, 2023 | | Year ended October 31, 2022 |
| Increase (Decrease) in Net Assets | | | | |
| Operations | | | | |
| Net investment income (loss) | $ | 74,884,949 | $ | 78,778,239 |
| Net realized gain (loss) | | 47,300,034 | | 170,598,372 |
| Change in net unrealized appreciation (depreciation) | | 93,637,886 | | (1,772,210,175) |
| Net increase (decrease) in net assets resulting from operations | | 215,822,869 | | (1,522,833,564) |
| Distributions to shareholders | | (211,666,578) | | (562,935,286) |
| | | | | |
| Share transactions | | | | |
| Proceeds from sales of shares | | 786,276,246 | | 318,375,461 |
| Reinvestment of distributions | | 211,666,578 | | 562,935,286 |
| Cost of shares redeemed | | (830,053,983) | | (397,219,829) |
| | | | | |
Net increase (decrease) in net assets resulting from share transactions | | 167,888,841 | | 484,090,918 |
| Total increase (decrease) in net assets | | 172,045,132 | | (1,601,677,932) |
| | | | | |
| Net Assets | | | | |
| Beginning of period | | 3,246,258,325 | | 4,847,936,257 |
| End of period | $ | 3,418,303,457 | $ | 3,246,258,325 |
| | | | | |
| Other Information | | | | |
| Shares | | | | |
| Sold | | 51,964,278 | | 18,537,989 |
| Issued in reinvestment of distributions | | 14,026,944 | | 27,025,218 |
| Redeemed | | (54,776,134) | | (22,410,759) |
| Net increase (decrease) | | 11,215,088 | | 23,152,448 |
| | | | | |
Financial Highlights
| Fidelity® Series International Small Cap Fund |
| |
| Years ended October 31, | | 2023 | | 2022 | | 2021 | | 2020 | | 2019 |
Selected Per-Share Data | | | | | | | | | | |
| Net asset value, beginning of period | $ | 14.48 | $ | 24.12 | $ | 17.55 | $ | 16.71 | $ | 16.43 |
| Income from Investment Operations | | | | | | | | | | |
Net investment income (loss) A,B | | .32 | | .35 | | .29 | | .22 | | .36 |
| Net realized and unrealized gain (loss) | | .67 | | (7.16) | | 6.45 | | 1.36 | | 1.47 |
| Total from investment operations | | .99 | | (6.81) | | 6.74 | | 1.58 | | 1.83 |
| Distributions from net investment income | | (.21) | | (.47) | | (.17) | | (.36) | | (.37) |
| Distributions from net realized gain | | (.73) | | (2.35) | | - | | (.38) | | (1.18) |
| Total distributions | | (.95) C | | (2.83) C | | (.17) | | (.74) | | (1.55) |
| Net asset value, end of period | $ | 14.52 | $ | 14.48 | $ | 24.12 | $ | 17.55 | $ | 16.71 |
Total Return D | | 6.57% | | (31.82)% | | 38.60% | | 9.60% | | 12.77% |
Ratios to Average Net Assets B,E,F | | | | | | | | | | |
| Expenses before reductions | | .01% | | .01% | | .01% | | .01% | | .01% |
| Expenses net of fee waivers, if any | | .01% | | .01% | | .01% | | .01% | | .01% |
| Expenses net of all reductions | | .01% | | .01% | | .01% | | .01% | | .01% |
| Net investment income (loss) | | 2.02% | | 2.03% | | 1.34% | | 1.36% | | 2.28% |
| Supplemental Data | | | | | | | | | | |
| Net assets, end of period (000 omitted) | $ | 3,418,303 | $ | 3,246,258 | $ | 4,847,936 | $ | 3,653,041 | $ | 3,498,064 |
Portfolio turnover rate G | | 26% | | 25% | | 32% | | 24% H | | 23% |
ACalculated based on average shares outstanding during the period.
BNet investment income (loss) is affected by the timing of the declaration of dividends by any underlying mutual funds or exchange-traded funds (ETFs). Net investment income (loss) of any mutual funds or ETFs is not included in the Fund's net investment income (loss) ratio.
CTotal distributions per share do not sum due to rounding.
DTotal returns would have been lower if certain expenses had not been reduced during the applicable periods shown.
EFees and expenses of any underlying mutual funds or exchange-traded funds (ETFs) are not included in the Fund's expense ratio. The Fund indirectly bears its proportionate share of these expenses. For additional expense information related to investments in Fidelity Central Funds, please refer to the "Investments in Fidelity Central Funds" note found in the Notes to Financial Statements section of the most recent Annual or Semi-Annual report.
FExpense ratios reflect operating expenses of the class. Expenses before reductions do not reflect amounts reimbursed, waived, or reduced through arrangements with the investment adviser, brokerage services, or other offset arrangements, if applicable, and do not represent the amount paid by the class during periods when reimbursements, waivers or reductions occur.
GAmount does not include the portfolio activity of any underlying mutual funds or exchange-traded funds (ETFs).
HPortfolio turnover rate excludes securities received or delivered in-kind.
Average annual total return reflects the change in the value of an investment, assuming reinvestment of distributions from dividend income and capital gains (the profits earned upon the sale of securities that have grown in value, if any) and assuming a constant rate of performance each year. The hypothetical investment and the average annual total returns do not reflect the deduction of taxes that a shareholder would pay on fund distributions or the redemption of fund shares. During periods of reimbursement by Fidelity, a fund's total return will be greater than it would be had the reimbursement not occurred. How a fund did yesterday is no guarantee of how it will do tomorrow.
| Average Annual Total Returns |
| | | | |
Periods ended October 31, 2023 | Past 1 year | Past 5 years | Past 10 years |
| Fidelity® Series International Value Fund | 18.99% | 5.87% | 3.26% |
| $10,000 Over 10 Years |
| |
Let's say hypothetically that $10,000 was invested in Fidelity® Series International Value Fund on October 31, 2013. The chart shows how the value of your investment would have changed, and also shows how the MSCI EAFE Value Index performed over the same period. |
|
|
Fidelity® Series International Value Fund
Market Recap:
International (non-U.S.) equities gained 12.27% for the 12 months ending October 31, 2023, according to the MSCI ACWI (All Country World Index) ex USA Index, as global economic expansion and a slowing in the pace of inflation in some markets provided a favorable backdrop for risk assets. After returning -15.86% in 2022, the index's upturn has been largely driven by a narrow set of companies in the information technology and communication services sectors, in part due to excitement for generative artificial intelligence applications. The index gained 14.07% year to date through July, including strong gains in both June (+4.50%) and July (+4.07%). The rally for international equities sputtered for the next three months (-11.33%) amid a stalling pattern in disinflationary trends, heightened global recession and geopolitical risks, soaring yields on longer-term U.S. government bonds and particularly weak economic conditions in the eurozone and China. The three-month decline left non-U.S. stocks up 1.15% year to date through October. Currency fluctuation also helped bolster non-U.S. equity performance overall. For the full 12 months, nearly all regions advanced, with Europe ex U.K. (+18%) and Japan (+17%) leading, whereas Canada (-0.38%) lagged by the widest margin. Each of the 11 sectors advanced, with information technology (+21%) and consumer discretionary (+19%) leading the way. Energy and industrials each rose about 14%. Conversely, four defensive-oriented sectors lagged by the widest margin: real estate (+4%), health care (+6%), consumer staples (+7%) and utilities (+8%).
Comments from Portfolio Manager Alex Zavratsky:
For the fiscal year ending October 31, 2023, the fund gained 18.99%, versus 18.45% for the benchmark MSCI EAFE Value Index (Net MA). From a regional standpoint, an underweight in Asia Pacific ex Japan, primarily in Hong Kong, along with security selection and an overweight in Japan, contributed to the fund's performance versus the benchmark. By sector, an underweight in consumer staples led the way, where an underweight among food, beverage & tobacco stocks contributed most. Smaller-than-benchmark exposure to real estate, especially real estate investment trusts, also helped. An underweight in communication services and outsized exposure financials, primarily among insurance providers, further boosted the fund's relative performance. The top individual relative contributor was our non-benchmark stake in Rheinmetall (+78%). Not owning British American Tobacco, a benchmark component that returned approximately -18%, was the second-largest relative contributor. A larger-than-benchmark position in BAE Systems (+48%) also helped. The stock was one of our largest holdings on October 31. In contrast, on a regional basis, security selection and an underweight in Europe ex the U.K., namely France, in addition to investment choices in the U.K., pressured the fund's relative result. By sector, the biggest detractor from performance versus the benchmark was stock picking in health care, primarily within the pharmaceuticals, biotechnology & life sciences industry. Investment choices in financials, especially among insurance firms, hampered the portfolio's relative return as well. An overweight in information technology also proved detrimental, especially in the semiconductors & semiconductor equipment industry. Lastly, the fund's position in cash was a notable detractor these past 12 months. The largest individual relative detractor was our stake in Prudential (-35%), which we established the past year. The second-largest relative detractor was an underweight in HSBC (+48%), another holding we initiated this period. A non-benchmark stake in Teleperformance (-57%) also hurt. Notable changes in positioning include lower allocations to equity markets in Switzerland and Australia. By sector, meaningful shifts include increased exposure to the consumer discretionary sector and a lower allocation to health care stocks.
The views expressed above reflect those of the portfolio manager(s) only through the end of the period as stated on the cover of this report and do not necessarily represent the views of Fidelity or any other person in the Fidelity organization. Any such views are subject to change at any time based upon market or other conditions and Fidelity disclaims any responsibility to update such views. These views may not be relied on as investment advice and, because investment decisions for a Fidelity fund are based on numerous factors, may not be relied on as an indication of trading intent on behalf of any Fidelity fund.
Fidelity® Series International Value Fund
Top Holdings (% of Fund's net assets) |
| |
| Shell PLC ADR (Netherlands, Oil, Gas & Consumable Fuels) | 4.9 | |
| TotalEnergies SE (France, Oil, Gas & Consumable Fuels) | 3.9 | |
| BHP Group Ltd. (Australia, Metals & Mining) | 3.5 | |
| Toyota Motor Corp. (Japan, Automobiles) | 3.2 | |
| Hitachi Ltd. (Japan, Industrial Conglomerates) | 2.4 | |
| BAE Systems PLC (United Kingdom, Aerospace & Defense) | 2.3 | |
| Mitsubishi UFJ Financial Group, Inc. (Japan, Banks) | 2.2 | |
| AXA SA (France, Insurance) | 2.2 | |
| UBS Group AG (Switzerland, Capital Markets) | 2.1 | |
| Banco Santander SA (Spain) (Spain, Banks) | 2.0 | |
| | 28.7 | |
| |
| Market Sectors (% of Fund's net assets) |
| |
| Financials | 32.1 | |
| Industrials | 15.4 | |
| Energy | 13.0 | |
| Materials | 12.8 | |
| Consumer Discretionary | 8.9 | |
| Health Care | 5.5 | |
| Information Technology | 5.2 | |
| Communication Services | 2.1 | |
| Utilities | 1.0 | |
| Consumer Staples | 0.5 | |
| Real Estate | 0.5 | |
| |
Asset Allocation (% of Fund's net assets) |
|
|
Geographic Diversification (% of Fund's net assets) |
|
* Includes Short-Term investments and Net Other Assets (Liabilities). Percentages are adjusted for the effect of derivatives, if applicable. |
| |
Fidelity® Series International Value Fund
Showing Percentage of Net Assets
| Common Stocks - 96.3% |
| | | Shares | Value ($) |
| Australia - 7.9% | | | |
| BHP Group Ltd. | | 15,741,922 | 445,614,091 |
| Flutter Entertainment PLC (a) | | 295,400 | 46,334,619 |
| Glencore PLC | | 47,508,027 | 251,641,987 |
| Macquarie Group Ltd. | | 1,393,488 | 143,236,597 |
| Woodside Energy Group Ltd. | | 5,546,620 | 120,804,287 |
TOTAL AUSTRALIA | | | 1,007,631,581 |
| Belgium - 0.9% | | | |
| KBC Group NV | | 1,335,887 | 73,360,755 |
| UCB SA | | 566,700 | 41,410,121 |
TOTAL BELGIUM | | | 114,770,876 |
| Canada - 0.1% | | | |
| Nutrien Ltd. | | 162,113 | 8,706,815 |
| Denmark - 0.5% | | | |
| DSV A/S | | 400,400 | 59,715,867 |
| Finland - 1.0% | | | |
| Mandatum Holding OY | | 2,760,087 | 10,665,476 |
| Sampo Oyj (A Shares) | | 2,967,887 | 116,537,321 |
TOTAL FINLAND | | | 127,202,797 |
| France - 12.2% | | | |
| Air Liquide SA | | 952,899 | 163,281,390 |
| Airbus Group NV | | 532,187 | 71,353,619 |
| ALTEN | | 455,908 | 53,690,703 |
| AXA SA | | 9,334,879 | 276,596,436 |
| BNP Paribas SA | | 3,032,570 | 174,384,982 |
| Capgemini SA | | 581,548 | 102,776,274 |
| Teleperformance | | 114,031 | 13,048,968 |
| TotalEnergies SE | | 7,455,392 | 498,448,737 |
| VINCI SA | | 1,216,929 | 134,561,192 |
| Vivendi SA | | 8,587,055 | 76,830,902 |
TOTAL FRANCE | | | 1,564,973,203 |
| Germany - 10.2% | | | |
| Bayer AG (b) | | 2,079,782 | 89,864,393 |
| Covestro AG (a)(b)(c) | | 773,100 | 39,019,416 |
| DHL Group | | 3,003,707 | 116,831,454 |
| Fresenius SE & Co. KGaA | | 2,330,100 | 59,763,206 |
| Hannover Reuck SE | | 736,763 | 162,384,208 |
| Infineon Technologies AG | | 1,455,500 | 42,515,476 |
| Muenchener Rueckversicherungs-Gesellschaft AG in Muenchen | | 427,817 | 171,336,793 |
| Rheinmetall AG | | 653,741 | 187,041,994 |
| RWE AG | | 3,547,600 | 135,621,743 |
| Siemens AG | | 1,831,807 | 243,078,710 |
| Vonovia SE (b) | | 2,637,341 | 60,717,093 |
TOTAL GERMANY | | | 1,308,174,486 |
| Hong Kong - 0.9% | | | |
| Prudential PLC | | 11,173,850 | 116,838,120 |
| India - 0.7% | | | |
| Reliance Industries Ltd. GDR (c) | | 1,584,000 | 86,486,400 |
| Indonesia - 0.6% | | | |
| PT Bank Rakyat Indonesia (Persero) Tbk | | 229,407,037 | 71,731,886 |
| Ireland - 1.5% | | | |
| Bank of Ireland Group PLC | | 11,961,700 | 106,948,901 |
| Ryanair Holdings PLC sponsored ADR (a) | | 1,030,000 | 90,331,000 |
TOTAL IRELAND | | | 197,279,901 |
| Italy - 3.9% | | | |
| Eni SpA | | 14,088,100 | 230,307,492 |
| Mediobanca SpA | | 10,444,955 | 124,553,863 |
| Prysmian SpA | | 1,542,700 | 57,604,956 |
| UniCredit SpA | | 3,267,100 | 81,904,941 |
TOTAL ITALY | | | 494,371,252 |
| Japan - 24.3% | | | |
| Daiichi Sankyo Kabushiki Kaisha | | 713,500 | 18,397,023 |
| DENSO Corp. | | 10,612,284 | 156,704,526 |
| Eisai Co. Ltd. | | 708,800 | 37,551,060 |
| Fast Retailing Co. Ltd. | | 299,600 | 66,330,363 |
| FUJIFILM Holdings Corp. | | 1,497,149 | 81,890,763 |
| Fujitsu Ltd. | | 715,900 | 92,743,091 |
| Hitachi Ltd. | | 4,826,500 | 305,935,558 |
| Hoya Corp. | | 390,509 | 37,593,763 |
| Ibiden Co. Ltd. | | 1,259,644 | 53,706,752 |
| INPEX Corp. | | 6,456,400 | 93,688,017 |
| Itochu Corp. | | 5,109,553 | 184,051,370 |
| LY Corp. | | 12,140,600 | 30,952,297 |
| Minebea Mitsumi, Inc. | | 3,242,551 | 50,840,940 |
| Mitsubishi UFJ Financial Group, Inc. | | 33,427,824 | 280,430,933 |
| NOF Corp. | | 637,600 | 25,153,922 |
| ORIX Corp. | | 8,102,633 | 147,357,333 |
| Renesas Electronics Corp. (a) | | 8,662,600 | 113,788,623 |
| Shin-Etsu Chemical Co. Ltd. | | 5,929,890 | 177,323,745 |
| SoftBank Group Corp. | | 1,434,337 | 58,741,940 |
| Sony Group Corp. | | 1,093,045 | 90,874,544 |
| Sumitomo Mitsui Financial Group, Inc. | | 4,818,363 | 232,283,544 |
| Suzuki Motor Corp. | | 3,293,582 | 127,830,544 |
| TIS, Inc. | | 1,908,556 | 40,871,447 |
| Tokio Marine Holdings, Inc. | | 8,669,945 | 193,966,056 |
| Toyota Motor Corp. | | 23,306,220 | 407,713,172 |
TOTAL JAPAN | | | 3,106,721,326 |
| Korea (South) - 0.8% | | | |
| Samsung Electronics Co. Ltd. | | 2,147,085 | 106,712,471 |
| Luxembourg - 0.3% | | | |
| ArcelorMittal SA (Netherlands) | | 1,746,058 | 38,575,883 |
| Netherlands - 5.3% | | | |
| Shell PLC ADR | | 9,763,748 | 636,010,545 |
| Universal Music Group NV | | 1,955,660 | 47,891,827 |
TOTAL NETHERLANDS | | | 683,902,372 |
| Singapore - 1.1% | | | |
| United Overseas Bank Ltd. | | 7,022,189 | 138,510,576 |
| South Africa - 1.0% | | | |
| Anglo American PLC (United Kingdom) | | 4,565,276 | 116,321,455 |
| Thungela Resources Ltd. (b) | | 739,074 | 6,536,085 |
TOTAL SOUTH AFRICA | | | 122,857,540 |
| Spain - 2.5% | | | |
| Banco Santander SA (Spain) (b) | | 68,958,672 | 252,897,281 |
| Cellnex Telecom SA (c) | | 1,349,538 | 39,671,166 |
| Unicaja Banco SA (c) | | 26,845,131 | 27,893,546 |
TOTAL SPAIN | | | 320,461,993 |
| Sweden - 1.7% | | | |
| Alleima AB | | 69,014 | 419,805 |
| Investor AB (B Shares) | | 10,800,072 | 197,764,354 |
| Sandvik AB | | 1,544,200 | 26,302,387 |
TOTAL SWEDEN | | | 224,486,546 |
| Switzerland - 4.4% | | | |
| Swiss Life Holding AG | | 158,040 | 101,080,275 |
| UBS Group AG (b) | | 11,655,091 | 273,428,435 |
| Zurich Insurance Group Ltd. | | 388,960 | 184,121,559 |
TOTAL SWITZERLAND | | | 558,630,269 |
| United Kingdom - 9.1% | | | |
| AstraZeneca PLC (United Kingdom) | | 1,368,099 | 171,291,128 |
| B&M European Value Retail SA | | 10,108,300 | 64,969,072 |
| BAE Systems PLC | | 21,836,170 | 293,617,483 |
| Barratt Developments PLC | | 18,300,573 | 92,065,563 |
| Beazley PLC | | 8,080,517 | 50,531,434 |
| HSBC Holdings PLC (United Kingdom) | | 8,770,700 | 63,328,186 |
| Imperial Brands PLC | | 2,908,337 | 61,959,766 |
| Lloyds Banking Group PLC | | 205,208,748 | 99,875,096 |
| NatWest Group PLC | | 13,986,100 | 30,431,197 |
| Rolls-Royce Holdings PLC (a) | | 17,875,400 | 47,052,104 |
| Standard Chartered PLC (United Kingdom) | | 25,174,722 | 192,771,280 |
TOTAL UNITED KINGDOM | | | 1,167,892,309 |
| United States of America - 5.4% | | | |
| CRH PLC | | 3,564,508 | 191,538,996 |
| Ferguson PLC | | 542,855 | 81,354,956 |
| Linde PLC | | 443,374 | 169,439,808 |
| Sanofi SA | | 2,719,306 | 246,929,899 |
TOTAL UNITED STATES OF AMERICA | | | 689,263,659 |
| TOTAL COMMON STOCKS (Cost $10,025,345,306) | | | 12,315,898,128 |
| | | | |
| Nonconvertible Preferred Stocks - 0.7% |
| | | Shares | Value ($) |
| Germany - 0.7% | | | |
Porsche Automobil Holding SE (Germany) (Cost $123,513,284) | | 1,897,077 | 84,909,574 |
| | | | |
| Money Market Funds - 3.6% |
| | | Shares | Value ($) |
| Fidelity Cash Central Fund 5.40% (d) | | 292,117,198 | 292,175,622 |
| Fidelity Securities Lending Cash Central Fund 5.40% (d)(e) | | 171,011,057 | 171,028,158 |
| TOTAL MONEY MARKET FUNDS (Cost $463,203,780) | | | 463,203,780 |
| | | | |
| TOTAL INVESTMENT IN SECURITIES - 100.6% (Cost $10,612,062,370) | 12,864,011,482 |
NET OTHER ASSETS (LIABILITIES) - (0.6)% | (77,248,970) |
| NET ASSETS - 100.0% | 12,786,762,512 |
| | |
Legend
| (b) | Security or a portion of the security is on loan at period end. |
| (c) | Security exempt from registration under Rule 144A of the Securities Act of 1933. These securities may be resold in transactions exempt from registration, normally to qualified institutional buyers. At the end of the period, the value of these securities amounted to $193,070,528 or 1.5% of net assets. |
| (d) | Affiliated fund that is generally available only to investment companies and other accounts managed by Fidelity Investments. The rate quoted is the annualized seven-day yield of the fund at period end. A complete unaudited listing of the fund's holdings as of its most recent quarter end is available upon request. In addition, each Fidelity Central Fund's financial statements, which are not covered by the Fund's Report of Independent Registered Public Accounting Firm, are available on the SEC's website or upon request. |
| (e) | Investment made with cash collateral received from securities on loan. |
Affiliated Central Funds
Fiscal year to date information regarding the Fund's investments in Fidelity Central Funds, including the ownership percentage, is presented below.
| Affiliate | Value, beginning of period ($) | Purchases ($) | Sales Proceeds ($) | Dividend Income ($) | Realized Gain (loss) ($) | Change in Unrealized appreciation (depreciation) ($) | Value, end of period ($) | % ownership, end of period |
| Fidelity Cash Central Fund 5.40% | 391,984,399 | 3,296,333,692 | 3,396,142,469 | 12,521,115 | - | - | 292,175,622 | 0.6% |
| Fidelity Securities Lending Cash Central Fund 5.40% | 513,502,912 | 3,775,112,041 | 4,117,586,795 | 4,197,517 | - | - | 171,028,158 | 0.7% |
| Total | 905,487,311 | 7,071,445,733 | 7,513,729,264 | 16,718,632 | - | - | 463,203,780 | |
| | | | | | | | | |
Amounts in the dividend income column in the above table include any capital gain distributions from underlying funds, which are presented in the corresponding line item in the Statement of Operations, if applicable.
Amounts in the dividend income column for Fidelity Securities Lending Cash Central Fund represents the income earned on investing cash collateral, less rebates paid to borrowers and any lending agent fees associated with the loan, plus any premium payments received for lending certain types of securities.
Amounts included in the purchases and sales proceeds columns may include in-kind transactions, if applicable.
Investment Valuation
The following is a summary of the inputs used, as of October 31, 2023, involving the Fund's assets and liabilities carried at fair value. The inputs or methodology used for valuing securities may not be an indication of the risk associated with investing in those securities. For more information on valuation inputs, and their aggregation into the levels used below, please refer to the Investment Valuation section in the accompanying Notes to Financial Statements.
| Valuation Inputs at Reporting Date: |
| Description | Total ($) | Level 1 ($) | Level 2 ($) | Level 3 ($) |
Investments in Securities: | | | | |
|
| Equities: | | | | |
Communication Services | 254,088,132 | 76,830,902 | 177,257,230 | - |
Consumer Discretionary | 1,137,731,977 | 203,369,254 | 934,362,723 | - |
Consumer Staples | 61,959,766 | - | 61,959,766 | - |
Energy | 1,672,281,563 | 729,033,030 | 943,248,533 | - |
Financials | 4,097,151,364 | 2,046,275,481 | 2,050,875,883 | - |
Health Care | 702,800,593 | 101,173,327 | 601,627,266 | - |
Industrials | 1,962,722,558 | 605,929,195 | 1,356,793,363 | - |
Information Technology | 688,695,600 | 53,690,703 | 635,004,897 | - |
Materials | 1,627,037,313 | 447,700,723 | 1,179,336,590 | - |
Real Estate | 60,717,093 | - | 60,717,093 | - |
Utilities | 135,621,743 | 135,621,743 | - | - |
|
| Money Market Funds | 463,203,780 | 463,203,780 | - | - |
| Total Investments in Securities: | 12,864,011,482 | 4,862,828,138 | 8,001,183,344 | - |
Fidelity® Series International Value Fund
| Statement of Assets and Liabilities |
| | | | October 31, 2023 |
| | | | | |
| Assets | | | | |
| Investment in securities, at value (including securities loaned of $157,742,574) - See accompanying schedule: | | | | |
Unaffiliated issuers (cost $10,148,858,590) | $ | 12,400,807,702 | | |
Fidelity Central Funds (cost $463,203,780) | | 463,203,780 | | |
| | | | | |
| | | | | |
| Total Investment in Securities (cost $10,612,062,370) | | | $ | 12,864,011,482 |
| Foreign currency held at value (cost $14,785) | | | | 14,785 |
| Receivable for investments sold | | | | 50,336,487 |
| Receivable for fund shares sold | | | | 171,444,581 |
| Dividends receivable | | | | 46,235,351 |
| Reclaims receivable | | | | 38,195,542 |
| Interest receivable | | | | 40,967 |
| Distributions receivable from Fidelity Central Funds | | | | 1,035,461 |
| Other receivables | | | | 245 |
Total assets | | | | 13,171,314,901 |
| Liabilities | | | | |
| Payable to custodian bank | $ | 371 | | |
| Payable for investments purchased | | 170,538,757 | | |
| Payable for fund shares redeemed | | 42,738,470 | | |
| Other payables and accrued expenses | | 246,633 | | |
| Collateral on securities loaned | | 171,028,158 | | |
| Total Liabilities | | | | 384,552,389 |
| Net Assets | | | $ | 12,786,762,512 |
| Net Assets consist of: | | | | |
| Paid in capital | | | $ | 11,330,904,984 |
| Total accumulated earnings (loss) | | | | 1,455,857,528 |
| Net Assets | | | $ | 12,786,762,512 |
Net Asset Value, offering price and redemption price per share ($12,786,762,512 ÷ 1,201,493,317 shares) | | | $ | 10.64 |
| Statement of Operations |
| | | | Year ended October 31, 2023 |
| Investment Income | | | | |
| Dividends | | | $ | 485,370,192 |
| Interest | | | | 68,743 |
| Income from Fidelity Central Funds (including $4,197,517 from security lending) | | | | 16,718,632 |
| Income before foreign taxes withheld | | | $ | 502,157,567 |
| Less foreign taxes withheld | | | | (41,577,647) |
| Total Income | | | | 460,579,920 |
| Expenses | | | | |
| Custodian fees and expenses | $ | 752,777 | | |
| Independent trustees' fees and expenses | | 75,957 | | |
| Interest | | 70,341 | | |
| Total expenses before reductions | | 899,075 | | |
| Expense reductions | | (2,621) | | |
| Total expenses after reductions | | | | 896,454 |
| Net Investment income (loss) | | | | 459,683,466 |
| Realized and Unrealized Gain (Loss) | | | | |
| Net realized gain (loss) on: | | | | |
| Investment Securities: | | | | |
| Unaffiliated issuers | | 67,030,007 | | |
| Redemptions in-kind | | 125,106,946 | | |
| Foreign currency transactions | | (1,824,091) | | |
| Total net realized gain (loss) | | | | 190,312,862 |
| Change in net unrealized appreciation (depreciation) on: | | | | |
| Investment Securities: | | | | |
| Unaffiliated issuers | | 1,673,297,390 | | |
| Assets and liabilities in foreign currencies | | 2,450,327 | | |
| Total change in net unrealized appreciation (depreciation) | | | | 1,675,747,717 |
| Net gain (loss) | | | | 1,866,060,579 |
| Net increase (decrease) in net assets resulting from operations | | | $ | 2,325,744,045 |
| Statement of Changes in Net Assets |
| |
| | Year ended October 31, 2023 | | Year ended October 31, 2022 |
| Increase (Decrease) in Net Assets | | | | |
| Operations | | | | |
| Net investment income (loss) | $ | 459,683,466 | $ | 571,708,614 |
| Net realized gain (loss) | | 190,312,862 | | (148,251,550) |
| Change in net unrealized appreciation (depreciation) | | 1,675,747,717 | | (2,774,795,334) |
| Net increase (decrease) in net assets resulting from operations | | 2,325,744,045 | | (2,351,338,270) |
| Distributions to shareholders | | (425,784,758) | | (770,910,384) |
| | | | | |
| Share transactions | | | | |
| Proceeds from sales of shares | | 1,992,285,965 | | 2,577,499,861 |
| Reinvestment of distributions | | 425,784,758 | | 770,910,384 |
| Cost of shares redeemed | | (3,899,245,756) | | (3,188,665,043) |
| | | | | |
Net increase (decrease) in net assets resulting from share transactions | | (1,481,175,033) | | 159,745,202 |
| Total increase (decrease) in net assets | | 418,784,254 | | (2,962,503,452) |
| | | | | |
| Net Assets | | | | |
| Beginning of period | | 12,367,978,258 | | 15,330,481,710 |
| End of period | $ | 12,786,762,512 | $ | 12,367,978,258 |
| | | | | |
| Other Information | | | | |
| Shares | | | | |
| Sold | | 187,826,877 | | 248,540,462 |
| Issued in reinvestment of distributions | | 42,493,489 | | 70,596,189 |
| Redeemed | | (368,035,186) | | (298,779,921) |
| Net increase (decrease) | | (137,714,820) | | 20,356,730 |
| | | | | |
Financial Highlights
| Fidelity® Series International Value Fund |
| |
| Years ended October 31, | | 2023 | | 2022 | | 2021 | | 2020 | | 2019 |
Selected Per-Share Data | | | | | | | | | | |
| Net asset value, beginning of period | $ | 9.24 | $ | 11.62 | $ | 8.25 | $ | 9.82 | $ | 9.68 |
| Income from Investment Operations | | | | | | | | | | |
Net investment income (loss) A,B | | .37 | | .42 | | .43 C | | .26 | | .39 |
| Net realized and unrealized gain (loss) | | 1.36 | | (2.24) | | 3.23 | | (1.43) | | .10 |
| Total from investment operations | | 1.73 | | (1.82) | | 3.66 | | (1.17) | | .49 |
| Distributions from net investment income | | (.33) | | (.56) | �� | (.29) | | (.36) | | (.35) |
| Distributions from net realized gain | | - | | - | | - | | (.04) | | - |
| Total distributions | | (.33) | | (.56) | | (.29) | | (.40) | | (.35) |
| Net asset value, end of period | $ | 10.64 | $ | 9.24 | $ | 11.62 | $ | 8.25 | $ | 9.82 |
Total Return D | | 18.99% | | (16.40)% | | 44.95% | | (12.55)% | | 5.48% |
Ratios to Average Net Assets B,E,F | | | | | | | | | | |
| Expenses before reductions | | .01% | | .01% | | .01% | | .01% | | .01% |
| Expenses net of fee waivers, if any | | .01% | | .01% | | .01% | | .01% | | .01% |
| Expenses net of all reductions | | .01% | | .01% | | .01% | | .01% | | .01% |
| Net investment income (loss) | | 3.42% | | 4.09% | | 3.97% C | | 2.92% | | 4.23% |
| Supplemental Data | | | | | | | | | | |
| Net assets, end of period (000 omitted) | $ | 12,786,763 | $ | 12,367,978 | $ | 15,330,482 | $ | 11,605,710 | $ | 15,992,396 |
Portfolio turnover rate G | | 30% H | | 31% H | | 34% | | 36% H | | 41% |
ACalculated based on average shares outstanding during the period.
BNet investment income (loss) is affected by the timing of the declaration of dividends by any underlying mutual funds or exchange-traded funds (ETFs). Net investment income (loss) of any mutual funds or ETFs is not included in the Fund's net investment income (loss) ratio.
CNet investment income per share reflects one or more large, non-recurring dividend(s) which amounted to $.11 per share. Excluding such non-recurring dividend(s), the ratio of net investment income (loss) to average net assets would have been 3.00%.
DTotal returns would have been lower if certain expenses had not been reduced during the applicable periods shown.
EFees and expenses of any underlying mutual funds or exchange-traded funds (ETFs) are not included in the Fund's expense ratio. The Fund indirectly bears its proportionate share of these expenses. For additional expense information related to investments in Fidelity Central Funds, please refer to the "Investments in Fidelity Central Funds" note found in the Notes to Financial Statements section of the most recent Annual or Semi-Annual report.
FExpense ratios reflect operating expenses of the class. Expenses before reductions do not reflect amounts reimbursed, waived, or reduced through arrangements with the investment adviser, brokerage services, or other offset arrangements, if applicable, and do not represent the amount paid by the class during periods when reimbursements, waivers or reductions occur.
GAmount does not include the portfolio activity of any underlying mutual funds or exchange-traded funds (ETFs).
HPortfolio turnover rate excludes securities received or delivered in-kind.
For the period ended October 31, 2023
1. Organization.
Fidelity Series Emerging Markets Fund, Fidelity Series Emerging Markets Opportunities Fund, Fidelity Series International Growth Fund, Fidelity Series International Small Cap Fund and Fidelity Series International Value Fund (the Funds) are funds of Fidelity Investment Trust (the Trust). The Trust is registered under the Investment Company Act of 1940, as amended (the 1940 Act), as an open-end management investment company organized as a Massachusetts business trust. Each Fund is authorized to issue an unlimited number of shares. Shares are offered only to certain other Fidelity funds, Fidelity managed 529 plans, and Fidelity managed collective investment trusts. Investments in emerging markets, if applicable, can be subject to social, economic, regulatory, and political uncertainties and can be extremely volatile.
2. Investments in Fidelity Central Funds.
Funds may invest in Fidelity Central Funds, which are open-end investment companies generally available only to other investment companies and accounts managed by the investment adviser and its affiliates. The Schedule of Investments lists any Fidelity Central Funds held as an investment as of period end, but does not include the underlying holdings of each Fidelity Central Fund. An investing fund indirectly bears its proportionate share of the expenses of the underlying Fidelity Central Funds.
Based on its investment objective, each Fidelity Central Fund may invest or participate in various investment vehicles or strategies that are similar to those of the investing fund. These strategies are consistent with the investment objectives of the investing fund and may involve certain economic risks which may cause a decline in value of each of the Fidelity Central Funds and thus a decline in the value of the investing fund.
| Fidelity Central Fund | Investment Manager | Investment Objective | Investment Practices | Expense RatioA |
| Fidelity Money Market Central Funds | Fidelity Management & Research Company LLC (FMR) | Each fund seeks to obtain a high level of current income consistent with the preservation of capital and liquidity. | Short-term Investments | Less than .005% |
A Expenses expressed as a percentage of average net assets and are as of each underlying Central Fund's most recent annual or semi-annual shareholder report.
A complete unaudited list of holdings for each Fidelity Central Fund is available upon request or at the Securities and Exchange Commission website at www.sec.gov. In addition, the financial statements of the Fidelity Central Funds which contain the significant accounting policies (including investment valuation policies) of those funds, and are not covered by the Report of Independent Registered Public Accounting Firm, are available on the Securities and Exchange Commission website or upon request.
3. Significant Accounting Policies.
Each Fund is an investment company and applies the accounting and reporting guidance of the Financial Accounting Standards Board (FASB) Accounting Standards Codification Topic 946 Financial Services - Investment Companies. The financial statements have been prepared in conformity with accounting principles generally accepted in the United States of America (GAAP), which require management to make certain estimates and assumptions at the date of the financial statements. Actual results could differ from those estimates. Subsequent events, if any, through the date that the financial statements were issued have been evaluated in the preparation of the financial statements. Each Fund's Schedule of Investments lists any underlying mutual funds or exchange-traded funds (ETFs) but does not include the underlying holdings of these funds. The following summarizes the significant accounting policies of each Fund:
Investment Valuation. Investments are valued as of 4:00 p.m. Eastern time on the last calendar day of the period. The Board of Trustees (the Board) has designated each Fund's investment adviser as the valuation designee responsible for the fair valuation function and performing fair value determinations as needed. The investment adviser has established a Fair Value Committee (the Committee) to carry out the day-to-day fair valuation responsibilities and has adopted policies and procedures to govern the fair valuation process and the activities of the Committee. In accordance with these fair valuation policies and procedures, which have been approved by the Board, each Fund attempts to obtain prices from one or more third party pricing services or brokers to value its investments. When current market prices, quotations or currency exchange rates are not readily available or reliable, investments will be fair valued in good faith by the Committee, in accordance with the policies and procedures. Factors used in determining fair value vary by investment type and may include market or investment specific events, transaction data, estimated cash flows, and market observations of comparable investments. The frequency that the fair valuation procedures are used cannot be predicted and they may be utilized to a significant extent. The Committee manages each Fund's fair valuation practices and maintains the fair valuation policies and procedures. Each Fund's investment adviser reports to the Board information regarding the fair valuation process and related material matters.
Each Fund categorizes the inputs to valuation techniques used to value its investments into a disclosure hierarchy consisting of three levels as shown below:
Level 1 - unadjusted quoted prices in active markets for identical investments
Level 2 - other significant observable inputs (including quoted prices for similar investments, interest rates, prepayment speeds, etc.)
Level 3 - unobservable inputs (including the Fund's own assumptions based on the best information available)
Valuation techniques used to value each Fund's investments by major category are as follows:
Equity securities, including restricted securities, for which market quotations are readily available, are valued at the last reported sale price or official closing price as reported by a third party pricing service on the primary market or exchange on which they are traded and are categorized as Level 1 in the hierarchy. In the event there were no sales during the day or closing prices are not available, securities are valued at the last quoted bid price or may be valued using the last available price and are generally categorized as Level 2 in the hierarchy. For foreign equity securities, when market or security specific events arise, comparisons to the valuation of American Depositary Receipts (ADRs), futures contracts, ETFs and certain indexes as well as quoted prices for similar securities may be used and would be categorized as Level 2 in the hierarchy. For equity securities, including restricted securities, where observable inputs are limited, assumptions about market activity and risk are used and these securities may be categorized as Level 3 in the hierarchy. Securities, including private placements or other restricted securities, for which observable inputs are not available are valued using alternate valuation approaches, including the market approach, the income approach and cost approach, and are categorized as Level 3 in the hierarchy. The market approach considers factors including the price of recent investments in the same or a similar security or financial metrics of comparable securities. The income approach considers factors including expected future cash flows, security specific risks and corresponding discount rates. The cost approach considers factors including the value of the security's underlying assets and liabilities.
Debt securities, including restricted securities, are valued based on evaluated prices received from third party pricing services or from brokers who make markets in such securities. Corporate bonds and U.S. government and government agency obligations are valued by pricing services who utilize matrix pricing which considers yield or price of bonds of comparable quality, coupon, maturity and type or by broker-supplied prices. When independent prices are unavailable or unreliable, debt securities may be valued utilizing pricing methodologies which consider similar factors that would be used by third party pricing services. Debt securities are generally categorized as Level 2 in the hierarchy but may be Level 3 depending on the circumstances. ETFs are valued at their last sale price or official closing price as reported by a third party pricing service on the primary market or exchange on which they are traded and are categorized as Level 1 in the hierarchy. In the event there were no sales during the day but the exchange reports a closing bid level, ETFs are valued at the closing bid and would be categorized as Level 1 in the hierarchy. In the event there was no closing bid, ETFs may be valued by another method that the Board believes reflects fair value in accordance with the Board's fair value pricing policies and may be categorized as Level 2 in the hierarchy.
Futures contracts are valued at the settlement price established each day by the board of trade or exchange on which they are traded and are categorized as Level 1 in the hierarchy. Investments in open-end mutual funds, including the Fidelity Central Funds, are valued at their closing net asset value (NAV) each business day and are categorized as Level 1 in the hierarchy.
The following provides information on Level 3 securities held by the Fund that were valued at period end based on unobservable inputs. These amounts exclude valuations provided by a broker.
Fidelity Series Emerging Markets Opportunities Fund:
| Asset Type | Fair Value | Valuation Technique(s) | Unobservable Input | Amount or Range/Weighted Average | Impact to Valuation from an Increase in InputA |
| Equities | $ 374,074,963 | Market comparable | Enterprise value/Revenue multiple (EV/R) | 2.5 - 9.8 / 4.5 | Increase |
| | | Market approach | Transaction price | $13.75 - $15.25 / $14.50 | Increase |
| | | | Discount rate | 20.0% - 50.0% / 20.8% | Decrease |
| | | Indicative market price | Bid price | $65.00 | Increase |
| | | Recovery value | Recovery value | $0.00 | Increase |
| | | Black scholes | Discount rate | 4.9% | Increase |
| | | | Volatility | 60.0% | Increase |
| | | | Term | 3.0 | Increase |
| Corporate Bonds | $ 46,132,823 | Market comparable | Enterprise value/Revenue multiple (EV/R) | 6.0 | Increase |
| | | Discounted cash flow | Discount rate | 4.3% | Decrease |
A Represents the directional change in the fair value of the Level 3 investments that could have resulted from an increase in the corresponding input as of period end. A decrease to the unobservable input would have had the opposite effect. Significant changes in these inputs may have resulted in a significantly higher or lower fair value measurement at period end.
Changes in valuation techniques may result in transfers in or out of an assigned level within the disclosure hierarchy. The aggregate value of investments by input level as of October 31, 2023, as well as a roll forward of Level 3 investments, is included at the end of each Fund's Schedule of Investments.
Foreign Currency. Certain Funds may use foreign currency contracts to facilitate transactions in foreign-denominated securities. Gains and losses from these transactions may arise from changes in the value of the foreign currency or if the counterparties do not perform under the contracts' terms.
Foreign-denominated assets, including investment securities, and liabilities are translated into U.S. dollars at the exchange rates at period end. Purchases and sales of investment securities, income and dividends received, and expenses denominated in foreign currencies are translated into U.S. dollars at the exchange rate in effect on the transaction date.
The effects of exchange rate fluctuations on investments are included with the net realized and unrealized gain (loss) on investment securities. Other foreign currency transactions resulting in realized and unrealized gain (loss) are disclosed separately.
Investment Transactions and Income. For financial reporting purposes, the Funds' investment holdings and NAV include trades executed through the end of the last business day of the period. The NAV per share for processing shareholder transactions is calculated as of the close of business of the New York Stock Exchange (NYSE), normally 4:00 p.m. Eastern time and includes trades executed through the end of the prior business day. Gains and losses on securities sold are determined on the basis of identified cost and for certain Funds include proceeds received from litigation. Commissions paid to certain brokers with whom the investment adviser, or its affiliates, places trades on behalf of a fund include an amount in addition to trade execution, which may be rebated back to a fund. Any such rebates are included in net realized gain (loss) on investments in the Statement of Operations. Dividend income is recorded on the ex-dividend date, except for certain dividends from foreign securities where the ex-dividend date may have passed, which are recorded as soon as the Funds are informed of the ex-dividend date. Non-cash dividends included in dividend income, if any, are recorded at the fair market value of the securities received. Income and capital gain distributions from Fidelity Central Funds, if any, are recorded on the ex-dividend date. Certain distributions received by the Funds represent a return of capital or capital gain. The Funds determine the components of these distributions subsequent to the ex-dividend date, based upon receipt of tax filings or other correspondence relating to the underlying investment. These distributions are recorded as a reduction of cost of investments and/or as a realized gain. Interest income is accrued as earned and includes coupon interest and amortization of premium and accretion of discount on debt securities as applicable. Investment income is recorded net of foreign taxes withheld where recovery of such taxes is uncertain. Funds may file withholding tax reclaims in certain jurisdictions to recover a portion of amounts previously withheld. Any withholding tax reclaims income is included in the Statement of Operations in foreign taxes withheld. Any receivables for withholding tax reclaims are included in the Statement of Assets and Liabilities in dividends receivable or reclaims receivable, as applicable. Fidelity Series International Small Cap Fund has filed tax reclaims for previously withheld taxes on dividends earned in certain European Union (EU) countries. These additional filings are subject to various administrative proceedings by the local jurisdictions' tax authorities within the EU, as well as a number of related judicial proceedings. Income recognized for EU reclaims is included with other reclaims in the Statement of Operations in foreign taxes withheld. These reclaims are recorded when the amount is known and there are no significant uncertainties on collectability. Fidelity Series Emerging Markets Fund did not recognize dividend income during the period on certain Russian securities due to restrictions imposed by the Russian government on these dividend payments. There is uncertainty regarding the timeline for these restrictions to be lifted and the collectability of these and future dividend payments on Russian securities.
Expenses. Expenses directly attributable to a fund are charged to that fund. Expenses attributable to more than one fund are allocated among the respective funds on the basis of relative net assets or other appropriate methods. Expenses included in the accompanying financial statements reflect the expenses of that fund and do not include any expenses associated with any underlying mutual funds or exchange-traded funds. Although not included in a fund's expenses, a fund indirectly bears its proportionate share of these expenses through the net asset value of each underlying mutual fund or exchange-traded fund. Expense estimates are accrued in the period to which they relate and adjustments are made when actual amounts are known.
Income Tax Information and Distributions to Shareholders. Each year, each Fund intends to qualify as a regulated investment company under Subchapter M of the Internal Revenue Code, including distributing substantially all of its taxable income and realized gains. As a result, no provision for U.S. Federal income taxes is required. As of October 31, 2023, each Fund did not have any unrecognized tax benefits in the financial statements; nor is each Fund aware of any tax positions for which it is reasonably possible that the total amounts of unrecognized tax benefits will significantly change in the next twelve months. Each Fund files a U.S. federal tax return, in addition to state and local tax returns as required. Each Fund's federal income tax returns are subject to examination by the Internal Revenue Service (IRS) for a period of three fiscal years after they are filed. State and local tax returns may be subject to examination for an additional fiscal year depending on the jurisdiction. Foreign taxes are provided for based on each Fund's understanding of the tax rules and rates that exist in the foreign markets in which it invests Fidelity Series Emerging Markets Fund, Fidelity Series Emerging Markets Opportunities Fund, Fidelity Series International Growth Fund and Fidelity Series International Small Cap Fund are subject to a tax imposed on capital gains by certain countries in which they invest. An estimated deferred tax liability for net unrealized appreciation on the applicable securities is included in Deferred taxes or Other payables and accrued expenses on each applicable Fund's Statement of Assets & Liabilities.
Distributions are declared and recorded on the ex-dividend date. Income and capital gain distributions are determined in accordance with income tax regulations, which may differ from GAAP. In addition, the Funds claimed a portion of the payment made to redeeming shareholders as a distribution for income tax purposes.
Capital accounts within the financial statements are adjusted for permanent book-tax differences. These adjustments have no impact on net assets or the results of operations. Capital accounts are not adjusted for temporary book-tax differences which will reverse in a subsequent period.
Book-tax differences are primarily due to futures contracts, foreign currency transactions, certain foreign taxes, passive foreign investment companies (PFIC), redemptions in-kind, capital loss carryforwards and losses deferred due to wash sales.
As of period end, the cost and unrealized appreciation (depreciation) in securities, and derivatives if applicable, for federal income tax purposes were as follows for each Fund:
| | Tax cost | Gross unrealized appreciation | Gross unrealized depreciation | Net unrealized appreciation (depreciation) |
Fidelity Series Emerging Markets Fund | $4,918,458,539 | $429,640,496 | $ (479,478,850) | $ (49,838,354) |
Fidelity Series Emerging Markets Opportunities Fund | 19,959,704,346 | 4,366,341,080 | (3,711,907,052) | 654,434,028 |
Fidelity Series International Growth Fund | 9,065,584,934 | 4,261,664,018 | (471,568,876) | 3,790,095,142 |
Fidelity Series International Small Cap Fund | 3,056,488,016 | 807,805,973 | (438,534,405) | 369,271,568 |
| Fidelity Series International Value Fund | 10,815,895,056 | 2,670,463,160 | (622,346,734) | 2,048,116,426 |
The tax-based components of distributable earnings as of period end were as follows for each Fund:
| | Undistributed ordinary income | Undistributed long-term capital gain | Capital loss carryforward | Net unrealized appreciation (depreciation) on securities and other investments |
Fidelity Series Emerging Markets Fund | $107,719,166 | $ - | $ (544,644,298) | $ (49,935,872) |
Fidelity Series Emerging Markets Opportunities Fund | 529,987,738 | - | (1,817,785,323) | 653,812,421 |
Fidelity Series International Growth Fund | 156,463,871 | - | (176,883,349) | 3,789,409,571 |
Fidelity Series International Small Cap Fund | 77,948,649 | 46,111,788 | - | 369,042,653 |
| Fidelity Series International Value Fund | 410,344,554 | - | (999,877,736) | 2,045,390,711 |
Capital loss carryforwards are only available to offset future capital gains of the Funds to the extent provided by regulations and may be limited. The capital loss carryforward information presented below, including any applicable limitation, is estimated as of fiscal period end and is subject to adjustment.
| | Short-term | Long-term | Total capital loss carryforward |
Fidelity Series Emerging Markets Fund | $ (416,445,717) | $ (128,198,581) | $ (544,644,298) |
Fidelity Series Emerging Markets Opportunities Fund | (1,148,522,328) | (669,262,994) | (1,817,785,322) |
Fidelity Series International Growth Fund | (49,487,799) | (127,395,550) | (176,883,349) |
| | | | |
| Fidelity Series International Value Fund | (999,877,736) | - | (999,877,736) |
The tax character of distributions paid was as follows:
| October 31, 2023 | | | |
| | Ordinary Income | Long-term Capital Gains | Total |
Fidelity Series Emerging Markets Fund | $65,273,730 | $ - | $65,273,730 |
Fidelity Series Emerging Markets Opportunities Fund | 559,062,771 | - | 559,062,771 |
Fidelity Series International Growth Fund | 172,554,159 | 262,282,322 | 434,836,481 |
Fidelity Series International Small Cap Fund | 47,608,217 | 164,058,361 | 211,666,578 |
| Fidelity Series International Value Fund | 425,784,758 | - | 425,784,758 |
| October 31, 2022 | | | |
| | Ordinary Income | Long-term Capital Gains | Total |
Fidelity Series Emerging Markets Fund | $105,313,301 | $ - | $105,313,301 |
Fidelity Series Emerging Markets Opportunities Fund | 1,355,505,288 | 1,975,800,325 | 3,331,305,613 |
Fidelity Series International Growth Fund | 332,369,715 | 896,087,260 | 1,228,456,975 |
Fidelity Series International Small Cap Fund | 97,971,051 | 464,964,235 | 562,935,286 |
| Fidelity Series International Value Fund | 770,910,384 | - | 770,910,384 |
Delayed Delivery Transactions and When-Issued Securities. During the period, certain Funds transacted in securities on a delayed delivery or when-issued basis. Payment and delivery may take place after the customary settlement period for that security. The price of the underlying securities and the date when the securities will be delivered and paid for are fixed at the time the transaction is negotiated. Securities purchased on a delayed delivery or when-issued basis are identified as such in the Schedule of Investments. Compensation for interest forgone in the purchase of a delayed delivery or when-issued debt security may be received. With respect to purchase commitments, each applicable Fund identifies securities as segregated in its records with a value at least equal to the amount of the commitment. Payables and receivables associated with the purchases and sales of delayed delivery securities having the same coupon, settlement date and broker are offset. Delayed delivery or when-issued securities that have been purchased from and sold to different brokers are reflected as both payables and receivables in the Statement of Assets and Liabilities under the caption "Delayed delivery", as applicable. Losses may arise due to changes in the value of the underlying securities or if the counterparty does not perform under the contract's terms, or if the issuer does not issue the securities due to political, economic, or other factors.
Restricted Securities (including Private Placements). Funds may invest in securities that are subject to legal or contractual restrictions on resale. These securities generally may be resold in transactions exempt from registration or to the public if the securities are registered. Disposal of these securities may involve time-consuming negotiations and expense, and prompt sale at an acceptable price may be difficult. Information regarding restricted securities held at period end is included at the end of the Schedule of Investments, if applicable.
New Accounting Pronouncement. In June 2022, the Financial Accounting Standards Board (FASB) issued Accounting Standards Update (ASU) 2022-03 Fair Value Measurement (Topic 820): Fair Value Measurement of Equity Securities Subject to Contractual Sale Restrictions. The amendments in this ASU clarify that a contractual restriction on the sale of an equity security is not considered part of the unit of account of the equity security and, therefore, is not considered in measuring fair value. They also clarify that an entity cannot, as a separate unit of account, recognize and measure a contractual sale restriction. They also require additional disclosures for equity securities subject to contractual sale restrictions. ASU 2022-03 will be effective for fiscal years, including interim periods within those fiscal years, beginning after December 15, 2023, and allows for early adoption. ASU 2022-03 will only be applicable to an equity security in which the contractual arrangement that restricts its sale is executed or modified on or after the adoption date. Management is currently evaluating the potential impact of ASU 2022-03 to the financial statements.
4. Derivative Instruments.
Risk Exposures and the Use of Derivative Instruments. Each Fund's investment objectives allow for various types of derivative instruments, including futures contracts. Derivatives are investments whose value is primarily derived from underlying assets, indices or reference rates and may be transacted on an exchange or over-the-counter (OTC). Derivatives may involve a future commitment to buy or sell a specified asset based on specified terms, to exchange future cash flows at periodic intervals based on a notional principal amount, or for one party to make one or more payments upon the occurrence of specified events in exchange for periodic payments from the other party.
Derivatives were used to increase returns and to manage exposure to certain risks as defined below. The success of any strategy involving derivatives depends on analysis of numerous economic factors, and if the strategies for investment do not work as intended, the objectives may not be achieved.
Derivatives were used to increase or decrease exposure to the following risk(s):
| | |
| Equity Risk | Equity risk relates to the fluctuations in the value of financial instruments as a result of changes in market prices (other than those arising from interest rate risk or foreign exchange risk), whether caused by factors specific to an individual investment, its issuer, or all factors affecting all instruments traded in a market or market segment. |
Funds are also exposed to additional risks from investing in derivatives, such as liquidity risk and counterparty credit risk. Liquidity risk is the risk that a fund will be unable to close out the derivative in the open market in a timely manner. Counterparty credit risk is the risk that the counterparty will not be able to fulfill its obligation to a fund. Counterparty credit risk related to exchange-traded contracts may be mitigated by the protection provided by the exchange on which they trade.
Investing in derivatives may involve greater risks than investing in the underlying assets directly and, to varying degrees, may involve risk of loss in excess of any initial investment and collateral received and amounts recognized in the Statement of Assets and Liabilities. In addition, there may be the risk that the change in value of the derivative contract does not correspond to the change in value of the underlying instrument.
Futures Contracts. A futures contract is an agreement between two parties to buy or sell a specified underlying instrument for a fixed price at a specified future date. Futures contracts were used to manage exposure to the stock market.
Upon entering into a futures contract, a fund is required to deposit either cash or securities (initial margin) with a clearing broker in an amount equal to a certain percentage of the face value of the contract. Futures contracts are marked-to-market daily and subsequent daily payments are made or received by a fund depending on the daily fluctuations in the value of the futures contracts and are recorded as unrealized appreciation or (depreciation). This receivable and/or payable, if any, is included in daily variation margin on futures contracts in the Statement of Assets and Liabilities. Realized gain or (loss) is recorded upon the expiration or closing of a futures contract. The net realized gain (loss) and change in net unrealized appreciation (depreciation) on futures contracts during the period is presented in the Statement of Operations.
Any open futures contracts at period end are presented in the Schedule of Investments under the caption "Futures Contracts". The notional amount at value reflects each contract's exposure to the underlying instrument or index at period end, and is representative of volume of activity during the period unless an average notional amount is presented. Any securities deposited to meet initial margin requirements are identified in the Schedule of Investments. Any cash deposited to meet initial margin requirements is presented as segregated cash with brokers for derivative instruments in the Statement of Assets and Liabilities.
5. Purchases and Sales of Investments.
Purchases and sales of securities, other than short-term securities, U.S. government securities and in-kind transactions, as applicable, are noted in the table below.
| | Purchases ($) | Sales ($) |
| Fidelity Series Emerging Markets Fund | 5,118,633,788 | 3,048,839,852 |
| Fidelity Series Emerging Markets Opportunities Fund | 9,079,118,043 | 13,156,198,514 |
| Fidelity Series International Growth Fund | 2,418,777,172 | 2,730,206,467 |
| Fidelity Series International Small Cap Fund | 970,180,533 | 930,180,882 |
| Fidelity Series International Value Fund | 3,961,094,059 | 4,970,606,875 |
Unaffiliated Redemptions In-Kind. Shares that were redeemed in-kind for investments, including accrued interest and cash, if any, are shown in the table below. The net realized gain or loss on investments delivered through in-kind redemptions is included in the "Net realized gain (loss) on: Redemptions in-kind" line in the accompanying Statement of Operations. The amount of the in-kind redemptions is included in share transactions in the accompanying Statement of Changes in Net Assets. There was no gain or loss for federal income tax purposes.
| | Shares | Total net realized gain or loss ($) | Total Proceeds ($) | |
| Fidelity Series International Growth Fund | 24,781,944 | 187,812,495 | 380,697,437 | |
| Fidelity Series International Value Fund | 36,205,694 | 125,106,946 | 383,424,293 | |
| | | | | |
6. Fees and Other Transactions with Affiliates.
Management Fee. Fidelity Management & Research Company LLC (the investment adviser) and its affiliates provide the Funds with investment management related services for which the Funds do not pay a management fee. Under the management contract, the investment adviser or an affiliate pays all ordinary operating expenses of the Funds, except custody fees, fees and expenses of the independent Trustees, and certain miscellaneous expenses such as proxy and shareholder meeting expenses.
Brokerage Commissions. A portion of portfolio transactions were placed with brokerage firms which are affiliates of the investment adviser. Brokerage commissions are included in net realized gain (loss) and change in net unrealized appreciation (depreciation) in the Statement of Operations. The commissions paid to these affiliated firms were as follows:
| | Amount |
| Fidelity Series Emerging Markets Fund | $1,022 |
| Fidelity Series Emerging Markets Opportunities Fund | 66,288 |
| Fidelity Series International Growth Fund | 4,177 |
| Fidelity Series International Small Cap Fund | 1,264 |
| Fidelity Series International Value Fund | 5,913 |
Interfund Lending Program. Pursuant to an Exemptive Order issued by the Securities and Exchange Commission (the SEC), each Fund, along with other registered investment companies having management contracts with Fidelity Management & Research Company LLC (FMR), or other affiliated entities of FMR, may participate in an interfund lending program. This program provides an alternative credit facility allowing each Fund to borrow from, or lend money to, other participating affiliated funds. At period end, there were no interfund loans outstanding. Activity in this program during the period for which loans were outstanding was as follows:
| | Borrower or Lender | Average Loan Balance | Weighted Average Interest Rate | Interest Expense |
Fidelity Series Emerging Markets Opportunities Fund | Borrower | $ 235,012,250 | 5.13% | $ 134,061 |
Fidelity Series International Growth Fund | Borrower | $86,931,000 | 4.21% | $ 20,320 |
| Fidelity Series International Value Fund | Borrower | $ 68,204,125 | 4.64% | $ 70,341 |
Interfund Trades. Funds may purchase from or sell securities to other Fidelity Funds under procedures adopted by the Board. The procedures have been designed to ensure these interfund trades are executed in accordance with Rule 17a-7 of the 1940 Act. Any interfund trades are included within the respective purchases and sales amounts shown in the Purchases and Sales of Investments note. Interfund trades during the period are noted in the table below.
| | Purchases ($) | Sales ($) | Realized Gain (Loss) ($) |
| Fidelity Series Emerging Markets Fund | 28,621,316 | 41,737,288 | (8,537,426) |
| Fidelity Series Emerging Markets Opportunities Fund | 75,799,167 | 210,607,439 | (8,054,769) |
| Fidelity Series International Growth Fund | 128,171,572 | 64,705,596 | (17,445,749) |
| Fidelity Series International Small Cap Fund | 26,101,074 | 21,522,668 | (1,058,307) |
| Fidelity Series International Value Fund | 115,378,755 | 118,283,839 | 12,054,956 |
Prior Fiscal Year Affiliated Redemptions In-Kind. Shares that were redeemed in-kind for investments, including accrued interest and cash, if any, are shown in the table below; along with realized gain or loss on investments delivered through in-kind redemptions. The amount of the in-kind redemptions is included in share transactions in the accompanying Statement of Changes in Net Assets. There was no gain or loss for federal income tax purposes.
| | Shares | Total net realized gain or loss ($) | Total Proceeds ($) |
| Fidelity Series International Growth Fund | 3,489,700 | 20,221,102 | 47,323,914 |
| Fidelity Series International Value Fund | 5,171,078 | 9,807,643 | 46,949,274 |
Other. During the period, the investment adviser reimbursed the Funds for certain losses as follows:
| | Amount ($) |
| Fidelity Series Emerging Markets Fund | 1,946 |
| Fidelity Series Emerging Markets Opportunities Fund | 10,371 |
7. Committed Line of Credit.
Certain Funds participate with other funds managed by the investment adviser or an affiliate in a $4.25 billion credit facility (the "line of credit") to be utilized for temporary or emergency purposes to fund shareholder redemptions or for other short-term liquidity purposes. The commitment fees on the pro-rata portion of the line of credit are borne by the investment adviser. During the period, there were no borrowings on this line of credit.
8. Security Lending.
Funds lend portfolio securities from time to time in order to earn additional income. Lending agents are used, including National Financial Services (NFS), an affiliate of the investment adviser. Pursuant to a securities lending agreement, NFS will receive a fee, which is capped at 9.9% of a fund's daily lending revenue, for its services as lending agent. A fund may lend securities to certain qualified borrowers, including NFS. On the settlement date of the loan, a fund receives collateral (in the form of U.S. Treasury obligations, letters of credit and/or cash) against the loaned securities and maintains collateral in an amount not less than 100% of the market value of the loaned securities during the period of the loan. The market value of the loaned securities is determined at the close of business of a fund and any additional required collateral is delivered to a fund on the next business day. A fund or borrower may terminate the loan at any time, and if the borrower defaults on its obligation to return the securities loaned because of insolvency or other reasons, a fund may apply collateral received from the borrower against the obligation. A fund may experience delays and costs in recovering the securities loaned. Any cash collateral received is invested in the Fidelity Securities Lending Cash Central Fund. Any loaned securities are identified as such in the Schedule of Investments, and the value of loaned securities and cash collateral at period end, as applicable, are presented in the Statement of Assets and Liabilities. Security lending income represents the income earned on investing cash collateral, less rebates paid to borrowers and any lending agent fees associated with the loan, plus any premium payments received for lending certain types of securities. Security lending income is presented in the Statement of Operations as a component of income from Fidelity Central Funds. Affiliated security lending activity, if any, was as follows:
| | Total Security Lending Fees Paid to NFS | Security Lending Income From Securities Loaned to NFS | Value of Securities Loaned to NFS at Period End |
| Fidelity Series Emerging Markets Fund | $33,157 | $- | $- |
| Fidelity Series Emerging Markets Opportunities Fund | $453,181 | $1 | $- |
| Fidelity Series International Growth Fund | $127,177 | $- | $- |
| Fidelity Series International Small Cap Fund | $23,326 | $3 | $- |
| Fidelity Series International Value Fund | $453,950 | $2,429 | $- |
9. Expense Reductions.
The investment adviser contractually agreed to reimburse each Fund to the extent annual operating expenses exceeded certain levels of average net assets as noted in the table below. This reimbursement will remain in place through February 28, 2027. Some expenses, for example the compensation of the independent Trustees, and certain other expenses such as interest expense, are excluded from this reimbursement.
The following Funds were in reimbursement during the period:
| | Expense Limitations | Reimbursement |
| Fidelity Series Emerging Markets Fund | .013% | $ 574,102 |
| Fidelity Series Emerging Markets Opportunities Fund | .013% | $ 3,461,152 |
Through arrangements with each applicable Fund's custodian, credits realized as a result of certain uninvested cash balances were used to reduce each applicable Fund's expenses. All of the applicable expense reductions are noted in the table below.
| | Custodian credits |
Fidelity Series Emerging Markets Fund | $10,608 |
Fidelity Series Emerging Markets Opportunities Fund | 6,492 |
Fidelity Series International Growth Fund | 798 |
Fidelity Series International Small Cap Fund | 5,497 |
Fidelity Series International Value Fund | 2,621 |
10. Other.
A fund's organizational documents provide former and current trustees and officers with a limited indemnification against liabilities arising in connection with the performance of their duties to the fund. In the normal course of business, a fund may also enter into contracts that provide general indemnifications. A fund's maximum exposure under these arrangements is unknown as this would be dependent on future claims that may be made against a fund. The risk of material loss from such claims is considered remote.
At the end of the period, mutual funds and accounts managed by the investment adviser or its affiliates were the owners of record of all of the outstanding shares of the Funds.
11. Risk and Uncertainties.
Many factors affect a fund's performance. Developments that disrupt global economies and financial markets, such as pandemics, epidemics, outbreaks of infectious diseases, war, terrorism, and environmental disasters, may significantly affect a fund's investment performance. The effects of these developments to a fund will be impacted by the types of securities in which a fund invests, the financial condition, industry, economic sector, and geographic location of an issuer, and a fund's level of investment in the securities of that issuer. Significant concentrations in security types, issuers, industries, sectors, and geographic locations may magnify the factors that affect a fund's performance.
To the Board of Trustees of Fidelity Investment Trust and the Shareholders of Fidelity Series Emerging Markets Fund, Fidelity Series Emerging Markets Opportunities Fund, Fidelity Series International Small Cap Fund, and Fidelity Series International Value Fund:
Opinion on the Financial Statements and Financial Highlights
We have audited the accompanying statements of assets and liabilities of Fidelity Series Emerging Markets Fund, Fidelity Series Emerging Markets Opportunities Fund, Fidelity Series International Small Cap Fund, and Fidelity Series International Value Fund (the "Funds"), each a fund of Fidelity Investment Trust, including the schedules of investments, as of October 31, 2023, the related statements of operations for the year then ended, the statements of changes in net assets for each of the two years in the period then ended, the financial highlights for each of the five years in the period then ended, and the related notes. In our opinion, the financial statements and financial highlights present fairly, in all material respects, the financial position of each of the Funds as of October 31, 2023, and the results of their operations for the year then ended, the changes in their net assets for each of the two years in the period then ended, and the financial highlights for each of the five years in the period then ended in conformity with accounting principles generally accepted in the United States of America.
Basis for Opinion
These financial statements and financial highlights are the responsibility of the Funds' management. Our responsibility is to express an opinion on the Funds' financial statements and financial highlights based on our audits. We are a public accounting firm registered with the Public Company Accounting Oversight Board (United States) (PCAOB) and are required to be independent with respect to the Funds in accordance with the U.S. federal securities laws and the applicable rules and regulations of the Securities and Exchange Commission and the PCAOB.
We conducted our audits in accordance with the standards of the PCAOB. Those standards require that we plan and perform the audit to obtain reasonable assurance about whether the financial statements and financial highlights are free of material misstatement, whether due to error or fraud. The Funds are not required to have, nor were we engaged to perform, an audit of their internal control over financial reporting. As part of our audits we are required to obtain an understanding of internal control over financial reporting but not for the purpose of expressing an opinion on the effectiveness of the Funds' internal control over financial reporting. Accordingly, we express no such opinion.
Our audits included performing procedures to assess the risks of material misstatement of the financial statements and financial highlights, whether due to error or fraud, and performing procedures that respond to those risks. Such procedures included examining, on a test basis, evidence regarding the amounts and disclosures in the financial statements and financial highlights. Our audits also included evaluating the accounting principles used and significant estimates made by management, as well as evaluating the overall presentation of the financial statements and financial highlights. Our procedures included confirmation of securities owned as of October 31, 2023, by correspondence with the custodians and brokers; when replies were not received from brokers, we performed other auditing procedures. We believe that our audits provide a reasonable basis for our opinion.
/s/ Deloitte & Touche LLP
Boston, Massachusetts
December 14, 2023
We have served as the auditor of one or more of the Fidelity investment companies since 1999.
To the Board of Trustees of Fidelity Investment Trust and Shareholders of Fidelity Series International Growth Fund
Opinion on the Financial Statements
We have audited the accompanying statement of assets and liabilities, including the schedule of investments, of Fidelity Series International Growth Fund (one of the funds constituting Fidelity Investment Trust, referred to hereafter as the "Fund") as of October 31, 2023, the related statement of operations for the year ended October 31, 2023, the statement of changes in net assets for each of the two years in the period ended October 31, 2023, including the related notes, and the financial highlights for each of the five years in the period ended October 31, 2023 (collectively referred to as the "financial statements"). In our opinion, the financial statements present fairly, in all material respects, the financial position of the Fund as of October 31, 2023, the results of its operations for the year then ended, the changes in its net assets for each of the two years in the period ended October 31, 2023 and the financial highlights for each of the five years in the period ended October 31, 2023 in conformity with accounting principles generally accepted in the United States of America.
Basis for Opinion
These financial statements are the responsibility of the Fund's management. Our responsibility is to express an opinion on the Fund's financial statements based on our audits. We are a public accounting firm registered with the Public Company Accounting Oversight Board (United States) (PCAOB) and are required to be independent with respect to the Fund in accordance with the U.S. federal securities laws and the applicable rules and regulations of the Securities and Exchange Commission and the PCAOB.
We conducted our audits of these financial statements in accordance with the standards of the PCAOB. Those standards require that we plan and perform the audit to obtain reasonable assurance about whether the financial statements are free of material misstatement, whether due to error or fraud.
Our audits included performing procedures to assess the risks of material misstatement of the financial statements, whether due to error or fraud, and performing procedures that respond to those risks. Such procedures included examining, on a test basis, evidence regarding the amounts and disclosures in the financial statements. Our audits also included evaluating the accounting principles used and significant estimates made by management, as well as evaluating the overall presentation of the financial statements. Our procedures included confirmation of securities owned as of October 31, 2023 by correspondence with the custodian, issuers of privately offered securities and brokers; when replies were not received from brokers, we performed other auditing procedures. We believe that our audits provide a reasonable basis for our opinion.
/s/ PricewaterhouseCoopers LLP
Boston, Massachusetts
December 14, 2023
We have served as the auditor of one or more investment companies in the Fidelity group of funds since 1932.
The Trustees, Members of the Advisory Board (if any), and officers of the trust and funds, as applicable, are listed below. The Board of Trustees governs each fund and is responsible for protecting the interests of shareholders. The Trustees are experienced executives who meet periodically throughout the year to oversee each fund's activities, review contractual arrangements with companies that provide services to each fund, oversee management of the risks associated with such activities and contractual arrangements, and review each fund's performance. Except for Jonathan Chiel, each of the Trustees oversees 322 funds. Mr. Chiel oversees 191 funds.
The Trustees hold office without limit in time except that (a) any Trustee may resign; (b) any Trustee may be removed by written instrument, signed by at least two-thirds of the number of Trustees prior to such removal; (c) any Trustee who requests to be retired or who has become incapacitated by illness or injury may be retired by written instrument signed by a majority of the other Trustees; and (d) any Trustee may be removed at any special meeting of shareholders by a two-thirds vote of the outstanding voting securities of the trust. Each Trustee who is not an interested person (as defined in the 1940 Act) of the trust and the funds is referred to herein as an Independent Trustee. Each Independent Trustee shall retire not later than the last day of the calendar year in which his or her 75th birthday occurs. The Independent Trustees may waive this mandatory retirement age policy with respect to individual Trustees. Officers and Advisory Board Members hold office without limit in time, except that any officer or Advisory Board Member may resign or may be removed by a vote of a majority of the Trustees at any regular meeting or any special meeting of the Trustees. Except as indicated, each individual has held the office shown or other offices in the same company for the past five years.
The funds' Statement of Additional Information (SAI) includes more information about the Trustees. To request a free copy, call Fidelity at 1-800-544-8544.
Experience, Skills, Attributes, and Qualifications of the Trustees. The Governance and Nominating Committee has adopted a statement of policy that describes the experience, qualifications, attributes, and skills that are necessary and desirable for potential Independent Trustee candidates (Statement of Policy). The Board believes that each Trustee satisfied at the time he or she was initially elected or appointed a Trustee, and continues to satisfy, the standards contemplated by the Statement of Policy. The Governance and Nominating Committee also engages professional search firms to help identify potential Independent Trustee candidates who have the experience, qualifications, attributes, and skills consistent with the Statement of Policy. From time to time, additional criteria based on the composition and skills of the current Independent Trustees, as well as experience or skills that may be appropriate in light of future changes to board composition, business conditions, and regulatory or other developments, have also been considered by the professional search firms and the Governance and Nominating Committee. In addition, the Board takes into account the Trustees' commitment and participation in Board and committee meetings, as well as their leadership of standing and ad hoc committees throughout their tenure.
In determining that a particular Trustee was and continues to be qualified to serve as a Trustee, the Board has considered a variety of criteria, none of which, in isolation, was controlling. The Board believes that, collectively, the Trustees have balanced and diverse experience, qualifications, attributes, and skills, which allow the Board to operate effectively in governing each fund and protecting the interests of shareholders. Information about the specific experience, skills, attributes, and qualifications of each Trustee, which in each case led to the Board's conclusion that the Trustee should serve (or continue to serve) as a trustee of the funds, is provided below.
Board Structure and Oversight Function. Robert A. Lawrence is an interested person and currently serves as Chair. The Trustees have determined that an interested Chair is appropriate and benefits shareholders because an interested Chair has a personal and professional stake in the quality and continuity of services provided to the funds. Independent Trustees exercise their informed business judgment to appoint an individual of their choosing to serve as Chair, regardless of whether the Trustee happens to be independent or a member of management. The Independent Trustees have determined that they can act independently and effectively without having an Independent Trustee serve as Chair and that a key structural component for assuring that they are in a position to do so is for the Independent Trustees to constitute a substantial majority for the Board. The Independent Trustees also regularly meet in executive session. David M. Thomas serves as Lead Independent Trustee and as such (i) acts as a liaison between the Independent Trustees and management with respect to matters important to the Independent Trustees and (ii) with management prepares agendas for Board meetings.
Fidelity® funds are overseen by different Boards of Trustees. The funds' Board oversees Fidelity's high income and certain equity funds, and other Boards oversee Fidelity's alternative investment, investment-grade bond, money market, asset allocation, and other equity funds. The asset allocation funds may invest in Fidelity® funds overseen by the funds' Board. The use of separate Boards, each with its own committee structure, allows the Trustees of each group of Fidelity® funds to focus on the unique issues of the funds they oversee, including common research, investment, and operational issues. On occasion, the separate Boards establish joint committees to address issues of overlapping consequences for the Fidelity® funds overseen by each Board.
The Trustees operate using a system of committees to facilitate the timely and efficient consideration of all matters of importance to the Trustees, each fund, and fund shareholders and to facilitate compliance with legal and regulatory requirements and oversight of the funds' activities and associated risks. The Board, acting through its committees, has charged FMR and its affiliates with (i) identifying events or circumstances the occurrence of which could have demonstrably adverse effects on the funds' business and/or reputation; (ii) implementing processes and controls to lessen the possibility that such events or circumstances occur or to mitigate the effects of such events or circumstances if they do occur; and (iii) creating and maintaining a system designed to evaluate continuously business and market conditions in order to facilitate the identification and implementation processes described in (i) and (ii) above. Because the day-to-day operations and activities of the funds are carried out by or through FMR, its affiliates, and other service providers, the funds' exposure to risks is mitigated but not eliminated by the processes overseen by the Trustees. While each of the Board's committees has responsibility for overseeing different aspects of the funds' activities, oversight is exercised primarily through the Operations, Audit, and Compliance Committees. Appropriate personnel, including but not limited to the funds' Chief Compliance Officer (CCO), FMR's internal auditor, the independent accountants, the funds' Treasurer and portfolio management personnel, make periodic reports to the Board's committees, as appropriate, including an annual review of Fidelity's risk management program for the Fidelity® funds. The responsibilities of each standing committee, including their oversight responsibilities, are described further under "Standing Committees of the Trustees."
Interested Trustees*:
Correspondence intended for a Trustee who is an interested person may be sent to Fidelity Investments, 245 Summer Street, Boston, Massachusetts 02210.
Name, Year of Birth; Principal Occupations and Other Relevant Experience+
Jonathan Chiel (1957)
Year of Election or Appointment: 2016
Trustee
Mr. Chiel also serves as Trustee of other Fidelity® funds. Mr. Chiel is General Counsel (2012-present) and Head of Legal, Risk and Compliance (2022-present). Mr Chiel serves as Executive Vice President and General Counsel for FMR LLC (diversified financial services company, 2012-present) and Director and President for OH Company LLC (holding company, 2018-present). Previously, Mr. Chiel served as general counsel (2004-2012) and senior vice president and deputy general counsel (2000-2004) for John Hancock Financial Services; a partner with Choate, Hall & Stewart (1996-2000) (law firm); and an Assistant United States Attorney for the United States Attorney's Office of the District of Massachusetts (1986-95), including Chief of the Criminal Division (1993-1995). Mr. Chiel is a director on the boards of the Boston Bar Foundation and the Maimonides School.
Bettina Doulton (1964)
Year of Election or Appointment: 2021
Trustee
Ms. Doulton also serves as Trustee of other Fidelity® funds. Prior to her retirement, Ms. Doulton served in a variety of positions at Fidelity Investments, including as a managing director of research (2006-2007), portfolio manager to certain Fidelity® funds (1993-2005), equity analyst and portfolio assistant (1990-1993), and research assistant (1987-1990). Ms. Doulton currently owns and operates Phi Builders + Architects and Cellardoor Winery. Previously, Ms. Doulton served as a member of the Board of Brown Capital Management, LLC (2014-2018).
Robert A. Lawrence (1952)
Year of Election or Appointment: 2020
Trustee
Chair of the Board of Trustees
Mr. Lawrence also serves as Trustee of other funds. Previously, Mr. Lawrence served as a Trustee and Member of the Advisory Board of certain funds. Prior to his retirement in 2008, Mr. Lawrence served as Vice President of certain Fidelity® funds (2006-2008), Senior Vice President, Head of High Income Division of Fidelity Management & Research Company (investment adviser firm, 2006-2008), and President of Fidelity Strategic Investments (investment adviser firm, 2002-2005).
* Determined to be an "Interested Trustee" by virtue of, among other things, his or her affiliation with the trust or various entities under common control with FMR.
+ The information includes the Trustee's principal occupation during the last five years and other information relating to the experience, attributes, and skills relevant to the Trustee's qualifications to serve as a Trustee, which led to the conclusion that the Trustee should serve as a Trustee for each fund.
Independent Trustees:
Correspondence intended for an Independent Trustee may be sent to Fidelity Investments, P.O. Box 55235, Boston, Massachusetts 02205-5235.
Name, Year of Birth; Principal Occupations and Other Relevant Experience+
Thomas P. Bostick (1956)
Year of Election or Appointment: 2021
Trustee
Lieutenant General Bostick also serves as Trustee of other Fidelity® funds. Prior to his retirement, General Bostick (United States Army, Retired) held a variety of positions within the U.S. Army, including Commanding General and Chief of Engineers, U.S. Army Corps of Engineers (2012-2016) and Deputy Chief of Staff and Director of Human Resources, U.S. Army (2009-2012). General Bostick currently serves as a member of the Board and Finance and Governance & Sustainability Committees of CSX Corporation (transportation, 2020-present) and a member of the Board and Corporate Governance and Nominating Committee of Perma-Fix Environmental Services, Inc. (nuclear waste management, 2020-present). General Bostick serves as Chief Executive Officer of Bostick Global Strategies, LLC (consulting, 2016-present), as a member of the Board of HireVue, Inc. (video interview and assessment, 2020-present), as a member of the Board of Allonnia (biotechnology and engineering solutions, 2022-present) and on the Advisory Board of Solugen, Inc. (specialty bio-based chemicals manufacturer, 2022-present). Previously, General Bostick served as a Member of the Advisory Board of certain Fidelity® funds (2021), President, Intrexon Bioengineering (2018-2020) and Chief Operating Officer (2017-2020) and Senior Vice President of the Environment Sector (2016-2017) of Intrexon Corporation (biopharmaceutical company).
Dennis J. Dirks (1948)
Year of Election or Appointment: 2005
Trustee
Mr. Dirks also serves as Trustee of other Fidelity® funds. Prior to his retirement in May 2003, Mr. Dirks served as Chief Operating Officer and as a member of the Board of The Depository Trust & Clearing Corporation (financial markets infrastructure), President, Chief Operating Officer and a member of the Board of The Depository Trust Company (DTC), President and a member of the Board of the National Securities Clearing Corporation (NSCC), Chief Executive Officer and a member of the Board of the Government Securities Clearing Corporation and Chief Executive Officer and a member of the Board of the Mortgage-Backed Securities Clearing Corporation. Mr. Dirks currently serves as a member of the Finance Committee (2016-present) and Board (2017-present) and is Treasurer (2018-present) of the Asolo Repertory Theatre.
Donald F. Donahue (1950)
Year of Election or Appointment: 2018
Trustee
Mr. Donahue also serves as Trustee of other Fidelity® funds. Mr. Donahue serves as President and Chief Executive Officer of Miranda Partners, LLC (risk consulting for the financial services industry, 2012-present). Previously, Mr. Donahue served as Chief Executive Officer (2006-2012), Chief Operating Officer (2003-2006) and Managing Director, Customer Marketing and Development (1999-2003) of The Depository Trust & Clearing Corporation (financial markets infrastructure). Mr. Donahue currently serves as a member (2007-present) and Co-Chairman (2016-present) of the Board of United Way of New York. Mr. Donahue previously served as a member of the Advisory Board of certain Fidelity® funds (2015-2018) and as a member of the Board of The Leadership Academy (previously NYC Leadership Academy) (2012-2022).
Vicki L. Fuller (1957)
Year of Election or Appointment: 2020
Trustee
Ms. Fuller also serves as Trustee of other Fidelity® funds. Previously, Ms. Fuller served as a member of the Advisory Board of certain Fidelity® funds (2018-2020), Chief Investment Officer of the New York State Common Retirement Fund (2012-2018) and held a variety of positions at AllianceBernstein L.P. (global asset management, 1985-2012), including Managing Director (2006-2012) and Senior Vice President and Senior Portfolio Manager (2001-2006). Ms. Fuller currently serves as a member of the Board, Audit Committee and Nominating and Governance Committee of two Blackstone business development companies (2020-present), as a member of the Board of Treliant, LLC (consulting, 2019-present), as a member of the Board of Ariel Alternatives, LLC (private equity, 2022-present) and as a member of the Board and Chair of the Audit Committee of Gusto, Inc. (software, 2021-present). In addition, Ms. Fuller currently serves as a member of the Board of Roosevelt University (2019-present) and as a member of the Executive Board of New York University's Stern School of Business. Ms. Fuller previously served as a member of the Board, Audit Committee and Nominating and Governance Committee of The Williams Companies, Inc. (natural gas infrastructure, 2018-2021).
Patricia L. Kampling (1959)
Year of Election or Appointment: 2020
Trustee
Ms. Kampling also serves as Trustee of other Fidelity® funds. Prior to her retirement, Ms. Kampling served as Chairman of the Board and Chief Executive Officer (2012-2019), President and Chief Operating Officer (2011-2012) and Executive Vice President and Chief Financial Officer (2010-2011) of Alliant Energy Corporation. Ms. Kampling currently serves as a member of the Board, Finance Committee and Governance, Compensation and Nominating Committee of Xcel Energy Inc. (utilities company, 2020-present) and as a member of the Board, Audit, Finance and Risk Committee and Safety, Environmental, Technology and Operations Committee and Chair of the Executive Development and Compensation Committee of American Water Works Company, Inc. (utilities company, 2019-present). In addition, Ms. Kampling currently serves as a member of the Board of the Nature Conservancy, Wisconsin Chapter (2019-present). Previously, Ms. Kampling served as a Member of the Advisory Board of certain Fidelity® funds (2020), a member of the Board, Compensation Committee and Executive Committee and Chair of the Audit Committee of Briggs & Stratton Corporation (manufacturing, 2011-2021), a member of the Board of Interstate Power and Light Company (2012-2019) and Wisconsin Power and Light Company (2012-2019) (each a subsidiary of Alliant Energy Corporation) and as a member of the Board and Workforce Development Committee of the Business Roundtable (2018-2019).
Thomas A. Kennedy (1955)
Year of Election or Appointment: 2021
Trustee
Mr. Kennedy also serves as Trustee of other Fidelity® funds. Previously, Mr. Kennedy served as a Member of the Advisory Board of certain Fidelity® funds (2020) and held a variety of positions at Raytheon Company (aerospace and defense, 1983-2020), including Chairman and Chief Executive Officer (2014-2020) and Executive Vice President and Chief Operating Officer (2013-2014). Mr. Kennedy served as Executive Chairman of the Board of Directors of Raytheon Technologies Corporation (aerospace and defense, 2020-2021). Mr. Kennedy serves as a Director of the Board of Directors of Textron Inc. (aerospace and defense, 2023-present).
Oscar Munoz (1959)
Year of Election or Appointment: 2021
Trustee
Mr. Munoz also serves as Trustee of other Fidelity® funds. Prior to his retirement, Mr. Munoz served as Executive Chairman (2020-2021), Chief Executive Officer (2015-2020), President (2015-2016) and a member of the Board (2010-2021) of United Airlines Holdings, Inc. Mr. Munoz currently serves as a member of the Board of CBRE Group, Inc. (commercial real estate, 2020-present), a member of the Board of Univision Communications, Inc. (Hispanic media, 2020-present), a member of the Board of Archer Aviation Inc. (2021-present), a member of the Defense Business Board of the United States Department of Defense (2021-present) and a member of the Board of Salesforce.com, Inc. (cloud-based software, 2022-present). Previously, Mr. Munoz served as a Member of the Advisory Board of certain Fidelity® funds (2021).
David M. Thomas (1949)
Year of Election or Appointment: 2008
Trustee
Lead Independent Trustee
Mr. Thomas also serves as Trustee of other Fidelity® funds. Previously, Mr. Thomas served as Executive Chairman (2005-2006) and Chairman and Chief Executive Officer (2000-2005) of IMS Health, Inc. (pharmaceutical and healthcare information solutions). Mr. Thomas currently serves as a member of the Board of Fortune Brands Home and Security (home and security products, 2004-present) and as Director (2013-present) and Non-Executive Chairman of the Board (2022-present) of Interpublic Group of Companies, Inc. (marketing communication).
Susan Tomasky (1953)
Year of Election or Appointment: 2020
Trustee
Ms. Tomasky also serves as Trustee of other Fidelity® funds. Prior to her retirement, Ms. Tomasky served in various executive officer positions at American Electric Power Company, Inc. (1998-2011), including most recently as President of AEP Transmission (2007-2011). Ms. Tomasky currently serves as a member of the Board and Sustainability Committee and as Chair of the Audit Committee of Marathon Petroleum Corporation (2018-present) and as a member of the Board, Executive Committee, Corporate Governance Committee and Organization and Compensation Committee and as Lead Director of the Board of Public Service Enterprise Group, Inc. (utilities company, 2012-present) and as a member of the Board of its subsidiary company, Public Service Electric and Gas Co. (2021-present). In addition, Ms. Tomasky currently serves as a member (2009-present) and President (2020-present) of the Board of the Royal Shakespeare Company - America (2009-present), as a member of the Board of the Columbus Association for the Performing Arts (2011-present) and as a member of the Board and Kenyon in the World Committee of Kenyon College (2016-present). Previously, Ms. Tomasky served as a Member of the Advisory Board of certain Fidelity® funds (2020), as a member of the Board of the Columbus Regional Airport Authority (2007-2020), as a member of the Board (2011-2018) and Lead Independent Director (2015-2018) of Andeavor Corporation (previously Tesoro Corporation) (independent oil refiner and marketer) and as a member of the Board of Summit Midstream Partners LP (energy, 2012-2018).
Michael E. Wiley (1950)
Year of Election or Appointment: 2020
Trustee
Mr. Wiley also serves as Trustee of other Fidelity® funds. Previously, Mr. Wiley served as a member of the Advisory Board of certain Fidelity® funds (2018-2020), Chairman, President and CEO of Baker Hughes, Inc. (oilfield services, 2000-2004). Mr. Wiley also previously served as a member of the Board of Andeavor Corporation (independent oil refiner and marketer, 2005-2018), a member of the Board of Andeavor Logistics LP (natural resources logistics, 2015-2018) and a member of the Board of High Point Resources (exploration and production, 2005-2020).
+ The information includes the Trustee's principal occupation during the last five years and other information relating to the experience, attributes, and skills relevant to the Trustee's qualifications to serve as a Trustee, which led to the conclusion that the Trustee should serve as a Trustee for each fund.
Advisory Board Members and Officers:
Correspondence intended for a Member of the Advisory Board (if any) may be sent to Fidelity Investments, P.O. Box 55235, Boston, Massachusetts 02205-5235. Correspondence intended for an officer or Peter S. Lynch may be sent to Fidelity Investments, 245 Summer Street, Boston, Massachusetts 02210.
Name, Year of Birth; Principal Occupation
Vijay C. Advani (1960)
Year of Election or Appointment: 2023
Member of the Advisory Board
Mr. Advani also serves as Trustee or Member of the Advisory Board of other funds. Previously, Mr. Advani served as Executive Chairman (2020-2022), Chief Executive Officer (2017-2020) and Chief Operating Officer (2016-2017) of Nuveen (global investment manager). He also served in various capacities at Franklin Resources (global investment manager), including Co-President (2015-2016), Executive Vice President, Global Advisory Services (2008-2015), Head of Global Retail Distribution (2005-2008), Executive Managing Director, International Retail Development (2002-2005), Managing Director, Product Developments, Sales & Marketing, Asia, Eastern Europe and Africa (2000-2002) and President, Templeton Asset Management India (1995-2000). Mr. Advani also served as Senior Investment Officer of International Finance Corporation (private equity and venture capital arm of The World Bank, 1984-1995). Mr. Advani is Chairman Emeritus of the U.S. India Business Council (2018-present), a Director of The Global Impact Investing Network (2019-present), a Director of LOK Capital (Mauritius) (2022-present), a member of the Advisory Council of LOK Capital (2022-present), a Senior Advisor of Neuberger Berman (2021-present), a Senior Advisor of Seviora Holdings Pte. Ltd (Temasek-Singapore) (2021-present), a Director of Seviora Capital (Singapore) (2021-present) and an Advisor of EQUIAM (2021-present). Mr. Advani formerly served as a member of the Board of BowX Acquisition Corp. (special purpose acquisition company, 2020-2021), a member of the Board of Intellecap (advisory arm of The Aavishkaar Group, 2018-2020), a member of the Board of Nuveen Investments, Inc. (2017-2020) and a member of the Board of Docusign (software, 2016-2019).
Peter S. Lynch (1944)
Year of Election or Appointment: 2003
Member of the Advisory Board
Mr. Lynch also serves as a Member of the Advisory Board of other Fidelity® funds. Mr. Lynch is Vice Chairman and a Director of Fidelity Management & Research Company LLC (investment adviser firm). In addition, Mr. Lynch serves as a Trustee of Boston College and as the Chairman of the Inner-City Scholarship Fund. Previously, Mr. Lynch served as Vice Chairman and a Director of FMR Co., Inc. (investment adviser firm) and on the Special Olympics International Board of Directors (1997-2006).
Karen B. Peetz (1955)
Year of Election or Appointment: 2023
Member of the Advisory Board
Ms. Peetz also serves as a Member of the Advisory Board of other funds. Previously, Ms. Peetz served as Chief Administration Officer (2020-2023) of Citigroup Inc. (a diversified financial service company). She also served in various capacities at Bank of New York Mellon Corporation, including President (2013-2016), Vice Chairman, Senior Executive Vice President and Chief Executive Officer of Financial Markets & Treasury Services (2010-2013), Senior Executive Vice President and Chief Executive Officer of Global Corporate Trust (2003-2008), Senior Vice President and Division Manager of Global Payments & Trade Services (2002-2003) and Senior Vice President and Division Manager of Domestic Corporate Trust (1998-2002). Ms. Peetz also served in various capacities at Chase Manhattan Corporation (1982-1998), including Senior Vice President and Manager of Corporate Trust International Business (1996-1998), Managing Director and Manager of Corporate Trust Services (1994-1996) and Managing Director and Group Manager of Financial Institution Sales (1990-1993). Ms. Peetz currently serves as Chair of Amherst Holdings Advisory Council (2018-present), Trustee of Johns Hopkins University (2016-present), Chair of the Carey Business School Advisory Council, Member of the Johns Hopkins Medicine Board and Finance Committee and Chair of the Lyme and Tick Related Disease Institute Advisory Council. Ms. Peetz previously served as a member of the Board of Guardian Life Insurance Company of America (2019-2023), a member of the Board of Trane Technologies (2018-2022), a member of the Board of Wells Fargo Corp. (2017-2019), a member of the Board of SunCoke Energy Inc. (2012-2016), a member of the Board of Private Export Funding Corporation (2010-2016) and as a Trustee of Penn State University (2010-2014) and the United Way of New York City (2008-2010).
Heather Bonner (1977)
Year of Election or Appointment: 2023
Assistant Treasurer
Ms. Bonner also serves as an officer of other funds. Ms. Bonner is a Senior Vice President (2022-present) and is an employee of Fidelity Investments (2022-present). Ms. Bonner serves as Vice President, Treasurer, or Assistant Treasurer of certain Fidelity entities. Prior to joining Fidelity, Ms. Bonner served as Managing Director at AQR Capital Management (2013-2022) and was the Treasurer and Principal Financial Officer of the AQR Funds (2013-2022).
Craig S. Brown (1977)
Year of Election or Appointment: 2022
Deputy Treasurer
Mr. Brown also serves as an officer of other funds. Mr. Brown is a Vice President (2015-present) and is an employee of Fidelity Investments. Mr. Brown serves as Assistant Treasurer of FIMM, LLC (2021-present). Previously, Mr. Brown served as Assistant Treasurer of certain Fidelity® funds (2019-2022).
John J. Burke III (1964)
Year of Election or Appointment: 2018
Chief Financial Officer
Mr. Burke also serves as Chief Financial Officer of other funds. Mr. Burke is Head of Fidelity Fund and Investment Operations (2018-present) and is an employee of Fidelity Investments. Mr. Burke serves as President, Executive Vice President, or Director of certain Fidelity entities. Previously Mr. Burke served as head of Asset Management Investment Operations (2012-2018).
Margaret Carey (1973)
Year of Election or Appointment: 2023
Secretary and Chief Legal Officer (CLO)
Ms. Carey also serves as an officer of other funds and as CLO of certain Fidelity entities. Ms. Carey is a Senior Vice President, Deputy General Counsel (2019-present) and is an employee of Fidelity Investments.
William C. Coffey (1969)
Year of Election or Appointment: 2019
Assistant Secretary
Mr. Coffey also serves as Assistant Secretary of other funds. Mr. Coffey is a Senior Vice President, Deputy General Counsel (2010-present) and is an employee of Fidelity Investments. Previously, Mr. Coffey served as Secretary and CLO of certain funds (2018-2019); CLO, Secretary, or Senior Vice President of certain Fidelity entities and Assistant Secretary of certain funds (2009-2018).
Timothy M. Cohen (1969)
Year of Election or Appointment: 2018
Vice President
Mr. Cohen also serves as Vice President of other funds. Mr. Cohen is Co-Head of Equity (2018-present) and is an employee of Fidelity Investments. Mr. Cohen serves a Director of Fidelity Management & Research (Japan) Limited (investment adviser firm, 2016-present). Previously, Mr. Cohen served as Executive Vice President of Fidelity SelectCo, LLC (2019) and Head of Global Equity Research (2016-2018).
Jonathan Davis (1968)
Year of Election or Appointment: 2010
Assistant Treasurer
Mr. Davis also serves as an officer of other funds. Mr. Davis is a Vice President (2006-present) and is an employee of Fidelity Investments. Mr. Davis serves as Assistant Treasurer of certain Fidelity entities.
Laura M. Del Prato (1964)
Year of Election or Appointment: 2018
Assistant Treasurer
Ms. Del Prato also serves as an officer of other funds. Ms. Del Prato is a Senior Vice President (2017-present) and is an employee of Fidelity Investments. Ms. Del Prato serves as Vice President or Assistant Treasurer of certain Fidelity entities. Previously, Ms. Del Prato served as President and Treasurer of The North Carolina Capital Management Trust: Cash Portfolio and Term Portfolio (2018-2020).
Colm A. Hogan (1973)
Year of Election or Appointment: 2020
Assistant Treasurer
Mr. Hogan also serves as an officer of other funds. Mr. Hogan is a Vice President (2016-present) and is an employee of Fidelity Investments. Mr. Hogan serves as Assistant Treasurer of certain Fidelity entities. Previously, Mr. Hogan served as Deputy Treasurer of certain Fidelity® funds (2016-2020) and Assistant Treasurer of certain Fidelity® funds (2016-2018).
Pamela R. Holding (1964)
Year of Election or Appointment: 2018
Vice President
Ms. Holding also serves as Vice President of other funds. Ms. Holding is Co-Head of Equity (2018-present) and is an employee of Fidelity Investments. Previously, Ms. Holding served as Executive Vice President of Fidelity SelectCo, LLC (2019) and as Chief Investment Officer of Fidelity Institutional Asset Management (2013-2018).
Chris Maher (1972)
Year of Election or Appointment: 2020
Deputy Treasurer
Mr. Maher also serves as an officer of other funds. Mr. Maher is a Vice President (2008-present) and is an employee of Fidelity Investments. Mr. Maher serves as Assistant Treasurer of certain Fidelity entities. Previously, Mr. Maher served as Assistant Treasurer of certain funds (2013-2020).
Jason P. Pogorelec (1975)
Year of Election or Appointment: 2020
Chief Compliance Officer
Mr. Pogorelec also serves as Chief Compliance Officer of other funds. Mr. Pogorelec is a Senior Vice President of Asset Management Compliance (2020-present) and is an employee of Fidelity Investments. Mr. Pogorelec serves as Compliance Officer of Fidelity Management & Research Company LLC (investment adviser firm, 2023-present) and Ballyrock Investment Advisors LLC (2023-present). Previously, Mr. Pogorelec served as a Vice President, Associate General Counsel for Fidelity Investments (2010-2020) and Assistant Secretary of certain Fidelity® funds (2015-2020).
Brett Segaloff (1972)
Year of Election or Appointment: 2021
Anti-Money Laundering (AML) Officer
Mr. Segaloff also serves as AML Officer of other funds. Mr. Segaloff is a Vice President (2022-present) and is an employee of Fidelity Investments. Mr. Segaloff serves as Anti Money Laundering Compliance Officer or Anti Money Laundering/Bank Secrecy Act Compliance Officer of certain Fidelity entities.
Stacie M. Smith (1974)
Year of Election or Appointment: 2016
President and Treasurer
Ms. Smith also serves as an officer of other funds. Ms. Smith is a Senior Vice President (2016-present) and is an employee of Fidelity Investments. Ms. Smith serves as Assistant Treasurer of certain Fidelity entities and has served in other fund officer roles.
Jim Wegmann (1979)
Year of Election or Appointment: 2019
Assistant Treasurer
Mr. Wegmann also serves as an officer of other funds. Mr. Wegmann is a Vice President (2016-present) and is an employee of Fidelity Investments. Mr. Wegmann serves as Assistant Treasurer of FIMM, LLC (2021-present). Previously, Mr. Wegmann served as Assistant Treasurer of certain Fidelity® funds (2019-2021).
As a shareholder, you incur two types of costs: (1) transaction costs, which may include sales charges (loads) on purchase payments or redemption proceeds, as applicable and (2) ongoing costs, which generally include management fees, distribution and/or service (12b-1) fees and other Fund expenses. This Example is intended to help you understand your ongoing costs (in dollars) of investing in a fund and to compare these costs with the ongoing costs of investing in other mutual funds.
| The Example is based on an investment of $1,000 invested at the beginning of the period and held for the entire period (May 1, 2023 to October 31, 2023). |
Actual Expenses
The first line of the accompanying table provides information about actual account values and actual expenses. You may use the information in this line, together with the amount you invested, to estimate the expenses that you paid over the period. Simply divide your account value by $1,000.00 (for example, an $8,600 account value divided by $1,000.00 = 8.6), then multiply the result by the number in the first line for a class/Fund under the heading entitled "Expenses Paid During Period" to estimate the expenses you paid on your account during this period. If any fund is a shareholder of any underlying mutual funds or exchange-traded funds (ETFs) (the Underlying Funds), such fund indirectly bears its proportional share of the expenses of the Underlying Funds in addition to the direct expenses incurred presented in the table. These fees and expenses are not included in the annualized expense ratio used to calculate the expense estimate in the table below.
Hypothetical Example for Comparison Purposes
The second line of the accompanying table provides information about hypothetical account values and hypothetical expenses based on the actual expense ratio and an assumed rate of return of 5% per year before expenses, which is not the actual return. The hypothetical account values and expenses may not be used to estimate the actual ending account balance or expenses you paid for the period. You may use this information to compare the ongoing costs of investing in the Fund and other funds. To do so, compare this 5% hypothetical example with the 5% hypothetical examples that appear in the shareholder reports of the other funds. If any fund is a shareholder of any Underlying Funds, such fund indirectly bears its proportional share of the expenses of the Underlying Funds in addition to the direct expenses as presented in the table. These fees and expenses are not included in the annualized expense ratio used to calculate the expense estimate in the table below.
Please note that the expenses shown in the table are meant to highlight your ongoing costs only and do not reflect any transaction costs. Therefore, the second line of the table is useful in comparing ongoing costs only, and will not help you determine the relative total costs of owning different funds. In addition, if these transactional costs were included, your costs would have been higher.
| | | | | Annualized Expense Ratio- A | | Beginning Account Value May 1, 2023 | | Ending Account Value October 31, 2023 | | Expenses Paid During Period- C May 1, 2023 to October 31, 2023 |
| | | | | | | | | | |
| Fidelity® Series Emerging Markets Fund | | | | .01% | | | | | | |
| Actual | | | | | | $ 1,000 | | $ 959.00 | | $ .05 |
Hypothetical-B | | | | | | $ 1,000 | | $ 1,025.16 | | $ .05 |
| | | | | | | | | | |
| Fidelity® Series Emerging Markets Opportunities Fund | | | | .01% | | | | | | |
| Actual | | | | | | $ 1,000 | | $ 961.20 | | $ .05 |
Hypothetical-B | | | | | | $ 1,000 | | $ 1,025.16 | | $ .05 |
| | | | | | | | | | |
| Fidelity® Series International Growth Fund | | | | -%-D | | | | | | |
| Actual | | | | | | $ 1,000 | | $ 921.50 | | $-E |
Hypothetical-B | | | | | | $ 1,000 | | $ 1,025.21 | | $-E |
| | | | | | | | | | |
| Fidelity® Series International Small Cap Fund | | | | .01% | | | | | | |
| Actual | | | | | | $ 1,000 | | $ 892.40 | | $ .05 |
Hypothetical-B | | | | | | $ 1,000 | | $ 1,025.16 | | $ .05 |
| | | | | | | | | | |
| Fidelity® Series International Value Fund | | | | .01% | | | | | | |
| Actual | | | | | | $ 1,000 | | $ 980.60 | | $ .05 |
Hypothetical-B | | | | | | $ 1,000 | | $ 1,025.16 | | $ .05 |
| |
A Annualized expense ratio reflects expenses net of applicable fee waivers.
B 5% return per year before expenses
C Expenses are equal to the annualized expense ratio, multiplied by the average account value over the period, multiplied by 184/ 365 (to reflect the one-half year period). The fees and expenses of any Underlying Funds are not included in each annualized expense ratio.
D Amount represents less than .005%.
E Amount represents less than $.005.
The dividend and capital gains distributions for the fund(s) are available on Fidelity.com or Institutional.Fidelity.com.
The funds hereby designate as capital gain dividend the amounts noted below for the taxable year ended October 31, 2023, or, if subsequently determined to be different, the net capital gain of such year.
| Fidelity Series International Small Cap Fund | $51,028,676 |
A percentage of the dividends distributed during the fiscal year for the following funds qualify for the dividends-received deduction for corporate shareholders:
| Fidelity Series International Growth Fund | |
| December 2022 | 12% |
| Fidelity Series International Small Cap Fund | |
| December 2022 | 3% |
A percentage of the dividends distributed during the fiscal year for the following funds may be taken into account as a dividend for purposes of the maximum rate under section 1(h)(11) of the Internal Revenue Code.
Fund Fidelity Series Emerging Markets Fund | |
| December 2022 | 37.99% |
| Fidelity Series Emerging Market Opportunities Fund | |
| December 2022 | 58.62% |
| Fidelity Series International Growth Fund | |
| December 2022 | 77.72% |
| Fidelity Series International Small Cap Fund | |
| December 2022 | 94.87% |
| Fidelity Series International Value Fund | |
| December 2022 | 89.26% |
The funds hereby designate the amounts noted below as distributions paid during the fiscal year ended 2023 as qualifying to be taxed as section 163(j) interest dividends:
| Fund Fidelity Series Emerging Markets Fund | $2,887,336 |
| Fidelity Series Emerging Market Opportunities Fund | $10,301,066 |
| Fidelity Series International Growth Fund | $4,692,189 |
| Fidelity Series International Small Cap Fund | $1,779,360 |
| Fidelity Series International Value Fund | $5,938,946 |
The amounts per share which represent income derived from sources within, and taxes paid to, foreign countries or possessions of the United States are as follows:
| | Pay Date | Income | Taxes |
| Fund Fidelity Series Emerging Markets Fund | 12/12/22 | $0.2219 | $0.0239 |
| Fidelity Series Emerging Market Opportunities Fund | 12/12/22 | $0.4373 | $0.0643 |
| Fidelity Series International Growth Fund | 12/12/22 | $0.1860 | $0.0195 |
| Fidelity Series International Small Cap Fund | 12/12/22 | $0.2543 | $0.0413 |
| Fidelity Series International Value Fund | 12/12/22 | $0.3571 | $0.0231 |
The funds will notify shareholders in January 2024 of amounts for use in preparing 2023 income tax returns.
Board Approval of Investment Advisory Contracts and Management Fees
Fidelity Series Emerging Markets Fund
Fidelity Series Emerging Markets Opportunities Fund
Fidelity Series International Growth Fund
Fidelity Series International Small Cap Fund
Fidelity Series International Value Fund
Each year, the Board of Trustees, including the Independent Trustees (together, the Board), considers the renewal of each fund's management contract with Fidelity Management & Research Company LLC (FMR) and the sub-advisory agreements (together, the Advisory Contracts) for each fund. FMR and the sub-advisers are referred to herein as the Investment Advisers. The Board, assisted by the advice of fund counsel and Independent Trustees' counsel, requests and considers a broad range of information relevant to the renewal of the Advisory Contracts throughout the year.
The Board meets regularly and, at each of its meetings, covers an extensive agenda of topics and materials and considers factors that are relevant to its annual consideration of the renewal of the fund's Advisory Contracts, including the services and support provided to each fund and its shareholders. The Board, acting directly and through its Committees (each of which is composed of and chaired by Independent Trustees), requests and receives information concerning the annual consideration of the renewal of each fund's Advisory Contracts. The Board also meets as needed to review matters specifically related to the Board's annual consideration of the renewal of the Advisory Contracts. Members of the Board may also meet with trustees of other Fidelity funds through joint ad hoc committees to discuss certain matters relevant to all of the Fidelity funds.
Approval of Stub Period Continuation. At its May 2023 meeting, the Board of Trustees voted to continue each fund's management contract with FMR, and the sub-advisory agreements and sub-sub-advisory agreements, in each case, where applicable (together, the Advisory Contracts), without modification, for two months from June 1, 2023 through July 31, 2023. The Board considered that the approval of each fund's Advisory Contracts will not result in any changes in (i) the investment process or strategies employed in the management of each fund's assets; (ii) the fees and expenses paid by shareholders; (iii) the nature, extent or quality of services provided under each fund's Advisory Contracts; or (iv) the day-to-day management of each fund or the persons primarily responsible for such management. The Board also considered that since its last approval of each fund's Advisory Contracts, FMR had provided additional information on each fund in support of the annual contract renewal process, including competitive analyses on total expenses and management fees and in-depth reviews of fund performance and fund profitability information. The Board concluded that each fund's Advisory Contracts are fair and reasonable, and that each fund's Advisory Contracts should be renewed, without modification, through July 31, 2023, with the understanding that the Board would consider the annual renewal for a full one year period in July 2023.
At its July 2023 meeting, the Board unanimously determined to renew each fund's Advisory Contracts. The Board considered all factors it believed relevant and reached a determination, with the assistance of fund counsel and Independent Trustees' counsel and through the exercise of its business judgment, that the renewal of the Advisory Contracts was in the best interests of each fund and its shareholders and the fact that no fee is payable under the management contracts was fair and reasonable in light of all of the surrounding circumstances.
Nature, Extent, and Quality of Services Provided. The Board considered staffing as it relates to the funds, including the backgrounds and experience of investment personnel of the Investment Advisers, and also considered the Investment Advisers' implementation of each fund's investment program. The Independent Trustees also had discussions with senior management of Fidelity's investment operations and investment groups. The Board considered the structure of the investment personnel compensation program and whether this structure provides appropriate incentives to act in the best interests of each fund.
Resources Dedicated to Investment Management and Support Services. The Board and the Fund Oversight and Research Committees reviewed the general qualifications and capabilities of Fidelity's investment staff, including its size, education, experience, and resources, as well as Fidelity's approach to recruiting, training, managing, and compensating investment personnel. The Board noted the resources devoted to expansion of Fidelity's global investment organization, and that Fidelity's analysts have extensive resources, tools, and capabilities that allow them to conduct sophisticated quantitative and fundamental analysis, as well as credit analysis of issuers, counterparties, and guarantors. Further, the Board considered that Fidelity's investment professionals have sufficient access to global information and data so as to provide competitive investment results over time, and that those professionals also have access to sophisticated tools that permit them to assess portfolio construction and risk and performance attribution characteristics continuously, as well as to transmit new information and research conclusions rapidly around the world. Additionally, in its deliberations, the Board considered Fidelity's trading, risk management, compliance, and technology and operations capabilities and resources, which are integral parts of the investment management process.
Administrative Services. The Board considered (i) the nature, extent, quality, and cost of advisory and administrative services performed by the Investment Advisers and their affiliates under the Advisory Contracts and under separate agreements covering transfer agency, pricing and bookkeeping, and securities lending services for each fund; (ii) the nature and extent of Fidelity's supervision of third party service providers, principally custodians, subcustodians, and pricing vendors; and (iii) the resources devoted by Fidelity to, and the record of compliance with, each fund's compliance policies and procedures. The Board also reviewed the allocation of fund brokerage, including allocations to brokers affiliated with the Investment Advisers, the use of brokerage commissions to pay fund expenses, and the use of "soft" commission dollars to pay for research services. The Board also considered each fund's securities lending activities and any payments made to Fidelity relating to securities lending.
Investment Performance. The Board reviewed each fund's absolute investment performance, as well as each fund's relative investment performance, but did not consider performance to be a material factor in its decision to renew each fund's Advisory Contracts, as the funds are not publicly offered as a stand-alone investment product. In this regard, the Board noted that each fund is designed to offer an investment option for other investment companies, 529 plans, and collective investment trusts managed by Fidelity and ultimately to enhance the performance of those investment companies, 529 plans, and collective investment trusts.
Based on its review, the Board concluded that the nature, extent, and quality of services provided to each fund under the Advisory Contracts should continue to benefit the shareholders of each fund.
Competitiveness of Management Fee and Total Expense Ratio. The Board considered that each fund does not pay FMR a management fee for investment advisory services, but that FMR receives fees for providing services to funds that invest in each fund. The Board noted that FMR or an affiliate undertakes to pay all operating expenses of each fund, except transfer agent fees, 12b-1 fees, Independent Trustee fees and expenses, custodian fees and expenses, proxy and shareholder meeting expenses, interest, taxes, and extraordinary expenses (such as litigation expenses). The Board further noted that each fund pays its non-operating expenses, including brokerage commissions and fees and expenses associated with the fund's securities lending program, if applicable.
The Board further considered that FMR has contractually agreed to reimburse each fund to the extent that total operating expenses, with certain exceptions, as a percentage of its average net assets, exceed 0.013% through February 28, 2026.
Based on its review, the Board considered that each fund does not pay a management fee and concluded that the total expense ratio of each fund was reasonable in light of the services that each fund and its shareholders receive and the other factors considered.
Costs of the Services and Profitability. The Board considered the level of Fidelity's profits in respect of all the Fidelity funds.
A public accounting firm has been engaged annually by the Board as part of the Board's assessment of Fidelity's profitability analysis. The engagement includes the review and assessment of the methodologies used by Fidelity in determining the revenues and expenses attributable to Fidelity's fund business, and completion of agreed-upon procedures in respect of the mathematical accuracy of certain fund profitability information and its conformity to established allocation methodologies. After considering the reports issued under the engagement and information provided by Fidelity, the Board concluded that while other allocation methods may also be reasonable, Fidelity's profitability methodologies are reasonable in all material respects.
The Board also reviewed Fidelity's non-fund businesses and potential indirect benefits such businesses may have received as a result of their association with Fidelity's fund business (i.e., fall-out benefits) as well as cases where Fidelity's affiliates may benefit from the funds' business. The Board considered areas where potential indirect benefits to the Fidelity funds from their relationships with Fidelity may exist. The Board's consideration of these matters was informed by the findings of a joint ad hoc committee created by it and the boards of other Fidelity funds to evaluate potential fall-out benefits.
The Board concluded that the costs of the services provided by and the profits realized by Fidelity in connection with the operation of each fund were not relevant to the renewal of the Advisory Contracts because each fund pays no advisory fees and FMR bears all expenses of each fund with certain exceptions.
Economies of Scale. The Board concluded that because each fund pays no advisory fees and FMR bears all expenses of each fund with certain exceptions, the realization of economies of scale was not a material factor in the Board's decision to renew each fund's Advisory Contracts.
Additional Information Requested by the Board. In order to develop fully the factual basis for consideration of the Fidelity funds' advisory contracts, the Board requested and received additional information on certain topics, including: (i) fund flow and performance trends, in particular the underperformance of certain funds and strategies, and Fidelity's long-term strategies for certain funds, including any consideration of fund liquidations or mergers; (ii) the operation of performance fees and competitor use of performance fees; (iii) Fidelity's pricing philosophy compared to competitors; (iv) fund profitability methodology and data; (v) evaluation of competitive fund data and peer group classifications and fee and expense comparisons; (vi) the management fee and expense structures for different funds and classes and information about the differences between various fee and expense structures; (vii) group fee breakpoints and related voluntary fee waivers; and (viii) information regarding other accounts managed by Fidelity and the funds' sub-advisory arrangements.
Conclusion. Based on its evaluation of all of the conclusions noted above, and after considering all factors it believed relevant, the Board, including the Independent Trustees, concluded that the advisory and sub-advisory fee arrangements are fair and reasonable in light of all of the surrounding circumstances, and that each fund's Advisory Contracts should be renewed through July 31, 2024.
1.907943.113
GSV-S-ANN-1223
Fidelity® Series Sustainable Emerging Markets Fund
Fidelity® Series Sustainable Non-U.S. Developed Markets Fund
Annual Report
October 31, 2023
Contents
To view a fund's proxy voting guidelines and proxy voting record for the 12-month period ended June 30, visit http://www.fidelity.com/proxyvotingresults or visit the Securities and Exchange Commission's (SEC) web site at http://www.sec.gov.
You may also call 1-800-544-8544 to request a free copy of the proxy voting guidelines.
Standard & Poor's, S&P and S&P 500 are registered service marks of The McGraw-Hill Companies, Inc. and have been licensed for use by Fidelity Distributors Corporation.
Other third-party marks appearing herein are the property of their respective owners.
All other marks appearing herein are registered or unregistered trademarks or service marks of FMR LLC or an affiliated company. © 2023 FMR LLC. All rights reserved.
This report and the financial statements contained herein are submitted for the general information of the shareholders of the Funds. This report is not authorized for distribution to prospective investors in the Funds unless preceded or accompanied by an effective prospectus.
A fund files its complete schedule of portfolio holdings with the SEC for the first and third quarters of each fiscal year on Form N-PORT. Forms N-PORT are available on the SEC's web site at http://www.sec.gov. A fund's Forms N-PORT may be reviewed and copied at the SEC's Public Reference Room in Washington, DC. Information regarding the operation of the SEC's Public Reference Room may be obtained by calling 1-800-SEC-0330.
For a complete list of a fund's portfolio holdings, view the most recent holdings listing, semiannual report, or annual report on Fidelity's web site at http://www.fidelity.com, http://www.institutional.fidelity.com, or http://www.401k.com, as applicable.
NOT FDIC INSURED •MAY LOSE VALUE •NO BANK GUARANTEE
Neither the Funds nor Fidelity Distributors Corporation is a bank.
Top Holdings (% of Fund's net assets) |
| |
| Taiwan Semiconductor Manufacturing Co. Ltd. sponsored ADR (Taiwan, Semiconductors & Semiconductor Equipment) | 8.1 | |
| Samsung Electronics Co. Ltd. (Korea (South), Technology Hardware, Storage & Peripherals) | 5.0 | |
| Tencent Holdings Ltd. (China, Interactive Media & Services) | 4.1 | |
| HDFC Bank Ltd. sponsored ADR (India, Banks) | 4.0 | |
| Reliance Industries Ltd. GDR (India, Oil, Gas & Consumable Fuels) | 3.3 | |
| Alibaba Group Holding Ltd. (China, Broadline Retail) | 3.0 | |
| ICICI Bank Ltd. sponsored ADR (India, Banks) | 2.8 | |
| Infosys Ltd. sponsored ADR (India, IT Services) | 2.8 | |
| PDD Holdings, Inc. ADR (China, Broadline Retail) | 2.0 | |
| China Construction Bank Corp. (H Shares) (China, Banks) | 1.9 | |
| | 37.0 | |
| |
| Market Sectors (% of Fund's net assets) |
| |
| Financials | 23.5 | |
| Information Technology | 21.1 | |
| Consumer Discretionary | 14.1 | |
| Communication Services | 9.1 | |
| Consumer Staples | 6.8 | |
| Industrials | 5.9 | |
| Energy | 4.8 | |
| Materials | 3.4 | |
| Health Care | 2.9 | |
| Utilities | 2.2 | |
| Real Estate | 1.9 | |
| |
Asset Allocation (% of Fund's net assets) |
|
Futures - 3.2% |
|
Geographic Diversification (% of Fund's net assets) |
|
* Includes Short-Term investments and Net Other Assets (Liabilities). Percentages are adjusted for the effect of derivatives, if applicable. |
| |
Fidelity® Series Sustainable Emerging Markets Fund
Showing Percentage of Net Assets
| Common Stocks - 93.1% |
| | | Shares | Value ($) |
| Brazil - 5.7% | | | |
| Banco BTG Pactual SA unit | | 300 | 1,761 |
| Banco do Brasil SA | | 1,300 | 12,467 |
| Cury Construtora e Incorporado SA | | 1,100 | 3,216 |
| Cyrela Brazil Realty SA | | 500 | 1,784 |
| ENGIE Brasil Energia SA | | 1,900 | 14,810 |
| Equatorial Energia SA | | 1,800 | 11,282 |
| Hapvida Participacoes e Investimentos SA (a)(b) | | 21,500 | 15,736 |
| Hypera SA (a) | | 700 | 4,205 |
| Localiza Rent a Car SA | | 2,900 | 29,260 |
| Localiza Rent a Car SA rights 11/10/23 (a) | | 18 | 25 |
| LOG Commercial Properties e Participacoes SA | | 1,000 | 4,110 |
| MercadoLibre, Inc. (a) | | 15 | 18,611 |
| Multiplan Empreendimentos Imobiliarios SA (a) | | 800 | 3,926 |
| Natura & Co. Holding SA | | 3,300 | 8,345 |
| Raia Drogasil SA | | 7,100 | 36,333 |
| Rede D'Oregon Sao Luiz SA (b) | | 500 | 2,144 |
| StoneCo Ltd. Class A (a) | | 1,106 | 10,966 |
| Suzano Papel e Celulose SA | | 1,700 | 17,389 |
| Transmissora Alianca de Energia Eletrica SA | | 1,800 | 12,064 |
| XP, Inc. Class A | | 1,556 | 31,120 |
| YDUQS Participacoes SA | | 1,800 | 6,330 |
TOTAL BRAZIL | | | 245,884 |
| Chile - 1.2% | | | |
| Antofagasta PLC | | 1,814 | 29,655 |
| Banco de Chile | | 210,396 | 21,616 |
TOTAL CHILE | | | 51,271 |
| China - 27.8% | | | |
| Akeso, Inc. (a)(b) | | 1,011 | 5,677 |
| Alibaba Group Holding Ltd. (a) | | 12,704 | 130,789 |
| Alibaba Group Holding Ltd. sponsored ADR (a) | | 134 | 11,060 |
| Baidu, Inc.: | | | |
| Class A (a) | | 739 | 9,702 |
| sponsored ADR (a) | | 51 | 5,355 |
| BeiGene Ltd. ADR (a) | | 79 | 14,716 |
| BYD Co. Ltd. (H Shares) | | 1,485 | 45,159 |
| China Communications Services Corp. Ltd. (H Shares) | | 16,198 | 6,625 |
| China Construction Bank Corp. (H Shares) | | 146,982 | 83,127 |
| China Gas Holdings Ltd. | | 6,400 | 5,754 |
| China Life Insurance Co. Ltd. (H Shares) | | 18,556 | 25,132 |
| China Resources Beer Holdings Co. Ltd. | | 4,129 | 21,849 |
| China Tower Corp. Ltd. (H Shares) (b) | | 46,966 | 4,380 |
| ENN Energy Holdings Ltd. | | 2,508 | 18,998 |
| ESR Group Ltd. (b) | | 2,598 | 3,338 |
| Flat Glass Group Co. Ltd. | | 1,000 | 1,796 |
| Guangdong Investment Ltd. | | 13,865 | 9,461 |
| Haier Smart Home Co. Ltd. | | 5,014 | 14,302 |
| Haier Smart Home Co. Ltd. ADR | | 798 | 9,112 |
| Haitian International Holdings Ltd. | | 5,000 | 11,928 |
| Industrial & Commercial Bank of China Ltd. (H Shares) | | 51,291 | 24,581 |
| Innovent Biologics, Inc. (a)(b) | | 1,035 | 6,099 |
| JD.com, Inc.: | | | |
| Class A | | 523 | 6,649 |
| sponsored ADR | | 114 | 2,898 |
| JOYY, Inc. ADR | | 93 | 3,620 |
| KE Holdings, Inc. ADR | | 175 | 2,574 |
| Kingdee International Software Group Co. Ltd. (a) | | 3,000 | 3,981 |
| Kunlun Energy Co. Ltd. | | 13,765 | 11,468 |
| Lenovo Group Ltd. | | 30,607 | 35,618 |
| Li Auto, Inc.: | | | |
| ADR (a) | | 719 | 24,309 |
| Class A (a) | | 771 | 13,040 |
| Meituan Class B (a)(b) | | 4,171 | 59,124 |
| NetEase, Inc. ADR | | 280 | 29,938 |
| New Oriental Education & Technology Group, Inc. sponsored ADR (a) | | 584 | 38,246 |
| PDD Holdings, Inc. ADR (a) | | 838 | 84,990 |
| Ping An Insurance Group Co. of China Ltd. (H Shares) | | 9,996 | 50,704 |
| Shangri-La Asia Ltd. (a) | | 17,906 | 11,424 |
| Sinopec Engineering Group Co. Ltd. (H Shares) | | 23,500 | 11,744 |
| Sinotruk Hong Kong Ltd. | | 8,499 | 16,008 |
| Sunny Optical Technology Group Co. Ltd. | | 392 | 3,284 |
| Tencent Holdings Ltd. | | 4,840 | 179,122 |
| Tongdao Liepin Group (a) | | 5,415 | 3,979 |
| TravelSky Technology Ltd. (H Shares) | | 7,123 | 11,252 |
| Trip.com Group Ltd. ADR (a) | | 1,087 | 36,958 |
| Tsingtao Brewery Co. Ltd. (H Shares) | | 2,016 | 15,288 |
| Uni-President China Holdings Ltd. | | 18,705 | 12,730 |
| WuXi AppTec Co. Ltd. (H Shares) (b) | | 1,041 | 12,509 |
| Wuxi Biologics (Cayman), Inc. (a)(b) | | 4,707 | 29,267 |
| XPeng, Inc. ADR (a) | | 629 | 9,108 |
| Zai Lab Ltd. (a) | | 1,613 | 4,116 |
| ZTO Express, Inc. sponsored ADR | | 619 | 14,590 |
TOTAL CHINA | | | 1,207,478 |
| Greece - 1.4% | | | |
| Alpha Bank SA (a) | | 32,020 | 47,771 |
| OPAP SA | | 812 | 13,747 |
TOTAL GREECE | | | 61,518 |
| Hong Kong - 1.3% | | | |
| ASMPT Ltd. | | 1,100 | 9,317 |
| Gushengtang Holdings Ltd. | | 200 | 1,198 |
| Huanxi Media Group Ltd. (a) | | 69,070 | 6,352 |
| Kerry Properties Ltd. | | 5,693 | 9,580 |
| Prudential PLC | | 3,003 | 31,401 |
TOTAL HONG KONG | | | 57,848 |
| India - 14.6% | | | |
| HDFC Bank Ltd. sponsored ADR | | 3,045 | 172,195 |
| ICICI Bank Ltd. sponsored ADR | | 5,599 | 124,242 |
| Infosys Ltd. sponsored ADR | | 7,532 | 123,675 |
| Larsen & Toubro Ltd. GDR | | 2,090 | 73,568 |
| Reliance Industries Ltd. GDR (b) | | 2,603 | 142,124 |
TOTAL INDIA | | | 635,804 |
| Indonesia - 4.3% | | | |
| First Resources Ltd. | | 22,829 | 25,206 |
| PT Bank Central Asia Tbk | | 119,400 | 65,780 |
| PT Bank Mandiri (Persero) Tbk | | 5,300 | 1,893 |
| PT Bank Negara Indonesia (Persero) Tbk | | 4,100 | 1,237 |
| PT Bank Rakyat Indonesia (Persero) Tbk | | 169,300 | 52,937 |
| PT Sumber Alfaria Trijaya Tbk | | 78,800 | 14,341 |
| PT Telkom Indonesia Persero Tbk | | 107,300 | 23,522 |
TOTAL INDONESIA | | | 184,916 |
| Korea (South) - 11.9% | | | |
| AMOREPACIFIC Corp. | | 107 | 10,029 |
| Coway Co. Ltd. | | 271 | 8,659 |
| Delivery Hero AG (a)(b) | | 473 | 11,997 |
| Hyundai Motor Co. Ltd. | | 35 | 4,403 |
| Jeisys Medical, Inc. (a) | | 538 | 4,194 |
| JYP Entertainment Corp. | | 64 | 4,864 |
| Kakao Corp. | | 623 | 17,534 |
| Kakao Pay Corp. (a) | | 26 | 662 |
| KB Financial Group, Inc. | | 744 | 28,318 |
| Kia Corp. | | 375 | 21,393 |
| Korea Aerospace Industries Ltd. | | 53 | 1,741 |
| LG Chemical Ltd. | | 12 | 3,927 |
| LG Corp. | | 141 | 8,059 |
| LS Electric Co. Ltd. | | 83 | 3,943 |
| NAVER Corp. | | 403 | 56,257 |
| NCSOFT Corp. | | 27 | 4,658 |
| POSCO | | 37 | 11,310 |
| Samsung Biologics Co. Ltd. (a)(b) | | 37 | 19,422 |
| Samsung Electronics Co. Ltd. | | 4,389 | 218,138 |
| Samsung SDI Co. Ltd. | | 35 | 11,066 |
| SK Hynix, Inc. | | 777 | 67,376 |
TOTAL KOREA (SOUTH) | | | 517,950 |
| Mexico - 3.5% | | | |
| Corporacion Inmobiliaria Vesta S.A.B. de CV | | 3,351 | 10,507 |
| Corporacion Inmobiliaria Vesta S.A.B. de CV ADR | | 367 | 11,538 |
| Fibra Uno Administracion SA de CV | | 2,500 | 3,795 |
| Gruma S.A.B. de CV Series B | | 1,067 | 18,567 |
| Grupo Aeroportuario del Pacifico S.A.B. de CV Series B | | 648 | 7,559 |
| Grupo Aeroportuario Norte S.A.B. de CV | | 1,200 | 9,161 |
| Grupo Financiero Banorte S.A.B. de CV Series O | | 6,591 | 53,491 |
| Wal-Mart de Mexico SA de CV Series V | | 10,532 | 37,696 |
TOTAL MEXICO | | | 152,314 |
| Netherlands - 0.5% | | | |
| CTP BV (b) | | 1,459 | 21,242 |
| Panama - 0.5% | | | |
| Copa Holdings SA Class A | | 243 | 19,841 |
| Philippines - 0.6% | | | |
| SM Investments Corp. | | 1,371 | 19,331 |
| SM Prime Holdings, Inc. | | 16,800 | 8,867 |
TOTAL PHILIPPINES | | | 28,198 |
| Poland - 0.6% | | | |
| CD Projekt RED SA | | 472 | 11,766 |
| Dino Polska SA (a)(b) | | 156 | 14,759 |
TOTAL POLAND | | | 26,525 |
| South Africa - 3.2% | | | |
| Absa Group Ltd. | | 901 | 8,215 |
| Bid Corp. Ltd. | | 535 | 11,350 |
| Capitec Bank Holdings Ltd. | | 343 | 30,456 |
| Discovery Ltd. | | 3,523 | 24,305 |
| FirstRand Ltd. | | 298 | 982 |
| Impala Platinum Holdings Ltd. | | 4,898 | 20,403 |
| Pick 'n Pay Stores Ltd. | | 4,936 | 6,621 |
| Shoprite Holdings Ltd. | | 1,744 | 22,348 |
| Standard Bank Group Ltd. | | 1,258 | 12,345 |
TOTAL SOUTH AFRICA | | | 137,025 |
| Taiwan - 13.6% | | | |
| ASE Technology Holding Co. Ltd. | | 1,000 | 3,498 |
| ASUSTeK Computer, Inc. | | 1,000 | 10,477 |
| BizLink Holding, Inc. | | 1,000 | 7,787 |
| Chailease Holding Co. Ltd. | | 8,000 | 43,363 |
| Chroma ATE, Inc. | | 1,000 | 6,752 |
| Delta Electronics, Inc. | | 3,000 | 27,015 |
| Formosa Plastics Corp. | | 14,000 | 33,269 |
| HIWIN Technologies Corp. | | 2,000 | 12,111 |
| International Games Systems Co. Ltd. | | 1,000 | 19,260 |
| King Yuan Electronics Co. Ltd. | | 5,000 | 11,837 |
| Lite-On Technology Corp. | | 4,000 | 12,444 |
| Taiwan Semiconductor Manufacturing Co. Ltd. sponsored ADR | | 4,090 | 353,012 |
| Uni-President Enterprises Corp. | | 23,000 | 48,216 |
TOTAL TAIWAN | | | 589,041 |
| Tanzania - 0.3% | | | |
| Helios Towers PLC (a) | | 17,800 | 13,100 |
| Thailand - 0.0% | | | |
| Bangkok Bank PCL (For. Reg.) | | 100 | 436 |
| United States of America - 2.1% | | | |
| FirstCash Holdings, Inc. | | 456 | 49,668 |
| Globant SA (a) | | 71 | 12,091 |
| Legend Biotech Corp. ADR (a) | | 106 | 7,003 |
| Tenaris SA sponsored ADR | | 260 | 8,143 |
| Titan Cement International Trading SA | | 691 | 13,073 |
TOTAL UNITED STATES OF AMERICA | | | 89,978 |
| TOTAL COMMON STOCKS (Cost $4,273,278) | | | 4,040,369 |
| | | | |
| Nonconvertible Preferred Stocks - 2.6% |
| | | Shares | Value ($) |
| Brazil - 2.1% | | | |
| Companhia de Transmissao de Energia Eletrica Paulista (PN) | | 3,400 | 14,290 |
| Itau Unibanco Holding SA | | 1,800 | 9,575 |
| Metalurgica Gerdau SA (PN) | | 5,900 | 12,088 |
| Petroleo Brasileiro SA - Petrobras: | | | |
| (PN) sponsored ADR (non-vtg.) | | 1,689 | 23,359 |
| sponsored ADR | | 2,054 | 30,810 |
TOTAL BRAZIL | | | 90,122 |
| Korea (South) - 0.5% | | | |
| Hyundai Motor Co. Ltd. Series 2 | | 188 | 13,946 |
| Samsung Electronics Co. Ltd. | | 271 | 10,804 |
TOTAL KOREA (SOUTH) | | | 24,750 |
| TOTAL NONCONVERTIBLE PREFERRED STOCKS (Cost $104,653) | | | 114,872 |
| | | | |
| Money Market Funds - 2.7% |
| | | Shares | Value ($) |
Fidelity Cash Central Fund 5.40% (c) (Cost $118,523) | | 118,499 | 118,523 |
| | | | |
| TOTAL INVESTMENT IN SECURITIES - 98.4% (Cost $4,496,454) | 4,273,764 |
NET OTHER ASSETS (LIABILITIES) - 1.6% | 67,407 |
| NET ASSETS - 100.0% | 4,341,171 |
| | |
| Futures Contracts |
| | Number of contracts | Expiration Date | Notional Amount ($) | Value ($) | Unrealized Appreciation/ (Depreciation) ($) |
| Purchased | | | | | |
| | | | | | |
| Equity Index Contracts | | | | | |
| ICE MSCI Emerging Markets Index Contracts (United States) | 3 | Dec 2023 | 137,880 | (2,959) | (2,959) |
| | | | | | |
| The notional amount of futures purchased as a percentage of Net Assets is 3.2% |
For the period, the average monthly notional amount at value for futures contracts in the aggregate was $88,378.
Legend
| (b) | Security exempt from registration under Rule 144A of the Securities Act of 1933. These securities may be resold in transactions exempt from registration, normally to qualified institutional buyers. At the end of the period, the value of these securities amounted to $347,818 or 8.0% of net assets. |
| (c) | Affiliated fund that is generally available only to investment companies and other accounts managed by Fidelity Investments. The rate quoted is the annualized seven-day yield of the fund at period end. A complete unaudited listing of the fund's holdings as of its most recent quarter end is available upon request. In addition, each Fidelity Central Fund's financial statements, which are not covered by the Fund's Report of Independent Registered Public Accounting Firm, are available on the SEC's website or upon request. |
Affiliated Central Funds
Fiscal year to date information regarding the Fund's investments in Fidelity Central Funds, including the ownership percentage, is presented below.
| Affiliate | Value, beginning of period ($) | Purchases ($) | Sales Proceeds ($) | Dividend Income ($) | Realized Gain (loss) ($) | Change in Unrealized appreciation (depreciation) ($) | Value, end of period ($) | % ownership, end of period |
| Fidelity Cash Central Fund 5.40% | - | 4,683,179 | 4,564,656 | 6,860 | - | - | 118,523 | 0.0% |
| Total | - | 4,683,179 | 4,564,656 | 6,860 | - | - | 118,523 | |
| | | | | | | | | |
Amounts in the dividend income column in the above table include any capital gain distributions from underlying funds, which are presented in the corresponding line item in the Statement of Operations, if applicable.
Amounts included in the purchases and sales proceeds columns may include in-kind transactions, if applicable.
Investment Valuation
The following is a summary of the inputs used, as of October 31, 2023, involving the Fund's assets and liabilities carried at fair value. The inputs or methodology used for valuing securities may not be an indication of the risk associated with investing in those securities. For more information on valuation inputs, and their aggregation into the levels used below, please refer to the Investment Valuation section in the accompanying Notes to Financial Statements.
| Valuation Inputs at Reporting Date: |
| Description | Total ($) | Level 1 ($) | Level 2 ($) | Level 3 ($) |
Investments in Securities: | | | | |
|
| Equities: | | | | |
Communication Services | 393,409 | 63,779 | 329,630 | - |
Consumer Discretionary | 612,506 | 272,366 | 340,140 | - |
Consumer Staples | 303,678 | 156,019 | 147,659 | - |
Energy | 204,436 | 204,436 | - | - |
Financials | 1,020,746 | 611,175 | 409,571 | - |
Health Care | 126,286 | 43,804 | 82,482 | - |
Industrials | 253,281 | 154,004 | 99,277 | - |
Information Technology | 922,181 | 488,778 | 433,403 | - |
Materials | 141,114 | 72,205 | 68,909 | - |
Real Estate | 79,477 | 57,692 | 21,785 | - |
Utilities | 98,127 | 52,446 | 45,681 | - |
|
| Money Market Funds | 118,523 | 118,523 | - | - |
| Total Investments in Securities: | 4,273,764 | 2,295,227 | 1,978,537 | - |
Derivative Instruments: Liabilities | | | | |
Futures Contracts | (2,959) | (2,959) | - | - |
| Total Liabilities | (2,959) | (2,959) | - | - |
| Total Derivative Instruments: | (2,959) | (2,959) | - | - |
Value of Derivative Instruments
The following table is a summary of the Fund's value of derivative instruments by primary risk exposure as of October 31, 2023. For additional information on derivative instruments, please refer to the Derivative Instruments section in the accompanying Notes to Financial Statements.
Primary Risk Exposure / Derivative Type �� | Value |
| Asset ($) | Liability ($) |
| Equity Risk | | |
Futures Contracts (a) | 0 | (2,959) |
| Total Equity Risk | 0 | (2,959) |
| Total Value of Derivatives | 0 | (2,959) |
(a)Reflects gross cumulative appreciation (depreciation) on futures contracts as presented in the Schedule of Investments. In the Statement of Assets and Liabilities, the period end daily variation margin is included in receivable or payable for daily variation margin on futures contracts, and the net cumulative appreciation (depreciation) is included in Total accumulated earnings (loss).
Fidelity® Series Sustainable Emerging Markets Fund
| Statement of Assets and Liabilities |
| | | | October 31, 2023 |
| | | | | |
| Assets | | | | |
| Investment in securities, at value - See accompanying schedule: | | | | |
Unaffiliated issuers (cost $4,377,931) | $ | 4,155,241 | | |
Fidelity Central Funds (cost $118,523) | | 118,523 | | |
| | | | | |
| | | | | |
| Total Investment in Securities (cost $4,496,454) | | | $ | 4,273,764 |
| Segregated cash with brokers for derivative instruments | | | | 8,612 |
| Cash | | | | 47,502 |
| Receivable for fund shares sold | | | | 5,319 |
| Dividends receivable | | | | 8,519 |
| Distributions receivable from Fidelity Central Funds | | | | 532 |
| Receivable from investment adviser for expense reductions | | | | 2,757 |
Total assets | | | | 4,347,005 |
| Liabilities | | | | |
| Payable for fund shares redeemed | $ | 184 | | |
| Payable for daily variation margin on futures contracts | | 915 | | |
| Custody fee payable | | 4,735 | | |
| Total Liabilities | | | | 5,834 |
| Net Assets | | | $ | 4,341,171 |
| Net Assets consist of: | | | | |
| Paid in capital | | | $ | 4,535,384 |
| Total accumulated earnings (loss) | | | | (194,213) |
| Net Assets | | | $ | 4,341,171 |
Net Asset Value, offering price and redemption price per share ($4,341,171 ÷ 451,158 shares) | | | $ | 9.62 |
| Statement of Operations |
| | | | For the period May 11, 2023 (commencement of operations) through October 31, 2023 |
| Investment Income | | | | |
| Dividends | | | $ | 69,190 |
| Interest | | | | 78 |
| Income from Fidelity Central Funds | | | | 6,860 |
| Income before foreign taxes withheld | | | $ | 76,128 |
| Less foreign taxes withheld | | | | (6,061) |
| Total Income | | | | 70,067 |
| Expenses | | | | |
| Custodian fees and expenses | $ | 6,414 | | |
| Independent trustees' fees and expenses | | 7 | | |
| Total expenses before reductions | | 6,421 | | |
| Expense reductions | | (6,259) | | |
| Total expenses after reductions | | | | 162 |
| Net Investment income (loss) | | | | 69,905 |
| Realized and Unrealized Gain (Loss) | | | | |
| Net realized gain (loss) on: | | | | |
| Investment Securities: | | | | |
| Unaffiliated issuers | | (26,149) | | |
| Foreign currency transactions | | (1,368) | | |
| Futures contracts | | (10,954) | | |
| Total net realized gain (loss) | | | | (38,471) |
| Change in net unrealized appreciation (depreciation) on: | | | | |
| Investment Securities: | | | | |
| Unaffiliated issuers | | (222,690) | | |
| Assets and liabilities in foreign currencies | | 3 | | |
| Futures contracts | | (2,959) | | |
| Total change in net unrealized appreciation (depreciation) | | | | (225,646) |
| Net gain (loss) | | | | (264,117) |
| Net increase (decrease) in net assets resulting from operations | | | $ | (194,212) |
| Statement of Changes in Net Assets |
| |
| | For the period May 11, 2023 (commencement of operations) through October 31, 2023 |
| Increase (Decrease) in Net Assets | | |
| Operations | | |
| Net investment income (loss) | $ | 69,905 |
| Net realized gain (loss) | | (38,471) |
| Change in net unrealized appreciation (depreciation) | | (225,646) |
| Net increase (decrease) in net assets resulting from operations | | (194,212) |
| Share transactions | | |
| Proceeds from sales of shares | | 4,692,849 |
| Cost of shares redeemed | | (157,466) |
| | | |
Net increase (decrease) in net assets resulting from share transactions | | 4,535,383 |
| Total increase (decrease) in net assets | | 4,341,171 |
| | | |
| Net Assets | | |
| Beginning of period | | - |
| End of period | $ | 4,341,171 |
| | | |
| Other Information | | |
| Shares | | |
| Sold | | 466,593 |
| Redeemed | | (15,435) |
| Net increase (decrease) | | 451,158 |
| | | |
Financial Highlights
| Fidelity® Series Sustainable Emerging Markets Fund |
| |
| Years ended October 31, | | 2023 A |
Selected Per-Share Data | | |
| Net asset value, beginning of period | $ | 10.00 |
| Income from Investment Operations | | |
Net investment income (loss) B,C | | .16 |
| Net realized and unrealized gain (loss) | | (.54) |
| Total from investment operations | | (.38) |
| Net asset value, end of period | $ | 9.62 |
Total Return D,E | | (3.80)% |
Ratios to Average Net Assets B,F,G | | |
| Expenses before reductions | | .31% H |
| Expenses net of fee waivers, if any | | .01% H |
| Expenses net of all reductions | | .01% H |
| Net investment income (loss) | | 3.40% H |
| Supplemental Data | | |
| Net assets, end of period (000 omitted) | $ | 4,341 |
Portfolio turnover rate I | | 36% J |
AFor the period May 11, 2023 (commencement of operations) through October 31, 2023.
BNet investment income (loss) is affected by the timing of the declaration of dividends by any underlying mutual funds or exchange-traded funds (ETFs). Net investment income (loss) of any mutual funds or ETFs is not included in the Fund's net investment income (loss) ratio.
CCalculated based on average shares outstanding during the period.
DTotal returns for periods of less than one year are not annualized.
ETotal returns would have been lower if certain expenses had not been reduced during the applicable periods shown.
FFees and expenses of any underlying mutual funds or exchange-traded funds (ETFs) are not included in the Fund's expense ratio. The Fund indirectly bears its proportionate share of these expenses. For additional expense information related to investments in Fidelity Central Funds, please refer to the "Investments in Fidelity Central Funds" note found in the Notes to Financial Statements section of the most recent Annual or Semi-Annual report.
GExpense ratios reflect operating expenses of the class. Expenses before reductions do not reflect amounts reimbursed, waived, or reduced through arrangements with the investment adviser, brokerage services, or other offset arrangements, if applicable, and do not represent the amount paid by the class during periods when reimbursements, waivers or reductions occur.
HAnnualized.
IAmount does not include the portfolio activity of any underlying mutual funds or exchange-traded funds (ETFs).
JAmount not annualized.
Top Holdings (% of Fund's net assets) |
| |
| ASML Holding NV (Netherlands) (Netherlands, Semiconductors & Semiconductor Equipment) | 2.6 | |
| Novo Nordisk A/S Series B (Denmark, Pharmaceuticals) | 2.4 | |
| LVMH Moet Hennessy Louis Vuitton SE (France, Textiles, Apparel & Luxury Goods) | 2.0 | |
| Linde PLC (United States of America, Chemicals) | 1.7 | |
| TotalEnergies SE (France, Oil, Gas & Consumable Fuels) | 1.7 | |
| Nestle SA (Reg. S) (United States of America, Food Products) | 1.6 | |
| BAE Systems PLC (United Kingdom, Aerospace & Defense) | 1.4 | |
| Shell PLC ADR (Netherlands, Oil, Gas & Consumable Fuels) | 1.4 | |
| AstraZeneca PLC (United Kingdom) (United Kingdom, Pharmaceuticals) | 1.1 | |
| Marsh & McLennan Companies, Inc. (United States of America, Insurance) | 1.1 | |
| | 17.0 | |
| |
| Market Sectors (% of Fund's net assets) |
| |
| Financials | 21.7 | |
| Industrials | 20.1 | |
| Information Technology | 11.5 | |
| Consumer Discretionary | 10.3 | |
| Materials | 8.4 | |
| Health Care | 7.9 | |
| Energy | 6.7 | |
| Consumer Staples | 5.6 | |
| Communication Services | 1.8 | |
| Real Estate | 1.3 | |
| Utilities | 0.6 | |
| |
Asset Allocation (% of Fund's net assets) |
|
Futures - 2.9% |
|
Geographic Diversification (% of Fund's net assets) |
|
* Includes Short-Term investments and Net Other Assets (Liabilities). Percentages are adjusted for the effect of derivatives, if applicable. |
| |
Fidelity® Series Sustainable Non-U.S. Developed Markets Fund
Showing Percentage of Net Assets
| Common Stocks - 95.9% |
| | | Shares | Value ($) |
| Australia - 2.3% | | | |
| ASX Ltd. | | 128 | 4,573 |
| BlueScope Steel Ltd. | | 164 | 1,966 |
| Brambles Ltd. | | 1,446 | 12,068 |
| Cochlear Ltd. | | 28 | 4,292 |
| Computershare Ltd. | | 292 | 4,608 |
| DEXUS Property Group unit | | 1,009 | 4,167 |
| EBOS Group Ltd. | | 430 | 8,778 |
| Flutter Entertainment PLC (a) | | 90 | 14,117 |
| Flutter Entertainment PLC (Ireland) (a) | | 7 | 1,096 |
| Fortescue Metals Group Ltd. | | 284 | 4,040 |
| IGO Ltd. | | 532 | 3,221 |
| Imdex Ltd. | | 1,927 | 2,021 |
| Lendlease Group unit | | 543 | 2,151 |
| Macquarie Group Ltd. | | 88 | 9,046 |
| Mineral Resources Ltd. | | 118 | 4,349 |
| Mirvac Group unit | | 5,231 | 6,069 |
| Orica Ltd. | | 493 | 4,607 |
| Pilbara Minerals Ltd. | | 1,284 | 3,016 |
| QBE Insurance Group Ltd. | | 144 | 1,428 |
| REA Group Ltd. | | 59 | 5,416 |
| Suncorp Group Ltd. | | 419 | 3,566 |
| Transurban Group unit | | 2,744 | 20,658 |
| Woodside Energy Group Ltd. | | 1,523 | 33,171 |
TOTAL AUSTRALIA | | | 158,424 |
| Austria - 0.4% | | | |
| Mondi PLC | | 274 | 4,426 |
| OMV AG | | 277 | 12,122 |
| Verbund AG | | 62 | 5,379 |
| Wienerberger AG | | 81 | 1,966 |
TOTAL AUSTRIA | | | 23,893 |
| Belgium - 1.0% | | | |
| Azelis Group NV | | 611 | 10,409 |
| Fagron NV | | 143 | 2,509 |
| KBC Ancora | | 215 | 8,121 |
| KBC Group NV | | 807 | 44,317 |
| Umicore SA | | 102 | 2,427 |
TOTAL BELGIUM | | | 67,783 |
| Brazil - 0.4% | | | |
| Wheaton Precious Metals Corp. | | 630 | 26,608 |
| Canada - 9.7% | | | |
| Alimentation Couche-Tard, Inc. Class A (multi-vtg.) | | 1,066 | 58,029 |
| Andlauer Healthcare Group, Inc. | | 163 | 4,565 |
| Bank of Montreal | | 598 | 45,188 |
| Brookfield Asset Management Ltd. Class A | | 131 | 3,755 |
| Brookfield Corp. (Canada) Class A | | 737 | 21,471 |
| CAE, Inc. (a) | | 1,280 | 26,731 |
| Cameco Corp. | | 427 | 17,468 |
| Cameco Corp. | | 127 | 5,196 |
| Canadian National Railway Co. | | 233 | 24,653 |
| Canadian Natural Resources Ltd. | | 186 | 11,811 |
| Canadian Pacific Kansas City Ltd. | | 828 | 58,788 |
| Cogeco Communications, Inc. | | 26 | 1,024 |
| Computer Modelling Group Ltd. | | 781 | 5,159 |
| Definity Financial Corp. | | 168 | 4,645 |
| Dollarama, Inc. | | 108 | 7,375 |
| Enbridge, Inc. | | 729 | 23,362 |
| Franco-Nevada Corp. | | 218 | 26,520 |
| Intact Financial Corp. | | 164 | 23,042 |
| Jamieson Wellness, Inc. (b) | | 78 | 1,281 |
| Magna International, Inc. Class A (sub. vtg.) | | 190 | 9,130 |
| Metro, Inc. | | 235 | 11,937 |
| Nutrien Ltd. | | 497 | 26,693 |
| Parkland Corp. | | 398 | 12,045 |
| Pason Systems, Inc. | | 530 | 5,079 |
| PrairieSky Royalty Ltd. | | 1,766 | 31,009 |
| Real Matters, Inc. (a) | | 413 | 1,456 |
| Richelieu Hardware Ltd. | | 249 | 7,448 |
| Royal Bank of Canada | | 516 | 41,213 |
| Shopify, Inc. Class A (a) | | 558 | 26,352 |
| Sun Life Financial, Inc. | | 1,051 | 48,005 |
| The Toronto-Dominion Bank | | 1,002 | 55,969 |
| Thomson Reuters Corp. | | 57 | 6,828 |
| TMX Group Ltd. | | 523 | 10,892 |
| Triple Flag Precious Metals Corp. | | 116 | 1,475 |
TOTAL CANADA | | | 665,594 |
| Chile - 0.1% | | | |
| Antofagasta PLC | | 315 | 5,150 |
| Lundin Mining Corp. | | 609 | 3,803 |
TOTAL CHILE | | | 8,953 |
| China - 0.1% | | | |
| BOC Hong Kong (Holdings) Ltd. | | 2,005 | 5,302 |
| Prosus NV | | 156 | 4,363 |
TOTAL CHINA | | | 9,665 |
| Denmark - 3.3% | | | |
| Carlsberg A/S Series B | | 34 | 4,052 |
| DSV A/S | | 217 | 32,363 |
| Genmab A/S (a) | | 13 | 3,675 |
| Novo Nordisk A/S Series B | | 1,686 | 162,659 |
| Novozymes A/S Series B | | 50 | 2,244 |
| ORSTED A/S (b) | | 21 | 1,015 |
| Pandora A/S | | 53 | 5,997 |
| Vestas Wind Systems A/S (a) | | 702 | 15,216 |
TOTAL DENMARK | | | 227,221 |
| Finland - 1.0% | | | |
| Kesko Oyj | | 262 | 4,426 |
| Metso Corp. | | 768 | 6,750 |
| Musti Group OYJ | | 98 | 1,930 |
| Neste OYJ | | 277 | 9,294 |
| Nokia Corp. | | 2,645 | 8,810 |
| Nordea Bank Abp | | 2,138 | 22,467 |
| UPM-Kymmene Corp. | | 124 | 4,168 |
| Wartsila Corp. | | 608 | 7,231 |
TOTAL FINLAND | | | 65,076 |
| France - 10.5% | | | |
| Air Liquide SA | | 143 | 24,503 |
| Airbus Group NV | | 376 | 50,413 |
| ALTEN | | 175 | 20,609 |
| AXA SA | | 1,304 | 38,638 |
| BNP Paribas SA | | 510 | 29,327 |
| Capgemini SA | | 195 | 34,462 |
| Compagnie Generale des Etablissements Michelin SCA Series B | | 821 | 24,391 |
| Covivio | | 257 | 10,986 |
| Danone SA | | 289 | 17,193 |
| Dassault Systemes SA | | 443 | 18,249 |
| Edenred SA | | 772 | 41,039 |
| EssilorLuxottica SA | | 64 | 11,555 |
| Exclusive Networks SA (a) | | 123 | 1,955 |
| Gecina SA | | 64 | 6,271 |
| Hermes International SCA | | 2 | 3,724 |
| Kering SA | | 14 | 5,694 |
| L'Oreal SA | | 78 | 32,786 |
| Lectra | | 333 | 8,421 |
| Legrand SA | | 324 | 28,028 |
| LVMH Moet Hennessy Louis Vuitton SE | | 195 | 139,606 |
| Pernod Ricard SA | | 89 | 15,774 |
| Societe Generale Series A | | 699 | 15,708 |
| Stef SA | | 25 | 2,688 |
| Teleperformance | | 45 | 5,150 |
| Thermador Groupe SA | | 36 | 2,556 |
| TotalEnergies SE | | 1,752 | 117,134 |
| Valeo SA | | 647 | 8,516 |
| Worldline SA (a)(b) | | 116 | 1,470 |
TOTAL FRANCE | | | 716,846 |
| Germany - 5.5% | | | |
| adidas AG | | 15 | 2,654 |
| Allianz SE | | 78 | 18,271 |
| Commerzbank AG | | 615 | 6,605 |
| Covestro AG (a)(b) | | 7 | 353 |
| Deutsche Borse AG | | 275 | 45,264 |
| Deutsche Lufthansa AG (a) | | 589 | 4,116 |
| DHL Group | | 268 | 10,424 |
| Fresenius SE & Co. KGaA | | 151 | 3,873 |
| GEA Group AG | | 276 | 9,412 |
| Hannover Reuck SE | | 151 | 33,281 |
| Henkel AG & Co. KGaA | | 230 | 14,536 |
| Infineon Technologies AG | | 1,023 | 29,882 |
| LEG Immobilien AG (a) | | 85 | 5,292 |
| Merck KGaA | | 226 | 34,040 |
| Muenchener Rueckversicherungs-Gesellschaft AG in Muenchen | | 102 | 40,850 |
| Puma AG | | 79 | 4,455 |
| Rheinmetall AG | | 126 | 36,050 |
| SAP SE | | 246 | 32,997 |
| Siemens AG | | 286 | 37,952 |
| Siemens Healthineers AG (b) | | 83 | 4,068 |
| Zalando SE (a)(b) | | 94 | 2,187 |
TOTAL GERMANY | | | 376,562 |
| Greece - 0.0% | | | |
| Mytilineos SA | | 59 | 2,184 |
| Hong Kong - 1.1% | | | |
| AIA Group Ltd. | | 3,594 | 31,210 |
| Hang Seng Bank Ltd. | | 501 | 5,728 |
| Hong Kong Exchanges and Clearing Ltd. | | 203 | 7,101 |
| MTR Corp. Ltd. | | 3,512 | 13,129 |
| Prudential PLC | | 1,382 | 14,451 |
| Swire Pacific Ltd. (A Shares) | | 518 | 3,309 |
| Swire Properties Ltd. | | 432 | 836 |
TOTAL HONG KONG | | | 75,764 |
| India - 0.3% | | | |
| HDFC Bank Ltd. sponsored ADR | | 367 | 20,754 |
| Indonesia - 0.2% | | | |
| PT Bank Rakyat Indonesia (Persero) Tbk | | 25,400 | 7,942 |
| PT Selamat Sempurna Tbk | | 15,200 | 2,076 |
TOTAL INDONESIA | | | 10,018 |
| Ireland - 0.5% | | | |
| Bank of Ireland Group PLC | | 1,197 | 10,702 |
| Kerry Group PLC Class A | | 105 | 8,097 |
| Kingspan Group PLC (Ireland) | | 262 | 17,598 |
TOTAL IRELAND | | | 36,397 |
| Israel - 0.4% | | | |
| Bank Hapoalim BM (Reg.) | | 127 | 907 |
| Elbit Systems Ltd. (Israel) | | 30 | 5,569 |
| Ituran Location & Control Ltd. | | 143 | 3,536 |
| NICE Ltd. (a) | | 21 | 3,245 |
| NICE Ltd. sponsored ADR (a) | | 72 | 11,113 |
| Wix.com Ltd. (a) | | 68 | 5,433 |
TOTAL ISRAEL | | | 29,803 |
| Italy - 2.1% | | | |
| Assicurazioni Generali SpA | | 1,717 | 34,055 |
| Banca Generali SpA | | 55 | 1,782 |
| BFF Bank SpA (b) | | 235 | 2,257 |
| Enel SpA | | 646 | 4,101 |
| Eni SpA | | 917 | 14,991 |
| GVS SpA (a)(b) | | 271 | 1,210 |
| Industrie de Nora SpA | | 119 | 1,678 |
| Intesa Sanpaolo SpA | | 6,611 | 17,227 |
| Prada SpA | | 2,240 | 13,494 |
| Recordati SpA | | 269 | 12,410 |
| Terna - Rete Elettrica Nazionale | | 293 | 2,240 |
| UniCredit SpA | | 1,610 | 40,362 |
TOTAL ITALY | | | 145,807 |
| Japan - 15.8% | | | |
| Ajinomoto Co., Inc. | | 504 | 18,407 |
| Ana Holdings, Inc. (a) | | 400 | 7,853 |
| Asahi Kasei Corp. | | 3,102 | 19,070 |
| Astellas Pharma, Inc. | | 296 | 3,744 |
| BayCurrent Consulting, Inc. | | 96 | 2,410 |
| Bridgestone Corp. | | 201 | 7,607 |
| Capcom Co. Ltd. | | 198 | 6,373 |
| Curves Holdings Co. Ltd. | | 1,018 | 4,441 |
| Daifuku Co. Ltd. | | 400 | 6,609 |
| Daiichi Sankyo Kabushiki Kaisha | | 206 | 5,312 |
| Daiwa Securities Group, Inc. | | 5,189 | 29,922 |
| DENSO Corp. | | 400 | 5,907 |
| Dexerials Corp. | | 100 | 2,281 |
| Eisai Co. Ltd. | | 201 | 10,649 |
| Elan Corp. | | 207 | 1,023 |
| ENEOS Holdings, Inc. | | 999 | 3,702 |
| FANUC Corp. | | 591 | 14,667 |
| Fast Retailing Co. Ltd. | | 100 | 22,140 |
| FUJIFILM Holdings Corp. | | 497 | 27,185 |
| Fujitsu Ltd. | | 201 | 26,039 |
| Hankyu Hanshin Holdings, Inc. | | 700 | 22,025 |
| Hitachi Ltd. | | 800 | 50,709 |
| Honda Motor Co. Ltd. | | 1,782 | 18,263 |
| Hoya Corp. | | 704 | 67,773 |
| Ibiden Co. Ltd. | | 390 | 16,628 |
| Itochu Corp. | | 1,477 | 53,203 |
| JFE Holdings, Inc. | | 378 | 5,267 |
| KDDI Corp. | | 798 | 23,872 |
| Koshidaka Holdings Co. Ltd. | | 592 | 4,212 |
| Kubota Corp. | | 594 | 7,989 |
| Kurita Water Industries Ltd. | | 200 | 6,077 |
| LIXIL Group Corp. | | 600 | 6,579 |
| LY Corp. | | 1,100 | 2,804 |
| Marubeni Corp. | | 689 | 10,074 |
| MatsukiyoCocokara & Co. | | 300 | 5,263 |
| Minebea Mitsumi, Inc. | | 298 | 4,672 |
| Mitsubishi Heavy Industries Ltd. | | 94 | 4,841 |
| Mitsui Chemicals, Inc. | | 99 | 2,495 |
| Miura Co. Ltd. | | 101 | 1,958 |
| NEC Corp. | | 97 | 4,671 |
| Nitto Denko Corp. | | 96 | 6,212 |
| Nomura Holdings, Inc. | | 797 | 3,079 |
| Nomura Research Institute Ltd. | | 397 | 10,421 |
| OMRON Corp. | | 300 | 10,748 |
| Oriental Land Co. Ltd. | | 301 | 9,736 |
| ORIX Corp. | | 1,180 | 21,460 |
| Panasonic Holdings Corp. | | 200 | 1,755 |
| Persol Holdings Co. Ltd. | | 4,000 | 5,998 |
| Rakuten Group, Inc. | | 1,296 | 4,794 |
| Recruit Holdings Co. Ltd. | | 979 | 28,071 |
| Renesas Electronics Corp. (a) | | 1,682 | 22,094 |
| San-Ai Obbli Co. Ltd. | | 200 | 2,160 |
| Seiko Epson Corp. | | 300 | 4,165 |
| Sekisui Chemical Co. Ltd. | | 298 | 4,082 |
| SG Holdings Co. Ltd. | | 791 | 11,212 |
| Shin-Etsu Chemical Co. Ltd. | | 1,200 | 35,884 |
| Shionogi & Co. Ltd. | | 2 | 93 |
| SoftBank Corp. | | 1,400 | 15,830 |
| SoftBank Group Corp. | | 99 | 4,054 |
| Sompo Holdings, Inc. | | 298 | 12,909 |
| Sony Group Corp. | | 691 | 57,449 |
| Sumitomo Chemical Co. Ltd. | | 6,182 | 15,713 |
| Sumitomo Metal Mining Co. Ltd. | | 199 | 5,590 |
| Sysmex Corp. | | 201 | 9,628 |
| T&D Holdings, Inc. | | 300 | 5,352 |
| TDK Corp. | | 99 | 3,704 |
| TIS, Inc. | | 496 | 10,622 |
| Tokio Marine Holdings, Inc. | | 2,575 | 57,609 |
| Tokyo Electron Ltd. | | 200 | 26,428 |
| Tokyo Gas Co. Ltd. | | 97 | 2,178 |
| Toray Industries, Inc. | | 2,997 | 14,499 |
| Toyota Motor Corp. | | 3,300 | 57,729 |
| USS Co. Ltd. | | 304 | 5,314 |
| YAKUODO Holdings Co. Ltd. | | 100 | 1,842 |
| Yamaha Corp. | | 399 | 10,657 |
| Yamaha Motor Co. Ltd. | | 702 | 17,155 |
| Yaskawa Electric Corp. | | 396 | 12,962 |
| Yokogawa Electric Corp. | | 360 | 6,536 |
TOTAL JAPAN | | | 1,080,440 |
| Korea (South) - 0.2% | | | |
| Samsung Electronics Co. Ltd. | | 303 | 15,059 |
| Netherlands - 5.5% | | | |
| Adyen BV (a)(b) | | 1 | 674 |
| Akzo Nobel NV | | 172 | 11,513 |
| ASM International NV (Netherlands) | | 32 | 13,154 |
| ASML Holding NV (Netherlands) | | 293 | 176,131 |
| BE Semiconductor Industries NV | | 24 | 2,471 |
| ING Groep NV (Certificaten Van Aandelen) | | 667 | 8,551 |
| Koninklijke KPN NV | | 4,145 | 13,932 |
| Shell PLC: | | | |
| ADR | | 1,212 | 78,950 |
| (London) | | 572 | 18,434 |
| TKH Group NV (bearer) (depositary receipt) | | 32 | 1,167 |
| Topicus.Com, Inc. (a) | | 20 | 1,317 |
| Universal Music Group NV | | 343 | 8,400 |
| Wolters Kluwer NV | | 296 | 37,928 |
TOTAL NETHERLANDS | | | 372,622 |
| New Zealand - 0.1% | | | |
| Meridian Energy Ltd. | | 696 | 1,960 |
| Xero Ltd. (a) | | 68 | 4,649 |
TOTAL NEW ZEALAND | | | 6,609 |
| Norway - 1.0% | | | |
| DNB Bank ASA | | 768 | 13,839 |
| Equinor ASA | | 573 | 19,209 |
| Gjensidige Forsikring ASA | | 478 | 7,159 |
| Kongsberg Gruppen ASA | | 271 | 11,062 |
| Norsk Hydro ASA | | 578 | 3,296 |
| Orkla ASA | | 425 | 2,927 |
| Schibsted ASA (B Shares) | | 285 | 5,281 |
| Telenor ASA | | 444 | 4,537 |
| Volue A/S (a) | | 594 | 996 |
TOTAL NORWAY | | | 68,306 |
| Portugal - 0.3% | | | |
| Galp Energia SGPS SA Class B | | 1,347 | 20,253 |
| Singapore - 0.9% | | | |
| CapitaLand Investment Ltd. | | 2,633 | 5,654 |
| City Developments Ltd. | | 2,111 | 9,744 |
| Keppel (REIT) (c) | | 722 | 419 |
| Keppel Corp. Ltd. | | 3,610 | 16,387 |
| STMicroelectronics NV (France) | | 365 | 13,914 |
| United Overseas Bank Ltd. | | 705 | 13,906 |
TOTAL SINGAPORE | | | 60,024 |
| South Africa - 0.2% | | | |
| Anglo American PLC (United Kingdom) | | 608 | 15,492 |
| Spain - 2.0% | | | |
| Amadeus IT Holding SA Class A | | 1,134 | 64,578 |
| Banco Bilbao Vizcaya Argentaria SA | | 1,357 | 10,676 |
| Banco Santander SA (Spain) | | 9,926 | 36,402 |
| Corp. ACCIONA Energias Renovables SA | | 125 | 3,383 |
| Iberdrola SA | | 131 | 1,457 |
| Industria de Diseno Textil SA | | 173 | 5,958 |
| Naturgy Energy Group SA | | 374 | 10,566 |
| Redeia Corp. SA | | 324 | 5,041 |
TOTAL SPAIN | | | 138,061 |
| Sweden - 3.5% | | | |
| Addlife AB | | 216 | 1,407 |
| AddTech AB (B Shares) | | 1,347 | 19,718 |
| Alfa Laval AB | | 131 | 4,232 |
| ASSA ABLOY AB (B Shares) | | 652 | 13,897 |
| Atlas Copco AB (A Shares) | | 5,182 | 67,102 |
| Autoliv, Inc. | | 156 | 14,297 |
| Bergman & Beving AB (B Shares) | | 290 | 3,887 |
| Boliden AB | | 464 | 11,878 |
| Dometic Group AB (b) | | 239 | 1,471 |
| Epiroc AB (A Shares) | | 1,559 | 25,684 |
| EQT AB | | 31 | 563 |
| Essity AB (B Shares) | | 138 | 3,144 |
| H&M Hennes & Mauritz AB (B Shares) | | 161 | 2,153 |
| Hemnet Group AB | | 266 | 4,616 |
| Indutrade AB | | 634 | 11,198 |
| Investor AB (B Shares) | | 113 | 2,069 |
| INVISIO AB | | 351 | 5,270 |
| Nibe Industrier AB (B Shares) | | 292 | 1,679 |
| Sandvik AB | | 124 | 2,112 |
| Svenska Cellulosa AB SCA (B Shares) | | 648 | 8,879 |
| Svenska Handelsbanken AB (A Shares) | | 681 | 5,806 |
| Swedbank AB (A Shares) | | 155 | 2,538 |
| Tele2 AB (B Shares) | | 848 | 6,012 |
| Telia Co. AB | | 4,674 | 9,909 |
| Volvo AB (A Shares) | | 425 | 8,506 |
TOTAL SWEDEN | | | 238,027 |
| Switzerland - 3.8% | | | |
| ABB Ltd. (Reg.) | | 1,112 | 37,361 |
| Alcon, Inc. (Switzerland) | | 226 | 16,104 |
| Banque Cantonale Vaudoise | | 12 | 1,353 |
| Compagnie Financiere Richemont SA Series A | | 235 | 27,724 |
| DSM-Firmenich AG | | 94 | 8,513 |
| Geberit AG (Reg.) | | 8 | 3,710 |
| Givaudan SA | | 4 | 13,280 |
| Kardex AG | | 15 | 2,892 |
| Kuehne & Nagel International AG | | 56 | 15,052 |
| Logitech International SA (Reg.) | | 163 | 12,751 |
| Novartis AG | | 22 | 2,060 |
| Partners Group Holding AG | | 10 | 10,518 |
| Sandoz Group AG | | 4 | 104 |
| SGS SA (Reg.) | | 114 | 9,271 |
| Sig Group AG | | 512 | 11,251 |
| Straumann Holding AG | | 23 | 2,704 |
| Swiss Life Holding AG | | 23 | 14,710 |
| Tecan Group AG | | 21 | 6,012 |
| Temenos Group AG | | 108 | 7,734 |
| VAT Group AG (b) | | 19 | 6,699 |
| Zurich Insurance Group Ltd. | | 103 | 48,757 |
TOTAL SWITZERLAND | | | 258,560 |
| Taiwan - 0.3% | | | |
| Taiwan Semiconductor Manufacturing Co. Ltd. sponsored ADR | | 239 | 20,628 |
| United Kingdom - 10.5% | | | |
| 3i Group PLC | | 1,209 | 28,505 |
| Ashtead Group PLC | | 200 | 11,435 |
| AstraZeneca PLC (United Kingdom) | | 625 | 78,252 |
| B&M European Value Retail SA | | 837 | 5,380 |
| BAE Systems PLC | | 7,077 | 95,160 |
| Barratt Developments PLC | | 2,637 | 13,266 |
| Beazley PLC | | 1,193 | 7,460 |
| Berkeley Group Holdings PLC | | 49 | 2,404 |
| Bodycote PLC | | 385 | 2,686 |
| Burberry Group PLC | | 226 | 4,648 |
| CNH Industrial NV | | 896 | 9,921 |
| Compass Group PLC | | 2,343 | 59,070 |
| Croda International PLC | | 154 | 8,195 |
| DCC PLC (United Kingdom) | | 187 | 10,376 |
| Dechra Pharmaceuticals PLC | | 79 | 3,656 |
| Deliveroo PLC Class A (a)(b) | | 1,122 | 1,773 |
| Diageo PLC | | 1,238 | 46,816 |
| Diploma PLC | | 280 | 9,672 |
| Entain PLC | | 139 | 1,572 |
| Hill & Smith Holdings PLC | | 104 | 2,083 |
| Howden Joinery Group PLC | | 793 | 6,146 |
| Informa PLC | | 574 | 4,965 |
| InterContinental Hotel Group PLC ADR | | 293 | 21,134 |
| J Sainsbury PLC | | 2,740 | 8,569 |
| Johnson Matthey PLC | | 317 | 5,756 |
| Kingfisher PLC | | 2,981 | 7,612 |
| Lloyds Banking Group PLC | | 19,622 | 9,550 |
| London Stock Exchange Group PLC | | 200 | 20,179 |
| NatWest Group PLC | | 4,109 | 8,940 |
| On The Beach Group PLC (a)(b) | | 1,107 | 1,278 |
| RELX PLC (London Stock Exchange) | | 1,682 | 58,748 |
| Rentokil Initial PLC | | 2,288 | 11,652 |
| Rightmove PLC | | 1,375 | 7,905 |
| Sage Group PLC | | 3,631 | 42,835 |
| Schroders PLC | | 3,007 | 13,497 |
| Segro PLC | | 991 | 8,586 |
| Spectris PLC | | 831 | 31,311 |
| Spirax-Sarco Engineering PLC | | 14 | 1,394 |
| SSE PLC | | 230 | 4,565 |
| St. James's Place PLC | | 655 | 5,092 |
| Standard Chartered PLC (United Kingdom) | | 3,685 | 28,217 |
| Synthomer PLC (a) | | 22 | 51 |
| Taylor Wimpey PLC | | 1,056 | 1,422 |
| Ten Entertainment Group PLC | | 209 | 749 |
| Unilever PLC | | 86 | 4,073 |
TOTAL UNITED KINGDOM | | | 716,556 |
| United States of America - 12.9% | | | |
| CBRE Group, Inc. (a) | | 245 | 16,988 |
| CDW Corp. | | 74 | 14,830 |
| CRH PLC | | 769 | 41,195 |
| CRH PLC | | 873 | 46,911 |
| CyberArk Software Ltd. (a) | | 35 | 5,727 |
| Eneti, Inc. | | 187 | 1,898 |
| Experian PLC | | 1,064 | 32,215 |
| Ferguson PLC | | 236 | 35,368 |
| ICON PLC (a) | | 81 | 19,761 |
| James Hardie Industries PLC CDI (a) | | 85 | 2,121 |
| Linde PLC | | 310 | 118,470 |
| Marsh & McLennan Companies, Inc. | | 394 | 74,722 |
| MasterCard, Inc. Class A | | 85 | 31,990 |
| Microsoft Corp. | | 51 | 17,244 |
| Moody's Corp. | | 96 | 29,568 |
| Morningstar, Inc. | | 28 | 7,091 |
| MSCI, Inc. | | 60 | 28,293 |
| Nestle SA (Reg. S) | | 1,001 | 107,947 |
| NOV, Inc. | | 588 | 11,736 |
| Otis Worldwide Corp. | | 66 | 5,096 |
| PriceSmart, Inc. | | 53 | 3,312 |
| ResMed, Inc. | | 115 | 16,240 |
| Roche Holding AG (participation certificate) | | 29 | 7,474 |
| S&P Global, Inc. | | 143 | 49,951 |
| Sanofi SA | | 320 | 29,058 |
| Schneider Electric SA | | 277 | 42,618 |
| Sherwin-Williams Co. | | 86 | 20,486 |
| Swiss Re Ltd. | | 155 | 16,890 |
| Synopsys, Inc. (a) | | 28 | 13,144 |
| Thermo Fisher Scientific, Inc. | | 12 | 5,337 |
| Visa, Inc. Class A | | 129 | 30,328 |
TOTAL UNITED STATES OF AMERICA | | | 884,009 |
| TOTAL COMMON STOCKS (Cost $7,087,949) | | | 6,561,998 |
| | | | |
| Nonconvertible Preferred Stocks - 0.0% |
| | | Shares | Value ($) |
| Germany - 0.0% | | | |
Sartorius AG (non-vtg.) (Cost $3,970) | | 12 | 2,999 |
| | | | |
| Money Market Funds - 3.6% |
| | | Shares | Value ($) |
Fidelity Cash Central Fund 5.40% (d) (Cost $246,454) | | 246,405 | 246,454 |
| | | | |
| TOTAL INVESTMENT IN SECURITIES - 99.5% (Cost $7,338,373) | 6,811,451 |
NET OTHER ASSETS (LIABILITIES) - 0.5% | 32,951 |
| NET ASSETS - 100.0% | 6,844,402 |
| | |
| Futures Contracts |
| | Number of contracts | Expiration Date | Notional Amount ($) | Value ($) | Unrealized Appreciation/ (Depreciation) ($) |
| Purchased | | | | | |
| | | | | | |
| Equity Index Contracts | | | | | |
| ICE MSCI EAFE Index Contracts (United States) | 2 | Dec 2023 | 197,410 | (335) | (335) |
| | | | | | |
| The notional amount of futures purchased as a percentage of Net Assets is 2.9% |
Legend
| (b) | Security exempt from registration under Rule 144A of the Securities Act of 1933. These securities may be resold in transactions exempt from registration, normally to qualified institutional buyers. At the end of the period, the value of these securities amounted to $25,736 or 0.4% of net assets. |
| (c) | Security or a portion of the security purchased on a delayed delivery or when-issued basis. |
| (d) | Affiliated fund that is generally available only to investment companies and other accounts managed by Fidelity Investments. The rate quoted is the annualized seven-day yield of the fund at period end. A complete unaudited listing of the fund's holdings as of its most recent quarter end is available upon request. In addition, each Fidelity Central Fund's financial statements, which are not covered by the Fund's Report of Independent Registered Public Accounting Firm, are available on the SEC's website or upon request. |
Affiliated Central Funds
Fiscal year to date information regarding the Fund's investments in Fidelity Central Funds, including the ownership percentage, is presented below.
| Affiliate | Value, beginning of period ($) | Purchases ($) | Sales Proceeds ($) | Dividend Income ($) | Realized Gain (loss) ($) | Change in Unrealized appreciation (depreciation) ($) | Value, end of period ($) | % ownership, end of period |
| Fidelity Cash Central Fund 5.40% | - | 7,501,259 | 7,254,805 | 9,251 | - | - | 246,454 | 0.0% |
| Total | - | 7,501,259 | 7,254,805 | 9,251 | - | - | 246,454 | |
| | | | | | | | | |
Amounts in the dividend income column in the above table include any capital gain distributions from underlying funds, which are presented in the corresponding line item in the Statement of Operations, if applicable.
Amounts included in the purchases and sales proceeds columns may include in-kind transactions, if applicable.
Investment Valuation
The following is a summary of the inputs used, as of October 31, 2023, involving the Fund's assets and liabilities carried at fair value. The inputs or methodology used for valuing securities may not be an indication of the risk associated with investing in those securities. For more information on valuation inputs, and their aggregation into the levels used below, please refer to the Investment Valuation section in the accompanying Notes to Financial Statements.
| Valuation Inputs at Reporting Date: |
| Description | Total ($) | Level 1 ($) | Level 2 ($) | Level 3 ($) |
Investments in Securities: | | | | |
|
| Equities: | | | | |
Communication Services | 124,930 | 34,340 | 90,590 | - |
Consumer Discretionary | 718,535 | 207,627 | 510,908 | - |
Consumer Staples | 370,411 | 117,496 | 252,915 | - |
Energy | 447,126 | 238,325 | 208,801 | - |
Financials | 1,516,056 | 983,794 | 532,262 | - |
Health Care | 541,814 | 147,344 | 394,470 | - |
Industrials | 1,359,016 | 548,314 | 810,702 | - |
Information Technology | 775,640 | 269,965 | 505,675 | - |
Materials | 587,656 | 411,867 | 175,789 | - |
Real Estate | 81,928 | 49,579 | 32,349 | - |
Utilities | 41,885 | 31,174 | 10,711 | - |
|
| Money Market Funds | 246,454 | 246,454 | - | - |
| Total Investments in Securities: | 6,811,451 | 3,286,279 | 3,525,172 | - |
Derivative Instruments: Liabilities | | | | |
Futures Contracts | (335) | (335) | - | - |
| Total Liabilities | (335) | (335) | - | - |
| Total Derivative Instruments: | (335) | (335) | - | - |
Value of Derivative Instruments
The following table is a summary of the Fund's value of derivative instruments by primary risk exposure as of October 31, 2023. For additional information on derivative instruments, please refer to the Derivative Instruments section in the accompanying Notes to Financial Statements.
Primary Risk Exposure / Derivative Type | Value |
| Asset ($) | Liability ($) |
| Equity Risk | | |
Futures Contracts (a) | 0 | (335) |
| Total Equity Risk | 0 | (335) |
| Total Value of Derivatives | 0 | (335) |
(a)Reflects gross cumulative appreciation (depreciation) on futures contracts as presented in the Schedule of Investments. In the Statement of Assets and Liabilities, the period end daily variation margin is included in receivable or payable for daily variation margin on futures contracts, and the net cumulative appreciation (depreciation) is included in Total accumulated earnings (loss).
Fidelity® Series Sustainable Non-U.S. Developed Markets Fund
| Statement of Assets and Liabilities |
| | | | October 31, 2023 |
| | | | | |
| Assets | | | | |
| Investment in securities, at value - See accompanying schedule: | | | | |
Unaffiliated issuers (cost $7,091,919) | $ | 6,564,997 | | |
Fidelity Central Funds (cost $246,454) | | 246,454 | | |
| | | | | |
| | | | | |
| Total Investment in Securities (cost $7,338,373) | | | $ | 6,811,451 |
| Segregated cash with brokers for derivative instruments | | | | 6,340 |
| Foreign currency held at value (cost $1,193) | | | | 1,190 |
| Receivable for fund shares sold | | | | 14,436 |
| Dividends receivable | | | | 15,655 |
| Interest receivable | | | | 9 |
| Distributions receivable from Fidelity Central Funds | | | | 671 |
| Receivable for daily variation margin on futures contracts | | | | 590 |
Total assets | | | | 6,850,342 |
| Liabilities | | | | |
| Payable for investments purchased on a delayed delivery basis | $ | 422 | | |
| Payable for fund shares redeemed | | 518 | | |
| Custody fee payable | | 4,976 | | |
| Other payables and accrued expenses | | 24 | | |
| Total Liabilities | | | | 5,940 |
| Net Assets | | | $ | 6,844,402 |
| Net Assets consist of: | | | | |
| Paid in capital | | | $ | 7,341,596 |
| Total accumulated earnings (loss) | | | | (497,194) |
| Net Assets | | | $ | 6,844,402 |
Net Asset Value, offering price and redemption price per share ($6,844,402 ÷ 732,893 shares) | | | $ | 9.34 |
| Statement of Operations |
| | | | For the period May 11, 2023 (commencement of operations) through October 31, 2023 |
| Investment Income | | | | |
| Dividends | | | $ | 72,495 |
| Interest | | | | 142 |
| Income from Fidelity Central Funds | | | | 9,251 |
| Income before foreign taxes withheld | | | $ | 81,888 |
| Less foreign taxes withheld | | | | (8,303) |
| Total Income | | | | 73,585 |
| Expenses | | | | |
| Custodian fees and expenses | $ | 9,047 | | |
| Independent trustees' fees and expenses | | 11 | | |
| Total expenses before reductions | | 9,058 | | |
| Expense reductions | | (8,724) | | |
| Total expenses after reductions | | | | 334 |
| Net Investment income (loss) | | | | 73,251 |
| Realized and Unrealized Gain (Loss) | | | | |
| Net realized gain (loss) on: | | | | |
| Investment Securities: | | | | |
| Unaffiliated issuers | | (24,017) | | |
| Foreign currency transactions | | (259) | | |
| Futures contracts | | (18,741) | | |
| Total net realized gain (loss) | | | | (43,017) |
| Change in net unrealized appreciation (depreciation) on: | | | | |
| Investment Securities: | | | | |
| Unaffiliated issuers | | (526,922) | | |
| Assets and liabilities in foreign currencies | | (172) | | |
| Futures contracts | | (335) | | |
| Total change in net unrealized appreciation (depreciation) | | | | (527,429) |
| Net gain (loss) | | | | (570,446) |
| Net increase (decrease) in net assets resulting from operations | | | $ | (497,195) |
| Statement of Changes in Net Assets |
| |
| | For the period May 11, 2023 (commencement of operations) through October 31, 2023 |
| Increase (Decrease) in Net Assets | | |
| Operations | | |
| Net investment income (loss) | $ | 73,251 |
| Net realized gain (loss) | | (43,017) |
| Change in net unrealized appreciation (depreciation) | | (527,429) |
| Net increase (decrease) in net assets resulting from operations | | (497,195) |
| Share transactions | | |
| Proceeds from sales of shares | | 7,829,024 |
| Cost of shares redeemed | | (487,427) |
| | | |
Net increase (decrease) in net assets resulting from share transactions | | 7,341,597 |
| Total increase (decrease) in net assets | | 6,844,402 |
| | | |
| Net Assets | | |
| Beginning of period | | - |
| End of period | $ | 6,844,402 |
| | | |
| Other Information | | |
| Shares | | |
| Sold | | 782,048 |
| Redeemed | | (49,155) |
| Net increase (decrease) | | 732,893 |
| | | |
Financial Highlights
| Fidelity® Series Sustainable Non-U.S. Developed Markets Fund |
| |
| Years ended October 31, | | 2023 A |
Selected Per-Share Data | | |
| Net asset value, beginning of period | $ | 10.00 |
| Income from Investment Operations | | |
Net investment income (loss) B,C | | .11 |
| Net realized and unrealized gain (loss) | | (.77) |
| Total from investment operations | | (.66) |
| Net asset value, end of period | $ | 9.34 |
Total Return D,E | | (6.60)% |
Ratios to Average Net Assets C,F,G | | |
| Expenses before reductions | | .29% H |
| Expenses net of fee waivers, if any | | .01% H |
| Expenses net of all reductions | | .01% H |
| Net investment income (loss) | | 2.35% H |
| Supplemental Data | | |
| Net assets, end of period (000 omitted) | $ | 6,844 |
Portfolio turnover rate I | | 8% J |
AFor the period May 11, 2023 (commencement of operations) through October 31, 2023.
BCalculated based on average shares outstanding during the period.
CNet investment income (loss) is affected by the timing of the declaration of dividends by any underlying mutual funds or exchange-traded funds (ETFs). Net investment income (loss) of any mutual funds or ETFs is not included in the Fund's net investment income (loss) ratio.
DTotal returns for periods of less than one year are not annualized.
ETotal returns would have been lower if certain expenses had not been reduced during the applicable periods shown.
FFees and expenses of any underlying mutual funds or exchange-traded funds (ETFs) are not included in the Fund's expense ratio. The Fund indirectly bears its proportionate share of these expenses. For additional expense information related to investments in Fidelity Central Funds, please refer to the "Investments in Fidelity Central Funds" note found in the Notes to Financial Statements section of the most recent Annual or Semi-Annual report.
GExpense ratios reflect operating expenses of the class. Expenses before reductions do not reflect amounts reimbursed, waived, or reduced through arrangements with the investment adviser, brokerage services, or other offset arrangements, if applicable, and do not represent the amount paid by the class during periods when reimbursements, waivers or reductions occur.
HAnnualized.
IAmount does not include the portfolio activity of any underlying mutual funds or exchange-traded funds (ETFs).
JAmount not annualized.
For the period ended October 31, 2023
1. Organization.
Fidelity Series Sustainable Emerging Markets Fund and Fidelity Series Sustainable Non-U.S. Developed Markets Fund (the Funds) are funds of Fidelity Investment Trust (the Trust). The Trust is registered under the Investment Company Act of 1940, as amended (the 1940 Act), as an open-end management investment company organized as a Massachusetts business trust. Each Fund is authorized to issue an unlimited number of shares. Shares are offered only to certain other Fidelity funds, Fidelity managed 529 plans, and Fidelity managed collective investment trusts. Investments in emerging markets, if applicable, can be subject to social, economic, regulatory, and political uncertainties and can be extremely volatile.
2. Investments in Fidelity Central Funds.
Funds may invest in Fidelity Central Funds, which are open-end investment companies generally available only to other investment companies and accounts managed by the investment adviser and its affiliates. The Schedule of Investments lists any Fidelity Central Funds held as an investment as of period end, but does not include the underlying holdings of each Fidelity Central Fund. An investing fund indirectly bears its proportionate share of the expenses of the underlying Fidelity Central Funds.
Based on its investment objective, each Fidelity Central Fund may invest or participate in various investment vehicles or strategies that are similar to those of the investing fund. These strategies are consistent with the investment objectives of the investing fund and may involve certain economic risks which may cause a decline in value of each of the Fidelity Central Funds and thus a decline in the value of the investing fund.
| Fidelity Central Fund | Investment Manager | Investment Objective | Investment Practices | Expense RatioA |
| Fidelity Money Market Central Funds | Fidelity Management & Research Company LLC (FMR) | Each fund seeks to obtain a high level of current income consistent with the preservation of capital and liquidity. | Short-term Investments | Less than .005% |
A Expenses expressed as a percentage of average net assets and are as of each underlying Central Fund's most recent annual or semi-annual shareholder report.
A complete unaudited list of holdings for each Fidelity Central Fund is available upon request or at the Securities and Exchange Commission website at www.sec.gov. In addition, the financial statements of the Fidelity Central Funds which contain the significant accounting policies (including investment valuation policies) of those funds, and are not covered by the Report of Independent Registered Public Accounting Firm, are available on the Securities and Exchange Commission website or upon request.
3. Significant Accounting Policies.
Each Fund is an investment company and applies the accounting and reporting guidance of the Financial Accounting Standards Board (FASB) Accounting Standards Codification Topic 946 Financial Services - Investment Companies. The financial statements have been prepared in conformity with accounting principles generally accepted in the United States of America (GAAP), which require management to make certain estimates and assumptions at the date of the financial statements. Actual results could differ from those estimates. Subsequent events, if any, through the date that the financial statements were issued have been evaluated in the preparation of the financial statements. Each Fund's Schedule of Investments lists any underlying mutual funds or exchange-traded funds (ETFs) but does not include the underlying holdings of these funds. The following summarizes the significant accounting policies of each Fund:
Investment Valuation. Investments are valued as of 4:00 p.m. Eastern time on the last calendar day of the period. The Board of Trustees (the Board) has designated each Fund's investment adviser as the valuation designee responsible for the fair valuation function and performing fair value determinations as needed. The investment adviser has established a Fair Value Committee (the Committee) to carry out the day-to-day fair valuation responsibilities and has adopted policies and procedures to govern the fair valuation process and the activities of the Committee. In accordance with these fair valuation policies and procedures, which have been approved by the Board, each Fund attempts to obtain prices from one or more third party pricing services or brokers to value its investments. When current market prices, quotations or currency exchange rates are not readily available or reliable, investments will be fair valued in good faith by the Committee, in accordance with the policies and procedures. Factors used in determining fair value vary by investment type and may include market or investment specific events, transaction data, estimated cash flows, and market observations of comparable investments. The frequency that the fair valuation procedures are used cannot be predicted and they may be utilized to a significant extent. The Committee manages each Fund's fair valuation practices and maintains the fair valuation policies and procedures. Each Fund's investment adviser reports to the Board information regarding the fair valuation process and related material matters.
Each Fund categorizes the inputs to valuation techniques used to value its investments into a disclosure hierarchy consisting of three levels as shown below:
Level 1 - unadjusted quoted prices in active markets for identical investments
Level 2 - other significant observable inputs (including quoted prices for similar investments, interest rates, prepayment speeds, etc.)
Level 3 - unobservable inputs (including the Fund's own assumptions based on the best information available)
Valuation techniques used to value each Fund's investments by major category are as follows:
Equity securities, including restricted securities, for which market quotations are readily available, are valued at the last reported sale price or official closing price as reported by a third party pricing service on the primary market or exchange on which they are traded and are categorized as Level 1 in the hierarchy. In the event there were no sales during the day or closing prices are not available, securities are valued at the last quoted bid price or may be valued using the last available price and are generally categorized as Level 2 in the hierarchy. For foreign equity securities, when market or security specific events arise, comparisons to the valuation of American Depositary Receipts (ADRs), futures contracts, ETFs and certain indexes as well as quoted prices for similar securities may be used and would be categorized as Level 2 in the hierarchy. For equity securities, including restricted securities, where observable inputs are limited, assumptions about market activity and risk are used and these securities may be categorized as Level 3 in the hierarchy.
Futures contracts are valued at the settlement price established each day by the board of trade or exchange on which they are traded and are categorized as Level 1 in the hierarchy. Investments in open-end mutual funds, including the Fidelity Central Funds, are valued at their closing net asset value (NAV) each business day and are categorized as Level 1 in the hierarchy.
Changes in valuation techniques may result in transfers in or out of an assigned level within the disclosure hierarchy. The aggregate value of investments by input level as of October 31, 2023 is included at the end of each Fund's Schedule of Investments.
Foreign Currency. Certain Funds may use foreign currency contracts to facilitate transactions in foreign-denominated securities. Gains and losses from these transactions may arise from changes in the value of the foreign currency or if the counterparties do not perform under the contracts' terms.
Foreign-denominated assets, including investment securities, and liabilities are translated into U.S. dollars at the exchange rates at period end. Purchases and sales of investment securities, income and dividends received, and expenses denominated in foreign currencies are translated into U.S. dollars at the exchange rate in effect on the transaction date.
The effects of exchange rate fluctuations on investments are included with the net realized and unrealized gain (loss) on investment securities. Other foreign currency transactions resulting in realized and unrealized gain (loss) are disclosed separately.
Investment Transactions and Income. For financial reporting purposes, the Funds' investment holdings and NAV include trades executed through the end of the last business day of the period. The NAV per share for processing shareholder transactions is calculated as of the close of business of the New York Stock Exchange (NYSE), normally 4:00 p.m. Eastern time and includes trades executed through the end of the prior business day. Gains and losses on securities sold are determined on the basis of identified cost. Commissions paid to certain brokers with whom the investment adviser, or its affiliates, places trades on behalf of a fund include an amount in addition to trade execution, which may be rebated back to a fund. Any such rebates are included in net realized gain (loss) on investments in the Statement of Operations. Dividend income is recorded on the ex-dividend date, except for certain dividends from foreign securities where the ex-dividend date may have passed, which are recorded as soon as the Funds are informed of the ex-dividend date. Non-cash dividends included in dividend income, if any, are recorded at the fair market value of the securities received. Income and capital gain distributions from Fidelity Central Funds, if any, are recorded on the ex-dividend date. Interest income is accrued as earned and includes coupon interest and amortization of premium and accretion of discount on debt securities as applicable. Investment income is recorded net of foreign taxes withheld where recovery of such taxes is uncertain. Funds may file withholding tax reclaims in certain jurisdictions to recover a portion of amounts previously withheld. Any withholding tax reclaims income is included in the Statement of Operations in foreign taxes withheld. Any receivables for withholding tax reclaims are included in the Statement of Assets and Liabilities in dividends receivable.
Expenses. Expenses directly attributable to a fund are charged to that fund. Expenses attributable to more than one fund are allocated among the respective funds on the basis of relative net assets or other appropriate methods. Expenses included in the accompanying financial statements reflect the expenses of that fund and do not include any expenses associated with any underlying mutual funds or exchange-traded funds. Although not included in a fund's expenses, a fund indirectly bears its proportionate share of these expenses through the net asset value of each underlying mutual fund or exchange-traded fund. Expense estimates are accrued in the period to which they relate and adjustments are made when actual amounts are known.
Income Tax Information and Distributions to Shareholders. Each year, each Fund intends to qualify as a regulated investment company under Subchapter M of the Internal Revenue Code, including distributing substantially all of its taxable income and realized gains. As a result, no provision for U.S. Federal income taxes is required. As of October 31, 2023, each Fund did not have any unrecognized tax benefits in the financial statements; nor is each Fund aware of any tax positions for which it is reasonably possible that the total amounts of unrecognized tax benefits will significantly change in the next twelve months. Each Fund files a U.S. federal tax return, in addition to state and local tax returns as required. Each Fund's federal income tax returns are subject to examination by the Internal Revenue Service (IRS) for a period of three fiscal years after they are filed. State and local tax returns may be subject to examination for an additional fiscal year depending on the jurisdiction. Foreign taxes are provided for based on each Fund's understanding of the tax rules and rates that exist in the foreign markets in which it invests.
Distributions are declared and recorded on the ex-dividend date. Income and capital gain distributions are determined in accordance with income tax regulations, which may differ from GAAP.
Capital accounts within the financial statements are adjusted for permanent book-tax differences. These adjustments have no impact on net assets or the results of operations. Capital accounts are not adjusted for temporary book-tax differences which will reverse in a subsequent period.
Book-tax differences are primarily due to foreign currency transactions, passive foreign investment companies (PFIC), capital loss carryforwards, futures transactions and losses deferred due to wash sales.
As of period end, the cost and unrealized appreciation (depreciation) in securities, and derivatives if applicable, for federal income tax purposes were as follows for each Fund:
| | Tax cost | Gross unrealized appreciation | Gross unrealized depreciation | Net unrealized appreciation (depreciation) |
Fidelity Series Sustainable Emerging Markets Fund | $4,512,089 | $143,782 | $ (382,107) | $ (238,325) |
Fidelity Series Sustainable Non-U.S. Developed Markets Fund | 7,341,762 | 166,838 | (697,149) | (530,311) |
The tax-based components of distributable earnings as of period end were as follows for each Fund:
| | Undistributed ordinary income | Capital loss carryforward | Net unrealized appreciation (depreciation) on securities and other investments |
Fidelity Series Sustainable Emerging Markets Fund | $77,556 | $ (33,447) | $(238,322) |
Fidelity Series Sustainable Non-U.S. Developed Markets Fund | 76,866 | (43,577) | (530,483) |
Capital loss carryforwards are only available to offset future capital gains of the Funds to the extent provided by regulations and may be limited. The capital loss carryforward information presented below, including any applicable limitation, is estimated as of fiscal period end and is subject to adjustment.
| | Short-term | Long-term | Total capital loss carryforward |
Fidelity Series Sustainable Emerging Markets Fund | $(25,100) | $(8,347) | $(33,447) |
Fidelity Series Sustainable Non-U.S. Developed Markets Fund | (32,131) | (11,446) | (43,577) |
The tax character of distributions paid was as follows:
October 31, 2023A | | | | | |
| | Tax-Exempt Income | Ordinary Income | Long-term Capital Gains | Tax Return of Capital | Total |
Fidelity Series Sustainable Emerging Markets Fund | $- | $- | $- | $- | $- |
Fidelity Series Sustainable Non-U.S. Developed Markets Fund | - | - | - | - | - |
A For the period May 11, 2023 (commencement of operations) through October 31, 2023.
Delayed Delivery Transactions and When-Issued Securities. During the period, certain Funds transacted in securities on a delayed delivery or when-issued basis. Payment and delivery may take place after the customary settlement period for that security. The price of the underlying securities and the date when the securities will be delivered and paid for are fixed at the time the transaction is negotiated. Securities purchased on a delayed delivery or when-issued basis are identified as such in the Schedule of Investments. Compensation for interest forgone in the purchase of a delayed delivery or when-issued debt security may be received. With respect to purchase commitments, each applicable Fund identifies securities as segregated in its records with a value at least equal to the amount of the commitment. Payables and receivables associated with the purchases and sales of delayed delivery securities having the same coupon, settlement date and broker are offset. Delayed delivery or when-issued securities that have been purchased from and sold to different brokers are reflected as both payables and receivables in the Statement of Assets and Liabilities under the caption "Delayed delivery", as applicable. Losses may arise due to changes in the value of the underlying securities or if the counterparty does not perform under the contract's terms, or if the issuer does not issue the securities due to political, economic, or other factors.
Restricted Securities (including Private Placements). Funds may invest in securities that are subject to legal or contractual restrictions on resale. These securities generally may be resold in transactions exempt from registration or to the public if the securities are registered. Disposal of these securities may involve time-consuming negotiations and expense, and prompt sale at an acceptable price may be difficult. Information regarding restricted securities held at period end is included at the end of the Schedule of Investments, if applicable.
4. Derivative Instruments.
Risk Exposures and the Use of Derivative Instruments. Each Fund's investment objectives allow for various types of derivative instruments, including futures contracts. Derivatives are investments whose value is primarily derived from underlying assets, indices or reference rates and may be transacted on an exchange or over-the-counter (OTC). Derivatives may involve a future commitment to buy or sell a specified asset based on specified terms, to exchange future cash flows at periodic intervals based on a notional principal amount, or for one party to make one or more payments upon the occurrence of specified events in exchange for periodic payments from the other party.
Derivatives were used to increase returns and to manage exposure to certain risks as defined below. The success of any strategy involving derivatives depends on analysis of numerous economic factors, and if the strategies for investment do not work as intended, the objectives may not be achieved.
Derivatives were used to increase or decrease exposure to the following risk(s):
| Equity Risk | Equity risk relates to the fluctuations in the value of financial instruments as a result of changes in market prices (other than those arising from interest rate risk or foreign exchange risk), whether caused by factors specific to an individual investment, its issuer, or all factors affecting all instruments traded in a market or market segment. |
Funds are also exposed to additional risks from investing in derivatives, such as liquidity risk and counterparty credit risk. Liquidity risk is the risk that a fund will be unable to close out the derivative in the open market in a timely manner. Counterparty credit risk is the risk that the counterparty will not be able to fulfill its obligation to a fund. Counterparty credit risk related to exchange-traded contracts may be mitigated by the protection provided by the exchange on which they trade.
Investing in derivatives may involve greater risks than investing in the underlying assets directly and, to varying degrees, may involve risk of loss in excess of any initial investment and collateral received and amounts recognized in the Statement of Assets and Liabilities. In addition, there may be the risk that the change in value of the derivative contract does not correspond to the change in value of the underlying instrument.
Futures Contracts. A futures contract is an agreement between two parties to buy or sell a specified underlying instrument for a fixed price at a specified future date. Futures contracts were used to manage exposure to the stock market.
Upon entering into a futures contract, a fund is required to deposit either cash or securities (initial margin) with a clearing broker in an amount equal to a certain percentage of the face value of the contract. Futures contracts are marked-to-market daily and subsequent daily payments are made or received by a fund depending on the daily fluctuations in the value of the futures contracts and are recorded as unrealized appreciation or (depreciation). This receivable and/or payable, if any, is included in daily variation margin on futures contracts in the Statement of Assets and Liabilities. Realized gain or (loss) is recorded upon the expiration or closing of a futures contract. The net realized gain (loss) and change in net unrealized appreciation (depreciation) on futures contracts during the period is presented in the Statement of Operations.
Any open futures contracts at period end are presented in the Schedule of Investments under the caption "Futures Contracts". The notional amount at value reflects each contract's exposure to the underlying instrument or index at period end, and is representative of volume of activity during the period unless an average notional amount is presented. Any securities deposited to meet initial margin requirements are identified in the Schedule of Investments. Any cash deposited to meet initial margin requirements is presented as segregated cash with brokers for derivative instruments in the Statement of Assets and Liabilities.
5. Purchases and Sales of Investments.
Purchases and sales of securities, other than short-term securities, U.S. government securities and in-kind transactions, as applicable, are noted in the table below.
| | Purchases ($) | Sales ($) |
| Fidelity Series Sustainable Emerging Markets Fund | 5,946,915 | 1,533,585 |
| Fidelity Series Sustainable Non-U.S. Developed Markets Fund | 7,635,308 | 518,601 |
6. Fees and Other Transactions with Affiliates.
Management Fee. Fidelity Management & Research Company LLC (the investment adviser) and its affiliates provide the Funds with investment management related services for which the Funds do not pay a management fee. Under the management contract, the investment adviser or an affiliate pays all ordinary operating expenses of the Funds, except custody fees, fees and expenses of the independent Trustees, and certain miscellaneous expenses such as proxy and shareholder meeting expenses.
Brokerage Commissions. A portion of portfolio transactions were placed with brokerage firms which are affiliates of the investment adviser. Brokerage commissions are included in net realized gain (loss) and change in net unrealized appreciation (depreciation) in the Statement of Operations. The commissions paid to these affiliated firms were as follows:
| | Amount |
| Fidelity Series Sustainable Emerging Markets Fund | $155 |
| Fidelity Series Sustainable Non-U.S. Developed Markets Fund | 4 |
Interfund Trades. Funds may purchase from or sell securities to other Fidelity Funds under procedures adopted by the Board. The procedures have been designed to ensure these interfund trades are executed in accordance with Rule 17a-7 of the 1940 Act. Any interfund trades are included within the respective purchases and sales amounts shown in the Purchases and Sales of Investments note. Interfund trades during the period are noted in the table below.
| | Purchases ($) | Sales ($) | Realized Gain (Loss) ($) |
| Fidelity Series Sustainable Emerging Markets Fund | 21,668 | - | - |
| Fidelity Series Sustainable Non-U.S. Developed Markets Fund | 39,958 | - | - |
7. Expense Reductions.
The investment adviser contractually agreed to reimburse each Fund to the extent annual operating expenses exceeded certain levels of average net assets as noted in the table below. This reimbursement will remain in place through February 28, 2027. Some expenses, for example the compensation of the independent Trustees, and certain other expenses such as interest expense, are excluded from this reimbursement.
The following Funds were in reimbursement during the period:
| | Expense Limitations | Reimbursement |
| Fidelity Series Sustainable Emerging Markets Fund | .013% | $ 6,142 |
| Fidelity Series Sustainable Non-U.S. Developed Markets Fund | .013% | $ 8,634 |
Through arrangements with each applicable Fund's custodian, credits realized as a result of certain uninvested cash balances were used to reduce each applicable Fund's expenses. All of the applicable expense reductions are noted in the table below.
| | Custodian credits |
Fidelity Series Sustainable Emerging Markets Fund | $117 |
Fidelity Series Sustainable Non-U.S. Developed Markets Fund | 90 |
8. Other.
A fund's organizational documents provide former and current trustees and officers with a limited indemnification against liabilities arising in connection with the performance of their duties to the fund. In the normal course of business, a fund may also enter into contracts that provide general indemnifications. A fund's maximum exposure under these arrangements is unknown as this would be dependent on future claims that may be made against a fund. The risk of material loss from such claims is considered remote.
At the end of the period, mutual funds and accounts managed by the investment adviser or its affiliates were the owners of record of all of the outstanding shares of the Funds.
9. Risk and Uncertainties.
Many factors affect a fund's performance. Developments that disrupt global economies and financial markets, such as pandemics, epidemics, outbreaks of infectious diseases, war, terrorism, and environmental disasters, may significantly affect a fund's investment performance. The effects of these developments to a fund will be impacted by the types of securities in which a fund invests, the financial condition, industry, economic sector, and geographic location of an issuer, and a fund's level of investment in the securities of that issuer. Significant concentrations in security types, issuers, industries, sectors, and geographic locations may magnify the factors that affect a fund's performance.
To the Board of Trustees of Fidelity Investment Trust and the Shareholders of Fidelity Series Sustainable Emerging Markets Fund and Fidelity Series Sustainable Non-U.S. Developed Markets Fund:
Opinion on the Financial Statements and Financial Highlights
We have audited the accompanying statements of assets and liabilities of Fidelity Series Sustainable Emerging Markets Fund and Fidelity Series Sustainable Non-U.S. Developed Markets Fund (the "Funds"), each a fund of Fidelity Investment Trust, including the schedules of investments, as of October 31, 2023, the related statements of operations, the statements of changes in net assets, and the financial highlights for the period from May 11, 2023 (commencement of operations) through October 31, 2023, and the related notes. In our opinion, the financial statements and financial highlights present fairly, in all material respects, the financial position of the Funds as of October 31, 2023, and the results of their operations, the changes in their net assets and the financial highlights for the period from May 11, 2023 (commencement of operations) through October 31, 2023, in conformity with accounting principles generally accepted in the United States of America.
Basis for Opinion
These financial statements and financial highlights are the responsibility of the Funds' management. Our responsibility is to express an opinion on the Funds' financial statements and financial highlights based on our audits. We are a public accounting firm registered with the Public Company Accounting Oversight Board (United States) (PCAOB) and are required to be independent with respect to the Funds in accordance with the U.S. federal securities laws and the applicable rules and regulations of the Securities and Exchange Commission and the PCAOB.
We conducted our audits in accordance with the standards of the PCAOB. Those standards require that we plan and perform the audits to obtain reasonable assurance about whether the financial statements and financial highlights are free of material misstatement, whether due to error or fraud. The Funds are not required to have, nor were we engaged to perform, an audit of their internal control over financial reporting. As part of our audits, we are required to obtain an understanding of internal control over financial reporting but not for the purpose of expressing an opinion on the effectiveness of the Funds' internal control over financial reporting. Accordingly, we express no such opinion.
Our audits included performing procedures to assess the risks of material misstatement of the financial statements and financial highlights, whether due to error or fraud, and performing procedures that respond to those risks. Such procedures included examining, on a test basis, evidence regarding the amounts and disclosures in the financial statements and financial highlights. Our audits also included evaluating the accounting principles used and significant estimates made by management, as well as evaluating the overall presentation of the financial statements and financial highlights. Our procedures included confirmation of securities owned as of October 31, 2023, by correspondence with the custodian and brokers; when replies were not received from brokers, we performed other auditing procedures. We believe that our audits provide a reasonable basis for our opinion.
/s/ Deloitte & Touche LLP
Boston, Massachusetts
December 15, 2023
We have served as the auditor of one or more of the Fidelity investment companies since 1999.
The Trustees, Members of the Advisory Board (if any), and officers of the trust and funds, as applicable, are listed below. The Board of Trustees governs each fund and is responsible for protecting the interests of shareholders. The Trustees are experienced executives who meet periodically throughout the year to oversee each fund's activities, review contractual arrangements with companies that provide services to each fund, oversee management of the risks associated with such activities and contractual arrangements, and review each fund's performance. Except for Jonathan Chiel, each of the Trustees oversees 322 funds. Mr. Chiel oversees 191 funds.
The Trustees hold office without limit in time except that (a) any Trustee may resign; (b) any Trustee may be removed by written instrument, signed by at least two-thirds of the number of Trustees prior to such removal; (c) any Trustee who requests to be retired or who has become incapacitated by illness or injury may be retired by written instrument signed by a majority of the other Trustees; and (d) any Trustee may be removed at any special meeting of shareholders by a two-thirds vote of the outstanding voting securities of the trust. Each Trustee who is not an interested person (as defined in the 1940 Act) of the trust and the funds is referred to herein as an Independent Trustee. Each Independent Trustee shall retire not later than the last day of the calendar year in which his or her 75th birthday occurs. The Independent Trustees may waive this mandatory retirement age policy with respect to individual Trustees. Officers and Advisory Board Members hold office without limit in time, except that any officer or Advisory Board Member may resign or may be removed by a vote of a majority of the Trustees at any regular meeting or any special meeting of the Trustees. Except as indicated, each individual has held the office shown or other offices in the same company for the past five years.
The funds' Statement of Additional Information (SAI) includes more information about the Trustees. To request a free copy, call Fidelity at 1-800-544-8544.
Experience, Skills, Attributes, and Qualifications of the Trustees. The Governance and Nominating Committee has adopted a statement of policy that describes the experience, qualifications, attributes, and skills that are necessary and desirable for potential Independent Trustee candidates (Statement of Policy). The Board believes that each Trustee satisfied at the time he or she was initially elected or appointed a Trustee, and continues to satisfy, the standards contemplated by the Statement of Policy. The Governance and Nominating Committee also engages professional search firms to help identify potential Independent Trustee candidates who have the experience, qualifications, attributes, and skills consistent with the Statement of Policy. From time to time, additional criteria based on the composition and skills of the current Independent Trustees, as well as experience or skills that may be appropriate in light of future changes to board composition, business conditions, and regulatory or other developments, have also been considered by the professional search firms and the Governance and Nominating Committee. In addition, the Board takes into account the Trustees' commitment and participation in Board and committee meetings, as well as their leadership of standing and ad hoc committees throughout their tenure.
In determining that a particular Trustee was and continues to be qualified to serve as a Trustee, the Board has considered a variety of criteria, none of which, in isolation, was controlling. The Board believes that, collectively, the Trustees have balanced and diverse experience, qualifications, attributes, and skills, which allow the Board to operate effectively in governing each fund and protecting the interests of shareholders. Information about the specific experience, skills, attributes, and qualifications of each Trustee, which in each case led to the Board's conclusion that the Trustee should serve (or continue to serve) as a trustee of the funds, is provided below.
Board Structure and Oversight Function. Robert A. Lawrence is an interested person and currently serves as Chair. The Trustees have determined that an interested Chair is appropriate and benefits shareholders because an interested Chair has a personal and professional stake in the quality and continuity of services provided to the funds. Independent Trustees exercise their informed business judgment to appoint an individual of their choosing to serve as Chair, regardless of whether the Trustee happens to be independent or a member of management. The Independent Trustees have determined that they can act independently and effectively without having an Independent Trustee serve as Chair and that a key structural component for assuring that they are in a position to do so is for the Independent Trustees to constitute a substantial majority for the Board. The Independent Trustees also regularly meet in executive session. David M. Thomas serves as Lead Independent Trustee and as such (i) acts as a liaison between the Independent Trustees and management with respect to matters important to the Independent Trustees and (ii) with management prepares agendas for Board meetings.
Fidelity® funds are overseen by different Boards of Trustees. The funds' Board oversees Fidelity's high income and certain equity funds, and other Boards oversee Fidelity's alternative investment, investment-grade bond, money market, asset allocation, and other equity funds. The asset allocation funds may invest in Fidelity® funds overseen by the funds' Board. The use of separate Boards, each with its own committee structure, allows the Trustees of each group of Fidelity® funds to focus on the unique issues of the funds they oversee, including common research, investment, and operational issues. On occasion, the separate Boards establish joint committees to address issues of overlapping consequences for the Fidelity® funds overseen by each Board.
The Trustees operate using a system of committees to facilitate the timely and efficient consideration of all matters of importance to the Trustees, each fund, and fund shareholders and to facilitate compliance with legal and regulatory requirements and oversight of the funds' activities and associated risks. The Board, acting through its committees, has charged FMR and its affiliates with (i) identifying events or circumstances the occurrence of which could have demonstrably adverse effects on the funds' business and/or reputation; (ii) implementing processes and controls to lessen the possibility that such events or circumstances occur or to mitigate the effects of such events or circumstances if they do occur; and (iii) creating and maintaining a system designed to evaluate continuously business and market conditions in order to facilitate the identification and implementation processes described in (i) and (ii) above. Because the day-to-day operations and activities of the funds are carried out by or through FMR, its affiliates, and other service providers, the funds' exposure to risks is mitigated but not eliminated by the processes overseen by the Trustees. While each of the Board's committees has responsibility for overseeing different aspects of the funds' activities, oversight is exercised primarily through the Operations, Audit, and Compliance Committees. Appropriate personnel, including but not limited to the funds' Chief Compliance Officer (CCO), FMR's internal auditor, the independent accountants, the funds' Treasurer and portfolio management personnel, make periodic reports to the Board's committees, as appropriate, including an annual review of Fidelity's risk management program for the Fidelity® funds. The responsibilities of each standing committee, including their oversight responsibilities, are described further under "Standing Committees of the Trustees."
Interested Trustees*:
Correspondence intended for a Trustee who is an interested person may be sent to Fidelity Investments, 245 Summer Street, Boston, Massachusetts 02210.
Name, Year of Birth; Principal Occupations and Other Relevant Experience+
Jonathan Chiel (1957)
Year of Election or Appointment: 2016
Trustee
Mr. Chiel also serves as Trustee of other Fidelity® funds. Mr. Chiel is General Counsel (2012-present) and Head of Legal, Risk and Compliance (2022-present). Mr Chiel serves as Executive Vice President and General Counsel for FMR LLC (diversified financial services company, 2012-present) and Director and President for OH Company LLC (holding company, 2018-present). Previously, Mr. Chiel served as general counsel (2004-2012) and senior vice president and deputy general counsel (2000-2004) for John Hancock Financial Services; a partner with Choate, Hall & Stewart (1996-2000) (law firm); and an Assistant United States Attorney for the United States Attorney's Office of the District of Massachusetts (1986-95), including Chief of the Criminal Division (1993-1995). Mr. Chiel is a director on the boards of the Boston Bar Foundation and the Maimonides School.
Bettina Doulton (1964)
Year of Election or Appointment: 2021
Trustee
Ms. Doulton also serves as Trustee of other Fidelity® funds. Prior to her retirement, Ms. Doulton served in a variety of positions at Fidelity Investments, including as a managing director of research (2006-2007), portfolio manager to certain Fidelity® funds (1993-2005), equity analyst and portfolio assistant (1990-1993), and research assistant (1987-1990). Ms. Doulton currently owns and operates Phi Builders + Architects and Cellardoor Winery. Previously, Ms. Doulton served as a member of the Board of Brown Capital Management, LLC (2014-2018).
Robert A. Lawrence (1952)
Year of Election or Appointment: 2020
Trustee
Chair of the Board of Trustees
Mr. Lawrence also serves as Trustee of other funds. Previously, Mr. Lawrence served as a Trustee and Member of the Advisory Board of certain funds. Prior to his retirement in 2008, Mr. Lawrence served as Vice President of certain Fidelity® funds (2006-2008), Senior Vice President, Head of High Income Division of Fidelity Management & Research Company (investment adviser firm, 2006-2008), and President of Fidelity Strategic Investments (investment adviser firm, 2002-2005).
* Determined to be an "Interested Trustee" by virtue of, among other things, his or her affiliation with the trust or various entities under common control with FMR.
+ The information includes the Trustee's principal occupation during the last five years and other information relating to the experience, attributes, and skills relevant to the Trustee's qualifications to serve as a Trustee, which led to the conclusion that the Trustee should serve as a Trustee for each fund.
Independent Trustees:
Correspondence intended for an Independent Trustee may be sent to Fidelity Investments, P.O. Box 55235, Boston, Massachusetts 02205-5235.
Name, Year of Birth; Principal Occupations and Other Relevant Experience+
Thomas P. Bostick (1956)
Year of Election or Appointment: 2021
Trustee
Lieutenant General Bostick also serves as Trustee of other Fidelity® funds. Prior to his retirement, General Bostick (United States Army, Retired) held a variety of positions within the U.S. Army, including Commanding General and Chief of Engineers, U.S. Army Corps of Engineers (2012-2016) and Deputy Chief of Staff and Director of Human Resources, U.S. Army (2009-2012). General Bostick currently serves as a member of the Board and Finance and Governance & Sustainability Committees of CSX Corporation (transportation, 2020-present) and a member of the Board and Corporate Governance and Nominating Committee of Perma-Fix Environmental Services, Inc. (nuclear waste management, 2020-present). General Bostick serves as Chief Executive Officer of Bostick Global Strategies, LLC (consulting, 2016-present), as a member of the Board of HireVue, Inc. (video interview and assessment, 2020-present), as a member of the Board of Allonnia (biotechnology and engineering solutions, 2022-present) and on the Advisory Board of Solugen, Inc. (specialty bio-based chemicals manufacturer, 2022-present). Previously, General Bostick served as a Member of the Advisory Board of certain Fidelity® funds (2021), President, Intrexon Bioengineering (2018-2020) and Chief Operating Officer (2017-2020) and Senior Vice President of the Environment Sector (2016-2017) of Intrexon Corporation (biopharmaceutical company).
Dennis J. Dirks (1948)
Year of Election or Appointment: 2005
Trustee
Mr. Dirks also serves as Trustee of other Fidelity® funds. Prior to his retirement in May 2003, Mr. Dirks served as Chief Operating Officer and as a member of the Board of The Depository Trust & Clearing Corporation (financial markets infrastructure), President, Chief Operating Officer and a member of the Board of The Depository Trust Company (DTC), President and a member of the Board of the National Securities Clearing Corporation (NSCC), Chief Executive Officer and a member of the Board of the Government Securities Clearing Corporation and Chief Executive Officer and a member of the Board of the Mortgage-Backed Securities Clearing Corporation. Mr. Dirks currently serves as a member of the Finance Committee (2016-present) and Board (2017-present) and is Treasurer (2018-present) of the Asolo Repertory Theatre.
Donald F. Donahue (1950)
Year of Election or Appointment: 2018
Trustee
Mr. Donahue also serves as Trustee of other Fidelity® funds. Mr. Donahue serves as President and Chief Executive Officer of Miranda Partners, LLC (risk consulting for the financial services industry, 2012-present). Previously, Mr. Donahue served as Chief Executive Officer (2006-2012), Chief Operating Officer (2003-2006) and Managing Director, Customer Marketing and Development (1999-2003) of The Depository Trust & Clearing Corporation (financial markets infrastructure). Mr. Donahue currently serves as a member (2007-present) and Co-Chairman (2016-present) of the Board of United Way of New York. Mr. Donahue previously served as a member of the Advisory Board of certain Fidelity® funds (2015-2018) and as a member of the Board of The Leadership Academy (previously NYC Leadership Academy) (2012-2022).
Vicki L. Fuller (1957)
Year of Election or Appointment: 2020
Trustee
Ms. Fuller also serves as Trustee of other Fidelity® funds. Previously, Ms. Fuller served as a member of the Advisory Board of certain Fidelity® funds (2018-2020), Chief Investment Officer of the New York State Common Retirement Fund (2012-2018) and held a variety of positions at AllianceBernstein L.P. (global asset management, 1985-2012), including Managing Director (2006-2012) and Senior Vice President and Senior Portfolio Manager (2001-2006). Ms. Fuller currently serves as a member of the Board, Audit Committee and Nominating and Governance Committee of two Blackstone business development companies (2020-present), as a member of the Board of Treliant, LLC (consulting, 2019-present), as a member of the Board of Ariel Alternatives, LLC (private equity, 2022-present) and as a member of the Board and Chair of the Audit Committee of Gusto, Inc. (software, 2021-present). In addition, Ms. Fuller currently serves as a member of the Board of Roosevelt University (2019-present) and as a member of the Executive Board of New York University's Stern School of Business. Ms. Fuller previously served as a member of the Board, Audit Committee and Nominating and Governance Committee of The Williams Companies, Inc. (natural gas infrastructure, 2018-2021).
Patricia L. Kampling (1959)
Year of Election or Appointment: 2020
Trustee
Ms. Kampling also serves as Trustee of other Fidelity® funds. Prior to her retirement, Ms. Kampling served as Chairman of the Board and Chief Executive Officer (2012-2019), President and Chief Operating Officer (2011-2012) and Executive Vice President and Chief Financial Officer (2010-2011) of Alliant Energy Corporation. Ms. Kampling currently serves as a member of the Board, Finance Committee and Governance, Compensation and Nominating Committee of Xcel Energy Inc. (utilities company, 2020-present) and as a member of the Board, Audit, Finance and Risk Committee and Safety, Environmental, Technology and Operations Committee and Chair of the Executive Development and Compensation Committee of American Water Works Company, Inc. (utilities company, 2019-present). In addition, Ms. Kampling currently serves as a member of the Board of the Nature Conservancy, Wisconsin Chapter (2019-present). Previously, Ms. Kampling served as a Member of the Advisory Board of certain Fidelity® funds (2020), a member of the Board, Compensation Committee and Executive Committee and Chair of the Audit Committee of Briggs & Stratton Corporation (manufacturing, 2011-2021), a member of the Board of Interstate Power and Light Company (2012-2019) and Wisconsin Power and Light Company (2012-2019) (each a subsidiary of Alliant Energy Corporation) and as a member of the Board and Workforce Development Committee of the Business Roundtable (2018-2019).
Thomas A. Kennedy (1955)
Year of Election or Appointment: 2021
Trustee
Mr. Kennedy also serves as Trustee of other Fidelity® funds. Previously, Mr. Kennedy served as a Member of the Advisory Board of certain Fidelity® funds (2020) and held a variety of positions at Raytheon Company (aerospace and defense, 1983-2020), including Chairman and Chief Executive Officer (2014-2020) and Executive Vice President and Chief Operating Officer (2013-2014). Mr. Kennedy served as Executive Chairman of the Board of Directors of Raytheon Technologies Corporation (aerospace and defense, 2020-2021). Mr. Kennedy serves as a Director of the Board of Directors of Textron Inc. (aerospace and defense, 2023-present).
Oscar Munoz (1959)
Year of Election or Appointment: 2021
Trustee
Mr. Munoz also serves as Trustee of other Fidelity® funds. Prior to his retirement, Mr. Munoz served as Executive Chairman (2020-2021), Chief Executive Officer (2015-2020), President (2015-2016) and a member of the Board (2010-2021) of United Airlines Holdings, Inc. Mr. Munoz currently serves as a member of the Board of CBRE Group, Inc. (commercial real estate, 2020-present), a member of the Board of Univision Communications, Inc. (Hispanic media, 2020-present), a member of the Board of Archer Aviation Inc. (2021-present), a member of the Defense Business Board of the United States Department of Defense (2021-present) and a member of the Board of Salesforce.com, Inc. (cloud-based software, 2022-present). Previously, Mr. Munoz served as a Member of the Advisory Board of certain Fidelity® funds (2021).
David M. Thomas (1949)
Year of Election or Appointment: 2008
Trustee
Lead Independent Trustee
Mr. Thomas also serves as Trustee of other Fidelity® funds. Previously, Mr. Thomas served as Executive Chairman (2005-2006) and Chairman and Chief Executive Officer (2000-2005) of IMS Health, Inc. (pharmaceutical and healthcare information solutions). Mr. Thomas currently serves as a member of the Board of Fortune Brands Home and Security (home and security products, 2004-present) and as Director (2013-present) and Non-Executive Chairman of the Board (2022-present) of Interpublic Group of Companies, Inc. (marketing communication).
Susan Tomasky (1953)
Year of Election or Appointment: 2020
Trustee
Ms. Tomasky also serves as Trustee of other Fidelity® funds. Prior to her retirement, Ms. Tomasky served in various executive officer positions at American Electric Power Company, Inc. (1998-2011), including most recently as President of AEP Transmission (2007-2011). Ms. Tomasky currently serves as a member of the Board and Sustainability Committee and as Chair of the Audit Committee of Marathon Petroleum Corporation (2018-present) and as a member of the Board, Executive Committee, Corporate Governance Committee and Organization and Compensation Committee and as Lead Director of the Board of Public Service Enterprise Group, Inc. (utilities company, 2012-present) and as a member of the Board of its subsidiary company, Public Service Electric and Gas Co. (2021-present). In addition, Ms. Tomasky currently serves as a member (2009-present) and President (2020-present) of the Board of the Royal Shakespeare Company - America (2009-present), as a member of the Board of the Columbus Association for the Performing Arts (2011-present) and as a member of the Board and Kenyon in the World Committee of Kenyon College (2016-present). Previously, Ms. Tomasky served as a Member of the Advisory Board of certain Fidelity® funds (2020), as a member of the Board of the Columbus Regional Airport Authority (2007-2020), as a member of the Board (2011-2018) and Lead Independent Director (2015-2018) of Andeavor Corporation (previously Tesoro Corporation) (independent oil refiner and marketer) and as a member of the Board of Summit Midstream Partners LP (energy, 2012-2018).
Michael E. Wiley (1950)
Year of Election or Appointment: 2020
Trustee
Mr. Wiley also serves as Trustee of other Fidelity® funds. Previously, Mr. Wiley served as a member of the Advisory Board of certain Fidelity® funds (2018-2020), Chairman, President and CEO of Baker Hughes, Inc. (oilfield services, 2000-2004). Mr. Wiley also previously served as a member of the Board of Andeavor Corporation (independent oil refiner and marketer, 2005-2018), a member of the Board of Andeavor Logistics LP (natural resources logistics, 2015-2018) and a member of the Board of High Point Resources (exploration and production, 2005-2020).
+ The information includes the Trustee's principal occupation during the last five years and other information relating to the experience, attributes, and skills relevant to the Trustee's qualifications to serve as a Trustee, which led to the conclusion that the Trustee should serve as a Trustee for each fund.
Advisory Board Members and Officers:
Correspondence intended for a Member of the Advisory Board (if any) may be sent to Fidelity Investments, P.O. Box 55235, Boston, Massachusetts 02205-5235. Correspondence intended for an officer or Peter S. Lynch may be sent to Fidelity Investments, 245 Summer Street, Boston, Massachusetts 02210.
Name, Year of Birth; Principal Occupation
Vijay C. Advani (1960)
Year of Election or Appointment: 2023
Member of the Advisory Board
Mr. Advani also serves as Trustee or Member of the Advisory Board of other funds. Previously, Mr. Advani served as Executive Chairman (2020-2022), Chief Executive Officer (2017-2020) and Chief Operating Officer (2016-2017) of Nuveen (global investment manager). He also served in various capacities at Franklin Resources (global investment manager), including Co-President (2015-2016), Executive Vice President, Global Advisory Services (2008-2015), Head of Global Retail Distribution (2005-2008), Executive Managing Director, International Retail Development (2002-2005), Managing Director, Product Developments, Sales & Marketing, Asia, Eastern Europe and Africa (2000-2002) and President, Templeton Asset Management India (1995-2000). Mr. Advani also served as Senior Investment Officer of International Finance Corporation (private equity and venture capital arm of The World Bank, 1984-1995). Mr. Advani is Chairman Emeritus of the U.S. India Business Council (2018-present), a Director of The Global Impact Investing Network (2019-present), a Director of LOK Capital (Mauritius) (2022-present), a member of the Advisory Council of LOK Capital (2022-present), a Senior Advisor of Neuberger Berman (2021-present), a Senior Advisor of Seviora Holdings Pte. Ltd (Temasek-Singapore) (2021-present), a Director of Seviora Capital (Singapore) (2021-present) and an Advisor of EQUIAM (2021-present). Mr. Advani formerly served as a member of the Board of BowX Acquisition Corp. (special purpose acquisition company, 2020-2021), a member of the Board of Intellecap (advisory arm of The Aavishkaar Group, 2018-2020), a member of the Board of Nuveen Investments, Inc. (2017-2020) and a member of the Board of Docusign (software, 2016-2019).
Peter S. Lynch (1944)
Year of Election or Appointment: 2003
Member of the Advisory Board
Mr. Lynch also serves as a Member of the Advisory Board of other Fidelity® funds. Mr. Lynch is Vice Chairman and a Director of Fidelity Management & Research Company LLC (investment adviser firm). In addition, Mr. Lynch serves as a Trustee of Boston College and as the Chairman of the Inner-City Scholarship Fund. Previously, Mr. Lynch served as Vice Chairman and a Director of FMR Co., Inc. (investment adviser firm) and on the Special Olympics International Board of Directors (1997-2006).
Karen B. Peetz (1955)
Year of Election or Appointment: 2023
Member of the Advisory Board
Ms. Peetz also serves as a Member of the Advisory Board of other funds. Previously, Ms. Peetz served as Chief Administration Officer (2020-2023) of Citigroup Inc. (a diversified financial service company). She also served in various capacities at Bank of New York Mellon Corporation, including President (2013-2016), Vice Chairman, Senior Executive Vice President and Chief Executive Officer of Financial Markets & Treasury Services (2010-2013), Senior Executive Vice President and Chief Executive Officer of Global Corporate Trust (2003-2008), Senior Vice President and Division Manager of Global Payments & Trade Services (2002-2003) and Senior Vice President and Division Manager of Domestic Corporate Trust (1998-2002). Ms. Peetz also served in various capacities at Chase Manhattan Corporation (1982-1998), including Senior Vice President and Manager of Corporate Trust International Business (1996-1998), Managing Director and Manager of Corporate Trust Services (1994-1996) and Managing Director and Group Manager of Financial Institution Sales (1990-1993). Ms. Peetz currently serves as Chair of Amherst Holdings Advisory Council (2018-present), Trustee of Johns Hopkins University (2016-present), Chair of the Carey Business School Advisory Council, Member of the Johns Hopkins Medicine Board and Finance Committee and Chair of the Lyme and Tick Related Disease Institute Advisory Council. Ms. Peetz previously served as a member of the Board of Guardian Life Insurance Company of America (2019-2023), a member of the Board of Trane Technologies (2018-2022), a member of the Board of Wells Fargo Corp. (2017-2019), a member of the Board of SunCoke Energy Inc. (2012-2016), a member of the Board of Private Export Funding Corporation (2010-2016) and as a Trustee of Penn State University (2010-2014) and the United Way of New York City (2008-2010).
Heather Bonner (1977)
Year of Election or Appointment: 2023
Assistant Treasurer
Ms. Bonner also serves as an officer of other funds. Ms. Bonner is a Senior Vice President (2022-present) and is an employee of Fidelity Investments (2022-present). Ms. Bonner serves as Vice President, Treasurer, or Assistant Treasurer of certain Fidelity entities. Prior to joining Fidelity, Ms. Bonner served as Managing Director at AQR Capital Management (2013-2022) and was the Treasurer and Principal Financial Officer of the AQR Funds (2013-2022).
Craig S. Brown (1977)
Year of Election or Appointment: 2022
Deputy Treasurer
Mr. Brown also serves as an officer of other funds. Mr. Brown is a Vice President (2015-present) and is an employee of Fidelity Investments. Mr. Brown serves as Assistant Treasurer of FIMM, LLC (2021-present). Previously, Mr. Brown served as Assistant Treasurer of certain Fidelity® funds (2019-2022).
John J. Burke III (1964)
Year of Election or Appointment: 2018
Chief Financial Officer
Mr. Burke also serves as Chief Financial Officer of other funds. Mr. Burke is Head of Fidelity Fund and Investment Operations (2018-present) and is an employee of Fidelity Investments. Mr. Burke serves as President, Executive Vice President, or Director of certain Fidelity entities. Previously Mr. Burke served as head of Asset Management Investment Operations (2012-2018).
Margaret Carey (1973)
Year of Election or Appointment: 2023
Secretary and Chief Legal Officer (CLO)
Ms. Carey also serves as an officer of other funds and as CLO of certain Fidelity entities. Ms. Carey is a Senior Vice President, Deputy General Counsel (2019-present) and is an employee of Fidelity Investments.
William C. Coffey (1969)
Year of Election or Appointment: 2019
Assistant Secretary
Mr. Coffey also serves as Assistant Secretary of other funds. Mr. Coffey is a Senior Vice President, Deputy General Counsel (2010-present) and is an employee of Fidelity Investments. Previously, Mr. Coffey served as Secretary and CLO of certain funds (2018-2019); CLO, Secretary, or Senior Vice President of certain Fidelity entities and Assistant Secretary of certain funds (2009-2018).
Timothy M. Cohen (1969)
Year of Election or Appointment: 2018
Vice President
Mr. Cohen also serves as Vice President of other funds. Mr. Cohen is Co-Head of Equity (2018-present) and is an employee of Fidelity Investments. Mr. Cohen serves a Director of Fidelity Management & Research (Japan) Limited (investment adviser firm, 2016-present). Previously, Mr. Cohen served as Executive Vice President of Fidelity SelectCo, LLC (2019) and Head of Global Equity Research (2016-2018).
Jonathan Davis (1968)
Year of Election or Appointment: 2010
Assistant Treasurer
Mr. Davis also serves as an officer of other funds. Mr. Davis is a Vice President (2006-present) and is an employee of Fidelity Investments. Mr. Davis serves as Assistant Treasurer of certain Fidelity entities.
Laura M. Del Prato (1964)
Year of Election or Appointment: 2018
Assistant Treasurer
Ms. Del Prato also serves as an officer of other funds. Ms. Del Prato is a Senior Vice President (2017-present) and is an employee of Fidelity Investments. Ms. Del Prato serves as Vice President or Assistant Treasurer of certain Fidelity entities. Previously, Ms. Del Prato served as President and Treasurer of The North Carolina Capital Management Trust: Cash Portfolio and Term Portfolio (2018-2020).
Colm A. Hogan (1973)
Year of Election or Appointment: 2020
Assistant Treasurer
Mr. Hogan also serves as an officer of other funds. Mr. Hogan is a Vice President (2016-present) and is an employee of Fidelity Investments. Mr. Hogan serves as Assistant Treasurer of certain Fidelity entities. Previously, Mr. Hogan served as Deputy Treasurer of certain Fidelity® funds (2016-2020) and Assistant Treasurer of certain Fidelity® funds (2016-2018).
Pamela R. Holding (1964)
Year of Election or Appointment: 2018
Vice President
Ms. Holding also serves as Vice President of other funds. Ms. Holding is Co-Head of Equity (2018-present) and is an employee of Fidelity Investments. Previously, Ms. Holding served as Executive Vice President of Fidelity SelectCo, LLC (2019) and as Chief Investment Officer of Fidelity Institutional Asset Management (2013-2018).
Chris Maher (1972)
Year of Election or Appointment: 2020
Deputy Treasurer
Mr. Maher also serves as an officer of other funds. Mr. Maher is a Vice President (2008-present) and is an employee of Fidelity Investments. Mr. Maher serves as Assistant Treasurer of certain Fidelity entities. Previously, Mr. Maher served as Assistant Treasurer of certain funds (2013-2020).
Jason P. Pogorelec (1975)
Year of Election or Appointment: 2020
Chief Compliance Officer
Mr. Pogorelec also serves as Chief Compliance Officer of other funds. Mr. Pogorelec is a Senior Vice President of Asset Management Compliance (2020-present) and is an employee of Fidelity Investments. Mr. Pogorelec serves as Compliance Officer of Fidelity Management & Research Company LLC (investment adviser firm, 2023-present) and Ballyrock Investment Advisors LLC (2023-present). Previously, Mr. Pogorelec served as a Vice President, Associate General Counsel for Fidelity Investments (2010-2020) and Assistant Secretary of certain Fidelity® funds (2015-2020).
Brett Segaloff (1972)
Year of Election or Appointment: 2021
Anti-Money Laundering (AML) Officer
Mr. Segaloff also serves as AML Officer of other funds. Mr. Segaloff is a Vice President (2022-present) and is an employee of Fidelity Investments. Mr. Segaloff serves as Anti Money Laundering Compliance Officer or Anti Money Laundering/Bank Secrecy Act Compliance Officer of certain Fidelity entities.
Stacie M. Smith (1974)
Year of Election or Appointment: 2016
President and Treasurer
Ms. Smith also serves as an officer of other funds. Ms. Smith is a Senior Vice President (2016-present) and is an employee of Fidelity Investments. Ms. Smith serves as Assistant Treasurer of certain Fidelity entities and has served in other fund officer roles.
Jim Wegmann (1979)
Year of Election or Appointment: 2019
Assistant Treasurer
Mr. Wegmann also serves as an officer of other funds. Mr. Wegmann is a Vice President (2016-present) and is an employee of Fidelity Investments. Mr. Wegmann serves as Assistant Treasurer of FIMM, LLC (2021-present). Previously, Mr. Wegmann served as Assistant Treasurer of certain Fidelity® funds (2019-2021).
As a shareholder, you incur two types of costs: (1) transaction costs, which may include sales charges (loads) on purchase payments or redemption proceeds, as applicable and (2) ongoing costs, which generally include management fees, distribution and/or service (12b-1) fees and other Fund expenses. This Example is intended to help you understand your ongoing costs (in dollars) of investing in a fund and to compare these costs with the ongoing costs of investing in other mutual funds.
| The actual expense Example is based on an investment of $1,000 invested at the beginning of the period and held for the entire period (May 11, 2023 to October 31, 2023) for each fund. The hypothetical expense Example is based on an investment of $1,000 invested for the one-half year period (May 1, 2023 to October 31, 2023). |
Actual Expenses
The first line of the accompanying table provides information about actual account values and actual expenses. You may use the information in this line, together with the amount you invested, to estimate the expenses that you paid over the period. Simply divide your account value by $1,000.00 (for example, an $8,600 account value divided by $1,000.00 = 8.6), then multiply the result by the number in the first line for a class/Fund under the heading entitled "Expenses Paid During Period" to estimate the expenses you paid on your account during this period. If any fund is a shareholder of any underlying mutual funds or exchange-traded funds (ETFs) (the Underlying Funds), such fund indirectly bears its proportional share of the expenses of the Underlying Funds in addition to the direct expenses incurred presented in the table. These fees and expenses are not included in the annualized expense ratio used to calculate the expense estimate in the table below.
Hypothetical Example for Comparison Purposes
The second line of the accompanying table provides information about hypothetical account values and hypothetical expenses based on the actual expense ratio and an assumed rate of return of 5% per year before expenses, which is not the actual return. The hypothetical account values and expenses may not be used to estimate the actual ending account balance or expenses you paid for the period. You may use this information to compare the ongoing costs of investing in the Fund and other funds. To do so, compare this 5% hypothetical example with the 5% hypothetical examples that appear in the shareholder reports of the other funds. If any fund is a shareholder of any Underlying Funds, such fund indirectly bears its proportional share of the expenses of the Underlying Funds in addition to the direct expenses as presented in the table. These fees and expenses are not included in the annualized expense ratio used to calculate the expense estimate in the table below.
Please note that the expenses shown in the table are meant to highlight your ongoing costs only and do not reflect any transaction costs. Therefore, the second line of the table is useful in comparing ongoing costs only, and will not help you determine the relative total costs of owning different funds. In addition, if these transactional costs were included, your costs would have been higher.
| | | | | Annualized Expense Ratio- A | | Beginning Account Value | | Ending Account Value October 31, 2023 | | Expenses Paid During Period |
| | | | | | | | | | |
| Fidelity® Series Sustainable Emerging Markets Fund | | | | .01% | | | | | | |
| Actual | | | | | | $ 1,000 | | $ 962.00 | | $ .05C |
Hypothetical-B | | | | | | $ 1,000 | | $ 1,025.16 | | $ .05D |
| | | | | | | | | | |
| Fidelity® Series Sustainable Non-U.S. Developed Markets Fund | | | | .01% | | | | | | |
| Actual | | | | | | $ 1,000 | | $ 934.00 | | $ .05C |
Hypothetical-B | | | | | | $ 1,000 | | $ 1,025.16 | | $ .05D |
| |
A Annualized expense ratio reflects expenses net of applicable fee waivers.
B 5% return per year before expenses
C Actual expenses are equal to the annualized expense ratio, multiplied by the average account value over the period, multiplied by 174 / 365 (to reflect the period May 11, 2023 to October 31, 2023) for each fund.
D Hypothetical expenses are equal to the annualized expense ratio, multiplied by the average account value over the period, multiplied by 184/365 (to reflect the one-half year period).
The dividend and capital gains distributions for the fund(s) are available on Fidelity.com or Institutional.Fidelity.com.
The fund will notify shareholders in January 2024 of amounts for use in preparing 2023 income tax returns.
Board Approval of Investment Advisory Contracts and Management Fees
Fidelity Series Sustainable Non-U.S. Developed Markets Fund
Fidelity Series Sustainable Emerging Markets Fund
At its January 2023 meeting, the Board of Trustees, including the Independent Trustees (together, the Board), voted to approve the management contract with Fidelity Management & Research Company LLC (FMR) and the sub-advisory agreements with affiliates of FMR (together, the Advisory Contracts) for the funds. FMR and the sub-advisers are collectively referred to herein as the Investment Advisers. The Board, assisted by the advice of fund counsel and Independent Trustees' counsel, considered a broad range of information.
Nature, Extent, and Quality of Services Provided. The Board considered Fidelity's staffing as it relates to the funds, including the backgrounds of investment personnel of Fidelity, and also considered the fund's investment objective, strategies, and related investment philosophy, and the purpose of Series funds generally. The Board considered the structure of the investment personnel compensation program and whether this structure provides appropriate incentives to act in the best interests of the funds.
Resources Dedicated to Investment Management and Support Services. The Board and the Fund Oversight and Research Committees reviewed the general qualifications and capabilities of Fidelity's investment staff, including its size, education, experience, and resources, as well as Fidelity's approach to recruiting, training, managing, and compensating investment personnel. The Board noted the resources devoted to Fidelity's global investment organization and that Fidelity's analysts have extensive resources, tools and capabilities that allow them to conduct sophisticated quantitative and fundamental analysis, as well as credit analysis of issuers, counterparties and guarantors. Further, the Board considered that Fidelity's investment professionals have sufficient access to global information and data so as to provide competitive investment results over time, and that those professionals also have access to sophisticated tools that permit them to assess portfolio construction and risk and performance attribution characteristics continuously, as well as to transmit new information and research conclusions rapidly around the world. Additionally, in its deliberations, the Board considered Fidelity's trading, risk management, compliance, cybersecurity, and technology and operations capabilities and resources, which are integral parts of the investment management process.
Administrative Services. The Board considered the nature, extent, quality, and cost of advisory and administrative services to be performed by the Investment Advisers and their affiliates under the Advisory Contracts and under separate agreements covering transfer agency, pricing and bookkeeping, and securities lending services for the funds. The Board also considered the nature and extent of the supervision of third party service providers, principally custodians, subcustodians, and pricing vendors.
Investment Performance. The funds are new and therefore had no historical performance for the Board to review at the time it approved the funds' Advisory Contracts. The Board considered the Investment Advisers' strength in fundamental, research-driven security selection, which the Board is familiar with through its supervision of other Fidelity funds. The Board also considered the fact that it oversees funds managed by FMR that have similar investment objectives and policies as the funds.
Based on its review, the Board concluded that the nature, extent, and quality of services to be provided to each fund under the Advisory Contracts should benefit the shareholders of each fund.
Competitiveness of Management Fee and Total Expense Ratio. The Board considered that the funds will not pay FMR a management fee for investment advisory services, but that FMR receives fees for providing services to funds that invest in the funds. In reviewing the Advisory Contracts, the Board also considered the projected total expense ratio of each fund. The Board noted that FMR or an affiliate undertakes to pay all operating expenses of each fund, with certain exceptions. The Board also noted that each fund pays its non-operating expenses, including brokerage commissions and fees and expenses associated with each fund's securities lending program, if applicable.
The Board also noted that FMR has contractually agreed to reimburse each fund to the extent that total operating expenses (excluding interest, fees and expenses of the Independent Trustees, and acquired fund fees and expenses (including fees and expenses associated with a wholly owned subsidiary), if any, as well as non-operating expenses such as brokerage commissions and fees and expenses associated with the fund's securities lending program, if applicable), as a percentage of its average net assets exceed 0.013% through February 28, 2027.
Based on its review, the Board considered that the funds will not pay a management fee and concluded that each fund's projected total expense ratio was reasonable in light of the services that each fund and its shareholders will receive and the other factors considered.
Costs of the Services and Profitability. The funds are new and therefore no revenue, cost, or profitability data were available for the Board to review in respect of each fund at the time it approved the Advisory Contracts. The Board also noted that the costs of the services provided by and the profits realized by Fidelity in connection with the operation of the funds are not relevant to approval of the Advisory Contracts because each fund pays no advisory fees and FMR bears all expenses of each fund, with certain exceptions. In connection with its consideration of future renewals of the fund's Advisory Contracts, the Board will consider Fidelity's profits in respect of all the Fidelity funds.
Economies of Scale. The Board concluded that because the funds will pay no advisory fees and FMR will bear all expenses of the funds, with certain limited exceptions, the realization of economies of scale was not a material factor in the Board's decision to approve each fund's Advisory Contracts.
Additional Information Requested by the Board. In order to develop fully the factual basis for consideration of the Advisory Contracts, the Board received information explaining that the fund is offered exclusively to other Fidelity funds, Fidelity managed 529 plans and collective investment trusts, which use the funds to gain exposure to a specific type of investment. The Board also noted that those Fidelity funds investing in the funds will benefit from investing in one centralized fund as the funds may deliver more uniform asset class performance and offer additional opportunities to generate returns and diversify the investing funds' equity allocations.
Based on its evaluation of all of the conclusions noted above, and after considering all factors it believed relevant, the Board concluded that the advisory fee arrangements are fair and reasonable, and that the funds' Advisory Contracts should be approved.
1.9908948.100
SMKC-ANN-1223
Fidelity® International Small Cap Fund
Annual Report
October 31, 2023
Includes Fidelity and Fidelity Advisor share classes
Contents
To view a fund's proxy voting guidelines and proxy voting record for the 12-month period ended June 30, visit http://www.fidelity.com/proxyvotingresults or visit the Securities and Exchange Commission's (SEC) web site at http://www.sec.gov.
You may also call 1-800-544-8544 if you're an individual investing directly with Fidelity, call 1-800-835-5092 if you're a plan sponsor or participant with Fidelity as your recordkeeper or call 1-877-208-0098 on institutional accounts or if you're an advisor or invest through one to request a free copy of the proxy voting guidelines.
Standard & Poor's, S&P and S&P 500 are registered service marks of The McGraw-Hill Companies, Inc. and have been licensed for use by Fidelity Distributors Corporation.
Other third-party marks appearing herein are the property of their respective owners.
All other marks appearing herein are registered or unregistered trademarks or service marks of FMR LLC or an affiliated company. © 2023 FMR LLC. All rights reserved.
This report and the financial statements contained herein are submitted for the general information of the shareholders of the Fund. This report is not authorized for distribution to prospective investors in the Fund unless preceded or accompanied by an effective prospectus.
A fund files its complete schedule of portfolio holdings with the SEC for the first and third quarters of each fiscal year on Form N-PORT. Forms N-PORT are available on the SEC's web site at http://www.sec.gov. A fund's Forms N-PORT may be reviewed and copied at the SEC's Public Reference Room in Washington, DC. Information regarding the operation of the SEC's Public Reference Room may be obtained by calling 1-800-SEC-0330.
For a complete list of a fund's portfolio holdings, view the most recent holdings listing, semiannual report, or annual report on Fidelity's web site at http://www.fidelity.com, http://www.institutional.fidelity.com, or http://www.401k.com, as applicable.
NOT FDIC INSURED •MAY LOSE VALUE •NO BANK GUARANTEE
Neither the Fund nor Fidelity Distributors Corporation is a bank.
Average annual total return reflects the change in the value of an investment, assuming reinvestment of distributions from dividend income and capital gains (the profits earned upon the sale of securities that have grown in value, if any) and assuming a constant rate of performance each year. The hypothetical investment and the average annual total returns do not reflect the deduction of taxes that a shareholder would pay on fund distributions or the redemption of fund shares. During periods of reimbursement by Fidelity, a fund's total return will be greater than it would be had the reimbursement not occurred. How a fund did yesterday is no guarantee of how it will do tomorrow.
| Average Annual Total Returns |
| | | | |
Periods ended October 31, 2023 | Past 1 year | Past 5 years | Past 10 years |
Class A (incl. 5.75% sales charge) | 6.38% | 2.86% | 4.06% |
Class M (incl. 3.50% sales charge) | 8.68% | 3.06% | 4.01% |
Class C (incl. contingent deferred sales charge) | 11.06% | 3.30% | 4.04% |
| Fidelity® International Small Cap Fund | 13.19% | 4.37% | 4.97% |
| Class I | 13.20% | 4.38% | 4.99% |
| Class Z | 13.38% | 4.52% | 5.07% |
Prior to April 1, 2014, the fund compared its performance to a different benchmark. The fund's historical performance may not represent its current investment policies.
Class C shares' contingent deferred sales charges included in the past one year, past five years and past ten years total return figures are 1%, 0% and 0%, respectively.
The initial offering of Class Z shares took place on October 2, 2018. Returns prior to October 2, 2018, are those of Class I.
| $10,000 Over 10 Years |
| |
Let's say hypothetically that $10,000 was invested in Fidelity® International Small Cap Fund, a class of the fund, on October 31, 2013. The chart shows how the value of your investment would have changed, and also shows how the MSCI ACWI (All Country World Index) ex USA Small Cap Index performed over the same period. |
|
|
Market Recap:
International (non-U.S.) equities gained 12.27% for the 12 months ending October 31, 2023, according to the MSCI ACWI (All Country World Index) ex USA Index, as global economic expansion and a slowing in the pace of inflation in some markets provided a favorable backdrop for risk assets. After returning -15.86% in 2022, the index's upturn has been largely driven by a narrow set of companies in the information technology and communication services sectors, in part due to excitement for generative artificial intelligence applications. The index gained 14.07% year to date through July, including strong gains in both June (+4.50%) and July (+4.07%). The rally for international equities sputtered for the next three months (-11.33%) amid a stalling pattern in disinflationary trends, heightened global recession and geopolitical risks, soaring yields on longer-term U.S. government bonds and particularly weak economic conditions in the eurozone and China. The three-month decline left non-U.S. stocks up 1.15% year to date through October. Currency fluctuation also helped bolster non-U.S. equity performance overall. For the full 12 months, nearly all regions advanced, with Europe ex U.K. (+18%) and Japan (+17%) leading, whereas Canada (-0.38%) lagged by the widest margin. Each of the 11 sectors advanced, with information technology (+21%) and consumer discretionary (+19%) leading the way. Energy and industrials each rose about 14%. Conversely, four defensive-oriented sectors lagged by the widest margin: real estate (+4%), health care (+6%), consumer staples (+7%) and utilities (+8%).
Comments from Portfolio Manager David Jenkins:
For the fiscal year ending October 31, 2023, the fund's share classes (excluding sales charges, if applicable) gained about 12% to 13%, versus 8.98% for the Fidelity International Small Cap Fund Linked Index and 8.98% for the broad-based MSCI All Country World ex US Small Cap Linked Index. From a regional standpoint, security selection in the U.K., along with picks and an underweight in Asia-Pacific ex-Japan, contributed to the fund's performance versus the benchmark. By sector, investment choices proved to be the primary contributor, especially within industrials, where our stock picks among capital goods firms helped most. Security selection in communication services was another plus. Stock selection in consumer discretionary and consumer staples also boosted the fund's relative performance. The top individual relative contributor was a stake in Mytilineos (+127%), one of the portfolio's biggest holdings. A stake in Rheinmetall gained 78% and was the second-largest relative contributor. The stock also was the fund's largest holding on October 31. Another notable relative contributor was our stake in Ashtead Technology Holdings (+103%), also one of the portfolio's more sizable holdings at period end. All of these relative contributors were non-benchmark positions. In contrast, on a regional basis, stock picks and an underweight in Japan, in addition to smaller-than-benchmark exposure to emerging markets, namely India, weighed on the fund's relative result. By sector, the biggest detractor from performance versus the benchmark was stock picking in materials. Investment choices among health care companies, especially in the pharmaceuticals, biotechnology & life sciences industry, also hampered the fund's result. Further pressuring performance was security selection and an underweight in energy. The fund's non-benchmark stake in Hypera Pharma returned roughly -37% and was the largest individual relative detractor. The firm was among the fund's largest holdings this period. A second notable relative detractor the past 12 months was avoiding EcoPro, a benchmark component that gained 887%. An outsized stake in Star Petroleum Refining (-34%) also hurt. Notable changes in positioning include decreased exposure to equity markets in China and a higher allocation to Mexico. By sector, meaningful shifts include increased exposure to the consumer staples sector and a lower allocation to health care stocks.
Note to shareholders:
After a thoughtful and deliberate transition, Sam Chamovitz came off the fund on September 30, 2023, leaving David Jenkins as sole portfolio manager.
The views expressed above reflect those of the portfolio manager(s) only through the end of the period as stated on the cover of this report and do not necessarily represent the views of Fidelity or any other person in the Fidelity organization. Any such views are subject to change at any time based upon market or other conditions and Fidelity disclaims any responsibility to update such views. These views may not be relied on as investment advice and, because investment decisions for a Fidelity fund are based on numerous factors, may not be relied on as an indication of trading intent on behalf of any Fidelity fund.
Top Holdings (% of Fund's net assets) |
| |
| Rheinmetall AG (Germany, Aerospace & Defense) | 1.4 | |
| Ashtead Technology Holdings PLC (United Kingdom, Trading Companies & Distributors) | 1.2 | |
| Gruma S.A.B. de CV Series B (Mexico, Food Products) | 1.1 | |
| Talanx AG (Germany, Insurance) | 1.1 | |
| Renesas Electronics Corp. (Japan, Semiconductors & Semiconductor Equipment) | 1.1 | |
| International Games Systems Co. Ltd. (Taiwan, Entertainment) | 1.1 | |
| Mytilineos SA (Greece, Industrial Conglomerates) | 1.0 | |
| Richter Gedeon PLC (Hungary, Pharmaceuticals) | 1.0 | |
| Compania de Distribucion Integral Logista Holdings SA (Spain, Air Freight & Logistics) | 0.9 | |
| RHI Magnesita NV (United States of America, Construction Materials) | 0.9 | |
| | 10.8 | |
| |
| Market Sectors (% of Fund's net assets) |
| |
| Industrials | 19.8 | |
| Consumer Discretionary | 14.0 | |
| Financials | 12.5 | |
| Consumer Staples | 10.8 | |
| Information Technology | 9.5 | |
| Materials | 8.3 | |
| Health Care | 5.8 | |
| Real Estate | 5.8 | |
| Communication Services | 4.0 | |
| Energy | 3.2 | |
| Utilities | 1.2 | |
| |
Asset Allocation (% of Fund's net assets) |
|
|
Geographic Diversification (% of Fund's net assets) |
|
* Includes Short-Term investments and Net Other Assets (Liabilities). Percentages are adjusted for the effect of derivatives, if applicable. |
| |
Showing Percentage of Net Assets
| Common Stocks - 94.9% |
| | | Shares | Value ($) |
| Australia - 3.5% | | | |
| EBOS Group Ltd. | | 618,595 | 12,628,136 |
| Flight Centre Travel Group Ltd. (a) | | 1,241,931 | 14,763,261 |
| GUD Holdings Ltd. | | 2,849,195 | 19,375,399 |
| Imdex Ltd. | | 12,986,983 | 13,622,162 |
| Inghams Group Ltd. | | 13,428,082 | 31,450,439 |
| Nanosonics Ltd. (b) | | 4,720,837 | 11,266,647 |
| National Storage REIT unit | | 8,738,696 | 11,141,704 |
| Servcorp Ltd. (c) | | 7,066,585 | 13,569,097 |
| SomnoMed Ltd. (b)(c) | | 5,478,184 | 1,718,117 |
TOTAL AUSTRALIA | | | 129,534,962 |
| Austria - 2.2% | | | |
| EuroTeleSites AG | | 2,012,735 | 6,772,366 |
| Mayr-Melnhof Karton AG | | 213,300 | 25,051,893 |
| Strabag SE | | 285,697 | 11,290,755 |
| Telekom Austria AG | | 2,700,000 | 18,855,342 |
| Wienerberger AG | | 808,900 | 19,634,279 |
TOTAL AUSTRIA | | | 81,604,635 |
| Belgium - 1.1% | | | |
| Econocom Group SA | | 4,581,895 | 11,223,359 |
| Fagron NV | | 1,586,600 | 27,834,196 |
TOTAL BELGIUM | | | 39,057,555 |
| Brazil - 1.8% | | | |
| Afya Ltd. (b) | | 264,216 | 4,253,878 |
| Atacadao SA | | 9,788,400 | 17,414,975 |
| Hypera SA (b) | | 4,493,400 | 26,995,604 |
| YDUQS Participacoes SA | | 5,099,500 | 17,933,086 |
TOTAL BRAZIL | | | 66,597,543 |
| Canada - 4.9% | | | |
| CCL Industries, Inc. Class B | | 378,600 | 14,802,734 |
| Computer Modelling Group Ltd. | | 3,070,263 | 20,280,230 |
| ECN Capital Corp. | | 4,904,970 | 6,791,089 |
| Genesis Land Development Corp. (c) | | 4,033,799 | 7,126,596 |
| Lassonde Industries, Inc. Class A (sub. vtg.) | | 246,099 | 24,463,492 |
| McCoy Global, Inc. | | 1,327,470 | 1,445,451 |
| North West Co., Inc. | | 1,093,800 | 27,890,224 |
| Open Text Corp. | | 668,096 | 22,306,000 |
| Parkland Corp. | | 652,900 | 19,760,024 |
| Quebecor, Inc. Class A | | 461,100 | 10,061,573 |
| Richelieu Hardware Ltd. | | 303,400 | 9,075,199 |
| Total Energy Services, Inc. | | 667,696 | 3,986,676 |
| VerticalScope Holdings, Inc. (b) | | 677,619 | 2,428,532 |
| Western Forest Products, Inc. (c) | | 17,341,175 | 9,003,531 |
TOTAL CANADA | | | 179,421,351 |
| China - 3.1% | | | |
| Best Pacific International Holdings Ltd. | | 22,158,900 | 2,945,374 |
| Chervon Holdings Ltd. | | 3,345,000 | 8,238,901 |
| Far East Horizon Ltd. | | 24,099,000 | 16,956,939 |
| Impro Precision Industries Ltd. (d) | | 22,065,300 | 5,947,300 |
| Precision Tsugami China Corp. Ltd. | | 9,795,453 | 10,071,695 |
| Qingdao Port International Co. Ltd. (H Shares) (d) | | 34,475,000 | 17,221,841 |
| Shenzhen YUTO Packaging Technology Co. Ltd. (A Shares) | | 4,773,466 | 17,139,016 |
| Sinopharm Group Co. Ltd. (H Shares) | | 6,564,000 | 15,696,383 |
| Weifu High-Technology Group Co. Ltd. (B Shares) | | 7,210,386 | 8,144,375 |
| Xingda International Holdings Ltd. | | 66,427,353 | 11,218,488 |
TOTAL CHINA | | | 113,580,312 |
| Denmark - 0.5% | | | |
| Spar Nord Bank A/S | | 1,194,575 | 18,086,920 |
| Finland - 1.2% | | | |
| Huhtamaki Oyj (a) | | 824,500 | 28,274,596 |
| Nanoform Finland PLC (b) | | 546,683 | 919,728 |
| Tokmanni Group Corp. | | 998,096 | 13,465,089 |
TOTAL FINLAND | | | 42,659,413 |
| France - 2.1% | | | |
| Altarea SCA (a) | | 133,357 | 9,482,259 |
| Antin Infrastructure Partners SA | | 373,955 | 4,447,463 |
| ARGAN SA | | 242,000 | 16,541,489 |
| Elior SA (a)(b)(d) | | 3,035,300 | 5,742,432 |
| Lectra | | 361,754 | 9,148,249 |
| Maisons du Monde SA (d) | | 1,033,507 | 5,190,006 |
| Thermador Groupe SA | | 358,666 | 25,464,751 |
TOTAL FRANCE | | | 76,016,649 |
| Germany - 4.5% | | | |
| DWS Group GmbH & Co. KGaA (d) | | 226,600 | 6,631,913 |
| JOST Werke AG (d) | | 437,020 | 20,022,390 |
| NORMA Group AG | | 623,692 | 10,968,012 |
| Rheinmetall AG | | 172,725 | 49,418,392 |
| Stabilus Se | | 316,900 | 20,085,182 |
| Takkt AG | | 1,279,912 | 16,386,726 |
| Talanx AG | | 632,867 | 39,809,894 |
TOTAL GERMANY | | | 163,322,509 |
| Greece - 1.0% | | | |
| Mytilineos SA | | 978,216 | 36,206,061 |
| Hong Kong - 1.9% | | | |
| ASMPT Ltd. | | 2,691,000 | 22,791,562 |
| China Metal Recycling (Holdings) Ltd. (b)(e) | | 436,800 | 1 |
| HKT Trust/HKT Ltd. unit | | 10,770,000 | 11,155,404 |
| Magnificent Hotel Investment Ltd. (b) | | 316,412,000 | 3,623,883 |
| Pico Far East Holdings Ltd. | | 61,300,071 | 10,749,517 |
| Sino Land Ltd. | | 11,082,375 | 11,063,850 |
| WH Group Ltd. (d) | | 19,230,500 | 11,485,092 |
TOTAL HONG KONG | | | 70,869,309 |
| Hungary - 1.0% | | | |
| Richter Gedeon PLC | | 1,492,304 | 34,990,409 |
| India - 2.2% | | | |
| Embassy Office Parks (REIT) | | 5,069,400 | 18,964,477 |
| IndusInd Bank Ltd. (b) | | 956,800 | 16,570,229 |
| Mahanagar Gas Ltd. | | 1,575,600 | 19,530,295 |
| Shriram Transport Finance Co. Ltd. | | 1,092,652 | 24,648,541 |
TOTAL INDIA | | | 79,713,542 |
| Indonesia - 0.7% | | | |
| PT Avia Avian Tbk | | 203,834,400 | 6,414,097 |
| PT Selamat Sempurna Tbk | | 147,354,400 | 20,121,033 |
TOTAL INDONESIA | | | 26,535,130 |
| Ireland - 1.6% | | | |
| AerCap Holdings NV (b) | | 286,472 | 17,795,641 |
| Dalata Hotel Group PLC | | 4,560,609 | 19,350,577 |
| Irish Residential Properties REIT PLC | | 15,083,700 | 14,523,657 |
| Mincon Group PLC (c) | | 13,529,844 | 8,303,238 |
TOTAL IRELAND | | | 59,973,113 |
| Italy - 2.2% | | | |
| Banca Generali SpA | | 565,700 | 18,328,127 |
| BFF Bank SpA (d) | | 2,405,056 | 23,093,967 |
| MARR SpA (b) | | 985,827 | 11,682,760 |
| Recordati SpA | | 552,011 | 25,466,012 |
TOTAL ITALY | | | 78,570,866 |
| Japan - 19.2% | | | |
| Amano Corp. | | 980,150 | 20,020,862 |
| Arcland Sakamoto Co. Ltd. | | 2,098,534 | 22,478,599 |
| ASKUL Corp. | | 1,561,100 | 20,379,206 |
| Capcom Co. Ltd. | | 595,900 | 19,181,621 |
| Central Automotive Products Ltd. | | 428,800 | 9,603,682 |
| DaikyoNishikawa Corp. | | 2,441,100 | 12,210,933 |
| Dexerials Corp. | | 783,200 | 17,865,044 |
| Dip Corp. | | 587,900 | 11,651,812 |
| Funai Soken Holdings, Inc. | | 1,128,800 | 18,552,855 |
| GMO Internet, Inc. | | 1,142,200 | 16,635,889 |
| Hokuhoku Financial Group, Inc. | | 1,100,000 | 12,842,591 |
| Inaba Denki Sangyo Co. Ltd. | | 1,225,400 | 25,553,133 |
| Isuzu Motors Ltd. | | 1,623,900 | 18,107,543 |
| Justsystems Corp. | | 510,200 | 9,091,992 |
| Kamigumi Co. Ltd. | | 1,341,300 | 27,210,352 |
| Kansai Electric Power Co., Inc. | | 1,995,800 | 25,553,909 |
| Kyoto Financial Group, Inc. | | 292,600 | 16,588,610 |
| Maruwa Ceramic Co. Ltd. | | 157,000 | 27,547,769 |
| Meitec Group Holdings, Inc. | | 958,100 | 16,862,650 |
| Minebea Mitsumi, Inc. | | 1,087,200 | 17,046,538 |
| Mitani Shoji Co. Ltd. | | 1,094,900 | 10,036,168 |
| Nishimoto Co. Ltd. | | 366,100 | 14,521,294 |
| NOF Corp. | | 709,900 | 28,006,226 |
| NSD Co. Ltd. | | 1,364,400 | 23,739,047 |
| PALTAC Corp. | | 697,700 | 22,616,978 |
| Park24 Co. Ltd. (b) | | 767,700 | 8,648,758 |
| Persol Holdings Co. Ltd. | | 11,078,000 | 16,610,530 |
| Prestige International, Inc. | | 2,099,100 | 8,520,459 |
| Relo Group, Inc. | | 1,325,000 | 13,136,160 |
| Renesas Electronics Corp. (b) | | 2,989,700 | 39,271,564 |
| Roland Corp. | | 726,500 | 21,006,001 |
| S Foods, Inc. | | 1,137,623 | 24,064,934 |
| San-Ai Obbli Co. Ltd. | | 1,799,200 | 19,426,857 |
| Ship Healthcare Holdings, Inc. | | 1,454,200 | 22,451,552 |
| Sumco Corp. | | 1,248,900 | 16,138,477 |
| TIS, Inc. | | 679,300 | 14,547,110 |
| TKC Corp. | | 301,500 | 7,033,097 |
| Tsuruha Holdings, Inc. (a) | | 374,200 | 27,487,499 |
TOTAL JAPAN | | | 702,248,301 |
| Korea (South) - 1.6% | | | |
| Hyundai Marine & Fire Insurance Co. Ltd. | | 546,046 | 12,718,719 |
| Soulbrain Co. Ltd. | | 158,300 | 27,295,251 |
| Vitzrocell Co. Ltd. (c) | | 1,372,541 | 17,271,915 |
TOTAL KOREA (SOUTH) | | | 57,285,885 |
| Mexico - 4.2% | | | |
| Bolsa Mexicana de Valores S.A.B. de CV | | 10,383,882 | 16,190,078 |
| GCC S.A.B. de CV | | 2,930,800 | 26,095,808 |
| Genomma Lab Internacional SA de CV | | 17,396,561 | 13,045,732 |
| Gruma S.A.B. de CV Series B | | 2,317,600 | 40,329,505 |
| Grupo Comercial Chedraui S.A.B. de CV | | 5,130,600 | 29,786,450 |
| Qualitas Controladora S.A.B. de CV | | 3,581,235 | 29,579,106 |
TOTAL MEXICO | | | 155,026,679 |
| Netherlands - 1.2% | | | |
| Acomo NV | | 874,199 | 17,852,306 |
| Arcadis NV | | 406,750 | 17,180,856 |
| Van Lanschot Kempen NV (Bearer) | | 283,041 | 7,591,962 |
TOTAL NETHERLANDS | | | 42,625,124 |
| Norway - 1.5% | | | |
| Europris ASA (d) | | 4,507,200 | 25,519,799 |
| Selvaag Bolig ASA | | 2,186,000 | 5,205,251 |
| Sparebanken Midt-Norge | | 2,032,500 | 24,635,371 |
TOTAL NORWAY | | | 55,360,421 |
| Peru - 0.4% | | | |
| Intercorp Financial Services, Inc. | | 683,100 | 12,828,618 |
| Philippines - 1.3% | | | |
| Century Pacific Food, Inc. | | 59,549,800 | 29,322,843 |
| Robinsons Land Corp. | | 78,319,100 | 19,207,692 |
TOTAL PHILIPPINES | | | 48,530,535 |
| Romania - 0.6% | | | |
| Banca Transilvania SA | | 4,760,605 | 22,576,096 |
| Singapore - 1.7% | | | |
| Boustead Singapore Ltd. | | 13,666,712 | 8,134,251 |
| HRnetgroup Ltd. | | 30,633,200 | 15,425,758 |
| Mapletree Industrial (REIT) | | 14,230,731 | 22,369,330 |
| The Hour Glass Ltd. | | 12,996,880 | 15,803,861 |
TOTAL SINGAPORE | | | 61,733,200 |
| Spain - 3.6% | | | |
| Cie Automotive SA | | 852,000 | 21,690,119 |
| Compania de Distribucion Integral Logista Holdings SA | | 1,388,500 | 34,055,403 |
| Grupo Catalana Occidente SA | | 733,122 | 23,465,421 |
| Indra Sistemas SA | | 1,941,877 | 27,224,776 |
| Prosegur Compania de Seguridad SA (Reg.) | | 6,982,481 | 10,432,086 |
| Viscofan Envolturas Celulosicas SA | | 268,900 | 15,534,961 |
TOTAL SPAIN | | | 132,402,766 |
| Sweden - 1.4% | | | |
| Alligo AB (B Shares) | | 866,597 | 6,800,828 |
| Granges AB | | 1,987,476 | 19,104,782 |
| Haypp Group (b) | | 1,154,900 | 4,645,486 |
| HEXPOL AB (B Shares) | | 1,875,600 | 16,584,327 |
| Nordnet AB | | 376,000 | 5,305,287 |
TOTAL SWEDEN | | | 52,440,710 |
| Switzerland - 0.5% | | | |
| Anhui Heli Co. Ltd. ELS (UBS AG London Branch Bank Warrant Programme) Class A warrants 1/5/24 (b)(d) | | 8,014,256 | 18,457,253 |
| Taiwan - 3.3% | | | |
| International Games Systems Co. Ltd. | | 2,037,000 | 39,232,782 |
| Lumax International Corp. Ltd. | | 4,537,292 | 11,372,799 |
| Sporton International, Inc. | | 1,966,977 | 12,974,422 |
| Test Research, Inc. | | 7,892,000 | 14,640,416 |
| Tripod Technology Corp. | | 4,536,000 | 23,204,681 |
| Yageo Corp. | | 845,578 | 13,775,301 |
| Yung Chi Paint & Varnish Manufacturing Co. Ltd. | | 2,538,000 | 5,732,177 |
TOTAL TAIWAN | | | 120,932,578 |
| Thailand - 0.4% | | | |
| Star Petroleum Refining PCL (For. Reg.) | | 70,104,800 | 14,373,470 |
| United Kingdom - 15.3% | | | |
| Alliance Pharma PLC (a) | | 18,161,527 | 8,840,808 |
| Ashtead Technology Holdings PLC (c) | | 7,272,000 | 42,426,011 |
| B&M European Value Retail SA | | 4,638,800 | 29,814,957 |
| Bodycote PLC | | 1,967,871 | 13,729,212 |
| Cranswick PLC | | 450,000 | 19,110,520 |
| DCC PLC (United Kingdom) | | 420,200 | 23,314,920 |
| Direct Line Insurance Group PLC (b) | | 8,403,700 | 15,454,201 |
| Grainger Trust PLC | | 6,741,166 | 18,632,133 |
| Harbour Energy PLC | | 4,471,994 | 13,795,261 |
| Hiscox Ltd. | | 2,484,148 | 28,321,575 |
| Indivior PLC (b) | | 731,500 | 14,003,351 |
| Informa PLC | | 2,889,633 | 24,992,847 |
| J.D. Wetherspoon PLC (b) | | 2,015,900 | 15,485,426 |
| Jet2 PLC | | 1,762,100 | 21,460,279 |
| John Wood Group PLC (b) | | 12,397,900 | 21,382,950 |
| Lancashire Holdings Ltd. | | 2,100,900 | 14,504,101 |
| LSL Property Services PLC | | 4,204,235 | 12,059,688 |
| Luxfer Holdings PLC sponsored | | 1,079,659 | 8,928,780 |
| Mears Group PLC (c) | | 7,409,314 | 23,189,551 |
| On The Beach Group PLC (b)(d) | | 6,731,236 | 7,772,407 |
| Pets At Home Group PLC | | 2,742,500 | 9,360,108 |
| Premier Foods PLC | | 17,360,500 | 24,730,161 |
| Rathbone Brothers PLC | | 846,400 | 15,410,778 |
| RS GROUP PLC | | 2,280,653 | 18,772,117 |
| Sabre Insurance Group PLC (d) | | 9,562,200 | 17,084,893 |
| Savills PLC | | 2,052,000 | 19,641,064 |
| Tate & Lyle PLC | | 3,343,443 | 25,622,182 |
| Ten Entertainment Group PLC (c) | | 5,931,311 | 21,267,175 |
| Vistry Group PLC | | 1,740,898 | 14,959,940 |
| WH Smith PLC | | 1,159,600 | 16,349,455 |
TOTAL UNITED KINGDOM | | | 560,416,851 |
| United States of America - 3.2% | | | |
| Adient PLC (b) | | 485,600 | 16,359,864 |
| Adtalem Global Education, Inc. (b) | | 554,100 | 28,702,380 |
| Antero Resources Corp. (b) | | 920,100 | 27,087,744 |
| RHI Magnesita NV (a) | | 1,054,291 | 32,881,699 |
| WestRock Co. | | 300,000 | 10,779,000 |
TOTAL UNITED STATES OF AMERICA | | | 115,810,687 |
| TOTAL COMMON STOCKS (Cost $3,535,635,619) | | | 3,469,789,453 |
| | | | |
| Money Market Funds - 3.4% |
| | | Shares | Value ($) |
| Fidelity Cash Central Fund 5.40% (f) | | 93,362,924 | 93,381,597 |
| Fidelity Securities Lending Cash Central Fund 5.40% (f)(g) | | 31,089,240 | 31,092,349 |
| TOTAL MONEY MARKET FUNDS (Cost $124,473,946) | | | 124,473,946 |
| | | | |
| TOTAL INVESTMENT IN SECURITIES - 98.3% (Cost $3,660,109,565) | 3,594,263,399 |
NET OTHER ASSETS (LIABILITIES) - 1.7% | 61,129,479 |
| NET ASSETS - 100.0% | 3,655,392,878 |
| | |
Security Type Abbreviations
| ELS | - | EQUITY-LINKED SECURITY |
Legend
| (a) | Security or a portion of the security is on loan at period end. |
| (d) | Security exempt from registration under Rule 144A of the Securities Act of 1933. These securities may be resold in transactions exempt from registration, normally to qualified institutional buyers. At the end of the period, the value of these securities amounted to $164,169,293 or 4.5% of net assets. |
| (f) | Affiliated fund that is generally available only to investment companies and other accounts managed by Fidelity Investments. The rate quoted is the annualized seven-day yield of the fund at period end. A complete unaudited listing of the fund's holdings as of its most recent quarter end is available upon request. In addition, each Fidelity Central Fund's financial statements, which are not covered by the Fund's Report of Independent Registered Public Accounting Firm, are available on the SEC's website or upon request. |
| (g) | Investment made with cash collateral received from securities on loan. |
Affiliated Central Funds
Fiscal year to date information regarding the Fund's investments in Fidelity Central Funds, including the ownership percentage, is presented below.
| Affiliate | Value, beginning of period ($) | Purchases ($) | Sales Proceeds ($) | Dividend Income ($) | Realized Gain (loss) ($) | Change in Unrealized appreciation (depreciation) ($) | Value, end of period ($) | % ownership, end of period |
| Fidelity Cash Central Fund 5.40% | - | 557,473,936 | 464,092,339 | 2,955,272 | - | - | 93,381,597 | 0.2% |
| Fidelity Securities Lending Cash Central Fund 5.40% | 28,602,852 | 339,399,634 | 336,910,137 | 281,769 | - | - | 31,092,349 | 0.1% |
| Total | 28,602,852 | 896,873,570 | 801,002,476 | 3,237,041 | - | - | 124,473,946 | |
| | | | | | | | | |
Amounts in the dividend income column in the above table include any capital gain distributions from underlying funds, which are presented in the corresponding line item in the Statement of Operations, if applicable.
Amounts in the dividend income column for Fidelity Securities Lending Cash Central Fund represents the income earned on investing cash collateral, less rebates paid to borrowers and any lending agent fees associated with the loan, plus any premium payments received for lending certain types of securities.
Amounts included in the purchases and sales proceeds columns may include in-kind transactions, if applicable.
Other Affiliated Issuers
An affiliated company is a company in which the Fund has ownership of at least 5% of the voting securities. Fiscal year to date transactions with companies which are or were affiliates are presented in the table below. Certain corporate actions, such as mergers, are excluded from the amounts in this table if applicable. A dash in the Value end of period ($) column means either the issuer is no longer held at period end, or the issuer is held at period end but is no longer an affiliate.
| Affiliate | Value, beginning of period ($) | Purchases ($) | Sales Proceeds ($) | Dividend Income ($) | Realized Gain (loss) ($) | Change in Unrealized appreciation (depreciation) ($) | Value, end of period ($) |
| Ashtead Technology Holdings PLC | 19,751,365 | 1,332,381 | - | 89,580 | - | 21,342,265 | 42,426,011 |
| Genesis Land Development Corp. | 5,655,343 | - | - | 405,932 | - | 1,471,253 | 7,126,596 |
| Mears Group PLC | 17,260,781 | - | 1,811,259 | 1,060,913 | (2,490,810) | 10,230,839 | 23,189,551 |
| Mincon Group PLC | 13,237,160 | - | - | 184,176 | - | (4,933,922) | 8,303,238 |
| Servcorp Ltd. | 15,413,681 | - | - | 1,024,210 | - | (1,844,584) | 13,569,097 |
| SomnoMed Ltd. | 3,698,161 | 505,948 | 7,215 | - | (25,592) | (2,453,185) | 1,718,117 |
| Ten Entertainment Group PLC | 14,590,349 | - | - | 768,395 | - | 6,676,826 | 21,267,175 |
| Vitzrocell Co. Ltd. | 12,328,605 | - | 1,730,761 | 191,205 | 258,145 | 6,415,926 | 17,271,915 |
| Western Forest Products, Inc. | 11,450,665 | 3,982,512 | 275,142 | 459,558 | (453,829) | (5,700,675) | 9,003,531 |
| Total | 113,386,110 | 5,820,841 | 3,824,377 | 4,183,969 | (2,712,086) | 31,204,743 | 143,875,231 |
Amounts included in the purchases and sales proceeds columns may include in-kind transactions, if applicable.
Investment Valuation
The following is a summary of the inputs used, as of October 31, 2023, involving the Fund's assets and liabilities carried at fair value. The inputs or methodology used for valuing securities may not be an indication of the risk associated with investing in those securities. For more information on valuation inputs, and their aggregation into the levels used below, please refer to the Investment Valuation section in the accompanying Notes to Financial Statements.
| Valuation Inputs at Reporting Date: |
| Description | Total ($) | Level 1 ($) | Level 2 ($) | Level 3 ($) |
Investments in Securities: | | | | |
|
| Equities: | | | | |
Communication Services | 143,429,984 | 63,110,660 | 80,319,324 | - |
Consumer Discretionary | 508,499,701 | 277,862,184 | 230,637,517 | - |
Consumer Staples | 392,749,637 | 254,417,536 | 138,332,101 | - |
Energy | 121,258,433 | 87,458,106 | 33,800,327 | - |
Financials | 450,462,489 | 350,136,860 | 100,325,629 | - |
Health Care | 215,856,675 | 152,095,840 | 63,760,835 | - |
Industrials | 729,909,976 | 445,306,390 | 284,603,586 | - |
Information Technology | 349,452,328 | 90,182,614 | 259,269,714 | - |
Materials | 300,421,579 | 202,212,649 | 98,208,929 | 1 |
Real Estate | 212,664,447 | 103,212,137 | 109,452,310 | - |
Utilities | 45,084,204 | - | 45,084,204 | - |
|
| Money Market Funds | 124,473,946 | 124,473,946 | - | - |
| Total Investments in Securities: | 3,594,263,399 | 2,150,468,922 | 1,443,794,476 | 1 |
| Statement of Assets and Liabilities |
| | | | October 31, 2023 |
| | | | | |
| Assets | | | | |
| Investment in securities, at value (including securities loaned of $29,598,389) - See accompanying schedule: | | | | |
Unaffiliated issuers (cost $3,386,640,102) | $ | 3,325,914,222 | | |
Fidelity Central Funds (cost $124,473,946) | | 124,473,946 | | |
Other affiliated issuers (cost $148,995,517) | | 143,875,231 | | |
| | | | | |
| | | | | |
| Total Investment in Securities (cost $3,660,109,565) | | | $ | 3,594,263,399 |
| Cash | | | | 397,451 |
| Foreign currency held at value (cost $87,767,120) | | | | 86,211,842 |
| Receivable for investments sold | | | | 1,312,951 |
| Receivable for fund shares sold | | | | 6,943,435 |
| Dividends receivable | | | | 7,868,129 |
| Reclaims receivable | | | | 3,190,580 |
| Distributions receivable from Fidelity Central Funds | | | | 436,938 |
| Prepaid expenses | | | | 4,953 |
| Other receivables | | | | 14,305 |
Total assets | | | | 3,700,643,983 |
| Liabilities | | | | |
| Payable for investments purchased | $ | 3,851,915 | | |
| Payable for fund shares redeemed | | 4,367,434 | | |
| Accrued management fee | | 3,012,275 | | |
| Distribution and service plan fees payable | | 40,362 | | |
| Other affiliated payables | | 542,789 | | |
| Other payables and accrued expenses | | 2,348,075 | | |
| Collateral on securities loaned | | 31,088,255 | | |
| Total Liabilities | | | | 45,251,105 |
| Net Assets | | | $ | 3,655,392,878 |
| Net Assets consist of: | | | | |
| Paid in capital | | | $ | 3,789,389,163 |
| Total accumulated earnings (loss) | | | | (133,996,285) |
| Net Assets | | | $ | 3,655,392,878 |
| | | | | |
| Net Asset Value and Maximum Offering Price | | | | |
| Class A : | | | | |
Net Asset Value and redemption price per share ($108,866,350 ÷ 4,055,392 shares)(a) | | | $ | 26.84 |
| Maximum offering price per share (100/94.25 of $26.84) | | | $ | 28.48 |
| Class M : | | | | |
Net Asset Value and redemption price per share ($15,515,131 ÷ 581,350 shares)(a) | | | $ | 26.69 |
| Maximum offering price per share (100/96.50 of $26.69) | | | $ | 27.66 |
| Class C : | | | | |
Net Asset Value and offering price per share ($12,603,181 ÷ 491,564 shares)(a) | | | $ | 25.64 |
| International Small Cap : | | | | |
Net Asset Value, offering price and redemption price per share ($1,342,755,054 ÷ 48,890,243 shares) | | | $ | 27.46 |
| Class I : | | | | |
Net Asset Value, offering price and redemption price per share ($924,094,263 ÷ 33,406,106 shares) | | | $ | 27.66 |
| Class Z : | | | | |
Net Asset Value, offering price and redemption price per share ($1,251,558,899 ÷ 45,270,491 shares) | | | $ | 27.65 |
(a)Redemption price per share is equal to net asset value less any applicable contingent deferred sales charge. |
| Statement of Operations |
| | | | Year ended October 31, 2023 |
| Investment Income | | | | |
| Dividends (including $4,183,969 earned from affiliated issuers) | | | $ | 111,153,833 |
| Income from Fidelity Central Funds (including $281,769 from security lending) | | | | 3,237,041 |
| Income before foreign taxes withheld | | | $ | 114,390,874 |
| Less foreign taxes withheld | | | | (9,705,918) |
| Total Income | | | | 104,684,956 |
| Expenses | | | | |
| Management fee | | | | |
| Basic fee | $ | 28,858,256 | | |
| Performance adjustment | | 3,560,470 | | |
| Transfer agent fees | | 4,707,717 | | |
| Distribution and service plan fees | | 509,862 | | |
| Accounting fees | | 1,396,638 | | |
| Custodian fees and expenses | | 436,698 | | |
| Independent trustees' fees and expenses | | 19,249 | | |
| Registration fees | | 211,521 | | |
| Audit | | 104,282 | | |
| Legal | | 3,246 | | |
| Interest | | 29,538 | | |
| Miscellaneous | | 15,905 | | |
| Total expenses before reductions | | 39,853,382 | | |
| Expense reductions | | (214,662) | | |
| Total expenses after reductions | | | | 39,638,720 |
| Net Investment income (loss) | | | | 65,046,236 |
| Realized and Unrealized Gain (Loss) | | | | |
| Net realized gain (loss) on: | | | | |
| Investment Securities: | | | | |
| Unaffiliated issuers (net of foreign taxes of $172,631) | | (46,550,543) | | |
| Affiliated issuers | | (2,712,086) | | |
| Foreign currency transactions | | (243,339) | | |
| Total net realized gain (loss) | | | | (49,505,968) |
| Change in net unrealized appreciation (depreciation) on: | | | | |
| Investment Securities: | | | | |
| Unaffiliated issuers(net of increase in deferred foreign taxes of $912,248) | | 302,905,925 | | |
| Affiliated issuers | | 31,204,743 | | |
| Assets and liabilities in foreign currencies | | (1,160,832) | | |
| Total change in net unrealized appreciation (depreciation) | | | | 332,949,836 |
| Net gain (loss) | | | | 283,443,868 |
| Net increase (decrease) in net assets resulting from operations | | | $ | 348,490,104 |
| Statement of Changes in Net Assets |
| |
| | Year ended October 31, 2023 | | Year ended October 31, 2022 |
| Increase (Decrease) in Net Assets | | | | |
| Operations | | | | |
| Net investment income (loss) | $ | 65,046,236 | $ | 78,961,606 |
| Net realized gain (loss) | | (49,505,968) | | (56,580,886) |
| Change in net unrealized appreciation (depreciation) | | 332,949,836 | | (993,174,796) |
| Net increase (decrease) in net assets resulting from operations | | 348,490,104 | | (970,794,076) |
| Distributions to shareholders | | (22,796,062) | | (242,362,167) |
| | | | | |
| Share transactions - net increase (decrease) | | 398,485,883 | | 612,399,770 |
| Total increase (decrease) in net assets | | 724,179,925 | | (600,756,473) |
| | | | | |
| Net Assets | | | | |
| Beginning of period | | 2,931,212,953 | | 3,531,969,426 |
| End of period | $ | 3,655,392,878 | $ | 2,931,212,953 |
| | | | | |
| | | | | |
Financial Highlights
| Fidelity Advisor® International Small Cap Fund Class A |
| |
| Years ended October 31, | | 2023 | | 2022 | | 2021 | | 2020 | | 2019 |
Selected Per-Share Data | | | | | | | | | | |
| Net asset value, beginning of period | $ | 23.88 | $ | 34.31 | $ | 24.75 | $ | 26.32 | $ | 25.78 |
| Income from Investment Operations | | | | | | | | | | |
Net investment income (loss) A,B | | .44 | | .58 | | .31 | | .27 | | .49 |
| Net realized and unrealized gain (loss) | | 2.63 | | (8.74) | | 9.42 | | (1.26) | | 1.43 |
| Total from investment operations | | 3.07 | | (8.16) | | 9.73 | | (.99) | | 1.92 |
| Distributions from net investment income | | (.11) | | (.75) | | (.17) | | (.44) | | (.38) |
| Distributions from net realized gain | | - | | (1.52) | | - | | (.14) | | (1.00) |
| Total distributions | | (.11) | | (2.27) | | (.17) | | (.58) | | (1.38) |
| Net asset value, end of period | $ | 26.84 | $ | 23.88 | $ | 34.31 | $ | 24.75 | $ | 26.32 |
Total Return C,D | | 12.87% | | (25.19)% | | 39.43% | | (3.91)% | | 8.00% |
Ratios to Average Net Assets B,E,F | | | | | | | | | | |
| Expenses before reductions | | 1.43% | | 1.29% | | 1.29% | | 1.36% | | 1.47% |
| Expenses net of fee waivers, if any | | 1.43% | | 1.29% | | 1.29% | | 1.36% | | 1.47% |
| Expenses net of all reductions | | 1.43% | | 1.29% | | 1.29% | | 1.35% | | 1.46% |
| Net investment income (loss) | | 1.56% | | 2.06% | | .95% | | 1.09% | | 1.94% |
| Supplemental Data | | | | | | | | | | |
| Net assets, end of period (000 omitted) | $ | 108,866 | $ | 95,906 | $ | 136,131 | $ | 92,044 | $ | 105,786 |
Portfolio turnover rate G | | 10% | | 17% | | 28% | | 43% | | 28% |
ACalculated based on average shares outstanding during the period.
BNet investment income (loss) is affected by the timing of the declaration of dividends by any underlying mutual funds or exchange-traded funds (ETFs). Net investment income (loss) of any mutual funds or ETFs is not included in the Fund's net investment income (loss) ratio.
CTotal returns would have been lower if certain expenses had not been reduced during the applicable periods shown.
DTotal returns do not include the effect of the sales charges.
EFees and expenses of any underlying mutual funds or exchange-traded funds (ETFs) are not included in the Fund's expense ratio. The Fund indirectly bears its proportionate share of these expenses. For additional expense information related to investments in Fidelity Central Funds, please refer to the "Investments in Fidelity Central Funds" note found in the Notes to Financial Statements section of the most recent Annual or Semi-Annual report.
FExpense ratios reflect operating expenses of the class. Expenses before reductions do not reflect amounts reimbursed, waived, or reduced through arrangements with the investment adviser, brokerage services, or other offset arrangements, if applicable, and do not represent the amount paid by the class during periods when reimbursements, waivers or reductions occur.
GAmount does not include the portfolio activity of any underlying mutual funds or exchange-traded funds (ETFs).
| Fidelity Advisor® International Small Cap Fund Class M |
| |
| Years ended October 31, | | 2023 | | 2022 | | 2021 | | 2020 | | 2019 |
Selected Per-Share Data | | | | | | | | | | |
| Net asset value, beginning of period | $ | 23.73 | $ | 34.12 | $ | 24.62 | $ | 26.18 | $ | 25.62 |
| Income from Investment Operations | | | | | | | | | | |
Net investment income (loss) A,B | | .36 | | .50 | | .22 | | .19 | | .41 |
| Net realized and unrealized gain (loss) | | 2.64 | | (8.70) | | 9.38 | | (1.25) | | 1.43 |
| Total from investment operations | | 3.00 | | (8.20) | | 9.60 | | (1.06) | | 1.84 |
| Distributions from net investment income | | (.04) | | (.66) | | (.10) | | (.36) | | (.27) |
| Distributions from net realized gain | | - | | (1.52) | | - | | (.14) | | (1.00) |
| Total distributions | | (.04) | | (2.19) C | | (.10) | | (.50) | | (1.28) C |
| Net asset value, end of period | $ | 26.69 | $ | 23.73 | $ | 34.12 | $ | 24.62 | $ | 26.18 |
Total Return D,E | | 12.62% | | (25.43)% | | 39.07% | | (4.19)% | | 7.65% |
Ratios to Average Net Assets B,F,G | | | | | | | | | | |
| Expenses before reductions | | 1.71% | | 1.57% | | 1.57% | | 1.67% | | 1.78% |
| Expenses net of fee waivers, if any | | 1.70% | | 1.56% | | 1.57% | | 1.67% | | 1.78% |
| Expenses net of all reductions | | 1.70% | | 1.56% | | 1.57% | | 1.65% | | 1.77% |
| Net investment income (loss) | | 1.29% | | 1.79% | | .68% | | .78% | | 1.62% |
| Supplemental Data | | | | | | | | | | |
| Net assets, end of period (000 omitted) | $ | 15,515 | $ | 13,761 | $ | 19,926 | $ | 12,492 | $ | 16,013 |
Portfolio turnover rate H | | 10% | | 17% | | 28% | | 43% | | 28% |
ACalculated based on average shares outstanding during the period.
BNet investment income (loss) is affected by the timing of the declaration of dividends by any underlying mutual funds or exchange-traded funds (ETFs). Net investment income (loss) of any mutual funds or ETFs is not included in the Fund's net investment income (loss) ratio.
CTotal distributions per share do not sum due to rounding.
DTotal returns would have been lower if certain expenses had not been reduced during the applicable periods shown.
ETotal returns do not include the effect of the sales charges.
FFees and expenses of any underlying mutual funds or exchange-traded funds (ETFs) are not included in the Fund's expense ratio. The Fund indirectly bears its proportionate share of these expenses. For additional expense information related to investments in Fidelity Central Funds, please refer to the "Investments in Fidelity Central Funds" note found in the Notes to Financial Statements section of the most recent Annual or Semi-Annual report.
GExpense ratios reflect operating expenses of the class. Expenses before reductions do not reflect amounts reimbursed, waived, or reduced through arrangements with the investment adviser, brokerage services, or other offset arrangements, if applicable, and do not represent the amount paid by the class during periods when reimbursements, waivers or reductions occur.
HAmount does not include the portfolio activity of any underlying mutual funds or exchange-traded funds (ETFs).
| Fidelity Advisor® International Small Cap Fund Class C |
| |
| Years ended October 31, | | 2023 | | 2022 | | 2021 | | 2020 | | 2019 |
Selected Per-Share Data | | | | | | | | | | |
| Net asset value, beginning of period | $ | 22.88 | $ | 32.93 | $ | 23.80 | $ | 25.27 | $ | 24.77 |
| Income from Investment Operations | | | | | | | | | | |
Net investment income (loss) A,B | | .21 | | .35 | | .06 | | .08 | | .28 |
| Net realized and unrealized gain (loss) | | 2.55 | | (8.40) | | 9.07 | | (1.23) | | 1.39 |
| Total from investment operations | | 2.76 | | (8.05) | | 9.13 | | (1.15) | | 1.67 |
| Distributions from net investment income | | - | | (.48) | | - | | (.18) | | (.17) |
| Distributions from net realized gain | | - | | (1.52) | | - | | (.14) | | (1.00) |
| Total distributions | | - | | (2.00) | | - | | (.32) | | (1.17) |
| Net asset value, end of period | $ | 25.64 | $ | 22.88 | $ | 32.93 | $ | 23.80 | $ | 25.27 |
Total Return C,D | | 12.06% | | (25.77)% | | 38.36% | | (4.65)% | | 7.17% |
Ratios to Average Net Assets B,E,F | | | | | | | | | | |
| Expenses before reductions | | 2.20% | | 2.06% | | 2.05% | | 2.13% | | 2.24% |
| Expenses net of fee waivers, if any | | 2.19% | | 2.05% | | 2.05% | | 2.13% | | 2.24% |
| Expenses net of all reductions | | 2.19% | | 2.05% | | 2.05% | | 2.11% | | 2.23% |
| Net investment income (loss) | | .80% | | 1.30% | | .19% | | .32% | | 1.16% |
| Supplemental Data | | | | | | | | | | |
| Net assets, end of period (000 omitted) | $ | 12,603 | $ | 13,556 | $ | 21,683 | $ | 17,659 | $ | 23,937 |
Portfolio turnover rate G | | 10% | | 17% | | 28% | | 43% | | 28% |
ACalculated based on average shares outstanding during the period.
BNet investment income (loss) is affected by the timing of the declaration of dividends by any underlying mutual funds or exchange-traded funds (ETFs). Net investment income (loss) of any mutual funds or ETFs is not included in the Fund's net investment income (loss) ratio.
CTotal returns would have been lower if certain expenses had not been reduced during the applicable periods shown.
DTotal returns do not include the effect of the contingent deferred sales charge.
EFees and expenses of any underlying mutual funds or exchange-traded funds (ETFs) are not included in the Fund's expense ratio. The Fund indirectly bears its proportionate share of these expenses. For additional expense information related to investments in Fidelity Central Funds, please refer to the "Investments in Fidelity Central Funds" note found in the Notes to Financial Statements section of the most recent Annual or Semi-Annual report.
FExpense ratios reflect operating expenses of the class. Expenses before reductions do not reflect amounts reimbursed, waived, or reduced through arrangements with the investment adviser, brokerage services, or other offset arrangements, if applicable, and do not represent the amount paid by the class during periods when reimbursements, waivers or reductions occur.
GAmount does not include the portfolio activity of any underlying mutual funds or exchange-traded funds (ETFs).
| Fidelity® International Small Cap Fund |
| |
| Years ended October 31, | | 2023 | | 2022 | | 2021 | | 2020 | | 2019 |
Selected Per-Share Data | | | | | | | | | | |
| Net asset value, beginning of period | $ | 24.43 | $ | 35.05 | $ | 25.28 | $ | 26.86 | $ | 26.29 |
| Income from Investment Operations | | | | | | | | | | |
Net investment income (loss) A,B | | .52 | | .67 | | .41 | | .34 | | .57 |
| Net realized and unrealized gain (loss) | | 2.70 | | (8.94) | | 9.61 | | (1.27) | | 1.45 |
| Total from investment operations | | 3.22 | | (8.27) | | 10.02 | | (.93) | | 2.02 |
| Distributions from net investment income | | (.19) | | (.83) | | (.25) | | (.51) | | (.45) |
| Distributions from net realized gain | | - | | (1.52) | | - | | (.14) | | (1.00) |
| Total distributions | | (.19) | | (2.35) | | (.25) | | (.65) | | (1.45) |
| Net asset value, end of period | $ | 27.46 | $ | 24.43 | $ | 35.05 | $ | 25.28 | $ | 26.86 |
Total Return C | | 13.19% | | (25.01)% | | 39.83% | | (3.61)% | | 8.27% |
Ratios to Average Net Assets B,D,E | | | | | | | | | | |
| Expenses before reductions | | 1.17% | | 1.02% | | 1.01% | | 1.08% | | 1.19% |
| Expenses net of fee waivers, if any | | 1.16% | | 1.02% | | 1.01% | | 1.08% | | 1.19% |
| Expenses net of all reductions | | 1.16% | | 1.02% | | 1.01% | | 1.07% | | 1.18% |
| Net investment income (loss) | | 1.83% | �� | 2.33% | | 1.23% | | 1.37% | | 2.22% |
| Supplemental Data | | | | | | | | | | |
| Net assets, end of period (000 omitted) | $ | 1,342,755 | $ | 1,145,773 | $ | 1,534,214 | $ | 1,122,746 | $ | 1,282,412 |
Portfolio turnover rate F | | 10% | | 17% | | 28% | | 43% | | 28% |
ACalculated based on average shares outstanding during the period.
BNet investment income (loss) is affected by the timing of the declaration of dividends by any underlying mutual funds or exchange-traded funds (ETFs). Net investment income (loss) of any mutual funds or ETFs is not included in the Fund's net investment income (loss) ratio.
CTotal returns would have been lower if certain expenses had not been reduced during the applicable periods shown.
DFees and expenses of any underlying mutual funds or exchange-traded funds (ETFs) are not included in the Fund's expense ratio. The Fund indirectly bears its proportionate share of these expenses. For additional expense information related to investments in Fidelity Central Funds, please refer to the "Investments in Fidelity Central Funds" note found in the Notes to Financial Statements section of the most recent Annual or Semi-Annual report.
EExpense ratios reflect operating expenses of the class. Expenses before reductions do not reflect amounts reimbursed, waived, or reduced through arrangements with the investment adviser, brokerage services, or other offset arrangements, if applicable, and do not represent the amount paid by the class during periods when reimbursements, waivers or reductions occur.
FAmount does not include the portfolio activity of any underlying mutual funds or exchange-traded funds (ETFs).
| Fidelity Advisor® International Small Cap Fund Class I |
| |
| Years ended October 31, | | 2023 | | 2022 | | 2021 | | 2020 | | 2019 |
Selected Per-Share Data | | | | | | | | | | |
| Net asset value, beginning of period | $ | 24.60 | $ | 35.27 | $ | 25.44 | $ | 27.03 | $ | 26.45 |
| Income from Investment Operations | | | | | | | | | | |
Net investment income (loss) A,B | | .53 | | .68 | | .41 | | .35 | | .58 |
| Net realized and unrealized gain (loss) | | 2.71 | | (8.99) | | 9.67 | | (1.28) | | 1.46 |
| Total from investment operations | | 3.24 | | (8.31) | | 10.08 | | (.93) | | 2.04 |
| Distributions from net investment income | | (.18) | | (.84) | | (.25) | | (.52) | | (.46) |
| Distributions from net realized gain | | - | | (1.52) | | - | | (.14) | | (1.00) |
| Total distributions | | (.18) | | (2.36) | | (.25) | | (.66) | | (1.46) |
| Net asset value, end of period | $ | 27.66 | $ | 24.60 | $ | 35.27 | $ | 25.44 | $ | 27.03 |
Total Return C | | 13.20% | | (24.98)% | | 39.80% | | (3.62)% | | 8.28% |
Ratios to Average Net Assets B,D,E | | | | | | | | | | |
| Expenses before reductions | | 1.16% | | 1.02% | | 1.02% | | 1.08% | | 1.19% |
| Expenses net of fee waivers, if any | | 1.15% | | 1.01% | | 1.02% | | 1.08% | | 1.18% |
| Expenses net of all reductions | | 1.15% | | 1.01% | | 1.02% | | 1.06% | | 1.18% |
| Net investment income (loss) | | 1.84% | | 2.34% | | 1.22% | | 1.38% | | 2.22% |
| Supplemental Data | | | | | | | | | | |
| Net assets, end of period (000 omitted) | $ | 924,094 | $ | 696,515 | $ | 1,080,258 | $ | 605,100 | $ | 777,771 |
Portfolio turnover rate F | | 10% | | 17% | | 28% | | 43% | | 28% |
ACalculated based on average shares outstanding during the period.
BNet investment income (loss) is affected by the timing of the declaration of dividends by any underlying mutual funds or exchange-traded funds (ETFs). Net investment income (loss) of any mutual funds or ETFs is not included in the Fund's net investment income (loss) ratio.
CTotal returns would have been lower if certain expenses had not been reduced during the applicable periods shown.
DFees and expenses of any underlying mutual funds or exchange-traded funds (ETFs) are not included in the Fund's expense ratio. The Fund indirectly bears its proportionate share of these expenses. For additional expense information related to investments in Fidelity Central Funds, please refer to the "Investments in Fidelity Central Funds" note found in the Notes to Financial Statements section of the most recent Annual or Semi-Annual report.
EExpense ratios reflect operating expenses of the class. Expenses before reductions do not reflect amounts reimbursed, waived, or reduced through arrangements with the investment adviser, brokerage services, or other offset arrangements, if applicable, and do not represent the amount paid by the class during periods when reimbursements, waivers or reductions occur.
FAmount does not include the portfolio activity of any underlying mutual funds or exchange-traded funds (ETFs).
| Fidelity Advisor® International Small Cap Fund Class Z |
| |
| Years ended October 31, | | 2023 | | 2022 | | 2021 | | 2020 | | 2019 |
Selected Per-Share Data | | | | | | | | | | |
| Net asset value, beginning of period | $ | 24.59 | $ | 35.26 | $ | 25.43 | $ | 27.03 | $ | 26.46 |
| Income from Investment Operations | | | | | | | | | | |
Net investment income (loss) A,B | | .56 | | .70 | | .45 | | .38 | | .61 |
| Net realized and unrealized gain (loss) | | 2.72 | | (8.97) | | 9.67 | | (1.28) | | 1.47 |
| Total from investment operations | | 3.28 | | (8.27) | | 10.12 | | (.90) | | 2.08 |
| Distributions from net investment income | | (.22) | | (.88) | | (.29) | | (.56) | | (.50) |
| Distributions from net realized gain | | - | | (1.52) | | - | | (.14) | | (1.00) |
| Total distributions | | (.22) | | (2.40) | | (.29) | | (.70) | | (1.51) C |
| Net asset value, end of period | $ | 27.65 | $ | 24.59 | $ | 35.26 | $ | 25.43 | $ | 27.03 |
Total Return D,E | | 13.38% | | (24.89)% | | 39.99% | | (3.51)% | | 8.44% |
Ratios to Average Net Assets A,F,G | | | | | | | | | | |
| Expenses before reductions | | 1.03% | | .89% | | .89% | | .94% | | 1.05% |
| Expenses net of fee waivers, if any | | 1.03% | | .89% | | .89% | | .94% | | 1.05% |
| Expenses net of all reductions | | 1.03% | | .89% | | .89% | | .93% | | 1.04% |
| Net investment income (loss) | | 1.96% | | 2.47% | | 1.35% | | 1.51% | | 2.35% |
| Supplemental Data | | | | | | | | | | |
| Net assets, end of period (000 omitted) | $ | 1,251,559 | $ | 965,701 | $ | 739,757 | $ | 275,127 | $ | 245,252 |
Portfolio turnover rate H | | 10% | | 17% | | 28% | | 43% | | 28% |
ANet investment income (loss) is affected by the timing of the declaration of dividends by any underlying mutual funds or exchange-traded funds (ETFs). Net investment income (loss) of any mutual funds or ETFs is not included in the Fund's net investment income (loss) ratio.
BCalculated based on average shares outstanding during the period.
CTotal distributions per share do not sum due to rounding.
DTotal returns for periods of less than one year are not annualized.
ETotal returns would have been lower if certain expenses had not been reduced during the applicable periods shown.
FFees and expenses of any underlying mutual funds or exchange-traded funds (ETFs) are not included in the Fund's expense ratio. The Fund indirectly bears its proportionate share of these expenses. For additional expense information related to investments in Fidelity Central Funds, please refer to the "Investments in Fidelity Central Funds" note found in the Notes to Financial Statements section of the most recent Annual or Semi-Annual report.
GExpense ratios reflect operating expenses of the class. Expenses before reductions do not reflect amounts reimbursed, waived, or reduced through arrangements with the investment adviser, brokerage services, or other offset arrangements, if applicable, and do not represent the amount paid by the class during periods when reimbursements, waivers or reductions occur.
HAmount does not include the portfolio activity of any underlying mutual funds or exchange-traded funds (ETFs).
For the period ended October 31, 2023
1. Organization.
Fidelity International Small Cap Fund (the Fund) is a fund of Fidelity Investment Trust (the Trust) and is authorized to issue an unlimited number of shares. The Trust is registered under the Investment Company Act of 1940, as amended (the 1940 Act), as an open-end management investment company organized as a Massachusetts business trust. The Fund offers Class A, Class M, Class C, International Small Cap, Class I and Class Z shares, each of which has equal rights as to assets and voting privileges. Class A, Class M, Class C, Class I and Class Z are Fidelity Advisor classes. Each class has exclusive voting rights with respect to matters that affect that class. Class C shares will automatically convert to Class A shares after a holding period of eight years from the initial date of purchase, with certain exceptions. The Fund's investments in emerging markets can be subject to social, economic, regulatory, and political uncertainties and can be extremely volatile.
2. Investments in Fidelity Central Funds.
Funds may invest in Fidelity Central Funds, which are open-end investment companies generally available only to other investment companies and accounts managed by the investment adviser and its affiliates. The Schedule of Investments lists any Fidelity Central Funds held as an investment as of period end, but does not include the underlying holdings of each Fidelity Central Fund. An investing fund indirectly bears its proportionate share of the expenses of the underlying Fidelity Central Funds.
Based on its investment objective, each Fidelity Central Fund may invest or participate in various investment vehicles or strategies that are similar to those of the investing fund. These strategies are consistent with the investment objectives of the investing fund and may involve certain economic risks which may cause a decline in value of each of the Fidelity Central Funds and thus a decline in the value of the investing fund.
| Fidelity Central Fund | Investment Manager | Investment Objective | Investment Practices | Expense RatioA |
| Fidelity Money Market Central Funds | Fidelity Management & Research Company LLC (FMR) | Each fund seeks to obtain a high level of current income consistent with the preservation of capital and liquidity. | Short-term Investments | Less than .005% |
A Expenses expressed as a percentage of average net assets and are as of each underlying Central Fund's most recent annual or semi-annual shareholder report.
A complete unaudited list of holdings for each Fidelity Central Fund is available upon request or at the Securities and Exchange Commission website at www.sec.gov. In addition, the financial statements of the Fidelity Central Funds which contain the significant accounting policies (including investment valuation policies) of those funds, and are not covered by the Report of Independent Registered Public Accounting Firm, are available on the Securities and Exchange Commission website or upon request.
3. Significant Accounting Policies.
The Fund is an investment company and applies the accounting and reporting guidance of the Financial Accounting Standards Board (FASB) Accounting Standards Codification Topic 946 Financial Services - Investment Companies. The financial statements have been prepared in conformity with accounting principles generally accepted in the United States of America (GAAP), which require management to make certain estimates and assumptions at the date of the financial statements. Actual results could differ from those estimates. Subsequent events, if any, through the date that the financial statements were issued have been evaluated in the preparation of the financial statements. The Fund's Schedule of Investments lists any underlying mutual funds or exchange-traded funds (ETFs) but does not include the underlying holdings of these funds. The following summarizes the significant accounting policies of the Fund:
Investment Valuation. Investments are valued as of 4:00 p.m. Eastern time on the last calendar day of the period. The Board of Trustees (the Board) has designated the Fund's investment adviser as the valuation designee responsible for the fair valuation function and performing fair value determinations as needed. The investment adviser has established a Fair Value Committee (the Committee) to carry out the day-to-day fair valuation responsibilities and has adopted policies and procedures to govern the fair valuation process and the activities of the Committee. In accordance with these fair valuation policies and procedures, which have been approved by the Board, the Fund attempts to obtain prices from one or more third party pricing services or brokers to value its investments. When current market prices, quotations or currency exchange rates are not readily available or reliable, investments will be fair valued in good faith by the Committee, in accordance with the policies and procedures. Factors used in determining fair value vary by investment type and may include market or investment specific events, transaction data, estimated cash flows, and market observations of comparable investments. The frequency that the fair valuation procedures are used cannot be predicted and they may be utilized to a significant extent. The Committee manages the Fund's fair valuation practices and maintains the fair valuation policies and procedures. The Fund's investment adviser reports to the Board information regarding the fair valuation process and related material matters.
The Fund categorizes the inputs to valuation techniques used to value its investments into a disclosure hierarchy consisting of three levels as shown below:
Level 1 - unadjusted quoted prices in active markets for identical investments
Level 2 - other significant observable inputs (including quoted prices for similar investments, interest rates, prepayment speeds, etc.)
Level 3 - unobservable inputs (including the Fund's own assumptions based on the best information available)
Valuation techniques used to value the Fund's investments by major category are as follows:
Equity securities, including restricted securities, for which market quotations are readily available, are valued at the last reported sale price or official closing price as reported by a third party pricing service on the primary market or exchange on which they are traded and are categorized as Level 1 in the hierarchy. In the event there were no sales during the day or closing prices are not available, securities are valued at the last quoted bid price or may be valued using the last available price and are generally categorized as Level 2 in the hierarchy. For foreign equity securities, when market or security specific events arise, comparisons to the valuation of American Depositary Receipts (ADRs), futures contracts, ETFs and certain indexes as well as quoted prices for similar securities may be used and would be categorized as Level 2 in the hierarchy. For equity securities, including restricted securities, where observable inputs are limited, assumptions about market activity and risk are used and these securities may be categorized as Level 3 in the hierarchy.
Investments in open-end mutual funds, including the Fidelity Central Funds, are valued at their closing net asset value (NAV) each business day and are categorized as Level 1 in the hierarchy.
Changes in valuation techniques may result in transfers in or out of an assigned level within the disclosure hierarchy. The aggregate value of investments by input level as of October 31, 2023 is included at the end of the Fund's Schedule of Investments.
Foreign Currency. Certain Funds may use foreign currency contracts to facilitate transactions in foreign-denominated securities. Gains and losses from these transactions may arise from changes in the value of the foreign currency or if the counterparties do not perform under the contracts' terms.
Foreign-denominated assets, including investment securities, and liabilities are translated into U.S. dollars at the exchange rates at period end. Purchases and sales of investment securities, income and dividends received, and expenses denominated in foreign currencies are translated into U.S. dollars at the exchange rate in effect on the transaction date.
The effects of exchange rate fluctuations on investments are included with the net realized and unrealized gain (loss) on investment securities. Other foreign currency transactions resulting in realized and unrealized gain (loss) are disclosed separately.
Investment Transactions and Income. For financial reporting purposes, the Fund's investment holdings and NAV include trades executed through the end of the last business day of the period. The NAV per share for processing shareholder transactions is calculated as of the close of business of the New York Stock Exchange (NYSE), normally 4:00 p.m. Eastern time and includes trades executed through the end of the prior business day. Gains and losses on securities sold are determined on the basis of identified cost and include proceeds received from litigation. Commissions paid to certain brokers with whom the investment adviser, or its affiliates, places trades on behalf of a fund include an amount in addition to trade execution, which may be rebated back to a fund. Any such rebates are included in net realized gain (loss) on investments in the Statement of Operations. Dividend income is recorded on the ex-dividend date, except for certain dividends from foreign securities where the ex-dividend date may have passed, which are recorded as soon as the Fund is informed of the ex-dividend date. Non-cash dividends included in dividend income, if any, are recorded at the fair market value of the securities received. Income and capital gain distributions from Fidelity Central Funds, if any, are recorded on the ex-dividend date. Investment income is recorded net of foreign taxes withheld where recovery of such taxes is uncertain. Funds may file withholding tax reclaims in certain jurisdictions to recover a portion of amounts previously withheld. Any withholding tax reclaims income is included in the Statement of Operations in foreign taxes withheld. Any receivables for withholding tax reclaims are included in the Statement of Assets and Liabilities in reclaims receivable. The Fund has filed tax reclaims for previously withheld taxes on dividends earned in certain European Union (EU) countries. These additional filings are subject to various administrative proceedings by the local jurisdictions' tax authorities within the EU, as well as a number of related judicial proceedings. Income recognized for EU reclaims is included with other reclaims in the Statement of Operations in foreign taxes withheld. These reclaims are recorded when the amount is known and there are no significant uncertainties on collectability.
Class Allocations and Expenses. Investment income, realized and unrealized capital gains and losses, common expenses of a fund, and certain fund-level expense reductions, if any, are allocated daily on a pro-rata basis to each class based on the relative net assets of each class to the total net assets of a fund. Each class differs with respect to transfer agent and distribution and service plan fees incurred, as applicable. Certain expense reductions may also differ by class, if applicable. For the reporting period, the allocated portion of income and expenses to each class as a percent of its average net assets may vary due to the timing of recording these transactions in relation to fluctuating net assets of the classes. Expenses directly attributable to a fund are charged to that fund. Expenses attributable to more than one fund are allocated among the respective funds on the basis of relative net assets or other appropriate methods. Expenses included in the accompanying financial statements reflect the expenses of that fund and do not include any expenses associated with any underlying mutual funds or exchange-traded funds (ETFs). Although not included in a fund's expenses, a fund indirectly bears its proportionate share of these expenses through the net asset value of each underlying mutual fund or exchange-traded fund (ETF). Expense estimates are accrued in the period to which they relate and adjustments are made when actual amounts are known.
Income Tax Information and Distributions to Shareholders. Each year, the Fund intends to qualify as a regulated investment company under Subchapter M of the Internal Revenue Code, including distributing substantially all of its taxable income and realized gains. As a result, no provision for U.S. Federal income taxes is required. As of October 31, 2023, the Fund did not have any unrecognized tax benefits in the financial statements; nor is the Fund aware of any tax positions for which it is reasonably possible that the total amounts of unrecognized tax benefits will significantly change in the next twelve months. The Fund files a U.S. federal tax return, in addition to state and local tax returns as required. The Fund's federal income tax returns are subject to examination by the Internal Revenue Service (IRS) for a period of three fiscal years after they are filed. State and local tax returns may be subject to examination for an additional fiscal year depending on the jurisdiction. Foreign taxes are provided for based on the Fund's understanding of the tax rules and rates that exist in the foreign markets in which it invests. The Fund is subject to a tax imposed on capital gains by certain countries in which it invests. An estimated deferred tax liability for net unrealized appreciation on the applicable securities is included in Other payables and accrued expenses on the Statement of Assets & Liabilities.
Distributions are declared and recorded on the ex-dividend date. Income and capital gain distributions are declared separately for each class. Income and capital gain distributions are determined in accordance with income tax regulations, which may differ from GAAP. In addition, the Fund claimed a portion of the payment made to redeeming shareholders as a distribution for income tax purposes.
Capital accounts within the financial statements are adjusted for permanent book-tax differences. These adjustments have no impact on net assets or the results of operations. Capital accounts are not adjusted for temporary book-tax differences which will reverse in a subsequent period.
Book-tax differences are primarily due to foreign currency transactions, passive foreign investment companies (PFIC), capital loss carryforwards, certain foreign taxes and losses deferred due to wash sales.
As of period end, the cost and unrealized appreciation (depreciation) in securities, and derivatives if applicable, for federal income tax purposes were as follows:
| Gross unrealized appreciation | $542,070,532 |
| Gross unrealized depreciation | (650,240,285) |
| Net unrealized appreciation (depreciation) | $(108,169,753) |
| Tax Cost | $3,702,433,152 |
The tax-based components of distributable earnings as of period end were as follows:
| Undistributed ordinary income | $72,348,728 |
| Capital loss carryforward | $(94,234,749) |
| Net unrealized appreciation (depreciation) on securities and other investments | $(109,938,678) |
Capital loss carryforwards are only available to offset future capital gains of the Fund to the extent provided by regulations and may be limited. The capital loss carryforward information presented below, including any applicable limitation, is estimated as of fiscal period end and is subject to adjustment.
| Short-term | $(51,144,509) |
| Long-term | (43,090,240) |
Total capital loss carryforward | $(94,234,749) |
The tax character of distributions paid was as follows:
| | October 31, 2023 | October 31, 2022 |
| Ordinary Income | $22,796,062 | $136,799,647 |
| Long-term Capital Gains | - | 105,562,520 |
| Total | $22,796,062 | $242,362,167 |
Restricted Securities (including Private Placements). Funds may invest in securities that are subject to legal or contractual restrictions on resale. These securities generally may be resold in transactions exempt from registration or to the public if the securities are registered. Disposal of these securities may involve time-consuming negotiations and expense, and prompt sale at an acceptable price may be difficult. Information regarding restricted securities held at period end is included at the end of the Schedule of Investments, if applicable.
4. Purchases and Sales of Investments.
Purchases and sales of securities, other than short-term securities and in-kind transactions, as applicable, are noted in the table below.
| | Purchases ($) | Sales ($) |
| Fidelity International Small Cap Fund | 649,831,964 | 332,656,860 |
5. Fees and Other Transactions with Affiliates.
Management Fee. Fidelity Management & Research Company LLC (the investment adviser) and its affiliates provide the Fund with investment management related services for which the Fund pays a monthly management fee. The management fee is the sum of an individual fund fee rate that is based on an annual rate of .60% of the Fund's average net assets and an annualized group fee rate that averaged .23% during the period. The group fee rate is based upon the monthly average net assets of a group of registered investment companies with which the investment adviser has management contracts. The group fee rate decreases as assets under management increase and increases as assets under management decrease. In addition, the management fee is subject to a performance adjustment (up to a maximum of +/- .20% of the Fund's average net assets over a 36 month performance period). The upward or downward adjustment to the management fee is based on the relative investment performance of International Small Cap as compared to its benchmark index, the MSCI ACWI (All Country World Index) ex USA Small Cap Index, over the same 36 month performance period. For the reporting period, the total annual management fee rate, including the performance adjustment, was .93% of the Fund's average net assets. The performance adjustment included in the management fee rate may be higher or lower than the maximum performance adjustment rate due to the difference between the average net assets for the reporting and performance periods.
Distribution and Service Plan Fees. In accordance with Rule 12b-1 of the 1940 Act, the Fund has adopted separate Distribution and Service Plans for each class of shares. Certain classes pay Fidelity Distributors Company LLC (FDC), an affiliate of the investment adviser, separate Distribution and Service Fees, each of which is based on an annual percentage of each class' average net assets. In addition, FDC may pay financial intermediaries for selling shares of the Fund and providing shareholder support services. For the period, the Distribution and Service Fee rates, total fees and amounts retained by FDC were as follows:
| | Distribution Fee | Service Fee | Total Fees | Retained by FDC |
| Class A | - % | .25% | $284,303 | $2,664 |
| Class M | .25% | .25% | 82,456 | 201 |
| Class C | .75% | .25% | 143,103 | 10,840 |
| | | | $509,862 | $13,705 |
Sales Load. FDC may receive a front-end sales charge of up to 5.75% for selling Class A shares and 3.50% for selling Class M shares, some of which is paid to financial intermediaries for selling shares of the Fund. Depending on the holding period, FDC may receive contingent deferred sales charges levied on Class A, Class M and Class C redemptions. The deferred sales charges are 1.00% for Class C shares, 1.00% for certain purchases of Class A shares and .25% for certain purchases of Class M shares.
For the period, sales charge amounts retained by FDC were as follows:
| | Retained by FDC |
| Class A | $13,455 |
| Class M | 1,227 |
Class CA | 87 |
| | $14,769 |
A When Class C shares are initially sold, FDC pays commissions from its own resources to financial intermediaries through which the sales are made.
Transfer Agent Fees. Fidelity Investments Institutional Operations Company LLC (FIIOC), an affiliate of the investment adviser, is the transfer, dividend disbursing and shareholder servicing agent for each class of the Fund. FIIOC receives account fees and asset-based fees that vary according to the account size and type of account of the shareholders of the respective classes of the Fund, except for Class Z. FIIOC receives an asset-based fee of Class Z's average net assets. FIIOC pays for typesetting, printing and mailing of shareholder reports, except proxy statements.
For the period, transfer agent fees for each class were as follows:
| | Amount | % of Class-Level Average Net Assets |
| Class A | $220,465 | .19 |
| Class M | 35,583 | .22 |
| Class C | 29,791 | .21 |
| International Small Cap | 2,508,236 | .18 |
| Class I | 1,450,702 | .17 |
| Class Z | 462,940 | .04 |
| | $4,707,717 | |
During November 2023, the Board approved a change in the transfer agent fees effective December 1, 2023 to a fixed annual rate of class-level average net assets as follows:
| | % of Class-Level Average Net Assets |
| Class A | 0.1909% |
| Class M | 0.2000% |
| Class C | 0.2000% |
| International Small Cap | 0.1743% |
| Class I | 0.1723% |
Accounting Fees. Fidelity Service Company, Inc. (FSC), an affiliate of the investment adviser, maintains the Fund's accounting records. The accounting fee is based on the level of average net assets for each month. For the period, the fees were equivalent to the following annual rates:
| | % of Average Net Assets |
| Fidelity International Small Cap Fund | .04 |
During November 2023, the Board approved a change in the accounting fees effective December 1, 2023 to a fixed annual rate of average net assets as follows:
| | % of Average Net Assets |
| Fidelity International Small Cap Fund | 0.0385% |
Brokerage Commissions. A portion of portfolio transactions were placed with brokerage firms which are affiliates of the investment adviser. Brokerage commissions are included in net realized gain (loss) and change in net unrealized appreciation (depreciation) in the Statement of Operations. The commissions paid to these affiliated firms were as follows:
| | Amount |
| Fidelity International Small Cap Fund | $2,135 |
Interfund Lending Program. Pursuant to an Exemptive Order issued by the Securities and Exchange Commission (the SEC), the Fund, along with other registered investment companies having management contracts with Fidelity Management & Research Company LLC (FMR), or other affiliated entities of FMR, may participate in an interfund lending program. This program provides an alternative credit facility allowing the Fund to borrow from, or lend money to, other participating affiliated funds. At period end, there were no interfund loans outstanding. Activity in this program during the period for which loans were outstanding was as follows:
| | Borrower or Lender | Average Loan Balance | Weighted Average Interest Rate | Interest Expense |
Fidelity International Small Cap Fund. | Borrower | $ 10,391,750 | 4.13% | $28,590 |
Interfund Trades. Funds may purchase from or sell securities to other Fidelity Funds under procedures adopted by the Board. The procedures have been designed to ensure these interfund trades are executed in accordance with Rule 17a-7 of the 1940 Act. Any interfund trades are included within the respective purchases and sales amounts shown in the Purchases and Sales of Investments note. Interfund trades during the period are noted in the table below.
| | Purchases ($) | Sales ($) | Realized Gain (Loss) ($) |
| Fidelity International Small Cap Fund | 12,095,723 | 25,895,654 | (3,031,398) |
6. Committed Line of Credit.
Certain Funds participate with other funds managed by the investment adviser or an affiliate in a $4.25 billion credit facility (the "line of credit") to be utilized for temporary or emergency purposes to fund shareholder redemptions or for other short-term liquidity purposes. The participating funds have agreed to pay commitment fees on their pro-rata portion of the line of credit, which are reflected in Miscellaneous expenses on the Statement of Operations, and are listed below. During the period, there were no borrowings on this line of credit.
| | Amount |
| Fidelity International Small Cap Fund | $6,205 |
7. Security Lending.
Funds lend portfolio securities from time to time in order to earn additional income. Lending agents are used, including National Financial Services (NFS), an affiliate of the investment adviser. Pursuant to a securities lending agreement, NFS will receive a fee, which is capped at 9.9% of a fund's daily lending revenue, for its services as lending agent. A fund may lend securities to certain qualified borrowers, including NFS. On the settlement date of the loan, a fund receives collateral (in the form of U.S. Treasury obligations, letters of credit and/or cash) against the loaned securities and maintains collateral in an amount not less than 100% of the market value of the loaned securities during the period of the loan. The market value of the loaned securities is determined at the close of business of a fund and any additional required collateral is delivered to a fund on the next business day. A fund or borrower may terminate the loan at any time, and if the borrower defaults on its obligation to return the securities loaned because of insolvency or other reasons, a fund may apply collateral received from the borrower against the obligation. A fund may experience delays and costs in recovering the securities loaned. Any cash collateral received is invested in the Fidelity Securities Lending Cash Central Fund. Any loaned securities are identified as such in the Schedule of Investments, and the value of loaned securities and cash collateral at period end, as applicable, are presented in the Statement of Assets and Liabilities. Security lending income represents the income earned on investing cash collateral, less rebates paid to borrowers and any lending agent fees associated with the loan, plus any premium payments received for lending certain types of securities. Security lending income is presented in the Statement of Operations as a component of income from Fidelity Central Funds. Affiliated security lending activity, if any, was as follows:
| | Total Security Lending Fees Paid to NFS | Security Lending Income From Securities Loaned to NFS | Value of Securities Loaned to NFS at Period End |
| Fidelity International Small Cap Fund | $30,264 | $- | $- |
8. Bank Borrowings.
The Fund is permitted to have bank borrowings for temporary or emergency purposes to fund shareholder redemptions or for other short-term liquidity requirements. The Fund has established borrowing arrangements with certain banks. The interest rate on the borrowings is the bank's base rate, as revised from time to time. Any open loans, including accrued interest, at period end are presented under the caption "Notes payable" in the Statement of Assets and Liabilities, if applicable. Activity in this program during the period for which loans were outstanding was as follows:
| | Average Loan Balance | Weighted Average Interest Rate | Interest Expense |
| Fidelity International Small Cap Fund | $9,529,000 | 3.58% | $948 |
9. Expense Reductions.
Through arrangements with each class' transfer agent, credits realized as a result of certain uninvested cash balances were used to reduce the Fund's expenses. During the period, transfer agent credits reduced each class' expenses as noted in the table below.
| | Expense reduction |
| | |
| Class M | 402 |
| Class C | 23 |
| | $425 |
In addition, during the period the investment adviser or an affiliate reimbursed and/or waived a portion of fund-level operating expenses in the amount of $214,237.
10. Distributions to Shareholders.
Distributions to shareholders of each class were as follows:
| | Year ended October 31, 2023 | Year ended October 31, 2022 |
| Fidelity International Small Cap Fund | | |
| Distributions to shareholders | | |
| Class A | $440,641 | $9,065,367 |
| Class M | 19,955 | 1,272,726 |
| Class C | - | 1,312,589 |
| International Small Cap | 8,831,165 | 100,730,178 |
| Class I | 5,018,235 | 74,208,475 |
| Class Z | 8,486,066 | 55,772,832 |
Total | $22,796,062 | $242,362,167 |
11. Share Transactions.
Share transactions for each class were as follows and may contain in-kind transactions, automatic conversions between classes or exchanges between affiliated funds:
| | Shares | Shares | Dollars | Dollars |
| | Year ended October 31, 2023 | Year ended October 31, 2022 | Year ended October 31, 2023 | Year ended October 31, 2022 |
| Fidelity International Small Cap Fund | | | | |
| Class A | | | | |
| Shares sold | 918,692 | 830,534 | $25,838,409 | $23,685,249 |
| Reinvestment of distributions | 16,707 | 295,136 | 437,544 | 8,995,592 |
| Shares redeemed | (896,876) | (1,076,634) | (25,017,177) | (30,435,716) |
| Net increase (decrease) | 38,523 | 49,036 | $1,258,776 | $2,245,125 |
| Class M | | | | |
| Shares sold | 114,850 | 86,516 | $3,220,186 | $2,471,290 |
| Reinvestment of distributions | 763 | 41,863 | 19,926 | 1,271,367 |
| Shares redeemed | (114,079) | (132,638) | (3,149,104) | (3,771,297) |
| Net increase (decrease) | 1,534 | (4,259) | $91,008 | $(28,640) |
| Class C | | | | |
| Shares sold | 51,153 | 60,983 | $1,355,166 | $1,691,801 |
| Reinvestment of distributions | - | 44,584 | - | 1,311,796 |
| Shares redeemed | (152,016) | (171,531) | (4,049,390) | (4,624,227) |
| Net increase (decrease) | (100,863) | (65,964) | $(2,694,224) | $(1,620,630) |
| International Small Cap | | | | |
| Shares sold | 12,448,015 | 13,356,832 | $353,729,600 | $375,220,830 |
| Reinvestment of distributions | 303,022 | 2,945,011 | 8,099,784 | 91,615,712 |
| Shares redeemed | (10,758,826) | (13,181,058) | (307,464,961) | (380,933,549) |
| Net increase (decrease) | 1,992,211 | 3,120,785 | $54,364,423 | $85,902,993 |
| Class I | | | | |
| Shares sold | 14,669,013 | 13,697,966 | $422,708,769 | $404,258,743 |
| Reinvestment of distributions | 178,126 | 2,305,754 | 4,795,157 | 72,208,170 |
| Shares redeemed | (9,758,006) | (18,313,122) | (275,755,333) | (518,387,511) |
| Net increase (decrease) | 5,089,133 | (2,309,402) | $151,748,593 | $(41,920,598) |
| Class Z | | | | |
| Shares sold | 18,575,488 | 35,845,899 | $542,508,039 | $1,046,158,928 |
| Reinvestment of distributions | 206,606 | 1,517,664 | 5,553,574 | 47,460,406 |
| Shares redeemed | (12,784,069) | (19,068,812) | (354,344,306) | (525,797,814) |
| Net increase (decrease) | 5,998,025 | 18,294,751 | $193,717,307 | $567,821,520 |
12. Other.
A fund's organizational documents provide former and current trustees and officers with a limited indemnification against liabilities arising in connection with the performance of their duties to the fund. In the normal course of business, a fund may also enter into contracts that provide general indemnifications. A fund's maximum exposure under these arrangements is unknown as this would be dependent on future claims that may be made against a fund. The risk of material loss from such claims is considered remote.
13. Risk and Uncertainties.
Many factors affect a fund's performance. Developments that disrupt global economies and financial markets, such as pandemics, epidemics, outbreaks of infectious diseases, war, terrorism, and environmental disasters, may significantly affect a fund's investment performance. The effects of these developments to a fund will be impacted by the types of securities in which a fund invests, the financial condition, industry, economic sector, and geographic location of an issuer, and a fund's level of investment in the securities of that issuer. Significant concentrations in security types, issuers, industries, sectors, and geographic locations may magnify the factors that affect a fund's performance.
To the Board of Trustees of Fidelity Investment Trust and Shareholders of Fidelity International Small Cap Fund:
Opinion on the Financial Statements and Financial Highlights
We have audited the accompanying statement of assets and liabilities of Fidelity International Small Cap Fund (the "Fund"), a fund of Fidelity Investment Trust, including the schedule of investments, as of October 31, 2023, the related statement of operations for the year then ended, the statement of changes in net assets for each of the two years in the period then ended, the financial highlights for each of five years in the period then ended, and the related notes. In our opinion, the financial statements and financial highlights present fairly, in all material respects, the financial position of the Fund as of October 31, 2023, and the results of its operations for the year then ended, the changes in its net assets for each of the two years in the period then ended, and the financial highlights for each of the five years in the period then ended in conformity with accounting principles generally accepted in the United States of America.
Basis for Opinion
These financial statements and financial highlights are the responsibility of the Fund's management. Our responsibility is to express an opinion on the Fund's financial statements and financial highlights based on our audits. We are a public accounting firm registered with the Public Company Accounting Oversight Board (United States) (PCAOB) and are required to be independent with respect to the Fund in accordance with the U.S. federal securities laws and the applicable rules and regulations of the Securities and Exchange Commission and the PCAOB.
We conducted our audits in accordance with the standards of the PCAOB. Those standards require that we plan and perform the audit to obtain reasonable assurance about whether the financial statements and financial highlights are free of material misstatement, whether due to error or fraud. The Fund is not required to have, nor were we engaged to perform, an audit of its internal control over financial reporting. As part of our audits we are required to obtain an understanding of internal control over financial reporting but not for the purpose of expressing an opinion on the effectiveness of the Fund's internal control over financial reporting. Accordingly, we express no such opinion.
Our audits included performing procedures to assess the risks of material misstatement of the financial statements and financial highlights, whether due to error or fraud, and performing procedures that respond to those risks. Such procedures included examining, on a test basis, evidence regarding the amounts and disclosures in the financial statements and financial highlights. Our audits also included evaluating the accounting principles used and significant estimates made by management, as well as evaluating the overall presentation of the financial statements and financial highlights. Our procedures included confirmation of securities owned as of October 31, 2023, by correspondence with the custodian and brokers; when replies were not received from brokers, we performed other auditing procedures. We believe that our audits provide a reasonable basis for our opinion.
/s/ Deloitte & Touche LLP
Boston, Massachusetts
December 14, 2023
We have served as the auditor of one or more of the Fidelity investment companies since 1999.
The Trustees, Members of the Advisory Board (if any), and officers of the trust and fund, as applicable, are listed below. The Board of Trustees governs the fund and is responsible for protecting the interests of shareholders. The Trustees are experienced executives who meet periodically throughout the year to oversee the fund's activities, review contractual arrangements with companies that provide services to the fund, oversee management of the risks associated with such activities and contractual arrangements, and review the fund's performance. Except for Jonathan Chiel, each of the Trustees oversees 322 funds. Mr. Chiel oversees 191 funds.
The Trustees hold office without limit in time except that (a) any Trustee may resign; (b) any Trustee may be removed by written instrument, signed by at least two-thirds of the number of Trustees prior to such removal; (c) any Trustee who requests to be retired or who has become incapacitated by illness or injury may be retired by written instrument signed by a majority of the other Trustees; and (d) any Trustee may be removed at any special meeting of shareholders by a two-thirds vote of the outstanding voting securities of the trust. Each Trustee who is not an interested person (as defined in the 1940 Act) of the trust and the fund is referred to herein as an Independent Trustee. Each Independent Trustee shall retire not later than the last day of the calendar year in which his or her 75th birthday occurs. The Independent Trustees may waive this mandatory retirement age policy with respect to individual Trustees. Officers and Advisory Board Members hold office without limit in time, except that any officer or Advisory Board Member may resign or may be removed by a vote of a majority of the Trustees at any regular meeting or any special meeting of the Trustees. Except as indicated, each individual has held the office shown or other offices in the same company for the past five years.
The fund's Statement of Additional Information (SAI) includes more information about the Trustees. To request a free copy, call Fidelity at 1-800-544-8544 if you're an individual investing directly with Fidelity, call 1-800-835-5092 if you're a plan sponsor or participant with Fidelity as your recordkeeper or call 1-877-208-0098 on institutional accounts or if you're an advisor or invest through one.
Experience, Skills, Attributes, and Qualifications of the Trustees. The Governance and Nominating Committee has adopted a statement of policy that describes the experience, qualifications, attributes, and skills that are necessary and desirable for potential Independent Trustee candidates (Statement of Policy). The Board believes that each Trustee satisfied at the time he or she was initially elected or appointed a Trustee, and continues to satisfy, the standards contemplated by the Statement of Policy. The Governance and Nominating Committee also engages professional search firms to help identify potential Independent Trustee candidates who have the experience, qualifications, attributes, and skills consistent with the Statement of Policy. From time to time, additional criteria based on the composition and skills of the current Independent Trustees, as well as experience or skills that may be appropriate in light of future changes to board composition, business conditions, and regulatory or other developments, have also been considered by the professional search firms and the Governance and Nominating Committee. In addition, the Board takes into account the Trustees' commitment and participation in Board and committee meetings, as well as their leadership of standing and ad hoc committees throughout their tenure.
In determining that a particular Trustee was and continues to be qualified to serve as a Trustee, the Board has considered a variety of criteria, none of which, in isolation, was controlling. The Board believes that, collectively, the Trustees have balanced and diverse experience, qualifications, attributes, and skills, which allow the Board to operate effectively in governing the fund and protecting the interests of shareholders. Information about the specific experience, skills, attributes, and qualifications of each Trustee, which in each case led to the Board's conclusion that the Trustee should serve (or continue to serve) as a trustee of the fund, is provided below.
Board Structure and Oversight Function. Robert A. Lawrence is an interested person and currently serves as Chair. The Trustees have determined that an interested Chair is appropriate and benefits shareholders because an interested Chair has a personal and professional stake in the quality and continuity of services provided to the fund. Independent Trustees exercise their informed business judgment to appoint an individual of their choosing to serve as Chair, regardless of whether the Trustee happens to be independent or a member of management. The Independent Trustees have determined that they can act independently and effectively without having an Independent Trustee serve as Chair and that a key structural component for assuring that they are in a position to do so is for the Independent Trustees to constitute a substantial majority for the Board. The Independent Trustees also regularly meet in executive session. David M. Thomas serves as Lead Independent Trustee and as such (i) acts as a liaison between the Independent Trustees and management with respect to matters important to the Independent Trustees and (ii) with management prepares agendas for Board meetings.
Fidelity® funds are overseen by different Boards of Trustees. The fund's Board oversees Fidelity's high income and certain equity funds, and other Boards oversee Fidelity's alternative investment, investment-grade bond, money market, asset allocation, and other equity funds. The asset allocation funds may invest in Fidelity® funds overseen by the fund's Board. The use of separate Boards, each with its own committee structure, allows the Trustees of each group of Fidelity® funds to focus on the unique issues of the funds they oversee, including common research, investment, and operational issues. On occasion, the separate Boards establish joint committees to address issues of overlapping consequences for the Fidelity® funds overseen by each Board.
The Trustees operate using a system of committees to facilitate the timely and efficient consideration of all matters of importance to the Trustees, the fund, and fund shareholders and to facilitate compliance with legal and regulatory requirements and oversight of the fund's activities and associated risks. The Board, acting through its committees, has charged FMR and its affiliates with (i) identifying events or circumstances the occurrence of which could have demonstrably adverse effects on the fund's business and/or reputation; (ii) implementing processes and controls to lessen the possibility that such events or circumstances occur or to mitigate the effects of such events or circumstances if they do occur; and (iii) creating and maintaining a system designed to evaluate continuously business and market conditions in order to facilitate the identification and implementation processes described in (i) and (ii) above. Because the day-to-day operations and activities of the fund are carried out by or through FMR, its affiliates, and other service providers, the fund's exposure to risks is mitigated but not eliminated by the processes overseen by the Trustees. While each of the Board's committees has responsibility for overseeing different aspects of the fund's activities, oversight is exercised primarily through the Operations, Audit, and Compliance Committees. Appropriate personnel, including but not limited to the fund's Chief Compliance Officer (CCO), FMR's internal auditor, the independent accountants, the fund's Treasurer and portfolio management personnel, make periodic reports to the Board's committees, as appropriate, including an annual review of Fidelity's risk management program for the Fidelity® funds. The responsibilities of each standing committee, including their oversight responsibilities, are described further under "Standing Committees of the Trustees."
Interested Trustees*:
Correspondence intended for a Trustee who is an interested person may be sent to Fidelity Investments, 245 Summer Street, Boston, Massachusetts 02210.
Name, Year of Birth; Principal Occupations and Other Relevant Experience+
Jonathan Chiel (1957)
Year of Election or Appointment: 2016
Trustee
Mr. Chiel also serves as Trustee of other Fidelity® funds. Mr. Chiel is General Counsel (2012-present) and Head of Legal, Risk and Compliance (2022-present). Mr Chiel serves as Executive Vice President and General Counsel for FMR LLC (diversified financial services company, 2012-present) and Director and President for OH Company LLC (holding company, 2018-present). Previously, Mr. Chiel served as general counsel (2004-2012) and senior vice president and deputy general counsel (2000-2004) for John Hancock Financial Services; a partner with Choate, Hall & Stewart (1996-2000) (law firm); and an Assistant United States Attorney for the United States Attorney's Office of the District of Massachusetts (1986-95), including Chief of the Criminal Division (1993-1995). Mr. Chiel is a director on the boards of the Boston Bar Foundation and the Maimonides School.
Bettina Doulton (1964)
Year of Election or Appointment: 2021
Trustee
Ms. Doulton also serves as Trustee of other Fidelity® funds. Prior to her retirement, Ms. Doulton served in a variety of positions at Fidelity Investments, including as a managing director of research (2006-2007), portfolio manager to certain Fidelity® funds (1993-2005), equity analyst and portfolio assistant (1990-1993), and research assistant (1987-1990). Ms. Doulton currently owns and operates Phi Builders + Architects and Cellardoor Winery. Previously, Ms. Doulton served as a member of the Board of Brown Capital Management, LLC (2014-2018).
Robert A. Lawrence (1952)
Year of Election or Appointment: 2020
Trustee
Chair of the Board of Trustees
Mr. Lawrence also serves as Trustee of other funds. Previously, Mr. Lawrence served as a Trustee and Member of the Advisory Board of certain funds. Prior to his retirement in 2008, Mr. Lawrence served as Vice President of certain Fidelity® funds (2006-2008), Senior Vice President, Head of High Income Division of Fidelity Management & Research Company (investment adviser firm, 2006-2008), and President of Fidelity Strategic Investments (investment adviser firm, 2002-2005).
* Determined to be an "Interested Trustee" by virtue of, among other things, his or her affiliation with the trust or various entities under common control with FMR.
+ The information includes the Trustee's principal occupation during the last five years and other information relating to the experience, attributes, and skills relevant to the Trustee's qualifications to serve as a Trustee, which led to the conclusion that the Trustee should serve as a Trustee for the fund.
Independent Trustees:
Correspondence intended for an Independent Trustee may be sent to Fidelity Investments, P.O. Box 55235, Boston, Massachusetts 02205-5235.
Name, Year of Birth; Principal Occupations and Other Relevant Experience+
Thomas P. Bostick (1956)
Year of Election or Appointment: 2021
Trustee
Lieutenant General Bostick also serves as Trustee of other Fidelity® funds. Prior to his retirement, General Bostick (United States Army, Retired) held a variety of positions within the U.S. Army, including Commanding General and Chief of Engineers, U.S. Army Corps of Engineers (2012-2016) and Deputy Chief of Staff and Director of Human Resources, U.S. Army (2009-2012). General Bostick currently serves as a member of the Board and Finance and Governance & Sustainability Committees of CSX Corporation (transportation, 2020-present) and a member of the Board and Corporate Governance and Nominating Committee of Perma-Fix Environmental Services, Inc. (nuclear waste management, 2020-present). General Bostick serves as Chief Executive Officer of Bostick Global Strategies, LLC (consulting, 2016-present), as a member of the Board of HireVue, Inc. (video interview and assessment, 2020-present), as a member of the Board of Allonnia (biotechnology and engineering solutions, 2022-present) and on the Advisory Board of Solugen, Inc. (specialty bio-based chemicals manufacturer, 2022-present). Previously, General Bostick served as a Member of the Advisory Board of certain Fidelity® funds (2021), President, Intrexon Bioengineering (2018-2020) and Chief Operating Officer (2017-2020) and Senior Vice President of the Environment Sector (2016-2017) of Intrexon Corporation (biopharmaceutical company).
Dennis J. Dirks (1948)
Year of Election or Appointment: 2005
Trustee
Mr. Dirks also serves as Trustee of other Fidelity® funds. Prior to his retirement in May 2003, Mr. Dirks served as Chief Operating Officer and as a member of the Board of The Depository Trust & Clearing Corporation (financial markets infrastructure), President, Chief Operating Officer and a member of the Board of The Depository Trust Company (DTC), President and a member of the Board of the National Securities Clearing Corporation (NSCC), Chief Executive Officer and a member of the Board of the Government Securities Clearing Corporation and Chief Executive Officer and a member of the Board of the Mortgage-Backed Securities Clearing Corporation. Mr. Dirks currently serves as a member of the Finance Committee (2016-present) and Board (2017-present) and is Treasurer (2018-present) of the Asolo Repertory Theatre.
Donald F. Donahue (1950)
Year of Election or Appointment: 2018
Trustee
Mr. Donahue also serves as Trustee of other Fidelity® funds. Mr. Donahue serves as President and Chief Executive Officer of Miranda Partners, LLC (risk consulting for the financial services industry, 2012-present). Previously, Mr. Donahue served as Chief Executive Officer (2006-2012), Chief Operating Officer (2003-2006) and Managing Director, Customer Marketing and Development (1999-2003) of The Depository Trust & Clearing Corporation (financial markets infrastructure). Mr. Donahue currently serves as a member (2007-present) and Co-Chairman (2016-present) of the Board of United Way of New York. Mr. Donahue previously served as a member of the Advisory Board of certain Fidelity® funds (2015-2018) and as a member of the Board of The Leadership Academy (previously NYC Leadership Academy) (2012-2022).
Vicki L. Fuller (1957)
Year of Election or Appointment: 2020
Trustee
Ms. Fuller also serves as Trustee of other Fidelity® funds. Previously, Ms. Fuller served as a member of the Advisory Board of certain Fidelity® funds (2018-2020), Chief Investment Officer of the New York State Common Retirement Fund (2012-2018) and held a variety of positions at AllianceBernstein L.P. (global asset management, 1985-2012), including Managing Director (2006-2012) and Senior Vice President and Senior Portfolio Manager (2001-2006). Ms. Fuller currently serves as a member of the Board, Audit Committee and Nominating and Governance Committee of two Blackstone business development companies (2020-present), as a member of the Board of Treliant, LLC (consulting, 2019-present), as a member of the Board of Ariel Alternatives, LLC (private equity, 2022-present) and as a member of the Board and Chair of the Audit Committee of Gusto, Inc. (software, 2021-present). In addition, Ms. Fuller currently serves as a member of the Board of Roosevelt University (2019-present) and as a member of the Executive Board of New York University's Stern School of Business. Ms. Fuller previously served as a member of the Board, Audit Committee and Nominating and Governance Committee of The Williams Companies, Inc. (natural gas infrastructure, 2018-2021).
Patricia L. Kampling (1959)
Year of Election or Appointment: 2020
Trustee
Ms. Kampling also serves as Trustee of other Fidelity® funds. Prior to her retirement, Ms. Kampling served as Chairman of the Board and Chief Executive Officer (2012-2019), President and Chief Operating Officer (2011-2012) and Executive Vice President and Chief Financial Officer (2010-2011) of Alliant Energy Corporation. Ms. Kampling currently serves as a member of the Board, Finance Committee and Governance, Compensation and Nominating Committee of Xcel Energy Inc. (utilities company, 2020-present) and as a member of the Board, Audit, Finance and Risk Committee and Safety, Environmental, Technology and Operations Committee and Chair of the Executive Development and Compensation Committee of American Water Works Company, Inc. (utilities company, 2019-present). In addition, Ms. Kampling currently serves as a member of the Board of the Nature Conservancy, Wisconsin Chapter (2019-present). Previously, Ms. Kampling served as a Member of the Advisory Board of certain Fidelity® funds (2020), a member of the Board, Compensation Committee and Executive Committee and Chair of the Audit Committee of Briggs & Stratton Corporation (manufacturing, 2011-2021), a member of the Board of Interstate Power and Light Company (2012-2019) and Wisconsin Power and Light Company (2012-2019) (each a subsidiary of Alliant Energy Corporation) and as a member of the Board and Workforce Development Committee of the Business Roundtable (2018-2019).
Thomas A. Kennedy (1955)
Year of Election or Appointment: 2021
Trustee
Mr. Kennedy also serves as Trustee of other Fidelity® funds. Previously, Mr. Kennedy served as a Member of the Advisory Board of certain Fidelity® funds (2020) and held a variety of positions at Raytheon Company (aerospace and defense, 1983-2020), including Chairman and Chief Executive Officer (2014-2020) and Executive Vice President and Chief Operating Officer (2013-2014). Mr. Kennedy served as Executive Chairman of the Board of Directors of Raytheon Technologies Corporation (aerospace and defense, 2020-2021). Mr. Kennedy serves as a Director of the Board of Directors of Textron Inc. (aerospace and defense, 2023-present).
Oscar Munoz (1959)
Year of Election or Appointment: 2021
Trustee
Mr. Munoz also serves as Trustee of other Fidelity® funds. Prior to his retirement, Mr. Munoz served as Executive Chairman (2020-2021), Chief Executive Officer (2015-2020), President (2015-2016) and a member of the Board (2010-2021) of United Airlines Holdings, Inc. Mr. Munoz currently serves as a member of the Board of CBRE Group, Inc. (commercial real estate, 2020-present), a member of the Board of Univision Communications, Inc. (Hispanic media, 2020-present), a member of the Board of Archer Aviation Inc. (2021-present), a member of the Defense Business Board of the United States Department of Defense (2021-present) and a member of the Board of Salesforce.com, Inc. (cloud-based software, 2022-present). Previously, Mr. Munoz served as a Member of the Advisory Board of certain Fidelity® funds (2021).
David M. Thomas (1949)
Year of Election or Appointment: 2008
Trustee
Lead Independent Trustee
Mr. Thomas also serves as Trustee of other Fidelity® funds. Previously, Mr. Thomas served as Executive Chairman (2005-2006) and Chairman and Chief Executive Officer (2000-2005) of IMS Health, Inc. (pharmaceutical and healthcare information solutions). Mr. Thomas currently serves as a member of the Board of Fortune Brands Home and Security (home and security products, 2004-present) and as Director (2013-present) and Non-Executive Chairman of the Board (2022-present) of Interpublic Group of Companies, Inc. (marketing communication).
Susan Tomasky (1953)
Year of Election or Appointment: 2020
Trustee
Ms. Tomasky also serves as Trustee of other Fidelity® funds. Prior to her retirement, Ms. Tomasky served in various executive officer positions at American Electric Power Company, Inc. (1998-2011), including most recently as President of AEP Transmission (2007-2011). Ms. Tomasky currently serves as a member of the Board and Sustainability Committee and as Chair of the Audit Committee of Marathon Petroleum Corporation (2018-present) and as a member of the Board, Executive Committee, Corporate Governance Committee and Organization and Compensation Committee and as Lead Director of the Board of Public Service Enterprise Group, Inc. (utilities company, 2012-present) and as a member of the Board of its subsidiary company, Public Service Electric and Gas Co. (2021-present). In addition, Ms. Tomasky currently serves as a member (2009-present) and President (2020-present) of the Board of the Royal Shakespeare Company - America (2009-present), as a member of the Board of the Columbus Association for the Performing Arts (2011-present) and as a member of the Board and Kenyon in the World Committee of Kenyon College (2016-present). Previously, Ms. Tomasky served as a Member of the Advisory Board of certain Fidelity® funds (2020), as a member of the Board of the Columbus Regional Airport Authority (2007-2020), as a member of the Board (2011-2018) and Lead Independent Director (2015-2018) of Andeavor Corporation (previously Tesoro Corporation) (independent oil refiner and marketer) and as a member of the Board of Summit Midstream Partners LP (energy, 2012-2018).
Michael E. Wiley (1950)
Year of Election or Appointment: 2020
Trustee
Mr. Wiley also serves as Trustee of other Fidelity® funds. Previously, Mr. Wiley served as a member of the Advisory Board of certain Fidelity® funds (2018-2020), Chairman, President and CEO of Baker Hughes, Inc. (oilfield services, 2000-2004). Mr. Wiley also previously served as a member of the Board of Andeavor Corporation (independent oil refiner and marketer, 2005-2018), a member of the Board of Andeavor Logistics LP (natural resources logistics, 2015-2018) and a member of the Board of High Point Resources (exploration and production, 2005-2020).
+ The information includes the Trustee's principal occupation during the last five years and other information relating to the experience, attributes, and skills relevant to the Trustee's qualifications to serve as a Trustee, which led to the conclusion that the Trustee should serve as a Trustee for the fund.
Advisory Board Members and Officers:
Correspondence intended for a Member of the Advisory Board (if any) may be sent to Fidelity Investments, P.O. Box 55235, Boston, Massachusetts 02205-5235. Correspondence intended for an officer or Peter S. Lynch may be sent to Fidelity Investments, 245 Summer Street, Boston, Massachusetts 02210.
Name, Year of Birth; Principal Occupation
Vijay C. Advani (1960)
Year of Election or Appointment: 2023
Member of the Advisory Board
Mr. Advani also serves as Trustee or Member of the Advisory Board of other funds. Previously, Mr. Advani served as Executive Chairman (2020-2022), Chief Executive Officer (2017-2020) and Chief Operating Officer (2016-2017) of Nuveen (global investment manager). He also served in various capacities at Franklin Resources (global investment manager), including Co-President (2015-2016), Executive Vice President, Global Advisory Services (2008-2015), Head of Global Retail Distribution (2005-2008), Executive Managing Director, International Retail Development (2002-2005), Managing Director, Product Developments, Sales & Marketing, Asia, Eastern Europe and Africa (2000-2002) and President, Templeton Asset Management India (1995-2000). Mr. Advani also served as Senior Investment Officer of International Finance Corporation (private equity and venture capital arm of The World Bank, 1984-1995). Mr. Advani is Chairman Emeritus of the U.S. India Business Council (2018-present), a Director of The Global Impact Investing Network (2019-present), a Director of LOK Capital (Mauritius) (2022-present), a member of the Advisory Council of LOK Capital (2022-present), a Senior Advisor of Neuberger Berman (2021-present), a Senior Advisor of Seviora Holdings Pte. Ltd (Temasek-Singapore) (2021-present), a Director of Seviora Capital (Singapore) (2021-present) and an Advisor of EQUIAM (2021-present). Mr. Advani formerly served as a member of the Board of BowX Acquisition Corp. (special purpose acquisition company, 2020-2021), a member of the Board of Intellecap (advisory arm of The Aavishkaar Group, 2018-2020), a member of the Board of Nuveen Investments, Inc. (2017-2020) and a member of the Board of Docusign (software, 2016-2019).
Peter S. Lynch (1944)
Year of Election or Appointment: 2003
Member of the Advisory Board
Mr. Lynch also serves as a Member of the Advisory Board of other Fidelity® funds. Mr. Lynch is Vice Chairman and a Director of Fidelity Management & Research Company LLC (investment adviser firm). In addition, Mr. Lynch serves as a Trustee of Boston College and as the Chairman of the Inner-City Scholarship Fund. Previously, Mr. Lynch served as Vice Chairman and a Director of FMR Co., Inc. (investment adviser firm) and on the Special Olympics International Board of Directors (1997-2006).
Karen B. Peetz (1955)
Year of Election or Appointment: 2023
Member of the Advisory Board
Ms. Peetz also serves as a Member of the Advisory Board of other funds. Previously, Ms. Peetz served as Chief Administration Officer (2020-2023) of Citigroup Inc. (a diversified financial service company). She also served in various capacities at Bank of New York Mellon Corporation, including President (2013-2016), Vice Chairman, Senior Executive Vice President and Chief Executive Officer of Financial Markets & Treasury Services (2010-2013), Senior Executive Vice President and Chief Executive Officer of Global Corporate Trust (2003-2008), Senior Vice President and Division Manager of Global Payments & Trade Services (2002-2003) and Senior Vice President and Division Manager of Domestic Corporate Trust (1998-2002). Ms. Peetz also served in various capacities at Chase Manhattan Corporation (1982-1998), including Senior Vice President and Manager of Corporate Trust International Business (1996-1998), Managing Director and Manager of Corporate Trust Services (1994-1996) and Managing Director and Group Manager of Financial Institution Sales (1990-1993). Ms. Peetz currently serves as Chair of Amherst Holdings Advisory Council (2018-present), Trustee of Johns Hopkins University (2016-present), Chair of the Carey Business School Advisory Council, Member of the Johns Hopkins Medicine Board and Finance Committee and Chair of the Lyme and Tick Related Disease Institute Advisory Council. Ms. Peetz previously served as a member of the Board of Guardian Life Insurance Company of America (2019-2023), a member of the Board of Trane Technologies (2018-2022), a member of the Board of Wells Fargo Corp. (2017-2019), a member of the Board of SunCoke Energy Inc. (2012-2016), a member of the Board of Private Export Funding Corporation (2010-2016) and as a Trustee of Penn State University (2010-2014) and the United Way of New York City (2008-2010).
Heather Bonner (1977)
Year of Election or Appointment: 2023
Assistant Treasurer
Ms. Bonner also serves as an officer of other funds. Ms. Bonner is a Senior Vice President (2022-present) and is an employee of Fidelity Investments (2022-present). Ms. Bonner serves as Vice President, Treasurer, or Assistant Treasurer of certain Fidelity entities. Prior to joining Fidelity, Ms. Bonner served as Managing Director at AQR Capital Management (2013-2022) and was the Treasurer and Principal Financial Officer of the AQR Funds (2013-2022).
Craig S. Brown (1977)
Year of Election or Appointment: 2022
Deputy Treasurer
Mr. Brown also serves as an officer of other funds. Mr. Brown is a Vice President (2015-present) and is an employee of Fidelity Investments. Mr. Brown serves as Assistant Treasurer of FIMM, LLC (2021-present). Previously, Mr. Brown served as Assistant Treasurer of certain Fidelity® funds (2019-2022).
John J. Burke III (1964)
Year of Election or Appointment: 2018
Chief Financial Officer
Mr. Burke also serves as Chief Financial Officer of other funds. Mr. Burke is Head of Fidelity Fund and Investment Operations (2018-present) and is an employee of Fidelity Investments. Mr. Burke serves as President, Executive Vice President, or Director of certain Fidelity entities. Previously Mr. Burke served as head of Asset Management Investment Operations (2012-2018).
Margaret Carey (1973)
Year of Election or Appointment: 2023
Secretary and Chief Legal Officer (CLO)
Ms. Carey also serves as an officer of other funds and as CLO of certain Fidelity entities. Ms. Carey is a Senior Vice President, Deputy General Counsel (2019-present) and is an employee of Fidelity Investments.
William C. Coffey (1969)
Year of Election or Appointment: 2019
Assistant Secretary
Mr. Coffey also serves as Assistant Secretary of other funds. Mr. Coffey is a Senior Vice President, Deputy General Counsel (2010-present) and is an employee of Fidelity Investments. Previously, Mr. Coffey served as Secretary and CLO of certain funds (2018-2019); CLO, Secretary, or Senior Vice President of certain Fidelity entities and Assistant Secretary of certain funds (2009-2018).
Timothy M. Cohen (1969)
Year of Election or Appointment: 2018
Vice President
Mr. Cohen also serves as Vice President of other funds. Mr. Cohen is Co-Head of Equity (2018-present) and is an employee of Fidelity Investments. Mr. Cohen serves a Director of Fidelity Management & Research (Japan) Limited (investment adviser firm, 2016-present). Previously, Mr. Cohen served as Executive Vice President of Fidelity SelectCo, LLC (2019) and Head of Global Equity Research (2016-2018).
Jonathan Davis (1968)
Year of Election or Appointment: 2010
Assistant Treasurer
Mr. Davis also serves as an officer of other funds. Mr. Davis is a Vice President (2006-present) and is an employee of Fidelity Investments. Mr. Davis serves as Assistant Treasurer of certain Fidelity entities.
Laura M. Del Prato (1964)
Year of Election or Appointment: 2018
Assistant Treasurer
Ms. Del Prato also serves as an officer of other funds. Ms. Del Prato is a Senior Vice President (2017-present) and is an employee of Fidelity Investments. Ms. Del Prato serves as Vice President or Assistant Treasurer of certain Fidelity entities. Previously, Ms. Del Prato served as President and Treasurer of The North Carolina Capital Management Trust: Cash Portfolio and Term Portfolio (2018-2020).
Colm A. Hogan (1973)
Year of Election or Appointment: 2020
Assistant Treasurer
Mr. Hogan also serves as an officer of other funds. Mr. Hogan is a Vice President (2016-present) and is an employee of Fidelity Investments. Mr. Hogan serves as Assistant Treasurer of certain Fidelity entities. Previously, Mr. Hogan served as Deputy Treasurer of certain Fidelity® funds (2016-2020) and Assistant Treasurer of certain Fidelity® funds (2016-2018).
Pamela R. Holding (1964)
Year of Election or Appointment: 2018
Vice President
Ms. Holding also serves as Vice President of other funds. Ms. Holding is Co-Head of Equity (2018-present) and is an employee of Fidelity Investments. Previously, Ms. Holding served as Executive Vice President of Fidelity SelectCo, LLC (2019) and as Chief Investment Officer of Fidelity Institutional Asset Management (2013-2018).
Chris Maher (1972)
Year of Election or Appointment: 2020
Deputy Treasurer
Mr. Maher also serves as an officer of other funds. Mr. Maher is a Vice President (2008-present) and is an employee of Fidelity Investments. Mr. Maher serves as Assistant Treasurer of certain Fidelity entities. Previously, Mr. Maher served as Assistant Treasurer of certain funds (2013-2020).
Jason P. Pogorelec (1975)
Year of Election or Appointment: 2020
Chief Compliance Officer
Mr. Pogorelec also serves as Chief Compliance Officer of other funds. Mr. Pogorelec is a Senior Vice President of Asset Management Compliance (2020-present) and is an employee of Fidelity Investments. Mr. Pogorelec serves as Compliance Officer of Fidelity Management & Research Company LLC (investment adviser firm, 2023-present) and Ballyrock Investment Advisors LLC (2023-present). Previously, Mr. Pogorelec served as a Vice President, Associate General Counsel for Fidelity Investments (2010-2020) and Assistant Secretary of certain Fidelity® funds (2015-2020).
Brett Segaloff (1972)
Year of Election or Appointment: 2021
Anti-Money Laundering (AML) Officer
Mr. Segaloff also serves as AML Officer of other funds. Mr. Segaloff is a Vice President (2022-present) and is an employee of Fidelity Investments. Mr. Segaloff serves as Anti Money Laundering Compliance Officer or Anti Money Laundering/Bank Secrecy Act Compliance Officer of certain Fidelity entities.
Stacie M. Smith (1974)
Year of Election or Appointment: 2016
President and Treasurer
Ms. Smith also serves as an officer of other funds. Ms. Smith is a Senior Vice President (2016-present) and is an employee of Fidelity Investments. Ms. Smith serves as Assistant Treasurer of certain Fidelity entities and has served in other fund officer roles.
Jim Wegmann (1979)
Year of Election or Appointment: 2019
Assistant Treasurer
Mr. Wegmann also serves as an officer of other funds. Mr. Wegmann is a Vice President (2016-present) and is an employee of Fidelity Investments. Mr. Wegmann serves as Assistant Treasurer of FIMM, LLC (2021-present). Previously, Mr. Wegmann served as Assistant Treasurer of certain Fidelity® funds (2019-2021).
As a shareholder, you incur two types of costs: (1) transaction costs, which may include sales charges (loads) on purchase payments or redemption proceeds, as applicable and (2) ongoing costs, which generally include management fees, distribution and/or service (12b-1) fees and other Fund expenses. This Example is intended to help you understand your ongoing costs (in dollars) of investing in a fund and to compare these costs with the ongoing costs of investing in other mutual funds.
| The Example is based on an investment of $1,000 invested at the beginning of the period and held for the entire period (May 1, 2023 to October 31, 2023). |
Actual Expenses
The first line of the accompanying table provides information about actual account values and actual expenses. You may use the information in this line, together with the amount you invested, to estimate the expenses that you paid over the period. Simply divide your account value by $1,000.00 (for example, an $8,600 account value divided by $1,000.00 = 8.6), then multiply the result by the number in the first line for a class/Fund under the heading entitled "Expenses Paid During Period" to estimate the expenses you paid on your account during this period. If any fund is a shareholder of any underlying mutual funds or exchange-traded funds (ETFs) (the Underlying Funds), such fund indirectly bears its proportional share of the expenses of the Underlying Funds in addition to the direct expenses incurred presented in the table. These fees and expenses are not included in the annualized expense ratio used to calculate the expense estimate in the table below.
Hypothetical Example for Comparison Purposes
The second line of the accompanying table provides information about hypothetical account values and hypothetical expenses based on the actual expense ratio and an assumed rate of return of 5% per year before expenses, which is not the actual return. The hypothetical account values and expenses may not be used to estimate the actual ending account balance or expenses you paid for the period. You may use this information to compare the ongoing costs of investing in the Fund and other funds. To do so, compare this 5% hypothetical example with the 5% hypothetical examples that appear in the shareholder reports of the other funds. If any fund is a shareholder of any Underlying Funds, such fund indirectly bears its proportional share of the expenses of the Underlying Funds in addition to the direct expenses as presented in the table. These fees and expenses are not included in the annualized expense ratio used to calculate the expense estimate in the table below.
Please note that the expenses shown in the table are meant to highlight your ongoing costs only and do not reflect any transaction costs. Therefore, the second line of the table is useful in comparing ongoing costs only, and will not help you determine the relative total costs of owning different funds. In addition, if these transactional costs were included, your costs would have been higher.
| | | | | Annualized Expense Ratio- A | | Beginning Account Value May 1, 2023 | | Ending Account Value October 31, 2023 | | Expenses Paid During Period- C May 1, 2023 to October 31, 2023 |
| Fidelity® International Small Cap Fund | | | | | | | | | | |
| Class A | | | | 1.47% | | | | | | |
| Actual | | | | | | $ 1,000 | | $ 935.80 | | $ 7.17 |
Hypothetical-B | | | | | | $ 1,000 | | $ 1,017.80 | | $ 7.48 |
| Class M | | | | 1.74% | | | | | | |
| Actual | | | | | | $ 1,000 | | $ 934.50 | | $ 8.48 |
Hypothetical-B | | | | | | $ 1,000 | | $ 1,016.43 | | $ 8.84 |
| Class C | | | | 2.24% | | | | | | |
| Actual | | | | | | $ 1,000 | | $ 932.40 | | $ 10.91 |
Hypothetical-B | | | | | | $ 1,000 | | $ 1,013.91 | | $ 11.37 |
| Fidelity® International Small Cap Fund | | | | 1.21% | | | | | | |
| Actual | | | | | | $ 1,000 | | $ 936.90 | | $ 5.91 |
Hypothetical-B | | | | | | $ 1,000 | | $ 1,019.11 | | $ 6.16 |
| Class I | | | | 1.20% | | | | | | |
| Actual | | | | | | $ 1,000 | | $ 937.00 | | $ 5.86 |
Hypothetical-B | | | | | | $ 1,000 | | $ 1,019.16 | | $ 6.11 |
| Class Z | | | | 1.07% | | | | | | |
| Actual | | | | | | $ 1,000 | | $ 937.90 | | $ 5.23 |
Hypothetical-B | | | | | | $ 1,000 | | $ 1,019.81 | | $ 5.45 |
| |
A Annualized expense ratio reflects expenses net of applicable fee waivers.
B 5% return per year before expenses
C Expenses are equal to the annualized expense ratio, multiplied by the average account value over the period, multiplied by 184/ 365 (to reflect the one-half year period). The fees and expenses of any Underlying Funds are not included in each annualized expense ratio.
The dividend and capital gains distributions for the fund(s) are available on Fidelity.com or Institutional.Fidelity.com.
The fund designates $24,106 of distributions paid during the fiscal year ended 2023 as qualifying to be taxed as section 163(j) interest dividends.
Class A, Class M, International Small Cap, Class I, and Class Z designate 100% of the dividends distributed during the fiscal year as amounts which may be taken into account as a dividend for purposes of the maximum rate under section 1(h)(11) of the Internal Revenue Code.
The amounts per share which represent income derived from sources within, and taxes paid to, foreign countries or possessions of the United States are as follows:
| | Pay Date | Income | Taxes |
| Insert Fund Name | | | |
| Class A | 12/12/2022 | $0.2209 | $0.1099 |
| Class M | 12/12/2022 | $0.1449 | $0.1099 |
| Class C | 12/12/2022 | $0.0000 | $0.0000 |
| International Small Cap | 12/12/2022 | $0.2969 | $0.1099 |
| Class I | 12/12/2022 | $0.2919 | $0.1099 |
| Class Z | 12/12/2022 | $0.3329 | $0.1099 |
The fund will notify shareholders in January 2024 of amounts for use in preparing 2023 income tax returns.
Board Approval of Investment Advisory Contracts and Management Fees
Fidelity International Small Cap Fund
Each year, the Board of Trustees, including the Independent Trustees (together, the Board), considers the renewal of the fund's management contract with Fidelity Management & Research Company LLC (FMR) and the sub-advisory agreements (together, the Advisory Contracts) for the fund. FMR and the sub-advisers are referred to herein as the Investment Advisers. The Board, assisted by the advice of fund counsel and Independent Trustees' counsel, requests and considers a broad range of information relevant to the renewal of the Advisory Contracts throughout the year.
The Board meets regularly and, at each of its meetings, covers an extensive agenda of topics and materials and considers factors that are relevant to its annual consideration of the renewal of the fund's Advisory Contracts, including the services and support provided to the fund and its shareholders. The Board, acting directly and through its Committees (each of which is composed of and chaired by Independent Trustees), requests and receives information concerning the annual consideration of the renewal of the fund's Advisory Contracts. The Board also meets as needed to review matters specifically related to the Board's annual consideration of the renewal of the Advisory Contracts. Members of the Board may also meet with trustees of other Fidelity funds through joint ad hoc committees to discuss certain matters relevant to all of the Fidelity funds.
Approval of Stub Period Continuation. At its May 2023 meeting, the Board of Trustees voted to continue the fund's management contract with FMR, and the sub-advisory agreements and sub-sub-advisory agreements, in each case, where applicable (together, the Advisory Contracts), without modification, for two months from June 1, 2023 through July 31, 2023. The Board considered that the approval of the fund's Advisory Contracts will not result in any changes in (i) the investment process or strategies employed in the management of the fund's assets; (ii) the fees and expenses paid by shareholders; (iii) the nature, extent or quality of services provided under the fund's Advisory Contracts; or (iv) the day-to-day management of the fund or the persons primarily responsible for such management. The Board also considered that since its last approval of the fund's Advisory Contracts, FMR had provided additional information on the fund in support of the annual contract renewal process, including competitive analyses on total expenses and management fees and in-depth reviews of fund performance and fund profitability information. The Board concluded that the fund's Advisory Contracts are fair and reasonable, and that the fund's Advisory Contracts should be renewed, without modification, through July 31, 2023, with the understanding that the Board would consider the annual renewal for a full one year period in July 2023.
At its July 2023 meeting, the Board unanimously determined to renew the fund's Advisory Contracts. In reaching its determination, the Board considered all factors it believed relevant, including (i) the nature, extent, and quality of the services provided to the fund and its shareholders (including the investment performance of the fund); (ii) the competitiveness relative to peer funds of the fund's management fee and the total expense ratio of a representative class (the retail class, which was selected because it was the largest class without 12b-1 fees); (iii) the total costs of the services provided by and the profits realized by FMR and its affiliates (Fidelity) from its relationships with the fund; and (iv) the extent to which, if any, economies of scale exist and are realized as the fund grows, and whether any economies of scale are appropriately shared with fund shareholders. The Board also considered the broad range of investment choices available to shareholders from FMR's competitors and that the fund's shareholders have chosen to invest in the fund, which is part of the Fidelity family of funds. The Board's decision to renew the Advisory Contracts was not based on any single factor.
The Board reached a determination, with the assistance of fund counsel and Independent Trustees' counsel and through the exercise of its business judgment, that the renewal of the Advisory Contracts was in the best interests of the fund and its shareholders and that the compensation payable under the Advisory Contracts was fair and reasonable in light of all of the surrounding circumstances.
Nature, Extent, and Quality of Services Provided. The Board considered staffing as it relates to the fund, including the backgrounds and experience of investment personnel of the Investment Advisers, and also considered the Investment Advisers' implementation of the fund's investment program. The Independent Trustees also had discussions with senior management of Fidelity's investment operations and investment groups. The Board considered the structure of the investment personnel compensation program and whether this structure provides appropriate incentives to act in the best interests of the fund. Additionally, the Board considered the portfolio managers' investments, if any, in the funds that they manage.
Resources Dedicated to Investment Management and Support Services. The Board and the Fund Oversight and Research Committees reviewed the general qualifications and capabilities of Fidelity's investment staff, including its size, education, experience, and resources, as well as Fidelity's approach to recruiting, training, managing, and compensating investment personnel. The Board noted the resources devoted to expansion of Fidelity's global investment organization, and that Fidelity's analysts have extensive resources, tools, and capabilities that allow them to conduct sophisticated quantitative and fundamental analysis, as well as credit analysis of issuers, counterparties and guarantors. Further, the Board considered that Fidelity's investment professionals have sufficient access to global information and data so as to provide competitive investment results over time, and that those professionals also have access to sophisticated tools that permit them to assess portfolio construction and risk and performance attribution characteristics continuously, as well as to transmit new information and research conclusions rapidly around the world. Additionally, in its deliberations, the Board considered Fidelity's trading, risk management, compliance, and technology and operations capabilities and resources, which are integral parts of the investment management process.
Shareholder and Administrative Services. The Board considered (i) the nature, extent, quality, and cost of advisory, administrative, and shareholder services performed by the Investment Advisers and their affiliates under the Advisory Contracts and under separate agreements covering transfer agency, pricing and bookkeeping, and securities lending services for the fund; (ii) the nature and extent of Fidelity's supervision of third party service providers, principally custodians, subcustodians, and pricing vendors; and (iii) the resources devoted by Fidelity to, and the record of compliance with, the fund's compliance policies and procedures. The Board also reviewed the allocation of fund brokerage, including allocations to brokers affiliated with the Investment Advisers, the use of brokerage commissions to pay fund expenses, and the use of "soft" commission dollars to pay for research services. The Board also considered the fund's securities lending activities and any payments made to Fidelity relating to securities lending.
The Board noted that the growth of fund assets over time across the complex allows Fidelity to reinvest in the development of services designed to enhance the value and convenience of the Fidelity funds as investment vehicles. These services include 24-hour access to account information and market information over the Internet and through telephone representatives, investor education materials, and asset allocation tools. The Board also considered that it reviews customer service metrics such as telephone response times, continuity of services on the website and metrics addressing services at Fidelity Investor Centers.
Investment in a Large Fund Family. The Board considered the benefits to shareholders of investing in a fund that is part of a large family of funds offering a variety of investment disciplines and providing a large variety of fund investor services. The Board noted that Fidelity had taken, or had made recommendations that resulted in the Fidelity funds taking, a number of actions over the previous year that benefited particular funds and/or the Fidelity funds in general.
Investment Performance. The Board took into account discussions that occur with representatives of the Investment Advisers, and reports that it receives, at Board meetings throughout the year, relating to fund investment performance. In this regard the Board noted that as part of regularly scheduled fund reviews and other reports to the Board on fund performance, the Board considered annualized return information for the fund for different time periods, measured against an appropriate securities market index (benchmark index) and an appropriate peer group of funds with similar objectives (peer group). The Board also considered information about performance attribution. In its ongoing evaluation of fund investment performance, the Board gives particular attention to information indicating changes in performance of the funds over different time periods and discussed with the Investment Advisers the reasons for any overperformance or underperformance.
In addition to reviewing absolute and relative fund performance, the Independent Trustees periodically consider the appropriateness of fund performance metrics in evaluating the results achieved. The Independent Trustees generally give greater weight to fund performance over longer time periods than over shorter time periods. Depending on the circumstances, the Independent Trustees may be satisfied with a fund's performance notwithstanding that it lags its benchmark index or peer group for certain periods.
Based on its review, the Board concluded that the nature, extent, and quality of services provided to the fund under the Advisory Contracts should continue to benefit the shareholders of the fund.
Competitiveness of Management Fee and Total Expense Ratio. The Board was provided with information regarding industry trends in management fees and expenses. In its review of the fund's management fee and the total expense ratio of the retail class, the Board considered the fund's management fee rate as well as other fund or class expenses, as applicable, such as transfer agent fees, pricing and bookkeeping fees, fund-paid 12b-1 fees, and custodial, legal, and audit fees. The Board noted that Fidelity may agree to waive fees or reimburse expenses from time to time, and the extent to which, if any, it has done so for the fund. The Board also considered information about the impact of the fund's performance adjustment.
Comparisons of Management Fees and Total Expense Ratios. Among other things, the Board reviewed data for selected groups of competitive funds and classes (referred to as "mapped groups") that were compiled by Fidelity based on combining similar investment objective categories (as classified by Lipper) that have comparable investment mandates. The data reviewed by the Board included (i) gross management fee comparisons (before taking into account expense reimbursements or caps and without taking into account the fund's performance adjustment) relative to the total universe of funds within the mapped group; (ii) gross management fee comparisons relative to a subset of non-Fidelity funds in the mapped group that are similar in size and management fee structure to the fund (referred to as the "asset size peer group"); (iii) total expense comparisons of the retail class of the fund relative to funds and classes in the mapped group that have a similar sales load structure to the retail class of the fund (referred to as the "similar sales load structure group"); and (iv) total expense comparisons of the retail class of the fund relative to funds and classes in the similar sales load structure group that are similar in size and management fee structure to the fund (referred to as the "total expense asset size peer group"). The total expense asset size peer group comparison excludes performance adjustments and fund-paid 12b-1 fees to eliminate variability in fee structures.
The information provided to the Board indicated that the fund's management fee rate ranked below the competitive median of the mapped group for the 12-month period ended September 30, 2022 and below the competitive median of the asset size peer group for the 12-month period ended September 30, 2022. Further, the information provided to the Board indicated that the total expense ratio of the retail class of the fund ranked below the competitive median of the similar sales load structure group for the 12-month period ended September 30, 2022 and below the competitive median of the total expense asset size peer group for the 12-month period ended September 30, 2022.
The Board also considered that, for funds subject to the group fee, FMR agreed to voluntarily waive fees over a specified period of time in amounts designed to account for assets converted from certain funds to certain collective investment trusts.
The Board also considered that the fund's management fee is subject to upward or downward adjustment depending upon whether, and to what extent, the fund's investment performance for the performance period (a rolling 36-month period) exceeds, or is exceeded by, a securities index, thus leading to a performance adjustment for the same period. The Board noted that the performance adjustment provides FMR with a strong economic incentive to seek to achieve superior long-term performance for the fund's shareholders and helps to more closely align the interests of FMR and the shareholders of the fund.
In connection with its consideration of the fund's performance adjustment, the Board noted that the performance of the retail class is used for purposes of determining the performance adjustment. The Board noted that to the extent the performance adjustment was based on the performance of a share class with higher total annual operating expenses, the fund would be subject to a smaller positive and larger negative performance adjustment. The Board considered the appropriateness of the use of the retail class as the basis for the performance adjustment. The Board noted that the retail class is typically the largest class (reflecting the actual investment experience for the plurality of shareholders), employs a standard expense structure, and does not include fund-paid 12b-1 fees, which Fidelity believes makes it a more appropriate measurement of Fidelity's investment skill.
Fees Charged to Other Fidelity Clients. The Board also considered Fidelity fee structures and other information with respect to clients of Fidelity, such as other funds advised or subadvised by Fidelity, pension plan clients, and other institutional clients with similar mandates. The Board noted that a joint ad hoc committee created by it and the boards of other Fidelity funds periodically reviews and compares Fidelity's institutional investment advisory business with its business of providing services to the Fidelity funds and also noted the most recent findings of the committee. The Board noted that the committee's review included a consideration of the differences in services provided, fees charged, and costs incurred, as well as competition in the markets serving the different categories of clients.
Based on its review, the Board concluded that the fund's management fee, including the use of the retail class as the basis for the performance adjustment, is fair and reasonable in light of the services that the fund receives and the other factors considered. Further, based on its review of total expense ratios and fees charged to other Fidelity clients, the Board concluded that the total expense ratio of each class of the fund was reasonable in light of the services that the fund and its shareholders receive and the other factors considered.
Costs of the Services and Profitability. The Board considered the revenues earned and the expenses incurred by Fidelity in conducting the business of developing, marketing, distributing, managing, administering and servicing the fund and servicing the fund's shareholders. The Board also considered the level of Fidelity's profits in respect of all the Fidelity funds.
On an annual basis, Fidelity presents to the Board information about the profitability of its relationships with the fund. Fidelity calculates profitability information for each fund, as well as aggregate profitability information for groups of Fidelity funds and all Fidelity funds, using a series of detailed revenue and cost allocation methodologies which originate with the books and records of Fidelity on which Fidelity's audited financial statements are based. The Audit Committee of the Board reviews any significant changes from the prior year's methodologies and the full Board approves such changes.
A public accounting firm has been engaged annually by the Board as part of the Board's assessment of Fidelity's profitability analysis. The engagement includes the review and assessment of the methodologies used by Fidelity in determining the revenues and expenses attributable to Fidelity's fund business, and completion of agreed-upon procedures in respect of the mathematical accuracy of certain fund profitability information and its conformity to established allocation methodologies. After considering the reports issued under the engagement and information provided by Fidelity, the Board concluded that while other allocation methods may also be reasonable, Fidelity's profitability methodologies are reasonable in all material respects.
The Board also reviewed Fidelity's non-fund businesses and potential indirect benefits such businesses may have received as a result of their association with Fidelity's fund business (i.e., fall-out benefits) as well as cases where Fidelity's affiliates may benefit from the funds' business. The Board considered areas where potential indirect benefits to the Fidelity funds from their relationships with Fidelity may exist. The Board's consideration of these matters was informed by the findings of a joint ad hoc committee created by it and the boards of other Fidelity funds to evaluate potential fall-out benefits.
The Board considered the costs of the services provided by and the profits realized by Fidelity in connection with the operation of the fund and was satisfied that the profitability was not excessive.
Economies of Scale. The Board considered whether there have been economies of scale in respect of the management of the Fidelity funds, whether the Fidelity funds (including the fund) have appropriately benefited from any such economies of scale, and whether there is potential for realization of any further economies of scale. The Board considered the extent to which the fund will benefit from economies of scale as assets grow through increased services to the fund, through waivers or reimbursements, or through fee or expense ratio reductions. The Board also noted that a committee (the Economies of Scale Committee) created by it and the boards of other Fidelity funds periodically analyzes whether Fidelity attains economies of scale in respect of the management and servicing of the Fidelity funds, whether the Fidelity funds have appropriately benefited from such economies of scale, and whether there is potential for realization of any further economies of scale.
The Board recognized that the fund's management contract incorporates a "group fee" structure, which provides for lower group fee rates as total "group assets" increase, and for higher group fee rates as total "group assets" decrease ("group assets" as defined in the management contract). FMR calculates the group fee rates based on a tiered asset "breakpoint" schedule that varies based on asset class. The Board considered that the group fee is designed to deliver the benefits of economies of scale to fund shareholders when total Fidelity fund assets increase, even if assets of any particular fund are unchanged or have declined, because some portion of Fidelity's costs are attributable to services provided to all Fidelity funds, and all funds benefit if those costs can be allocated among more assets. The Board further considered that Fidelity agreed to impose a temporary fee waiver in the form of additional breakpoints to the current breakpoint schedule. The Board concluded that, given the group fee structure, fund shareholders will benefit from lower management fees as "group assets" increase at the fund complex level, regardless of whether Fidelity achieves any such economies of scale.
The Board concluded, taking into account the analysis of the Economies of Scale Committee, that economies of scale, if any, are being appropriately shared between fund shareholders and Fidelity.
Additional Information Requested by the Board. In order to develop fully the factual basis for consideration of the Fidelity funds' advisory contracts, the Board requested and received additional information on certain topics, including: (i) fund flow and performance trends, in particular the underperformance of certain funds and strategies, and Fidelity's long-term strategies for certain funds, including any consideration of fund liquidations or mergers; (ii) the operation of performance fees and competitor use of performance fees; (iii) Fidelity's pricing philosophy compared to competitors; (iv) fund profitability methodology and data; (v) evaluation of competitive fund data and peer group classifications and fee and expense comparisons; (vi) the management fee and expense structures for different funds and classes and information about the differences between various fee and expense structures; (vii) group fee breakpoints and related voluntary fee waivers; and (viii) information regarding other accounts managed by Fidelity and the funds' sub-advisory arrangements.
Conclusion. Based on its evaluation of all of the conclusions noted above, and after considering all factors it believed relevant, the Board, including the Independent Trustees, concluded that the advisory and sub-advisory fee arrangements are fair and reasonable in light of all of the surrounding circumstances and that the fund's Advisory Contracts should be renewed through July 31, 2024.
1.793585.120
ISC-ANN-1223
Fidelity® SAI Sustainable Emerging Markets Equity Fund
Annual Report
October 31, 2023
Offered exclusively to certain clients of the Adviser, or its affiliates, including Strategic Advisers LLC (Strategic Advisers) - not available for sale to the general public. Fidelity® SAI is a product name of Fidelity® funds dedicated to certain programs affiliated with Strategic Advisers.
Contents
To view a fund's proxy voting guidelines and proxy voting record for the 12-month period ended June 30, visit http://www.fidelity.com/proxyvotingresults or visit the Securities and Exchange Commission's (SEC) web site at http://www.sec.gov.
You may also call 1-800-544-3455 to request a free copy of the proxy voting guidelines.
Standard & Poor's, S&P and S&P 500 are registered service marks of The McGraw-Hill Companies, Inc. and have been licensed for use by Fidelity Distributors Corporation.
Other third-party marks appearing herein are the property of their respective owners.
All other marks appearing herein are registered or unregistered trademarks or service marks of FMR LLC or an affiliated company. © 2023 FMR LLC. All rights reserved.
This report and the financial statements contained herein are submitted for the general information of the shareholders of the Fund. This report is not authorized for distribution to prospective investors in the Fund unless preceded or accompanied by an effective prospectus.
A fund files its complete schedule of portfolio holdings with the SEC for the first and third quarters of each fiscal year on Form N-PORT. Forms N-PORT are available on the SEC's web site at http://www.sec.gov. A fund's Forms N-PORT may be reviewed and copied at the SEC's Public Reference Room in Washington, DC. Information regarding the operation of the SEC's Public Reference Room may be obtained by calling 1-800-SEC-0330.
For a complete list of a fund's portfolio holdings, view the most recent holdings listing, semiannual report, or annual report on Fidelity's web site at http://www.fidelity.com, http://www.institutional.fidelity.com, or http://www.401k.com, as applicable.
NOT FDIC INSURED •MAY LOSE VALUE •NO BANK GUARANTEE
Neither the Fund nor Fidelity Distributors Corporation is a bank.
Average annual total return reflects the change in the value of an investment, assuming reinvestment of distributions from dividend income and capital gains (the profits earned upon the sale of securities that have grown in value, if any) and assuming a constant rate of performance each year. The hypothetical investment and the average annual total returns do not reflect the deduction of taxes that a shareholder would pay on fund distributions or the redemption of fund shares. During periods of reimbursement by Fidelity, a fund's total return will be greater than it would be had the reimbursement not occurred. How a fund did yesterday is no guarantee of how it will do tomorrow.
| Average Annual Total Returns |
| | | | |
Periods ended October 31, 2023 | Past 1 year | Life of Fund A |
| Fidelity® SAI Sustainable Emerging Markets Equity Fund | 13.74% | -8.98% |
A From April 14, 2022
| $10,000 Over Life of Fund |
| |
Let's say hypothetically that $10,000 was invested in Fidelity SAI Sustainable Emerging Markets Equity Fund, on April 14, 2022, when the fund started. The chart shows how the value of your investment would have changed, and also shows how the MSCI Emerging Markets Index performed over the same period. |
|
|
Market Recap:
International (non-U.S.) equities gained 12.27% for the 12 months ending October 31, 2023, according to the MSCI ACWI (All Country World Index) ex USA Index, as global economic expansion and a slowing in the pace of inflation in some markets provided a favorable backdrop for risk assets. After returning -15.86% in 2022, the index's upturn has been largely driven by a narrow set of companies in the information technology and communication services sectors, in part due to excitement for generative artificial intelligence applications. The index gained 14.07% year to date through July, including strong gains in both June (+4.50%) and July (+4.07%). The rally for international equities sputtered for the next three months (-11.33%) amid a stalling pattern in disinflationary trends, heightened global recession and geopolitical risks, soaring yields on longer-term U.S. government bonds and particularly weak economic conditions in the eurozone and China. The three-month decline left non-U.S. stocks up 1.15% year to date through October. Currency fluctuation also helped bolster non-U.S. equity performance overall. For the full 12 months, nearly all regions advanced, with Europe ex U.K. (+18%) and Japan (+17%) leading, whereas Canada (-0.38%) lagged by the widest margin. Each of the 11 sectors advanced, with information technology (+21%) and consumer discretionary (+19%) leading the way. Energy and industrials each rose about 14%. Conversely, four defensive-oriented sectors lagged by the widest margin: real estate (+4%), health care (+6%), consumer staples (+7%) and utilities (+8%).
Comments from Portfolio Manager John Chow:
For the fiscal year ending October 31, 2023, the fund gained 13.74%, versus 10.84% for the benchmark MSCI Emerging Markets (Net MA) Index. From a regional standpoint, stock picking in Emerging Asia and an underweight in Middle East, primarily Saudi Arabia, contributed to the fund's performance versus the benchmark. By sector, the biggest contributor to performance versus the benchmark was stock selection in consumer discretionary. Picks and an underweight in industrials, primarily within the capital goods industry, also boosted relative performance. Further bolstering our relative result was an underweight in utilities. The top individual relative contributor was an overweight in Taiwan Semiconductor (+43%), the fund's largest holding. A second notable relative contributor was an overweight in PDD (+81%), another of the portfolio's biggest holdings at period end. We increased our investment in PDD the past 12 months. An overweight in NetEase (+95%) also contributed. The stock was among the fund's largest holdings this period. In contrast, from a regional standpoint, picks in Latin America, primarily in Brazil, along with investment choices and an underweight in Emerging Europe, primarily Poland and Turkey, detracted from the fund's relative result. By sector, the biggest detractor from performance versus the benchmark was security selection in financials, especially among banks. Also hurting our result were stock picks in the multisector and energy categories. The biggest individual relative detractor was an overweight in Localiza Rent A Car (-25%). A second notable relative detractor was our non-benchmark stake in iShares MSCI India ETF (+2%), though it was no longer held at period end. Another notable relative detractor was our non-benchmark stake in Sea (-44%). Notable changes in positioning include increased exposure to the Multi-Country - Emerging Markets category and cash. By sector, meaningful changes in positioning include lower allocations to the multisector group and materials.
Note to shareholders:
Application of FMR's environmental, social, and governance (ESG) ratings process and/or its sustainable investing exclusion criteria may affect the fund's exposure to certain issuers, sectors, regions, and countries, and may affect the fund's performance.
The views expressed above reflect those of the portfolio manager(s) only through the end of the period as stated on the cover of this report and do not necessarily represent the views of Fidelity or any other person in the Fidelity organization. Any such views are subject to change at any time based upon market or other conditions and Fidelity disclaims any responsibility to update such views. These views may not be relied on as investment advice and, because investment decisions for a Fidelity fund are based on numerous factors, may not be relied on as an indication of trading intent on behalf of any Fidelity fund.
Top Holdings (% of Fund's net assets) |
| |
| Taiwan Semiconductor Manufacturing Co. Ltd. sponsored ADR (Taiwan, Semiconductors & Semiconductor Equipment) | 8.7 | |
| Samsung Electronics Co. Ltd. (Korea (South), Technology Hardware, Storage & Peripherals) | 6.4 | |
| Tencent Holdings Ltd. (China, Interactive Media & Services) | 5.4 | |
| Alibaba Group Holding Ltd. (China, Broadline Retail) | 4.4 | |
| PDD Holdings, Inc. ADR (China, Broadline Retail) | 3.0 | |
| SK Hynix, Inc. (Korea (South), Semiconductors & Semiconductor Equipment) | 1.9 | |
| New Oriental Education & Technology Group, Inc. sponsored ADR (China, Diversified Consumer Services) | 1.9 | |
| China Construction Bank Corp. (H Shares) (China, Banks) | 1.7 | |
| Reliance Industries Ltd. GDR (India, Oil, Gas & Consumable Fuels) | 1.7 | |
| NetEase, Inc. ADR (China, Entertainment) | 1.5 | |
| | 36.6 | |
| |
| Market Sectors (% of Fund's net assets) |
| |
| Information Technology | 23.6 | |
| Financials | 21.3 | |
| Consumer Discretionary | 17.5 | |
| Communication Services | 11.2 | |
| Consumer Staples | 4.8 | |
| Industrials | 4.7 | |
| Health Care | 4.3 | |
| Materials | 3.6 | |
| Energy | 2.3 | |
| Utilities | 1.3 | |
| Real Estate | 0.8 | |
| |
Asset Allocation (% of Fund's net assets) |
|
Futures - 0.7% |
|
Geographic Diversification (% of Fund's net assets) |
|
* Includes Short-Term investments and Net Other Assets (Liabilities). Percentages are adjusted for the effect of derivatives, if applicable. |
| |
Showing Percentage of Net Assets
| Common Stocks - 94.0% |
| | | Shares | Value ($) |
| Brazil - 4.1% | | | |
| Banco BTG Pactual SA unit | | 10,952 | 64,299 |
| Banco do Brasil SA | | 4,311 | 41,342 |
| Hapvida Participacoes e Investimentos SA (a)(b) | | 73,385 | 53,710 |
| Localiza Rent a Car SA | | 4,835 | 48,784 |
| Localiza Rent a Car SA rights 11/10/23 (a) | | 23 | 32 |
| Raia Drogasil SA | | 9,927 | 50,799 |
TOTAL BRAZIL | | | 258,966 |
| China - 32.7% | | | |
| Alibaba Group Holding Ltd. (a) | | 24,249 | 249,645 |
| Alibaba Group Holding Ltd. sponsored ADR (a) | | 338 | 27,899 |
| Baidu, Inc. sponsored ADR (a) | | 175 | 18,375 |
| BeiGene Ltd. ADR (a) | | 76 | 14,157 |
| BYD Co. Ltd. (H Shares) | | 1,685 | 51,241 |
| China Construction Bank Corp. (H Shares) | | 189,477 | 107,160 |
| China Life Insurance Co. Ltd. (H Shares) | | 37,363 | 50,604 |
| China Merchants Bank Co. Ltd. (H Shares) | | 2,758 | 10,462 |
| ENN Energy Holdings Ltd. | | 2,099 | 15,900 |
| Flat Glass Group Co. Ltd. | | 13,913 | 24,986 |
| Haier Smart Home Co. Ltd. | | 11,004 | 31,387 |
| Innovent Biologics, Inc. (a)(b) | | 5,612 | 33,072 |
| JD.com, Inc. sponsored ADR | | 1,465 | 37,240 |
| Kweichow Moutai Co. Ltd. (A Shares) | | 163 | 37,548 |
| Li Auto, Inc. ADR (a) | | 1,052 | 35,568 |
| Meituan Class B (a)(b) | | 6,667 | 94,505 |
| NetEase, Inc. ADR | | 888 | 94,945 |
| New Oriental Education & Technology Group, Inc. sponsored ADR (a) | | 1,808 | 118,406 |
| PDD Holdings, Inc. ADR (a) | | 1,869 | 189,554 |
| Ping An Insurance Group Co. of China Ltd. (H Shares) | | 14,197 | 72,014 |
| Qingdao Port International Co. Ltd. (H Shares) (b) | | 23,607 | 11,793 |
| Shenzhen Mindray Bio-Medical Electronics Co. Ltd. (A Shares) (a) | | 2,277 | 89,016 |
| Shenzhou International Group Holdings Ltd. | | 1,522 | 14,950 |
| Sinotruk Hong Kong Ltd. | | 40,253 | 75,817 |
| Tencent Holdings Ltd. | | 9,180 | 339,740 |
| Trip.com Group Ltd. ADR (a) | | 2,217 | 75,378 |
| Will Semiconductor Ltd. | | 1,100 | 16,600 |
| Wuliangye Yibin Co. Ltd. (A Shares) | | 917 | 19,551 |
| WuXi AppTec Co. Ltd. (H Shares) (b) | | 1,786 | 21,462 |
| Wuxi Biologics (Cayman), Inc. (a)(b) | | 6,444 | 40,067 |
| Zijin Mining Group Co. Ltd. (H Shares) | | 18,057 | 27,933 |
TOTAL CHINA | | | 2,046,975 |
| Greece - 0.5% | | | |
| OPAP SA | | 1,827 | 30,930 |
| Hungary - 0.5% | | | |
| Richter Gedeon PLC | | 1,373 | 32,193 |
| India - 13.8% | | | |
| Axis Bank Ltd. | | 4,498 | 53,060 |
| Bharti Airtel Ltd. | | 5,852 | 64,251 |
| HDFC Bank Ltd. | | 3,363 | 59,657 |
| HDFC Bank Ltd. sponsored ADR | | 1,061 | 60,000 |
| HDFC Standard Life Insurance Co. Ltd. (b) | | 8,942 | 66,407 |
| Hindustan Unilever Ltd. | | 845 | 25,210 |
| ICICI Bank Ltd. | | 6,327 | 69,588 |
| Infosys Ltd. sponsored ADR | | 2,466 | 40,492 |
| Larsen & Toubro Ltd. | | 2,537 | 89,253 |
| NTPC Ltd. | | 22,821 | 64,636 |
| Reliance Industries Ltd. GDR (b) | | 1,893 | 103,358 |
| SRF Ltd. | | 1,841 | 48,530 |
| Tata Consultancy Services Ltd. | | 459 | 18,576 |
| Tata Steel Ltd. | | 16,059 | 22,909 |
| Ultratech Cement Ltd. | | 746 | 75,476 |
TOTAL INDIA | | | 861,403 |
| Indonesia - 2.9% | | | |
| PT Bank Central Asia Tbk | | 138,341 | 76,215 |
| PT Bank Mandiri (Persero) Tbk | | 92,372 | 33,000 |
| PT Bank Negara Indonesia (Persero) Tbk | | 53,615 | 16,180 |
| PT Bank Rakyat Indonesia (Persero) Tbk | | 116,476 | 36,420 |
| PT Telkom Indonesia Persero Tbk | | 90,464 | 19,831 |
TOTAL INDONESIA | | | 181,646 |
| Korea (South) - 13.4% | | | |
| AMOREPACIFIC Corp. | | 336 | 31,492 |
| Hansol Chemical Co. Ltd. | | 109 | 12,146 |
| Hyundai Marine & Fire Insurance Co. Ltd. | | 476 | 11,087 |
| Hyundai Mipo Dockyard Co. Ltd. (a) | | 93 | 4,785 |
| Hyundai Motor Co. Ltd. | | 706 | 88,813 |
| JYP Entertainment Corp. | | 467 | 35,495 |
| KB Financial Group, Inc. | | 889 | 33,837 |
| LG Chemical Ltd. | | 36 | 11,781 |
| LG Corp. | | 252 | 14,403 |
| LG Innotek Co. Ltd. | | 74 | 12,264 |
| NAVER Corp. | | 427 | 59,607 |
| Samsung Electronics Co. Ltd. | | 8,116 | 403,374 |
| SK Hynix, Inc. | | 1,374 | 119,144 |
TOTAL KOREA (SOUTH) | | | 838,228 |
| Mexico - 3.7% | | | |
| Corporacion Inmobiliaria Vesta S.A.B. de CV ADR | | 1,230 | 38,671 |
| Fomento Economico Mexicano S.A.B. de CV sponsored ADR | | 264 | 29,940 |
| Grupo Aeroportuario Norte S.A.B. de CV | | 1,681 | 12,832 |
| Grupo Financiero Banorte S.A.B. de CV Series O | | 9,507 | 77,157 |
| Wal-Mart de Mexico SA de CV Series V | | 19,603 | 70,164 |
TOTAL MEXICO | | | 228,764 |
| Peru - 0.4% | | | |
| Credicorp Ltd. (United States) | | 206 | 25,742 |
| Philippines - 0.2% | | | |
| Ayala Land, Inc. | | 27,288 | 13,395 |
| Saudi Arabia - 1.4% | | | |
| Al Rajhi Bank | | 2,744 | 49,078 |
| The Saudi National Bank | | 4,604 | 41,173 |
TOTAL SAUDI ARABIA | | | 90,251 |
| Singapore - 0.3% | | | |
| Sea Ltd. ADR (a) | | 385 | 16,055 |
| South Africa - 3.0% | | | |
| Absa Group Ltd. | | 4,182 | 38,128 |
| Bid Corp. Ltd. | | 1,594 | 33,816 |
| Capitec Bank Holdings Ltd. | | 239 | 21,222 |
| FirstRand Ltd. | | 3,684 | 12,145 |
| MTN Group Ltd. | | 1,778 | 8,679 |
| Naspers Ltd. Class N | | 307 | 47,923 |
| Standard Bank Group Ltd. | | 2,706 | 26,554 |
TOTAL SOUTH AFRICA | | | 188,467 |
| Taiwan - 16.0% | | | |
| Alchip Technologies Ltd. | | 964 | 79,003 |
| Chailease Holding Co. Ltd. | | 11,434 | 61,977 |
| E Ink Holdings, Inc. | | 1,980 | 10,294 |
| E.SUN Financial Holdings Co. Ltd. | | 19,572 | 14,410 |
| eMemory Technology, Inc. | | 908 | 56,844 |
| HIWIN Technologies Corp. | | 6,489 | 39,294 |
| International Games Systems Co. Ltd. | | 2,380 | 45,839 |
| King Yuan Electronics Co. Ltd. | | 14,137 | 33,468 |
| MediaTek, Inc. | | 1,517 | 39,562 |
| Realtek Semiconductor Corp. | | 1,115 | 13,885 |
| Taiwan Semiconductor Manufacturing Co. Ltd. sponsored ADR | | 6,272 | 541,340 |
| Unimicron Technology Corp. | | 4,327 | 19,283 |
| Yageo Corp. | | 2,783 | 45,338 |
TOTAL TAIWAN | | | 1,000,537 |
| Thailand - 1.1% | | | |
| Bangkok Bank PCL (For. Reg.) | | 3,951 | 17,218 |
| PTT Exploration and Production PCL (For. Reg.) | | 7,699 | 34,965 |
| SCB X PCL (For. Reg.) | | 5,399 | 14,721 |
TOTAL THAILAND | | | 66,904 |
| TOTAL COMMON STOCKS (Cost $6,040,021) | | | 5,880,456 |
| | | | |
| Nonconvertible Preferred Stocks - 1.4% |
| | | Shares | Value ($) |
| Brazil - 1.4% | | | |
| Banco Bradesco SA (PN) | | 4,166 | 11,560 |
| Gerdau SA | | 3,854 | 16,641 |
| Itau Unibanco Holding SA | | 10,638 | 56,590 |
| | | | |
| TOTAL NONCONVERTIBLE PREFERRED STOCKS (Cost $89,049) | | | 84,791 |
| | | | |
| Government Obligations - 0.3% |
| | | Principal Amount (c) | Value ($) |
| United States of America - 0.3% | | | |
U.S. Treasury Bills, yield at date of purchase 5.38% 1/25/24 (d) (Cost $19,749) | | 20,000 | 19,749 |
| | | | |
| Money Market Funds - 10.1% |
| | | Shares | Value ($) |
Fidelity Cash Central Fund 5.40% (e) (Cost $633,452) | | 633,326 | 633,452 |
| | | | |
| TOTAL INVESTMENT IN SECURITIES - 105.8% (Cost $6,782,271) | 6,618,448 |
NET OTHER ASSETS (LIABILITIES) - (5.8)% | (361,104) |
| NET ASSETS - 100.0% | 6,257,344 |
| | |
| Futures Contracts |
| | Number of contracts | Expiration Date | Notional Amount ($) | Value ($) | Unrealized Appreciation/ (Depreciation) ($) |
| Purchased | | | | | |
| | | | | | |
| Equity Index Contracts | | | | | |
| ICE MSCI Emerging Markets Index Contracts (United States) | 1 | Dec 2023 | 45,960 | 194 | 194 |
| | | | | | |
| The notional amount of futures purchased as a percentage of Net Assets is 0.7% |
For the period, the average monthly notional amount at value for futures contracts in the aggregate was $102,158.
Legend
| (b) | Security exempt from registration under Rule 144A of the Securities Act of 1933. These securities may be resold in transactions exempt from registration, normally to qualified institutional buyers. At the end of the period, the value of these securities amounted to $424,374 or 6.8% of net assets. |
| (c) | Amount is stated in United States dollars unless otherwise noted. |
| (d) | Security or a portion of the security was pledged to cover margin requirements for futures contracts. At period end, the value of securities pledged amounted to $19,749. |
| (e) | Affiliated fund that is generally available only to investment companies and other accounts managed by Fidelity Investments. The rate quoted is the annualized seven-day yield of the fund at period end. A complete unaudited listing of the fund's holdings as of its most recent quarter end is available upon request. In addition, each Fidelity Central Fund's financial statements, which are not covered by the Fund's Report of Independent Registered Public Accounting Firm, are available on the SEC's website or upon request. |
Affiliated Central Funds
Fiscal year to date information regarding the Fund's investments in Fidelity Central Funds, including the ownership percentage, is presented below.
| Affiliate | Value, beginning of period ($) | Purchases ($) | Sales Proceeds ($) | Dividend Income ($) | Realized Gain (loss) ($) | Change in Unrealized appreciation (depreciation) ($) | Value, end of period ($) | % ownership, end of period |
| Fidelity Cash Central Fund 5.40% | 56,344 | 3,878,024 | 3,300,916 | 12,562 | - | - | 633,452 | 0.0% |
| Total | 56,344 | 3,878,024 | 3,300,916 | 12,562 | - | - | 633,452 | |
| | | | | | | | | |
Amounts in the dividend income column in the above table include any capital gain distributions from underlying funds, which are presented in the corresponding line item in the Statement of Operations, if applicable.
Amounts included in the purchases and sales proceeds columns may include in-kind transactions, if applicable.
Investment Valuation
The following is a summary of the inputs used, as of October 31, 2023, involving the Fund's assets and liabilities carried at fair value. The inputs or methodology used for valuing securities may not be an indication of the risk associated with investing in those securities. For more information on valuation inputs, and their aggregation into the levels used below, please refer to the Investment Valuation section in the accompanying Notes to Financial Statements.
| Valuation Inputs at Reporting Date: |
| Description | Total ($) | Level 1 ($) | Level 2 ($) | Level 3 ($) |
Investments in Securities: | | | | |
|
| Equities: | | | | |
Communication Services | 702,817 | 138,054 | 564,763 | - |
Consumer Discretionary | 1,093,439 | 562,898 | 530,541 | - |
Consumer Staples | 298,520 | 184,719 | 113,801 | - |
Energy | 138,323 | 103,358 | 34,965 | - |
Financials | 1,329,007 | 524,990 | 804,017 | - |
Health Care | 283,677 | 100,060 | 183,617 | - |
Industrials | 296,993 | 61,648 | 235,345 | - |
Information Technology | 1,474,453 | 581,832 | 892,621 | - |
Materials | 215,416 | 16,641 | 198,775 | - |
Real Estate | 52,066 | 38,671 | 13,395 | - |
Utilities | 80,536 | - | 80,536 | - |
|
| Government Obligations | 19,749 | - | 19,749 | - |
|
| Money Market Funds | 633,452 | 633,452 | - | - |
| Total Investments in Securities: | 6,618,448 | 2,946,323 | 3,672,125 | - |
Derivative Instruments: Assets | | | | |
Futures Contracts | 194 | 194 | - | - |
| Total Assets | 194 | 194 | - | - |
| Total Derivative Instruments: | 194 | 194 | - | - |
Value of Derivative Instruments
The following table is a summary of the Fund's value of derivative instruments by primary risk exposure as of October 31, 2023. For additional information on derivative instruments, please refer to the Derivative Instruments section in the accompanying Notes to Financial Statements.
Primary Risk Exposure / Derivative Type �� | Value |
| Asset ($) | Liability ($) |
| Equity Risk | | |
Futures Contracts (a) | 194 | 0 |
| Total Equity Risk | 194 | 0 |
| Total Value of Derivatives | 194 | 0 |
(a)Reflects gross cumulative appreciation (depreciation) on futures contracts as presented in the Schedule of Investments. In the Statement of Assets and Liabilities, the period end daily variation margin is included in receivable or payable for daily variation margin on futures contracts, and the net cumulative appreciation (depreciation) is included in Total accumulated earnings (loss).
| Statement of Assets and Liabilities |
| | | | October 31, 2023 |
| | | | | |
| Assets | | | | |
| Investment in securities, at value - See accompanying schedule: | | | | |
Unaffiliated issuers (cost $6,148,819) | $ | 5,984,996 | | |
Fidelity Central Funds (cost $633,452) | | 633,452 | | |
| | | | | |
| | | | | |
| Total Investment in Securities (cost $6,782,271) | | | $ | 6,618,448 |
| Foreign currency held at value (cost $6,628) | | | | 6,627 |
| Receivable for investments sold | | | | 39,380 |
| Receivable for fund shares sold | | | | 101,458 |
| Dividends receivable | | | | 3,565 |
| Distributions receivable from Fidelity Central Funds | | | | 2,455 |
| Prepaid expenses | | | | 5 |
| Receivable from investment adviser for expense reductions | | | | 10,377 |
| Other receivables | | | | 16 |
Total assets | | | | 6,782,331 |
| Liabilities | | | | |
| Payable for investments purchased | $ | 446,834 | | |
| Payable for fund shares redeemed | | 9,570 | | |
| Accrued management fee | | 3,476 | | |
| Payable for daily variation margin on futures contracts | | 2,221 | | |
| Audit fee payable | | 41,209 | | |
| Other payables and accrued expenses | | 21,677 | | |
| Total Liabilities | | | | 524,987 |
| Net Assets | | | $ | 6,257,344 |
| Net Assets consist of: | | | | |
| Paid in capital | | | $ | 6,733,635 |
| Total accumulated earnings (loss) | | | | (476,291) |
| Net Assets | | | $ | 6,257,344 |
Net Asset Value, offering price and redemption price per share ($6,257,344 ÷ 730,528 shares) | | | $ | 8.57 |
| Statement of Operations |
| | | | Year ended October 31, 2023 |
| Investment Income | | | | |
| Dividends | | | $ | 75,649 |
| Non-Cash dividends | | | | 6,765 |
| Interest | | | | 649 |
| Income from Fidelity Central Funds | | | | 12,562 |
| Income before foreign taxes withheld | | | $ | 95,625 |
| Less foreign taxes withheld | | | | (9,838) |
| Total Income | | | | 85,787 |
| Expenses | | | | |
| Management fee | $ | 25,617 | | |
| Custodian fees and expenses | | 44,527 | | |
| Independent trustees' fees and expenses | | 15 | | |
| Registration fees | | 32,201 | | |
| Audit | | 63,451 | | |
| Legal | | 2 | | |
| Miscellaneous | | 8 | | |
| Total expenses before reductions | | 165,821 | | |
| Expense reductions | | (134,907) | | |
| Total expenses after reductions | | | | 30,914 |
| Net Investment income (loss) | | | | 54,873 |
| Realized and Unrealized Gain (Loss) | | | | |
| Net realized gain (loss) on: | | | | |
| Investment Securities: | | | | |
| Unaffiliated issuers (net of foreign taxes of $931) | | (200,333) | | |
| Foreign currency transactions | | (6,570) | | |
| Futures contracts | | (19,997) | | |
| Total net realized gain (loss) | | | | (226,900) |
| Change in net unrealized appreciation (depreciation) on: | | | | |
| Investment Securities: | | | | |
| Unaffiliated issuers(net of increase in deferred foreign taxes of $2,684) | | 214,840 | | |
| Assets and liabilities in foreign currencies | | 50 | | |
| Futures contracts | | 194 | | |
| Total change in net unrealized appreciation (depreciation) | | | | 215,084 |
| Net gain (loss) | | | | (11,816) |
| Net increase (decrease) in net assets resulting from operations | | | $ | 43,057 |
| Statement of Changes in Net Assets |
| |
| | Year ended October 31, 2023 | | For the period April 14, 2022 (commencement of operations) through October 31, 2022 |
| Increase (Decrease) in Net Assets | | | | |
| Operations | | | | |
| Net investment income (loss) | $ | 54,873 | $ | 12,746 |
| Net realized gain (loss) | | (226,900) | | (131,753) |
| Change in net unrealized appreciation (depreciation) | | 215,084 | | (381,337) |
| Net increase (decrease) in net assets resulting from operations | | 43,057 | | (500,344) |
| Distributions to shareholders | | (19,218) | | - |
| | | | | |
| Share transactions | | | | |
| Proceeds from sales of shares | | 4,888,662 | | 2,279,784 |
| Reinvestment of distributions | | 18,756 | | - |
| Cost of shares redeemed | | (446,184) | | (7,169) |
| | | | | |
Net increase (decrease) in net assets resulting from share transactions | | 4,461,234 | | 2,272,615 |
| Total increase (decrease) in net assets | | 4,485,073 | | 1,772,271 |
| | | | | |
| Net Assets | | | | |
| Beginning of period | | 1,772,271 | | - |
| End of period | $ | 6,257,344 | $ | 1,772,271 |
| | | | | |
| Other Information | | | | |
| Shares | | | | |
| Sold | | 544,845 | | 233,926 |
| Issued in reinvestment of distributions | | 2,130 | | - |
| Redeemed | | (49,495) | | (878) |
| Net increase (decrease) | | 497,480 | | 233,048 |
| | | | | |
Financial Highlights
| Fidelity SAI Sustainable Emerging Markets Equity Fund |
| |
| Years ended October 31, | | 2023 | | 2022 A |
Selected Per-Share Data | | | | |
| Net asset value, beginning of period | $ | 7.60 | $ | 10.00 |
| Income from Investment Operations | | | | |
Net investment income (loss) B,C | | .15 | | .06 |
| Net realized and unrealized gain (loss) | | .90 D | | (2.46) |
| Total from investment operations | | 1.05 | | (2.40) |
| Distributions from net investment income | | (.08) | | - |
| Total distributions | | (.08) | | - |
| Net asset value, end of period | $ | 8.57 | $ | 7.60 |
Total Return E,F | | 13.74% | | (24.00)% |
Ratios to Average Net Assets C,G,H | | | | |
| Expenses before reductions | | 4.99% | | 6.38% I,J |
| Expenses net of fee waivers, if any | | .94% | | .96% I |
| Expenses net of all reductions | | .93% | | .96% I |
| Net investment income (loss) | | 1.65% | | 1.27% I |
| Supplemental Data | | | | |
| Net assets, end of period (000 omitted) | $ | 6,257 | $ | 1,772 |
Portfolio turnover rate K | | 87% | | 74% I |
AFor the period April 14, 2022 (commencement of operations) through October 31, 2022.
BCalculated based on average shares outstanding during the period.
CNet investment income (loss) is affected by the timing of the declaration of dividends by any underlying mutual funds or exchange-traded funds (ETFs). Net investment income (loss) of any mutual funds or ETFs is not included in the Fund's net investment income (loss) ratio.
DThe amount shown for a share outstanding does not correspond with the aggregate net gain (loss) on investments for the period due to the timing of sales and repurchases of shares in relation to fluctuating market values of the investments of the Fund.
ETotal returns for periods of less than one year are not annualized.
FTotal returns would have been lower if certain expenses had not been reduced during the applicable periods shown.
GFees and expenses of any underlying mutual funds or exchange-traded funds (ETFs) are not included in the Fund's expense ratio. The Fund indirectly bears its proportionate share of these expenses. For additional expense information related to investments in Fidelity Central Funds, please refer to the "Investments in Fidelity Central Funds" note found in the Notes to Financial Statements section of the most recent Annual or Semi-Annual report.
HExpense ratios reflect operating expenses of the class. Expenses before reductions do not reflect amounts reimbursed, waived, or reduced through arrangements with the investment adviser, brokerage services, or other offset arrangements, if applicable, and do not represent the amount paid by the class during periods when reimbursements, waivers or reductions occur.
IAnnualized.
JAudit fees are not annualized.
KAmount does not include the portfolio activity of any underlying mutual funds or exchange-traded funds (ETFs).
For the period ended October 31, 2023
1. Organization.
Fidelity SAI Sustainable Emerging Markets Equity Fund (the Fund) is a fund of Fidelity Investment Trust (the Trust) and is authorized to issue an unlimited number of shares. Shares are offered exclusively to certain clients of Fidelity Management & Research Company LLC (FMR) or its affiliates. The Trust is registered under the Investment Company Act of 1940, as amended (the 1940 Act), as an open-end management investment company organized as a Massachusetts business trust. The Fund's investments in emerging markets can be subject to social, economic, regulatory, and political uncertainties and can be extremely volatile.
2. Investments in Fidelity Central Funds.
Funds may invest in Fidelity Central Funds, which are open-end investment companies generally available only to other investment companies and accounts managed by the investment adviser and its affiliates. The Schedule of Investments lists any Fidelity Central Funds held as an investment as of period end, but does not include the underlying holdings of each Fidelity Central Fund. An investing fund indirectly bears its proportionate share of the expenses of the underlying Fidelity Central Funds.
Based on its investment objective, each Fidelity Central Fund may invest or participate in various investment vehicles or strategies that are similar to those of the investing fund. These strategies are consistent with the investment objectives of the investing fund and may involve certain economic risks which may cause a decline in value of each of the Fidelity Central Funds and thus a decline in the value of the investing fund.
| Fidelity Central Fund | Investment Manager | Investment Objective | Investment Practices | Expense RatioA |
| Fidelity Money Market Central Funds | Fidelity Management & Research Company LLC (FMR) | Each fund seeks to obtain a high level of current income consistent with the preservation of capital and liquidity. | Short-term Investments | Less than .005% |
A Expenses expressed as a percentage of average net assets and are as of each underlying Central Fund's most recent annual or semi-annual shareholder report.
A complete unaudited list of holdings for each Fidelity Central Fund is available upon request or at the Securities and Exchange Commission website at www.sec.gov. In addition, the financial statements of the Fidelity Central Funds which contain the significant accounting policies (including investment valuation policies) of those funds, and are not covered by the Report of Independent Registered Public Accounting Firm, are available on the Securities and Exchange Commission website or upon request.
3. Significant Accounting Policies.
The Fund is an investment company and applies the accounting and reporting guidance of the Financial Accounting Standards Board (FASB) Accounting Standards Codification Topic 946 Financial Services - Investment Companies. The financial statements have been prepared in conformity with accounting principles generally accepted in the United States of America (GAAP), which require management to make certain estimates and assumptions at the date of the financial statements. Actual results could differ from those estimates. Subsequent events, if any, through the date that the financial statements were issued have been evaluated in the preparation of the financial statements. The Fund's Schedule of Investments lists any underlying mutual funds or exchange-traded funds (ETFs) but does not include the underlying holdings of these funds. The following summarizes the significant accounting policies of the Fund:
Investment Valuation. Investments are valued as of 4:00 p.m. Eastern time on the last calendar day of the period. The Board of Trustees (the Board) has designated the Fund's investment adviser as the valuation designee responsible for the fair valuation function and performing fair value determinations as needed. The investment adviser has established a Fair Value Committee (the Committee) to carry out the day-to-day fair valuation responsibilities and has adopted policies and procedures to govern the fair valuation process and the activities of the Committee. In accordance with these fair valuation policies and procedures, which have been approved by the Board, the Fund attempts to obtain prices from one or more third party pricing services or brokers to value its investments. When current market prices, quotations or currency exchange rates are not readily available or reliable, investments will be fair valued in good faith by the Committee, in accordance with the policies and procedures. Factors used in determining fair value vary by investment type and may include market or investment specific events, transaction data, estimated cash flows, and market observations of comparable investments. The frequency that the fair valuation procedures are used cannot be predicted and they may be utilized to a significant extent. The Committee manages the Fund's fair valuation practices and maintains the fair valuation policies and procedures. The Fund's investment adviser reports to the Board information regarding the fair valuation process and related material matters.
The Fund categorizes the inputs to valuation techniques used to value its investments into a disclosure hierarchy consisting of three levels as shown below:
Level 1 - unadjusted quoted prices in active markets for identical investments
Level 2 - other significant observable inputs (including quoted prices for similar investments, interest rates, prepayment speeds, etc.)
Level 3 - unobservable inputs (including the Fund's own assumptions based on the best information available)
Valuation techniques used to value the Fund's investments by major category are as follows:
Equity securities, including restricted securities, for which market quotations are readily available, are valued at the last reported sale price or official closing price as reported by a third party pricing service on the primary market or exchange on which they are traded and are categorized as Level 1 in the hierarchy. In the event there were no sales during the day or closing prices are not available, securities are valued at the last quoted bid price or may be valued using the last available price and are generally categorized as Level 2 in the hierarchy. For foreign equity securities, when market or security specific events arise, comparisons to the valuation of American Depositary Receipts (ADRs), futures contracts, ETFs and certain indexes as well as quoted prices for similar securities may be used and would be categorized as Level 2 in the hierarchy. For equity securities, including restricted securities, where observable inputs are limited, assumptions about market activity and risk are used and these securities may be categorized as Level 3 in the hierarchy.
Debt securities, including restricted securities, are valued based on evaluated prices received from third party pricing services or from brokers who make markets in such securities. U.S. government and government agency obligations are valued by pricing services who utilize matrix pricing which considers yield or price of bonds of comparable quality, coupon, maturity and type or by broker-supplied prices. ETFs are valued at their last sale price or official closing price as reported by a third party pricing service on the primary market or exchange on which they are traded and are categorized as Level 1 in the hierarchy. In the event there were no sales during the day but the exchange reports a closing bid level, ETFs are valued at the closing bid and would be categorized as Level 1 in the hierarchy. In the event there was no closing bid, ETFs may be valued by another method that the Board believes reflects fair value in accordance with the Board's fair value pricing policies and may be categorized as Level 2 in the hierarchy.
Investments in open-end mutual funds, including the Fidelity Central Funds, are valued at their closing net asset value (NAV) each business day and are categorized as Level 1 in the hierarchy.
Changes in valuation techniques may result in transfers in or out of an assigned level within the disclosure hierarchy. The aggregate value of investments by input level as of October 31, 2023 is included at the end of the Fund's Schedule of Investments.
Foreign Currency. Certain Funds may use foreign currency contracts to facilitate transactions in foreign-denominated securities. Gains and losses from these transactions may arise from changes in the value of the foreign currency or if the counterparties do not perform under the contracts' terms.
Foreign-denominated assets, including investment securities, and liabilities are translated into U.S. dollars at the exchange rates at period end. Purchases and sales of investment securities, income and dividends received, and expenses denominated in foreign currencies are translated into U.S. dollars at the exchange rate in effect on the transaction date.
The effects of exchange rate fluctuations on investments are included with the net realized and unrealized gain (loss) on investment securities. Other foreign currency transactions resulting in realized and unrealized gain (loss) are disclosed separately.
Investment Transactions and Income. For financial reporting purposes, the Fund's investment holdings and NAV include trades executed through the end of the last business day of the period. The NAV per share for processing shareholder transactions is calculated as of the close of business of the New York Stock Exchange (NYSE), normally 4:00 p.m. Eastern time and includes trades executed through the end of the prior business day. Gains and losses on securities sold are determined on the basis of identified cost. Commissions paid to certain brokers with whom the investment adviser, or its affiliates, places trades on behalf of a fund include an amount in addition to trade execution, which may be rebated back to a fund. Any such rebates are included in net realized gain (loss) on investments in the Statement of Operations. Dividend income is recorded on the ex-dividend date, except for certain dividends from foreign securities where the ex-dividend date may have passed, which are recorded as soon as the Fund is informed of the ex-dividend date. Non-cash dividends included in dividend income, if any, are recorded at the fair market value of the securities received. Income and capital gain distributions from Fidelity Central Funds, if any, are recorded on the ex-dividend date. Interest income is accrued as earned and includes coupon interest and amortization of premium and accretion of discount on debt securities as applicable. Investment income is recorded net of foreign taxes withheld where recovery of such taxes is uncertain.
Expenses. Expenses directly attributable to a fund are charged to that fund. Expenses attributable to more than one fund are allocated among the respective funds on the basis of relative net assets or other appropriate methods. Expenses included in the accompanying financial statements reflect the expenses of that fund and do not include any expenses associated with any underlying mutual funds or exchange-traded funds. Although not included in a fund's expenses, a fund indirectly bears its proportionate share of these expenses through the net asset value of each underlying mutual fund or exchange-traded fund. Expense estimates are accrued in the period to which they relate and adjustments are made when actual amounts are known.
Income Tax Information and Distributions to Shareholders. Each year, the Fund intends to qualify as a regulated investment company under Subchapter M of the Internal Revenue Code, including distributing substantially all of its taxable income and realized gains. As a result, no provision for U.S. Federal income taxes is required. As of October 31, 2023, the Fund did not have any unrecognized tax benefits in the financial statements; nor is the Fund aware of any tax positions for which it is reasonably possible that the total amounts of unrecognized tax benefits will significantly change in the next twelve months. The Fund files a U.S. federal tax return, in addition to state and local tax returns as required. The Fund's federal income tax returns are subject to examination by the Internal Revenue Service (IRS) for a period of three fiscal years after they are filed. State and local tax returns may be subject to examination for an additional fiscal year depending on the jurisdiction. Foreign taxes are provided for based on the Fund's understanding of the tax rules and rates that exist in the foreign markets in which it invests. The Fund is subject to a tax imposed on capital gains by certain countries in which it invests. An estimated deferred tax liability for net unrealized appreciation on the applicable securities is included in Other payables and accrued expenses on the Statement of Assets & Liabilities.
Distributions are declared and recorded on the ex-dividend date. Income and capital gain distributions are determined in accordance with income tax regulations, which may differ from GAAP.
Capital accounts within the financial statements are adjusted for permanent book-tax differences. These adjustments have no impact on net assets or the results of operations. Capital accounts are not adjusted for temporary book-tax differences which will reverse in a subsequent period.
Book-tax differences are primarily due to futures contracts, foreign currency transactions, certain foreign taxes, passive foreign investment companies (PFIC), capital loss carryforwards and losses deferred due to wash sales.
As of period end, the cost and unrealized appreciation (depreciation) in securities, and derivatives if applicable, for federal income tax purposes were as follows:
| Gross unrealized appreciation | $206,460 |
| Gross unrealized depreciation | (489,044) |
| Net unrealized appreciation (depreciation) | $(282,584) |
| Tax Cost | $6,901,032 |
The tax-based components of distributable earnings as of period end were as follows:
| Undistributed ordinary income | $66,848 |
| Capital loss carryforward | $(257,931) |
| Net unrealized appreciation (depreciation) on securities and other investments | $(282,524) |
Capital loss carryforwards are only available to offset future capital gains of the Fund to the extent provided by regulations and may be limited. The capital loss carryforward information presented below, including any applicable limitation, is estimated as of fiscal period end and is subject to adjustment.
| Short-term | $(220,676) |
| Long-term | (37,254) |
| Total Capital loss carryforward | $(257,930) |
Due to large subscriptions in the period, approximately $143,423 of the Fund's realized capital losses are subject to limitation. Due to this limitation, the Fund will only be permitted to use approximately $97,911 of those capital losses per year to offset capital gains.
The tax character of distributions paid was as follows:
| | October 31, 2023 | October 31, 2022 |
| Ordinary Income | $19,218 | $- |
Restricted Securities (including Private Placements). Funds may invest in securities that are subject to legal or contractual restrictions on resale. These securities generally may be resold in transactions exempt from registration or to the public if the securities are registered. Disposal of these securities may involve time-consuming negotiations and expense, and prompt sale at an acceptable price may be difficult. Information regarding restricted securities held at period end is included at the end of the Schedule of Investments, if applicable.
4. Derivative Instruments.
Risk Exposures and the Use of Derivative Instruments. The Fund's investment objectives allow for various types of derivative instruments, including futures contracts. Derivatives are investments whose value is primarily derived from underlying assets, indices or reference rates and may be transacted on an exchange or over-the-counter (OTC). Derivatives may involve a future commitment to buy or sell a specified asset based on specified terms, to exchange future cash flows at periodic intervals based on a notional principal amount, or for one party to make one or more payments upon the occurrence of specified events in exchange for periodic payments from the other party.
Derivatives were used to increase returns and to manage exposure to certain risks as defined below. The success of any strategy involving derivatives depends on analysis of numerous economic factors, and if the strategies for investment do not work as intended, the objectives may not be achieved.
Derivatives were used to increase or decrease exposure to the following risk(s):
| | |
| Equity Risk | Equity risk relates to the fluctuations in the value of financial instruments as a result of changes in market prices (other than those arising from interest rate risk or foreign exchange risk), whether caused by factors specific to an individual investment, its issuer, or all factors affecting all instruments traded in a market or market segment. |
Funds are also exposed to additional risks from investing in derivatives, such as liquidity risk and counterparty credit risk. Liquidity risk is the risk that a fund will be unable to close out the derivative in the open market in a timely manner. Counterparty credit risk is the risk that the counterparty will not be able to fulfill its obligation to a fund. Counterparty credit risk related to exchange-traded contracts may be mitigated by the protection provided by the exchange on which they trade.
Investing in derivatives may involve greater risks than investing in the underlying assets directly and, to varying degrees, may involve risk of loss in excess of any initial investment and collateral received and amounts recognized in the Statement of Assets and Liabilities. In addition, there may be the risk that the change in value of the derivative contract does not correspond to the change in value of the underlying instrument.
Futures Contracts. A futures contract is an agreement between two parties to buy or sell a specified underlying instrument for a fixed price at a specified future date. Futures contracts were used to manage exposure to the stock market.
Upon entering into a futures contract, a fund is required to deposit either cash or securities (initial margin) with a clearing broker in an amount equal to a certain percentage of the face value of the contract. Futures contracts are marked-to-market daily and subsequent daily payments are made or received by a fund depending on the daily fluctuations in the value of the futures contracts and are recorded as unrealized appreciation or (depreciation). This receivable and/or payable, if any, is included in daily variation margin on futures contracts in the Statement of Assets and Liabilities. Realized gain or (loss) is recorded upon the expiration or closing of a futures contract. The net realized gain (loss) and change in net unrealized appreciation (depreciation) on futures contracts during the period is presented in the Statement of Operations.
Any open futures contracts at period end are presented in the Schedule of Investments under the caption "Futures Contracts". The notional amount at value reflects each contract's exposure to the underlying instrument or index at period end, and is representative of volume of activity during the period unless an average notional amount is presented. Any securities deposited to meet initial margin requirements are identified in the Schedule of Investments. Any cash deposited to meet initial margin requirements is presented as segregated cash with brokers for derivative instruments in the Statement of Assets and Liabilities.
5. Purchases and Sales of Investments.
Purchases and sales of securities, other than short-term securities, U.S. government securities and in-kind transactions, as applicable, are noted in the table below.
| | Purchases ($) | Sales ($) |
| Fidelity SAI Sustainable Emerging Markets Equity Fund | 6,991,217 | 2,764,489 |
6. Fees and Other Transactions with Affiliates.
Management Fee. Fidelity Management & Research Company LLC (the investment adviser) and its affiliates provide the Fund with investment management related services for which the Fund pays a monthly management fee. The management fee is the sum of an individual fund fee rate that is based on an annual rate of .55% of the Fund's average net assets and an annualized group fee rate that averaged .23% during the period. The group fee rate is based upon the monthly average net assets of a group of registered investment companies with which the investment adviser has management contracts. The group fee rate decreases as assets under management increase and increases as assets under management decrease. For the reporting period, the total annual management fee rate was .77% of the Fund's average net assets.
Brokerage Commissions. A portion of portfolio transactions were placed with brokerage firms which are affiliates of the investment adviser. Brokerage commissions are included in net realized gain (loss) and change in net unrealized appreciation (depreciation) in the Statement of Operations. The commissions paid to these affiliated firms were as follows:
| | Amount |
| Fidelity SAI Sustainable Emerging Markets Equity Fund | $15 |
Interfund Trades. Funds may purchase from or sell securities to other Fidelity Funds under procedures adopted by the Board. The procedures have been designed to ensure these interfund trades are executed in accordance with Rule 17a-7 of the 1940 Act. Any interfund trades are included within the respective purchases and sales amounts shown in the Purchases and Sales of Investments note. Interfund trades during the period are noted in the table below.
| | Purchases ($) | Sales ($) | Realized Gain (Loss) ($) |
| Fidelity SAI Sustainable Emerging Markets Equity Fund | 93,950 | 54,874 | (7,180) |
7. Committed Line of Credit.
Certain Funds participate with other funds managed by the investment adviser or an affiliate in a $4.25 billion credit facility (the "line of credit") to be utilized for temporary or emergency purposes to fund shareholder redemptions or for other short-term liquidity purposes. The participating funds have agreed to pay commitment fees on their pro-rata portion of the line of credit, which are reflected in Miscellaneous expenses on the Statement of Operations, and are listed below. During the period, there were no borrowings on this line of credit.
| | Amount |
| Fidelity SAI Sustainable Emerging Markets Equity Fund | $3 |
8. Expense Reductions.
The investment adviser contractually agreed to reimburse the Fund to the extent annual operating expenses exceeded .95% of average net assets. This reimbursement will remain in place through February 28, 2025. Some expenses, for example the compensation of the independent Trustees, and certain miscellaneous expenses such as proxy and shareholder meeting expenses, are excluded from this reimbursement. During the period this reimbursement reduced the Fund's expenses by $134,337.
Through arrangements with the Fund's custodian, credits realized as a result of certain uninvested cash balances were used to reduce the Fund's expenses by $434.
In addition, during the period the investment adviser or an affiliate reimbursed and/or waived a portion of operating expenses in the amount of $136.
9. Other.
A fund's organizational documents provide former and current trustees and officers with a limited indemnification against liabilities arising in connection with the performance of their duties to the fund. In the normal course of business, a fund may also enter into contracts that provide general indemnifications. A fund's maximum exposure under these arrangements is unknown as this would be dependent on future claims that may be made against a fund. The risk of material loss from such claims is considered remote.
At the end of the period, the investment adviser or its affiliates were owners of record of more than 10% of the outstanding shares as follows:
| Fund | Affiliated % |
Fidelity SAI Sustainable Emerging Markets Equity Fund | 28% |
10. Risk and Uncertainties.
Many factors affect a fund's performance. Developments that disrupt global economies and financial markets, such as pandemics, epidemics, outbreaks of infectious diseases, war, terrorism, and environmental disasters, may significantly affect a fund's investment performance. The effects of these developments to a fund will be impacted by the types of securities in which a fund invests, the financial condition, industry, economic sector, and geographic location of an issuer, and a fund's level of investment in the securities of that issuer. Significant concentrations in security types, issuers, industries, sectors, and geographic locations may magnify the factors that affect a fund's performance.
To the Board of Trustees of Fidelity Investment Trust and the Shareholders of Fidelity SAI Sustainable Emerging Markets Equity Fund:
Opinion on the Financial Statements and Financial Highlights
We have audited the accompanying statement of assets and liabilities of Fidelity SAI Sustainable Emerging Markets Equity Fund (the "Fund"), a fund of Fidelity Investment Trust, including the schedule of investments, as of October 31, 2023, the related statement of operations for the year then ended, and the statement of changes in net assets and the financial highlights for the year then ended and for the period from April 14, 2022 (commencement of operations) through October 31, 2022, and the related notes. In our opinion, the financial statements and financial highlights present fairly, in all material respects, the financial position of the Fund as of October 31, 2023, and the results of its operations for the year then ended, and the changes in its net assets and financial highlights for the year then ended and for the period from April 14, 2022 (commencement of operations) through October 31, 2022, in conformity with accounting principles generally accepted in the United States of America.
Basis for Opinion
These financial statements and financial highlights are the responsibility of the Fund's management. Our responsibility is to express an opinion on the Fund's financial statements and financial highlights based on our audits. We are a public accounting firm registered with the Public Company Accounting Oversight Board (United States) (PCAOB) and are required to be independent with respect to the Fund in accordance with the U.S. federal securities laws and the applicable rules and regulations of the Securities and Exchange Commission and the PCAOB.
We conducted our audits in accordance with the standards of the PCAOB. Those standards require that we plan and perform the audit to obtain reasonable assurance about whether the financial statements and financial highlights are free of material misstatement, whether due to error or fraud. The Fund is not required to have, nor were we engaged to perform, an audit of its internal control over financial reporting. As part of our audits we are required to obtain an understanding of internal control over financial reporting but not for the purpose of expressing an opinion on the effectiveness of the Fund's internal control over financial reporting. Accordingly, we express no such opinion.
Our audits included performing procedures to assess the risks of material misstatement of the financial statements and financial highlights, whether due to error or fraud, and performing procedures that respond to those risks. Such procedures included examining, on a test basis, evidence regarding the amounts and disclosures in the financial statements and financial highlights. Our audits also included evaluating the accounting principles used and significant estimates made by management, as well as evaluating the overall presentation of the financial statements and financial highlights. Our procedures included confirmation of securities owned as of October 31, 2023, by correspondence with the custodian and brokers; when replies were not received from brokers, we performed other auditing procedures. We believe that our audits provide a reasonable basis for our opinion.
/s/ Deloitte & Touche LLP
Boston, Massachusetts
December 13, 2023
We have served as the auditor of one or more of the Fidelity investment companies since 1999.
The Trustees, Members of the Advisory Board (if any), and officers of the trust and fund, as applicable, are listed below. The Board of Trustees governs the fund and is responsible for protecting the interests of shareholders. The Trustees are experienced executives who meet periodically throughout the year to oversee the fund's activities, review contractual arrangements with companies that provide services to the fund, oversee management of the risks associated with such activities and contractual arrangements, and review the fund's performance. Except for Jonathan Chiel, each of the Trustees oversees 322 funds. Mr. Chiel oversees 191 funds.
The Trustees hold office without limit in time except that (a) any Trustee may resign; (b) any Trustee may be removed by written instrument, signed by at least two-thirds of the number of Trustees prior to such removal; (c) any Trustee who requests to be retired or who has become incapacitated by illness or injury may be retired by written instrument signed by a majority of the other Trustees; and (d) any Trustee may be removed at any special meeting of shareholders by a two-thirds vote of the outstanding voting securities of the trust. Each Trustee who is not an interested person (as defined in the 1940 Act) of the trust and the fund is referred to herein as an Independent Trustee. Each Independent Trustee shall retire not later than the last day of the calendar year in which his or her 75th birthday occurs. The Independent Trustees may waive this mandatory retirement age policy with respect to individual Trustees. Officers and Advisory Board Members hold office without limit in time, except that any officer or Advisory Board Member may resign or may be removed by a vote of a majority of the Trustees at any regular meeting or any special meeting of the Trustees. Except as indicated, each individual has held the office shown or other offices in the same company for the past five years.
The fund's Statement of Additional Information (SAI) includes more information about the Trustees. To request a free copy, call Fidelity at 1-800-544-3455.
Experience, Skills, Attributes, and Qualifications of the Trustees. The Governance and Nominating Committee has adopted a statement of policy that describes the experience, qualifications, attributes, and skills that are necessary and desirable for potential Independent Trustee candidates (Statement of Policy). The Board believes that each Trustee satisfied at the time he or she was initially elected or appointed a Trustee, and continues to satisfy, the standards contemplated by the Statement of Policy. The Governance and Nominating Committee also engages professional search firms to help identify potential Independent Trustee candidates who have the experience, qualifications, attributes, and skills consistent with the Statement of Policy. From time to time, additional criteria based on the composition and skills of the current Independent Trustees, as well as experience or skills that may be appropriate in light of future changes to board composition, business conditions, and regulatory or other developments, have also been considered by the professional search firms and the Governance and Nominating Committee. In addition, the Board takes into account the Trustees' commitment and participation in Board and committee meetings, as well as their leadership of standing and ad hoc committees throughout their tenure.
In determining that a particular Trustee was and continues to be qualified to serve as a Trustee, the Board has considered a variety of criteria, none of which, in isolation, was controlling. The Board believes that, collectively, the Trustees have balanced and diverse experience, qualifications, attributes, and skills, which allow the Board to operate effectively in governing the fund and protecting the interests of shareholders. Information about the specific experience, skills, attributes, and qualifications of each Trustee, which in each case led to the Board's conclusion that the Trustee should serve (or continue to serve) as a trustee of the fund, is provided below.
Board Structure and Oversight Function. Robert A. Lawrence is an interested person and currently serves as Chair. The Trustees have determined that an interested Chair is appropriate and benefits shareholders because an interested Chair has a personal and professional stake in the quality and continuity of services provided to the fund. Independent Trustees exercise their informed business judgment to appoint an individual of their choosing to serve as Chair, regardless of whether the Trustee happens to be independent or a member of management. The Independent Trustees have determined that they can act independently and effectively without having an Independent Trustee serve as Chair and that a key structural component for assuring that they are in a position to do so is for the Independent Trustees to constitute a substantial majority for the Board. The Independent Trustees also regularly meet in executive session. David M. Thomas serves as Lead Independent Trustee and as such (i) acts as a liaison between the Independent Trustees and management with respect to matters important to the Independent Trustees and (ii) with management prepares agendas for Board meetings.
Fidelity® funds are overseen by different Boards of Trustees. The fund's Board oversees Fidelity's high income and certain equity funds, and other Boards oversee Fidelity's alternative investment, investment-grade bond, money market, asset allocation, and other equity funds. The asset allocation funds may invest in Fidelity® funds overseen by the fund's Board. The use of separate Boards, each with its own committee structure, allows the Trustees of each group of Fidelity® funds to focus on the unique issues of the funds they oversee, including common research, investment, and operational issues. On occasion, the separate Boards establish joint committees to address issues of overlapping consequences for the Fidelity® funds overseen by each Board.
The Trustees operate using a system of committees to facilitate the timely and efficient consideration of all matters of importance to the Trustees, the fund, and fund shareholders and to facilitate compliance with legal and regulatory requirements and oversight of the fund's activities and associated risks. The Board, acting through its committees, has charged FMR and its affiliates with (i) identifying events or circumstances the occurrence of which could have demonstrably adverse effects on the fund's business and/or reputation; (ii) implementing processes and controls to lessen the possibility that such events or circumstances occur or to mitigate the effects of such events or circumstances if they do occur; and (iii) creating and maintaining a system designed to evaluate continuously business and market conditions in order to facilitate the identification and implementation processes described in (i) and (ii) above. Because the day-to-day operations and activities of the fund are carried out by or through FMR, its affiliates, and other service providers, the fund's exposure to risks is mitigated but not eliminated by the processes overseen by the Trustees. While each of the Board's committees has responsibility for overseeing different aspects of the fund's activities, oversight is exercised primarily through the Operations, Audit, and Compliance Committees. Appropriate personnel, including but not limited to the fund's Chief Compliance Officer (CCO), FMR's internal auditor, the independent accountants, the fund's Treasurer and portfolio management personnel, make periodic reports to the Board's committees, as appropriate, including an annual review of Fidelity's risk management program for the Fidelity® funds. The responsibilities of each standing committee, including their oversight responsibilities, are described further under "Standing Committees of the Trustees."
Interested Trustees*:
Correspondence intended for a Trustee who is an interested person may be sent to Fidelity Investments, 245 Summer Street, Boston, Massachusetts 02210.
Name, Year of Birth; Principal Occupations and Other Relevant Experience+
Jonathan Chiel (1957)
Year of Election or Appointment: 2016
Trustee
Mr. Chiel also serves as Trustee of other Fidelity® funds. Mr. Chiel is General Counsel (2012-present) and Head of Legal, Risk and Compliance (2022-present). Mr Chiel serves as Executive Vice President and General Counsel for FMR LLC (diversified financial services company, 2012-present) and Director and President for OH Company LLC (holding company, 2018-present). Previously, Mr. Chiel served as general counsel (2004-2012) and senior vice president and deputy general counsel (2000-2004) for John Hancock Financial Services; a partner with Choate, Hall & Stewart (1996-2000) (law firm); and an Assistant United States Attorney for the United States Attorney's Office of the District of Massachusetts (1986-95), including Chief of the Criminal Division (1993-1995). Mr. Chiel is a director on the boards of the Boston Bar Foundation and the Maimonides School.
Bettina Doulton (1964)
Year of Election or Appointment: 2021
Trustee
Ms. Doulton also serves as Trustee of other Fidelity® funds. Prior to her retirement, Ms. Doulton served in a variety of positions at Fidelity Investments, including as a managing director of research (2006-2007), portfolio manager to certain Fidelity® funds (1993-2005), equity analyst and portfolio assistant (1990-1993), and research assistant (1987-1990). Ms. Doulton currently owns and operates Phi Builders + Architects and Cellardoor Winery. Previously, Ms. Doulton served as a member of the Board of Brown Capital Management, LLC (2014-2018).
Robert A. Lawrence (1952)
Year of Election or Appointment: 2020
Trustee
Chair of the Board of Trustees
Mr. Lawrence also serves as Trustee of other funds. Previously, Mr. Lawrence served as a Trustee and Member of the Advisory Board of certain funds. Prior to his retirement in 2008, Mr. Lawrence served as Vice President of certain Fidelity® funds (2006-2008), Senior Vice President, Head of High Income Division of Fidelity Management & Research Company (investment adviser firm, 2006-2008), and President of Fidelity Strategic Investments (investment adviser firm, 2002-2005).
* Determined to be an "Interested Trustee" by virtue of, among other things, his or her affiliation with the trust or various entities under common control with FMR.
+ The information includes the Trustee's principal occupation during the last five years and other information relating to the experience, attributes, and skills relevant to the Trustee's qualifications to serve as a Trustee, which led to the conclusion that the Trustee should serve as a Trustee for the fund.
Independent Trustees:
Correspondence intended for an Independent Trustee may be sent to Fidelity Investments, P.O. Box 55235, Boston, Massachusetts 02205-5235.
Name, Year of Birth; Principal Occupations and Other Relevant Experience+
Thomas P. Bostick (1956)
Year of Election or Appointment: 2021
Trustee
Lieutenant General Bostick also serves as Trustee of other Fidelity® funds. Prior to his retirement, General Bostick (United States Army, Retired) held a variety of positions within the U.S. Army, including Commanding General and Chief of Engineers, U.S. Army Corps of Engineers (2012-2016) and Deputy Chief of Staff and Director of Human Resources, U.S. Army (2009-2012). General Bostick currently serves as a member of the Board and Finance and Governance & Sustainability Committees of CSX Corporation (transportation, 2020-present) and a member of the Board and Corporate Governance and Nominating Committee of Perma-Fix Environmental Services, Inc. (nuclear waste management, 2020-present). General Bostick serves as Chief Executive Officer of Bostick Global Strategies, LLC (consulting, 2016-present), as a member of the Board of HireVue, Inc. (video interview and assessment, 2020-present), as a member of the Board of Allonnia (biotechnology and engineering solutions, 2022-present) and on the Advisory Board of Solugen, Inc. (specialty bio-based chemicals manufacturer, 2022-present). Previously, General Bostick served as a Member of the Advisory Board of certain Fidelity® funds (2021), President, Intrexon Bioengineering (2018-2020) and Chief Operating Officer (2017-2020) and Senior Vice President of the Environment Sector (2016-2017) of Intrexon Corporation (biopharmaceutical company).
Dennis J. Dirks (1948)
Year of Election or Appointment: 2005
Trustee
Mr. Dirks also serves as Trustee of other Fidelity® funds. Prior to his retirement in May 2003, Mr. Dirks served as Chief Operating Officer and as a member of the Board of The Depository Trust & Clearing Corporation (financial markets infrastructure), President, Chief Operating Officer and a member of the Board of The Depository Trust Company (DTC), President and a member of the Board of the National Securities Clearing Corporation (NSCC), Chief Executive Officer and a member of the Board of the Government Securities Clearing Corporation and Chief Executive Officer and a member of the Board of the Mortgage-Backed Securities Clearing Corporation. Mr. Dirks currently serves as a member of the Finance Committee (2016-present) and Board (2017-present) and is Treasurer (2018-present) of the Asolo Repertory Theatre.
Donald F. Donahue (1950)
Year of Election or Appointment: 2018
Trustee
Mr. Donahue also serves as Trustee of other Fidelity® funds. Mr. Donahue serves as President and Chief Executive Officer of Miranda Partners, LLC (risk consulting for the financial services industry, 2012-present). Previously, Mr. Donahue served as Chief Executive Officer (2006-2012), Chief Operating Officer (2003-2006) and Managing Director, Customer Marketing and Development (1999-2003) of The Depository Trust & Clearing Corporation (financial markets infrastructure). Mr. Donahue currently serves as a member (2007-present) and Co-Chairman (2016-present) of the Board of United Way of New York. Mr. Donahue previously served as a member of the Advisory Board of certain Fidelity® funds (2015-2018) and as a member of the Board of The Leadership Academy (previously NYC Leadership Academy) (2012-2022).
Vicki L. Fuller (1957)
Year of Election or Appointment: 2020
Trustee
Ms. Fuller also serves as Trustee of other Fidelity® funds. Previously, Ms. Fuller served as a member of the Advisory Board of certain Fidelity® funds (2018-2020), Chief Investment Officer of the New York State Common Retirement Fund (2012-2018) and held a variety of positions at AllianceBernstein L.P. (global asset management, 1985-2012), including Managing Director (2006-2012) and Senior Vice President and Senior Portfolio Manager (2001-2006). Ms. Fuller currently serves as a member of the Board, Audit Committee and Nominating and Governance Committee of two Blackstone business development companies (2020-present), as a member of the Board of Treliant, LLC (consulting, 2019-present), as a member of the Board of Ariel Alternatives, LLC (private equity, 2022-present) and as a member of the Board and Chair of the Audit Committee of Gusto, Inc. (software, 2021-present). In addition, Ms. Fuller currently serves as a member of the Board of Roosevelt University (2019-present) and as a member of the Executive Board of New York University's Stern School of Business. Ms. Fuller previously served as a member of the Board, Audit Committee and Nominating and Governance Committee of The Williams Companies, Inc. (natural gas infrastructure, 2018-2021).
Patricia L. Kampling (1959)
Year of Election or Appointment: 2020
Trustee
Ms. Kampling also serves as Trustee of other Fidelity® funds. Prior to her retirement, Ms. Kampling served as Chairman of the Board and Chief Executive Officer (2012-2019), President and Chief Operating Officer (2011-2012) and Executive Vice President and Chief Financial Officer (2010-2011) of Alliant Energy Corporation. Ms. Kampling currently serves as a member of the Board, Finance Committee and Governance, Compensation and Nominating Committee of Xcel Energy Inc. (utilities company, 2020-present) and as a member of the Board, Audit, Finance and Risk Committee and Safety, Environmental, Technology and Operations Committee and Chair of the Executive Development and Compensation Committee of American Water Works Company, Inc. (utilities company, 2019-present). In addition, Ms. Kampling currently serves as a member of the Board of the Nature Conservancy, Wisconsin Chapter (2019-present). Previously, Ms. Kampling served as a Member of the Advisory Board of certain Fidelity® funds (2020), a member of the Board, Compensation Committee and Executive Committee and Chair of the Audit Committee of Briggs & Stratton Corporation (manufacturing, 2011-2021), a member of the Board of Interstate Power and Light Company (2012-2019) and Wisconsin Power and Light Company (2012-2019) (each a subsidiary of Alliant Energy Corporation) and as a member of the Board and Workforce Development Committee of the Business Roundtable (2018-2019).
Thomas A. Kennedy (1955)
Year of Election or Appointment: 2021
Trustee
Mr. Kennedy also serves as Trustee of other Fidelity® funds. Previously, Mr. Kennedy served as a Member of the Advisory Board of certain Fidelity® funds (2020) and held a variety of positions at Raytheon Company (aerospace and defense, 1983-2020), including Chairman and Chief Executive Officer (2014-2020) and Executive Vice President and Chief Operating Officer (2013-2014). Mr. Kennedy served as Executive Chairman of the Board of Directors of Raytheon Technologies Corporation (aerospace and defense, 2020-2021). Mr. Kennedy serves as a Director of the Board of Directors of Textron Inc. (aerospace and defense, 2023-present).
Oscar Munoz (1959)
Year of Election or Appointment: 2021
Trustee
Mr. Munoz also serves as Trustee of other Fidelity® funds. Prior to his retirement, Mr. Munoz served as Executive Chairman (2020-2021), Chief Executive Officer (2015-2020), President (2015-2016) and a member of the Board (2010-2021) of United Airlines Holdings, Inc. Mr. Munoz currently serves as a member of the Board of CBRE Group, Inc. (commercial real estate, 2020-present), a member of the Board of Univision Communications, Inc. (Hispanic media, 2020-present), a member of the Board of Archer Aviation Inc. (2021-present), a member of the Defense Business Board of the United States Department of Defense (2021-present) and a member of the Board of Salesforce.com, Inc. (cloud-based software, 2022-present). Previously, Mr. Munoz served as a Member of the Advisory Board of certain Fidelity® funds (2021).
David M. Thomas (1949)
Year of Election or Appointment: 2008
Trustee
Lead Independent Trustee
Mr. Thomas also serves as Trustee of other Fidelity® funds. Previously, Mr. Thomas served as Executive Chairman (2005-2006) and Chairman and Chief Executive Officer (2000-2005) of IMS Health, Inc. (pharmaceutical and healthcare information solutions). Mr. Thomas currently serves as a member of the Board of Fortune Brands Home and Security (home and security products, 2004-present) and as Director (2013-present) and Non-Executive Chairman of the Board (2022-present) of Interpublic Group of Companies, Inc. (marketing communication).
Susan Tomasky (1953)
Year of Election or Appointment: 2020
Trustee
Ms. Tomasky also serves as Trustee of other Fidelity® funds. Prior to her retirement, Ms. Tomasky served in various executive officer positions at American Electric Power Company, Inc. (1998-2011), including most recently as President of AEP Transmission (2007-2011). Ms. Tomasky currently serves as a member of the Board and Sustainability Committee and as Chair of the Audit Committee of Marathon Petroleum Corporation (2018-present) and as a member of the Board, Executive Committee, Corporate Governance Committee and Organization and Compensation Committee and as Lead Director of the Board of Public Service Enterprise Group, Inc. (utilities company, 2012-present) and as a member of the Board of its subsidiary company, Public Service Electric and Gas Co. (2021-present). In addition, Ms. Tomasky currently serves as a member (2009-present) and President (2020-present) of the Board of the Royal Shakespeare Company - America (2009-present), as a member of the Board of the Columbus Association for the Performing Arts (2011-present) and as a member of the Board and Kenyon in the World Committee of Kenyon College (2016-present). Previously, Ms. Tomasky served as a Member of the Advisory Board of certain Fidelity® funds (2020), as a member of the Board of the Columbus Regional Airport Authority (2007-2020), as a member of the Board (2011-2018) and Lead Independent Director (2015-2018) of Andeavor Corporation (previously Tesoro Corporation) (independent oil refiner and marketer) and as a member of the Board of Summit Midstream Partners LP (energy, 2012-2018).
Michael E. Wiley (1950)
Year of Election or Appointment: 2020
Trustee
Mr. Wiley also serves as Trustee of other Fidelity® funds. Previously, Mr. Wiley served as a member of the Advisory Board of certain Fidelity® funds (2018-2020), Chairman, President and CEO of Baker Hughes, Inc. (oilfield services, 2000-2004). Mr. Wiley also previously served as a member of the Board of Andeavor Corporation (independent oil refiner and marketer, 2005-2018), a member of the Board of Andeavor Logistics LP (natural resources logistics, 2015-2018) and a member of the Board of High Point Resources (exploration and production, 2005-2020).
+ The information includes the Trustee's principal occupation during the last five years and other information relating to the experience, attributes, and skills relevant to the Trustee's qualifications to serve as a Trustee, which led to the conclusion that the Trustee should serve as a Trustee for the fund.
Advisory Board Members and Officers:
Correspondence intended for a Member of the Advisory Board (if any) may be sent to Fidelity Investments, P.O. Box 55235, Boston, Massachusetts 02205-5235. Correspondence intended for an officer or Peter S. Lynch may be sent to Fidelity Investments, 245 Summer Street, Boston, Massachusetts 02210.
Name, Year of Birth; Principal Occupation
Vijay C. Advani (1960)
Year of Election or Appointment: 2023
Member of the Advisory Board
Mr. Advani also serves as Trustee or Member of the Advisory Board of other funds. Previously, Mr. Advani served as Executive Chairman (2020-2022), Chief Executive Officer (2017-2020) and Chief Operating Officer (2016-2017) of Nuveen (global investment manager). He also served in various capacities at Franklin Resources (global investment manager), including Co-President (2015-2016), Executive Vice President, Global Advisory Services (2008-2015), Head of Global Retail Distribution (2005-2008), Executive Managing Director, International Retail Development (2002-2005), Managing Director, Product Developments, Sales & Marketing, Asia, Eastern Europe and Africa (2000-2002) and President, Templeton Asset Management India (1995-2000). Mr. Advani also served as Senior Investment Officer of International Finance Corporation (private equity and venture capital arm of The World Bank, 1984-1995). Mr. Advani is Chairman Emeritus of the U.S. India Business Council (2018-present), a Director of The Global Impact Investing Network (2019-present), a Director of LOK Capital (Mauritius) (2022-present), a member of the Advisory Council of LOK Capital (2022-present), a Senior Advisor of Neuberger Berman (2021-present), a Senior Advisor of Seviora Holdings Pte. Ltd (Temasek-Singapore) (2021-present), a Director of Seviora Capital (Singapore) (2021-present) and an Advisor of EQUIAM (2021-present). Mr. Advani formerly served as a member of the Board of BowX Acquisition Corp. (special purpose acquisition company, 2020-2021), a member of the Board of Intellecap (advisory arm of The Aavishkaar Group, 2018-2020), a member of the Board of Nuveen Investments, Inc. (2017-2020) and a member of the Board of Docusign (software, 2016-2019).
Peter S. Lynch (1944)
Year of Election or Appointment: 2003
Member of the Advisory Board
Mr. Lynch also serves as a Member of the Advisory Board of other Fidelity® funds. Mr. Lynch is Vice Chairman and a Director of Fidelity Management & Research Company LLC (investment adviser firm). In addition, Mr. Lynch serves as a Trustee of Boston College and as the Chairman of the Inner-City Scholarship Fund. Previously, Mr. Lynch served as Vice Chairman and a Director of FMR Co., Inc. (investment adviser firm) and on the Special Olympics International Board of Directors (1997-2006).
Karen B. Peetz (1955)
Year of Election or Appointment: 2023
Member of the Advisory Board
Ms. Peetz also serves as a Member of the Advisory Board of other funds. Previously, Ms. Peetz served as Chief Administration Officer (2020-2023) of Citigroup Inc. (a diversified financial service company). She also served in various capacities at Bank of New York Mellon Corporation, including President (2013-2016), Vice Chairman, Senior Executive Vice President and Chief Executive Officer of Financial Markets & Treasury Services (2010-2013), Senior Executive Vice President and Chief Executive Officer of Global Corporate Trust (2003-2008), Senior Vice President and Division Manager of Global Payments & Trade Services (2002-2003) and Senior Vice President and Division Manager of Domestic Corporate Trust (1998-2002). Ms. Peetz also served in various capacities at Chase Manhattan Corporation (1982-1998), including Senior Vice President and Manager of Corporate Trust International Business (1996-1998), Managing Director and Manager of Corporate Trust Services (1994-1996) and Managing Director and Group Manager of Financial Institution Sales (1990-1993). Ms. Peetz currently serves as Chair of Amherst Holdings Advisory Council (2018-present), Trustee of Johns Hopkins University (2016-present), Chair of the Carey Business School Advisory Council, Member of the Johns Hopkins Medicine Board and Finance Committee and Chair of the Lyme and Tick Related Disease Institute Advisory Council. Ms. Peetz previously served as a member of the Board of Guardian Life Insurance Company of America (2019-2023), a member of the Board of Trane Technologies (2018-2022), a member of the Board of Wells Fargo Corp. (2017-2019), a member of the Board of SunCoke Energy Inc. (2012-2016), a member of the Board of Private Export Funding Corporation (2010-2016) and as a Trustee of Penn State University (2010-2014) and the United Way of New York City (2008-2010).
Heather Bonner (1977)
Year of Election or Appointment: 2023
Assistant Treasurer
Ms. Bonner also serves as an officer of other funds. Ms. Bonner is a Senior Vice President (2022-present) and is an employee of Fidelity Investments (2022-present). Ms. Bonner serves as Vice President, Treasurer, or Assistant Treasurer of certain Fidelity entities. Prior to joining Fidelity, Ms. Bonner served as Managing Director at AQR Capital Management (2013-2022) and was the Treasurer and Principal Financial Officer of the AQR Funds (2013-2022).
Craig S. Brown (1977)
Year of Election or Appointment: 2022
Deputy Treasurer
Mr. Brown also serves as an officer of other funds. Mr. Brown is a Vice President (2015-present) and is an employee of Fidelity Investments. Mr. Brown serves as Assistant Treasurer of FIMM, LLC (2021-present). Previously, Mr. Brown served as Assistant Treasurer of certain Fidelity® funds (2019-2022).
John J. Burke III (1964)
Year of Election or Appointment: 2018
Chief Financial Officer
Mr. Burke also serves as Chief Financial Officer of other funds. Mr. Burke is Head of Fidelity Fund and Investment Operations (2018-present) and is an employee of Fidelity Investments. Mr. Burke serves as President, Executive Vice President, or Director of certain Fidelity entities. Previously Mr. Burke served as head of Asset Management Investment Operations (2012-2018).
Margaret Carey (1973)
Year of Election or Appointment: 2023
Secretary and Chief Legal Officer (CLO)
Ms. Carey also serves as an officer of other funds and as CLO of certain Fidelity entities. Ms. Carey is a Senior Vice President, Deputy General Counsel (2019-present) and is an employee of Fidelity Investments.
William C. Coffey (1969)
Year of Election or Appointment: 2019
Assistant Secretary
Mr. Coffey also serves as Assistant Secretary of other funds. Mr. Coffey is a Senior Vice President, Deputy General Counsel (2010-present) and is an employee of Fidelity Investments. Previously, Mr. Coffey served as Secretary and CLO of certain funds (2018-2019); CLO, Secretary, or Senior Vice President of certain Fidelity entities and Assistant Secretary of certain funds (2009-2018).
Timothy M. Cohen (1969)
Year of Election or Appointment: 2018
Vice President
Mr. Cohen also serves as Vice President of other funds. Mr. Cohen is Co-Head of Equity (2018-present) and is an employee of Fidelity Investments. Mr. Cohen serves a Director of Fidelity Management & Research (Japan) Limited (investment adviser firm, 2016-present). Previously, Mr. Cohen served as Executive Vice President of Fidelity SelectCo, LLC (2019) and Head of Global Equity Research (2016-2018).
Jonathan Davis (1968)
Year of Election or Appointment: 2010
Assistant Treasurer
Mr. Davis also serves as an officer of other funds. Mr. Davis is a Vice President (2006-present) and is an employee of Fidelity Investments. Mr. Davis serves as Assistant Treasurer of certain Fidelity entities.
Laura M. Del Prato (1964)
Year of Election or Appointment: 2018
Assistant Treasurer
Ms. Del Prato also serves as an officer of other funds. Ms. Del Prato is a Senior Vice President (2017-present) and is an employee of Fidelity Investments. Ms. Del Prato serves as Vice President or Assistant Treasurer of certain Fidelity entities. Previously, Ms. Del Prato served as President and Treasurer of The North Carolina Capital Management Trust: Cash Portfolio and Term Portfolio (2018-2020).
Colm A. Hogan (1973)
Year of Election or Appointment: 2020
Assistant Treasurer
Mr. Hogan also serves as an officer of other funds. Mr. Hogan is a Vice President (2016-present) and is an employee of Fidelity Investments. Mr. Hogan serves as Assistant Treasurer of certain Fidelity entities. Previously, Mr. Hogan served as Deputy Treasurer of certain Fidelity® funds (2016-2020) and Assistant Treasurer of certain Fidelity® funds (2016-2018).
Pamela R. Holding (1964)
Year of Election or Appointment: 2018
Vice President
Ms. Holding also serves as Vice President of other funds. Ms. Holding is Co-Head of Equity (2018-present) and is an employee of Fidelity Investments. Previously, Ms. Holding served as Executive Vice President of Fidelity SelectCo, LLC (2019) and as Chief Investment Officer of Fidelity Institutional Asset Management (2013-2018).
Chris Maher (1972)
Year of Election or Appointment: 2020
Deputy Treasurer
Mr. Maher also serves as an officer of other funds. Mr. Maher is a Vice President (2008-present) and is an employee of Fidelity Investments. Mr. Maher serves as Assistant Treasurer of certain Fidelity entities. Previously, Mr. Maher served as Assistant Treasurer of certain funds (2013-2020).
Jason P. Pogorelec (1975)
Year of Election or Appointment: 2020
Chief Compliance Officer
Mr. Pogorelec also serves as Chief Compliance Officer of other funds. Mr. Pogorelec is a Senior Vice President of Asset Management Compliance (2020-present) and is an employee of Fidelity Investments. Mr. Pogorelec serves as Compliance Officer of Fidelity Management & Research Company LLC (investment adviser firm, 2023-present) and Ballyrock Investment Advisors LLC (2023-present). Previously, Mr. Pogorelec served as a Vice President, Associate General Counsel for Fidelity Investments (2010-2020) and Assistant Secretary of certain Fidelity® funds (2015-2020).
Brett Segaloff (1972)
Year of Election or Appointment: 2021
Anti-Money Laundering (AML) Officer
Mr. Segaloff also serves as AML Officer of other funds. Mr. Segaloff is a Vice President (2022-present) and is an employee of Fidelity Investments. Mr. Segaloff serves as Anti Money Laundering Compliance Officer or Anti Money Laundering/Bank Secrecy Act Compliance Officer of certain Fidelity entities.
Stacie M. Smith (1974)
Year of Election or Appointment: 2016
President and Treasurer
Ms. Smith also serves as an officer of other funds. Ms. Smith is a Senior Vice President (2016-present) and is an employee of Fidelity Investments. Ms. Smith serves as Assistant Treasurer of certain Fidelity entities and has served in other fund officer roles.
Jim Wegmann (1979)
Year of Election or Appointment: 2019
Assistant Treasurer
Mr. Wegmann also serves as an officer of other funds. Mr. Wegmann is a Vice President (2016-present) and is an employee of Fidelity Investments. Mr. Wegmann serves as Assistant Treasurer of FIMM, LLC (2021-present). Previously, Mr. Wegmann served as Assistant Treasurer of certain Fidelity® funds (2019-2021).
As a shareholder, you incur two types of costs: (1) transaction costs, which may include sales charges (loads) on purchase payments or redemption proceeds, as applicable and (2) ongoing costs, which generally include management fees, distribution and/or service (12b-1) fees and other Fund expenses. This Example is intended to help you understand your ongoing costs (in dollars) of investing in a fund and to compare these costs with the ongoing costs of investing in other mutual funds.
| The Example is based on an investment of $1,000 invested at the beginning of the period and held for the entire period (May 1, 2023 to October 31, 2023). |
Actual Expenses
The first line of the accompanying table provides information about actual account values and actual expenses. You may use the information in this line, together with the amount you invested, to estimate the expenses that you paid over the period. Simply divide your account value by $1,000.00 (for example, an $8,600 account value divided by $1,000.00 = 8.6), then multiply the result by the number in the first line for a class/Fund under the heading entitled "Expenses Paid During Period" to estimate the expenses you paid on your account during this period. If any fund is a shareholder of any underlying mutual funds or exchange-traded funds (ETFs) (the Underlying Funds), such fund indirectly bears its proportional share of the expenses of the Underlying Funds in addition to the direct expenses incurred presented in the table. These fees and expenses are not included in the annualized expense ratio used to calculate the expense estimate in the table below.
Hypothetical Example for Comparison Purposes
The second line of the accompanying table provides information about hypothetical account values and hypothetical expenses based on the actual expense ratio and an assumed rate of return of 5% per year before expenses, which is not the actual return. The hypothetical account values and expenses may not be used to estimate the actual ending account balance or expenses you paid for the period. You may use this information to compare the ongoing costs of investing in the Fund and other funds. To do so, compare this 5% hypothetical example with the 5% hypothetical examples that appear in the shareholder reports of the other funds. If any fund is a shareholder of any Underlying Funds, such fund indirectly bears its proportional share of the expenses of the Underlying Funds in addition to the direct expenses as presented in the table. These fees and expenses are not included in the annualized expense ratio used to calculate the expense estimate in the table below.
Please note that the expenses shown in the table are meant to highlight your ongoing costs only and do not reflect any transaction costs. Therefore, the second line of the table is useful in comparing ongoing costs only, and will not help you determine the relative total costs of owning different funds. In addition, if these transactional costs were included, your costs would have been higher.
| | | | | Annualized Expense Ratio- A | | Beginning Account Value May 1, 2023 | | Ending Account Value October 31, 2023 | | Expenses Paid During Period- C May 1, 2023 to October 31, 2023 |
| | | | | | | | | | |
| Fidelity® SAI Sustainable Emerging Markets Equity Fund | | | | .95% | | | | | | |
| Actual | | | | | | $ 1,000 | | $ 950.10 | | $ 4.67 |
Hypothetical-B | | | | | | $ 1,000 | | $ 1,020.42 | | $ 4.84 |
| |
A Annualized expense ratio reflects expenses net of applicable fee waivers.
B 5% return per year before expenses
C Expenses are equal to the annualized expense ratio, multiplied by the average account value over the period, multiplied by 184/ 365 (to reflect the one-half year period). The fees and expenses of any Underlying Funds are not included in each annualized expense ratio.
The dividend and capital gains distributions for the fund(s) are available on Fidelity.com or Institutional.Fidelity.com.
The fund designates $388 of distributions paid during the fiscal year ended 2023 as qualifying to be taxed as section 163(j) interest dividends.
The fund designates 92.62% and 82.24%, of the dividends distributed in December during the fiscal year as amounts which may be taken into account as a dividend for the purposes of the maximum rate under section 1(h)(11) of the Internal Revenue Code.
The amounts per share which represent income derived from sources within, and taxes paid to, foreign countries or possessions of the United States are $.0816 and $.0116, and $.0028 and $.0000 for the dividends paid December 12, 2022 and December 29, 2022, respectively.
The fund will notify shareholders in January 2024 of amounts for use in preparing 2023 income tax returns.
Board Approval of Investment Advisory Contracts and Management Fees
Fidelity SAI Sustainable Emerging Markets Equity Fund
Each year, the Board of Trustees, including the Independent Trustees (together, the Board), considers the renewal of the fund's management contract with Fidelity Management & Research Company LLC (FMR) and the sub-advisory agreements (together, the Advisory Contracts) for the fund. FMR and the sub-advisers are referred to herein as the Investment Advisers. The Board, assisted by the advice of fund counsel and Independent Trustees' counsel, requests and considers a broad range of information relevant to the renewal of the Advisory Contracts throughout the year.
The Board meets regularly and, at each of its meetings, covers an extensive agenda of topics and materials and considers factors that are relevant to its annual consideration of the renewal of the fund's Advisory Contracts, including the services and support provided to the fund and its shareholders. The Board, acting directly and through its Committees (each of which is composed of and chaired by Independent Trustees), requests and receives information concerning the annual consideration of the renewal of the fund's Advisory Contracts. The Board also meets as needed to review matters specifically related to the Board's annual consideration of the renewal of the Advisory Contracts. Members of the Board may also meet with trustees of other Fidelity funds through joint ad hoc committees to discuss certain matters relevant to all of the Fidelity funds.
Approval of Stub Period Continuation. At its May 2023 meeting, the Board of Trustees voted to continue the fund's management contract with FMR, and the sub-advisory agreements and sub-sub-advisory agreements, in each case, where applicable (together, the Advisory Contracts), without modification, for two months from June 1, 2023 through July 31, 2023. The Board considered that the approval of the fund's Advisory Contracts will not result in any changes in (i) the investment process or strategies employed in the management of the fund's assets; (ii) the fees and expenses paid by shareholders; (iii) the nature, extent or quality of services provided under the fund's Advisory Contracts; or (iv) the day-to-day management of the fund or the persons primarily responsible for such management. The Board also considered that since its last approval of the fund's Advisory Contracts, FMR had provided additional information on the fund in support of the annual contract renewal process, including competitive analyses on total expenses and management fees and in-depth reviews of fund performance and fund profitability information. The Board concluded that the fund's Advisory Contracts are fair and reasonable, and that the fund's Advisory Contracts should be renewed, without modification, through July 31, 2023, with the understanding that the Board would consider the annual renewal for a full one year period in July 2023.
At its July 2023 meeting, the Board unanimously determined to renew the fund's Advisory Contracts. In reaching its determination, the Board considered all factors it believed relevant, including (i) the nature, extent, and quality of the services provided to the fund and its shareholders (including the investment performance of the fund); (ii) the competitiveness relative to peer funds of the fund's management fee and total expense ratio; (iii) the total costs of the services provided by and the profits realized by FMR and its affiliates (Fidelity) from its relationships with the fund; and (iv) the extent to which, if any, economies of scale exist and are realized as the fund grows, and whether any economies of scale are appropriately shared with fund shareholders. The Board also considered the broad range of investment choices available to shareholders from FMR's competitors and that the fund's shareholders have chosen to invest in the fund, which is part of the Fidelity family of funds. The Board's decision to renew the Advisory Contracts was not based on any single factor.
The Board reached a determination, with the assistance of fund counsel and Independent Trustees' counsel and through the exercise of its business judgment, that the renewal of the Advisory Contracts was in the best interests of the fund and its shareholders and that the compensation payable under the Advisory Contracts was fair and reasonable in light of all of the surrounding circumstances.
Nature, Extent, and Quality of Services Provided. The Board considered staffing as it relates to the fund, including the backgrounds and experience of investment personnel of the Investment Advisers, and also considered the Investment Advisers' implementation of the fund's investment program. The Independent Trustees also had discussions with senior management of Fidelity's investment operations and investment groups. The Board considered the structure of the investment personnel compensation program and whether this structure provides appropriate incentives to act in the best interests of the fund. Additionally, the Board considered the portfolio managers' investments, if any, in the funds that they manage.
Resources Dedicated to Investment Management and Support Services. The Board and the Fund Oversight and Research Committees reviewed the general qualifications and capabilities of Fidelity's investment staff, including its size, education, experience, and resources, as well as Fidelity's approach to recruiting, training, managing, and compensating investment personnel. The Board noted the resources devoted to expansion of Fidelity's global investment organization, and that Fidelity's analysts have extensive resources, tools, and capabilities that allow them to conduct sophisticated quantitative and fundamental analysis, as well as credit analysis of issuers, counterparties, and guarantors. Further, the Board considered that Fidelity's investment professionals have sufficient access to global information and data so as to provide competitive investment results over time, and that those professionals also have access to sophisticated tools that permit them to assess portfolio construction and risk and performance attribution characteristics continuously, as well as to transmit new information and research conclusions rapidly around the world. Additionally, in its deliberations, the Board considered Fidelity's trading, risk management, compliance, and technology and operations capabilities and resources, which are integral parts of the investment management process.
Shareholder and Administrative Services. The Board considered (i) the nature, extent, quality, and cost of advisory, administrative, and shareholder services performed by the Investment Advisers and their affiliates under the Advisory Contracts and under separate agreements covering transfer agency, pricing and bookkeeping, and securities lending services for the fund; (ii) the nature and extent of Fidelity's supervision of third party service providers, principally custodians, subcustodians, and pricing vendors; and (iii) the resources devoted by Fidelity to, and the record of compliance with, the fund's compliance policies and procedures. The Board also reviewed the allocation of fund brokerage, including allocations to brokers affiliated with the Investment Advisers, the use of brokerage commissions to pay fund expenses, and the use of "soft" commission dollars to pay for research services. The Board also considered the fund's securities lending activities and any payments made to Fidelity relating to securities lending.
The Board noted that the growth of fund assets over time across the complex allows Fidelity to reinvest in the development of services designed to enhance the value and convenience of the Fidelity funds as investment vehicles. These services include 24-hour access to account information and market information over the Internet and through telephone representatives, investor education materials, and asset allocation tools. The Board also considered that it reviews customer service metrics such as telephone response times, continuity of services on the website and metrics addressing services at Fidelity Investor Centers.
Investment in a Large Fund Family. The Board considered the benefits to shareholders of investing in a fund that is part of a large family of funds offering a variety of investment disciplines and providing a large variety of fund investor services. The Board noted that Fidelity had taken, or had made recommendations that resulted in the Fidelity funds taking, a number of actions over the previous year that benefited particular funds and/or the Fidelity funds in general.
Investment Performance. The Board took into account discussions that occur with representatives of the Investment Advisers, and reports that it receives, at Board meetings throughout the year, relating to fund investment performance. In this regard the Board noted that as part of regularly scheduled fund reviews and other reports to the Board on fund performance, the Board considered annualized return information for the fund for different time periods, measured against an appropriate securities market index (benchmark index) and an appropriate peer group of funds with similar objectives (peer group). The Board also considered information about performance attribution. In its ongoing evaluation of fund investment performance, the Board gives particular attention to information indicating changes in performance of the funds over different time periods and discussed with the Investment Advisers the reasons for any overperformance or underperformance.
In addition to reviewing absolute and relative fund performance, the Independent Trustees periodically consider the appropriateness of fund performance metrics in evaluating the results achieved. The Independent Trustees generally give greater weight to fund performance over longer time periods than over shorter time periods. Depending on the circumstances, the Independent Trustees may be satisfied with a fund's performance notwithstanding that it lags its benchmark index or peer group for certain periods.
Based on its review, the Board concluded that the nature, extent, and quality of services provided to the fund under the Advisory Contracts should continue to benefit the shareholders of the fund.
Competitiveness of Management Fee and Total Expense Ratio. The Board was provided with information regarding industry trends in management fees and expenses. In its review of the fund's management fee and total expense ratio, the Board considered the fund's management fee rate as well as other fund expenses, such as transfer agent fees, pricing and bookkeeping fees, and custodial, legal, and audit fees. The Board noted that Fidelity may agree to waive fees or reimburse expenses from time to time, and the extent to which, if any, it has done so for the fund.
Comparisons of Management Fees and Total Expense Ratios. Among other things, the Board reviewed data for selected groups of competitive funds and classes (referred to as "mapped groups") that were compiled by Fidelity based on combining similar investment objective categories (as classified by Lipper) that have comparable investment mandates. The data reviewed by the Board included (i) gross management fee comparisons (before taking into account expense reimbursements or caps) relative to the total universe of funds within the mapped group; (ii) gross management fee comparisons relative to a subset of non-Fidelity funds in the mapped group that are similar in size and management fee structure to the fund (referred to as the "asset size peer group"); (iii) total expense comparisons of the fund relative to funds and classes in the mapped group that have a similar sales load structure to the fund (referred to as the "similar sales load structure group"); and (iv) total expense comparisons of the fund relative to funds and classes in the similar sales load structure group that are similar in size and management fee structure to the fund (referred to as the "total expense asset size peer group"). The total expense asset size peer group comparison excludes performance adjustments and fund-paid 12b-1 fees to eliminate variability in fee structures.
The information provided to the Board indicated that the fund's management fee rate ranked below the competitive median of the mapped group for the period ended September 30, 2022 and below the competitive median of the asset size peer group for the period ended September 30, 2022. Further, the information provided to the Board indicated that the total expense ratio of the fund ranked below the competitive median of the similar sales load structure group for the period ended September 30, 2022 and below the competitive median of the total expense asset size peer group for the period ended September 30, 2022.
The Board also considered that, for funds subject to the group fee, FMR agreed to voluntarily waive fees over a specified period of time in amounts designed to account for assets converted from certain funds to certain collective investment trusts.
Fees Charged to Other Fidelity Clients. The Board also considered Fidelity fee structures and other information with respect to clients of Fidelity, such as other funds advised or subadvised by Fidelity, pension plan clients, and other institutional clients with similar mandates. The Board noted that a joint ad hoc committee created by it and the boards of other Fidelity funds periodically reviews and compares Fidelity's institutional investment advisory business with its business of providing services to the Fidelity funds and also noted the most recent findings of the committee. The Board noted that the committee's review included a consideration of the differences in services provided, fees charged, and costs incurred, as well as competition in the markets serving the different categories of clients.
Based on its review, the Board concluded that the fund's management fee is fair and reasonable in light of the services that the fund receives and the other factors considered. Further, based on its review of total expense ratios and fees charged to other Fidelity clients, the Board concluded that the fund's total expense ratio was reasonable in light of the services that the fund and its shareholders receive and the other factors considered.
Costs of the Services and Profitability. The Board considered the revenues earned and the expenses incurred by Fidelity in conducting the business of developing, marketing, distributing, managing, administering and servicing the fund and servicing the fund's shareholders. The Board also considered the level of Fidelity's profits in respect of all the Fidelity funds.
On an annual basis, Fidelity presents to the Board information about the profitability of its relationships with the fund. Fidelity calculates profitability information for each fund, as well as aggregate profitability information for groups of Fidelity funds and all Fidelity funds, using a series of detailed revenue and cost allocation methodologies which originate with the books and records of Fidelity on which Fidelity's audited financial statements are based. The Audit Committee of the Board reviews any significant changes from the prior year's methodologies and the full Board approves such changes.
A public accounting firm has been engaged annually by the Board as part of the Board's assessment of Fidelity's profitability analysis. The engagement includes the review and assessment of the methodologies used by Fidelity in determining the revenues and expenses attributable to Fidelity's fund business, and completion of agreed-upon procedures in respect of the mathematical accuracy of certain fund profitability information and its conformity to established allocation methodologies. After considering the reports issued under the engagement and information provided by Fidelity, the Board concluded that while other allocation methods may also be reasonable, Fidelity's profitability methodologies are reasonable in all material respects.
The Board also reviewed Fidelity's non-fund businesses and potential indirect benefits such businesses may have received as a result of their association with Fidelity's fund business (i.e., fall-out benefits) as well as cases where Fidelity's affiliates may benefit from the funds' business. The Board considered areas where potential indirect benefits to the Fidelity funds from their relationships with Fidelity may exist. The Board's consideration of these matters was informed by the findings of a joint ad hoc committee created by it and the boards of other Fidelity funds to evaluate potential fall-out benefits.
The Board considered the costs of the services provided by and the profits realized by Fidelity in connection with the operation of the fund and was satisfied that the profitability was not excessive.
Economies of Scale. The Board considered whether there have been economies of scale in respect of the management of the Fidelity funds, whether the Fidelity funds (including the fund) have appropriately benefited from any such economies of scale, and whether there is potential for realization of any further economies of scale. The Board considered the extent to which the fund will benefit from economies of scale as assets grow through increased services to the fund, through waivers or reimbursements, or through fee or expense ratio reductions. The Board also noted that a committee (the Economies of Scale Committee) created by it and the boards of other Fidelity funds periodically analyzes whether Fidelity attains economies of scale in respect of the management and servicing of the Fidelity funds, whether the Fidelity funds have appropriately benefited from such economies of scale, and whether there is potential for realization of any further economies of scale.
The Board recognized that the fund's management contract incorporates a "group fee" structure, which provides for lower group fee rates as total "group assets" increase, and for higher group fee rates as total "group assets" decrease ("group assets" as defined in the management contract). FMR calculates the group fee rates based on a tiered asset "breakpoint" schedule that varies based on asset class. The Board considered that the group fee is designed to deliver the benefits of economies of scale to fund shareholders when total Fidelity fund assets increase, even if assets of any particular fund are unchanged or have declined, because some portion of Fidelity's costs are attributable to services provided to all Fidelity funds, and all funds benefit if those costs can be allocated among more assets. The Board further considered that Fidelity agreed to impose a temporary fee waiver in the form of additional breakpoints to the current breakpoint schedule. The Board concluded that, given the group fee structure, fund shareholders will benefit from lower management fees as "group assets" increase at the fund complex level, regardless of whether Fidelity achieves any such economies of scale.
The Board concluded, taking into account the analysis of the Economies of Scale Committee, that economies of scale, if any, are being appropriately shared between fund shareholders and Fidelity.
Additional Information Requested by the Board. In order to develop fully the factual basis for consideration of the Fidelity funds' advisory contracts, the Board requested and received additional information on certain topics, including: (i) fund flow and performance trends, in particular the underperformance of certain funds and strategies, and Fidelity's long-term strategies for certain funds, including any consideration of fund liquidations or mergers; (ii) the operation of performance fees and competitor use of performance fees; (iii) Fidelity's pricing philosophy compared to competitors; (iv) fund profitability methodology and data; (v) evaluation of competitive fund data and peer group classifications and fee and expense comparisons; (vi) the management fee and expense structures for different funds and classes and information about the differences between various fee and expense structures; (vii) group fee breakpoints and related voluntary fee waivers; and (viii) information regarding other accounts managed by Fidelity and the funds' sub-advisory arrangements.
Conclusion. Based on its evaluation of all of the conclusions noted above, and after considering all factors it believed relevant, the Board, including the Independent Trustees, concluded that the advisory and sub-advisory fee arrangements are fair and reasonable in light of all of the surrounding circumstances and that the fund's Advisory Contracts should be renewed through July 31, 2024.
1.9905647.101
ESP-ANN-1223
Fidelity® Enduring Opportunities Fund
Annual Report
October 31, 2023
Contents
To view a fund's proxy voting guidelines and proxy voting record for the 12-month period ended June 30, visit http://www.fidelity.com/proxyvotingresults or visit the Securities and Exchange Commission's (SEC) web site at http://www.sec.gov.
You may also call 1-800-544-8544 to request a free copy of the proxy voting guidelines.
Standard & Poor's, S&P and S&P 500 are registered service marks of The McGraw-Hill Companies, Inc. and have been licensed for use by Fidelity Distributors Corporation.
Other third-party marks appearing herein are the property of their respective owners.
All other marks appearing herein are registered or unregistered trademarks or service marks of FMR LLC or an affiliated company. © 2023 FMR LLC. All rights reserved.
This report and the financial statements contained herein are submitted for the general information of the shareholders of the Fund. This report is not authorized for distribution to prospective investors in the Fund unless preceded or accompanied by an effective prospectus.
A fund files its complete schedule of portfolio holdings with the SEC for the first and third quarters of each fiscal year on Form N-PORT. Forms N-PORT are available on the SEC's web site at http://www.sec.gov. A fund's Forms N-PORT may be reviewed and copied at the SEC's Public Reference Room in Washington, DC. Information regarding the operation of the SEC's Public Reference Room may be obtained by calling 1-800-SEC-0330.
For a complete list of a fund's portfolio holdings, view the most recent holdings listing, semiannual report, or annual report on Fidelity's web site at http://www.fidelity.com, http://www.institutional.fidelity.com, or http://www.401k.com, as applicable.
NOT FDIC INSURED •MAY LOSE VALUE •NO BANK GUARANTEE
Neither the Fund nor Fidelity Distributors Corporation is a bank.
Average annual total return reflects the change in the value of an investment, assuming reinvestment of distributions from dividend income and capital gains (the profits earned upon the sale of securities that have grown in value, if any) and assuming a constant rate of performance each year. The hypothetical investment and the average annual total returns do not reflect the deduction of taxes that a shareholder would pay on fund distributions or the redemption of fund shares. During periods of reimbursement by Fidelity, a fund's total return will be greater than it would be had the reimbursement not occurred. How a fund did yesterday is no guarantee of how it will do tomorrow.
| Average Annual Total Returns |
| | | | |
Periods ended October 31, 2023 | Past 1 year | Life of Fund A |
| Fidelity® Enduring Opportunities Fund | 9.96% | 5.48% |
A From November 5, 2019
| $10,000 Over Life of Fund |
| |
Let's say hypothetically that $10,000 was invested in Fidelity® Enduring Opportunities Fund, on November 5, 2019, when the fund started. The chart shows how the value of your investment would have changed, and also shows how the MSCI ACWI (All Country World Index) Index performed over the same period. |
|
|
Market Recap:
Global equities gained 10.91% for the 12 months ending October 31, 2023, according to the MSCI All Country World Index, as global economic expansion and a slowing in the pace of inflation in some markets provided a favorable backdrop for risk assets. After returning -18.07% in 2022, the index's upturn has been largely driven by a narrow set of companies in the information technology and communication services sectors, in part due to excitement for generative artificial intelligence applications. The index gained 18.36% year to date through July, including gains in June (+5.83%) and July (+3.68%). The rally for international equities sputtered for the next three months (-9.54%) amid a stalling pattern in disinflationary trends, heightened global recession and geopolitical risks, soaring yields on longer-term U.S. government bonds, and particularly weak economic conditions in the eurozone and China. Still, the three-month decline left global stocks up 7.07% year to date through October. Currency fluctuation also bolstered non-U.S. equity performance overall. For the full 12 months, nearly all regions advanced, with Europe ex U.K. (+18%) and Japan (+17%) leading, whereas Canada (-0.38%) lagged by the widest margin, while the U.S. middled (+10%). All but three of 11 sectors advanced, with information technology (+29%) and communication services (+27%) leading. Conversely, the real estate sector (-3%) lagged most, followed by health care and utilities (-1% each).
Comments from Co-Manager Michael Kim:
For the fiscal year ending October 31, 2023, the fund gained 9.96%, versus 10.91% for the benchmark MSCI All Country World Index (Net MA). From a regional standpoint, stock picking in Japan and Europe ex the U.K., primarily in Italy, detracted from the fund's relative result. By sector, security selection was the primary detractor, especially within financials, where our stock selection in banks hurt most. Stock picking in industrials, primarily within the capital goods industry, and in information technology, primarily within the semiconductors & semiconductor equipment industry, also hampered the fund's result. An overweight in real estate, especially within the equity real estate investment trusts (REITs) industry, further detracted. The largest individual relative detractor was an average underweight in Nvidia (+202%). Nvidia was an investment we established during the 12-month period and was among the fund's biggest holdings at period end. A small stake in SVB Financial Group returned -100% and was a second notable relative detractor. Avoiding Broadcom, a benchmark component that gained 84%, also hurt. In contrast, from a regional standpoint, stock picking in Canada and an underweight in emerging markets contributed to the fund's performance versus the benchmark. By sector, the biggest contributor was an underweight in health care, primarily within the pharmaceuticals, biotechnology & life sciences industry. Security selection and an underweight in consumer staples, primarily within the food, beverage & tobacco industry, and picks and an overweight in consumer discretionary, primarily within the consumer durables & apparel industry, also boosted the fund's relative performance. The top individual relative contributor was an overweight in Meta Platforms (+223%), a stock that was one of the fund's largest holdings. The second-largest contributor was a non-benchmark stake in Qualitas Controlado (+120%). Avoiding Pfizer, a benchmark component that returned about -32%, also helped. By sector, meaningful changes in positioning include lower allocations to the consumer staples and health care sectors.
Note to shareholders:
On December 27, 2022, Fahim Razzaque came off of the fund.
On June 30, 2023, Risteard Hogan assumed co-management responsibilities for the fund, succeeding Christopher Lee.
The views expressed above reflect those of the portfolio manager(s) only through the end of the period as stated on the cover of this report and do not necessarily represent the views of Fidelity or any other person in the Fidelity organization. Any such views are subject to change at any time based upon market or other conditions and Fidelity disclaims any responsibility to update such views. These views may not be relied on as investment advice and, because investment decisions for a Fidelity fund are based on numerous factors, may not be relied on as an indication of trading intent on behalf of any Fidelity fund.
Top Holdings (% of Fund's net assets) |
| |
| Microsoft Corp. | 4.4 | |
| Amazon.com, Inc. | 2.5 | |
| NVIDIA Corp. | 2.0 | |
| Meta Platforms, Inc. Class A | 1.5 | |
| Alphabet, Inc. Class A | 1.4 | |
| Alphabet, Inc. Class C | 1.3 | |
| Tesla, Inc. | 1.3 | |
| UnitedHealth Group, Inc. | 1.2 | |
| Visa, Inc. Class A | 1.0 | |
| JPMorgan Chase & Co. | 1.0 | |
| | 17.6 | |
| |
| Market Sectors (% of Fund's net assets) |
| |
| Information Technology | 20.6 | |
| Consumer Discretionary | 18.9 | |
| Industrials | 15.1 | |
| Financials | 12.1 | |
| Communication Services | 7.7 | |
| Health Care | 7.7 | |
| Consumer Staples | 5.5 | |
| Materials | 4.3 | |
| Real Estate | 4.2 | |
| Energy | 2.2 | |
| Utilities | 0.6 | |
| |
Asset Allocation (% of Fund's net assets) |
|
|
Geographic Diversification (% of Fund's net assets) |
|
* Includes Short-Term investments and Net Other Assets (Liabilities). Percentages are adjusted for the effect of derivatives, if applicable. |
| |
Showing Percentage of Net Assets
| Common Stocks - 98.5% |
| | | Shares | Value ($) |
| COMMUNICATION SERVICES - 7.7% | | | |
| Diversified Telecommunication Services - 0.1% | | | |
| Elisa Corp. (A Shares) | | 363 | 15,394 |
| Entertainment - 1.3% | | | |
| Netflix, Inc. (a) | | 167 | 68,752 |
| Sea Ltd. ADR (a) | | 418 | 17,431 |
| The Walt Disney Co. (a) | | 684 | 55,808 |
| | | | 141,991 |
| Interactive Media & Services - 6.1% | | | |
| Adevinta ASA Class B (a) | | 2,741 | 24,058 |
| Alphabet, Inc.: | | | |
| Class A (a) | | 1,253 | 155,472 |
| Class C (a) | | 1,127 | 141,213 |
| Hemnet Group AB | | 1,213 | 21,049 |
| Kakao Corp. | | 572 | 16,098 |
| LY Corp. | | 7,791 | 19,863 |
| Match Group, Inc. (a) | | 920 | 31,832 |
| Meta Platforms, Inc. Class A (a) | | 549 | 165,397 |
| NAVER Corp. | | 163 | 22,754 |
| Rightmove PLC | | 2,316 | 13,315 |
| Tencent Holdings Ltd. | | 1,889 | 69,910 |
| | | | 680,961 |
| Media - 0.2% | | | |
| Schibsted ASA (A Shares) | | 957 | 19,121 |
TOTAL COMMUNICATION SERVICES | | | 857,467 |
| CONSUMER DISCRETIONARY - 18.9% | | | |
| Automobile Components - 0.5% | | | |
| Aptiv PLC (a) | | 330 | 28,776 |
| DENSO Corp. | | 2,052 | 30,301 |
| | | | 59,077 |
| Automobiles - 2.3% | | | |
| Ferrari NV (Italy) | | 86 | 25,980 |
| Maruti Suzuki India Ltd. | | 277 | 34,581 |
| Tesla, Inc. (a) | | 700 | 140,588 |
| Toyota Motor Corp. | | 3,324 | 58,149 |
| | | | 259,298 |
| Broadline Retail - 3.4% | | | |
| Amazon.com, Inc. (a) | | 2,058 | 273,899 |
| B&M European Value Retail SA | | 4,042 | 25,979 |
| Dollarama, Inc. | | 393 | 26,838 |
| MercadoLibre, Inc. (a) | | 27 | 33,500 |
| Prosus NV | | 642 | 18,095 |
| | | | 378,311 |
| Diversified Consumer Services - 0.3% | | | |
| Duolingo, Inc. (a) | | 192 | 28,042 |
| Hotels, Restaurants & Leisure - 4.3% | | | |
| Amadeus IT Holding SA Class A | | 496 | 28,246 |
| Chipotle Mexican Grill, Inc. (a) | | 28 | 54,382 |
| Churchill Downs, Inc. | | 382 | 41,959 |
| Compass Group PLC | | 1,215 | 30,632 |
| Domino's Pizza, Inc. | | 99 | 33,560 |
| Doordash, Inc. (a) | | 524 | 39,274 |
| Flutter Entertainment PLC (a) | | 104 | 16,313 |
| Hilton Worldwide Holdings, Inc. | | 336 | 50,914 |
| Oriental Land Co. Ltd. | | 972 | 31,440 |
| Restaurant Brands Asia Ltd. (a) | | 12,252 | 16,404 |
| Vail Resorts, Inc. | | 131 | 27,805 |
| Wingstop, Inc. | | 227 | 41,489 |
| Yum! Brands, Inc. | | 311 | 37,587 |
| Zomato Ltd. (a) | | 21,289 | 26,919 |
| | | | 476,924 |
| Household Durables - 0.6% | | | |
| Berkeley Group Holdings PLC | | 397 | 19,475 |
| Maytronics Ltd. | | 1,154 | 10,735 |
| NVR, Inc. (a) | | 7 | 37,888 |
| | | | 68,098 |
| Leisure Products - 0.3% | | | |
| Roland Corp. | | 647 | 18,707 |
| SHIMANO, Inc. | | 129 | 18,564 |
| | | | 37,271 |
| Specialty Retail - 4.4% | | | |
| Carvana Co. Class A (a) | | 920 | 24,840 |
| Fast Retailing Co. Ltd. | | 136 | 30,110 |
| Five Below, Inc. (a) | | 218 | 37,928 |
| Floor & Decor Holdings, Inc. Class A (a) | | 404 | 33,290 |
| Lowe's Companies, Inc. | | 311 | 59,267 |
| National Vision Holdings, Inc. (a) | | 2,141 | 33,271 |
| Nitori Holdings Co. Ltd. | | 184 | 19,926 |
| The Home Depot, Inc. | | 295 | 83,984 |
| TJX Companies, Inc. | | 596 | 52,490 |
| Ulta Beauty, Inc. (a) | | 99 | 37,750 |
| Wayfair LLC Class A (a) | | 635 | 27,057 |
| WH Smith PLC | | 1,154 | 16,271 |
| Workman Co. Ltd. | | 659 | 16,978 |
| ZOZO, Inc. | | 833 | 15,839 |
| | | | 489,001 |
| Textiles, Apparel & Luxury Goods - 2.8% | | | |
| adidas AG | | 108 | 19,107 |
| Hermes International SCA | | 16 | 29,789 |
| lululemon athletica, Inc. (a) | | 196 | 77,122 |
| LVMH Moet Hennessy Louis Vuitton SE | | 80 | 57,274 |
| Moncler SpA | | 333 | 17,244 |
| NIKE, Inc. Class B | | 481 | 49,432 |
| Prada SpA | | 2,910 | 17,530 |
| PVH Corp. | | 335 | 24,907 |
| Shenzhou International Group Holdings Ltd. | | 1,715 | 16,846 |
| | | | 309,251 |
TOTAL CONSUMER DISCRETIONARY | | | 2,105,273 |
| CONSUMER STAPLES - 5.5% | | | |
| Beverages - 1.3% | | | |
| Ambev SA | | 9,685 | 24,704 |
| Davide Campari Milano NV | | 1,556 | 17,172 |
| Kweichow Moutai Co. Ltd. (A Shares) | | 115 | 26,491 |
| Monster Beverage Corp. | | 783 | 40,011 |
| Pernod Ricard SA | | 167 | 29,598 |
| | | | 137,976 |
| Consumer Staples Distribution & Retail - 2.8% | | | |
| Alimentation Couche-Tard, Inc. Class A (multi-vtg.) | | 518 | 28,198 |
| Casey's General Stores, Inc. | | 164 | 44,593 |
| Clicks Group Ltd. | | 1,582 | 23,312 |
| Cosmos Pharmaceutical Corp. | | 150 | 15,610 |
| Costco Wholesale Corp. | | 168 | 92,810 |
| Wal-Mart de Mexico SA de CV Series V | | 8,533 | 30,542 |
| Walmart, Inc. | | 487 | 79,581 |
| | | | 314,646 |
| Food Products - 0.5% | | | |
| Freshpet, Inc. (a) | | 482 | 27,667 |
| McCormick & Co., Inc. (non-vtg.) | | 399 | 25,496 |
| | | | 53,163 |
| Household Products - 0.2% | | | |
| Unicharm Corp. | | 664 | 22,562 |
| Personal Care Products - 0.7% | | | |
| Hindustan Unilever Ltd. | | 887 | 26,463 |
| L'Oreal SA | | 97 | 40,772 |
| Shiseido Co. Ltd. | | 471 | 14,938 |
| | | | 82,173 |
TOTAL CONSUMER STAPLES | | | 610,520 |
| ENERGY - 2.2% | | | |
| Energy Equipment & Services - 0.5% | | | |
| Schlumberger Ltd. | | 1,026 | 57,107 |
| Oil, Gas & Consumable Fuels - 1.7% | | | |
| Cheniere Energy, Inc. | | 260 | 43,269 |
| Hess Corp. | | 322 | 46,497 |
| Parkland Corp. | | 761 | 23,032 |
| PrairieSky Royalty Ltd. | | 2,270 | 39,859 |
| Reliance Industries Ltd. | | 1,219 | 33,510 |
| | | | 186,167 |
TOTAL ENERGY | | | 243,274 |
| FINANCIALS - 12.1% | | | |
| Banks - 2.7% | | | |
| Bank of America Corp. | | 2,432 | 64,059 |
| Credicorp Ltd. (United States) | | 253 | 31,615 |
| FinecoBank SpA | | 1,536 | 18,065 |
| JPMorgan Chase & Co. | | 786 | 109,301 |
| KBC Group NV | | 396 | 21,746 |
| PNC Financial Services Group, Inc. | | 278 | 31,823 |
| PT Bank Central Asia Tbk | | 53,349 | 29,391 |
| | | | 306,000 |
| Capital Markets - 3.5% | | | |
| Avanza Bank Holding AB | | 742 | 12,497 |
| Banca Generali SpA | | 585 | 18,953 |
| Bolsa Mexicana de Valores S.A.B. de CV | | 13,232 | 20,631 |
| Brookfield Corp. (Canada) Class A | | 823 | 23,976 |
| Charles Schwab Corp. | | 796 | 41,424 |
| CME Group, Inc. | | 209 | 44,613 |
| HUB24 Ltd. | | 1,140 | 22,011 |
| Moody's Corp. | | 120 | 36,960 |
| Morningstar, Inc. | | 154 | 38,999 |
| Netwealth Group Ltd. | | 1,886 | 15,324 |
| Nordnet AB | | 1,221 | 17,228 |
| Partners Group Holding AG | | 19 | 19,985 |
| S&P Global, Inc. | | 147 | 51,349 |
| VZ Holding AG | | 239 | 23,436 |
| | | | 387,386 |
| Financial Services - 2.5% | | | |
| Adyen BV (a)(b) | | 30 | 20,235 |
| Block, Inc. Class A (a) | | 528 | 21,252 |
| Edenred SA | | 403 | 21,423 |
| Fiserv, Inc. (a) | | 411 | 46,751 |
| Flywire Corp. (a) | | 1,282 | 34,473 |
| Visa, Inc. Class A | | 469 | 110,262 |
| Zenkoku Hosho Co. Ltd. | | 657 | 21,010 |
| | | | 275,406 |
| Insurance - 3.4% | | | |
| American Financial Group, Inc. | | 313 | 34,230 |
| Arch Capital Group Ltd. (a) | | 378 | 32,765 |
| Arthur J. Gallagher & Co. | | 185 | 43,566 |
| Assurant, Inc. | | 240 | 35,736 |
| Chubb Ltd. | | 268 | 57,518 |
| Globe Life, Inc. | | 313 | 36,421 |
| Hannover Reuck SE | | 142 | 31,297 |
| Qualitas Controladora S.A.B. de CV | | 5,255 | 43,404 |
| Steadfast Group Ltd. | | 5,820 | 20,013 |
| The Travelers Companies, Inc. | | 252 | 42,195 |
| | | | 377,145 |
TOTAL FINANCIALS | | | 1,345,937 |
| HEALTH CARE - 7.5% | | | |
| Biotechnology - 0.3% | | | |
| Repligen Corp. (a) | | 159 | 21,395 |
| Zai Lab Ltd. (a) | | 7,076 | 18,058 |
| | | | 39,453 |
| Health Care Equipment & Supplies - 3.3% | | | |
| Align Technology, Inc. (a) | | 128 | 23,628 |
| Boston Scientific Corp. (a) | | 1,047 | 53,596 |
| Coloplast A/S Series B | | 165 | 17,193 |
| Fisher & Paykel Healthcare Corp. | | 1,258 | 15,259 |
| Hoya Corp. | | 275 | 26,474 |
| IDEXX Laboratories, Inc. (a) | | 83 | 33,156 |
| Inspire Medical Systems, Inc. (a) | | 158 | 23,251 |
| Intuitive Surgical, Inc. (a) | | 163 | 42,742 |
| Masimo Corp. (a) | | 417 | 33,831 |
| ResMed, Inc. | | 178 | 25,137 |
| Shenzhen Mindray Bio-Medical Electronics Co. Ltd. (A Shares) (a) | | 486 | 18,999 |
| Straumann Holding AG | | 192 | 22,574 |
| The Cooper Companies, Inc. | | 113 | 35,228 |
| | | | 371,068 |
| Health Care Providers & Services - 2.1% | | | |
| Apollo Hospitals Enterprise Ltd. | | 437 | 25,296 |
| Humana, Inc. | | 103 | 53,940 |
| Surgery Partners, Inc. (a) | | 870 | 20,123 |
| UnitedHealth Group, Inc. | | 247 | 132,283 |
| | | | 231,642 |
| Health Care Technology - 0.3% | | | |
| Veeva Systems, Inc. Class A (a) | | 159 | 30,641 |
| Life Sciences Tools & Services - 1.5% | | | |
| 10X Genomics, Inc. (a) | | 566 | 19,968 |
| Danaher Corp. | | 287 | 55,110 |
| Lonza Group AG | | 45 | 15,759 |
| Sartorius Stedim Biotech | | 66 | 12,329 |
| West Pharmaceutical Services, Inc. | | 131 | 41,696 |
| Wuxi Biologics (Cayman), Inc. (a)(b) | | 3,155 | 19,617 |
| | | | 164,479 |
TOTAL HEALTH CARE | | | 837,283 |
| INDUSTRIALS - 14.9% | | | |
| Aerospace & Defense - 1.2% | | | |
| HEICO Corp. | | 226 | 35,801 |
| INVISIO AB | | 1,159 | 17,402 |
| Northrop Grumman Corp. | | 109 | 51,386 |
| Safran SA | | 215 | 33,587 |
| | | | 138,176 |
| Air Freight & Logistics - 1.2% | | | |
| C.H. Robinson Worldwide, Inc. | | 428 | 35,023 |
| Delhivery Private Ltd. (a) | | 4,535 | 22,506 |
| DHL Group | | 725 | 28,199 |
| DSV A/S | | 145 | 21,625 |
| ZTO Express, Inc. sponsored ADR | | 919 | 21,661 |
| | | | 129,014 |
| Building Products - 1.1% | | | |
| ASSA ABLOY AB (B Shares) | | 1,195 | 25,472 |
| Kingspan Group PLC (Ireland) | | 315 | 21,158 |
| Reliance Worldwide Corp. Ltd. | | 7,856 | 17,511 |
| The AZEK Co., Inc. (a) | | 1,066 | 27,929 |
| Trex Co., Inc. (a) | | 505 | 28,386 |
| | | | 120,456 |
| Commercial Services & Supplies - 1.5% | | | |
| Casella Waste Systems, Inc. Class A (a) | | 455 | 34,330 |
| Cintas Corp. | | 84 | 42,598 |
| Copart, Inc. | | 1,184 | 51,528 |
| GFL Environmental, Inc. | | 625 | 18,005 |
| Waste Connections, Inc. (Canada) | | 135 | 17,480 |
| | | | 163,941 |
| Electrical Equipment - 1.2% | | | |
| AMETEK, Inc. | | 283 | 39,838 |
| Eaton Corp. PLC | | 258 | 53,641 |
| Generac Holdings, Inc. (a) | | 305 | 25,641 |
| Nidec Corp. | | 481 | 17,644 |
| | | | 136,764 |
| Ground Transportation - 0.7% | | | |
| Localiza Rent a Car SA | | 2,311 | 23,317 |
| Old Dominion Freight Lines, Inc. | | 99 | 37,289 |
| Vamos Locacao de Caminhoes Maquinas e Equipamentos SA | | 13,622 | 21,155 |
| | | | 81,761 |
| Industrial Conglomerates - 1.0% | | | |
| General Electric Co. | | 548 | 59,529 |
| Honeywell International, Inc. | | 284 | 52,046 |
| | | | 111,575 |
| Machinery - 2.4% | | | |
| Atlas Copco AB (A Shares) | | 2,298 | 29,757 |
| Fortive Corp. | | 554 | 36,165 |
| IDEX Corp. | | 167 | 31,965 |
| Indutrade AB | | 1,208 | 21,336 |
| Japan Steel Works Ltd. | | 966 | 15,673 |
| Minebea Mitsumi, Inc. | | 935 | 14,660 |
| Misumi Group, Inc. | | 855 | 12,944 |
| Miura Co. Ltd. | | 820 | 15,899 |
| Rational AG | | 22 | 12,512 |
| SMC Corp. | | 48 | 22,165 |
| Tocalo Co. Ltd. | | 1,606 | 14,516 |
| VAT Group AG (b) | | 53 | 18,685 |
| Zhejiang Sanhua Intelligent Controls Co. Ltd. (A Shares) | | 4,467 | 16,352 |
| | | | 262,629 |
| Marine Transportation - 0.1% | | | |
| SITC International Holdings Co. Ltd. | | 8,782 | 13,528 |
| Passenger Airlines - 0.2% | | | |
| Ryanair Holdings PLC sponsored ADR (a) | | 221 | 19,382 |
| Professional Services - 3.3% | | | |
| BayCurrent Consulting, Inc. | | 540 | 13,558 |
| Centre Testing International Group Co. Ltd. (A Shares) | | 4,438 | 9,184 |
| Ceridian HCM Holding, Inc. (a) | | 584 | 37,382 |
| Equifax, Inc. | | 198 | 33,575 |
| Experian PLC | | 879 | 26,613 |
| Funai Soken Holdings, Inc. | | 852 | 14,003 |
| Headhunter Group PLC ADR (a)(c) | | 622 | 1,693 |
| Paycom Software, Inc. | | 120 | 29,396 |
| Recruit Holdings Co. Ltd. | | 903 | 25,891 |
| RELX PLC (London Stock Exchange) | | 939 | 32,797 |
| Sporton International, Inc. | | 3,398 | 22,414 |
| Thomson Reuters Corp. | | 225 | 26,951 |
| TriNet Group, Inc. (a) | | 289 | 29,695 |
| Verisk Analytics, Inc. | | 195 | 44,335 |
| Wolters Kluwer NV | | 161 | 20,630 |
| | | | 368,117 |
| Trading Companies & Distributors - 1.0% | | | |
| AddTech AB (B Shares) | | 979 | 14,331 |
| Ashtead Group PLC | | 479 | 27,387 |
| Azelis Group NV | | 826 | 14,071 |
| Ferguson PLC | | 284 | 42,657 |
| IMCD NV | | 158 | 18,975 |
| | | | 117,421 |
TOTAL INDUSTRIALS | | | 1,662,764 |
| INFORMATION TECHNOLOGY - 20.6% | | | |
| Electronic Equipment, Instruments & Components - 1.9% | | | |
| Amphenol Corp. Class A | | 526 | 42,369 |
| Azbil Corp. | | 666 | 19,679 |
| CDW Corp. | | 223 | 44,689 |
| Keyence Corp. | | 84 | 32,518 |
| Lagercrantz Group AB (B Shares) | | 2,284 | 20,809 |
| Murata Manufacturing Co. Ltd. | | 1,428 | 24,461 |
| Teledyne Technologies, Inc. (a) | | 84 | 31,466 |
| | | | 215,991 |
| IT Services - 1.9% | | | |
| Cloudflare, Inc. (a) | | 613 | 34,751 |
| Kainos Group PLC | | 981 | 13,378 |
| Nagarro SE (a) | | 139 | 9,773 |
| SHIFT, Inc. (a) | | 109 | 19,777 |
| Shopify, Inc. Class A (a) | | 364 | 17,177 |
| Softcat PLC | | 1,081 | 16,621 |
| Tata Consultancy Services Ltd. | | 842 | 34,077 |
| Twilio, Inc. Class A (a) | | 517 | 26,501 |
| VeriSign, Inc. (a) | | 191 | 38,135 |
| | | | 210,190 |
| Semiconductors & Semiconductor Equipment - 5.8% | | | |
| Advantest Corp. | | 692 | 17,825 |
| ASM International NV (Netherlands) | | 58 | 23,842 |
| ASML Holding NV (Netherlands) | | 108 | 64,921 |
| BE Semiconductor Industries NV | | 189 | 19,458 |
| Disco Corp. | | 134 | 23,664 |
| eMemory Technology, Inc. | | 499 | 31,239 |
| Monolithic Power Systems, Inc. | | 88 | 38,873 |
| NVIDIA Corp. | | 543 | 221,435 |
| Silicon Laboratories, Inc. (a) | | 339 | 31,249 |
| Taiwan Semiconductor Manufacturing Co. Ltd. | | 6,368 | 103,925 |
| Teradyne, Inc. | | 356 | 29,644 |
| Tokyo Electron Ltd. | | 269 | 35,545 |
| | | | 641,620 |
| Software - 10.6% | | | |
| Adobe, Inc. (a) | | 146 | 77,681 |
| ANSYS, Inc. (a) | | 120 | 33,391 |
| Atlassian Corp. PLC (a) | | 143 | 25,832 |
| ATOSS Software AG | | 90 | 18,951 |
| Bill Holdings, Inc. (a) | | 408 | 37,246 |
| Confluent, Inc. (a) | | 1,109 | 32,061 |
| Constellation Software, Inc. | | 17 | 34,080 |
| Constellation Software, Inc. warrants 8/22/28 (a)(c) | | 17 | 0 |
| Dassault Systemes SA | | 758 | 31,225 |
| Fortnox AB | | 3,520 | 13,919 |
| HubSpot, Inc. (a) | | 98 | 41,529 |
| Lumine Group, Inc. | | 1,322 | 16,626 |
| Microsoft Corp. | | 1,462 | 494,315 |
| Money Forward, Inc. (a) | | 614 | 15,508 |
| Procore Technologies, Inc. (a) | | 587 | 35,860 |
| Salesforce, Inc. (a) | | 370 | 74,307 |
| SAP SE | | 332 | 44,532 |
| ServiceNow, Inc. (a) | | 88 | 51,203 |
| Synopsys, Inc. (a) | | 99 | 46,475 |
| Topicus.Com, Inc. (a) | | 259 | 17,054 |
| Workday, Inc. Class A (a) | | 180 | 38,108 |
| | | | 1,179,903 |
| Technology Hardware, Storage & Peripherals - 0.4% | | | |
| Seagate Technology Holdings PLC | | 597 | 40,745 |
TOTAL INFORMATION TECHNOLOGY | | | 2,288,449 |
| MATERIALS - 4.3% | | | |
| Chemicals - 2.7% | | | |
| Air Products & Chemicals, Inc. | | 151 | 42,648 |
| Ecolab, Inc. | | 222 | 37,238 |
| Givaudan SA | | 8 | 26,560 |
| Linde PLC | | 159 | 60,763 |
| NOF Corp. | | 431 | 17,003 |
| Shin-Etsu Chemical Co. Ltd. | | 1,086 | 32,475 |
| Sika AG | | 119 | 28,375 |
| Solar Industries India Ltd. | | 438 | 28,925 |
| Symrise AG | | 185 | 18,905 |
| | | | 292,892 |
| Construction Materials - 0.8% | | | |
| Martin Marietta Materials, Inc. | | 113 | 46,210 |
| Vulcan Materials Co. | | 234 | 45,979 |
| | | | 92,189 |
| Metals & Mining - 0.8% | | | |
| First Quantum Minerals Ltd. | | 931 | 10,789 |
| Freeport-McMoRan, Inc. | | 1,128 | 38,104 |
| Press Metal Aluminium Holdings | | 19,537 | 20,195 |
| Ternium SA sponsored ADR | | 583 | 21,857 |
| | | | 90,945 |
TOTAL MATERIALS | | | 476,026 |
| REAL ESTATE - 4.2% | | | |
| Equity Real Estate Investment Trusts (REITs) - 2.8% | | | |
| American Tower Corp. | | 255 | 45,438 |
| Big Yellow Group PLC | | 1,115 | 12,942 |
| Embassy Office Parks (REIT) | | 6,240 | 23,344 |
| Equinix, Inc. | | 63 | 45,967 |
| Equity Lifestyle Properties, Inc. | | 518 | 34,084 |
| Extra Space Storage, Inc. | | 210 | 21,754 |
| National Storage REIT unit | | 15,614 | 19,908 |
| Prologis (REIT), Inc. | | 385 | 38,789 |
| Safestore Holdings PLC | | 1,505 | 12,503 |
| Segro PLC | | 1,591 | 13,784 |
| Sun Communities, Inc. | | 248 | 27,588 |
| Warehouses de Pauw | | 822 | 20,283 |
| | | | 316,384 |
| Real Estate Management & Development - 1.4% | | | |
| Ayala Land, Inc. | | 36,338 | 17,838 |
| CBRE Group, Inc. (a) | | 454 | 31,480 |
| Colliers International Group, Inc. | | 176 | 15,955 |
| CoStar Group, Inc. (a) | | 490 | 35,971 |
| Grainger Trust PLC | | 6,615 | 18,283 |
| Katitas Co. Ltd. | | 926 | 12,360 |
| Oberoi Realty Ltd. | | 1,739 | 23,761 |
| | | | 155,648 |
TOTAL REAL ESTATE | | | 472,032 |
| UTILITIES - 0.6% | | | |
| Electric Utilities - 0.4% | | | |
| Constellation Energy Corp. | | 427 | 48,217 |
| Gas Utilities - 0.2% | | | |
| Nippon Gas Co. Ltd. | | 1,244 | 18,697 |
TOTAL UTILITIES | | | 66,914 |
| TOTAL COMMON STOCKS (Cost $10,092,294) | | | 10,965,939 |
| | | | |
| Nonconvertible Preferred Stocks - 0.4% |
| | | Shares | Value ($) |
| HEALTH CARE - 0.2% | | | |
| Life Sciences Tools & Services - 0.2% | | | |
| Sartorius AG (non-vtg.) | | 63 | 15,745 |
| INDUSTRIALS - 0.2% | | | |
| Passenger Airlines - 0.2% | | | |
| Azul SA (a) | | 9,189 | 23,475 |
| TOTAL NONCONVERTIBLE PREFERRED STOCKS (Cost $36,715) | | | 39,220 |
| | | | |
| Money Market Funds - 1.4% |
| | | Shares | Value ($) |
Fidelity Cash Central Fund 5.40% (d) (Cost $160,448) | | 160,416 | 160,448 |
| | | | |
| TOTAL INVESTMENT IN SECURITIES - 100.3% (Cost $10,289,457) | 11,165,607 |
NET OTHER ASSETS (LIABILITIES) - (0.3)% | (32,004) |
| NET ASSETS - 100.0% | 11,133,603 |
| | |
Legend
| (b) | Security exempt from registration under Rule 144A of the Securities Act of 1933. These securities may be resold in transactions exempt from registration, normally to qualified institutional buyers. At the end of the period, the value of these securities amounted to $58,537 or 0.5% of net assets. |
| (d) | Affiliated fund that is generally available only to investment companies and other accounts managed by Fidelity Investments. The rate quoted is the annualized seven-day yield of the fund at period end. A complete unaudited listing of the fund's holdings as of its most recent quarter end is available upon request. In addition, each Fidelity Central Fund's financial statements, which are not covered by the Fund's Report of Independent Registered Public Accounting Firm, are available on the SEC's website or upon request. |
Affiliated Central Funds
Fiscal year to date information regarding the Fund's investments in Fidelity Central Funds, including the ownership percentage, is presented below.
| Affiliate | Value, beginning of period ($) | Purchases ($) | Sales Proceeds ($) | Dividend Income ($) | Realized Gain (loss) ($) | Change in Unrealized appreciation (depreciation) ($) | Value, end of period ($) | % ownership, end of period |
| Fidelity Cash Central Fund 5.40% | - | 1,941,742 | 1,781,294 | 4,870 | - | - | 160,448 | 0.0% |
| Total | - | 1,941,742 | 1,781,294 | 4,870 | - | - | 160,448 | |
| | | | | | | | | |
Amounts in the dividend income column in the above table include any capital gain distributions from underlying funds, which are presented in the corresponding line item in the Statement of Operations, if applicable.
Amounts included in the purchases and sales proceeds columns may include in-kind transactions, if applicable.
Investment Valuation
The following is a summary of the inputs used, as of October 31, 2023, involving the Fund's assets and liabilities carried at fair value. The inputs or methodology used for valuing securities may not be an indication of the risk associated with investing in those securities. For more information on valuation inputs, and their aggregation into the levels used below, please refer to the Investment Valuation section in the accompanying Notes to Financial Statements.
| Valuation Inputs at Reporting Date: |
| Description | Total ($) | Level 1 ($) | Level 2 ($) | Level 3 ($) |
Investments in Securities: | | | | |
|
| Equities: | | | | |
Communication Services | 857,467 | 728,842 | 128,625 | - |
Consumer Discretionary | 2,105,273 | 1,665,073 | 440,200 | - |
Consumer Staples | 610,520 | 463,684 | 146,836 | - |
Energy | 243,274 | 209,764 | 33,510 | - |
Financials | 1,345,937 | 1,217,953 | 127,984 | - |
Health Care | 853,028 | 713,566 | 139,462 | - |
Industrials | 1,686,239 | 1,294,485 | 390,061 | 1,693 |
Information Technology | 2,288,449 | 1,789,553 | 498,896 | - |
Materials | 476,026 | 358,523 | 117,503 | - |
Real Estate | 472,032 | 374,821 | 97,211 | - |
Utilities | 66,914 | 48,217 | 18,697 | - |
|
| Money Market Funds | 160,448 | 160,448 | - | - |
| Total Investments in Securities: | 11,165,607 | 9,024,929 | 2,138,985 | 1,693 |
| Statement of Assets and Liabilities |
| | | | October 31, 2023 |
| | | | | |
| Assets | | | | |
| Investment in securities, at value - See accompanying schedule: | | | | |
Unaffiliated issuers (cost $10,129,009) | $ | 11,005,159 | | |
Fidelity Central Funds (cost $160,448) | | 160,448 | | |
| | | | | |
| | | | | |
| Total Investment in Securities (cost $10,289,457) | | | $ | 11,165,607 |
| Cash | | | | 8,120 |
| Foreign currency held at value (cost $355) | | | | 356 |
| Receivable for fund shares sold | | | | 4,947 |
| Dividends receivable | | | | 10,095 |
| Distributions receivable from Fidelity Central Funds | | | | 708 |
| Prepaid expenses | | | | 17 |
| Receivable from investment adviser for expense reductions | | | | 14,921 |
Total assets | | | | 11,204,771 |
| Liabilities | | | | |
| Payable for fund shares redeemed | $ | 27,154 | | |
| Accrued management fee | | 2,929 | | |
| Other affiliated payables | | 2,833 | | |
| Audit fee payable | | 32,777 | | |
| Other payables and accrued expenses | | 5,475 | | |
| Total Liabilities | | | | 71,168 |
| Net Assets | | | $ | 11,133,603 |
| Net Assets consist of: | | | | |
| Paid in capital | | | $ | 11,293,341 |
| Total accumulated earnings (loss) | | | | (159,738) |
| Net Assets | | | $ | 11,133,603 |
Net Asset Value, offering price and redemption price per share ($11,133,603 ÷ 925,281 shares) | | | $ | 12.03 |
| Statement of Operations |
| | | | Year ended October 31, 2023 |
| Investment Income | | | | |
| Dividends | | | $ | 147,984 |
| Income from Fidelity Central Funds | | | | 4,870 |
| Income before foreign taxes withheld | | | $ | 152,854 |
| Less foreign taxes withheld | | | | (11,638) |
| Total Income | | | | 141,216 |
| Expenses | | | | |
| Management fee | | | | |
| Basic fee | $ | 68,229 | | |
| Performance adjustment | | (22,092) | | |
| Transfer agent fees | | 30,668 | | |
| Accounting fees and expenses | | 4,202 | | |
| Custodian fees and expenses | | 8,671 | | |
| Independent trustees' fees and expenses | | 72 | | |
| Registration fees | | 22,472 | | |
| Audit | | 66,421 | | |
| Legal | | 428 | | |
| Miscellaneous | | 52 | | |
| Total expenses before reductions | | 179,123 | | |
| Expense reductions | | (67,283) | | |
| Total expenses after reductions | | | | 111,840 |
| Net Investment income (loss) | | | | 29,376 |
| Realized and Unrealized Gain (Loss) | | | | |
| Net realized gain (loss) on: | | | | |
| Investment Securities: | | | | |
| Unaffiliated issuers (net of foreign taxes of $3,605) | | (25,360) | | |
| Foreign currency transactions | | 372 | | |
| Total net realized gain (loss) | | | | (24,988) |
| Change in net unrealized appreciation (depreciation) on: | | | | |
| Investment Securities: | | | | |
| Unaffiliated issuers(net of decrease in deferred foreign taxes of $1,557) | | 1,076,798 | | |
| Assets and liabilities in foreign currencies | | 243 | | |
| Total change in net unrealized appreciation (depreciation) | | | | 1,077,041 |
| Net gain (loss) | | | | 1,052,053 |
| Net increase (decrease) in net assets resulting from operations | | | $ | 1,081,429 |
| Statement of Changes in Net Assets |
| |
| | Year ended October 31, 2023 | | Year ended October 31, 2022 |
| Increase (Decrease) in Net Assets | | | | |
| Operations | | | | |
| Net investment income (loss) | $ | 29,376 | $ | 8,806 |
| Net realized gain (loss) | | (24,988) | | (933,940) |
| Change in net unrealized appreciation (depreciation) | | 1,077,041 | | (6,033,124) |
| Net increase (decrease) in net assets resulting from operations | | 1,081,429 | | (6,958,258) |
| Distributions to shareholders | | - | | (572,700) |
| | | | | |
| Share transactions | | | | |
| Proceeds from sales of shares | | 1,803,511 | | 3,817,785 |
| Reinvestment of distributions | | - | | 537,633 |
| Cost of shares redeemed | | (2,959,519) | | (7,108,348) |
| | | | | |
Net increase (decrease) in net assets resulting from share transactions | | (1,156,008) | | (2,752,930) |
| Total increase (decrease) in net assets | | (74,579) | | (10,283,888) |
| | | | | |
| Net Assets | | | | |
| Beginning of period | | 11,208,182 | | 21,492,070 |
| End of period | $ | 11,133,603 | $ | 11,208,182 |
| | | | | |
| Other Information | | | | |
| Shares | | | | |
| Sold | | 142,807 | | 278,587 |
| Issued in reinvestment of distributions | | - | | 33,571 |
| Redeemed | | (242,007) | | (575,644) |
| Net increase (decrease) | | (99,200) | | (263,486) |
| | | | | |
Financial Highlights
| Fidelity® Enduring Opportunities Fund |
| |
| Years ended October 31, | | 2023 | | 2022 | | 2021 | | 2020 A |
Selected Per-Share Data | | | | | | | | |
| Net asset value, beginning of period | $ | 10.94 | $ | 16.69 | $ | 11.91 | $ | 10.00 |
| Income from Investment Operations | | | | | | | | |
Net investment income (loss) B,C | | .03 | | .01 | | (.04) | | (.01) |
| Net realized and unrealized gain (loss) | | 1.06 | | (5.32) | | 4.82 | | 1.93 |
| Total from investment operations | | 1.09 | | (5.31) | | 4.78 | | 1.92 |
| Distributions from net investment income | | - | | (.03) | | - | | - D |
| Distributions from net realized gain | | - | | (.41) | | - | | - |
| Tax return of capital | | - | | - | | - | | (.01) |
| Total distributions | | - | | (.44) | | - | | (.01) |
| Net asset value, end of period | $ | 12.03 | $ | 10.94 | $ | 16.69 | $ | 11.91 |
Total Return E,F | | 9.96% | | (32.65)% | | 40.13% | | 19.22% |
Ratios to Average Net Assets C,G,H | | | | | | | | |
| Expenses before reductions | | 1.51% | | 1.41% | | 1.70% | | 2.63% I |
| Expenses net of fee waivers, if any | | .94% | | .98% | | 1.08% | | 1.10% I |
| Expenses net of all reductions | | .94% | | .98% | | 1.08% | | 1.09% I |
| Net investment income (loss) | | .25% | | .05% | | (.25)% | | (.10)% I |
| Supplemental Data | | | | | | | | |
| Net assets, end of period (000 omitted) | $ | 11,134 | $ | 11,208 | $ | 21,492 | $ | 10,055 |
Portfolio turnover rate J | | 19% | | 15% | | 23% | | 17% I |
AFor the period November 5, 2019 (commencement of operations) through October 31, 2020.
BCalculated based on average shares outstanding during the period.
CNet investment income (loss) is affected by the timing of the declaration of dividends by any underlying mutual funds or exchange-traded funds (ETFs). Net investment income (loss) of any mutual funds or ETFs is not included in the Fund's net investment income (loss) ratio.
DAmount represents less than $.005 per share.
ETotal returns for periods of less than one year are not annualized.
FTotal returns would have been lower if certain expenses had not been reduced during the applicable periods shown.
GFees and expenses of any underlying mutual funds or exchange-traded funds (ETFs) are not included in the Fund's expense ratio. The Fund indirectly bears its proportionate share of these expenses.
HExpense ratios reflect operating expenses of the class. Expenses before reductions do not reflect amounts reimbursed, waived, or reduced through arrangements with the investment adviser, brokerage services, or other offset arrangements, if applicable, and do not represent the amount paid by the class during periods when reimbursements, waivers or reductions occur.
IAnnualized.
JAmount does not include the portfolio activity of any underlying mutual funds or exchange-traded funds (ETFs).
For the period ended October 31, 2023
1. Organization.
Fidelity Enduring Opportunities Fund (the Fund) is a fund of Fidelity Investment Trust (the Trust) and is authorized to issue an unlimited number of shares. Share transactions on the Statement of Changes in Net Assets may contain exchanges between affiliated funds. The Trust is registered under the Investment Company Act of 1940, as amended (the 1940 Act), as an open-end management investment company organized as a Massachusetts business trust.
2. Investments in Fidelity Central Funds.
Funds may invest in Fidelity Central Funds, which are open-end investment companies generally available only to other investment companies and accounts managed by the investment adviser and its affiliates. The Schedule of Investments lists any Fidelity Central Funds held as an investment as of period end, but does not include the underlying holdings of each Fidelity Central Fund. An investing fund indirectly bears its proportionate share of the expenses of the underlying Fidelity Central Funds.
Based on its investment objective, each Fidelity Central Fund may invest or participate in various investment vehicles or strategies that are similar to those of the investing fund. These strategies are consistent with the investment objectives of the investing fund and may involve certain economic risks which may cause a decline in value of each of the Fidelity Central Funds and thus a decline in the value of the investing fund.
| Fidelity Central Fund | Investment Manager | Investment Objective | Investment Practices | Expense RatioA |
| Fidelity Money Market Central Funds | Fidelity Management & Research Company LLC (FMR) | Each fund seeks to obtain a high level of current income consistent with the preservation of capital and liquidity. | Short-term Investments | Less than .005% |
A Expenses expressed as a percentage of average net assets and are as of each underlying Central Fund's most recent annual or semi-annual shareholder report.
A complete unaudited list of holdings for each Fidelity Central Fund is available upon request or at the Securities and Exchange Commission website at www.sec.gov. In addition, the financial statements of the Fidelity Central Funds which contain the significant accounting policies (including investment valuation policies) of those funds, and are not covered by the Report of Independent Registered Public Accounting Firm, are available on the Securities and Exchange Commission website or upon request.
3. Significant Accounting Policies.
The Fund is an investment company and applies the accounting and reporting guidance of the Financial Accounting Standards Board (FASB) Accounting Standards Codification Topic 946 Financial Services - Investment Companies. The financial statements have been prepared in conformity with accounting principles generally accepted in the United States of America (GAAP), which require management to make certain estimates and assumptions at the date of the financial statements. Actual results could differ from those estimates. Subsequent events, if any, through the date that the financial statements were issued have been evaluated in the preparation of the financial statements. The Fund's Schedule of Investments lists any underlying mutual funds or exchange-traded funds (ETFs) but does not include the underlying holdings of these funds. The following summarizes the significant accounting policies of the Fund:
Investment Valuation. Investments are valued as of 4:00 p.m. Eastern time on the last calendar day of the period. The Board of Trustees (the Board) has designated the Fund's investment adviser as the valuation designee responsible for the fair valuation function and performing fair value determinations as needed. The investment adviser has established a Fair Value Committee (the Committee) to carry out the day-to-day fair valuation responsibilities and has adopted policies and procedures to govern the fair valuation process and the activities of the Committee. In accordance with these fair valuation policies and procedures, which have been approved by the Board, the Fund attempts to obtain prices from one or more third party pricing services or brokers to value its investments. When current market prices, quotations or currency exchange rates are not readily available or reliable, investments will be fair valued in good faith by the Committee, in accordance with the policies and procedures. Factors used in determining fair value vary by investment type and may include market or investment specific events, transaction data, estimated cash flows, and market observations of comparable investments. The frequency that the fair valuation procedures are used cannot be predicted and they may be utilized to a significant extent. The Committee manages the Fund's fair valuation practices and maintains the fair valuation policies and procedures. The Fund's investment adviser reports to the Board information regarding the fair valuation process and related material matters.
The Fund categorizes the inputs to valuation techniques used to value its investments into a disclosure hierarchy consisting of three levels as shown below:
Level 1 - unadjusted quoted prices in active markets for identical investments
Level 2 - other significant observable inputs (including quoted prices for similar investments, interest rates, prepayment speeds, etc.)
Level 3 - unobservable inputs (including the Fund's own assumptions based on the best information available)
Valuation techniques used to value the Fund's investments by major category are as follows:
Equity securities, including restricted securities, for which market quotations are readily available, are valued at the last reported sale price or official closing price as reported by a third party pricing service on the primary market or exchange on which they are traded and are categorized as Level 1 in the hierarchy. In the event there were no sales during the day or closing prices are not available, securities are valued at the last quoted bid price or may be valued using the last available price and are generally categorized as Level 2 in the hierarchy. For foreign equity securities, when market or security specific events arise, comparisons to the valuation of American Depositary Receipts (ADRs), futures contracts, ETFs and certain indexes as well as quoted prices for similar securities may be used and would be categorized as Level 2 in the hierarchy. For equity securities, including restricted securities, where observable inputs are limited, assumptions about market activity and risk are used and these securities may be categorized as Level 3 in the hierarchy.
Investments in open-end mutual funds, including the Fidelity Central Funds, are valued at their closing net asset value (NAV) each business day and are categorized as Level 1 in the hierarchy.
Changes in valuation techniques may result in transfers in or out of an assigned level within the disclosure hierarchy. The aggregate value of investments by input level as of October 31, 2023 is included at the end of the Fund's Schedule of Investments.
Foreign Currency. Certain Funds may use foreign currency contracts to facilitate transactions in foreign-denominated securities. Gains and losses from these transactions may arise from changes in the value of the foreign currency or if the counterparties do not perform under the contracts' terms.
Foreign-denominated assets, including investment securities, and liabilities are translated into U.S. dollars at the exchange rates at period end. Purchases and sales of investment securities, income and dividends received, and expenses denominated in foreign currencies are translated into U.S. dollars at the exchange rate in effect on the transaction date.
The effects of exchange rate fluctuations on investments are included with the net realized and unrealized gain (loss) on investment securities. Other foreign currency transactions resulting in realized and unrealized gain (loss) are disclosed separately.
Investment Transactions and Income. For financial reporting purposes, the Fund's investment holdings and NAV include trades executed through the end of the last business day of the period. The NAV per share for processing shareholder transactions is calculated as of the close of business of the New York Stock Exchange (NYSE), normally 4:00 p.m. Eastern time and includes trades executed through the end of the prior business day. Gains and losses on securities sold are determined on the basis of identified cost. Commissions paid to certain brokers with whom the investment adviser, or its affiliates, places trades on behalf of a fund include an amount in addition to trade execution, which may be rebated back to a fund. Any such rebates are included in net realized gain (loss) on investments in the Statement of Operations. Dividend income is recorded on the ex-dividend date, except for certain dividends from foreign securities where the ex-dividend date may have passed, which are recorded as soon as the Fund is informed of the ex-dividend date. Non-cash dividends included in dividend income, if any, are recorded at the fair market value of the securities received. Income and capital gain distributions from Fidelity Central Funds, if any, are recorded on the ex-dividend date. Certain distributions received by the Fund represent a return of capital or capital gain. The Fund determines the components of these distributions subsequent to the ex-dividend date, based upon receipt of tax filings or other correspondence relating to the underlying investment. These distributions are recorded as a reduction of cost of investments and/or as a realized gain. Investment income is recorded net of foreign taxes withheld where recovery of such taxes is uncertain. Funds may file withholding tax reclaims in certain jurisdictions to recover a portion of amounts previously withheld. Any withholding tax reclaims income is included in the Statement of Operations in foreign taxes withheld. Any receivables for withholding tax reclaims are included in the Statement of Assets and Liabilities in dividends receivable.
Expenses. Expenses directly attributable to a fund are charged to that fund. Expenses attributable to more than one fund are allocated among the respective funds on the basis of relative net assets or other appropriate methods. Expenses included in the accompanying financial statements reflect the expenses of that fund and do not include any expenses associated with any underlying mutual funds or exchange-traded funds. Although not included in a fund's expenses, a fund indirectly bears its proportionate share of these expenses through the net asset value of each underlying mutual fund or exchange-traded fund. Expense estimates are accrued in the period to which they relate and adjustments are made when actual amounts are known.
Income Tax Information and Distributions to Shareholders. Each year, the Fund intends to qualify as a regulated investment company under Subchapter M of the Internal Revenue Code, including distributing substantially all of its taxable income and realized gains. As a result, no provision for U.S. Federal income taxes is required. As of October 31, 2023, the Fund did not have any unrecognized tax benefits in the financial statements; nor is the Fund aware of any tax positions for which it is reasonably possible that the total amounts of unrecognized tax benefits will significantly change in the next twelve months. The Fund files a U.S. federal tax return, in addition to state and local tax returns as required. The Fund's federal income tax returns are subject to examination by the Internal Revenue Service (IRS) for a period of three fiscal years after they are filed. State and local tax returns may be subject to examination for an additional fiscal year depending on the jurisdiction. Foreign taxes are provided for based on the Fund's understanding of the tax rules and rates that exist in the foreign markets in which it invests. The Fund is subject to a tax imposed on capital gains by certain countries in which it invests. An estimated deferred tax liability for net unrealized appreciation on the applicable securities is included in Other payables and accrued expenses on the Statement of Assets & Liabilities.
Distributions are declared and recorded on the ex-dividend date. Income and capital gain distributions are determined in accordance with income tax regulations, which may differ from GAAP. In addition, the Fund claimed a portion of the payment made to redeeming shareholders as a distribution for income tax purposes.
Capital accounts within the financial statements are adjusted for permanent book-tax differences. These adjustments have no impact on net assets or the results of operations. Capital accounts are not adjusted for temporary book-tax differences which will reverse in a subsequent period.
Book-tax differences are primarily due to foreign currency transactions, certain foreign taxes, passive foreign investment companies (PFIC), capital loss carryforwards and losses deferred due to wash sales and excise tax regulations.
As of period end, the cost and unrealized appreciation (depreciation) in securities, and derivatives if applicable, for federal income tax purposes were as follows:
| Gross unrealized appreciation | $2,185,990 |
| Gross unrealized depreciation | (1,343,389) |
| Net unrealized appreciation (depreciation) | $842,601 |
| Tax Cost | $10,323,006 |
The tax-based components of distributable earnings as of period end were as follows:
| Undistributed ordinary income | $30,401 |
| Capital loss carryforward | $(1,028,754) |
| Net unrealized appreciation (depreciation) on securities and other investments | $842,438 |
Capital loss carryforwards are only available to offset future capital gains of the Fund to the extent provided by regulations and may be limited. The capital loss carryforward information presented below, including any applicable limitation, is estimated as of fiscal period end and is subject to adjustment.
Short-term | $(472,241) |
Long-term | (556,513) |
| Total capital loss carryforward | $(1,028,754) |
The tax character of distributions paid was as follows:
| | October 31, 2023 | October 31, 2022 |
| Ordinary Income | $- | $161,718 |
| Long-term Capital Gains | - | 410,982 |
| Total | $- | $572,700 |
Restricted Securities (including Private Placements). Funds may invest in securities that are subject to legal or contractual restrictions on resale. These securities generally may be resold in transactions exempt from registration or to the public if the securities are registered. Disposal of these securities may involve time-consuming negotiations and expense, and prompt sale at an acceptable price may be difficult. Information regarding restricted securities held at period end is included at the end of the Schedule of Investments, if applicable.
4. Purchases and Sales of Investments.
Purchases and sales of securities, other than short-term securities and in-kind transactions, as applicable, are noted in the table below.
| | Purchases ($) | Sales ($) |
| Fidelity Enduring Opportunities Fund | 2,287,178 | 3,499,541 |
5. Fees and Other Transactions with Affiliates.
Management Fee. Fidelity Management & Research Company LLC (the investment adviser) and its affiliates provide the Fund with investment management related services for which the Fund pays a monthly management fee. The management fee is the sum of an individual fund fee rate that is based on an annual rate of .35% of the Fund's average net assets and an annualized group fee rate that averaged .23% during the period. The group fee rate is based upon the monthly average net assets of a group of registered investment companies with which the investment adviser has management contracts. The group fee rate decreases as assets under management increase and increases as assets under management decrease. In addition, the management fee is subject to a performance adjustment (up to a maximum of +/- .20% of the Fund's average net assets over a 36 month performance period). The upward or downward adjustment to the management fee is based on the Fund's relative investment performance as compared to its benchmark index, the MSCI ACWI (All Country World Index) Index, over the same 36 month performance period. For the reporting period, the total annual management fee rate, including the performance adjustment, was .39% of the Fund's average net assets. The performance adjustment included in the management fee rate may be higher or lower than the maximum performance adjustment rate due to the difference between the average net assets for the reporting and performance periods.
Transfer Agent Fees. Fidelity Investments Institutional Operations Company LLC (FIIOC), an affiliate of the investment adviser, is the Fund's transfer, dividend disbursing and shareholder servicing agent. FIIOC receives account fees and asset-based fees that vary according to account size and type of account. FIIOC pays for typesetting, printing and mailing of shareholder reports, except proxy statements. For the period, the transfer agent fees were equivalent to an annual rate of .26% of average net assets.
During November 2023, the Board approved a change in the transfer agent fees effective December 1, 2023 to a fixed annual rate of 0.2000% of average net assets.
Accounting Fees. Fidelity Service Company, Inc. (FSC), an affiliate of the investment adviser, maintains the Fund's accounting records. The accounting fee is based on the level of average net assets for each month. For the period, the fees were equivalent to the following annual rates:
| | % of Average Net Assets |
| Fidelity Enduring Opportunities Fund | .04 |
During November 2023, the Board approved a change in the accounting fees effective December 1, 2023 to a fixed annual rate of average net assets as follows:
| | % of Average Net Assets |
| Fidelity Enduring Opportunities Fund | 0.0354% |
Brokerage Commissions. A portion of portfolio transactions were placed with brokerage firms which are affiliates of the investment adviser. Brokerage commissions are included in net realized gain (loss) and change in net unrealized appreciation (depreciation) in the Statement of Operations. The commissions paid to these affiliated firms were as follows:
| | Amount |
| Fidelity Enduring Opportunities Fund | $12 |
Interfund Trades. Funds may purchase from or sell securities to other Fidelity Funds under procedures adopted by the Board. The procedures have been designed to ensure these interfund trades are executed in accordance with Rule 17a-7 of the 1940 Act. Any interfund trades are included within the respective purchases and sales amounts shown in the Purchases and Sales of Investments note. Interfund trades during the period are noted in the table below.
| | Purchases ($) | Sales ($) | Realized Gain (Loss) ($) |
| Fidelity Enduring Opportunities Fund | 7,377 | 89,417 | 15,966 |
6. Committed Line of Credit.
Certain Funds participate with other funds managed by the investment adviser or an affiliate in a $4.25 billion credit facility (the "line of credit") to be utilized for temporary or emergency purposes to fund shareholder redemptions or for other short-term liquidity purposes. The participating funds have agreed to pay commitment fees on their pro-rata portion of the line of credit, which are reflected in Miscellaneous expenses on the Statement of Operations, and are listed below. During the period, there were no borrowings on this line of credit.
| | Amount |
| Fidelity Enduring Opportunities Fund | $22 |
7. Expense Reductions.
The investment adviser contractually agreed to reimburse the Fund to the extent annual operating expenses exceeded .95% of average net assets. This reimbursement will remain in place through February 28, 2025. Some expenses, for example the compensation of the independent Trustees, and certain miscellaneous expenses such as proxy and shareholder meeting expenses, are excluded from this reimbursement. During the period this reimbursement reduced the Fund's expenses by $66,268.
Through arrangements with the Fund's custodian, credits realized as a result of certain uninvested cash balances were used to reduce the Fund's expenses by $292.
In addition, during the period the investment adviser or an affiliate reimbursed and/or waived a portion of operating expenses in the amount of $723.
8. Other.
A fund's organizational documents provide former and current trustees and officers with a limited indemnification against liabilities arising in connection with the performance of their duties to the fund. In the normal course of business, a fund may also enter into contracts that provide general indemnifications. A fund's maximum exposure under these arrangements is unknown as this would be dependent on future claims that may be made against a fund. The risk of material loss from such claims is considered remote.
At the end of the period, the investment adviser or its affiliates were owners of record of more than 10% of the outstanding shares as follows:
| Fund | Affiliated % |
| Fidelity Enduring Opportunities Fund. | 21% |
9. Risk and Uncertainties.
Many factors affect a fund's performance. Developments that disrupt global economies and financial markets, such as pandemics, epidemics, outbreaks of infectious diseases, war, terrorism, and environmental disasters, may significantly affect a fund's investment performance. The effects of these developments to a fund will be impacted by the types of securities in which a fund invests, the financial condition, industry, economic sector, and geographic location of an issuer, and a fund's level of investment in the securities of that issuer. Significant concentrations in security types, issuers, industries, sectors, and geographic locations may magnify the factors that affect a fund's performance.
To the Board of Trustees of Fidelity Investment Trust and Shareholders of Fidelity Enduring Opportunities Fund
Opinion on the Financial Statements
We have audited the accompanying statement of assets and liabilities, including the schedule of investments, of Fidelity Enduring Opportunities Fund (one of the funds constituting Fidelity Investment Trust, referred to hereafter as the "Fund") as of October 31, 2023, the related statement of operations for the year ended October 31, 2023, the statement of changes in net assets for each of the two years in the period ended October 31, 2023, including the related notes, and the financial highlights for each of the three years in the period ended October 31, 2023 and for the period November 5, 2019 (commencement of operations) through October 31, 2020 (collectively referred to as the "financial statements"). In our opinion, the financial statements present fairly, in all material respects, the financial position of the Fund as of October 31, 2023, the results of its operations for the year then ended, the changes in its net assets for each of the two years in the period ended October 31, 2023 and the financial highlights for each of the three years in the period ended October 31, 2023 and for the period November 5, 2019 (commencement of operations) through October 31, 2020 in conformity with accounting principles generally accepted in the United States of America.
Basis for Opinion
These financial statements are the responsibility of the Fund's management. Our responsibility is to express an opinion on the Fund's financial statements based on our audits. We are a public accounting firm registered with the Public Company Accounting Oversight Board (United States) (PCAOB) and are required to be independent with respect to the Fund in accordance with the U.S. federal securities laws and the applicable rules and regulations of the Securities and Exchange Commission and the PCAOB.
We conducted our audits of these financial statements in accordance with the standards of the PCAOB. Those standards require that we plan and perform the audit to obtain reasonable assurance about whether the financial statements are free of material misstatement, whether due to error or fraud.
Our audits included performing procedures to assess the risks of material misstatement of the financial statements, whether due to error or fraud, and performing procedures that respond to those risks. Such procedures included examining, on a test basis, evidence regarding the amounts and disclosures in the financial statements. Our audits also included evaluating the accounting principles used and significant estimates made by management, as well as evaluating the overall presentation of the financial statements. Our procedures included confirmation of securities owned as of October 31, 2023 by correspondence with the custodian. We believe that our audits provide a reasonable basis for our opinion.
/s/ PricewaterhouseCoopers LLP
Boston, Massachusetts
December 14, 2023
We have served as the auditor of one or more investment companies in the Fidelity group of funds since 1932.
The Trustees, Members of the Advisory Board (if any), and officers of the trust and fund, as applicable, are listed below. The Board of Trustees governs the fund and is responsible for protecting the interests of shareholders. The Trustees are experienced executives who meet periodically throughout the year to oversee the fund's activities, review contractual arrangements with companies that provide services to the fund, oversee management of the risks associated with such activities and contractual arrangements, and review the fund's performance. Except for Jonathan Chiel, each of the Trustees oversees 322 funds. Mr. Chiel oversees 191 funds.
The Trustees hold office without limit in time except that (a) any Trustee may resign; (b) any Trustee may be removed by written instrument, signed by at least two-thirds of the number of Trustees prior to such removal; (c) any Trustee who requests to be retired or who has become incapacitated by illness or injury may be retired by written instrument signed by a majority of the other Trustees; and (d) any Trustee may be removed at any special meeting of shareholders by a two-thirds vote of the outstanding voting securities of the trust. Each Trustee who is not an interested person (as defined in the 1940 Act) of the trust and the fund is referred to herein as an Independent Trustee. Each Independent Trustee shall retire not later than the last day of the calendar year in which his or her 75th birthday occurs. The Independent Trustees may waive this mandatory retirement age policy with respect to individual Trustees. Officers and Advisory Board Members hold office without limit in time, except that any officer or Advisory Board Member may resign or may be removed by a vote of a majority of the Trustees at any regular meeting or any special meeting of the Trustees. Except as indicated, each individual has held the office shown or other offices in the same company for the past five years.
The fund's Statement of Additional Information (SAI) includes more information about the Trustees. To request a free copy, call Fidelity at 1-800-544-8544.
Experience, Skills, Attributes, and Qualifications of the Trustees. The Governance and Nominating Committee has adopted a statement of policy that describes the experience, qualifications, attributes, and skills that are necessary and desirable for potential Independent Trustee candidates (Statement of Policy). The Board believes that each Trustee satisfied at the time he or she was initially elected or appointed a Trustee, and continues to satisfy, the standards contemplated by the Statement of Policy. The Governance and Nominating Committee also engages professional search firms to help identify potential Independent Trustee candidates who have the experience, qualifications, attributes, and skills consistent with the Statement of Policy. From time to time, additional criteria based on the composition and skills of the current Independent Trustees, as well as experience or skills that may be appropriate in light of future changes to board composition, business conditions, and regulatory or other developments, have also been considered by the professional search firms and the Governance and Nominating Committee. In addition, the Board takes into account the Trustees' commitment and participation in Board and committee meetings, as well as their leadership of standing and ad hoc committees throughout their tenure.
In determining that a particular Trustee was and continues to be qualified to serve as a Trustee, the Board has considered a variety of criteria, none of which, in isolation, was controlling. The Board believes that, collectively, the Trustees have balanced and diverse experience, qualifications, attributes, and skills, which allow the Board to operate effectively in governing the fund and protecting the interests of shareholders. Information about the specific experience, skills, attributes, and qualifications of each Trustee, which in each case led to the Board's conclusion that the Trustee should serve (or continue to serve) as a trustee of the fund, is provided below.
Board Structure and Oversight Function. Robert A. Lawrence is an interested person and currently serves as Chair. The Trustees have determined that an interested Chair is appropriate and benefits shareholders because an interested Chair has a personal and professional stake in the quality and continuity of services provided to the fund. Independent Trustees exercise their informed business judgment to appoint an individual of their choosing to serve as Chair, regardless of whether the Trustee happens to be independent or a member of management. The Independent Trustees have determined that they can act independently and effectively without having an Independent Trustee serve as Chair and that a key structural component for assuring that they are in a position to do so is for the Independent Trustees to constitute a substantial majority for the Board. The Independent Trustees also regularly meet in executive session. David M. Thomas serves as Lead Independent Trustee and as such (i) acts as a liaison between the Independent Trustees and management with respect to matters important to the Independent Trustees and (ii) with management prepares agendas for Board meetings.
Fidelity® funds are overseen by different Boards of Trustees. The fund's Board oversees Fidelity's high income and certain equity funds, and other Boards oversee Fidelity's alternative investment, investment-grade bond, money market, asset allocation, and other equity funds. The asset allocation funds may invest in Fidelity® funds overseen by the fund's Board. The use of separate Boards, each with its own committee structure, allows the Trustees of each group of Fidelity® funds to focus on the unique issues of the funds they oversee, including common research, investment, and operational issues. On occasion, the separate Boards establish joint committees to address issues of overlapping consequences for the Fidelity® funds overseen by each Board.
The Trustees operate using a system of committees to facilitate the timely and efficient consideration of all matters of importance to the Trustees, the fund, and fund shareholders and to facilitate compliance with legal and regulatory requirements and oversight of the fund's activities and associated risks. The Board, acting through its committees, has charged FMR and its affiliates with (i) identifying events or circumstances the occurrence of which could have demonstrably adverse effects on the fund's business and/or reputation; (ii) implementing processes and controls to lessen the possibility that such events or circumstances occur or to mitigate the effects of such events or circumstances if they do occur; and (iii) creating and maintaining a system designed to evaluate continuously business and market conditions in order to facilitate the identification and implementation processes described in (i) and (ii) above. Because the day-to-day operations and activities of the fund are carried out by or through FMR, its affiliates, and other service providers, the fund's exposure to risks is mitigated but not eliminated by the processes overseen by the Trustees. While each of the Board's committees has responsibility for overseeing different aspects of the fund's activities, oversight is exercised primarily through the Operations, Audit, and Compliance Committees. Appropriate personnel, including but not limited to the fund's Chief Compliance Officer (CCO), FMR's internal auditor, the independent accountants, the fund's Treasurer and portfolio management personnel, make periodic reports to the Board's committees, as appropriate, including an annual review of Fidelity's risk management program for the Fidelity® funds. The responsibilities of each standing committee, including their oversight responsibilities, are described further under "Standing Committees of the Trustees."
Interested Trustees*:
Correspondence intended for a Trustee who is an interested person may be sent to Fidelity Investments, 245 Summer Street, Boston, Massachusetts 02210.
Name, Year of Birth; Principal Occupations and Other Relevant Experience+
Jonathan Chiel (1957)
Year of Election or Appointment: 2016
Trustee
Mr. Chiel also serves as Trustee of other Fidelity® funds. Mr. Chiel is General Counsel (2012-present) and Head of Legal, Risk and Compliance (2022-present). Mr Chiel serves as Executive Vice President and General Counsel for FMR LLC (diversified financial services company, 2012-present) and Director and President for OH Company LLC (holding company, 2018-present). Previously, Mr. Chiel served as general counsel (2004-2012) and senior vice president and deputy general counsel (2000-2004) for John Hancock Financial Services; a partner with Choate, Hall & Stewart (1996-2000) (law firm); and an Assistant United States Attorney for the United States Attorney's Office of the District of Massachusetts (1986-95), including Chief of the Criminal Division (1993-1995). Mr. Chiel is a director on the boards of the Boston Bar Foundation and the Maimonides School.
Bettina Doulton (1964)
Year of Election or Appointment: 2021
Trustee
Ms. Doulton also serves as Trustee of other Fidelity® funds. Prior to her retirement, Ms. Doulton served in a variety of positions at Fidelity Investments, including as a managing director of research (2006-2007), portfolio manager to certain Fidelity® funds (1993-2005), equity analyst and portfolio assistant (1990-1993), and research assistant (1987-1990). Ms. Doulton currently owns and operates Phi Builders + Architects and Cellardoor Winery. Previously, Ms. Doulton served as a member of the Board of Brown Capital Management, LLC (2014-2018).
Robert A. Lawrence (1952)
Year of Election or Appointment: 2020
Trustee
Chair of the Board of Trustees
Mr. Lawrence also serves as Trustee of other funds. Previously, Mr. Lawrence served as a Trustee and Member of the Advisory Board of certain funds. Prior to his retirement in 2008, Mr. Lawrence served as Vice President of certain Fidelity® funds (2006-2008), Senior Vice President, Head of High Income Division of Fidelity Management & Research Company (investment adviser firm, 2006-2008), and President of Fidelity Strategic Investments (investment adviser firm, 2002-2005).
* Determined to be an "Interested Trustee" by virtue of, among other things, his or her affiliation with the trust or various entities under common control with FMR.
+ The information includes the Trustee's principal occupation during the last five years and other information relating to the experience, attributes, and skills relevant to the Trustee's qualifications to serve as a Trustee, which led to the conclusion that the Trustee should serve as a Trustee for the fund.
Independent Trustees:
Correspondence intended for an Independent Trustee may be sent to Fidelity Investments, P.O. Box 55235, Boston, Massachusetts 02205-5235.
Name, Year of Birth; Principal Occupations and Other Relevant Experience+
Thomas P. Bostick (1956)
Year of Election or Appointment: 2021
Trustee
Lieutenant General Bostick also serves as Trustee of other Fidelity® funds. Prior to his retirement, General Bostick (United States Army, Retired) held a variety of positions within the U.S. Army, including Commanding General and Chief of Engineers, U.S. Army Corps of Engineers (2012-2016) and Deputy Chief of Staff and Director of Human Resources, U.S. Army (2009-2012). General Bostick currently serves as a member of the Board and Finance and Governance & Sustainability Committees of CSX Corporation (transportation, 2020-present) and a member of the Board and Corporate Governance and Nominating Committee of Perma-Fix Environmental Services, Inc. (nuclear waste management, 2020-present). General Bostick serves as Chief Executive Officer of Bostick Global Strategies, LLC (consulting, 2016-present), as a member of the Board of HireVue, Inc. (video interview and assessment, 2020-present), as a member of the Board of Allonnia (biotechnology and engineering solutions, 2022-present) and on the Advisory Board of Solugen, Inc. (specialty bio-based chemicals manufacturer, 2022-present). Previously, General Bostick served as a Member of the Advisory Board of certain Fidelity® funds (2021), President, Intrexon Bioengineering (2018-2020) and Chief Operating Officer (2017-2020) and Senior Vice President of the Environment Sector (2016-2017) of Intrexon Corporation (biopharmaceutical company).
Dennis J. Dirks (1948)
Year of Election or Appointment: 2005
Trustee
Mr. Dirks also serves as Trustee of other Fidelity® funds. Prior to his retirement in May 2003, Mr. Dirks served as Chief Operating Officer and as a member of the Board of The Depository Trust & Clearing Corporation (financial markets infrastructure), President, Chief Operating Officer and a member of the Board of The Depository Trust Company (DTC), President and a member of the Board of the National Securities Clearing Corporation (NSCC), Chief Executive Officer and a member of the Board of the Government Securities Clearing Corporation and Chief Executive Officer and a member of the Board of the Mortgage-Backed Securities Clearing Corporation. Mr. Dirks currently serves as a member of the Finance Committee (2016-present) and Board (2017-present) and is Treasurer (2018-present) of the Asolo Repertory Theatre.
Donald F. Donahue (1950)
Year of Election or Appointment: 2018
Trustee
Mr. Donahue also serves as Trustee of other Fidelity® funds. Mr. Donahue serves as President and Chief Executive Officer of Miranda Partners, LLC (risk consulting for the financial services industry, 2012-present). Previously, Mr. Donahue served as Chief Executive Officer (2006-2012), Chief Operating Officer (2003-2006) and Managing Director, Customer Marketing and Development (1999-2003) of The Depository Trust & Clearing Corporation (financial markets infrastructure). Mr. Donahue currently serves as a member (2007-present) and Co-Chairman (2016-present) of the Board of United Way of New York. Mr. Donahue previously served as a member of the Advisory Board of certain Fidelity® funds (2015-2018) and as a member of the Board of The Leadership Academy (previously NYC Leadership Academy) (2012-2022).
Vicki L. Fuller (1957)
Year of Election or Appointment: 2020
Trustee
Ms. Fuller also serves as Trustee of other Fidelity® funds. Previously, Ms. Fuller served as a member of the Advisory Board of certain Fidelity® funds (2018-2020), Chief Investment Officer of the New York State Common Retirement Fund (2012-2018) and held a variety of positions at AllianceBernstein L.P. (global asset management, 1985-2012), including Managing Director (2006-2012) and Senior Vice President and Senior Portfolio Manager (2001-2006). Ms. Fuller currently serves as a member of the Board, Audit Committee and Nominating and Governance Committee of two Blackstone business development companies (2020-present), as a member of the Board of Treliant, LLC (consulting, 2019-present), as a member of the Board of Ariel Alternatives, LLC (private equity, 2022-present) and as a member of the Board and Chair of the Audit Committee of Gusto, Inc. (software, 2021-present). In addition, Ms. Fuller currently serves as a member of the Board of Roosevelt University (2019-present) and as a member of the Executive Board of New York University's Stern School of Business. Ms. Fuller previously served as a member of the Board, Audit Committee and Nominating and Governance Committee of The Williams Companies, Inc. (natural gas infrastructure, 2018-2021).
Patricia L. Kampling (1959)
Year of Election or Appointment: 2020
Trustee
Ms. Kampling also serves as Trustee of other Fidelity® funds. Prior to her retirement, Ms. Kampling served as Chairman of the Board and Chief Executive Officer (2012-2019), President and Chief Operating Officer (2011-2012) and Executive Vice President and Chief Financial Officer (2010-2011) of Alliant Energy Corporation. Ms. Kampling currently serves as a member of the Board, Finance Committee and Governance, Compensation and Nominating Committee of Xcel Energy Inc. (utilities company, 2020-present) and as a member of the Board, Audit, Finance and Risk Committee and Safety, Environmental, Technology and Operations Committee and Chair of the Executive Development and Compensation Committee of American Water Works Company, Inc. (utilities company, 2019-present). In addition, Ms. Kampling currently serves as a member of the Board of the Nature Conservancy, Wisconsin Chapter (2019-present). Previously, Ms. Kampling served as a Member of the Advisory Board of certain Fidelity® funds (2020), a member of the Board, Compensation Committee and Executive Committee and Chair of the Audit Committee of Briggs & Stratton Corporation (manufacturing, 2011-2021), a member of the Board of Interstate Power and Light Company (2012-2019) and Wisconsin Power and Light Company (2012-2019) (each a subsidiary of Alliant Energy Corporation) and as a member of the Board and Workforce Development Committee of the Business Roundtable (2018-2019).
Thomas A. Kennedy (1955)
Year of Election or Appointment: 2021
Trustee
Mr. Kennedy also serves as Trustee of other Fidelity® funds. Previously, Mr. Kennedy served as a Member of the Advisory Board of certain Fidelity® funds (2020) and held a variety of positions at Raytheon Company (aerospace and defense, 1983-2020), including Chairman and Chief Executive Officer (2014-2020) and Executive Vice President and Chief Operating Officer (2013-2014). Mr. Kennedy served as Executive Chairman of the Board of Directors of Raytheon Technologies Corporation (aerospace and defense, 2020-2021). Mr. Kennedy serves as a Director of the Board of Directors of Textron Inc. (aerospace and defense, 2023-present).
Oscar Munoz (1959)
Year of Election or Appointment: 2021
Trustee
Mr. Munoz also serves as Trustee of other Fidelity® funds. Prior to his retirement, Mr. Munoz served as Executive Chairman (2020-2021), Chief Executive Officer (2015-2020), President (2015-2016) and a member of the Board (2010-2021) of United Airlines Holdings, Inc. Mr. Munoz currently serves as a member of the Board of CBRE Group, Inc. (commercial real estate, 2020-present), a member of the Board of Univision Communications, Inc. (Hispanic media, 2020-present), a member of the Board of Archer Aviation Inc. (2021-present), a member of the Defense Business Board of the United States Department of Defense (2021-present) and a member of the Board of Salesforce.com, Inc. (cloud-based software, 2022-present). Previously, Mr. Munoz served as a Member of the Advisory Board of certain Fidelity® funds (2021).
David M. Thomas (1949)
Year of Election or Appointment: 2008
Trustee
Lead Independent Trustee
Mr. Thomas also serves as Trustee of other Fidelity® funds. Previously, Mr. Thomas served as Executive Chairman (2005-2006) and Chairman and Chief Executive Officer (2000-2005) of IMS Health, Inc. (pharmaceutical and healthcare information solutions). Mr. Thomas currently serves as a member of the Board of Fortune Brands Home and Security (home and security products, 2004-present) and as Director (2013-present) and Non-Executive Chairman of the Board (2022-present) of Interpublic Group of Companies, Inc. (marketing communication).
Susan Tomasky (1953)
Year of Election or Appointment: 2020
Trustee
Ms. Tomasky also serves as Trustee of other Fidelity® funds. Prior to her retirement, Ms. Tomasky served in various executive officer positions at American Electric Power Company, Inc. (1998-2011), including most recently as President of AEP Transmission (2007-2011). Ms. Tomasky currently serves as a member of the Board and Sustainability Committee and as Chair of the Audit Committee of Marathon Petroleum Corporation (2018-present) and as a member of the Board, Executive Committee, Corporate Governance Committee and Organization and Compensation Committee and as Lead Director of the Board of Public Service Enterprise Group, Inc. (utilities company, 2012-present) and as a member of the Board of its subsidiary company, Public Service Electric and Gas Co. (2021-present). In addition, Ms. Tomasky currently serves as a member (2009-present) and President (2020-present) of the Board of the Royal Shakespeare Company - America (2009-present), as a member of the Board of the Columbus Association for the Performing Arts (2011-present) and as a member of the Board and Kenyon in the World Committee of Kenyon College (2016-present). Previously, Ms. Tomasky served as a Member of the Advisory Board of certain Fidelity® funds (2020), as a member of the Board of the Columbus Regional Airport Authority (2007-2020), as a member of the Board (2011-2018) and Lead Independent Director (2015-2018) of Andeavor Corporation (previously Tesoro Corporation) (independent oil refiner and marketer) and as a member of the Board of Summit Midstream Partners LP (energy, 2012-2018).
Michael E. Wiley (1950)
Year of Election or Appointment: 2020
Trustee
Mr. Wiley also serves as Trustee of other Fidelity® funds. Previously, Mr. Wiley served as a member of the Advisory Board of certain Fidelity® funds (2018-2020), Chairman, President and CEO of Baker Hughes, Inc. (oilfield services, 2000-2004). Mr. Wiley also previously served as a member of the Board of Andeavor Corporation (independent oil refiner and marketer, 2005-2018), a member of the Board of Andeavor Logistics LP (natural resources logistics, 2015-2018) and a member of the Board of High Point Resources (exploration and production, 2005-2020).
+ The information includes the Trustee's principal occupation during the last five years and other information relating to the experience, attributes, and skills relevant to the Trustee's qualifications to serve as a Trustee, which led to the conclusion that the Trustee should serve as a Trustee for the fund.
Advisory Board Members and Officers:
Correspondence intended for a Member of the Advisory Board (if any) may be sent to Fidelity Investments, P.O. Box 55235, Boston, Massachusetts 02205-5235. Correspondence intended for an officer or Peter S. Lynch may be sent to Fidelity Investments, 245 Summer Street, Boston, Massachusetts 02210.
Name, Year of Birth; Principal Occupation
Vijay C. Advani (1960)
Year of Election or Appointment: 2023
Member of the Advisory Board
Mr. Advani also serves as Trustee or Member of the Advisory Board of other funds. Previously, Mr. Advani served as Executive Chairman (2020-2022), Chief Executive Officer (2017-2020) and Chief Operating Officer (2016-2017) of Nuveen (global investment manager). He also served in various capacities at Franklin Resources (global investment manager), including Co-President (2015-2016), Executive Vice President, Global Advisory Services (2008-2015), Head of Global Retail Distribution (2005-2008), Executive Managing Director, International Retail Development (2002-2005), Managing Director, Product Developments, Sales & Marketing, Asia, Eastern Europe and Africa (2000-2002) and President, Templeton Asset Management India (1995-2000). Mr. Advani also served as Senior Investment Officer of International Finance Corporation (private equity and venture capital arm of The World Bank, 1984-1995). Mr. Advani is Chairman Emeritus of the U.S. India Business Council (2018-present), a Director of The Global Impact Investing Network (2019-present), a Director of LOK Capital (Mauritius) (2022-present), a member of the Advisory Council of LOK Capital (2022-present), a Senior Advisor of Neuberger Berman (2021-present), a Senior Advisor of Seviora Holdings Pte. Ltd (Temasek-Singapore) (2021-present), a Director of Seviora Capital (Singapore) (2021-present) and an Advisor of EQUIAM (2021-present). Mr. Advani formerly served as a member of the Board of BowX Acquisition Corp. (special purpose acquisition company, 2020-2021), a member of the Board of Intellecap (advisory arm of The Aavishkaar Group, 2018-2020), a member of the Board of Nuveen Investments, Inc. (2017-2020) and a member of the Board of Docusign (software, 2016-2019).
Peter S. Lynch (1944)
Year of Election or Appointment: 2003
Member of the Advisory Board
Mr. Lynch also serves as a Member of the Advisory Board of other Fidelity® funds. Mr. Lynch is Vice Chairman and a Director of Fidelity Management & Research Company LLC (investment adviser firm). In addition, Mr. Lynch serves as a Trustee of Boston College and as the Chairman of the Inner-City Scholarship Fund. Previously, Mr. Lynch served as Vice Chairman and a Director of FMR Co., Inc. (investment adviser firm) and on the Special Olympics International Board of Directors (1997-2006).
Karen B. Peetz (1955)
Year of Election or Appointment: 2023
Member of the Advisory Board
Ms. Peetz also serves as a Member of the Advisory Board of other funds. Previously, Ms. Peetz served as Chief Administration Officer (2020-2023) of Citigroup Inc. (a diversified financial service company). She also served in various capacities at Bank of New York Mellon Corporation, including President (2013-2016), Vice Chairman, Senior Executive Vice President and Chief Executive Officer of Financial Markets & Treasury Services (2010-2013), Senior Executive Vice President and Chief Executive Officer of Global Corporate Trust (2003-2008), Senior Vice President and Division Manager of Global Payments & Trade Services (2002-2003) and Senior Vice President and Division Manager of Domestic Corporate Trust (1998-2002). Ms. Peetz also served in various capacities at Chase Manhattan Corporation (1982-1998), including Senior Vice President and Manager of Corporate Trust International Business (1996-1998), Managing Director and Manager of Corporate Trust Services (1994-1996) and Managing Director and Group Manager of Financial Institution Sales (1990-1993). Ms. Peetz currently serves as Chair of Amherst Holdings Advisory Council (2018-present), Trustee of Johns Hopkins University (2016-present), Chair of the Carey Business School Advisory Council, Member of the Johns Hopkins Medicine Board and Finance Committee and Chair of the Lyme and Tick Related Disease Institute Advisory Council. Ms. Peetz previously served as a member of the Board of Guardian Life Insurance Company of America (2019-2023), a member of the Board of Trane Technologies (2018-2022), a member of the Board of Wells Fargo Corp. (2017-2019), a member of the Board of SunCoke Energy Inc. (2012-2016), a member of the Board of Private Export Funding Corporation (2010-2016) and as a Trustee of Penn State University (2010-2014) and the United Way of New York City (2008-2010).
Heather Bonner (1977)
Year of Election or Appointment: 2023
Assistant Treasurer
Ms. Bonner also serves as an officer of other funds. Ms. Bonner is a Senior Vice President (2022-present) and is an employee of Fidelity Investments (2022-present). Ms. Bonner serves as Vice President, Treasurer, or Assistant Treasurer of certain Fidelity entities. Prior to joining Fidelity, Ms. Bonner served as Managing Director at AQR Capital Management (2013-2022) and was the Treasurer and Principal Financial Officer of the AQR Funds (2013-2022).
Craig S. Brown (1977)
Year of Election or Appointment: 2022
Deputy Treasurer
Mr. Brown also serves as an officer of other funds. Mr. Brown is a Vice President (2015-present) and is an employee of Fidelity Investments. Mr. Brown serves as Assistant Treasurer of FIMM, LLC (2021-present). Previously, Mr. Brown served as Assistant Treasurer of certain Fidelity® funds (2019-2022).
John J. Burke III (1964)
Year of Election or Appointment: 2018
Chief Financial Officer
Mr. Burke also serves as Chief Financial Officer of other funds. Mr. Burke is Head of Fidelity Fund and Investment Operations (2018-present) and is an employee of Fidelity Investments. Mr. Burke serves as President, Executive Vice President, or Director of certain Fidelity entities. Previously Mr. Burke served as head of Asset Management Investment Operations (2012-2018).
Margaret Carey (1973)
Year of Election or Appointment: 2023
Secretary and Chief Legal Officer (CLO)
Ms. Carey also serves as an officer of other funds and as CLO of certain Fidelity entities. Ms. Carey is a Senior Vice President, Deputy General Counsel (2019-present) and is an employee of Fidelity Investments.
William C. Coffey (1969)
Year of Election or Appointment: 2019
Assistant Secretary
Mr. Coffey also serves as Assistant Secretary of other funds. Mr. Coffey is a Senior Vice President, Deputy General Counsel (2010-present) and is an employee of Fidelity Investments. Previously, Mr. Coffey served as Secretary and CLO of certain funds (2018-2019); CLO, Secretary, or Senior Vice President of certain Fidelity entities and Assistant Secretary of certain funds (2009-2018).
Timothy M. Cohen (1969)
Year of Election or Appointment: 2018
Vice President
Mr. Cohen also serves as Vice President of other funds. Mr. Cohen is Co-Head of Equity (2018-present) and is an employee of Fidelity Investments. Mr. Cohen serves a Director of Fidelity Management & Research (Japan) Limited (investment adviser firm, 2016-present). Previously, Mr. Cohen served as Executive Vice President of Fidelity SelectCo, LLC (2019) and Head of Global Equity Research (2016-2018).
Jonathan Davis (1968)
Year of Election or Appointment: 2010
Assistant Treasurer
Mr. Davis also serves as an officer of other funds. Mr. Davis is a Vice President (2006-present) and is an employee of Fidelity Investments. Mr. Davis serves as Assistant Treasurer of certain Fidelity entities.
Laura M. Del Prato (1964)
Year of Election or Appointment: 2018
Assistant Treasurer
Ms. Del Prato also serves as an officer of other funds. Ms. Del Prato is a Senior Vice President (2017-present) and is an employee of Fidelity Investments. Ms. Del Prato serves as Vice President or Assistant Treasurer of certain Fidelity entities. Previously, Ms. Del Prato served as President and Treasurer of The North Carolina Capital Management Trust: Cash Portfolio and Term Portfolio (2018-2020).
Colm A. Hogan (1973)
Year of Election or Appointment: 2020
Assistant Treasurer
Mr. Hogan also serves as an officer of other funds. Mr. Hogan is a Vice President (2016-present) and is an employee of Fidelity Investments. Mr. Hogan serves as Assistant Treasurer of certain Fidelity entities. Previously, Mr. Hogan served as Deputy Treasurer of certain Fidelity® funds (2016-2020) and Assistant Treasurer of certain Fidelity® funds (2016-2018).
Pamela R. Holding (1964)
Year of Election or Appointment: 2018
Vice President
Ms. Holding also serves as Vice President of other funds. Ms. Holding is Co-Head of Equity (2018-present) and is an employee of Fidelity Investments. Previously, Ms. Holding served as Executive Vice President of Fidelity SelectCo, LLC (2019) and as Chief Investment Officer of Fidelity Institutional Asset Management (2013-2018).
Chris Maher (1972)
Year of Election or Appointment: 2020
Deputy Treasurer
Mr. Maher also serves as an officer of other funds. Mr. Maher is a Vice President (2008-present) and is an employee of Fidelity Investments. Mr. Maher serves as Assistant Treasurer of certain Fidelity entities. Previously, Mr. Maher served as Assistant Treasurer of certain funds (2013-2020).
Jason P. Pogorelec (1975)
Year of Election or Appointment: 2020
Chief Compliance Officer
Mr. Pogorelec also serves as Chief Compliance Officer of other funds. Mr. Pogorelec is a Senior Vice President of Asset Management Compliance (2020-present) and is an employee of Fidelity Investments. Mr. Pogorelec serves as Compliance Officer of Fidelity Management & Research Company LLC (investment adviser firm, 2023-present) and Ballyrock Investment Advisors LLC (2023-present). Previously, Mr. Pogorelec served as a Vice President, Associate General Counsel for Fidelity Investments (2010-2020) and Assistant Secretary of certain Fidelity® funds (2015-2020).
Brett Segaloff (1972)
Year of Election or Appointment: 2021
Anti-Money Laundering (AML) Officer
Mr. Segaloff also serves as AML Officer of other funds. Mr. Segaloff is a Vice President (2022-present) and is an employee of Fidelity Investments. Mr. Segaloff serves as Anti Money Laundering Compliance Officer or Anti Money Laundering/Bank Secrecy Act Compliance Officer of certain Fidelity entities.
Stacie M. Smith (1974)
Year of Election or Appointment: 2016
President and Treasurer
Ms. Smith also serves as an officer of other funds. Ms. Smith is a Senior Vice President (2016-present) and is an employee of Fidelity Investments. Ms. Smith serves as Assistant Treasurer of certain Fidelity entities and has served in other fund officer roles.
Jim Wegmann (1979)
Year of Election or Appointment: 2019
Assistant Treasurer
Mr. Wegmann also serves as an officer of other funds. Mr. Wegmann is a Vice President (2016-present) and is an employee of Fidelity Investments. Mr. Wegmann serves as Assistant Treasurer of FIMM, LLC (2021-present). Previously, Mr. Wegmann served as Assistant Treasurer of certain Fidelity® funds (2019-2021).
As a shareholder, you incur two types of costs: (1) transaction costs, which may include sales charges (loads) on purchase payments or redemption proceeds, as applicable and (2) ongoing costs, which generally include management fees, distribution and/or service (12b-1) fees and other Fund expenses. This Example is intended to help you understand your ongoing costs (in dollars) of investing in a fund and to compare these costs with the ongoing costs of investing in other mutual funds.
| The Example is based on an investment of $1,000 invested at the beginning of the period and held for the entire period (May 1, 2023 to October 31, 2023). |
Actual Expenses
The first line of the accompanying table provides information about actual account values and actual expenses. You may use the information in this line, together with the amount you invested, to estimate the expenses that you paid over the period. Simply divide your account value by $1,000.00 (for example, an $8,600 account value divided by $1,000.00 = 8.6), then multiply the result by the number in the first line for a class/Fund under the heading entitled "Expenses Paid During Period" to estimate the expenses you paid on your account during this period. If any fund is a shareholder of any underlying mutual funds or exchange-traded funds (ETFs) (the Underlying Funds), such fund indirectly bears its proportional share of the expenses of the Underlying Funds in addition to the direct expenses incurred presented in the table. These fees and expenses are not included in the annualized expense ratio used to calculate the expense estimate in the table below.
Hypothetical Example for Comparison Purposes
The second line of the accompanying table provides information about hypothetical account values and hypothetical expenses based on the actual expense ratio and an assumed rate of return of 5% per year before expenses, which is not the actual return. The hypothetical account values and expenses may not be used to estimate the actual ending account balance or expenses you paid for the period. You may use this information to compare the ongoing costs of investing in the Fund and other funds. To do so, compare this 5% hypothetical example with the 5% hypothetical examples that appear in the shareholder reports of the other funds. If any fund is a shareholder of any Underlying Funds, such fund indirectly bears its proportional share of the expenses of the Underlying Funds in addition to the direct expenses as presented in the table. These fees and expenses are not included in the annualized expense ratio used to calculate the expense estimate in the table below.
Please note that the expenses shown in the table are meant to highlight your ongoing costs only and do not reflect any transaction costs. Therefore, the second line of the table is useful in comparing ongoing costs only, and will not help you determine the relative total costs of owning different funds. In addition, if these transactional costs were included, your costs would have been higher.
| | | | | Annualized Expense Ratio- A | | Beginning Account Value May 1, 2023 | | Ending Account Value October 31, 2023 | | Expenses Paid During Period- C May 1, 2023 to October 31, 2023 |
| | | | | | | | | | |
Fidelity® Enduring Opportunities Fund ** | | | | .94% | | | | | | |
| Actual | | | | | | $ 1,000 | | $ 967.80 | | $ 4.66 |
Hypothetical-B | | | | | | $ 1,000 | | $ 1,020.47 | | $ 4.79 |
| |
A Annualized expense ratio reflects expenses net of applicable fee waivers.
B 5% return per year before expenses
C Expenses are equal to the annualized expense ratio, multiplied by the average account value over the period, multiplied by 184/ 365 (to reflect the one-half year period). The fees and expenses of any Underlying Funds are not included in each annualized expense ratio.
** If fees and changes to the expense contract and/or expense cap, effective December 1, 2023, had been in effect during the current period, the restated annualized expense ratio and the expenses paid in the actual and hypothetical examples above would have been as shown in table below:
| | | | | Annualized Expense Ratio- A | | Expenses Paid |
| | | | | | |
| Fidelity® Enduring Opportunities Fund | | | | .88% | | |
| Actual | | | | | | $ 4.37 |
Hypothetical- B | | | | | | $ 4.48 |
| | | | | | | |
| A Annualized expense ratio reflects expenses net of applicable fee waivers. | | | | | | |
| B 5% return per year before expenses | | | | | | |
The dividend and capital gains distributions for the fund(s) are available on Fidelity.com or Institutional.Fidelity.com.
The fund will notify shareholders in January 2024 of amounts for use in preparing 2023 income tax returns.
Board Approval of Investment Advisory Contracts and Management Fees
Fidelity Enduring Opportunities Fund
Each year, the Board of Trustees, including the Independent Trustees (together, the Board), considers the renewal of the fund's management contract with Fidelity Management & Research Company LLC (FMR) and the sub-advisory agreements (together, the Advisory Contracts) for the fund. FMR and the sub-advisers are referred to herein as the Investment Advisers. The Board, assisted by the advice of fund counsel and Independent Trustees' counsel, requests and considers a broad range of information relevant to the renewal of the Advisory Contracts throughout the year.
The Board meets regularly and, at each of its meetings, covers an extensive agenda of topics and materials and considers factors that are relevant to its annual consideration of the renewal of the fund's Advisory Contracts, including the services and support provided to the fund and its shareholders. The Board, acting directly and through its Committees (each of which is composed of and chaired by Independent Trustees), requests and receives information concerning the annual consideration of the renewal of the fund's Advisory Contracts. The Board also meets as needed to review matters specifically related to the Board's annual consideration of the renewal of the Advisory Contracts. Members of the Board may also meet with trustees of other Fidelity funds through joint ad hoc committees to discuss certain matters relevant to all of the Fidelity funds.
Approval of Stub Period Continuation. At its May 2023 meeting, the Board of Trustees voted to continue the fund's management contract with FMR, and the sub-advisory agreements and sub-sub-advisory agreements, in each case, where applicable (together, the Advisory Contracts), without modification, for two months from June 1, 2023 through July 31, 2023. The Board considered that the approval of the fund's Advisory Contracts will not result in any changes in (i) the investment process or strategies employed in the management of the fund's assets; (ii) the fees and expenses paid by shareholders; (iii) the nature, extent or quality of services provided under the fund's Advisory Contracts; or (iv) the day-to-day management of the fund or the persons primarily responsible for such management. The Board also considered that since its last approval of the fund's Advisory Contracts, FMR had provided additional information on the fund in support of the annual contract renewal process, including competitive analyses on total expenses and management fees and in-depth reviews of fund performance and fund profitability information. The Board concluded that the fund's Advisory Contracts are fair and reasonable, and that the fund's Advisory Contracts should be renewed, without modification, through July 31, 2023, with the understanding that the Board would consider the annual renewal for a full one year period in July 2023.
At its July 2023 meeting, the Board unanimously determined to renew the fund's Advisory Contracts. In reaching its determination, the Board considered all factors it believed relevant, including (i) the nature, extent, and quality of the services provided to the fund and its shareholders (including the investment performance of the fund); (ii) the competitiveness relative to peer funds of the fund's management fee and total expense ratio; (iii) the total costs of the services provided by and the profits realized by FMR and its affiliates (Fidelity) from its relationships with the fund; and (iv) the extent to which, if any, economies of scale exist and are realized as the fund grows, and whether any economies of scale are appropriately shared with fund shareholders. The Board also considered the broad range of investment choices available to shareholders from FMR's competitors and that the fund's shareholders have chosen to invest in the fund, which is part of the Fidelity family of funds. The Board's decision to renew the Advisory Contracts was not based on any single factor.
The Board reached a determination, with the assistance of fund counsel and Independent Trustees' counsel and through the exercise of its business judgment, that the renewal of the Advisory Contracts was in the best interests of the fund and its shareholders and that the compensation payable under the Advisory Contracts was fair and reasonable in light of all of the surrounding circumstances.
Nature, Extent, and Quality of Services Provided. The Board considered staffing as it relates to the fund, including the backgrounds and experience of investment personnel of the Investment Advisers, and also considered the Investment Advisers' implementation of the fund's investment program. The Independent Trustees also had discussions with senior management of Fidelity's investment operations and investment groups. The Board considered the structure of the investment personnel compensation program and whether this structure provides appropriate incentives to act in the best interests of the fund. Additionally, the Board considered the portfolio managers' investments, if any, in the funds that they manage.
Resources Dedicated to Investment Management and Support Services. The Board and the Fund Oversight and Research Committees reviewed the general qualifications and capabilities of Fidelity's investment staff, including its size, education, experience, and resources, as well as Fidelity's approach to recruiting, training, managing, and compensating investment personnel. The Board noted the resources devoted to expansion of Fidelity's global investment organization, and that Fidelity's analysts have extensive resources, tools, and capabilities that allow them to conduct sophisticated quantitative and fundamental analysis, as well as credit analysis of issuers, counterparties, and guarantors. Further, the Board considered that Fidelity's investment professionals have sufficient access to global information and data so as to provide competitive investment results over time, and that those professionals also have access to sophisticated tools that permit them to assess portfolio construction and risk and performance attribution characteristics continuously, as well as to transmit new information and research conclusions rapidly around the world. Additionally, in its deliberations, the Board considered Fidelity's trading, risk management, compliance, and technology and operations capabilities and resources, which are integral parts of the investment management process.
Shareholder and Administrative Services. The Board considered (i) the nature, extent, quality, and cost of advisory, administrative, and shareholder services performed by the Investment Advisers and their affiliates under the Advisory Contracts and under separate agreements covering transfer agency, pricing and bookkeeping, and securities lending services for the fund; (ii) the nature and extent of Fidelity's supervision of third party service providers, principally custodians, subcustodians, and pricing vendors; and (iii) the resources devoted by Fidelity to, and the record of compliance with, the fund's compliance policies and procedures. The Board also reviewed the allocation of fund brokerage, including allocations to brokers affiliated with the Investment Advisers, the use of brokerage commissions to pay fund expenses, and the use of "soft" commission dollars to pay for research services. The Board also considered the fund's securities lending activities and any payments made to Fidelity relating to securities lending.
The Board noted that the growth of fund assets over time across the complex allows Fidelity to reinvest in the development of services designed to enhance the value and convenience of the Fidelity funds as investment vehicles. These services include 24-hour access to account information and market information over the Internet and through telephone representatives, investor education materials, and asset allocation tools. The Board also considered that it reviews customer service metrics such as telephone response times, continuity of services on the website and metrics addressing services at Fidelity Investor Centers.
Investment in a Large Fund Family. The Board considered the benefits to shareholders of investing in a fund that is part of a large family of funds offering a variety of investment disciplines and providing a large variety of fund investor services. The Board noted that Fidelity had taken, or had made recommendations that resulted in the Fidelity funds taking, a number of actions over the previous year that benefited particular funds and/or the Fidelity funds in general.
Investment Performance. The Board took into account discussions that occur with representatives of the Investment Advisers, and reports that it receives, at Board meetings throughout the year, relating to fund investment performance. In this regard the Board noted that as part of regularly scheduled fund reviews and other reports to the Board on fund performance, the Board considered annualized return information for the fund for different time periods, measured against an appropriate securities market index (benchmark index) and an appropriate peer group of funds with similar objectives (peer group). The Board also considered information about performance attribution. In its ongoing evaluation of fund investment performance, the Board gives particular attention to information indicating changes in performance of the funds over different time periods and discussed with the Investment Advisers the reasons for any overperformance or underperformance. The fund underperformed its benchmark and peers for the one- and three-year periods ended February 28, 2023, and as a result, the Board continues to engage in discussions with FMR about the steps it is taking to address the fund's performance.
In addition to reviewing absolute and relative fund performance, the Independent Trustees periodically consider the appropriateness of fund performance metrics in evaluating the results achieved. The Independent Trustees generally give greater weight to fund performance over longer time periods than over shorter time periods. Depending on the circumstances, the Independent Trustees may be satisfied with a fund's performance notwithstanding that it lags its benchmark index or peer group for certain periods.
Based on its review, the Board concluded that the nature, extent, and quality of services provided to the fund under the Advisory Contracts should continue to benefit the shareholders of the fund.
Competitiveness of Management Fee and Total Expense Ratio. The Board was provided with information regarding industry trends in management fees and expenses. In its review of the fund's management fee and total expense ratio, the Board considered the fund's management fee rate as well as other fund expenses, such as transfer agent fees, pricing and bookkeeping fees, and custodial, legal, and audit fees. The Board noted that Fidelity may agree to waive fees or reimburse expenses from time to time, and the extent to which, if any, it has done so for the fund. The Board also considered information about the impact of the fund's performance adjustment.
Comparisons of Management Fees and Total Expense Ratios. Among other things, the Board reviewed data for selected groups of competitive funds and classes (referred to as "mapped groups") that were compiled by Fidelity based on combining similar investment objective categories (as classified by Lipper) that have comparable investment mandates. The data reviewed by the Board included (i) gross management fee comparisons (before taking into account expense reimbursements or caps and without taking into account the fund's performance adjustment) relative to the total universe of funds within the mapped group; (ii) gross management fee comparisons relative to a subset of non-Fidelity funds in the mapped group that are similar in size and management fee structure to the fund (referred to as the "asset size peer group"); (iii) total expense comparisons of the fund relative to funds and classes in the mapped group that have a similar sales load structure to the fund (referred to as the "similar sales load structure group"); and (iv) total expense comparisons of the fund relative to funds and classes in the similar sales load structure group that are similar in size and management fee structure to the fund (referred to as the "total expense asset size peer group"). The total expense asset size peer group comparison excludes performance adjustments and fund-paid 12b-1 fees to eliminate variability in fee structures.
The information provided to the Board indicated that the fund's management fee rate ranked below the competitive median of the mapped group for the 12-month period ended September 30, 2022 and below the competitive median of the asset size peer group for the 12-month period ended September 30, 2022. Further, the information provided to the Board indicated that the total expense ratio of the fund ranked below the competitive median of the similar sales load structure group for the 12-month period ended September 30, 2022 and below the competitive median of the total expense asset size peer group for the 12-month period ended September 30, 2022.
The Board also considered that, for funds subject to the group fee, FMR agreed to voluntarily waive fees over a specified period of time in amounts designed to account for assets converted from certain funds to certain collective investment trusts.
The Board also considered that the fund's management fee is subject to upward or downward adjustment depending upon whether, and to what extent, the fund's investment performance for the performance period (a rolling 36-month period) exceeds, or is exceeded by, a securities index, thus leading to a performance adjustment for the same period. The Board noted that the performance adjustment provides FMR with a strong economic incentive to seek to achieve superior long-term performance for the fund's shareholders and helps to more closely align the interests of FMR and the shareholders of the fund.
Other Contractual Arrangements. The Board further considered that FMR has contractually agreed to reimburse the fund to the extent that total operating expenses, with certain exceptions, as a percentage of its average net assets, exceed 0.95% through February 29, 2024.
Fees Charged to Other Fidelity Clients. The Board also considered Fidelity fee structures and other information with respect to clients of Fidelity, such as other funds advised or subadvised by Fidelity, pension plan clients, and other institutional clients with similar mandates. The Board noted that a joint ad hoc committee created by it and the boards of other Fidelity funds periodically reviews and compares Fidelity's institutional investment advisory business with its business of providing services to the Fidelity funds and also noted the most recent findings of the committee. The Board noted that the committee's review included a consideration of the differences in services provided, fees charged, and costs incurred, as well as competition in the markets serving the different categories of clients.
Based on its review, the Board concluded that the fund's management fee is fair and reasonable in light of the services that the fund receives and the other factors considered. Further based on its review of total expense ratios and fees charged to other Fidelity clients, the Board concluded that the fund's total expense ratio was reasonable in light of the services that the fund and its shareholders receive and the other factors considered.
Costs of the Services and Profitability. The Board considered the revenues earned and the expenses incurred by Fidelity in conducting the business of developing, marketing, distributing, managing, administering and servicing the fund and servicing the fund's shareholders. The Board also considered the level of Fidelity's profits in respect of all the Fidelity funds.
On an annual basis, Fidelity presents to the Board information about the profitability of its relationships with the fund. Fidelity calculates profitability information for each fund, as well as aggregate profitability information for groups of Fidelity funds and all Fidelity funds, using a series of detailed revenue and cost allocation methodologies which originate with the books and records of Fidelity on which Fidelity's audited financial statements are based. The Audit Committee of the Board reviews any significant changes from the prior year's methodologies and the full Board approves such changes.
A public accounting firm has been engaged annually by the Board as part of the Board's assessment of Fidelity's profitability analysis. The engagement includes the review and assessment of the methodologies used by Fidelity in determining the revenues and expenses attributable to Fidelity's fund business, and completion of agreed-upon procedures in respect of the mathematical accuracy of certain fund profitability information and its conformity to established allocation methodologies. After considering the reports issued under the engagement and information provided by Fidelity, the Board concluded that while other allocation methods may also be reasonable, Fidelity's profitability methodologies are reasonable in all material respects.
The Board also reviewed Fidelity's non-fund businesses and potential indirect benefits such businesses may have received as a result of their association with Fidelity's fund business (i.e., fall-out benefits) as well as cases where Fidelity's affiliates may benefit from the funds' business. The Board considered areas where potential indirect benefits to the Fidelity funds from their relationships with Fidelity may exist. The Board's consideration of these matters was informed by the findings of a joint ad hoc committee created by it and the boards of other Fidelity funds to evaluate potential fall-out benefits.
The Board considered the costs of the services provided by and the profits realized by Fidelity in connection with the operation of the fund and was satisfied that the profitability was not excessive.
Economies of Scale. The Board considered whether there have been economies of scale in respect of the management of the Fidelity funds, whether the Fidelity funds (including the fund) have appropriately benefited from any such economies of scale, and whether there is potential for realization of any further economies of scale. The Board considered the extent to which the fund will benefit from economies of scale as assets grow through increased services to the fund, through waivers or reimbursements, or through fee or expense ratio reductions. The Board also noted that a committee (the Economies of Scale Committee) created by it and the boards of other Fidelity funds periodically analyzes whether Fidelity attains economies of scale in respect of the management and servicing of the Fidelity funds, whether the Fidelity funds have appropriately benefited from such economies of scale, and whether there is potential for realization of any further economies of scale.
The Board recognized that the fund's management contract incorporates a "group fee" structure, which provides for lower group fee rates as total "group assets" increase, and for higher group fee rates as total "group assets" decrease ("group assets" as defined in the management contract). FMR calculates the group fee rates based on a tiered asset "breakpoint" schedule that varies based on asset class. The Board considered that the group fee is designed to deliver the benefits of economies of scale to fund shareholders when total Fidelity fund assets increase, even if assets of any particular fund are unchanged or have declined, because some portion of Fidelity's costs are attributable to services provided to all Fidelity funds, and all funds benefit if those costs can be allocated among more assets. The Board further considered that Fidelity agreed to impose a temporary fee waiver in the form of additional breakpoints to the current breakpoint schedule. The Board concluded that, given the group fee structure, fund shareholders will benefit from lower management fees as "group assets" increase at the fund complex level, regardless of whether Fidelity achieves any such economies of scale.
The Board concluded, taking into account the analysis of the Economies of Scale Committee, that economies of scale, if any, are being appropriately shared between fund shareholders and Fidelity.
Additional Information Requested by the Board. In order to develop fully the factual basis for consideration of the Fidelity funds' advisory contracts, the Board requested and received additional information on certain topics, including: (i) fund flow and performance trends, in particular the underperformance of certain funds and strategies, and Fidelity's long-term strategies for certain funds, including any consideration of fund liquidations or mergers; (ii) the operation of performance fees and competitor use of performance fees; (iii) Fidelity's pricing philosophy compared to competitors; (iv) fund profitability methodology and data; (v) evaluation of competitive fund data and peer group classifications and fee and expense comparisons; (vi) the management fee and expense structures for different funds and classes and information about the differences between various fee and expense structures; (vii) group fee breakpoints and related voluntary fee waivers; and (viii) information regarding other accounts managed by Fidelity and the funds' sub-advisory arrangements.
Conclusion. Based on its evaluation of all of the conclusions noted above, and after considering all factors it believed relevant, the Board, including the Independent Trustees, concluded that the advisory and sub-advisory fee arrangements are fair and reasonable in light of all of the surrounding circumstances and that the fund's Advisory Contracts should be renewed through July 31, 2024.
1.9896221.103
IDF-ANN-1223
Fidelity® International Small Cap Opportunities Fund
Annual Report
October 31, 2023
Includes Fidelity and Fidelity Advisor share classes
Contents
To view a fund's proxy voting guidelines and proxy voting record for the 12-month period ended June 30, visit http://www.fidelity.com/proxyvotingresults or visit the Securities and Exchange Commission's (SEC) web site at http://www.sec.gov.
You may also call 1-800-544-8544 if you're an individual investing directly with Fidelity, call 1-800-835-5092 if you're a plan sponsor or participant with Fidelity as your recordkeeper or call 1-877-208-0098 on institutional accounts or if you're an advisor or invest through one to request a free copy of the proxy voting guidelines.
Standard & Poor's, S&P and S&P 500 are registered service marks of The McGraw-Hill Companies, Inc. and have been licensed for use by Fidelity Distributors Corporation.
Other third-party marks appearing herein are the property of their respective owners.
All other marks appearing herein are registered or unregistered trademarks or service marks of FMR LLC or an affiliated company. © 2023 FMR LLC. All rights reserved.
This report and the financial statements contained herein are submitted for the general information of the shareholders of the Fund. This report is not authorized for distribution to prospective investors in the Fund unless preceded or accompanied by an effective prospectus.
A fund files its complete schedule of portfolio holdings with the SEC for the first and third quarters of each fiscal year on Form N-PORT. Forms N-PORT are available on the SEC's web site at http://www.sec.gov. A fund's Forms N-PORT may be reviewed and copied at the SEC's Public Reference Room in Washington, DC. Information regarding the operation of the SEC's Public Reference Room may be obtained by calling 1-800-SEC-0330.
For a complete list of a fund's portfolio holdings, view the most recent holdings listing, semiannual report, or annual report on Fidelity's web site at http://www.fidelity.com, http://www.institutional.fidelity.com, or http://www.401k.com, as applicable.
NOT FDIC INSURED •MAY LOSE VALUE •NO BANK GUARANTEE
Neither the Fund nor Fidelity Distributors Corporation is a bank.
Average annual total return reflects the change in the value of an investment, assuming reinvestment of distributions from dividend income and capital gains (the profits earned upon the sale of securities that have grown in value, if any) and assuming a constant rate of performance each year. The hypothetical investment and the average annual total returns do not reflect the deduction of taxes that a shareholder would pay on fund distributions or the redemption of fund shares. During periods of reimbursement by Fidelity, a fund's total return will be greater than it would be had the reimbursement not occurred. How a fund did yesterday is no guarantee of how it will do tomorrow.
| Average Annual Total Returns |
| | | | |
Periods ended October 31, 2023 | Past 1 year | Past 5 years | Past 10 years |
Class A (incl. 5.75% sales charge) | -2.22% | 1.84% | 3.87% |
Class M (incl. 3.50% sales charge) | -0.19% | 2.05% | 3.83% |
Class C (incl. contingent deferred sales charge) | 1.97% | 2.27% | 3.84% |
| Fidelity® International Small Cap Opportunities Fund | 4.11% | 3.38% | 4.80% |
| Class I | 4.02% | 3.35% | 4.79% |
| Class Z | 4.19% | 3.49% | 4.86% |
Class C shares' contingent deferred sales charges included in the past one year, past five years and past ten years total return figures are 1%, 0% and 0%, respectively.
The initial offering of Class Z shares took place on October 2, 2018. Returns prior to October 2, 2018, are those of Class I.
| $10,000 Over 10 Years |
| |
Let's say hypothetically that $10,000 was invested in Fidelity® International Small Cap Opportunities Fund, a class of the fund, on October 31, 2013. The chart shows how the value of your investment would have changed, and also shows how the MSCI EAFE Small Cap Index performed over the same period. |
|
|
Market Recap:
International (non-U.S.) equities gained 12.27% for the 12 months ending October 31, 2023, according to the MSCI ACWI (All Country World Index) ex USA Index, as global economic expansion and a slowing in the pace of inflation in some markets provided a favorable backdrop for risk assets. After returning -15.86% in 2022, the index's upturn has been largely driven by a narrow set of companies in the information technology and communication services sectors, in part due to excitement for generative artificial intelligence applications. The index gained 14.07% year to date through July, including strong gains in both June (+4.50%) and July (+4.07%). The rally for international equities sputtered for the next three months (-11.33%) amid a stalling pattern in disinflationary trends, heightened global recession and geopolitical risks, soaring yields on longer-term U.S. government bonds and particularly weak economic conditions in the eurozone and China. The three-month decline left non-U.S. stocks up 1.15% year to date through October. Currency fluctuation also helped bolster non-U.S. equity performance overall. For the full 12 months, nearly all regions advanced, with Europe ex U.K. (+18%) and Japan (+17%) leading, whereas Canada (-0.38%) lagged by the widest margin. Each of the 11 sectors advanced, with information technology (+21%) and consumer discretionary (+19%) leading the way. Energy and industrials each rose about 14%. Conversely, four defensive-oriented sectors lagged by the widest margin: real estate (+4%), health care (+6%), consumer staples (+7%) and utilities (+8%).
Comments from Portfolio Manager Jed Weiss:
For the fiscal year ending October 31, 2023, the fund's share classes (excluding sales charges, if applicable) gained about 3% to 4%, versus 6.67% for the benchmark MSCI EAFE Small Cap Index (Net MA). From a regional standpoint, security selection in Japan and emerging markets notably detracted from the fund's relative result. By sector, picks among health care firms weighed most on relative performance, especially in the health care equipment & services industry. Subpar investment choices in consumer staples, primarily within the consumer staples distribution & retail category, also hurt. Stock picks in information technology proved to be another performance headwind, particularly among software & services companies. Further detracting from the portfolio's relative return were security selection and an underweight in financials, especially banks. The largest individual relative detractor was a stake in ResMed (-36%), followed by Misumi Group (-30%) and Digital Hearts Holdings (-56%). All of these relative detractors were non-benchmark positions. In contrast, on a regional basis, security selection and an underweight in Asia Pacific ex Japan - namely Australia - along with picks in Europe ex the U.K., primarily Sweden, contributed to the fund's performance versus the benchmark. By sector, investment choices and an underweight in real estate, primarily among equity real estate investment trusts, added the most value compared with the benchmark. Picks in communication services also bolstered relative performance. Further aiding the portfolio's relative return was outsized exposure to industrials firms, particularly within the capital goods industry. Lastly, the fund's position in cash was a key contributor as well. The top individual relative contributor was an overweight in Addtech (+22%), the fund's top holding these past 12 months. A second notable relative contributor was an outsized stake in CTS Eventim (+28%), another of the portfolio's biggest holdings on October 31. A non-benchmark position in Rheinmetall (+79%) also helped. Notable changes in positioning this period include increased exposure to cash and equity markets in Germany. By sector, meaningful shifts include lower allocations to the health care and consumer staples sectors.
The views expressed above reflect those of the portfolio manager(s) only through the end of the period as stated on the cover of this report and do not necessarily represent the views of Fidelity or any other person in the Fidelity organization. Any such views are subject to change at any time based upon market or other conditions and Fidelity disclaims any responsibility to update such views. These views may not be relied on as investment advice and, because investment decisions for a Fidelity fund are based on numerous factors, may not be relied on as an indication of trading intent on behalf of any Fidelity fund.
Top Holdings (% of Fund's net assets) |
| |
| Spectris PLC (United Kingdom, Electronic Equipment, Instruments & Components) | 3.7 | |
| Azbil Corp. (Japan, Electronic Equipment, Instruments & Components) | 3.7 | |
| AddTech AB (B Shares) (Sweden, Trading Companies & Distributors) | 3.5 | |
| Lagercrantz Group AB (B Shares) (Sweden, Electronic Equipment, Instruments & Components) | 3.3 | |
| CTS Eventim AG (Germany, Entertainment) | 3.0 | |
| Interpump Group SpA (Italy, Machinery) | 2.8 | |
| Aalberts Industries NV (Netherlands, Machinery) | 2.4 | |
| Morningstar, Inc. (United States of America, Capital Markets) | 2.3 | |
| SHO-BOND Holdings Co. Ltd. (Japan, Construction & Engineering) | 2.0 | |
| OBIC Co. Ltd. (Japan, IT Services) | 2.0 | |
| | 28.7 | |
| |
| Market Sectors (% of Fund's net assets) |
| |
| Industrials | 30.3 | |
| Information Technology | 21.3 | |
| Consumer Discretionary | 9.9 | |
| Health Care | 7.8 | |
| Communication Services | 7.1 | |
| Financials | 4.8 | |
| Consumer Staples | 4.7 | |
| Materials | 3.1 | |
| Real Estate | 2.2 | |
| Energy | 2.0 | |
| |
Asset Allocation (% of Fund's net assets) |
|
|
Geographic Diversification (% of Fund's net assets) |
|
* Includes Short-Term investments and Net Other Assets (Liabilities). Percentages are adjusted for the effect of derivatives, if applicable. |
| |
Showing Percentage of Net Assets
| Common Stocks - 93.2% |
| | | Shares | Value ($) |
| Australia - 1.0% | | | |
| Imdex Ltd. | | 4,147,753 | 4,350,615 |
| Steadfast Group Ltd. | | 1,715,000 | 5,897,446 |
TOTAL AUSTRALIA | | | 10,248,061 |
| Belgium - 1.6% | | | |
| Azelis Group NV | | 305,300 | 5,200,911 |
| KBC Ancora | | 273,989 | 10,349,707 |
TOTAL BELGIUM | | | 15,550,618 |
| Canada - 3.9% | | | |
| CAE, Inc. (a) | | 446,900 | 9,332,774 |
| McCoy Global, Inc. | | 630,215 | 686,227 |
| Osisko Gold Royalties Ltd. | | 370,000 | 4,522,445 |
| Pason Systems, Inc. | | 492,300 | 4,717,986 |
| Richelieu Hardware Ltd. | | 620,663 | 18,565,063 |
TOTAL CANADA | | | 37,824,495 |
| China - 0.5% | | | |
| Chlitina Holding Ltd. | | 829,500 | 4,991,580 |
| Denmark - 0.5% | | | |
| Spar Nord Bank A/S | | 346,634 | 5,248,345 |
| Egypt - 0.2% | | | |
| Integrated Diagnostics Holdings PLC (a)(b) | | 5,996,716 | 2,284,749 |
| Finland - 0.7% | | | |
| Musti Group OYJ | | 341,496 | 6,724,480 |
| France - 2.9% | | | |
| Laurent-Perrier Group SA | | 35,632 | 4,448,862 |
| Lectra | | 426,210 | 10,778,250 |
| LISI | | 155,310 | 3,590,687 |
| Vetoquinol SA | | 112,417 | 9,480,190 |
TOTAL FRANCE | | | 28,297,989 |
| Germany - 6.7% | | | |
| CTS Eventim AG | | 481,054 | 29,038,635 |
| Nexus AG | | 291,358 | 14,196,566 |
| Rheinmetall AG | | 35,000 | 10,013,858 |
| Scout24 AG (b) | | 117,200 | 7,195,021 |
| Stabilus Se | | 78,636 | 4,983,965 |
TOTAL GERMANY | | | 65,428,045 |
| India - 0.3% | | | |
| Embassy Office Parks (REIT) | | 661,870 | 2,476,036 |
| Ireland - 1.9% | | | |
| AerCap Holdings NV (a)(c) | | 155,000 | 9,628,600 |
| Cairn Homes PLC | | 4,286,800 | 5,028,027 |
| Irish Residential Properties REIT PLC | | 3,923,200 | 3,777,535 |
TOTAL IRELAND | | | 18,434,162 |
| Israel - 1.6% | | | |
| Ituran Location & Control Ltd. | | 355,577 | 8,793,419 |
| NICE Ltd. sponsored ADR (a) | | 26,500 | 4,090,275 |
| Tel Aviv Stock Exchange Ltd. (a) | | 674,096 | 3,001,912 |
TOTAL ISRAEL | | | 15,885,606 |
| Italy - 2.8% | | | |
| Interpump Group SpA | | 646,943 | 26,970,497 |
| Japan - 32.1% | | | |
| Ai Holdings Corp. | | 157,100 | 2,431,967 |
| Aoki Super Co. Ltd. | | 175,000 | 2,982,302 |
| Artnature, Inc. | | 483,700 | 2,583,452 |
| Aucnet, Inc. (c) | | 306,977 | 3,574,100 |
| Azbil Corp. | | 1,215,592 | 35,919,125 |
| Broadleaf Co. Ltd. | | 2,509,998 | 8,870,809 |
| Central Automotive Products Ltd. | | 151,500 | 3,393,092 |
| Curves Holdings Co. Ltd. | | 2,240,026 | 9,771,360 |
| Daiichikosho Co. Ltd. | | 672,600 | 9,942,010 |
| Daikokutenbussan Co. Ltd. | | 67,500 | 2,860,580 |
| Digital Hearts Holdings Co. Ltd. | | 529,314 | 3,221,952 |
| Fujitec Co. Ltd. | | 203,000 | 4,407,154 |
| Funai Soken Holdings, Inc. | | 290,650 | 4,777,097 |
| Goldcrest Co. Ltd. | | 595,530 | 8,492,452 |
| Iwatsuka Confectionary Co. Ltd. | | 18,900 | 636,607 |
| Kobayashi Pharmaceutical Co. Ltd. | | 160,550 | 6,628,030 |
| Koshidaka Holdings Co. Ltd. | | 1,472,400 | 10,475,586 |
| Kusuri No Aoki Holdings Co. Ltd. | | 78,500 | 5,143,136 |
| Lasertec Corp. | | 80,144 | 13,238,204 |
| Medikit Co. Ltd. | | 294,400 | 5,200,893 |
| Miroku Jyoho Service Co., Ltd. (c) | | 238,400 | 2,441,590 |
| Misumi Group, Inc. | | 660,268 | 9,995,575 |
| Mitsuboshi Belting Ltd. | | 89,780 | 2,591,852 |
| Nagaileben Co. Ltd. | | 671,327 | 9,264,213 |
| Nihon Parkerizing Co. Ltd. | | 1,657,100 | 12,026,537 |
| NS Tool Co. Ltd. | | 554,700 | 3,978,095 |
| NSD Co. Ltd. | | 476,349 | 8,287,944 |
| OBIC Co. Ltd. | | 130,600 | 19,304,816 |
| OSG Corp. | | 809,800 | 9,240,298 |
| Paramount Bed Holdings Co. Ltd. | | 217,220 | 3,700,920 |
| ProNexus, Inc. | | 497,100 | 3,871,503 |
| San-Ai Obbli Co. Ltd. | | 574,300 | 6,201,003 |
| SHO-BOND Holdings Co. Ltd. | | 502,100 | 19,774,236 |
| Shoei Co. Ltd. | | 517,604 | 6,896,436 |
| SK Kaken Co. Ltd. | | 200,400 | 9,366,659 |
| Software Service, Inc. | | 67,600 | 3,851,747 |
| Techno Medica Co. Ltd. | | 80,791 | 1,220,988 |
| The Monogatari Corp. | | 282,600 | 7,652,965 |
| TIS, Inc. | | 211,800 | 4,535,666 |
| Tocalo Co. Ltd. | | 540,636 | 4,886,682 |
| USS Co. Ltd. | | 632,100 | 11,048,411 |
| YAKUODO Holdings Co. Ltd. | | 251,900 | 4,639,857 |
| YONEX Co. Ltd. | | 370,400 | 4,012,857 |
TOTAL JAPAN | | | 313,340,758 |
| Kenya - 0.0% | | | |
| Safaricom Ltd. | | 751,217 | 62,123 |
| Korea (South) - 0.5% | | | |
| BGF Retail Co. Ltd. | | 44,596 | 4,553,700 |
| Netherlands - 5.0% | | | |
| Aalberts Industries NV | | 762,980 | 23,751,035 |
| BE Semiconductor Industries NV | | 110,000 | 11,324,844 |
| IMCD NV | | 114,517 | 13,752,845 |
TOTAL NETHERLANDS | | | 48,828,724 |
| Norway - 2.3% | | | |
| Kongsberg Gruppen ASA | | 427,281 | 17,441,680 |
| Medistim ASA | | 175,242 | 3,035,492 |
| Volue A/S (a) | | 963,944 | 1,617,079 |
TOTAL NORWAY | | | 22,094,251 |
| Spain - 0.3% | | | |
| Fluidra SA | | 145,001 | 2,549,933 |
| Sweden - 11.3% | | | |
| Addlife AB | | 604,344 | 3,936,036 |
| AddTech AB (B Shares) | | 2,354,665 | 34,468,442 |
| Autoliv, Inc. | | 154,800 | 14,187,420 |
| Bergman & Beving AB (B Shares) | | 417,154 | 5,590,729 |
| Hemnet Group AB | | 570,600 | 9,901,520 |
| INVISIO AB | | 374,778 | 5,627,151 |
| John Mattson Fastighetsforetag (a)(c) | | 471,026 | 2,253,339 |
| Lagercrantz Group AB (B Shares) | | 3,556,312 | 32,401,214 |
| Teqnion AB (a)(c) | | 72,885 | 1,341,808 |
TOTAL SWEDEN | | | 109,707,659 |
| Switzerland - 1.0% | | | |
| Tecan Group AG | | 34,821 | 9,967,997 |
| Taiwan - 0.6% | | | |
| Addcn Technology Co. Ltd. | | 940,535 | 5,748,366 |
| United Kingdom - 11.2% | | | |
| Bodycote PLC | | 2,056,267 | 14,345,923 |
| Clarkson PLC | | 184,953 | 5,945,990 |
| Dechra Pharmaceuticals PLC | | 106,495 | 4,929,050 |
| DP Poland PLC (a) | | 15,541,591 | 1,511,202 |
| Howden Joinery Group PLC | | 1,461,900 | 11,329,300 |
| InterContinental Hotel Group PLC ADR | | 172,000 | 12,406,360 |
| Rightmove PLC | | 1,386,393 | 7,970,482 |
| Sage Group PLC | | 345,000 | 4,070,019 |
| Spectris PLC | | 963,878 | 36,317,913 |
| Spirax-Sarco Engineering PLC | | 67,991 | 6,769,841 |
| Unite Group PLC | | 364,800 | 3,850,896 |
TOTAL UNITED KINGDOM | | | 109,446,976 |
| United States of America - 4.3% | | | |
| Morningstar, Inc. | | 87,400 | 22,133,176 |
| NOV, Inc. | | 405,000 | 8,083,800 |
| PriceSmart, Inc. | | 87,960 | 5,496,620 |
| ResMed, Inc. | | 41,495 | 5,859,924 |
TOTAL UNITED STATES OF AMERICA | | | 41,573,520 |
| TOTAL COMMON STOCKS (Cost $764,462,153) | | | 908,238,670 |
| | | | |
| Investment Companies - 1.5% |
| | | Shares | Value ($) |
| United States of America - 1.5% | | | |
iShares MSCI EAFE Small-Cap ETF (Cost $15,847,316) | | 280,000 | 15,066,800 |
| | | | |
| Money Market Funds - 5.4% |
| | | Shares | Value ($) |
| Fidelity Cash Central Fund 5.40% (d) | | 47,744,983 | 47,754,532 |
| Fidelity Securities Lending Cash Central Fund 5.40% (d)(e) | | 4,475,067 | 4,475,514 |
| TOTAL MONEY MARKET FUNDS (Cost $52,230,046) | | | 52,230,046 |
| | | | |
| TOTAL INVESTMENT IN SECURITIES - 100.1% (Cost $832,539,515) | 975,535,516 |
NET OTHER ASSETS (LIABILITIES) - (0.1)% | (655,794) |
| NET ASSETS - 100.0% | 974,879,722 |
| | |
Security Type Abbreviations
Legend
| (b) | Security exempt from registration under Rule 144A of the Securities Act of 1933. These securities may be resold in transactions exempt from registration, normally to qualified institutional buyers. At the end of the period, the value of these securities amounted to $9,479,770 or 1.0% of net assets. |
| (c) | Security or a portion of the security is on loan at period end. |
| (d) | Affiliated fund that is generally available only to investment companies and other accounts managed by Fidelity Investments. The rate quoted is the annualized seven-day yield of the fund at period end. A complete unaudited listing of the fund's holdings as of its most recent quarter end is available upon request. In addition, each Fidelity Central Fund's financial statements, which are not covered by the Fund's Report of Independent Registered Public Accounting Firm, are available on the SEC's website or upon request. |
| (e) | Investment made with cash collateral received from securities on loan. |
Affiliated Central Funds
Fiscal year to date information regarding the Fund's investments in Fidelity Central Funds, including the ownership percentage, is presented below.
| Affiliate | Value, beginning of period ($) | Purchases ($) | Sales Proceeds ($) | Dividend Income ($) | Realized Gain (loss) ($) | Change in Unrealized appreciation (depreciation) ($) | Value, end of period ($) | % ownership, end of period |
| Fidelity Cash Central Fund 5.40% | 26,881,448 | 176,323,111 | 155,450,026 | 1,790,529 | - | (1) | 47,754,532 | 0.1% |
| Fidelity Securities Lending Cash Central Fund 5.40% | 13,986,458 | 255,492,566 | 265,003,510 | 108,177 | - | - | 4,475,514 | 0.0% |
| Total | 40,867,906 | 431,815,677 | 420,453,536 | 1,898,706 | - | (1) | 52,230,046 | |
| | | | | | | | | |
Amounts in the dividend income column in the above table include any capital gain distributions from underlying funds, which are presented in the corresponding line item in the Statement of Operations, if applicable.
Amounts in the dividend income column for Fidelity Securities Lending Cash Central Fund represents the income earned on investing cash collateral, less rebates paid to borrowers and any lending agent fees associated with the loan, plus any premium payments received for lending certain types of securities.
Amounts included in the purchases and sales proceeds columns may include in-kind transactions, if applicable.
Investment Valuation
The following is a summary of the inputs used, as of October 31, 2023, involving the Fund's assets and liabilities carried at fair value. The inputs or methodology used for valuing securities may not be an indication of the risk associated with investing in those securities. For more information on valuation inputs, and their aggregation into the levels used below, please refer to the Investment Valuation section in the accompanying Notes to Financial Statements.
| Valuation Inputs at Reporting Date: |
| Description | Total ($) | Level 1 ($) | Level 2 ($) | Level 3 ($) |
Investments in Securities: | | | | |
|
| Equities: | | | | |
Communication Services | 69,858,157 | 54,167,781 | 15,690,376 | - |
Consumer Discretionary | 96,682,296 | 39,857,489 | 56,824,807 | - |
Consumer Staples | 44,964,726 | 9,945,482 | 35,019,244 | - |
Energy | 19,689,016 | 13,488,013 | 6,201,003 | - |
Financials | 46,630,586 | 40,733,140 | 5,897,446 | - |
Health Care | 76,928,765 | 53,690,004 | 23,238,761 | - |
Industrials | 294,723,524 | 231,201,032 | 63,522,492 | - |
Information Technology | 207,645,086 | 109,393,013 | 98,252,073 | - |
Materials | 30,266,256 | 4,522,445 | 25,743,811 | - |
Real Estate | 20,850,258 | 9,881,770 | 10,968,488 | - |
|
| Investment Companies | 15,066,800 | 15,066,800 | - | - |
|
| Money Market Funds | 52,230,046 | 52,230,046 | - | - |
| Total Investments in Securities: | 975,535,516 | 634,177,015 | 341,358,501 | - |
| Statement of Assets and Liabilities |
| | | | October 31, 2023 |
| | | | | |
| Assets | | | | |
| Investment in securities, at value (including securities loaned of $4,323,729) - See accompanying schedule: | | | | |
Unaffiliated issuers (cost $780,309,469) | $ | 923,305,470 | | |
Fidelity Central Funds (cost $52,230,046) | | 52,230,046 | | |
| | | | | |
| | | | | |
| Total Investment in Securities (cost $832,539,515) | | | $ | 975,535,516 |
| Cash | | | | 74,459 |
| Foreign currency held at value (cost $100,160) | | | | 100,085 |
| Receivable for investments sold | | | | 35,453 |
| Receivable for fund shares sold | | | | 491,624 |
| Dividends receivable | | | | 2,966,316 |
| Reclaims receivable | | | | 1,623,697 |
| Distributions receivable from Fidelity Central Funds | | | | 233,589 |
| Prepaid expenses | | | | 1,511 |
| Other receivables | | | | 2,926 |
Total assets | | | | 981,065,176 |
| Liabilities | | | | |
| Payable for investments purchased | $ | 336,038 | | |
| Payable for fund shares redeemed | | 638,589 | | |
| Accrued management fee | | 515,471 | | |
| Distribution and service plan fees payable | | 11,445 | | |
| Other affiliated payables | | 156,736 | | |
| Other payables and accrued expenses | | 48,051 | | |
| Collateral on securities loaned | | 4,479,124 | | |
| Total Liabilities | | | | 6,185,454 |
| Net Assets | | | $ | 974,879,722 |
| Net Assets consist of: | | | | |
| Paid in capital | | | $ | 794,709,014 |
| Total accumulated earnings (loss) | | | | 180,170,708 |
| Net Assets | | | $ | 974,879,722 |
| | | | | |
| Net Asset Value and Maximum Offering Price | | | | |
| Class A : | | | | |
Net Asset Value and redemption price per share ($26,559,237 ÷ 1,585,764 shares)(a) | | | $ | 16.75 |
| Maximum offering price per share (100/94.25 of $16.75) | | | $ | 17.77 |
| Class M : | | | | |
Net Asset Value and redemption price per share ($9,588,774 ÷ 583,453 shares)(a) | | | $ | 16.43 |
| Maximum offering price per share (100/96.50 of $16.43) | | | $ | 17.03 |
| Class C : | | | | |
Net Asset Value and offering price per share ($2,035,719 ÷ 130,180 shares)(a) | | | $ | 15.64 |
| International Small Cap Opportunities : | | | | |
Net Asset Value, offering price and redemption price per share ($632,320,222 ÷ 36,941,373 shares) | | | $ | 17.12 |
| Class I : | | | | |
Net Asset Value, offering price and redemption price per share ($81,122,052 ÷ 4,747,579 shares) | | | $ | 17.09 |
| Class Z : | | | | |
Net Asset Value, offering price and redemption price per share ($223,253,718 ÷ 13,076,229 shares) | | | $ | 17.07 |
(a)Redemption price per share is equal to net asset value less any applicable contingent deferred sales charge. |
| Statement of Operations |
| | | | Year ended October 31, 2023 |
| Investment Income | | | | |
| Dividends | | | $ | 20,159,488 |
| Income from Fidelity Central Funds (including $108,177 from security lending) | | | | 1,898,706 |
| Income before foreign taxes withheld | | | $ | 22,058,194 |
| Less foreign taxes withheld | | | | (1,917,777) |
| Total Income | | | | 20,140,417 |
| Expenses | | | | |
| Management fee | | | | |
| Basic fee | $ | 8,908,675 | | |
| Performance adjustment | | (533,939) | | |
| Transfer agent fees | | 1,481,005 | | |
| Distribution and service plan fees | | 158,794 | | |
| Accounting fees | | 478,109 | | |
| Custodian fees and expenses | | 89,031 | | |
| Independent trustees' fees and expenses | | 6,359 | | |
| Registration fees | | 94,504 | | |
| Audit | | 89,814 | | |
| Legal | | 1,327 | | |
| Interest | | 4,911 | | |
| Miscellaneous | | 5,294 | | |
| Total expenses before reductions | | 10,783,884 | | |
| Expense reductions | | (65,390) | | |
| Total expenses after reductions | | | | 10,718,494 |
| Net Investment income (loss) | | | | 9,421,923 |
| Realized and Unrealized Gain (Loss) | | | | |
| Net realized gain (loss) on: | | | | |
| Investment Securities: | | | | |
| Unaffiliated issuers (net of foreign taxes of $391,791) | | 34,721,508 | | |
| Foreign currency transactions | | (120,059) | | |
| Total net realized gain (loss) | | | | 34,601,449 |
| Change in net unrealized appreciation (depreciation) on: | | | | |
| Investment Securities: | | | | |
| Unaffiliated issuers(net of decrease in deferred foreign taxes of $650,013) | | 5,986,825 | | |
| Fidelity Central Funds | | (1) | | |
| Assets and liabilities in foreign currencies | | 145,561 | | |
| Total change in net unrealized appreciation (depreciation) | | | | 6,132,385 |
| Net gain (loss) | | | | 40,733,834 |
| Net increase (decrease) in net assets resulting from operations | | | $ | 50,155,757 |
| Statement of Changes in Net Assets |
| |
| | Year ended October 31, 2023 | | Year ended October 31, 2022 |
| Increase (Decrease) in Net Assets | | | | |
| Operations | | | | |
| Net investment income (loss) | $ | 9,421,923 | $ | 8,172,300 |
| Net realized gain (loss) | | 34,601,449 | | 72,325,342 |
| Change in net unrealized appreciation (depreciation) | | 6,132,385 | | (657,801,200) �� |
| Net increase (decrease) in net assets resulting from operations | | 50,155,757 | | (577,303,558) |
| Distributions to shareholders | | (64,708,392) | | (145,923,001) |
| | | | | |
| Share transactions - net increase (decrease) | | (52,713,432) | | (23,291,061) |
| Total increase (decrease) in net assets | | (67,266,067) | | (746,517,620) |
| | | | | |
| Net Assets | | | | |
| Beginning of period | | 1,042,145,789 | | 1,788,663,409 |
| End of period | $ | 974,879,722 | $ | 1,042,145,789 |
| | | | | |
| | | | | |
Financial Highlights
| Fidelity Advisor® International Small Cap Opportunities Fund Class A |
| |
| Years ended October 31, | | 2023 | | 2022 | | 2021 | | 2020 | | 2019 |
Selected Per-Share Data | | | | | | | | | | |
| Net asset value, beginning of period | $ | 17.17 | $ | 28.35 | $ | 20.86 | $ | 19.02 | $ | 17.33 |
| Income from Investment Operations | | | | | | | | | | |
Net investment income (loss) A,B | | .10 | | .06 | | (.06) | | (.04) | | .11 |
| Net realized and unrealized gain (loss) | | .61 | | (8.93) | | 7.55 | | 2.05 | | 2.01 |
| Total from investment operations | | .71 | | (8.87) | | 7.49 | | 2.01 | | 2.12 |
| Distributions from net investment income | | - | | - | | - | | (.11) | | (.11) |
| Distributions from net realized gain | | (1.13) | | (2.31) | | - | | (.05) | | (.31) |
| Total distributions | | (1.13) | | (2.31) | | - | | (.17) C | | (.43) C |
| Net asset value, end of period | $ | 16.75 | $ | 17.17 | $ | 28.35 | $ | 20.86 | $ | 19.02 |
Total Return D,E | | 3.74% | | (33.79)% | | 35.91% | | 10.58% | | 12.61% |
Ratios to Average Net Assets B,F,G | | | | | | | | | | |
| Expenses before reductions | | 1.31% | | 1.49% | | 1.50% | | 1.57% | | 1.49% |
| Expenses net of fee waivers, if any | | 1.31% | | 1.48% | | 1.50% | | 1.57% | | 1.49% |
| Expenses net of all reductions | | 1.31% | | 1.48% | | 1.50% | | 1.56% | | 1.48% |
| Net investment income (loss) | | .56% | | .30% | | (.25)% | | (.20)% | | .64% |
| Supplemental Data | | | | | | | | | | |
| Net assets, end of period (000 omitted) | $ | 26,559 | $ | 26,380 | $ | 45,981 | $ | 37,771 | $ | 41,679 |
Portfolio turnover rate H | | 10% | | 13% | | 21% | | 20% | | 17% |
ACalculated based on average shares outstanding during the period.
BNet investment income (loss) is affected by the timing of the declaration of dividends by any underlying mutual funds or exchange-traded funds (ETFs). Net investment income (loss) of any mutual funds or ETFs is not included in the Fund's net investment income (loss) ratio.
CTotal distributions per share do not sum due to rounding.
DTotal returns would have been lower if certain expenses had not been reduced during the applicable periods shown.
ETotal returns do not include the effect of the sales charges.
FFees and expenses of any underlying mutual funds or exchange-traded funds (ETFs) are not included in the Fund's expense ratio. The Fund indirectly bears its proportionate share of these expenses. For additional expense information related to investments in Fidelity Central Funds, please refer to the "Investments in Fidelity Central Funds" note found in the Notes to Financial Statements section of the most recent Annual or Semi-Annual report.
GExpense ratios reflect operating expenses of the class. Expenses before reductions do not reflect amounts reimbursed, waived, or reduced through arrangements with the investment adviser, brokerage services, or other offset arrangements, if applicable, and do not represent the amount paid by the class during periods when reimbursements, waivers or reductions occur.
HAmount does not include the portfolio activity of any underlying mutual funds or exchange-traded funds (ETFs).
| Fidelity Advisor® International Small Cap Opportunities Fund Class M |
| |
| Years ended October 31, | | 2023 | | 2022 | | 2021 | | 2020 | | 2019 |
Selected Per-Share Data | | | | | | | | | | |
| Net asset value, beginning of period | $ | 16.91 | $ | 28.02 | $ | 20.67 | $ | 18.85 | $ | 17.17 |
| Income from Investment Operations | | | | | | | | | | |
Net investment income (loss) A,B | | .06 | | .01 | | (.13) | | (.09) | | .06 |
| Net realized and unrealized gain (loss) | | .59 | | (8.81) | | 7.48 | | 2.03 | | 1.99 |
| Total from investment operations | | .65 | | (8.80) | | 7.35 | | 1.94 | | 2.05 |
| Distributions from net investment income | | - | | - | | - | | (.06) | | (.06) |
| Distributions from net realized gain | | (1.13) | | (2.31) | | - | | (.05) | | (.31) |
| Total distributions | | (1.13) | | (2.31) | | - | | (.12) C | | (.37) |
| Net asset value, end of period | $ | 16.43 | $ | 16.91 | $ | 28.02 | $ | 20.67 | $ | 18.85 |
Total Return D,E | | 3.43% | | (33.95)% | | 35.56% | | 10.29% | | 12.29% |
Ratios to Average Net Assets B,F,G | | | | | | | | | | |
| Expenses before reductions | | 1.57% | | 1.74% | | 1.75% | | 1.84% | | 1.77% |
| Expenses net of fee waivers, if any | | 1.56% | | 1.74% | | 1.75% | | 1.84% | | 1.77% |
| Expenses net of all reductions | | 1.56% | | 1.74% | | 1.75% | | 1.83% | | 1.77% |
| Net investment income (loss) | | .31% | | .05% | | (.50)% | | (.47)% | | .36% |
| Supplemental Data | | | | | | | | | | |
| Net assets, end of period (000 omitted) | $ | 9,589 | $ | 10,115 | $ | 16,378 | $ | 13,141 | $ | 13,875 |
Portfolio turnover rate H | | 10% | | 13% | | 21% | | 20% | | 17% |
ACalculated based on average shares outstanding during the period.
BNet investment income (loss) is affected by the timing of the declaration of dividends by any underlying mutual funds or exchange-traded funds (ETFs). Net investment income (loss) of any mutual funds or ETFs is not included in the Fund's net investment income (loss) ratio.
CTotal distributions per share do not sum due to rounding.
DTotal returns would have been lower if certain expenses had not been reduced during the applicable periods shown.
ETotal returns do not include the effect of the sales charges.
FFees and expenses of any underlying mutual funds or exchange-traded funds (ETFs) are not included in the Fund's expense ratio. The Fund indirectly bears its proportionate share of these expenses. For additional expense information related to investments in Fidelity Central Funds, please refer to the "Investments in Fidelity Central Funds" note found in the Notes to Financial Statements section of the most recent Annual or Semi-Annual report.
GExpense ratios reflect operating expenses of the class. Expenses before reductions do not reflect amounts reimbursed, waived, or reduced through arrangements with the investment adviser, brokerage services, or other offset arrangements, if applicable, and do not represent the amount paid by the class during periods when reimbursements, waivers or reductions occur.
HAmount does not include the portfolio activity of any underlying mutual funds or exchange-traded funds (ETFs).
| Fidelity Advisor® International Small Cap Opportunities Fund Class C |
| |
| Years ended October 31, | | 2023 | | 2022 | | 2021 | | 2020 | | 2019 |
Selected Per-Share Data | | | | | | | | | | |
| Net asset value, beginning of period | $ | 16.22 | $ | 27.10 | $ | 20.09 | $ | 18.31 | $ | 16.69 |
| Income from Investment Operations | | | | | | | | | | |
Net investment income (loss) A,B | | (.04) | | (.09) | | (.25) | | (.18) | | (.02) |
| Net realized and unrealized gain (loss) | | .59 | | (8.48) | | 7.26 | | 1.96 | | 1.93 |
| Total from investment operations | | .55 | | (8.57) | | 7.01 | | 1.78 | | 1.91 |
| Distributions from net realized gain | | (1.13) | | (2.31) | | - | | - | | (.29) |
| Total distributions | | (1.13) | | (2.31) | | - | | - | | (.29) |
| Net asset value, end of period | $ | 15.64 | $ | 16.22 | $ | 27.10 | $ | 20.09 | $ | 18.31 |
Total Return C,D | | 2.93% | | (34.28)% | | 34.89% | | 9.72% | | 11.74% |
Ratios to Average Net Assets B,E,F | | | | | | | | | | |
| Expenses before reductions | | 2.10% | | 2.26% | | 2.26% | | 2.33% | | 2.27% |
| Expenses net of fee waivers, if any | | 2.10% | | 2.25% | | 2.26% | | 2.33% | | 2.26% |
| Expenses net of all reductions | | 2.10% | | 2.25% | | 2.26% | | 2.33% | | 2.26% |
| Net investment income (loss) | | (.23)% | | (.47)% | | (1.01)% | | (.96)% | | (.13)% |
| Supplemental Data | | | | | | | | | | |
| Net assets, end of period (000 omitted) | $ | 2,036 | $ | 3,314 | $ | 6,770 | $ | 7,253 | $ | 9,424 |
Portfolio turnover rate G | | 10% | | 13% | | 21% | | 20% | | 17% |
ACalculated based on average shares outstanding during the period.
BNet investment income (loss) is affected by the timing of the declaration of dividends by any underlying mutual funds or exchange-traded funds (ETFs). Net investment income (loss) of any mutual funds or ETFs is not included in the Fund's net investment income (loss) ratio.
CTotal returns would have been lower if certain expenses had not been reduced during the applicable periods shown.
DTotal returns do not include the effect of the contingent deferred sales charge.
EFees and expenses of any underlying mutual funds or exchange-traded funds (ETFs) are not included in the Fund's expense ratio. The Fund indirectly bears its proportionate share of these expenses. For additional expense information related to investments in Fidelity Central Funds, please refer to the "Investments in Fidelity Central Funds" note found in the Notes to Financial Statements section of the most recent Annual or Semi-Annual report.
FExpense ratios reflect operating expenses of the class. Expenses before reductions do not reflect amounts reimbursed, waived, or reduced through arrangements with the investment adviser, brokerage services, or other offset arrangements, if applicable, and do not represent the amount paid by the class during periods when reimbursements, waivers or reductions occur.
GAmount does not include the portfolio activity of any underlying mutual funds or exchange-traded funds (ETFs).
| Fidelity® International Small Cap Opportunities Fund |
| |
| Years ended October 31, | | 2023 | | 2022 | | 2021 | | 2020 | | 2019 |
Selected Per-Share Data | | | | | | | | | | |
| Net asset value, beginning of period | $ | 17.47 | $ | 28.77 | $ | 21.10 | $ | 19.24 | $ | 17.53 |
| Income from Investment Operations | | | | | | | | | | |
Net investment income (loss) A,B | | .16 | | .13 | | .01 | | .02 | | .17 |
| Net realized and unrealized gain (loss) | | .63 | | (9.09) | | 7.66 | | 2.07 | | 2.02 |
| Total from investment operations | | .79 | | (8.96) | | 7.67 | | 2.09 | | 2.19 |
| Distributions from net investment income | | - C | | (.04) | | - | | (.17) | | (.17) |
| Distributions from net realized gain | | (1.13) | | (2.31) | | - | | (.05) | | (.31) |
| Total distributions | | (1.14) D | | (2.34) D | | - | | (.23) D | | (.48) |
| Net asset value, end of period | $ | 17.12 | $ | 17.47 | $ | 28.77 | $ | 21.10 | $ | 19.24 |
Total Return E | | 4.11% | | (33.62)% | | 36.35% | | 10.90% | | 12.97% |
Ratios to Average Net Assets B,F,G | | | | | | | | | | |
| Expenses before reductions | | 1.01% | | 1.19% | | 1.21% | | 1.26% | | 1.19% |
| Expenses net of fee waivers, if any | | 1.00% | | 1.19% | | 1.20% | | 1.26% | | 1.19% |
| Expenses net of all reductions | | 1.00% | | 1.19% | | 1.20% | | 1.25% | | 1.19% |
| Net investment income (loss) | | .87% | | .60% | | .05% | | .11% | | .94% |
| Supplemental Data | | | | | | | | | | |
| Net assets, end of period (000 omitted) | $ | 632,320 | $ | 700,271 | $ | 1,268,421 | $ | 1,152,472 | $ | 1,040,989 |
Portfolio turnover rate H | | 10% | | 13% | | 21% | | 20% | | 17% |
ACalculated based on average shares outstanding during the period.
BNet investment income (loss) is affected by the timing of the declaration of dividends by any underlying mutual funds or exchange-traded funds (ETFs). Net investment income (loss) of any mutual funds or ETFs is not included in the Fund's net investment income (loss) ratio.
CAmount represents less than $.005 per share.
DTotal distributions per share do not sum due to rounding.
ETotal returns would have been lower if certain expenses had not been reduced during the applicable periods shown.
FFees and expenses of any underlying mutual funds or exchange-traded funds (ETFs) are not included in the Fund's expense ratio. The Fund indirectly bears its proportionate share of these expenses. For additional expense information related to investments in Fidelity Central Funds, please refer to the "Investments in Fidelity Central Funds" note found in the Notes to Financial Statements section of the most recent Annual or Semi-Annual report.
GExpense ratios reflect operating expenses of the class. Expenses before reductions do not reflect amounts reimbursed, waived, or reduced through arrangements with the investment adviser, brokerage services, or other offset arrangements, if applicable, and do not represent the amount paid by the class during periods when reimbursements, waivers or reductions occur.
HAmount does not include the portfolio activity of any underlying mutual funds or exchange-traded funds (ETFs).
| Fidelity Advisor® International Small Cap Opportunities Fund Class I |
| |
| Years ended October 31, | | 2023 | | 2022 | | 2021 | | 2020 | | 2019 |
Selected Per-Share Data | | | | | | | | | | |
| Net asset value, beginning of period | $ | 17.46 | $ | 28.75 | $ | 21.09 | $ | 19.22 | $ | 17.51 |
| Income from Investment Operations | | | | | | | | | | |
Net investment income (loss) A,B | | .15 | | .13 | | .01 | | .02 | | .17 |
| Net realized and unrealized gain (loss) | | .62 | | (9.07) | | 7.65 | | 2.07 | | 2.02 |
| Total from investment operations | | .77 | | (8.94) | | 7.66 | | 2.09 | | 2.19 |
| Distributions from net investment income | | (.01) | | (.04) | | - | | (.16) | | (.16) |
| Distributions from net realized gain | | (1.13) | | (2.31) | | - | | (.05) | | (.31) |
| Total distributions | | (1.14) | | (2.35) | | - | | (.22) C | | (.48) C |
| Net asset value, end of period | $ | 17.09 | $ | 17.46 | $ | 28.75 | $ | 21.09 | $ | 19.22 |
Total Return D | | 4.02% | | (33.60)% | | 36.32% | | 10.90% | | 12.93% |
Ratios to Average Net Assets B,E,F | | | | | | | | | | |
| Expenses before reductions | | 1.05% | | 1.20% | | 1.22% | | 1.28% | | 1.20% |
| Expenses net of fee waivers, if any | | 1.04% | | 1.19% | | 1.22% | | 1.27% | | 1.19% |
| Expenses net of all reductions | | 1.04% | | 1.19% | | 1.22% | | 1.27% | | 1.19% |
| Net investment income (loss) | | .83% | | .59% | | .04% | | .09% | | .93% |
| Supplemental Data | | | | | | | | | | |
| Net assets, end of period (000 omitted) | $ | 81,122 | $ | 82,705 | $ | 141,310 | $ | 113,041 | $ | 142,854 |
Portfolio turnover rate G | | 10% | | 13% | | 21% | | 20% | | 17% |
ACalculated based on average shares outstanding during the period.
BNet investment income (loss) is affected by the timing of the declaration of dividends by any underlying mutual funds or exchange-traded funds (ETFs). Net investment income (loss) of any mutual funds or ETFs is not included in the Fund's net investment income (loss) ratio.
CTotal distributions per share do not sum due to rounding.
DTotal returns would have been lower if certain expenses had not been reduced during the applicable periods shown.
EFees and expenses of any underlying mutual funds or exchange-traded funds (ETFs) are not included in the Fund's expense ratio. The Fund indirectly bears its proportionate share of these expenses. For additional expense information related to investments in Fidelity Central Funds, please refer to the "Investments in Fidelity Central Funds" note found in the Notes to Financial Statements section of the most recent Annual or Semi-Annual report.
FExpense ratios reflect operating expenses of the class. Expenses before reductions do not reflect amounts reimbursed, waived, or reduced through arrangements with the investment adviser, brokerage services, or other offset arrangements, if applicable, and do not represent the amount paid by the class during periods when reimbursements, waivers or reductions occur.
GAmount does not include the portfolio activity of any underlying mutual funds or exchange-traded funds (ETFs).
| Fidelity Advisor® International Small Cap Opportunities Fund Class Z |
| |
| Years ended October 31, | | 2023 | | 2022 | | 2021 | | 2020 | | 2019 |
Selected Per-Share Data | | | | | | | | | | |
| Net asset value, beginning of period | $ | 17.44 | $ | 28.73 | $ | 21.05 | $ | 19.20 | $ | 17.51 |
| Income from Investment Operations | | | | | | | | | | |
Net investment income (loss) A,B | | .18 | | .15 | | .04 | | .05 | | .19 |
| Net realized and unrealized gain (loss) | | .62 | | (9.05) | | 7.64 | | 2.05 | | 2.02 |
| Total from investment operations | | .80 | | (8.90) | | 7.68 | | 2.10 | | 2.21 |
| Distributions from net investment income | | (.04) | | (.08) | | - | | (.20) | | (.20) |
| Distributions from net realized gain | | (1.13) | | (2.31) | | - | | (.05) | | (.31) |
| Total distributions | | (1.17) | | (2.39) | | - | | (.25) | | (.52) C |
| Net asset value, end of period | $ | 17.07 | $ | 17.44 | $ | 28.73 | $ | 21.05 | $ | 19.20 |
Total Return D | | 4.19% | | (33.52)% | | 36.48% | | 11.03% | | 13.10% |
Ratios to Average Net Assets B,E,F | | | | | | | | | | |
| Expenses before reductions | | .89% | | 1.07% | | 1.09% | | 1.14% | | 1.05% |
| Expenses net of fee waivers, if any | | .88% | | 1.07% | | 1.09% | | 1.13% | | 1.05% |
| Expenses net of all reductions | | .88% | | 1.07% | | 1.09% | | 1.13% | | 1.05% |
| Net investment income (loss) | | .98% | | .72% | | .16% | | .23% | | 1.08% |
| Supplemental Data | | | | | | | | | | |
| Net assets, end of period (000 omitted) | $ | 223,254 | $ | 219,360 | $ | 309,803 | $ | 82,476 | $ | 76,527 |
Portfolio turnover rate G | | 10% | | 13% | | 21% | | 20% | | 17% |
ACalculated based on average shares outstanding during the period.
BNet investment income (loss) is affected by the timing of the declaration of dividends by any underlying mutual funds or exchange-traded funds (ETFs). Net investment income (loss) of any mutual funds or ETFs is not included in the Fund's net investment income (loss) ratio.
CTotal distributions per share do not sum due to rounding.
DTotal returns would have been lower if certain expenses had not been reduced during the applicable periods shown.
EFees and expenses of any underlying mutual funds or exchange-traded funds (ETFs) are not included in the Fund's expense ratio. The Fund indirectly bears its proportionate share of these expenses. For additional expense information related to investments in Fidelity Central Funds, please refer to the "Investments in Fidelity Central Funds" note found in the Notes to Financial Statements section of the most recent Annual or Semi-Annual report.
FExpense ratios reflect operating expenses of the class. Expenses before reductions do not reflect amounts reimbursed, waived, or reduced through arrangements with the investment adviser, brokerage services, or other offset arrangements, if applicable, and do not represent the amount paid by the class during periods when reimbursements, waivers or reductions occur.
GAmount does not include the portfolio activity of any underlying mutual funds or exchange-traded funds (ETFs).
For the period ended October 31, 2023
1. Organization.
Fidelity International Small Cap Opportunities Fund (the Fund) is a fund of Fidelity Investment Trust (the Trust) and is authorized to issue an unlimited number of shares. The Trust is registered under the Investment Company Act of 1940, as amended (the 1940 Act), as an open-end management investment company organized as a Massachusetts business trust. The Fund offers Class A, Class M, Class C, International Small Cap Opportunities, Class I and Class Z shares, each of which has equal rights as to assets and voting privileges. Class A, Class M, Class C, Class I and Class Z are Fidelity Advisor classes. Each class has exclusive voting rights with respect to matters that affect that class. Class C shares will automatically convert to Class A shares after a holding period of eight years from the initial date of purchase, with certain exceptions.
2. Investments in Fidelity Central Funds.
Funds may invest in Fidelity Central Funds, which are open-end investment companies generally available only to other investment companies and accounts managed by the investment adviser and its affiliates. The Schedule of Investments lists any Fidelity Central Funds held as an investment as of period end, but does not include the underlying holdings of each Fidelity Central Fund. An investing fund indirectly bears its proportionate share of the expenses of the underlying Fidelity Central Funds.
Based on its investment objective, each Fidelity Central Fund may invest or participate in various investment vehicles or strategies that are similar to those of the investing fund. These strategies are consistent with the investment objectives of the investing fund and may involve certain economic risks which may cause a decline in value of each of the Fidelity Central Funds and thus a decline in the value of the investing fund.
| Fidelity Central Fund | Investment Manager | Investment Objective | Investment Practices | Expense RatioA |
| Fidelity Money Market Central Funds | Fidelity Management & Research Company LLC (FMR) | Each fund seeks to obtain a high level of current income consistent with the preservation of capital and liquidity. | Short-term Investments | Less than .005% |
A Expenses expressed as a percentage of average net assets and are as of each underlying Central Fund's most recent annual or semi-annual shareholder report.
A complete unaudited list of holdings for each Fidelity Central Fund is available upon request or at the Securities and Exchange Commission website at www.sec.gov. In addition, the financial statements of the Fidelity Central Funds which contain the significant accounting policies (including investment valuation policies) of those funds, and are not covered by the Report of Independent Registered Public Accounting Firm, are available on the Securities and Exchange Commission website or upon request.
3. Significant Accounting Policies.
The Fund is an investment company and applies the accounting and reporting guidance of the Financial Accounting Standards Board (FASB) Accounting Standards Codification Topic 946 Financial Services - Investment Companies. The financial statements have been prepared in conformity with accounting principles generally accepted in the United States of America (GAAP), which require management to make certain estimates and assumptions at the date of the financial statements. Actual results could differ from those estimates. Subsequent events, if any, through the date that the financial statements were issued have been evaluated in the preparation of the financial statements. The Fund's Schedule of Investments lists any underlying mutual funds or exchange-traded funds (ETFs) but does not include the underlying holdings of these funds. The following summarizes the significant accounting policies of the Fund:
Investment Valuation. Investments are valued as of 4:00 p.m. Eastern time on the last calendar day of the period. The Board of Trustees (the Board) has designated the Fund's investment adviser as the valuation designee responsible for the fair valuation function and performing fair value determinations as needed. The investment adviser has established a Fair Value Committee (the Committee) to carry out the day-to-day fair valuation responsibilities and has adopted policies and procedures to govern the fair valuation process and the activities of the Committee. In accordance with these fair valuation policies and procedures, which have been approved by the Board, the Fund attempts to obtain prices from one or more third party pricing services or brokers to value its investments. When current market prices, quotations or currency exchange rates are not readily available or reliable, investments will be fair valued in good faith by the Committee, in accordance with the policies and procedures. Factors used in determining fair value vary by investment type and may include market or investment specific events, transaction data, estimated cash flows, and market observations of comparable investments. The frequency that the fair valuation procedures are used cannot be predicted and they may be utilized to a significant extent. The Committee manages the Fund's fair valuation practices and maintains the fair valuation policies and procedures. The Fund's investment adviser reports to the Board information regarding the fair valuation process and related material matters.
The Fund categorizes the inputs to valuation techniques used to value its investments into a disclosure hierarchy consisting of three levels as shown below:
Level 1 - unadjusted quoted prices in active markets for identical investments
Level 2 - other significant observable inputs (including quoted prices for similar investments, interest rates, prepayment speeds, etc.)
Level 3 - unobservable inputs (including the Fund's own assumptions based on the best information available)
Valuation techniques used to value the Fund's investments by major category are as follows:
Equity securities, including restricted securities, for which market quotations are readily available, are valued at the last reported sale price or official closing price as reported by a third party pricing service on the primary market or exchange on which they are traded and are categorized as Level 1 in the hierarchy. In the event there were no sales during the day or closing prices are not available, securities are valued at the last quoted bid price or may be valued using the last available price and are generally categorized as Level 2 in the hierarchy. For foreign equity securities, when market or security specific events arise, comparisons to the valuation of American Depositary Receipts (ADRs), futures contracts, Exchange-Traded Funds (ETFs) and certain indexes as well as quoted prices for similar securities may be used and would be categorized as Level 2 in the hierarchy. For equity securities, including restricted securities, where observable inputs are limited, assumptions about market activity and risk are used and these securities may be categorized as Level 3 in the hierarchy. ETFs are valued at their last sale price or official closing price as reported by a third party pricing service on the primary market or exchange on which they are traded and are categorized as Level 1 in the hierarchy. In the event there were no sales during the day but the exchange reports a closing bid level, ETFs are valued at the closing bid and would be categorized as Level 1 in the hierarchy. In the event there was no closing bid, ETFs may be valued by another method that the Board believes reflects fair value in accordance with the Board's fair value pricing policies and may be categorized as Level 2 in the hierarchy.
Investments in open-end mutual funds, including the Fidelity Central Funds, are valued at their closing net asset value (NAV) each business day and are categorized as Level 1 in the hierarchy.
Changes in valuation techniques may result in transfers in or out of an assigned level within the disclosure hierarchy. The aggregate value of investments by input level as of October 31, 2023 is included at the end of the Fund's Schedule of Investments.
Foreign Currency. Certain Funds may use foreign currency contracts to facilitate transactions in foreign-denominated securities. Gains and losses from these transactions may arise from changes in the value of the foreign currency or if the counterparties do not perform under the contracts' terms.
Foreign-denominated assets, including investment securities, and liabilities are translated into U.S. dollars at the exchange rates at period end. Purchases and sales of investment securities, income and dividends received, and expenses denominated in foreign currencies are translated into U.S. dollars at the exchange rate in effect on the transaction date.
The effects of exchange rate fluctuations on investments are included with the net realized and unrealized gain (loss) on investment securities. Other foreign currency transactions resulting in realized and unrealized gain (loss) are disclosed separately.
Investment Transactions and Income. For financial reporting purposes, the Fund's investment holdings and NAV include trades executed through the end of the last business day of the period. The NAV per share for processing shareholder transactions is calculated as of the close of business of the New York Stock Exchange (NYSE), normally 4:00 p.m. Eastern time and includes trades executed through the end of the prior business day. Gains and losses on securities sold are determined on the basis of identified cost and include proceeds received from litigation. Commissions paid to certain brokers with whom the investment adviser, or its affiliates, places trades on behalf of a fund include an amount in addition to trade execution, which may be rebated back to a fund. Any such rebates are included in net realized gain (loss) on investments in the Statement of Operations. Dividend income is recorded on the ex-dividend date, except for certain dividends from foreign securities where the ex-dividend date may have passed, which are recorded as soon as the Fund is informed of the ex-dividend date. Non-cash dividends included in dividend income, if any, are recorded at the fair market value of the securities received. Income and capital gain distributions from Fidelity Central Funds, if any, are recorded on the ex-dividend date. Certain distributions received by the Fund represent a return of capital or capital gain. The Fund determines the components of these distributions subsequent to the ex-dividend date, based upon receipt of tax filings or other correspondence relating to the underlying investment. These distributions are recorded as a reduction of cost of investments and/or as a realized gain. Investment income is recorded net of foreign taxes withheld where recovery of such taxes is uncertain. Funds may file withholding tax reclaims in certain jurisdictions to recover a portion of amounts previously withheld. Any withholding tax reclaims income is included in the Statement of Operations in foreign taxes withheld. Any receivables for withholding tax reclaims are included in the Statement of Assets and Liabilities in reclaims receivable. The Fund has filed tax reclaims for previously withheld taxes on dividends earned in certain European Union (EU) countries. These additional filings are subject to various administrative proceedings by the local jurisdictions' tax authorities within the EU, as well as a number of related judicial proceedings. Income recognized for EU reclaims is included with other reclaims in the Statement of Operations in foreign taxes withheld. These reclaims are recorded when the amount is known and there are no significant uncertainties on collectability.
Class Allocations and Expenses. Investment income, realized and unrealized capital gains and losses, common expenses of a fund, and certain fund-level expense reductions, if any, are allocated daily on a pro-rata basis to each class based on the relative net assets of each class to the total net assets of a fund. Each class differs with respect to transfer agent and distribution and service plan fees incurred, as applicable. Certain expense reductions may also differ by class, if applicable. For the reporting period, the allocated portion of income and expenses to each class as a percent of its average net assets may vary due to the timing of recording these transactions in relation to fluctuating net assets of the classes. Expenses directly attributable to a fund are charged to that fund. Expenses attributable to more than one fund are allocated among the respective funds on the basis of relative net assets or other appropriate methods. Expenses included in the accompanying financial statements reflect the expenses of that fund and do not include any expenses associated with any underlying mutual funds or exchange-traded funds (ETFs). Although not included in a fund's expenses, a fund indirectly bears its proportionate share of these expenses through the net asset value of each underlying mutual fund or exchange-traded fund (ETF). Expense estimates are accrued in the period to which they relate and adjustments are made when actual amounts are known.
Income Tax Information and Distributions to Shareholders. Each year, the Fund intends to qualify as a regulated investment company under Subchapter M of the Internal Revenue Code, including distributing substantially all of its taxable income and realized gains. As a result, no provision for U.S. Federal income taxes is required. As of October 31, 2023, the Fund did not have any unrecognized tax benefits in the financial statements; nor is the Fund aware of any tax positions for which it is reasonably possible that the total amounts of unrecognized tax benefits will significantly change in the next twelve months. The Fund files a U.S. federal tax return, in addition to state and local tax returns as required. The Fund's federal income tax returns are subject to examination by the Internal Revenue Service (IRS) for a period of three fiscal years after they are filed. State and local tax returns may be subject to examination for an additional fiscal year depending on the jurisdiction. Foreign taxes are provided for based on the Fund's understanding of the tax rules and rates that exist in the foreign markets in which it invests. The Fund is subject to a tax imposed on capital gains by certain countries in which it invests. An estimated deferred tax liability for net unrealized appreciation on the applicable securities is included in Other payables and accrued expenses on the Statement of Assets & Liabilities.
Distributions are declared and recorded on the ex-dividend date. Income and capital gain distributions are declared separately for each class. Income and capital gain distributions are determined in accordance with income tax regulations, which may differ from GAAP. In addition, the Fund claimed a portion of the payment made to redeeming shareholders as a distribution for income tax purposes.
Capital accounts within the financial statements are adjusted for permanent book-tax differences. These adjustments have no impact on net assets or the results of operations. Capital accounts are not adjusted for temporary book-tax differences which will reverse in a subsequent period.
Book-tax differences are primarily due to foreign currency transactions, certain foreign taxes, passive foreign investment companies (PFIC) and losses deferred due to wash sales.
As of period end, the cost and unrealized appreciation (depreciation) in securities, and derivatives if applicable, for federal income tax purposes were as follows:
| Gross unrealized appreciation | $258,881,050 |
| Gross unrealized depreciation | (120,694,150) |
| Net unrealized appreciation (depreciation) | $138,186,900 |
| Tax Cost | $837,348,616 |
The tax-based components of distributable earnings as of period end were as follows:
| Undistributed ordinary income | $10,239,162 |
| Undistributed long-term capital gain | $31,849,119 |
| Net unrealized appreciation (depreciation) on securities and other investments | $138,059,909 |
The tax character of distributions paid was as follows:
| | October 31, 2023 | October 31, 2022 |
| Ordinary Income | $593,300 | $ 2,549,889 |
| Long-term Capital Gains | 64,115,092 | 143,373,112 |
| Total | $64,708,392 | $ 145,923,001 |
Restricted Securities (including Private Placements). Funds may invest in securities that are subject to legal or contractual restrictions on resale. These securities generally may be resold in transactions exempt from registration or to the public if the securities are registered. Disposal of these securities may involve time-consuming negotiations and expense, and prompt sale at an acceptable price may be difficult. Information regarding restricted securities held at period end is included at the end of the Schedule of Investments, if applicable.
4. Purchases and Sales of Investments.
Purchases and sales of securities, other than short-term securities and in-kind transactions, as applicable, are noted in the table below.
| | Purchases ($) | Sales ($) |
| Fidelity International Small Cap Opportunities Fund | 104,500,348 | 234,052,891 |
5. Fees and Other Transactions with Affiliates.
Management Fee. Fidelity Management & Research Company LLC (the investment adviser) and its affiliates provide the Fund with investment management related services for which the Fund pays a monthly management fee. The management fee is the sum of an individual fund fee rate that is based on an annual rate of .60% of the Fund's average net assets and an annualized group fee rate that averaged .23% during the period. The group fee rate is based upon the monthly average net assets of a group of registered investment companies with which the investment adviser has management contracts. The group fee rate decreases as assets under management increase and increases as assets under management decrease. In addition, the management fee is subject to a performance adjustment (up to a maximum of +/- .20% of the Fund's average net assets over a 36 month performance period). The upward or downward adjustment to the management fee is based on the relative investment performance of International Small Cap Opportunities as compared to its benchmark index, the MSCI EAFE Small Cap Index, over the same 36 month performance period. For the reporting period, the total annual management fee rate, including the performance adjustment, was .78% of the Fund's average net assets. The performance adjustment included in the management fee rate may be higher or lower than the maximum performance adjustment rate due to the difference between the average net assets for the reporting and performance periods.
Distribution and Service Plan Fees. In accordance with Rule 12b-1 of the 1940 Act, the Fund has adopted separate Distribution and Service Plans for each class of shares. Certain classes pay Fidelity Distributors Company LLC (FDC), an affiliate of the investment adviser, separate Distribution and Service Fees, each of which is based on an annual percentage of each class' average net assets. In addition, FDC may pay financial intermediaries for selling shares of the Fund and providing shareholder support services. For the period, the Distribution and Service Fee rates, total fees and amounts retained by FDC were as follows:
| | Distribution Fee | Service Fee | Total Fees | Retained by FDC |
| Class A | - % | .25% | $72,134 | $250 |
| Class M | .25% | .25% | 55,224 | 166 |
| Class C | .75% | .25% | 31,436 | 1,209 |
| | | | $158,794 | $1,625 |
Sales Load. FDC may receive a front-end sales charge of up to 5.75% for selling Class A shares and 3.50% for selling Class M shares, some of which is paid to financial intermediaries for selling shares of the Fund. Depending on the holding period, FDC may receive contingent deferred sales charges levied on Class A, Class M and Class C redemptions. The deferred sales charges are 1.00% for Class C shares, 1.00% for certain purchases of Class A shares and .25% for certain purchases of Class M shares.
For the period, sales charge amounts retained by FDC were as follows:
| | Retained by FDC |
| Class A | $2,163 |
| Class M | 505 |
Class CA | 31 |
| | $2,699 |
A When Class C shares are initially sold, FDC pays commissions from its own resources to financial intermediaries through which the sales are made.
Transfer Agent Fees. Fidelity Investments Institutional Operations Company LLC (FIIOC), an affiliate of the investment adviser, is the transfer, dividend disbursing and shareholder servicing agent for each class of the Fund. FIIOC receives account fees and asset-based fees that vary according to the account size and type of account of the shareholders of the respective classes of the Fund, except for Class Z. FIIOC receives an asset-based fee of Class Z's average net assets. FIIOC pays for typesetting, printing and mailing of shareholder reports, except proxy statements.
For the period, transfer agent fees for each class were as follows:
| | Amount | % of Class-Level Average Net Assets |
| Class A | $62,299 | .22 |
| Class M | 24,423 | .22 |
| Class C | 7,894 | .25 |
| International Small Cap Opportunities | 1,133,042 | .16 |
| Class I | 151,758 | .20 |
| Class Z | 101,589 | .04 |
| | $1,481,005 | |
During November 2023, the Board approved a change in the transfer agent fees effective December 1, 2023 to a fixed annual rate of class-level average net assets as follows:
| | % of Class-Level Average Net Assets |
| Class A | 0.2000% |
| Class M | 0.2000% |
| Class C | 0.2000% |
| International Small Cap Opportunities | 0.1547% |
| Class I | 0.2000% |
Accounting Fees. Fidelity Service Company, Inc. (FSC), an affiliate of the investment adviser, maintains the Fund's accounting records. The accounting fee is based on the level of average net assets for each month. For the period, the fees were equivalent to the following annual rates:
| | % of Average Net Assets |
| Fidelity International Small Cap Opportunities Fund | .04 |
During November 2023, the Board approved a change in the accounting fees effective December 1, 2023 to a fixed annual rate of average net assets as follows:
| | % of Class-Level Average Net Assets |
| Fidelity International Small Cap Opportunities Fund | 0.0441% |
Brokerage Commissions. A portion of portfolio transactions were placed with brokerage firms which are affiliates of the investment adviser. Brokerage commissions are included in net realized gain (loss) and change in net unrealized appreciation (depreciation) in the Statement of Operations. The commissions paid to these affiliated firms were as follows:
| | Amount |
| Fidelity International Small Cap Opportunities Fund | $ 129 |
Interfund Lending Program. Pursuant to an Exemptive Order issued by the Securities and Exchange Commission (the SEC), the Fund, along with other registered investment companies having management contracts with Fidelity Management & Research Company LLC (FMR), or other affiliated entities of FMR, may participate in an interfund lending program. This program provides an alternative credit facility allowing the Fund to borrow from, or lend money to, other participating affiliated funds. At period end, there were no interfund loans outstanding. Activity in this program during the period for which loans were outstanding was as follows:
| | Borrower or Lender | Average Loan Balance | Weighted Average Interest Rate | Interest Expense |
Fidelity International Small Cap Opportunities Fund | Borrower | $ 9,180,000 | 4.82% | $4,911 |
Interfund Trades. Funds may purchase from or sell securities to other Fidelity Funds under procedures adopted by the Board. The procedures have been designed to ensure these interfund trades are executed in accordance with Rule 17a-7 of the 1940 Act. Any interfund trades are included within the respective purchases and sales amounts shown in the Purchases and Sales of Investments note. Interfund trades during the period are noted in the table below.
| | Purchases ($) | Sales ($) | Realized Gain (Loss) ($) |
| Fidelity International Small Cap Opportunities Fund | 3,091,312 | 12,385,884 | (558,433) |
6. Committed Line of Credit.
Certain Funds participate with other funds managed by the investment adviser or an affiliate in a $4.25 billion credit facility (the "line of credit") to be utilized for temporary or emergency purposes to fund shareholder redemptions or for other short-term liquidity purposes. The participating funds have agreed to pay commitment fees on their pro-rata portion of the line of credit, which are reflected in Miscellaneous expenses on the Statement of Operations, and are listed below. During the period, there were no borrowings on this line of credit.
| | Amount |
| Fidelity International Small Cap Opportunities Fund | $1,970 |
7. Security Lending.
Funds lend portfolio securities from time to time in order to earn additional income. Lending agents are used, including National Financial Services (NFS), an affiliate of the investment adviser. Pursuant to a securities lending agreement, NFS will receive a fee, which is capped at 9.9% of a fund's daily lending revenue, for its services as lending agent. A fund may lend securities to certain qualified borrowers, including NFS. On the settlement date of the loan, a fund receives collateral (in the form of U.S. Treasury obligations, letters of credit and/or cash) against the loaned securities and maintains collateral in an amount not less than 100% of the market value of the loaned securities during the period of the loan. The market value of the loaned securities is determined at the close of business of a fund and any additional required collateral is delivered to a fund on the next business day. A fund or borrower may terminate the loan at any time, and if the borrower defaults on its obligation to return the securities loaned because of insolvency or other reasons, a fund may apply collateral received from the borrower against the obligation. A fund may experience delays and costs in recovering the securities loaned. Any cash collateral received is invested in the Fidelity Securities Lending Cash Central Fund. Any loaned securities are identified as such in the Schedule of Investments, and the value of loaned securities and cash collateral at period end, as applicable, are presented in the Statement of Assets and Liabilities. Security lending income represents the income earned on investing cash collateral, less rebates paid to borrowers and any lending agent fees associated with the loan, plus any premium payments received for lending certain types of securities. Security lending income is presented in the Statement of Operations as a component of income from Fidelity Central Funds. Affiliated security lending activity, if any, was as follows:
| | Total Security Lending Fees Paid to NFS | Security Lending Income From Securities Loaned to NFS | Value of Securities Loaned to NFS at Period End |
| Fidelity International Small Cap Opportunities Fund | $7,549 | $- | $- |
8. Expense Reductions.
During the period, transfer agent credits reduced each class' expenses as noted in the table below.
| | Expense reduction |
| | |
| Class M | $352 |
| | |
In addition, during the period the investment adviser or an affiliate reimbursed and/or waived a portion of fund-level operating expenses in the amount of $65,038.
9. Distributions to Shareholders.
Distributions to shareholders of each class were as follows:
| | Year ended October 31, 2023 | Year ended October 31, 2022 |
| Fidelity International Small Cap Opportunities Fund | | |
| Distributions to shareholders | | |
| Class A | $ 1,724,252 | $3,712,302 |
| Class M | 668,890 | 1,347,073 |
| Class C | 228,866 | 565,280 |
| International Small Cap Opportunities | 42,205,549 | 103,110,108 |
| Class I | 5,288,952 | 11,507,400 |
| Class Z | 14,591,883 | 25,680,838 |
Total | $ 64,708,392 | $ 145,923,001 |
10. Share Transactions.
Share transactions for each class were as follows and may contain in-kind transactions, automatic conversions between classes or exchanges between affiliated funds:
| | Shares | Shares | Dollars | Dollars |
| | Year ended October 31, 2023 | Year ended October 31, 2022 | Year ended October 31, 2023 | Year ended October 31, 2022 |
| Fidelity International Small Cap Opportunities Fund | | | | |
| Class A | | | | |
| Shares sold | 171,839 | 107,181 | $3,136,955 | $2,213,121 |
| Reinvestment of distributions | 94,841 | 146,450 | 1,693,860 | 3,629,027 |
| Shares redeemed | (217,502) | (339,023) | (3,984,745) | (7,042,478) |
| Net increase (decrease) | 49,178 | (85,392) | $846,070 | $(1,200,330) |
| Class M | | | | |
| Shares sold | 21,269 | 19,908 | $383,026 | $424,699 |
| Reinvestment of distributions | 37,879 | 54,676 | 665,150 | 1,337,368 |
| Shares redeemed | (74,046) | (60,774) | (1,330,926) | (1,238,854) |
| Net increase (decrease) | (14,898) | 13,810 | $(282,750) | $523,213 |
| Class C | | | | |
| Shares sold | 7,494 | 9,960 | $129,355 | $199,008 |
| Reinvestment of distributions | 13,606 | 23,946 | 228,441 | 564,404 |
| Shares redeemed | (95,302) | (79,310) | (1,646,239) | (1,567,463) |
| Net increase (decrease) | (74,202) | (45,404) | $(1,288,443) | $(804,051) |
| International Small Cap Opportunities | | | | |
| Shares sold | 2,233,362 | 2,966,612 | $41,954,989 | $62,249,598 |
| Reinvestment of distributions | 1,900,059 | 3,165,438 | 34,581,075 | 79,642,429 |
| Shares redeemed | (7,265,881) | (10,146,566) | (137,436,859) | (202,796,085) |
| Net increase (decrease) | (3,132,460) | (4,014,516) | $(60,900,795) | $(60,904,058) |
| Class I | | | | |
| Shares sold | 2,306,791 | 698,127 | $42,956,688 | $14,776,475 |
| Reinvestment of distributions | 193,260 | 335,375 | 3,513,459 | 8,427,973 |
| Shares redeemed | (2,490,268) | (1,211,577) | (47,134,219) | (25,532,337) |
| Net increase (decrease) | 9,783 | (178,075) | $(664,072) | $(2,327,889) |
| Class Z | | | | |
| Shares sold | 1,446,980 | 2,588,492 | $27,457,499 | $51,781,304 |
| Reinvestment of distributions | 741,352 | 928,091 | 13,440,712 | 23,276,518 |
| Shares redeemed | (1,687,699) | (1,722,683) | (31,321,653) | (33,635,768) |
| Net increase (decrease) | 500,633 | 1,793,900 | $9,576,558 | $41,422,054 |
11. Other.
A fund's organizational documents provide former and current trustees and officers with a limited indemnification against liabilities arising in connection with the performance of their duties to the fund. In the normal course of business, a fund may also enter into contracts that provide general indemnifications. A fund's maximum exposure under these arrangements is unknown as this would be dependent on future claims that may be made against a fund. The risk of material loss from such claims is considered remote.
Mutual funds managed by the investment adviser or its affiliates, in aggregate, were the owners of record of more than 20% of the total outstanding shares.
| Fund | % of shares held |
| Fidelity International Small Cap Opportunities Fund | 25% |
12. Risk and Uncertainties.
Many factors affect a fund's performance. Developments that disrupt global economies and financial markets, such as pandemics, epidemics, outbreaks of infectious diseases, war, terrorism, and environmental disasters, may significantly affect a fund's investment performance. The effects of these developments to a fund will be impacted by the types of securities in which a fund invests, the financial condition, industry, economic sector, and geographic location of an issuer, and a fund's level of investment in the securities of that issuer. Significant concentrations in security types, issuers, industries, sectors, and geographic locations may magnify the factors that affect a fund's performance.
To the Board of Trustees of Fidelity Investment Trust and the Shareholders of Fidelity International Small Cap Opportunities Fund:
Opinion on the Financial Statements and Financial Highlights
We have audited the accompanying statement of assets and liabilities of Fidelity International Small Cap Opportunities Fund (the "Fund"), a fund of Fidelity Investment Trust, including the schedule of investments, as of October 31, 2023, the related statement of operations for the year then ended, the statement of changes in net assets for each of the two years in the period then ended, the financial highlights for each of the five years in the period then ended, and the related notes. In our opinion, the financial statements and financial highlights present fairly, in all material respects, the financial position of the Fund as of October 31, 2023, and the results of its operations for the year then ended, the changes in its net assets for each of the two years in the period then ended, and the financial highlights for each of the five years in the period then ended in conformity with accounting principles generally accepted in the United States of America.
Basis for Opinion
These financial statements and financial highlights are the responsibility of the Fund's management. Our responsibility is to express an opinion on the Fund's financial statements and financial highlights based on our audits. We are a public accounting firm registered with the Public Company Accounting Oversight Board (United States) (PCAOB) and are required to be independent with respect to the Fund in accordance with the U.S. federal securities laws and the applicable rules and regulations of the Securities and Exchange Commission and the PCAOB.
We conducted our audits in accordance with the standards of the PCAOB. Those standards require that we plan and perform the audit to obtain reasonable assurance about whether the financial statements and financial highlights are free of material misstatement, whether due to error or fraud. The Fund is not required to have, nor were we engaged to perform, an audit of its internal control over financial reporting. As part of our audits we are required to obtain an understanding of internal control over financial reporting but not for the purpose of expressing an opinion on the effectiveness of the Fund's internal control over financial reporting. Accordingly, we express no such opinion.
Our audits included performing procedures to assess the risks of material misstatement of the financial statements and financial highlights, whether due to error or fraud, and performing procedures that respond to those risks. Such procedures included examining, on a test basis, evidence regarding the amounts and disclosures in the financial statements and financial highlights. Our audits also included evaluating the accounting principles used and significant estimates made by management, as well as evaluating the overall presentation of the financial statements and financial highlights. Our procedures included confirmation of securities owned as of October 31, 2023, by correspondence with the custodian and brokers; when replies were not received from brokers, we performed other auditing procedures. We believe that our audits provide a reasonable basis for our opinion.
/s/ Deloitte & Touche LLP
Boston, Massachusetts
December 13, 2023
We have served as the auditor of one or more of the Fidelity investment companies since 1999.
The Trustees, Members of the Advisory Board (if any), and officers of the trust and fund, as applicable, are listed below. The Board of Trustees governs the fund and is responsible for protecting the interests of shareholders. The Trustees are experienced executives who meet periodically throughout the year to oversee the fund's activities, review contractual arrangements with companies that provide services to the fund, oversee management of the risks associated with such activities and contractual arrangements, and review the fund's performance. Except for Jonathan Chiel, each of the Trustees oversees 322 funds. Mr. Chiel oversees 191 funds.
The Trustees hold office without limit in time except that (a) any Trustee may resign; (b) any Trustee may be removed by written instrument, signed by at least two-thirds of the number of Trustees prior to such removal; (c) any Trustee who requests to be retired or who has become incapacitated by illness or injury may be retired by written instrument signed by a majority of the other Trustees; and (d) any Trustee may be removed at any special meeting of shareholders by a two-thirds vote of the outstanding voting securities of the trust. Each Trustee who is not an interested person (as defined in the 1940 Act) of the trust and the fund is referred to herein as an Independent Trustee. Each Independent Trustee shall retire not later than the last day of the calendar year in which his or her 75th birthday occurs. The Independent Trustees may waive this mandatory retirement age policy with respect to individual Trustees. Officers and Advisory Board Members hold office without limit in time, except that any officer or Advisory Board Member may resign or may be removed by a vote of a majority of the Trustees at any regular meeting or any special meeting of the Trustees. Except as indicated, each individual has held the office shown or other offices in the same company for the past five years.
The fund's Statement of Additional Information (SAI) includes more information about the Trustees. To request a free copy, call Fidelity at 1-800-544-8544 if you're an individual investing directly with Fidelity, call 1-800-835-5092 if you're a plan sponsor or participant with Fidelity as your recordkeeper or call 1-877-208-0098 on institutional accounts or if you're an advisor or invest through one.
Experience, Skills, Attributes, and Qualifications of the Trustees. The Governance and Nominating Committee has adopted a statement of policy that describes the experience, qualifications, attributes, and skills that are necessary and desirable for potential Independent Trustee candidates (Statement of Policy). The Board believes that each Trustee satisfied at the time he or she was initially elected or appointed a Trustee, and continues to satisfy, the standards contemplated by the Statement of Policy. The Governance and Nominating Committee also engages professional search firms to help identify potential Independent Trustee candidates who have the experience, qualifications, attributes, and skills consistent with the Statement of Policy. From time to time, additional criteria based on the composition and skills of the current Independent Trustees, as well as experience or skills that may be appropriate in light of future changes to board composition, business conditions, and regulatory or other developments, have also been considered by the professional search firms and the Governance and Nominating Committee. In addition, the Board takes into account the Trustees' commitment and participation in Board and committee meetings, as well as their leadership of standing and ad hoc committees throughout their tenure.
In determining that a particular Trustee was and continues to be qualified to serve as a Trustee, the Board has considered a variety of criteria, none of which, in isolation, was controlling. The Board believes that, collectively, the Trustees have balanced and diverse experience, qualifications, attributes, and skills, which allow the Board to operate effectively in governing the fund and protecting the interests of shareholders. Information about the specific experience, skills, attributes, and qualifications of each Trustee, which in each case led to the Board's conclusion that the Trustee should serve (or continue to serve) as a trustee of the fund, is provided below.
Board Structure and Oversight Function. Robert A. Lawrence is an interested person and currently serves as Chair. The Trustees have determined that an interested Chair is appropriate and benefits shareholders because an interested Chair has a personal and professional stake in the quality and continuity of services provided to the fund. Independent Trustees exercise their informed business judgment to appoint an individual of their choosing to serve as Chair, regardless of whether the Trustee happens to be independent or a member of management. The Independent Trustees have determined that they can act independently and effectively without having an Independent Trustee serve as Chair and that a key structural component for assuring that they are in a position to do so is for the Independent Trustees to constitute a substantial majority for the Board. The Independent Trustees also regularly meet in executive session. David M. Thomas serves as Lead Independent Trustee and as such (i) acts as a liaison between the Independent Trustees and management with respect to matters important to the Independent Trustees and (ii) with management prepares agendas for Board meetings.
Fidelity® funds are overseen by different Boards of Trustees. The fund's Board oversees Fidelity's high income and certain equity funds, and other Boards oversee Fidelity's alternative investment, investment-grade bond, money market, asset allocation, and other equity funds. The asset allocation funds may invest in Fidelity® funds overseen by the fund's Board. The use of separate Boards, each with its own committee structure, allows the Trustees of each group of Fidelity® funds to focus on the unique issues of the funds they oversee, including common research, investment, and operational issues. On occasion, the separate Boards establish joint committees to address issues of overlapping consequences for the Fidelity® funds overseen by each Board.
The Trustees operate using a system of committees to facilitate the timely and efficient consideration of all matters of importance to the Trustees, the fund, and fund shareholders and to facilitate compliance with legal and regulatory requirements and oversight of the fund's activities and associated risks. The Board, acting through its committees, has charged FMR and its affiliates with (i) identifying events or circumstances the occurrence of which could have demonstrably adverse effects on the fund's business and/or reputation; (ii) implementing processes and controls to lessen the possibility that such events or circumstances occur or to mitigate the effects of such events or circumstances if they do occur; and (iii) creating and maintaining a system designed to evaluate continuously business and market conditions in order to facilitate the identification and implementation processes described in (i) and (ii) above. Because the day-to-day operations and activities of the fund are carried out by or through FMR, its affiliates, and other service providers, the fund's exposure to risks is mitigated but not eliminated by the processes overseen by the Trustees. While each of the Board's committees has responsibility for overseeing different aspects of the fund's activities, oversight is exercised primarily through the Operations, Audit, and Compliance Committees. Appropriate personnel, including but not limited to the fund's Chief Compliance Officer (CCO), FMR's internal auditor, the independent accountants, the fund's Treasurer and portfolio management personnel, make periodic reports to the Board's committees, as appropriate, including an annual review of Fidelity's risk management program for the Fidelity® funds. The responsibilities of each standing committee, including their oversight responsibilities, are described further under "Standing Committees of the Trustees."
Interested Trustees*:
Correspondence intended for a Trustee who is an interested person may be sent to Fidelity Investments, 245 Summer Street, Boston, Massachusetts 02210.
Name, Year of Birth; Principal Occupations and Other Relevant Experience+
Jonathan Chiel (1957)
Year of Election or Appointment: 2016
Trustee
Mr. Chiel also serves as Trustee of other Fidelity® funds. Mr. Chiel is General Counsel (2012-present) and Head of Legal, Risk and Compliance (2022-present). Mr Chiel serves as Executive Vice President and General Counsel for FMR LLC (diversified financial services company, 2012-present) and Director and President for OH Company LLC (holding company, 2018-present). Previously, Mr. Chiel served as general counsel (2004-2012) and senior vice president and deputy general counsel (2000-2004) for John Hancock Financial Services; a partner with Choate, Hall & Stewart (1996-2000) (law firm); and an Assistant United States Attorney for the United States Attorney's Office of the District of Massachusetts (1986-95), including Chief of the Criminal Division (1993-1995). Mr. Chiel is a director on the boards of the Boston Bar Foundation and the Maimonides School.
Bettina Doulton (1964)
Year of Election or Appointment: 2021
Trustee
Ms. Doulton also serves as Trustee of other Fidelity® funds. Prior to her retirement, Ms. Doulton served in a variety of positions at Fidelity Investments, including as a managing director of research (2006-2007), portfolio manager to certain Fidelity® funds (1993-2005), equity analyst and portfolio assistant (1990-1993), and research assistant (1987-1990). Ms. Doulton currently owns and operates Phi Builders + Architects and Cellardoor Winery. Previously, Ms. Doulton served as a member of the Board of Brown Capital Management, LLC (2014-2018).
Robert A. Lawrence (1952)
Year of Election or Appointment: 2020
Trustee
Chair of the Board of Trustees
Mr. Lawrence also serves as Trustee of other funds. Previously, Mr. Lawrence served as a Trustee and Member of the Advisory Board of certain funds. Prior to his retirement in 2008, Mr. Lawrence served as Vice President of certain Fidelity® funds (2006-2008), Senior Vice President, Head of High Income Division of Fidelity Management & Research Company (investment adviser firm, 2006-2008), and President of Fidelity Strategic Investments (investment adviser firm, 2002-2005).
* Determined to be an "Interested Trustee" by virtue of, among other things, his or her affiliation with the trust or various entities under common control with FMR.
+ The information includes the Trustee's principal occupation during the last five years and other information relating to the experience, attributes, and skills relevant to the Trustee's qualifications to serve as a Trustee, which led to the conclusion that the Trustee should serve as a Trustee for the fund.
Independent Trustees:
Correspondence intended for an Independent Trustee may be sent to Fidelity Investments, P.O. Box 55235, Boston, Massachusetts 02205-5235.
Name, Year of Birth; Principal Occupations and Other Relevant Experience+
Thomas P. Bostick (1956)
Year of Election or Appointment: 2021
Trustee
Lieutenant General Bostick also serves as Trustee of other Fidelity® funds. Prior to his retirement, General Bostick (United States Army, Retired) held a variety of positions within the U.S. Army, including Commanding General and Chief of Engineers, U.S. Army Corps of Engineers (2012-2016) and Deputy Chief of Staff and Director of Human Resources, U.S. Army (2009-2012). General Bostick currently serves as a member of the Board and Finance and Governance & Sustainability Committees of CSX Corporation (transportation, 2020-present) and a member of the Board and Corporate Governance and Nominating Committee of Perma-Fix Environmental Services, Inc. (nuclear waste management, 2020-present). General Bostick serves as Chief Executive Officer of Bostick Global Strategies, LLC (consulting, 2016-present), as a member of the Board of HireVue, Inc. (video interview and assessment, 2020-present), as a member of the Board of Allonnia (biotechnology and engineering solutions, 2022-present) and on the Advisory Board of Solugen, Inc. (specialty bio-based chemicals manufacturer, 2022-present). Previously, General Bostick served as a Member of the Advisory Board of certain Fidelity® funds (2021), President, Intrexon Bioengineering (2018-2020) and Chief Operating Officer (2017-2020) and Senior Vice President of the Environment Sector (2016-2017) of Intrexon Corporation (biopharmaceutical company).
Dennis J. Dirks (1948)
Year of Election or Appointment: 2005
Trustee
Mr. Dirks also serves as Trustee of other Fidelity® funds. Prior to his retirement in May 2003, Mr. Dirks served as Chief Operating Officer and as a member of the Board of The Depository Trust & Clearing Corporation (financial markets infrastructure), President, Chief Operating Officer and a member of the Board of The Depository Trust Company (DTC), President and a member of the Board of the National Securities Clearing Corporation (NSCC), Chief Executive Officer and a member of the Board of the Government Securities Clearing Corporation and Chief Executive Officer and a member of the Board of the Mortgage-Backed Securities Clearing Corporation. Mr. Dirks currently serves as a member of the Finance Committee (2016-present) and Board (2017-present) and is Treasurer (2018-present) of the Asolo Repertory Theatre.
Donald F. Donahue (1950)
Year of Election or Appointment: 2018
Trustee
Mr. Donahue also serves as Trustee of other Fidelity® funds. Mr. Donahue serves as President and Chief Executive Officer of Miranda Partners, LLC (risk consulting for the financial services industry, 2012-present). Previously, Mr. Donahue served as Chief Executive Officer (2006-2012), Chief Operating Officer (2003-2006) and Managing Director, Customer Marketing and Development (1999-2003) of The Depository Trust & Clearing Corporation (financial markets infrastructure). Mr. Donahue currently serves as a member (2007-present) and Co-Chairman (2016-present) of the Board of United Way of New York. Mr. Donahue previously served as a member of the Advisory Board of certain Fidelity® funds (2015-2018) and as a member of the Board of The Leadership Academy (previously NYC Leadership Academy) (2012-2022).
Vicki L. Fuller (1957)
Year of Election or Appointment: 2020
Trustee
Ms. Fuller also serves as Trustee of other Fidelity® funds. Previously, Ms. Fuller served as a member of the Advisory Board of certain Fidelity® funds (2018-2020), Chief Investment Officer of the New York State Common Retirement Fund (2012-2018) and held a variety of positions at AllianceBernstein L.P. (global asset management, 1985-2012), including Managing Director (2006-2012) and Senior Vice President and Senior Portfolio Manager (2001-2006). Ms. Fuller currently serves as a member of the Board, Audit Committee and Nominating and Governance Committee of two Blackstone business development companies (2020-present), as a member of the Board of Treliant, LLC (consulting, 2019-present), as a member of the Board of Ariel Alternatives, LLC (private equity, 2022-present) and as a member of the Board and Chair of the Audit Committee of Gusto, Inc. (software, 2021-present). In addition, Ms. Fuller currently serves as a member of the Board of Roosevelt University (2019-present) and as a member of the Executive Board of New York University's Stern School of Business. Ms. Fuller previously served as a member of the Board, Audit Committee and Nominating and Governance Committee of The Williams Companies, Inc. (natural gas infrastructure, 2018-2021).
Patricia L. Kampling (1959)
Year of Election or Appointment: 2020
Trustee
Ms. Kampling also serves as Trustee of other Fidelity® funds. Prior to her retirement, Ms. Kampling served as Chairman of the Board and Chief Executive Officer (2012-2019), President and Chief Operating Officer (2011-2012) and Executive Vice President and Chief Financial Officer (2010-2011) of Alliant Energy Corporation. Ms. Kampling currently serves as a member of the Board, Finance Committee and Governance, Compensation and Nominating Committee of Xcel Energy Inc. (utilities company, 2020-present) and as a member of the Board, Audit, Finance and Risk Committee and Safety, Environmental, Technology and Operations Committee and Chair of the Executive Development and Compensation Committee of American Water Works Company, Inc. (utilities company, 2019-present). In addition, Ms. Kampling currently serves as a member of the Board of the Nature Conservancy, Wisconsin Chapter (2019-present). Previously, Ms. Kampling served as a Member of the Advisory Board of certain Fidelity® funds (2020), a member of the Board, Compensation Committee and Executive Committee and Chair of the Audit Committee of Briggs & Stratton Corporation (manufacturing, 2011-2021), a member of the Board of Interstate Power and Light Company (2012-2019) and Wisconsin Power and Light Company (2012-2019) (each a subsidiary of Alliant Energy Corporation) and as a member of the Board and Workforce Development Committee of the Business Roundtable (2018-2019).
Thomas A. Kennedy (1955)
Year of Election or Appointment: 2021
Trustee
Mr. Kennedy also serves as Trustee of other Fidelity® funds. Previously, Mr. Kennedy served as a Member of the Advisory Board of certain Fidelity® funds (2020) and held a variety of positions at Raytheon Company (aerospace and defense, 1983-2020), including Chairman and Chief Executive Officer (2014-2020) and Executive Vice President and Chief Operating Officer (2013-2014). Mr. Kennedy served as Executive Chairman of the Board of Directors of Raytheon Technologies Corporation (aerospace and defense, 2020-2021). Mr. Kennedy serves as a Director of the Board of Directors of Textron Inc. (aerospace and defense, 2023-present).
Oscar Munoz (1959)
Year of Election or Appointment: 2021
Trustee
Mr. Munoz also serves as Trustee of other Fidelity® funds. Prior to his retirement, Mr. Munoz served as Executive Chairman (2020-2021), Chief Executive Officer (2015-2020), President (2015-2016) and a member of the Board (2010-2021) of United Airlines Holdings, Inc. Mr. Munoz currently serves as a member of the Board of CBRE Group, Inc. (commercial real estate, 2020-present), a member of the Board of Univision Communications, Inc. (Hispanic media, 2020-present), a member of the Board of Archer Aviation Inc. (2021-present), a member of the Defense Business Board of the United States Department of Defense (2021-present) and a member of the Board of Salesforce.com, Inc. (cloud-based software, 2022-present). Previously, Mr. Munoz served as a Member of the Advisory Board of certain Fidelity® funds (2021).
David M. Thomas (1949)
Year of Election or Appointment: 2008
Trustee
Lead Independent Trustee
Mr. Thomas also serves as Trustee of other Fidelity® funds. Previously, Mr. Thomas served as Executive Chairman (2005-2006) and Chairman and Chief Executive Officer (2000-2005) of IMS Health, Inc. (pharmaceutical and healthcare information solutions). Mr. Thomas currently serves as a member of the Board of Fortune Brands Home and Security (home and security products, 2004-present) and as Director (2013-present) and Non-Executive Chairman of the Board (2022-present) of Interpublic Group of Companies, Inc. (marketing communication).
Susan Tomasky (1953)
Year of Election or Appointment: 2020
Trustee
Ms. Tomasky also serves as Trustee of other Fidelity® funds. Prior to her retirement, Ms. Tomasky served in various executive officer positions at American Electric Power Company, Inc. (1998-2011), including most recently as President of AEP Transmission (2007-2011). Ms. Tomasky currently serves as a member of the Board and Sustainability Committee and as Chair of the Audit Committee of Marathon Petroleum Corporation (2018-present) and as a member of the Board, Executive Committee, Corporate Governance Committee and Organization and Compensation Committee and as Lead Director of the Board of Public Service Enterprise Group, Inc. (utilities company, 2012-present) and as a member of the Board of its subsidiary company, Public Service Electric and Gas Co. (2021-present). In addition, Ms. Tomasky currently serves as a member (2009-present) and President (2020-present) of the Board of the Royal Shakespeare Company - America (2009-present), as a member of the Board of the Columbus Association for the Performing Arts (2011-present) and as a member of the Board and Kenyon in the World Committee of Kenyon College (2016-present). Previously, Ms. Tomasky served as a Member of the Advisory Board of certain Fidelity® funds (2020), as a member of the Board of the Columbus Regional Airport Authority (2007-2020), as a member of the Board (2011-2018) and Lead Independent Director (2015-2018) of Andeavor Corporation (previously Tesoro Corporation) (independent oil refiner and marketer) and as a member of the Board of Summit Midstream Partners LP (energy, 2012-2018).
Michael E. Wiley (1950)
Year of Election or Appointment: 2020
Trustee
Mr. Wiley also serves as Trustee of other Fidelity® funds. Previously, Mr. Wiley served as a member of the Advisory Board of certain Fidelity® funds (2018-2020), Chairman, President and CEO of Baker Hughes, Inc. (oilfield services, 2000-2004). Mr. Wiley also previously served as a member of the Board of Andeavor Corporation (independent oil refiner and marketer, 2005-2018), a member of the Board of Andeavor Logistics LP (natural resources logistics, 2015-2018) and a member of the Board of High Point Resources (exploration and production, 2005-2020).
+ The information includes the Trustee's principal occupation during the last five years and other information relating to the experience, attributes, and skills relevant to the Trustee's qualifications to serve as a Trustee, which led to the conclusion that the Trustee should serve as a Trustee for the fund.
Advisory Board Members and Officers:
Correspondence intended for a Member of the Advisory Board (if any) may be sent to Fidelity Investments, P.O. Box 55235, Boston, Massachusetts 02205-5235. Correspondence intended for an officer or Peter S. Lynch may be sent to Fidelity Investments, 245 Summer Street, Boston, Massachusetts 02210.
Name, Year of Birth; Principal Occupation
Vijay C. Advani (1960)
Year of Election or Appointment: 2023
Member of the Advisory Board
Mr. Advani also serves as Trustee or Member of the Advisory Board of other funds. Previously, Mr. Advani served as Executive Chairman (2020-2022), Chief Executive Officer (2017-2020) and Chief Operating Officer (2016-2017) of Nuveen (global investment manager). He also served in various capacities at Franklin Resources (global investment manager), including Co-President (2015-2016), Executive Vice President, Global Advisory Services (2008-2015), Head of Global Retail Distribution (2005-2008), Executive Managing Director, International Retail Development (2002-2005), Managing Director, Product Developments, Sales & Marketing, Asia, Eastern Europe and Africa (2000-2002) and President, Templeton Asset Management India (1995-2000). Mr. Advani also served as Senior Investment Officer of International Finance Corporation (private equity and venture capital arm of The World Bank, 1984-1995). Mr. Advani is Chairman Emeritus of the U.S. India Business Council (2018-present), a Director of The Global Impact Investing Network (2019-present), a Director of LOK Capital (Mauritius) (2022-present), a member of the Advisory Council of LOK Capital (2022-present), a Senior Advisor of Neuberger Berman (2021-present), a Senior Advisor of Seviora Holdings Pte. Ltd (Temasek-Singapore) (2021-present), a Director of Seviora Capital (Singapore) (2021-present) and an Advisor of EQUIAM (2021-present). Mr. Advani formerly served as a member of the Board of BowX Acquisition Corp. (special purpose acquisition company, 2020-2021), a member of the Board of Intellecap (advisory arm of The Aavishkaar Group, 2018-2020), a member of the Board of Nuveen Investments, Inc. (2017-2020) and a member of the Board of Docusign (software, 2016-2019).
Peter S. Lynch (1944)
Year of Election or Appointment: 2003
Member of the Advisory Board
Mr. Lynch also serves as a Member of the Advisory Board of other Fidelity® funds. Mr. Lynch is Vice Chairman and a Director of Fidelity Management & Research Company LLC (investment adviser firm). In addition, Mr. Lynch serves as a Trustee of Boston College and as the Chairman of the Inner-City Scholarship Fund. Previously, Mr. Lynch served as Vice Chairman and a Director of FMR Co., Inc. (investment adviser firm) and on the Special Olympics International Board of Directors (1997-2006).
Karen B. Peetz (1955)
Year of Election or Appointment: 2023
Member of the Advisory Board
Ms. Peetz also serves as a Member of the Advisory Board of other funds. Previously, Ms. Peetz served as Chief Administration Officer (2020-2023) of Citigroup Inc. (a diversified financial service company). She also served in various capacities at Bank of New York Mellon Corporation, including President (2013-2016), Vice Chairman, Senior Executive Vice President and Chief Executive Officer of Financial Markets & Treasury Services (2010-2013), Senior Executive Vice President and Chief Executive Officer of Global Corporate Trust (2003-2008), Senior Vice President and Division Manager of Global Payments & Trade Services (2002-2003) and Senior Vice President and Division Manager of Domestic Corporate Trust (1998-2002). Ms. Peetz also served in various capacities at Chase Manhattan Corporation (1982-1998), including Senior Vice President and Manager of Corporate Trust International Business (1996-1998), Managing Director and Manager of Corporate Trust Services (1994-1996) and Managing Director and Group Manager of Financial Institution Sales (1990-1993). Ms. Peetz currently serves as Chair of Amherst Holdings Advisory Council (2018-present), Trustee of Johns Hopkins University (2016-present), Chair of the Carey Business School Advisory Council, Member of the Johns Hopkins Medicine Board and Finance Committee and Chair of the Lyme and Tick Related Disease Institute Advisory Council. Ms. Peetz previously served as a member of the Board of Guardian Life Insurance Company of America (2019-2023), a member of the Board of Trane Technologies (2018-2022), a member of the Board of Wells Fargo Corp. (2017-2019), a member of the Board of SunCoke Energy Inc. (2012-2016), a member of the Board of Private Export Funding Corporation (2010-2016) and as a Trustee of Penn State University (2010-2014) and the United Way of New York City (2008-2010).
Heather Bonner (1977)
Year of Election or Appointment: 2023
Assistant Treasurer
Ms. Bonner also serves as an officer of other funds. Ms. Bonner is a Senior Vice President (2022-present) and is an employee of Fidelity Investments (2022-present). Ms. Bonner serves as Vice President, Treasurer, or Assistant Treasurer of certain Fidelity entities. Prior to joining Fidelity, Ms. Bonner served as Managing Director at AQR Capital Management (2013-2022) and was the Treasurer and Principal Financial Officer of the AQR Funds (2013-2022).
Craig S. Brown (1977)
Year of Election or Appointment: 2022
Deputy Treasurer
Mr. Brown also serves as an officer of other funds. Mr. Brown is a Vice President (2015-present) and is an employee of Fidelity Investments. Mr. Brown serves as Assistant Treasurer of FIMM, LLC (2021-present). Previously, Mr. Brown served as Assistant Treasurer of certain Fidelity® funds (2019-2022).
John J. Burke III (1964)
Year of Election or Appointment: 2018
Chief Financial Officer
Mr. Burke also serves as Chief Financial Officer of other funds. Mr. Burke is Head of Fidelity Fund and Investment Operations (2018-present) and is an employee of Fidelity Investments. Mr. Burke serves as President, Executive Vice President, or Director of certain Fidelity entities. Previously Mr. Burke served as head of Asset Management Investment Operations (2012-2018).
Margaret Carey (1973)
Year of Election or Appointment: 2023
Secretary and Chief Legal Officer (CLO)
Ms. Carey also serves as an officer of other funds and as CLO of certain Fidelity entities. Ms. Carey is a Senior Vice President, Deputy General Counsel (2019-present) and is an employee of Fidelity Investments.
William C. Coffey (1969)
Year of Election or Appointment: 2019
Assistant Secretary
Mr. Coffey also serves as Assistant Secretary of other funds. Mr. Coffey is a Senior Vice President, Deputy General Counsel (2010-present) and is an employee of Fidelity Investments. Previously, Mr. Coffey served as Secretary and CLO of certain funds (2018-2019); CLO, Secretary, or Senior Vice President of certain Fidelity entities and Assistant Secretary of certain funds (2009-2018).
Timothy M. Cohen (1969)
Year of Election or Appointment: 2018
Vice President
Mr. Cohen also serves as Vice President of other funds. Mr. Cohen is Co-Head of Equity (2018-present) and is an employee of Fidelity Investments. Mr. Cohen serves a Director of Fidelity Management & Research (Japan) Limited (investment adviser firm, 2016-present). Previously, Mr. Cohen served as Executive Vice President of Fidelity SelectCo, LLC (2019) and Head of Global Equity Research (2016-2018).
Jonathan Davis (1968)
Year of Election or Appointment: 2010
Assistant Treasurer
Mr. Davis also serves as an officer of other funds. Mr. Davis is a Vice President (2006-present) and is an employee of Fidelity Investments. Mr. Davis serves as Assistant Treasurer of certain Fidelity entities.
Laura M. Del Prato (1964)
Year of Election or Appointment: 2018
Assistant Treasurer
Ms. Del Prato also serves as an officer of other funds. Ms. Del Prato is a Senior Vice President (2017-present) and is an employee of Fidelity Investments. Ms. Del Prato serves as Vice President or Assistant Treasurer of certain Fidelity entities. Previously, Ms. Del Prato served as President and Treasurer of The North Carolina Capital Management Trust: Cash Portfolio and Term Portfolio (2018-2020).
Colm A. Hogan (1973)
Year of Election or Appointment: 2020
Assistant Treasurer
Mr. Hogan also serves as an officer of other funds. Mr. Hogan is a Vice President (2016-present) and is an employee of Fidelity Investments. Mr. Hogan serves as Assistant Treasurer of certain Fidelity entities. Previously, Mr. Hogan served as Deputy Treasurer of certain Fidelity® funds (2016-2020) and Assistant Treasurer of certain Fidelity® funds (2016-2018).
Pamela R. Holding (1964)
Year of Election or Appointment: 2018
Vice President
Ms. Holding also serves as Vice President of other funds. Ms. Holding is Co-Head of Equity (2018-present) and is an employee of Fidelity Investments. Previously, Ms. Holding served as Executive Vice President of Fidelity SelectCo, LLC (2019) and as Chief Investment Officer of Fidelity Institutional Asset Management (2013-2018).
Chris Maher (1972)
Year of Election or Appointment: 2020
Deputy Treasurer
Mr. Maher also serves as an officer of other funds. Mr. Maher is a Vice President (2008-present) and is an employee of Fidelity Investments. Mr. Maher serves as Assistant Treasurer of certain Fidelity entities. Previously, Mr. Maher served as Assistant Treasurer of certain funds (2013-2020).
Jason P. Pogorelec (1975)
Year of Election or Appointment: 2020
Chief Compliance Officer
Mr. Pogorelec also serves as Chief Compliance Officer of other funds. Mr. Pogorelec is a Senior Vice President of Asset Management Compliance (2020-present) and is an employee of Fidelity Investments. Mr. Pogorelec serves as Compliance Officer of Fidelity Management & Research Company LLC (investment adviser firm, 2023-present) and Ballyrock Investment Advisors LLC (2023-present). Previously, Mr. Pogorelec served as a Vice President, Associate General Counsel for Fidelity Investments (2010-2020) and Assistant Secretary of certain Fidelity® funds (2015-2020).
Brett Segaloff (1972)
Year of Election or Appointment: 2021
Anti-Money Laundering (AML) Officer
Mr. Segaloff also serves as AML Officer of other funds. Mr. Segaloff is a Vice President (2022-present) and is an employee of Fidelity Investments. Mr. Segaloff serves as Anti Money Laundering Compliance Officer or Anti Money Laundering/Bank Secrecy Act Compliance Officer of certain Fidelity entities.
Stacie M. Smith (1974)
Year of Election or Appointment: 2016
President and Treasurer
Ms. Smith also serves as an officer of other funds. Ms. Smith is a Senior Vice President (2016-present) and is an employee of Fidelity Investments. Ms. Smith serves as Assistant Treasurer of certain Fidelity entities and has served in other fund officer roles.
Jim Wegmann (1979)
Year of Election or Appointment: 2019
Assistant Treasurer
Mr. Wegmann also serves as an officer of other funds. Mr. Wegmann is a Vice President (2016-present) and is an employee of Fidelity Investments. Mr. Wegmann serves as Assistant Treasurer of FIMM, LLC (2021-present). Previously, Mr. Wegmann served as Assistant Treasurer of certain Fidelity® funds (2019-2021).
As a shareholder, you incur two types of costs: (1) transaction costs, which may include sales charges (loads) on purchase payments or redemption proceeds, as applicable and (2) ongoing costs, which generally include management fees, distribution and/or service (12b-1) fees and other Fund expenses. This Example is intended to help you understand your ongoing costs (in dollars) of investing in a fund and to compare these costs with the ongoing costs of investing in other mutual funds.
| The Example is based on an investment of $1,000 invested at the beginning of the period and held for the entire period (May 1, 2023 to October 31, 2023). |
Actual Expenses
The first line of the accompanying table provides information about actual account values and actual expenses. You may use the information in this line, together with the amount you invested, to estimate the expenses that you paid over the period. Simply divide your account value by $1,000.00 (for example, an $8,600 account value divided by $1,000.00 = 8.6), then multiply the result by the number in the first line for a class/Fund under the heading entitled "Expenses Paid During Period" to estimate the expenses you paid on your account during this period. If any fund is a shareholder of any underlying mutual funds or exchange-traded funds (ETFs) (the Underlying Funds), such fund indirectly bears its proportional share of the expenses of the Underlying Funds in addition to the direct expenses incurred presented in the table. These fees and expenses are not included in the annualized expense ratio used to calculate the expense estimate in the table below.
Hypothetical Example for Comparison Purposes
The second line of the accompanying table provides information about hypothetical account values and hypothetical expenses based on the actual expense ratio and an assumed rate of return of 5% per year before expenses, which is not the actual return. The hypothetical account values and expenses may not be used to estimate the actual ending account balance or expenses you paid for the period. You may use this information to compare the ongoing costs of investing in the Fund and other funds. To do so, compare this 5% hypothetical example with the 5% hypothetical examples that appear in the shareholder reports of the other funds. If any fund is a shareholder of any Underlying Funds, such fund indirectly bears its proportional share of the expenses of the Underlying Funds in addition to the direct expenses as presented in the table. These fees and expenses are not included in the annualized expense ratio used to calculate the expense estimate in the table below.
Please note that the expenses shown in the table are meant to highlight your ongoing costs only and do not reflect any transaction costs. Therefore, the second line of the table is useful in comparing ongoing costs only, and will not help you determine the relative total costs of owning different funds. In addition, if these transactional costs were included, your costs would have been higher.
| | | | | Annualized Expense Ratio- A | | Beginning Account Value May 1, 2023 | | Ending Account Value October 31, 2023 | | Expenses Paid During Period- C May 1, 2023 to October 31, 2023 |
| Fidelity® International Small Cap Opportunities Fund | | | | | | | | | | |
| Class A | | | | 1.24% | | | | | | |
| Actual | | | | | | $ 1,000 | | $ 883.40 | | $ 5.89 |
Hypothetical-B | | | | | | $ 1,000 | | $ 1,018.95 | | $ 6.31 |
| Class M | | | | 1.49% | | | | | | |
| Actual | | | | | | $ 1,000 | | $ 882.40 | | $ 7.07 |
Hypothetical-B | | | | | | $ 1,000 | | $ 1,017.69 | | $ 7.58 |
| Class C | | | | 2.00% | | | | | | |
| Actual | | | | | | $ 1,000 | | $ 880.10 | | $ 9.48 |
Hypothetical-B | | | | | | $ 1,000 | | $ 1,015.12 | | $ 10.16 |
| Fidelity® International Small Cap Opportunities Fund | | | | .93% | | | | | | |
| Actual | | | | | | $ 1,000 | | $ 885.20 | | $ 4.42 |
Hypothetical-B | | | | | | $ 1,000 | | $ 1,020.52 | | $ 4.74 |
| Class I | | | | .99% | | | | | | |
| Actual | | | | | | $ 1,000 | | $ 884.60 | | $ 4.70 |
Hypothetical-B | | | | | | $ 1,000 | | $ 1,020.21 | | $ 5.04 |
| Class Z | | | | .81% | | | | | | |
| Actual | | | | | | $ 1,000 | | $ 885.40 | | $ 3.85 |
Hypothetical-B | | | | | | $ 1,000 | | $ 1,021.12 | | $ 4.13 |
| |
A Annualized expense ratio reflects expenses net of applicable fee waivers.
B 5% return per year before expenses
C Expenses are equal to the annualized expense ratio, multiplied by the average account value over the period, multiplied by 184/ 365 (to reflect the one-half year period). The fees and expenses of any Underlying Funds are not included in each annualized expense ratio.
The dividend and capital gains distributions for the fund(s) are available on Fidelity.com or Institutional.Fidelity.com.
The fund hereby designates as a capital gain dividend with respect to the taxable year ended October 31, 2023, $34,527,634, or, if subsequently determined to be different, the net capital gain of such year.
International Small Cap Opportunities designates 18%; Class I designates 16%; and Class Z designates 11%; of the dividend distributed during the fiscal year as qualifying for the dividends-received deduction for corporate shareholders.
International Small Cap Opportunities, Class I and Class Z designate 100% of the dividend distributed during the fiscal year as amounts which may be taken into account as a dividend for purposes of the maximum rate under section 1(h)(11) of the Internal Revenue Code.
The amounts per share which represent income derived from sources within, and taxes paid to, foreign countries or possessions of the United States are as follows:
| | Pay Date | Income | Taxes |
| Fidelity International Small Cap Opportunities Fund | | | |
| Class A | 12/12/2022 | $0.0000 | $0.0000 |
| Class M | 12/12/2022 | $0.0000 | $0.0000 |
| Class C | 12/12/2022 | $0.0000 | $0.0000 |
| International Small Cap Opportunities | 12/12/2022 | $0.0564 | $0.0534 |
| Class I | 12/12/2022 | $0.0604 | $0.0534 |
| Class Z | 12/12/2022 | $0.0894 | $0.0534 |
The fund will notify shareholders in January 2024 of amounts for use in preparing 2023 income tax returns.
Board Approval of Investment Advisory Contracts and Management Fees
Fidelity International Small Cap Opportunities Fund
Each year, the Board of Trustees, including the Independent Trustees (together, the Board), considers the renewal of the fund's management contract with Fidelity Management & Research Company LLC (FMR) and the sub-advisory agreements (together, the Advisory Contracts) for the fund. FMR and the sub-advisers are referred to herein as the Investment Advisers. The Board, assisted by the advice of fund counsel and Independent Trustees' counsel, requests and considers a broad range of information relevant to the renewal of the Advisory Contracts throughout the year.
The Board meets regularly and, at each of its meetings, covers an extensive agenda of topics and materials and considers factors that are relevant to its annual consideration of the renewal of the fund's Advisory Contracts, including the services and support provided to the fund and its shareholders. The Board, acting directly and through its Committees (each of which is composed of and chaired by Independent Trustees), requests and receives information concerning the annual consideration of the renewal of the fund's Advisory Contracts. The Board also meets as needed to review matters specifically related to the Board's annual consideration of the renewal of the Advisory Contracts. Members of the Board may also meet with trustees of other Fidelity funds through joint ad hoc committees to discuss certain matters relevant to all of the Fidelity funds.
Approval of Stub Period Continuation. At its May 2023 meeting, the Board of Trustees voted to continue the fund's management contract with FMR, and the sub-advisory agreements and sub-sub-advisory agreements, in each case, where applicable (together, the Advisory Contracts), without modification, for two months from June 1, 2023 through July 31, 2023. The Board considered that the approval of the fund's Advisory Contracts will not result in any changes in (i) the investment process or strategies employed in the management of the fund's assets; (ii) the fees and expenses paid by shareholders; (iii) the nature, extent or quality of services provided under the fund's Advisory Contracts; or (iv) the day-to-day management of the fund or the persons primarily responsible for such management. The Board also considered that since its last approval of the fund's Advisory Contracts, FMR had provided additional information on the fund in support of the annual contract renewal process, including competitive analyses on total expenses and management fees and in-depth reviews of fund performance and fund profitability information. The Board concluded that the fund's Advisory Contracts are fair and reasonable, and that the fund's Advisory Contracts should be renewed, without modification, through July 31, 2023, with the understanding that the Board would consider the annual renewal for a full one year period in July 2023.
At its July 2023 meeting, the Board unanimously determined to renew the fund's Advisory Contracts. In reaching its determination, the Board considered all factors it believed relevant, including (i) the nature, extent, and quality of the services provided to the fund and its shareholders (including the investment performance of the fund); (ii) the competitiveness relative to peer funds of the fund's management fee and the total expense ratio of a representative class (the retail class, which was selected because it was the largest class without 12b-1 fees); (iii) the total costs of the services provided by and the profits realized by FMR and its affiliates (Fidelity) from its relationships with the fund; and (iv) the extent to which, if any, economies of scale exist and are realized as the fund grows, and whether any economies of scale are appropriately shared with fund shareholders. The Board also considered the broad range of investment choices available to shareholders from FMR's competitors and that the fund's shareholders have chosen to invest in the fund, which is part of the Fidelity family of funds. The Board's decision to renew the Advisory Contracts was not based on any single factor.
The Board reached a determination, with the assistance of fund counsel and Independent Trustees' counsel and through the exercise of its business judgment, that the renewal of the Advisory Contracts was in the best interests of the fund and its shareholders and that the compensation payable under the Advisory Contracts was fair and reasonable in light of all of the surrounding circumstances.
Nature, Extent, and Quality of Services Provided. The Board considered staffing as it relates to the fund, including the backgrounds and experience of investment personnel of the Investment Advisers, and also considered the Investment Advisers' implementation of the fund's investment program. The Independent Trustees also had discussions with senior management of Fidelity's investment operations and investment groups. The Board considered the structure of the investment personnel compensation program and whether this structure provides appropriate incentives to act in the best interests of the fund. Additionally, the Board considered the portfolio managers' investments, if any, in the funds that they manage.
Resources Dedicated to Investment Management and Support Services. The Board and the Fund Oversight and Research Committees reviewed the general qualifications and capabilities of Fidelity's investment staff, including its size, education, experience, and resources, as well as Fidelity's approach to recruiting, training, managing, and compensating investment personnel. The Board noted the resources devoted to expansion of Fidelity's global investment organization, and that Fidelity's analysts have extensive resources, tools, and capabilities that allow them to conduct sophisticated quantitative and fundamental analysis, as well as credit analysis of issuers, counterparties and guarantors. Further, the Board considered that Fidelity's investment professionals have sufficient access to global information and data so as to provide competitive investment results over time, and that those professionals also have access to sophisticated tools that permit them to assess portfolio construction and risk and performance attribution characteristics continuously, as well as to transmit new information and research conclusions rapidly around the world. Additionally, in its deliberations, the Board considered Fidelity's trading, risk management, compliance, and technology and operations capabilities and resources, which are integral parts of the investment management process.
Shareholder and Administrative Services. The Board considered (i) the nature, extent, quality, and cost of advisory, administrative, and shareholder services performed by the Investment Advisers and their affiliates under the Advisory Contracts and under separate agreements covering transfer agency, pricing and bookkeeping, and securities lending services for the fund; (ii) the nature and extent of Fidelity's supervision of third party service providers, principally custodians, subcustodians, and pricing vendors; and (iii) the resources devoted by Fidelity to, and the record of compliance with, the fund's compliance policies and procedures. The Board also reviewed the allocation of fund brokerage, including allocations to brokers affiliated with the Investment Advisers, the use of brokerage commissions to pay fund expenses, and the use of "soft" commission dollars to pay for research services. The Board also considered the fund's securities lending activities and any payments made to Fidelity relating to securities lending.
The Board noted that the growth of fund assets over time across the complex allows Fidelity to reinvest in the development of services designed to enhance the value and convenience of the Fidelity funds as investment vehicles. These services include 24-hour access to account information and market information over the Internet and through telephone representatives, investor education materials, and asset allocation tools. The Board also considered that it reviews customer service metrics such as telephone response times, continuity of services on the website and metrics addressing services at Fidelity Investor Centers.
Investment in a Large Fund Family. The Board considered the benefits to shareholders of investing in a fund that is part of a large family of funds offering a variety of investment disciplines and providing a large variety of fund investor services. The Board noted that Fidelity had taken, or had made recommendations that resulted in the Fidelity funds taking, a number of actions over the previous year that benefited particular funds and/or the Fidelity funds in general.
Investment Performance. The Board took into account discussions that occur with representatives of the Investment Advisers, and reports that it receives, at Board meetings throughout the year, relating to fund investment performance. In this regard the Board noted that as part of regularly scheduled fund reviews and other reports to the Board on fund performance, the Board considered annualized return information for the fund for different time periods, measured against an appropriate securities market index (benchmark index) and an appropriate peer group of funds with similar objectives (peer group). The Board also considered information about performance attribution. In its ongoing evaluation of fund investment performance, the Board gives particular attention to information indicating changes in performance of the funds over different time periods and discussed with the Investment Advisers the reasons for any overperformance or underperformance.
In addition to reviewing absolute and relative fund performance, the Independent Trustees periodically consider the appropriateness of fund performance metrics in evaluating the results achieved. The Independent Trustees generally give greater weight to fund performance over longer time periods than over shorter time periods. Depending on the circumstances, the Independent Trustees may be satisfied with a fund's performance notwithstanding that it lags its benchmark index or peer group for certain periods.
Based on its review, the Board concluded that the nature, extent, and quality of services provided to the fund under the Advisory Contracts should continue to benefit the shareholders of the fund.
Competitiveness of Management Fee and Total Expense Ratio. The Board was provided with information regarding industry trends in management fees and expenses. In its review of the fund's management fee and the total expense ratio of the retail class, the Board considered the fund's management fee rate as well as other fund or class expenses, as applicable, such as transfer agent fees, pricing and bookkeeping fees, fund-paid 12b-1 fees, and custodial, legal, and audit fees. The Board noted that Fidelity may agree to waive fees or reimburse expenses from time to time, and the extent to which, if any, it has done so for the fund. The Board also considered information about the impact of the fund's performance adjustment.
Comparisons of Management Fees and Total Expense Ratios. Among other things, the Board reviewed data for selected groups of competitive funds and classes (referred to as "mapped groups") that were compiled by Fidelity based on combining similar investment objective categories (as classified by Lipper) that have comparable investment mandates. The data reviewed by the Board included (i) gross management fee comparisons (before taking into account expense reimbursements or caps and without taking into account the fund's performance adjustment) relative to the total universe of funds within the mapped group; (ii) gross management fee comparisons relative to a subset of non-Fidelity funds in the mapped group that are similar in size and management fee structure to the fund (referred to as the "asset size peer group"); (iii) total expense comparisons of the retail class of the fund relative to funds and classes in the mapped group that have a similar sales load structure to the retail class of the fund (referred to as the "similar sales load structure group"); and (iv) total expense comparisons of the retail class of the fund relative to funds and classes in the similar sales load structure group that are similar in size and management fee structure to the fund (referred to as the "total expense asset size peer group"). The total expense asset size peer group comparison excludes performance adjustments and fund-paid 12b-1 fees to eliminate variability in fee structures.
The information provided to the Board indicated that the fund's management fee rate ranked below the competitive median of the mapped group for the 12-month period ended September 30, 2022 and below the competitive median of the asset size peer group for the 12-month period ended September 30, 2022. Further, the information provided to the Board indicated that the total expense ratio of the retail class of the fund ranked below the competitive median of the similar sales load structure group for the 12-month period ended September 30, 2022 and below the competitive median of the total expense asset size peer group for the 12-month period ended September 30, 2022.
The Board also considered that, for funds subject to the group fee, FMR agreed to voluntarily waive fees over a specified period of time in amounts designed to account for assets converted from certain funds to certain collective investment trusts.
The Board also considered that the fund's management fee is subject to upward or downward adjustment depending upon whether, and to what extent, the fund's investment performance for the performance period (a rolling 36-month period) exceeds, or is exceeded by, a securities index, thus leading to a performance adjustment for the same period. The Board noted that the performance adjustment provides FMR with a strong economic incentive to seek to achieve superior long-term performance for the fund's shareholders and helps to more closely align the interests of FMR and the shareholders of the fund.
In connection with its consideration of the fund's performance adjustment, the Board noted that the performance of the retail class is used for purposes of determining the performance adjustment. The Board noted that to the extent the performance adjustment was based on the performance of a share class with higher total annual operating expenses, the fund would be subject to a smaller positive and larger negative performance adjustment. The Board considered the appropriateness of the use of the retail class as the basis for the performance adjustment. The Board noted that the retail class is typically the largest class (reflecting the actual investment experience for the plurality of shareholders), employs a standard expense structure, and does not include fund-paid 12b-1 fees, which Fidelity believes makes it a more appropriate measurement of Fidelity's investment skill.
Fees Charged to Other Fidelity Clients. The Board also considered Fidelity fee structures and other information with respect to clients of Fidelity, such as other funds advised or subadvised by Fidelity, pension plan clients, and other institutional clients with similar mandates. The Board noted that a joint ad hoc committee created by it and the boards of other Fidelity funds periodically reviews and compares Fidelity's institutional investment advisory business with its business of providing services to the Fidelity funds and also noted the most recent findings of the committee. The Board noted that the committee's review included a consideration of the differences in services provided, fees charged, and costs incurred, as well as competition in the markets serving the different categories of clients.
Based on its review, the Board concluded that the fund's management fee, including the use of the retail class as the basis for the performance adjustment, is fair and reasonable in light of the services that the fund receives and the other factors considered. Further, based on its review of total expense ratios and fees charged to other Fidelity clients, the Board concluded that the total expense ratio of each class of the fund was reasonable in light of the services that the fund and its shareholders receive and the other factors considered.
Costs of the Services and Profitability. The Board considered the revenues earned and the expenses incurred by Fidelity in conducting the business of developing, marketing, distributing, managing, administering and servicing the fund and servicing the fund's shareholders. The Board also considered the level of Fidelity's profits in respect of all the Fidelity funds.
On an annual basis, Fidelity presents to the Board information about the profitability of its relationships with the fund. Fidelity calculates profitability information for each fund, as well as aggregate profitability information for groups of Fidelity funds and all Fidelity funds, using a series of detailed revenue and cost allocation methodologies which originate with the books and records of Fidelity on which Fidelity's audited financial statements are based. The Audit Committee of the Board reviews any significant changes from the prior year's methodologies and the full Board approves such changes.
A public accounting firm has been engaged annually by the Board as part of the Board's assessment of Fidelity's profitability analysis. The engagement includes the review and assessment of the methodologies used by Fidelity in determining the revenues and expenses attributable to Fidelity's fund business, and completion of agreed-upon procedures in respect of the mathematical accuracy of certain fund profitability information and its conformity to established allocation methodologies. After considering the reports issued under the engagement and information provided by Fidelity, the Board concluded that while other allocation methods may also be reasonable, Fidelity's profitability methodologies are reasonable in all material respects.
The Board also reviewed Fidelity's non-fund businesses and potential indirect benefits such businesses may have received as a result of their association with Fidelity's fund business (i.e., fall-out benefits) as well as cases where Fidelity's affiliates may benefit from the funds' business. The Board considered areas where potential indirect benefits to the Fidelity funds from their relationships with Fidelity may exist. The Board's consideration of these matters was informed by the findings of a joint ad hoc committee created by it and the boards of other Fidelity funds to evaluate potential fall-out benefits.
The Board considered the costs of the services provided by and the profits realized by Fidelity in connection with the operation of the fund and was satisfied that the profitability was not excessive.
Economies of Scale. The Board considered whether there have been economies of scale in respect of the management of the Fidelity funds, whether the Fidelity funds (including the fund) have appropriately benefited from any such economies of scale, and whether there is potential for realization of any further economies of scale. The Board considered the extent to which the fund will benefit from economies of scale as assets grow through increased services to the fund, through waivers or reimbursements, or through fee or expense ratio reductions. The Board also noted that a committee (the Economies of Scale Committee) created by it and the boards of other Fidelity funds periodically analyzes whether Fidelity attains economies of scale in respect of the management and servicing of the Fidelity funds, whether the Fidelity funds have appropriately benefited from such economies of scale, and whether there is potential for realization of any further economies of scale.
The Board recognized that the fund's management contract incorporates a "group fee" structure, which provides for lower group fee rates as total "group assets" increase, and for higher group fee rates as total "group assets" decrease ("group assets" as defined in the management contract). FMR calculates the group fee rates based on a tiered asset "breakpoint" schedule that varies based on asset class. The Board considered that the group fee is designed to deliver the benefits of economies of scale to fund shareholders when total Fidelity fund assets increase, even if assets of any particular fund are unchanged or have declined, because some portion of Fidelity's costs are attributable to services provided to all Fidelity funds, and all funds benefit if those costs can be allocated among more assets. The Board further considered that Fidelity agreed to impose a temporary fee waiver in the form of additional breakpoints to the current breakpoint schedule. The Board also considered that although the fund is partially closed to new investors, it continues to incur investment management expenses, and marketing and distribution expenses related to the retention of existing shareholders and assets. The Board further noted that the fund may continue to realize benefits from the group fee structure, even though assets may not be expected to grow significantly at the fund level. The Board concluded that, given the group fee structure, fund shareholders will benefit from lower management fees as "group assets" increase at the fund complex level, regardless of whether Fidelity achieves any such economies of scale.
The Board concluded, taking into account the analysis of the Economies of Scale Committee, that economies of scale, if any, are being appropriately shared between fund shareholders and Fidelity.
Additional Information Requested by the Board. In order to develop fully the factual basis for consideration of the Fidelity funds' advisory contracts, the Board requested and received additional information on certain topics, including: (i) fund flow and performance trends, in particular the underperformance of certain funds and strategies, and Fidelity's long-term strategies for certain funds, including any consideration of fund liquidations or mergers; (ii) the operation of performance fees and competitor use of performance fees; (iii) Fidelity's pricing philosophy compared to competitors; (iv) fund profitability methodology and data; (v) evaluation of competitive fund data and peer group classifications and fee and expense comparisons; (vi) the management fee and expense structures for different funds and classes and information about the differences between various fee and expense structures; (vii) group fee breakpoints and related voluntary fee waivers; and (viii) information regarding other accounts managed by Fidelity and the funds' sub-advisory arrangements.
Conclusion. Based on its evaluation of all of the conclusions noted above, and after considering all factors it believed relevant, the Board, including the Independent Trustees, concluded that the advisory and sub-advisory fee arrangements are fair and reasonable in light of all of the surrounding circumstances and that the fund's Advisory Contracts should be renewed through July 31, 2024.
1.815075.119
ILS-ANN-1223
Fidelity® Sustainable International Equity Fund
Annual Report
October 31, 2023
Includes Fidelity and Fidelity Advisor share classes
Contents
To view a fund's proxy voting guidelines and proxy voting record for the 12-month period ended June 30, visit http://www.fidelity.com/proxyvotingresults or visit the Securities and Exchange Commission's (SEC) web site at http://www.sec.gov.
You may also call 1-800-544-8544 if you're an individual investing directly with Fidelity, call 1-800-835-5092 if you're a plan sponsor or participant with Fidelity as your recordkeeper or call 1-877-208-0098 on institutional accounts or if you're an advisor or invest through one to request a free copy of the proxy voting guidelines.
Standard & Poor's, S&P and S&P 500 are registered service marks of The McGraw-Hill Companies, Inc. and have been licensed for use by Fidelity Distributors Corporation.
Other third-party marks appearing herein are the property of their respective owners.
All other marks appearing herein are registered or unregistered trademarks or service marks of FMR LLC or an affiliated company. © 2023 FMR LLC. All rights reserved.
This report and the financial statements contained herein are submitted for the general information of the shareholders of the Fund. This report is not authorized for distribution to prospective investors in the Fund unless preceded or accompanied by an effective prospectus.
A fund files its complete schedule of portfolio holdings with the SEC for the first and third quarters of each fiscal year on Form N-PORT. Forms N-PORT are available on the SEC's web site at http://www.sec.gov. A fund's Forms N-PORT may be reviewed and copied at the SEC's Public Reference Room in Washington, DC. Information regarding the operation of the SEC's Public Reference Room may be obtained by calling 1-800-SEC-0330.
For a complete list of a fund's portfolio holdings, view the most recent holdings listing, semiannual report, or annual report on Fidelity's web site at http://www.fidelity.com, http://www.institutional.fidelity.com, or http://www.401k.com, as applicable.
NOT FDIC INSURED •MAY LOSE VALUE •NO BANK GUARANTEE
Neither the Fund nor Fidelity Distributors Corporation is a bank.
Average annual total return reflects the change in the value of an investment, assuming reinvestment of distributions from dividend income and capital gains (the profits earned upon the sale of securities that have grown in value, if any) and assuming a constant rate of performance each year. The hypothetical investment and the average annual total returns do not reflect the deduction of taxes that a shareholder would pay on fund distributions or the redemption of fund shares. During periods of reimbursement by Fidelity, a fund's total return will be greater than it would be had the reimbursement not occurred. How a fund did yesterday is no guarantee of how it will do tomorrow.
| Average Annual Total Returns |
| | | | |
Periods ended October 31, 2023 | Past 1 year | Life of Fund A |
Class A (incl. 5.75% sales charge) | 3.14% | -15.88% |
Class M (incl. 3.50% sales charge) | 5.26% | -14.95% |
Class C (incl. contingent deferred sales charge) | 7.66% | -13.58% |
| Fidelity® Sustainable International Equity Fund | 9.73% | -12.73% |
| Class I | 9.73% | -12.73% |
| Class Z | 9.86% | -12.60% |
A From February 10, 2022
Class C shares' contingent deferred sales charges included in the past one year and life of fund total return figures are 1% and 0%, respectively.
| $10,000 Over Life of Fund |
| |
Let's say hypothetically that $10,000 was invested in Fidelity® Sustainable International Equity Fund, a class of the fund, on February 10, 2022, when the fund started. The chart shows how the value of your investment would have changed, and also shows how the MSCI EAFE Index performed over the same period. |
|
|
Market Recap:
International (non-U.S.) equities gained 12.27% for the 12 months ending October 31, 2023, according to the MSCI ACWI (All Country World Index) ex USA Index, as global economic expansion and a slowing in the pace of inflation in some markets provided a favorable backdrop for risk assets. After returning -15.86% in 2022, the index's upturn has been largely driven by a narrow set of companies in the information technology and communication services sectors, in part due to excitement for generative artificial intelligence applications. The index gained 14.07% year to date through July, including strong gains in both June (+4.50%) and July (+4.07%). The rally for international equities sputtered for the next three months (-11.33%) amid a stalling pattern in disinflationary trends, heightened global recession and geopolitical risks, soaring yields on longer-term U.S. government bonds and particularly weak economic conditions in the eurozone and China. The three-month decline left non-U.S. stocks up 1.15% year to date through October. Currency fluctuation also helped bolster non-U.S. equity performance overall. For the full 12 months, nearly all regions advanced, with Europe ex U.K. (+18%) and Japan (+17%) leading, whereas Canada (-0.38%) lagged by the widest margin. Each of the 11 sectors advanced, with information technology (+21%) and consumer discretionary (+19%) leading the way. Energy and industrials each rose about 14%. Conversely, four defensive-oriented sectors lagged by the widest margin: real estate (+4%), health care (+6%), consumer staples (+7%) and utilities (+8%).
Comments from Co-Managers Niamh Brodie-Machura and William Kennedy:
For the fiscal year ending October 31, 2023, the fund's share classes (excluding sales charges, if applicable) gained about 9% to 10%, versus 14.65% for the benchmark MSCI EAFE Index (Net MA). From a regional standpoint, stock picks in Europe ex the U.K. and investment choices in the U.K. notably detracted from the fund's relative result. Investment choices in emerging markets and Canada also hindered performance versus the benchmark. By sector, security selection was the primary detractor, especially within financials, where our picks among banks hurt most. Security selection in the consumer discretionary and utilities sectors and positioning in energy also hampered the fund's result versus the benchmark. The biggest individual relative detractor was an overweight in Finland-based Neste (-21%). A non-benchmark stake in HDFC Bank (-9%), which is in India, and an overweight in Orsted (-28%) in Denmark also hurt relative performance. Orsted was not held at period end. In contrast, from a regional standpoint, an underweight in Asia Pacific ex Japan helped performance most versus the benchmark. By sector, the biggest contributor to relative performance was stock selection in health care, primarily within the pharmaceuticals, biotechnology & life sciences industry. Stock picks and an overweight in information technology, primarily within the technology hardware & equipment industry, and an underweight in real estate also boosted relative performance. The top individual relative contributor was an overweight in Denmark-headquartered Novo-Nordisk (+44%), a position we established this period. Novo-Nordisk was the fund's top holding on October 31. Other notable relative contributors included overweights in Itochu (+41%) and Hitachi (+40%), Japan-based companies that were among the fund's largest holdings. By sector, meaningful changes included a higher allocation to information technology.
Note to shareholders:
Application of FMR's environmental, social, and governance (ESG) ratings process and/or its sustainable investing exclusion criteria may affect the Fund's exposure to certain issuers, sectors, regions, and countries and may affect the Fund's performance.
The views expressed above reflect those of the portfolio manager(s) only through the end of the period as stated on the cover of this report and do not necessarily represent the views of Fidelity or any other person in the Fidelity organization. Any such views are subject to change at any time based upon market or other conditions and Fidelity disclaims any responsibility to update such views. These views may not be relied on as investment advice and, because investment decisions for a Fidelity fund are based on numerous factors, may not be relied on as an indication of trading intent on behalf of any Fidelity fund.
Top Holdings (% of Fund's net assets) |
| |
| Novo Nordisk A/S Series B (Denmark, Pharmaceuticals) | 5.6 | |
| Sony Group Corp. (Japan, Household Durables) | 3.7 | |
| AstraZeneca PLC (United Kingdom) (United Kingdom, Pharmaceuticals) | 3.6 | |
| ASML Holding NV (Netherlands) (Netherlands, Semiconductors & Semiconductor Equipment) | 3.2 | |
| Itochu Corp. (Japan, Trading Companies & Distributors) | 2.9 | |
| Nestle SA (Reg. S) (United States of America, Food Products) | 2.9 | |
| ORIX Corp. (Japan, Financial Services) | 2.8 | |
| Hitachi Ltd. (Japan, Industrial Conglomerates) | 2.6 | |
| LVMH Moet Hennessy Louis Vuitton SE (France, Textiles, Apparel & Luxury Goods) | 2.3 | |
| Taiwan Semiconductor Manufacturing Co. Ltd. (Taiwan, Semiconductors & Semiconductor Equipment) | 2.2 | |
| | 31.8 | |
| |
| Market Sectors (% of Fund's net assets) |
| |
| Financials | 21.4 | |
| Health Care | 14.8 | |
| Industrials | 13.2 | |
| Information Technology | 13.2 | |
| Consumer Discretionary | 10.3 | |
| Consumer Staples | 9.5 | |
| Materials | 6.5 | |
| Utilities | 4.0 | |
| Communication Services | 2.2 | |
| Energy | 1.1 | |
| Real Estate | 0.6 | |
| |
Asset Allocation (% of Fund's net assets) |
|
|
Geographic Diversification (% of Fund's net assets) |
|
* Includes Short-Term investments and Net Other Assets (Liabilities). Percentages are adjusted for the effect of derivatives, if applicable. |
| |
Showing Percentage of Net Assets
| Common Stocks - 96.8% |
| | | Shares | Value ($) |
| Australia - 1.8% | | | |
| Bapcor Ltd. | | 13,815 | 47,024 |
| Macquarie Group Ltd. | | 719 | 73,906 |
TOTAL AUSTRALIA | | | 120,930 |
| Austria - 2.0% | | | |
| Verbund AG | | 1,017 | 88,239 |
| Wienerberger AG | | 2,030 | 49,274 |
TOTAL AUSTRIA | | | 137,513 |
| Belgium - 1.4% | | | |
| KBC Group NV | | 583 | 32,016 |
| UCB SA | | 860 | 62,842 |
TOTAL BELGIUM | | | 94,858 |
| China - 0.5% | | | |
| Chervon Holdings Ltd. | | 14,888 | 36,670 |
| Denmark - 6.0% | | | |
| Novo Nordisk A/S Series B | | 3,895 | 375,774 |
| Vestas Wind Systems A/S (a) | | 1,320 | 28,611 |
TOTAL DENMARK | | | 404,385 |
| Finland - 1.1% | | | |
| Neste OYJ | | 2,189 | 73,446 |
| France - 11.8% | | | |
| Air Liquide SA | | 512 | 87,732 |
| AXA SA | | 4,024 | 119,233 |
| BNP Paribas SA | | 2,100 | 120,758 |
| Capgemini SA | | 263 | 46,480 |
| Edenred SA | | 653 | 34,713 |
| L'Oreal SA | | 270 | 113,489 |
| LVMH Moet Hennessy Louis Vuitton SE | | 220 | 157,505 |
| Pernod Ricard SA | | 657 | 116,441 |
| Worldline SA (a)(b) | | 577 | 7,314 |
TOTAL FRANCE | | | 803,665 |
| Germany - 8.4% | | | |
| Deutsche Borse AG | | 373 | 61,394 |
| DHL Group | | 1,244 | 48,386 |
| Gerresheimer AG | | 594 | 55,246 |
| Merck KGaA | | 760 | 114,472 |
| Muenchener Rueckversicherungs-Gesellschaft AG in Muenchen | | 294 | 117,744 |
| SAP SE | | 403 | 54,055 |
| Siemens AG | | 910 | 120,756 |
TOTAL GERMANY | | | 572,053 |
| Hong Kong - 3.7% | | | |
| AIA Group Ltd. | | 17,003 | 147,651 |
| Hang Seng Bank Ltd. | | 5,365 | 61,339 |
| Prudential PLC | | 3,969 | 41,501 |
TOTAL HONG KONG | | | 250,491 |
| India - 1.2% | | | |
| HDFC Bank Ltd. sponsored ADR | | 1,446 | 81,771 |
| Ireland - 1.3% | | | |
| Dalata Hotel Group PLC | | 15,478 | 65,673 |
| Kingspan Group PLC (Ireland) | | 314 | 21,091 |
TOTAL IRELAND | | | 86,764 |
| Italy - 1.0% | | | |
| Prysmian SpA | | 1,733 | 64,711 |
| Japan - 18.7% | | | |
| Eisai Co. Ltd. | | 575 | 30,463 |
| FUJIFILM Holdings Corp. | | 1,831 | 100,152 |
| Fujitsu Ltd. | | 573 | 74,231 |
| Hitachi Ltd. | | 2,838 | 179,891 |
| Hoya Corp. | | 1,246 | 119,951 |
| Itochu Corp. | | 5,463 | 196,783 |
| ORIX Corp. | | 10,454 | 190,120 |
| Persol Holdings Co. Ltd. | | 27,131 | 40,681 |
| Sony Group Corp. | | 3,018 | 250,913 |
| TIS, Inc. | | 1,107 | 23,706 |
| Tokyo Electron Ltd. | | 483 | 63,823 |
TOTAL JAPAN | | | 1,270,714 |
| Korea (South) - 0.7% | | | |
| SK Hynix, Inc. | | 537 | 46,565 |
| Netherlands - 9.2% | | | |
| ASML Holding NV (Netherlands) | | 359 | 215,802 |
| BE Semiconductor Industries NV | | 318 | 32,739 |
| Heineken NV (Bearer) | | 571 | 51,301 |
| ING Groep NV (Certificaten Van Aandelen) | | 7,239 | 92,808 |
| Koninklijke KPN NV | | 43,358 | 145,734 |
| Wolters Kluwer NV | | 683 | 87,517 |
TOTAL NETHERLANDS | | | 625,901 |
| New Zealand - 0.8% | | | |
| Contact Energy Ltd. | | 12,683 | 57,612 |
| Norway - 1.9% | | | |
| DNB Bank ASA | | 6,961 | 125,437 |
| Schibsted ASA (A Shares) | | 329 | 6,574 |
TOTAL NORWAY | | | 132,011 |
| Spain - 1.4% | | | |
| CaixaBank SA | | 5,687 | 23,121 |
| EDP Renovaveis SA | | 637 | 10,238 |
| Iberdrola SA | | 5,306 | 59,013 |
TOTAL SPAIN | | | 92,372 |
| Sweden - 2.0% | | | |
| Boliden AB | | 3,445 | 88,189 |
| Instalco AB | | 1,724 | 4,816 |
| Investor AB (B Shares) | | 1,544 | 28,273 |
| Lagercrantz Group AB (B Shares) | | 1,680 | 15,306 |
TOTAL SWEDEN | | | 136,584 |
| Taiwan - 2.2% | | | |
| Taiwan Semiconductor Manufacturing Co. Ltd. | | 9,201 | 150,160 |
| United Kingdom - 13.1% | | | |
| 3i Group PLC | | 1,847 | 43,548 |
| AstraZeneca PLC (United Kingdom) | | 1,968 | 246,401 |
| Barratt Developments PLC | | 5,622 | 28,283 |
| Beazley PLC | | 3,146 | 19,673 |
| Big Yellow Group PLC | | 1,008 | 11,700 |
| Bunzl PLC | | 595 | 21,204 |
| Compass Group PLC | | 4,481 | 112,972 |
| Diageo PLC | | 2,977 | 112,578 |
| Endava PLC ADR (a) | | 250 | 12,540 |
| Grainger Trust PLC | | 10,931 | 30,213 |
| Impax Asset Management Group PLC | | 849 | 3,973 |
| London Stock Exchange Group PLC | | 347 | 35,011 |
| National Grid PLC | | 4,350 | 51,865 |
| Reckitt Benckiser Group PLC | | 856 | 57,272 |
| Renewi PLC (a) | | 1,071 | 7,641 |
| Sage Group PLC | | 4,461 | 52,627 |
| Smart Metering Systems PLC | | 5,274 | 40,962 |
TOTAL UNITED KINGDOM | | | 888,463 |
| United States of America - 6.6% | | | |
| CRH PLC | | 2,402 | 129,072 |
| Ferguson PLC | | 243 | 36,417 |
| Linde PLC | | 236 | 90,190 |
| Nestle SA (Reg. S) | | 1,805 | 194,649 |
TOTAL UNITED STATES OF AMERICA | | | 450,328 |
| TOTAL COMMON STOCKS (Cost $6,677,172) | | | 6,577,967 |
| | | | |
| Money Market Funds - 3.4% |
| | | Shares | Value ($) |
Fidelity Cash Central Fund 5.40% (c) (Cost $226,885) | | 226,840 | 226,885 |
| | | | |
| TOTAL INVESTMENT IN SECURITIES - 100.2% (Cost $6,904,057) | 6,804,852 |
NET OTHER ASSETS (LIABILITIES) - (0.2)% | (11,616) |
| NET ASSETS - 100.0% | 6,793,236 |
| | |
Legend
| (b) | Security exempt from registration under Rule 144A of the Securities Act of 1933. These securities may be resold in transactions exempt from registration, normally to qualified institutional buyers. At the end of the period, the value of these securities amounted to $7,314 or 0.1% of net assets. |
| (c) | Affiliated fund that is generally available only to investment companies and other accounts managed by Fidelity Investments. The rate quoted is the annualized seven-day yield of the fund at period end. A complete unaudited listing of the fund's holdings as of its most recent quarter end is available upon request. In addition, each Fidelity Central Fund's financial statements, which are not covered by the Fund's Report of Independent Registered Public Accounting Firm, are available on the SEC's website or upon request. |
Affiliated Central Funds
Fiscal year to date information regarding the Fund's investments in Fidelity Central Funds, including the ownership percentage, is presented below.
| Affiliate | Value, beginning of period ($) | Purchases ($) | Sales Proceeds ($) | Dividend Income ($) | Realized Gain (loss) ($) | Change in Unrealized appreciation (depreciation) ($) | Value, end of period ($) | % ownership, end of period |
| Fidelity Cash Central Fund 5.40% | 225,629 | 2,952,294 | 2,951,038 | 11,275 | - | - | 226,885 | 0.0% |
| Total | 225,629 | 2,952,294 | 2,951,038 | 11,275 | - | - | 226,885 | |
| | | | | | | | | |
Amounts in the dividend income column in the above table include any capital gain distributions from underlying funds, which are presented in the corresponding line item in the Statement of Operations, if applicable.
Amounts included in the purchases and sales proceeds columns may include in-kind transactions, if applicable.
Investment Valuation
The following is a summary of the inputs used, as of October 31, 2023, involving the Fund's assets and liabilities carried at fair value. The inputs or methodology used for valuing securities may not be an indication of the risk associated with investing in those securities. For more information on valuation inputs, and their aggregation into the levels used below, please refer to the Investment Valuation section in the accompanying Notes to Financial Statements.
| Valuation Inputs at Reporting Date: |
| Description | Total ($) | Level 1 ($) | Level 2 ($) | Level 3 ($) |
Investments in Securities: | | | | |
|
| Equities: | | | | |
Communication Services | 152,308 | 6,574 | 145,734 | - |
Consumer Discretionary | 699,040 | 93,956 | 605,084 | - |
Consumer Staples | 645,730 | 116,441 | 529,289 | - |
Energy | 73,446 | 73,446 | - | - |
Financials | 1,461,304 | 450,914 | 1,010,390 | - |
Health Care | 1,005,149 | 232,560 | 772,589 | - |
Industrials | 899,467 | 332,745 | 566,722 | - |
Information Technology | 888,186 | 113,212 | 774,974 | - |
Materials | 444,457 | 356,725 | 87,732 | - |
Real Estate | 41,913 | 41,913 | - | - |
Utilities | 266,967 | 98,477 | 168,490 | - |
|
| Money Market Funds | 226,885 | 226,885 | - | - |
| Total Investments in Securities: | 6,804,852 | 2,143,848 | 4,661,004 | - |
| Statement of Assets and Liabilities |
| | | | October 31, 2023 |
| | | | | |
| Assets | | | | |
| Investment in securities, at value - See accompanying schedule: | | | | |
Unaffiliated issuers (cost $6,677,172) | $ | 6,577,967 | | |
Fidelity Central Funds (cost $226,885) | | 226,885 | | |
| | | | | |
| | | | | |
| Total Investment in Securities (cost $6,904,057) | | | $ | 6,804,852 |
| Cash | | | | 15,972 |
| Foreign currency held at value (cost $5) | | | | 5 |
| Receivable for fund shares sold | | | | 91 |
| Dividends receivable | | | | 13,971 |
| Reclaims receivable | | | | 9,489 |
| Distributions receivable from Fidelity Central Funds | | | | 1,110 |
| Prepaid expenses | | | | 10 |
| Receivable from investment adviser for expense reductions | | | | 4,965 |
Total assets | | | | 6,850,465 |
| Liabilities | | | | |
| Payable for fund shares redeemed | $ | 1,104 | | |
| Accrued management fee | | 3,571 | | |
| Distribution and service plan fees payable | | 321 | | |
| Other affiliated payables | | 1,664 | | |
| Audit fee payable | | 47,999 | | |
| Other payables and accrued expenses | | 2,570 | | |
| Total Liabilities | | | | 57,229 |
| Net Assets | | | $ | 6,793,236 |
| Net Assets consist of: | | | | |
| Paid in capital | | | $ | 7,361,715 |
| Total accumulated earnings (loss) | | | | (568,479) |
| Net Assets | | | $ | 6,793,236 |
| | | | | |
| Net Asset Value and Maximum Offering Price | | | | |
| Class A : | | | | |
Net Asset Value and redemption price per share ($352,985 ÷ 44,967 shares)(a) | | | $ | 7.85 |
| Maximum offering price per share (100/94.25 of $7.85) | | | $ | 8.33 |
| Class M : | | | | |
Net Asset Value and redemption price per share ($196,169 ÷ 25,049 shares)(a) | | | $ | 7.83 |
| Maximum offering price per share (100/96.50 of $7.83) | | | $ | 8.11 |
| Class C : | | | | |
Net Asset Value and offering price per share ($194,412 ÷ 25,000 shares)(a) | | | $ | 7.78 |
| Fidelity Sustainable International Equity Fund : | | | | |
Net Asset Value, offering price and redemption price per share ($5,562,733 ÷ 706,702 shares) | | | $ | 7.87 |
| Class I : | | | | |
Net Asset Value, offering price and redemption price per share ($199,451 ÷ 25,340 shares) | | | $ | 7.87 |
| Class Z : | | | | |
Net Asset Value, offering price and redemption price per share ($287,486 ÷ 36,435 shares) | | | $ | 7.89 |
(a)Redemption price per share is equal to net asset value less any applicable contingent deferred sales charge. |
| Statement of Operations |
| | | | Year ended October 31, 2023 |
| Investment Income | | | | |
| Dividends | | | $ | 187,401 |
| Income from Fidelity Central Funds | | | | 11,275 |
| Income before foreign taxes withheld | | | $ | 198,676 |
| Less foreign taxes withheld | | | | (24,250) |
| Total Income | | | | 174,426 |
| Expenses | | | | |
| Management fee | | | | |
| Basic fee | $ | 46,660 | | |
| Performance adjustment | | (2,969) | | |
| Transfer agent fees | | 15,043 | | |
| Distribution and service plan fees | | 4,002 | | |
| Accounting fees and expenses | | 3,444 | | |
| Custodian fees and expenses | | 13,736 | | |
| Independent trustees' fees and expenses | | 33 | | |
| Registration fees | | 106,699 | | |
| Audit | | 74,007 | | |
| Legal | | 6 | | |
| Miscellaneous | | 22 | | |
| Total expenses before reductions | | 260,683 | | |
| Expense reductions | | (185,187) | | |
| Total expenses after reductions | | | | 75,496 |
| Net Investment income (loss) | | | | 98,930 |
| Realized and Unrealized Gain (Loss) | | | | |
| Net realized gain (loss) on: | | | | |
| Investment Securities: | | | | |
| Unaffiliated issuers | | (273,821) | | |
| Foreign currency transactions | | 634 | | |
| Total net realized gain (loss) | | | | (273,187) |
| Change in net unrealized appreciation (depreciation) on: | | | | |
| Investment Securities: | | | | |
| Unaffiliated issuers | | 561,747 | | |
| Assets and liabilities in foreign currencies | | (218) | | |
| Total change in net unrealized appreciation (depreciation) | | | | 561,529 |
| Net gain (loss) | | | | 288,342 |
| Net increase (decrease) in net assets resulting from operations | | | $ | 387,272 |
| Statement of Changes in Net Assets |
| |
| | Year ended October 31, 2023 | | For the period February 10, 2022 (commencement of operations) through October 31, 2022 |
| Increase (Decrease) in Net Assets | | | | |
| Operations | | | | |
| Net investment income (loss) | $ | 98,930 | $ | 29,662 |
| Net realized gain (loss) | | (273,187) | | (295,162) |
| Change in net unrealized appreciation (depreciation) | | 561,529 | | (661,097) |
| Net increase (decrease) in net assets resulting from operations | | 387,272 | | (926,597) |
| Distributions to shareholders | | (29,290) | | - |
| | | | | |
| Share transactions - net increase (decrease) | | 1,623,323 | | 5,738,528 |
| Total increase (decrease) in net assets | | 1,981,305 | | 4,811,931 |
| | | | | |
| Net Assets | | | | |
| Beginning of period | | 4,811,931 | | - |
| End of period | $ | 6,793,236 | $ | 4,811,931 |
| | | | | |
| | | | | |
Financial Highlights
| Fidelity Advisor® Sustainable International Equity Fund Class A |
| |
| Years ended October 31, | | 2023 | | 2022 A |
Selected Per-Share Data | | | | |
| Net asset value, beginning of period | $ | 7.20 | $ | 10.00 |
| Income from Investment Operations | | | | |
Net investment income (loss) B,C | | .10 | | .07 |
| Net realized and unrealized gain (loss) | | .58 | | (2.87) |
| Total from investment operations | | .68 | | (2.80) |
| Distributions from net investment income | | (.03) | | - |
| Total distributions | | (.03) | | - |
| Net asset value, end of period | $ | 7.85 | $ | 7.20 |
Total Return D,E,F | | 9.43% | | (28.00)% |
Ratios to Average Net Assets C,G,H | | | | |
| Expenses before reductions | | 3.91% | | 7.77% I,J |
| Expenses net of fee waivers, if any | | 1.29% | | 1.30% I |
| Expenses net of all reductions | | 1.29% | | 1.28% I |
| Net investment income (loss) | | 1.23% | | 1.18% I |
| Supplemental Data | | | | |
| Net assets, end of period (000 omitted) | $ | 353 | $ | 185 |
Portfolio turnover rate K | | 36% | | 43% I |
AFor the period February 10, 2022 (commencement of operations) through October 31, 2022
BCalculated based on average shares outstanding during the period.
CNet investment income (loss) is affected by the timing of the declaration of dividends by any underlying mutual funds or exchange-traded funds (ETFs). Net investment income (loss) of any mutual funds or ETFs is not included in the Fund's net investment income (loss) ratio.
DTotal returns for periods of less than one year are not annualized.
ETotal returns would have been lower if certain expenses had not been reduced during the applicable periods shown.
FTotal returns do not include the effect of the sales charges.
GFees and expenses of any underlying mutual funds or exchange-traded funds (ETFs) are not included in the Fund's expense ratio. The Fund indirectly bears its proportionate share of these expenses. For additional expense information related to investments in Fidelity Central Funds, please refer to the "Investments in Fidelity Central Funds" note found in the Notes to Financial Statements section of the most recent Annual or Semi-Annual report.
HExpense ratios reflect operating expenses of the class. Expenses before reductions do not reflect amounts reimbursed, waived, or reduced through arrangements with the investment adviser, brokerage services, or other offset arrangements, if applicable, and do not represent the amount paid by the class during periods when reimbursements, waivers or reductions occur.
IAnnualized.
JAudit fees are not annualized.
KAmount does not include the portfolio activity of any underlying mutual funds or exchange-traded funds (ETFs).
| Fidelity Advisor® Sustainable International Equity Fund Class M |
| |
| Years ended October 31, | | 2023 | | 2022 A |
Selected Per-Share Data | | | | |
| Net asset value, beginning of period | $ | 7.19 | $ | 10.00 |
| Income from Investment Operations | | | | |
Net investment income (loss) B,C | | .08 | | .05 |
| Net realized and unrealized gain (loss) | | .57 | | (2.86) |
| Total from investment operations | | .65 | | (2.81) |
| Distributions from net investment income | | (.01) | | - |
| Total distributions | | (.01) | | - |
| Net asset value, end of period | $ | 7.83 | $ | 7.19 |
Total Return D,E,F | | 9.08% | | (28.10)% |
Ratios to Average Net Assets C,G,H | | | | |
| Expenses before reductions | | 4.24% | | 8.02% I,J |
| Expenses net of fee waivers, if any | | 1.55% | | 1.55% I |
| Expenses net of all reductions | | 1.54% | | 1.55% I |
| Net investment income (loss) | | .98% | | .91% I |
| Supplemental Data | | | | |
| Net assets, end of period (000 omitted) | $ | 196 | $ | 180 |
Portfolio turnover rate K | | 36% | | 43% I |
AFor the period February 10, 2022 (commencement of operations) through October 31, 2022
BCalculated based on average shares outstanding during the period.
CNet investment income (loss) is affected by the timing of the declaration of dividends by any underlying mutual funds or exchange-traded funds (ETFs). Net investment income (loss) of any mutual funds or ETFs is not included in the Fund's net investment income (loss) ratio.
DTotal returns for periods of less than one year are not annualized.
ETotal returns would have been lower if certain expenses had not been reduced during the applicable periods shown.
FTotal returns do not include the effect of the sales charges.
GFees and expenses of any underlying mutual funds or exchange-traded funds (ETFs) are not included in the Fund's expense ratio. The Fund indirectly bears its proportionate share of these expenses. For additional expense information related to investments in Fidelity Central Funds, please refer to the "Investments in Fidelity Central Funds" note found in the Notes to Financial Statements section of the most recent Annual or Semi-Annual report.
HExpense ratios reflect operating expenses of the class. Expenses before reductions do not reflect amounts reimbursed, waived, or reduced through arrangements with the investment adviser, brokerage services, or other offset arrangements, if applicable, and do not represent the amount paid by the class during periods when reimbursements, waivers or reductions occur.
IAnnualized.
JAudit fees are not annualized.
KAmount does not include the portfolio activity of any underlying mutual funds or exchange-traded funds (ETFs).
| Fidelity Advisor® Sustainable International Equity Fund Class C |
| |
| Years ended October 31, | | 2023 | | 2022 A |
Selected Per-Share Data | | | | |
| Net asset value, beginning of period | $ | 7.16 | $ | 10.00 |
| Income from Investment Operations | | | | |
Net investment income (loss) B,C | | .04 | | .02 |
| Net realized and unrealized gain (loss) | | .58 | | (2.86) |
| Total from investment operations | | .62 | | (2.84) |
| Net asset value, end of period | $ | 7.78 | $ | 7.16 |
Total Return D,E,F | | 8.66% | | (28.40)% |
Ratios to Average Net Assets C,G,H | | | | |
| Expenses before reductions | | 4.73% | | 8.51% I,J |
| Expenses net of fee waivers, if any | | 2.04% | | 2.05% J |
| Expenses net of all reductions | | 2.04% | | 2.05% J |
| Net investment income (loss) | | .48% | | .41% J |
| Supplemental Data | | | | |
| Net assets, end of period (000 omitted) | $ | 194 | $ | 179 |
Portfolio turnover rate K | | 36% | | 43% J |
AFor the period February 10, 2022 (commencement of operations) through October 31, 2022
BCalculated based on average shares outstanding during the period.
CNet investment income (loss) is affected by the timing of the declaration of dividends by any underlying mutual funds or exchange-traded funds (ETFs). Net investment income (loss) of any mutual funds or ETFs is not included in the Fund's net investment income (loss) ratio.
DTotal returns for periods of less than one year are not annualized.
ETotal returns would have been lower if certain expenses had not been reduced during the applicable periods shown.
FTotal returns do not include the effect of the contingent deferred sales charge.
GFees and expenses of any underlying mutual funds or exchange-traded funds (ETFs) are not included in the Fund's expense ratio. The Fund indirectly bears its proportionate share of these expenses. For additional expense information related to investments in Fidelity Central Funds, please refer to the "Investments in Fidelity Central Funds" note found in the Notes to Financial Statements section of the most recent Annual or Semi-Annual report.
HExpense ratios reflect operating expenses of the class. Expenses before reductions do not reflect amounts reimbursed, waived, or reduced through arrangements with the investment adviser, brokerage services, or other offset arrangements, if applicable, and do not represent the amount paid by the class during periods when reimbursements, waivers or reductions occur.
IAudit fees are not annualized.
JAnnualized.
KAmount does not include the portfolio activity of any underlying mutual funds or exchange-traded funds (ETFs).
| Fidelity® Sustainable International Equity Fund |
| |
| Years ended October 31, | | 2023 | | 2022 A |
Selected Per-Share Data | | | | |
| Net asset value, beginning of period | $ | 7.21 | $ | 10.00 |
| Income from Investment Operations | | | | |
Net investment income (loss) B,C | | .12 | | .08 |
| Net realized and unrealized gain (loss) | | .58 | | (2.87) |
| Total from investment operations | | .70 | | (2.79) |
| Distributions from net investment income | | (.04) | | - |
| Total distributions | | (.04) | | - |
| Net asset value, end of period | $ | 7.87 | $ | 7.21 |
Total Return D,E | | 9.73% | | (27.90)% |
Ratios to Average Net Assets C,F,G | | | | |
| Expenses before reductions | | 3.72% | | 7.64% H,I |
| Expenses net of fee waivers, if any | | 1.04% | | 1.05% I |
| Expenses net of all reductions | | 1.04% | | 1.01% I |
| Net investment income (loss) | | 1.48% | | 1.45% I |
| Supplemental Data | | | | |
| Net assets, end of period (000 omitted) | $ | 5,563 | $ | 3,908 |
Portfolio turnover rate J | | 36% | | 43% I |
AFor the period February 10, 2022 (commencement of operations) through October 31, 2022
BCalculated based on average shares outstanding during the period.
CNet investment income (loss) is affected by the timing of the declaration of dividends by any underlying mutual funds or exchange-traded funds (ETFs). Net investment income (loss) of any mutual funds or ETFs is not included in the Fund's net investment income (loss) ratio.
DTotal returns for periods of less than one year are not annualized.
ETotal returns would have been lower if certain expenses had not been reduced during the applicable periods shown.
FFees and expenses of any underlying mutual funds or exchange-traded funds (ETFs) are not included in the Fund's expense ratio. The Fund indirectly bears its proportionate share of these expenses. For additional expense information related to investments in Fidelity Central Funds, please refer to the "Investments in Fidelity Central Funds" note found in the Notes to Financial Statements section of the most recent Annual or Semi-Annual report.
GExpense ratios reflect operating expenses of the class. Expenses before reductions do not reflect amounts reimbursed, waived, or reduced through arrangements with the investment adviser, brokerage services, or other offset arrangements, if applicable, and do not represent the amount paid by the class during periods when reimbursements, waivers or reductions occur.
HAudit fees are not annualized.
IAnnualized.
JAmount does not include the portfolio activity of any underlying mutual funds or exchange-traded funds (ETFs).
| Fidelity Advisor® Sustainable International Equity Fund Class I |
| |
| Years ended October 31, | | 2023 | | 2022 A |
Selected Per-Share Data | | | | |
| Net asset value, beginning of period | $ | 7.21 | $ | 10.00 |
| Income from Investment Operations | | | | |
Net investment income (loss) B,C | | .12 | | .08 |
| Net realized and unrealized gain (loss) | | .58 | | (2.87) |
| Total from investment operations | | .70 | | (2.79) |
| Distributions from net investment income | | (.04) | | - |
| Total distributions | | (.04) | | - |
| Net asset value, end of period | $ | 7.87 | $ | 7.21 |
Total Return D,E | | 9.73% | | (27.90)% |
Ratios to Average Net Assets C,F,G | | | | |
| Expenses before reductions | | 3.74% | | 7.52% H,I |
| Expenses net of fee waivers, if any | | 1.04% | | 1.05% H |
| Expenses net of all reductions | | 1.04% | | 1.03% H |
| Net investment income (loss) | | 1.48% | | 1.43% H |
| Supplemental Data | | | | |
| Net assets, end of period (000 omitted) | $ | 199 | $ | 180 |
Portfolio turnover rate J | | 36% | | 43% H |
AFor the period February 10, 2022 (commencement of operations) through October 31, 2022
BCalculated based on average shares outstanding during the period.
CNet investment income (loss) is affected by the timing of the declaration of dividends by any underlying mutual funds or exchange-traded funds (ETFs). Net investment income (loss) of any mutual funds or ETFs is not included in the Fund's net investment income (loss) ratio.
DTotal returns for periods of less than one year are not annualized.
ETotal returns would have been lower if certain expenses had not been reduced during the applicable periods shown.
FFees and expenses of any underlying mutual funds or exchange-traded funds (ETFs) are not included in the Fund's expense ratio. The Fund indirectly bears its proportionate share of these expenses. For additional expense information related to investments in Fidelity Central Funds, please refer to the "Investments in Fidelity Central Funds" note found in the Notes to Financial Statements section of the most recent Annual or Semi-Annual report.
GExpense ratios reflect operating expenses of the class. Expenses before reductions do not reflect amounts reimbursed, waived, or reduced through arrangements with the investment adviser, brokerage services, or other offset arrangements, if applicable, and do not represent the amount paid by the class during periods when reimbursements, waivers or reductions occur.
HAnnualized.
IAudit fees are not annualized.
JAmount does not include the portfolio activity of any underlying mutual funds or exchange-traded funds (ETFs).
| Fidelity Advisor® Sustainable International Equity Fund Class Z |
| |
| Years ended October 31, | | 2023 | | 2022 A |
Selected Per-Share Data | | | | |
| Net asset value, beginning of period | $ | 7.22 | $ | 10.00 |
| Income from Investment Operations | | | | |
Net investment income (loss) B,C | | .14 | | .09 |
| Net realized and unrealized gain (loss) | | .57 | | (2.87) |
| Total from investment operations | | .71 | | (2.78) |
| Distributions from net investment income | | (.04) | | - |
| Total distributions | | (.04) | | - |
| Net asset value, end of period | $ | 7.89 | $ | 7.22 |
Total Return D,E | | 9.86% | | (27.80)% |
Ratios to Average Net Assets C,F,G | | | | |
| Expenses before reductions | | 3.56% | | 7.46% H,I |
| Expenses net of fee waivers, if any | | .89% | | .90% I |
| Expenses net of all reductions | | .89% | | .90% I |
| Net investment income (loss) | | 1.63% | | 1.56% I |
| Supplemental Data | | | | |
| Net assets, end of period (000 omitted) | $ | 287 | $ | 181 |
Portfolio turnover rate J | | 36% | | 43% I |
AFor the period February 10, 2022 (commencement of operations) through October 31, 2022
BCalculated based on average shares outstanding during the period.
CNet investment income (loss) is affected by the timing of the declaration of dividends by any underlying mutual funds or exchange-traded funds (ETFs). Net investment income (loss) of any mutual funds or ETFs is not included in the Fund's net investment income (loss) ratio.
DTotal returns for periods of less than one year are not annualized.
ETotal returns would have been lower if certain expenses had not been reduced during the applicable periods shown.
FFees and expenses of any underlying mutual funds or exchange-traded funds (ETFs) are not included in the Fund's expense ratio. The Fund indirectly bears its proportionate share of these expenses. For additional expense information related to investments in Fidelity Central Funds, please refer to the "Investments in Fidelity Central Funds" note found in the Notes to Financial Statements section of the most recent Annual or Semi-Annual report.
GExpense ratios reflect operating expenses of the class. Expenses before reductions do not reflect amounts reimbursed, waived, or reduced through arrangements with the investment adviser, brokerage services, or other offset arrangements, if applicable, and do not represent the amount paid by the class during periods when reimbursements, waivers or reductions occur.
HAudit fees are not annualized.
IAnnualized.
JAmount does not include the portfolio activity of any underlying mutual funds or exchange-traded funds (ETFs).
For the period ended October 31, 2023
1. Organization.
Fidelity Sustainable International Equity Fund (the Fund) is a fund of Fidelity Investment Trust (the Trust) and is authorized to issue an unlimited number of shares. The Trust is registered under the Investment Company Act of 1940, as amended (the 1940 Act), as an open-end management investment company organized as a Massachusetts business trust. The Fund offers Class A, Class M, Class C, Fidelity Sustainable International Equity Fund, Class I and Class Z shares, each of which has equal rights as to assets and voting privileges. Class A, Class M, Class C, Class I and Class Z are Fidelity Advisor classes. Each class has exclusive voting rights with respect to matters that affect that class. Class C shares will automatically convert to Class A shares after a holding period of eight years from the initial date of purchase, with certain exceptions.
2. Investments in Fidelity Central Funds.
Funds may invest in Fidelity Central Funds, which are open-end investment companies generally available only to other investment companies and accounts managed by the investment adviser and its affiliates. The Schedule of Investments lists any Fidelity Central Funds held as an investment as of period end, but does not include the underlying holdings of each Fidelity Central Fund. An investing fund indirectly bears its proportionate share of the expenses of the underlying Fidelity Central Funds.
Based on its investment objective, each Fidelity Central Fund may invest or participate in various investment vehicles or strategies that are similar to those of the investing fund. These strategies are consistent with the investment objectives of the investing fund and may involve certain economic risks which may cause a decline in value of each of the Fidelity Central Funds and thus a decline in the value of the investing fund.
| Fidelity Central Fund | Investment Manager | Investment Objective | Investment Practices | Expense RatioA |
| Fidelity Money Market Central Funds | Fidelity Management & Research Company LLC (FMR) | Each fund seeks to obtain a high level of current income consistent with the preservation of capital and liquidity. | Short-term Investments | Less than .005% |
A Expenses expressed as a percentage of average net assets and are as of each underlying Central Fund's most recent annual or semi-annual shareholder report.
A complete unaudited list of holdings for each Fidelity Central Fund is available upon request or at the Securities and Exchange Commission website at www.sec.gov. In addition, the financial statements of the Fidelity Central Funds which contain the significant accounting policies (including investment valuation policies) of those funds, and are not covered by the Report of Independent Registered Public Accounting Firm, are available on the Securities and Exchange Commission website or upon request.
3. Significant Accounting Policies.
The Fund is an investment company and applies the accounting and reporting guidance of the Financial Accounting Standards Board (FASB) Accounting Standards Codification Topic 946 Financial Services - Investment Companies. The financial statements have been prepared in conformity with accounting principles generally accepted in the United States of America (GAAP), which require management to make certain estimates and assumptions at the date of the financial statements. Actual results could differ from those estimates. Subsequent events, if any, through the date that the financial statements were issued have been evaluated in the preparation of the financial statements. The Fund's Schedule of Investments lists any underlying mutual funds or exchange-traded funds (ETFs) but does not include the underlying holdings of these funds. The following summarizes the significant accounting policies of the Fund:
Investment Valuation. Investments are valued as of 4:00 p.m. Eastern time on the last calendar day of the period. The Board of Trustees (the Board) has designated the Fund's investment adviser as the valuation designee responsible for the fair valuation function and performing fair value determinations as needed. The investment adviser has established a Fair Value Committee (the Committee) to carry out the day-to-day fair valuation responsibilities and has adopted policies and procedures to govern the fair valuation process and the activities of the Committee. In accordance with these fair valuation policies and procedures, which have been approved by the Board, the Fund attempts to obtain prices from one or more third party pricing services or brokers to value its investments. When current market prices, quotations or currency exchange rates are not readily available or reliable, investments will be fair valued in good faith by the Committee, in accordance with the policies and procedures. Factors used in determining fair value vary by investment type and may include market or investment specific events, transaction data, estimated cash flows, and market observations of comparable investments. The frequency that the fair valuation procedures are used cannot be predicted and they may be utilized to a significant extent. The Committee manages the Fund's fair valuation practices and maintains the fair valuation policies and procedures. The Fund's investment adviser reports to the Board information regarding the fair valuation process and related material matters.
The Fund categorizes the inputs to valuation techniques used to value its investments into a disclosure hierarchy consisting of three levels as shown below:
Level 1 - unadjusted quoted prices in active markets for identical investments
Level 2 - other significant observable inputs (including quoted prices for similar investments, interest rates, prepayment speeds, etc.)
Level 3 - unobservable inputs (including the Fund's own assumptions based on the best information available)
Valuation techniques used to value the Fund's investments by major category are as follows:
Equity securities, including restricted securities, for which market quotations are readily available, are valued at the last reported sale price or official closing price as reported by a third party pricing service on the primary market or exchange on which they are traded and are categorized as Level 1 in the hierarchy. In the event there were no sales during the day or closing prices are not available, securities are valued at the last quoted bid price or may be valued using the last available price and are generally categorized as Level 2 in the hierarchy. For foreign equity securities, when market or security specific events arise, comparisons to the valuation of American Depositary Receipts (ADRs), futures contracts, ETFs and certain indexes as well as quoted prices for similar securities may be used and would be categorized as Level 2 in the hierarchy. For equity securities, including restricted securities, where observable inputs are limited, assumptions about market activity and risk are used and these securities may be categorized as Level 3 in the hierarchy.
Investments in open-end mutual funds, including the Fidelity Central Funds, are valued at their closing net asset value (NAV) each business day and are categorized as Level 1 in the hierarchy.
Changes in valuation techniques may result in transfers in or out of an assigned level within the disclosure hierarchy. The aggregate value of investments by input level as of October 31, 2023 is included at the end of the Fund's Schedule of Investments.
Foreign Currency. Certain Funds may use foreign currency contracts to facilitate transactions in foreign-denominated securities. Gains and losses from these transactions may arise from changes in the value of the foreign currency or if the counterparties do not perform under the contracts' terms.
Foreign-denominated assets, including investment securities, and liabilities are translated into U.S. dollars at the exchange rates at period end. Purchases and sales of investment securities, income and dividends received, and expenses denominated in foreign currencies are translated into U.S. dollars at the exchange rate in effect on the transaction date.
The effects of exchange rate fluctuations on investments are included with the net realized and unrealized gain (loss) on investment securities. Other foreign currency transactions resulting in realized and unrealized gain (loss) are disclosed separately.
Investment Transactions and Income. For financial reporting purposes, the Fund's investment holdings and NAV include trades executed through the end of the last business day of the period. The NAV per share for processing shareholder transactions is calculated as of the close of business of the New York Stock Exchange (NYSE), normally 4:00 p.m. Eastern time and includes trades executed through the end of the prior business day. Gains and losses on securities sold are determined on the basis of identified cost. Commissions paid to certain brokers with whom the investment adviser, or its affiliates, places trades on behalf of a fund include an amount in addition to trade execution, which may be rebated back to a fund. Any such rebates are included in net realized gain (loss) on investments in the Statement of Operations. Dividend income is recorded on the ex-dividend date, except for certain dividends from foreign securities where the ex-dividend date may have passed, which are recorded as soon as the Fund is informed of the ex-dividend date. Non-cash dividends included in dividend income, if any, are recorded at the fair market value of the securities received. Income and capital gain distributions from Fidelity Central Funds, if any, are recorded on the ex-dividend date. Investment income is recorded net of foreign taxes withheld where recovery of such taxes is uncertain. Funds may file withholding tax reclaims in certain jurisdictions to recover a portion of amounts previously withheld. Any withholding tax reclaims income is included in the Statement of Operations in foreign taxes withheld. Any receivables for withholding tax reclaims are included in the Statement of Assets and Liabilities in reclaims receivable.
Class Allocations and Expenses. Investment income, realized and unrealized capital gains and losses, common expenses of a fund, and certain fund-level expense reductions, if any, are allocated daily on a pro-rata basis to each class based on the relative net assets of each class to the total net assets of a fund. Each class differs with respect to transfer agent and distribution and service plan fees incurred, as applicable. Certain expense reductions may also differ by class, if applicable. For the reporting period, the allocated portion of income and expenses to each class as a percent of its average net assets may vary due to the timing of recording these transactions in relation to fluctuating net assets of the classes. Expenses directly attributable to a fund are charged to that fund. Expenses attributable to more than one fund are allocated among the respective funds on the basis of relative net assets or other appropriate methods. Expenses included in the accompanying financial statements reflect the expenses of that fund and do not include any expenses associated with any underlying mutual funds or exchange-traded funds (ETFs). Although not included in a fund's expenses, a fund indirectly bears its proportionate share of these expenses through the net asset value of each underlying mutual fund or exchange-traded fund (ETF). Expense estimates are accrued in the period to which they relate and adjustments are made when actual amounts are known.
Income Tax Information and Distributions to Shareholders. Each year, the Fund intends to qualify as a regulated investment company under Subchapter M of the Internal Revenue Code, including distributing substantially all of its taxable income and realized gains. As a result, no provision for U.S. Federal income taxes is required. As of October 31, 2023, the Fund did not have any unrecognized tax benefits in the financial statements; nor is the Fund aware of any tax positions for which it is reasonably possible that the total amounts of unrecognized tax benefits will significantly change in the next twelve months. The Fund files a U.S. federal tax return, in addition to state and local tax returns as required. The Fund's federal income tax returns are subject to examination by the Internal Revenue Service (IRS) for a period of three fiscal years after they are filed. State and local tax returns may be subject to examination for an additional fiscal year depending on the jurisdiction. Foreign taxes are provided for based on the Fund's understanding of the tax rules and rates that exist in the foreign markets in which it invests.
Distributions are declared and recorded on the ex-dividend date. Income and capital gain distributions are declared separately for each class. Income and capital gain distributions are determined in accordance with income tax regulations, which may differ from GAAP.
Capital accounts within the financial statements are adjusted for permanent book-tax differences. These adjustments have no impact on net assets or the results of operations. Capital accounts are not adjusted for temporary book-tax differences which will reverse in a subsequent period.
Book-tax differences are primarily due to foreign currency transactions, passive foreign investment companies (PFIC), capital loss carryforwards and losses deferred due to wash sales.
As of period end, the cost and unrealized appreciation (depreciation) in securities, and derivatives if applicable, for federal income tax purposes were as follows:
| Gross unrealized appreciation | $442,343 |
| Gross unrealized depreciation | (626,301) |
| Net unrealized appreciation (depreciation) | $(183,958) |
| Tax Cost | $6,988,810 |
The tax-based components of distributable earnings as of period end were as follows:
| Undistributed ordinary income | $115,892 |
| Capital loss carryforward | $(500,051) |
| Net unrealized appreciation (depreciation) on securities and other investments | $(184,321) |
Capital loss carryforwards are only available to offset future capital gains of the Fund to the extent provided by regulations and may be limited. The capital loss carryforward information presented below, including any applicable limitation, is estimated as of fiscal period end and is subject to adjustment.
| Short-term | $(377,972) |
| Long-term | $(122,079) |
| Total capital loss carryforward | $(500,051) |
Due to large subscriptions in a prior period, approximately $219,163 of the Fund's realized capital losses are subject to limitation. Due to this limitation, the Fund will only be permitted to use approximately $74,614 of those capital losses per year to offset capital gains. Additionally, the Fund is subject to an annual limit on its use of some of its unrealized capital losses to offset capital gains in future periods. If those losses are realized and the limitation prevents the Fund from using any of those losses in a future period, those capital losses will be available to offset capital gains in subsequent periods.
The tax character of distributions paid was as follows:
| | October 31, 2023 | October 31, 2022 A |
| Ordinary Income | $29,290 | - |
A For the period February 10,2022 (commencement of operations) through October 31,2023.
Restricted Securities (including Private Placements). Funds may invest in securities that are subject to legal or contractual restrictions on resale. These securities generally may be resold in transactions exempt from registration or to the public if the securities are registered. Disposal of these securities may involve time-consuming negotiations and expense, and prompt sale at an acceptable price may be difficult. Information regarding restricted securities held at period end is included at the end of the Schedule of Investments, if applicable.
4. Purchases and Sales of Investments.
Purchases and sales of securities, other than short-term securities and in-kind transactions, as applicable, are noted in the table below.
| | Purchases ($) | Sales ($) |
| Fidelity Sustainable International Equity Fund | 4,043,966 | 2,394,095 |
5. Fees and Other Transactions with Affiliates.
Management Fee. Fidelity Management & Research Company LLC (the investment adviser) and its affiliates provide the Fund with investment management related services for which the Fund pays a monthly management fee. The management fee is the sum of an individual fund fee rate that is based on an annual rate of .45% of the Fund's average net assets and an annualized group fee rate that averaged .23% during the period. The group fee rate is based upon the monthly average net assets of a group of registered investment companies with which the investment adviser has management contracts. The group fee rate decreases as assets under management increase and increases as assets under management decrease. In addition, the management fee is subject to a performance adjustment (up to a maximum of +/- .10% of the Fund's average net assets over a 36 month performance period). The upward or downward adjustment to the management fee is based on the relative investment performance of Fidelity Sustainable International Equity Fund as compared to its benchmark index, the MSCI EAFE Index, over the same 36 month performance period. The Fund's performance adjustment took effect in October,2022. Subsequent months will be added until the performance period includes 36 months. For the reporting period, the total annual management fee rate, including the performance adjustment, was .63% of the Fund's average net assets. The performance adjustment included in the management fee rate may be higher or lower than the maximum performance adjustment rate due to the difference between the average net assets for the reporting and performance periods.
Distribution and Service Plan Fees. In accordance with Rule 12b-1 of the 1940 Act, the Fund has adopted separate Distribution and Service Plans for each class of shares. Certain classes pay Fidelity Distributors Company LLC (FDC), an affiliate of the investment adviser, separate Distribution and Service Fees, each of which is based on an annual percentage of each class' average net assets. In addition, FDC may pay financial intermediaries for selling shares of the Fund and providing shareholder support services. For the period, the Distribution and Service Fee rates, total fees and amounts retained by FDC were as follows:
| | Distribution Fee | Service Fee | Total Fees | Retained by FDC |
| Class A | - % | .25% | $881 | $525 |
| Class M | .25% | .25% | 1,044 | 1,044 |
| Class C | .75% | .25% | 2,077 | 2,077 |
| | | | $4,002 | $3,646 |
Sales Load. FDC may receive a front-end sales charge of up to 5.75% for selling Class A shares and 3.50% for selling Class M shares, some of which is paid to financial intermediaries for selling shares of the Fund. Depending on the holding period, FDC may receive contingent deferred sales charges levied on Class A, Class M and Class C redemptions. The deferred sales charges are 1.00% for Class C shares, 1.00% for certain purchases of Class A shares and .25% for certain purchases of Class M shares. For the period, there were no sales charge amount retained by FDC
Transfer Agent Fees. Fidelity Investments Institutional Operations Company LLC (FIIOC), an affiliate of the investment adviser, is the transfer, dividend disbursing and shareholder servicing agent for each class of the Fund. FIIOC receives account fees and asset-based fees that vary according to the account size and type of account of the shareholders of the respective classes of the Fund, except for Class Z. FIIOC receives an asset-based fee of Class Z's average net assets. FIIOC pays for typesetting, printing and mailing of shareholder reports, except proxy statements.
For the period, transfer agent fees for each class were as follows:
| | Amount | % of Class-Level Average Net AssetsA |
| Class A | $587 | .17 |
| Class M | 228 | .11 |
| Class C | 200 | .10 |
| Fidelity Sustainable International Equity Fund | 13,679 | .24 |
| Class I | 253 | .12 |
| Class Z | 96 | .04 |
| | $15,043 | |
During November 2023, the Board approved a change in the transfer agent fees effective December 1, 2023 to a fixed annual rate of class-level average net assets as follows:
| | % of Class-Level Average Net Assets |
| Class A | 0.1367% |
| Class M | 0.1048% |
| Class C | 0.0960% |
| Fidelity Sustainable International Equity Fund | 0.2000% |
| Class I | 0.1047% |
Accounting Fees. Fidelity Service Company, Inc. (FSC), an affiliate of the investment adviser, maintains the Fund's accounting records. The accounting fee is based on the level of average net assets for each month. For the period, the fees were equivalent to the following annual rates:
| | % of Average Net Assets |
| Fidelity Sustainable International Equity Fund | .05 |
During November 2023, the Board approved a change in the accounting fees effective December 1, 2023 to a fixed annual rate of average net assets as follows:
| | % of Average Net Assets |
| Fidelity Sustainable International Equity Fund | 0.0498% |
Interfund Trades. Funds may purchase from or sell securities to other Fidelity Funds under procedures adopted by the Board. The procedures have been designed to ensure these interfund trades are executed in accordance with Rule 17a-7 of the 1940 Act. Any interfund trades are included within the respective purchases and sales amounts shown in the Purchases and Sales of Investments note. Interfund trades during the period are noted in the table below.
| | Purchases ($) | Sales ($) | Realized Gain (Loss) ($) |
| Fidelity Sustainable International Equity Fund | 143,021 | 162,571 | (18,972) |
6. Committed Line of Credit.
Certain Funds participate with other funds managed by the investment adviser or an affiliate in a $4.25 billion credit facility (the "line of credit") to be utilized for temporary or emergency purposes to fund shareholder redemptions or for other short-term liquidity purposes. The participating funds have agreed to pay commitment fees on their pro-rata portion of the line of credit, which are reflected in Miscellaneous expenses on the Statement of Operations, and are listed below. During the period, there were no borrowings on this line of credit.
| | Amount |
| Fidelity Sustainable International Equity Fund | $12 |
7. Expense Reductions.
The investment adviser contractually agreed to reimburse expenses of each class to the extent annual operating expenses exceeded certain levels of class-level average net assets as noted in the table below. This reimbursement will remain in place through February 28, 2025. Some expenses, for example the compensation of the independent Trustees, and certain miscellaneous expenses such as proxy and shareholder meeting expenses, are excluded from this reimbursement.
The following classes were in reimbursement during the period:
| | Expense Limitations | Reimbursement |
| Class A | 1.30% | $9,194 |
| Class M | 1.55% | 5,621 |
| Class C | 2.05% | 5,567 |
| Fidelity Sustainable International Equity Fund | 1.05% | 152,236 |
| Class I | 1.05% | 5,682 |
| Class Z | .90% | 6,085 |
| | | $184,385 |
Through arrangements with the Fund's custodian, credits realized as a result of certain uninvested cash balances were used to reduce the Fund's expenses. During the period, custodian credits reduced the Fund's expenses by $379.
In addition, during the period the investment adviser or an affiliate reimbursed and/or waived a portion of fund-level operating expenses in the amount of $423.
8. Distributions to Shareholders.
Distributions to shareholders of each class were as follows:
| | Year ended October 31, 2023 | Year ended October 31, 2022A |
| Fidelity Sustainable International Equity Fund | | |
| Distributions to shareholders | | |
| Class A | $863 | $- |
| Class M | 325 | - |
| Fidelity Sustainable International Equity Fund | 25,952 | - |
| Class I | 1,075 | - |
| Class Z | 1,075 | - |
Total | $29,290 | $- |
A For the period February 10,2022 (commencement of operations) through October 31,2022.
9. Share Transactions.
Share transactions for each class were as follows and may contain in-kind transactions, automatic conversions between classes or exchanges between affiliated funds:
| | Shares | Shares | Dollars | Dollars |
| | Year ended October 31, 2023 | Year ended October 31, 2022 A | Year ended October 31, 2023 | Year ended October 31, 2022 A |
| Fidelity Sustainable International Equity Fund | | | | |
| Class A | | | | |
| Shares sold | 19,860 | 25,690 | $158,247 | $255,541 |
| Reinvestment of distributions | 107 | - | 863 | - |
| Shares redeemed | (633) | (57) | (5,146) | (435) |
| Net increase (decrease) | 19,334 | 25,633 | $153,964 | $255,106 |
| Class M | | | | |
| Shares sold | 9 | 25,000 | $77 | $250,003 |
| Reinvestment of distributions | 40 | - | 325 | - |
| Net increase (decrease) | 49 | 25,000 | $402 | $250,003 |
| Class C | | | | |
| Shares sold | - | 25,000 | $- | $250,000 |
| Net increase (decrease) | - | 25,000 | $- | $250,000 |
| Fidelity Sustainable International Equity Fund | | | | |
| Shares sold | 397,160 | 564,957 | $3,312,938 | $4,670,389 |
| Reinvestment of distributions | 2,932 | - | 23,779 | - |
| Shares redeemed | (235,082) | (23,265) | (1,968,118) | (187,070) |
| Net increase (decrease) | 165,010 | 541,692 | $1,368,599 | $4,483,319 |
| Class I | | | | |
| Shares sold | 211 | 25,054 | $1,800 | $250,509 |
| Reinvestment of distributions | 133 | - | 1,075 | - |
| Shares redeemed | (4) | (54) | (30) | (409) |
| Net increase (decrease) | 340 | 25,000 | $2,845 | $250,100 |
| Class Z | | | | |
| Shares sold | 12,333 | 25,000 | $104,463 | $250,000 |
| Reinvestment of distributions | 132 | - | 1,075 | - |
| Shares redeemed | (1,030) | - | (8,025) | - |
| Net increase (decrease) | 11,435 | 25,000 | $97,513 | $250,000 |
A For the period February 10,2022 (commencement of operations) through October 31, 2022.
10. Other.
A fund's organizational documents provide former and current trustees and officers with a limited indemnification against liabilities arising in connection with the performance of their duties to the fund. In the normal course of business, a fund may also enter into contracts that provide general indemnifications. A fund's maximum exposure under these arrangements is unknown as this would be dependent on future claims that may be made against a fund. The risk of material loss from such claims is considered remote.
At the end of the period, the investment adviser or its affiliates were owners of record of more than 10% of the outstanding shares as follows:
| Fund | Affiliated % |
Fidelity Sustainable International Equity Fund | 21% |
In addition, at the end of the period, the following mutual funds managed by the investment adviser or its affiliates were the owners of record of 10% or more of the total outstanding shares.
| | Fidelity Sustainable Multi-Asset Fund |
| Fidelity Sustainable International Equity Fund | 31% |
11. Risk and Uncertainties.
Many factors affect a fund's performance. Developments that disrupt global economies and financial markets, such as pandemics, epidemics, outbreaks of infectious diseases, war, terrorism, and environmental disasters, may significantly affect a fund's investment performance. The effects of these developments to a fund will be impacted by the types of securities in which a fund invests, the financial condition, industry, economic sector, and geographic location of an issuer, and a fund's level of investment in the securities of that issuer. Significant concentrations in security types, issuers, industries, sectors, and geographic locations may magnify the factors that affect a fund's performance.
To the Board of Trustees of Fidelity Investment Trust and the Shareholders of Fidelity Sustainable International Equity Fund:
Opinion on the Financial Statements and Financial Highlights
We have audited the accompanying statement of assets and liabilities of Fidelity Sustainable International Equity Fund (the "Fund"), a fund of Fidelity Investment Trust, including the schedule of investments, as of October 31, 2023, the related statement of operations for the year then ended, and the statement of changes in net assets and the financial highlights for the year then ended and for the period from February 10, 2022 (commencement of operations) through October 31, 2022, and the related notes. In our opinion, the financial statements and financial highlights present fairly, in all material respects, the financial position of the Fund as of October 31, 2023, and the results of its operations for the year then ended, and the changes in its net assets and the financial highlights for the year then ended and for the period from February 10, 2022 (commencement of operations) through October 31, 2022, in conformity with accounting principles generally accepted in the United States of America.
Basis for Opinion
These financial statements and financial highlights are the responsibility of the Fund's management. Our responsibility is to express an opinion on the Fund's financial statements and financial highlights based on our audits. We are a public accounting firm registered with the Public Company Accounting Oversight Board (United States) (PCAOB) and are required to be independent with respect to the Fund in accordance with the U.S. federal securities laws and the applicable rules and regulations of the Securities and Exchange Commission and the PCAOB.
We conducted our audits in accordance with the standards of the PCAOB. Those standards require that we plan and perform the audit to obtain reasonable assurance about whether the financial statements and financial highlights are free of material misstatement, whether due to error or fraud. The Fund is not required to have, nor were we engaged to perform, an audit of its internal control over financial reporting. As part of our audits, we are required to obtain an understanding of internal control over financial reporting but not for the purpose of expressing an opinion on the effectiveness of the Fund's internal control over financial reporting. Accordingly, we express no such opinion.
Our audits included performing procedures to assess the risks of material misstatement of the financial statements and financial highlights, whether due to error or fraud, and performing procedures that respond to those risks. Such procedures included examining, on a test basis, evidence regarding the amounts and disclosures in the financial statements and financial highlights. Our audits also included evaluating the accounting principles used and significant estimates made by management, as well as evaluating the overall presentation of the financial statements and financial highlights. Our procedures included confirmation of securities owned as of October 31, 2023, by correspondence with the custodian and brokers; when replies were not received from brokers, we performed other auditing procedures. We believe that our audits provide a reasonable basis for our opinion.
/s/ Deloitte & Touche LLP
Boston, Massachusetts
December 13, 2023
We have served as the auditor of one or more of the Fidelity investment companies since 1999.
The Trustees, Members of the Advisory Board (if any), and officers of the trust and fund, as applicable, are listed below. The Board of Trustees governs the fund and is responsible for protecting the interests of shareholders. The Trustees are experienced executives who meet periodically throughout the year to oversee the fund's activities, review contractual arrangements with companies that provide services to the fund, oversee management of the risks associated with such activities and contractual arrangements, and review the fund's performance. Except for Jonathan Chiel, each of the Trustees oversees 322 funds. Mr. Chiel oversees 191 funds.
The Trustees hold office without limit in time except that (a) any Trustee may resign; (b) any Trustee may be removed by written instrument, signed by at least two-thirds of the number of Trustees prior to such removal; (c) any Trustee who requests to be retired or who has become incapacitated by illness or injury may be retired by written instrument signed by a majority of the other Trustees; and (d) any Trustee may be removed at any special meeting of shareholders by a two-thirds vote of the outstanding voting securities of the trust. Each Trustee who is not an interested person (as defined in the 1940 Act) of the trust and the fund is referred to herein as an Independent Trustee. Each Independent Trustee shall retire not later than the last day of the calendar year in which his or her 75th birthday occurs. The Independent Trustees may waive this mandatory retirement age policy with respect to individual Trustees. Officers and Advisory Board Members hold office without limit in time, except that any officer or Advisory Board Member may resign or may be removed by a vote of a majority of the Trustees at any regular meeting or any special meeting of the Trustees. Except as indicated, each individual has held the office shown or other offices in the same company for the past five years.
The fund's Statement of Additional Information (SAI) includes more information about the Trustees. To request a free copy, call Fidelity at 1-800-544-8544 if you're an individual investing directly with Fidelity, call 1-800-835-5092 if you're a plan sponsor or participant with Fidelity as your recordkeeper or call 1-877-208-0098 on institutional accounts or if you're an advisor or invest through one.
Experience, Skills, Attributes, and Qualifications of the Trustees. The Governance and Nominating Committee has adopted a statement of policy that describes the experience, qualifications, attributes, and skills that are necessary and desirable for potential Independent Trustee candidates (Statement of Policy). The Board believes that each Trustee satisfied at the time he or she was initially elected or appointed a Trustee, and continues to satisfy, the standards contemplated by the Statement of Policy. The Governance and Nominating Committee also engages professional search firms to help identify potential Independent Trustee candidates who have the experience, qualifications, attributes, and skills consistent with the Statement of Policy. From time to time, additional criteria based on the composition and skills of the current Independent Trustees, as well as experience or skills that may be appropriate in light of future changes to board composition, business conditions, and regulatory or other developments, have also been considered by the professional search firms and the Governance and Nominating Committee. In addition, the Board takes into account the Trustees' commitment and participation in Board and committee meetings, as well as their leadership of standing and ad hoc committees throughout their tenure.
In determining that a particular Trustee was and continues to be qualified to serve as a Trustee, the Board has considered a variety of criteria, none of which, in isolation, was controlling. The Board believes that, collectively, the Trustees have balanced and diverse experience, qualifications, attributes, and skills, which allow the Board to operate effectively in governing the fund and protecting the interests of shareholders. Information about the specific experience, skills, attributes, and qualifications of each Trustee, which in each case led to the Board's conclusion that the Trustee should serve (or continue to serve) as a trustee of the fund, is provided below.
Board Structure and Oversight Function. Robert A. Lawrence is an interested person and currently serves as Chair. The Trustees have determined that an interested Chair is appropriate and benefits shareholders because an interested Chair has a personal and professional stake in the quality and continuity of services provided to the fund. Independent Trustees exercise their informed business judgment to appoint an individual of their choosing to serve as Chair, regardless of whether the Trustee happens to be independent or a member of management. The Independent Trustees have determined that they can act independently and effectively without having an Independent Trustee serve as Chair and that a key structural component for assuring that they are in a position to do so is for the Independent Trustees to constitute a substantial majority for the Board. The Independent Trustees also regularly meet in executive session. David M. Thomas serves as Lead Independent Trustee and as such (i) acts as a liaison between the Independent Trustees and management with respect to matters important to the Independent Trustees and (ii) with management prepares agendas for Board meetings.
Fidelity® funds are overseen by different Boards of Trustees. The fund's Board oversees Fidelity's high income and certain equity funds, and other Boards oversee Fidelity's alternative investment, investment-grade bond, money market, asset allocation, and other equity funds. The asset allocation funds may invest in Fidelity® funds overseen by the fund's Board. The use of separate Boards, each with its own committee structure, allows the Trustees of each group of Fidelity® funds to focus on the unique issues of the funds they oversee, including common research, investment, and operational issues. On occasion, the separate Boards establish joint committees to address issues of overlapping consequences for the Fidelity® funds overseen by each Board.
The Trustees operate using a system of committees to facilitate the timely and efficient consideration of all matters of importance to the Trustees, the fund, and fund shareholders and to facilitate compliance with legal and regulatory requirements and oversight of the fund's activities and associated risks. The Board, acting through its committees, has charged FMR and its affiliates with (i) identifying events or circumstances the occurrence of which could have demonstrably adverse effects on the fund's business and/or reputation; (ii) implementing processes and controls to lessen the possibility that such events or circumstances occur or to mitigate the effects of such events or circumstances if they do occur; and (iii) creating and maintaining a system designed to evaluate continuously business and market conditions in order to facilitate the identification and implementation processes described in (i) and (ii) above. Because the day-to-day operations and activities of the fund are carried out by or through FMR, its affiliates, and other service providers, the fund's exposure to risks is mitigated but not eliminated by the processes overseen by the Trustees. While each of the Board's committees has responsibility for overseeing different aspects of the fund's activities, oversight is exercised primarily through the Operations, Audit, and Compliance Committees. Appropriate personnel, including but not limited to the fund's Chief Compliance Officer (CCO), FMR's internal auditor, the independent accountants, the fund's Treasurer and portfolio management personnel, make periodic reports to the Board's committees, as appropriate, including an annual review of Fidelity's risk management program for the Fidelity® funds. The responsibilities of each standing committee, including their oversight responsibilities, are described further under "Standing Committees of the Trustees."
Interested Trustees*:
Correspondence intended for a Trustee who is an interested person may be sent to Fidelity Investments, 245 Summer Street, Boston, Massachusetts 02210.
Name, Year of Birth; Principal Occupations and Other Relevant Experience+
Jonathan Chiel (1957)
Year of Election or Appointment: 2016
Trustee
Mr. Chiel also serves as Trustee of other Fidelity® funds. Mr. Chiel is General Counsel (2012-present) and Head of Legal, Risk and Compliance (2022-present). Mr Chiel serves as Executive Vice President and General Counsel for FMR LLC (diversified financial services company, 2012-present) and Director and President for OH Company LLC (holding company, 2018-present). Previously, Mr. Chiel served as general counsel (2004-2012) and senior vice president and deputy general counsel (2000-2004) for John Hancock Financial Services; a partner with Choate, Hall & Stewart (1996-2000) (law firm); and an Assistant United States Attorney for the United States Attorney's Office of the District of Massachusetts (1986-95), including Chief of the Criminal Division (1993-1995). Mr. Chiel is a director on the boards of the Boston Bar Foundation and the Maimonides School.
Bettina Doulton (1964)
Year of Election or Appointment: 2021
Trustee
Ms. Doulton also serves as Trustee of other Fidelity® funds. Prior to her retirement, Ms. Doulton served in a variety of positions at Fidelity Investments, including as a managing director of research (2006-2007), portfolio manager to certain Fidelity® funds (1993-2005), equity analyst and portfolio assistant (1990-1993), and research assistant (1987-1990). Ms. Doulton currently owns and operates Phi Builders + Architects and Cellardoor Winery. Previously, Ms. Doulton served as a member of the Board of Brown Capital Management, LLC (2014-2018).
Robert A. Lawrence (1952)
Year of Election or Appointment: 2020
Trustee
Chair of the Board of Trustees
Mr. Lawrence also serves as Trustee of other funds. Previously, Mr. Lawrence served as a Trustee and Member of the Advisory Board of certain funds. Prior to his retirement in 2008, Mr. Lawrence served as Vice President of certain Fidelity® funds (2006-2008), Senior Vice President, Head of High Income Division of Fidelity Management & Research Company (investment adviser firm, 2006-2008), and President of Fidelity Strategic Investments (investment adviser firm, 2002-2005).
* Determined to be an "Interested Trustee" by virtue of, among other things, his or her affiliation with the trust or various entities under common control with FMR.
+ The information includes the Trustee's principal occupation during the last five years and other information relating to the experience, attributes, and skills relevant to the Trustee's qualifications to serve as a Trustee, which led to the conclusion that the Trustee should serve as a Trustee for the fund.
Independent Trustees:
Correspondence intended for an Independent Trustee may be sent to Fidelity Investments, P.O. Box 55235, Boston, Massachusetts 02205-5235.
Name, Year of Birth; Principal Occupations and Other Relevant Experience+
Thomas P. Bostick (1956)
Year of Election or Appointment: 2021
Trustee
Lieutenant General Bostick also serves as Trustee of other Fidelity® funds. Prior to his retirement, General Bostick (United States Army, Retired) held a variety of positions within the U.S. Army, including Commanding General and Chief of Engineers, U.S. Army Corps of Engineers (2012-2016) and Deputy Chief of Staff and Director of Human Resources, U.S. Army (2009-2012). General Bostick currently serves as a member of the Board and Finance and Governance & Sustainability Committees of CSX Corporation (transportation, 2020-present) and a member of the Board and Corporate Governance and Nominating Committee of Perma-Fix Environmental Services, Inc. (nuclear waste management, 2020-present). General Bostick serves as Chief Executive Officer of Bostick Global Strategies, LLC (consulting, 2016-present), as a member of the Board of HireVue, Inc. (video interview and assessment, 2020-present), as a member of the Board of Allonnia (biotechnology and engineering solutions, 2022-present) and on the Advisory Board of Solugen, Inc. (specialty bio-based chemicals manufacturer, 2022-present). Previously, General Bostick served as a Member of the Advisory Board of certain Fidelity® funds (2021), President, Intrexon Bioengineering (2018-2020) and Chief Operating Officer (2017-2020) and Senior Vice President of the Environment Sector (2016-2017) of Intrexon Corporation (biopharmaceutical company).
Dennis J. Dirks (1948)
Year of Election or Appointment: 2005
Trustee
Mr. Dirks also serves as Trustee of other Fidelity® funds. Prior to his retirement in May 2003, Mr. Dirks served as Chief Operating Officer and as a member of the Board of The Depository Trust & Clearing Corporation (financial markets infrastructure), President, Chief Operating Officer and a member of the Board of The Depository Trust Company (DTC), President and a member of the Board of the National Securities Clearing Corporation (NSCC), Chief Executive Officer and a member of the Board of the Government Securities Clearing Corporation and Chief Executive Officer and a member of the Board of the Mortgage-Backed Securities Clearing Corporation. Mr. Dirks currently serves as a member of the Finance Committee (2016-present) and Board (2017-present) and is Treasurer (2018-present) of the Asolo Repertory Theatre.
Donald F. Donahue (1950)
Year of Election or Appointment: 2018
Trustee
Mr. Donahue also serves as Trustee of other Fidelity® funds. Mr. Donahue serves as President and Chief Executive Officer of Miranda Partners, LLC (risk consulting for the financial services industry, 2012-present). Previously, Mr. Donahue served as Chief Executive Officer (2006-2012), Chief Operating Officer (2003-2006) and Managing Director, Customer Marketing and Development (1999-2003) of The Depository Trust & Clearing Corporation (financial markets infrastructure). Mr. Donahue currently serves as a member (2007-present) and Co-Chairman (2016-present) of the Board of United Way of New York. Mr. Donahue previously served as a member of the Advisory Board of certain Fidelity® funds (2015-2018) and as a member of the Board of The Leadership Academy (previously NYC Leadership Academy) (2012-2022).
Vicki L. Fuller (1957)
Year of Election or Appointment: 2020
Trustee
Ms. Fuller also serves as Trustee of other Fidelity® funds. Previously, Ms. Fuller served as a member of the Advisory Board of certain Fidelity® funds (2018-2020), Chief Investment Officer of the New York State Common Retirement Fund (2012-2018) and held a variety of positions at AllianceBernstein L.P. (global asset management, 1985-2012), including Managing Director (2006-2012) and Senior Vice President and Senior Portfolio Manager (2001-2006). Ms. Fuller currently serves as a member of the Board, Audit Committee and Nominating and Governance Committee of two Blackstone business development companies (2020-present), as a member of the Board of Treliant, LLC (consulting, 2019-present), as a member of the Board of Ariel Alternatives, LLC (private equity, 2022-present) and as a member of the Board and Chair of the Audit Committee of Gusto, Inc. (software, 2021-present). In addition, Ms. Fuller currently serves as a member of the Board of Roosevelt University (2019-present) and as a member of the Executive Board of New York University's Stern School of Business. Ms. Fuller previously served as a member of the Board, Audit Committee and Nominating and Governance Committee of The Williams Companies, Inc. (natural gas infrastructure, 2018-2021).
Patricia L. Kampling (1959)
Year of Election or Appointment: 2020
Trustee
Ms. Kampling also serves as Trustee of other Fidelity® funds. Prior to her retirement, Ms. Kampling served as Chairman of the Board and Chief Executive Officer (2012-2019), President and Chief Operating Officer (2011-2012) and Executive Vice President and Chief Financial Officer (2010-2011) of Alliant Energy Corporation. Ms. Kampling currently serves as a member of the Board, Finance Committee and Governance, Compensation and Nominating Committee of Xcel Energy Inc. (utilities company, 2020-present) and as a member of the Board, Audit, Finance and Risk Committee and Safety, Environmental, Technology and Operations Committee and Chair of the Executive Development and Compensation Committee of American Water Works Company, Inc. (utilities company, 2019-present). In addition, Ms. Kampling currently serves as a member of the Board of the Nature Conservancy, Wisconsin Chapter (2019-present). Previously, Ms. Kampling served as a Member of the Advisory Board of certain Fidelity® funds (2020), a member of the Board, Compensation Committee and Executive Committee and Chair of the Audit Committee of Briggs & Stratton Corporation (manufacturing, 2011-2021), a member of the Board of Interstate Power and Light Company (2012-2019) and Wisconsin Power and Light Company (2012-2019) (each a subsidiary of Alliant Energy Corporation) and as a member of the Board and Workforce Development Committee of the Business Roundtable (2018-2019).
Thomas A. Kennedy (1955)
Year of Election or Appointment: 2021
Trustee
Mr. Kennedy also serves as Trustee of other Fidelity® funds. Previously, Mr. Kennedy served as a Member of the Advisory Board of certain Fidelity® funds (2020) and held a variety of positions at Raytheon Company (aerospace and defense, 1983-2020), including Chairman and Chief Executive Officer (2014-2020) and Executive Vice President and Chief Operating Officer (2013-2014). Mr. Kennedy served as Executive Chairman of the Board of Directors of Raytheon Technologies Corporation (aerospace and defense, 2020-2021). Mr. Kennedy serves as a Director of the Board of Directors of Textron Inc. (aerospace and defense, 2023-present).
Oscar Munoz (1959)
Year of Election or Appointment: 2021
Trustee
Mr. Munoz also serves as Trustee of other Fidelity® funds. Prior to his retirement, Mr. Munoz served as Executive Chairman (2020-2021), Chief Executive Officer (2015-2020), President (2015-2016) and a member of the Board (2010-2021) of United Airlines Holdings, Inc. Mr. Munoz currently serves as a member of the Board of CBRE Group, Inc. (commercial real estate, 2020-present), a member of the Board of Univision Communications, Inc. (Hispanic media, 2020-present), a member of the Board of Archer Aviation Inc. (2021-present), a member of the Defense Business Board of the United States Department of Defense (2021-present) and a member of the Board of Salesforce.com, Inc. (cloud-based software, 2022-present). Previously, Mr. Munoz served as a Member of the Advisory Board of certain Fidelity® funds (2021).
David M. Thomas (1949)
Year of Election or Appointment: 2008
Trustee
Lead Independent Trustee
Mr. Thomas also serves as Trustee of other Fidelity® funds. Previously, Mr. Thomas served as Executive Chairman (2005-2006) and Chairman and Chief Executive Officer (2000-2005) of IMS Health, Inc. (pharmaceutical and healthcare information solutions). Mr. Thomas currently serves as a member of the Board of Fortune Brands Home and Security (home and security products, 2004-present) and as Director (2013-present) and Non-Executive Chairman of the Board (2022-present) of Interpublic Group of Companies, Inc. (marketing communication).
Susan Tomasky (1953)
Year of Election or Appointment: 2020
Trustee
Ms. Tomasky also serves as Trustee of other Fidelity® funds. Prior to her retirement, Ms. Tomasky served in various executive officer positions at American Electric Power Company, Inc. (1998-2011), including most recently as President of AEP Transmission (2007-2011). Ms. Tomasky currently serves as a member of the Board and Sustainability Committee and as Chair of the Audit Committee of Marathon Petroleum Corporation (2018-present) and as a member of the Board, Executive Committee, Corporate Governance Committee and Organization and Compensation Committee and as Lead Director of the Board of Public Service Enterprise Group, Inc. (utilities company, 2012-present) and as a member of the Board of its subsidiary company, Public Service Electric and Gas Co. (2021-present). In addition, Ms. Tomasky currently serves as a member (2009-present) and President (2020-present) of the Board of the Royal Shakespeare Company - America (2009-present), as a member of the Board of the Columbus Association for the Performing Arts (2011-present) and as a member of the Board and Kenyon in the World Committee of Kenyon College (2016-present). Previously, Ms. Tomasky served as a Member of the Advisory Board of certain Fidelity® funds (2020), as a member of the Board of the Columbus Regional Airport Authority (2007-2020), as a member of the Board (2011-2018) and Lead Independent Director (2015-2018) of Andeavor Corporation (previously Tesoro Corporation) (independent oil refiner and marketer) and as a member of the Board of Summit Midstream Partners LP (energy, 2012-2018).
Michael E. Wiley (1950)
Year of Election or Appointment: 2020
Trustee
Mr. Wiley also serves as Trustee of other Fidelity® funds. Previously, Mr. Wiley served as a member of the Advisory Board of certain Fidelity® funds (2018-2020), Chairman, President and CEO of Baker Hughes, Inc. (oilfield services, 2000-2004). Mr. Wiley also previously served as a member of the Board of Andeavor Corporation (independent oil refiner and marketer, 2005-2018), a member of the Board of Andeavor Logistics LP (natural resources logistics, 2015-2018) and a member of the Board of High Point Resources (exploration and production, 2005-2020).
+ The information includes the Trustee's principal occupation during the last five years and other information relating to the experience, attributes, and skills relevant to the Trustee's qualifications to serve as a Trustee, which led to the conclusion that the Trustee should serve as a Trustee for the fund.
Advisory Board Members and Officers:
Correspondence intended for a Member of the Advisory Board (if any) may be sent to Fidelity Investments, P.O. Box 55235, Boston, Massachusetts 02205-5235. Correspondence intended for an officer or Peter S. Lynch may be sent to Fidelity Investments, 245 Summer Street, Boston, Massachusetts 02210.
Name, Year of Birth; Principal Occupation
Vijay C. Advani (1960)
Year of Election or Appointment: 2023
Member of the Advisory Board
Mr. Advani also serves as Trustee or Member of the Advisory Board of other funds. Previously, Mr. Advani served as Executive Chairman (2020-2022), Chief Executive Officer (2017-2020) and Chief Operating Officer (2016-2017) of Nuveen (global investment manager). He also served in various capacities at Franklin Resources (global investment manager), including Co-President (2015-2016), Executive Vice President, Global Advisory Services (2008-2015), Head of Global Retail Distribution (2005-2008), Executive Managing Director, International Retail Development (2002-2005), Managing Director, Product Developments, Sales & Marketing, Asia, Eastern Europe and Africa (2000-2002) and President, Templeton Asset Management India (1995-2000). Mr. Advani also served as Senior Investment Officer of International Finance Corporation (private equity and venture capital arm of The World Bank, 1984-1995). Mr. Advani is Chairman Emeritus of the U.S. India Business Council (2018-present), a Director of The Global Impact Investing Network (2019-present), a Director of LOK Capital (Mauritius) (2022-present), a member of the Advisory Council of LOK Capital (2022-present), a Senior Advisor of Neuberger Berman (2021-present), a Senior Advisor of Seviora Holdings Pte. Ltd (Temasek-Singapore) (2021-present), a Director of Seviora Capital (Singapore) (2021-present) and an Advisor of EQUIAM (2021-present). Mr. Advani formerly served as a member of the Board of BowX Acquisition Corp. (special purpose acquisition company, 2020-2021), a member of the Board of Intellecap (advisory arm of The Aavishkaar Group, 2018-2020), a member of the Board of Nuveen Investments, Inc. (2017-2020) and a member of the Board of Docusign (software, 2016-2019).
Peter S. Lynch (1944)
Year of Election or Appointment: 2003
Member of the Advisory Board
Mr. Lynch also serves as a Member of the Advisory Board of other Fidelity® funds. Mr. Lynch is Vice Chairman and a Director of Fidelity Management & Research Company LLC (investment adviser firm). In addition, Mr. Lynch serves as a Trustee of Boston College and as the Chairman of the Inner-City Scholarship Fund. Previously, Mr. Lynch served as Vice Chairman and a Director of FMR Co., Inc. (investment adviser firm) and on the Special Olympics International Board of Directors (1997-2006).
Karen B. Peetz (1955)
Year of Election or Appointment: 2023
Member of the Advisory Board
Ms. Peetz also serves as a Member of the Advisory Board of other funds. Previously, Ms. Peetz served as Chief Administration Officer (2020-2023) of Citigroup Inc. (a diversified financial service company). She also served in various capacities at Bank of New York Mellon Corporation, including President (2013-2016), Vice Chairman, Senior Executive Vice President and Chief Executive Officer of Financial Markets & Treasury Services (2010-2013), Senior Executive Vice President and Chief Executive Officer of Global Corporate Trust (2003-2008), Senior Vice President and Division Manager of Global Payments & Trade Services (2002-2003) and Senior Vice President and Division Manager of Domestic Corporate Trust (1998-2002). Ms. Peetz also served in various capacities at Chase Manhattan Corporation (1982-1998), including Senior Vice President and Manager of Corporate Trust International Business (1996-1998), Managing Director and Manager of Corporate Trust Services (1994-1996) and Managing Director and Group Manager of Financial Institution Sales (1990-1993). Ms. Peetz currently serves as Chair of Amherst Holdings Advisory Council (2018-present), Trustee of Johns Hopkins University (2016-present), Chair of the Carey Business School Advisory Council, Member of the Johns Hopkins Medicine Board and Finance Committee and Chair of the Lyme and Tick Related Disease Institute Advisory Council. Ms. Peetz previously served as a member of the Board of Guardian Life Insurance Company of America (2019-2023), a member of the Board of Trane Technologies (2018-2022), a member of the Board of Wells Fargo Corp. (2017-2019), a member of the Board of SunCoke Energy Inc. (2012-2016), a member of the Board of Private Export Funding Corporation (2010-2016) and as a Trustee of Penn State University (2010-2014) and the United Way of New York City (2008-2010).
Heather Bonner (1977)
Year of Election or Appointment: 2023
Assistant Treasurer
Ms. Bonner also serves as an officer of other funds. Ms. Bonner is a Senior Vice President (2022-present) and is an employee of Fidelity Investments (2022-present). Ms. Bonner serves as Vice President, Treasurer, or Assistant Treasurer of certain Fidelity entities. Prior to joining Fidelity, Ms. Bonner served as Managing Director at AQR Capital Management (2013-2022) and was the Treasurer and Principal Financial Officer of the AQR Funds (2013-2022).
Craig S. Brown (1977)
Year of Election or Appointment: 2022
Deputy Treasurer
Mr. Brown also serves as an officer of other funds. Mr. Brown is a Vice President (2015-present) and is an employee of Fidelity Investments. Mr. Brown serves as Assistant Treasurer of FIMM, LLC (2021-present). Previously, Mr. Brown served as Assistant Treasurer of certain Fidelity® funds (2019-2022).
John J. Burke III (1964)
Year of Election or Appointment: 2018
Chief Financial Officer
Mr. Burke also serves as Chief Financial Officer of other funds. Mr. Burke is Head of Fidelity Fund and Investment Operations (2018-present) and is an employee of Fidelity Investments. Mr. Burke serves as President, Executive Vice President, or Director of certain Fidelity entities. Previously Mr. Burke served as head of Asset Management Investment Operations (2012-2018).
Margaret Carey (1973)
Year of Election or Appointment: 2023
Secretary and Chief Legal Officer (CLO)
Ms. Carey also serves as an officer of other funds and as CLO of certain Fidelity entities. Ms. Carey is a Senior Vice President, Deputy General Counsel (2019-present) and is an employee of Fidelity Investments.
William C. Coffey (1969)
Year of Election or Appointment: 2019
Assistant Secretary
Mr. Coffey also serves as Assistant Secretary of other funds. Mr. Coffey is a Senior Vice President, Deputy General Counsel (2010-present) and is an employee of Fidelity Investments. Previously, Mr. Coffey served as Secretary and CLO of certain funds (2018-2019); CLO, Secretary, or Senior Vice President of certain Fidelity entities and Assistant Secretary of certain funds (2009-2018).
Timothy M. Cohen (1969)
Year of Election or Appointment: 2018
Vice President
Mr. Cohen also serves as Vice President of other funds. Mr. Cohen is Co-Head of Equity (2018-present) and is an employee of Fidelity Investments. Mr. Cohen serves a Director of Fidelity Management & Research (Japan) Limited (investment adviser firm, 2016-present). Previously, Mr. Cohen served as Executive Vice President of Fidelity SelectCo, LLC (2019) and Head of Global Equity Research (2016-2018).
Jonathan Davis (1968)
Year of Election or Appointment: 2010
Assistant Treasurer
Mr. Davis also serves as an officer of other funds. Mr. Davis is a Vice President (2006-present) and is an employee of Fidelity Investments. Mr. Davis serves as Assistant Treasurer of certain Fidelity entities.
Laura M. Del Prato (1964)
Year of Election or Appointment: 2018
Assistant Treasurer
Ms. Del Prato also serves as an officer of other funds. Ms. Del Prato is a Senior Vice President (2017-present) and is an employee of Fidelity Investments. Ms. Del Prato serves as Vice President or Assistant Treasurer of certain Fidelity entities. Previously, Ms. Del Prato served as President and Treasurer of The North Carolina Capital Management Trust: Cash Portfolio and Term Portfolio (2018-2020).
Colm A. Hogan (1973)
Year of Election or Appointment: 2020
Assistant Treasurer
Mr. Hogan also serves as an officer of other funds. Mr. Hogan is a Vice President (2016-present) and is an employee of Fidelity Investments. Mr. Hogan serves as Assistant Treasurer of certain Fidelity entities. Previously, Mr. Hogan served as Deputy Treasurer of certain Fidelity® funds (2016-2020) and Assistant Treasurer of certain Fidelity® funds (2016-2018).
Pamela R. Holding (1964)
Year of Election or Appointment: 2018
Vice President
Ms. Holding also serves as Vice President of other funds. Ms. Holding is Co-Head of Equity (2018-present) and is an employee of Fidelity Investments. Previously, Ms. Holding served as Executive Vice President of Fidelity SelectCo, LLC (2019) and as Chief Investment Officer of Fidelity Institutional Asset Management (2013-2018).
Chris Maher (1972)
Year of Election or Appointment: 2020
Deputy Treasurer
Mr. Maher also serves as an officer of other funds. Mr. Maher is a Vice President (2008-present) and is an employee of Fidelity Investments. Mr. Maher serves as Assistant Treasurer of certain Fidelity entities. Previously, Mr. Maher served as Assistant Treasurer of certain funds (2013-2020).
Jason P. Pogorelec (1975)
Year of Election or Appointment: 2020
Chief Compliance Officer
Mr. Pogorelec also serves as Chief Compliance Officer of other funds. Mr. Pogorelec is a Senior Vice President of Asset Management Compliance (2020-present) and is an employee of Fidelity Investments. Mr. Pogorelec serves as Compliance Officer of Fidelity Management & Research Company LLC (investment adviser firm, 2023-present) and Ballyrock Investment Advisors LLC (2023-present). Previously, Mr. Pogorelec served as a Vice President, Associate General Counsel for Fidelity Investments (2010-2020) and Assistant Secretary of certain Fidelity® funds (2015-2020).
Brett Segaloff (1972)
Year of Election or Appointment: 2021
Anti-Money Laundering (AML) Officer
Mr. Segaloff also serves as AML Officer of other funds. Mr. Segaloff is a Vice President (2022-present) and is an employee of Fidelity Investments. Mr. Segaloff serves as Anti Money Laundering Compliance Officer or Anti Money Laundering/Bank Secrecy Act Compliance Officer of certain Fidelity entities.
Stacie M. Smith (1974)
Year of Election or Appointment: 2016
President and Treasurer
Ms. Smith also serves as an officer of other funds. Ms. Smith is a Senior Vice President (2016-present) and is an employee of Fidelity Investments. Ms. Smith serves as Assistant Treasurer of certain Fidelity entities and has served in other fund officer roles.
Jim Wegmann (1979)
Year of Election or Appointment: 2019
Assistant Treasurer
Mr. Wegmann also serves as an officer of other funds. Mr. Wegmann is a Vice President (2016-present) and is an employee of Fidelity Investments. Mr. Wegmann serves as Assistant Treasurer of FIMM, LLC (2021-present). Previously, Mr. Wegmann served as Assistant Treasurer of certain Fidelity® funds (2019-2021).
As a shareholder, you incur two types of costs: (1) transaction costs, which may include sales charges (loads) on purchase payments or redemption proceeds, as applicable and (2) ongoing costs, which generally include management fees, distribution and/or service (12b-1) fees and other Fund expenses. This Example is intended to help you understand your ongoing costs (in dollars) of investing in a fund and to compare these costs with the ongoing costs of investing in other mutual funds.
| The Example is based on an investment of $1,000 invested at the beginning of the period and held for the entire period (May 1, 2023 to October 31, 2023). |
Actual Expenses
The first line of the accompanying table provides information about actual account values and actual expenses. You may use the information in this line, together with the amount you invested, to estimate the expenses that you paid over the period. Simply divide your account value by $1,000.00 (for example, an $8,600 account value divided by $1,000.00 = 8.6), then multiply the result by the number in the first line for a class/Fund under the heading entitled "Expenses Paid During Period" to estimate the expenses you paid on your account during this period. If any fund is a shareholder of any underlying mutual funds or exchange-traded funds (ETFs) (the Underlying Funds), such fund indirectly bears its proportional share of the expenses of the Underlying Funds in addition to the direct expenses incurred presented in the table. These fees and expenses are not included in the annualized expense ratio used to calculate the expense estimate in the table below.
Hypothetical Example for Comparison Purposes
The second line of the accompanying table provides information about hypothetical account values and hypothetical expenses based on the actual expense ratio and an assumed rate of return of 5% per year before expenses, which is not the actual return. The hypothetical account values and expenses may not be used to estimate the actual ending account balance or expenses you paid for the period. You may use this information to compare the ongoing costs of investing in the Fund and other funds. To do so, compare this 5% hypothetical example with the 5% hypothetical examples that appear in the shareholder reports of the other funds. If any fund is a shareholder of any Underlying Funds, such fund indirectly bears its proportional share of the expenses of the Underlying Funds in addition to the direct expenses as presented in the table. These fees and expenses are not included in the annualized expense ratio used to calculate the expense estimate in the table below.
Please note that the expenses shown in the table are meant to highlight your ongoing costs only and do not reflect any transaction costs. Therefore, the second line of the table is useful in comparing ongoing costs only, and will not help you determine the relative total costs of owning different funds. In addition, if these transactional costs were included, your costs would have been higher.
| | | | | Annualized Expense Ratio- A | | Beginning Account Value May 1, 2023 | | Ending Account Value October 31, 2023 | | Expenses Paid During Period- C May 1, 2023 to October 31, 2023 |
| Fidelity® Sustainable International Equity Fund | | | | | | | | | | |
| Class A | | | | 1.30% | | | | | | |
| Actual | | | | | | $ 1,000 | | $ 901.30 | | $ 6.23 |
Hypothetical-B | | | | | | $ 1,000 | | $ 1,018.65 | | $ 6.61 |
| Class M | | | | 1.54% | | | | | | |
| Actual | | | | | | $ 1,000 | | $ 900.00 | | $ 7.38 |
Hypothetical-B | | | | | | $ 1,000 | | $ 1,017.44 | | $ 7.83 |
| Class C | | | | 2.04% | | | | | | |
| Actual | | | | | | $ 1,000 | | $ 898.40 | | $ 9.76 |
Hypothetical-B | | | | | | $ 1,000 | | $ 1,014.92 | | $ 10.36 |
| Fidelity® Sustainable International Equity Fund | | | | 1.05% | | | | | | |
| Actual | | | | | | $ 1,000 | | $ 902.50 | | $ 5.04 |
Hypothetical-B | | | | | | $ 1,000 | | $ 1,019.91 | | $ 5.35 |
| Class I | | | | 1.04% | | | | | | |
| Actual | | | | | | $ 1,000 | | $ 902.50 | | $ 4.99 |
Hypothetical-B | | | | | | $ 1,000 | | $ 1,019.96 | | $ 5.30 |
| Class Z | | | | .89% | | | | | | |
| Actual | | | | | | $ 1,000 | | $ 903.80 | | $ 4.27 |
Hypothetical-B | | | | | | $ 1,000 | | $ 1,020.72 | | $ 4.53 |
| |
A Annualized expense ratio reflects expenses net of applicable fee waivers.
B 5% return per year before expenses
C Expenses are equal to the annualized expense ratio, multiplied by the average account value over the period, multiplied by 184/ 365 (to reflect the one-half year period). The fees and expenses of any Underlying Funds are not included in each annualized expense ratio.
The dividend and capital gains distributions for the fund(s) are available on Fidelity.com or Institutional.Fidelity.com.
The fund designates $1,279 of distributions paid during the fiscal year ended 2023 as qualifying to be taxed as section 163(j) interest dividends.
Class A, Class M, Fidelity Sustainable International Equity Fund, Class I and Class Z designate 100% of each dividend distributed during the fiscal year as amounts which may be taken into account as a dividend for purposes of the maximum rate under section 1(h)(11) of the Internal Revenue Code.
The amounts per share which represent income derived from sources within, and taxes paid to, foreign countries or possessions of the United States are as follows:
| | Pay Date | Income | Taxes |
| Fidelity Sustainable International Equity Fund | | | |
| Class A | 12/12/2022 | $0.0416 | $0.0116 |
| Class M | 12/12/2022 | $0.0246 | $0.0116 |
| Class C | 12/12/2022 | $0.0000 | $0.0000 |
| Fidelity Sustainable International Equity Fund | 12/12/2022 | $0.0546 | $0.0116 |
| Class I | 12/12/2022 | $0.0546 | $0.0116 |
Class Z | 12/12/2022 | $0.0546 | $0.0116 |
The fund will notify shareholders in January 2024 of amounts for use in preparing 2023 income tax returns.
Board Approval of Investment Advisory Contracts and Management Fees
Fidelity Sustainable International Equity Fund
Each year, the Board of Trustees, including the Independent Trustees (together, the Board), considers the renewal of the fund's management contract with Fidelity Management & Research Company LLC (FMR) and the sub-advisory agreements (together, the Advisory Contracts) for the fund. FMR and the sub-advisers are referred to herein as the Investment Advisers. The Board, assisted by the advice of fund counsel and Independent Trustees' counsel, requests and considers a broad range of information relevant to the renewal of the Advisory Contracts throughout the year.
The Board meets regularly and, at each of its meetings, covers an extensive agenda of topics and materials and considers factors that are relevant to its annual consideration of the renewal of the fund's Advisory Contracts, including the services and support provided to the fund and its shareholders. The Board, acting directly and through its Committees (each of which is composed of and chaired by Independent Trustees), requests and receives information concerning the annual consideration of the renewal of the fund's Advisory Contracts. The Board also meets as needed to review matters specifically related to the Board's annual consideration of the renewal of the Advisory Contracts. Members of the Board may also meet with trustees of other Fidelity funds through joint ad hoc committees to discuss certain matters relevant to all of the Fidelity funds.
Approval of Stub Period Continuation. At its May 2023 meeting, the Board of Trustees voted to continue the fund's management contract with FMR, and the sub-advisory agreements and sub-sub-advisory agreements, in each case, where applicable (together, the Advisory Contracts), without modification, for two months from June 1, 2023 through July 31, 2023. The Board considered that the approval of the fund's Advisory Contracts will not result in any changes in (i) the investment process or strategies employed in the management of the fund's assets; (ii) the fees and expenses paid by shareholders; (iii) the nature, extent or quality of services provided under the fund's Advisory Contracts; or (iv) the day-to-day management of the fund or the persons primarily responsible for such management. The Board also considered that since its last approval of the fund's Advisory Contracts, FMR had provided additional information on the fund in support of the annual contract renewal process, including competitive analyses on total expenses and management fees and in-depth reviews of fund performance and fund profitability information. The Board concluded that the fund's Advisory Contracts are fair and reasonable, and that the fund's Advisory Contracts should be renewed, without modification, through July 31, 2023, with the understanding that the Board would consider the annual renewal for a full one year period in July 2023.
At its July 2023 meeting, the Board unanimously determined to renew the fund's Advisory Contracts. In reaching its determination, the Board considered all factors it believed relevant, including (i) the nature, extent, and quality of the services provided to the fund and its shareholders (including the investment performance of the fund); (ii) the competitiveness relative to peer funds of the fund's management fee and the total expense ratio of a representative class (the retail class, which was selected because it was the largest class without 12b-1 fees); (iii) the total costs of the services provided by and the profits realized by FMR and its affiliates (Fidelity) from its relationships with the fund; and (iv) the extent to which, if any, economies of scale exist and are realized as the fund grows, and whether any economies of scale are appropriately shared with fund shareholders. The Board also considered the broad range of investment choices available to shareholders from FMR's competitors and that the fund's shareholders have chosen to invest in the fund, which is part of the Fidelity family of funds. The Board's decision to renew the Advisory Contracts was not based on any single factor.
The Board reached a determination, with the assistance of fund counsel and Independent Trustees' counsel and through the exercise of its business judgment, that the renewal of the Advisory Contracts was in the best interests of the fund and its shareholders and that the compensation payable under the Advisory Contracts was fair and reasonable in light of all of the surrounding circumstances.
Nature, Extent, and Quality of Services Provided. The Board considered staffing as it relates to the fund, including the backgrounds and experience of investment personnel of the Investment Advisers, and also considered the Investment Advisers' implementation of the fund's investment program. The Independent Trustees also had discussions with senior management of Fidelity's investment operations and investment groups. The Board considered the structure of the investment personnel compensation program and whether this structure provides appropriate incentives to act in the best interests of the fund. Additionally, the Board considered the portfolio managers' investments, if any, in the funds that they manage.
Resources Dedicated to Investment Management and Support Services. The Board and the Fund Oversight and Research Committees reviewed the general qualifications and capabilities of Fidelity's investment staff, including its size, education, experience, and resources, as well as Fidelity's approach to recruiting, training, managing, and compensating investment personnel. The Board noted the resources devoted to expansion of Fidelity's global investment organization, and that Fidelity's analysts have extensive resources, tools, and capabilities that allow them to conduct sophisticated quantitative and fundamental analysis, as well as credit analysis of issuers, counterparties, and guarantors. Further, the Board considered that Fidelity's investment professionals have sufficient access to global information and data so as to provide competitive investment results over time, and that those professionals also have access to sophisticated tools that permit them to assess portfolio construction and risk and performance attribution characteristics continuously, as well as to transmit new information and research conclusions rapidly around the world. Additionally, in its deliberations, the Board considered Fidelity's trading, risk management, compliance, and technology and operations capabilities and resources, which are integral parts of the investment management process.
Shareholder and Administrative Services. The Board considered (i) the nature, extent, quality, and cost of advisory, administrative, and shareholder services performed by the Investment Advisers and their affiliates under the Advisory Contracts and under separate agreements covering transfer agency, pricing and bookkeeping, and securities lending services for the fund; (ii) the nature and extent of Fidelity's supervision of third party service providers, principally custodians, subcustodians, and pricing vendors; and (iii) the resources devoted by Fidelity to, and the record of compliance with, the fund's compliance policies and procedures. The Board also reviewed the allocation of fund brokerage, including allocations to brokers affiliated with the Investment Advisers, the use of brokerage commissions to pay fund expenses, and the use of "soft" commission dollars to pay for research services. The Board also considered the fund's securities lending activities and any payments made to Fidelity relating to securities lending.
The Board noted that the growth of fund assets over time across the complex allows Fidelity to reinvest in the development of services designed to enhance the value and convenience of the Fidelity funds as investment vehicles. These services include 24-hour access to account information and market information over the Internet and through telephone representatives, investor education materials, and asset allocation tools. The Board also considered that it reviews customer service metrics such as telephone response times, continuity of services on the website and metrics addressing services at Fidelity Investor Centers.
Investment in a Large Fund Family. The Board considered the benefits to shareholders of investing in a fund that is part of a large family of funds offering a variety of investment disciplines and providing a large variety of fund investor services. The Board noted that Fidelity had taken, or had made recommendations that resulted in the Fidelity funds taking, a number of actions over the previous year that benefited particular funds and/or the Fidelity funds in general.
Investment Performance. The Board took into account discussions that occur with representatives of the Investment Advisers, and reports that it receives, at Board meetings throughout the year, relating to fund investment performance. In this regard the Board noted that as part of regularly scheduled fund reviews and other reports to the Board on fund performance, the Board considered annualized return information for the fund for different time periods, measured against an appropriate securities market index (benchmark index) and an appropriate peer group of funds with similar objectives (peer group). The Board also considered information about performance attribution. In its ongoing evaluation of fund investment performance, the Board gives particular attention to information indicating changes in performance of the funds over different time periods and discussed with the Investment Advisers the reasons for any overperformance or underperformance.
In addition to reviewing absolute and relative fund performance, the Independent Trustees periodically consider the appropriateness of fund performance metrics in evaluating the results achieved. The Independent Trustees generally give greater weight to fund performance over longer time periods than over shorter time periods. Depending on the circumstances, the Independent Trustees may be satisfied with a fund's performance notwithstanding that it lags its benchmark index or peer group for certain periods.
Based on its review, the Board concluded that the nature, extent, and quality of services provided to the fund under the Advisory Contracts should continue to benefit the shareholders of the fund.
Competitiveness of Management Fee and Total Expense Ratio. The Board was provided with information regarding industry trends in management fees and expenses. In its review of the fund's management fee and the total expense ratio of the retail class, the Board considered the fund's management fee rate as well as other fund or class expenses, as applicable, such as transfer agent fees, pricing and bookkeeping fees, fund-paid 12b-1 fees, and custodial, legal, and audit fees. The Board noted that Fidelity may agree to waive fees or reimburse expenses from time to time, and the extent to which, if any, it has done so for the fund. The Board also considered information about the impact of the fund's performance adjustment.
Comparisons of Management Fees and Total Expense Ratios. Among other things, the Board reviewed data for selected groups of competitive funds and classes (referred to as "mapped groups") that were compiled by Fidelity based on combining similar investment objective categories (as classified by Lipper) that have comparable investment mandates. The data reviewed by the Board included (i) gross management fee comparisons (before taking into account expense reimbursements or caps and without taking into account the fund's performance adjustment) relative to the total universe of funds within the mapped group; (ii) gross management fee comparisons relative to a subset of non-Fidelity funds in the mapped group that are similar in size and management fee structure to the fund (referred to as the "asset size peer group"); (iii) total expense comparisons of the retail class of the fund relative to funds and classes in the mapped group that have a similar sales load structure to the retail class of the fund (referred to as the "similar sales load structure group"); and (iv) total expense comparisons of the retail class of the fund relative to funds and classes in the similar sales load structure group that are similar in size and management fee structure to the fund (referred to as the "total expense asset size peer group"). The total expense asset size peer group comparison excludes performance adjustments and fund-paid 12b-1 fees to eliminate variability in fee structures.
The information provided to the Board indicated that the fund's management fee rate ranked below the competitive median of the mapped group for the period ended September 30, 2022 and below the competitive median of the asset size peer group for the period ended September 30, 2022. Further, the information provided to the Board indicated that the total expense ratio of the retail class of the fund ranked below the competitive median of the similar sales load structure group for the period ended September 30, 2022 and above the competitive median of the total expense asset size peer group for the period ended September 30, 2022.
The Board noted that the fund offers multiple classes, each of which has a different sales load and 12b-1 fee structure, and that the multiple structures are intended to offer a range of pricing options for the intermediary market. The Board also noted that the total expense ratios of the classes vary primarily by the level of their 12b-1 fees, although differences in transfer agent fees may also cause expenses to vary from class to class.
The Board also considered that, for funds subject to the group fee, FMR agreed to voluntarily waive fees over a specified period of time in amounts designed to account for assets converted from certain funds to certain collective investment trusts.
The Board also considered that the fund's management fee is subject to upward or downward adjustment depending upon whether, and to what extent, the fund's investment performance for the performance period (a rolling 36-month period) exceeds, or is exceeded by, a securities index, thus leading to a performance adjustment for the same period. The Board noted that the performance adjustment provides FMR with a strong economic incentive to seek to achieve superior long-term performance for the fund's shareholders and helps to more closely align the interests of FMR and the shareholders of the fund.
In connection with its consideration of the fund's performance adjustment, the Board noted that the performance of the retail class is used for purposes of determining the performance adjustment. The Board noted that to the extent the performance adjustment was based on the performance of a share class with higher total annual operating expenses, the fund would be subject to a smaller positive and larger negative performance adjustment. The Board considered the appropriateness of the use of the retail class as the basis for the performance adjustment. The Board noted that the retail class is typically the largest class (reflecting the actual investment experience for the plurality of shareholders), employs a standard expense structure, and does not include fund-paid 12b-1 fees, which Fidelity believes makes it a more appropriate measurement of Fidelity's investment skill.
Fees Charged to Other Fidelity Clients. The Board also considered Fidelity fee structures and other information with respect to clients of Fidelity, such as other funds advised or subadvised by Fidelity, pension plan clients, and other institutional clients with similar mandates. The Board noted that a joint ad hoc committee created by it and the boards of other Fidelity funds periodically reviews and compares Fidelity's institutional investment advisory business with its business of providing services to the Fidelity funds and also noted the most recent findings of the committee. The Board noted that the committee's review included a consideration of the differences in services provided, fees charged, and costs incurred, as well as competition in the markets serving the different categories of clients.
Based on its review, the Board concluded that the fund's management fee, including the use of the retail class as the basis for the performance adjustment, is fair and reasonable in light of the services that the fund receives and the other factors considered. Further, based on its review of total expense ratios and fees charged to other Fidelity clients, the Board concluded that the total expense ratio of each class of the fund was reasonable in light of the services that the fund and its shareholders receive and the other factors considered.
Costs of the Services and Profitability. The Board considered the revenues earned and the expenses incurred by Fidelity in conducting the business of developing, marketing, distributing, managing, administering and servicing the fund and servicing the fund's shareholders. The Board also considered the level of Fidelity's profits in respect of all the Fidelity funds.
On an annual basis, Fidelity presents to the Board information about the profitability of its relationships with the fund. Fidelity calculates profitability information for each fund, as well as aggregate profitability information for groups of Fidelity funds and all Fidelity funds, using a series of detailed revenue and cost allocation methodologies which originate with the books and records of Fidelity on which Fidelity's audited financial statements are based. The Audit Committee of the Board reviews any significant changes from the prior year's methodologies and the full Board approves such changes.
A public accounting firm has been engaged annually by the Board as part of the Board's assessment of Fidelity's profitability analysis. The engagement includes the review and assessment of the methodologies used by Fidelity in determining the revenues and expenses attributable to Fidelity's fund business, and completion of agreed-upon procedures in respect of the mathematical accuracy of certain fund profitability information and its conformity to established allocation methodologies. After considering the reports issued under the engagement and information provided by Fidelity, the Board concluded that while other allocation methods may also be reasonable, Fidelity's profitability methodologies are reasonable in all material respects.
The Board also reviewed Fidelity's non-fund businesses and potential indirect benefits such businesses may have received as a result of their association with Fidelity's fund business (i.e., fall-out benefits) as well as cases where Fidelity's affiliates may benefit from the funds' business. The Board considered areas where potential indirect benefits to the Fidelity funds from their relationships with Fidelity may exist. The Board's consideration of these matters was informed by the findings of a joint ad hoc committee created by it and the boards of other Fidelity funds to evaluate potential fall-out benefits.
The Board considered the costs of the services provided by and the profits realized by Fidelity in connection with the operation of the fund and was satisfied that the profitability was not excessive.
Economies of Scale. The Board considered whether there have been economies of scale in respect of the management of the Fidelity funds, whether the Fidelity funds (including the fund) have appropriately benefited from any such economies of scale, and whether there is potential for realization of any further economies of scale. The Board considered the extent to which the fund will benefit from economies of scale as assets grow through increased services to the fund, through waivers or reimbursements, or through fee or expense ratio reductions. The Board also noted that a committee (the Economies of Scale Committee) created by it and the boards of other Fidelity funds periodically analyzes whether Fidelity attains economies of scale in respect of the management and servicing of the Fidelity funds, whether the Fidelity funds have appropriately benefited from such economies of scale, and whether there is potential for realization of any further economies of scale.
The Board recognized that the fund's management contract incorporates a "group fee" structure, which provides for lower group fee rates as total "group assets" increase, and for higher group fee rates as total "group assets" decrease ("group assets" as defined in the management contract). FMR calculates the group fee rates based on a tiered asset "breakpoint" schedule that varies based on asset class. The Board considered that the group fee is designed to deliver the benefits of economies of scale to fund shareholders when total Fidelity fund assets increase, even if assets of any particular fund are unchanged or have declined, because some portion of Fidelity's costs are attributable to services provided to all Fidelity funds, and all funds benefit if those costs can be allocated among more assets. The Board further considered that Fidelity agreed to impose a temporary fee waiver in the form of additional breakpoints to the current breakpoint schedule. The Board concluded that, given the group fee structure, fund shareholders will benefit from lower management fees as "group assets" increase at the fund complex level, regardless of whether Fidelity achieves any such economies of scale.
The Board concluded, taking into account the analysis of the Economies of Scale Committee, that economies of scale, if any, are being appropriately shared between fund shareholders and Fidelity.
Additional Information Requested by the Board. In order to develop fully the factual basis for consideration of the Fidelity funds' advisory contracts, the Board requested and received additional information on certain topics, including: (i) fund flow and performance trends, in particular the underperformance of certain funds and strategies, and Fidelity's long-term strategies for certain funds, including any consideration of fund liquidations or mergers; (ii) the operation of performance fees and competitor use of performance fees; (iii) Fidelity's pricing philosophy compared to competitors; (iv) fund profitability methodology and data; (v) evaluation of competitive fund data and peer group classifications and fee and expense comparisons; (vi) the management fee and expense structures for different funds and classes and information about the differences between various fee and expense structures; (vii) group fee breakpoints and related voluntary fee waivers; and (viii) information regarding other accounts managed by Fidelity and the funds' sub-advisory arrangements.
Conclusion. Based on its evaluation of all of the conclusions noted above, and after considering all factors it believed relevant, the Board, including the Independent Trustees, concluded that the advisory and sub-advisory fee arrangements are fair and reasonable in light of all of the surrounding circumstances and that the fund's Advisory Contracts should be renewed through July 31, 2024.
1.9904429.101
SIC-ANN-1223
Fidelity® SAI Sustainable International Equity Fund
Annual Report
October 31, 2023
Offered exclusively to certain clients of the Adviser, or its affiliates, including Strategic Advisers LLC (Strategic Advisers) - not available for sale to the general public. Fidelity® SAI is a product name of Fidelity® funds dedicated to certain programs affiliated with Strategic Advisers.
Contents
To view a fund's proxy voting guidelines and proxy voting record for the 12-month period ended June 30, visit http://www.fidelity.com/proxyvotingresults or visit the Securities and Exchange Commission's (SEC) web site at http://www.sec.gov.
You may also call 1-800-544-3455 to request a free copy of the proxy voting guidelines.
Standard & Poor's, S&P and S&P 500 are registered service marks of The McGraw-Hill Companies, Inc. and have been licensed for use by Fidelity Distributors Corporation.
Other third-party marks appearing herein are the property of their respective owners.
All other marks appearing herein are registered or unregistered trademarks or service marks of FMR LLC or an affiliated company. © 2023 FMR LLC. All rights reserved.
This report and the financial statements contained herein are submitted for the general information of the shareholders of the Fund. This report is not authorized for distribution to prospective investors in the Fund unless preceded or accompanied by an effective prospectus.
A fund files its complete schedule of portfolio holdings with the SEC for the first and third quarters of each fiscal year on Form N-PORT. Forms N-PORT are available on the SEC's web site at http://www.sec.gov. A fund's Forms N-PORT may be reviewed and copied at the SEC's Public Reference Room in Washington, DC. Information regarding the operation of the SEC's Public Reference Room may be obtained by calling 1-800-SEC-0330.
For a complete list of a fund's portfolio holdings, view the most recent holdings listing, semiannual report, or annual report on Fidelity's web site at http://www.fidelity.com, http://www.institutional.fidelity.com, or http://www.401k.com, as applicable.
NOT FDIC INSURED •MAY LOSE VALUE •NO BANK GUARANTEE
Neither the Fund nor Fidelity Distributors Corporation is a bank.
Average annual total return reflects the change in the value of an investment, assuming reinvestment of distributions from dividend income and capital gains (the profits earned upon the sale of securities that have grown in value, if any) and assuming a constant rate of performance each year. The hypothetical investment and the average annual total returns do not reflect the deduction of taxes that a shareholder would pay on fund distributions or the redemption of fund shares. During periods of reimbursement by Fidelity, a fund's total return will be greater than it would be had the reimbursement not occurred. How a fund did yesterday is no guarantee of how it will do tomorrow.
| Average Annual Total Returns |
| | | | |
Periods ended October 31, 2023 | Past 1 year | Life of Fund A |
| Fidelity® SAI Sustainable International Equity Fund | 10.12% | -7.42% |
A From April 14, 2022
| $10,000 Over Life of Fund |
| |
Let's say hypothetically that $10,000 was invested in Fidelity SAI Sustainable International Equity Fund, on April 14, 2022, when the fund started. The chart shows how the value of your investment would have changed, and also shows how the MSCI EAFE Index performed over the same period. |
|
|
Market Recap:
International (non-U.S.) equities gained 12.27% for the 12 months ending October 31, 2023, according to the MSCI ACWI (All Country World Index) ex USA Index, as global economic expansion and a slowing in the pace of inflation in some markets provided a favorable backdrop for risk assets. After returning -15.86% in 2022, the index's upturn has been largely driven by a narrow set of companies in the information technology and communication services sectors, in part due to excitement for generative artificial intelligence applications. The index gained 14.07% year to date through July, including strong gains in both June (+4.50%) and July (+4.07%). The rally for international equities sputtered for the next three months (-11.33%) amid a stalling pattern in disinflationary trends, heightened global recession and geopolitical risks, soaring yields on longer-term U.S. government bonds and particularly weak economic conditions in the eurozone and China. The three-month decline left non-U.S. stocks up 1.15% year to date through October. Currency fluctuation also helped bolster non-U.S. equity performance overall. For the full 12 months, nearly all regions advanced, with Europe ex U.K. (+18%) and Japan (+17%) leading, whereas Canada (-0.38%) lagged by the widest margin. Each of the 11 sectors advanced, with information technology (+21%) and consumer discretionary (+19%) leading the way. Energy and industrials each rose about 14%. Conversely, four defensive-oriented sectors lagged by the widest margin: real estate (+4%), health care (+6%), consumer staples (+7%) and utilities (+8%).
Comments from Co-Managers Niamh Brodie-Machura and William Kennedy:
For the fiscal year ending October 31, 2023, the fund gained 10.12%, versus 14.65% for the benchmark MSCI EAFE Index (Net MA). From a regional standpoint, stock picks in Europe ex the U.K. and investment choices in the U.K. notably detracted from the fund's relative result. Stock picks in emerging markets and Canada also hindered performance versus the benchmark. By sector, security selection was the primary detractor, especially within financials, where our picks among banks hurt most. Investment choices in the consumer discretionary and utilities sectors and positioning in energy also hurt. The largest individual relative detractor was an overweight in Finland-based Neste (-21%), a position we increased this period. A non-benchmark stake in HDFC Bank (-9%), which is in India, and exposure to Orsted (-29%) in Denmark also hurt relative performance. Orsted was not held at period end. In contrast, from a regional standpoint, an underweight in Asia Pacific ex Japan helped the fund's performance versus the benchmark. By sector, the biggest contributor to the fund's relative performance was security selection in health care, primarily within the pharmaceuticals, biotechnology & life sciences industry. Stock picks in information technology, primarily within the technology hardware & equipment segment, and an underweight in real estate also boosted relative performance. The top individual relative contributor was an overweight in Denmark-headquartered Novo-Nordisk (+44%), the fund's top holding as of period end. This was a stake we established this period. Other notable relative contributors included overweights in Itochu (+40%) and Hitachi (+39%), Japan-based companies that were among the fund's largest holdings. Notable changes in positioning include an increased cash position. By sector, meaningful changes include increased exposure to the information technology sector and a lower allocation to consumer discretionary.
Note to shareholders:
Application of FMR's environmental, social, and governance (ESG) ratings process and/or its sustainable investing exclusion criteria may affect the Fund's exposure to certain issuers, sectors, regions, and countries and may affect the Fund's performance.
The views expressed above reflect those of the portfolio manager(s) only through the end of the period as stated on the cover of this report and do not necessarily represent the views of Fidelity or any other person in the Fidelity organization. Any such views are subject to change at any time based upon market or other conditions and Fidelity disclaims any responsibility to update such views. These views may not be relied on as investment advice and, because investment decisions for a Fidelity fund are based on numerous factors, may not be relied on as an indication of trading intent on behalf of any Fidelity fund.
Top Holdings (% of Fund's net assets) |
| |
| Novo Nordisk A/S Series B (Denmark, Pharmaceuticals) | 5.5 | |
| AstraZeneca PLC (United Kingdom) (United Kingdom, Pharmaceuticals) | 3.6 | |
| Sony Group Corp. (Japan, Household Durables) | 3.5 | |
| ASML Holding NV (Netherlands) (Netherlands, Semiconductors & Semiconductor Equipment) | 3.1 | |
| Nestle SA (Reg. S) (United States of America, Food Products) | 2.9 | |
| Itochu Corp. (Japan, Trading Companies & Distributors) | 2.8 | |
| ORIX Corp. (Japan, Financial Services) | 2.7 | |
| Hitachi Ltd. (Japan, Industrial Conglomerates) | 2.5 | |
| LVMH Moet Hennessy Louis Vuitton SE (France, Textiles, Apparel & Luxury Goods) | 2.3 | |
| Koninklijke KPN NV (Netherlands, Diversified Telecommunication Services) | 2.1 | |
| | 31.0 | |
| |
| Market Sectors (% of Fund's net assets) |
| |
| Financials | 21.0 | |
| Health Care | 14.2 | |
| Industrials | 12.8 | |
| Information Technology | 12.6 | |
| Consumer Discretionary | 9.9 | |
| Consumer Staples | 9.3 | |
| Materials | 6.5 | |
| Utilities | 3.9 | |
| Communication Services | 2.2 | |
| Energy | 1.1 | |
| Real Estate | 0.6 | |
| |
Asset Allocation (% of Fund's net assets) |
|
|
Geographic Diversification (% of Fund's net assets) |
|
* Includes Short-Term investments and Net Other Assets (Liabilities). Percentages are adjusted for the effect of derivatives, if applicable. |
| |
Showing Percentage of Net Assets
| Common Stocks - 94.1% |
| | | Shares | Value ($) |
| Australia - 1.7% | | | |
| Bapcor Ltd. | | 18,927 | 64,425 |
| Macquarie Group Ltd. | | 980 | 100,734 |
TOTAL AUSTRALIA | | | 165,159 |
| Austria - 2.0% | | | |
| Verbund AG | | 1,436 | 124,593 |
| Wienerberger AG | | 2,866 | 69,566 |
TOTAL AUSTRIA | | | 194,159 |
| Belgium - 1.4% | | | |
| KBC Group NV | | 823 | 45,195 |
| UCB SA | | 1,214 | 88,710 |
TOTAL BELGIUM | | | 133,905 |
| China - 0.4% | | | |
| Chervon Holdings Ltd. | | 17,516 | 43,143 |
| Denmark - 5.9% | | | |
| Novo Nordisk A/S Series B | | 5,498 | 530,424 |
| Vestas Wind Systems A/S (a) | | 1,863 | 40,380 |
TOTAL DENMARK | | | 570,804 |
| Finland - 1.1% | | | |
| Neste OYJ | | 3,090 | 103,677 |
| France - 11.7% | | | |
| Air Liquide SA | | 723 | 123,888 |
| AXA SA | | 5,681 | 168,330 |
| BNP Paribas SA | | 2,965 | 170,499 |
| Capgemini SA | | 371 | 65,566 |
| Edenred SA | | 922 | 49,013 |
| L'Oreal SA | | 381 | 160,146 |
| LVMH Moet Hennessy Louis Vuitton SE | | 310 | 221,938 |
| Pernod Ricard SA | | 927 | 164,294 |
| Worldline SA (a)(b) | | 840 | 10,648 |
TOTAL FRANCE | | | 1,134,322 |
| Germany - 7.9% | | | |
| Deutsche Borse AG | | 526 | 86,578 |
| DHL Group | | 1,756 | 68,301 |
| Gerresheimer AG | | 399 | 37,110 |
| Merck KGaA | | 1,073 | 161,616 |
| Muenchener Rueckversicherungs-Gesellschaft AG in Muenchen | | 415 | 166,204 |
| SAP SE | | 569 | 76,321 |
| Siemens AG | | 1,285 | 170,518 |
TOTAL GERMANY | | | 766,648 |
| Hong Kong - 3.5% | | | |
| AIA Group Ltd. | | 23,155 | 201,074 |
| Hang Seng Bank Ltd. | | 7,326 | 83,759 |
| Prudential PLC | | 5,603 | 58,587 |
TOTAL HONG KONG | | | 343,420 |
| India - 1.2% | | | |
| HDFC Bank Ltd. sponsored ADR | | 2,041 | 115,419 |
| Ireland - 1.3% | | | |
| Dalata Hotel Group PLC | | 21,850 | 92,709 |
| Kingspan Group PLC (Ireland) | | 445 | 29,890 |
TOTAL IRELAND | | | 122,599 |
| Italy - 0.9% | | | |
| Prysmian SpA | | 2,446 | 91,334 |
| Japan - 17.8% | | | |
| Eisai Co. Ltd. | | 779 | 41,270 |
| FUJIFILM Holdings Corp. | | 2,493 | 136,362 |
| Fujitsu Ltd. | | 782 | 101,306 |
| Hitachi Ltd. | | 3,865 | 244,989 |
| Hoya Corp. | | 1,697 | 163,368 |
| Itochu Corp. | | 7,440 | 267,996 |
| ORIX Corp. | | 14,237 | 258,919 |
| Persol Holdings Co. Ltd. | | 36,646 | 54,948 |
| Sony Group Corp. | | 4,110 | 341,701 |
| TIS, Inc. | | 1,511 | 32,358 |
| Tokyo Electron Ltd. | | 659 | 87,079 |
TOTAL JAPAN | | | 1,730,296 |
| Korea (South) - 0.7% | | | |
| SK Hynix, Inc. | | 725 | 62,867 |
| Netherlands - 9.1% | | | |
| ASML Holding NV (Netherlands) | | 507 | 304,768 |
| BE Semiconductor Industries NV | | 431 | 44,373 |
| Heineken NV (Bearer) | | 806 | 72,414 |
| ING Groep NV (Certificaten Van Aandelen) | | 10,219 | 131,013 |
| Koninklijke KPN NV | | 61,207 | 205,728 |
| Wolters Kluwer NV | | 964 | 123,523 |
TOTAL NETHERLANDS | | | 881,819 |
| New Zealand - 0.8% | | | |
| Contact Energy Ltd. | | 17,334 | 78,739 |
| Norway - 1.9% | | | |
| DNB Bank ASA | | 9,827 | 177,082 |
| Schibsted ASA (A Shares) | | 436 | 8,711 |
TOTAL NORWAY | | | 185,793 |
| Spain - 1.3% | | | |
| CaixaBank SA | | 8,028 | 32,638 |
| EDP Renovaveis SA | | 916 | 14,722 |
| Iberdrola SA | | 7,490 | 83,304 |
TOTAL SPAIN | | | 130,664 |
| Sweden - 1.9% | | | |
| Boliden AB | | 4,863 | 124,489 |
| Instalco AB | | 2,493 | 6,964 |
| Investor AB (B Shares) | | 2,180 | 39,919 |
| Lagercrantz Group AB (B Shares) | | 1,022 | 9,311 |
TOTAL SWEDEN | | | 180,683 |
| Taiwan - 2.1% | | | |
| Taiwan Semiconductor Manufacturing Co. Ltd. | | 12,530 | 204,489 |
| United Kingdom - 12.9% | | | |
| 3i Group PLC | | 2,607 | 61,467 |
| AstraZeneca PLC (United Kingdom) | | 2,778 | 347,816 |
| Barratt Developments PLC | | 7,936 | 39,924 |
| Beazley PLC | | 4,465 | 27,922 |
| Big Yellow Group PLC | | 1,453 | 16,866 |
| Bunzl PLC | | 842 | 30,006 |
| Compass Group PLC | | 6,326 | 159,487 |
| Diageo PLC | | 4,203 | 158,941 |
| Endava PLC ADR (a) | | 357 | 17,907 |
| Grainger Trust PLC | | 15,431 | 42,650 |
| Impax Asset Management Group PLC | | 1,162 | 5,438 |
| London Stock Exchange Group PLC | | 490 | 49,439 |
| National Grid PLC | | 6,141 | 73,219 |
| Reckitt Benckiser Group PLC | | 1,208 | 80,824 |
| Renewi PLC (a) | | 1,489 | 10,624 |
| Sage Group PLC | | 6,297 | 74,287 |
| Smart Metering Systems PLC | | 7,445 | 57,823 |
TOTAL UNITED KINGDOM | | | 1,254,640 |
| United States of America - 6.6% | | | |
| CRH PLC | | 3,391 | 182,216 |
| Ferguson PLC | | 343 | 51,404 |
| Linde PLC | | 333 | 127,259 |
| Nestle SA (Reg. S) | | 2,548 | 274,773 |
TOTAL UNITED STATES OF AMERICA | | | 635,652 |
| TOTAL COMMON STOCKS (Cost $9,466,195) | | | 9,130,231 |
| | | | |
| Money Market Funds - 7.3% |
| | | Shares | Value ($) |
Fidelity Cash Central Fund 5.40% (c) (Cost $712,258) | | 712,116 | 712,258 |
| | | | |
| TOTAL INVESTMENT IN SECURITIES - 101.4% (Cost $10,178,453) | 9,842,489 |
NET OTHER ASSETS (LIABILITIES) - (1.4)% | (137,532) |
| NET ASSETS - 100.0% | 9,704,957 |
| | |
Legend
| (b) | Security exempt from registration under Rule 144A of the Securities Act of 1933. These securities may be resold in transactions exempt from registration, normally to qualified institutional buyers. At the end of the period, the value of these securities amounted to $10,648 or 0.1% of net assets. |
| (c) | Affiliated fund that is generally available only to investment companies and other accounts managed by Fidelity Investments. The rate quoted is the annualized seven-day yield of the fund at period end. A complete unaudited listing of the fund's holdings as of its most recent quarter end is available upon request. In addition, each Fidelity Central Fund's financial statements, which are not covered by the Fund's Report of Independent Registered Public Accounting Firm, are available on the SEC's website or upon request. |
Affiliated Central Funds
Fiscal year to date information regarding the Fund's investments in Fidelity Central Funds, including the ownership percentage, is presented below.
| Affiliate | Value, beginning of period ($) | Purchases ($) | Sales Proceeds ($) | Dividend Income ($) | Realized Gain (loss) ($) | Change in Unrealized appreciation (depreciation) ($) | Value, end of period ($) | % ownership, end of period |
| Fidelity Cash Central Fund 5.40% | 102,083 | 4,154,689 | 3,544,514 | 10,846 | - | - | 712,258 | 0.0% |
| Total | 102,083 | 4,154,689 | 3,544,514 | 10,846 | - | - | 712,258 | |
| | | | | | | | | |
Amounts in the dividend income column in the above table include any capital gain distributions from underlying funds, which are presented in the corresponding line item in the Statement of Operations, if applicable.
Amounts included in the purchases and sales proceeds columns may include in-kind transactions, if applicable.
Investment Valuation
The following is a summary of the inputs used, as of October 31, 2023, involving the Fund's assets and liabilities carried at fair value. The inputs or methodology used for valuing securities may not be an indication of the risk associated with investing in those securities. For more information on valuation inputs, and their aggregation into the levels used below, please refer to the Investment Valuation section in the accompanying Notes to Financial Statements.
| Valuation Inputs at Reporting Date: |
| Description | Total ($) | Level 1 ($) | Level 2 ($) | Level 3 ($) |
Investments in Securities: | | | | |
|
| Equities: | | | | |
Communication Services | 214,439 | 8,711 | 205,728 | - |
Consumer Discretionary | 963,327 | 132,633 | 830,694 | - |
Consumer Staples | 911,392 | 164,294 | 747,098 | - |
Energy | 103,677 | 103,677 | - | - |
Financials | 2,039,877 | 636,840 | 1,403,037 | - |
Health Care | 1,370,314 | 287,436 | 1,082,878 | - |
Industrials | 1,248,700 | 469,869 | 778,831 | - |
Information Technology | 1,216,994 | 145,878 | 1,071,116 | - |
Materials | 627,418 | 503,530 | 123,888 | - |
Real Estate | 59,516 | 59,516 | - | - |
Utilities | 374,577 | 139,315 | 235,262 | - |
|
| Money Market Funds | 712,258 | 712,258 | - | - |
| Total Investments in Securities: | 9,842,489 | 3,363,957 | 6,478,532 | - |
| Statement of Assets and Liabilities |
| | | | October 31, 2023 |
| | | | | |
| Assets | | | | |
| Investment in securities, at value - See accompanying schedule: | | | | |
Unaffiliated issuers (cost $9,466,195) | $ | 9,130,231 | | |
Fidelity Central Funds (cost $712,258) | | 712,258 | | |
| | | | | |
| | | | | |
| Total Investment in Securities (cost $10,178,453) | | | $ | 9,842,489 |
| Foreign currency held at value (cost $5,315) | | | | 5,315 |
| Receivable for fund shares sold | | | | 149,371 |
| Dividends receivable | | | | 13,020 |
| Reclaims receivable | | | | 9,333 |
| Distributions receivable from Fidelity Central Funds | | | | 2,693 |
| Prepaid expenses | | | | 7 |
| Receivable from investment adviser for expense reductions | | | | 8,884 |
| Other receivables | | | | 73 |
Total assets | | | | 10,031,185 |
| Liabilities | | | | |
| Payable for investments purchased | $ | 268,591 | | |
| Payable for fund shares redeemed | | 1,403 | | |
| Accrued management fee | | 4,512 | | |
| Audit fee payable | | 36,050 | | |
| Other payables and accrued expenses | | 15,672 | | |
| Total Liabilities | | | | 326,228 |
| Net Assets | | | $ | 9,704,957 |
| Net Assets consist of: | | | | |
| Paid in capital | | | $ | 10,195,248 |
| Total accumulated earnings (loss) | | | | (490,291) |
| Net Assets | | | $ | 9,704,957 |
Net Asset Value, offering price and redemption price per share ($9,704,957 ÷ 1,100,829 shares) | | | $ | 8.82 |
| Statement of Operations |
| | | | Year ended October 31, 2023 |
| Investment Income | | | | |
| Dividends | | | $ | 119,909 |
| Foreign Tax Reclaims | | | | 8,747 |
| Income from Fidelity Central Funds | | | | 10,846 |
| Income before foreign taxes withheld | | | $ | 139,502 |
| Less foreign taxes withheld | | | | (20,139) |
| Total Income | | | | 119,363 |
| Expenses | | | | |
| Management fee | $ | 31,130 | | |
| Transfer agent fees | | 478 | | |
| Custodian fees and expenses | | 31,149 | | |
| Independent trustees' fees and expenses | | 20 | | |
| Registration fees | | 29,780 | | |
| Audit | | 52,671 | | |
| Legal | | 3 | | |
| Miscellaneous | | 11 | | |
| Total expenses before reductions | | 145,242 | | |
| Expense reductions | | (111,125) | | |
| Total expenses after reductions | | | | 34,117 |
| Net Investment income (loss) | | | | 85,246 |
| Realized and Unrealized Gain (Loss) | | | | |
| Net realized gain (loss) on: | | | | |
| Investment Securities: | | | | |
| Unaffiliated issuers | | (149,284) | | |
| Foreign currency transactions | | 749 | | |
| Total net realized gain (loss) | | | | (148,535) |
| Change in net unrealized appreciation (depreciation) on: | | | | |
| Investment Securities: | | | | |
| Unaffiliated issuers | | (15,214) | | |
| Assets and liabilities in foreign currencies | | (662) | | |
| Total change in net unrealized appreciation (depreciation) | | | | (15,876) |
| Net gain (loss) | | | | (164,411) |
| Net increase (decrease) in net assets resulting from operations | | | $ | (79,165) |
| Statement of Changes in Net Assets |
| |
| | Year ended October 31, 2023 | | For the period April 14, 2022 (commencement of operations) through October 31, 2022 |
| Increase (Decrease) in Net Assets | | | | |
| Operations | | | | |
| Net investment income (loss) | $ | 85,246 | $ | 18,247 |
| Net realized gain (loss) | | (148,535) | | (91,225) |
| Change in net unrealized appreciation (depreciation) | | (15,876) | | (320,866) |
| Net increase (decrease) in net assets resulting from operations | | (79,165) | | (393,844) |
| Distributions to shareholders | | (17,379) | | - |
| | | | | |
| Share transactions | | | | |
| Proceeds from sales of shares | | 8,192,591 | | 2,599,216 |
| Reinvestment of distributions | | 16,766 | | - |
| Cost of shares redeemed | | (593,538) | | (19,690) |
| | | | | |
Net increase (decrease) in net assets resulting from share transactions | | 7,615,819 | | 2,579,526 |
| Total increase (decrease) in net assets | | 7,519,275 | | 2,185,682 |
| | | | | |
| Net Assets | | | | |
| Beginning of period | | 2,185,682 | | - |
| End of period | $ | 9,704,957 | $ | 2,185,682 |
| | | | | |
| Other Information | | | | |
| Shares | | | | |
| Sold | | 892,144 | | 273,624 |
| Issued in reinvestment of distributions | | 1,851 | | - |
| Redeemed | | (64,420) | | (2,370) |
| Net increase (decrease) | | 829,575 | | 271,254 |
| | | | | |
Financial Highlights
| Fidelity SAI Sustainable International Equity Fund |
| |
| Years ended October 31, | | 2023 | | 2022 A |
Selected Per-Share Data | | | | |
| Net asset value, beginning of period | $ | 8.06 | $ | 10.00 |
| Income from Investment Operations | | | | |
Net investment income (loss) B,C | | .17 | | .08 |
| Net realized and unrealized gain (loss) | | .65 D | | (2.02) |
| Total from investment operations | | .82 | | (1.94) |
| Distributions from net investment income | | (.06) | | - |
| Total distributions | | (.06) | | - |
| Net asset value, end of period | $ | 8.82 | $ | 8.06 |
Total Return E,F | | 10.12% | | (19.40)% |
Ratios to Average Net Assets C,G,H | | | | |
| Expenses before reductions | | 3.13% | | 5.78% I,J |
| Expenses net of fee waivers, if any | | .75% | | .75% J |
| Expenses net of all reductions | | .73% | | .68% J |
| Net investment income (loss) | | 1.84% | | 1.79% J |
| Supplemental Data | | | | |
| Net assets, end of period (000 omitted) | $ | 9,705 | $ | 2,186 |
Portfolio turnover rate K | | 27% | | 51% J |
AFor the period April 14, 2022 (commencement of operations) through October 31, 2022.
BCalculated based on average shares outstanding during the period.
CNet investment income (loss) is affected by the timing of the declaration of dividends by any underlying mutual funds or exchange-traded funds (ETFs). Net investment income (loss) of any mutual funds or ETFs is not included in the Fund's net investment income (loss) ratio.
DThe amount shown for a share outstanding does not correspond with the aggregate net gain (loss) on investments for the period due to the timing of sales and repurchases of shares in relation to fluctuating market values of the investments of the Fund.
ETotal returns for periods of less than one year are not annualized.
FTotal returns would have been lower if certain expenses had not been reduced during the applicable periods shown.
GFees and expenses of any underlying mutual funds or exchange-traded funds (ETFs) are not included in the Fund's expense ratio. The Fund indirectly bears its proportionate share of these expenses. For additional expense information related to investments in Fidelity Central Funds, please refer to the "Investments in Fidelity Central Funds" note found in the Notes to Financial Statements section of the most recent Annual or Semi-Annual report.
HExpense ratios reflect operating expenses of the class. Expenses before reductions do not reflect amounts reimbursed, waived, or reduced through arrangements with the investment adviser, brokerage services, or other offset arrangements, if applicable, and do not represent the amount paid by the class during periods when reimbursements, waivers or reductions occur.
IAudit fees are not annualized.
JAnnualized.
KAmount does not include the portfolio activity of any underlying mutual funds or exchange-traded funds (ETFs).
For the period ended October 31, 2023
1. Organization.
Fidelity SAI Sustainable International Equity Fund (the Fund) is a fund of Fidelity Investment Trust (the Trust) and is authorized to issue an unlimited number of shares. Shares are offered exclusively to certain clients of Fidelity Management & Research Company LLC (FMR) or its affiliates. The Trust is registered under the Investment Company Act of 1940, as amended (the 1940 Act), as an open-end management investment company organized as a Massachusetts business trust.
2. Investments in Fidelity Central Funds.
Funds may invest in Fidelity Central Funds, which are open-end investment companies generally available only to other investment companies and accounts managed by the investment adviser and its affiliates. The Schedule of Investments lists any Fidelity Central Funds held as an investment as of period end, but does not include the underlying holdings of each Fidelity Central Fund. An investing fund indirectly bears its proportionate share of the expenses of the underlying Fidelity Central Funds.
Based on its investment objective, each Fidelity Central Fund may invest or participate in various investment vehicles or strategies that are similar to those of the investing fund. These strategies are consistent with the investment objectives of the investing fund and may involve certain economic risks which may cause a decline in value of each of the Fidelity Central Funds and thus a decline in the value of the investing fund.
| Fidelity Central Fund | Investment Manager | Investment Objective | Investment Practices | Expense RatioA |
| Fidelity Money Market Central Funds | Fidelity Management & Research Company LLC (FMR) | Each fund seeks to obtain a high level of current income consistent with the preservation of capital and liquidity. | Short-term Investments | Less than .005% |
A Expenses expressed as a percentage of average net assets and are as of each underlying Central Fund's most recent annual or semi-annual shareholder report.
A complete unaudited list of holdings for each Fidelity Central Fund is available upon request or at the Securities and Exchange Commission website at www.sec.gov. In addition, the financial statements of the Fidelity Central Funds which contain the significant accounting policies (including investment valuation policies) of those funds, and are not covered by the Report of Independent Registered Public Accounting Firm, are available on the Securities and Exchange Commission website or upon request.
3. Significant Accounting Policies.
The Fund is an investment company and applies the accounting and reporting guidance of the Financial Accounting Standards Board (FASB) Accounting Standards Codification Topic 946 Financial Services - Investment Companies. The financial statements have been prepared in conformity with accounting principles generally accepted in the United States of America (GAAP), which require management to make certain estimates and assumptions at the date of the financial statements. Actual results could differ from those estimates. Subsequent events, if any, through the date that the financial statements were issued have been evaluated in the preparation of the financial statements. The Fund's Schedule of Investments lists any underlying mutual funds or exchange-traded funds (ETFs) but does not include the underlying holdings of these funds. The following summarizes the significant accounting policies of the Fund:
Investment Valuation. Investments are valued as of 4:00 p.m. Eastern time on the last calendar day of the period. The Board of Trustees (the Board) has designated the Fund's investment adviser as the valuation designee responsible for the fair valuation function and performing fair value determinations as needed. The investment adviser has established a Fair Value Committee (the Committee) to carry out the day-to-day fair valuation responsibilities and has adopted policies and procedures to govern the fair valuation process and the activities of the Committee. In accordance with these fair valuation policies and procedures, which have been approved by the Board, the Fund attempts to obtain prices from one or more third party pricing services or brokers to value its investments. When current market prices, quotations or currency exchange rates are not readily available or reliable, investments will be fair valued in good faith by the Committee, in accordance with the policies and procedures. Factors used in determining fair value vary by investment type and may include market or investment specific events, transaction data, estimated cash flows, and market observations of comparable investments. The frequency that the fair valuation procedures are used cannot be predicted and they may be utilized to a significant extent. The Committee manages the Fund's fair valuation practices and maintains the fair valuation policies and procedures. The Fund's investment adviser reports to the Board information regarding the fair valuation process and related material matters.
The Fund categorizes the inputs to valuation techniques used to value its investments into a disclosure hierarchy consisting of three levels as shown below:
Level 1 - unadjusted quoted prices in active markets for identical investments
Level 2 - other significant observable inputs (including quoted prices for similar investments, interest rates, prepayment speeds, etc.)
Level 3 - unobservable inputs (including the Fund's own assumptions based on the best information available)
Valuation techniques used to value the Fund's investments by major category are as follows:
Equity securities, including restricted securities, for which market quotations are readily available, are valued at the last reported sale price or official closing price as reported by a third party pricing service on the primary market or exchange on which they are traded and are categorized as Level 1 in the hierarchy. In the event there were no sales during the day or closing prices are not available, securities are valued at the last quoted bid price or may be valued using the last available price and are generally categorized as Level 2 in the hierarchy. For foreign equity securities, when market or security specific events arise, comparisons to the valuation of American Depositary Receipts (ADRs), futures contracts, Exchange-Traded Funds (ETFs) and certain indexes as well as quoted prices for similar securities may be used and would be categorized as Level 2 in the hierarchy. For equity securities, including restricted securities, where observable inputs are limited, assumptions about market activity and risk are used and these securities may be categorized as Level 3 in the hierarchy.
Investments in open-end mutual funds, including the Fidelity Central Funds, are valued at their closing net asset value (NAV) each business day and are categorized as Level 1 in the hierarchy.
Changes in valuation techniques may result in transfers in or out of an assigned level within the disclosure hierarchy. The aggregate value of investments by input level as of October 31, 2023 is included at the end of the Fund's Schedule of Investments.
Foreign Currency. Certain Funds may use foreign currency contracts to facilitate transactions in foreign-denominated securities. Gains and losses from these transactions may arise from changes in the value of the foreign currency or if the counterparties do not perform under the contracts' terms.
Foreign-denominated assets, including investment securities, and liabilities are translated into U.S. dollars at the exchange rates at period end. Purchases and sales of investment securities, income and dividends received, and expenses denominated in foreign currencies are translated into U.S. dollars at the exchange rate in effect on the transaction date.
The effects of exchange rate fluctuations on investments are included with the net realized and unrealized gain (loss) on investment securities. Other foreign currency transactions resulting in realized and unrealized gain (loss) are disclosed separately.
Investment Transactions and Income. For financial reporting purposes, the Fund's investment holdings and NAV include trades executed through the end of the last business day of the period. The NAV per share for processing shareholder transactions is calculated as of the close of business of the New York Stock Exchange (NYSE), normally 4:00 p.m. Eastern time and includes trades executed through the end of the prior business day. Gains and losses on securities sold are determined on the basis of identified cost. Commissions paid to certain brokers with whom the investment adviser, or its affiliates, places trades on behalf of a fund include an amount in addition to trade execution, which may be rebated back to a fund. Any such rebates are included in net realized gain (loss) on investments in the Statement of Operations. Dividend income is recorded on the ex-dividend date, except for certain dividends from foreign securities where the ex-dividend date may have passed, which are recorded as soon as the Fund is informed of the ex-dividend date. Non-cash dividends included in dividend income, if any, are recorded at the fair market value of the securities received. Income and capital gain distributions from Fidelity Central Funds, if any, are recorded on the ex-dividend date. Investment income is recorded net of foreign taxes withheld where recovery of such taxes is uncertain. Funds may file withholding tax reclaims in certain jurisdictions to recover a portion of amounts previously withheld. Any withholding tax reclaims income is included in the Statement of Operations in foreign tax reclaims. Any receivables for withholding tax reclaims are included in the Statement of Assets and Liabilities in reclaims receivable.
Expenses. Expenses directly attributable to a fund are charged to that fund. Expenses attributable to more than one fund are allocated among the respective funds on the basis of relative net assets or other appropriate methods. Expenses included in the accompanying financial statements reflect the expenses of that fund and do not include any expenses associated with any underlying mutual funds or exchange-traded funds. Although not included in a fund's expenses, a fund indirectly bears its proportionate share of these expenses through the net asset value of each underlying mutual fund or exchange-traded fund. Expense estimates are accrued in the period to which they relate and adjustments are made when actual amounts are known.
Income Tax Information and Distributions to Shareholders. Each year, the Fund intends to qualify as a regulated investment company under Subchapter M of the Internal Revenue Code, including distributing substantially all of its taxable income and realized gains. As a result, no provision for U.S. Federal income taxes is required. As of October 31, 2023, the Fund did not have any unrecognized tax benefits in the financial statements; nor is the Fund aware of any tax positions for which it is reasonably possible that the total amounts of unrecognized tax benefits will significantly change in the next twelve months. The Fund files a U.S. federal tax return, in addition to state and local tax returns as required. The Fund's federal income tax returns are subject to examination by the Internal Revenue Service (IRS) for a period of three fiscal years after they are filed. State and local tax returns may be subject to examination for an additional fiscal year depending on the jurisdiction. Foreign taxes are provided for based on the Fund's understanding of the tax rules and rates that exist in the foreign markets in which it invests.
Distributions are declared and recorded on the ex-dividend date. Income and capital gain distributions are determined in accordance with income tax regulations, which may differ from GAAP.
Capital accounts within the financial statements are adjusted for permanent book-tax differences. These adjustments have no impact on net assets or the results of operations. Capital accounts are not adjusted for temporary book-tax differences which will reverse in a subsequent period.
Book-tax differences are primarily due to foreign currency transactions, passive foreign investment companies (PFIC), capital loss carryforwards and losses deferred due to wash sales.
As of period end, the cost and unrealized appreciation (depreciation) in securities, and derivatives if applicable, for federal income tax purposes were as follows:
| Gross unrealized appreciation | $292,572 |
| Gross unrealized depreciation | (676,241) |
| Net unrealized appreciation (depreciation) | $(383,669) |
| Tax Cost | $10,226,158 |
The tax-based components of distributable earnings as of period end were as follows:
| Undistributed ordinary income | $94,201 |
| Capital loss carryforward | $(200,044) |
| Net unrealized appreciation (depreciation) on securities and other investments | $(384,447) |
Capital loss carryforwards are only available to offset future capital gains of the Fund to the extent provided by regulations and may be limited. The capital loss carryforward information presented below, including any applicable limitation, is estimated as of fiscal period end and is subject to adjustment.
| Short-term | $(157,729) |
| Long-term | (42,315) |
| Total capital loss carryforward | $(200,044) |
The tax character of distributions paid was as follows:
| | October 31, 2023 |
| Ordinary Income | $17,379 |
Restricted Securities (including Private Placements). Funds may invest in securities that are subject to legal or contractual restrictions on resale. These securities generally may be resold in transactions exempt from registration or to the public if the securities are registered. Disposal of these securities may involve time-consuming negotiations and expense, and prompt sale at an acceptable price may be difficult. Information regarding restricted securities held at period end is included at the end of the Schedule of Investments, if applicable.
4. Purchases and Sales of Investments.
Purchases and sales of securities, other than short-term securities and in-kind transactions, as applicable, are noted in the table below.
| | Purchases ($) | Sales ($) |
| Fidelity SAI Sustainable International Equity Fund | 8,397,335 | 1,227,922 |
5. Fees and Other Transactions with Affiliates.
Management Fee. Fidelity Management & Research Company LLC (the investment adviser) and its affiliates provide the Fund with investment management related services for which the Fund pays a monthly management fee. The management fee is the sum of an individual fund fee rate that is based on an annual rate of .45% of the Fund's average net assets and an annualized group fee rate that averaged .23% during the period. The group fee rate is based upon the monthly average net assets of a group of registered investment companies with which the investment adviser has management contracts. The group fee rate decreases as assets under management increase and increases as assets under management decrease. For the reporting period, the total annual management fee rate was .67% of the Fund's average net assets.
Brokerage Commissions. A portion of portfolio transactions were placed with brokerage firms which are affiliates of the investment adviser. Brokerage commissions are included in net realized gain (loss) and change in net unrealized appreciation (depreciation) in the Statement of Operations. The commissions paid to these affiliated firms were as follows:
| | Amount |
| Fidelity SAI Sustainable International Equity Fund | $1 |
Interfund Trades. Funds may purchase from or sell securities to other Fidelity Funds under procedures adopted by the Board. The procedures have been designed to ensure these interfund trades are executed in accordance with Rule 17a-7 of the 1940 Act. Any interfund trades are included within the respective purchases and sales amounts shown in the Purchases and Sales of Investments note. Interfund trades during the period are noted in the table below.
| | Purchases ($) | Sales ($) | Realized Gain (Loss) ($) |
| Fidelity SAI Sustainable International Equity Fund | 540,426 | 41,225 | (2,904) |
6. Committed Line of Credit.
Certain Funds participate with other funds managed by the investment adviser or an affiliate in a $4.25 billion credit facility (the "line of credit") to be utilized for temporary or emergency purposes to fund shareholder redemptions or for other short-term liquidity purposes. The participating funds have agreed to pay commitment fees on their pro-rata portion of the line of credit, which are reflected in Miscellaneous expenses on the Statement of Operations, and are listed below. During the period, there were no borrowings on this line of credit.
| | Amount |
| Fidelity SAI Sustainable International Equity Fund | $5 |
7. Expense Reductions.
The investment adviser contractually agreed to reimburse the Fund to the extent annual operating expenses exceeded .75% of average net assets. This reimbursement will remain in place through February 28, 2025. Some expenses, for example the compensation of the independent Trustees, and certain miscellaneous expenses such as proxy and shareholder meeting expenses, are excluded from this reimbursement. During the period this reimbursement reduced the Fund's expenses by $110,531.
Through arrangements with the Fund's custodian, credits realized as a result of certain uninvested cash balances were used to reduce the Fund's expenses by $406.
In addition, during the period the investment adviser or an affiliate reimbursed and/or waived a portion of operating expenses in the amount of $188.
8. Other.
A fund's organizational documents provide former and current trustees and officers with a limited indemnification against liabilities arising in connection with the performance of their duties to the fund. In the normal course of business, a fund may also enter into contracts that provide general indemnifications. A fund's maximum exposure under these arrangements is unknown as this would be dependent on future claims that may be made against a fund. The risk of material loss from such claims is considered remote.
At the end of the period, the investment adviser or its affiliates were owners of record of more than 10% of the outstanding shares as follows:
| Fund | Affiliated % |
Fidelity SAI Sustainable International Equity Fund | 19% |
9. Risk and Uncertainties.
Many factors affect a fund's performance. Developments that disrupt global economies and financial markets, such as pandemics, epidemics, outbreaks of infectious diseases, war, terrorism, and environmental disasters, may significantly affect a fund's investment performance. The effects of these developments to a fund will be impacted by the types of securities in which a fund invests, the financial condition, industry, economic sector, and geographic location of an issuer, and a fund's level of investment in the securities of that issuer. Significant concentrations in security types, issuers, industries, sectors, and geographic locations may magnify the factors that affect a fund's performance.
To the Board of Trustees of Fidelity Investment Trust and the Shareholders of Fidelity SAI Sustainable International Equity Fund:
Opinion on the Financial Statements and Financial Highlights
We have audited the accompanying statement of assets and liabilities of Fidelity SAI Sustainable International Equity Fund (the "Fund"), a fund of Fidelity Investment Trust, including the schedule of investments, as of October 31, 2023, the related statement of operations for the year then ended, and the statement of changes in net assets and the financial highlights for the year then ended and for the period from April 14, 2022 (commencement of operations) through October 31, 2022, and the related notes. In our opinion, the financial statements and financial highlights present fairly, in all material respects, the financial position of the Fund as of October 31, 2023, and the results of its operations for the year then ended, and the changes in its net assets and financial highlights for the year then ended and for the period from April 14, 2022 (commencement of operations) through October 31, 2022, in conformity with accounting principles generally accepted in the United States of America.
Basis for Opinion
These financial statements and financial highlights are the responsibility of the Fund's management. Our responsibility is to express an opinion on the Fund's financial statements and financial highlights based on our audits. We are a public accounting firm registered with the Public Company Accounting Oversight Board (United States) (PCAOB) and are required to be independent with respect to the Fund in accordance with the U.S. federal securities laws and the applicable rules and regulations of the Securities and Exchange Commission and the PCAOB.
We conducted our audits in accordance with the standards of the PCAOB. Those standards require that we plan and perform the audit to obtain reasonable assurance about whether the financial statements and financial highlights are free of material misstatement, whether due to error or fraud. The Fund is not required to have, nor were we engaged to perform, an audit of its internal control over financial reporting. As part of our audits we are required to obtain an understanding of internal control over financial reporting but not for the purpose of expressing an opinion on the effectiveness of the Fund's internal control over financial reporting. Accordingly, we express no such opinion.
Our audits included performing procedures to assess the risks of material misstatement of the financial statements and financial highlights, whether due to error or fraud, and performing procedures that respond to those risks. Such procedures included examining, on a test basis, evidence regarding the amounts and disclosures in the financial statements and financial highlights. Our audits also included evaluating the accounting principles used and significant estimates made by management, as well as evaluating the overall presentation of the financial statements and financial highlights. Our procedures included confirmation of securities owned as of October 31, 2023, by correspondence with the custodian and brokers; when replies were not received from brokers, we performed other auditing procedures. We believe that our audits provide a reasonable basis for our opinion.
/s/ Deloitte & Touche LLP
Boston, Massachusetts
December 12, 2023
We have served as the auditor of one or more of the Fidelity investment companies since 1999.
The Trustees, Members of the Advisory Board (if any), and officers of the trust and fund, as applicable, are listed below. The Board of Trustees governs the fund and is responsible for protecting the interests of shareholders. The Trustees are experienced executives who meet periodically throughout the year to oversee the fund's activities, review contractual arrangements with companies that provide services to the fund, oversee management of the risks associated with such activities and contractual arrangements, and review the fund's performance. Except for Jonathan Chiel, each of the Trustees oversees 322 funds. Mr. Chiel oversees 191 funds.
The Trustees hold office without limit in time except that (a) any Trustee may resign; (b) any Trustee may be removed by written instrument, signed by at least two-thirds of the number of Trustees prior to such removal; (c) any Trustee who requests to be retired or who has become incapacitated by illness or injury may be retired by written instrument signed by a majority of the other Trustees; and (d) any Trustee may be removed at any special meeting of shareholders by a two-thirds vote of the outstanding voting securities of the trust. Each Trustee who is not an interested person (as defined in the 1940 Act) of the trust and the fund is referred to herein as an Independent Trustee. Each Independent Trustee shall retire not later than the last day of the calendar year in which his or her 75th birthday occurs. The Independent Trustees may waive this mandatory retirement age policy with respect to individual Trustees. Officers and Advisory Board Members hold office without limit in time, except that any officer or Advisory Board Member may resign or may be removed by a vote of a majority of the Trustees at any regular meeting or any special meeting of the Trustees. Except as indicated, each individual has held the office shown or other offices in the same company for the past five years.
The fund's Statement of Additional Information (SAI) includes more information about the Trustees. To request a free copy, call Fidelity at 1-800-544-3455.
Experience, Skills, Attributes, and Qualifications of the Trustees. The Governance and Nominating Committee has adopted a statement of policy that describes the experience, qualifications, attributes, and skills that are necessary and desirable for potential Independent Trustee candidates (Statement of Policy). The Board believes that each Trustee satisfied at the time he or she was initially elected or appointed a Trustee, and continues to satisfy, the standards contemplated by the Statement of Policy. The Governance and Nominating Committee also engages professional search firms to help identify potential Independent Trustee candidates who have the experience, qualifications, attributes, and skills consistent with the Statement of Policy. From time to time, additional criteria based on the composition and skills of the current Independent Trustees, as well as experience or skills that may be appropriate in light of future changes to board composition, business conditions, and regulatory or other developments, have also been considered by the professional search firms and the Governance and Nominating Committee. In addition, the Board takes into account the Trustees' commitment and participation in Board and committee meetings, as well as their leadership of standing and ad hoc committees throughout their tenure.
In determining that a particular Trustee was and continues to be qualified to serve as a Trustee, the Board has considered a variety of criteria, none of which, in isolation, was controlling. The Board believes that, collectively, the Trustees have balanced and diverse experience, qualifications, attributes, and skills, which allow the Board to operate effectively in governing the fund and protecting the interests of shareholders. Information about the specific experience, skills, attributes, and qualifications of each Trustee, which in each case led to the Board's conclusion that the Trustee should serve (or continue to serve) as a trustee of the fund, is provided below.
Board Structure and Oversight Function. Robert A. Lawrence is an interested person and currently serves as Chair. The Trustees have determined that an interested Chair is appropriate and benefits shareholders because an interested Chair has a personal and professional stake in the quality and continuity of services provided to the fund. Independent Trustees exercise their informed business judgment to appoint an individual of their choosing to serve as Chair, regardless of whether the Trustee happens to be independent or a member of management. The Independent Trustees have determined that they can act independently and effectively without having an Independent Trustee serve as Chair and that a key structural component for assuring that they are in a position to do so is for the Independent Trustees to constitute a substantial majority for the Board. The Independent Trustees also regularly meet in executive session. David M. Thomas serves as Lead Independent Trustee and as such (i) acts as a liaison between the Independent Trustees and management with respect to matters important to the Independent Trustees and (ii) with management prepares agendas for Board meetings.
Fidelity® funds are overseen by different Boards of Trustees. The fund's Board oversees Fidelity's high income and certain equity funds, and other Boards oversee Fidelity's alternative investment, investment-grade bond, money market, asset allocation, and other equity funds. The asset allocation funds may invest in Fidelity® funds overseen by the fund's Board. The use of separate Boards, each with its own committee structure, allows the Trustees of each group of Fidelity® funds to focus on the unique issues of the funds they oversee, including common research, investment, and operational issues. On occasion, the separate Boards establish joint committees to address issues of overlapping consequences for the Fidelity® funds overseen by each Board.
The Trustees operate using a system of committees to facilitate the timely and efficient consideration of all matters of importance to the Trustees, the fund, and fund shareholders and to facilitate compliance with legal and regulatory requirements and oversight of the fund's activities and associated risks. The Board, acting through its committees, has charged FMR and its affiliates with (i) identifying events or circumstances the occurrence of which could have demonstrably adverse effects on the fund's business and/or reputation; (ii) implementing processes and controls to lessen the possibility that such events or circumstances occur or to mitigate the effects of such events or circumstances if they do occur; and (iii) creating and maintaining a system designed to evaluate continuously business and market conditions in order to facilitate the identification and implementation processes described in (i) and (ii) above. Because the day-to-day operations and activities of the fund are carried out by or through FMR, its affiliates, and other service providers, the fund's exposure to risks is mitigated but not eliminated by the processes overseen by the Trustees. While each of the Board's committees has responsibility for overseeing different aspects of the fund's activities, oversight is exercised primarily through the Operations, Audit, and Compliance Committees. Appropriate personnel, including but not limited to the fund's Chief Compliance Officer (CCO), FMR's internal auditor, the independent accountants, the fund's Treasurer and portfolio management personnel, make periodic reports to the Board's committees, as appropriate, including an annual review of Fidelity's risk management program for the Fidelity® funds. The responsibilities of each standing committee, including their oversight responsibilities, are described further under "Standing Committees of the Trustees."
Interested Trustees*:
Correspondence intended for a Trustee who is an interested person may be sent to Fidelity Investments, 245 Summer Street, Boston, Massachusetts 02210.
Name, Year of Birth; Principal Occupations and Other Relevant Experience+
Jonathan Chiel (1957)
Year of Election or Appointment: 2016
Trustee
Mr. Chiel also serves as Trustee of other Fidelity® funds. Mr. Chiel is General Counsel (2012-present) and Head of Legal, Risk and Compliance (2022-present). Mr Chiel serves as Executive Vice President and General Counsel for FMR LLC (diversified financial services company, 2012-present) and Director and President for OH Company LLC (holding company, 2018-present). Previously, Mr. Chiel served as general counsel (2004-2012) and senior vice president and deputy general counsel (2000-2004) for John Hancock Financial Services; a partner with Choate, Hall & Stewart (1996-2000) (law firm); and an Assistant United States Attorney for the United States Attorney's Office of the District of Massachusetts (1986-95), including Chief of the Criminal Division (1993-1995). Mr. Chiel is a director on the boards of the Boston Bar Foundation and the Maimonides School.
Bettina Doulton (1964)
Year of Election or Appointment: 2021
Trustee
Ms. Doulton also serves as Trustee of other Fidelity® funds. Prior to her retirement, Ms. Doulton served in a variety of positions at Fidelity Investments, including as a managing director of research (2006-2007), portfolio manager to certain Fidelity® funds (1993-2005), equity analyst and portfolio assistant (1990-1993), and research assistant (1987-1990). Ms. Doulton currently owns and operates Phi Builders + Architects and Cellardoor Winery. Previously, Ms. Doulton served as a member of the Board of Brown Capital Management, LLC (2014-2018).
Robert A. Lawrence (1952)
Year of Election or Appointment: 2020
Trustee
Chair of the Board of Trustees
Mr. Lawrence also serves as Trustee of other funds. Previously, Mr. Lawrence served as a Trustee and Member of the Advisory Board of certain funds. Prior to his retirement in 2008, Mr. Lawrence served as Vice President of certain Fidelity® funds (2006-2008), Senior Vice President, Head of High Income Division of Fidelity Management & Research Company (investment adviser firm, 2006-2008), and President of Fidelity Strategic Investments (investment adviser firm, 2002-2005).
* Determined to be an "Interested Trustee" by virtue of, among other things, his or her affiliation with the trust or various entities under common control with FMR.
+ The information includes the Trustee's principal occupation during the last five years and other information relating to the experience, attributes, and skills relevant to the Trustee's qualifications to serve as a Trustee, which led to the conclusion that the Trustee should serve as a Trustee for the fund.
Independent Trustees:
Correspondence intended for an Independent Trustee may be sent to Fidelity Investments, P.O. Box 55235, Boston, Massachusetts 02205-5235.
Name, Year of Birth; Principal Occupations and Other Relevant Experience+
Thomas P. Bostick (1956)
Year of Election or Appointment: 2021
Trustee
Lieutenant General Bostick also serves as Trustee of other Fidelity® funds. Prior to his retirement, General Bostick (United States Army, Retired) held a variety of positions within the U.S. Army, including Commanding General and Chief of Engineers, U.S. Army Corps of Engineers (2012-2016) and Deputy Chief of Staff and Director of Human Resources, U.S. Army (2009-2012). General Bostick currently serves as a member of the Board and Finance and Governance & Sustainability Committees of CSX Corporation (transportation, 2020-present) and a member of the Board and Corporate Governance and Nominating Committee of Perma-Fix Environmental Services, Inc. (nuclear waste management, 2020-present). General Bostick serves as Chief Executive Officer of Bostick Global Strategies, LLC (consulting, 2016-present), as a member of the Board of HireVue, Inc. (video interview and assessment, 2020-present), as a member of the Board of Allonnia (biotechnology and engineering solutions, 2022-present) and on the Advisory Board of Solugen, Inc. (specialty bio-based chemicals manufacturer, 2022-present). Previously, General Bostick served as a Member of the Advisory Board of certain Fidelity® funds (2021), President, Intrexon Bioengineering (2018-2020) and Chief Operating Officer (2017-2020) and Senior Vice President of the Environment Sector (2016-2017) of Intrexon Corporation (biopharmaceutical company).
Dennis J. Dirks (1948)
Year of Election or Appointment: 2005
Trustee
Mr. Dirks also serves as Trustee of other Fidelity® funds. Prior to his retirement in May 2003, Mr. Dirks served as Chief Operating Officer and as a member of the Board of The Depository Trust & Clearing Corporation (financial markets infrastructure), President, Chief Operating Officer and a member of the Board of The Depository Trust Company (DTC), President and a member of the Board of the National Securities Clearing Corporation (NSCC), Chief Executive Officer and a member of the Board of the Government Securities Clearing Corporation and Chief Executive Officer and a member of the Board of the Mortgage-Backed Securities Clearing Corporation. Mr. Dirks currently serves as a member of the Finance Committee (2016-present) and Board (2017-present) and is Treasurer (2018-present) of the Asolo Repertory Theatre.
Donald F. Donahue (1950)
Year of Election or Appointment: 2018
Trustee
Mr. Donahue also serves as Trustee of other Fidelity® funds. Mr. Donahue serves as President and Chief Executive Officer of Miranda Partners, LLC (risk consulting for the financial services industry, 2012-present). Previously, Mr. Donahue served as Chief Executive Officer (2006-2012), Chief Operating Officer (2003-2006) and Managing Director, Customer Marketing and Development (1999-2003) of The Depository Trust & Clearing Corporation (financial markets infrastructure). Mr. Donahue currently serves as a member (2007-present) and Co-Chairman (2016-present) of the Board of United Way of New York. Mr. Donahue previously served as a member of the Advisory Board of certain Fidelity® funds (2015-2018) and as a member of the Board of The Leadership Academy (previously NYC Leadership Academy) (2012-2022).
Vicki L. Fuller (1957)
Year of Election or Appointment: 2020
Trustee
Ms. Fuller also serves as Trustee of other Fidelity® funds. Previously, Ms. Fuller served as a member of the Advisory Board of certain Fidelity® funds (2018-2020), Chief Investment Officer of the New York State Common Retirement Fund (2012-2018) and held a variety of positions at AllianceBernstein L.P. (global asset management, 1985-2012), including Managing Director (2006-2012) and Senior Vice President and Senior Portfolio Manager (2001-2006). Ms. Fuller currently serves as a member of the Board, Audit Committee and Nominating and Governance Committee of two Blackstone business development companies (2020-present), as a member of the Board of Treliant, LLC (consulting, 2019-present), as a member of the Board of Ariel Alternatives, LLC (private equity, 2022-present) and as a member of the Board and Chair of the Audit Committee of Gusto, Inc. (software, 2021-present). In addition, Ms. Fuller currently serves as a member of the Board of Roosevelt University (2019-present) and as a member of the Executive Board of New York University's Stern School of Business. Ms. Fuller previously served as a member of the Board, Audit Committee and Nominating and Governance Committee of The Williams Companies, Inc. (natural gas infrastructure, 2018-2021).
Patricia L. Kampling (1959)
Year of Election or Appointment: 2020
Trustee
Ms. Kampling also serves as Trustee of other Fidelity® funds. Prior to her retirement, Ms. Kampling served as Chairman of the Board and Chief Executive Officer (2012-2019), President and Chief Operating Officer (2011-2012) and Executive Vice President and Chief Financial Officer (2010-2011) of Alliant Energy Corporation. Ms. Kampling currently serves as a member of the Board, Finance Committee and Governance, Compensation and Nominating Committee of Xcel Energy Inc. (utilities company, 2020-present) and as a member of the Board, Audit, Finance and Risk Committee and Safety, Environmental, Technology and Operations Committee and Chair of the Executive Development and Compensation Committee of American Water Works Company, Inc. (utilities company, 2019-present). In addition, Ms. Kampling currently serves as a member of the Board of the Nature Conservancy, Wisconsin Chapter (2019-present). Previously, Ms. Kampling served as a Member of the Advisory Board of certain Fidelity® funds (2020), a member of the Board, Compensation Committee and Executive Committee and Chair of the Audit Committee of Briggs & Stratton Corporation (manufacturing, 2011-2021), a member of the Board of Interstate Power and Light Company (2012-2019) and Wisconsin Power and Light Company (2012-2019) (each a subsidiary of Alliant Energy Corporation) and as a member of the Board and Workforce Development Committee of the Business Roundtable (2018-2019).
Thomas A. Kennedy (1955)
Year of Election or Appointment: 2021
Trustee
Mr. Kennedy also serves as Trustee of other Fidelity® funds. Previously, Mr. Kennedy served as a Member of the Advisory Board of certain Fidelity® funds (2020) and held a variety of positions at Raytheon Company (aerospace and defense, 1983-2020), including Chairman and Chief Executive Officer (2014-2020) and Executive Vice President and Chief Operating Officer (2013-2014). Mr. Kennedy served as Executive Chairman of the Board of Directors of Raytheon Technologies Corporation (aerospace and defense, 2020-2021). Mr. Kennedy serves as a Director of the Board of Directors of Textron Inc. (aerospace and defense, 2023-present).
Oscar Munoz (1959)
Year of Election or Appointment: 2021
Trustee
Mr. Munoz also serves as Trustee of other Fidelity® funds. Prior to his retirement, Mr. Munoz served as Executive Chairman (2020-2021), Chief Executive Officer (2015-2020), President (2015-2016) and a member of the Board (2010-2021) of United Airlines Holdings, Inc. Mr. Munoz currently serves as a member of the Board of CBRE Group, Inc. (commercial real estate, 2020-present), a member of the Board of Univision Communications, Inc. (Hispanic media, 2020-present), a member of the Board of Archer Aviation Inc. (2021-present), a member of the Defense Business Board of the United States Department of Defense (2021-present) and a member of the Board of Salesforce.com, Inc. (cloud-based software, 2022-present). Previously, Mr. Munoz served as a Member of the Advisory Board of certain Fidelity® funds (2021).
David M. Thomas (1949)
Year of Election or Appointment: 2008
Trustee
Lead Independent Trustee
Mr. Thomas also serves as Trustee of other Fidelity® funds. Previously, Mr. Thomas served as Executive Chairman (2005-2006) and Chairman and Chief Executive Officer (2000-2005) of IMS Health, Inc. (pharmaceutical and healthcare information solutions). Mr. Thomas currently serves as a member of the Board of Fortune Brands Home and Security (home and security products, 2004-present) and as Director (2013-present) and Non-Executive Chairman of the Board (2022-present) of Interpublic Group of Companies, Inc. (marketing communication).
Susan Tomasky (1953)
Year of Election or Appointment: 2020
Trustee
Ms. Tomasky also serves as Trustee of other Fidelity® funds. Prior to her retirement, Ms. Tomasky served in various executive officer positions at American Electric Power Company, Inc. (1998-2011), including most recently as President of AEP Transmission (2007-2011). Ms. Tomasky currently serves as a member of the Board and Sustainability Committee and as Chair of the Audit Committee of Marathon Petroleum Corporation (2018-present) and as a member of the Board, Executive Committee, Corporate Governance Committee and Organization and Compensation Committee and as Lead Director of the Board of Public Service Enterprise Group, Inc. (utilities company, 2012-present) and as a member of the Board of its subsidiary company, Public Service Electric and Gas Co. (2021-present). In addition, Ms. Tomasky currently serves as a member (2009-present) and President (2020-present) of the Board of the Royal Shakespeare Company - America (2009-present), as a member of the Board of the Columbus Association for the Performing Arts (2011-present) and as a member of the Board and Kenyon in the World Committee of Kenyon College (2016-present). Previously, Ms. Tomasky served as a Member of the Advisory Board of certain Fidelity® funds (2020), as a member of the Board of the Columbus Regional Airport Authority (2007-2020), as a member of the Board (2011-2018) and Lead Independent Director (2015-2018) of Andeavor Corporation (previously Tesoro Corporation) (independent oil refiner and marketer) and as a member of the Board of Summit Midstream Partners LP (energy, 2012-2018).
Michael E. Wiley (1950)
Year of Election or Appointment: 2020
Trustee
Mr. Wiley also serves as Trustee of other Fidelity® funds. Previously, Mr. Wiley served as a member of the Advisory Board of certain Fidelity® funds (2018-2020), Chairman, President and CEO of Baker Hughes, Inc. (oilfield services, 2000-2004). Mr. Wiley also previously served as a member of the Board of Andeavor Corporation (independent oil refiner and marketer, 2005-2018), a member of the Board of Andeavor Logistics LP (natural resources logistics, 2015-2018) and a member of the Board of High Point Resources (exploration and production, 2005-2020).
+ The information includes the Trustee's principal occupation during the last five years and other information relating to the experience, attributes, and skills relevant to the Trustee's qualifications to serve as a Trustee, which led to the conclusion that the Trustee should serve as a Trustee for the fund.
Advisory Board Members and Officers:
Correspondence intended for a Member of the Advisory Board (if any) may be sent to Fidelity Investments, P.O. Box 55235, Boston, Massachusetts 02205-5235. Correspondence intended for an officer or Peter S. Lynch may be sent to Fidelity Investments, 245 Summer Street, Boston, Massachusetts 02210.
Name, Year of Birth; Principal Occupation
Vijay C. Advani (1960)
Year of Election or Appointment: 2023
Member of the Advisory Board
Mr. Advani also serves as Trustee or Member of the Advisory Board of other funds. Previously, Mr. Advani served as Executive Chairman (2020-2022), Chief Executive Officer (2017-2020) and Chief Operating Officer (2016-2017) of Nuveen (global investment manager). He also served in various capacities at Franklin Resources (global investment manager), including Co-President (2015-2016), Executive Vice President, Global Advisory Services (2008-2015), Head of Global Retail Distribution (2005-2008), Executive Managing Director, International Retail Development (2002-2005), Managing Director, Product Developments, Sales & Marketing, Asia, Eastern Europe and Africa (2000-2002) and President, Templeton Asset Management India (1995-2000). Mr. Advani also served as Senior Investment Officer of International Finance Corporation (private equity and venture capital arm of The World Bank, 1984-1995). Mr. Advani is Chairman Emeritus of the U.S. India Business Council (2018-present), a Director of The Global Impact Investing Network (2019-present), a Director of LOK Capital (Mauritius) (2022-present), a member of the Advisory Council of LOK Capital (2022-present), a Senior Advisor of Neuberger Berman (2021-present), a Senior Advisor of Seviora Holdings Pte. Ltd (Temasek-Singapore) (2021-present), a Director of Seviora Capital (Singapore) (2021-present) and an Advisor of EQUIAM (2021-present). Mr. Advani formerly served as a member of the Board of BowX Acquisition Corp. (special purpose acquisition company, 2020-2021), a member of the Board of Intellecap (advisory arm of The Aavishkaar Group, 2018-2020), a member of the Board of Nuveen Investments, Inc. (2017-2020) and a member of the Board of Docusign (software, 2016-2019).
Peter S. Lynch (1944)
Year of Election or Appointment: 2003
Member of the Advisory Board
Mr. Lynch also serves as a Member of the Advisory Board of other Fidelity® funds. Mr. Lynch is Vice Chairman and a Director of Fidelity Management & Research Company LLC (investment adviser firm). In addition, Mr. Lynch serves as a Trustee of Boston College and as the Chairman of the Inner-City Scholarship Fund. Previously, Mr. Lynch served as Vice Chairman and a Director of FMR Co., Inc. (investment adviser firm) and on the Special Olympics International Board of Directors (1997-2006).
Karen B. Peetz (1955)
Year of Election or Appointment: 2023
Member of the Advisory Board
Ms. Peetz also serves as a Member of the Advisory Board of other funds. Previously, Ms. Peetz served as Chief Administration Officer (2020-2023) of Citigroup Inc. (a diversified financial service company). She also served in various capacities at Bank of New York Mellon Corporation, including President (2013-2016), Vice Chairman, Senior Executive Vice President and Chief Executive Officer of Financial Markets & Treasury Services (2010-2013), Senior Executive Vice President and Chief Executive Officer of Global Corporate Trust (2003-2008), Senior Vice President and Division Manager of Global Payments & Trade Services (2002-2003) and Senior Vice President and Division Manager of Domestic Corporate Trust (1998-2002). Ms. Peetz also served in various capacities at Chase Manhattan Corporation (1982-1998), including Senior Vice President and Manager of Corporate Trust International Business (1996-1998), Managing Director and Manager of Corporate Trust Services (1994-1996) and Managing Director and Group Manager of Financial Institution Sales (1990-1993). Ms. Peetz currently serves as Chair of Amherst Holdings Advisory Council (2018-present), Trustee of Johns Hopkins University (2016-present), Chair of the Carey Business School Advisory Council, Member of the Johns Hopkins Medicine Board and Finance Committee and Chair of the Lyme and Tick Related Disease Institute Advisory Council. Ms. Peetz previously served as a member of the Board of Guardian Life Insurance Company of America (2019-2023), a member of the Board of Trane Technologies (2018-2022), a member of the Board of Wells Fargo Corp. (2017-2019), a member of the Board of SunCoke Energy Inc. (2012-2016), a member of the Board of Private Export Funding Corporation (2010-2016) and as a Trustee of Penn State University (2010-2014) and the United Way of New York City (2008-2010).
Heather Bonner (1977)
Year of Election or Appointment: 2023
Assistant Treasurer
Ms. Bonner also serves as an officer of other funds. Ms. Bonner is a Senior Vice President (2022-present) and is an employee of Fidelity Investments (2022-present). Ms. Bonner serves as Vice President, Treasurer, or Assistant Treasurer of certain Fidelity entities. Prior to joining Fidelity, Ms. Bonner served as Managing Director at AQR Capital Management (2013-2022) and was the Treasurer and Principal Financial Officer of the AQR Funds (2013-2022).
Craig S. Brown (1977)
Year of Election or Appointment: 2022
Deputy Treasurer
Mr. Brown also serves as an officer of other funds. Mr. Brown is a Vice President (2015-present) and is an employee of Fidelity Investments. Mr. Brown serves as Assistant Treasurer of FIMM, LLC (2021-present). Previously, Mr. Brown served as Assistant Treasurer of certain Fidelity® funds (2019-2022).
John J. Burke III (1964)
Year of Election or Appointment: 2018
Chief Financial Officer
Mr. Burke also serves as Chief Financial Officer of other funds. Mr. Burke is Head of Fidelity Fund and Investment Operations (2018-present) and is an employee of Fidelity Investments. Mr. Burke serves as President, Executive Vice President, or Director of certain Fidelity entities. Previously Mr. Burke served as head of Asset Management Investment Operations (2012-2018).
Margaret Carey (1973)
Year of Election or Appointment: 2023
Secretary and Chief Legal Officer (CLO)
Ms. Carey also serves as an officer of other funds and as CLO of certain Fidelity entities. Ms. Carey is a Senior Vice President, Deputy General Counsel (2019-present) and is an employee of Fidelity Investments.
William C. Coffey (1969)
Year of Election or Appointment: 2019
Assistant Secretary
Mr. Coffey also serves as Assistant Secretary of other funds. Mr. Coffey is a Senior Vice President, Deputy General Counsel (2010-present) and is an employee of Fidelity Investments. Previously, Mr. Coffey served as Secretary and CLO of certain funds (2018-2019); CLO, Secretary, or Senior Vice President of certain Fidelity entities and Assistant Secretary of certain funds (2009-2018).
Timothy M. Cohen (1969)
Year of Election or Appointment: 2018
Vice President
Mr. Cohen also serves as Vice President of other funds. Mr. Cohen is Co-Head of Equity (2018-present) and is an employee of Fidelity Investments. Mr. Cohen serves a Director of Fidelity Management & Research (Japan) Limited (investment adviser firm, 2016-present). Previously, Mr. Cohen served as Executive Vice President of Fidelity SelectCo, LLC (2019) and Head of Global Equity Research (2016-2018).
Jonathan Davis (1968)
Year of Election or Appointment: 2010
Assistant Treasurer
Mr. Davis also serves as an officer of other funds. Mr. Davis is a Vice President (2006-present) and is an employee of Fidelity Investments. Mr. Davis serves as Assistant Treasurer of certain Fidelity entities.
Laura M. Del Prato (1964)
Year of Election or Appointment: 2018
Assistant Treasurer
Ms. Del Prato also serves as an officer of other funds. Ms. Del Prato is a Senior Vice President (2017-present) and is an employee of Fidelity Investments. Ms. Del Prato serves as Vice President or Assistant Treasurer of certain Fidelity entities. Previously, Ms. Del Prato served as President and Treasurer of The North Carolina Capital Management Trust: Cash Portfolio and Term Portfolio (2018-2020).
Colm A. Hogan (1973)
Year of Election or Appointment: 2020
Assistant Treasurer
Mr. Hogan also serves as an officer of other funds. Mr. Hogan is a Vice President (2016-present) and is an employee of Fidelity Investments. Mr. Hogan serves as Assistant Treasurer of certain Fidelity entities. Previously, Mr. Hogan served as Deputy Treasurer of certain Fidelity® funds (2016-2020) and Assistant Treasurer of certain Fidelity® funds (2016-2018).
Pamela R. Holding (1964)
Year of Election or Appointment: 2018
Vice President
Ms. Holding also serves as Vice President of other funds. Ms. Holding is Co-Head of Equity (2018-present) and is an employee of Fidelity Investments. Previously, Ms. Holding served as Executive Vice President of Fidelity SelectCo, LLC (2019) and as Chief Investment Officer of Fidelity Institutional Asset Management (2013-2018).
Chris Maher (1972)
Year of Election or Appointment: 2020
Deputy Treasurer
Mr. Maher also serves as an officer of other funds. Mr. Maher is a Vice President (2008-present) and is an employee of Fidelity Investments. Mr. Maher serves as Assistant Treasurer of certain Fidelity entities. Previously, Mr. Maher served as Assistant Treasurer of certain funds (2013-2020).
Jason P. Pogorelec (1975)
Year of Election or Appointment: 2020
Chief Compliance Officer
Mr. Pogorelec also serves as Chief Compliance Officer of other funds. Mr. Pogorelec is a Senior Vice President of Asset Management Compliance (2020-present) and is an employee of Fidelity Investments. Mr. Pogorelec serves as Compliance Officer of Fidelity Management & Research Company LLC (investment adviser firm, 2023-present) and Ballyrock Investment Advisors LLC (2023-present). Previously, Mr. Pogorelec served as a Vice President, Associate General Counsel for Fidelity Investments (2010-2020) and Assistant Secretary of certain Fidelity® funds (2015-2020).
Brett Segaloff (1972)
Year of Election or Appointment: 2021
Anti-Money Laundering (AML) Officer
Mr. Segaloff also serves as AML Officer of other funds. Mr. Segaloff is a Vice President (2022-present) and is an employee of Fidelity Investments. Mr. Segaloff serves as Anti Money Laundering Compliance Officer or Anti Money Laundering/Bank Secrecy Act Compliance Officer of certain Fidelity entities.
Stacie M. Smith (1974)
Year of Election or Appointment: 2016
President and Treasurer
Ms. Smith also serves as an officer of other funds. Ms. Smith is a Senior Vice President (2016-present) and is an employee of Fidelity Investments. Ms. Smith serves as Assistant Treasurer of certain Fidelity entities and has served in other fund officer roles.
Jim Wegmann (1979)
Year of Election or Appointment: 2019
Assistant Treasurer
Mr. Wegmann also serves as an officer of other funds. Mr. Wegmann is a Vice President (2016-present) and is an employee of Fidelity Investments. Mr. Wegmann serves as Assistant Treasurer of FIMM, LLC (2021-present). Previously, Mr. Wegmann served as Assistant Treasurer of certain Fidelity® funds (2019-2021).
As a shareholder, you incur two types of costs: (1) transaction costs, which may include sales charges (loads) on purchase payments or redemption proceeds, as applicable and (2) ongoing costs, which generally include management fees, distribution and/or service (12b-1) fees and other Fund expenses. This Example is intended to help you understand your ongoing costs (in dollars) of investing in a fund and to compare these costs with the ongoing costs of investing in other mutual funds.
| The Example is based on an investment of $1,000 invested at the beginning of the period and held for the entire period (May 1, 2023 to October 31, 2023). |
Actual Expenses
The first line of the accompanying table provides information about actual account values and actual expenses. You may use the information in this line, together with the amount you invested, to estimate the expenses that you paid over the period. Simply divide your account value by $1,000.00 (for example, an $8,600 account value divided by $1,000.00 = 8.6), then multiply the result by the number in the first line for a class/Fund under the heading entitled "Expenses Paid During Period" to estimate the expenses you paid on your account during this period. If any fund is a shareholder of any underlying mutual funds or exchange-traded funds (ETFs) (the Underlying Funds), such fund indirectly bears its proportional share of the expenses of the Underlying Funds in addition to the direct expenses incurred presented in the table. These fees and expenses are not included in the annualized expense ratio used to calculate the expense estimate in the table below.
Hypothetical Example for Comparison Purposes
The second line of the accompanying table provides information about hypothetical account values and hypothetical expenses based on the actual expense ratio and an assumed rate of return of 5% per year before expenses, which is not the actual return. The hypothetical account values and expenses may not be used to estimate the actual ending account balance or expenses you paid for the period. You may use this information to compare the ongoing costs of investing in the Fund and other funds. To do so, compare this 5% hypothetical example with the 5% hypothetical examples that appear in the shareholder reports of the other funds. If any fund is a shareholder of any Underlying Funds, such fund indirectly bears its proportional share of the expenses of the Underlying Funds in addition to the direct expenses as presented in the table. These fees and expenses are not included in the annualized expense ratio used to calculate the expense estimate in the table below.
Please note that the expenses shown in the table are meant to highlight your ongoing costs only and do not reflect any transaction costs. Therefore, the second line of the table is useful in comparing ongoing costs only, and will not help you determine the relative total costs of owning different funds. In addition, if these transactional costs were included, your costs would have been higher.
| | | | | Annualized Expense Ratio- A | | Beginning Account Value May 1, 2023 | | Ending Account Value October 31, 2023 | | Expenses Paid During Period- C May 1, 2023 to October 31, 2023 |
| | | | | | | | | | |
| Fidelity® SAI Sustainable International Equity Fund | | | | .75% | | | | | | |
| Actual | | | | | | $ 1,000 | | $ 904.60 | | $ 3.60 |
Hypothetical-B | | | | | | $ 1,000 | | $ 1,021.42 | | $ 3.82 |
| |
A Annualized expense ratio reflects expenses net of applicable fee waivers.
B 5% return per year before expenses
C Expenses are equal to the annualized expense ratio, multiplied by the average account value over the period, multiplied by 184/ 365 (to reflect the one-half year period). The fees and expenses of any Underlying Funds are not included in each annualized expense ratio.
The dividend and capital gains distributions for the fund(s) are available on Fidelity.com or Institutional.Fidelity.com.
The fund designates 100% of the dividend distributed during the fiscal year as amounts which may be taken into account as a dividend for the purposes of the maximum rate under section 1(h)(11) of the Internal Revenue Code.
The amounts per share which represent income derived from sources within, and taxes paid to, foreign countries or possessions of the United States are $0.0688 and $0.0118 for the dividend paid December 12,2022.
The fund will notify shareholders in January 2024 of amounts for use in preparing 2023 income tax returns.
Board Approval of Investment Advisory Contracts and Management Fees
Fidelity SAI Sustainable International Equity Fund
Each year, the Board of Trustees, including the Independent Trustees (together, the Board), considers the renewal of the fund's management contract with Fidelity Management & Research Company LLC (FMR) and the sub-advisory agreements (together, the Advisory Contracts) for the fund. FMR and the sub-advisers are referred to herein as the Investment Advisers. The Board, assisted by the advice of fund counsel and Independent Trustees' counsel, requests and considers a broad range of information relevant to the renewal of the Advisory Contracts throughout the year.
The Board meets regularly and, at each of its meetings, covers an extensive agenda of topics and materials and considers factors that are relevant to its annual consideration of the renewal of the fund's Advisory Contracts, including the services and support provided to the fund and its shareholders. The Board, acting directly and through its Committees (each of which is composed of and chaired by Independent Trustees), requests and receives information concerning the annual consideration of the renewal of the fund's Advisory Contracts. The Board also meets as needed to review matters specifically related to the Board's annual consideration of the renewal of the Advisory Contracts. Members of the Board may also meet with trustees of other Fidelity funds through joint ad hoc committees to discuss certain matters relevant to all of the Fidelity funds.
Approval of Stub Period Continuation. At its May 2023 meeting, the Board of Trustees voted to continue the fund's management contract with FMR, and the sub-advisory agreements and sub-sub-advisory agreements, in each case, where applicable (together, the Advisory Contracts), without modification, for two months from June 1, 2023 through July 31, 2023. The Board considered that the approval of the fund's Advisory Contracts will not result in any changes in (i) the investment process or strategies employed in the management of the fund's assets; (ii) the fees and expenses paid by shareholders; (iii) the nature, extent or quality of services provided under the fund's Advisory Contracts; or (iv) the day-to-day management of the fund or the persons primarily responsible for such management. The Board also considered that since its last approval of the fund's Advisory Contracts, FMR had provided additional information on the fund in support of the annual contract renewal process, including competitive analyses on total expenses and management fees and in-depth reviews of fund performance and fund profitability information. The Board concluded that the fund's Advisory Contracts are fair and reasonable, and that the fund's Advisory Contracts should be renewed, without modification, through July 31, 2023, with the understanding that the Board would consider the annual renewal for a full one year period in July 2023.
At its July 2023 meeting, the Board unanimously determined to renew the fund's Advisory Contracts. In reaching its determination, the Board considered all factors it believed relevant, including (i) the nature, extent, and quality of the services provided to the fund and its shareholders (including the investment performance of the fund); (ii) the competitiveness relative to peer funds of the fund's management fee and total expense ratio; (iii) the total costs of the services provided by and the profits realized by FMR and its affiliates (Fidelity) from its relationships with the fund; and (iv) the extent to which, if any, economies of scale exist and are realized as the fund grows, and whether any economies of scale are appropriately shared with fund shareholders. The Board also considered the broad range of investment choices available to shareholders from FMR's competitors and that the fund's shareholders have chosen to invest in the fund, which is part of the Fidelity family of funds. The Board's decision to renew the Advisory Contracts was not based on any single factor.
The Board reached a determination, with the assistance of fund counsel and Independent Trustees' counsel and through the exercise of its business judgment, that the renewal of the Advisory Contracts was in the best interests of the fund and its shareholders and that the compensation payable under the Advisory Contracts was fair and reasonable in light of all of the surrounding circumstances.
Nature, Extent, and Quality of Services Provided. The Board considered staffing as it relates to the fund, including the backgrounds and experience of investment personnel of the Investment Advisers, and also considered the Investment Advisers' implementation of the fund's investment program. The Independent Trustees also had discussions with senior management of Fidelity's investment operations and investment groups. The Board considered the structure of the investment personnel compensation program and whether this structure provides appropriate incentives to act in the best interests of the fund. Additionally, the Board considered the portfolio managers' investments, if any, in the funds that they manage.
Resources Dedicated to Investment Management and Support Services. The Board and the Fund Oversight and Research Committees reviewed the general qualifications and capabilities of Fidelity's investment staff, including its size, education, experience, and resources, as well as Fidelity's approach to recruiting, training, managing, and compensating investment personnel. The Board noted the resources devoted to expansion of Fidelity's global investment organization, and that Fidelity's analysts have extensive resources, tools, and capabilities that allow them to conduct sophisticated quantitative and fundamental analysis, as well as credit analysis of issuers, counterparties, and guarantors. Further, the Board considered that Fidelity's investment professionals have sufficient access to global information and data so as to provide competitive investment results over time, and that those professionals also have access to sophisticated tools that permit them to assess portfolio construction and risk and performance attribution characteristics continuously, as well as to transmit new information and research conclusions rapidly around the world. Additionally, in its deliberations, the Board considered Fidelity's trading, risk management, compliance, and technology and operations capabilities and resources, which are integral parts of the investment management process.
Shareholder and Administrative Services. The Board considered (i) the nature, extent, quality, and cost of advisory, administrative, and shareholder services performed by the Investment Advisers and their affiliates under the Advisory Contracts and under separate agreements covering transfer agency, pricing and bookkeeping, and securities lending services for the fund; (ii) the nature and extent of Fidelity's supervision of third party service providers, principally custodians, subcustodians, and pricing vendors; and (iii) the resources devoted by Fidelity to, and the record of compliance with, the fund's compliance policies and procedures. The Board also reviewed the allocation of fund brokerage, including allocations to brokers affiliated with the Investment Advisers, the use of brokerage commissions to pay fund expenses, and the use of "soft" commission dollars to pay for research services. The Board also considered the fund's securities lending activities and any payments made to Fidelity relating to securities lending.
The Board noted that the growth of fund assets over time across the complex allows Fidelity to reinvest in the development of services designed to enhance the value and convenience of the Fidelity funds as investment vehicles. These services include 24-hour access to account information and market information over the Internet and through telephone representatives, investor education materials, and asset allocation tools. The Board also considered that it reviews customer service metrics such as telephone response times, continuity of services on the website and metrics addressing services at Fidelity Investor Centers.
Investment in a Large Fund Family. The Board considered the benefits to shareholders of investing in a fund that is part of a large family of funds offering a variety of investment disciplines and providing a large variety of fund investor services. The Board noted that Fidelity had taken, or had made recommendations that resulted in the Fidelity funds taking, a number of actions over the previous year that benefited particular funds and/or the Fidelity funds in general.
Investment Performance. The Board took into account discussions that occur with representatives of the Investment Advisers, and reports that it receives, at Board meetings throughout the year, relating to fund investment performance. In this regard the Board noted that as part of regularly scheduled fund reviews and other reports to the Board on fund performance, the Board considered annualized return information for the fund for different time periods, measured against an appropriate securities market index (benchmark index) and an appropriate peer group of funds with similar objectives (peer group). The Board also considered information about performance attribution. In its ongoing evaluation of fund investment performance, the Board gives particular attention to information indicating changes in performance of the funds over different time periods and discussed with the Investment Advisers the reasons for any overperformance or underperformance.
In addition to reviewing absolute and relative fund performance, the Independent Trustees periodically consider the appropriateness of fund performance metrics in evaluating the results achieved. The Independent Trustees generally give greater weight to fund performance over longer time periods than over shorter time periods. Depending on the circumstances, the Independent Trustees may be satisfied with a fund's performance notwithstanding that it lags its benchmark index or peer group for certain periods.
Based on its review, the Board concluded that the nature, extent, and quality of services provided to the fund under the Advisory Contracts should continue to benefit the shareholders of the fund.
Competitiveness of Management Fee and Total Expense Ratio. The Board was provided with information regarding industry trends in management fees and expenses. In its review of the fund's management fee and total expense ratio, the Board considered the fund's management fee rate as well as other fund expenses, such as transfer agent fees, pricing and bookkeeping fees, and custodial, legal, and audit fees. The Board noted that Fidelity may agree to waive fees or reimburse expenses from time to time, and the extent to which, if any, it has done so for the fund.
Comparisons of Management Fees and Total Expense Ratios. Among other things, the Board reviewed data for selected groups of competitive funds and classes (referred to as "mapped groups") that were compiled by Fidelity based on combining similar investment objective categories (as classified by Lipper) that have comparable investment mandates. The data reviewed by the Board included (i) gross management fee comparisons (before taking into account expense reimbursements or caps) relative to the total universe of funds within the mapped group; (ii) gross management fee comparisons relative to a subset of non-Fidelity funds in the mapped group that are similar in size and management fee structure to the fund (referred to as the "asset size peer group"); (iii) total expense comparisons of the fund relative to funds and classes in the mapped group that have a similar sales load structure to the fund (referred to as the "similar sales load structure group"); and (iv) total expense comparisons of the fund relative to funds and classes in the similar sales load structure group that are similar in size and management fee structure to the fund (referred to as the "total expense asset size peer group"). The total expense asset size peer group comparison excludes performance adjustments and fund-paid 12b-1 fees to eliminate variability in fee structures.
The information provided to the Board indicated that the fund's management fee rate ranked below the competitive median of the mapped group for the period ended September 30, 2022 and below the competitive median of the asset size peer group for the period ended September 30, 2022. Further, the information provided to the Board indicated that the total expense ratio of the fund ranked below the competitive median of the similar sales load structure group for the period ended September 30, 2022 and below the competitive median of the total expense asset size peer group for the period ended September 30, 2022.
The Board also considered that, for funds subject to the group fee, FMR agreed to voluntarily waive fees over a specified period of time in amounts designed to account for assets converted from certain funds to certain collective investment trusts.
Fees Charged to Other Fidelity Clients. The Board also considered Fidelity fee structures and other information with respect to clients of Fidelity, such as other funds advised or subadvised by Fidelity, pension plan clients, and other institutional clients with similar mandates. The Board noted that a joint ad hoc committee created by it and the boards of other Fidelity funds periodically reviews and compares Fidelity's institutional investment advisory business with its business of providing services to the Fidelity funds and also noted the most recent findings of the committee. The Board noted that the committee's review included a consideration of the differences in services provided, fees charged, and costs incurred, as well as competition in the markets serving the different categories of clients.
Based on its review, the Board concluded that the fund's management fee is fair and reasonable in light of the services that the fund receives and the other factors considered. Further, based on its review of total expense ratios and fees charged to other Fidelity clients, the Board concluded that the fund's total expense ratio was reasonable in light of the services that the fund and its shareholders receive and the other factors considered.
Costs of the Services and Profitability. The Board considered the revenues earned and the expenses incurred by Fidelity in conducting the business of developing, marketing, distributing, managing, administering and servicing the fund and servicing the fund's shareholders. The Board also considered the level of Fidelity's profits in respect of all the Fidelity funds.
On an annual basis, Fidelity presents to the Board information about the profitability of its relationships with the fund. Fidelity calculates profitability information for each fund, as well as aggregate profitability information for groups of Fidelity funds and all Fidelity funds, using a series of detailed revenue and cost allocation methodologies which originate with the books and records of Fidelity on which Fidelity's audited financial statements are based. The Audit Committee of the Board reviews any significant changes from the prior year's methodologies and the full Board approves such changes.
A public accounting firm has been engaged annually by the Board as part of the Board's assessment of Fidelity's profitability analysis. The engagement includes the review and assessment of the methodologies used by Fidelity in determining the revenues and expenses attributable to Fidelity's fund business, and completion of agreed-upon procedures in respect of the mathematical accuracy of certain fund profitability information and its conformity to established allocation methodologies. After considering the reports issued under the engagement and information provided by Fidelity, the Board concluded that while other allocation methods may also be reasonable, Fidelity's profitability methodologies are reasonable in all material respects.
The Board also reviewed Fidelity's non-fund businesses and potential indirect benefits such businesses may have received as a result of their association with Fidelity's fund business (i.e., fall-out benefits) as well as cases where Fidelity's affiliates may benefit from the funds' business. The Board considered areas where potential indirect benefits to the Fidelity funds from their relationships with Fidelity may exist. The Board's consideration of these matters was informed by the findings of a joint ad hoc committee created by it and the boards of other Fidelity funds to evaluate potential fall-out benefits.
The Board considered the costs of the services provided by and the profits realized by Fidelity in connection with the operation of the fund and was satisfied that the profitability was not excessive.
Economies of Scale. The Board considered whether there have been economies of scale in respect of the management of the Fidelity funds, whether the Fidelity funds (including the fund) have appropriately benefited from any such economies of scale, and whether there is potential for realization of any further economies of scale. The Board considered the extent to which the fund will benefit from economies of scale as assets grow through increased services to the fund, through waivers or reimbursements, or through fee or expense ratio reductions. The Board also noted that a committee (the Economies of Scale Committee) created by it and the boards of other Fidelity funds periodically analyzes whether Fidelity attains economies of scale in respect of the management and servicing of the Fidelity funds, whether the Fidelity funds have appropriately benefited from such economies of scale, and whether there is potential for realization of any further economies of scale.
The Board recognized that the fund's management contract incorporates a "group fee" structure, which provides for lower group fee rates as total "group assets" increase, and for higher group fee rates as total "group assets" decrease ("group assets" as defined in the management contract). FMR calculates the group fee rates based on a tiered asset "breakpoint" schedule that varies based on asset class. The Board considered that the group fee is designed to deliver the benefits of economies of scale to fund shareholders when total Fidelity fund assets increase, even if assets of any particular fund are unchanged or have declined, because some portion of Fidelity's costs are attributable to services provided to all Fidelity funds, and all funds benefit if those costs can be allocated among more assets. The Board further considered that Fidelity agreed to impose a temporary fee waiver in the form of additional breakpoints to the current breakpoint schedule. The Board concluded that, given the group fee structure, fund shareholders will benefit from lower management fees as "group assets" increase at the fund complex level, regardless of whether Fidelity achieves any such economies of scale.
The Board concluded, taking into account the analysis of the Economies of Scale Committee, that economies of scale, if any, are being appropriately shared between fund shareholders and Fidelity.
Additional Information Requested by the Board. In order to develop fully the factual basis for consideration of the Fidelity funds' advisory contracts, the Board requested and received additional information on certain topics, including: (i) fund flow and performance trends, in particular the underperformance of certain funds and strategies, and Fidelity's long-term strategies for certain funds, including any consideration of fund liquidations or mergers; (ii) the operation of performance fees and competitor use of performance fees; (iii) Fidelity's pricing philosophy compared to competitors; (iv) fund profitability methodology and data; (v) evaluation of competitive fund data and peer group classifications and fee and expense comparisons; (vi) the management fee and expense structures for different funds and classes and information about the differences between various fee and expense structures; (vii) group fee breakpoints and related voluntary fee waivers; and (viii) information regarding other accounts managed by Fidelity and the funds' sub-advisory arrangements.
Conclusion. Based on its evaluation of all of the conclusions noted above, and after considering all factors it believed relevant, the Board, including the Independent Trustees, concluded that the advisory and sub-advisory fee arrangements are fair and reasonable in light of all of the surrounding circumstances and that the fund's Advisory Contracts should be renewed through July 31, 2024.
1.9904871.101
IEE-ANN-1223
Fidelity® Series Overseas Fund
Annual Report
October 31, 2023
Contents
To view a fund's proxy voting guidelines and proxy voting record for the 12-month period ended June 30, visit http://www.fidelity.com/proxyvotingresults or visit the Securities and Exchange Commission's (SEC) web site at http://www.sec.gov.
You may also call 1-800-544-8544 to request a free copy of the proxy voting guidelines.
Standard & Poor's, S&P and S&P 500 are registered service marks of The McGraw-Hill Companies, Inc. and have been licensed for use by Fidelity Distributors Corporation.
Other third-party marks appearing herein are the property of their respective owners.
All other marks appearing herein are registered or unregistered trademarks or service marks of FMR LLC or an affiliated company. © 2023 FMR LLC. All rights reserved.
This report and the financial statements contained herein are submitted for the general information of the shareholders of the Fund. This report is not authorized for distribution to prospective investors in the Fund unless preceded or accompanied by an effective prospectus.
A fund files its complete schedule of portfolio holdings with the SEC for the first and third quarters of each fiscal year on Form N-PORT. Forms N-PORT are available on the SEC's web site at http://www.sec.gov. A fund's Forms N-PORT may be reviewed and copied at the SEC's Public Reference Room in Washington, DC. Information regarding the operation of the SEC's Public Reference Room may be obtained by calling 1-800-SEC-0330.
For a complete list of a fund's portfolio holdings, view the most recent holdings listing, semiannual report, or annual report on Fidelity's web site at http://www.fidelity.com, http://www.institutional.fidelity.com, or http://www.401k.com, as applicable.
NOT FDIC INSURED •MAY LOSE VALUE •NO BANK GUARANTEE
Neither the Fund nor Fidelity Distributors Corporation is a bank.
Average annual total return reflects the change in the value of an investment, assuming reinvestment of distributions from dividend income and capital gains (the profits earned upon the sale of securities that have grown in value, if any) and assuming a constant rate of performance each year. The hypothetical investment and the average annual total returns do not reflect the deduction of taxes that a shareholder would pay on fund distributions or the redemption of fund shares. During periods of reimbursement by Fidelity, a fund's total return will be greater than it would be had the reimbursement not occurred. How a fund did yesterday is no guarantee of how it will do tomorrow.
| Average Annual Total Returns |
| | | | |
Periods ended October 31, 2023 | Past 1 year | Life of Fund A |
| Fidelity® Series Overseas Fund | 14.05% | 4.36% |
A From June 21, 2019
| $10,000 Over Life of Fund |
| |
Let's say hypothetically that $10,000 was invested in Fidelity® Series Overseas Fund, on June 21, 2019, when the fund started. The chart shows how the value of your investment would have changed, and also shows how the MSCI EAFE Index performed over the same period. |
|
|
Market Recap:
International (non-U.S.) equities gained 12.27% for the 12 months ending October 31, 2023, according to the MSCI ACWI (All Country World Index) ex USA Index, as global economic expansion and a slowing in the pace of inflation in some markets provided a favorable backdrop for risk assets. After returning -15.86% in 2022, the index's upturn has been largely driven by a narrow set of companies in the information technology and communication services sectors, in part due to excitement for generative artificial intelligence applications. The index gained 14.07% year to date through July, including strong gains in both June (+4.50%) and July (+4.07%). The rally for international equities sputtered for the next three months (-11.33%) amid a stalling pattern in disinflationary trends, heightened global recession and geopolitical risks, soaring yields on longer-term U.S. government bonds and particularly weak economic conditions in the eurozone and China. The three-month decline left non-U.S. stocks up 1.15% year to date through October. For the full 12 months, nearly all regions advanced, with Europe ex U.K. (+18%) and Japan (+17%) leading, whereas Canada (-0.38%) lagged by the widest margin. Each of the 11 sectors advanced, with information technology (+21%) and consumer discretionary (+19%) leading the way. Energy and industrials each rose about 14%. Conversely, four defensive-oriented sectors lagged by the widest margin: real estate (+4%), health care (+6%), consumer staples (+7%) and utilities (+8%).
Comments from Portfolio Manager Vincent Montemaggiore:
For the fiscal year ending October 31, 2023, the fund gained 14.05%, versus 14.65% for the benchmark MSCI EAFE Index (Net MA). From a regional standpoint, stock picks in Europe ex U.K., primarily in France, and positioning in Japan detracted from the fund's relative result. By sector, security selection was the primary detractor, especially within industrials and financials. The largest individual relative detractor was our stake in Teleperformance (-34%), which was not held at period end. A stake in Olympus returned approximately -24% and was a second notable relative detractor. Olympus was not held at period end. An overweight in Rentokil Initial (-17%) also hurt. In contrast, from a regional standpoint, an overweight in Europe ex U.K. and a non-benchmark allocation to Canada contributed to the fund's performance versus the benchmark. By sector, the biggest contributors to performance versus the benchmark were stock picks and an overweight in information technology, primarily within the semiconductors & semiconductor equipment industry. Security selection and an underweight in communication services also boosted relative performance. The top individual relative contributor was an overweight in ASM International (+88%), and we reduced our stake. The second-largest relative contributor was our non-benchmark stake in Constellation Software (+41%), and we reduced the position. An overweight in Safran (+41%) also contributed. Although we trimmed our holdings, Safran was among the biggest holdings at period end. Notable changes in positioning include increased exposure to the materials and information technology sectors.
The views expressed above reflect those of the portfolio manager(s) only through the end of the period as stated on the cover of this report and do not necessarily represent the views of Fidelity or any other person in the Fidelity organization. Any such views are subject to change at any time based upon market or other conditions and Fidelity disclaims any responsibility to update such views. These views may not be relied on as investment advice and, because investment decisions for a Fidelity fund are based on numerous factors, may not be relied on as an indication of trading intent on behalf of any Fidelity fund.
Top Holdings (% of Fund's net assets) |
| |
| Novo Nordisk A/S Series B (Denmark, Pharmaceuticals) | 3.4 | |
| ASML Holding NV (Netherlands) (Netherlands, Semiconductors & Semiconductor Equipment) | 3.2 | |
| AstraZeneca PLC (United Kingdom) (United Kingdom, Pharmaceuticals) | 2.9 | |
| LVMH Moet Hennessy Louis Vuitton SE (France, Textiles, Apparel & Luxury Goods) | 2.5 | |
| TotalEnergies SE (France, Oil, Gas & Consumable Fuels) | 2.2 | |
| RELX PLC (London Stock Exchange) (United Kingdom, Professional Services) | 2.1 | |
| Compass Group PLC (United Kingdom, Hotels, Restaurants & Leisure) | 2.0 | |
| Diageo PLC (United Kingdom, Beverages) | 2.0 | |
| Wolters Kluwer NV (Netherlands, Professional Services) | 2.0 | |
| Safran SA (France, Aerospace & Defense) | 1.8 | |
| | 24.1 | |
| |
| Market Sectors (% of Fund's net assets) |
| |
| Financials | 22.7 | |
| Industrials | 18.8 | |
| Information Technology | 15.7 | |
| Health Care | 14.2 | |
| Consumer Discretionary | 9.3 | |
| Consumer Staples | 6.8 | |
| Materials | 6.0 | |
| Energy | 2.2 | |
| Real Estate | 1.0 | |
| Communication Services | 0.5 | |
| |
Asset Allocation (% of Fund's net assets) |
|
|
Geographic Diversification (% of Fund's net assets) |
|
* Includes Short-Term investments and Net Other Assets (Liabilities). Percentages are adjusted for the effect of derivatives, if applicable. |
| |
Showing Percentage of Net Assets
| Common Stocks - 97.2% |
| | | Shares | Value ($) |
| Australia - 0.2% | | | |
| Flutter Entertainment PLC (a) | | 193,102 | 30,288,787 |
| Belgium - 0.6% | | | |
| Azelis Group NV | | 1,864,843 | 31,768,365 |
| KBC Group NV | | 945,965 | 51,948,037 |
TOTAL BELGIUM | | | 83,716,402 |
| Canada - 2.7% | | | |
| Alimentation Couche-Tard, Inc. Class A (multi-vtg.) | | 2,382,100 | 129,673,502 |
| Constellation Software, Inc. | | 104,770 | 210,031,835 |
| Constellation Software, Inc. warrants 8/22/28 (a)(b) | | 106,270 | 8 |
| Lumine Group, Inc. | | 316,650 | 3,982,243 |
TOTAL CANADA | | | 343,687,588 |
| China - 0.0% | | | |
| Chervon Holdings Ltd. | | 1,000,400 | 2,464,035 |
| Denmark - 5.4% | | | |
| Carlsberg A/S Series B | | 574,100 | 68,417,343 |
| DSV A/S | | 1,292,231 | 192,724,014 |
| Novo Nordisk A/S Series B | | 4,463,600 | 430,631,325 |
TOTAL DENMARK | | | 691,772,682 |
| Finland - 1.1% | | | |
| Nordea Bank Abp | | 13,057,800 | 137,217,183 |
| France - 15.6% | | | |
| Air Liquide SA | | 1,220,860 | 209,197,110 |
| ALTEN | | 918,751 | 108,198,117 |
| Antin Infrastructure Partners SA | | 344,400 | 4,095,964 |
| Capgemini SA | | 1,134,062 | 200,421,405 |
| Edenred SA | | 3,190,924 | 169,626,150 |
| EssilorLuxottica SA | | 1,129,616 | 203,956,894 |
| L'Oreal SA | | 463,900 | 194,991,419 |
| LVMH Moet Hennessy Louis Vuitton SE | | 452,483 | 323,946,412 |
| Pernod Ricard SA | | 465,300 | 82,465,933 |
| Safran SA | | 1,477,000 | 230,736,269 |
| TotalEnergies SE | | 4,209,179 | 281,415,110 |
TOTAL FRANCE | | | 2,009,050,783 |
| Germany - 8.2% | | | |
| Allianz SE | | 809,233 | 189,556,797 |
| Deutsche Borse AG | | 1,014,860 | 167,042,364 |
| Hannover Reuck SE | | 867,869 | 191,280,262 |
| Infineon Technologies AG | | 4,312,400 | 125,966,154 |
| Merck KGaA | | 1,044,420 | 157,311,099 |
| SAP SE | | 642,316 | 86,155,343 |
| Siemens Healthineers AG (c) | | 2,765,800 | 135,555,154 |
TOTAL GERMANY | | | 1,052,867,173 |
| India - 1.8% | | | |
| HCL Technologies Ltd. | | 3,847,400 | 58,995,535 |
| HDFC Bank Ltd. | | 9,393,000 | 166,624,920 |
TOTAL INDIA | | | 225,620,455 |
| Indonesia - 0.6% | | | |
| PT Bank Central Asia Tbk | | 145,241,700 | 80,016,653 |
| Ireland - 0.9% | | | |
| Kingspan Group PLC (Ireland) | | 1,726,100 | 115,939,009 |
| Italy - 3.3% | | | |
| FinecoBank SpA | | 8,554,485 | 100,607,429 |
| GVS SpA (a)(c) | | 858,638 | 3,833,975 |
| Industrie de Nora SpA | | 615,200 | 8,677,072 |
| Recordati SpA | | 2,982,439 | 137,589,335 |
| UniCredit SpA | | 6,736,600 | 168,883,972 |
TOTAL ITALY | | | 419,591,783 |
| Japan - 12.4% | | | |
| Bandai Namco Holdings, Inc. | | 2,146,200 | 44,466,080 |
| BayCurrent Consulting, Inc. | | 1,202,600 | 30,193,383 |
| Capcom Co. Ltd. | | 2,060,300 | 66,319,673 |
| FUJIFILM Holdings Corp. | | 1,852,600 | 101,333,152 |
| Hoya Corp. | | 1,599,407 | 153,972,706 |
| Misumi Group, Inc. | | 2,990,561 | 45,273,096 |
| Persol Holdings Co. Ltd. | | 41,957,230 | 62,911,340 |
| Relo Group, Inc. | | 3,031,628 | 30,055,811 |
| Shin-Etsu Chemical Co. Ltd. | | 5,034,400 | 150,545,569 |
| Sony Group Corp. | | 2,676,800 | 222,546,171 |
| Sumitomo Mitsui Financial Group, Inc. | | 3,953,500 | 190,590,246 |
| Suzuki Motor Corp. | | 2,652,745 | 102,958,370 |
| TIS, Inc. | | 2,262,276 | 48,446,308 |
| Tokio Marine Holdings, Inc. | | 9,801,300 | 219,276,997 |
| Tokyo Electron Ltd. | | 920,100 | 121,579,891 |
TOTAL JAPAN | | | 1,590,468,793 |
| Netherlands - 7.2% | | | |
| ASM International NV (Netherlands) | | 282,600 | 116,168,904 |
| ASML Holding NV (Netherlands) | | 681,428 | 409,620,280 |
| IMCD NV | | 1,086,651 | 130,500,645 |
| Topicus.Com, Inc. (a) | | 188,377 | 12,403,608 |
| Wolters Kluwer NV | | 1,955,808 | 250,609,237 |
TOTAL NETHERLANDS | | | 919,302,674 |
| Spain - 0.5% | | | |
| Amadeus IT Holding SA Class A | | 1,242,970 | 70,783,340 |
| Sweden - 2.8% | | | |
| AddTech AB (B Shares) | | 4,628,219 | 67,749,552 |
| Atlas Copco AB (A Shares) | | 13,263,200 | 171,745,464 |
| Indutrade AB | | 7,013,875 | 123,878,311 |
| Kry International AB (a)(b)(d) | | 4,451 | 163,376 |
TOTAL SWEDEN | | | 363,536,703 |
| Switzerland - 5.0% | | | |
| Compagnie Financiere Richemont SA Series A | | 1,436,590 | 169,482,448 |
| Julius Baer Group Ltd. | | 2,411,568 | 142,913,623 |
| Partners Group Holding AG | | 125,110 | 131,594,842 |
| Sika AG | | 819,911 | 195,502,332 |
TOTAL SWITZERLAND | | | 639,493,245 |
| Taiwan - 0.6% | | | |
| Taiwan Semiconductor Manufacturing Co. Ltd. | | 4,865,684 | 79,407,671 |
| United Kingdom - 15.9% | | | |
| 3i Group PLC | | 5,638,091 | 132,932,598 |
| AstraZeneca PLC (United Kingdom) | | 2,986,900 | 373,971,088 |
| BAE Systems PLC | | 12,411,500 | 166,889,770 |
| Beazley PLC | | 4,441,051 | 27,772,069 |
| Compass Group PLC | | 10,063,487 | 253,714,457 |
| Diageo PLC | | 6,694,747 | 253,168,720 |
| Diploma PLC | | 1,489,331 | 51,446,093 |
| Halma PLC | | 3,082,700 | 69,129,709 |
| Hiscox Ltd. | | 3,592,872 | 40,962,050 |
| London Stock Exchange Group PLC | | 1,807,900 | 182,408,242 |
| RELX PLC (London Stock Exchange) | | 7,672,855 | 267,995,298 |
| Rentokil Initial PLC | | 18,455,022 | 93,982,029 |
| Sage Group PLC | | 10,511,200 | 124,002,284 |
TOTAL UNITED KINGDOM | | | 2,038,374,407 |
| United States of America - 12.4% | | | |
| CBRE Group, Inc. (a) | | 1,533,400 | 106,325,956 |
| CDW Corp. | | 458,700 | 91,923,480 |
| Experian PLC | | 3,954,500 | 119,729,841 |
| Ferguson PLC | | 957,700 | 143,525,696 |
| Fiserv, Inc. (a) | | 278,700 | 31,702,125 |
| ICON PLC (a) | | 576,900 | 140,740,524 |
| Linde PLC | | 560,100 | 214,047,816 |
| Marsh & McLennan Companies, Inc. | | 1,147,128 | 217,552,825 |
| Nestle SA (Reg. S) | | 1,438,411 | 155,116,488 |
| S&P Global, Inc. | | 483,451 | 168,874,269 |
| Schneider Electric SA | | 704,231 | 108,351,061 |
| Thermo Fisher Scientific, Inc. | | 199,800 | 88,865,046 |
TOTAL UNITED STATES OF AMERICA | | | 1,586,755,127 |
| TOTAL COMMON STOCKS (Cost $10,894,853,379) | | | 12,480,354,493 |
| | | | |
| Nonconvertible Preferred Stocks - 0.0% |
| | | Shares | Value ($) |
| Sweden - 0.0% | | | |
Kry International AB Series E (a)(b)(d) (Cost $11,754,376) | | 25,711 | 943,735 |
| | | | |
| Money Market Funds - 2.5% |
| | | Shares | Value ($) |
Fidelity Cash Central Fund 5.40% (e) (Cost $329,038,521) | | 328,972,727 | 329,038,521 |
| | | | |
| TOTAL INVESTMENT IN SECURITIES - 99.7% (Cost $11,235,646,276) | 12,810,336,749 |
NET OTHER ASSETS (LIABILITIES) - 0.3% | 34,562,879 |
| NET ASSETS - 100.0% | 12,844,899,628 |
| | |
Legend
| (c) | Security exempt from registration under Rule 144A of the Securities Act of 1933. These securities may be resold in transactions exempt from registration, normally to qualified institutional buyers. At the end of the period, the value of these securities amounted to $139,389,129 or 1.1% of net assets. |
| (d) | Restricted securities (including private placements) - Investment in securities not registered under the Securities Act of 1933 (excluding 144A issues). At the end of the period, the value of restricted securities (excluding 144A issues) amounted to $1,107,111 or 0.0% of net assets. |
| (e) | Affiliated fund that is generally available only to investment companies and other accounts managed by Fidelity Investments. The rate quoted is the annualized seven-day yield of the fund at period end. A complete unaudited listing of the fund's holdings as of its most recent quarter end is available upon request. In addition, each Fidelity Central Fund's financial statements, which are not covered by the Fund's Report of Independent Registered Public Accounting Firm, are available on the SEC's website or upon request. |
| Additional information on each restricted holding is as follows: |
| Security | Acquisition Date | Acquisition Cost ($) |
| Kry International AB | 5/14/21 | 1,933,095 |
| | | |
| Kry International AB Series E | 5/14/21 | 11,754,376 |
| | | |
Affiliated Central Funds
Fiscal year to date information regarding the Fund's investments in Fidelity Central Funds, including the ownership percentage, is presented below.
| Affiliate | Value, beginning of period ($) | Purchases ($) | Sales Proceeds ($) | Dividend Income ($) | Realized Gain (loss) ($) | Change in Unrealized appreciation (depreciation) ($) | Value, end of period ($) | % ownership, end of period |
| Fidelity Cash Central Fund 5.40% | 433,222,869 | 3,046,041,398 | 3,150,225,746 | 8,575,473 | - | - | 329,038,521 | 0.7% |
| Fidelity Securities Lending Cash Central Fund 5.40% | 246,472,375 | 1,474,269,746 | 1,720,742,121 | 1,148,624 | - | - | - | 0.0% |
| Total | 679,695,244 | 4,520,311,144 | 4,870,967,867 | 9,724,097 | - | - | 329,038,521 | |
| | | | | | | | | |
Amounts in the dividend income column in the above table include any capital gain distributions from underlying funds, which are presented in the corresponding line item in the Statement of Operations, if applicable.
Amounts in the dividend income column for Fidelity Securities Lending Cash Central Fund represents the income earned on investing cash collateral, less rebates paid to borrowers and any lending agent fees associated with the loan, plus any premium payments received for lending certain types of securities.
Amounts included in the purchases and sales proceeds columns may include in-kind transactions, if applicable.
Investment Valuation
The following is a summary of the inputs used, as of October 31, 2023, involving the Fund's assets and liabilities carried at fair value. The inputs or methodology used for valuing securities may not be an indication of the risk associated with investing in those securities. For more information on valuation inputs, and their aggregation into the levels used below, please refer to the Investment Valuation section in the accompanying Notes to Financial Statements.
| Valuation Inputs at Reporting Date: |
| Description | Total ($) | Level 1 ($) | Level 2 ($) | Level 3 ($) |
Investments in Securities: | | | | |
|
| Equities: | | | | |
Communication Services | 66,319,673 | - | 66,319,673 | - |
Consumer Discretionary | 1,220,650,100 | 101,072,127 | 1,119,577,973 | - |
Consumer Staples | 883,833,405 | 212,139,435 | 671,693,970 | - |
Energy | 281,415,110 | - | 281,415,110 | - |
Financials | 2,913,479,617 | 1,273,233,205 | 1,640,246,412 | - |
Health Care | 1,822,593,171 | 864,018,052 | 958,575,119 | - |
Industrials | 2,418,459,520 | 1,240,381,810 | 1,178,077,710 | - |
Information Technology | 1,968,873,038 | 735,840,180 | 1,231,925,739 | 1,107,119 |
Materials | 769,292,827 | 409,550,148 | 359,742,679 | - |
Real Estate | 136,381,767 | 106,325,956 | 30,055,811 | - |
|
| Money Market Funds | 329,038,521 | 329,038,521 | - | - |
| Total Investments in Securities: | 12,810,336,749 | 5,271,599,434 | 7,537,630,196 | 1,107,119 |
| Statement of Assets and Liabilities |
| | | | October 31, 2023 |
| | | | | |
| Assets | | | | |
| Investment in securities, at value - See accompanying schedule: | | | | |
Unaffiliated issuers (cost $10,906,607,755) | $ | 12,481,298,228 | | |
Fidelity Central Funds (cost $329,038,521) | | 329,038,521 | | |
| | | | | |
| | | | | |
| Total Investment in Securities (cost $11,235,646,276) | | | $ | 12,810,336,749 |
| Foreign currency held at value (cost $535,787) | | | | 535,665 |
| Receivable for investments sold | | | | 55,433,184 |
| Receivable for fund shares sold | | | | 141,311,338 |
| Dividends receivable | | | | 16,594,392 |
| Reclaims receivable | | | | 44,796,223 |
| Distributions receivable from Fidelity Central Funds | | | | 1,361,107 |
Total assets | | | | 13,070,368,658 |
| Liabilities | | | | |
| Payable for investments purchased | $ | 176,800,002 | | |
| Payable for fund shares redeemed | | 44,561,596 | | |
| Other payables and accrued expenses | | 4,107,432 | | |
| Total Liabilities | | | | 225,469,030 |
| Net Assets | | | $ | 12,844,899,628 |
| Net Assets consist of: | | | | |
| Paid in capital | | | $ | 11,685,210,642 |
| Total accumulated earnings (loss) | | | | 1,159,688,986 |
| Net Assets | | | $ | 12,844,899,628 |
Net Asset Value, offering price and redemption price per share ($12,844,899,628 ÷ 1,134,493,972 shares) | | | $ | 11.32 |
| Statement of Operations |
| | | | Year ended October 31, 2023 |
| Investment Income | | | | |
| Dividends | | | $ | 274,487,922 |
| Foreign Tax Reclaims | | | | 15,691,286 |
| Income from Fidelity Central Funds (including $1,148,624 from security lending) | | | | 9,724,097 |
| Income before foreign taxes withheld | | | $ | 299,903,305 |
| Less foreign taxes withheld | | | | (44,647,677) |
| Total Income | | | | 255,255,628 |
| Expenses | | | | |
| Custodian fees and expenses | $ | 933,347 | | |
| Independent trustees' fees and expenses | | 75,727 | | |
| Interest | | 34,750 | | |
| Total Expenses | | | | 1,043,824 |
| Net Investment income (loss) | | | | 254,211,804 |
| Realized and Unrealized Gain (Loss) | | | | |
| Net realized gain (loss) on: | | | | |
| Investment Securities: | | | | |
| Unaffiliated issuers (net of foreign taxes of $623,921) | | (29,662,288) | | |
| Redemptions in-kind | | 121,959,420 | | |
| Foreign currency transactions | | (1,831,522) | | |
| Total net realized gain (loss) | | | | 90,465,610 |
| Change in net unrealized appreciation (depreciation) on: | | | | |
| Investment Securities: | | | | |
| Unaffiliated issuers(net of increase in deferred foreign taxes of $303,992) | | 1,366,930,365 | | |
| Assets and liabilities in foreign currencies | | 3,116,587 | | |
| Total change in net unrealized appreciation (depreciation) | | | | 1,370,046,952 |
| Net gain (loss) | | | | 1,460,512,562 |
| Net increase (decrease) in net assets resulting from operations | | | $ | 1,714,724,366 |
| Statement of Changes in Net Assets |
| |
| | Year ended October 31, 2023 | | Year ended October 31, 2022 |
| Increase (Decrease) in Net Assets | | | | |
| Operations | | | | |
| Net investment income (loss) | $ | 254,211,804 | $ | 248,884,392 |
| Net realized gain (loss) | | 90,465,610 | | (580,283,592) |
| Change in net unrealized appreciation (depreciation) | | 1,370,046,952 | | (4,371,425,395) |
| Net increase (decrease) in net assets resulting from operations | | 1,714,724,366 | | (4,702,824,595) |
| Distributions to shareholders | | (228,975,390) | | (454,822,647) |
| | | | | |
| Share transactions | | | | |
| Proceeds from sales of shares | | 1,971,571,393 | | 3,241,589,484 |
| Reinvestment of distributions | | 228,975,390 | | 454,822,647 |
| Cost of shares redeemed | | (3,158,640,518) | | (1,640,720,377) |
| | | | | |
Net increase (decrease) in net assets resulting from share transactions | | (958,093,735) | | 2,055,691,754 |
| Total increase (decrease) in net assets | | 527,655,241 | | (3,101,955,488) |
| | | | | |
| Net Assets | | | | |
| Beginning of period | | 12,317,244,387 | | 15,419,199,875 |
| End of period | $ | 12,844,899,628 | $ | 12,317,244,387 |
| | | | | |
| Other Information | | | | |
| Shares | | | | |
| Sold | | 166,640,804 | | 267,011,806 |
| Issued in reinvestment of distributions | | 20,554,344 | | 32,302,745 |
| Redeemed | | (271,702,575) | | (137,519,813) |
| Net increase (decrease) | | (84,507,427) | | 161,794,738 |
| | | | | |
Financial Highlights
| Fidelity® Series Overseas Fund |
| |
| Years ended October 31, | | 2023 | | 2022 | | 2021 | | 2020 | | 2019 A |
Selected Per-Share Data | | | | | | | | | | |
| Net asset value, beginning of period | $ | 10.10 | $ | 14.58 | $ | 10.62 | $ | 10.20 | $ | 10.00 |
| Income from Investment Operations | | | | | | | | | | |
Net investment income (loss) B,C | | .22 | | .21 | | .17 | | .14 | | .06 D |
| Net realized and unrealized gain (loss) | | 1.20 | | (4.27) | | 3.93 | | .32 | | .14 |
| Total from investment operations | | 1.42 | | (4.06) | | 4.10 | | .46 | | .20 |
| Distributions from net investment income | | (.20) | | (.17) | | (.14) | | (.04) | | - |
| Distributions from net realized gain | | - | | (.25) | | - | | - | | - |
| Total distributions | | (.20) | | (.42) | | (.14) | | (.04) | | - |
| Net asset value, end of period | $ | 11.32 | $ | 10.10 | $ | 14.58 | $ | 10.62 | $ | 10.20 |
Total Return E | | 14.05% | | (28.66)% | | 38.89% | | 4.51% | | 2.00% |
Ratios to Average Net Assets C,F,G | | | | | | | | | | |
| Expenses before reductions | | .01% | | .01% | | .01% | | .01% | | .01% H |
| Expenses net of fee waivers, if any | | .01% | | .01% | | .01% | | .01% | | .01% H |
| Expenses net of all reductions | | .01% | | .01% | | .01% | | .01% | | .01% H |
| Net investment income (loss) | | 1.90% | | 1.79% | | 1.29% | | 1.35% | | 1.69% D,H |
| Supplemental Data | | | | | | | | | | |
| Net assets, end of period (000 omitted) | $ | 12,844,900 | $ | 12,317,244 | $ | 15,419,200 | $ | 11,508,376 | $ | 6,226,806 |
Portfolio turnover rate I | | 38% J | | 28% J | | 33% | | 50% | | 12% J,K |
AFor the period June 21, 2019 (commencement of operations) through October 31, 2019.
BCalculated based on average shares outstanding during the period.
CNet investment income (loss) is affected by the timing of the declaration of dividends by any underlying mutual funds or exchange-traded funds (ETFs). Net investment income (loss) of any mutual funds or ETFs is not included in the Fund's net investment income (loss) ratio.
DNet investment income per share reflects one or more large, non-recurring dividend(s) which amounted to $.03 per share. Such dividends are not annualized in the ratio of net investment income (loss) to average net assets. Excluding such non-recurring dividend(s), the ratio of net investment income (loss) to average net assets would have been .98%.
ETotal returns for periods of less than one year are not annualized.
FFees and expenses of any underlying mutual funds or exchange-traded funds (ETFs) are not included in the Fund's expense ratio. The Fund indirectly bears its proportionate share of these expenses. For additional expense information related to investments in Fidelity Central Funds, please refer to the "Investments in Fidelity Central Funds" note found in the Notes to Financial Statements section of the most recent Annual or Semi-Annual report.
GExpense ratios reflect operating expenses of the class. Expenses before reductions do not reflect amounts reimbursed, waived, or reduced through arrangements with the investment adviser, brokerage services, or other offset arrangements, if applicable, and do not represent the amount paid by the class during periods when reimbursements, waivers or reductions occur.
HAnnualized.
IAmount does not include the portfolio activity of any underlying mutual funds or exchange-traded funds (ETFs).
JPortfolio turnover rate excludes securities received or delivered in-kind.
KAmount not annualized.
For the period ended October 31, 2023
1. Organization.
Fidelity Series Overseas Fund (the Fund) is a fund of Fidelity Investment Trust (the Trust) and is authorized to issue an unlimited number of shares. Shares are offered only to certain other Fidelity funds, Fidelity managed 529 plans, and Fidelity managed collective investment trusts. The Trust is registered under the Investment Company Act of 1940, as amended (the 1940 Act), as an open-end management investment company organized as a Massachusetts business trust.
2. Investments in Fidelity Central Funds.
Funds may invest in Fidelity Central Funds, which are open-end investment companies generally available only to other investment companies and accounts managed by the investment adviser and its affiliates. The Schedule of Investments lists any Fidelity Central Funds held as an investment as of period end, but does not include the underlying holdings of each Fidelity Central Fund. An investing fund indirectly bears its proportionate share of the expenses of the underlying Fidelity Central Funds.
Based on its investment objective, each Fidelity Central Fund may invest or participate in various investment vehicles or strategies that are similar to those of the investing fund. These strategies are consistent with the investment objectives of the investing fund and may involve certain economic risks which may cause a decline in value of each of the Fidelity Central Funds and thus a decline in the value of the investing fund.
| Fidelity Central Fund | Investment Manager | Investment Objective | Investment Practices | Expense RatioA |
| Fidelity Money Market Central Funds | Fidelity Management & Research Company LLC (FMR) | Each fund seeks to obtain a high level of current income consistent with the preservation of capital and liquidity. | Short-term Investments | Less than .005% |
A Expenses expressed as a percentage of average net assets and are as of each underlying Central Fund's most recent annual or semi-annual shareholder report.
A complete unaudited list of holdings for each Fidelity Central Fund is available upon request or at the Securities and Exchange Commission website at www.sec.gov. In addition, the financial statements of the Fidelity Central Funds which contain the significant accounting policies (including investment valuation policies) of those funds, and are not covered by the Report of Independent Registered Public Accounting Firm, are available on the Securities and Exchange Commission website or upon request.
3. Significant Accounting Policies.
The Fund is an investment company and applies the accounting and reporting guidance of the Financial Accounting Standards Board (FASB) Accounting Standards Codification Topic 946 Financial Services - Investment Companies. The financial statements have been prepared in conformity with accounting principles generally accepted in the United States of America (GAAP), which require management to make certain estimates and assumptions at the date of the financial statements. Actual results could differ from those estimates. Subsequent events, if any, through the date that the financial statements were issued have been evaluated in the preparation of the financial statements. The Fund's Schedule of Investments lists any underlying mutual funds or exchange-traded funds (ETFs) but does not include the underlying holdings of these funds. The following summarizes the significant accounting policies of the Fund:
Investment Valuation. Investments are valued as of 4:00 p.m. Eastern time on the last calendar day of the period. The Board of Trustees (the Board) has designated the Fund's investment adviser as the valuation designee responsible for the fair valuation function and performing fair value determinations as needed. The investment adviser has established a Fair Value Committee (the Committee) to carry out the day-to-day fair valuation responsibilities and has adopted policies and procedures to govern the fair valuation process and the activities of the Committee. In accordance with these fair valuation policies and procedures, which have been approved by the Board, the Fund attempts to obtain prices from one or more third party pricing services or brokers to value its investments. When current market prices, quotations or currency exchange rates are not readily available or reliable, investments will be fair valued in good faith by the Committee, in accordance with the policies and procedures. Factors used in determining fair value vary by investment type and may include market or investment specific events, transaction data, estimated cash flows, and market observations of comparable investments. The frequency that the fair valuation procedures are used cannot be predicted and they may be utilized to a significant extent. The Committee manages the Fund's fair valuation practices and maintains the fair valuation policies and procedures. The Fund's investment adviser reports to the Board information regarding the fair valuation process and related material matters.
The Fund categorizes the inputs to valuation techniques used to value its investments into a disclosure hierarchy consisting of three levels as shown below:
Level 1 - unadjusted quoted prices in active markets for identical investments
Level 2 - other significant observable inputs (including quoted prices for similar investments, interest rates, prepayment speeds, etc.)
Level 3 - unobservable inputs (including the Fund's own assumptions based on the best information available)
Valuation techniques used to value the Fund's investments by major category are as follows:
Equity securities, including restricted securities, for which market quotations are readily available, are valued at the last reported sale price or official closing price as reported by a third party pricing service on the primary market or exchange on which they are traded and are categorized as Level 1 in the hierarchy. In the event there were no sales during the day or closing prices are not available, securities are valued at the last quoted bid price or may be valued using the last available price and are generally categorized as Level 2 in the hierarchy. For foreign equity securities, when market or security specific events arise, comparisons to the valuation of American Depositary Receipts (ADRs), futures contracts, Exchange-Traded Funds (ETFs) and certain indexes as well as quoted prices for similar securities may be used and would be categorized as Level 2 in the hierarchy. For equity securities, including restricted securities, where observable inputs are limited, assumptions about market activity and risk are used and these securities may be categorized as Level 3 in the hierarchy.
Investments in open-end mutual funds, including the Fidelity Central Funds, are valued at their closing net asset value (NAV) each business day and are categorized as Level 1 in the hierarchy.
Changes in valuation techniques may result in transfers in or out of an assigned level within the disclosure hierarchy. The aggregate value of investments by input level as of October 31, 2023 is included at the end of the Fund's Schedule of Investments.
Foreign Currency. Certain Funds may use foreign currency contracts to facilitate transactions in foreign-denominated securities. Gains and losses from these transactions may arise from changes in the value of the foreign currency or if the counterparties do not perform under the contracts' terms.
Foreign-denominated assets, including investment securities, and liabilities are translated into U.S. dollars at the exchange rates at period end. Purchases and sales of investment securities, income and dividends received, and expenses denominated in foreign currencies are translated into U.S. dollars at the exchange rate in effect on the transaction date.
The effects of exchange rate fluctuations on investments are included with the net realized and unrealized gain (loss) on investment securities. Other foreign currency transactions resulting in realized and unrealized gain (loss) are disclosed separately.
Investment Transactions and Income. For financial reporting purposes, the Fund's investment holdings and NAV include trades executed through the end of the last business day of the period. The NAV per share for processing shareholder transactions is calculated as of the close of business of the New York Stock Exchange (NYSE), normally 4:00 p.m. Eastern time and includes trades executed through the end of the prior business day. Gains and losses on securities sold are determined on the basis of identified cost. Commissions paid to certain brokers with whom the investment adviser, or its affiliates, places trades on behalf of a fund include an amount in addition to trade execution, which may be rebated back to a fund. Any such rebates are included in net realized gain (loss) on investments in the Statement of Operations. Dividend income is recorded on the ex-dividend date, except for certain dividends from foreign securities where the ex-dividend date may have passed, which are recorded as soon as the Fund is informed of the ex-dividend date. Non-cash dividends included in dividend income, if any, are recorded at the fair market value of the securities received. Income and capital gain distributions from Fidelity Central Funds, if any, are recorded on the ex-dividend date. Certain distributions received by the Fund represent a return of capital or capital gain. The Fund determines the components of these distributions subsequent to the ex-dividend date, based upon receipt of tax filings or other correspondence relating to the underlying investment. These distributions are recorded as a reduction of cost of investments and/or as a realized gain. Investment income is recorded net of foreign taxes withheld where recovery of such taxes is uncertain. Funds may file withholding tax reclaims in certain jurisdictions to recover a portion of amounts previously withheld. Any withholding tax reclaims income is included in the Statement of Operations in foreign tax reclaims. Any receivables for withholding tax reclaims are included in the Statement of Assets and Liabilities in reclaims receivable.
Expenses. Expenses directly attributable to a fund are charged to that fund. Expenses attributable to more than one fund are allocated among the respective funds on the basis of relative net assets or other appropriate methods. Expenses included in the accompanying financial statements reflect the expenses of that fund and do not include any expenses associated with any underlying mutual funds or exchange-traded funds. Although not included in a fund's expenses, a fund indirectly bears its proportionate share of these expenses through the net asset value of each underlying mutual fund or exchange-traded fund. Expense estimates are accrued in the period to which they relate and adjustments are made when actual amounts are known.
Income Tax Information and Distributions to Shareholders. Each year, the Fund intends to qualify as a regulated investment company under Subchapter M of the Internal Revenue Code, including distributing substantially all of its taxable income and realized gains. As a result, no provision for U.S. Federal income taxes is required. As of October 31, 2023, the Fund did not have any unrecognized tax benefits in the financial statements; nor is the Fund aware of any tax positions for which it is reasonably possible that the total amounts of unrecognized tax benefits will significantly change in the next twelve months. The Fund files a U.S. federal tax return, in addition to state and local tax returns as required. The Fund's federal income tax returns are subject to examination by the Internal Revenue Service (IRS) for a period of three fiscal years after they are filed. State and local tax returns may be subject to examination for an additional fiscal year depending on the jurisdiction. Foreign taxes are provided for based on the Fund's understanding of the tax rules and rates that exist in the foreign markets in which it invests. The Fund is subject to a tax imposed on capital gains by certain countries in which it invests. An estimated deferred tax liability for net unrealized appreciation on the applicable securities is included in Other payables and accrued expenses on the Statement of Assets & Liabilities.
Distributions are declared and recorded on the ex-dividend date. Income and capital gain distributions are determined in accordance with income tax regulations, which may differ from GAAP. In addition, the Fund claimed a portion of the payment made to redeeming shareholders as a distribution for income tax purposes.
Capital accounts within the financial statements are adjusted for permanent book-tax differences. These adjustments have no impact on net assets or the results of operations. Capital accounts are not adjusted for temporary book-tax differences which will reverse in a subsequent period.
Book-tax differences are primarily due to foreign currency transactions, certain foreign taxes, passive foreign investment companies (PFIC), redemptions in-kind, capital loss carryforwards and losses deferred due to wash sales.
As of period end, the cost and unrealized appreciation (depreciation) in securities, and derivatives if applicable, for federal income tax purposes were as follows:
| Gross unrealized appreciation | $2,111,567,944 |
| Gross unrealized depreciation | (551,526,583) |
| Net unrealized appreciation (depreciation) | $1,560,041,361 |
| Tax Cost | $11,250,295,388 |
The tax-based components of distributable earnings as of period end were as follows:
| Undistributed ordinary income | $216,052,626 |
| Capital loss carryforward | $(611,597,364) |
| Net unrealized appreciation (depreciation) on securities and other investments | $1,559,032,941 |
Capital loss carryforwards are only available to offset future capital gains of the Fund to the extent provided by regulations and may be limited. The capital loss carryforward information presented below, including any applicable limitation, is estimated as of fiscal period end and is subject to adjustment.
Short-term | $(514,624,302) |
Long-term | (96,973,062) |
| Total capital loss carryforward | $(611,597,364) |
The tax character of distributions paid was as follows:
| | October 31, 2023 | October 31, 2022 |
| Ordinary Income | $228,975,390 | $186,260,703 |
| Long-term Capital Gains | - | 268,561,944 |
| Total | $228,975,390 | $454,822,647 |
Restricted Securities (including Private Placements). Funds may invest in securities that are subject to legal or contractual restrictions on resale. These securities generally may be resold in transactions exempt from registration or to the public if the securities are registered. Disposal of these securities may involve time-consuming negotiations and expense, and prompt sale at an acceptable price may be difficult. Information regarding restricted securities held at period end is included at the end of the Schedule of Investments, if applicable.
4. Purchases and Sales of Investments.
Purchases and sales of securities, other than short-term securities and in-kind transactions, as applicable, are noted in the table below.
| | Purchases ($) | Sales ($) |
| Fidelity Series Overseas Fund | 4,976,805,546 | 5,495,440,806 |
Unaffiliated Redemptions In-Kind. Shares that were redeemed in-kind for investments, including accrued interest and cash, if any, are shown in the table below. The net realized gain or loss on investments delivered through in-kind redemptions is included in the "Net realized gain (loss) on: Redemptions in-kind" line in the accompanying Statement of Operations. The amount of the in-kind redemptions is included in share transactions in the accompanying Statement of Changes in Net Assets. There was no gain or loss for federal income tax purposes.
| | Shares | Total net realized gain or loss ($) | Total Proceeds ($) |
| Fidelity Series Overseas Fund | 32,698,280 | 121,959,420 | 380,570,728 |
5. Fees and Other Transactions with Affiliates.
Management Fee. Fidelity Management & Research Company LLC (the investment adviser) and its affiliates provide the Fund with investment management related services for which the Fund does not pay a management fee. Under the management contract, the investment adviser or an affiliate pays all ordinary operating expenses of the Fund, except custody fees, fees and expenses of the independent Trustees, and certain miscellaneous expenses such as proxy and shareholder meeting expenses.
Brokerage Commissions. A portion of portfolio transactions were placed with brokerage firms which are affiliates of the investment adviser. Brokerage commissions are included in net realized gain (loss) and change in net unrealized appreciation (depreciation) in the Statement of Operations. The commissions paid to these affiliated firms were as follows:
| | Amount |
| Fidelity Series Overseas Fund | $ 2,047 |
Interfund Lending Program. Pursuant to an Exemptive Order issued by the Securities and Exchange Commission (the SEC), the Fund, along with other registered investment companies having management contracts with Fidelity Management & Research Company LLC (FMR), or other affiliated entities of FMR, may participate in an interfund lending program. This program provides an alternative credit facility allowing the Fund to borrow from, or lend money to, other participating affiliated funds. At period end, there were no interfund loans outstanding. Activity in this program during the period for which loans were outstanding was as follows:
| | Borrower or Lender | Average Loan Balance | Weighted Average Interest Rate | Interest Expense |
| Fidelity Series Overseas Fund | Borrower | $ 33,953,375 | 4.61% | $ 34,750 |
Interfund Trades. Funds may purchase from or sell securities to other Fidelity Funds under procedures adopted by the Board. The procedures have been designed to ensure these interfund trades are executed in accordance with Rule 17a-7 of the 1940 Act. Any interfund trades are included within the respective purchases and sales amounts shown in the Purchases and Sales of Investments note. Interfund trades during the period are noted in the table below.
| | Purchases ($) | Sales ($) | Realized Gain (Loss) ($) |
| Fidelity Series Overseas Fund | 246,129,847 | 94,964,927 | (4,564,405) |
Prior Fiscal Year Affiliated Redemptions In-Kind. Shares that were redeemed in-kind for investments, including accrued interest and cash, if any, are shown in the table below; along with realized gain or loss on investments delivered through in-kind redemptions. The amount of the in-kind redemptions is included in share transactions in the accompanying Statement of Changes in Net Assets. There was no gain or loss for federal income tax purposes.
| | Shares | Total net realized gain or loss ($) | Total Proceeds ($) |
| Fidelity Series Overseas Fund | 4,714,174 | 10,846,765 | 47,182,852 |
Other. During the period, the investment adviser reimbursed the Fund for certain losses as follows:
| | Amount ($) |
| Fidelity Series Overseas Fund | 3,323 |
6. Committed Line of Credit.
Certain Funds participate with other funds managed by the investment adviser or an affiliate in a $4.25 billion credit facility (the "line of credit") to be utilized for temporary or emergency purposes to fund shareholder redemptions or for other short-term liquidity purposes. The commitment fees on the pro-rata portion of the line of credit are borne by the investment adviser. During the period, there were no borrowings on this line of credit.
7. Security Lending.
Funds lend portfolio securities from time to time in order to earn additional income. Lending agents are used, including National Financial Services (NFS), an affiliate of the investment adviser. Pursuant to a securities lending agreement, NFS will receive a fee, which is capped at 9.9% of a fund's daily lending revenue, for its services as lending agent. A fund may lend securities to certain qualified borrowers, including NFS. On the settlement date of the loan, a fund receives collateral (in the form of U.S. Treasury obligations, letters of credit and/or cash) against the loaned securities and maintains collateral in an amount not less than 100% of the market value of the loaned securities during the period of the loan. The market value of the loaned securities is determined at the close of business of a fund and any additional required collateral is delivered to a fund on the next business day. A fund or borrower may terminate the loan at any time, and if the borrower defaults on its obligation to return the securities loaned because of insolvency or other reasons, a fund may apply collateral received from the borrower against the obligation. A fund may experience delays and costs in recovering the securities loaned. Any cash collateral received is invested in the Fidelity Securities Lending Cash Central Fund. Any loaned securities are identified as such in the Schedule of Investments, and the value of loaned securities and cash collateral at period end, as applicable, are presented in the Statement of Assets and Liabilities. Security lending income represents the income earned on investing cash collateral, less rebates paid to borrowers and any lending agent fees associated with the loan, plus any premium payments received for lending certain types of securities. Security lending income is presented in the Statement of Operations as a component of income from Fidelity Central Funds. Affiliated security lending activity, if any, was as follows:
| | Total Security Lending Fees Paid to NFS | Security Lending Income From Securities Loaned to NFS | Value of Securities Loaned to NFS at Period End |
| Fidelity Series Overseas Fund | $121,513 | $ - | $- |
8. Other.
A fund's organizational documents provide former and current trustees and officers with a limited indemnification against liabilities arising in connection with the performance of their duties to the fund. In the normal course of business, a fund may also enter into contracts that provide general indemnifications. A fund's maximum exposure under these arrangements is unknown as this would be dependent on future claims that may be made against a fund. The risk of material loss from such claims is considered remote.
At the end of the period, mutual funds and accounts managed by the investment adviser or its affiliates were the owners of record of all of the outstanding shares of the Fund.
9. Risk and Uncertainties.
Many factors affect a fund's performance. Developments that disrupt global economies and financial markets, such as pandemics, epidemics, outbreaks of infectious diseases, war, terrorism, and environmental disasters, may significantly affect a fund's investment performance. The effects of these developments to a fund will be impacted by the types of securities in which a fund invests, the financial condition, industry, economic sector, and geographic location of an issuer, and a fund's level of investment in the securities of that issuer. Significant concentrations in security types, issuers, industries, sectors, and geographic locations may magnify the factors that affect a fund's performance.
To the Board of Trustees of Fidelity Investment Trust and the Shareholders of Fidelity Series Overseas Fund:
Opinion on the Financial Statements and Financial Highlights
We have audited the accompanying statement of assets and liabilities of Fidelity Series Overseas Fund (the "Fund"), a fund of Fidelity Investment Trust, including the schedule of investments, as of October 31, 2023, the related statement of operations for the year then ended, the statement of changes in net assets for each of the two years in the period then ended, the financial highlights for each of the four years in the period then ended and for the period from June 21, 2019 (commencement of operations) through October 31, 2019, and the related notes. In our opinion, the financial statements and financial highlights present fairly, in all material respects, the financial position of the Fund as of October 31, 2023, and the results of its operations for the year then ended, the changes in its net assets for each of the two years in the period then ended, and the financial highlights for each of the four years in the period then ended and for the period from June 21, 2019 (commencement of operations) through October 31, 2019, in conformity with accounting principles generally accepted in the United States of America.
Basis for Opinion
These financial statements and financial highlights are the responsibility of the Fund's management. Our responsibility is to express an opinion on the Fund's financial statements and financial highlights based on our audits. We are a public accounting firm registered with the Public Company Accounting Oversight Board (United States) (PCAOB) and are required to be independent with respect to the Fund in accordance with the U.S. federal securities laws and the applicable rules and regulations of the Securities and Exchange Commission and the PCAOB.
We conducted our audits in accordance with the standards of the PCAOB. Those standards require that we plan and perform the audit to obtain reasonable assurance about whether the financial statements and financial highlights are free of material misstatement, whether due to error or fraud. The Fund is not required to have, nor were we engaged to perform, an audit of its internal control over financial reporting. As part of our audits we are required to obtain an understanding of internal control over financial reporting but not for the purpose of expressing an opinion on the effectiveness of the Fund's internal control over financial reporting. Accordingly, we express no such opinion.
Our audits included performing procedures to assess the risks of material misstatement of the financial statements and financial highlights, whether due to error or fraud, and performing procedures that respond to those risks. Such procedures included examining, on a test basis, evidence regarding the amounts and disclosures in the financial statements and financial highlights. Our audits also included evaluating the accounting principles used and significant estimates made by management, as well as evaluating the overall presentation of the financial statements and financial highlights. Our procedures included confirmation of securities owned as of October 31, 2023, by correspondence with the custodian and brokers; when replies were not received from brokers, we performed other auditing procedures. We believe that our audits provide a reasonable basis for our opinion.
/s/ Deloitte & Touche LLP
Boston, Massachusetts
December 15, 2023
We have served as the auditor of one or more of the Fidelity investment companies since 1999.
The Trustees, Members of the Advisory Board (if any), and officers of the trust and fund, as applicable, are listed below. The Board of Trustees governs the fund and is responsible for protecting the interests of shareholders. The Trustees are experienced executives who meet periodically throughout the year to oversee the fund's activities, review contractual arrangements with companies that provide services to the fund, oversee management of the risks associated with such activities and contractual arrangements, and review the fund's performance. Except for Jonathan Chiel, each of the Trustees oversees 322 funds. Mr. Chiel oversees 191 funds.
The Trustees hold office without limit in time except that (a) any Trustee may resign; (b) any Trustee may be removed by written instrument, signed by at least two-thirds of the number of Trustees prior to such removal; (c) any Trustee who requests to be retired or who has become incapacitated by illness or injury may be retired by written instrument signed by a majority of the other Trustees; and (d) any Trustee may be removed at any special meeting of shareholders by a two-thirds vote of the outstanding voting securities of the trust. Each Trustee who is not an interested person (as defined in the 1940 Act) of the trust and the fund is referred to herein as an Independent Trustee. Each Independent Trustee shall retire not later than the last day of the calendar year in which his or her 75th birthday occurs. The Independent Trustees may waive this mandatory retirement age policy with respect to individual Trustees. Officers and Advisory Board Members hold office without limit in time, except that any officer or Advisory Board Member may resign or may be removed by a vote of a majority of the Trustees at any regular meeting or any special meeting of the Trustees. Except as indicated, each individual has held the office shown or other offices in the same company for the past five years.
The fund's Statement of Additional Information (SAI) includes more information about the Trustees. To request a free copy, call Fidelity at 1-800-544-8544.
Experience, Skills, Attributes, and Qualifications of the Trustees. The Governance and Nominating Committee has adopted a statement of policy that describes the experience, qualifications, attributes, and skills that are necessary and desirable for potential Independent Trustee candidates (Statement of Policy). The Board believes that each Trustee satisfied at the time he or she was initially elected or appointed a Trustee, and continues to satisfy, the standards contemplated by the Statement of Policy. The Governance and Nominating Committee also engages professional search firms to help identify potential Independent Trustee candidates who have the experience, qualifications, attributes, and skills consistent with the Statement of Policy. From time to time, additional criteria based on the composition and skills of the current Independent Trustees, as well as experience or skills that may be appropriate in light of future changes to board composition, business conditions, and regulatory or other developments, have also been considered by the professional search firms and the Governance and Nominating Committee. In addition, the Board takes into account the Trustees' commitment and participation in Board and committee meetings, as well as their leadership of standing and ad hoc committees throughout their tenure.
In determining that a particular Trustee was and continues to be qualified to serve as a Trustee, the Board has considered a variety of criteria, none of which, in isolation, was controlling. The Board believes that, collectively, the Trustees have balanced and diverse experience, qualifications, attributes, and skills, which allow the Board to operate effectively in governing the fund and protecting the interests of shareholders. Information about the specific experience, skills, attributes, and qualifications of each Trustee, which in each case led to the Board's conclusion that the Trustee should serve (or continue to serve) as a trustee of the fund, is provided below.
Board Structure and Oversight Function. Robert A. Lawrence is an interested person and currently serves as Chair. The Trustees have determined that an interested Chair is appropriate and benefits shareholders because an interested Chair has a personal and professional stake in the quality and continuity of services provided to the fund. Independent Trustees exercise their informed business judgment to appoint an individual of their choosing to serve as Chair, regardless of whether the Trustee happens to be independent or a member of management. The Independent Trustees have determined that they can act independently and effectively without having an Independent Trustee serve as Chair and that a key structural component for assuring that they are in a position to do so is for the Independent Trustees to constitute a substantial majority for the Board. The Independent Trustees also regularly meet in executive session. David M. Thomas serves as Lead Independent Trustee and as such (i) acts as a liaison between the Independent Trustees and management with respect to matters important to the Independent Trustees and (ii) with management prepares agendas for Board meetings.
Fidelity® funds are overseen by different Boards of Trustees. The fund's Board oversees Fidelity's high income and certain equity funds, and other Boards oversee Fidelity's alternative investment, investment-grade bond, money market, asset allocation, and other equity funds. The asset allocation funds may invest in Fidelity® funds overseen by the fund's Board. The use of separate Boards, each with its own committee structure, allows the Trustees of each group of Fidelity® funds to focus on the unique issues of the funds they oversee, including common research, investment, and operational issues. On occasion, the separate Boards establish joint committees to address issues of overlapping consequences for the Fidelity® funds overseen by each Board.
The Trustees operate using a system of committees to facilitate the timely and efficient consideration of all matters of importance to the Trustees, the fund, and fund shareholders and to facilitate compliance with legal and regulatory requirements and oversight of the fund's activities and associated risks. The Board, acting through its committees, has charged FMR and its affiliates with (i) identifying events or circumstances the occurrence of which could have demonstrably adverse effects on the fund's business and/or reputation; (ii) implementing processes and controls to lessen the possibility that such events or circumstances occur or to mitigate the effects of such events or circumstances if they do occur; and (iii) creating and maintaining a system designed to evaluate continuously business and market conditions in order to facilitate the identification and implementation processes described in (i) and (ii) above. Because the day-to-day operations and activities of the fund are carried out by or through FMR, its affiliates, and other service providers, the fund's exposure to risks is mitigated but not eliminated by the processes overseen by the Trustees. While each of the Board's committees has responsibility for overseeing different aspects of the fund's activities, oversight is exercised primarily through the Operations, Audit, and Compliance Committees. Appropriate personnel, including but not limited to the fund's Chief Compliance Officer (CCO), FMR's internal auditor, the independent accountants, the fund's Treasurer and portfolio management personnel, make periodic reports to the Board's committees, as appropriate, including an annual review of Fidelity's risk management program for the Fidelity® funds. The responsibilities of each standing committee, including their oversight responsibilities, are described further under "Standing Committees of the Trustees."
Interested Trustees*:
Correspondence intended for a Trustee who is an interested person may be sent to Fidelity Investments, 245 Summer Street, Boston, Massachusetts 02210.
Name, Year of Birth; Principal Occupations and Other Relevant Experience+
Jonathan Chiel (1957)
Year of Election or Appointment: 2016
Trustee
Mr. Chiel also serves as Trustee of other Fidelity® funds. Mr. Chiel is General Counsel (2012-present) and Head of Legal, Risk and Compliance (2022-present). Mr Chiel serves as Executive Vice President and General Counsel for FMR LLC (diversified financial services company, 2012-present) and Director and President for OH Company LLC (holding company, 2018-present). Previously, Mr. Chiel served as general counsel (2004-2012) and senior vice president and deputy general counsel (2000-2004) for John Hancock Financial Services; a partner with Choate, Hall & Stewart (1996-2000) (law firm); and an Assistant United States Attorney for the United States Attorney's Office of the District of Massachusetts (1986-95), including Chief of the Criminal Division (1993-1995). Mr. Chiel is a director on the boards of the Boston Bar Foundation and the Maimonides School.
Bettina Doulton (1964)
Year of Election or Appointment: 2021
Trustee
Ms. Doulton also serves as Trustee of other Fidelity® funds. Prior to her retirement, Ms. Doulton served in a variety of positions at Fidelity Investments, including as a managing director of research (2006-2007), portfolio manager to certain Fidelity® funds (1993-2005), equity analyst and portfolio assistant (1990-1993), and research assistant (1987-1990). Ms. Doulton currently owns and operates Phi Builders + Architects and Cellardoor Winery. Previously, Ms. Doulton served as a member of the Board of Brown Capital Management, LLC (2014-2018).
Robert A. Lawrence (1952)
Year of Election or Appointment: 2020
Trustee
Chair of the Board of Trustees
Mr. Lawrence also serves as Trustee of other funds. Previously, Mr. Lawrence served as a Trustee and Member of the Advisory Board of certain funds. Prior to his retirement in 2008, Mr. Lawrence served as Vice President of certain Fidelity® funds (2006-2008), Senior Vice President, Head of High Income Division of Fidelity Management & Research Company (investment adviser firm, 2006-2008), and President of Fidelity Strategic Investments (investment adviser firm, 2002-2005).
* Determined to be an "Interested Trustee" by virtue of, among other things, his or her affiliation with the trust or various entities under common control with FMR.
+ The information includes the Trustee's principal occupation during the last five years and other information relating to the experience, attributes, and skills relevant to the Trustee's qualifications to serve as a Trustee, which led to the conclusion that the Trustee should serve as a Trustee for the fund.
Independent Trustees:
Correspondence intended for an Independent Trustee may be sent to Fidelity Investments, P.O. Box 55235, Boston, Massachusetts 02205-5235.
Name, Year of Birth; Principal Occupations and Other Relevant Experience+
Thomas P. Bostick (1956)
Year of Election or Appointment: 2021
Trustee
Lieutenant General Bostick also serves as Trustee of other Fidelity® funds. Prior to his retirement, General Bostick (United States Army, Retired) held a variety of positions within the U.S. Army, including Commanding General and Chief of Engineers, U.S. Army Corps of Engineers (2012-2016) and Deputy Chief of Staff and Director of Human Resources, U.S. Army (2009-2012). General Bostick currently serves as a member of the Board and Finance and Governance & Sustainability Committees of CSX Corporation (transportation, 2020-present) and a member of the Board and Corporate Governance and Nominating Committee of Perma-Fix Environmental Services, Inc. (nuclear waste management, 2020-present). General Bostick serves as Chief Executive Officer of Bostick Global Strategies, LLC (consulting, 2016-present), as a member of the Board of HireVue, Inc. (video interview and assessment, 2020-present), as a member of the Board of Allonnia (biotechnology and engineering solutions, 2022-present) and on the Advisory Board of Solugen, Inc. (specialty bio-based chemicals manufacturer, 2022-present). Previously, General Bostick served as a Member of the Advisory Board of certain Fidelity® funds (2021), President, Intrexon Bioengineering (2018-2020) and Chief Operating Officer (2017-2020) and Senior Vice President of the Environment Sector (2016-2017) of Intrexon Corporation (biopharmaceutical company).
Dennis J. Dirks (1948)
Year of Election or Appointment: 2005
Trustee
Mr. Dirks also serves as Trustee of other Fidelity® funds. Prior to his retirement in May 2003, Mr. Dirks served as Chief Operating Officer and as a member of the Board of The Depository Trust & Clearing Corporation (financial markets infrastructure), President, Chief Operating Officer and a member of the Board of The Depository Trust Company (DTC), President and a member of the Board of the National Securities Clearing Corporation (NSCC), Chief Executive Officer and a member of the Board of the Government Securities Clearing Corporation and Chief Executive Officer and a member of the Board of the Mortgage-Backed Securities Clearing Corporation. Mr. Dirks currently serves as a member of the Finance Committee (2016-present) and Board (2017-present) and is Treasurer (2018-present) of the Asolo Repertory Theatre.
Donald F. Donahue (1950)
Year of Election or Appointment: 2018
Trustee
Mr. Donahue also serves as Trustee of other Fidelity® funds. Mr. Donahue serves as President and Chief Executive Officer of Miranda Partners, LLC (risk consulting for the financial services industry, 2012-present). Previously, Mr. Donahue served as Chief Executive Officer (2006-2012), Chief Operating Officer (2003-2006) and Managing Director, Customer Marketing and Development (1999-2003) of The Depository Trust & Clearing Corporation (financial markets infrastructure). Mr. Donahue currently serves as a member (2007-present) and Co-Chairman (2016-present) of the Board of United Way of New York. Mr. Donahue previously served as a member of the Advisory Board of certain Fidelity® funds (2015-2018) and as a member of the Board of The Leadership Academy (previously NYC Leadership Academy) (2012-2022).
Vicki L. Fuller (1957)
Year of Election or Appointment: 2020
Trustee
Ms. Fuller also serves as Trustee of other Fidelity® funds. Previously, Ms. Fuller served as a member of the Advisory Board of certain Fidelity® funds (2018-2020), Chief Investment Officer of the New York State Common Retirement Fund (2012-2018) and held a variety of positions at AllianceBernstein L.P. (global asset management, 1985-2012), including Managing Director (2006-2012) and Senior Vice President and Senior Portfolio Manager (2001-2006). Ms. Fuller currently serves as a member of the Board, Audit Committee and Nominating and Governance Committee of two Blackstone business development companies (2020-present), as a member of the Board of Treliant, LLC (consulting, 2019-present), as a member of the Board of Ariel Alternatives, LLC (private equity, 2022-present) and as a member of the Board and Chair of the Audit Committee of Gusto, Inc. (software, 2021-present). In addition, Ms. Fuller currently serves as a member of the Board of Roosevelt University (2019-present) and as a member of the Executive Board of New York University's Stern School of Business. Ms. Fuller previously served as a member of the Board, Audit Committee and Nominating and Governance Committee of The Williams Companies, Inc. (natural gas infrastructure, 2018-2021).
Patricia L. Kampling (1959)
Year of Election or Appointment: 2020
Trustee
Ms. Kampling also serves as Trustee of other Fidelity® funds. Prior to her retirement, Ms. Kampling served as Chairman of the Board and Chief Executive Officer (2012-2019), President and Chief Operating Officer (2011-2012) and Executive Vice President and Chief Financial Officer (2010-2011) of Alliant Energy Corporation. Ms. Kampling currently serves as a member of the Board, Finance Committee and Governance, Compensation and Nominating Committee of Xcel Energy Inc. (utilities company, 2020-present) and as a member of the Board, Audit, Finance and Risk Committee and Safety, Environmental, Technology and Operations Committee and Chair of the Executive Development and Compensation Committee of American Water Works Company, Inc. (utilities company, 2019-present). In addition, Ms. Kampling currently serves as a member of the Board of the Nature Conservancy, Wisconsin Chapter (2019-present). Previously, Ms. Kampling served as a Member of the Advisory Board of certain Fidelity® funds (2020), a member of the Board, Compensation Committee and Executive Committee and Chair of the Audit Committee of Briggs & Stratton Corporation (manufacturing, 2011-2021), a member of the Board of Interstate Power and Light Company (2012-2019) and Wisconsin Power and Light Company (2012-2019) (each a subsidiary of Alliant Energy Corporation) and as a member of the Board and Workforce Development Committee of the Business Roundtable (2018-2019).
Thomas A. Kennedy (1955)
Year of Election or Appointment: 2021
Trustee
Mr. Kennedy also serves as Trustee of other Fidelity® funds. Previously, Mr. Kennedy served as a Member of the Advisory Board of certain Fidelity® funds (2020) and held a variety of positions at Raytheon Company (aerospace and defense, 1983-2020), including Chairman and Chief Executive Officer (2014-2020) and Executive Vice President and Chief Operating Officer (2013-2014). Mr. Kennedy served as Executive Chairman of the Board of Directors of Raytheon Technologies Corporation (aerospace and defense, 2020-2021). Mr. Kennedy serves as a Director of the Board of Directors of Textron Inc. (aerospace and defense, 2023-present).
Oscar Munoz (1959)
Year of Election or Appointment: 2021
Trustee
Mr. Munoz also serves as Trustee of other Fidelity® funds. Prior to his retirement, Mr. Munoz served as Executive Chairman (2020-2021), Chief Executive Officer (2015-2020), President (2015-2016) and a member of the Board (2010-2021) of United Airlines Holdings, Inc. Mr. Munoz currently serves as a member of the Board of CBRE Group, Inc. (commercial real estate, 2020-present), a member of the Board of Univision Communications, Inc. (Hispanic media, 2020-present), a member of the Board of Archer Aviation Inc. (2021-present), a member of the Defense Business Board of the United States Department of Defense (2021-present) and a member of the Board of Salesforce.com, Inc. (cloud-based software, 2022-present). Previously, Mr. Munoz served as a Member of the Advisory Board of certain Fidelity® funds (2021).
David M. Thomas (1949)
Year of Election or Appointment: 2008
Trustee
Lead Independent Trustee
Mr. Thomas also serves as Trustee of other Fidelity® funds. Previously, Mr. Thomas served as Executive Chairman (2005-2006) and Chairman and Chief Executive Officer (2000-2005) of IMS Health, Inc. (pharmaceutical and healthcare information solutions). Mr. Thomas currently serves as a member of the Board of Fortune Brands Home and Security (home and security products, 2004-present) and as Director (2013-present) and Non-Executive Chairman of the Board (2022-present) of Interpublic Group of Companies, Inc. (marketing communication).
Susan Tomasky (1953)
Year of Election or Appointment: 2020
Trustee
Ms. Tomasky also serves as Trustee of other Fidelity® funds. Prior to her retirement, Ms. Tomasky served in various executive officer positions at American Electric Power Company, Inc. (1998-2011), including most recently as President of AEP Transmission (2007-2011). Ms. Tomasky currently serves as a member of the Board and Sustainability Committee and as Chair of the Audit Committee of Marathon Petroleum Corporation (2018-present) and as a member of the Board, Executive Committee, Corporate Governance Committee and Organization and Compensation Committee and as Lead Director of the Board of Public Service Enterprise Group, Inc. (utilities company, 2012-present) and as a member of the Board of its subsidiary company, Public Service Electric and Gas Co. (2021-present). In addition, Ms. Tomasky currently serves as a member (2009-present) and President (2020-present) of the Board of the Royal Shakespeare Company - America (2009-present), as a member of the Board of the Columbus Association for the Performing Arts (2011-present) and as a member of the Board and Kenyon in the World Committee of Kenyon College (2016-present). Previously, Ms. Tomasky served as a Member of the Advisory Board of certain Fidelity® funds (2020), as a member of the Board of the Columbus Regional Airport Authority (2007-2020), as a member of the Board (2011-2018) and Lead Independent Director (2015-2018) of Andeavor Corporation (previously Tesoro Corporation) (independent oil refiner and marketer) and as a member of the Board of Summit Midstream Partners LP (energy, 2012-2018).
Michael E. Wiley (1950)
Year of Election or Appointment: 2020
Trustee
Mr. Wiley also serves as Trustee of other Fidelity® funds. Previously, Mr. Wiley served as a member of the Advisory Board of certain Fidelity® funds (2018-2020), Chairman, President and CEO of Baker Hughes, Inc. (oilfield services, 2000-2004). Mr. Wiley also previously served as a member of the Board of Andeavor Corporation (independent oil refiner and marketer, 2005-2018), a member of the Board of Andeavor Logistics LP (natural resources logistics, 2015-2018) and a member of the Board of High Point Resources (exploration and production, 2005-2020).
+ The information includes the Trustee's principal occupation during the last five years and other information relating to the experience, attributes, and skills relevant to the Trustee's qualifications to serve as a Trustee, which led to the conclusion that the Trustee should serve as a Trustee for the fund.
Advisory Board Members and Officers:
Correspondence intended for a Member of the Advisory Board (if any) may be sent to Fidelity Investments, P.O. Box 55235, Boston, Massachusetts 02205-5235. Correspondence intended for an officer or Peter S. Lynch may be sent to Fidelity Investments, 245 Summer Street, Boston, Massachusetts 02210.
Name, Year of Birth; Principal Occupation
Vijay C. Advani (1960)
Year of Election or Appointment: 2023
Member of the Advisory Board
Mr. Advani also serves as Trustee or Member of the Advisory Board of other funds. Previously, Mr. Advani served as Executive Chairman (2020-2022), Chief Executive Officer (2017-2020) and Chief Operating Officer (2016-2017) of Nuveen (global investment manager). He also served in various capacities at Franklin Resources (global investment manager), including Co-President (2015-2016), Executive Vice President, Global Advisory Services (2008-2015), Head of Global Retail Distribution (2005-2008), Executive Managing Director, International Retail Development (2002-2005), Managing Director, Product Developments, Sales & Marketing, Asia, Eastern Europe and Africa (2000-2002) and President, Templeton Asset Management India (1995-2000). Mr. Advani also served as Senior Investment Officer of International Finance Corporation (private equity and venture capital arm of The World Bank, 1984-1995). Mr. Advani is Chairman Emeritus of the U.S. India Business Council (2018-present), a Director of The Global Impact Investing Network (2019-present), a Director of LOK Capital (Mauritius) (2022-present), a member of the Advisory Council of LOK Capital (2022-present), a Senior Advisor of Neuberger Berman (2021-present), a Senior Advisor of Seviora Holdings Pte. Ltd (Temasek-Singapore) (2021-present), a Director of Seviora Capital (Singapore) (2021-present) and an Advisor of EQUIAM (2021-present). Mr. Advani formerly served as a member of the Board of BowX Acquisition Corp. (special purpose acquisition company, 2020-2021), a member of the Board of Intellecap (advisory arm of The Aavishkaar Group, 2018-2020), a member of the Board of Nuveen Investments, Inc. (2017-2020) and a member of the Board of Docusign (software, 2016-2019).
Peter S. Lynch (1944)
Year of Election or Appointment: 2003
Member of the Advisory Board
Mr. Lynch also serves as a Member of the Advisory Board of other Fidelity® funds. Mr. Lynch is Vice Chairman and a Director of Fidelity Management & Research Company LLC (investment adviser firm). In addition, Mr. Lynch serves as a Trustee of Boston College and as the Chairman of the Inner-City Scholarship Fund. Previously, Mr. Lynch served as Vice Chairman and a Director of FMR Co., Inc. (investment adviser firm) and on the Special Olympics International Board of Directors (1997-2006).
Karen B. Peetz (1955)
Year of Election or Appointment: 2023
Member of the Advisory Board
Ms. Peetz also serves as a Member of the Advisory Board of other funds. Previously, Ms. Peetz served as Chief Administration Officer (2020-2023) of Citigroup Inc. (a diversified financial service company). She also served in various capacities at Bank of New York Mellon Corporation, including President (2013-2016), Vice Chairman, Senior Executive Vice President and Chief Executive Officer of Financial Markets & Treasury Services (2010-2013), Senior Executive Vice President and Chief Executive Officer of Global Corporate Trust (2003-2008), Senior Vice President and Division Manager of Global Payments & Trade Services (2002-2003) and Senior Vice President and Division Manager of Domestic Corporate Trust (1998-2002). Ms. Peetz also served in various capacities at Chase Manhattan Corporation (1982-1998), including Senior Vice President and Manager of Corporate Trust International Business (1996-1998), Managing Director and Manager of Corporate Trust Services (1994-1996) and Managing Director and Group Manager of Financial Institution Sales (1990-1993). Ms. Peetz currently serves as Chair of Amherst Holdings Advisory Council (2018-present), Trustee of Johns Hopkins University (2016-present), Chair of the Carey Business School Advisory Council, Member of the Johns Hopkins Medicine Board and Finance Committee and Chair of the Lyme and Tick Related Disease Institute Advisory Council. Ms. Peetz previously served as a member of the Board of Guardian Life Insurance Company of America (2019-2023), a member of the Board of Trane Technologies (2018-2022), a member of the Board of Wells Fargo Corp. (2017-2019), a member of the Board of SunCoke Energy Inc. (2012-2016), a member of the Board of Private Export Funding Corporation (2010-2016) and as a Trustee of Penn State University (2010-2014) and the United Way of New York City (2008-2010).
Heather Bonner (1977)
Year of Election or Appointment: 2023
Assistant Treasurer
Ms. Bonner also serves as an officer of other funds. Ms. Bonner is a Senior Vice President (2022-present) and is an employee of Fidelity Investments (2022-present). Ms. Bonner serves as Vice President, Treasurer, or Assistant Treasurer of certain Fidelity entities. Prior to joining Fidelity, Ms. Bonner served as Managing Director at AQR Capital Management (2013-2022) and was the Treasurer and Principal Financial Officer of the AQR Funds (2013-2022).
Craig S. Brown (1977)
Year of Election or Appointment: 2022
Deputy Treasurer
Mr. Brown also serves as an officer of other funds. Mr. Brown is a Vice President (2015-present) and is an employee of Fidelity Investments. Mr. Brown serves as Assistant Treasurer of FIMM, LLC (2021-present). Previously, Mr. Brown served as Assistant Treasurer of certain Fidelity® funds (2019-2022).
John J. Burke III (1964)
Year of Election or Appointment: 2018
Chief Financial Officer
Mr. Burke also serves as Chief Financial Officer of other funds. Mr. Burke is Head of Fidelity Fund and Investment Operations (2018-present) and is an employee of Fidelity Investments. Mr. Burke serves as President, Executive Vice President, or Director of certain Fidelity entities. Previously Mr. Burke served as head of Asset Management Investment Operations (2012-2018).
Margaret Carey (1973)
Year of Election or Appointment: 2023
Secretary and Chief Legal Officer (CLO)
Ms. Carey also serves as an officer of other funds and as CLO of certain Fidelity entities. Ms. Carey is a Senior Vice President, Deputy General Counsel (2019-present) and is an employee of Fidelity Investments.
William C. Coffey (1969)
Year of Election or Appointment: 2019
Assistant Secretary
Mr. Coffey also serves as Assistant Secretary of other funds. Mr. Coffey is a Senior Vice President, Deputy General Counsel (2010-present) and is an employee of Fidelity Investments. Previously, Mr. Coffey served as Secretary and CLO of certain funds (2018-2019); CLO, Secretary, or Senior Vice President of certain Fidelity entities and Assistant Secretary of certain funds (2009-2018).
Timothy M. Cohen (1969)
Year of Election or Appointment: 2018
Vice President
Mr. Cohen also serves as Vice President of other funds. Mr. Cohen is Co-Head of Equity (2018-present) and is an employee of Fidelity Investments. Mr. Cohen serves a Director of Fidelity Management & Research (Japan) Limited (investment adviser firm, 2016-present). Previously, Mr. Cohen served as Executive Vice President of Fidelity SelectCo, LLC (2019) and Head of Global Equity Research (2016-2018).
Jonathan Davis (1968)
Year of Election or Appointment: 2010
Assistant Treasurer
Mr. Davis also serves as an officer of other funds. Mr. Davis is a Vice President (2006-present) and is an employee of Fidelity Investments. Mr. Davis serves as Assistant Treasurer of certain Fidelity entities.
Laura M. Del Prato (1964)
Year of Election or Appointment: 2018
Assistant Treasurer
Ms. Del Prato also serves as an officer of other funds. Ms. Del Prato is a Senior Vice President (2017-present) and is an employee of Fidelity Investments. Ms. Del Prato serves as Vice President or Assistant Treasurer of certain Fidelity entities. Previously, Ms. Del Prato served as President and Treasurer of The North Carolina Capital Management Trust: Cash Portfolio and Term Portfolio (2018-2020).
Colm A. Hogan (1973)
Year of Election or Appointment: 2020
Assistant Treasurer
Mr. Hogan also serves as an officer of other funds. Mr. Hogan is a Vice President (2016-present) and is an employee of Fidelity Investments. Mr. Hogan serves as Assistant Treasurer of certain Fidelity entities. Previously, Mr. Hogan served as Deputy Treasurer of certain Fidelity® funds (2016-2020) and Assistant Treasurer of certain Fidelity® funds (2016-2018).
Pamela R. Holding (1964)
Year of Election or Appointment: 2018
Vice President
Ms. Holding also serves as Vice President of other funds. Ms. Holding is Co-Head of Equity (2018-present) and is an employee of Fidelity Investments. Previously, Ms. Holding served as Executive Vice President of Fidelity SelectCo, LLC (2019) and as Chief Investment Officer of Fidelity Institutional Asset Management (2013-2018).
Chris Maher (1972)
Year of Election or Appointment: 2020
Deputy Treasurer
Mr. Maher also serves as an officer of other funds. Mr. Maher is a Vice President (2008-present) and is an employee of Fidelity Investments. Mr. Maher serves as Assistant Treasurer of certain Fidelity entities. Previously, Mr. Maher served as Assistant Treasurer of certain funds (2013-2020).
Jason P. Pogorelec (1975)
Year of Election or Appointment: 2020
Chief Compliance Officer
Mr. Pogorelec also serves as Chief Compliance Officer of other funds. Mr. Pogorelec is a Senior Vice President of Asset Management Compliance (2020-present) and is an employee of Fidelity Investments. Mr. Pogorelec serves as Compliance Officer of Fidelity Management & Research Company LLC (investment adviser firm, 2023-present) and Ballyrock Investment Advisors LLC (2023-present). Previously, Mr. Pogorelec served as a Vice President, Associate General Counsel for Fidelity Investments (2010-2020) and Assistant Secretary of certain Fidelity® funds (2015-2020).
Brett Segaloff (1972)
Year of Election or Appointment: 2021
Anti-Money Laundering (AML) Officer
Mr. Segaloff also serves as AML Officer of other funds. Mr. Segaloff is a Vice President (2022-present) and is an employee of Fidelity Investments. Mr. Segaloff serves as Anti Money Laundering Compliance Officer or Anti Money Laundering/Bank Secrecy Act Compliance Officer of certain Fidelity entities.
Stacie M. Smith (1974)
Year of Election or Appointment: 2016
President and Treasurer
Ms. Smith also serves as an officer of other funds. Ms. Smith is a Senior Vice President (2016-present) and is an employee of Fidelity Investments. Ms. Smith serves as Assistant Treasurer of certain Fidelity entities and has served in other fund officer roles.
Jim Wegmann (1979)
Year of Election or Appointment: 2019
Assistant Treasurer
Mr. Wegmann also serves as an officer of other funds. Mr. Wegmann is a Vice President (2016-present) and is an employee of Fidelity Investments. Mr. Wegmann serves as Assistant Treasurer of FIMM, LLC (2021-present). Previously, Mr. Wegmann served as Assistant Treasurer of certain Fidelity® funds (2019-2021).
As a shareholder, you incur two types of costs: (1) transaction costs, which may include sales charges (loads) on purchase payments or redemption proceeds, as applicable and (2) ongoing costs, which generally include management fees, distribution and/or service (12b-1) fees and other Fund expenses. This Example is intended to help you understand your ongoing costs (in dollars) of investing in a fund and to compare these costs with the ongoing costs of investing in other mutual funds.
| The Example is based on an investment of $1,000 invested at the beginning of the period and held for the entire period (May 1, 2023 to October 31, 2023). |
Actual Expenses
The first line of the accompanying table provides information about actual account values and actual expenses. You may use the information in this line, together with the amount you invested, to estimate the expenses that you paid over the period. Simply divide your account value by $1,000.00 (for example, an $8,600 account value divided by $1,000.00 = 8.6), then multiply the result by the number in the first line for a class/Fund under the heading entitled "Expenses Paid During Period" to estimate the expenses you paid on your account during this period. If any fund is a shareholder of any underlying mutual funds or exchange-traded funds (ETFs) (the Underlying Funds), such fund indirectly bears its proportional share of the expenses of the Underlying Funds in addition to the direct expenses incurred presented in the table. These fees and expenses are not included in the annualized expense ratio used to calculate the expense estimate in the table below.
Hypothetical Example for Comparison Purposes
The second line of the accompanying table provides information about hypothetical account values and hypothetical expenses based on the actual expense ratio and an assumed rate of return of 5% per year before expenses, which is not the actual return. The hypothetical account values and expenses may not be used to estimate the actual ending account balance or expenses you paid for the period. You may use this information to compare the ongoing costs of investing in the Fund and other funds. To do so, compare this 5% hypothetical example with the 5% hypothetical examples that appear in the shareholder reports of the other funds. If any fund is a shareholder of any Underlying Funds, such fund indirectly bears its proportional share of the expenses of the Underlying Funds in addition to the direct expenses as presented in the table. These fees and expenses are not included in the annualized expense ratio used to calculate the expense estimate in the table below.
Please note that the expenses shown in the table are meant to highlight your ongoing costs only and do not reflect any transaction costs. Therefore, the second line of the table is useful in comparing ongoing costs only, and will not help you determine the relative total costs of owning different funds. In addition, if these transactional costs were included, your costs would have been higher.
| | | | | Annualized Expense Ratio- A | | Beginning Account Value May 1, 2023 | | Ending Account Value October 31, 2023 | | Expenses Paid During Period- C May 1, 2023 to October 31, 2023 |
| | | | | | | | | | |
| Fidelity® Series Overseas Fund | | | | .01% | | | | | | |
| Actual | | | | | | $ 1,000 | | $ 915.90 | | $ .05 |
Hypothetical-B | | | | | | $ 1,000 | | $ 1,025.16 | | $ .05 |
| |
A Annualized expense ratio reflects expenses net of applicable fee waivers.
B 5% return per year before expenses
C Expenses are equal to the annualized expense ratio, multiplied by the average account value over the period, multiplied by 184/ 365 (to reflect the one-half year period). The fees and expenses of any Underlying Funds are not included in each annualized expense ratio.
The dividend and capital gains distributions for the fund(s) are available on Fidelity.com or Institutional.Fidelity.com.
The fund designates $5,021,730 of distributions paid during the fiscal year ended 2023 as qualifying to be taxed as section 163(j) interest dividends.
The fund designates 3% of the dividends distributed during the fiscal year as qualifying for the dividends-received deduction for corporate shareholders.
The fund designates 78.33% of the dividends distributed during the fiscal year as amounts which may be taken into account as a dividend for the purposes of the maximum rate under section 1(h)(11) of the Internal Revenue Code.
The amounts per share which represent income derived from sources within, and taxes paid to, foreign countries or possessions of the United States are $0.2226 and $.0266 for the dividend paid December 12, 2022.
The fund will notify shareholders in January 2024 of amounts for use in preparing 2023 income tax returns.
Board Approval of Investment Advisory Contracts and Management Fees
Fidelity Series Overseas Fund
Each year, the Board of Trustees, including the Independent Trustees (together, the Board), considers the renewal of the fund's management contract with Fidelity Management & Research Company LLC (FMR) and the sub-advisory agreements (together, the Advisory Contracts) for the fund. FMR and the sub-advisers are referred to herein as the Investment Advisers. The Board, assisted by the advice of fund counsel and Independent Trustees' counsel, requests and considers a broad range of information relevant to the renewal of the Advisory Contracts throughout the year.
The Board meets regularly and, at each of its meetings, covers an extensive agenda of topics and materials and considers factors that are relevant to its annual consideration of the renewal of the fund's Advisory Contracts, including the services and support provided to the fund and its shareholders. The Board, acting directly and through its Committees (each of which is composed of and chaired by Independent Trustees), requests and receives information concerning the annual consideration of the renewal of the fund's Advisory Contracts. The Board also meets as needed to review matters specifically related to the Board's annual consideration of the renewal of the Advisory Contracts. Members of the Board may also meet with trustees of other Fidelity funds through joint ad hoc committees to discuss certain matters relevant to all of the Fidelity funds.
Approval of Stub Period Continuation. At its May 2023 meeting, the Board of Trustees voted to continue the fund's management contract with FMR, and the sub-advisory agreements and sub-sub-advisory agreements, in each case, where applicable (together, the Advisory Contracts), without modification, for two months from June 1, 2023 through July 31, 2023. The Board considered that the approval of the fund's Advisory Contracts will not result in any changes in (i) the investment process or strategies employed in the management of the fund's assets; (ii) the fees and expenses paid by shareholders; (iii) the nature, extent or quality of services provided under the fund's Advisory Contracts; or (iv) the day-to-day management of the fund or the persons primarily responsible for such management. The Board also considered that since its last approval of the fund's Advisory Contracts, FMR had provided additional information on the fund in support of the annual contract renewal process, including competitive analyses on total expenses and management fees and in-depth reviews of fund performance and fund profitability information. The Board concluded that the fund's Advisory Contracts are fair and reasonable, and that the fund's Advisory Contracts should be renewed, without modification, through July 31, 2023, with the understanding that the Board would consider the annual renewal for a full one year period in July 2023.
At its July 2023 meeting, the Board unanimously determined to renew the fund's Advisory Contracts. The Board considered all factors it believed relevant and reached a determination, with the assistance of fund counsel and Independent Trustees' counsel and through the exercise of its business judgment, that the renewal of the Advisory Contracts was in the best interests of the fund and its shareholders and the fact that no fee is payable under the management contract was fair and reasonable in light of all of the surrounding circumstances.
Nature, Extent, and Quality of Services Provided. The Board considered staffing as it relates to the fund, including the backgrounds and experience of investment personnel of the Investment Advisers, and also considered the Investment Advisers' implementation of the fund's investment program. The Independent Trustees also had discussions with senior management of Fidelity's investment operations and investment groups. The Board considered the structure of the investment personnel compensation program and whether this structure provides appropriate incentives to act in the best interests of the fund.
Resources Dedicated to Investment Management and Support Services. The Board and the Fund Oversight and Research Committees reviewed the general qualifications and capabilities of Fidelity's investment staff, including its size, education, experience, and resources, as well as Fidelity's approach to recruiting, training, managing, and compensating investment personnel. The Board noted the resources devoted to expansion of Fidelity's global investment organization, and that Fidelity's analysts have extensive resources, tools, and capabilities that allow them to conduct sophisticated quantitative and fundamental analysis, as well as credit analysis of issuers, counterparties, and guarantors. Further, the Board considered that Fidelity's investment professionals have sufficient access to global information and data so as to provide competitive investment results over time, and that those professionals also have access to sophisticated tools that permit them to assess portfolio construction and risk and performance attribution characteristics continuously, as well as to transmit new information and research conclusions rapidly around the world. Additionally, in its deliberations, the Board considered Fidelity's trading, risk management, compliance, and technology and operations capabilities and resources, which are integral parts of the investment management process.
Administrative Services. The Board considered (i) the nature, extent, quality, and cost of advisory and administrative services performed by the Investment Advisers and their affiliates under the Advisory Contracts and under separate agreements covering transfer agency, pricing and bookkeeping, and securities lending services for the fund; (ii) the nature and extent of Fidelity's supervision of third party service providers, principally custodians, subcustodians, and pricing vendors; and (iii) the resources devoted by Fidelity to, and the record of compliance with, the fund's compliance policies and procedures. The Board also reviewed the allocation of fund brokerage, including allocations to brokers affiliated with the Investment Advisers, the use of brokerage commissions to pay fund expenses, and the use of "soft" commission dollars to pay for research services. The Board also considered the fund's securities lending activities and any payments made to Fidelity relating to securities lending.
Investment Performance. The Board reviewed the fund's absolute investment performance, as well as the fund's relative investment performance, but did not consider performance to be a material factor in its decision to renew the fund's Advisory Contracts, as the fund is not publicly offered as a stand-alone investment product. In this regard, the Board noted that the fund is designed to offer an investment option for other investment companies, 529 plans, and collective investment trusts managed by Fidelity and ultimately to enhance the performance of those investment companies, 529 plans, and collective investment trusts.
Based on its review, the Board concluded that the nature, extent, and quality of services provided to the fund under the Advisory Contracts should continue to benefit the shareholders of the fund.
Competitiveness of Management Fee and Total Expense Ratio. The Board considered that the fund does not pay FMR a management fee for investment advisory services, but that FMR receives fees for providing services to funds that invest in the fund. The Board noted that FMR or an affiliate undertakes to pay all operating expenses of the fund, except transfer agent fees, 12b-1 fees, Independent Trustee fees and expenses, custodian fees and expenses, proxy and shareholder meeting expenses, interest, taxes, and extraordinary expenses (such as litigation expenses). The Board further noted that the fund pays its non-operating expenses, including brokerage commissions and fees and expenses associated with the fund's securities lending program, if applicable.
The Board further considered that FMR has contractually agreed to reimburse the fund to the extent that total operating expenses, with certain exceptions, as a percentage of its average net assets, exceed 0.013% through February 28, 2026.
Based on its review, the Board considered that the fund does not pay a management fee and concluded that the total expense ratio of the fund was reasonable in light of the services that the fund and its shareholders receive and the other factors considered.
Costs of the Services and Profitability. The Board considered the level of Fidelity's profits in respect of all the Fidelity funds.
A public accounting firm has been engaged annually by the Board as part of the Board's assessment of Fidelity's profitability analysis. The engagement includes the review and assessment of the methodologies used by Fidelity in determining the revenues and expenses attributable to Fidelity's fund business, and completion of agreed-upon procedures in respect of the mathematical accuracy of certain fund profitability information and its conformity to established allocation methodologies. After considering the reports issued under the engagement and information provided by Fidelity, the Board concluded that while other allocation methods may also be reasonable, Fidelity's profitability methodologies are reasonable in all material respects.
The Board also reviewed Fidelity's non-fund businesses and potential indirect benefits such businesses may have received as a result of their association with Fidelity's fund business (i.e., fall-out benefits) as well as cases where Fidelity's affiliates may benefit from the funds' business. The Board considered areas where potential indirect benefits to the Fidelity funds from their relationships with Fidelity may exist. The Board's consideration of these matters was informed by the findings of a joint ad hoc committee created by it and the boards of other Fidelity funds to evaluate potential fall-out benefits.
The Board concluded that the costs of the services provided by and the profits realized by Fidelity in connection with the operation of the fund were not relevant to the renewal of the Advisory Contracts because the fund pays no advisory fees and FMR bears all expenses of the fund with certain exceptions.
Economies of Scale. The Board concluded that because the fund pays no advisory fees and FMR bears all expenses of the fund with certain exceptions, the realization of economies of scale was not a material factor in the Board's decision to renew the fund's Advisory Contracts.
Additional Information Requested by the Board. In order to develop fully the factual basis for consideration of the Fidelity funds' advisory contracts, the Board requested and received additional information on certain topics, including: (i) fund flow and performance trends, in particular the underperformance of certain funds and strategies, and Fidelity's long-term strategies for certain funds, including any consideration of fund liquidations or mergers; (ii) the operation of performance fees and competitor use of performance fees; (iii) Fidelity's pricing philosophy compared to competitors; (iv) fund profitability methodology and data; (v) evaluation of competitive fund data and peer group classifications and fee and expense comparisons; (vi) the management fee and expense structures for different funds and classes and information about the differences between various fee and expense structures; (vii) group fee breakpoints and related voluntary fee waivers; and (viii) information regarding other accounts managed by Fidelity and the funds' sub-advisory arrangements.
Conclusion. Based on its evaluation of all of the conclusions noted above, and after considering all factors it believed relevant, the Board, including the Independent Trustees, concluded that the advisory and sub-advisory fee arrangements are fair and reasonable in light of all of the surrounding circumstances and that the fund's Advisory Contracts should be renewed through July 31, 2024.
1.9894003.104
SOV-ANN-1223
Fidelity® International Discovery Fund
Annual Report
October 31, 2023
Includes Fidelity and Fidelity Advisor share classes
Contents
To view a fund's proxy voting guidelines and proxy voting record for the 12-month period ended June 30, visit http://www.fidelity.com/proxyvotingresults or visit the Securities and Exchange Commission's (SEC) web site at http://www.sec.gov.
You may also call 1-800-544-8544 if you're an individual investing directly with Fidelity, call 1-800-835-5092 if you're a plan sponsor or participant with Fidelity as your recordkeeper or call 1-877-208-0098 on institutional accounts or if you're an advisor or invest through one to request a free copy of the proxy voting guidelines.
Standard & Poor's, S&P and S&P 500 are registered service marks of The McGraw-Hill Companies, Inc. and have been licensed for use by Fidelity Distributors Corporation.
Other third-party marks appearing herein are the property of their respective owners.
All other marks appearing herein are registered or unregistered trademarks or service marks of FMR LLC or an affiliated company. © 2023 FMR LLC. All rights reserved.
This report and the financial statements contained herein are submitted for the general information of the shareholders of the Fund. This report is not authorized for distribution to prospective investors in the Fund unless preceded or accompanied by an effective prospectus.
A fund files its complete schedule of portfolio holdings with the SEC for the first and third quarters of each fiscal year on Form N-PORT. Forms N-PORT are available on the SEC's web site at http://www.sec.gov. A fund's Forms N-PORT may be reviewed and copied at the SEC's Public Reference Room in Washington, DC. Information regarding the operation of the SEC's Public Reference Room may be obtained by calling 1-800-SEC-0330.
For a complete list of a fund's portfolio holdings, view the most recent holdings listing, semiannual report, or annual report on Fidelity's web site at http://www.fidelity.com, http://www.institutional.fidelity.com, or http://www.401k.com, as applicable.
NOT FDIC INSURED •MAY LOSE VALUE •NO BANK GUARANTEE
Neither the Fund nor Fidelity Distributors Corporation is a bank.
Average annual total return reflects the change in the value of an investment, assuming reinvestment of distributions from dividend income and capital gains (the profits earned upon the sale of securities that have grown in value, if any) and assuming a constant rate of performance each year. The hypothetical investment and the average annual total returns do not reflect the deduction of taxes that a shareholder would pay on fund distributions or the redemption of fund shares. During periods of reimbursement by Fidelity, a fund's total return will be greater than it would be had the reimbursement not occurred. How a fund did yesterday is no guarantee of how it will do tomorrow.
| Average Annual Total Returns |
| | | | |
Periods ended October 31, 2023 | Past 1 year | Past 5 years | Past 10 years |
Class A (incl. 5.75% sales charge) | 0.52% | 2.31% | 2.17% |
Class M (incl. 3.50% sales charge) | 2.68% | 2.54% | 2.17% |
Class C (incl. contingent deferred sales charge) | 4.84% | 2.71% | 2.15% |
| Fidelity® International Discovery Fund | 7.04% | 3.88% | 3.13% |
| Class K | 7.15% | 3.98% | 3.25% |
| Class I | 7.01% | 3.85% | 3.11% |
| Class Z | 7.14% | 3.98% | 3.25% |
Class C shares' contingent deferred sales charges included in the past one year, past five years and past ten years total return figures are 1%, 0% and 0%, respectively.
| $10,000 Over 10 Years |
| |
Let's say hypothetically that $10,000 was invested in Fidelity® International Discovery Fund, a class of the fund, on October 31, 2013. The chart shows how the value of your investment would have changed, and also shows how the MSCI EAFE Index performed over the same period. |
|
|
Market Recap:
International (non-U.S.) equities gained 12.27% for the 12 months ending October 31, 2023, according to the MSCI ACWI (All Country World Index) ex USA Index, as global economic expansion and a slowing in the pace of inflation in some markets provided a favorable backdrop for risk assets. After returning -15.86% in 2022, the index's upturn has been largely driven by a narrow set of companies in the information technology and communication services sectors, in part due to excitement for generative artificial intelligence applications. The index gained 14.07% year to date through July, including strong gains in both June (+4.50%) and July (+4.07%). The rally for international equities sputtered for the next three months (-11.33%) amid a stalling pattern in disinflationary trends, heightened global recession and geopolitical risks, soaring yields on longer-term U.S. government bonds and particularly weak economic conditions in the eurozone and China. The three-month decline left non-U.S. stocks up 1.15% year to date through October. Currency fluctuation also helped bolster non-U.S. equity performance overall. For the full 12 months, nearly all regions advanced, with Europe ex U.K. (+18%) and Japan (+17%) leading, whereas Canada (-0.38%) lagged by the widest margin. Each of the 11 sectors advanced, with information technology (+21%) and consumer discretionary (+19%) leading the way. Energy and industrials each rose about 14%. Conversely, four defensive-oriented sectors lagged by the widest margin: real estate (+4%), health care (+6%), consumer staples (+7%) and utilities (+8%).
Comments from Portfolio Manager William Kennedy:
For the fiscal year ending October 31, 2023, the fund's share classes (excluding sales charges, if applicable) gained about 6% to 7%, versus 14.65% for the benchmark MSCI EAFE Index (Net MA). From a regional standpoint, security selection in Europe, emerging markets and the U.K. detracted most from the fund's relative result. By sector, investment choices among consumer discretionary companies, along with stock picks and an underweight in energy, also hurt. Security selection in health care and financials proved detrimental as well the past 12 months. The biggest individual relative detractor was an outsized stake in Norway-based Equinor (-23%), a position that was no longer held at period end. The portfolio's non-benchmark exposure to HDFC Bank in India returned roughly -3% and notably detracted from relative performance. The stock was among the fund's largest holdings on October 31. An overweight stake in Japan-based Olympus, which was not held at period end, returned -22% and further weighed on relative performance. In contrast, on a regional basis, an underweight in Asia Pacific ex Japan, primarily Australia, and a non-benchmark allocation to and stock picks in the U.S. helped versus the benchmark. By sector, the biggest contributors to relative performance were underweights in communication services, consumer staples and real estate. The fund's non-benchmark stake in U.S.-based Nvidia gained approximately 91% and was the top individual relative contributor. Outsized exposure to BE Semiconductor Industries (+70%) in the Netherlands was another plus. An overweight in Italy-based UniCredit (+33%), a top-10 holding at the end of October, also helped. Nvidia, BE Semiconductor and UniCredit were new additions to the portfolio during the reporting period. Notable changes in positioning include higher allocations to Italy, the U.S. and the U.K., and reductions in Switzerland and India. By sector, meaningful shifts include decreased exposure to the energy and health care sectors and higher allocations to information technology and consumer discretionary stocks.
The views expressed above reflect those of the portfolio manager(s) only through the end of the period as stated on the cover of this report and do not necessarily represent the views of Fidelity or any other person in the Fidelity organization. Any such views are subject to change at any time based upon market or other conditions and Fidelity disclaims any responsibility to update such views. These views may not be relied on as investment advice and, because investment decisions for a Fidelity fund are based on numerous factors, may not be relied on as an indication of trading intent on behalf of any Fidelity fund.
Top Holdings (% of Fund's net assets) |
| |
| Novo Nordisk A/S Series B (Denmark, Pharmaceuticals) | 3.3 | |
| AstraZeneca PLC (United Kingdom) (United Kingdom, Pharmaceuticals) | 2.7 | |
| ASML Holding NV (Netherlands) (Netherlands, Semiconductors & Semiconductor Equipment) | 2.7 | |
| Nestle SA (Reg. S) (United States of America, Food Products) | 2.5 | |
| LVMH Moet Hennessy Louis Vuitton SE (France, Textiles, Apparel & Luxury Goods) | 2.3 | |
| HDFC Bank Ltd. (India, Bank) | 2.1 | |
| Taiwan Semiconductor Manufacturing Co. Ltd. (Taiwan, Semiconductors & Semiconductor Equipment) | 2.1 | |
| Hitachi Ltd. (Japan, Industrial Conglomerates) | 2.0 | |
| Air Liquide SA (France, Chemicals) | 1.9 | |
| UniCredit SpA (Italy, Banks) | 1.8 | |
| | 23.4 | |
| |
| Market Sectors (% of Fund's net assets) |
| |
| Financials | 19.1 | |
| Information Technology | 16.4 | |
| Industrials | 15.4 | |
| Consumer Discretionary | 13.4 | |
| Health Care | 12.2 | |
| Consumer Staples | 6.2 | |
| Materials | 6.2 | |
| Energy | 3.1 | |
| Communication Services | 2.8 | |
| Real Estate | 1.1 | |
| |
Asset Allocation (% of Fund's net assets) |
|
|
Geographic Diversification (% of Fund's net assets) |
|
* Includes Short-Term investments and Net Other Assets (Liabilities). Percentages are adjusted for the effect of derivatives, if applicable. |
| |
Showing Percentage of Net Assets
| Common Stocks - 95.0% |
| | | Shares | Value ($) (000s) |
| Australia - 2.5% | | | |
| Bapcor Ltd. | | 5,572,948 | 18,969 |
| Flight Centre Travel Group Ltd. (a) | | 3,499,107 | 41,595 |
| Flutter Entertainment PLC (b) | | 304,826 | 47,813 |
| IperionX Ltd. (b)(c)(d) | | 16,527,456 | 13,105 |
| National Storage REIT unit | | 42,709,609 | 54,454 |
TOTAL AUSTRALIA | | | 175,936 |
| Bailiwick of Jersey - 0.4% | | | |
| JTC PLC (e) | | 3,616,073 | 28,063 |
| Belgium - 1.2% | | | |
| KBC Group NV | | 444,579 | 24,414 |
| UCB SA | | 823,012 | 60,139 |
TOTAL BELGIUM | | | 84,553 |
| Brazil - 0.7% | | | |
| MercadoLibre, Inc. (b) | | 39,936 | 49,550 |
| Canada - 3.8% | | | |
| Canadian Natural Resources Ltd. | | 1,711,559 | 108,686 |
| Constellation Software, Inc. | | 59,911 | 120,103 |
| Constellation Software, Inc. warrants 8/22/28 (b)(d) | | 51,211 | 0 |
| Definity Financial Corp. | | 506,686 | 14,009 |
| Franco-Nevada Corp. | | 205,729 | 25,027 |
| Lumine Group, Inc. | | 158,876 | 1,998 |
TOTAL CANADA | | | 269,823 |
| China - 1.5% | | | |
| Alibaba Group Holding Ltd. (b) | | 1,764,328 | 18,164 |
| Chervon Holdings Ltd. | | 7,803,207 | 19,220 |
| JOYY, Inc. ADR | | 1,289,500 | 50,187 |
| Tencent Holdings Ltd. | | 551,494 | 20,410 |
TOTAL CHINA | | | 107,981 |
| Denmark - 3.8% | | | |
| DSV A/S | | 216,872 | 32,344 |
| Novo Nordisk A/S Series B | | 2,474,606 | 238,740 |
TOTAL DENMARK | | | 271,084 |
| France - 11.2% | | | |
| Air Liquide SA | | 774,350 | 132,687 |
| Airbus Group NV | | 489,145 | 65,583 |
| AXA SA | | 3,101,358 | 91,895 |
| BNP Paribas SA | | 1,381,796 | 79,459 |
| Edenred SA | | 969,780 | 51,552 |
| EssilorLuxottica SA | | 314,416 | 56,769 |
| Exclusive Networks SA (b) | | 1,616,563 | 25,691 |
| L'Oreal SA | | 195,645 | 82,236 |
| LVMH Moet Hennessy Louis Vuitton SE | | 225,550 | 161,478 |
| Pernod Ricard SA | | 276,393 | 48,986 |
TOTAL FRANCE | | | 796,336 |
| Germany - 4.4% | | | |
| Fresenius SE & Co. KGaA | | 918,300 | 23,553 |
| Merck KGaA | | 359,030 | 54,077 |
| Muenchener Rueckversicherungs-Gesellschaft AG in Muenchen | | 174,315 | 69,812 |
| Nexus AG | | 562,762 | 27,421 |
| Rheinmetall AG | | 187,945 | 53,773 |
| Siemens AG | | 461,612 | 61,255 |
| Siemens Healthineers AG (e) | | 475,045 | 23,283 |
TOTAL GERMANY | | | 313,174 |
| Hong Kong - 1.2% | | | |
| AIA Group Ltd. | | 9,534,937 | 82,800 |
| Hungary - 0.3% | | | |
| Richter Gedeon PLC | | 850,465 | 19,941 |
| India - 4.1% | | | |
| Avenue Supermarts Ltd. (b)(e) | | 505,358 | 22,058 |
| HDFC Bank Ltd. | | 6,770,919 | 120,111 |
| HDFC Bank Ltd. sponsored ADR | | 524,765 | 29,675 |
| ITC Ltd. | | 4,656,000 | 23,960 |
| Larsen & Toubro Ltd. | | 523,073 | 18,402 |
| One97 Communications Ltd. (b) | | 4,023,500 | 44,515 |
| Pine Labs Private Ltd. (b)(d)(f) | | 8,672 | 2,720 |
| PVR INOX Ltd. (b) | | 449,200 | 8,622 |
| Sona Blw Precision Forgings Ltd. (e) | | 2,874,000 | 18,698 |
| Star Health & Allied Insurance Co. Ltd. (b) | | 992,200 | 6,910 |
TOTAL INDIA | | | 295,671 |
| Ireland - 1.4% | | | |
| Cairn Homes PLC | | 27,436,266 | 32,180 |
| Dalata Hotel Group PLC | | 11,172,339 | 47,404 |
| Kingspan Group PLC (Ireland) | | 348,509 | 23,409 |
TOTAL IRELAND | | | 102,993 |
| Italy - 4.1% | | | |
| BFF Bank SpA (e) | | 3,154,969 | 30,295 |
| Davide Campari Milano NV | | 2,893,514 | 31,933 |
| Ferrari NV | | 163,803 | 49,410 |
| FinecoBank SpA | | 1,625,451 | 19,117 |
| Prysmian SpA | | 800,300 | 29,883 |
| Recordati SpA | | 160,944 | 7,425 |
| UniCredit SpA | | 4,998,771 | 125,317 |
TOTAL ITALY | | | 293,380 |
| Japan - 18.9% | | | |
| Advantest Corp. | | 1,046,428 | 26,955 |
| BayCurrent Consulting, Inc. | | 577,000 | 14,487 |
| Capcom Co. Ltd. | | 1,225,625 | 39,452 |
| Daiichi Sankyo Kabushiki Kaisha | | 1,712,619 | 44,159 |
| Eisai Co. Ltd. | | 299,900 | 15,888 |
| Fast Retailing Co. Ltd. | | 280,173 | 62,029 |
| FUJIFILM Holdings Corp. | | 692,538 | 37,880 |
| Hitachi Ltd. | | 2,274,914 | 144,199 |
| Hoya Corp. | | 1,020,783 | 98,269 |
| Itochu Corp. | | 2,615,509 | 94,213 |
| JTOWER, Inc. (a)(b) | | 880,212 | 32,032 |
| Keyence Corp. | | 125,031 | 48,402 |
| Misumi Group, Inc. | | 937,676 | 14,195 |
| Mitsubishi UFJ Financial Group, Inc. | | 9,101,298 | 76,352 |
| NOF Corp. | | 447,204 | 17,643 |
| ORIX Corp. | | 4,171,266 | 75,860 |
| Outsourcing, Inc. | | 2,520,506 | 18,730 |
| Pan Pacific International Holdings Ltd. | | 1,971,400 | 38,178 |
| Persol Holdings Co. Ltd. | | 22,870,620 | 34,293 |
| Renesas Electronics Corp. (b) | | 5,996,514 | 78,768 |
| Shin-Etsu Chemical Co. Ltd. | | 3,250,901 | 97,213 |
| Sony Group Corp. | | 1,195,018 | 99,352 |
| Sumitomo Mitsui Financial Group, Inc. | | 1,229,174 | 59,256 |
| TechnoPro Holdings, Inc. | | 803,637 | 15,921 |
| TIS, Inc. | | 1,356,750 | 29,055 |
| Tokio Marine Holdings, Inc. | | 1,758,860 | 39,350 |
TOTAL JAPAN | | | 1,352,131 |
| Kazakhstan - 0.0% | | | |
| Kaspi.KZ JSC GDR (Reg. S) | | 40,900 | 3,697 |
| Korea (South) - 1.3% | | | |
| Samsung Electronics Co. Ltd. | | 1,931,510 | 95,998 |
| Netherlands - 8.0% | | | |
| ASML Holding NV (Netherlands) | | 315,174 | 189,458 |
| BE Semiconductor Industries NV | | 721,740 | 74,305 |
| IMCD NV | | 225,189 | 27,044 |
| ING Groep NV (Certificaten Van Aandelen) | | 3,889,474 | 49,865 |
| Shell PLC (London) | | 3,654,000 | 117,757 |
| Topicus.Com, Inc. (b) | | 101,548 | 6,686 |
| Universal Music Group NV | | 970,544 | 23,767 |
| Wolters Kluwer NV | | 653,600 | 83,750 |
TOTAL NETHERLANDS | | | 572,632 |
| Russia - 0.0% | | | |
| Fix Price Group Ltd. GDR (Reg. S) (b)(d) | | 619,390 | 229 |
| Spain - 1.4% | | | |
| CaixaBank SA | | 17,998,287 | 73,173 |
| Cie Automotive SA | | 1,050,928 | 26,754 |
TOTAL SPAIN | | | 99,927 |
| Sweden - 1.4% | | | |
| ASSA ABLOY AB (B Shares) | | 1,380,789 | 29,432 |
| Indutrade AB | | 2,394,149 | 42,285 |
| Kry International AB (b)(d)(f) | | 4,183 | 154 |
| Lagercrantz Group AB (B Shares) | | 2,939,024 | 26,777 |
TOTAL SWEDEN | | | 98,648 |
| Switzerland - 0.4% | | | |
| Partners Group Holding AG | | 30,988 | 32,594 |
| Taiwan - 2.1% | | | |
| Taiwan Semiconductor Manufacturing Co. Ltd. | | 9,144,000 | 149,230 |
| United Kingdom - 13.1% | | | |
| 3i Group PLC | | 2,902,400 | 68,432 |
| AstraZeneca PLC (United Kingdom) | | 1,546,581 | 193,638 |
| BAE Systems PLC | | 7,885,321 | 106,029 |
| Big Yellow Group PLC | | 2,163,353 | 25,111 |
| Bunzl PLC | | 2,238,046 | 79,757 |
| Cab Payments Holdings Ltd. | | 3,856,300 | 2,869 |
| Compass Group PLC | | 4,817,210 | 121,449 |
| Diageo PLC | | 1,519,133 | 57,448 |
| Games Workshop Group PLC | | 220,822 | 26,504 |
| JD Sports Fashion PLC | | 15,236,172 | 23,611 |
| London Stock Exchange Group PLC | | 522,513 | 52,719 |
| RELX PLC (London Stock Exchange) | | 2,138,000 | 74,675 |
| Sage Group PLC | | 4,764,000 | 56,202 |
| Smart Metering Systems PLC | | 2,852,560 | 22,155 |
| Starling Bank Ltd. Series D (b)(d)(f) | | 6,223,100 | 22,238 |
| Zegona Communications PLC (b)(c)(d) | | 322,474 | 122 |
TOTAL UNITED KINGDOM | | | 932,959 |
| United States of America - 7.7% | | | |
| CRH PLC | | 1,123,211 | 60,356 |
| Energy Recovery, Inc. (b) | | 319,500 | 4,856 |
| Globant SA (b) | | 100,728 | 17,153 |
| Lattice Semiconductor Corp. (b) | | 259,585 | 14,436 |
| Linde PLC | | 236,383 | 90,336 |
| Microsoft Corp. | | 198,900 | 67,250 |
| Nestle SA (Reg. S) | | 1,652,478 | 178,201 |
| NVIDIA Corp. | | 184,132 | 75,089 |
| Samsonite International SA (b)(e) | | 12,741,420 | 39,462 |
TOTAL UNITED STATES OF AMERICA | | | 547,139 |
| Zambia - 0.1% | | | |
| First Quantum Minerals Ltd. | | 511,300 | 5,925 |
| TOTAL COMMON STOCKS (Cost $5,773,259) | | | 6,782,394 |
| | | | |
| Preferred Stocks - 0.9% |
| | | Shares | Value ($) (000s) |
| Convertible Preferred Stocks - 0.7% | | | |
| China - 0.5% | | | |
| ByteDance Ltd. Series E1 (b)(d)(f) | | 131,235 | 30,663 |
| dMed Biopharmaceutical Co. Ltd. Series C (b)(d)(f) | | 727,754 | 4,286 |
| | | | 34,949 |
| Estonia - 0.2% | | | |
| Bolt Technology OU Series E (b)(d)(f) | | 87,239 | 10,303 |
| United States of America - 0.0% | | | |
| Canva, Inc.: | | | |
| Series A (d)(f) | | 931 | 994 |
| Series A2 (d)(f) | | 169 | 180 |
| | | | 1,174 |
TOTAL CONVERTIBLE PREFERRED STOCKS | | | 46,426 |
| Nonconvertible Preferred Stocks - 0.2% | | | |
| India - 0.2% | | | |
| Pine Labs Private Ltd.: | | | |
| Series 1 (b)(d)(f) | | 20,726 | 6,502 |
| Series A (b)(d)(f) | | 5,179 | 1,625 |
| Series B (b)(d)(f) | | 5,635 | 1,768 |
| Series B2 (b)(d)(f) | | 4,558 | 1,430 |
| Series C (b)(d)(f) | | 8,478 | 2,659 |
| Series C1 (b)(d)(f) | | 1,786 | 560 |
| Series D (b)(d)(f) | | 1,910 | 599 |
| | | | 15,143 |
| Sweden - 0.0% | | | |
| Kry International AB Series E (b)(d)(f) | | 24,162 | 887 |
TOTAL NONCONVERTIBLE PREFERRED STOCKS | | | 16,030 |
| TOTAL PREFERRED STOCKS (Cost $77,597) | | | 62,456 |
| | | | |
| Money Market Funds - 4.2% |
| | | Shares | Value ($) (000s) |
| Fidelity Cash Central Fund 5.40% (g) | | 264,550,089 | 264,603 |
| Fidelity Securities Lending Cash Central Fund 5.40% (g)(h) | | 31,744,080 | 31,747 |
| TOTAL MONEY MARKET FUNDS (Cost $296,350) | | | 296,350 |
| | | | |
| TOTAL INVESTMENT IN SECURITIES - 100.1% (Cost $6,147,206) | 7,141,200 |
NET OTHER ASSETS (LIABILITIES) - (0.1)% | (5,530) |
| NET ASSETS - 100.0% | 7,135,670 |
| | |
Any values shown as $0 in the Schedule of Investments may reflect amounts less than $500.
Legend
| (a) | Security or a portion of the security is on loan at period end. |
| (e) | Security exempt from registration under Rule 144A of the Securities Act of 1933. These securities may be resold in transactions exempt from registration, normally to qualified institutional buyers. At the end of the period, the value of these securities amounted to $161,859,000 or 2.3% of net assets. |
| (f) | Restricted securities (including private placements) - Investment in securities not registered under the Securities Act of 1933 (excluding 144A issues). At the end of the period, the value of restricted securities (excluding 144A issues) amounted to $87,568,000 or 1.2% of net assets. |
| (g) | Affiliated fund that is generally available only to investment companies and other accounts managed by Fidelity Investments. The rate quoted is the annualized seven-day yield of the fund at period end. A complete unaudited listing of the fund's holdings as of its most recent quarter end is available upon request. In addition, each Fidelity Central Fund's financial statements, which are not covered by the Fund's Report of Independent Registered Public Accounting Firm, are available on the SEC's website or upon request. |
| (h) | Investment made with cash collateral received from securities on loan. |
| Additional information on each restricted holding is as follows: |
| Security | Acquisition Date | Acquisition Cost ($) (000s) |
| Bolt Technology OU Series E | 1/03/22 | 22,664 |
| | | |
| ByteDance Ltd. Series E1 | 11/18/20 | 14,380 |
| | | |
| Canva, Inc. Series A | 9/22/23 | 993 |
| | | |
| Canva, Inc. Series A2 | 9/22/23 | 180 |
| | | |
| dMed Biopharmaceutical Co. Ltd. Series C | 12/01/20 | 10,336 |
| | | |
| Kry International AB | 5/14/21 | 1,817 |
| | | |
| Kry International AB Series E | 5/14/21 | 11,046 |
| | | |
| Pine Labs Private Ltd. | 6/30/21 | 3,233 |
| | | |
| Pine Labs Private Ltd. Series 1 | 6/30/21 | 7,728 |
| | | |
| Pine Labs Private Ltd. Series A | 6/30/21 | 1,931 |
| | | |
| Pine Labs Private Ltd. Series B | 6/30/21 | 2,101 |
| | | |
| Pine Labs Private Ltd. Series B2 | 6/30/21 | 1,699 |
| | | |
| Pine Labs Private Ltd. Series C | 6/30/21 | 3,161 |
| | | |
| Pine Labs Private Ltd. Series C1 | 6/30/21 | 666 |
| | | |
| Pine Labs Private Ltd. Series D | 6/30/21 | 712 |
| | | |
| Starling Bank Ltd. Series D | 6/18/21 | 11,126 |
| | | |
Affiliated Central Funds
Fiscal year to date information regarding the Fund's investments in Fidelity Central Funds, including the ownership percentage, is presented below.
| Affiliate (Amounts in thousands) | Value, beginning of period ($) | Purchases ($) | Sales Proceeds ($) | Dividend Income ($) | Realized Gain (loss) ($) | Change in Unrealized appreciation (depreciation) ($) | Value, end of period ($) | % ownership, end of period |
| Fidelity Cash Central Fund 5.40% | 376,692 | 2,030,286 | 2,142,375 | 10,679 | - | - | 264,603 | 0.6% |
| Fidelity Securities Lending Cash Central Fund 5.40% | 29,429 | 1,022,327 | 1,020,009 | 1,310 | - | - | 31,747 | 0.1% |
| Total | 406,121 | 3,052,613 | 3,162,384 | 11,989 | - | - | 296,350 | |
| | | | | | | | | |
Amounts in the dividend income column in the above table include any capital gain distributions from underlying funds, which are presented in the corresponding line item in the Statement of Operations, if applicable.
Amounts in the dividend income column for Fidelity Securities Lending Cash Central Fund represents the income earned on investing cash collateral, less rebates paid to borrowers and any lending agent fees associated with the loan, plus any premium payments received for lending certain types of securities.
Amounts included in the purchases and sales proceeds columns may include in-kind transactions, if applicable.
Other Affiliated Issuers
An affiliated company is a company in which the Fund has ownership of at least 5% of the voting securities. Fiscal year to date transactions with companies which are or were affiliates are presented in the table below. Certain corporate actions, such as mergers, are excluded from the amounts in this table if applicable. A dash in the Value end of period ($) column means either the issuer is no longer held at period end, or the issuer is held at period end but is no longer an affiliate.
| Affiliate (Amounts in thousands) | Value, beginning of period ($) | Purchases ($) | Sales Proceeds ($) | Dividend Income ($) | Realized Gain (loss) ($) | Change in Unrealized appreciation (depreciation) ($) | Value, end of period ($) |
| Dalata Hotel Group PLC | 36,423 | - | 171 | 476 | 65 | 11,544 | - |
| IperionX Ltd. | 6,780 | 1,236 | 35 | - | 7 | 5,223 | 13,105 |
| Zegona Communications PLC | 282 | - | 1 | - | (1) | (153) | 122 |
| Total | 43,485 | 1,236 | 207 | 476 | 71 | 16,614 | 13,227 |
Amounts included in the purchases and sales proceeds columns may include in-kind transactions, if applicable.
Investment Valuation
The following is a summary of the inputs used, as of October 31, 2023, involving the Fund's assets and liabilities carried at fair value. The inputs or methodology used for valuing securities may not be an indication of the risk associated with investing in those securities. For more information on valuation inputs, and their aggregation into the levels used below, please refer to the Investment Valuation section in the accompanying Notes to Financial Statements.
| Valuation Inputs at Reporting Date: |
Description (Amounts in thousands) | Total ($) | Level 1 ($) | Level 2 ($) | Level 3 ($) |
Investments in Securities: | | | | |
|
| Equities: | | | | |
Communication Services | 205,255 | 50,187 | 124,283 | 30,785 |
Consumer Discretionary | 942,994 | 303,226 | 638,594 | 1,174 |
Consumer Staples | 445,051 | 80,919 | 363,903 | 229 |
Energy | 226,443 | 108,686 | 117,757 | - |
Financials | 1,374,349 | 306,097 | 1,046,014 | 22,238 |
Health Care | 867,588 | 272,608 | 590,694 | 4,286 |
Industrials | 1,090,670 | 399,256 | 691,414 | - |
Information Technology | 1,170,643 | 485,690 | 655,746 | 29,207 |
Materials | 442,292 | 181,644 | 247,543 | 13,105 |
Real Estate | 79,565 | 25,111 | 54,454 | - |
|
| Money Market Funds | 296,350 | 296,350 | - | - |
| Total Investments in Securities: | 7,141,200 | 2,509,774 | 4,530,402 | 101,024 |
The following is a reconciliation of Investments in Securities for which Level 3 inputs were used in determining value:
| (Amounts in thousands) | |
| Investments in Securities: | |
| Beginning Balance | $ | 91,683 | |
| Net Realized Gain (Loss) on Investment Securities | | 11 | |
| Net Unrealized Gain (Loss) on Investment Securities | | 10 | |
| Cost of Purchases | | 2,409 | |
| Proceeds of Sales | | (151) | |
| Amortization/Accretion | | - | |
| Transfers into Level 3 | | 7,062 | |
| Transfers out of Level 3 | | - | |
| Ending Balance | $ | 101,024 | |
| The change in unrealized gain (loss) for the period attributable to Level 3 securities held at October 31, 2023 | $ | 10 | |
| The information used in the above reconciliation represents fiscal year to date activity for any Investments in Securities identified as using Level 3 inputs at either the beginning or the end of the current fiscal period. Cost of purchases and proceeds of sales may include securities received and/or delivered through in-kind transactions, corporate actions or exchanges. Transfers into Level 3 were attributable to a lack of observable market data resulting from decreases in market activity, decreases in liquidity, security restructurings or corporate actions. Transfers out of Level 3 were attributable to observable market data becoming available for those securities. Transfers in or out of Level 3 represent the beginning value of any Security or Instrument where a change in the pricing level occurred from the beginning to the end of the period. Realized and unrealized gains (losses) disclosed in the reconciliation are included in Net Gain (Loss) on the Fund's Statement of Operations. | |
| Statement of Assets and Liabilities |
| Amounts in thousands (except per-share amounts) | | | | October 31, 2023 |
| | | | | |
| Assets | | | | |
| Investment in securities, at value (including securities loaned of $30,220) - See accompanying schedule: | | | | |
Unaffiliated issuers (cost $5,837,280) | $ | 6,831,623 | | |
Fidelity Central Funds (cost $296,350) | | 296,350 | | |
Other affiliated issuers (cost $13,576) | | 13,227 | | |
| | | | | |
| | | | | |
| Total Investment in Securities (cost $6,147,206) | | | $ | 7,141,200 |
| Foreign currency held at value (cost $41) | | | | 41 |
| Receivable for investments sold | | | | 67,934 |
| Receivable for fund shares sold | | | | 4,531 |
| Dividends receivable | | | | 11,451 |
| Reclaims receivable | | | | 26,867 |
| Distributions receivable from Fidelity Central Funds | | | | 1,523 |
| Prepaid expenses | | | | 11 |
| Other receivables | | | | 3,408 |
Total assets | | | | 7,256,966 |
| Liabilities | | | | |
| Payable for investments purchased | $ | 74,593 | | |
| Payable for fund shares redeemed | | 3,997 | | |
| Accrued management fee | | 2,377 | | |
| Distribution and service plan fees payable | | 36 | | |
| Other affiliated payables | | 785 | | |
| Deferred taxes | | 7,146 | | |
| Other payables and accrued expenses | | 615 | | |
| Collateral on securities loaned | | 31,747 | | |
| Total Liabilities | | | | 121,296 |
| Net Assets | | | $ | 7,135,670 |
| Net Assets consist of: | | | | |
| Paid in capital | | | $ | 6,625,956 |
| Total accumulated earnings (loss) | | | | 509,714 |
| Net Assets | | | $ | 7,135,670 |
| | | | | |
| Net Asset Value and Maximum Offering Price | | | | |
| Class A : | | | | |
Net Asset Value and redemption price per share ($122,305 ÷ 3,127 shares)(a)(b) | | | $ | 39.12 |
| Maximum offering price per share (100/94.25 of $39.12) | | | $ | 41.51 |
| Class M : | | | | |
Net Asset Value and redemption price per share ($15,275 ÷ 395 shares)(a)(b) | | | $ | 38.71 |
| Maximum offering price per share (100/96.50 of $38.71) | | | $ | 40.11 |
| Class C : | | | | |
Net Asset Value and offering price per share ($4,391 ÷ 115 shares)(a)(b) | | | $ | 38.06 |
| International Discovery : | | | | |
Net Asset Value, offering price and redemption price per share ($3,352,940 ÷ 84,870 shares) | | | $ | 39.51 |
| Class K : | | | | |
Net Asset Value, offering price and redemption price per share ($476,117 ÷ 12,088 shares) | | | $ | 39.39 |
| Class I : | | | | |
Net Asset Value, offering price and redemption price per share ($496,845 ÷ 12,626 shares) | | | $ | 39.35 |
| Class Z : | | | | |
Net Asset Value, offering price and redemption price per share ($2,667,797 ÷ 67,828 shares) | | | $ | 39.33 |
(a)Redemption price per share is equal to net asset value less any applicable contingent deferred sales charge. |
(b)Corresponding Net Asset Value does not calculate due to rounding of fractional net assets and/or shares. |
| Statement of Operations |
| Amounts in thousands | | | | Year ended October 31, 2023 |
| Investment Income | | | | |
| Dividends (including $476 earned from affiliated issuers) | | | $ | 175,205 |
| Interest | | | | 202 |
| Income from Fidelity Central Funds (including $1,310 from security lending) | | | | 11,989 |
| Income before foreign taxes withheld | | | $ | 187,396 |
| Less foreign taxes withheld | | | | (18,260) |
| Total Income | | | | 169,136 |
| Expenses | | | | |
| Management fee | | | | |
| Basic fee | $ | 50,801 | | |
| Performance adjustment | | (13,772) | | |
| Transfer agent fees | | 8,126 | | |
| Distribution and service plan fees | | 491 | | |
| Accounting fees | | 1,612 | | |
| Custodian fees and expenses | | 662 | | |
| Independent trustees' fees and expenses | | 45 | | |
| Registration fees | | 158 | | |
| Audit | | 218 | | |
| Legal | | 9 | | |
| Miscellaneous | | 39 | | |
| Total expenses before reductions | | 48,389 | | |
| Expense reductions | | (474) | | |
| Total expenses after reductions | | | | 47,915 |
| Net Investment income (loss) | | | | 121,221 |
| Realized and Unrealized Gain (Loss) | | | | |
| Net realized gain (loss) on: | | | | |
| Investment Securities: | | | | |
| Unaffiliated issuers (net of foreign taxes of $2) | | (123,014) | | |
| Redemptions in-kind | | 29,458 | | |
| Affiliated issuers | | 71 | | |
| Foreign currency transactions | | 823 | | |
| Total net realized gain (loss) | | | | (92,662) |
| Change in net unrealized appreciation (depreciation) on: | | | | |
| Investment Securities: | | | | |
| Unaffiliated issuers(net of increase in deferred foreign taxes of $1,949) | | 505,956 | | |
| Affiliated issuers | | 16,614 | | |
| Assets and liabilities in foreign currencies | | 1,813 | | |
| Total change in net unrealized appreciation (depreciation) | | | | 524,383 |
| Net gain (loss) | | | | 431,721 |
| Net increase (decrease) in net assets resulting from operations | | | $ | 552,942 |
| Statement of Changes in Net Assets |
| |
| Amount in thousands | | Year ended October 31, 2023 | | Year ended October 31, 2022 |
| Increase (Decrease) in Net Assets | | | | |
| Operations | | | | |
| Net investment income (loss) | $ | 121,221 | $ | 150,460 |
| Net realized gain (loss) | | (92,662) | | (304,705) |
| Change in net unrealized appreciation (depreciation) | | 524,383 | | (3,205,165) |
| Net increase (decrease) in net assets resulting from operations | | 552,942 | | (3,359,410) |
| Distributions to shareholders | | (30,708) | | (1,127,528) |
| | | | | |
| Share transactions - net increase (decrease) | | (756,854) | | 588,890 |
| Total increase (decrease) in net assets | | (234,620) | | (3,898,048) |
| | | | | |
| Net Assets | | | | |
| Beginning of period | | 7,370,290 | | 11,268,338 |
| End of period | $ | 7,135,670 | $ | 7,370,290 |
| | | | | |
| | | | | |
Financial Highlights
| Fidelity Advisor® International Discovery Fund Class A |
| |
| Years ended October 31, | | 2023 | | 2022 | | 2021 | | 2020 | | 2019 |
Selected Per-Share Data | | | | | | | | | | |
| Net asset value, beginning of period | $ | 36.68 | $ | 58.79 | $ | 45.84 | $ | 43.31 | $ | 39.99 |
| Income from Investment Operations | | | | | | | | | | |
Net investment income (loss) A,B | | .49 | | .56 C | | .18 | | .16 | | .63 D |
| Net realized and unrealized gain (loss) | | 1.95 | | (16.91) | | 14.60 | | 3.27 | | 3.93 |
| Total from investment operations | | 2.44 | | (16.35) | | 14.78 | | 3.43 | | 4.56 |
| Distributions from net investment income | | - | | (1.38) | | (.12) | | (.62) | | (.33) |
| Distributions from net realized gain | | - | | (4.38) | | (1.71) | | (.28) | | (.91) |
| Total distributions | | - | | (5.76) | | (1.83) | | (.90) | | (1.24) |
| Net asset value, end of period | $ | 39.12 | $ | 36.68 | $ | 58.79 | $ | 45.84 | $ | 43.31 |
Total Return E,F | | 6.65% | | (30.57)% | | 32.86% | | 8.02% | | 11.90% |
Ratios to Average Net Assets B,G,H | | | | | | | | | | |
| Expenses before reductions | | 1.00% | | 1.31% | | 1.32% | | 1.36% | | 1.12% |
| Expenses net of fee waivers, if any | | .99% | | 1.30% | | 1.32% | | 1.36% | | 1.12% |
| Expenses net of all reductions | | .99% | | 1.30% | | 1.32% | | 1.36% | | 1.11% |
| Net investment income (loss) | | 1.17% | | 1.27% C | | .32% | | .38% | | 1.57% D |
| Supplemental Data | | | | | | | | | | |
| Net assets, end of period (in millions) | $ | 122 | $ | 131 | $ | 206 | $ | 173 | $ | 185 |
Portfolio turnover rate I | | 49% J | | 43% J | | 41% J | | 34% J | | 70% J |
ACalculated based on average shares outstanding during the period.
BNet investment income (loss) is affected by the timing of the declaration of dividends by any underlying mutual funds or exchange-traded funds (ETFs). Net investment income (loss) of any mutual funds or ETFs is not included in the Fund's net investment income (loss) ratio.
CNet investment income per share reflects one or more large, non-recurring dividend(s) which amounted to $.16 per share. Excluding such non-recurring dividend(s), the ratio of net investment income (loss) to average net assets would have been .92%.
DNet investment income per share reflects one or more large, non-recurring dividend(s) which amounted to $.21 per share. Excluding such non-recurring dividend(s), the ratio of net investment income (loss) to average net assets would have been 1.05%.
ETotal returns would have been lower if certain expenses had not been reduced during the applicable periods shown.
FTotal returns do not include the effect of the sales charges.
GFees and expenses of any underlying mutual funds or exchange-traded funds (ETFs) are not included in the Fund's expense ratio. The Fund indirectly bears its proportionate share of these expenses. For additional expense information related to investments in Fidelity Central Funds, please refer to the "Investments in Fidelity Central Funds" note found in the Notes to Financial Statements section of the most recent Annual or Semi-Annual report.
HExpense ratios reflect operating expenses of the class. Expenses before reductions do not reflect amounts reimbursed, waived, or reduced through arrangements with the investment adviser, brokerage services, or other offset arrangements, if applicable, and do not represent the amount paid by the class during periods when reimbursements, waivers or reductions occur.
IAmount does not include the portfolio activity of any underlying mutual funds or exchange-traded funds (ETFs).
JPortfolio turnover rate excludes securities received or delivered in-kind.
| Fidelity Advisor® International Discovery Fund Class M |
| |
| Years ended October 31, | | 2023 | | 2022 | | 2021 | | 2020 | | 2019 |
Selected Per-Share Data | | | | | | | | | | |
| Net asset value, beginning of period | $ | 36.38 | $ | 58.35 | $ | 45.53 | $ | 43.01 | $ | 39.71 |
| Income from Investment Operations | | | | | | | | | | |
Net investment income (loss) A,B | | .38 | | .45 C | | .04 | | .06 | | .53 D |
| Net realized and unrealized gain (loss) | | 1.95 | | (16.81) | | 14.51 | | 3.24 | | 3.91 |
| Total from investment operations | | 2.33 | | (16.36) | | 14.55 | | 3.30 | | 4.44 |
| Distributions from net investment income | | - | | (1.23) | | (.02) | | (.51) | | (.22) |
| Distributions from net realized gain | | - | | (4.38) | | (1.71) | | (.28) | | (.91) |
| Total distributions | | - | | (5.61) | | (1.73) | | (.78) E | | (1.14) E |
| Net asset value, end of period | $ | 38.71 | $ | 36.38 | $ | 58.35 | $ | 45.53 | $ | 43.01 |
Total Return F,G | | 6.40% | �� | (30.76)% | | 32.53% | | 7.77% | | 11.62% |
Ratios to Average Net Assets B,H,I | | | | | | | | | | |
| Expenses before reductions | | 1.24% | | 1.55% | | 1.57% | | 1.61% | | 1.37% |
| Expenses net of fee waivers, if any | | 1.24% | | 1.55% | | 1.57% | | 1.61% | | 1.37% |
| Expenses net of all reductions | | 1.23% | | 1.55% | | 1.57% | | 1.60% | | 1.35% |
| Net investment income (loss) | | .93% | | 1.02% C | | .07% | | .13% | | 1.32% D |
| Supplemental Data | | | | | | | | | | |
| Net assets, end of period (in millions) | $ | 15 | $ | 16 | $ | 25 | $ | 21 | $ | 24 |
Portfolio turnover rate J | | 49% K | | 43% K | | 41% K | | 34% K | | 70% K |
ACalculated based on average shares outstanding during the period.
BNet investment income (loss) is affected by the timing of the declaration of dividends by any underlying mutual funds or exchange-traded funds (ETFs). Net investment income (loss) of any mutual funds or ETFs is not included in the Fund's net investment income (loss) ratio.
CNet investment income per share reflects one or more large, non-recurring dividend(s) which amounted to $.16 per share. Excluding such non-recurring dividend(s), the ratio of net investment income (loss) to average net assets would have been .67%.
DNet investment income per share reflects one or more large, non-recurring dividend(s) which amounted to $.21 per share. Excluding such non-recurring dividend(s), the ratio of net investment income (loss) to average net assets would have been .80%.
ETotal distributions per share do not sum due to rounding.
FTotal returns would have been lower if certain expenses had not been reduced during the applicable periods shown.
GTotal returns do not include the effect of the sales charges.
HFees and expenses of any underlying mutual funds or exchange-traded funds (ETFs) are not included in the Fund's expense ratio. The Fund indirectly bears its proportionate share of these expenses. For additional expense information related to investments in Fidelity Central Funds, please refer to the "Investments in Fidelity Central Funds" note found in the Notes to Financial Statements section of the most recent Annual or Semi-Annual report.
IExpense ratios reflect operating expenses of the class. Expenses before reductions do not reflect amounts reimbursed, waived, or reduced through arrangements with the investment adviser, brokerage services, or other offset arrangements, if applicable, and do not represent the amount paid by the class during periods when reimbursements, waivers or reductions occur.
JAmount does not include the portfolio activity of any underlying mutual funds or exchange-traded funds (ETFs).
KPortfolio turnover rate excludes securities received or delivered in-kind.
| Fidelity Advisor® International Discovery Fund Class C |
| |
| Years ended October 31, | | 2023 | | 2022 | | 2021 | | 2020 | | 2019 |
Selected Per-Share Data | | | | | | | | | | |
| Net asset value, beginning of period | $ | 35.96 | $ | 57.59 | $ | 45.18 | $ | 42.60 | $ | 39.32 |
| Income from Investment Operations | | | | | | | | | | |
Net investment income (loss) A,B | | .16 | | .21 C | | (.27) | | (.18) | | .31 D |
| Net realized and unrealized gain (loss) | | 1.94 | | (16.66) | | 14.38 | | 3.22 | | 3.88 |
| Total from investment operations | | 2.10 | | (16.45) | | 14.11 | | 3.04 | | 4.19 |
| Distributions from net investment income | | - | | (.80) | | - | | (.19) | | - |
| Distributions from net realized gain | | - | | (4.38) | | (1.70) | | (.28) | | (.91) |
| Total distributions | | - | | (5.18) | | (1.70) | | (.46) E | | (.91) |
| Net asset value, end of period | $ | 38.06 | $ | 35.96 | $ | 57.59 | $ | 45.18 | $ | 42.60 |
Total Return F,G | | 5.84% | | (31.14)% | | 31.79% | | 7.19% | | 11.02% |
Ratios to Average Net Assets B,H,I | | | | | | | | | | |
| Expenses before reductions | | 1.77% | | 2.10% | | 2.14% | | 2.16% | | 1.91% |
| Expenses net of fee waivers, if any | | 1.76% | | 2.10% | | 2.13% | | 2.15% | | 1.91% |
| Expenses net of all reductions | | 1.76% | | 2.10% | | 2.13% | | 2.15% | | 1.90% |
| Net investment income (loss) | | .40% | | .48% C | | (.50)% | | (.41)% | | .78% D |
| Supplemental Data | | | | | | | | | | |
| Net assets, end of period (in millions) | $ | 4 | $ | 5 | $ | 10 | $ | 11 | $ | 12 |
Portfolio turnover rate J | | 49% K | | 43% K | | 41% K | | 34% K | | 70% K |
ACalculated based on average shares outstanding during the period.
BNet investment income (loss) is affected by the timing of the declaration of dividends by any underlying mutual funds or exchange-traded funds (ETFs). Net investment income (loss) of any mutual funds or ETFs is not included in the Fund's net investment income (loss) ratio.
CNet investment income per share reflects one or more large, non-recurring dividend(s) which amounted to $.16 per share. Excluding such non-recurring dividend(s), the ratio of net investment income (loss) to average net assets would have been .12%.
DNet investment income per share reflects one or more large, non-recurring dividend(s) which amounted to $.21 per share. Excluding such non-recurring dividend(s), the ratio of net investment income (loss) to average net assets would have been .26%.
ETotal distributions per share do not sum due to rounding.
FTotal returns would have been lower if certain expenses had not been reduced during the applicable periods shown.
GTotal returns do not include the effect of the contingent deferred sales charge.
HFees and expenses of any underlying mutual funds or exchange-traded funds (ETFs) are not included in the Fund's expense ratio. The Fund indirectly bears its proportionate share of these expenses. For additional expense information related to investments in Fidelity Central Funds, please refer to the "Investments in Fidelity Central Funds" note found in the Notes to Financial Statements section of the most recent Annual or Semi-Annual report.
IExpense ratios reflect operating expenses of the class. Expenses before reductions do not reflect amounts reimbursed, waived, or reduced through arrangements with the investment adviser, brokerage services, or other offset arrangements, if applicable, and do not represent the amount paid by the class during periods when reimbursements, waivers or reductions occur.
JAmount does not include the portfolio activity of any underlying mutual funds or exchange-traded funds (ETFs).
KPortfolio turnover rate excludes securities received or delivered in-kind.
| Fidelity® International Discovery Fund |
| |
| Years ended October 31, | | 2023 | | 2022 | | 2021 | | 2020 | | 2019 |
Selected Per-Share Data | | | | | | | | | | |
| Net asset value, beginning of period | $ | 37.04 | $ | 59.31 | $ | 46.20 | $ | 43.65 | $ | 40.32 |
| Income from Investment Operations | | | | | | | | | | |
Net investment income (loss) A,B | | .63 | | .72 C | | .36 | | .32 | | .78 D |
| Net realized and unrealized gain (loss) | | 1.98 | | (17.07) | | 14.71 | | 3.29 | | 3.95 |
| Total from investment operations | | 2.61 | | (16.35) | | 15.07 | | 3.61 | | 4.73 |
| Distributions from net investment income | | (.14) | | (1.54) | | (.25) | | (.78) | | (.49) |
| Distributions from net realized gain | | - | | (4.38) | | (1.71) | | (.28) | | (.91) |
| Total distributions | | (.14) | | (5.92) | | (1.96) | | (1.06) | | (1.40) |
| Net asset value, end of period | $ | 39.51 | $ | 37.04 | $ | 59.31 | $ | 46.20 | $ | 43.65 |
Total Return E | | 7.04% | | (30.36)% | | 33.29% | | 8.39% | | 12.31% |
Ratios to Average Net Assets B,F,G | | | | | | | | | | |
| Expenses before reductions | | .66% | | .98% | | .99% | | 1.02% | | .78% |
| Expenses net of fee waivers, if any | | .65% | | .97% | | .99% | | 1.02% | | .78% |
| Expenses net of all reductions | | .65% | | .97% | | .99% | | 1.01% | | .76% |
| Net investment income (loss) | | 1.51% | | 1.60% C | | .65% | | .72% | | 1.92% D |
| Supplemental Data | | | | | | | | | | |
| Net assets, end of period (in millions) | $ | 3,353 | $ | 3,386 | $ | 5,117 | $ | 6,784 | $ | 6,726 |
Portfolio turnover rate H | | 49% I | | 43% I | | 41% I | | 34% I | | 70% I |
ACalculated based on average shares outstanding during the period.
BNet investment income (loss) is affected by the timing of the declaration of dividends by any underlying mutual funds or exchange-traded funds (ETFs). Net investment income (loss) of any mutual funds or ETFs is not included in the Fund's net investment income (loss) ratio.
CNet investment income per share reflects one or more large, non-recurring dividend(s) which amounted to $.16 per share. Excluding such non-recurring dividend(s), the ratio of net investment income (loss) to average net assets would have been 1.25%.
DNet investment income per share reflects one or more large, non-recurring dividend(s) which amounted to $.21 per share. Excluding such non-recurring dividend(s), the ratio of net investment income (loss) to average net assets would have been 1.40%.
ETotal returns would have been lower if certain expenses had not been reduced during the applicable periods shown.
FFees and expenses of any underlying mutual funds or exchange-traded funds (ETFs) are not included in the Fund's expense ratio. The Fund indirectly bears its proportionate share of these expenses. For additional expense information related to investments in Fidelity Central Funds, please refer to the "Investments in Fidelity Central Funds" note found in the Notes to Financial Statements section of the most recent Annual or Semi-Annual report.
GExpense ratios reflect operating expenses of the class. Expenses before reductions do not reflect amounts reimbursed, waived, or reduced through arrangements with the investment adviser, brokerage services, or other offset arrangements, if applicable, and do not represent the amount paid by the class during periods when reimbursements, waivers or reductions occur.
HAmount does not include the portfolio activity of any underlying mutual funds or exchange-traded funds (ETFs).
IPortfolio turnover rate excludes securities received or delivered in-kind.
| Fidelity® International Discovery Fund Class K |
| |
| Years ended October 31, | | 2023 | | 2022 | | 2021 | | 2020 | | 2019 |
Selected Per-Share Data | | | | | | | | | | |
| Net asset value, beginning of period | $ | 36.93 | $ | 59.18 | $ | 46.10 | $ | 43.55 | $ | 40.25 |
| Income from Investment Operations | | | | | | | | | | |
Net investment income (loss) A,B | | .68 | | .78 C | | .41 | | .36 | | .82 D |
| Net realized and unrealized gain (loss) | | 1.96 | | (17.02) | | 14.67 | | 3.29 | | 3.93 |
| Total from investment operations | | 2.64 | | (16.24) | | 15.08 | | 3.65 | | 4.75 |
| Distributions from net investment income | | (.18) | | (1.62) | | (.29) | | (.82) | | (.54) |
| Distributions from net realized gain | | - | | (4.38) | | (1.71) | | (.28) | | (.91) |
| Total distributions | | (.18) | | (6.01) E | | (2.00) | | (1.10) | | (1.45) |
| Net asset value, end of period | $ | 39.39 | $ | 36.93 | $ | 59.18 | $ | 46.10 | $ | 43.55 |
Total Return F | | 7.15% | | (30.28)% | | 33.40% | | 8.52% | | 12.41% |
Ratios to Average Net Assets B,G,H | | | | | | | | | | |
| Expenses before reductions | | .55% | | .87% | | .90% | | .91% | | .66% |
| Expenses net of fee waivers, if any | | .54% | | .87% | | .90% | | .91% | | .66% |
| Expenses net of all reductions | | .54% | | .87% | | .90% | | .91% | | .65% |
| Net investment income (loss) | | 1.62% | | 1.71% C | | .74% | | .83% | | 2.03% D |
| Supplemental Data | | | | | | | | | | |
| Net assets, end of period (in millions) | $ | 476 | $ | 603 | $ | 1,371 | $ | 1,401 | $ | 1,566 |
Portfolio turnover rate I | | 49% J | | 43% J | | 41% J | | 34% J | | 70% J |
ACalculated based on average shares outstanding during the period.
BNet investment income (loss) is affected by the timing of the declaration of dividends by any underlying mutual funds or exchange-traded funds (ETFs). Net investment income (loss) of any mutual funds or ETFs is not included in the Fund's net investment income (loss) ratio.
CNet investment income per share reflects one or more large, non-recurring dividend(s) which amounted to $.16 per share. Excluding such non-recurring dividend(s), the ratio of net investment income (loss) to average net assets would have been 1.35%.
DNet investment income per share reflects one or more large, non-recurring dividend(s) which amounted to $.21 per share. Excluding such non-recurring dividend(s), the ratio of net investment income (loss) to average net assets would have been 1.51%.
ETotal distributions per share do not sum due to rounding.
FTotal returns would have been lower if certain expenses had not been reduced during the applicable periods shown.
GFees and expenses of any underlying mutual funds or exchange-traded funds (ETFs) are not included in the Fund's expense ratio. The Fund indirectly bears its proportionate share of these expenses. For additional expense information related to investments in Fidelity Central Funds, please refer to the "Investments in Fidelity Central Funds" note found in the Notes to Financial Statements section of the most recent Annual or Semi-Annual report.
HExpense ratios reflect operating expenses of the class. Expenses before reductions do not reflect amounts reimbursed, waived, or reduced through arrangements with the investment adviser, brokerage services, or other offset arrangements, if applicable, and do not represent the amount paid by the class during periods when reimbursements, waivers or reductions occur.
IAmount does not include the portfolio activity of any underlying mutual funds or exchange-traded funds (ETFs).
JPortfolio turnover rate excludes securities received or delivered in-kind.
| Fidelity Advisor® International Discovery Fund Class I |
| |
| Years ended October 31, | | 2023 | | 2022 | | 2021 | | 2020 | | 2019 |
Selected Per-Share Data | | | | | | | | | | |
| Net asset value, beginning of period | $ | 36.90 | $ | 59.15 | $ | 46.08 | $ | 43.53 | $ | 40.22 |
| Income from Investment Operations | | | | | | | | | | |
Net investment income (loss) A,B | | .63 | | .69 C | | .35 | | .31 | | .77 D |
| Net realized and unrealized gain (loss) | | 1.96 | | (16.99) | | 14.67 | | 3.28 | | 3.93 |
| Total from investment operations | | 2.59 | | (16.30) | | 15.02 | | 3.59 | | 4.70 |
| Distributions from net investment income | | (.14) | | (1.57) | | (.24) | | (.76) | | (.48) |
| Distributions from net realized gain | | - | | (4.38) | | (1.71) | | (.28) | | (.91) |
| Total distributions | | (.14) | | (5.95) | | (1.95) | | (1.04) | | (1.39) |
| Net asset value, end of period | $ | 39.35 | $ | 36.90 | $ | 59.15 | $ | 46.08 | $ | 43.53 |
Total Return E | | 7.01% | | (30.37)% | | 33.26% | | 8.37% | | 12.26% |
Ratios to Average Net Assets B,F,G | | | | | | | | | | |
| Expenses before reductions | | .67% | | .99% | | 1.02% | | 1.04% | | .80% |
| Expenses net of fee waivers, if any | | .66% | | .99% | | 1.02% | | 1.04% | | .80% |
| Expenses net of all reductions | | .66% | | .99% | | 1.02% | | 1.03% | | .79% |
| Net investment income (loss) | | 1.50% | | 1.59% C | | .62% | | .70% | | 1.89% D |
| Supplemental Data | | | | | | | | | | |
| Net assets, end of period (in millions) | $ | 497 | $ | 509 | $ | 566 | $ | 388 | $ | 463 |
Portfolio turnover rate H | | 49% I | | 43% I | | 41% I | | 34% I | | 70% I |
ACalculated based on average shares outstanding during the period.
BNet investment income (loss) is affected by the timing of the declaration of dividends by any underlying mutual funds or exchange-traded funds (ETFs). Net investment income (loss) of any mutual funds or ETFs is not included in the Fund's net investment income (loss) ratio.
CNet investment income per share reflects one or more large, non-recurring dividend(s) which amounted to $.16 per share. Excluding such non-recurring dividend(s), the ratio of net investment income (loss) to average net assets would have been 1.23%.
DNet investment income per share reflects one or more large, non-recurring dividend(s) which amounted to $.21 per share. Excluding such non-recurring dividend(s), the ratio of net investment income (loss) to average net assets would have been 1.37%.
ETotal returns would have been lower if certain expenses had not been reduced during the applicable periods shown.
FFees and expenses of any underlying mutual funds or exchange-traded funds (ETFs) are not included in the Fund's expense ratio. The Fund indirectly bears its proportionate share of these expenses. For additional expense information related to investments in Fidelity Central Funds, please refer to the "Investments in Fidelity Central Funds" note found in the Notes to Financial Statements section of the most recent Annual or Semi-Annual report.
GExpense ratios reflect operating expenses of the class. Expenses before reductions do not reflect amounts reimbursed, waived, or reduced through arrangements with the investment adviser, brokerage services, or other offset arrangements, if applicable, and do not represent the amount paid by the class during periods when reimbursements, waivers or reductions occur.
HAmount does not include the portfolio activity of any underlying mutual funds or exchange-traded funds (ETFs).
IPortfolio turnover rate excludes securities received or delivered in-kind.
| Fidelity Advisor® International Discovery Fund Class Z |
| |
| Years ended October 31, | | 2023 | | 2022 | | 2021 | | 2020 | | 2019 |
Selected Per-Share Data | | | | | | | | | | |
| Net asset value, beginning of period | $ | 36.88 | $ | 59.14 | $ | 46.07 | $ | 43.52 | $ | 40.22 |
| Income from Investment Operations | | | | | | | | | | |
Net investment income (loss) A,B | | .67 | | .76 C | | .43 | | .36 | | .82 D |
| Net realized and unrealized gain (loss) | �� | 1.97 | | (16.99) | | 14.64 | | 3.29 | | 3.94 |
| Total from investment operations | | 2.64 | | (16.23) | | 15.07 | | 3.65 | | 4.76 |
| Distributions from net investment income | | (.19) | | (1.65) | | (.29) | | (.82) | | (.54) |
| Distributions from net realized gain | | - | | (4.38) | | (1.71) | | (.28) | | (.91) |
| Total distributions | | (.19) | | (6.03) | | (2.00) | | (1.10) | | (1.46) E |
| Net asset value, end of period | $ | 39.33 | $ | 36.88 | $ | 59.14 | $ | 46.07 | $ | 43.52 |
Total Return F | | 7.14% | | (30.29)% | | 33.40% | | 8.53% | | 12.42% |
Ratios to Average Net Assets B,G,H | | | | | | | | | | |
| Expenses before reductions | | .55% | | .87% | | .90% | | .91% | | .66% |
| Expenses net of fee waivers, if any | | .54% | | .87% | | .90% | | .91% | | .66% |
| Expenses net of all reductions | | .54% | | .87% | | .90% | | .91% | | .65% |
| Net investment income (loss) | | 1.62% | | 1.71% C | | .74% | | .83% | | 2.03% D |
| Supplemental Data | | | | | | | | | | |
| Net assets, end of period (in millions) | $ | 2,668 | $ | 2,720 | $ | 3,972 | $ | 54 | $ | 82 |
Portfolio turnover rate I | | 49% J | | 43% J | | 41% J | | 34% J | | 70% J |
ACalculated based on average shares outstanding during the period.
BNet investment income (loss) is affected by the timing of the declaration of dividends by any underlying mutual funds or exchange-traded funds (ETFs). Net investment income (loss) of any mutual funds or ETFs is not included in the Fund's net investment income (loss) ratio.
CNet investment income per share reflects one or more large, non-recurring dividend(s) which amounted to $.16 per share. Excluding such non-recurring dividend(s), the ratio of net investment income (loss) to average net assets would have been 1.35%.
DNet investment income per share reflects one or more large, non-recurring dividend(s) which amounted to $.21 per share. Excluding such non-recurring dividend(s), the ratio of net investment income (loss) to average net assets would have been 1.51%.
ETotal distributions per share do not sum due to rounding.
FTotal returns would have been lower if certain expenses had not been reduced during the applicable periods shown.
GFees and expenses of any underlying mutual funds or exchange-traded funds (ETFs) are not included in the Fund's expense ratio. The Fund indirectly bears its proportionate share of these expenses. For additional expense information related to investments in Fidelity Central Funds, please refer to the "Investments in Fidelity Central Funds" note found in the Notes to Financial Statements section of the most recent Annual or Semi-Annual report.
HExpense ratios reflect operating expenses of the class. Expenses before reductions do not reflect amounts reimbursed, waived, or reduced through arrangements with the investment adviser, brokerage services, or other offset arrangements, if applicable, and do not represent the amount paid by the class during periods when reimbursements, waivers or reductions occur.
IAmount does not include the portfolio activity of any underlying mutual funds or exchange-traded funds (ETFs).
JPortfolio turnover rate excludes securities received or delivered in-kind.
For the period ended October 31, 2023
(Amounts in thousands except percentages)
1. Organization.
Fidelity International Discovery Fund (the Fund) is a fund of Fidelity Investment Trust (the Trust) and is authorized to issue an unlimited number of shares. The Trust is registered under the Investment Company Act of 1940, as amended (the 1940 Act), as an open-end management investment company organized as a Massachusetts business trust. The Fund offers Class A, Class M, Class C, International Discovery, Class K, Class I and Class Z shares, each of which has equal rights as to assets and voting privileges. Class A, Class M, Class C, Class I and Class Z are Fidelity Advisor classes. Each class has exclusive voting rights with respect to matters that affect that class. Class C shares will automatically convert to Class A shares after a holding period of eight years from the initial date of purchase, with certain exceptions. The Fund's investments in emerging markets can be subject to social, economic, regulatory, and political uncertainties and can be extremely volatile.
2. Investments in Fidelity Central Funds.
Funds may invest in Fidelity Central Funds, which are open-end investment companies generally available only to other investment companies and accounts managed by the investment adviser and its affiliates. The Schedule of Investments lists any Fidelity Central Funds held as an investment as of period end, but does not include the underlying holdings of each Fidelity Central Fund. An investing fund indirectly bears its proportionate share of the expenses of the underlying Fidelity Central Funds.
Based on its investment objective, each Fidelity Central Fund may invest or participate in various investment vehicles or strategies that are similar to those of the investing fund. These strategies are consistent with the investment objectives of the investing fund and may involve certain economic risks which may cause a decline in value of each of the Fidelity Central Funds and thus a decline in the value of the investing fund.
| Fidelity Central Fund | Investment Manager | Investment Objective | Investment Practices | Expense RatioA |
| Fidelity Money Market Central Funds | Fidelity Management & Research Company LLC (FMR) | Each fund seeks to obtain a high level of current income consistent with the preservation of capital and liquidity. | Short-term Investments | Less than .005% |
A Expenses expressed as a percentage of average net assets and are as of each underlying Central Fund's most recent annual or semi-annual shareholder report.
A complete unaudited list of holdings for each Fidelity Central Fund is available upon request or at the Securities and Exchange Commission website at www.sec.gov. In addition, the financial statements of the Fidelity Central Funds which contain the significant accounting policies (including investment valuation policies) of those funds, and are not covered by the Report of Independent Registered Public Accounting Firm, are available on the Securities and Exchange Commission website or upon request.
3. Significant Accounting Policies.
The Fund is an investment company and applies the accounting and reporting guidance of the Financial Accounting Standards Board (FASB) Accounting Standards Codification Topic 946 Financial Services - Investment Companies. The financial statements have been prepared in conformity with accounting principles generally accepted in the United States of America (GAAP), which require management to make certain estimates and assumptions at the date of the financial statements. Actual results could differ from those estimates. Subsequent events, if any, through the date that the financial statements were issued have been evaluated in the preparation of the financial statements. The Fund's Schedule of Investments lists any underlying mutual funds or exchange-traded funds (ETFs) but does not include the underlying holdings of these funds. The following summarizes the significant accounting policies of the Fund:
Investment Valuation. Investments are valued as of 4:00 p.m. Eastern time on the last calendar day of the period. The Board of Trustees (the Board) has designated the Fund's investment adviser as the valuation designee responsible for the fair valuation function and performing fair value determinations as needed. The investment adviser has established a Fair Value Committee (the Committee) to carry out the day-to-day fair valuation responsibilities and has adopted policies and procedures to govern the fair valuation process and the activities of the Committee. In accordance with these fair valuation policies and procedures, which have been approved by the Board, the Fund attempts to obtain prices from one or more third party pricing services or brokers to value its investments. When current market prices, quotations or currency exchange rates are not readily available or reliable, investments will be fair valued in good faith by the Committee, in accordance with the policies and procedures. Factors used in determining fair value vary by investment type and may include market or investment specific events, transaction data, estimated cash flows, and market observations of comparable investments. The frequency that the fair valuation procedures are used cannot be predicted and they may be utilized to a significant extent. The Committee manages the Fund's fair valuation practices and maintains the fair valuation policies and procedures. The Fund's investment adviser reports to the Board information regarding the fair valuation process and related material matters.
The Fund categorizes the inputs to valuation techniques used to value its investments into a disclosure hierarchy consisting of three levels as shown below:
Level 1 - unadjusted quoted prices in active markets for identical investments
Level 2 - other significant observable inputs (including quoted prices for similar investments, interest rates, prepayment speeds, etc.)
Level 3 - unobservable inputs (including the Fund's own assumptions based on the best information available)
Valuation techniques used to value the Fund's investments by major category are as follows:
Equity securities, including restricted securities, for which market quotations are readily available, are valued at the last reported sale price or official closing price as reported by a third party pricing service on the primary market or exchange on which they are traded and are categorized as Level 1 in the hierarchy. In the event there were no sales during the day or closing prices are not available, securities are valued at the last quoted bid price or may be valued using the last available price and are generally categorized as Level 2 in the hierarchy. For foreign equity securities, when market or security specific events arise, comparisons to the valuation of American Depositary Receipts (ADRs), futures contracts, ETFs and certain indexes as well as quoted prices for similar securities may be used and would be categorized as Level 2 in the hierarchy. For equity securities, including restricted securities, where observable inputs are limited, assumptions about market activity and risk are used and these securities may be categorized as Level 3 in the hierarchy. Securities, including private placements or other restricted securities, for which observable inputs are not available are valued using alternate valuation approaches, including the market approach, the income approach and cost approach, and are categorized as Level 3 in the hierarchy. The market approach considers factors including the price of recent investments in the same or a similar security or financial metrics of comparable securities. The income approach considers factors including expected future cash flows, security specific risks and corresponding discount rates. The cost approach considers factors including the value of the security's underlying assets and liabilities.
Investments in open-end mutual funds, including the Fidelity Central Funds, are valued at their closing net asset value (NAV) each business day and are categorized as Level 1 in the hierarchy.
The following provides information on Level 3 securities held by the Fund that were valued at period end based on unobservable inputs. These amounts exclude valuations provided by a broker.
| Asset Type | Fair Value | Valuation Technique(s) | Unobservable Input | Amount or Range/Weighted Average | Impact to Valuation from an Increase in InputA |
| Equities | $101,024 | Market comparable | Enterprise value/Revenue multiple (EV/R) | 2.0 - 12.8 / 5.3 | Increase |
| | | | Enterprise value/Net income multiple (EV/NI) | 11.5 | Increase |
| | | Market approach | Transaction price | $0.38 - $0.79 / $0.79 | Increase |
| | | | Discount rate | 50.0% | Decrease |
| | | Recovery value | Recovery value | $0.00 | Increase |
| | | Black scholes | Discount rate | 4.9% | Increase |
| | | | Volatility | 60.0% | Increase |
| | | | Term | 3.0 | Increase |
A Represents the directional change in the fair value of the Level 3 investments that could have resulted from an increase in the corresponding input as of period end. A decrease to the unobservable input would have had the opposite effect. Significant changes in these inputs may have resulted in a significantly higher or lower fair value measurement at period end.
Changes in valuation techniques may result in transfers in or out of an assigned level within the disclosure hierarchy. The aggregate value of investments by input level as of October 31, 2023, as well as a roll forward of Level 3 investments, is included at the end of the Fund's Schedule of Investments.
Foreign Currency. Certain Funds may use foreign currency contracts to facilitate transactions in foreign-denominated securities. Gains and losses from these transactions may arise from changes in the value of the foreign currency or if the counterparties do not perform under the contracts' terms.
Foreign-denominated assets, including investment securities, and liabilities are translated into U.S. dollars at the exchange rates at period end. Purchases and sales of investment securities, income and dividends received, and expenses denominated in foreign currencies are translated into U.S. dollars at the exchange rate in effect on the transaction date.
The effects of exchange rate fluctuations on investments are included with the net realized and unrealized gain (loss) on investment securities. Other foreign currency transactions resulting in realized and unrealized gain (loss) are disclosed separately.
Investment Transactions and Income. For financial reporting purposes, the Fund's investment holdings and NAV include trades executed through the end of the last business day of the period. The NAV per share for processing shareholder transactions is calculated as of the close of business of the New York Stock Exchange (NYSE), normally 4:00 p.m. Eastern time and includes trades executed through the end of the prior business day. Gains and losses on securities sold are determined on the basis of identified cost and include proceeds received from litigation. Commissions paid to certain brokers with whom the investment adviser, or its affiliates, places trades on behalf of a fund include an amount in addition to trade execution, which may be rebated back to a fund. Any such rebates are included in net realized gain (loss) on investments in the Statement of Operations. Dividend income is recorded on the ex-dividend date, except for certain dividends from foreign securities where the ex-dividend date may have passed, which are recorded as soon as the Fund is informed of the ex-dividend date. Non-cash dividends included in dividend income, if any, are recorded at the fair market value of the securities received. Income and capital gain distributions from Fidelity Central Funds, if any, are recorded on the ex-dividend date. Interest income is accrued as earned and includes coupon interest and amortization of premium and accretion of discount on debt securities as applicable. Investment income is recorded net of foreign taxes withheld where recovery of such taxes is uncertain. Funds may file withholding tax reclaims in certain jurisdictions to recover a portion of amounts previously withheld. Any withholding tax reclaims income is included in the Statement of Operations in foreign taxes withheld. Any receivables for withholding tax reclaims are included in the Statement of Assets and Liabilities in reclaims receivable. The Fund has filed tax reclaims for previously withheld taxes on dividends earned in certain European Union (EU) countries. These additional filings are subject to various administrative proceedings by the local jurisdictions' tax authorities within the EU, as well as a number of related judicial proceedings. Income recognized for EU reclaims is included with other reclaims in the Statement of Operations in foreign taxes withheld. These reclaims are recorded when the amount is known and there are no significant uncertainties on collectability.
Class Allocations and Expenses. Investment income, realized and unrealized capital gains and losses, common expenses of a fund, and certain fund-level expense reductions, if any, are allocated daily on a pro-rata basis to each class based on the relative net assets of each class to the total net assets of a fund. Each class differs with respect to transfer agent and distribution and service plan fees incurred, as applicable. Certain expense reductions may also differ by class, if applicable. For the reporting period, the allocated portion of income and expenses to each class as a percent of its average net assets may vary due to the timing of recording these transactions in relation to fluctuating net assets of the classes. Expenses directly attributable to a fund are charged to that fund. Expenses attributable to more than one fund are allocated among the respective funds on the basis of relative net assets or other appropriate methods. Expenses included in the accompanying financial statements reflect the expenses of that fund and do not include any expenses associated with any underlying mutual funds or exchange-traded funds (ETFs). Although not included in a fund's expenses, a fund indirectly bears its proportionate share of these expenses through the net asset value of each underlying mutual fund or exchange-traded fund (ETF). Expense estimates are accrued in the period to which they relate and adjustments are made when actual amounts are known.
Deferred Trustee Compensation. Under a Deferred Compensation Plan (the Plan) for certain Funds, certain independent Trustees have elected to defer receipt of a portion of their annual compensation. Deferred amounts are invested in affiliated mutual funds, are marked-to-market and remain in a fund until distributed in accordance with the Plan. The investment of deferred amounts and the offsetting payable to the Trustees presented below are included in the accompanying Statement of Assets and Liabilities in other receivables and other payables and accrued expenses, as applicable.
| Fidelity International Discovery Fund | $388 |
Income Tax Information and Distributions to Shareholders. Each year, the Fund intends to qualify as a regulated investment company under Subchapter M of the Internal Revenue Code, including distributing substantially all of its taxable income and realized gains. As a result, no provision for U.S. Federal income taxes is required. As of October 31, 2023, the Fund did not have any unrecognized tax benefits in the financial statements; nor is the Fund aware of any tax positions for which it is reasonably possible that the total amounts of unrecognized tax benefits will significantly change in the next twelve months. The Fund files a U.S. federal tax return, in addition to state and local tax returns as required. The Fund's federal income tax returns are subject to examination by the Internal Revenue Service (IRS) for a period of three fiscal years after they are filed. State and local tax returns may be subject to examination for an additional fiscal year depending on the jurisdiction. Foreign taxes are provided for based on the Fund's understanding of the tax rules and rates that exist in the foreign markets in which it invests. The Fund is subject to a tax imposed on capital gains by certain countries in which it invests. An estimated deferred tax liability for net unrealized appreciation on the applicable securities is included in Deferred taxes on the Statement of Assets & Liabilities.
Distributions are declared and recorded on the ex-dividend date. Income and capital gain distributions are declared separately for each class. Income and capital gain distributions are determined in accordance with income tax regulations, which may differ from GAAP. In addition, the Fund claimed a portion of the payment made to redeeming shareholders as a distribution for income tax purposes.
Capital accounts within the financial statements are adjusted for permanent book-tax differences. These adjustments have no impact on net assets or the results of operations. Capital accounts are not adjusted for temporary book-tax differences which will reverse in a subsequent period.
Book-tax differences are primarily due to foreign currency transactions, certain foreign taxes, passive foreign investment companies (PFIC), redemptions in-kind, deferred Trustee compensation, capital loss carryforwards, and losses deferred due to wash sales.
As of period end, the cost and unrealized appreciation (depreciation) in securities, and derivatives if applicable, for federal income tax purposes were as follows:
| Gross unrealized appreciation | $1,321,852 |
| Gross unrealized depreciation | (415,433) |
| Net unrealized appreciation (depreciation) | $906,419 |
| Tax Cost | $6,234,781 |
The tax-based components of distributable earnings as of period end were as follows:
| Undistributed ordinary income | $147,909 |
| Capital loss carryforward | $(533,865) |
| Net unrealized appreciation (depreciation) on securities and other investments | $903,039 |
Capital loss carryforwards are only available to offset future capital gains of the Fund to the extent provided by regulations and may be limited. The capital loss carryforward information presented below, including any applicable limitation, is estimated as of fiscal period end and is subject to adjustment.
| Short-term | $(533,865) |
| Long-term | - |
| Total capital loss carryforward | $(533,865) |
The tax character of distributions paid was as follows:
| | October 31, 2023 | October 31, 2022 |
| Ordinary Income | $30,708 | $382,080 |
| Long-term Capital Gains | - | 745,448 |
| Total | $30,708 | $1,127,528 |
Restricted Securities (including Private Placements). Funds may invest in securities that are subject to legal or contractual restrictions on resale. These securities generally may be resold in transactions exempt from registration or to the public if the securities are registered. Disposal of these securities may involve time-consuming negotiations and expense, and prompt sale at an acceptable price may be difficult. Information regarding restricted securities held at period end is included at the end of the Schedule of Investments, if applicable.
New Accounting Pronouncement. In June 2022, the Financial Accounting Standards Board (FASB) issued Accounting Standards Update (ASU) 2022-03 Fair Value Measurement (Topic 820): Fair Value Measurement of Equity Securities Subject to Contractual Sale Restrictions. The amendments in this ASU clarify that a contractual restriction on the sale of an equity security is not considered part of the unit of account of the equity security and, therefore, is not considered in measuring fair value. They also clarify that an entity cannot, as a separate unit of account, recognize and measure a contractual sale restriction. They also require additional disclosures for equity securities subject to contractual sale restrictions. ASU 2022-03 will be effective for fiscal years, including interim periods within those fiscal years, beginning after December 15, 2023, and allows for early adoption. ASU 2022-03 will only be applicable to an equity security in which the contractual arrangement that restricts its sale is executed or modified on or after the adoption date. Management is currently evaluating the potential impact of ASU 2022-03 to the financial statements.
4. Purchases and Sales of Investments.
Purchases and sales of securities, other than short-term securities and in-kind transactions, as applicable, are noted in the table below.
| | Purchases ($) | Sales ($) |
| Fidelity International Discovery Fund | 3,669,932 | 4,113,943 |
Unaffiliated Redemptions In-Kind. Shares that were redeemed in-kind for investments, including accrued interest and cash, if any, are shown in the table below. The net realized gain or loss on investments delivered through in-kind redemptions is included in the "Net realized gain (loss) on: Redemptions in-kind" line in the accompanying Statement of Operations. The amount of the in-kind redemptions is included in share transactions in the accompanying Statement of Changes in Net Assets. There was no gain or loss for federal income tax purposes.
| | Shares | Total net realized gain or loss ($) | Total Proceeds ($) | Participating classes |
| Fidelity International Discovery Fund | 2,746 | 29,458 | 115,652 | International Discovery and Class K |
Prior Fiscal Year Unaffiliated Redemptions In-Kind. Shares that were redeemed in-kind for investments, including accrued interest and cash, if any, are shown in the table below; along with realized gain or loss on investments delivered through in-kind redemptions. The amount of the in-kind redemptions is included in share transactions in the accompanying Statement of Changes in Net Assets. There was no gain or loss for federal income tax purposes.
| | Shares | Total net realized gain or loss ($) | Total Proceeds ($) | Participating classes |
| Fidelity International Discovery Fund | 5,635 | 85,105 | 263,151 | International Discovery and Class K |
5. Fees and Other Transactions with Affiliates.
Management Fee. Fidelity Management & Research Company LLC (the investment adviser) and its affiliates provide the Fund with investment management related services for which the Fund pays a monthly management fee. The management fee is the sum of an individual fund fee rate that is based on an annual rate of .424% of the Fund's average net assets and an annualized group fee rate that averaged .23% during the period. The group fee rate is based upon the monthly average net assets of a group of registered investment companies with which the investment adviser has management contracts. The group fee rate decreases as assets under management increase and increases as assets under management decrease. In addition, the management fee is subject to a performance adjustment (up to a maximum of +/- 20% of the Fund's average net assets over a 36 month performance period). The upward or downward adjustment to the management fee is based on the relative investment performance of International Discovery as compared to its benchmark index, the MSCI EAFE Index, over the same 36 month performance period. For the reporting period, the total annual management fee rate, including the performance adjustment, was .47% of the Fund's average net assets. The performance adjustment included in the management fee rate may be higher or lower than the maximum performance adjustment rate due to the difference between the average net assets for the reporting and performance periods.
Distribution and Service Plan Fees. In accordance with Rule 12b-1 of the 1940 Act, the Fund has adopted separate Distribution and Service Plans for each class of shares. Certain classes pay Fidelity Distributors Company LLC (FDC), an affiliate of the investment adviser, separate Distribution and Service Fees, each of which is based on an annual percentage of each class' average net assets. In addition, FDC may pay financial intermediaries for selling shares of the Fund and providing shareholder support services. For the period, the Distribution and Service Fee rates, total fees and amounts retained by FDC were as follows:
| | Distribution Fee | Service Fee | Total Fees | Retained by FDC |
| Class A | - % | .25% | $351 | $2 |
| Class M | .25% | .25% | 86 | -A |
| Class C | .75% | .25% | 54 | 4 |
| | | | $491 | $6 |
A In the amount of the less than five hundred dollars.
Sales Load. FDC may receive a front-end sales charge of up to 5.75% for selling Class A shares and 3.50% for selling Class M shares, some of which is paid to financial intermediaries for selling shares of the Fund. Depending on the holding period, FDC may receive contingent deferred sales charges levied on Class A, Class M and Class C redemptions. The deferred sales charges are 1.00% for Class C shares, 1.00% for certain purchases of Class A shares and .25% for certain purchases of Class M shares.
For the period, sales charge amounts retained by FDC were as follows:
| | Retained by FDC |
| Class A | $7 |
| Class M | 1 |
Class CA | -B |
| | $8 |
A When Class C shares are initially sold, FDC pays commissions from its own resources to financial intermediaries through which the sales are made.
B In the amount of the less than five hundred dollars.
Transfer Agent Fees. Fidelity Investments Institutional Operations Company LLC (FIIOC), an affiliate of the investment adviser, is the transfer, dividend disbursing and shareholder servicing agent for each class of the Fund. FIIOC receives account fees and asset-based fees that vary according to the account size and type of account of the shareholders of the respective classes of the Fund, except for Class K and Class Z. FIIOC receives an asset-based fee of Class K's and Class Z's average net assets. FIIOC pays for typesetting, printing and mailing of shareholder reports, except proxy statements.
For the period, transfer agent fees for each class were as follows:
| | Amount | % of Class-Level Average Net Assets |
| Class A | $333 | .24 |
| Class M | 40 | .23 |
| Class C | 14 | .26 |
| International Discovery | 5,430 | .15 |
| Class K | 240 | .04 |
| Class I | 863 | .16 |
| Class Z | 1,206 | .04 |
| | $8,126 | |
During November 2023, the Board approved a change in the transfer agent fees effective December 1, 2023 to a fixed annual rate of class-level average net assets as follows:
| | % of Class-Level Average Net Assets |
| Class A | 0.2000% |
| Class M | 0.2000% |
| Class C | 0.2000% |
| International Discovery | 0.1447% |
| Class I | 0.1603% |
Accounting Fees. Fidelity Service Company, Inc. (FSC), an affiliate of the investment adviser, maintains the Fund's accounting records. The accounting fee is based on the level of average net assets for each month. For the period, the fees were equivalent to the following annual rates:
| | % of Average Net Assets |
| Fidelity International Discovery Fund | .02 |
During November 2023, the Board approved a change in the accounting fees effective December 1, 2023 to a fixed annual rate of average net assets as follows:
| | % of Average Net Assets |
| Fidelity International Discovery Fund | 0.0200% |
Brokerage Commissions. A portion of portfolio transactions were placed with brokerage firms which are affiliates of the investment adviser. Brokerage commissions are included in net realized gain (loss) and change in net unrealized appreciation (depreciation) in the Statement of Operations. The commissions paid to these affiliated firms were as follows:
| | Amount |
| Fidelity International Discovery Fund | $5 |
Interfund Trades. Funds may purchase from or sell securities to other Fidelity Funds under procedures adopted by the Board. The procedures have been designed to ensure these interfund trades are executed in accordance with Rule 17a-7 of the 1940 Act. Any interfund trades are included within the respective purchases and sales amounts shown in the Purchases and Sales of Investments note. Interfund trades during the period are noted in the table below.
| | Purchases ($) | Sales ($) | Realized Gain (Loss) ($) |
| Fidelity International Discovery Fund | 116,280 | 85,679 | (10,839) |
6. Committed Line of Credit.
Certain Funds participate with other funds managed by the investment adviser or an affiliate in a $4.25 billion credit facility (the "line of credit") to be utilized for temporary or emergency purposes to fund shareholder redemptions or for other short-term liquidity purposes. The participating funds have agreed to pay commitment fees on their pro-rata portion of the line of credit, which are reflected in Miscellaneous expenses on the Statement of Operations, and are listed below. During the period, there were no borrowings on this line of credit.
| | Amount |
| Fidelity International Discovery Fund | $14 |
7. Security Lending.
Funds lend portfolio securities from time to time in order to earn additional income. Lending agents are used, including National Financial Services (NFS), an affiliate of the investment adviser. Pursuant to a securities lending agreement, NFS will receive a fee, which is capped at 9.9% of a fund's daily lending revenue, for its services as lending agent. A fund may lend securities to certain qualified borrowers, including NFS. On the settlement date of the loan, a fund receives collateral (in the form of U.S. Treasury obligations, letters of credit and/or cash) against the loaned securities and maintains collateral in an amount not less than 100% of the market value of the loaned securities during the period of the loan. The market value of the loaned securities is determined at the close of business of a fund and any additional required collateral is delivered to a fund on the next business day. A fund or borrower may terminate the loan at any time, and if the borrower defaults on its obligation to return the securities loaned because of insolvency or other reasons, a fund may apply collateral received from the borrower against the obligation. A fund may experience delays and costs in recovering the securities loaned. Any cash collateral received is invested in the Fidelity Securities Lending Cash Central Fund. Any loaned securities are identified as such in the Schedule of Investments, and the value of loaned securities and cash collateral at period end, as applicable, are presented in the Statement of Assets and Liabilities. Security lending income represents the income earned on investing cash collateral, less rebates paid to borrowers and any lending agent fees associated with the loan, plus any premium payments received for lending certain types of securities. Security lending income is presented in the Statement of Operations as a component of income from Fidelity Central Funds. Affiliated security lending activity, if any, was as follows:
| | Total Security Lending Fees Paid to NFS | Security Lending Income From Securities Loaned to NFS | Value of Securities Loaned to NFS at Period End |
| Fidelity International Discovery Fund | $142 | $- | $- |
8. Expense Reductions.
Through arrangements with the Fund's custodian, and each class' transfer agent, credits realized as a result of certain uninvested cash balances were used to reduce the Fund's expenses. During the period, custodian credits reduced the Fund's expenses by $1. During the period, transfer agent credits reduced each class' expenses as noted in the table below.
| | Expense reduction |
| Class M | -A |
| | |
A In the amount of the less than five hundred dollars.
In addition, during the period the investment adviser or an affiliate reimbursed and/or waived a portion of fund-level operating expenses in the amount of $473.
9. Distributions to Shareholders.
Distributions to shareholders of each class were as follows:
| | Year ended October 31, 2023 | Year ended October 31, 2022 |
| Fidelity International Discovery Fund | | |
| Distributions to shareholders | | |
| Class A | $- | $20,037 |
| Class M | - | 2,384 |
| Class C | - | 909 |
| International Discovery | 12,630 | 509,968 |
| Class K | 2,923 | 134,333 |
| Class I | 1,852 | 53,775 |
| Class Z | 13,303 | 406,122 |
Total | $30,708 | $1,127,528 |
10. Share Transactions.
Share transactions for each class were as follows and may contain in-kind transactions, automatic conversions between classes or exchanges between affiliated funds:
| | Shares | Shares | Dollars | Dollars |
| | Year ended October 31, 2023 | Year ended October 31, 2022 | Year ended October 31, 2023 | Year ended October 31, 2022 |
| Fidelity International Discovery Fund | | | | |
| Class A | | | | |
| Shares sold | 180 | 268 | $7,469 | $11,889 |
| Reinvestment of distributions | - | 387 | - | 19,790 |
| Shares redeemed | (617) | (597) | (25,738) | (26,398) |
| Net increase (decrease) | (437) | 58 | $(18,269) | $5,281 |
| Class M | | | | |
| Shares sold | 16 | 22 | $693 | $962 |
| Reinvestment of distributions | - | 47 | - | 2,368 |
| Shares redeemed | (64) | (58) | (2,637) | (2,608) |
| Net increase (decrease) | (48) | 11 | $(1,944) | $722 |
| Class C | | | | |
| Shares sold | 14 | 12 | $581 | $599 |
| Reinvestment of distributions | - | 18 | - | 888 |
| Shares redeemed | (50) | (57) | (2,029) | (2,536) |
| Net increase (decrease) | (36) | (27) | $(1,448) | $(1,049) |
| International Discovery | | | | |
| Shares sold | 4,512 | 7,204 | $188,209 | $327,014 |
| Reinvestment of distributions | 286 | 9,116 | 11,602 | 469,882 |
| Shares redeemed | (11,328) | (11,205) | (472,160) | (499,877) |
| Net increase (decrease) | (6,530) | 5,115 | $(272,349) | $297,019 |
| Class K | | | | |
| Shares sold | 1,401 | 2,511 | $58,356 | $114,979 |
| Reinvestment of distributions | 72 | 2,616 | 2,923 | 134,333 |
| Shares redeemed | (5,700) | (11,983) | (236,604) | (555,470) |
| Net increase (decrease) | (4,227) | (6,856) | $(175,325) | $(306,158) |
| Class I | | | | |
| Shares sold | 2,991 | 34,479 | $122,437 | $1,453,949 |
| Reinvestment of distributions | 9 | 298 | 373 | 15,297 |
| Shares redeemed | (4,177) | (30,537) | (170,989) | (1,266,702) |
| Net increase (decrease) | (1,177) | 4,240 | $(48,179) | $202,544 |
| Class Z | | | | |
| Shares sold | 576 | 3,672 | $24,069 | $187,806 |
| Reinvestment of distributions | 329 | 7,866 | 13,272 | 403,304 |
| Shares redeemed | (6,831) | (4,955) | (276,681) | (200,579) |
| Net increase (decrease) | (5,926) | 6,583 | $(239,340) | $390,531 |
11. Other.
A fund's organizational documents provide former and current trustees and officers with a limited indemnification against liabilities arising in connection with the performance of their duties to the fund. In the normal course of business, a fund may also enter into contracts that provide general indemnifications. A fund's maximum exposure under these arrangements is unknown as this would be dependent on future claims that may be made against a fund. The risk of material loss from such claims is considered remote.
At the end of the period, the following mutual funds managed by the investment adviser or its affiliates were the owners of record of 10% or more of the total outstanding shares.
| | Strategic Advisers Fidelity International Fund | Strategic Advisers International Fund |
| Fidelity International Discovery Fund | 26% | 10% |
Mutual funds managed by the investment adviser or its affiliates, in aggregate, were the owners of record of more than 20% of the total outstanding shares.
| Fund | % of shares held |
| Fidelity International Discovery Fund | 39% |
12. Risk and Uncertainties.
Many factors affect a fund's performance. Developments that disrupt global economies and financial markets, such as pandemics, epidemics, outbreaks of infectious diseases, war, terrorism, and environmental disasters, may significantly affect a fund's investment performance. The effects of these developments to a fund will be impacted by the types of securities in which a fund invests, the financial condition, industry, economic sector, and geographic location of an issuer, and a fund's level of investment in the securities of that issuer. Significant concentrations in security types, issuers, industries, sectors, and geographic locations may magnify the factors that affect a fund's performance.
To the Board of Trustees of Fidelity Investment Trust and Shareholders of Fidelity International Discovery Fund
Opinion on the Financial Statements
We have audited the accompanying statement of assets and liabilities, including the schedule of investments, of Fidelity International Discovery Fund (one of the funds constituting Fidelity Investment Trust, referred to hereafter as the "Fund") as of October 31, 2023, the related statement of operations for the year ended October 31, 2023, the statement of changes in net assets for each of the two years in the period ended October 31, 2023, including the related notes, and the financial highlights for each of the five years in the period ended October 31, 2023 (collectively referred to as the "financial statements"). In our opinion, the financial statements present fairly, in all material respects, the financial position of the Fund as of October 31, 2023, the results of its operations for the year then ended, the changes in its net assets for each of the two years in the period ended October 31, 2023 and the financial highlights for each of the five years in the period ended October 31, 2023 in conformity with accounting principles generally accepted in the United States of America.
Basis for Opinion
These financial statements are the responsibility of the Fund's management. Our responsibility is to express an opinion on the Fund's financial statements based on our audits. We are a public accounting firm registered with the Public Company Accounting Oversight Board (United States) (PCAOB) and are required to be independent with respect to the Fund in accordance with the U.S. federal securities laws and the applicable rules and regulations of the Securities and Exchange Commission and the PCAOB.
We conducted our audits of these financial statements in accordance with the standards of the PCAOB. Those standards require that we plan and perform the audit to obtain reasonable assurance about whether the financial statements are free of material misstatement, whether due to error or fraud.
Our audits included performing procedures to assess the risks of material misstatement of the financial statements, whether due to error or fraud, and performing procedures that respond to those risks. Such procedures included examining, on a test basis, evidence regarding the amounts and disclosures in the financial statements. Our audits also included evaluating the accounting principles used and significant estimates made by management, as well as evaluating the overall presentation of the financial statements. Our procedures included confirmation of securities owned as of October 31, 2023 by correspondence with the custodian, issuers of privately offered securities and brokers; when replies were not received from brokers, we performed other auditing procedures. We believe that our audits provide a reasonable basis for our opinion.
/s/ PricewaterhouseCoopers LLP
Boston, Massachusetts
December 14, 2023
We have served as the auditor of one or more investment companies in the Fidelity group of funds since 1932.
The Trustees, Members of the Advisory Board (if any), and officers of the trust and fund, as applicable, are listed below. The Board of Trustees governs the fund and is responsible for protecting the interests of shareholders. The Trustees are experienced executives who meet periodically throughout the year to oversee the fund's activities, review contractual arrangements with companies that provide services to the fund, oversee management of the risks associated with such activities and contractual arrangements, and review the fund's performance. Except for Jonathan Chiel, each of the Trustees oversees 322 funds. Mr. Chiel oversees 191 funds.
The Trustees hold office without limit in time except that (a) any Trustee may resign; (b) any Trustee may be removed by written instrument, signed by at least two-thirds of the number of Trustees prior to such removal; (c) any Trustee who requests to be retired or who has become incapacitated by illness or injury may be retired by written instrument signed by a majority of the other Trustees; and (d) any Trustee may be removed at any special meeting of shareholders by a two-thirds vote of the outstanding voting securities of the trust. Each Trustee who is not an interested person (as defined in the 1940 Act) of the trust and the fund is referred to herein as an Independent Trustee. Each Independent Trustee shall retire not later than the last day of the calendar year in which his or her 75th birthday occurs. The Independent Trustees may waive this mandatory retirement age policy with respect to individual Trustees. Officers and Advisory Board Members hold office without limit in time, except that any officer or Advisory Board Member may resign or may be removed by a vote of a majority of the Trustees at any regular meeting or any special meeting of the Trustees. Except as indicated, each individual has held the office shown or other offices in the same company for the past five years.
The fund's Statement of Additional Information (SAI) includes more information about the Trustees. To request a free copy, call Fidelity at 1-800-544-8544 if you're an individual investing directly with Fidelity, call 1-800-835-5092 if you're a plan sponsor or participant with Fidelity as your recordkeeper or call 1-877-208-0098 on institutional accounts or if you're an advisor or invest through one.
Experience, Skills, Attributes, and Qualifications of the Trustees. The Governance and Nominating Committee has adopted a statement of policy that describes the experience, qualifications, attributes, and skills that are necessary and desirable for potential Independent Trustee candidates (Statement of Policy). The Board believes that each Trustee satisfied at the time he or she was initially elected or appointed a Trustee, and continues to satisfy, the standards contemplated by the Statement of Policy. The Governance and Nominating Committee also engages professional search firms to help identify potential Independent Trustee candidates who have the experience, qualifications, attributes, and skills consistent with the Statement of Policy. From time to time, additional criteria based on the composition and skills of the current Independent Trustees, as well as experience or skills that may be appropriate in light of future changes to board composition, business conditions, and regulatory or other developments, have also been considered by the professional search firms and the Governance and Nominating Committee. In addition, the Board takes into account the Trustees' commitment and participation in Board and committee meetings, as well as their leadership of standing and ad hoc committees throughout their tenure.
In determining that a particular Trustee was and continues to be qualified to serve as a Trustee, the Board has considered a variety of criteria, none of which, in isolation, was controlling. The Board believes that, collectively, the Trustees have balanced and diverse experience, qualifications, attributes, and skills, which allow the Board to operate effectively in governing the fund and protecting the interests of shareholders. Information about the specific experience, skills, attributes, and qualifications of each Trustee, which in each case led to the Board's conclusion that the Trustee should serve (or continue to serve) as a trustee of the fund, is provided below.
Board Structure and Oversight Function. Robert A. Lawrence is an interested person and currently serves as Chair. The Trustees have determined that an interested Chair is appropriate and benefits shareholders because an interested Chair has a personal and professional stake in the quality and continuity of services provided to the fund. Independent Trustees exercise their informed business judgment to appoint an individual of their choosing to serve as Chair, regardless of whether the Trustee happens to be independent or a member of management. The Independent Trustees have determined that they can act independently and effectively without having an Independent Trustee serve as Chair and that a key structural component for assuring that they are in a position to do so is for the Independent Trustees to constitute a substantial majority for the Board. The Independent Trustees also regularly meet in executive session. David M. Thomas serves as Lead Independent Trustee and as such (i) acts as a liaison between the Independent Trustees and management with respect to matters important to the Independent Trustees and (ii) with management prepares agendas for Board meetings.
Fidelity® funds are overseen by different Boards of Trustees. The fund's Board oversees Fidelity's high income and certain equity funds, and other Boards oversee Fidelity's alternative investment, investment-grade bond, money market, asset allocation, and other equity funds. The asset allocation funds may invest in Fidelity® funds overseen by the fund's Board. The use of separate Boards, each with its own committee structure, allows the Trustees of each group of Fidelity® funds to focus on the unique issues of the funds they oversee, including common research, investment, and operational issues. On occasion, the separate Boards establish joint committees to address issues of overlapping consequences for the Fidelity® funds overseen by each Board.
The Trustees operate using a system of committees to facilitate the timely and efficient consideration of all matters of importance to the Trustees, the fund, and fund shareholders and to facilitate compliance with legal and regulatory requirements and oversight of the fund's activities and associated risks. The Board, acting through its committees, has charged FMR and its affiliates with (i) identifying events or circumstances the occurrence of which could have demonstrably adverse effects on the fund's business and/or reputation; (ii) implementing processes and controls to lessen the possibility that such events or circumstances occur or to mitigate the effects of such events or circumstances if they do occur; and (iii) creating and maintaining a system designed to evaluate continuously business and market conditions in order to facilitate the identification and implementation processes described in (i) and (ii) above. Because the day-to-day operations and activities of the fund are carried out by or through FMR, its affiliates, and other service providers, the fund's exposure to risks is mitigated but not eliminated by the processes overseen by the Trustees. While each of the Board's committees has responsibility for overseeing different aspects of the fund's activities, oversight is exercised primarily through the Operations, Audit, and Compliance Committees. Appropriate personnel, including but not limited to the fund's Chief Compliance Officer (CCO), FMR's internal auditor, the independent accountants, the fund's Treasurer and portfolio management personnel, make periodic reports to the Board's committees, as appropriate, including an annual review of Fidelity's risk management program for the Fidelity® funds. The responsibilities of each standing committee, including their oversight responsibilities, are described further under "Standing Committees of the Trustees."
Interested Trustees*:
Correspondence intended for a Trustee who is an interested person may be sent to Fidelity Investments, 245 Summer Street, Boston, Massachusetts 02210.
Name, Year of Birth; Principal Occupations and Other Relevant Experience+
Jonathan Chiel (1957)
Year of Election or Appointment: 2016
Trustee
Mr. Chiel also serves as Trustee of other Fidelity® funds. Mr. Chiel is General Counsel (2012-present) and Head of Legal, Risk and Compliance (2022-present). Mr Chiel serves as Executive Vice President and General Counsel for FMR LLC (diversified financial services company, 2012-present) and Director and President for OH Company LLC (holding company, 2018-present). Previously, Mr. Chiel served as general counsel (2004-2012) and senior vice president and deputy general counsel (2000-2004) for John Hancock Financial Services; a partner with Choate, Hall & Stewart (1996-2000) (law firm); and an Assistant United States Attorney for the United States Attorney's Office of the District of Massachusetts (1986-95), including Chief of the Criminal Division (1993-1995). Mr. Chiel is a director on the boards of the Boston Bar Foundation and the Maimonides School.
Bettina Doulton (1964)
Year of Election or Appointment: 2021
Trustee
Ms. Doulton also serves as Trustee of other Fidelity® funds. Prior to her retirement, Ms. Doulton served in a variety of positions at Fidelity Investments, including as a managing director of research (2006-2007), portfolio manager to certain Fidelity® funds (1993-2005), equity analyst and portfolio assistant (1990-1993), and research assistant (1987-1990). Ms. Doulton currently owns and operates Phi Builders + Architects and Cellardoor Winery. Previously, Ms. Doulton served as a member of the Board of Brown Capital Management, LLC (2014-2018).
Robert A. Lawrence (1952)
Year of Election or Appointment: 2020
Trustee
Chair of the Board of Trustees
Mr. Lawrence also serves as Trustee of other funds. Previously, Mr. Lawrence served as a Trustee and Member of the Advisory Board of certain funds. Prior to his retirement in 2008, Mr. Lawrence served as Vice President of certain Fidelity® funds (2006-2008), Senior Vice President, Head of High Income Division of Fidelity Management & Research Company (investment adviser firm, 2006-2008), and President of Fidelity Strategic Investments (investment adviser firm, 2002-2005).
* Determined to be an "Interested Trustee" by virtue of, among other things, his or her affiliation with the trust or various entities under common control with FMR.
+ The information includes the Trustee's principal occupation during the last five years and other information relating to the experience, attributes, and skills relevant to the Trustee's qualifications to serve as a Trustee, which led to the conclusion that the Trustee should serve as a Trustee for the fund.
Independent Trustees:
Correspondence intended for an Independent Trustee may be sent to Fidelity Investments, P.O. Box 55235, Boston, Massachusetts 02205-5235.
Name, Year of Birth; Principal Occupations and Other Relevant Experience+
Thomas P. Bostick (1956)
Year of Election or Appointment: 2021
Trustee
Lieutenant General Bostick also serves as Trustee of other Fidelity® funds. Prior to his retirement, General Bostick (United States Army, Retired) held a variety of positions within the U.S. Army, including Commanding General and Chief of Engineers, U.S. Army Corps of Engineers (2012-2016) and Deputy Chief of Staff and Director of Human Resources, U.S. Army (2009-2012). General Bostick currently serves as a member of the Board and Finance and Governance & Sustainability Committees of CSX Corporation (transportation, 2020-present) and a member of the Board and Corporate Governance and Nominating Committee of Perma-Fix Environmental Services, Inc. (nuclear waste management, 2020-present). General Bostick serves as Chief Executive Officer of Bostick Global Strategies, LLC (consulting, 2016-present), as a member of the Board of HireVue, Inc. (video interview and assessment, 2020-present), as a member of the Board of Allonnia (biotechnology and engineering solutions, 2022-present) and on the Advisory Board of Solugen, Inc. (specialty bio-based chemicals manufacturer, 2022-present). Previously, General Bostick served as a Member of the Advisory Board of certain Fidelity® funds (2021), President, Intrexon Bioengineering (2018-2020) and Chief Operating Officer (2017-2020) and Senior Vice President of the Environment Sector (2016-2017) of Intrexon Corporation (biopharmaceutical company).
Dennis J. Dirks (1948)
Year of Election or Appointment: 2005
Trustee
Mr. Dirks also serves as Trustee of other Fidelity® funds. Prior to his retirement in May 2003, Mr. Dirks served as Chief Operating Officer and as a member of the Board of The Depository Trust & Clearing Corporation (financial markets infrastructure), President, Chief Operating Officer and a member of the Board of The Depository Trust Company (DTC), President and a member of the Board of the National Securities Clearing Corporation (NSCC), Chief Executive Officer and a member of the Board of the Government Securities Clearing Corporation and Chief Executive Officer and a member of the Board of the Mortgage-Backed Securities Clearing Corporation. Mr. Dirks currently serves as a member of the Finance Committee (2016-present) and Board (2017-present) and is Treasurer (2018-present) of the Asolo Repertory Theatre.
Donald F. Donahue (1950)
Year of Election or Appointment: 2018
Trustee
Mr. Donahue also serves as Trustee of other Fidelity® funds. Mr. Donahue serves as President and Chief Executive Officer of Miranda Partners, LLC (risk consulting for the financial services industry, 2012-present). Previously, Mr. Donahue served as Chief Executive Officer (2006-2012), Chief Operating Officer (2003-2006) and Managing Director, Customer Marketing and Development (1999-2003) of The Depository Trust & Clearing Corporation (financial markets infrastructure). Mr. Donahue currently serves as a member (2007-present) and Co-Chairman (2016-present) of the Board of United Way of New York. Mr. Donahue previously served as a member of the Advisory Board of certain Fidelity® funds (2015-2018) and as a member of the Board of The Leadership Academy (previously NYC Leadership Academy) (2012-2022).
Vicki L. Fuller (1957)
Year of Election or Appointment: 2020
Trustee
Ms. Fuller also serves as Trustee of other Fidelity® funds. Previously, Ms. Fuller served as a member of the Advisory Board of certain Fidelity® funds (2018-2020), Chief Investment Officer of the New York State Common Retirement Fund (2012-2018) and held a variety of positions at AllianceBernstein L.P. (global asset management, 1985-2012), including Managing Director (2006-2012) and Senior Vice President and Senior Portfolio Manager (2001-2006). Ms. Fuller currently serves as a member of the Board, Audit Committee and Nominating and Governance Committee of two Blackstone business development companies (2020-present), as a member of the Board of Treliant, LLC (consulting, 2019-present), as a member of the Board of Ariel Alternatives, LLC (private equity, 2022-present) and as a member of the Board and Chair of the Audit Committee of Gusto, Inc. (software, 2021-present). In addition, Ms. Fuller currently serves as a member of the Board of Roosevelt University (2019-present) and as a member of the Executive Board of New York University's Stern School of Business. Ms. Fuller previously served as a member of the Board, Audit Committee and Nominating and Governance Committee of The Williams Companies, Inc. (natural gas infrastructure, 2018-2021).
Patricia L. Kampling (1959)
Year of Election or Appointment: 2020
Trustee
Ms. Kampling also serves as Trustee of other Fidelity® funds. Prior to her retirement, Ms. Kampling served as Chairman of the Board and Chief Executive Officer (2012-2019), President and Chief Operating Officer (2011-2012) and Executive Vice President and Chief Financial Officer (2010-2011) of Alliant Energy Corporation. Ms. Kampling currently serves as a member of the Board, Finance Committee and Governance, Compensation and Nominating Committee of Xcel Energy Inc. (utilities company, 2020-present) and as a member of the Board, Audit, Finance and Risk Committee and Safety, Environmental, Technology and Operations Committee and Chair of the Executive Development and Compensation Committee of American Water Works Company, Inc. (utilities company, 2019-present). In addition, Ms. Kampling currently serves as a member of the Board of the Nature Conservancy, Wisconsin Chapter (2019-present). Previously, Ms. Kampling served as a Member of the Advisory Board of certain Fidelity® funds (2020), a member of the Board, Compensation Committee and Executive Committee and Chair of the Audit Committee of Briggs & Stratton Corporation (manufacturing, 2011-2021), a member of the Board of Interstate Power and Light Company (2012-2019) and Wisconsin Power and Light Company (2012-2019) (each a subsidiary of Alliant Energy Corporation) and as a member of the Board and Workforce Development Committee of the Business Roundtable (2018-2019).
Thomas A. Kennedy (1955)
Year of Election or Appointment: 2021
Trustee
Mr. Kennedy also serves as Trustee of other Fidelity® funds. Previously, Mr. Kennedy served as a Member of the Advisory Board of certain Fidelity® funds (2020) and held a variety of positions at Raytheon Company (aerospace and defense, 1983-2020), including Chairman and Chief Executive Officer (2014-2020) and Executive Vice President and Chief Operating Officer (2013-2014). Mr. Kennedy served as Executive Chairman of the Board of Directors of Raytheon Technologies Corporation (aerospace and defense, 2020-2021). Mr. Kennedy serves as a Director of the Board of Directors of Textron Inc. (aerospace and defense, 2023-present).
Oscar Munoz (1959)
Year of Election or Appointment: 2021
Trustee
Mr. Munoz also serves as Trustee of other Fidelity® funds. Prior to his retirement, Mr. Munoz served as Executive Chairman (2020-2021), Chief Executive Officer (2015-2020), President (2015-2016) and a member of the Board (2010-2021) of United Airlines Holdings, Inc. Mr. Munoz currently serves as a member of the Board of CBRE Group, Inc. (commercial real estate, 2020-present), a member of the Board of Univision Communications, Inc. (Hispanic media, 2020-present), a member of the Board of Archer Aviation Inc. (2021-present), a member of the Defense Business Board of the United States Department of Defense (2021-present) and a member of the Board of Salesforce.com, Inc. (cloud-based software, 2022-present). Previously, Mr. Munoz served as a Member of the Advisory Board of certain Fidelity® funds (2021).
David M. Thomas (1949)
Year of Election or Appointment: 2008
Trustee
Lead Independent Trustee
Mr. Thomas also serves as Trustee of other Fidelity® funds. Previously, Mr. Thomas served as Executive Chairman (2005-2006) and Chairman and Chief Executive Officer (2000-2005) of IMS Health, Inc. (pharmaceutical and healthcare information solutions). Mr. Thomas currently serves as a member of the Board of Fortune Brands Home and Security (home and security products, 2004-present) and as Director (2013-present) and Non-Executive Chairman of the Board (2022-present) of Interpublic Group of Companies, Inc. (marketing communication).
Susan Tomasky (1953)
Year of Election or Appointment: 2020
Trustee
Ms. Tomasky also serves as Trustee of other Fidelity® funds. Prior to her retirement, Ms. Tomasky served in various executive officer positions at American Electric Power Company, Inc. (1998-2011), including most recently as President of AEP Transmission (2007-2011). Ms. Tomasky currently serves as a member of the Board and Sustainability Committee and as Chair of the Audit Committee of Marathon Petroleum Corporation (2018-present) and as a member of the Board, Executive Committee, Corporate Governance Committee and Organization and Compensation Committee and as Lead Director of the Board of Public Service Enterprise Group, Inc. (utilities company, 2012-present) and as a member of the Board of its subsidiary company, Public Service Electric and Gas Co. (2021-present). In addition, Ms. Tomasky currently serves as a member (2009-present) and President (2020-present) of the Board of the Royal Shakespeare Company - America (2009-present), as a member of the Board of the Columbus Association for the Performing Arts (2011-present) and as a member of the Board and Kenyon in the World Committee of Kenyon College (2016-present). Previously, Ms. Tomasky served as a Member of the Advisory Board of certain Fidelity® funds (2020), as a member of the Board of the Columbus Regional Airport Authority (2007-2020), as a member of the Board (2011-2018) and Lead Independent Director (2015-2018) of Andeavor Corporation (previously Tesoro Corporation) (independent oil refiner and marketer) and as a member of the Board of Summit Midstream Partners LP (energy, 2012-2018).
Michael E. Wiley (1950)
Year of Election or Appointment: 2020
Trustee
Mr. Wiley also serves as Trustee of other Fidelity® funds. Previously, Mr. Wiley served as a member of the Advisory Board of certain Fidelity® funds (2018-2020), Chairman, President and CEO of Baker Hughes, Inc. (oilfield services, 2000-2004). Mr. Wiley also previously served as a member of the Board of Andeavor Corporation (independent oil refiner and marketer, 2005-2018), a member of the Board of Andeavor Logistics LP (natural resources logistics, 2015-2018) and a member of the Board of High Point Resources (exploration and production, 2005-2020).
+ The information includes the Trustee's principal occupation during the last five years and other information relating to the experience, attributes, and skills relevant to the Trustee's qualifications to serve as a Trustee, which led to the conclusion that the Trustee should serve as a Trustee for the fund.
Advisory Board Members and Officers:
Correspondence intended for a Member of the Advisory Board (if any) may be sent to Fidelity Investments, P.O. Box 55235, Boston, Massachusetts 02205-5235. Correspondence intended for an officer or Peter S. Lynch may be sent to Fidelity Investments, 245 Summer Street, Boston, Massachusetts 02210.
Name, Year of Birth; Principal Occupation
Vijay C. Advani (1960)
Year of Election or Appointment: 2023
Member of the Advisory Board
Mr. Advani also serves as Trustee or Member of the Advisory Board of other funds. Previously, Mr. Advani served as Executive Chairman (2020-2022), Chief Executive Officer (2017-2020) and Chief Operating Officer (2016-2017) of Nuveen (global investment manager). He also served in various capacities at Franklin Resources (global investment manager), including Co-President (2015-2016), Executive Vice President, Global Advisory Services (2008-2015), Head of Global Retail Distribution (2005-2008), Executive Managing Director, International Retail Development (2002-2005), Managing Director, Product Developments, Sales & Marketing, Asia, Eastern Europe and Africa (2000-2002) and President, Templeton Asset Management India (1995-2000). Mr. Advani also served as Senior Investment Officer of International Finance Corporation (private equity and venture capital arm of The World Bank, 1984-1995). Mr. Advani is Chairman Emeritus of the U.S. India Business Council (2018-present), a Director of The Global Impact Investing Network (2019-present), a Director of LOK Capital (Mauritius) (2022-present), a member of the Advisory Council of LOK Capital (2022-present), a Senior Advisor of Neuberger Berman (2021-present), a Senior Advisor of Seviora Holdings Pte. Ltd (Temasek-Singapore) (2021-present), a Director of Seviora Capital (Singapore) (2021-present) and an Advisor of EQUIAM (2021-present). Mr. Advani formerly served as a member of the Board of BowX Acquisition Corp. (special purpose acquisition company, 2020-2021), a member of the Board of Intellecap (advisory arm of The Aavishkaar Group, 2018-2020), a member of the Board of Nuveen Investments, Inc. (2017-2020) and a member of the Board of Docusign (software, 2016-2019).
Peter S. Lynch (1944)
Year of Election or Appointment: 2003
Member of the Advisory Board
Mr. Lynch also serves as a Member of the Advisory Board of other Fidelity® funds. Mr. Lynch is Vice Chairman and a Director of Fidelity Management & Research Company LLC (investment adviser firm). In addition, Mr. Lynch serves as a Trustee of Boston College and as the Chairman of the Inner-City Scholarship Fund. Previously, Mr. Lynch served as Vice Chairman and a Director of FMR Co., Inc. (investment adviser firm) and on the Special Olympics International Board of Directors (1997-2006).
Karen B. Peetz (1955)
Year of Election or Appointment: 2023
Member of the Advisory Board
Ms. Peetz also serves as a Member of the Advisory Board of other funds. Previously, Ms. Peetz served as Chief Administration Officer (2020-2023) of Citigroup Inc. (a diversified financial service company). She also served in various capacities at Bank of New York Mellon Corporation, including President (2013-2016), Vice Chairman, Senior Executive Vice President and Chief Executive Officer of Financial Markets & Treasury Services (2010-2013), Senior Executive Vice President and Chief Executive Officer of Global Corporate Trust (2003-2008), Senior Vice President and Division Manager of Global Payments & Trade Services (2002-2003) and Senior Vice President and Division Manager of Domestic Corporate Trust (1998-2002). Ms. Peetz also served in various capacities at Chase Manhattan Corporation (1982-1998), including Senior Vice President and Manager of Corporate Trust International Business (1996-1998), Managing Director and Manager of Corporate Trust Services (1994-1996) and Managing Director and Group Manager of Financial Institution Sales (1990-1993). Ms. Peetz currently serves as Chair of Amherst Holdings Advisory Council (2018-present), Trustee of Johns Hopkins University (2016-present), Chair of the Carey Business School Advisory Council, Member of the Johns Hopkins Medicine Board and Finance Committee and Chair of the Lyme and Tick Related Disease Institute Advisory Council. Ms. Peetz previously served as a member of the Board of Guardian Life Insurance Company of America (2019-2023), a member of the Board of Trane Technologies (2018-2022), a member of the Board of Wells Fargo Corp. (2017-2019), a member of the Board of SunCoke Energy Inc. (2012-2016), a member of the Board of Private Export Funding Corporation (2010-2016) and as a Trustee of Penn State University (2010-2014) and the United Way of New York City (2008-2010).
Heather Bonner (1977)
Year of Election or Appointment: 2023
Assistant Treasurer
Ms. Bonner also serves as an officer of other funds. Ms. Bonner is a Senior Vice President (2022-present) and is an employee of Fidelity Investments (2022-present). Ms. Bonner serves as Vice President, Treasurer, or Assistant Treasurer of certain Fidelity entities. Prior to joining Fidelity, Ms. Bonner served as Managing Director at AQR Capital Management (2013-2022) and was the Treasurer and Principal Financial Officer of the AQR Funds (2013-2022).
Craig S. Brown (1977)
Year of Election or Appointment: 2022
Deputy Treasurer
Mr. Brown also serves as an officer of other funds. Mr. Brown is a Vice President (2015-present) and is an employee of Fidelity Investments. Mr. Brown serves as Assistant Treasurer of FIMM, LLC (2021-present). Previously, Mr. Brown served as Assistant Treasurer of certain Fidelity® funds (2019-2022).
John J. Burke III (1964)
Year of Election or Appointment: 2018
Chief Financial Officer
Mr. Burke also serves as Chief Financial Officer of other funds. Mr. Burke is Head of Fidelity Fund and Investment Operations (2018-present) and is an employee of Fidelity Investments. Mr. Burke serves as President, Executive Vice President, or Director of certain Fidelity entities. Previously Mr. Burke served as head of Asset Management Investment Operations (2012-2018).
Margaret Carey (1973)
Year of Election or Appointment: 2023
Secretary and Chief Legal Officer (CLO)
Ms. Carey also serves as an officer of other funds and as CLO of certain Fidelity entities. Ms. Carey is a Senior Vice President, Deputy General Counsel (2019-present) and is an employee of Fidelity Investments.
William C. Coffey (1969)
Year of Election or Appointment: 2019
Assistant Secretary
Mr. Coffey also serves as Assistant Secretary of other funds. Mr. Coffey is a Senior Vice President, Deputy General Counsel (2010-present) and is an employee of Fidelity Investments. Previously, Mr. Coffey served as Secretary and CLO of certain funds (2018-2019); CLO, Secretary, or Senior Vice President of certain Fidelity entities and Assistant Secretary of certain funds (2009-2018).
Timothy M. Cohen (1969)
Year of Election or Appointment: 2018
Vice President
Mr. Cohen also serves as Vice President of other funds. Mr. Cohen is Co-Head of Equity (2018-present) and is an employee of Fidelity Investments. Mr. Cohen serves a Director of Fidelity Management & Research (Japan) Limited (investment adviser firm, 2016-present). Previously, Mr. Cohen served as Executive Vice President of Fidelity SelectCo, LLC (2019) and Head of Global Equity Research (2016-2018).
Jonathan Davis (1968)
Year of Election or Appointment: 2010
Assistant Treasurer
Mr. Davis also serves as an officer of other funds. Mr. Davis is a Vice President (2006-present) and is an employee of Fidelity Investments. Mr. Davis serves as Assistant Treasurer of certain Fidelity entities.
Laura M. Del Prato (1964)
Year of Election or Appointment: 2018
Assistant Treasurer
Ms. Del Prato also serves as an officer of other funds. Ms. Del Prato is a Senior Vice President (2017-present) and is an employee of Fidelity Investments. Ms. Del Prato serves as Vice President or Assistant Treasurer of certain Fidelity entities. Previously, Ms. Del Prato served as President and Treasurer of The North Carolina Capital Management Trust: Cash Portfolio and Term Portfolio (2018-2020).
Colm A. Hogan (1973)
Year of Election or Appointment: 2020
Assistant Treasurer
Mr. Hogan also serves as an officer of other funds. Mr. Hogan is a Vice President (2016-present) and is an employee of Fidelity Investments. Mr. Hogan serves as Assistant Treasurer of certain Fidelity entities. Previously, Mr. Hogan served as Deputy Treasurer of certain Fidelity® funds (2016-2020) and Assistant Treasurer of certain Fidelity® funds (2016-2018).
Pamela R. Holding (1964)
Year of Election or Appointment: 2018
Vice President
Ms. Holding also serves as Vice President of other funds. Ms. Holding is Co-Head of Equity (2018-present) and is an employee of Fidelity Investments. Previously, Ms. Holding served as Executive Vice President of Fidelity SelectCo, LLC (2019) and as Chief Investment Officer of Fidelity Institutional Asset Management (2013-2018).
Chris Maher (1972)
Year of Election or Appointment: 2020
Deputy Treasurer
Mr. Maher also serves as an officer of other funds. Mr. Maher is a Vice President (2008-present) and is an employee of Fidelity Investments. Mr. Maher serves as Assistant Treasurer of certain Fidelity entities. Previously, Mr. Maher served as Assistant Treasurer of certain funds (2013-2020).
Jason P. Pogorelec (1975)
Year of Election or Appointment: 2020
Chief Compliance Officer
Mr. Pogorelec also serves as Chief Compliance Officer of other funds. Mr. Pogorelec is a Senior Vice President of Asset Management Compliance (2020-present) and is an employee of Fidelity Investments. Mr. Pogorelec serves as Compliance Officer of Fidelity Management & Research Company LLC (investment adviser firm, 2023-present) and Ballyrock Investment Advisors LLC (2023-present). Previously, Mr. Pogorelec served as a Vice President, Associate General Counsel for Fidelity Investments (2010-2020) and Assistant Secretary of certain Fidelity® funds (2015-2020).
Brett Segaloff (1972)
Year of Election or Appointment: 2021
Anti-Money Laundering (AML) Officer
Mr. Segaloff also serves as AML Officer of other funds. Mr. Segaloff is a Vice President (2022-present) and is an employee of Fidelity Investments. Mr. Segaloff serves as Anti Money Laundering Compliance Officer or Anti Money Laundering/Bank Secrecy Act Compliance Officer of certain Fidelity entities.
Stacie M. Smith (1974)
Year of Election or Appointment: 2016
President and Treasurer
Ms. Smith also serves as an officer of other funds. Ms. Smith is a Senior Vice President (2016-present) and is an employee of Fidelity Investments. Ms. Smith serves as Assistant Treasurer of certain Fidelity entities and has served in other fund officer roles.
Jim Wegmann (1979)
Year of Election or Appointment: 2019
Assistant Treasurer
Mr. Wegmann also serves as an officer of other funds. Mr. Wegmann is a Vice President (2016-present) and is an employee of Fidelity Investments. Mr. Wegmann serves as Assistant Treasurer of FIMM, LLC (2021-present). Previously, Mr. Wegmann served as Assistant Treasurer of certain Fidelity® funds (2019-2021).
As a shareholder, you incur two types of costs: (1) transaction costs, which may include sales charges (loads) on purchase payments or redemption proceeds, as applicable and (2) ongoing costs, which generally include management fees, distribution and/or service (12b-1) fees and other Fund expenses. This Example is intended to help you understand your ongoing costs (in dollars) of investing in a fund and to compare these costs with the ongoing costs of investing in other mutual funds.
| The Example is based on an investment of $1,000 invested at the beginning of the period and held for the entire period (May 1, 2023 to October 31, 2023). |
Actual Expenses
The first line of the accompanying table provides information about actual account values and actual expenses. You may use the information in this line, together with the amount you invested, to estimate the expenses that you paid over the period. Simply divide your account value by $1,000.00 (for example, an $8,600 account value divided by $1,000.00 = 8.6), then multiply the result by the number in the first line for a class/Fund under the heading entitled "Expenses Paid During Period" to estimate the expenses you paid on your account during this period. If any fund is a shareholder of any underlying mutual funds or exchange-traded funds (ETFs) (the Underlying Funds), such fund indirectly bears its proportional share of the expenses of the Underlying Funds in addition to the direct expenses incurred presented in the table. These fees and expenses are not included in the annualized expense ratio used to calculate the expense estimate in the table below.
Hypothetical Example for Comparison Purposes
The second line of the accompanying table provides information about hypothetical account values and hypothetical expenses based on the actual expense ratio and an assumed rate of return of 5% per year before expenses, which is not the actual return. The hypothetical account values and expenses may not be used to estimate the actual ending account balance or expenses you paid for the period. You may use this information to compare the ongoing costs of investing in the Fund and other funds. To do so, compare this 5% hypothetical example with the 5% hypothetical examples that appear in the shareholder reports of the other funds. If any fund is a shareholder of any Underlying Funds, such fund indirectly bears its proportional share of the expenses of the Underlying Funds in addition to the direct expenses as presented in the table. These fees and expenses are not included in the annualized expense ratio used to calculate the expense estimate in the table below.
Please note that the expenses shown in the table are meant to highlight your ongoing costs only and do not reflect any transaction costs. Therefore, the second line of the table is useful in comparing ongoing costs only, and will not help you determine the relative total costs of owning different funds. In addition, if these transactional costs were included, your costs would have been higher.
| | | | | Annualized Expense Ratio- A | | Beginning Account Value May 1, 2023 | | Ending Account Value October 31, 2023 | | Expenses Paid During Period- C May 1, 2023 to October 31, 2023 |
| Fidelity® International Discovery Fund | | | | | | | | | | |
| Class A | | | | .92% | | | | | | |
| Actual | | | | | | $ 1,000 | | $ 914.00 | | $ 4.44 |
Hypothetical-B | | | | | | $ 1,000 | | $ 1,020.57 | | $ 4.69 |
| Class M | | | | 1.17% | | | | | | |
| Actual | | | | | | $ 1,000 | | $ 912.80 | | $ 5.64 |
Hypothetical-B | | | | | | $ 1,000 | | $ 1,019.31 | | $ 5.96 |
| Class C | | | | 1.68% | | | | | | |
| Actual | | | | | | $ 1,000 | | $ 910.30 | | $ 8.09 |
Hypothetical-B | | | | | | $ 1,000 | | $ 1,016.74 | | $ 8.54 |
| Fidelity® International Discovery Fund | | | | .58% | | | | | | |
| Actual | | | | | | $ 1,000 | | $ 915.60 | | $ 2.80 |
Hypothetical-B | | | | | | $ 1,000 | | $ 1,022.28 | | $ 2.96 |
| Class K | | | | .46% | | | | | | |
| Actual | | | | | | $ 1,000 | | $ 916.00 | | $ 2.22 |
Hypothetical-B | | | | | | $ 1,000 | | $ 1,022.89 | | $ 2.35 |
| Class I | | | | .60% | | | | | | |
| Actual | | | | | | $ 1,000 | | $ 915.30 | | $ 2.90 |
Hypothetical-B | | | | | | $ 1,000 | | $ 1,022.18 | | $ 3.06 |
| Class Z | | | | .48% | | | | | | |
| Actual | | | | | | $ 1,000 | | $ 915.90 | | $ 2.32 |
Hypothetical-B | | | | | | $ 1,000 | | $ 1,022.79 | | $ 2.45 |
| |
A Annualized expense ratio reflects expenses net of applicable fee waivers.
B 5% return per year before expenses
C Expenses are equal to the annualized expense ratio, multiplied by the average account value over the period, multiplied by 184/ 365 (to reflect the one-half year period). The fees and expenses of any Underlying Funds are not included in each annualized expense ratio.
The dividend and capital gains distributions for the fund(s) are available on Fidelity.com or Institutional.Fidelity.com.
International Discovery, Class K, Class I, and Class Z designate 100% of the dividends distributed during the fiscal year as amounts which may be taken into account as a dividend for purposes of the maximum rate under section 1(h)(11) of the Internal Revenue Code.
The amounts per share which represent income derived from sources within, and taxes paid to, foreign countries or possessions of the United States are as follows:
| | Pay Date | Income | Taxes |
| Fidelity International Discovery Fund | | | |
| International Discovery | 12/12/2022 | $0.2456 | $0.1056 |
| Class K | 12/12/2022 | $0.2896 | $0.1056 |
| Class I | 12/12/2022 | $0.2446 | $0.1056 |
| Class Z | 12/12/2022 | $0.2916 | $0.1056 |
| | | | |
| | | | |
| | | | |
The fund will notify shareholders in January 2024 of amounts for use in preparing 2023 income tax returns.
Board Approval of Investment Advisory Contracts and Management Fees
Fidelity International Discovery Fund
Each year, the Board of Trustees, including the Independent Trustees (together, the Board), considers the renewal of the fund's management contract with Fidelity Management & Research Company LLC (FMR) and the sub-advisory agreements (together, the Advisory Contracts) for the fund. FMR and the sub-advisers are referred to herein as the Investment Advisers. The Board, assisted by the advice of fund counsel and Independent Trustees' counsel, requests and considers a broad range of information relevant to the renewal of the Advisory Contracts throughout the year.
The Board meets regularly and, at each of its meetings, covers an extensive agenda of topics and materials and considers factors that are relevant to its annual consideration of the renewal of the fund's Advisory Contracts, including the services and support provided to the fund and its shareholders. The Board, acting directly and through its Committees (each of which is composed of and chaired by Independent Trustees), requests and receives information concerning the annual consideration of the renewal of the fund's Advisory Contracts. The Board also meets as needed to review matters specifically related to the Board's annual consideration of the renewal of the Advisory Contracts. Members of the Board may also meet with trustees of other Fidelity funds through joint ad hoc committees to discuss certain matters relevant to all of the Fidelity funds.
Approval of Stub Period Continuation. At its May 2023 meeting, the Board of Trustees voted to continue the fund's management contract with FMR, and the sub-advisory agreements and sub-sub-advisory agreements, in each case, where applicable (together, the Advisory Contracts), without modification, for two months from June 1, 2023 through July 31, 2023. The Board considered that the approval of the fund's Advisory Contracts will not result in any changes in (i) the investment process or strategies employed in the management of the fund's assets; (ii) the fees and expenses paid by shareholders; (iii) the nature, extent or quality of services provided under the fund's Advisory Contracts; or (iv) the day-to-day management of the fund or the persons primarily responsible for such management. The Board also considered that since its last approval of the fund's Advisory Contracts, FMR had provided additional information on the fund in support of the annual contract renewal process, including competitive analyses on total expenses and management fees and in-depth reviews of fund performance and fund profitability information. The Board concluded that the fund's Advisory Contracts are fair and reasonable, and that the fund's Advisory Contracts should be renewed, without modification, through July 31, 2023, with the understanding that the Board would consider the annual renewal for a full one year period in July 2023.
At its July 2023 meeting, the Board unanimously determined to renew the fund's Advisory Contracts. In reaching its determination, the Board considered all factors it believed relevant, including (i) the nature, extent, and quality of the services provided to the fund and its shareholders (including the investment performance of the fund); (ii) the competitiveness relative to peer funds of the fund's management fee and the total expense ratio of a representative class (the retail class, which was selected because it was the largest class without 12b-1 fees); (iii) the total costs of the services provided by and the profits realized by FMR and its affiliates (Fidelity) from its relationships with the fund; and (iv) the extent to which, if any, economies of scale exist and are realized as the fund grows, and whether any economies of scale are appropriately shared with fund shareholders. The Board also considered the broad range of investment choices available to shareholders from FMR's competitors and that the fund's shareholders have chosen to invest in the fund, which is part of the Fidelity family of funds. The Board's decision to renew the Advisory Contracts was not based on any single factor.
The Board reached a determination, with the assistance of fund counsel and Independent Trustees' counsel and through the exercise of its business judgment, that the renewal of the Advisory Contracts was in the best interests of the fund and its shareholders and that the compensation payable under the Advisory Contracts was fair and reasonable in light of all of the surrounding circumstances.
Nature, Extent, and Quality of Services Provided. The Board considered staffing as it relates to the fund, including the backgrounds and experience of investment personnel of the Investment Advisers, and also considered the Investment Advisers' implementation of the fund's investment program. The Independent Trustees also had discussions with senior management of Fidelity's investment operations and investment groups. The Board considered the structure of the investment personnel compensation program and whether this structure provides appropriate incentives to act in the best interests of the fund. Additionally, the Board considered the portfolio managers' investments, if any, in the funds that they manage.
Resources Dedicated to Investment Management and Support Services. The Board and the Fund Oversight and Research Committees reviewed the general qualifications and capabilities of Fidelity's investment staff, including its size, education, experience, and resources, as well as Fidelity's approach to recruiting, training, managing, and compensating investment personnel. The Board noted the resources devoted to expansion of Fidelity's global investment organization, and that Fidelity's analysts have extensive resources, tools, and capabilities that allow them to conduct sophisticated quantitative and fundamental analysis, as well as credit analysis of issuers, counterparties, and guarantors. Further, the Board considered that Fidelity's investment professionals have sufficient access to global information and data so as to provide competitive investment results over time, and that those professionals also have access to sophisticated tools that permit them to assess portfolio construction and risk and performance attribution characteristics continuously, as well as to transmit new information and research conclusions rapidly around the world. Additionally, in its deliberations, the Board considered Fidelity's trading, risk management, compliance, and technology and operations capabilities and resources, which are integral parts of the investment management process.
Shareholder and Administrative Services. The Board considered (i) the nature, extent, quality, and cost of advisory, administrative, and shareholder services performed by the Investment Advisers and their affiliates under the Advisory Contracts and under separate agreements covering transfer agency, pricing and bookkeeping, and securities lending services for the fund; (ii) the nature and extent of Fidelity's supervision of third party service providers, principally custodians, subcustodians, and pricing vendors; and (iii) the resources devoted by Fidelity to, and the record of compliance with, the fund's compliance policies and procedures. The Board also reviewed the allocation of fund brokerage, including allocations to brokers affiliated with the Investment Advisers, the use of brokerage commissions to pay fund expenses, and the use of "soft" commission dollars to pay for research services. The Board also considered the fund's securities lending activities and any payments made to Fidelity relating to securities lending.
The Board noted that the growth of fund assets over time across the complex allows Fidelity to reinvest in the development of services designed to enhance the value and convenience of the Fidelity funds as investment vehicles. These services include 24-hour access to account information and market information over the Internet and through telephone representatives, investor education materials, and asset allocation tools. The Board also considered that it reviews customer service metrics such as telephone response times, continuity of services on the website and metrics addressing services at Fidelity Investor Centers.
Investment in a Large Fund Family. The Board considered the benefits to shareholders of investing in a fund that is part of a large family of funds offering a variety of investment disciplines and providing a large variety of fund investor services. The Board noted that Fidelity had taken, or had made recommendations that resulted in the Fidelity funds taking, a number of actions over the previous year that benefited particular funds and/or the Fidelity funds in general.
Investment Performance. The Board took into account discussions that occur with representatives of the Investment Advisers, and reports that it receives, at Board meetings throughout the year, relating to fund investment performance. In this regard the Board noted that as part of regularly scheduled fund reviews and other reports to the Board on fund performance, the Board considered annualized return information for the fund for different time periods, measured against an appropriate securities market index (benchmark index) and an appropriate peer group of funds with similar objectives (peer group). The Board also considered information about performance attribution. In its ongoing evaluation of fund investment performance, the Board gives particular attention to information indicating changes in performance of the funds over different time periods and discussed with the Investment Advisers the reasons for any overperformance or underperformance. The fund underperformed its benchmark and peers for the one- and three-year periods ended February 28, 2023, and as a result, the Board continues to engage in discussions with FMR about the steps it is taking to address the fund's performance.
In addition to reviewing absolute and relative fund performance, the Independent Trustees periodically consider the appropriateness of fund performance metrics in evaluating the results achieved. The Independent Trustees generally give greater weight to fund performance over longer time periods than over shorter time periods. Depending on the circumstances, the Independent Trustees may be satisfied with a fund's performance notwithstanding that it lags its benchmark index or peer group for certain periods.
Based on its review, the Board concluded that the nature, extent, and quality of services provided to the fund under the Advisory Contracts should continue to benefit the shareholders of the fund.
Competitiveness of Management Fee and Total Expense Ratio. The Board was provided with information regarding industry trends in management fees and expenses. In its review of the fund's management fee and the total expense ratio of the retail class, the Board considered the fund's management fee rate as well as other fund or class expenses, as applicable, such as transfer agent fees, pricing and bookkeeping fees, fund-paid 12b-1 fees, and custodial, legal, and audit fees. The Board noted that Fidelity may agree to waive fees or reimburse expenses from time to time, and the extent to which, if any, it has done so for the fund. The Board also considered information about the impact of the fund's performance adjustment.
Comparisons of Management Fees and Total Expense Ratios. Among other things, the Board reviewed data for selected groups of competitive funds and classes (referred to as "mapped groups") that were compiled by Fidelity based on combining similar investment objective categories (as classified by Lipper) that have comparable investment mandates. The data reviewed by the Board included (i) gross management fee comparisons (before taking into account expense reimbursements or caps and without taking into account the fund's performance adjustment) relative to the total universe of funds within the mapped group; (ii) gross management fee comparisons relative to a subset of non-Fidelity funds in the mapped group that are similar in size and management fee structure to the fund (referred to as the "asset size peer group"); (iii) total expense comparisons of the retail class of the fund relative to funds and classes in the mapped group that have a similar sales load structure to the retail class of the fund (referred to as the "similar sales load structure group"); and (iv) total expense comparisons of the retail class of the fund relative to funds and classes in the similar sales load structure group that are similar in size and management fee structure to the fund (referred to as the "total expense asset size peer group"). The total expense asset size peer group comparison excludes performance adjustments and fund-paid 12b-1 fees to eliminate variability in fee structures.
The information provided to the Board indicated that the fund's management fee rate ranked below the competitive median of the mapped group for the 12-month period ended September 30, 2022 and below the competitive median of the asset size peer group for the 12-month period ended September 30, 2022. Further, the information provided to the Board indicated that the total expense ratio of the retail class of the fund ranked below the competitive median of the similar sales load structure group for the 12-month period ended September 30, 2022 and above the competitive median of the total expense asset size peer group for the 12-month period ended September 30, 2022. The Board also noted that if funds in a fund complex with a unique at-cost service model were excluded from the total expense asset size peer group, the total expense ratio for the retail class was below the total expense asset size peer group for 2022.
The Board noted that the fund offers multiple classes, each of which has a different sales load and 12b-1 fee structure, and that the multiple structures are intended to offer a range of pricing options for the intermediary market. The Board also noted that the total expense ratios of the classes vary primarily by the level of their 12b-1 fees, although differences in transfer agent fees may also cause expenses to vary from class to class.
The Board also considered that, for funds subject to the group fee, FMR agreed to voluntarily waive fees over a specified period of time in amounts designed to account for assets converted from certain funds to certain collective investment trusts.
The Board also considered that the fund's management fee is subject to upward or downward adjustment depending upon whether, and to what extent, the fund's investment performance for the performance period (a rolling 36-month period) exceeds, or is exceeded by, a securities index, thus leading to a performance adjustment for the same period. The Board noted that the performance adjustment provides FMR with a strong economic incentive to seek to achieve superior long-term performance for the fund's shareholders and helps to more closely align the interests of FMR and the shareholders of the fund.
In connection with its consideration of the fund's performance adjustment, the Board noted that the performance of the retail class is used for purposes of determining the performance adjustment. The Board noted that to the extent the performance adjustment was based on the performance of a share class with higher total annual operating expenses, the fund would be subject to a smaller positive and larger negative performance adjustment. The Board considered the appropriateness of the use of the retail class as the basis for the performance adjustment. The Board noted that the retail class is typically the largest class (reflecting the actual investment experience for the plurality of shareholders), employs a standard expense structure, and does not include fund-paid 12b-1 fees, which Fidelity believes makes it a more appropriate measurement of Fidelity's investment skill.
Fees Charged to Other Fidelity Clients. The Board also considered Fidelity fee structures and other information with respect to clients of Fidelity, such as other funds advised or subadvised by Fidelity, pension plan clients, and other institutional clients with similar mandates. The Board noted that a joint ad hoc committee created by it and the boards of other Fidelity funds periodically reviews and compares Fidelity's institutional investment advisory business with its business of providing services to the Fidelity funds and also noted the most recent findings of the committee. The Board noted that the committee's review included a consideration of the differences in services provided, fees charged, and costs incurred, as well as competition in the markets serving the different categories of clients.
Based on its review, the Board concluded that the fund's management fee, including the use of the retail class as the basis for the performance adjustment, is fair and reasonable in light of the services that the fund receives and the other factors considered. Further, based on its review of total expense ratios and fees charged to other Fidelity clients, the Board concluded that the total expense ratio of each class of the fund was reasonable in light of the services that the fund and its shareholders receive and the other factors considered.
Costs of the Services and Profitability. The Board considered the revenues earned and the expenses incurred by Fidelity in conducting the business of developing, marketing, distributing, managing, administering and servicing the fund and servicing the fund's shareholders. The Board also considered the level of Fidelity's profits in respect of all the Fidelity funds.
On an annual basis, Fidelity presents to the Board information about the profitability of its relationships with the fund. Fidelity calculates profitability information for each fund, as well as aggregate profitability information for groups of Fidelity funds and all Fidelity funds, using a series of detailed revenue and cost allocation methodologies which originate with the books and records of Fidelity on which Fidelity's audited financial statements are based. The Audit Committee of the Board reviews any significant changes from the prior year's methodologies and the full Board approves such changes.
A public accounting firm has been engaged annually by the Board as part of the Board's assessment of Fidelity's profitability analysis. The engagement includes the review and assessment of the methodologies used by Fidelity in determining the revenues and expenses attributable to Fidelity's fund business, and completion of agreed-upon procedures in respect of the mathematical accuracy of certain fund profitability information and its conformity to established allocation methodologies. After considering the reports issued under the engagement and information provided by Fidelity, the Board concluded that while other allocation methods may also be reasonable, Fidelity's profitability methodologies are reasonable in all material respects.
The Board also reviewed Fidelity's non-fund businesses and potential indirect benefits such businesses may have received as a result of their association with Fidelity's fund business (i.e., fall-out benefits) as well as cases where Fidelity's affiliates may benefit from the funds' business. The Board considered areas where potential indirect benefits to the Fidelity funds from their relationships with Fidelity may exist. The Board's consideration of these matters was informed by the findings of a joint ad hoc committee created by it and the boards of other Fidelity funds to evaluate potential fall-out benefits.
The Board considered the costs of the services provided by and the profits realized by Fidelity in connection with the operation of the fund and was satisfied that the profitability was not excessive.
Economies of Scale. The Board considered whether there have been economies of scale in respect of the management of the Fidelity funds, whether the Fidelity funds (including the fund) have appropriately benefited from any such economies of scale, and whether there is potential for realization of any further economies of scale. The Board considered the extent to which the fund will benefit from economies of scale as assets grow through increased services to the fund, through waivers or reimbursements, or through fee or expense ratio reductions. The Board also noted that a committee (the Economies of Scale Committee) created by it and the boards of other Fidelity funds periodically analyzes whether Fidelity attains economies of scale in respect of the management and servicing of the Fidelity funds, whether the Fidelity funds have appropriately benefited from such economies of scale, and whether there is potential for realization of any further economies of scale.
The Board recognized that the fund's management contract incorporates a "group fee" structure, which provides for lower group fee rates as total "group assets" increase, and for higher group fee rates as total "group assets" decrease ("group assets" as defined in the management contract). FMR calculates the group fee rates based on a tiered asset "breakpoint" schedule that varies based on asset class. The Board considered that the group fee is designed to deliver the benefits of economies of scale to fund shareholders when total Fidelity fund assets increase, even if assets of any particular fund are unchanged or have declined, because some portion of Fidelity's costs are attributable to services provided to all Fidelity funds, and all funds benefit if those costs can be allocated among more assets. The Board further considered that Fidelity agreed to impose a temporary fee waiver in the form of additional breakpoints to the current breakpoint schedule. The Board concluded that, given the group fee structure, fund shareholders will benefit from lower management fees as "group assets" increase at the fund complex level, regardless of whether Fidelity achieves any such economies of scale.
The Board concluded, taking into account the analysis of the Economies of Scale Committee, that economies of scale, if any, are being appropriately shared between fund shareholders and Fidelity.
Additional Information Requested by the Board. In order to develop fully the factual basis for consideration of the Fidelity funds' advisory contracts, the Board requested and received additional information on certain topics, including: (i) fund flow and performance trends, in particular the underperformance of certain funds and strategies, and Fidelity's long-term strategies for certain funds, including any consideration of fund liquidations or mergers; (ii) the operation of performance fees and competitor use of performance fees; (iii) Fidelity's pricing philosophy compared to competitors; (iv) fund profitability methodology and data; (v) evaluation of competitive fund data and peer group classifications and fee and expense comparisons; (vi) the management fee and expense structures for different funds and classes and information about the differences between various fee and expense structures; (vii) group fee breakpoints and related voluntary fee waivers; and (viii) information regarding other accounts managed by Fidelity and the funds' sub-advisory arrangements.
Conclusion. Based on its evaluation of all of the conclusions noted above, and after considering all factors it believed relevant, the Board, including the Independent Trustees, concluded that the advisory and sub-advisory fee arrangements are fair and reasonable in light of all of the surrounding circumstances and that the fund's Advisory Contracts should be renewed through July 31, 2024.
1.807258.119
IGI-ANN-1223
Fidelity Series Select International Small Cap Fund
Annual Report
October 31, 2023
Contents
To view a fund's proxy voting guidelines and proxy voting record for the 12-month period ended June 30, visit http://www.fidelity.com/proxyvotingresults or visit the Securities and Exchange Commission's (SEC) web site at http://www.sec.gov.
You may also call 1-800-544-8544 to request a free copy of the proxy voting guidelines.
Standard & Poor's, S&P and S&P 500 are registered service marks of The McGraw-Hill Companies, Inc. and have been licensed for use by Fidelity Distributors Corporation.
Other third-party marks appearing herein are the property of their respective owners.
All other marks appearing herein are registered or unregistered trademarks or service marks of FMR LLC or an affiliated company. © 2023 FMR LLC. All rights reserved.
This report and the financial statements contained herein are submitted for the general information of the shareholders of the Fund. This report is not authorized for distribution to prospective investors in the Fund unless preceded or accompanied by an effective prospectus.
A fund files its complete schedule of portfolio holdings with the SEC for the first and third quarters of each fiscal year on Form N-PORT. Forms N-PORT are available on the SEC's web site at http://www.sec.gov. A fund's Forms N-PORT may be reviewed and copied at the SEC's Public Reference Room in Washington, DC. Information regarding the operation of the SEC's Public Reference Room may be obtained by calling 1-800-SEC-0330.
For a complete list of a fund's portfolio holdings, view the most recent holdings listing, semiannual report, or annual report on Fidelity's web site at http://www.fidelity.com, http://www.institutional.fidelity.com, or http://www.401k.com, as applicable.
NOT FDIC INSURED •MAY LOSE VALUE •NO BANK GUARANTEE
Neither the Fund nor Fidelity Distributors Corporation is a bank.
Average annual total return reflects the change in the value of an investment, assuming reinvestment of distributions from dividend income and capital gains (the profits earned upon the sale of securities that have grown in value, if any) and assuming a constant rate of performance each year. The hypothetical investment and the average annual total returns do not reflect the deduction of taxes that a shareholder would pay on fund distributions or the redemption of fund shares. During periods of reimbursement by Fidelity, a fund's total return will be greater than it would be had the reimbursement not occurred. How a fund did yesterday is no guarantee of how it will do tomorrow.
Average annual total returns for Fidelity Series Select International Small Cap Fund will be reported once the fund is a year old.
| $10,000 Over Life of Fund |
| |
Let's say hypothetically that $10,000 was invested in Fidelity Series Select International Small Cap Fund, on November 4, 2022, when the fund started. The chart shows how the value of your investment would have changed, and also shows how the MSCI EAFE Small Cap Index performed over the same period. |
|
|
Market Recap:
International (non-U.S.) equities gained 12.27% for the 12 months ending October 31, 2023, according to the MSCI ACWI (All Country World Index) ex USA Index, as global economic expansion and a slowing in the pace of inflation in some markets provided a favorable backdrop for risk assets. After returning -15.86% in 2022, the index's upturn has been largely driven by a narrow set of companies in the information technology and communication services sectors, in part due to excitement for generative artificial intelligence applications. The index gained 14.07% year to date through July, including strong gains in both June (+4.50%) and July (+4.07%). The rally for international equities sputtered for the next three months (-11.33%) amid a stalling pattern in disinflationary trends, heightened global recession and geopolitical risks, soaring yields on longer-term U.S. government bonds and particularly weak economic conditions in the eurozone and China. The three-month decline left non-U.S. stocks up 1.15% year to date through October. Currency fluctuation also helped bolster non-U.S. equity performance overall. For the full 12 months, nearly all regions advanced, with Europe ex U.K. (+18%) and Japan (+17%) leading, whereas Canada (-0.38%) lagged by the widest margin. Each of the 11 sectors advanced, with information technology (+21%) and consumer discretionary (+19%) leading the way. Energy and industrials each rose about 14%. Conversely, four defensive-oriented sectors lagged by the widest margin: real estate (+4%), health care (+6%), consumer staples (+7%) and utilities (+8%).
Comments from Portfolio Manager Shah Badkoubei:
From inception on November 4, 2023, through October 31, 2023, the fund gained 8.03%, versus 5.93% for the benchmark MSCI EAFE Small Cap Index (Net MA). From a regional standpoint, stock picks in the U.K. notably contributed to the fund's result versus the benchmark, as did positioning in Asia ex Japan and emerging markets. By sector, stock selection was the primary contributor, especially within industrials. Stock picking in the consumer discretionary and financials sectors also helped. The fund's biggest individual relative contributor was Sabre Insurance Group (+82%). Sabre was one of the fund's largest holdings at the end of the period. The fund's second-largest relative contributor was an overweight in Munters Group (+52%), from the industrials sector. Munters was the fund's largest holding as of October 31. In the utilities sector, an overweight in Sembcorp Industries (+58%) also helped. In contrast, from a regional standpoint, stock choices in Japan detracted from the fund's performance versus the benchmark. By sector, the biggest relative detractor was stock picks in the materials sector. Security selection in the information technology sector also hurt relative performance, as did choices in energy and consumer staples. The largest individual relative detractor was Euroapi (-71%), from the health care sector. A second notable relative detractor was an overweight in 29Metals (-70%), from the materials sector. An overweight stake in Synthomer returned approximately -89% and weighed on relative performance.
The views expressed above reflect those of the portfolio manager(s) only through the end of the period as stated on the cover of this report and do not necessarily represent the views of Fidelity or any other person in the Fidelity organization. Any such views are subject to change at any time based upon market or other conditions and Fidelity disclaims any responsibility to update such views. These views may not be relied on as investment advice and, because investment decisions for a Fidelity fund are based on numerous factors, may not be relied on as an indication of trading intent on behalf of any Fidelity fund.
Top Holdings (% of Fund's net assets) |
| |
| Munters Group AB (Sweden, Building Products) | 1.0 | |
| VZ Holding AG (Switzerland, Capital Markets) | 1.0 | |
| Lancashire Holdings Ltd. (United Kingdom, Insurance) | 1.0 | |
| Sabre Insurance Group PLC (United Kingdom, Insurance) | 0.9 | |
| Kyoto Financial Group, Inc. (Japan, Banks) | 0.9 | |
| Mitie Group PLC (United Kingdom, Commercial Services & Supplies) | 0.9 | |
| B&M European Value Retail SA (United Kingdom, Broadline Retail) | 0.9 | |
| Steadfast Group Ltd. (Australia, Insurance) | 0.9 | |
| Toyo Suisan Kaisha Ltd. (Japan, Food Products) | 0.8 | |
| Fuyo General Lease Co. Ltd. (Japan, Financial Services) | 0.8 | |
| | 9.1 | |
| |
| Market Sectors (% of Fund's net assets) |
| |
| Industrials | 22.2 | |
| Consumer Discretionary | 14.2 | |
| Financials | 11.6 | |
| Information Technology | 9.8 | |
| Materials | 8.3 | |
| Real Estate | 8.0 | |
| Consumer Staples | 6.7 | |
| Health Care | 5.9 | |
| Communication Services | 5.5 | |
| Energy | 2.9 | |
| Utilities | 2.0 | |
| |
Asset Allocation (% of Fund's net assets) |
|
|
Geographic Diversification (% of Fund's net assets) |
|
* Includes Short-Term investments and Net Other Assets (Liabilities). Percentages are adjusted for the effect of derivatives, if applicable. |
| |
Showing Percentage of Net Assets
| Common Stocks - 96.6% |
| | | Shares | Value ($) |
| Australia - 7.7% | | | |
| 29Metals Ltd. | | 3,273 | 1,290 |
| ALS Ltd. | | 968 | 6,625 |
| Ansell Ltd. | | 270 | 3,648 |
| Aurizon Holdings Ltd. | | 2,153 | 4,689 |
| Beach Energy Ltd. | | 6,020 | 5,929 |
| CAR Group Ltd. | | 463 | 8,161 |
| Challenger Ltd. | | 953 | 3,553 |
| Evolution Mining Ltd. | | 2,072 | 4,634 |
| Flight Centre Travel Group Ltd. | | 488 | 5,801 |
| GUD Holdings Ltd. | | 1,090 | 7,412 |
| Incitec Pivot Ltd. | | 2,876 | 5,021 |
| Iress Ltd. | | 669 | 2,133 |
| McMillan Shakespeare Ltd. | | 213 | 2,270 |
| National Storage REIT unit | | 4,732 | 6,033 |
| Steadfast Group Ltd. | | 2,681 | 9,219 |
| Treasury Wine Estates Ltd. | | 809 | 6,210 |
TOTAL AUSTRALIA | | | 82,628 |
| Austria - 1.8% | | | |
| AT&S Austria Technologie & Systemtechnik AG | | 197 | 4,936 |
| Schoeller-Bleckmann Oilfield Equipment AG | | 97 | 4,896 |
| Wienerberger AG | | 268 | 6,505 |
| Zumtobel AG | | 440 | 2,686 |
TOTAL AUSTRIA | | | 19,023 |
| Bailiwick of Jersey - 0.5% | | | |
| JTC PLC (a) | | 725 | 5,626 |
| Belgium - 1.6% | | | |
| Azelis Group NV | | 277 | 4,719 |
| Econocom Group SA | | 2,021 | 4,950 |
| Fagron NV | | 406 | 7,123 |
TOTAL BELGIUM | | | 16,792 |
| Finland - 0.9% | | | |
| Huhtamaki Oyj | | 173 | 5,933 |
| Musti Group OYJ | | 206 | 4,056 |
TOTAL FINLAND | | | 9,989 |
| France - 5.5% | | | |
| Altarea SCA | | 44 | 3,129 |
| ALTEN | | 48 | 5,653 |
| Euroapi SASU (b) | | 363 | 1,899 |
| Exclusive Networks SA (b) | | 374 | 5,944 |
| Ipsos SA | | 117 | 5,677 |
| Nexans SA | | 35 | 2,470 |
| Rexel SA | | 413 | 8,406 |
| SEB SA | | 50 | 4,928 |
| Ubisoft Entertainment SA (b) | | 180 | 5,120 |
| Vallourec SA (b) | | 514 | 6,159 |
| Vicat SA | | 127 | 3,897 |
| Virbac SA | | 23 | 6,595 |
TOTAL FRANCE | | | 59,877 |
| Germany - 4.9% | | | |
| Bilfinger Berger AG | | 151 | 5,531 |
| CTS Eventim AG | | 108 | 6,519 |
| Gerresheimer AG | | 60 | 5,580 |
| Lanxess AG | | 140 | 3,200 |
| Mensch und Maschine Software SE | | 82 | 4,282 |
| Patrizia Immobilien AG | | 474 | 3,827 |
| PVA TePla AG (b) | | 189 | 2,862 |
| SAF-Holland SA | | 623 | 8,306 |
| Stabilus Se | | 126 | 7,986 |
| Takkt AG | | 400 | 5,121 |
TOTAL GERMANY | | | 53,214 |
| Hong Kong - 2.4% | | | |
| ASMPT Ltd. | | 469 | 3,972 |
| Dah Sing Financial Holdings Ltd. | | 1,207 | 2,732 |
| Fortune (REIT) | | 4,496 | 2,515 |
| Hysan Development Co. Ltd. | | 2,024 | 3,726 |
| Luk Fook Holdings International Ltd. | | 2,386 | 5,919 |
| Melco International Development Ltd. (b) | | 3,000 | 2,097 |
| Pacific Basin Shipping Ltd. | | 16,000 | 4,630 |
TOTAL HONG KONG | | | 25,591 |
| Ireland - 1.7% | | | |
| Bank of Ireland Group PLC | | 675 | 6,035 |
| C&C Group PLC (United Kingdom) | | 3,268 | 5,529 |
| Dalata Hotel Group PLC | | 1,460 | 6,195 |
TOTAL IRELAND | | | 17,759 |
| Israel - 1.7% | | | |
| Bezeq The Israel Telecommunication Corp. Ltd. | | 4,330 | 5,328 |
| Nova Ltd. (b) | | 80 | 7,618 |
| Rami Levi Chain Stores Hashikma Marketing 2006 Ltd. | | 103 | 5,555 |
TOTAL ISRAEL | | | 18,501 |
| Italy - 2.4% | | | |
| Banca Generali SpA | | 257 | 8,327 |
| Banco BPM SpA | | 1,200 | 6,124 |
| Brembo SpA | | 474 | 5,091 |
| Carel Industries SpA (a) | | 144 | 2,999 |
| GVS SpA (a)(b) | | 739 | 3,300 |
TOTAL ITALY | | | 25,841 |
| Japan - 34.4% | | | |
| Aeon Delight Co. Ltd. | | 230 | 5,071 |
| Anritsu Corp. | | 441 | 3,283 |
| As One Corp. | | 120 | 3,824 |
| ASKUL Corp. | | 541 | 7,062 |
| Azbil Corp. | | 196 | 5,792 |
| Cosmos Pharmaceutical Corp. | | 51 | 5,307 |
| Daido Steel Co. Ltd. | | 150 | 5,884 |
| Daiichikosho Co. Ltd. | | 376 | 5,558 |
| Daiwa Securities Living Invest | | 8 | 5,915 |
| Dexerials Corp. | | 250 | 5,703 |
| Dowa Holdings Co. Ltd. | | 182 | 5,564 |
| FP Corp. | | 241 | 4,641 |
| Fujitec Co. Ltd. | | 230 | 4,993 |
| Fukushima Industries Corp. | | 180 | 5,959 |
| Funai Soken Holdings, Inc. | | 330 | 5,424 |
| Fuyo General Lease Co. Ltd. | | 110 | 8,943 |
| GMO Internet, Inc. | | 180 | 2,622 |
| Haseko Corp. | | 668 | 8,221 |
| Inaba Denki Sangyo Co. Ltd. | | 400 | 8,341 |
| J. Front Retailing Co. Ltd. | | 442 | 4,214 |
| JTOWER, Inc. (b) | | 135 | 4,913 |
| Kamigumi Co. Ltd. | | 398 | 8,074 |
| Kaneka Corp. | | 298 | 7,293 |
| Kawasaki Heavy Industries Ltd. | | 290 | 6,401 |
| Kissei Pharmaceutical Co. Ltd. | | 285 | 6,028 |
| Koshidaka Holdings Co. Ltd. | | 900 | 6,403 |
| Kyoritsu Maintenance Co. Ltd. | | 148 | 5,660 |
| Kyoto Financial Group, Inc. | | 169 | 9,581 |
| Kyushu Railway Co. | | 310 | 6,338 |
| Maruwa Ceramic Co. Ltd. | | 47 | 8,247 |
| Milbon Co. Ltd. | | 162 | 4,283 |
| Mitsubishi Logisnext Co. Ltd. | | 900 | 7,061 |
| Miura Co. Ltd. | | 250 | 4,847 |
| Money Forward, Inc. (b) | | 100 | 2,526 |
| Morinaga & Co. Ltd. | | 222 | 8,006 |
| Nabtesco Corp. | | 291 | 5,154 |
| Nagaileben Co. Ltd. | | 290 | 4,002 |
| Net One Systems Co. Ltd. | | 238 | 3,633 |
| Nikkiso Co. Ltd. | | 978 | 6,230 |
| Nippon Gas Co. Ltd. | | 413 | 6,207 |
| Okinawa Cellular Telephone Co. | | 299 | 6,324 |
| PALTAC Corp. | | 182 | 5,900 |
| Park24 Co. Ltd. (b) | | 416 | 4,687 |
| Penta-Ocean Construction Co. Ltd. | | 908 | 5,338 |
| Relo Group, Inc. | | 388 | 3,847 |
| Resonac Holdings Corp. | | 325 | 5,269 |
| Rinnai Corp. | | 150 | 2,755 |
| Roland Corp. | | 186 | 5,378 |
| Santen Pharmaceutical Co. Ltd. | | 700 | 6,071 |
| Sanwa Holdings Corp. | | 568 | 7,664 |
| SHIFT, Inc. (b) | | 13 | 2,359 |
| SOSiLA Logistics REIT, Inc. | | 5 | 3,961 |
| Stanley Electric Co. Ltd. | | 358 | 5,726 |
| Sumco Corp. | | 459 | 5,931 |
| Suruga Bank Ltd. | | 1,988 | 8,494 |
| SWCC Showa Holdings Co. Ltd. | | 300 | 4,171 |
| Tokyo Tatemono Co. Ltd. | | 433 | 5,750 |
| Toyo Gosei Co. Ltd. | | 100 | 4,161 |
| Toyo Suisan Kaisha Ltd. | | 195 | 8,996 |
| Tsumura & Co. | | 219 | 3,919 |
| Tsuruha Holdings, Inc. | | 69 | 5,069 |
| Valqua Ltd. | | 348 | 8,585 |
| Workman Co. Ltd. | | 183 | 4,715 |
| Yokogawa Electric Corp. | | 348 | 6,318 |
| Zuken, Inc. | | 290 | 7,247 |
TOTAL JAPAN | | | 371,843 |
| Netherlands - 1.0% | | | |
| Eurocommercial Properties NV | | 342 | 7,324 |
| TKH Group NV (bearer) (depositary receipt) | | 100 | 3,648 |
TOTAL NETHERLANDS | | | 10,972 |
| New Zealand - 0.8% | | | |
| Contact Energy Ltd. | | 1,780 | 8,086 |
| Norway - 1.5% | | | |
| Schibsted ASA (A Shares) | | 260 | 5,195 |
| Sparebanken Midt-Norge | | 500 | 6,060 |
| TGS ASA | | 389 | 5,300 |
TOTAL NORWAY | | | 16,555 |
| Singapore - 2.1% | | | |
| CDL Hospitality Trusts unit | | 7,932 | 5,608 |
| Mapletree Industrial (REIT) | | 3,885 | 6,107 |
| Sembcorp Industries Ltd. | | 1,893 | 6,351 |
| Wing Tai Holdings Ltd. | | 4,256 | 4,234 |
TOTAL SINGAPORE | | | 22,300 |
| Spain - 2.4% | | | |
| Bankinter SA | | 1,287 | 8,119 |
| Cie Automotive SA | | 179 | 4,557 |
| Compania de Distribucion Integral Logista Holdings SA | | 317 | 7,775 |
| Fluidra SA | | 320 | 5,627 |
TOTAL SPAIN | | | 26,078 |
| Sweden - 5.5% | | | |
| AAK AB | | 410 | 7,787 |
| AddTech AB (B Shares) | | 391 | 5,724 |
| Arjo AB | | 1,090 | 3,638 |
| Avanza Bank Holding AB | | 310 | 5,221 |
| Cloetta AB | | 2,481 | 3,976 |
| Granges AB | | 500 | 4,806 |
| Hemnet Group AB | | 338 | 5,865 |
| HEXPOL AB (B Shares) | | 715 | 6,322 |
| Loomis AB (B Shares) | | 210 | 5,445 |
| Munters Group AB (a) | | 905 | 11,011 |
TOTAL SWEDEN | | | 59,795 |
| Switzerland - 3.6% | | | |
| Bucher Industries AG | | 16 | 5,688 |
| Lastminute.com NV (b) | | 155 | 3,919 |
| OC Oerlikon Corp. AG (Reg.) | | 793 | 3,149 |
| PSP Swiss Property AG | | 57 | 6,999 |
| Sensirion Holding AG (a)(b) | | 45 | 3,364 |
| Tecan Group AG | | 18 | 5,153 |
| VZ Holding AG | | 109 | 10,689 |
TOTAL SWITZERLAND | | | 38,961 |
| United Kingdom - 14.2% | | | |
| B&M European Value Retail SA | | 1,466 | 9,422 |
| Britvic PLC | | 699 | 7,120 |
| Close Brothers Group PLC | | 531 | 5,144 |
| DCC PLC (United Kingdom) | | 110 | 6,103 |
| Grainger Trust PLC | | 2,272 | 6,280 |
| Harbour Energy PLC | | 1,109 | 3,421 |
| Hill & Smith Holdings PLC | | 342 | 6,850 |
| Inchcape PLC | | 773 | 6,257 |
| Indivior PLC (b) | | 240 | 4,594 |
| J.D. Wetherspoon PLC (b) | | 707 | 5,431 |
| Jet2 PLC | | 516 | 6,284 |
| John Wood Group PLC (b) | | 2,800 | 4,829 |
| Lancashire Holdings Ltd. | | 1,522 | 10,508 |
| Mitie Group PLC | | 7,896 | 9,453 |
| Pets At Home Group PLC | | 1,177 | 4,017 |
| Renewi PLC (b) | | 532 | 3,796 |
| Sabre Insurance Group PLC (a) | | 5,571 | 9,954 |
| Savills PLC | | 600 | 5,743 |
| Senior Engineering Group PLC | | 3,931 | 7,473 |
| Spectris PLC | | 189 | 7,121 |
| Synthomer PLC (b) | | 125 | 288 |
| Tate & Lyle PLC | | 651 | 4,989 |
| Unite Group PLC | | 623 | 6,577 |
| Vistry Group PLC | | 764 | 6,565 |
| WH Smith PLC | | 401 | 5,654 |
TOTAL UNITED KINGDOM | | | 153,873 |
| TOTAL COMMON STOCKS (Cost $1,023,787) | | | 1,043,304 |
| | | | |
| Nonconvertible Preferred Stocks - 0.5% |
| | | Shares | Value ($) |
| Germany - 0.5% | | | |
Jungheinrich AG (Cost $5,082) | | 201 | 5,389 |
| | | | |
| TOTAL INVESTMENT IN SECURITIES - 97.1% (Cost $1,028,869) | 1,048,693 |
NET OTHER ASSETS (LIABILITIES) - 2.9% | 31,704 |
| NET ASSETS - 100.0% | 1,080,397 |
| | |
Legend
| (a) | Security exempt from registration under Rule 144A of the Securities Act of 1933. These securities may be resold in transactions exempt from registration, normally to qualified institutional buyers. At the end of the period, the value of these securities amounted to $36,254 or 3.4% of net assets. |
Affiliated Central Funds
Fiscal year to date information regarding the Fund's investments in Fidelity Central Funds, including the ownership percentage, is presented below.
| Affiliate | Value, beginning of period ($) | Purchases ($) | Sales Proceeds ($) | Dividend Income ($) | Realized Gain (loss) ($) | Change in Unrealized appreciation (depreciation) ($) | Value, end of period ($) | % ownership, end of period |
| Fidelity Cash Central Fund 5.40% | - | 1,000,000 | 1,000,000 | 423 | - | - | - | 0.0% |
| Total | - | 1,000,000 | 1,000,000 | 423 | - | - | - | |
| | | | | | | | | |
Amounts in the dividend income column in the above table include any capital gain distributions from underlying funds, which are presented in the corresponding line item in the Statement of Operations, if applicable.
Amounts included in the purchases and sales proceeds columns may include in-kind transactions, if applicable.
Investment Valuation
The following is a summary of the inputs used, as of October 31, 2023, involving the Fund's assets and liabilities carried at fair value. The inputs or methodology used for valuing securities may not be an indication of the risk associated with investing in those securities. For more information on valuation inputs, and their aggregation into the levels used below, please refer to the Investment Valuation section in the accompanying Notes to Financial Statements.
| Valuation Inputs at Reporting Date: |
| Description | Total ($) | Level 1 ($) | Level 2 ($) | Level 3 ($) |
Investments in Securities: | | | | |
|
| Equities: | | | | |
Communication Services | 58,660 | 33,704 | 24,956 | - |
Consumer Discretionary | 151,661 | 74,398 | 77,263 | - |
Consumer Staples | 72,827 | 34,956 | 37,871 | - |
Energy | 30,534 | 24,605 | 5,929 | - |
Financials | 124,329 | 81,807 | 42,522 | - |
Health Care | 62,074 | 34,582 | 27,492 | - |
Industrials | 243,750 | 129,783 | 113,967 | - |
Information Technology | 106,496 | 46,730 | 59,766 | - |
Materials | 90,143 | 37,801 | 52,342 | - |
Real Estate | 87,575 | 39,879 | 47,696 | - |
Utilities | 20,644 | - | 20,644 | - |
| | | | | |
| Total Investments in Securities: | 1,048,693 | 538,245 | 510,448 | - |
| Statement of Assets and Liabilities |
| | | | October 31, 2023 |
| | | | | |
| Assets | | | | |
Investment in securities, at value - See accompanying schedule Unaffiliated issuers (cost $1,028,869): | | | $ | 1,048,693 |
| Cash | | | | 27,511 |
| Foreign currency held at value (cost $1,303) | | | | 1,304 |
| Dividends receivable | | | | 3,199 |
| Receivable from investment adviser for expense reductions | | | | 127 |
Total assets | | | | 1,080,834 |
| Liabilities | | | | |
| Custody fee payable | $ | 437 | | |
| Total Liabilities | | | | 437 |
| Net Assets | | | $ | 1,080,397 |
| Net Assets consist of: | | | | |
| Paid in capital | | | $ | 1,003,394 |
| Total accumulated earnings (loss) | | | | 77,003 |
| Net Assets | | | $ | 1,080,397 |
Net Asset Value, offering price and redemption price per share ($1,080,397 ÷ 100,311 shares) | | | $ | 10.77 |
| Statement of Operations |
| | | | For the period November 4, 2022 (commencement of operations) through October 31, 2023 |
| Investment Income | | | | |
| Dividends | | | $ | 33,920 |
| Income from Fidelity Central Funds | | | | 423 |
| Income before foreign taxes withheld | | | $ | 34,343 |
| Less foreign taxes withheld | | | | (3,533) |
| Total Income | | | | 30,810 |
| Expenses | | | | |
| Custodian fees and expenses | $ | 2,647 | | |
| Independent trustees' fees and expenses | | 5 | | |
| Total expenses before reductions | | 2,652 | | |
| Expense reductions | | (2,498) | | |
| Total expenses after reductions | | | | 154 |
| Net Investment income (loss) | | | | 30,656 |
| Realized and Unrealized Gain (Loss) | | | | |
| Net realized gain (loss) on: | | | | |
| Investment Securities: | | | | |
| Unaffiliated issuers | | 25,902 | | |
| Foreign currency transactions | | 4,060 | | |
| Total net realized gain (loss) | | | | 29,962 |
| Change in net unrealized appreciation (depreciation) on: | | | | |
| Investment Securities: | | | | |
| Unaffiliated issuers | | 19,824 | | |
| Assets and liabilities in foreign currencies | | (45) | | |
| Total change in net unrealized appreciation (depreciation) | | | | 19,779 |
| Net gain (loss) | | | | 49,741 |
| Net increase (decrease) in net assets resulting from operations | | | $ | 80,397 |
| Statement of Changes in Net Assets |
| |
| | For the period November 4, 2022 (commencement of operations) through October 31, 2023 |
| Increase (Decrease) in Net Assets | | |
| Operations | | |
| Net investment income (loss) | $ | 30,656 |
| Net realized gain (loss) | | 29,962 |
| Change in net unrealized appreciation (depreciation) | | 19,779 |
| Net increase (decrease) in net assets resulting from operations | | 80,397 |
| Distributions to shareholders | | (3,400) |
| | | |
| Share transactions | | |
| Proceeds from sales of shares | | 1,000,000 |
| Reinvestment of distributions | | 3,400 |
| | | |
Net increase (decrease) in net assets resulting from share transactions | | 1,003,400 |
| Total increase (decrease) in net assets | | 1,080,397 |
| | | |
| Net Assets | | |
| Beginning of period | | - |
| End of period | $ | 1,080,397 |
| | | |
| Other Information | | |
| Shares | | |
| Sold | | 100,000 |
| Issued in reinvestment of distributions | | 311 |
| Net increase (decrease) | | 100,311 |
| | | |
Financial Highlights
| Fidelity Series Select International Small Cap Fund |
| |
| Years ended October 31, | | 2023 A |
Selected Per-Share Data | | |
| Net asset value, beginning of period | $ | 10.00 |
| Income from Investment Operations | | |
Net investment income (loss) B,C | | .31 |
| Net realized and unrealized gain (loss) | | .49 |
| Total from investment operations | | .80 |
| Distributions from net investment income | | (.03) |
| Total distributions | | (.03) |
| Net asset value, end of period | $ | 10.77 |
Total Return D,E | | 8.03% |
Ratios to Average Net Assets C,F,G | | |
| Expenses before reductions | | .23% H |
| Expenses net of fee waivers, if any | | .01% H |
| Expenses net of all reductions | | .01% H |
| Net investment income (loss) | | 2.69% H |
| Supplemental Data | | |
| Net assets, end of period (000 omitted) | $ | 1,080 |
Portfolio turnover rate I | | 23% H |
AFor the period November 4, 2022 (commencement of operations) through October 31, 2023.
BCalculated based on average shares outstanding during the period.
CNet investment income (loss) is affected by the timing of the declaration of dividends by any underlying mutual funds or exchange-traded funds (ETFs). Net investment income (loss) of any mutual funds or ETFs is not included in the Fund's net investment income (loss) ratio.
DTotal returns for periods of less than one year are not annualized.
ETotal returns would have been lower if certain expenses had not been reduced during the applicable periods shown.
FFees and expenses of any underlying mutual funds or exchange-traded funds (ETFs) are not included in the Fund's expense ratio. The Fund indirectly bears its proportionate share of these expenses.
GExpense ratios reflect operating expenses of the class. Expenses before reductions do not reflect amounts reimbursed, waived, or reduced through arrangements with the investment adviser, brokerage services, or other offset arrangements, if applicable, and do not represent the amount paid by the class during periods when reimbursements, waivers or reductions occur.
HAnnualized.
IAmount does not include the portfolio activity of any underlying mutual funds or exchange-traded funds (ETFs).
For the period ended October 31, 2023
1. Organization.
Fidelity Series Select International Small Cap Fund (the Fund) is a fund of Fidelity Investment Trust (the Trust) and is authorized to issue an unlimited number of shares. Shares are offered only to certain other Fidelity funds, Fidelity managed 529 plans, and Fidelity managed collective investment trusts. The Trust is registered under the Investment Company Act of 1940, as amended (the 1940 Act), as an open-end management investment company organized as a Massachusetts business trust.
2. Investments in Fidelity Central Funds.
Funds may invest in Fidelity Central Funds, which are open-end investment companies generally available only to other investment companies and accounts managed by the investment adviser and its affiliates. The Schedule of Investments lists any Fidelity Central Funds held as an investment as of period end, but does not include the underlying holdings of each Fidelity Central Fund. An investing fund indirectly bears its proportionate share of the expenses of the underlying Fidelity Central Funds.
Based on its investment objective, each Fidelity Central Fund may invest or participate in various investment vehicles or strategies that are similar to those of the investing fund. These strategies are consistent with the investment objectives of the investing fund and may involve certain economic risks which may cause a decline in value of each of the Fidelity Central Funds and thus a decline in the value of the investing fund.
| Fidelity Central Fund | Investment Manager | Investment Objective | Investment Practices | Expense RatioA |
| Fidelity Money Market Central Funds | Fidelity Management & Research Company LLC (FMR) | Each fund seeks to obtain a high level of current income consistent with the preservation of capital and liquidity. | Short-term Investments | Less than .005% |
A Expenses expressed as a percentage of average net assets and are as of each underlying Central Fund's most recent annual or semi-annual shareholder report.
A complete unaudited list of holdings for each Fidelity Central Fund is available upon request or at the Securities and Exchange Commission website at www.sec.gov. In addition, the financial statements of the Fidelity Central Funds which contain the significant accounting policies (including investment valuation policies) of those funds, and are not covered by the Report of Independent Registered Public Accounting Firm, are available on the Securities and Exchange Commission website or upon request.
3. Significant Accounting Policies.
The Fund is an investment company and applies the accounting and reporting guidance of the Financial Accounting Standards Board (FASB) Accounting Standards Codification Topic 946 Financial Services - Investment Companies. The financial statements have been prepared in conformity with accounting principles generally accepted in the United States of America (GAAP), which require management to make certain estimates and assumptions at the date of the financial statements. Actual results could differ from those estimates. Subsequent events, if any, through the date that the financial statements were issued have been evaluated in the preparation of the financial statements. The Fund's Schedule of Investments lists any underlying mutual funds or exchange-traded funds (ETFs) but does not include the underlying holdings of these funds. The following summarizes the significant accounting policies of the Fund:
Investment Valuation. Investments are valued as of 4:00 p.m. Eastern time on the last calendar day of the period. The Board of Trustees (the Board) has designated the Fund's investment adviser as the valuation designee responsible for the fair valuation function and performing fair value determinations as needed. The investment adviser has established a Fair Value Committee (the Committee) to carry out the day-to-day fair valuation responsibilities and has adopted policies and procedures to govern the fair valuation process and the activities of the Committee. In accordance with these fair valuation policies and procedures, which have been approved by the Board, the Fund attempts to obtain prices from one or more third party pricing services or brokers to value its investments. When current market prices, quotations or currency exchange rates are not readily available or reliable, investments will be fair valued in good faith by the Committee, in accordance with the policies and procedures. Factors used in determining fair value vary by investment type and may include market or investment specific events, transaction data, estimated cash flows, and market observations of comparable investments. The frequency that the fair valuation procedures are used cannot be predicted and they may be utilized to a significant extent. The Committee manages the Fund's fair valuation practices and maintains the fair valuation policies and procedures. The Fund's investment adviser reports to the Board information regarding the fair valuation process and related material matters.
The Fund categorizes the inputs to valuation techniques used to value its investments into a disclosure hierarchy consisting of three levels as shown below:
Level 1 - unadjusted quoted prices in active markets for identical investments
Level 2 - other significant observable inputs (including quoted prices for similar investments, interest rates, prepayment speeds, etc.)
Level 3 - unobservable inputs (including the Fund's own assumptions based on the best information available)
Valuation techniques used to value the Fund's investments by major category are as follows:
Equity securities, including restricted securities, for which market quotations are readily available, are valued at the last reported sale price or official closing price as reported by a third party pricing service on the primary market or exchange on which they are traded and are categorized as Level 1 in the hierarchy. In the event there were no sales during the day or closing prices are not available, securities are valued at the last quoted bid price or may be valued using the last available price and are generally categorized as Level 2 in the hierarchy. For foreign equity securities, when market or security specific events arise, comparisons to the valuation of American Depositary Receipts (ADRs), futures contracts, Exchange-Traded Funds (ETFs) and certain indexes as well as quoted prices for similar securities may be used and would be categorized as Level 2 in the hierarchy. For equity securities, including restricted securities, where observable inputs are limited, assumptions about market activity and risk are used and these securities may be categorized as Level 3 in the hierarchy.
Changes in valuation techniques may result in transfers in or out of an assigned level within the disclosure hierarchy. The aggregate value of investments by input level as of October 31, 2023 is included at the end of the Fund's Schedule of Investments.
Foreign Currency. Certain Funds may use foreign currency contracts to facilitate transactions in foreign-denominated securities. Gains and losses from these transactions may arise from changes in the value of the foreign currency or if the counterparties do not perform under the contracts' terms.
Foreign-denominated assets, including investment securities, and liabilities are translated into U.S. dollars at the exchange rates at period end. Purchases and sales of investment securities, income and dividends received, and expenses denominated in foreign currencies are translated into U.S. dollars at the exchange rate in effect on the transaction date.
The effects of exchange rate fluctuations on investments are included with the net realized and unrealized gain (loss) on investment securities. Other foreign currency transactions resulting in realized and unrealized gain (loss) are disclosed separately.
Investment Transactions and Income. For financial reporting purposes, the Fund's investment holdings and NAV include trades executed through the end of the last business day of the period. The NAV per share for processing shareholder transactions is calculated as of the close of business of the New York Stock Exchange (NYSE), normally 4:00 p.m. Eastern time and includes trades executed through the end of the prior business day. Gains and losses on securities sold are determined on the basis of identified cost. Commissions paid to certain brokers with whom the investment adviser, or its affiliates, places trades on behalf of a fund include an amount in addition to trade execution, which may be rebated back to a fund. Any such rebates are included in net realized gain (loss) on investments in the Statement of Operations. Dividend income is recorded on the ex-dividend date, except for certain dividends from foreign securities where the ex-dividend date may have passed, which are recorded as soon as the Fund is informed of the ex-dividend date. Non-cash dividends included in dividend income, if any, are recorded at the fair market value of the securities received. Income and capital gain distributions from Fidelity Central Funds, if any, are recorded on the ex-dividend date. Investment income is recorded net of foreign taxes withheld where recovery of such taxes is uncertain. Funds may file withholding tax reclaims in certain jurisdictions to recover a portion of amounts previously withheld. Any withholding tax reclaims income is included in the Statement of Operations in foreign taxes withheld. Any receivables for withholding tax reclaims are included in the Statement of Assets and Liabilities in dividends receivable.
Expenses. Expenses directly attributable to a fund are charged to that fund. Expenses attributable to more than one fund are allocated among the respective funds on the basis of relative net assets or other appropriate methods. Expenses included in the accompanying financial statements reflect the expenses of that fund and do not include any expenses associated with any underlying mutual funds or exchange-traded funds. Although not included in a fund's expenses, a fund indirectly bears its proportionate share of these expenses through the net asset value of each underlying mutual fund or exchange-traded fund. Expense estimates are accrued in the period to which they relate and adjustments are made when actual amounts are known.
Income Tax Information and Distributions to Shareholders. Each year, the Fund intends to qualify as a regulated investment company under Subchapter M of the Internal Revenue Code, including distributing substantially all of its taxable income and realized gains. As a result, no provision for U.S. Federal income taxes is required. As of October 31, 2023, the Fund did not have any unrecognized tax benefits in the financial statements; nor is the Fund aware of any tax positions for which it is reasonably possible that the total amounts of unrecognized tax benefits will significantly change in the next twelve months. The Fund files a U.S. federal tax return, in addition to state and local tax returns as required. The Fund's federal income tax returns are subject to examination by the Internal Revenue Service (IRS) for a period of three fiscal years after they are filed. State and local tax returns may be subject to examination for an additional fiscal year depending on the jurisdiction. Foreign taxes are provided for based on the Fund's understanding of the tax rules and rates that exist in the foreign markets in which it invests.
Distributions are declared and recorded on the ex-dividend date. Income and capital gain distributions are determined in accordance with income tax regulations, which may differ from GAAP.
Capital accounts within the financial statements are adjusted for permanent book-tax differences. These adjustments have no impact on net assets or the results of operations. Capital accounts are not adjusted for temporary book-tax differences which will reverse in a subsequent period.
Book-tax differences are primarily due to passive foreign investment companies (PFIC).
As of period end, the cost and unrealized appreciation (depreciation) in securities, and derivatives if applicable, for federal income tax purposes were as follows:
| Gross unrealized appreciation | $98,561 |
| Gross unrealized depreciation | (85,750) |
| Net unrealized appreciation (depreciation) | $12,811 |
| Tax Cost | $1,035,882 |
The tax-based components of distributable earnings as of period end were as follows:
| Undistributed ordinary income | $64,237 |
| Net unrealized appreciation (depreciation) on securities and other investments | $12,766 |
The tax character of distributions paid was as follows:
| | October 31, 2023A |
| Ordinary Income | $3,400 |
| Total | $3,400 |
A For the period November 4, 2022 (commencement of operations) through October 31, 2023.
Restricted Securities (including Private Placements). Funds may invest in securities that are subject to legal or contractual restrictions on resale. These securities generally may be resold in transactions exempt from registration or to the public if the securities are registered. Disposal of these securities may involve time-consuming negotiations and expense, and prompt sale at an acceptable price may be difficult. Information regarding restricted securities held at period end is included at the end of the Schedule of Investments, if applicable.
4. Purchases and Sales of Investments.
Purchases and sales of securities, other than short-term securities, and in-kind transactions, as applicable, are noted in the table below.
| | Purchases ($) | Sales ($) |
| Fidelity Series Select International Small Cap Fund | 1,259,216 | 255,634 |
5. Fees and Other Transactions with Affiliates.
Management Fee. Fidelity Management & Research Company LLC (the investment adviser) and its affiliates provide the Fund with investment management related services for which the Fund does not pay a management fee. Under the management contract, the investment adviser or an affiliate pays all ordinary operating expenses of the Fund, except custody fees, fees and expenses of the independent Trustees, and certain miscellaneous expenses such as proxy and shareholder meeting expenses.
Interfund Trades. Funds may purchase from or sell securities to other Fidelity Funds under procedures adopted by the Board. The procedures have been designed to ensure these interfund trades are executed in accordance with Rule 17a-7 of the 1940 Act. Any interfund trades are included within the respective purchases and sales amounts shown in the Purchases and Sales of Investments note. Interfund trades during the period are noted in the table below.
| | Purchases ($) | Sales ($) | Realized Gain (Loss) ($) |
| Fidelity Series Select International Small Cap Fund | - | 611 | 155 |
6. Committed Line of Credit.
Certain Funds participate with other funds managed by the investment adviser or an affiliate in a $4.25 billion credit facility (the "line of credit") to be utilized for temporary or emergency purposes to fund shareholder redemptions or for other short-term liquidity purposes. The commitment fees on the pro-rata portion of the line of credit are borne by the investment adviser. During the period, there were no borrowings on this line of credit.
7. Expense Reductions.
The investment adviser contractually agreed to reimburse the Fund to the extent annual operating expenses exceeded .013% of average net assets. This reimbursement will remain in place through February 28, 2027. Some expenses, for example the compensation of the independent Trustees, and certain other expenses such as interest expense, are excluded from this reimbursement. During the period this reimbursement reduced the Fund's expenses by $2,498.
8. Other.
A fund's organizational documents provide former and current trustees and officers with a limited indemnification against liabilities arising in connection with the performance of their duties to the fund. In the normal course of business, a fund may also enter into contracts that provide general indemnifications. A fund's maximum exposure under these arrangements is unknown as this would be dependent on future claims that may be made against a fund. The risk of material loss from such claims is considered remote.
At the end of the period, mutual funds and accounts managed by the investment adviser or its affiliates were the owners of record of all of the outstanding shares of the Fund.
9. Risk and Uncertainties.
Many factors affect a fund's performance. Developments that disrupt global economies and financial markets, such as pandemics, epidemics, outbreaks of infectious diseases, war, terrorism, and environmental disasters, may significantly affect a fund's investment performance. The effects of these developments to a fund will be impacted by the types of securities in which a fund invests, the financial condition, industry, economic sector, and geographic location of an issuer, and a fund's level of investment in the securities of that issuer. Significant concentrations in security types, issuers, industries, sectors, and geographic locations may magnify the factors that affect a fund's performance.
To the Board of Trustees of Fidelity Investment Trust and the Shareholders of Fidelity Series Select International Small Cap Fund:
Opinion on the Financial Statements and Financial Highlights
We have audited the accompanying statement of assets and liabilities of Fidelity Series Select International Small Cap Fund (the "Fund"), a fund of Fidelity Investment Trust, including the schedule of investments, as of October 31, 2023, the related statement of operations, the statement of changes in net assets, and the financial highlights for the period from November 4, 2022 (commencement of operations) through October 31, 2023, and the related notes. In our opinion, the financial statements and financial highlights present fairly, in all material respects, the financial position of the Fund as of October 31, 2023, and the results of its operations, the changes in its net assets and the financial highlights for the period from November 4, 2022 (commencement of operations) through October 31, 2023, in conformity with accounting principles generally accepted in the United States of America.
Basis for Opinion
These financial statements and financial highlights are the responsibility of the Fund's management. Our responsibility is to express an opinion on the Fund's financial statements and financial highlights based on our audit. We are a public accounting firm registered with the Public Company Accounting Oversight Board (United States) (PCAOB) and are required to be independent with respect to the Fund in accordance with the U.S. federal securities laws and the applicable rules and regulations of the Securities and Exchange Commission and the PCAOB.
We conducted our audit in accordance with the standards of the PCAOB. Those standards require that we plan and perform the audit to obtain reasonable assurance about whether the financial statements and financial highlights are free of material misstatement, whether due to error or fraud. The Fund is not required to have, nor were we engaged to perform, an audit of its internal control over financial reporting. As part of our audit, we are required to obtain an understanding of internal control over financial reporting but not for the purpose of expressing an opinion on the effectiveness of the Fund's internal control over financial reporting. Accordingly, we express no such opinion.
Our audit included performing procedures to assess the risks of material misstatement of the financial statements and financial highlights, whether due to error or fraud, and performing procedures that respond to those risks. Such procedures included examining, on a test basis, evidence regarding the amounts and disclosures in the financial statements and financial highlights. Our audit also included evaluating the accounting principles used and significant estimates made by management, as well as evaluating the overall presentation of the financial statements and financial highlights. Our procedures included confirmation of securities owned as of October 31, 2023, by correspondence with the custodian and brokers; when replies were not received from brokers, we performed other auditing procedures. We believe that our audit provides a reasonable basis for our opinion.
/s/ Deloitte & Touche LLP
Boston, Massachusetts
December 14, 2023
We have served as the auditor of one or more of the Fidelity investment companies since 1999.
The Trustees, Members of the Advisory Board (if any), and officers of the trust and fund, as applicable, are listed below. The Board of Trustees governs the fund and is responsible for protecting the interests of shareholders. The Trustees are experienced executives who meet periodically throughout the year to oversee the fund's activities, review contractual arrangements with companies that provide services to the fund, oversee management of the risks associated with such activities and contractual arrangements, and review the fund's performance. Except for Jonathan Chiel, each of the Trustees oversees 322 funds. Mr. Chiel oversees 191 funds.
The Trustees hold office without limit in time except that (a) any Trustee may resign; (b) any Trustee may be removed by written instrument, signed by at least two-thirds of the number of Trustees prior to such removal; (c) any Trustee who requests to be retired or who has become incapacitated by illness or injury may be retired by written instrument signed by a majority of the other Trustees; and (d) any Trustee may be removed at any special meeting of shareholders by a two-thirds vote of the outstanding voting securities of the trust. Each Trustee who is not an interested person (as defined in the 1940 Act) of the trust and the fund is referred to herein as an Independent Trustee. Each Independent Trustee shall retire not later than the last day of the calendar year in which his or her 75th birthday occurs. The Independent Trustees may waive this mandatory retirement age policy with respect to individual Trustees. Officers and Advisory Board Members hold office without limit in time, except that any officer or Advisory Board Member may resign or may be removed by a vote of a majority of the Trustees at any regular meeting or any special meeting of the Trustees. Except as indicated, each individual has held the office shown or other offices in the same company for the past five years.
The fund's Statement of Additional Information (SAI) includes more information about the Trustees. To request a free copy, call Fidelity at 1-800-544-8544.
Experience, Skills, Attributes, and Qualifications of the Trustees. The Governance and Nominating Committee has adopted a statement of policy that describes the experience, qualifications, attributes, and skills that are necessary and desirable for potential Independent Trustee candidates (Statement of Policy). The Board believes that each Trustee satisfied at the time he or she was initially elected or appointed a Trustee, and continues to satisfy, the standards contemplated by the Statement of Policy. The Governance and Nominating Committee also engages professional search firms to help identify potential Independent Trustee candidates who have the experience, qualifications, attributes, and skills consistent with the Statement of Policy. From time to time, additional criteria based on the composition and skills of the current Independent Trustees, as well as experience or skills that may be appropriate in light of future changes to board composition, business conditions, and regulatory or other developments, have also been considered by the professional search firms and the Governance and Nominating Committee. In addition, the Board takes into account the Trustees' commitment and participation in Board and committee meetings, as well as their leadership of standing and ad hoc committees throughout their tenure.
In determining that a particular Trustee was and continues to be qualified to serve as a Trustee, the Board has considered a variety of criteria, none of which, in isolation, was controlling. The Board believes that, collectively, the Trustees have balanced and diverse experience, qualifications, attributes, and skills, which allow the Board to operate effectively in governing the fund and protecting the interests of shareholders. Information about the specific experience, skills, attributes, and qualifications of each Trustee, which in each case led to the Board's conclusion that the Trustee should serve (or continue to serve) as a trustee of the fund, is provided below.
Board Structure and Oversight Function. Robert A. Lawrence is an interested person and currently serves as Chair. The Trustees have determined that an interested Chair is appropriate and benefits shareholders because an interested Chair has a personal and professional stake in the quality and continuity of services provided to the fund. Independent Trustees exercise their informed business judgment to appoint an individual of their choosing to serve as Chair, regardless of whether the Trustee happens to be independent or a member of management. The Independent Trustees have determined that they can act independently and effectively without having an Independent Trustee serve as Chair and that a key structural component for assuring that they are in a position to do so is for the Independent Trustees to constitute a substantial majority for the Board. The Independent Trustees also regularly meet in executive session. David M. Thomas serves as Lead Independent Trustee and as such (i) acts as a liaison between the Independent Trustees and management with respect to matters important to the Independent Trustees and (ii) with management prepares agendas for Board meetings.
Fidelity® funds are overseen by different Boards of Trustees. The fund's Board oversees Fidelity's high income and certain equity funds, and other Boards oversee Fidelity's alternative investment, investment-grade bond, money market, asset allocation, and other equity funds. The asset allocation funds may invest in Fidelity® funds overseen by the fund's Board. The use of separate Boards, each with its own committee structure, allows the Trustees of each group of Fidelity® funds to focus on the unique issues of the funds they oversee, including common research, investment, and operational issues. On occasion, the separate Boards establish joint committees to address issues of overlapping consequences for the Fidelity® funds overseen by each Board.
The Trustees operate using a system of committees to facilitate the timely and efficient consideration of all matters of importance to the Trustees, the fund, and fund shareholders and to facilitate compliance with legal and regulatory requirements and oversight of the fund's activities and associated risks. The Board, acting through its committees, has charged FMR and its affiliates with (i) identifying events or circumstances the occurrence of which could have demonstrably adverse effects on the fund's business and/or reputation; (ii) implementing processes and controls to lessen the possibility that such events or circumstances occur or to mitigate the effects of such events or circumstances if they do occur; and (iii) creating and maintaining a system designed to evaluate continuously business and market conditions in order to facilitate the identification and implementation processes described in (i) and (ii) above. Because the day-to-day operations and activities of the fund are carried out by or through FMR, its affiliates, and other service providers, the fund's exposure to risks is mitigated but not eliminated by the processes overseen by the Trustees. While each of the Board's committees has responsibility for overseeing different aspects of the fund's activities, oversight is exercised primarily through the Operations, Audit, and Compliance Committees. Appropriate personnel, including but not limited to the fund's Chief Compliance Officer (CCO), FMR's internal auditor, the independent accountants, the fund's Treasurer and portfolio management personnel, make periodic reports to the Board's committees, as appropriate, including an annual review of Fidelity's risk management program for the Fidelity® funds. The responsibilities of each standing committee, including their oversight responsibilities, are described further under "Standing Committees of the Trustees."
Interested Trustees*:
Correspondence intended for a Trustee who is an interested person may be sent to Fidelity Investments, 245 Summer Street, Boston, Massachusetts 02210.
Name, Year of Birth; Principal Occupations and Other Relevant Experience+
Jonathan Chiel (1957)
Year of Election or Appointment: 2016
Trustee
Mr. Chiel also serves as Trustee of other Fidelity® funds. Mr. Chiel is General Counsel (2012-present) and Head of Legal, Risk and Compliance (2022-present). Mr Chiel serves as Executive Vice President and General Counsel for FMR LLC (diversified financial services company, 2012-present) and Director and President for OH Company LLC (holding company, 2018-present). Previously, Mr. Chiel served as general counsel (2004-2012) and senior vice president and deputy general counsel (2000-2004) for John Hancock Financial Services; a partner with Choate, Hall & Stewart (1996-2000) (law firm); and an Assistant United States Attorney for the United States Attorney's Office of the District of Massachusetts (1986-95), including Chief of the Criminal Division (1993-1995). Mr. Chiel is a director on the boards of the Boston Bar Foundation and the Maimonides School.
Bettina Doulton (1964)
Year of Election or Appointment: 2021
Trustee
Ms. Doulton also serves as Trustee of other Fidelity® funds. Prior to her retirement, Ms. Doulton served in a variety of positions at Fidelity Investments, including as a managing director of research (2006-2007), portfolio manager to certain Fidelity® funds (1993-2005), equity analyst and portfolio assistant (1990-1993), and research assistant (1987-1990). Ms. Doulton currently owns and operates Phi Builders + Architects and Cellardoor Winery. Previously, Ms. Doulton served as a member of the Board of Brown Capital Management, LLC (2014-2018).
Robert A. Lawrence (1952)
Year of Election or Appointment: 2020
Trustee
Chair of the Board of Trustees
Mr. Lawrence also serves as Trustee of other funds. Previously, Mr. Lawrence served as a Trustee and Member of the Advisory Board of certain funds. Prior to his retirement in 2008, Mr. Lawrence served as Vice President of certain Fidelity® funds (2006-2008), Senior Vice President, Head of High Income Division of Fidelity Management & Research Company (investment adviser firm, 2006-2008), and President of Fidelity Strategic Investments (investment adviser firm, 2002-2005).
* Determined to be an "Interested Trustee" by virtue of, among other things, his or her affiliation with the trust or various entities under common control with FMR.
+ The information includes the Trustee's principal occupation during the last five years and other information relating to the experience, attributes, and skills relevant to the Trustee's qualifications to serve as a Trustee, which led to the conclusion that the Trustee should serve as a Trustee for the fund.
Independent Trustees:
Correspondence intended for an Independent Trustee may be sent to Fidelity Investments, P.O. Box 55235, Boston, Massachusetts 02205-5235.
Name, Year of Birth; Principal Occupations and Other Relevant Experience+
Thomas P. Bostick (1956)
Year of Election or Appointment: 2021
Trustee
Lieutenant General Bostick also serves as Trustee of other Fidelity® funds. Prior to his retirement, General Bostick (United States Army, Retired) held a variety of positions within the U.S. Army, including Commanding General and Chief of Engineers, U.S. Army Corps of Engineers (2012-2016) and Deputy Chief of Staff and Director of Human Resources, U.S. Army (2009-2012). General Bostick currently serves as a member of the Board and Finance and Governance & Sustainability Committees of CSX Corporation (transportation, 2020-present) and a member of the Board and Corporate Governance and Nominating Committee of Perma-Fix Environmental Services, Inc. (nuclear waste management, 2020-present). General Bostick serves as Chief Executive Officer of Bostick Global Strategies, LLC (consulting, 2016-present), as a member of the Board of HireVue, Inc. (video interview and assessment, 2020-present), as a member of the Board of Allonnia (biotechnology and engineering solutions, 2022-present) and on the Advisory Board of Solugen, Inc. (specialty bio-based chemicals manufacturer, 2022-present). Previously, General Bostick served as a Member of the Advisory Board of certain Fidelity® funds (2021), President, Intrexon Bioengineering (2018-2020) and Chief Operating Officer (2017-2020) and Senior Vice President of the Environment Sector (2016-2017) of Intrexon Corporation (biopharmaceutical company).
Dennis J. Dirks (1948)
Year of Election or Appointment: 2005
Trustee
Mr. Dirks also serves as Trustee of other Fidelity® funds. Prior to his retirement in May 2003, Mr. Dirks served as Chief Operating Officer and as a member of the Board of The Depository Trust & Clearing Corporation (financial markets infrastructure), President, Chief Operating Officer and a member of the Board of The Depository Trust Company (DTC), President and a member of the Board of the National Securities Clearing Corporation (NSCC), Chief Executive Officer and a member of the Board of the Government Securities Clearing Corporation and Chief Executive Officer and a member of the Board of the Mortgage-Backed Securities Clearing Corporation. Mr. Dirks currently serves as a member of the Finance Committee (2016-present) and Board (2017-present) and is Treasurer (2018-present) of the Asolo Repertory Theatre.
Donald F. Donahue (1950)
Year of Election or Appointment: 2018
Trustee
Mr. Donahue also serves as Trustee of other Fidelity® funds. Mr. Donahue serves as President and Chief Executive Officer of Miranda Partners, LLC (risk consulting for the financial services industry, 2012-present). Previously, Mr. Donahue served as Chief Executive Officer (2006-2012), Chief Operating Officer (2003-2006) and Managing Director, Customer Marketing and Development (1999-2003) of The Depository Trust & Clearing Corporation (financial markets infrastructure). Mr. Donahue currently serves as a member (2007-present) and Co-Chairman (2016-present) of the Board of United Way of New York. Mr. Donahue previously served as a member of the Advisory Board of certain Fidelity® funds (2015-2018) and as a member of the Board of The Leadership Academy (previously NYC Leadership Academy) (2012-2022).
Vicki L. Fuller (1957)
Year of Election or Appointment: 2020
Trustee
Ms. Fuller also serves as Trustee of other Fidelity® funds. Previously, Ms. Fuller served as a member of the Advisory Board of certain Fidelity® funds (2018-2020), Chief Investment Officer of the New York State Common Retirement Fund (2012-2018) and held a variety of positions at AllianceBernstein L.P. (global asset management, 1985-2012), including Managing Director (2006-2012) and Senior Vice President and Senior Portfolio Manager (2001-2006). Ms. Fuller currently serves as a member of the Board, Audit Committee and Nominating and Governance Committee of two Blackstone business development companies (2020-present), as a member of the Board of Treliant, LLC (consulting, 2019-present), as a member of the Board of Ariel Alternatives, LLC (private equity, 2022-present) and as a member of the Board and Chair of the Audit Committee of Gusto, Inc. (software, 2021-present). In addition, Ms. Fuller currently serves as a member of the Board of Roosevelt University (2019-present) and as a member of the Executive Board of New York University's Stern School of Business. Ms. Fuller previously served as a member of the Board, Audit Committee and Nominating and Governance Committee of The Williams Companies, Inc. (natural gas infrastructure, 2018-2021).
Patricia L. Kampling (1959)
Year of Election or Appointment: 2020
Trustee
Ms. Kampling also serves as Trustee of other Fidelity® funds. Prior to her retirement, Ms. Kampling served as Chairman of the Board and Chief Executive Officer (2012-2019), President and Chief Operating Officer (2011-2012) and Executive Vice President and Chief Financial Officer (2010-2011) of Alliant Energy Corporation. Ms. Kampling currently serves as a member of the Board, Finance Committee and Governance, Compensation and Nominating Committee of Xcel Energy Inc. (utilities company, 2020-present) and as a member of the Board, Audit, Finance and Risk Committee and Safety, Environmental, Technology and Operations Committee and Chair of the Executive Development and Compensation Committee of American Water Works Company, Inc. (utilities company, 2019-present). In addition, Ms. Kampling currently serves as a member of the Board of the Nature Conservancy, Wisconsin Chapter (2019-present). Previously, Ms. Kampling served as a Member of the Advisory Board of certain Fidelity® funds (2020), a member of the Board, Compensation Committee and Executive Committee and Chair of the Audit Committee of Briggs & Stratton Corporation (manufacturing, 2011-2021), a member of the Board of Interstate Power and Light Company (2012-2019) and Wisconsin Power and Light Company (2012-2019) (each a subsidiary of Alliant Energy Corporation) and as a member of the Board and Workforce Development Committee of the Business Roundtable (2018-2019).
Thomas A. Kennedy (1955)
Year of Election or Appointment: 2021
Trustee
Mr. Kennedy also serves as Trustee of other Fidelity® funds. Previously, Mr. Kennedy served as a Member of the Advisory Board of certain Fidelity® funds (2020) and held a variety of positions at Raytheon Company (aerospace and defense, 1983-2020), including Chairman and Chief Executive Officer (2014-2020) and Executive Vice President and Chief Operating Officer (2013-2014). Mr. Kennedy served as Executive Chairman of the Board of Directors of Raytheon Technologies Corporation (aerospace and defense, 2020-2021). Mr. Kennedy serves as a Director of the Board of Directors of Textron Inc. (aerospace and defense, 2023-present).
Oscar Munoz (1959)
Year of Election or Appointment: 2021
Trustee
Mr. Munoz also serves as Trustee of other Fidelity® funds. Prior to his retirement, Mr. Munoz served as Executive Chairman (2020-2021), Chief Executive Officer (2015-2020), President (2015-2016) and a member of the Board (2010-2021) of United Airlines Holdings, Inc. Mr. Munoz currently serves as a member of the Board of CBRE Group, Inc. (commercial real estate, 2020-present), a member of the Board of Univision Communications, Inc. (Hispanic media, 2020-present), a member of the Board of Archer Aviation Inc. (2021-present), a member of the Defense Business Board of the United States Department of Defense (2021-present) and a member of the Board of Salesforce.com, Inc. (cloud-based software, 2022-present). Previously, Mr. Munoz served as a Member of the Advisory Board of certain Fidelity® funds (2021).
David M. Thomas (1949)
Year of Election or Appointment: 2008
Trustee
Lead Independent Trustee
Mr. Thomas also serves as Trustee of other Fidelity® funds. Previously, Mr. Thomas served as Executive Chairman (2005-2006) and Chairman and Chief Executive Officer (2000-2005) of IMS Health, Inc. (pharmaceutical and healthcare information solutions). Mr. Thomas currently serves as a member of the Board of Fortune Brands Home and Security (home and security products, 2004-present) and as Director (2013-present) and Non-Executive Chairman of the Board (2022-present) of Interpublic Group of Companies, Inc. (marketing communication).
Susan Tomasky (1953)
Year of Election or Appointment: 2020
Trustee
Ms. Tomasky also serves as Trustee of other Fidelity® funds. Prior to her retirement, Ms. Tomasky served in various executive officer positions at American Electric Power Company, Inc. (1998-2011), including most recently as President of AEP Transmission (2007-2011). Ms. Tomasky currently serves as a member of the Board and Sustainability Committee and as Chair of the Audit Committee of Marathon Petroleum Corporation (2018-present) and as a member of the Board, Executive Committee, Corporate Governance Committee and Organization and Compensation Committee and as Lead Director of the Board of Public Service Enterprise Group, Inc. (utilities company, 2012-present) and as a member of the Board of its subsidiary company, Public Service Electric and Gas Co. (2021-present). In addition, Ms. Tomasky currently serves as a member (2009-present) and President (2020-present) of the Board of the Royal Shakespeare Company - America (2009-present), as a member of the Board of the Columbus Association for the Performing Arts (2011-present) and as a member of the Board and Kenyon in the World Committee of Kenyon College (2016-present). Previously, Ms. Tomasky served as a Member of the Advisory Board of certain Fidelity® funds (2020), as a member of the Board of the Columbus Regional Airport Authority (2007-2020), as a member of the Board (2011-2018) and Lead Independent Director (2015-2018) of Andeavor Corporation (previously Tesoro Corporation) (independent oil refiner and marketer) and as a member of the Board of Summit Midstream Partners LP (energy, 2012-2018).
Michael E. Wiley (1950)
Year of Election or Appointment: 2020
Trustee
Mr. Wiley also serves as Trustee of other Fidelity® funds. Previously, Mr. Wiley served as a member of the Advisory Board of certain Fidelity® funds (2018-2020), Chairman, President and CEO of Baker Hughes, Inc. (oilfield services, 2000-2004). Mr. Wiley also previously served as a member of the Board of Andeavor Corporation (independent oil refiner and marketer, 2005-2018), a member of the Board of Andeavor Logistics LP (natural resources logistics, 2015-2018) and a member of the Board of High Point Resources (exploration and production, 2005-2020).
+ The information includes the Trustee's principal occupation during the last five years and other information relating to the experience, attributes, and skills relevant to the Trustee's qualifications to serve as a Trustee, which led to the conclusion that the Trustee should serve as a Trustee for the fund.
Advisory Board Members and Officers:
Correspondence intended for a Member of the Advisory Board (if any) may be sent to Fidelity Investments, P.O. Box 55235, Boston, Massachusetts 02205-5235. Correspondence intended for an officer or Peter S. Lynch may be sent to Fidelity Investments, 245 Summer Street, Boston, Massachusetts 02210.
Name, Year of Birth; Principal Occupation
Vijay C. Advani (1960)
Year of Election or Appointment: 2023
Member of the Advisory Board
Mr. Advani also serves as Trustee or Member of the Advisory Board of other funds. Previously, Mr. Advani served as Executive Chairman (2020-2022), Chief Executive Officer (2017-2020) and Chief Operating Officer (2016-2017) of Nuveen (global investment manager). He also served in various capacities at Franklin Resources (global investment manager), including Co-President (2015-2016), Executive Vice President, Global Advisory Services (2008-2015), Head of Global Retail Distribution (2005-2008), Executive Managing Director, International Retail Development (2002-2005), Managing Director, Product Developments, Sales & Marketing, Asia, Eastern Europe and Africa (2000-2002) and President, Templeton Asset Management India (1995-2000). Mr. Advani also served as Senior Investment Officer of International Finance Corporation (private equity and venture capital arm of The World Bank, 1984-1995). Mr. Advani is Chairman Emeritus of the U.S. India Business Council (2018-present), a Director of The Global Impact Investing Network (2019-present), a Director of LOK Capital (Mauritius) (2022-present), a member of the Advisory Council of LOK Capital (2022-present), a Senior Advisor of Neuberger Berman (2021-present), a Senior Advisor of Seviora Holdings Pte. Ltd (Temasek-Singapore) (2021-present), a Director of Seviora Capital (Singapore) (2021-present) and an Advisor of EQUIAM (2021-present). Mr. Advani formerly served as a member of the Board of BowX Acquisition Corp. (special purpose acquisition company, 2020-2021), a member of the Board of Intellecap (advisory arm of The Aavishkaar Group, 2018-2020), a member of the Board of Nuveen Investments, Inc. (2017-2020) and a member of the Board of Docusign (software, 2016-2019).
Peter S. Lynch (1944)
Year of Election or Appointment: 2003
Member of the Advisory Board
Mr. Lynch also serves as a Member of the Advisory Board of other Fidelity® funds. Mr. Lynch is Vice Chairman and a Director of Fidelity Management & Research Company LLC (investment adviser firm). In addition, Mr. Lynch serves as a Trustee of Boston College and as the Chairman of the Inner-City Scholarship Fund. Previously, Mr. Lynch served as Vice Chairman and a Director of FMR Co., Inc. (investment adviser firm) and on the Special Olympics International Board of Directors (1997-2006).
Karen B. Peetz (1955)
Year of Election or Appointment: 2023
Member of the Advisory Board
Ms. Peetz also serves as a Member of the Advisory Board of other funds. Previously, Ms. Peetz served as Chief Administration Officer (2020-2023) of Citigroup Inc. (a diversified financial service company). She also served in various capacities at Bank of New York Mellon Corporation, including President (2013-2016), Vice Chairman, Senior Executive Vice President and Chief Executive Officer of Financial Markets & Treasury Services (2010-2013), Senior Executive Vice President and Chief Executive Officer of Global Corporate Trust (2003-2008), Senior Vice President and Division Manager of Global Payments & Trade Services (2002-2003) and Senior Vice President and Division Manager of Domestic Corporate Trust (1998-2002). Ms. Peetz also served in various capacities at Chase Manhattan Corporation (1982-1998), including Senior Vice President and Manager of Corporate Trust International Business (1996-1998), Managing Director and Manager of Corporate Trust Services (1994-1996) and Managing Director and Group Manager of Financial Institution Sales (1990-1993). Ms. Peetz currently serves as Chair of Amherst Holdings Advisory Council (2018-present), Trustee of Johns Hopkins University (2016-present), Chair of the Carey Business School Advisory Council, Member of the Johns Hopkins Medicine Board and Finance Committee and Chair of the Lyme and Tick Related Disease Institute Advisory Council. Ms. Peetz previously served as a member of the Board of Guardian Life Insurance Company of America (2019-2023), a member of the Board of Trane Technologies (2018-2022), a member of the Board of Wells Fargo Corp. (2017-2019), a member of the Board of SunCoke Energy Inc. (2012-2016), a member of the Board of Private Export Funding Corporation (2010-2016) and as a Trustee of Penn State University (2010-2014) and the United Way of New York City (2008-2010).
Heather Bonner (1977)
Year of Election or Appointment: 2023
Assistant Treasurer
Ms. Bonner also serves as an officer of other funds. Ms. Bonner is a Senior Vice President (2022-present) and is an employee of Fidelity Investments (2022-present). Ms. Bonner serves as Vice President, Treasurer, or Assistant Treasurer of certain Fidelity entities. Prior to joining Fidelity, Ms. Bonner served as Managing Director at AQR Capital Management (2013-2022) and was the Treasurer and Principal Financial Officer of the AQR Funds (2013-2022).
Craig S. Brown (1977)
Year of Election or Appointment: 2022
Deputy Treasurer
Mr. Brown also serves as an officer of other funds. Mr. Brown is a Vice President (2015-present) and is an employee of Fidelity Investments. Mr. Brown serves as Assistant Treasurer of FIMM, LLC (2021-present). Previously, Mr. Brown served as Assistant Treasurer of certain Fidelity® funds (2019-2022).
John J. Burke III (1964)
Year of Election or Appointment: 2018
Chief Financial Officer
Mr. Burke also serves as Chief Financial Officer of other funds. Mr. Burke is Head of Fidelity Fund and Investment Operations (2018-present) and is an employee of Fidelity Investments. Mr. Burke serves as President, Executive Vice President, or Director of certain Fidelity entities. Previously Mr. Burke served as head of Asset Management Investment Operations (2012-2018).
Margaret Carey (1973)
Year of Election or Appointment: 2023
Secretary and Chief Legal Officer (CLO)
Ms. Carey also serves as an officer of other funds and as CLO of certain Fidelity entities. Ms. Carey is a Senior Vice President, Deputy General Counsel (2019-present) and is an employee of Fidelity Investments.
William C. Coffey (1969)
Year of Election or Appointment: 2019
Assistant Secretary
Mr. Coffey also serves as Assistant Secretary of other funds. Mr. Coffey is a Senior Vice President, Deputy General Counsel (2010-present) and is an employee of Fidelity Investments. Previously, Mr. Coffey served as Secretary and CLO of certain funds (2018-2019); CLO, Secretary, or Senior Vice President of certain Fidelity entities and Assistant Secretary of certain funds (2009-2018).
Timothy M. Cohen (1969)
Year of Election or Appointment: 2018
Vice President
Mr. Cohen also serves as Vice President of other funds. Mr. Cohen is Co-Head of Equity (2018-present) and is an employee of Fidelity Investments. Mr. Cohen serves a Director of Fidelity Management & Research (Japan) Limited (investment adviser firm, 2016-present). Previously, Mr. Cohen served as Executive Vice President of Fidelity SelectCo, LLC (2019) and Head of Global Equity Research (2016-2018).
Jonathan Davis (1968)
Year of Election or Appointment: 2010
Assistant Treasurer
Mr. Davis also serves as an officer of other funds. Mr. Davis is a Vice President (2006-present) and is an employee of Fidelity Investments. Mr. Davis serves as Assistant Treasurer of certain Fidelity entities.
Laura M. Del Prato (1964)
Year of Election or Appointment: 2018
Assistant Treasurer
Ms. Del Prato also serves as an officer of other funds. Ms. Del Prato is a Senior Vice President (2017-present) and is an employee of Fidelity Investments. Ms. Del Prato serves as Vice President or Assistant Treasurer of certain Fidelity entities. Previously, Ms. Del Prato served as President and Treasurer of The North Carolina Capital Management Trust: Cash Portfolio and Term Portfolio (2018-2020).
Colm A. Hogan (1973)
Year of Election or Appointment: 2020
Assistant Treasurer
Mr. Hogan also serves as an officer of other funds. Mr. Hogan is a Vice President (2016-present) and is an employee of Fidelity Investments. Mr. Hogan serves as Assistant Treasurer of certain Fidelity entities. Previously, Mr. Hogan served as Deputy Treasurer of certain Fidelity® funds (2016-2020) and Assistant Treasurer of certain Fidelity® funds (2016-2018).
Pamela R. Holding (1964)
Year of Election or Appointment: 2018
Vice President
Ms. Holding also serves as Vice President of other funds. Ms. Holding is Co-Head of Equity (2018-present) and is an employee of Fidelity Investments. Previously, Ms. Holding served as Executive Vice President of Fidelity SelectCo, LLC (2019) and as Chief Investment Officer of Fidelity Institutional Asset Management (2013-2018).
Chris Maher (1972)
Year of Election or Appointment: 2020
Deputy Treasurer
Mr. Maher also serves as an officer of other funds. Mr. Maher is a Vice President (2008-present) and is an employee of Fidelity Investments. Mr. Maher serves as Assistant Treasurer of certain Fidelity entities. Previously, Mr. Maher served as Assistant Treasurer of certain funds (2013-2020).
Jason P. Pogorelec (1975)
Year of Election or Appointment: 2020
Chief Compliance Officer
Mr. Pogorelec also serves as Chief Compliance Officer of other funds. Mr. Pogorelec is a Senior Vice President of Asset Management Compliance (2020-present) and is an employee of Fidelity Investments. Mr. Pogorelec serves as Compliance Officer of Fidelity Management & Research Company LLC (investment adviser firm, 2023-present) and Ballyrock Investment Advisors LLC (2023-present). Previously, Mr. Pogorelec served as a Vice President, Associate General Counsel for Fidelity Investments (2010-2020) and Assistant Secretary of certain Fidelity® funds (2015-2020).
Brett Segaloff (1972)
Year of Election or Appointment: 2021
Anti-Money Laundering (AML) Officer
Mr. Segaloff also serves as AML Officer of other funds. Mr. Segaloff is a Vice President (2022-present) and is an employee of Fidelity Investments. Mr. Segaloff serves as Anti Money Laundering Compliance Officer or Anti Money Laundering/Bank Secrecy Act Compliance Officer of certain Fidelity entities.
Stacie M. Smith (1974)
Year of Election or Appointment: 2016
President and Treasurer
Ms. Smith also serves as an officer of other funds. Ms. Smith is a Senior Vice President (2016-present) and is an employee of Fidelity Investments. Ms. Smith serves as Assistant Treasurer of certain Fidelity entities and has served in other fund officer roles.
Jim Wegmann (1979)
Year of Election or Appointment: 2019
Assistant Treasurer
Mr. Wegmann also serves as an officer of other funds. Mr. Wegmann is a Vice President (2016-present) and is an employee of Fidelity Investments. Mr. Wegmann serves as Assistant Treasurer of FIMM, LLC (2021-present). Previously, Mr. Wegmann served as Assistant Treasurer of certain Fidelity® funds (2019-2021).
As a shareholder, you incur two types of costs: (1) transaction costs, which may include sales charges (loads) on purchase payments or redemption proceeds, as applicable and (2) ongoing costs, which generally include management fees, distribution and/or service (12b-1) fees and other Fund expenses. This Example is intended to help you understand your ongoing costs (in dollars) of investing in a fund and to compare these costs with the ongoing costs of investing in other mutual funds.
| The Example is based on an investment of $1,000 invested at the beginning of the period and held for the entire period (May 1, 2023 to October 31, 2023). |
Actual Expenses
The first line of the accompanying table provides information about actual account values and actual expenses. You may use the information in this line, together with the amount you invested, to estimate the expenses that you paid over the period. Simply divide your account value by $1,000.00 (for example, an $8,600 account value divided by $1,000.00 = 8.6), then multiply the result by the number in the first line for a class/Fund under the heading entitled "Expenses Paid During Period" to estimate the expenses you paid on your account during this period. If any fund is a shareholder of any underlying mutual funds or exchange-traded funds (ETFs) (the Underlying Funds), such fund indirectly bears its proportional share of the expenses of the Underlying Funds in addition to the direct expenses incurred presented in the table. These fees and expenses are not included in the annualized expense ratio used to calculate the expense estimate in the table below.
Hypothetical Example for Comparison Purposes
The second line of the accompanying table provides information about hypothetical account values and hypothetical expenses based on the actual expense ratio and an assumed rate of return of 5% per year before expenses, which is not the actual return. The hypothetical account values and expenses may not be used to estimate the actual ending account balance or expenses you paid for the period. You may use this information to compare the ongoing costs of investing in the Fund and other funds. To do so, compare this 5% hypothetical example with the 5% hypothetical examples that appear in the shareholder reports of the other funds. If any fund is a shareholder of any Underlying Funds, such fund indirectly bears its proportional share of the expenses of the Underlying Funds in addition to the direct expenses as presented in the table. These fees and expenses are not included in the annualized expense ratio used to calculate the expense estimate in the table below.
Please note that the expenses shown in the table are meant to highlight your ongoing costs only and do not reflect any transaction costs. Therefore, the second line of the table is useful in comparing ongoing costs only, and will not help you determine the relative total costs of owning different funds. In addition, if these transactional costs were included, your costs would have been higher.
| | | | | Annualized Expense Ratio- A | | Beginning Account Value May 1, 2023 | | Ending Account Value October 31, 2023 | | Expenses Paid During Period- C May 1, 2023 to October 31, 2023 |
| | | | | | | | | | |
| Fidelity Series Select International Small Cap Fund | | | | .01% | | | | | | |
| Actual | | | | | | $ 1,000 | | $ 902.00 | | $ .05 |
Hypothetical-B | | | | | | $ 1,000 | | $ 1,025.16 | | $ .05 |
| |
A Annualized expense ratio reflects expenses net of applicable fee waivers.
B 5% return per year before expenses
C Expenses are equal to the annualized expense ratio, multiplied by the average account value over the period, multiplied by 184/ 365 (to reflect the one-half year period). The fees and expenses of any Underlying Funds are not included in each annualized expense ratio.
The dividend and capital gains distributions for the fund(s) are available on Fidelity.com or Institutional.Fidelity.com.
The fund designates $426 of distributions paid during the fiscal year ended 2023 as qualifying to be taxed as section 163(j) interest dividends.
The fund designates 66.97% of the dividend distributed during the fiscal year as amounts which may be taken into account as a dividend for the purposes of the maximum rate under section 1(h)(11) of the Internal Revenue Code.
The fund will notify shareholders in January 2024 of amounts for use in preparing 2023 income tax returns.
1.9906198.100
SSI-ANN-1223
Fidelity's Broadly Diversified International Equity Funds
Fidelity® Diversified International Fund
Fidelity® International Capital Appreciation Fund
Fidelity® Overseas Fund
Fidelity® Worldwide Fund
Annual Report
October 31, 2023
Includes Fidelity and Fidelity Advisor share classes
Contents
To view a fund's proxy voting guidelines and proxy voting record for the 12-month period ended June 30, visit http://www.fidelity.com/proxyvotingresults or visit the Securities and Exchange Commission's (SEC) web site at http://www.sec.gov.
You may also call 1-800-544-8544 if you're an individual investing directly with Fidelity, call 1-800-835-5092 if you're a plan sponsor or participant with Fidelity as your recordkeeper or call 1-877-208-0098 on institutional accounts or if you're an advisor or invest through one to request a free copy of the proxy voting guidelines.
Standard & Poor's, S&P and S&P 500 are registered service marks of The McGraw-Hill Companies, Inc. and have been licensed for use by Fidelity Distributors Corporation.
Other third-party marks appearing herein are the property of their respective owners.
All other marks appearing herein are registered or unregistered trademarks or service marks of FMR LLC or an affiliated company. © 2023 FMR LLC. All rights reserved.
This report and the financial statements contained herein are submitted for the general information of the shareholders of the Funds. This report is not authorized for distribution to prospective investors in the Funds unless preceded or accompanied by an effective prospectus.
A fund files its complete schedule of portfolio holdings with the SEC for the first and third quarters of each fiscal year on Form N-PORT. Forms N-PORT are available on the SEC's web site at http://www.sec.gov. A fund's Forms N-PORT may be reviewed and copied at the SEC's Public Reference Room in Washington, DC. Information regarding the operation of the SEC's Public Reference Room may be obtained by calling 1-800-SEC-0330.
For a complete list of a fund's portfolio holdings, view the most recent holdings listing, semiannual report, or annual report on Fidelity's web site at http://www.fidelity.com, http://www.institutional.fidelity.com, or http://www.401k.com, as applicable.
NOT FDIC INSURED •MAY LOSE VALUE •NO BANK GUARANTEE
Neither the Funds nor Fidelity Distributors Corporation is a bank.
Average annual total return reflects the change in the value of an investment, assuming reinvestment of distributions from dividend income and capital gains (the profits earned upon the sale of securities that have grown in value, if any) and assuming a constant rate of performance each year. The hypothetical investment and the average annual total returns do not reflect the deduction of taxes that a shareholder would pay on fund distributions or the redemption of fund shares. During periods of reimbursement by Fidelity, a fund's total return will be greater than it would be had the reimbursement not occurred. How a fund did yesterday is no guarantee of how it will do tomorrow.
| Average Annual Total Returns |
| | | | |
Periods ended October 31, 2023 | Past 1 year | Past 5 years | Past 10 years |
| Fidelity® Diversified International Fund | 12.15% | 5.37% | 3.95% |
| Class K | 12.29% | 5.49% | 4.08% |
| $10,000 Over 10 Years |
| |
Let's say hypothetically that $10,000 was invested in Fidelity® Diversified International Fund, a class of the fund, on October 31, 2013. The chart shows how the value of your investment would have changed, and also shows how the MSCI EAFE Index performed over the same period. |
|
|
Fidelity® Diversified International Fund
Market Recap:
International (non-U.S.) equities gained 12.27% for the 12 months ending October 31, 2023, according to the MSCI ACWI (All Country World Index) ex USA Index, as global economic expansion and a slowing in the pace of inflation in some markets provided a favorable backdrop for risk assets. After returning -15.86% in 2022, the index's upturn has been largely driven by a narrow set of companies in the information technology and communication services sectors, in part due to excitement for generative artificial intelligence applications. The index gained 14.07% year to date through July, including strong gains in both June (+4.50%) and July (+4.07%). The rally for international equities sputtered for the next three months (-11.33%) amid a stalling pattern in disinflationary trends, heightened global recession and geopolitical risks, soaring yields on longer-term U.S. government bonds and particularly weak economic conditions in the eurozone and China. The three-month decline left non-U.S. stocks up 1.15% year to date through October. Currency fluctuation also helped bolster non-U.S. equity performance overall. For the full 12 months, nearly all regions advanced, with Europe ex U.K. (+18%) and Japan (+17%) leading, whereas Canada (-0.38%) lagged by the widest margin. Each of the 11 sectors advanced, with information technology (+21%) and consumer discretionary (+19%) leading the way. Energy and industrials each rose about 14%. Conversely, four defensive-oriented sectors lagged by the widest margin: real estate (+4%), health care (+6%), consumer staples (+7%) and utilities (+8%).
Comments from Portfolio Manager Bill Bower:
For the fiscal year ending October 31, 2023, the fund's share classes gained about 12%, versus 14.65% for the benchmark MSCI EAFE Index (Net MA). From a regional standpoint, stock picks in Europe ex U.K. and a non-benchmark allocation to Canada detracted from the fund's relative result. By sector, security selection was the primary detractor, especially within financials. Stock selection in industrials also hurt. Also hurting our result were stock picks in energy and health care. The fund's non-benchmark stake in First Quantum Minerals returned -34% and was the fund's biggest individual relative detractor. Not owning Mitsubishi UFJ Financial Group, a benchmark component that gained roughly 83%, was a second notable relative detractor. Another notable relative detractor was our non-benchmark stake in HDFC Bank (-1%). HDFC Bank was among the fund's biggest holdings. In contrast, from a regional standpoint, underweights in Europe ex U.K., primarily in Switzerland, and Asia Pacific ex Japan, primarily in Australia, contributed to the fund's performance versus the benchmark. By sector, the biggest contributor to performance versus the benchmark was an underweight in consumer staples. An overweight in financials, primarily within the insurance industry, and an underweight in communication services also boosted the fund's relative performance. The fund's non-benchmark stake in B&M European Value Retail gained 85% and was the fund's top individual relative contributor. I trimmed the position. A second notable relative contributor was an overweight in BAE Systems (+47%). An overweight in Hitachi (+40%) also contributed. Hitachi was among our largest holdings. Notable changes in positioning include decreased exposure to Switzerland and a higher allocation to the United Kingdom. By sector, meaningful changes in positioning include decreased exposure to the health care sector and a higher allocation to materials.
The views expressed above reflect those of the portfolio manager(s) only through the end of the period as stated on the cover of this report and do not necessarily represent the views of Fidelity or any other person in the Fidelity organization. Any such views are subject to change at any time based upon market or other conditions and Fidelity disclaims any responsibility to update such views. These views may not be relied on as investment advice and, because investment decisions for a Fidelity fund are based on numerous factors, may not be relied on as an indication of trading intent on behalf of any Fidelity fund.
Fidelity® Diversified International Fund
Top Holdings (% of Fund's net assets) |
| |
| ASML Holding NV (depository receipt) (Netherlands, Semiconductors & Semiconductor Equipment) | 2.8 | |
| Novo Nordisk A/S Series B (Denmark, Pharmaceuticals) | 2.5 | |
| LVMH Moet Hennessy Louis Vuitton SE (France, Textiles, Apparel & Luxury Goods) | 2.5 | |
| HDFC Bank Ltd. (India, Banks) | 2.2 | |
| AstraZeneca PLC (United Kingdom) (United Kingdom, Pharmaceuticals) | 2.0 | |
| Hitachi Ltd. (Japan, Industrial Conglomerates) | 1.9 | |
| Linde PLC (United States of America, Chemicals) | 1.9 | |
| RELX PLC (Euronext N.V.) (United Kingdom, Professional Services) | 1.8 | |
| Nestle SA (Reg. S) (United States of America, Food Products) | 1.8 | |
| Shin-Etsu Chemical Co. Ltd. (Japan, Chemicals) | 1.5 | |
| | 20.9 | |
| |
| Market Sectors (% of Fund's net assets) |
| |
| Financials | 24.0 | |
| Industrials | 19.5 | |
| Information Technology | 14.1 | |
| Health Care | 9.7 | |
| Consumer Discretionary | 8.8 | |
| Materials | 7.7 | |
| Energy | 5.7 | |
| Consumer Staples | 5.6 | |
| Real Estate | 0.4 | |
| Communication Services | 0.4 | |
| |
Asset Allocation (% of Fund's net assets) |
|
|
Geographic Diversification (% of Fund's net assets) |
|
* Includes Short-Term investments and Net Other Assets (Liabilities). Percentages are adjusted for the effect of derivatives, if applicable. |
| |
Fidelity® Diversified International Fund
Showing Percentage of Net Assets
| Common Stocks - 95.4% |
| | | Shares | Value ($) |
| Australia - 1.4% | | | |
| Aristocrat Leisure Ltd. | | 1,189,197 | 29,230,591 |
| Flutter Entertainment PLC (a) | | 203,217 | 31,875,363 |
| Glencore PLC | | 10,251,963 | 54,302,915 |
TOTAL AUSTRALIA | | | 115,408,869 |
| Belgium - 0.6% | | | |
| KBC Group NV | | 894,510 | 49,122,365 |
| Canada - 7.1% | | | |
| Alimentation Couche-Tard, Inc. Class A (multi-vtg.) | | 1,408,585 | 76,678,624 |
| Cameco Corp. | | 802,845 | 32,843,264 |
| Canadian Natural Resources Ltd. (b) | | 1,674,571 | 106,336,919 |
| Canadian Pacific Kansas City Ltd. (b) | | 605,223 | 42,952,676 |
| Constellation Software, Inc. | | 46,070 | 92,356,272 |
| Constellation Software, Inc. warrants 8/22/28 (a)(c) | | 50,923 | 4 |
| Franco-Nevada Corp. | | 380,112 | 46,241,135 |
| GFL Environmental, Inc. | | 1,745,818 | 50,314,475 |
| Imperial Oil Ltd. | | 786,606 | 44,828,175 |
| Ivanhoe Mines Ltd. (a) | | 3,385,466 | 24,950,036 |
| Lumine Group, Inc. | | 151,931 | 1,910,710 |
| MEG Energy Corp. (a) | | 1,472,598 | 29,096,222 |
| Thomson Reuters Corp. | | 293,389 | 35,143,210 |
| Tourmaline Oil Corp. (b) | | 392,954 | 20,779,028 |
TOTAL CANADA | | | 604,430,750 |
| China - 1.0% | | | |
| Anta Sports Products Ltd. | | 776,646 | 8,783,471 |
| Chervon Holdings Ltd. | | 2,991,956 | 7,369,336 |
| Li Ning Co. Ltd. | | 3,118,301 | 9,555,734 |
| NXP Semiconductors NV | | 343,303 | 59,195,736 |
TOTAL CHINA | | | 84,904,277 |
| Denmark - 3.7% | | | |
| Carlsberg A/S Series B | | 276,136 | 32,908,015 |
| DSV A/S | | 444,758 | 66,331,443 |
| Novo Nordisk A/S Series B | | 2,251,407 | 217,207,273 |
TOTAL DENMARK | | | 316,446,731 |
| France - 10.2% | | | |
| Air Liquide SA | | 467,909 | 80,177,261 |
| Airbus Group NV | | 497,909 | 66,757,754 |
| AXA SA | | 1,998,418 | 59,213,975 |
| BNP Paribas SA | | 1,392,250 | 80,059,979 |
| Capgemini SA | | 504,484 | 89,156,847 |
| Edenred SA | | 371,140 | 19,729,410 |
| EssilorLuxottica SA | | 480,685 | 86,789,688 |
| Legrand SA | | 516,274 | 44,660,996 |
| LVMH Moet Hennessy Louis Vuitton SE | | 293,745 | 210,301,025 |
| Pernod Ricard SA | | 529,463 | 93,837,654 |
| Sartorius Stedim Biotech | | 18,904 | 3,531,410 |
| Thales SA | | 171,329 | 25,225,559 |
| Worldline SA (a)(d) | | 331,500 | 4,202,107 |
TOTAL FRANCE | | | 863,643,665 |
| Germany - 6.2% | | | |
| Allianz SE | | 526,893 | 123,420,757 |
| Bayer AG | | 396,367 | 17,126,449 |
| Deutsche Borse AG | | 316,419 | 52,081,448 |
| DHL Group | | 1,822,422 | 70,884,481 |
| Hannover Reuck SE | | 266,743 | 58,790,752 |
| Infineon Technologies AG | | 1,202,735 | 35,132,154 |
| Merck KGaA | | 478,520 | 72,074,938 |
| Muenchener Rueckversicherungs-Gesellschaft AG in Muenchen | | 157,530 | 63,089,323 |
| SAP SE | | 65,000 | 8,718,602 |
| Siemens Healthineers AG (d) | | 531,949 | 26,071,454 |
TOTAL GERMANY | | | 527,390,358 |
| Greece - 0.1% | | | |
| Piraeus Financial Holdings SA (a) | | 3,855,600 | 11,382,113 |
| Hong Kong - 1.4% | | | |
| AIA Group Ltd. | | 13,953,466 | 121,169,221 |
| India - 3.6% | | | |
| Axis Bank Ltd. | | 2,650,700 | 31,268,471 |
| Fairfax India Holdings Corp. (a)(d) | | 1,270,594 | 15,488,541 |
| HDFC Bank Ltd. | | 10,321,904 | 183,102,995 |
| HDFC Standard Life Insurance Co. Ltd. (d) | | 1,147,600 | 8,522,610 |
| Reliance Industries Ltd. | | 2,304,046 | 63,337,342 |
TOTAL INDIA | | | 301,719,959 |
| Indonesia - 1.1% | | | |
| PT Bank Central Asia Tbk | | 80,395,083 | 44,291,312 |
| PT Bank Rakyat Indonesia (Persero) Tbk | | 141,278,911 | 44,175,640 |
TOTAL INDONESIA | | | 88,466,952 |
| Ireland - 0.9% | | | |
| Kingspan Group PLC (Ireland) | | 604,844 | 40,626,275 |
| Ryanair Holdings PLC sponsored ADR (a) | | 232,393 | 20,380,866 |
| Smurfit Kappa Group PLC | | 495,095 | 16,103,457 |
TOTAL IRELAND | | | 77,110,598 |
| Israel - 0.4% | | | |
| NICE Ltd. sponsored ADR (a) | | 196,357 | 30,307,703 |
| Italy - 1.4% | | | |
| FinecoBank SpA | | 3,473,036 | 40,845,617 |
| UniCredit SpA | | 3,156,367 | 79,128,907 |
TOTAL ITALY | | | 119,974,524 |
| Japan - 16.4% | | | |
| Bandai Namco Holdings, Inc. | | 984,253 | 20,392,262 |
| BayCurrent Consulting, Inc. | | 584,360 | 14,671,383 |
| CUC, Inc. (a)(b) | | 48,094 | 824,715 |
| Daikin Industries Ltd. | | 107,935 | 15,561,954 |
| Fast Retailing Co. Ltd. | | 38,885 | 8,608,999 |
| FUJIFILM Holdings Corp. | | 1,086,630 | 59,436,275 |
| Fujitsu Ltd. | | 186,136 | 24,113,463 |
| Hitachi Ltd. | | 2,498,662 | 158,381,758 |
| Hoya Corp. | | 1,052,389 | 101,312,037 |
| Itochu Corp. | | 2,423,246 | 87,287,821 |
| Keyence Corp. | | 229,387 | 88,800,001 |
| Marui Group Co. Ltd. | | 275,648 | 4,358,860 |
| Minebea Mitsumi, Inc. | | 3,800,891 | 59,595,322 |
| Misumi Group, Inc. | | 1,640,057 | 24,828,271 |
| Nomura Research Institute Ltd. | | 1,024,029 | 26,880,715 |
| NSD Co. Ltd. | | 153,855 | 2,676,906 |
| ORIX Corp. | | 3,308,171 | 60,163,561 |
| Persol Holdings Co. Ltd. | | 21,148,518 | 31,710,425 |
| Relo Group, Inc. | | 1,684,349 | 16,698,776 |
| Renesas Electronics Corp. (a) | | 886,709 | 11,647,473 |
| Resona Holdings, Inc. | | 1,782,984 | 9,527,058 |
| Seven & i Holdings Co. Ltd. | | 686,797 | 25,163,356 |
| Shin-Etsu Chemical Co. Ltd. | | 4,335,768 | 129,654,112 |
| SMC Corp. | | 150,055 | 69,289,867 |
| SMS Co., Ltd. | | 266,162 | 4,223,435 |
| Sony Group Corp. | | 1,333,568 | 110,871,358 |
| Sumitomo Mitsui Financial Group, Inc. | | 1,941,883 | 93,614,255 |
| Suzuki Motor Corp. | | 622,445 | 24,158,343 |
| TechnoPro Holdings, Inc. | | 811,675 | 16,079,972 |
| TIS, Inc. | | 932,437 | 19,968,001 |
| Tokyo Electron Ltd. | | 532,854 | 70,410,098 |
TOTAL JAPAN | | | 1,390,910,832 |
| Korea (South) - 0.8% | | | |
| Samsung Electronics Co. Ltd. | | 1,407,970 | 69,977,648 |
| Netherlands - 6.4% | | | |
| Argenx SE (a) | | 99,051 | 46,591,768 |
| ASML Holding NV (depository receipt) (b) | | 401,676 | 240,527,608 |
| BE Semiconductor Industries NV | | 216,432 | 22,282,352 |
| IMCD NV | | 489,012 | 58,727,578 |
| Shell PLC (London) | | 1,609,718 | 51,876,145 |
| Wolters Kluwer NV | | 970,503 | 124,356,285 |
TOTAL NETHERLANDS | | | 544,361,736 |
| Norway - 0.5% | | | |
| Equinor ASA | | 1,301,341 | 43,625,136 |
| Spain - 1.7% | | | |
| Banco Santander SA (Spain) | | 10,859,263 | 39,824,985 |
| CaixaBank SA | | 13,419,402 | 54,557,131 |
| Industria de Diseno Textil SA (b) | | 1,331,829 | 45,869,729 |
TOTAL SPAIN | | | 140,251,845 |
| Sweden - 2.0% | | | |
| Autoliv, Inc. | | 228,947 | 20,982,993 |
| Indutrade AB | | 3,946,998 | 69,711,457 |
| Investor AB (B Shares) | | 4,433,019 | 81,174,750 |
| Kry International AB (a)(c)(e) | | 2,651 | 97,306 |
TOTAL SWEDEN | | | 171,966,506 |
| Switzerland - 2.0% | | | |
| Compagnie Financiere Richemont SA Series A | | 239,726 | 28,281,799 |
| Partners Group Holding AG | | 26,131 | 27,485,451 |
| Sika AG | �� | 257,244 | 61,338,123 |
| UBS Group AG | | 711,213 | 16,590,930 |
| Zurich Insurance Group Ltd. | | 77,611 | 36,738,632 |
TOTAL SWITZERLAND | | | 170,434,935 |
| Taiwan - 1.3% | | | |
| ECLAT Textile Co. Ltd. | | 654,000 | 10,401,206 |
| Taiwan Semiconductor Manufacturing Co. Ltd. sponsored ADR | | 1,126,991 | 97,270,593 |
TOTAL TAIWAN | | | 107,671,799 |
| United Kingdom - 13.7% | | | |
| 3i Group PLC | | 1,139,016 | 26,855,252 |
| AstraZeneca PLC (United Kingdom) | | 1,333,812 | 166,998,267 |
| B&M European Value Retail SA | | 11,532,716 | 74,124,221 |
| BAE Systems PLC | | 8,301,323 | 111,622,760 |
| Beazley PLC | | 3,797,748 | 23,749,180 |
| Big Yellow Group PLC | | 1,698,559 | 19,716,104 |
| Cab Payments Holdings Ltd. | | 2,479,972 | 1,844,741 |
| Compass Group PLC | | 2,571,956 | 64,842,576 |
| Diageo PLC | | 2,370,360 | 89,637,593 |
| Games Workshop Group PLC | | 159,998 | 19,203,870 |
| Hiscox Ltd. | | 3,723,289 | 42,448,924 |
| JD Sports Fashion PLC | | 10,113,784 | 15,673,318 |
| London Stock Exchange Group PLC | | 874,289 | 88,211,472 |
| RELX PLC (Euronext N.V.) | | 4,373,611 | 152,298,192 |
| Rentokil Initial PLC | | 10,714,773 | 54,564,882 |
| RS GROUP PLC | | 2,507,848 | 20,642,166 |
| Sage Group PLC | | 4,291,512 | 50,627,644 |
| Smith & Nephew PLC | | 3,777,650 | 42,276,187 |
| Standard Chartered PLC (United Kingdom) | | 4,282,179 | 32,790,079 |
| Starling Bank Ltd. Series D (a)(c)(e) | | 8,636,400 | 30,861,510 |
| WPP PLC | | 3,597,184 | 30,976,183 |
TOTAL UNITED KINGDOM | | | 1,159,965,121 |
| United States of America - 11.2% | | | |
| Aon PLC | | 121,327 | 37,538,574 |
| CRH PLC | | 943,846 | 50,717,607 |
| Experian PLC | | 1,224,197 | 37,064,841 |
| Ferguson PLC | | 589,001 | 88,270,626 |
| ICON PLC (a) | | 180,332 | 43,993,795 |
| Linde PLC | | 411,417 | 157,227,121 |
| Marsh & McLennan Companies, Inc. | | 471,835 | 89,483,508 |
| Marvell Technology, Inc. | | 1,150,220 | 54,313,388 |
| MasterCard, Inc. Class A | | 166,283 | 62,580,607 |
| Nestle SA (Reg. S) | | 1,384,335 | 149,284,998 |
| S&P Global, Inc. | | 203,808 | 71,192,172 |
| Sanofi SA | | 83,045 | 7,541,003 |
| Schlumberger Ltd. | | 1,760,431 | 97,985,589 |
TOTAL UNITED STATES OF AMERICA | | | 947,193,829 |
| Zambia - 0.3% | | | |
| First Quantum Minerals Ltd. | | 2,024,871 | 23,464,703 |
| TOTAL COMMON STOCKS (Cost $6,020,585,957) | | | 8,081,302,175 |
| | | | |
| Preferred Stocks - 0.5% |
| | | Shares | Value ($) |
| Convertible Preferred Stocks - 0.5% | | | |
| Estonia - 0.1% | | | |
| Bolt Technology OU Series E (a)(c)(e) | | 79,275 | 9,362,784 |
| United States of America - 0.4% | | | |
| Wasabi Holdings, Inc. Series C (a)(c)(e) | | 2,976,172 | 34,077,169 |
TOTAL CONVERTIBLE PREFERRED STOCKS | | | 43,439,953 |
| Nonconvertible Preferred Stocks - 0.0% | | | |
| Sweden - 0.0% | | | |
| Kry International AB Series E (a)(c)(e) | | 15,316 | 562,181 |
| TOTAL PREFERRED STOCKS (Cost $59,932,348) | | | 44,002,134 |
| | | | |
| Money Market Funds - 6.7% |
| | | Shares | Value ($) |
| Fidelity Cash Central Fund 5.40% (f) | | 345,612,227 | 345,681,349 |
| Fidelity Securities Lending Cash Central Fund 5.40% (f)(g) | | 221,650,814 | 221,672,979 |
| TOTAL MONEY MARKET FUNDS (Cost $567,353,371) | | | 567,354,328 |
| | | | |
| TOTAL INVESTMENT IN SECURITIES - 102.6% (Cost $6,647,871,676) | 8,692,658,637 |
NET OTHER ASSETS (LIABILITIES) - (2.6)% �� | (222,409,326) |
| NET ASSETS - 100.0% | 8,470,249,311 |
| | |
Legend
| (b) | Security or a portion of the security is on loan at period end. |
| (d) | Security exempt from registration under Rule 144A of the Securities Act of 1933. These securities may be resold in transactions exempt from registration, normally to qualified institutional buyers. At the end of the period, the value of these securities amounted to $54,284,712 or 0.6% of net assets. |
| (e) | Restricted securities (including private placements) - Investment in securities not registered under the Securities Act of 1933 (excluding 144A issues). At the end of the period, the value of restricted securities (excluding 144A issues) amounted to $74,960,950 or 0.9% of net assets. |
| (f) | Affiliated fund that is generally available only to investment companies and other accounts managed by Fidelity Investments. The rate quoted is the annualized seven-day yield of the fund at period end. A complete unaudited listing of the fund's holdings as of its most recent quarter end is available upon request. In addition, each Fidelity Central Fund's financial statements, which are not covered by the Fund's Report of Independent Registered Public Accounting Firm, are available on the SEC's website or upon request. |
| (g) | Investment made with cash collateral received from securities on loan. |
| Additional information on each restricted holding is as follows: |
| Security | Acquisition Date | Acquisition Cost ($) |
| Bolt Technology OU Series E | 1/03/22 | 20,595,368 |
| | | |
| Kry International AB | 5/14/21 | 1,151,345 |
| | | |
| Kry International AB Series E | 5/14/21 | 7,002,062 |
| | | |
| Starling Bank Ltd. Series D | 6/18/21 | 15,440,896 |
| | | |
| Wasabi Holdings, Inc. Series C | 3/31/21 | 32,334,918 |
| | | |
Affiliated Central Funds
Fiscal year to date information regarding the Fund's investments in Fidelity Central Funds, including the ownership percentage, is presented below.
| Affiliate | Value, beginning of period ($) | Purchases ($) | Sales Proceeds ($) | Dividend Income ($) | Realized Gain (loss) ($) | Change in Unrealized appreciation (depreciation) ($) | Value, end of period ($) | % ownership, end of period |
| Fidelity Cash Central Fund 5.40% | 378,167,562 | 1,123,710,015 | 1,156,196,228 | 14,349,457 | - | - | 345,681,349 | 0.8% |
| Fidelity Securities Lending Cash Central Fund 5.40% | 172,610,171 | 1,623,124,259 | 1,574,061,451 | 1,021,302 | - | - | 221,672,979 | 0.9% |
| Total | 550,777,733 | 2,746,834,274 | 2,730,257,679 | 15,370,759 | - | - | 567,354,328 | |
| | | | | | | | | |
Amounts in the dividend income column in the above table include any capital gain distributions from underlying funds, which are presented in the corresponding line item in the Statement of Operations, if applicable.
Amounts in the dividend income column for Fidelity Securities Lending Cash Central Fund represents the income earned on investing cash collateral, less rebates paid to borrowers and any lending agent fees associated with the loan, plus any premium payments received for lending certain types of securities.
Amounts included in the purchases and sales proceeds columns may include in-kind transactions, if applicable.
Investment Valuation
The following is a summary of the inputs used, as of October 31, 2023, involving the Fund's assets and liabilities carried at fair value. The inputs or methodology used for valuing securities may not be an indication of the risk associated with investing in those securities. For more information on valuation inputs, and their aggregation into the levels used below, please refer to the Investment Valuation section in the accompanying Notes to Financial Statements.
| Valuation Inputs at Reporting Date: |
| Description | Total ($) | Level 1 ($) | Level 2 ($) | Level 3 ($) |
Investments in Securities: | | | | |
|
| Equities: | | | | |
Communication Services | 30,976,183 | - | 30,976,183 | - |
Consumer Discretionary | 740,526,194 | 207,729,494 | 532,796,700 | - |
Consumer Staples | 467,510,240 | 170,516,278 | 296,993,962 | - |
Energy | 490,707,820 | 331,869,197 | 158,838,623 | - |
Financials | 2,020,677,175 | 826,092,761 | 1,163,722,904 | 30,861,510 |
Health Care | 832,338,984 | 232,461,285 | 599,877,699 | - |
Industrials | 1,662,166,730 | 902,930,130 | 759,236,600 | - |
Information Technology | 1,199,809,633 | 648,792,006 | 506,918,183 | 44,099,444 |
Materials | 644,176,470 | 380,042,182 | 264,134,288 | - |
Real Estate | 36,414,880 | 19,716,104 | 16,698,776 | - |
|
| Money Market Funds | 567,354,328 | 567,354,328 | - | - |
| Total Investments in Securities: | 8,692,658,637 | 4,287,503,765 | 4,330,193,918 | 74,960,954 |
Fidelity® Diversified International Fund
| Statement of Assets and Liabilities |
| | | | October 31, 2023 |
| | | | | |
| Assets | | | | |
| Investment in securities, at value (including securities loaned of $212,294,420) - See accompanying schedule: | | | | |
Unaffiliated issuers (cost $6,080,518,305) | $ | 8,125,304,309 | | |
Fidelity Central Funds (cost $567,353,371) | | 567,354,328 | | |
| | | | | |
| | | | | |
| Total Investment in Securities (cost $6,647,871,676) | | | $ | 8,692,658,637 |
| Foreign currency held at value (cost $6,259,242) | | | | 6,224,276 |
| Receivable for investments sold | | | | 21,732,583 |
| Receivable for fund shares sold | | | | 4,340,272 |
| Dividends receivable | | | | 16,528,263 |
| Reclaims receivable | | | | 32,362,582 |
| Distributions receivable from Fidelity Central Funds | | | | 1,382,493 |
| Prepaid expenses | | | | 13,356 |
| Other receivables | | | | 1,446,540 |
Total assets | | | | 8,776,689,002 |
| Liabilities | | | | |
| Payable for investments purchased | $ | 9,188,184 | | |
| Payable for fund shares redeemed | | 58,943,232 | | |
| Accrued management fee | | 2,735,794 | | |
| Other affiliated payables | | 1,190,379 | | |
| Other payables and accrued expenses | | 12,709,123 | | |
| Collateral on securities loaned | | 221,672,979 | | |
| Total Liabilities | | | | 306,439,691 |
| Net Assets | | | $ | 8,470,249,311 |
| Net Assets consist of: | | | | |
| Paid in capital | | | $ | 6,132,643,899 |
| Total accumulated earnings (loss) | | | | 2,337,605,412 |
| Net Assets | | | $ | 8,470,249,311 |
| | | | | |
| Net Asset Value and Maximum Offering Price | | | | |
| Diversified International : | | | | |
Net Asset Value, offering price and redemption price per share ($7,407,098,489 ÷ 196,837,314 shares) | | | $ | 37.63 |
| Class K : | | | | |
Net Asset Value, offering price and redemption price per share ($1,063,150,822 ÷ 28,294,923 shares) | | | $ | 37.57 |
| Statement of Operations |
| | | | Year ended October 31, 2023 |
| Investment Income | | | | |
| Dividends | | | $ | 201,773,151 |
| Income from Fidelity Central Funds (including $1,021,302 from security lending) | | | | 15,370,759 |
| Income before foreign taxes withheld | | | $ | 217,143,910 |
| Less foreign taxes withheld | | | | (20,267,828) |
| Total Income | | | | 196,876,082 |
| Expenses | | | | |
| Management fee | | | | |
| Basic fee | $ | 60,921,458 | | |
| Performance adjustment | | (16,733,518) | | |
| Transfer agent fees | | 12,883,023 | | |
| Accounting fees | | 1,675,465 | | |
| Custodian fees and expenses | | 689,416 | | |
| Independent trustees' fees and expenses | | 54,672 | | |
| Registration fees | | 91,740 | | |
| Audit | | 147,081 | | |
| Legal | | 9,397 | | |
| Miscellaneous | | 45,289 | | |
| Total expenses before reductions | | 59,784,023 | | |
| Expense reductions | | (570,294) | | |
| Total expenses after reductions | | | | 59,213,729 |
| Net Investment income (loss) | | | | 137,662,353 |
| Realized and Unrealized Gain (Loss) | | | | |
| Net realized gain (loss) on: | | | | |
| Investment Securities: | | | | |
| Unaffiliated issuers (net of foreign taxes of $3,642,253) | | 287,423,473 | | |
| Redemptions in-kind | | 127,948,104 | | |
| Foreign currency transactions | | (1,221,539) | | |
| Total net realized gain (loss) | | | | 414,150,038 |
| Change in net unrealized appreciation (depreciation) on: | | | | |
| Investment Securities: | | | | |
| Unaffiliated issuers(net of decrease in deferred foreign taxes of $4,528,945) | | 525,555,117 | | |
| Assets and liabilities in foreign currencies | | 2,405,657 | | |
| Total change in net unrealized appreciation (depreciation) | | | | 527,960,774 |
| Net gain (loss) | | | | 942,110,812 |
| Net increase (decrease) in net assets resulting from operations | | | $ | 1,079,773,165 |
| Statement of Changes in Net Assets |
| |
| | Year ended October 31, 2023 | | Year ended October 31, 2022 |
| Increase (Decrease) in Net Assets | | | | |
| Operations | | | | |
| Net investment income (loss) | $ | 137,662,353 | $ | 92,319,482 |
| Net realized gain (loss) | | 414,150,038 | | 665,262,947 |
| Change in net unrealized appreciation (depreciation) | | 527,960,774 | | (4,726,389,174) |
| Net increase (decrease) in net assets resulting from operations | | 1,079,773,165 | | (3,968,806,745) |
| Distributions to shareholders | | (123,021,576) | | (1,395,065,915) |
| | | | | |
| Share transactions - net increase (decrease) | | (1,113,876,746) | | (845,248,874) |
| | | | | |
| Total increase (decrease) in net assets | | (157,125,157) | | (6,209,121,534) |
| | | | | |
| Net Assets | | | | |
| Beginning of period | | 8,627,374,468 | | 14,836,496,002 |
| End of period | $ | 8,470,249,311 | $ | 8,627,374,468 |
| | | | | |
| | | | | |
Financial Highlights
| Fidelity® Diversified International Fund |
| |
| Years ended October 31, | | 2023 | | 2022 | | 2021 | | 2020 | | 2019 |
Selected Per-Share Data | | | | | | | | | | |
| Net asset value, beginning of period | $ | 33.99 | $ | 53.38 | $ | 41.61 | $ | 38.67 | $ | 35.72 |
| Income from Investment Operations | | | | | | | | | | |
Net investment income (loss) A,B | | .57 | | .33 | | .16 | | .10 | | .50 |
| Net realized and unrealized gain (loss) | | 3.56 | | (14.58) | | 12.07 | | 3.37 | | 4.77 |
| Total from investment operations | | 4.13 | | (14.25) | | 12.23 | | 3.47 | | 5.27 |
| Distributions from net investment income | | (.14) | | (.57) | | (.02) | | (.53) | | (.43) |
| Distributions from net realized gain | | (.35) | | (4.57) | | (.45) | | - | | (1.89) |
| Total distributions | | (.49) | | (5.14) | | (.46) C | | (.53) | | (2.32) |
| Net asset value, end of period | $ | 37.63 | $ | 33.99 | $ | 53.38 | $ | 41.61 | $ | 38.67 |
Total Return D | | 12.15% | | (29.36)% | | 29.58% | | 9.07% | | 16.02% |
Ratios to Average Net Assets B,E,F | | | | | | | | | | |
| Expenses before reductions | | .65% | | .99% | | 1.01% | | 1.05% | | .75% |
| Expenses net of fee waivers, if any | | .65% | | .99% | | 1.01% | | 1.05% | | .75% |
| Expenses net of all reductions | | .65% | | .99% | | 1.01% | | 1.04% | | .75% |
| Net investment income (loss) | | 1.45% | | .80% | | .32% | | .26% | | 1.42% |
| Supplemental Data | | | | | | | | | | |
| Net assets, end of period (000 omitted) | $ | 7,407,098 | $ | 7,230,515 | $ | 11,529,722 | $ | 9,419,192 | $ | 8,734,682 |
Portfolio turnover rate G,H | | 22% | | 20% | | 29% | | 29% | | 37% |
ACalculated based on average shares outstanding during the period.
BNet investment income (loss) is affected by the timing of the declaration of dividends by any underlying mutual funds or exchange-traded funds (ETFs). Net investment income (loss) of any mutual funds or ETFs is not included in the Fund's net investment income (loss) ratio.
CTotal distributions per share do not sum due to rounding.
DTotal returns would have been lower if certain expenses had not been reduced during the applicable periods shown.
EFees and expenses of any underlying mutual funds or exchange-traded funds (ETFs) are not included in the Fund's expense ratio. The Fund indirectly bears its proportionate share of these expenses. For additional expense information related to investments in Fidelity Central Funds, please refer to the "Investments in Fidelity Central Funds" note found in the Notes to Financial Statements section of the most recent Annual or Semi-Annual report.
FExpense ratios reflect operating expenses of the class. Expenses before reductions do not reflect amounts reimbursed, waived, or reduced through arrangements with the investment adviser, brokerage services, or other offset arrangements, if applicable, and do not represent the amount paid by the class during periods when reimbursements, waivers or reductions occur.
GAmount does not include the portfolio activity of any underlying mutual funds or exchange-traded funds (ETFs).
HPortfolio turnover rate excludes securities received or delivered in-kind.
| Fidelity® Diversified International Fund Class K |
| |
| Years ended October 31, | | 2023 | | 2022 | | 2021 | | 2020 | | 2019 |
Selected Per-Share Data | | | | | | | | | | |
| Net asset value, beginning of period | $ | 33.94 | $ | 53.32 | $ | 41.56 | $ | 38.61 | $ | 35.68 |
| Income from Investment Operations | | | | | | | | | | |
Net investment income (loss) A,B | | .61 | | .38 | | .21 | | .15 | | .55 |
| Net realized and unrealized gain (loss) | | 3.56 | | (14.58) | | 12.06 | | 3.37 | | 4.74 |
| Total from investment operations | | 4.17 | | (14.20) | | 12.27 | | 3.52 | | 5.29 |
| Distributions from net investment income | | (.19) | | (.62) | | (.06) | | (.57) | | (.47) |
| Distributions from net realized gain | | (.35) | | (4.57) | | (.45) | | - | | (1.89) |
| Total distributions | | (.54) | | (5.18) C | | (.51) | | (.57) | | (2.36) |
| Net asset value, end of period | $ | 37.57 | $ | 33.94 | $ | 53.32 | $ | 41.56 | $ | 38.61 |
Total Return D | | 12.29% | | (29.31)% | | 29.71% | | 9.22% | | 16.14% |
Ratios to Average Net Assets B,E,F | | | | | | | | | | |
| Expenses before reductions | | .54% | | .88% | | .91% | | .94% | | .63% |
| Expenses net of fee waivers, if any | | .54% | | .88% | | .91% | | .94% | | .63% |
| Expenses net of all reductions | | .54% | | .88% | | .91% | | .93% | | .63% |
| Net investment income (loss) | | 1.56% | | .91% | | .42% | | .38% | | 1.54% |
| Supplemental Data | | | | | | | | | | |
| Net assets, end of period (000 omitted) | $ | 1,063,151 | $ | 1,396,859 | $ | 3,306,774 | $ | 3,761,267 | $ | 4,246,651 |
Portfolio turnover rate G,H | | 22% | | 20% | | 29% | | 29% | | 37% |
ACalculated based on average shares outstanding during the period.
BNet investment income (loss) is affected by the timing of the declaration of dividends by any underlying mutual funds or exchange-traded funds (ETFs). Net investment income (loss) of any mutual funds or ETFs is not included in the Fund's net investment income (loss) ratio.
CTotal distributions per share do not sum due to rounding.
DTotal returns would have been lower if certain expenses had not been reduced during the applicable periods shown.
EFees and expenses of any underlying mutual funds or exchange-traded funds (ETFs) are not included in the Fund's expense ratio. The Fund indirectly bears its proportionate share of these expenses. For additional expense information related to investments in Fidelity Central Funds, please refer to the "Investments in Fidelity Central Funds" note found in the Notes to Financial Statements section of the most recent Annual or Semi-Annual report.
FExpense ratios reflect operating expenses of the class. Expenses before reductions do not reflect amounts reimbursed, waived, or reduced through arrangements with the investment adviser, brokerage services, or other offset arrangements, if applicable, and do not represent the amount paid by the class during periods when reimbursements, waivers or reductions occur.
GAmount does not include the portfolio activity of any underlying mutual funds or exchange-traded funds (ETFs).
HPortfolio turnover rate excludes securities received or delivered in-kind.
For the period ended October 31, 2023
1. Organization.
Fidelity Diversified International Fund (the Fund) is a fund of Fidelity Investment Trust (the Trust) and is authorized to issue an unlimited number of shares. The Trust is registered under the Investment Company Act of 1940, as amended (the 1940 Act), as an open-end management investment company organized as a Massachusetts business trust. The Fund offers Diversified International and Class K shares, each of which has equal rights as to assets and voting privileges. Each class has exclusive voting rights with respect to matters that affect that class.
2. Investments in Fidelity Central Funds.
Funds may invest in Fidelity Central Funds, which are open-end investment companies generally available only to other investment companies and accounts managed by the investment adviser and its affiliates. The Schedule of Investments lists any Fidelity Central Funds held as an investment as of period end, but does not include the underlying holdings of each Fidelity Central Fund. An investing fund indirectly bears its proportionate share of the expenses of the underlying Fidelity Central Funds.
Based on its investment objective, each Fidelity Central Fund may invest or participate in various investment vehicles or strategies that are similar to those of the investing fund. These strategies are consistent with the investment objectives of the investing fund and may involve certain economic risks which may cause a decline in value of each of the Fidelity Central Funds and thus a decline in the value of the investing fund.
| Fidelity Central Fund | Investment Manager | Investment Objective | Investment Practices | Expense RatioA |
| Fidelity Money Market Central Funds | Fidelity Management & Research Company LLC (FMR) | Each fund seeks to obtain a high level of current income consistent with the preservation of capital and liquidity. | Short-term Investments | Less than .005% |
A Expenses expressed as a percentage of average net assets and are as of each underlying Central Fund's most recent annual or semi-annual shareholder report.
A complete unaudited list of holdings for each Fidelity Central Fund is available upon request or at the Securities and Exchange Commission website at www.sec.gov. In addition, the financial statements of the Fidelity Central Funds which contain the significant accounting policies (including investment valuation policies) of those funds, and are not covered by the Report of Independent Registered Public Accounting Firm, are available on the Securities and Exchange Commission website or upon request.
3. Significant Accounting Policies.
The Fund is an investment company and applies the accounting and reporting guidance of the Financial Accounting Standards Board (FASB) Accounting Standards Codification Topic 946 Financial Services - Investment Companies. The financial statements have been prepared in conformity with accounting principles generally accepted in the United States of America (GAAP), which require management to make certain estimates and assumptions at the date of the financial statements. Actual results could differ from those estimates. Subsequent events, if any, through the date that the financial statements were issued have been evaluated in the preparation of the financial statements. The Fund's Schedule of Investments lists any underlying mutual funds or exchange-traded funds (ETFs) but does not include the underlying holdings of these funds. The following summarizes the significant accounting policies of the Fund:
Investment Valuation. Investments are valued as of 4:00 p.m. Eastern time on the last calendar day of the period. The Board of Trustees (the Board) has designated the Fund's investment adviser as the valuation designee responsible for the fair valuation function and performing fair value determinations as needed. The investment adviser has established a Fair Value Committee (the Committee) to carry out the day-to-day fair valuation responsibilities and has adopted policies and procedures to govern the fair valuation process and the activities of the Committee. In accordance with these fair valuation policies and procedures, which have been approved by the Board, the Fund attempts to obtain prices from one or more third party pricing services or brokers to value its investments. When current market prices, quotations or currency exchange rates are not readily available or reliable, investments will be fair valued in good faith by the Committee, in accordance with the policies and procedures. Factors used in determining fair value vary by investment type and may include market or investment specific events, transaction data, estimated cash flows, and market observations of comparable investments. The frequency that the fair valuation procedures are used cannot be predicted and they may be utilized to a significant extent. The Committee manages the Fund's fair valuation practices and maintains the fair valuation policies and procedures. The Fund's investment adviser reports to the Board information regarding the fair valuation process and related material matters.
The Fund categorizes the inputs to valuation techniques used to value its investments into a disclosure hierarchy consisting of three levels as shown below:
Level 1 - unadjusted quoted prices in active markets for identical investments
Level 2 - other significant observable inputs (including quoted prices for similar investments, interest rates, prepayment speeds, etc.)
Level 3 - unobservable inputs (including the Fund's own assumptions based on the best information available)
Valuation techniques used to value the Fund's investments by major category are as follows:
Equity securities, including restricted securities, for which market quotations are readily available, are valued at the last reported sale price or official closing price as reported by a third party pricing service on the primary market or exchange on which they are traded and are categorized as Level 1 in the hierarchy. In the event there were no sales during the day or closing prices are not available, securities are valued at the last quoted bid price or may be valued using the last available price and are generally categorized as Level 2 in the hierarchy. For foreign equity securities, when market or security specific events arise, comparisons to the valuation of American Depositary Receipts (ADRs), futures contracts, Exchange-Traded Funds (ETFs) and certain indexes as well as quoted prices for similar securities may be used and would be categorized as Level 2 in the hierarchy. For equity securities, including restricted securities, where observable inputs are limited, assumptions about market activity and risk are used and these securities may be categorized as Level 3 in the hierarchy.
Investments in open-end mutual funds, including the Fidelity Central Funds, are valued at their closing net asset value (NAV) each business day and are categorized as Level 1 in the hierarchy.
Changes in valuation techniques may result in transfers in or out of an assigned level within the disclosure hierarchy. The aggregate value of investments by input level as of October 31, 2023 is included at the end of the Fund's Schedule of Investments.
Foreign Currency. Foreign-denominated assets, including investment securities, and liabilities are translated into U.S. dollars at the exchange rates at period end. Purchases and sales of investment securities, income and dividends received, and expenses denominated in foreign currencies are translated into U.S. dollars at the exchange rate in effect on the transaction date.
The effects of exchange rate fluctuations on investments are included with the net realized and unrealized gain (loss) on investment securities. Other foreign currency transactions resulting in realized and unrealized gain (loss) are disclosed separately.
Realized gains and losses on foreign currency transactions arise from the disposition of foreign currency, realized changes in the value of foreign currency between the trade and settlement dates on security transactions, and the difference between the amounts of dividends, interest and foreign withholding taxes recorded on transaction date and the U.S. dollar equivalent of the amounts actually received or paid. Unrealized gains and losses on assets and liabilities in foreign currencies arise from changes in the value of foreign currency, and from assets and liabilities denominated in foreign currencies, other than investments, which are held at period end.
Investment Transactions and Income. For financial reporting purposes, the Fund's investment holdings and NAV include trades executed through the end of the last business day of the period. The NAV per share for processing shareholder transactions is calculated as of the close of business of the New York Stock Exchange (NYSE), normally 4:00 p.m. Eastern time and includes trades executed through the end of the prior business day. Gains and losses on securities sold are determined on the basis of identified cost and include proceeds received from litigation. Commissions paid to certain brokers with whom the investment adviser, or its affiliates, places trades on behalf of a fund include an amount in addition to trade execution, which may be rebated back to a fund. Any such rebates are included in net realized gain (loss) on investments in the Statement of Operations. Dividend income is recorded on the ex-dividend date, except for certain dividends from foreign securities where the ex-dividend date may have passed, which are recorded as soon as the Fund is informed of the ex-dividend date. Non-cash dividends included in dividend income, if any, are recorded at the fair market value of the securities received. Income and capital gain distributions from Fidelity Central Funds, if any, are recorded on the ex-dividend date. Investment income is recorded net of foreign taxes withheld where recovery of such taxes is uncertain. Funds may file withholding tax reclaims in certain jurisdictions to recover a portion of amounts previously withheld. Any withholding tax reclaims income is included in the Statement of Operations in foreign taxes withheld. Any receivables for withholding tax reclaims are included in the Statement of Assets and Liabilities in reclaims receivable. The Fund has filed tax reclaims for previously withheld taxes on dividends earned in certain European Union (EU) countries. These additional filings are subject to various administrative proceedings by the local jurisdictions' tax authorities within the EU, as well as a number of related judicial proceedings. Income recognized for EU reclaims is included with other reclaims in the Statement of Operations in foreign taxes withheld. These reclaims are recorded when the amount is known and there are no significant uncertainties on collectability.
Class Allocations and Expenses. Investment income, realized and unrealized capital gains and losses, common expenses of a fund, and certain fund-level expense reductions, if any, are allocated daily on a pro-rata basis to each class based on the relative net assets of each class to the total net assets of a fund. Each class differs with respect to transfer agent and distribution and service plan fees incurred, as applicable. Certain expense reductions may also differ by class, if applicable. For the reporting period, the allocated portion of income and expenses to each class as a percent of its average net assets may vary due to the timing of recording these transactions in relation to fluctuating net assets of the classes. Expenses directly attributable to a fund are charged to that fund. Expenses attributable to more than one fund are allocated among the respective funds on the basis of relative net assets or other appropriate methods. Expenses included in the accompanying financial statements reflect the expenses of that fund and do not include any expenses associated with any underlying mutual funds or exchange-traded funds (ETFs). Although not included in a fund's expenses, a fund indirectly bears its proportionate share of these expenses through the net asset value of each underlying mutual fund or exchange-traded fund (ETF). Expense estimates are accrued in the period to which they relate and adjustments are made when actual amounts are known.
Deferred Trustee Compensation. Under a Deferred Compensation Plan (the Plan) for certain Funds, certain independent Trustees have elected to defer receipt of a portion of their annual compensation. Deferred amounts are invested in affiliated mutual funds, are marked-to-market and remain in a fund until distributed in accordance with the Plan. The investment of deferred amounts and the offsetting payable to the Trustees presented below are included in the accompanying Statement of Assets and Liabilities in other receivables and other payables and accrued expenses, as applicable.
| Fidelity Diversified International Fund | $1,190,235 |
Income Tax Information and Distributions to Shareholders. Each year, the Fund intends to qualify as a regulated investment company under Subchapter M of the Internal Revenue Code, including distributing substantially all of its taxable income and realized gains. As a result, no provision for U.S. Federal income taxes is required. As of October 31, 2023, the Fund did not have any unrecognized tax benefits in the financial statements; nor is the Fund aware of any tax positions for which it is reasonably possible that the total amounts of unrecognized tax benefits will significantly change in the next twelve months. The Fund files a U.S. federal tax return, in addition to state and local tax returns as required. The Fund's federal income tax returns are subject to examination by the Internal Revenue Service (IRS) for a period of three fiscal years after they are filed. State and local tax returns may be subject to examination for an additional fiscal year depending on the jurisdiction. Foreign taxes are provided for based on the Fund's understanding of the tax rules and rates that exist in the foreign markets in which it invests. The Fund is subject to a tax imposed on capital gains by certain countries in which it invests. An estimated deferred tax liability for net unrealized appreciation on the applicable securities is included in Other payables and accrued expenses on the Statement of Assets & Liabilities.
Distributions are declared and recorded on the ex-dividend date. Income and capital gain distributions are declared separately for each class. Income and capital gain distributions are determined in accordance with income tax regulations, which may differ from GAAP. In addition, the Fund claimed a portion of the payment made to redeeming shareholders as a distribution for income tax purposes.
Capital accounts within the financial statements are adjusted for permanent book-tax differences. These adjustments have no impact on net assets or the results of operations. Capital accounts are not adjusted for temporary book-tax differences which will reverse in a subsequent period.
Book-tax differences are primarily due to foreign currency transactions, certain foreign taxes, passive foreign investment companies (PFIC), redemptions in kind, deferred trustees compensation and losses deferred due to wash sales.
As of period end, the cost and unrealized appreciation (depreciation) in securities, and derivatives if applicable, for federal income tax purposes were as follows:
| Gross unrealized appreciation | $2,388,380,898 |
| Gross unrealized depreciation | (426,032,052) |
| Net unrealized appreciation (depreciation) | $1,962,348,846 |
| Tax Cost | $6,730,309,791 |
The tax-based components of distributable earnings as of period end were as follows:
| Undistributed ordinary income | $149,050,159 |
| Undistributed long-term capital gain | $239,619,867 |
| Net unrealized appreciation (depreciation) on securities and other investments | $1,960,855,851 |
The tax character of distributions paid was as follows:
| | October 31, 2023 | October 31, 2022 |
| Ordinary Income | $36,550,051 | $ 156,793,723 |
| Long-term Capital Gains | 86,471,525 | 1,238,272,192 |
| Total | $123,021,576 | $ 1,395,065,915 |
Restricted Securities (including Private Placements). Funds may invest in securities that are subject to legal or contractual restrictions on resale. These securities generally may be resold in transactions exempt from registration or to the public if the securities are registered. Disposal of these securities may involve time-consuming negotiations and expense, and prompt sale at an acceptable price may be difficult. Information regarding restricted securities held at period end is included at the end of the Schedule of Investments, if applicable.
4. Purchases and Sales of Investments.
Purchases and sales of securities, other than short-term securities and in-kind transactions, as applicable, are noted in the table below.
| | Purchases ($) | Sales ($) |
| Fidelity Diversified International Fund | 1,959,691,879 | 2,671,442,980 |
Unaffiliated Redemptions In-Kind. Shares that were redeemed in-kind for investments, including accrued interest and cash, if any, are shown in the table below. The net realized gain or loss on investments delivered through in-kind redemptions is included in the "Net realized gain (loss) on: Redemptions in-kind" line in the accompanying Statement of Operations. The amount of the in-kind redemptions is included in share transactions in the accompanying Statement of Changes in Net Assets. There was no gain or loss for federal income tax purposes.
| | Shares | Total net realized gain or loss ($) | Total Proceeds ($) | Participating classes |
| Fidelity Diversified International Fund | 9,154,362 | 127,948,104 | 353,583,024 | Diversified International and Class K |
Prior Fiscal Year Unaffiliated Redemptions In-Kind. Shares that were redeemed in-kind for investments, including accrued interest and cash, if any, are shown in the table below; along with realized gain or loss on investments delivered through in-kind redemptions. The amount of the in-kind redemptions is included in share transactions in the accompanying Statement of Changes in Net Assets. There was no gain or loss for federal income tax purposes.
| | Shares | Total net realized gain or loss ($) | Total Proceeds ($) | Participating classes |
| Fidelity Diversified International Fund | 26,571,800 | 431,418,900 | 1,092,083,654 | Diversified International and Class K |
5. Fees and Other Transactions with Affiliates.
Management Fee. Fidelity Management & Research Company LLC (the investment adviser) and its affiliates provide the Fund with investment management related services for which the Fund pays a monthly management fee. The management fee is the sum of an individual fund fee rate that is based on an annual rate of .424% of the Fund's average net assets and an annualized group fee rate that averaged .23% during the period. The group fee rate is based upon the monthly average net assets of a group of registered investment companies with which the investment adviser has management contracts. The group fee rate decreases as assets under management increase and increases as assets under management decrease. In addition, the management fee is subject to a performance adjustment (up to a maximum of +/- .20% of the Fund's average net assets over a 36 month performance period). The upward or downward adjustment to the management fee is based on the relative investment performance of the Fund as compared to its benchmark index, the MSCI EAFE Index, over the same 36 month performance period. For the reporting period, the total annual management fee rate, including the performance adjustment, was .47% of the Fund's average net assets. The performance adjustment included in the management fee rate may be higher or lower than the maximum performance adjustment rate due to the difference between the average net assets for the reporting and performance periods.
Transfer Agent Fees. Fidelity Investments Institutional Operations Company LLC (FIIOC), an affiliate of the investment adviser, is the transfer, dividend disbursing and shareholder servicing agent for each class of the Fund. FIIOC receives account fees and asset-based fees that vary according to the account size and type of account of the shareholders of the respective classes of the Fund, except for Class K. FIIOC receives an asset-based fee of Class K's average net assets. FIIOC pays for typesetting, printing and mailing of shareholder reports, except proxy statements.
For the period, transfer agent fees for each class were as follows:
| | Amount | % of Class-Level Average Net Assets |
| Diversified International | $ 12,288,952 | .15 |
| Class K | 594,071 | .04 |
| | $ 12,883,023 | |
During November 2023, the Board approved a change in the transfer agent fees effective December 1, 2023 to a fixed annual rate of class-level average net assets as follows:
| | % of Class-Level Average Net Assets |
| Fidelity Diversified International Fund | 0.1519% |
Accounting Fees. Fidelity Service Company, Inc. (FSC), an affiliate of the investment adviser, maintains the Fund's accounting records. The accounting fee is based on the level of average net assets for each month. For the period, the fees were equivalent to the following annual rates:
| | % of Average Net Assets |
| Fidelity Diversified International Fund | .02 |
During November 2023, the Board approved a change in the accounting fees effective December 1, 2023 to a fixed annual rate of average net assets as follows:
| | % of Average Net Assets |
| Fidelity Diversified International Fund | 0.0173% |
Brokerage Commissions. A portion of portfolio transactions were placed with brokerage firms which are affiliates of the investment adviser. Brokerage commissions are included in net realized gain (loss) and change in net unrealized appreciation (depreciation) in the Statement of Operations. The commissions paid to these affiliated firms were as follows:
| | Amount |
| Fidelity Diversified International Fund | $ 2,386 |
Interfund Trades. Funds may purchase from or sell securities to other Fidelity Funds under procedures adopted by the Board. The procedures have been designed to ensure these interfund trades are executed in accordance with Rule 17a-7 of the 1940 Act. Any interfund trades are included within the respective purchases and sales amounts shown in the Purchases and Sales of Investments note. Interfund trades during the period are noted in the table below.
| | Purchases ($) | Sales ($) | Realized Gain (Loss) ($) |
| Fidelity Diversified International Fund | 37,949,420 | 105,784,317 | 19,141,388 |
6. Committed Line of Credit.
Certain Funds participate with other funds managed by the investment adviser or an affiliate in a $4.25 billion credit facility (the "line of credit") to be utilized for temporary or emergency purposes to fund shareholder redemptions or for other short-term liquidity purposes. The participating funds have agreed to pay commitment fees on their pro-rata portion of the line of credit, which are reflected in Miscellaneous expenses on the Statement of Operations, and are listed below. During the period, there were no borrowings on this line of credit.
| | Amount |
| Fidelity Diversified International Fund | $17,026 |
7. Security Lending.
Funds lend portfolio securities from time to time in order to earn additional income. Lending agents are used, including National Financial Services (NFS), an affiliate of the investment adviser. Pursuant to a securities lending agreement, NFS will receive a fee, which is capped at 9.9% of a fund's daily lending revenue, for its services as lending agent. A fund may lend securities to certain qualified borrowers, including NFS. On the settlement date of the loan, a fund receives collateral (in the form of U.S. Treasury obligations, letters of credit and/or cash) against the loaned securities and maintains collateral in an amount not less than 100% of the market value of the loaned securities during the period of the loan. The market value of the loaned securities is determined at the close of business of a fund and any additional required collateral is delivered to a fund on the next business day. A fund or borrower may terminate the loan at any time, and if the borrower defaults on its obligation to return the securities loaned because of insolvency or other reasons, a fund may apply collateral received from the borrower against the obligation. A fund may experience delays and costs in recovering the securities loaned. Any cash collateral received is invested in the Fidelity Securities Lending Cash Central Fund. Any loaned securities are identified as such in the Schedule of Investments, and the value of loaned securities and cash collateral at period end, as applicable, are presented in the Statement of Assets and Liabilities. Security lending income represents the income earned on investing cash collateral, less rebates paid to borrowers and any lending agent fees associated with the loan, plus any premium payments received for lending certain types of securities. Security lending income is presented in the Statement of Operations as a component of income from Fidelity Central Funds. Affiliated security lending activity, if any, was as follows:
| | Total Security Lending Fees Paid to NFS | Security Lending Income From Securities Loaned to NFS | Value of Securities Loaned to NFS at Period End |
| Fidelity Diversified International Fund | $110,034 | $- | $- |
8.Expense Reductions.
Through arrangements with the Fund's custodian, credits realized as a result of certain uninvested cash balances were used to reduce the Fund's expenses. During the period, custodian credits reduced the Fund's expenses by $2,146.
In addition, during the period the investment adviser or an affiliate reimbursed and/or waived a portion of fund-level operating expenses in the amount of $568,148.
9. Distributions to Shareholders.
Distributions to shareholders of each class were as follows:
| | Year ended October 31, 2023 | Year ended October 31, 2022 |
| Fidelity Diversified International Fund | | |
| Distributions to shareholders | | |
| Diversified International | $ 101,421,493 | $1,090,192,506 |
| Class K | 21,600,083 | 304,873,409 |
Total | $ 123,021,576 | $1,395,065,915 |
10. Share Transactions.
Share transactions for each class were as follows and may contain in-kind transactions, automatic conversions between classes or exchanges between affiliated funds:
| | Shares | Shares | Dollars | Dollars |
| | Year ended October 31, 2023 | Year ended October 31, 2022 | Year ended October 31, 2023 | Year ended October 31, 2022 |
| Fidelity Diversified International Fund | | | | |
| Diversified International | | | | |
| Shares sold | 9,925,175 | 48,845,163 | $388,397,522 | $1,865,951,127 |
| Reinvestment of distributions | 2,350,798 | 20,838,853 | 87,708,207 | 979,217,736 |
| Shares redeemed | (28,189,272) | (72,908,948) | (1,089,796,435) | (2,840,874,254) |
| Net increase (decrease) | (15,913,299) | (3,224,932) | $(613,690,706) | $4,294,609 |
| Class K | | | | |
| Shares sold | 5,103,356 | 7,508,397 | $201,187,282 | $323,341,358 |
| Reinvestment of distributions | 580,051 | 6,500,350 | 21,589,508 | 304,736,401 |
| Shares redeemed | (18,542,037) | (34,873,914) | (722,962,830) | (1,477,621,242) |
| Net increase (decrease) | (12,858,630) | (20,865,167) | $(500,186,040) | $(849,543,483) |
11. Other.
A fund's organizational documents provide former and current trustees and officers with a limited indemnification against liabilities arising in connection with the performance of their duties to the fund. In the normal course of business, a fund may also enter into contracts that provide general indemnifications. A fund's maximum exposure under these arrangements is unknown as this would be dependent on future claims that may be made against a fund. The risk of material loss from such claims is considered remote.
In addition, at the end of the period, the following mutual funds managed by the investment adviser or its affiliates were the owners of record of 10% or more of the total outstanding shares.
| | Strategic Advisers Fidelity International Fund |
| Fidelity Diversified International Fund | 19% |
Mutual funds managed by the investment adviser or its affiliates, in aggregate, were the owners of record of more than 20% of the total outstanding shares.
| Fund | % of shares held |
| Fidelity Diversified International Fund | 25% |
12. Risk and Uncertainties.
Many factors affect a fund's performance. Developments that disrupt global economies and financial markets, such as pandemics, epidemics, outbreaks of infectious diseases, war, terrorism, and environmental disasters, may significantly affect a fund's investment performance. The effects of these developments to a fund will be impacted by the types of securities in which a fund invests, the financial condition, industry, economic sector, and geographic location of an issuer, and a fund's level of investment in the securities of that issuer. Significant concentrations in security types, issuers, industries, sectors, and geographic locations may magnify the factors that affect a fund's performance.
Average annual total return reflects the change in the value of an investment, assuming reinvestment of distributions from dividend income and capital gains (the profits earned upon the sale of securities that have grown in value, if any) and assuming a constant rate of performance each year. The hypothetical investment and the average annual total returns do not reflect the deduction of taxes that a shareholder would pay on fund distributions or the redemption of fund shares. During periods of reimbursement by Fidelity, a fund's total return will be greater than it would be had the reimbursement not occurred. How a fund did yesterday is no guarantee of how it will do tomorrow.
| Average Annual Total Returns |
| | | | |
Periods ended October 31, 2023 | Past 1 year | Past 5 years | Past 10 years |
| Fidelity® International Capital Appreciation Fund | 15.89% | 7.21% | 6.29% |
| $10,000 Over 10 Years |
| |
Let's say hypothetically that $10,000 was invested in Fidelity® International Capital Appreciation Fund on October 31, 2013. The chart shows how the value of your investment would have changed, and also shows how the MSCI ACWI (All Country World Index) ex USA Index performed over the same period. |
|
|
Fidelity® International Capital Appreciation Fund
Market Recap:
International (non-U.S.) equities gained 12.27% for the 12 months ending October 31, 2023, according to the MSCI ACWI (All Country World Index) ex USA Index, as global economic expansion and a slowing in the pace of inflation in some markets provided a favorable backdrop for risk assets. After returning -15.86% in 2022, the index's upturn has been largely driven by a narrow set of companies in the information technology and communication services sectors, in part due to excitement for generative artificial intelligence applications. The index gained 14.07% year to date through July, including strong gains in both June (+4.50%) and July (+4.07%). The rally for international equities sputtered for the next three months (-11.33%) amid a stalling pattern in disinflationary trends, heightened global recession and geopolitical risks, soaring yields on longer-term U.S. government bonds and particularly weak economic conditions in the eurozone and China. The three-month decline left non-U.S. stocks up 1.15% year to date through October. Currency fluctuation also helped bolster non-U.S. equity performance overall. For the full 12 months, nearly all regions advanced, with Europe ex U.K. (+18%) and Japan (+17%) leading, whereas Canada (-0.38%) lagged by the widest margin. Each of the 11 sectors advanced, with information technology (+21%) and consumer discretionary (+19%) leading the way. Energy and industrials each rose about 14%. Conversely, four defensive-oriented sectors lagged by the widest margin: real estate (+4%), health care (+6%), consumer staples (+7%) and utilities (+8%).
Comments from Portfolio Manager Sammy Simnegar:
For the fiscal year ending October 31, 2023, the fund gained 15.89%, versus 12.27% for the benchmark MSCI All Country World ex USA (Net MA) Index. From a regional standpoint, stock picks and an overweight in Europe ex-U.K., along with an underweight in emerging markets and security selection in Canada, meaningfully aided the fund's performance versus the benchmark. By sector, investment choices in consumer discretionary contributed most on a relative basis. Picks among health care stocks also boosted relative performance. The top individual relative contributor was an overweight stake in ASM International (+85%), followed by outsized exposure to Novo-Nordisk (+78%), one of our biggest holdings this period. A larger-than-benchmark position in Ferrari (+55%) was another plus. In contrast, on a regional basis, stock selection and a notable underweight in Japan, in addition to subpar picks and an overweight in the U.K., detracted from the fund's relative result. By sector, picks among industrials and financials stocks meaningfully detracted this period. The fund's stake in Brookfield returned approximately -28% and was the largest individual relative detractor. A non-benchmark stake in SolarEdge Technologies (-19%) pressured relative performance as well. Untimely ownership of Siemens (-20%) also detracted. Neither SolarEdge Technologies nor Siemens was held by the fund at period end. Notable changes in positioning include increased exposure to equity markets in India and a lower allocation to Switzerland. By sector, meaningful changes in positioning include increased exposure to financials and materials.
The views expressed above reflect those of the portfolio manager(s) only through the end of the period as stated on the cover of this report and do not necessarily represent the views of Fidelity or any other person in the Fidelity organization. Any such views are subject to change at any time based upon market or other conditions and Fidelity disclaims any responsibility to update such views. These views may not be relied on as investment advice and, because investment decisions for a Fidelity fund are based on numerous factors, may not be relied on as an indication of trading intent on behalf of any Fidelity fund.
Fidelity® International Capital Appreciation Fund
Top Holdings (% of Fund's net assets) |
| |
| Taiwan Semiconductor Manufacturing Co. Ltd. (Taiwan, Semiconductors & Semiconductor Equipment) | 3.2 | |
| Novo Nordisk A/S Series B (Denmark, Pharmaceuticals) | 3.0 | |
| ASML Holding NV (Netherlands) (Netherlands, Semiconductors & Semiconductor Equipment) | 2.7 | |
| LVMH Moet Hennessy Louis Vuitton SE (France, Textiles, Apparel & Luxury Goods) | 2.4 | |
| AstraZeneca PLC (United Kingdom) (United Kingdom, Pharmaceuticals) | 2.3 | |
| L'Oreal SA (France, Personal Care Products) | 2.0 | |
| RELX PLC (London Stock Exchange) (United Kingdom, Professional Services) | 1.9 | |
| Dassault Systemes SA (France, Software) | 1.8 | |
| Keyence Corp. (Japan, Electronic Equipment, Instruments & Components) | 1.8 | |
| Air Liquide SA (France, Chemicals) | 1.8 | |
| | 22.9 | |
| |
| Market Sectors (% of Fund's net assets) |
| |
| Information Technology | 22.9 | |
| Industrials | 21.8 | |
| Financials | 18.2 | |
| Consumer Discretionary | 13.8 | |
| Health Care | 8.1 | |
| Materials | 7.8 | |
| Consumer Staples | 5.3 | |
| |
Asset Allocation (% of Fund's net assets) |
|
|
Geographic Diversification (% of Fund's net assets) |
|
* Includes Short-Term investments and Net Other Assets (Liabilities). Percentages are adjusted for the effect of derivatives, if applicable. |
| |
Fidelity® International Capital Appreciation Fund
Showing Percentage of Net Assets
| Common Stocks - 97.9% |
| | | Shares | Value ($) |
| Brazil - 1.4% | | | |
| MercadoLibre, Inc. (a) | | 48,228 | 59,838,409 |
| Canada - 10.7% | | | |
| Alimentation Couche-Tard, Inc. Class A (multi-vtg.) | | 1,357,290 | 73,886,297 |
| Brookfield Asset Management Ltd. Class A (b) | | 1,843,417 | 52,850,765 |
| Canadian National Railway Co. | | 586,762 | 62,084,434 |
| Canadian Pacific Kansas City Ltd. | | 933,592 | 66,285,537 |
| CGI, Inc. Class A (sub. vtg.) (a) | | 557,228 | 53,796,059 |
| Constellation Software, Inc. | | 36,392 | 72,954,840 |
| Constellation Software, Inc. warrants 8/22/28 (a)(c) | | 38,399 | 3 |
| Thomson Reuters Corp. | | 521,364 | 62,450,892 |
TOTAL CANADA | | | 444,308,827 |
| China - 1.6% | | | |
| PDD Holdings, Inc. ADR (a) | | 664,604 | 67,404,138 |
| Denmark - 4.5% | | | |
| DSV A/S | | 437,715 | 65,281,046 |
| Novo Nordisk A/S Series B | | 1,282,051 | 123,687,455 |
TOTAL DENMARK | | | 188,968,501 |
| France - 12.9% | | | |
| Air Liquide SA | | 434,455 | 74,444,843 |
| Capgemini SA | | 372,710 | 65,868,587 |
| Dassault Systemes SA | | 1,845,785 | 76,034,104 |
| Hermes International SCA | | 38,106 | 70,946,999 |
| L'Oreal SA | | 194,414 | 81,718,176 |
| LVMH Moet Hennessy Louis Vuitton SE | | 141,950 | 101,626,345 |
| Safran SA | | 421,129 | 65,788,581 |
TOTAL FRANCE | | | 536,427,635 |
| Germany - 2.3% | | | |
| Infineon Technologies AG | | 2,101,868 | 61,396,028 |
| SAP SE | | 256,700 | 34,431,770 |
TOTAL GERMANY | | | 95,827,798 |
| India - 9.7% | | | |
| Axis Bank Ltd. | | 5,099,761 | 60,158,346 |
| HCL Technologies Ltd. | | 4,636,090 | 71,089,206 |
| HDFC Bank Ltd. | | 4,005,072 | 71,047,035 |
| ICICI Bank Ltd. | | 6,522,067 | 71,733,170 |
| ITC Ltd. | | 11,720,634 | 60,314,509 |
| Larsen & Toubro Ltd. | | 1,911,402 | 67,243,975 |
TOTAL INDIA | | | 401,586,241 |
| Indonesia - 1.5% | | | |
| PT Bank Central Asia Tbk | | 115,323,884 | 63,534,310 |
| Ireland - 1.5% | | | |
| Kingspan Group PLC (Ireland) | | 921,677 | 61,907,374 |
| Italy - 1.7% | | | |
| Ferrari NV (Italy) | | 228,600 | 69,057,214 |
| Japan - 6.3% | | | |
| Hoya Corp. | | 494,618 | 47,616,193 |
| Keyence Corp. | | 194,762 | 75,396,015 |
| Shin-Etsu Chemical Co. Ltd. | | 2,224,286 | 66,513,666 |
| Tokyo Electron Ltd. | | 556,477 | 73,531,587 |
TOTAL JAPAN | | | 263,057,461 |
| Netherlands - 6.0% | | | |
| ASM International NV (Netherlands) | | 161,306 | 66,308,356 |
| ASML Holding NV (Netherlands) | | 184,742 | 111,052,187 |
| Wolters Kluwer NV | | 568,329 | 72,823,353 |
TOTAL NETHERLANDS | | | 250,183,896 |
| Sweden - 1.6% | | | |
| Atlas Copco AB (A Shares) | | 5,028,172 | 65,109,908 |
| Switzerland - 5.0% | | | |
| Compagnie Financiere Richemont SA Series A | | 609,054 | 71,853,460 |
| Sika AG | | 260,477 | 62,109,010 |
| UBS Group AG | | 3,077,601 | 71,793,210 |
TOTAL SWITZERLAND | | | 205,755,680 |
| Taiwan - 3.2% | | | |
| Taiwan Semiconductor Manufacturing Co. Ltd. | | 8,036,949 | 131,162,522 |
| United Kingdom - 10.1% | | | |
| Ashtead Group PLC | | 1,030,566 | 58,922,372 |
| AstraZeneca PLC (United Kingdom) | | 754,541 | 94,471,364 |
| BAE Systems PLC | | 3,619,154 | 48,664,527 |
| Compass Group PLC | | 2,945,117 | 74,250,482 |
| London Stock Exchange Group PLC | | 630,096 | 63,573,596 |
| RELX PLC (London Stock Exchange) | | 2,283,162 | 79,745,633 |
TOTAL UNITED KINGDOM | | | 419,627,974 |
| United States of America - 17.9% | | | |
| Aon PLC | | 20,564 | 6,362,502 |
| AutoZone, Inc. (a) | | 23,885 | 59,166,250 |
| Linde PLC | | 180,297 | 68,902,302 |
| Marsh & McLennan Companies, Inc. | | 321,820 | 61,033,163 |
| Martin Marietta Materials, Inc. | | 125,232 | 51,212,374 |
| MasterCard, Inc. Class A | | 146,900 | 55,285,815 |
| Moody's Corp. | | 202,892 | 62,490,736 |
| NVIDIA Corp. | | 140,244 | 57,191,503 |
| S&P Global, Inc. | | 169,404 | 59,174,511 |
| Schneider Electric SA | | 475,402 | 73,144,055 |
| UnitedHealth Group, Inc. | | 133,101 | 71,283,572 |
| Visa, Inc. Class A | | 248,743 | 58,479,479 |
| Waste Connections, Inc. (Canada) | | 458,899 | 59,419,437 |
TOTAL UNITED STATES OF AMERICA | | | 743,145,699 |
| TOTAL COMMON STOCKS (Cost $3,280,844,393) | | | 4,066,903,587 |
| | | | |
| Money Market Funds - 2.0% |
| | | Shares | Value ($) |
| Fidelity Cash Central Fund 5.40% (d) | | 69,937,147 | 69,951,135 |
| Fidelity Securities Lending Cash Central Fund 5.40% (d)(e) | | 12,704,955 | 12,706,225 |
| TOTAL MONEY MARKET FUNDS (Cost $82,657,360) | | | 82,657,360 |
| | | | |
| TOTAL INVESTMENT IN SECURITIES - 99.9% (Cost $3,363,501,753) | 4,149,560,947 |
NET OTHER ASSETS (LIABILITIES) - 0.1% | 2,754,780 |
| NET ASSETS - 100.0% | 4,152,315,727 |
| | |
Legend
| (b) | Security or a portion of the security is on loan at period end. |
| (d) | Affiliated fund that is generally available only to investment companies and other accounts managed by Fidelity Investments. The rate quoted is the annualized seven-day yield of the fund at period end. A complete unaudited listing of the fund's holdings as of its most recent quarter end is available upon request. In addition, each Fidelity Central Fund's financial statements, which are not covered by the Fund's Report of Independent Registered Public Accounting Firm, are available on the SEC's website or upon request. |
| (e) | Investment made with cash collateral received from securities on loan. |
Affiliated Central Funds
Fiscal year to date information regarding the Fund's investments in Fidelity Central Funds, including the ownership percentage, is presented below.
| Affiliate | Value, beginning of period ($) | Purchases ($) | Sales Proceeds ($) | Dividend Income ($) | Realized Gain (loss) ($) | Change in Unrealized appreciation (depreciation) ($) | Value, end of period ($) | % ownership, end of period |
| Fidelity Cash Central Fund 5.40% | 44,808,754 | 1,237,996,723 | 1,212,854,342 | 2,239,788 | - | - | 69,951,135 | 0.2% |
| Fidelity Securities Lending Cash Central Fund 5.40% | 10,588,050 | 935,687,674 | 933,569,499 | 92,024 | - | - | 12,706,225 | 0.1% |
| Total | 55,396,804 | 2,173,684,397 | 2,146,423,841 | 2,331,812 | - | - | 82,657,360 | |
| | | | | | | | | |
Amounts in the dividend income column in the above table include any capital gain distributions from underlying funds, which are presented in the corresponding line item in the Statement of Operations, if applicable.
Amounts in the dividend income column for Fidelity Securities Lending Cash Central Fund represents the income earned on investing cash collateral, less rebates paid to borrowers and any lending agent fees associated with the loan, plus any premium payments received for lending certain types of securities.
Amounts included in the purchases and sales proceeds columns may include in-kind transactions, if applicable.
Investment Valuation
The following is a summary of the inputs used, as of October 31, 2023, involving the Fund's assets and liabilities carried at fair value. The inputs or methodology used for valuing securities may not be an indication of the risk associated with investing in those securities. For more information on valuation inputs, and their aggregation into the levels used below, please refer to the Investment Valuation section in the accompanying Notes to Financial Statements.
| Valuation Inputs at Reporting Date: |
| Description | Total ($) | Level 1 ($) | Level 2 ($) | Level 3 ($) |
Investments in Securities: | | | | |
|
| Equities: | | | | |
Consumer Discretionary | 574,143,297 | 326,413,010 | 247,730,287 | - |
Consumer Staples | 215,918,982 | 73,886,297 | 142,032,685 | - |
Financials | 757,516,638 | 427,470,181 | 330,046,457 | - |
Health Care | 337,058,584 | 71,283,572 | 265,775,012 | - |
Industrials | 908,871,124 | 509,174,445 | 399,696,679 | - |
Information Technology | 950,212,767 | 250,250,758 | 699,962,006 | 3 |
Materials | 323,182,195 | 182,223,686 | 140,958,509 | - |
|
| Money Market Funds | 82,657,360 | 82,657,360 | - | - |
| Total Investments in Securities: | 4,149,560,947 | 1,923,359,309 | 2,226,201,635 | 3 |
Fidelity® International Capital Appreciation Fund
| Statement of Assets and Liabilities |
| | | | October 31, 2023 |
| | | | | |
| Assets | | | | |
| Investment in securities, at value (including securities loaned of $12,244,957) - See accompanying schedule: | | | | |
Unaffiliated issuers (cost $3,280,844,393) | $ | 4,066,903,587 | | |
Fidelity Central Funds (cost $82,657,360) | | 82,657,360 | | |
| | | | | |
| | | | | |
| Total Investment in Securities (cost $3,363,501,753) | | | $ | 4,149,560,947 |
| Cash | | | | 1,954,516 |
| Foreign currency held at value (cost $519,895) | | | | 519,771 |
| Receivable for investments sold | | | | 28,089,025 |
| Receivable for fund shares sold | | | | 2,927,320 |
| Dividends receivable | | | | 1,914,749 |
| Reclaims receivable | | | | 6,490,152 |
| Distributions receivable from Fidelity Central Funds | | | | 320,006 |
| Prepaid expenses | | | | 6,220 |
| Other receivables | | | | 1,869,881 |
Total assets | | | | 4,193,652,587 |
| Liabilities | | | | |
| Payable for investments purchased | $ | 14,123,226 | | |
| Payable for fund shares redeemed | | 4,571,651 | | |
| Accrued management fee | | 1,671,389 | | |
| Other affiliated payables | | 697,198 | | |
| Other payables and accrued expenses | | 7,567,171 | | |
| Collateral on securities loaned | | 12,706,225 | | |
| Total Liabilities | | | | 41,336,860 |
| Net Assets | | | $ | 4,152,315,727 |
| Net Assets consist of: | | | | |
| Paid in capital | | | $ | 3,701,772,503 |
| Total accumulated earnings (loss) | | | | 450,543,224 |
| Net Assets | | | $ | 4,152,315,727 |
Net Asset Value, offering price and redemption price per share ($4,152,315,727 ÷ 183,715,394 shares) | | | $ | 22.60 |
| Statement of Operations |
| | | | Year ended October 31, 2023 |
| Investment Income | | | | |
| Dividends | | | $ | 57,347,101 |
| Foreign Tax Reclaims | | | | 4,160,355 |
| Income from Fidelity Central Funds (including $92,024 from security lending) | | | | 2,331,812 |
| Income before foreign taxes withheld | | | $ | 63,839,268 |
| Less foreign taxes withheld | | | | (8,926,310) |
| Total Income | | | | 54,912,958 |
| Expenses | | | | |
| Management fee | | | | |
| Basic fee | $ | 29,178,011 | | |
| Performance adjustment | | (3,606,338) | | |
| Transfer agent fees | | 6,806,238 | | |
| Accounting fees | | 1,467,784 | | |
| Custodian fees and expenses | | 391,550 | | |
| Independent trustees' fees and expenses | | 24,607 | | |
| Registration fees | | 69,403 | | |
| Audit | | 116,027 | | |
| Legal | | 6,849 | | |
| Interest | | 107,651 | | |
| Miscellaneous | | 20,378 | | |
| Total expenses before reductions | | 34,582,160 | | |
| Expense reductions | | (262,852) | | |
| Total expenses after reductions | | | | 34,319,308 |
| Net Investment income (loss) | | | | 20,593,650 |
| Realized and Unrealized Gain (Loss) | | | | |
| Net realized gain (loss) on: | | | | |
| Investment Securities: | | | | |
| Unaffiliated issuers (net of foreign taxes of $1,177,119) | | 79,860,619 | | |
| Foreign currency transactions | | 346,767 | | |
| Total net realized gain (loss) | | | | 80,207,386 |
| Change in net unrealized appreciation (depreciation) on: | | | | |
| Investment Securities: | | | | |
| Unaffiliated issuers(net of increase in deferred foreign taxes of $5,877,899) | | 499,077,072 | | |
| Assets and liabilities in foreign currencies | | 459,026 | | |
| Total change in net unrealized appreciation (depreciation) | | | | 499,536,098 |
| Net gain (loss) | | | | 579,743,484 |
| Net increase (decrease) in net assets resulting from operations | | | $ | 600,337,134 |
| Statement of Changes in Net Assets |
| |
| | Year ended October 31, 2023 | | Year ended October 31, 2022 |
| Increase (Decrease) in Net Assets | | | | |
| Operations | | | | |
| Net investment income (loss) | $ | 20,593,650 | $ | 4,726,060 |
| Net realized gain (loss) | | 80,207,386 | | (421,962,871) |
| Change in net unrealized appreciation (depreciation) | | 499,536,098 | | (1,404,871,443) |
| Net increase (decrease) in net assets resulting from operations | | 600,337,134 | | (1,822,108,254) |
| Distributions to shareholders | | (1,939,358) | | (482,951,298) |
| | | | | |
| Share transactions | | | | |
| Proceeds from sales of shares | | 435,752,549 | | 1,823,528,638 |
| Reinvestment of distributions | | 1,625,726 | | 405,305,190 |
| Cost of shares redeemed | | (706,723,757) | | (1,952,267,374) |
| | | | | |
Net increase (decrease) in net assets resulting from share transactions | | (269,345,482) | | 276,566,454 |
| Total increase (decrease) in net assets | | 329,052,294 | | (2,028,493,098) |
| | | | | |
| Net Assets | | | | |
| Beginning of period | | 3,823,263,433 | | 5,851,756,531 |
| End of period | $ | 4,152,315,727 | $ | 3,823,263,433 |
| | | | | |
| Other Information | | | | |
| Shares | | | | |
| Sold | | 18,847,487 | | 78,948,065 |
| Issued in reinvestment of distributions | | 72,968 | | 14,830,047 |
| Redeemed | | (31,187,640) | | (87,008,238) |
| Net increase (decrease) | | (12,267,185) | | 6,769,874 |
| | | | | |
Financial Highlights
| Fidelity® International Capital Appreciation Fund |
| |
| Years ended October 31, | | 2023 | | 2022 | | 2021 | | 2020 | | 2019 |
Selected Per-Share Data | | | | | | | | | | |
| Net asset value, beginning of period | $ | 19.51 | $ | 30.93 | $ | 24.57 | $ | 22.41 | $ | 18.84 |
| Income from Investment Operations | | | | | | | | | | |
Net investment income (loss) A,B | | .11 | | .02 | | (.02) | | .06 | | .17 C |
| Net realized and unrealized gain (loss) | | 2.99 | | (8.86) | | 6.74 | | 2.86 | | 3.93 |
| Total from investment operations | | 3.10 | | (8.84) | | 6.72 | | 2.92 | | 4.10 |
| Distributions from net investment income | | (.01) | | - | | (.05) | | (.13) | | (.08) |
| Distributions from net realized gain | | - | | (2.58) | | (.31) | | (.62) | | (.45) |
| Total distributions | | (.01) | | (2.58) | | (.36) | | (.76) D | | (.53) |
| Net asset value, end of period | $ | 22.60 | $ | 19.51 | $ | 30.93 | $ | 24.57 | $ | 22.41 |
Total Return E | | 15.89% | | (30.97)% | | 27.56% | | 13.35% | | 22.45% |
Ratios to Average Net Assets B,F,G | | | | | | | | | | |
| Expenses before reductions | | .80% | | .99% | | 1.00% | | 1.03% | | 1.01% |
| Expenses net of fee waivers, if any | | .79% | | .98% | | 1.00% | | 1.03% | | 1.01% |
| Expenses net of all reductions | | .79% | | .98% | | 1.00% | | .99% | | 1.00% |
| Net investment income (loss) | | .48% | | .10% | | (.08)% | | .25% | | .81% C |
| Supplemental Data | | | | | | | | | | |
| Net assets, end of period (000 omitted) | $ | 4,152,316 | $ | 3,823,263 | $ | 5,851,757 | $ | 4,514,343 | $ | 3,480,765 |
Portfolio turnover rate H | | 79% | | 112% I | | 141% | | 135% | | 131% I |
ACalculated based on average shares outstanding during the period.
BNet investment income (loss) is affected by the timing of the declaration of dividends by any underlying mutual funds or exchange-traded funds (ETFs). Net investment income (loss) of any mutual funds or ETFs is not included in the Fund's net investment income (loss) ratio.
CNet investment income per share reflects one or more large, non-recurring dividend(s) which amounted to $.08 per share. Excluding such non-recurring dividend(s), the ratio of net investment income (loss) to average net assets would have been .40%.
DTotal distributions per share do not sum due to rounding.
ETotal returns would have been lower if certain expenses had not been reduced during the applicable periods shown.
FFees and expenses of any underlying mutual funds or exchange-traded funds (ETFs) are not included in the Fund's expense ratio. The Fund indirectly bears its proportionate share of these expenses. For additional expense information related to investments in Fidelity Central Funds, please refer to the "Investments in Fidelity Central Funds" note found in the Notes to Financial Statements section of the most recent Annual or Semi-Annual report.
GExpense ratios reflect operating expenses of the class. Expenses before reductions do not reflect amounts reimbursed, waived, or reduced through arrangements with the investment adviser, brokerage services, or other offset arrangements, if applicable, and do not represent the amount paid by the class during periods when reimbursements, waivers or reductions occur.
HAmount does not include the portfolio activity of any underlying mutual funds or exchange-traded funds (ETFs).
IPortfolio turnover rate excludes securities received or delivered in-kind.
For the period ended October 31, 2023
1. Organization.
Fidelity International Capital Appreciation Fund (the Fund) is a fund of Fidelity Investment Trust (the Trust) and is authorized to issue an unlimited number of shares. Share transactions on the Statement of Changes in Net Assets may contain exchanges between affiliated funds. The Trust is registered under the Investment Company Act of 1940, as amended (the 1940 Act), as an open-end management investment company organized as a Massachusetts business trust. The Fund's investments in emerging markets can be subject to social, economic, regulatory, and political uncertainties and can be extremely volatile.
2. Investments in Fidelity Central Funds.
Funds may invest in Fidelity Central Funds, which are open-end investment companies generally available only to other investment companies and accounts managed by the investment adviser and its affiliates. The Schedule of Investments lists any Fidelity Central Funds held as an investment as of period end, but does not include the underlying holdings of each Fidelity Central Fund. An investing fund indirectly bears its proportionate share of the expenses of the underlying Fidelity Central Funds.
Based on its investment objective, each Fidelity Central Fund may invest or participate in various investment vehicles or strategies that are similar to those of the investing fund. These strategies are consistent with the investment objectives of the investing fund and may involve certain economic risks which may cause a decline in value of each of the Fidelity Central Funds and thus a decline in the value of the investing fund.
| Fidelity Central Fund | Investment Manager | Investment Objective | Investment Practices | Expense RatioA |
| Fidelity Money Market Central Funds | Fidelity Management & Research Company LLC (FMR) | Each fund seeks to obtain a high level of current income consistent with the preservation of capital and liquidity. | Short-term Investments | Less than .005% |
A Expenses expressed as a percentage of average net assets and are as of each underlying Central Fund's most recent annual or semi-annual shareholder report.
A complete unaudited list of holdings for each Fidelity Central Fund is available upon request or at the Securities and Exchange Commission website at www.sec.gov. In addition, the financial statements of the Fidelity Central Funds which contain the significant accounting policies (including investment valuation policies) of those funds, and are not covered by the Report of Independent Registered Public Accounting Firm, are available on the Securities and Exchange Commission website or upon request.
3. Significant Accounting Policies.
The Fund is an investment company and applies the accounting and reporting guidance of the Financial Accounting Standards Board (FASB) Accounting Standards Codification Topic 946 Financial Services - Investment Companies. The financial statements have been prepared in conformity with accounting principles generally accepted in the United States of America (GAAP), which require management to make certain estimates and assumptions at the date of the financial statements. Actual results could differ from those estimates. Subsequent events, if any, through the date that the financial statements were issued have been evaluated in the preparation of the financial statements. The Fund's Schedule of Investments lists any underlying mutual funds or exchange-traded funds (ETFs) but does not include the underlying holdings of these funds. The following summarizes the significant accounting policies of the Fund:
Investment Valuation. Investments are valued as of 4:00 p.m. Eastern time on the last calendar day of the period. The Board of Trustees (the Board) has designated the Fund's investment adviser as the valuation designee responsible for the fair valuation function and performing fair value determinations as needed. The investment adviser has established a Fair Value Committee (the Committee) to carry out the day-to-day fair valuation responsibilities and has adopted policies and procedures to govern the fair valuation process and the activities of the Committee. In accordance with these fair valuation policies and procedures, which have been approved by the Board, the Fund attempts to obtain prices from one or more third party pricing services or brokers to value its investments. When current market prices, quotations or currency exchange rates are not readily available or reliable, investments will be fair valued in good faith by the Committee, in accordance with the policies and procedures. Factors used in determining fair value vary by investment type and may include market or investment specific events, transaction data, estimated cash flows, and market observations of comparable investments. The frequency that the fair valuation procedures are used cannot be predicted and they may be utilized to a significant extent. The Committee manages the Fund's fair valuation practices and maintains the fair valuation policies and procedures. The Fund's investment adviser reports to the Board information regarding the fair valuation process and related material matters.
The Fund categorizes the inputs to valuation techniques used to value its investments into a disclosure hierarchy consisting of three levels as shown below:
Level 1 - unadjusted quoted prices in active markets for identical investments
Level 2 - other significant observable inputs (including quoted prices for similar investments, interest rates, prepayment speeds, etc.)
Level 3 - unobservable inputs (including the Fund's own assumptions based on the best information available)
Valuation techniques used to value the Fund's investments by major category are as follows:
Equity securities, including restricted securities, for which market quotations are readily available, are valued at the last reported sale price or official closing price as reported by a third party pricing service on the primary market or exchange on which they are traded and are categorized as Level 1 in the hierarchy. In the event there were no sales during the day or closing prices are not available, securities are valued at the last quoted bid price or may be valued using the last available price and are generally categorized as Level 2 in the hierarchy. For foreign equity securities, when market or security specific events arise, comparisons to the valuation of American Depositary Receipts (ADRs), futures contracts, Exchange-Traded Funds (ETFs) and certain indexes as well as quoted prices for similar securities may be used and would be categorized as Level 2 in the hierarchy. For equity securities, including restricted securities, where observable inputs are limited, assumptions about market activity and risk are used and these securities may be categorized as Level 3 in the hierarchy.
Investments in open-end mutual funds, including the Fidelity Central Funds, are valued at their closing net asset value (NAV) each business day and are categorized as Level 1 in the hierarchy.
Changes in valuation techniques may result in transfers in or out of an assigned level within the disclosure hierarchy. The aggregate value of investments by input level as of October 31, 2023 is included at the end of the Fund's Schedule of Investments.
Foreign Currency. Certain Funds may use foreign currency contracts to facilitate transactions in foreign-denominated securities. Gains and losses from these transactions may arise from changes in the value of the foreign currency or if the counterparties do not perform under the contracts' terms.
Foreign-denominated assets, including investment securities, and liabilities are translated into U.S. dollars at the exchange rates at period end. Purchases and sales of investment securities, income and dividends received, and expenses denominated in foreign currencies are translated into U.S. dollars at the exchange rate in effect on the transaction date.
The effects of exchange rate fluctuations on investments are included with the net realized and unrealized gain (loss) on investment securities. Other foreign currency transactions resulting in realized and unrealized gain (loss) are disclosed separately.
Investment Transactions and Income. For financial reporting purposes, the Fund's investment holdings and NAV include trades executed through the end of the last business day of the period. The NAV per share for processing shareholder transactions is calculated as of the close of business of the New York Stock Exchange (NYSE), normally 4:00 p.m. Eastern time and includes trades executed through the end of the prior business day. Gains and losses on securities sold are determined on the basis of identified cost and include proceeds received from litigation. Commissions paid to certain brokers with whom the investment adviser, or its affiliates, places trades on behalf of a fund include an amount in addition to trade execution, which may be rebated back to a fund. Any such rebates are included in net realized gain (loss) on investments in the Statement of Operations. Dividend income is recorded on the ex-dividend date, except for certain dividends from foreign securities where the ex-dividend date may have passed, which are recorded as soon as the Fund is informed of the ex-dividend date. Non-cash dividends included in dividend income, if any, are recorded at the fair market value of the securities received. Income and capital gain distributions from Fidelity Central Funds, if any, are recorded on the ex-dividend date. Certain distributions received by the Fund represent a return of capital or capital gain. The Fund determines the components of these distributions subsequent to the ex-dividend date, based upon receipt of tax filings or other correspondence relating to the underlying investment. These distributions are recorded as a reduction of cost of investments and/or as a realized gain. Investment income is recorded net of foreign taxes withheld where recovery of such taxes is uncertain. Funds may file withholding tax reclaims in certain jurisdictions to recover a portion of amounts previously withheld. Any withholding tax reclaims income is included in the Statement of Operations in foreign tax reclaims. Any receivables for withholding tax reclaims are included in the Statement of Assets and Liabilities in reclaims receivable. The Fund has filed tax reclaims for previously withheld taxes on dividends earned in certain European Union (EU) countries. These additional filings are subject to various administrative proceedings by the local jurisdictions' tax authorities within the EU, as well as a number of related judicial proceedings. Income recognized for EU reclaims is included with other reclaims in the Statement of Operations in foreign tax reclaims. These reclaims are recorded when the amount is known and there are no significant uncertainties on collectability.
Expenses. Expenses directly attributable to a fund are charged to that fund. Expenses attributable to more than one fund are allocated among the respective funds on the basis of relative net assets or other appropriate methods. Expenses included in the accompanying financial statements reflect the expenses of that fund and do not include any expenses associated with any underlying mutual funds or exchange-traded funds. Although not included in a fund's expenses, a fund indirectly bears its proportionate share of these expenses through the net asset value of each underlying mutual fund or exchange-traded fund. Expense estimates are accrued in the period to which they relate and adjustments are made when actual amounts are known.
Income Tax Information and Distributions to Shareholders. Each year, the Fund intends to qualify as a regulated investment company under Subchapter M of the Internal Revenue Code, including distributing substantially all of its taxable income and realized gains. As a result, no provision for U.S. Federal income taxes is required. As of October 31, 2023, the Fund did not have any unrecognized tax benefits in the financial statements; nor is the Fund aware of any tax positions for which it is reasonably possible that the total amounts of unrecognized tax benefits will significantly change in the next twelve months. The Fund files a U.S. federal tax return, in addition to state and local tax returns as required. The Fund's federal income tax returns are subject to examination by the Internal Revenue Service (IRS) for a period of three fiscal years after they are filed. State and local tax returns may be subject to examination for an additional fiscal year depending on the jurisdiction. Foreign taxes are provided for based on the Fund's understanding of the tax rules and rates that exist in the foreign markets in which it invests. The Fund is subject to a tax imposed on capital gains by certain countries in which it invests. An estimated deferred tax liability for net unrealized appreciation on the applicable securities is included in Other payables and accrued expenses on the Statement of Assets & Liabilities.
Distributions are declared and recorded on the ex-dividend date. Income and capital gain distributions are determined in accordance with income tax regulations, which may differ from GAAP. In addition, the Fund claimed a portion of the payment made to redeeming shareholders as a distribution for income tax purposes.
Capital accounts within the financial statements are adjusted for permanent book-tax differences. These adjustments have no impact on net assets or the results of operations. Capital accounts are not adjusted for temporary book-tax differences which will reverse in a subsequent period.
Book-tax differences are primarily due to foreign currency transactions, certain foreign taxes, passive foreign investment companies (PFIC), capital loss carryforwards and losses deferred due to wash sales.
As of period end, the cost and unrealized appreciation (depreciation) in securities, and derivatives if applicable, for federal income tax purposes were as follows:
| Gross unrealized appreciation | $853,122,151 |
| Gross unrealized depreciation | (79,493,642) |
| Net unrealized appreciation (depreciation) | $773,628,509 |
| Tax Cost | $3,375,932,438 |
The tax-based components of distributable earnings as of period end were as follows:
| Undistributed ordinary income | $18,603,385 |
| Capital loss carryforward | $(333,784,644) |
| Net unrealized appreciation (depreciation) on securities and other investments | $773,141,128 |
Capital loss carryforwards are only available to offset future capital gains of the Fund to the extent provided by regulations and may be limited. The capital loss carryforward information presented below, including any applicable limitation, is estimated as of fiscal period end and is subject to adjustment.
Short-term | $(333,784,644) |
| Total capital loss carryforward | $(333,784,644) |
The tax character of distributions paid was as follows:
| | October 31, 2023 | October 31, 2022 |
| Ordinary Income | $1,939,358 | $136,649,011 |
| Long-term Capital Gains | - | 346,302,287 |
| Total | $1,939,358 | $482,951,298 |
4. Purchases and Sales of Investments.
Purchases and sales of securities, other than short-term securities and in-kind transactions, as applicable, are noted in the table below.
| | Purchases ($) | Sales ($) |
| Fidelity International Capital Appreciation Fund | 3,337,279,852 | 3,631,125,524 |
Prior Fiscal Year Unaffiliated Redemptions In-Kind. Shares that were redeemed in-kind for investments, including accrued interest and cash, if any, are shown in the table below; along with realized gain or loss on investments delivered through in-kind redemptions. The amount of the in-kind redemptions is included in share transactions in the accompanying Statement of Changes in Net Assets. There was no gain or loss for federal income tax purposes.
| | Shares | Total net realized gain or loss ($) | Total Proceeds ($) |
| Fidelity International Capital Appreciation Fund | 237,890 | 2,446,488 | 6,501,540 |
5. Fees and Other Transactions with Affiliates.
Management Fee. Fidelity Management & Research Company LLC (the investment adviser) and its affiliates provide the Fund with investment management related services for which the Fund pays a monthly management fee. The management fee is the sum of an individual fund fee rate that is based on an annual rate of .45% of the Fund's average net assets and an annualized group fee rate that averaged .23% during the period. The group fee rate is based upon the monthly average net assets of a group of registered investment companies with which the investment adviser has management contracts. The group fee rate decreases as assets under management increase and increases as assets under management decrease. In addition, the management fee is subject to a performance adjustment (up to a maximum of +/- .20% of the Fund's average net assets over a 36 month performance period). The upward or downward adjustment to the management fee is based on the Fund's relative investment performance as compared to its benchmark index, the MSCI All Country World ex USA Index, over the same 36 month performance period. For the reporting period, the total annual management fee rate, including the performance adjustment, was .59% of the Fund's average net assets. The performance adjustment included in the management fee rate may be higher or lower than the maximum performance adjustment rate due to the difference between the average net assets for the reporting and performance periods.
Transfer Agent Fees. Fidelity Investments Institutional Operations Company LLC (FIIOC), an affiliate of the investment adviser, is the Fund's transfer, dividend disbursing and shareholder servicing agent. FIIOC receives account fees and asset-based fees that vary according to account size and type of account. FIIOC pays for typesetting, printing and mailing of shareholder reports, except proxy statements. For the period, the transfer agent fees were equivalent to an annual rate of .16% of average net assets.
During November 2023, the Board approved a change in the transfer agent fees effective December 1, 2023 to a fixed annual rate of class-level average net assets as follows:
| | % of Class-Level Average Net Assets |
| Fidelity International Capital Appreciation Fund | 0.1559% |
Accounting Fees. Fidelity Service Company, Inc. (FSC), an affiliate of the investment adviser, maintains the Fund's accounting records. The accounting fee is based on the level of average net assets for each month. For the period, the fees were equivalent to the following annual rates:
| | % of Average Net Assets |
| Fidelity International Capital Appreciation Fund | .03 |
During November 2023, the Board approved a change in the accounting fees effective December 1, 2023 to a fixed annual rate of average net assets as follows:
| | % of Average Net Assets |
| Fidelity International Captal Appreciation Fund | 0.0322% |
Brokerage Commissions. A portion of portfolio transactions were placed with brokerage firms which are affiliates of the investment adviser. Brokerage commissions are included in net realized gain (loss) and change in net unrealized appreciation (depreciation) in the Statement of Operations. The commissions paid to these affiliated firms were as follows:
| | Amount |
| Fidelity International Capital Appreciation Fund | $ 4,191 |
Interfund Lending Program. Pursuant to an Exemptive Order issued by the Securities and Exchange Commission (the SEC), the Fund, along with other registered investment companies having management contracts with Fidelity Management & Research Company LLC (FMR), or other affiliated entities of FMR, may participate in an interfund lending program. This program provides an alternative credit facility allowing the Fund to borrow from, or lend money to, other participating affiliated funds. At period end, there were no interfund loans outstanding. Activity in this program during the period for which loans were outstanding was as follows:
| | Borrower or Lender | Average Loan Balance | Weighted Average Interest Rate | Interest Expense |
Fidelity International Capital Appreciation Fund | Borrower | $ 22,972,657 | 4.82% | $107,651 |
Interfund Trades. Funds may purchase from or sell securities to other Fidelity Funds under procedures adopted by the Board. The procedures have been designed to ensure these interfund trades are executed in accordance with Rule 17a-7 of the 1940 Act. Any interfund trades are included within the respective purchases and sales amounts shown in the Purchases and Sales of Investments note. Interfund trades during the period are noted in the table below.
| | Purchases ($) | Sales ($) | Realized Gain (Loss) ($) |
| Fidelity International Capital Appreciation Fund | 81,775,248 | 191,162,086 | 4,959,364 |
6. Committed Line of Credit.
Certain Funds participate with other funds managed by the investment adviser or an affiliate in a $4.25 billion credit facility (the "line of credit") to be utilized for temporary or emergency purposes to fund shareholder redemptions or for other short-term liquidity purposes. The participating funds have agreed to pay commitment fees on their pro-rata portion of the line of credit, which are reflected in Miscellaneous expenses on the Statement of Operations, and are listed below. During the period, there were no borrowings on this line of credit.
| | Amount |
| Fidelity International Capital Appreciation Fund | $7,759 |
7. Security Lending.
Funds lend portfolio securities from time to time in order to earn additional income. Lending agents are used, including National Financial Services (NFS), an affiliate of the investment adviser. Pursuant to a securities lending agreement, NFS will receive a fee, which is capped at 9.9% of a fund's daily lending revenue, for its services as lending agent. A fund may lend securities to certain qualified borrowers, including NFS. On the settlement date of the loan, a fund receives collateral (in the form of U.S. Treasury obligations, letters of credit and/or cash) against the loaned securities and maintains collateral in an amount not less than 100% of the market value of the loaned securities during the period of the loan. The market value of the loaned securities is determined at the close of business of a fund and any additional required collateral is delivered to a fund on the next business day. A fund or borrower may terminate the loan at any time, and if the borrower defaults on its obligation to return the securities loaned because of insolvency or other reasons, a fund may apply collateral received from the borrower against the obligation. A fund may experience delays and costs in recovering the securities loaned. Any cash collateral received is invested in the Fidelity Securities Lending Cash Central Fund. Any loaned securities are identified as such in the Schedule of Investments, and the value of loaned securities and cash collateral at period end, as applicable, are presented in the Statement of Assets and Liabilities. Security lending income represents the income earned on investing cash collateral, less rebates paid to borrowers and any lending agent fees associated with the loan, plus any premium payments received for lending certain types of securities. Security lending income is presented in the Statement of Operations as a component of income from Fidelity Central Funds. Affiliated security lending activity, if any, was as follows:
| | Total Security Lending Fees Paid to NFS | Security Lending Income From Securities Loaned to NFS | Value of Securities Loaned to NFS at Period End |
| Fidelity International Capital Appreciation Fund | $9,923 | $- | $- |
8. Expense Reductions.
During the period the investment adviser or an affiliate reimbursed and/or waived a portion of operating expenses in the amount of $262,852.
9. Other.
A fund's organizational documents provide former and current trustees and officers with a limited indemnification against liabilities arising in connection with the performance of their duties to the fund. In the normal course of business, a fund may also enter into contracts that provide general indemnifications. A fund's maximum exposure under these arrangements is unknown as this would be dependent on future claims that may be made against a fund. The risk of material loss from such claims is considered remote.
At the end of the period, the following mutual funds managed by the investment adviser or its affiliates were the owners of record of 10% or more of the total outstanding shares.
| | Strategic Advisers Fidelity International Fund |
| Fidelity International Capital Appreciation Fund | 36% |
Mutual funds managed by the investment adviser or its affiliates, in aggregate, were the owners of record of more than 20% of the total outstanding shares.
| Fund | % of shares held |
| Fidelity International Capital Appreciation Fund | 40% |
10. Risk and Uncertainties.
Many factors affect a fund's performance. Developments that disrupt global economies and financial markets, such as pandemics, epidemics, outbreaks of infectious diseases, war, terrorism, and environmental disasters, may significantly affect a fund's investment performance. The effects of these developments to a fund will be impacted by the types of securities in which a fund invests, the financial condition, industry, economic sector, and geographic location of an issuer, and a fund's level of investment in the securities of that issuer. Significant concentrations in security types, issuers, industries, sectors, and geographic locations may magnify the factors that affect a fund's performance.
Average annual total return reflects the change in the value of an investment, assuming reinvestment of distributions from dividend income and capital gains (the profits earned upon the sale of securities that have grown in value, if any) and assuming a constant rate of performance each year. The hypothetical investment and the average annual total returns do not reflect the deduction of taxes that a shareholder would pay on fund distributions or the redemption of fund shares. During periods of reimbursement by Fidelity, a fund's total return will be greater than it would be had the reimbursement not occurred. How a fund did yesterday is no guarantee of how it will do tomorrow.
| Average Annual Total Returns |
| | | | |
Periods ended October 31, 2023 | Past 1 year | Past 5 years | Past 10 years |
| Fidelity® Overseas Fund | 12.95% | 5.23% | 5.03% |
| Class K | 13.06% | 5.34% | 5.15% |
| $10,000 Over 10 Years |
| |
Let's say hypothetically that $10,000 was invested in Fidelity® Overseas Fund, a class of the fund, on October 31, 2013. The chart shows how the value of your investment would have changed, and also shows how the MSCI EAFE Index performed over the same period. |
|
|
Fidelity® Overseas Fund
Market Recap:
International (non-U.S.) equities gained 12.27% for the 12 months ending October 31, 2023, according to the MSCI ACWI (All Country World Index) ex USA Index, as global economic expansion and a slowing in the pace of inflation in some markets provided a favorable backdrop for risk assets. After returning -15.86% in 2022, the index's upturn has been largely driven by a narrow set of companies in the information technology and communication services sectors, in part due to excitement for generative artificial intelligence applications. The index gained 14.07% year to date through July, including strong gains in both June (+4.50%) and July (+4.07%). The rally for international equities sputtered for the next three months (-11.33%) amid a stalling pattern in disinflationary trends, heightened global recession and geopolitical risks, soaring yields on longer-term U.S. government bonds and particularly weak economic conditions in the eurozone and China. The three-month decline left non-U.S. stocks up 1.15% year to date through October. For the full 12 months, nearly all regions advanced, with Europe ex U.K. (+18%) and Japan (+17%) leading, whereas Canada (-0.38%) lagged by the widest margin. Each of the 11 sectors advanced, with information technology (+21%) and consumer discretionary (+19%) leading the way. Energy and industrials each rose about 14%. Conversely, four defensive-oriented sectors lagged by the widest margin: real estate (+4%), health care (+6%), consumer staples (+7%) and utilities (+8%).
Comments from Portfolio Manager Vincent Montemaggiore:
For the fiscal year ending October 31, 2023, the fund's share classes gained about 13%, versus 14.65% for the benchmark MSCI EAFE Index (Net MA). From a regional standpoint, security selection in Europe ex U.K., primarily in France, and stock picking and an underweight in Japan meaningfully detracted from the fund's relative result. By sector, security selection detracted overall, especially within industrials and financials. The fund's outsized stake in Teleperformance returned roughly -34% and was the largest individual relative detractor. Teleperformance was not held at period end. A second notable relative detractor was our overweight stake in Olympus (-24%). Olympus was not held at period end. An overweight in Rentokil Initial (-17%) also detracted. In contrast, from a regional standpoint, underweighting the lagging Asia-Pacific ex-Japan area notably bolstered the fund's relative result. A non-benchmark allocation to Canada and an overweight in Europe ex the U.K. also contributed to the fund's performance versus the benchmark. By sector, the biggest contributors to performance versus the benchmark were stock selection and an overweight in information technology. An underweight in communication services also boosted the fund's relative performance. The top individual relative contributor was an overweight in ASM International (+89%). A non-benchmark stake in Constellation Software gained 41% and was the second-largest relative contributor. An overweight in Safran (+41%) also helped. Safran was among the fund's largest holdings at period end. Notable changes in positioning include increased exposure to the information technology and materials sectors.
The views expressed above reflect those of the portfolio manager(s) only through the end of the period as stated on the cover of this report and do not necessarily represent the views of Fidelity or any other person in the Fidelity organization. Any such views are subject to change at any time based upon market or other conditions and Fidelity disclaims any responsibility to update such views. These views may not be relied on as investment advice and, because investment decisions for a Fidelity fund are based on numerous factors, may not be relied on as an indication of trading intent on behalf of any Fidelity fund.
Fidelity® Overseas Fund
Top Holdings (% of Fund's net assets) |
| |
| Novo Nordisk A/S Series B (Denmark, Pharmaceuticals) | 3.2 | |
| ASML Holding NV (Netherlands) (Netherlands, Semiconductors & Semiconductor Equipment) | 3.1 | |
| AstraZeneca PLC (United Kingdom) (United Kingdom, Pharmaceuticals) | 2.8 | |
| LVMH Moet Hennessy Louis Vuitton SE (France, Textiles, Apparel & Luxury Goods) | 2.5 | |
| TotalEnergies SE (France, Oil, Gas & Consumable Fuels) | 2.1 | |
| RELX PLC (London Stock Exchange) (United Kingdom, Professional Services) | 2.0 | |
| Compass Group PLC (United Kingdom, Hotels, Restaurants & Leisure) | 1.9 | |
| Diageo PLC (United Kingdom, Beverages) | 1.9 | |
| Wolters Kluwer NV (Netherlands, Professional Services) | 1.9 | |
| Safran SA (France, Aerospace & Defense) | 1.8 | |
| | 23.2 | |
| |
| Market Sectors (% of Fund's net assets) |
| |
| Financials | 22.5 | |
| Industrials | 19.6 | |
| Information Technology | 15.1 | |
| Health Care | 14.1 | |
| Consumer Discretionary | 9.3 | |
| Consumer Staples | 6.7 | |
| Materials | 6.3 | |
| Energy | 2.1 | |
| Real Estate | 1.0 | |
| Communication Services | 0.5 | |
| |
Asset Allocation (% of Fund's net assets) |
|
|
Geographic Diversification (% of Fund's net assets) |
|
* Includes Short-Term investments and Net Other Assets (Liabilities). Percentages are adjusted for the effect of derivatives, if applicable. |
| |
Fidelity® Overseas Fund
Showing Percentage of Net Assets
| Common Stocks - 97.2% |
| | | Shares | Value ($) |
| Australia - 0.2% | | | |
| Flutter Entertainment PLC (a) | | 106,174 | 16,653,798 |
| Bailiwick of Jersey - 0.3% | | | |
| JTC PLC (b) | | 3,047,000 | 23,646,695 |
| Belgium - 0.6% | | | |
| Azelis Group NV | | 1,024,000 | 17,444,260 |
| KBC Group NV | | 520,590 | 28,588,403 |
TOTAL BELGIUM | | | 46,032,663 |
| Canada - 2.6% | | | |
| Alimentation Couche-Tard, Inc. Class A (multi-vtg.) | | 1,328,700 | 72,329,953 |
| Constellation Software, Inc. | | 58,500 | 117,274,624 |
| Constellation Software, Inc. warrants 8/22/28 (a)(c) | | 62,100 | 4 |
| Lumine Group, Inc. | | 178,222 | 2,241,350 |
TOTAL CANADA | | | 191,845,931 |
| China - 0.0% | | | |
| Chervon Holdings Ltd. | | 699,700 | 1,723,396 |
| Denmark - 5.2% | | | |
| Carlsberg A/S Series B | | 319,300 | 38,052,008 |
| DSV A/S | | 721,200 | 107,560,149 |
| Novo Nordisk A/S Series B | | 2,491,100 | 240,331,950 |
TOTAL DENMARK | | | 385,944,107 |
| Finland - 1.0% | | | |
| Nordea Bank Abp | | 7,207,600 | 75,740,673 |
| France - 15.3% | | | |
| Air Liquide SA | | 681,329 | 116,747,258 |
| ALTEN | | 516,656 | 60,844,784 |
| Antin Infrastructure Partners SA | | 198,900 | 2,365,526 |
| Capgemini SA | | 632,933 | 111,857,483 |
| Edenred SA | | 1,816,979 | 96,588,685 |
| EssilorLuxottica SA | | 630,413 | 113,823,704 |
| L'Oreal SA | | 258,900 | 108,823,622 |
| LVMH Moet Hennessy Louis Vuitton SE | | 257,242 | 184,167,412 |
| Pernod Ricard SA | | 259,700 | 46,027,085 |
| Safran SA | | 824,300 | 128,771,772 |
| TotalEnergies SE | | 2,349,144 | 157,057,853 |
TOTAL FRANCE | | | 1,127,075,184 |
| Germany - 8.0% | | | |
| Allianz SE | | 451,601 | 105,784,167 |
| Deutsche Borse AG | | 566,391 | 93,225,954 |
| Hannover Reuck SE | | 490,700 | 108,151,374 |
| Infineon Technologies AG | | 2,405,100 | 70,253,501 |
| Merck KGaA | | 582,900 | 87,796,709 |
| SAP SE | | 371,900 | 49,883,814 |
| Siemens Healthineers AG (b) | | 1,543,600 | 75,653,676 |
TOTAL GERMANY | | | 590,749,195 |
| India - 1.7% | | | |
| HCL Technologies Ltd. | | 2,147,200 | 32,924,888 |
| HDFC Bank Ltd. | | 5,242,200 | 92,992,777 |
TOTAL INDIA | | | 125,917,665 |
| Indonesia - 0.6% | | | |
| PT Bank Central Asia Tbk | | 80,843,700 | 44,538,464 |
| Ireland - 0.9% | | | |
| Kingspan Group PLC (Ireland) | | 963,300 | 64,703,115 |
| Italy - 3.2% | | | |
| FinecoBank SpA | | 4,669,000 | 54,911,089 |
| GVS SpA (a)(b) | | 528,100 | 2,358,063 |
| Industrie de Nora SpA | | 363,000 | 5,119,924 |
| Recordati SpA | | 1,698,130 | 78,340,103 |
| UniCredit SpA | | 3,759,700 | 94,254,233 |
TOTAL ITALY | | | 234,983,412 |
| Japan - 12.8% | | | |
| Bandai Namco Holdings, Inc. | | 1,201,900 | 24,901,585 |
| BayCurrent Consulting, Inc. | | 674,900 | 16,944,549 |
| Capcom Co. Ltd. | | 1,162,600 | 37,423,313 |
| FUJIFILM Holdings Corp. | | 1,033,900 | 56,552,060 |
| Hoya Corp. | | 892,600 | 85,929,371 |
| Iriso Electronics Co. Ltd. | | 501,900 | 11,849,071 |
| Misumi Group, Inc. | | 1,737,300 | 26,300,400 |
| NOF Corp. | | 941,400 | 37,139,119 |
| Persol Holdings Co. Ltd. | | 23,853,000 | 35,765,568 |
| Relo Group, Inc. | | 1,741,700 | 17,267,358 |
| Shin-Etsu Chemical Co. Ltd. | | 2,809,700 | 84,019,523 |
| Sony Group Corp. | | 1,493,900 | 124,201,182 |
| Sumitomo Mitsui Financial Group, Inc. | | 2,247,600 | 108,352,254 |
| Suzuki Motor Corp. | | 1,480,500 | 57,461,184 |
| TIS, Inc. | | 1,260,200 | 26,986,998 |
| Tokio Marine Holdings, Inc. | | 5,470,100 | 122,378,368 |
| Tokyo Electron Ltd. | | 513,500 | 67,852,705 |
TOTAL JAPAN | | | 941,324,608 |
| Netherlands - 7.0% | | | |
| ASM International NV (Netherlands) | | 157,700 | 64,826,030 |
| ASML Holding NV (Netherlands) | | 380,300 | 228,606,092 |
| IMCD NV | | 622,424 | 74,749,605 |
| Topicus.Com, Inc. (a) | | 122,288 | 8,052,005 |
| Wolters Kluwer NV | | 1,091,521 | 139,863,036 |
TOTAL NETHERLANDS | | | 516,096,768 |
| Spain - 0.6% | | | |
| Amadeus IT Holding SA Class A | | 708,757 | 40,361,544 |
| Sweden - 3.4% | | | |
| Addlife AB | | 2,778,272 | 18,094,627 |
| AddTech AB (B Shares) | | 3,841,696 | 56,236,142 |
| Atlas Copco AB (A Shares) | | 7,402,144 | 95,850,523 |
| Indutrade AB | | 4,506,101 | 79,586,275 |
| Kry International AB (a)(c)(d) | | 2,787 | 102,298 |
TOTAL SWEDEN | | | 249,869,865 |
| Switzerland - 4.9% | | | |
| Compagnie Financiere Richemont SA Series A | | 824,946 | 97,323,431 |
| Julius Baer Group Ltd. | | 1,345,884 | 79,759,376 |
| Partners Group Holding AG | | 69,820 | 73,438,989 |
| Sika AG | | 457,592 | 109,109,773 |
TOTAL SWITZERLAND | | | 359,631,569 |
| Taiwan - 0.6% | | | |
| Taiwan Semiconductor Manufacturing Co. Ltd. | | 2,697,000 | 44,014,878 |
| United Kingdom - 16.3% | | | |
| 3i Group PLC | | 3,146,600 | 74,189,245 |
| AstraZeneca PLC (United Kingdom) | | 1,667,000 | 208,714,655 |
| BAE Systems PLC | | 6,926,800 | 93,140,399 |
| Beazley PLC | | 2,551,229 | 15,954,086 |
| Compass Group PLC | | 5,616,398 | 141,597,179 |
| Diageo PLC | | 3,736,300 | 141,292,014 |
| Diploma PLC | | 1,567,295 | 54,139,211 |
| Halma PLC | | 1,719,700 | 38,564,363 |
| Hiscox Ltd. | | 2,323,213 | 26,486,768 |
| London Stock Exchange Group PLC | | 1,009,000 | 101,803,151 |
| RELX PLC (London Stock Exchange) | | 4,282,200 | 149,567,464 |
| Rentokil Initial PLC | | 10,456,515 | 53,249,706 |
| Sage Group PLC | | 5,866,300 | 69,205,666 |
| Volution Group PLC | | 7,215,267 | 31,799,281 |
TOTAL UNITED KINGDOM | | | 1,199,703,188 |
| United States of America - 12.0% | | | |
| CBRE Group, Inc. (a) | | 855,800 | 59,341,172 |
| CDW Corp. | | 256,000 | 51,302,400 |
| Experian PLC | | 2,207,000 | 66,821,029 |
| Ferguson PLC | | 534,500 | 80,102,834 |
| Fiserv, Inc. (a) | | 154,400 | 17,563,000 |
| ICON PLC (a) | | 325,200 | 79,335,792 |
| Linde PLC | | 312,600 | 119,463,216 |
| Marsh & McLennan Companies, Inc. | | 640,200 | 121,413,930 |
| Nestle SA (Reg. S) | | 815,550 | 87,947,918 |
| S&P Global, Inc. | | 269,805 | 94,245,585 |
| Schneider Electric SA | | 393,000 | 60,465,908 |
| Thermo Fisher Scientific, Inc. | | 111,500 | 49,591,855 |
TOTAL UNITED STATES OF AMERICA | | | 887,594,639 |
| TOTAL COMMON STOCKS (Cost $5,789,905,828) | | | 7,168,151,357 |
| | | | |
| Nonconvertible Preferred Stocks - 0.0% |
| | | Shares | Value ($) |
| Sweden - 0.0% | | | |
Kry International AB Series E (a)(c)(d) (Cost $7,360,943) | | 16,101 | 590,995 |
| | | | |
| Money Market Funds - 2.0% |
| | | Shares | Value ($) |
Fidelity Cash Central Fund 5.40% (e) (Cost $150,881,981) | | 150,851,810 | 150,881,981 |
| | | | |
| TOTAL INVESTMENT IN SECURITIES - 99.2% (Cost $5,948,148,752) | 7,319,624,333 |
NET OTHER ASSETS (LIABILITIES) - 0.8% | 57,522,400 |
| NET ASSETS - 100.0% | 7,377,146,733 |
| | |
Legend
| (b) | Security exempt from registration under Rule 144A of the Securities Act of 1933. These securities may be resold in transactions exempt from registration, normally to qualified institutional buyers. At the end of the period, the value of these securities amounted to $101,658,434 or 1.4% of net assets. |
| (d) | Restricted securities (including private placements) - Investment in securities not registered under the Securities Act of 1933 (excluding 144A issues). At the end of the period, the value of restricted securities (excluding 144A issues) amounted to $693,293 or 0.0% of net assets. |
| (e) | Affiliated fund that is generally available only to investment companies and other accounts managed by Fidelity Investments. The rate quoted is the annualized seven-day yield of the fund at period end. A complete unaudited listing of the fund's holdings as of its most recent quarter end is available upon request. In addition, each Fidelity Central Fund's financial statements, which are not covered by the Fund's Report of Independent Registered Public Accounting Firm, are available on the SEC's website or upon request. |
| Additional information on each restricted holding is as follows: |
| Security | Acquisition Date | Acquisition Cost ($) |
| Kry International AB | 5/14/21 | 1,210,410 |
| | | |
| Kry International AB Series E | 5/14/21 | 7,360,943 |
| | | |
Affiliated Central Funds
Fiscal year to date information regarding the Fund's investments in Fidelity Central Funds, including the ownership percentage, is presented below.
| Affiliate | Value, beginning of period ($) | Purchases ($) | Sales Proceeds ($) | Dividend Income ($) | Realized Gain (loss) ($) | Change in Unrealized appreciation (depreciation) ($) | Value, end of period ($) | % ownership, end of period |
| Fidelity Cash Central Fund 5.40% | 214,978,741 | 1,425,901,464 | 1,489,998,224 | 5,108,119 | - | - | 150,881,981 | 0.3% |
| Fidelity Securities Lending Cash Central Fund 5.40% | 17,314,388 | 1,014,312,343 | 1,031,626,731 | 739,822 | - | - | - | 0.0% |
| Total | 232,293,129 | 2,440,213,807 | 2,521,624,955 | 5,847,941 | - | - | 150,881,981 | |
| | | | | | | | | |
Amounts in the dividend income column in the above table include any capital gain distributions from underlying funds, which are presented in the corresponding line item in the Statement of Operations, if applicable.
Amounts in the dividend income column for Fidelity Securities Lending Cash Central Fund represents the income earned on investing cash collateral, less rebates paid to borrowers and any lending agent fees associated with the loan, plus any premium payments received for lending certain types of securities.
Amounts included in the purchases and sales proceeds columns may include in-kind transactions, if applicable.
Investment Valuation
The following is a summary of the inputs used, as of October 31, 2023, involving the Fund's assets and liabilities carried at fair value. The inputs or methodology used for valuing securities may not be an indication of the risk associated with investing in those securities. For more information on valuation inputs, and their aggregation into the levels used below, please refer to the Investment Valuation section in the accompanying Notes to Financial Statements.
| Valuation Inputs at Reporting Date: |
| Description | Total ($) | Level 1 ($) | Level 2 ($) | Level 3 ($) |
Investments in Securities: | | | | |
|
| Equities: | | | | |
Communication Services | 37,423,313 | - | 37,423,313 | - |
Consumer Discretionary | 688,390,711 | 57,015,342 | 631,375,369 | - |
Consumer Staples | 494,472,600 | 118,357,038 | 376,115,562 | - |
Energy | 157,057,853 | - | 157,057,853 | - |
Financials | 1,656,372,792 | 739,094,803 | 917,277,989 | - |
Health Care | 1,037,612,442 | 502,636,466 | 534,975,976 | - |
Industrials | 1,440,539,213 | 780,482,924 | 660,056,289 | - |
Information Technology | 1,113,786,009 | 412,311,222 | 700,781,490 | 693,297 |
Materials | 466,478,889 | 228,572,989 | 237,905,900 | - |
Real Estate | 76,608,530 | 59,341,172 | 17,267,358 | - |
|
| Money Market Funds | 150,881,981 | 150,881,981 | - | - |
| Total Investments in Securities: | 7,319,624,333 | 3,048,693,937 | 4,270,237,099 | 693,297 |
Fidelity® Overseas Fund
| Statement of Assets and Liabilities |
| | | | October 31, 2023 |
| | | | | |
| Assets | | | | |
| Investment in securities, at value - See accompanying schedule: | | | | |
Unaffiliated issuers (cost $5,797,266,771) | $ | 7,168,742,352 | | |
Fidelity Central Funds (cost $150,881,981) | | 150,881,981 | | |
| | | | | |
| | | | | |
| Total Investment in Securities (cost $5,948,148,752) | | | $ | 7,319,624,333 |
| Foreign currency held at value (cost $1,775,737) | | | | 1,775,736 |
| Receivable for investments sold | | | | 32,257,315 |
| Receivable for fund shares sold | | | | 5,879,269 |
| Dividends receivable | | | | 9,977,434 |
| Reclaims receivable | | | | 28,776,767 |
| Distributions receivable from Fidelity Central Funds | | | | 690,792 |
| Prepaid expenses | | | | 11,041 |
| Other receivables | | | | 254,858 |
Total assets | | | | 7,399,247,545 |
| Liabilities | | | | |
| Payable for investments purchased | $ | 7,810,626 | | |
| Payable for fund shares redeemed | | 8,128,782 | | |
| Accrued management fee | | 2,623,425 | | |
| Other affiliated payables | | 1,042,306 | | |
| Deferred taxes | | 2,079,693 | | |
| Other payables and accrued expenses | | 415,980 | | |
| Total Liabilities | | | | 22,100,812 |
| Net Assets | | | $ | 7,377,146,733 |
| Net Assets consist of: | | | | |
| Paid in capital | | | $ | 6,016,502,669 |
| Total accumulated earnings (loss) | | | | 1,360,644,064 |
| Net Assets | | | $ | 7,377,146,733 |
| | | | | |
| Net Asset Value and Maximum Offering Price | | | | |
| Overseas : | | | | |
Net Asset Value, offering price and redemption price per share ($6,684,862,461 ÷ 128,084,466 shares) | | | $ | 52.19 |
| Class K : | | | | |
Net Asset Value, offering price and redemption price per share ($692,284,272 ÷ 13,284,821 shares) | | | $ | 52.11 |
| Statement of Operations |
| | | | Year ended October 31, 2023 |
| Investment Income | | | | |
| Dividends | | | $ | 158,274,364 |
| Foreign Tax Reclaims | | | | 11,016,295 |
| Income from Fidelity Central Funds (including $739,822 from security lending) | | | | 5,847,941 |
| Income before foreign taxes withheld | | | $ | 175,138,600 |
| Less foreign taxes withheld | | | | (24,141,257) |
| Total Income | | | | 150,997,343 |
| Expenses | | | | |
| Management fee | | | | |
| Basic fee | $ | 50,289,138 | | |
| Performance adjustment | | (7,837,589) | | |
| Transfer agent fees | | 10,864,794 | | |
| Accounting fees | | 1,608,300 | | |
| Custodian fees and expenses | | 301,780 | | |
| Independent trustees' fees and expenses | | 44,391 | | |
| Registration fees | | 125,467 | | |
| Audit | | 125,012 | | |
| Legal | | 7,951 | | |
| Interest | | 7,793 | | |
| Miscellaneous | | 36,667 | | |
| Total expenses before reductions | | 55,573,704 | | |
| Expense reductions | | (471,441) | | |
| Total expenses after reductions | | | | 55,102,263 |
| Net Investment income (loss) | | | | 95,895,080 |
| Realized and Unrealized Gain (Loss) | | | | |
| Net realized gain (loss) on: | | | | |
| Investment Securities: | | | | |
| Unaffiliated issuers (net of foreign taxes of $39,393) | | 179,547,434 | | |
| Foreign currency transactions | | (696,912) | | |
| Total net realized gain (loss) | | | | 178,850,522 |
| Change in net unrealized appreciation (depreciation) on: | | | | |
| Investment Securities: | | | | |
| Unaffiliated issuers(net of increase in deferred foreign taxes of $499,581) | | 586,673,000 | | |
| Assets and liabilities in foreign currencies | | 1,737,844 | | |
| Total change in net unrealized appreciation (depreciation) | | | | 588,410,844 |
| Net gain (loss) | | | | 767,261,366 |
| Net increase (decrease) in net assets resulting from operations | | | $ | 863,156,446 |
| Statement of Changes in Net Assets |
| |
| | Year ended October 31, 2023 | | Year ended October 31, 2022 |
| Increase (Decrease) in Net Assets | | | | |
| Operations | | | | |
| Net investment income (loss) | $ | 95,895,080 | $ | 74,612,993 |
| Net realized gain (loss) | | 178,850,522 | | (261,677,190) |
| Change in net unrealized appreciation (depreciation) | | 588,410,844 | | (3,015,457,116) |
| Net increase (decrease) in net assets resulting from operations | | 863,156,446 | | (3,202,521,313) |
| Distributions to shareholders | | (57,098,273) | | (471,071,500) |
| | | | | |
| Share transactions - net increase (decrease) | | (224,690,399) | | (103,633,659) |
| | | | | |
| Total increase (decrease) in net assets | | 581,367,774 | | (3,777,226,472) |
| | | | | |
| Net Assets | | | | |
| Beginning of period | | 6,795,778,959 | | 10,573,005,431 |
| End of period | $ | 7,377,146,733 | $ | 6,795,778,959 |
| | | | | |
| | | | | |
Financial Highlights
| Years ended October 31, | | 2023 | | 2022 | | 2021 | | 2020 | | 2019 |
Selected Per-Share Data | | | | | | | | | | |
| Net asset value, beginning of period | $ | 46.55 | $ | 69.79 | $ | 50.91 | $ | 49.51 | $ | 46.04 |
| Income from Investment Operations | | | | | | | | | | |
Net investment income (loss) A,B | | .67 | | .47 | | .21 | | .13 | | .77 |
| Net realized and unrealized gain (loss) | | 5.36 | | (20.64) | | 18.98 | | 1.97 | | 5.12 |
| Total from investment operations | | 6.03 | | (20.17) | | 19.19 | | 2.10 | | 5.89 |
| Distributions from net investment income | | (.39) | | (.20) | | (.11) | | (.70) | | (.68) |
| Distributions from net realized gain | | - | | (2.87) | | (.21) | | - | | (1.74) |
| Total distributions | | (.39) | | (3.07) | | (.31) C | | (.70) | | (2.42) |
| Net asset value, end of period | $ | 52.19 | $ | 46.55 | $ | 69.79 | $ | 50.91 | $ | 49.51 |
Total Return D | | 12.95% | | (30.12)% | | 37.83% | | 4.25% | | 13.78% |
Ratios to Average Net Assets B,E,F | | | | | | | | | | |
| Expenses before reductions | | .73% | | .95% | | .99% | | 1.04% | | .90% |
| Expenses net of fee waivers, if any | | .72% | | .95% | | .98% | | 1.04% | | .90% |
| Expenses net of all reductions | | .72% | | .94% | | .98% | | 1.03% | | .89% |
| Net investment income (loss) | | 1.23% | | .84% | | .33% | | .27% | | 1.68% |
| Supplemental Data | | | | | | | | | | |
| Net assets, end of period (000 omitted) | $ | 6,684,862 | $ | 6,175,776 | $ | 8,981,609 | $ | 6,160,617 | $ | 6,182,831 |
Portfolio turnover rate G | | 34% | | 25% | | 30% H | | 41% | | 46% H |
ACalculated based on average shares outstanding during the period.
BNet investment income (loss) is affected by the timing of the declaration of dividends by any underlying mutual funds or exchange-traded funds (ETFs). Net investment income (loss) of any mutual funds or ETFs is not included in the Fund's net investment income (loss) ratio.
CTotal distributions per share do not sum due to rounding.
DTotal returns would have been lower if certain expenses had not been reduced during the applicable periods shown.
EFees and expenses of any underlying mutual funds or exchange-traded funds (ETFs) are not included in the Fund's expense ratio. The Fund indirectly bears its proportionate share of these expenses. For additional expense information related to investments in Fidelity Central Funds, please refer to the "Investments in Fidelity Central Funds" note found in the Notes to Financial Statements section of the most recent Annual or Semi-Annual report.
FExpense ratios reflect operating expenses of the class. Expenses before reductions do not reflect amounts reimbursed, waived, or reduced through arrangements with the investment adviser, brokerage services, or other offset arrangements, if applicable, and do not represent the amount paid by the class during periods when reimbursements, waivers or reductions occur.
GAmount does not include the portfolio activity of any underlying mutual funds or exchange-traded funds (ETFs).
HPortfolio turnover rate excludes securities received or delivered in-kind.
| Fidelity® Overseas Fund Class K |
| |
| Years ended October 31, | | 2023 | | 2022 | | 2021 | | 2020 | | 2019 |
Selected Per-Share Data | | | | | | | | | | |
| Net asset value, beginning of period | $ | 46.48 | $ | 69.68 | $ | 50.83 | $ | 49.43 | $ | 45.98 |
| Income from Investment Operations | | | | | | | | | | |
Net investment income (loss) A,B | | .73 | | .54 | | .27 | | .19 | | .82 |
| Net realized and unrealized gain (loss) | | 5.34 | | (20.60) | | 18.95 | | 1.96 | | 5.11 |
| Total from investment operations | | 6.07 | | (20.06) | | 19.22 | | 2.15 | | 5.93 |
| Distributions from net investment income | | (.44) | | (.26) | | (.16) | | (.75) | | (.73) |
| Distributions from net realized gain | | - | | (2.87) | | (.21) | | - | | (1.74) |
| Total distributions | | (.44) | | (3.14) C | | (.37) | | (.75) | | (2.48) C |
| Net asset value, end of period | $ | 52.11 | $ | 46.48 | $ | 69.68 | $ | 50.83 | $ | 49.43 |
Total Return D | | 13.06% | | (30.04)% | | 37.97% | | 4.36% | | 13.90% |
Ratios to Average Net Assets B,E,F | | | | | | | | | | |
| Expenses before reductions | | .62% | | .84% | | .89% | | .94% | | .78% |
| Expenses net of fee waivers, if any | | .61% | | .84% | | .88% | | .93% | | .78% |
| Expenses net of all reductions | | .61% | | .84% | | .88% | | .93% | | .77% |
| Net investment income (loss) | | 1.34% | | .94% | | .43% | | .38% | | 1.79% |
| Supplemental Data | | | | | | | | | | |
| Net assets, end of period (000 omitted) | $ | 692,284 | $ | 620,003 | $ | 1,591,397 | $ | 1,022,402 | $ | 1,040,002 |
Portfolio turnover rate G | | 34% | | 25% | | 30% H | | 41% | | 46% H |
ACalculated based on average shares outstanding during the period.
BNet investment income (loss) is affected by the timing of the declaration of dividends by any underlying mutual funds or exchange-traded funds (ETFs). Net investment income (loss) of any mutual funds or ETFs is not included in the Fund's net investment income (loss) ratio.
CTotal distributions per share do not sum due to rounding.
DTotal returns would have been lower if certain expenses had not been reduced during the applicable periods shown.
EFees and expenses of any underlying mutual funds or exchange-traded funds (ETFs) are not included in the Fund's expense ratio. The Fund indirectly bears its proportionate share of these expenses. For additional expense information related to investments in Fidelity Central Funds, please refer to the "Investments in Fidelity Central Funds" note found in the Notes to Financial Statements section of the most recent Annual or Semi-Annual report.
FExpense ratios reflect operating expenses of the class. Expenses before reductions do not reflect amounts reimbursed, waived, or reduced through arrangements with the investment adviser, brokerage services, or other offset arrangements, if applicable, and do not represent the amount paid by the class during periods when reimbursements, waivers or reductions occur.
GAmount does not include the portfolio activity of any underlying mutual funds or exchange-traded funds (ETFs).
HPortfolio turnover rate excludes securities received or delivered in-kind.
For the period ended October 31, 2023
1. Organization.
Fidelity Overseas Fund (the Fund) is a fund of Fidelity Investment Trust (the Trust) and is authorized to issue an unlimited number of shares. The Trust is registered under the Investment Company Act of 1940, as amended (the 1940 Act), as an open-end management investment company organized as a Massachusetts business trust. The Fund offers Overseas and Class K shares, each of which has equal rights as to assets and voting privileges. Each class has exclusive voting rights with respect to matters that affect that class.
2. Investments in Fidelity Central Funds.
Funds may invest in Fidelity Central Funds, which are open-end investment companies generally available only to other investment companies and accounts managed by the investment adviser and its affiliates. The Schedule of Investments lists any Fidelity Central Funds held as an investment as of period end, but does not include the underlying holdings of each Fidelity Central Fund. An investing fund indirectly bears its proportionate share of the expenses of the underlying Fidelity Central Funds.
Based on its investment objective, each Fidelity Central Fund may invest or participate in various investment vehicles or strategies that are similar to those of the investing fund. These strategies are consistent with the investment objectives of the investing fund and may involve certain economic risks which may cause a decline in value of each of the Fidelity Central Funds and thus a decline in the value of the investing fund.
| Fidelity Central Fund | Investment Manager | Investment Objective | Investment Practices | Expense RatioA |
| Fidelity Money Market Central Funds | Fidelity Management & Research Company LLC (FMR) | Each fund seeks to obtain a high level of current income consistent with the preservation of capital and liquidity. | Short-term Investments | Less than .005% |
A Expenses expressed as a percentage of average net assets and are as of each underlying Central Fund's most recent annual or semi-annual shareholder report.
A complete unaudited list of holdings for each Fidelity Central Fund is available upon request or at the Securities and Exchange Commission website at www.sec.gov. In addition, the financial statements of the Fidelity Central Funds which contain the significant accounting policies (including investment valuation policies) of those funds, and are not covered by the Report of Independent Registered Public Accounting Firm, are available on the Securities and Exchange Commission website or upon request.
3. Significant Accounting Policies.
The Fund is an investment company and applies the accounting and reporting guidance of the Financial Accounting Standards Board (FASB) Accounting Standards Codification Topic 946 Financial Services - Investment Companies. The financial statements have been prepared in conformity with accounting principles generally accepted in the United States of America (GAAP), which require management to make certain estimates and assumptions at the date of the financial statements. Actual results could differ from those estimates. Subsequent events, if any, through the date that the financial statements were issued have been evaluated in the preparation of the financial statements. The Fund's Schedule of Investments lists any underlying mutual funds or exchange-traded funds (ETFs) but does not include the underlying holdings of these funds. The following summarizes the significant accounting policies of the Fund:
Investment Valuation. Investments are valued as of 4:00 p.m. Eastern time on the last calendar day of the period. The Board of Trustees (the Board) has designated the Fund's investment adviser as the valuation designee responsible for the fair valuation function and performing fair value determinations as needed. The investment adviser has established a Fair Value Committee (the Committee) to carry out the day-to-day fair valuation responsibilities and has adopted policies and procedures to govern the fair valuation process and the activities of the Committee. In accordance with these fair valuation policies and procedures, which have been approved by the Board, the Fund attempts to obtain prices from one or more third party pricing services or brokers to value its investments. When current market prices, quotations or currency exchange rates are not readily available or reliable, investments will be fair valued in good faith by the Committee, in accordance with the policies and procedures. Factors used in determining fair value vary by investment type and may include market or investment specific events, transaction data, estimated cash flows, and market observations of comparable investments. The frequency that the fair valuation procedures are used cannot be predicted and they may be utilized to a significant extent. The Committee manages the Fund's fair valuation practices and maintains the fair valuation policies and procedures. The Fund's investment adviser reports to the Board information regarding the fair valuation process and related material matters.
The Fund categorizes the inputs to valuation techniques used to value its investments into a disclosure hierarchy consisting of three levels as shown below:
Level 1 - unadjusted quoted prices in active markets for identical investments
Level 2 - other significant observable inputs (including quoted prices for similar investments, interest rates, prepayment speeds, etc.)
Level 3 - unobservable inputs (including the Fund's own assumptions based on the best information available)
Valuation techniques used to value the Fund's investments by major category are as follows:
Equity securities, including restricted securities, for which market quotations are readily available, are valued at the last reported sale price or official closing price as reported by a third party pricing service on the primary market or exchange on which they are traded and are categorized as Level 1 in the hierarchy. In the event there were no sales during the day or closing prices are not available, securities are valued at the last quoted bid price or may be valued using the last available price and are generally categorized as Level 2 in the hierarchy. For foreign equity securities, when market or security specific events arise, comparisons to the valuation of American Depositary Receipts (ADRs), futures contracts, Exchange-Traded Funds (ETFs) and certain indexes as well as quoted prices for similar securities may be used and would be categorized as Level 2 in the hierarchy. For equity securities, including restricted securities, where observable inputs are limited, assumptions about market activity and risk are used and these securities may be categorized as Level 3 in the hierarchy.
Investments in open-end mutual funds, including the Fidelity Central Funds, are valued at their closing net asset value (NAV) each business day and are categorized as Level 1 in the hierarchy.
Changes in valuation techniques may result in transfers in or out of an assigned level within the disclosure hierarchy. The aggregate value of investments by input level as of October 31, 2023 is included at the end of the Fund's Schedule of Investments.
Foreign Currency. Certain Funds may use foreign currency contracts to facilitate transactions in foreign-denominated securities. Gains and losses from these transactions may arise from changes in the value of the foreign currency or if the counterparties do not perform under the contracts' terms.
Foreign-denominated assets, including investment securities, and liabilities are translated into U.S. dollars at the exchange rates at period end. Purchases and sales of investment securities, income and dividends received, and expenses denominated in foreign currencies are translated into U.S. dollars at the exchange rate in effect on the transaction date.
The effects of exchange rate fluctuations on investments are included with the net realized and unrealized gain (loss) on investment securities. Other foreign currency transactions resulting in realized and unrealized gain (loss) are disclosed separately.
Investment Transactions and Income. For financial reporting purposes, the Fund's investment holdings and NAV include trades executed through the end of the last business day of the period. The NAV per share for processing shareholder transactions is calculated as of the close of business of the New York Stock Exchange (NYSE), normally 4:00 p.m. Eastern time and includes trades executed through the end of the prior business day. Gains and losses on securities sold are determined on the basis of identified cost and include proceeds received from litigation. Commissions paid to certain brokers with whom the investment adviser, or its affiliates, places trades on behalf of a fund include an amount in addition to trade execution, which may be rebated back to a fund. Any such rebates are included in net realized gain (loss) on investments in the Statement of Operations. Dividend income is recorded on the ex-dividend date, except for certain dividends from foreign securities where the ex-dividend date may have passed, which are recorded as soon as the Fund is informed of the ex-dividend date. Non-cash dividends included in dividend income, if any, are recorded at the fair market value of the securities received. Income and capital gain distributions from Fidelity Central Funds, if any, are recorded on the ex-dividend date. Certain distributions received by the Fund represent a return of capital or capital gain. The Fund determines the components of these distributions subsequent to the ex-dividend date, based upon receipt of tax filings or other correspondence relating to the underlying investment. These distributions are recorded as a reduction of cost of investments and/or as a realized gain. Investment income is recorded net of foreign taxes withheld where recovery of such taxes is uncertain. Funds may file withholding tax reclaims in certain jurisdictions to recover a portion of amounts previously withheld. Any withholding tax reclaims income is included in the Statement of Operations in foreign tax reclaims. Any receivables for withholding tax reclaims are included in the Statement of Assets and Liabilities in reclaims receivable. The Fund has filed tax reclaims for previously withheld taxes on dividends earned in certain European Union (EU) countries. These additional filings are subject to various administrative proceedings by the local jurisdictions' tax authorities within the EU, as well as a number of related judicial proceedings. Income recognized for EU reclaims is included with other reclaims in the Statement of Operations in foreign tax reclaims. These reclaims are recorded when the amount is known and there are no significant uncertainties on collectability.
Class Allocations and Expenses. Investment income, realized and unrealized capital gains and losses, common expenses of a fund, and certain fund-level expense reductions, if any, are allocated daily on a pro-rata basis to each class based on the relative net assets of each class to the total net assets of a fund. Each class differs with respect to transfer agent and distribution and service plan fees incurred, as applicable. Certain expense reductions may also differ by class, if applicable. For the reporting period, the allocated portion of income and expenses to each class as a percent of its average net assets may vary due to the timing of recording these transactions in relation to fluctuating net assets of the classes. Expenses directly attributable to a fund are charged to that fund. Expenses attributable to more than one fund are allocated among the respective funds on the basis of relative net assets or other appropriate methods. Expenses included in the accompanying financial statements reflect the expenses of that fund and do not include any expenses associated with any underlying mutual funds or exchange-traded funds (ETFs). Although not included in a fund's expenses, a fund indirectly bears its proportionate share of these expenses through the net asset value of each underlying mutual fund or exchange-traded fund (ETF). Expense estimates are accrued in the period to which they relate and adjustments are made when actual amounts are known.
Deferred Trustee Compensation. Under a Deferred Compensation Plan (the Plan) for certain Funds, certain independent Trustees have elected to defer receipt of a portion of their annual compensation. Deferred amounts are invested in affiliated mutual funds, are marked-to-market and remain in a fund until distributed in accordance with the Plan. The investment of deferred amounts and the offsetting payable to the Trustees presented below are included in the accompanying Statement of Assets and Liabilities in other receivables and other payables and accrued expenses, as applicable.
| Fidelity Overseas Fund | $254,830 |
Income Tax Information and Distributions to Shareholders. Each year, the Fund intends to qualify as a regulated investment company under Subchapter M of the Internal Revenue Code, including distributing substantially all of its taxable income and realized gains. As a result, no provision for U.S. Federal income taxes is required. As of October 31, 2023, the Fund did not have any unrecognized tax benefits in the financial statements; nor is the Fund aware of any tax positions for which it is reasonably possible that the total amounts of unrecognized tax benefits will significantly change in the next twelve months. The Fund files a U.S. federal tax return, in addition to state and local tax returns as required. The Fund's federal income tax returns are subject to examination by the Internal Revenue Service (IRS) for a period of three fiscal years after they are filed. State and local tax returns may be subject to examination for an additional fiscal year depending on the jurisdiction. Foreign taxes are provided for based on the Fund's understanding of the tax rules and rates that exist in the foreign markets in which it invests. The Fund is subject to a tax imposed on capital gains by certain countries in which it invests. An estimated deferred tax liability for net unrealized appreciation on the applicable securities is included in Deferred taxes on the Statement of Assets & Liabilities.
Distributions are declared and recorded on the ex-dividend date. Income and capital gain distributions are declared separately for each class. Income and capital gain distributions are determined in accordance with income tax regulations, which may differ from GAAP. In addition, the Fund claimed a portion of the payment made to redeeming shareholders as a distribution for income tax purposes.
Capital accounts within the financial statements are adjusted for permanent book-tax differences. These adjustments have no impact on net assets or the results of operations. Capital accounts are not adjusted for temporary book-tax differences which will reverse in a subsequent period.
Book-tax differences are primarily due to foreign currency transactions, certain foreign taxes, passive foreign investment companies (PFIC), deferred trustees compensation, capital loss carryforwards and losses deferred due to wash sales.
As of period end, the cost and unrealized appreciation (depreciation) in securities, and derivatives if applicable, for federal income tax purposes were as follows:
| Gross unrealized appreciation | $1,703,975,178 |
| Gross unrealized depreciation | (344,457,061) |
| Net unrealized appreciation (depreciation) | $1,359,518,117 |
| Tax Cost | $5,960,106,216 |
The tax-based components of distributable earnings as of period end were as follows:
| Undistributed ordinary income | $89,078,628 |
| Capital loss carryforward | $(84,908,134) |
| Net unrealized appreciation (depreciation) on securities and other investments | $1,358,727,494 |
Capital loss carryforwards are only available to offset future capital gains of the Fund to the extent provided by regulations and may be limited. The capital loss carryforward information presented below, including any applicable limitation, is estimated as of fiscal period end and is subject to adjustment.
Short-term | $(84,908,134) |
| Total capital loss carryforward | $(84,908,134) |
The tax character of distributions paid was as follows:
| | October 31, 2023 | October 31, 2022 |
| Ordinary Income | $57,098,273 | $57,969,693 |
| Long-term Capital Gains | - | 413,101,807 |
| Total | $57,098,273 | $471,071,500 |
Restricted Securities (including Private Placements). Funds may invest in securities that are subject to legal or contractual restrictions on resale. These securities generally may be resold in transactions exempt from registration or to the public if the securities are registered. Disposal of these securities may involve time-consuming negotiations and expense, and prompt sale at an acceptable price may be difficult. Information regarding restricted securities held at period end is included at the end of the Schedule of Investments, if applicable.
4. Purchases and Sales of Investments.
Purchases and sales of securities, other than short-term securities and in-kind transactions, as applicable, are noted in the table below.
| | Purchases ($) | Sales ($) |
| Fidelity Overseas Fund | 2,550,277,768 | 2,684,297,635 |
5. Fees and Other Transactions with Affiliates.
Management Fee. Fidelity Management & Research Company LLC (the investment adviser) and its affiliates provide the Fund with investment management related services for which the Fund pays a monthly management fee. The management fee is the sum of an individual fund fee rate that is based on an annual rate of .424% of the Fund's average net assets and an annualized group fee rate that averaged .23% during the period. The group fee rate is based upon the monthly average net assets of a group of registered investment companies with which the investment adviser has management contracts. The group fee rate decreases as assets under management increase and increases as assets under management decrease. In addition, the management fee is subject to a performance adjustment (up to a maximum of +/- .20% of the Fund's average net assets over a 36 month performance period). The upward or downward adjustment to the management fee is based on the relative investment performance of the Overseas Fund as compared to its benchmark index, the MSCI EAFE Index, over the same 36 month performance period. For the reporting period, the total annual management fee rate, including the performance adjustment, was .55% of the Fund's average net assets. The performance adjustment included in the management fee rate may be higher or lower than the maximum performance adjustment rate due to the difference between the average net assets for the reporting and performance periods.
Transfer Agent Fees. Fidelity Investments Institutional Operations Company LLC (FIIOC), an affiliate of the investment adviser, is the transfer, dividend disbursing and shareholder servicing agent for each class of the Fund. FIIOC receives account fees and asset-based fees that vary according to the account size and type of account of the shareholders of Overseas, except for Class K. FIIOC receives an asset-based fee of Class K's average net assets. FIIOC pays for typesetting, printing and mailing of shareholder reports, except proxy statements.
For the period, transfer agent fees for each class were as follows:
| | Amount | % of Class-Level Average Net Assets |
| Overseas | $ 10,602,894 | .15 |
| Class K | 261,900 | .04 |
| | $ 10,864,794 | |
During November 2023, the Board approved a change in the transfer agent fees effective December 1, 2023 to a fixed annual rate of class-level average net assets as follows:
| | % of Class-Level Average Net Assets |
| Fidelity Overseas Fund | 0.1476% |
Accounting Fees. Fidelity Service Company, Inc. (FSC), an affiliate of the investment adviser, maintains the Fund's accounting records. The accounting fee is based on the level of average net assets for each month. For the period, the fees were equivalent to the following annual rates:
| | % of Average Net Assets |
| Fidelity Overseas Fund | .02 |
During November 2023, the Board approved a change in the accounting fees effective December 1, 2023 to a fixed annual rate of average net assets as follows:
| | % of Average Net Assets |
| Fidelity Overseas Fund | 0.0199% |
Brokerage Commissions. A portion of portfolio transactions were placed with brokerage firms which are affiliates of the investment adviser. Brokerage commissions are included in net realized gain (loss) and change in net unrealized appreciation (depreciation) in the Statement of Operations. The commissions paid to these affiliated firms were as follows:
| | Amount |
| Fidelity Overseas Fund | $ 1,076 |
Interfund Lending Program. Pursuant to an Exemptive Order issued by the Securities and Exchange Commission (the SEC), the Fund, along with other registered investment companies having management contracts with Fidelity Management & Research Company LLC (FMR), or other affiliated entities of FMR, may participate in an interfund lending program. This program provides an alternative credit facility allowing the Fund to borrow from, or lend money to, other participating affiliated funds. At period end, there were no interfund loans outstanding. Activity in this program during the period for which loans were outstanding was as follows:
| | Borrower or Lender | Average Loan Balance | Weighted Average Interest Rate | Interest Expense |
| Fidelity Overseas Fund | Borrower | $ 32,348,500 | 4.34% | $7,793 |
Interfund Trades. Funds may purchase from or sell securities to other Fidelity Funds under procedures adopted by the Board. The procedures have been designed to ensure these interfund trades are executed in accordance with Rule 17a-7 of the 1940 Act. Any interfund trades are included within the respective purchases and sales amounts shown in the Purchases and Sales of Investments note. Interfund trades during the period are noted in the table below.
| | Purchases ($) | Sales ($) | Realized Gain (Loss) ($) |
| Fidelity Overseas Fund | 61,906,786 | 139,759,630 | (11,613,431) |
6. Committed Line of Credit.
Certain Funds participate with other funds managed by the investment adviser or an affiliate in a $4.25 billion credit facility (the "line of credit") to be utilized for temporary or emergency purposes to fund shareholder redemptions or for other short-term liquidity purposes. The participating funds have agreed to pay commitment fees on their pro-rata portion of the line of credit, which are reflected in Miscellaneous expenses on the Statement of Operations, and are listed below. During the period, there were no borrowings on this line of credit.
| | Amount |
| Fidelity Overseas Fund | $13,914 |
7. Security Lending.
Funds lend portfolio securities from time to time in order to earn additional income. Lending agents are used, including National Financial Services (NFS), an affiliate of the investment adviser. Pursuant to a securities lending agreement, NFS will receive a fee, which is capped at 9.9% of a fund's daily lending revenue, for its services as lending agent. A fund may lend securities to certain qualified borrowers, including NFS. On the settlement date of the loan, a fund receives collateral (in the form of U.S. Treasury obligations, letters of credit and/or cash) against the loaned securities and maintains collateral in an amount not less than 100% of the market value of the loaned securities during the period of the loan. The market value of the loaned securities is determined at the close of business of a fund and any additional required collateral is delivered to a fund on the next business day. A fund or borrower may terminate the loan at any time, and if the borrower defaults on its obligation to return the securities loaned because of insolvency or other reasons, a fund may apply collateral received from the borrower against the obligation. A fund may experience delays and costs in recovering the securities loaned. Any cash collateral received is invested in the Fidelity Securities Lending Cash Central Fund. Any loaned securities are identified as such in the Schedule of Investments, and the value of loaned securities and cash collateral at period end, as applicable, are presented in the Statement of Assets and Liabilities. Security lending income represents the income earned on investing cash collateral, less rebates paid to borrowers and any lending agent fees associated with the loan, plus any premium payments received for lending certain types of securities. Security lending income is presented in the Statement of Operations as a component of income from Fidelity Central Funds. Affiliated security lending activity, if any, was as follows:
| | Total Security Lending Fees Paid to NFS | Security Lending Income From Securities Loaned to NFS | Value of Securities Loaned to NFS at Period End |
| Fidelity Overseas Fund | $78,664 | $- | $- |
8. Expense Reductions.
Through arrangements with the Fund's custodian, credits realized as a result of certain uninvested cash balances were used to reduce the Fund's expenses. During the period, custodian credits reduced the Fund's expenses by $942.
In addition, during the period the investment adviser or an affiliate reimbursed and/or waived a portion of fund-level operating expenses in the amount of $470,499.
10. Distributions to Shareholders.
Distributions to shareholders of each class were as follows:
| | Year ended October 31, 2023 | Year ended October 31, 2022 |
| Fidelity Overseas Fund | | |
| Distributions to shareholders | | |
| Overseas | $ 51,233,808 | $398,074,722 |
| Class K | 5,864,465 | 72,996,778 |
Total | $ 57,098,273 | $ 471,071,500 |
11. Share Transactions.
Share transactions for each class were as follows and may contain in-kind transactions, automatic conversions between classes or exchanges between affiliated funds:
| | Shares | Shares | Dollars | Dollars |
| | Year ended October 31, 2023 | Year ended October 31, 2022 | Year ended October 31, 2023 | Year ended October 31, 2022 |
| Fidelity Overseas Fund | | | | |
| Overseas | | | | |
| Shares sold | 10,936,067 | 40,345,843 | $596,408,589 | $2,183,494,857 |
| Reinvestment of distributions | 849,241 | 5,519,644 | 44,738,039 | 355,685,872 |
| Shares redeemed | (16,363,021) | (41,890,883) | (880,663,957) | (2,190,097,209) |
| Net increase (decrease) | (4,577,713) | 3,974,604 | $(239,517,329) | $349,083,520 |
| Class K | | | | |
| Shares sold | 5,973,191 | 4,842,077 | $340,532,508 | $287,643,692 |
| Reinvestment of distributions | 111,598 | 1,135,606 | 5,864,465 | 72,996,779 |
| Shares redeemed | (6,139,595) | (15,475,778) | (331,570,043) | (813,357,650) |
| Net increase (decrease) | (54,806) | (9,498,095) | $14,826,930 | $(452,717,179) |
12. Other.
A fund's organizational documents provide former and current trustees and officers with a limited indemnification against liabilities arising in connection with the performance of their duties to the fund. In the normal course of business, a fund may also enter into contracts that provide general indemnifications. A fund's maximum exposure under these arrangements is unknown as this would be dependent on future claims that may be made against a fund. The risk of material loss from such claims is considered remote.
At the end of the period, the following mutual funds managed by the investment adviser or its affiliates were the owners of record of 10% or more of the total outstanding shares.
| | Strategic Advisers Fidelity International Fund |
| Fidelity Overseas Fund | 29% |
Mutual funds managed by the investment adviser or its affiliates, in aggregate, were the owners of record of more than 20% of the total outstanding shares.
| Fund | % of shares held |
| Fidelity Overseas Fund | 48% |
13. Risk and Uncertainties.
Many factors affect a fund's performance. Developments that disrupt global economies and financial markets, such as pandemics, epidemics, outbreaks of infectious diseases, war, terrorism, and environmental disasters, may significantly affect a fund's investment performance. The effects of these developments to a fund will be impacted by the types of securities in which a fund invests, the financial condition, industry, economic sector, and geographic location of an issuer, and a fund's level of investment in the securities of that issuer. Significant concentrations in security types, issuers, industries, sectors, and geographic locations may magnify the factors that affect a fund's performance.
Average annual total return reflects the change in the value of an investment, assuming reinvestment of distributions from dividend income and capital gains (the profits earned upon the sale of securities that have grown in value, if any) and assuming a constant rate of performance each year. The hypothetical investment and the average annual total returns do not reflect the deduction of taxes that a shareholder would pay on fund distributions or the redemption of fund shares. During periods of reimbursement by Fidelity, a fund's total return will be greater than it would be had the reimbursement not occurred. How a fund did yesterday is no guarantee of how it will do tomorrow.
| Average Annual Total Returns |
| | | | |
Periods ended October 31, 2023 | Past 1 year | Past 5 years | Past 10 years |
Class A (incl. 5.75% sales charge) | 4.26% | 7.20% | 7.20% |
Class M (incl. 3.50% sales charge) | 6.53% | 7.43% | 7.15% |
Class C (incl. contingent deferred sales charge) | 8.76% | 7.63% | 7.16% |
| Fidelity® Worldwide Fund | 10.95% | 8.79% | 8.16% |
| Class I | 10.97% | 8.78% | 8.13% |
| Class Z | 11.10% | 8.92% | 8.20% |
Class C shares' contingent deferred sales charges included in the past one year, past five years and past ten years total return figures are 1%, 0% and 0%, respectively.
The initial offering of Class Z shares took place on October 2, 2018. Returns prior to October 2, 2018, are those of Class I.
| $10,000 Over 10 Years |
| |
Let's say hypothetically that $10,000 was invested in Fidelity® Worldwide Fund, a class of the fund, on October 31, 2013. The chart shows how the value of your investment would have changed, and also shows how the MSCI World Index performed over the same period. |
|
|
Fidelity® Worldwide Fund
Market Recap:
Global equities gained 10.91% for the 12 months ending October 31, 2023, according to the MSCI All Country World Index, as global economic expansion and a slowing in the pace of inflation in some markets provided a favorable backdrop for risk assets. After returning -18.07% in 2022, the index's upturn has been largely driven by a narrow set of companies in the information technology and communication services sectors, in part due to excitement for generative artificial intelligence applications. The index gained 18.36% year to date through July, including gains in June (+5.83%) and July (+3.68%). The rally for international equities sputtered for the next three months (-9.54%) amid a stalling pattern in disinflationary trends, heightened global recession and geopolitical risks, soaring yields on longer-term U.S. government bonds, and particularly weak economic conditions in the eurozone and China. Still, the three-month decline left global stocks up 7.07% year to date through October. Currency fluctuation also bolstered non-U.S. equity performance overall. For the full 12 months, nearly all regions advanced, with Europe ex U.K. (+18%) and Japan (+17%) leading, whereas Canada (-0.38%) lagged by the widest margin, while the U.S. middled (+10%). All but three of 11 sectors advanced, with information technology (+29%) and communication services (+27%) leading. Conversely, the real estate sector (-3%) lagged most, followed by health care and utilities (-1% each).
Comments from Co-Managers Stephen DuFour and Andrew Sergeant:
For the fiscal year ending October 31, 2023, the fund's share classes (excluding sales charges, if applicable) gained about 10% to 11%, versus 10.93% for the benchmark MSCI World Net MA Index. From a regional standpoint, security selection in the United States and an overweight in Europe ex U.K., primarily in Switzerland, contributed to the fund's performance versus the benchmark. By sector, market selection was the primary contributor, with underweight positions in consumer staples and energy helping most. Stock selection in communication services and health care - primarily within the pharmaceuticals, biotechnology & life sciences industry - also notably boosted relative performance. The top individual relative contributor was an overweight in Nvidia (+197%), a stock which was the fund's third-largest holding at period end. The second-biggest relative contributor was an overweight in Meta Platforms (+60%), another of the fund's biggest holdings and a stake we established the past year. An overweight in Eli Lilly (+54%), also a top-five portfolio holding, further contributed. In contrast, from a regional standpoint, stock picks in Europe ex U.K. and stock selection and an overweight in the U.K. detracted from the fund's relative result. By sector, the biggest detractor from performance versus the benchmark was stock selection in industrials, primarily within the capital goods industry. Also hurting our result were stock picks in information technology and utilities. The biggest individual relative detractors were overweight positions in UnitedHealth (-3%), a top-20 fund holding at period end, and Constellation Energy (-22%). We decreased our position in both UnitedHealth and Constellation Energy during the past 12 months. A stake in Northrop Grumman returned -17% and also notably hurt. Northrop Grumman was not held at period end. By country, notable changes in positioning include a higher allocation to Japan. By sector, meaningful changes include higher allocations to the communication services and energy sectors, and lower allocations to health care and financials.
The views expressed above reflect those of the portfolio manager(s) only through the end of the period as stated on the cover of this report and do not necessarily represent the views of Fidelity or any other person in the Fidelity organization. Any such views are subject to change at any time based upon market or other conditions and Fidelity disclaims any responsibility to update such views. These views may not be relied on as investment advice and, because investment decisions for a Fidelity fund are based on numerous factors, may not be relied on as an indication of trading intent on behalf of any Fidelity fund.
Fidelity® Worldwide Fund
Top Holdings (% of Fund's net assets) |
| |
| Microsoft Corp. (United States of America, Software) | 6.4 | |
| Meta Platforms, Inc. Class A (United States of America, Interactive Media & Services) | 5.6 | |
| NVIDIA Corp. (United States of America, Semiconductors & Semiconductor Equipment) | 5.3 | |
| Eli Lilly & Co. (United States of America, Pharmaceuticals) | 4.7 | |
| Amazon.com, Inc. (United States of America, Broadline Retail) | 4.2 | |
| Alphabet, Inc. Class A (United States of America, Interactive Media & Services) | 3.8 | |
| Eaton Corp. PLC (United States of America, Electrical Equipment) | 3.4 | |
| Fiserv, Inc. (United States of America, Financial Services) | 3.4 | |
| Oracle Corp. (United States of America, Software) | 2.7 | |
| S&P Global, Inc. (United States of America, Capital Markets) | 2.4 | |
| | 41.9 | |
| |
| Market Sectors (% of Fund's net assets) |
| |
| Information Technology | 25.4 | |
| Financials | 13.7 | |
| Industrials | 13.2 | |
| Consumer Discretionary | 13.1 | |
| Communication Services | 11.9 | |
| Health Care | 10.1 | |
| Energy | 5.6 | |
| Consumer Staples | 2.6 | |
| Materials | 1.8 | |
| Real Estate | 1.0 | |
| Utilities | 0.3 | |
| |
Asset Allocation (% of Fund's net assets) |
|
|
Geographic Diversification (% of Fund's net assets) |
|
* Includes Short-Term investments and Net Other Assets (Liabilities). Percentages are adjusted for the effect of derivatives, if applicable. |
| |
Fidelity® Worldwide Fund
Showing Percentage of Net Assets
| Common Stocks - 98.4% |
| | | Shares | Value ($) |
| Australia - 1.3% | | | |
| Aub Group Ltd. | | 257,900 | 4,429,048 |
| CAR Group Ltd. | | 544,560 | 9,599,102 |
| Flutter Entertainment PLC (a) | | 35,700 | 5,599,681 |
| Lovisa Holdings Ltd. | | 357,317 | 3,954,170 |
| National Storage REIT unit | | 4,853,097 | 6,187,625 |
TOTAL AUSTRALIA | | | 29,769,626 |
| Austria - 0.2% | | | |
| Wienerberger AG | | 203,600 | 4,941,945 |
| Belgium - 0.4% | | | |
| Azelis Group NV | | 231,900 | 3,950,512 |
| UCB SA | | 60,600 | 4,428,187 |
TOTAL BELGIUM | | | 8,378,699 |
| Canada - 2.9% | | | |
| Canada Goose Holdings, Inc. (a) | | 48,300 | 535,680 |
| Constellation Software, Inc. | | 3,700 | 7,417,369 |
| Constellation Software, Inc. warrants 8/22/28 (a)(b) | | 3,700 | 0 |
| Franco-Nevada Corp. | | 32,900 | 4,002,329 |
| PrairieSky Royalty Ltd. | | 2,744,700 | 48,194,300 |
| Quebecor, Inc. Class B (sub. vtg.) | | 230,500 | 4,755,439 |
| Shopify, Inc. Class A (a) | | 1,000 | 47,190 |
TOTAL CANADA | | | 64,952,307 |
| China - 1.5% | | | |
| BYD Co. Ltd. (H Shares) | | 168,500 | 5,124,107 |
| Centre Testing International Group Co. Ltd. (A Shares) | | 2,106,400 | 4,359,195 |
| Kweichow Moutai Co. Ltd. (A Shares) | | 18,100 | 4,169,412 |
| Tencent Holdings Ltd. | | 182,800 | 6,765,201 |
| Trip.com Group Ltd. ADR (a) | | 160,600 | 5,460,400 |
| ZTO Express, Inc. sponsored ADR | | 306,000 | 7,212,420 |
TOTAL CHINA | | | 33,090,735 |
| Denmark - 1.2% | | | |
| Carlsberg A/S Series B | | 34,800 | 4,147,228 |
| GN Store Nord A/S (a) | | 379,775 | 6,315,450 |
| Novo Nordisk A/S Series B | | 175,400 | 16,921,932 |
TOTAL DENMARK | | | 27,384,610 |
| Finland - 0.5% | | | |
| Nanoform Finland PLC (a) | | 754,800 | 1,269,860 |
| Olvi Oyj (A Shares) | | 86,661 | 2,562,903 |
| Sampo Oyj (A Shares) | | 159,551 | 6,264,944 |
TOTAL FINLAND | | | 10,097,707 |
| France - 1.6% | | | |
| Dassault Aviation SA | | 15,500 | 3,075,103 |
| L'Oreal SA | | 31,000 | 13,030,252 |
| LVMH Moet Hennessy Louis Vuitton SE | | 20,927 | 14,982,279 |
| Pernod Ricard SA | | 26,100 | 4,625,749 |
TOTAL FRANCE | | | 35,713,383 |
| Germany - 1.0% | | | |
| DHL Group | | 204,311 | 7,946,831 |
| Instone Real Estate Group BV (c) | | 332,488 | 1,892,714 |
| Nexus AG | | 46,000 | 2,241,373 |
| Stabilus Se | | 144,286 | 9,144,874 |
TOTAL GERMANY | | | 21,225,792 |
| Hong Kong - 1.2% | | | |
| AIA Group Ltd. | | 761,327 | 6,611,218 |
| Hong Kong Exchanges and Clearing Ltd. | | 170,174 | 5,953,138 |
| Prudential PLC | | 1,366,086 | 14,284,326 |
TOTAL HONG KONG | | | 26,848,682 |
| Hungary - 0.1% | | | |
| Richter Gedeon PLC | | 86,900 | 2,037,565 |
| India - 0.0% | | | |
| Pine Labs Private Ltd. (a)(b)(d) | | 792 | 248,442 |
| Indonesia - 0.8% | | | |
| PT Bank Central Asia Tbk | | 20,561,200 | 11,327,590 |
| PT Bank Rakyat Indonesia (Persero) Tbk | | 21,144,000 | 6,611,388 |
TOTAL INDONESIA | | | 17,938,978 |
| Ireland - 0.3% | | | |
| Cairn Homes PLC | | 3,237,500 | 3,797,294 |
| Irish Residential Properties REIT PLC | | 3,953,167 | 3,806,390 |
TOTAL IRELAND | | | 7,603,684 |
| Italy - 1.0% | | | |
| BFF Bank SpA (c) | | 1,389,790 | 13,345,121 |
| Prysmian SpA | | 105,000 | 3,920,737 |
| Recordati SpA | | 128,900 | 5,946,564 |
TOTAL ITALY | | | 23,212,422 |
| Japan - 5.2% | | | |
| FUJIFILM Holdings Corp. | | 87,992 | 4,812,969 |
| Funai Soken Holdings, Inc. | | 149,400 | 2,455,525 |
| GMO Internet, Inc. | | 300,866 | 4,382,046 |
| Hitachi Ltd. | | 190,900 | 12,100,507 |
| Hoya Corp. | | 63,443 | 6,107,570 |
| Iriso Electronics Co. Ltd. | | 204,185 | 4,820,487 |
| Katitas Co. Ltd. | | 257,600 | 3,438,300 |
| Keyence Corp. | | 22,340 | 8,648,232 |
| NOF Corp. | | 207,695 | 8,193,764 |
| Osaka Soda Co. Ltd. | | 93,700 | 5,503,059 |
| PALTAC Corp. | | 188,891 | 6,123,181 |
| Pan Pacific International Holdings Ltd. | | 403,700 | 7,817,999 |
| Renesas Electronics Corp. (a) | | 502,231 | 6,597,116 |
| Shin-Etsu Chemical Co. Ltd. | | 262,015 | 7,835,134 |
| Sony Group Corp. | | 116,703 | 9,702,557 |
| Tsuruha Holdings, Inc. | | 120,200 | 8,829,496 |
| USS Co. Ltd. | | 324,600 | 5,673,650 |
| ZOZO, Inc. | | 129,400 | 2,460,508 |
TOTAL JAPAN | | | 115,502,100 |
| Kenya - 0.0% | | | |
| Safaricom Ltd. | | 5,920,700 | 489,623 |
| Luxembourg - 0.1% | | | |
| Novem Group SA | | 292,876 | 1,846,957 |
| Netherlands - 1.0% | | | |
| ASML Holding NV (Netherlands) | | 23,800 | 14,306,666 |
| BE Semiconductor Industries NV | | 39,000 | 4,015,172 |
| IMCD NV | | 32,351 | 3,885,172 |
TOTAL NETHERLANDS | | | 22,207,010 |
| Norway - 0.8% | | | |
| Schibsted ASA (B Shares) | | 299,297 | 5,546,035 |
| TGS ASA | | 883,149 | 12,032,574 |
TOTAL NORWAY | | | 17,578,609 |
| Russia - 0.0% | | | |
| Fix Price Group Ltd. GDR (Reg. S) (a)(b) | | 139,553 | 51,541 |
| Spain - 0.6% | | | |
| CaixaBank SA | | 1,697,900 | 6,902,882 |
| Cie Automotive SA | | 230,635 | 5,871,480 |
TOTAL SPAIN | | | 12,774,362 |
| Sweden - 3.2% | | | |
| Addlife AB | | 783,810 | 5,104,882 |
| Autoliv, Inc. (depository receipt) | | 76,777 | 7,067,299 |
| Dustin Group AB (a)(c)(e) | | 2,591,588 | 2,913,736 |
| Evolution AB (c) | | 88,200 | 7,837,489 |
| Haypp Group (a) | | 603,300 | 2,426,723 |
| Hemnet Group AB | | 876,830 | 15,215,474 |
| HEXPOL AB (B Shares) | | 850,359 | 7,518,997 |
| INVISIO AB | | 272,280 | 4,088,182 |
| JM AB (B Shares) | | 334,900 | 3,564,282 |
| Kry International AB (a)(b)(d) | | 489 | 17,949 |
| Sandvik AB | | 21,257 | 362,071 |
| Swedbank AB (A Shares) | | 727,850 | 11,916,254 |
| Swedish Logistic Property AB (a) | | 1,522,409 | 3,546,053 |
TOTAL SWEDEN | | | 71,579,391 |
| Taiwan - 0.3% | | | |
| E Ink Holdings, Inc. | | 1,422,000 | 7,393,146 |
| United Kingdom - 4.5% | | | |
| 3i Group PLC | | 296,400 | 6,988,398 |
| AstraZeneca PLC (United Kingdom) | | 104,843 | 13,126,737 |
| Beazley PLC | | 824,700 | 5,157,253 |
| Clarkson PLC | | 145,262 | 4,669,978 |
| Diageo PLC | | 288,873 | 10,924,029 |
| Endava PLC ADR (a) | | 72,400 | 3,631,584 |
| Games Workshop Group PLC | | 34,000 | 4,080,873 |
| Harbour Energy PLC | | 1,486,871 | 4,586,718 |
| Hiscox Ltd. | | 856,247 | 9,762,004 |
| Lancashire Holdings Ltd. | | 1,178,720 | 8,137,595 |
| London Stock Exchange Group PLC | | 71,200 | 7,183,731 |
| RS GROUP PLC | | 303,095 | 2,494,783 |
| Sabre Insurance Group PLC (c) | | 6,755,301 | 12,069,774 |
| Softcat PLC | | 234,700 | 3,608,616 |
| WH Smith PLC | | 329,610 | 4,647,244 |
| Zegona Communications PLC (a)(b) | | 30,559 | 11,589 |
TOTAL UNITED KINGDOM | | | 101,080,906 |
| United States of America - 68.7% | | | |
| Adobe, Inc. (a) | | 48,000 | 25,538,880 |
| Alphabet, Inc. Class A (a) | | 691,000 | 85,739,280 |
| Amazon.com, Inc. (a) | | 714,000 | 95,026,260 |
| ANSYS, Inc. (a) | | 1,000 | 278,260 |
| Apple, Inc. | | 273,000 | 46,620,210 |
| Arthur J. Gallagher & Co. | | 51,000 | 12,009,990 |
| Cadence Design Systems, Inc. (a) | | 27,000 | 6,475,950 |
| Celsius Holdings, Inc. (a) | | 1,000 | 152,090 |
| Chart Industries, Inc. (a)(e) | | 99,000 | 11,506,770 |
| Confluent, Inc. (a) | | 25,000 | 722,750 |
| Constellation Energy Corp. | | 62,000 | 7,001,040 |
| Costco Wholesale Corp. | | 16,000 | 8,839,040 |
| Crane Nxt Co. | | 65,000 | 3,380,000 |
| CSX Corp. | | 424,000 | 12,656,400 |
| Curtiss-Wright Corp. | | 3,000 | 596,430 |
| Deckers Outdoor Corp. (a) | | 77,155 | 46,066,164 |
| Dell Technologies, Inc. | | 97,000 | 6,490,270 |
| Eaton Corp. PLC | | 371,000 | 77,134,610 |
| Eli Lilly & Co. | | 189,000 | 104,692,770 |
| Exxon Mobil Corp. | | 412,000 | 43,610,200 |
| Fiserv, Inc. (a) | | 667,201 | 75,894,114 |
| General Electric Co. | | 42,000 | 4,562,460 |
| HealthEquity, Inc. (a) | | 108,000 | 7,741,440 |
| Ingersoll Rand, Inc. | | 185,000 | 11,225,800 |
| J.B. Hunt Transport Services, Inc. | | 23,000 | 3,953,010 |
| Jabil, Inc. | | 325,000 | 39,910,000 |
| KBR, Inc. | | 429,000 | 24,946,350 |
| Lattice Semiconductor Corp. (a) | | 33,400 | 1,857,374 |
| Leidos Holdings, Inc. | | 9,000 | 892,080 |
| lululemon athletica, Inc. (a) | | 7,800 | 3,069,144 |
| Maplebear, Inc. | | 8,000 | 177,336 |
| Marathon Petroleum Corp. | | 11,000 | 1,663,750 |
| Marsh & McLennan Companies, Inc. | | 62,000 | 11,758,300 |
| Marvell Technology, Inc. | | 98,100 | 4,632,282 |
| Meta Platforms, Inc. Class A (a) | | 415,000 | 125,027,050 |
| Micron Technology, Inc. | | 431,000 | 28,820,970 |
| Microsoft Corp. | | 424,000 | 143,358,640 |
| Moody's Corp. | | 14,000 | 4,312,000 |
| Netflix, Inc. (a) | | 19,000 | 7,822,110 |
| NVIDIA Corp. | | 291,000 | 118,669,800 |
| Occidental Petroleum Corp. | | 87,000 | 5,377,470 |
| Oracle Corp. | | 577,000 | 59,661,800 |
| Parker Hannifin Corp. | | 73,000 | 26,930,430 |
| RHI Magnesita NV | | 83,122 | 2,592,446 |
| Rivian Automotive, Inc. (a) | | 1,000 | 16,220 |
| Roche Holding AG (participation certificate) | | 48,651 | 12,537,832 |
| S&P Global, Inc. | | 152,628 | 53,314,487 |
| Schlumberger Ltd. | | 162,000 | 9,016,920 |
| Skechers U.S.A., Inc. Class A (sub. vtg.) (a) | | 11,000 | 530,420 |
| Stripe, Inc. Class B (a)(b)(d) | | 10,000 | 182,500 |
| Synopsys, Inc. (a) | | 13,000 | 6,102,720 |
| Tesla, Inc. (a) | | 145,000 | 29,121,800 |
| The Boeing Co. (a) | | 19,000 | 3,549,580 |
| TJX Companies, Inc. | | 48,000 | 4,227,360 |
| TransDigm Group, Inc. (a) | | 9,000 | 7,452,810 |
| United Rentals, Inc. | | 34,000 | 13,813,180 |
| UnitedHealth Group, Inc. | | 81,000 | 43,380,360 |
| Vertiv Holdings Co. | | 741,000 | 29,099,070 |
| Visa, Inc. Class A | | 70,000 | 16,457,000 |
TOTAL UNITED STATES OF AMERICA | | | 1,538,195,779 |
| TOTAL COMMON STOCKS (Cost $1,835,952,387) | | | 2,202,144,001 |
| | | | |
| Preferred Stocks - 0.3% |
| | | Shares | Value ($) |
| Convertible Preferred Stocks - 0.2% | | | |
| China - 0.2% | | | |
| ByteDance Ltd. Series E1 (a)(b)(d) | | 14,425 | 3,370,401 |
| dMed Biopharmaceutical Co. Ltd. Series C (a)(b)(d) | | 138,905 | 818,150 |
| | | | 4,188,551 |
| Ireland - 0.0% | | | |
| Circle Internet Financial Ltd. Series F (a)(b)(d) | | 23,730 | 510,432 |
| United States of America - 0.0% | | | |
| Stripe, Inc. Series H (a)(b)(d) | | 29,122 | 531,477 |
TOTAL CONVERTIBLE PREFERRED STOCKS | | | 5,230,460 |
| Nonconvertible Preferred Stocks - 0.1% | | | |
| India - 0.1% | | | |
| Pine Labs Private Ltd.: | | | |
| Series 1 (a)(b)(d) | | 1,892 | 593,501 |
| Series A (a)(b)(d) | | 473 | 148,375 |
| Series B (a)(b)(d) | | 514 | 161,237 |
| Series B2 (a)(b)(d) | | 416 | 130,495 |
| Series C (a)(b)(d) | | 774 | 242,796 |
| Series C1 (a)(b)(d) | | 163 | 51,131 |
| Series D (a)(b)(d) | | 174 | 54,582 |
| | | | 1,382,117 |
| Sweden - 0.0% | | | |
| Kry International AB Series E (a)(b)(d) | | 2,824 | 103,656 |
TOTAL NONCONVERTIBLE PREFERRED STOCKS | | | 1,485,773 |
| TOTAL PREFERRED STOCKS (Cost $8,655,877) | | | 6,716,233 |
| | | | |
| Money Market Funds - 1.0% |
| | | Shares | Value ($) |
| Fidelity Cash Central Fund 5.40% (f) | | 19,648,458 | 19,652,388 |
| Fidelity Securities Lending Cash Central Fund 5.40% (f)(g) | | 3,365,463 | 3,365,800 |
| TOTAL MONEY MARKET FUNDS (Cost $23,014,724) | | | 23,018,188 |
| | | | |
| TOTAL INVESTMENT IN SECURITIES - 99.7% (Cost $1,867,622,988) | 2,231,878,422 |
NET OTHER ASSETS (LIABILITIES) - 0.3% | 6,864,803 |
| NET ASSETS - 100.0% | 2,238,743,225 |
| | |
Legend
| (c) | Security exempt from registration under Rule 144A of the Securities Act of 1933. These securities may be resold in transactions exempt from registration, normally to qualified institutional buyers. At the end of the period, the value of these securities amounted to $38,058,834 or 1.7% of net assets. |
| (d) | Restricted securities (including private placements) - Investment in securities not registered under the Securities Act of 1933 (excluding 144A issues). At the end of the period, the value of restricted securities (excluding 144A issues) amounted to $7,165,124 or 0.3% of net assets. |
| (e) | Security or a portion of the security is on loan at period end. |
| (f) | Affiliated fund that is generally available only to investment companies and other accounts managed by Fidelity Investments. The rate quoted is the annualized seven-day yield of the fund at period end. A complete unaudited listing of the fund's holdings as of its most recent quarter end is available upon request. In addition, each Fidelity Central Fund's financial statements, which are not covered by the Fund's Report of Independent Registered Public Accounting Firm, are available on the SEC's website or upon request. |
| (g) | Investment made with cash collateral received from securities on loan. |
| Additional information on each restricted holding is as follows: |
| Security | Acquisition Date | Acquisition Cost ($) |
| ByteDance Ltd. Series E1 | 11/18/20 | 1,580,608 |
| | | |
| Circle Internet Financial Ltd. Series F | 5/09/22 | 999,982 |
| | | |
| dMed Biopharmaceutical Co. Ltd. Series C | 12/01/20 | 1,972,888 |
| | | |
| Kry International AB | 5/14/21 | 212,376 |
| | | |
| Kry International AB Series E | 5/14/21 | 1,291,057 |
| | | |
| Pine Labs Private Ltd. | 6/30/21 | 295,305 |
| | | |
| Pine Labs Private Ltd. Series 1 | 6/30/21 | 705,451 |
| | | |
| Pine Labs Private Ltd. Series A | 6/30/21 | 176,363 |
| | | |
| Pine Labs Private Ltd. Series B | 6/30/21 | 191,650 |
| | | |
| Pine Labs Private Ltd. Series B2 | 6/30/21 | 155,110 |
| | | |
| Pine Labs Private Ltd. Series C | 6/30/21 | 288,594 |
| | | |
| Pine Labs Private Ltd. Series C1 | 6/30/21 | 60,776 |
| | | |
| Pine Labs Private Ltd. Series D | 6/30/21 | 64,878 |
| | | |
| Stripe, Inc. Class B | 5/18/21 | 401,284 |
| | | |
| Stripe, Inc. Series H | 3/15/21 - 5/25/23 | 1,168,520 |
| | | |
Affiliated Central Funds
Fiscal year to date information regarding the Fund's investments in Fidelity Central Funds, including the ownership percentage, is presented below.
| Affiliate | Value, beginning of period ($) | Purchases ($) | Sales Proceeds ($) | Dividend Income ($) | Realized Gain (loss) ($) | Change in Unrealized appreciation (depreciation) ($) | Value, end of period ($) | % ownership, end of period |
| Fidelity Cash Central Fund 5.40% | 15,584,500 | 839,895,207 | 835,827,320 | 1,413,320 | 81 | (80) | 19,652,388 | 0.0% |
| Fidelity Securities Lending Cash Central Fund 5.40% | 7,256,240 | 222,270,932 | 226,161,372 | 89,548 | - | - | 3,365,800 | 0.0% |
| Total | 22,840,740 | 1,062,166,139 | 1,061,988,692 | 1,502,868 | 81 | (80) | 23,018,188 | |
| | | | | | | | | |
Amounts in the dividend income column in the above table include any capital gain distributions from underlying funds, which are presented in the corresponding line item in the Statement of Operations, if applicable.
Amounts in the dividend income column for Fidelity Securities Lending Cash Central Fund represents the income earned on investing cash collateral, less rebates paid to borrowers and any lending agent fees associated with the loan, plus any premium payments received for lending certain types of securities.
Amounts included in the purchases and sales proceeds columns may include in-kind transactions, if applicable.
Investment Valuation
The following is a summary of the inputs used, as of October 31, 2023, involving the Fund's assets and liabilities carried at fair value. The inputs or methodology used for valuing securities may not be an indication of the risk associated with investing in those securities. For more information on valuation inputs, and their aggregation into the levels used below, please refer to the Investment Valuation section in the accompanying Notes to Financial Statements.
| Valuation Inputs at Reporting Date: |
| Description | Total ($) | Level 1 ($) | Level 2 ($) | Level 3 ($) |
Investments in Securities: | | | | |
|
| Equities: | | | | |
Communication Services | 264,341,304 | 244,595,011 | 16,364,303 | 3,381,990 |
Consumer Discretionary | 292,946,671 | 237,108,220 | 55,838,451 | - |
Consumer Staples | 57,509,076 | 16,179,782 | 41,277,753 | 51,541 |
Energy | 124,481,932 | 124,481,932 | - | - |
Financials | 311,200,987 | 240,398,836 | 70,291,719 | 510,432 |
Health Care | 226,355,222 | 176,843,001 | 48,694,071 | 818,150 |
Industrials | 297,984,870 | 278,707,572 | 19,277,298 | - |
Information Technology | 567,580,376 | 514,153,573 | 50,960,662 | 2,466,141 |
Materials | 40,587,674 | 19,055,717 | 21,531,957 | - |
Real Estate | 18,871,082 | 9,245,157 | 9,625,925 | - |
Utilities | 7,001,040 | 7,001,040 | - | - |
|
| Money Market Funds | 23,018,188 | 23,018,188 | - | - |
| Total Investments in Securities: | 2,231,878,422 | 1,890,788,029 | 333,862,139 | 7,228,254 |
Fidelity® Worldwide Fund
| Statement of Assets and Liabilities |
| | | | October 31, 2023 |
| | | | | |
| Assets | | | | |
| Investment in securities, at value (including securities loaned of $2,705,920) - See accompanying schedule: | | | | |
Unaffiliated issuers (cost $1,844,608,264) | $ | 2,208,860,234 | | |
Fidelity Central Funds (cost $23,014,724) | | 23,018,188 | | |
| | | | | |
| | | | | |
| Total Investment in Securities (cost $1,867,622,988) | | | $ | 2,231,878,422 |
| Foreign currency held at value (cost $54,498) | | | | 54,405 |
| Receivable for investments sold | | | | 30,327,653 |
| Receivable for fund shares sold | | | | 449,061 |
| Dividends receivable | | | | 537,066 |
| Reclaims receivable | | | | 2,623,104 |
| Distributions receivable from Fidelity Central Funds | | | | 119,414 |
| Prepaid expenses | | | | 3,231 |
| Other receivables | | | | 81,611 |
Total assets | | | | 2,266,073,967 |
| Liabilities | | | | |
| Payable for investments purchased | $ | 21,612,401 | | |
| Payable for fund shares redeemed | | 1,091,418 | | |
| Accrued management fee | | 806,084 | | |
| Distribution and service plan fees payable | | 28,912 | | |
| Other affiliated payables | | 352,256 | | |
| Other payables and accrued expenses | | 73,871 | | |
| Collateral on securities loaned | | 3,365,800 | | |
| Total Liabilities | | | | 27,330,742 |
| Net Assets | | | $ | 2,238,743,225 |
| Net Assets consist of: | | | | |
| Paid in capital | | | $ | 1,866,994,770 |
| Total accumulated earnings (loss) | | | | 371,748,455 |
| Net Assets | | | $ | 2,238,743,225 |
| | | | | |
| Net Asset Value and Maximum Offering Price | | | | |
| Class A : | | | | |
Net Asset Value and redemption price per share ($73,934,926 ÷ 2,748,170 shares)(a) | | | $ | 26.90 |
| Maximum offering price per share (100/94.25 of $26.90) | | | $ | 28.54 |
| Class M : | | | | |
Net Asset Value and redemption price per share ($16,050,766 ÷ 603,442 shares)(a) | | | $ | 26.60 |
| Maximum offering price per share (100/96.50 of $26.60) | | | $ | 27.56 |
| Class C : | | | | |
Net Asset Value and offering price per share ($7,292,462 ÷ 288,821 shares)(a) | | | $ | 25.25 |
| Worldwide : | | | | |
Net Asset Value, offering price and redemption price per share ($1,982,943,304 ÷ 72,255,506 shares) | | | $ | 27.44 |
| Class I : | | | | |
Net Asset Value, offering price and redemption price per share ($41,289,414 ÷ 1,516,333 shares) | | | $ | 27.23 |
| Class Z : | | | | |
Net Asset Value, offering price and redemption price per share ($117,232,353 ÷ 4,309,264 shares) | | | $ | 27.20 |
(a)Redemption price per share is equal to net asset value less any applicable contingent deferred sales charge. |
| Statement of Operations |
| | | | Year ended October 31, 2023 |
| Investment Income | | | | |
| Dividends | | | $ | 31,102,304 |
| Income from Fidelity Central Funds (including $89,548 from security lending) | | | | 1,502,868 |
| Income before foreign taxes withheld | | | $ | 32,605,172 |
| Less foreign taxes withheld | | | | (1,961,230) |
| Total Income | | | | 30,643,942 |
| Expenses | | | | |
| Management fee | | | | |
| Basic fee | $ | 14,647,460 | | |
| Performance adjustment | | (4,013,549) | | |
| Transfer agent fees | | 3,418,216 | | |
| Distribution and service plan fees | | 350,515 | | |
| Accounting fees | | 598,854 | | |
| Custodian fees and expenses | | 80,550 | | |
| Independent trustees' fees and expenses | | 12,908 | | |
| Registration fees | | 106,021 | | |
| Audit | | 97,177 | | |
| Legal | | 7,483 | | |
| Miscellaneous | | 10,930 | | |
| Total expenses before reductions | | 15,316,565 | | |
| Expense reductions | | (138,332) | | |
| Total expenses after reductions | | | | 15,178,233 |
| Net Investment income (loss) | | | | 15,465,709 |
| Realized and Unrealized Gain (Loss) | | | | |
| Net realized gain (loss) on: | | | | |
| Investment Securities: | | | | |
| Unaffiliated issuers (net of foreign taxes of $137,150) | | 2,083,251 | | |
| Fidelity Central Funds | | 81 | | |
| Foreign currency transactions | | 572,140 | | |
| Total net realized gain (loss) | | | | 2,655,472 |
| Change in net unrealized appreciation (depreciation) on: | | | | |
| Investment Securities: | | | | |
| Unaffiliated issuers(net of decrease in deferred foreign taxes of $108,910) | | 205,131,592 | | |
| Fidelity Central Funds | | (80) | | |
| Unfunded commitments | | 227,538 | | |
| Assets and liabilities in foreign currencies | | 170,868 | | |
| Total change in net unrealized appreciation (depreciation) | | | | 205,529,918 |
| Net gain (loss) | | | | 208,185,390 |
| Net increase (decrease) in net assets resulting from operations | | | $ | 223,651,099 |
| Statement of Changes in Net Assets |
| |
| | Year ended October 31, 2023 | | Year ended October 31, 2022 |
| Increase (Decrease) in Net Assets | | | | |
| Operations | | | | |
| Net investment income (loss) | $ | 15,465,709 | $ | 14,477,798 |
| Net realized gain (loss) | | 2,655,472 | | 145,952,644 |
| Change in net unrealized appreciation (depreciation) | | 205,529,918 | | (1,000,391,802) |
| Net increase (decrease) in net assets resulting from operations | | 223,651,099 | | (839,961,360) |
| Distributions to shareholders | | (124,836,814) | | (362,130,555) |
| | | | | |
| Share transactions - net increase (decrease) | | 37,686,493 | | 68,731,196 |
| | | | | |
| Total increase (decrease) in net assets | | 136,500,778 | | (1,133,360,719) |
| | | | | |
| Net Assets | | | | |
| Beginning of period | | 2,102,242,447 | | 3,235,603,166 |
| End of period | $ | 2,238,743,225 | $ | 2,102,242,447 |
| | | | | |
| | | | | |
Financial Highlights
| Fidelity Advisor® Worldwide Fund Class A |
| |
| Years ended October 31, | | 2023 | | 2022 | | 2021 | | 2020 | | 2019 |
Selected Per-Share Data | | | | | | | | | | |
| Net asset value, beginning of period | $ | 25.75 | $ | 40.06 | $ | 31.49 | $ | 27.36 | $ | 26.57 |
| Income from Investment Operations | | | | | | | | | | |
Net investment income (loss) A,B | | .11 | | .09 | | (.13) | | (.05) | | .11 |
| Net realized and unrealized gain (loss) | | 2.52 | | (9.90) | | 11.40 | | 5.50 | | 2.84 |
| Total from investment operations | | 2.63 | | (9.81) | | 11.27 | | 5.45 | | 2.95 |
| Distributions from net investment income | | (.11) | | (.07) | | - | | (.12) | | (.02) |
| Distributions from net realized gain | | (1.37) | | (4.43) | | (2.70) | | (1.20) | | (2.14) |
| Total distributions | | (1.48) | | (4.50) | | (2.70) | | (1.32) | | (2.16) |
| Net asset value, end of period | $ | 26.90 | $ | 25.75 | $ | 40.06 | $ | 31.49 | $ | 27.36 |
Total Return C,D | | 10.62% | | (27.31)% | | 37.72% | | 20.72% | | 12.35% |
Ratios to Average Net Assets A,E,F | | | | | | | | | | |
| Expenses before reductions | | .96% | | 1.21% | | 1.29% | | 1.34% | | 1.26% |
| Expenses net of fee waivers, if any | | .95% | | 1.21% | | 1.28% | | 1.34% | | 1.26% |
| Expenses net of all reductions | | .95% | | 1.21% | | 1.28% | | 1.33% | | 1.25% |
| Net investment income (loss) | | .41% | | .28% | | (.34)% | | (.18)% | | .41% |
| Supplemental Data | | | | | | | | | | |
| Net assets, end of period (000 omitted) | $ | 73,935 | $ | 68,608 | $ | 99,731 | $ | 63,690 | $ | 52,516 |
Portfolio turnover rate G | | 114% | | 137% | | 96% | | 112% | | 147% |
ANet investment income (loss) is affected by the timing of the declaration of dividends by any underlying mutual funds or exchange-traded funds (ETFs). Net investment income (loss) of any mutual funds or ETFs is not included in the Fund's net investment income (loss) ratio.
BCalculated based on average shares outstanding during the period.
CTotal returns would have been lower if certain expenses had not been reduced during the applicable periods shown.
DTotal returns do not include the effect of the sales charges.
EFees and expenses of any underlying mutual funds or exchange-traded funds (ETFs) are not included in the Fund's expense ratio. The Fund indirectly bears its proportionate share of these expenses. For additional expense information related to investments in Fidelity Central Funds, please refer to the "Investments in Fidelity Central Funds" note found in the Notes to Financial Statements section of the most recent Annual or Semi-Annual report.
FExpense ratios reflect operating expenses of the class. Expenses before reductions do not reflect amounts reimbursed, waived, or reduced through arrangements with the investment adviser, brokerage services, or other offset arrangements, if applicable, and do not represent the amount paid by the class during periods when reimbursements, waivers or reductions occur.
GAmount does not include the portfolio activity of any underlying mutual funds or exchange-traded funds (ETFs).
| Fidelity Advisor® Worldwide Fund Class M |
| |
| Years ended October 31, | | 2023 | | 2022 | | 2021 | | 2020 | | 2019 |
Selected Per-Share Data | | | | | | | | | | |
| Net asset value, beginning of period | $ | 25.44 | $ | 39.62 | $ | 31.19 | $ | 27.10 | $ | 26.39 |
| Income from Investment Operations | | | | | | | | | | |
Net investment income (loss) A,B | | .04 | | .01 | | (.22) | | (.13) | | .03 |
| Net realized and unrealized gain (loss) | | 2.51 | | (9.81) | | 11.29 | | 5.46 | | 2.82 |
| Total from investment operations | | 2.55 | | (9.80) | | 11.07 | | 5.33 | | 2.85 |
| Distributions from net investment income | | (.02) | | - | | - | | (.04) | | - |
| Distributions from net realized gain | | (1.37) | | (4.38) | | (2.64) | | (1.20) | | (2.14) |
| Total distributions | | (1.39) | | (4.38) | | (2.64) | | (1.24) | | (2.14) |
| Net asset value, end of period | $ | 26.60 | $ | 25.44 | $ | 39.62 | $ | 31.19 | $ | 27.10 |
Total Return C,D | | 10.39% | | (27.53)% | | 37.37% | | 20.40% | | 12.05% |
Ratios to Average Net Assets B,E,F | | | | | | | | | | |
| Expenses before reductions | | 1.21% | | 1.47% | | 1.55% | | 1.61% | | 1.55% |
| Expenses net of fee waivers, if any | | 1.21% | | 1.47% | | 1.55% | | 1.61% | | 1.54% |
| Expenses net of all reductions | | 1.20% | | 1.47% | | 1.55% | | 1.61% | | 1.54% |
| Net investment income (loss) | | .15% | | .02% | | (.61)% | | (.45)% | | .13% |
| Supplemental Data | | | | | | | | | | |
| Net assets, end of period (000 omitted) | $ | 16,051 | $ | 15,275 | $ | 22,771 | $ | 17,387 | $ | 13,066 |
Portfolio turnover rate G | | 114% | | 137% | | 96% | | 112% | | 147% |
ACalculated based on average shares outstanding during the period.
BNet investment income (loss) is affected by the timing of the declaration of dividends by any underlying mutual funds or exchange-traded funds (ETFs). Net investment income (loss) of any mutual funds or ETFs is not included in the Fund's net investment income (loss) ratio.
CTotal returns would have been lower if certain expenses had not been reduced during the applicable periods shown.
DTotal returns do not include the effect of the sales charges.
EFees and expenses of any underlying mutual funds or exchange-traded funds (ETFs) are not included in the Fund's expense ratio. The Fund indirectly bears its proportionate share of these expenses. For additional expense information related to investments in Fidelity Central Funds, please refer to the "Investments in Fidelity Central Funds" note found in the Notes to Financial Statements section of the most recent Annual or Semi-Annual report.
FExpense ratios reflect operating expenses of the class. Expenses before reductions do not reflect amounts reimbursed, waived, or reduced through arrangements with the investment adviser, brokerage services, or other offset arrangements, if applicable, and do not represent the amount paid by the class during periods when reimbursements, waivers or reductions occur.
GAmount does not include the portfolio activity of any underlying mutual funds or exchange-traded funds (ETFs).
| Fidelity Advisor® Worldwide Fund Class C |
| |
| Years ended October 31, | | 2023 | | 2022 | | 2021 | | 2020 | | 2019 |
Selected Per-Share Data | | | | | | | | | | |
| Net asset value, beginning of period | $ | 24.33 | $ | 38.05 | $ | 30.14 | $ | 26.33 | $ | 25.82 |
| Income from Investment Operations | | | | | | | | | | |
Net investment income (loss) A,B | | (.10) | | (.15) | | (.39) | | (.27) | | (.10) |
| Net realized and unrealized gain (loss) | | 2.39 | | (9.39) | | 10.88 | | 5.28 | | 2.75 |
| Total from investment operations | | 2.29 | | (9.54) | | 10.49 | | 5.01 | | 2.65 |
| Distributions from net realized gain | | (1.37) | | (4.18) | | (2.58) | | (1.20) | | (2.14) |
| Total distributions | | (1.37) | | (4.18) | | (2.58) | | (1.20) | | (2.14) |
| Net asset value, end of period | $ | 25.25 | $ | 24.33 | $ | 38.05 | $ | 30.14 | $ | 26.33 |
Total Return C,D | | 9.76% | | (27.89)% | | 36.63% | | 19.76% | | 11.49% |
Ratios to Average Net Assets B,E,F | | | | | | | | | | |
| Expenses before reductions | | 1.76% | | 2.00% | | 2.08% | | 2.14% | | 2.06% |
| Expenses net of fee waivers, if any | | 1.75% | | 2.00% | | 2.08% | | 2.14% | | 2.06% |
| Expenses net of all reductions | | 1.75% | | 2.00% | | 2.08% | | 2.13% | | 2.06% |
| Net investment income (loss) | | (.39)% | | (.51)% | | (1.14)% | | (.98)% | | (.39)% |
| Supplemental Data | | | | | | | | | | |
| Net assets, end of period (000 omitted) | $ | 7,292 | $ | 8,517 | $ | 13,602 | $ | 11,677 | $ | 10,618 |
Portfolio turnover rate G | | 114% | | 137% | | 96% | | 112% | | 147% |
ACalculated based on average shares outstanding during the period.
BNet investment income (loss) is affected by the timing of the declaration of dividends by any underlying mutual funds or exchange-traded funds (ETFs). Net investment income (loss) of any mutual funds or ETFs is not included in the Fund's net investment income (loss) ratio.
CTotal returns would have been lower if certain expenses had not been reduced during the applicable periods shown.
DTotal returns do not include the effect of the contingent deferred sales charge.
EFees and expenses of any underlying mutual funds or exchange-traded funds (ETFs) are not included in the Fund's expense ratio. The Fund indirectly bears its proportionate share of these expenses. For additional expense information related to investments in Fidelity Central Funds, please refer to the "Investments in Fidelity Central Funds" note found in the Notes to Financial Statements section of the most recent Annual or Semi-Annual report.
FExpense ratios reflect operating expenses of the class. Expenses before reductions do not reflect amounts reimbursed, waived, or reduced through arrangements with the investment adviser, brokerage services, or other offset arrangements, if applicable, and do not represent the amount paid by the class during periods when reimbursements, waivers or reductions occur.
GAmount does not include the portfolio activity of any underlying mutual funds or exchange-traded funds (ETFs).
| Years ended October 31, | | 2023 | | 2022 | | 2021 | | 2020 | | 2019 |
Selected Per-Share Data | | | | | | | | | | |
| Net asset value, beginning of period | $ | 26.26 | $ | 40.76 | $ | 31.97 | $ | 27.74 | $ | 26.90 |
| Income from Investment Operations | | | | | | | | | | |
Net investment income (loss) A,B | | .19 | | .18 | | (.02) | | .03 | | .18 |
| Net realized and unrealized gain (loss) | | 2.57 | | (10.09) | | 11.58 | | 5.58 | | 2.89 |
| Total from investment operations | | 2.76 | | (9.91) | | 11.56 | | 5.61 | | 3.07 |
| Distributions from net investment income | | (.21) | | (.16) | | (.02) | | (.18) | | (.09) |
| Distributions from net realized gain | | (1.37) | | (4.43) | | (2.75) | | (1.20) | | (2.14) |
| Total distributions | | (1.58) | | (4.59) | | (2.77) | | (1.38) | | (2.23) |
| Net asset value, end of period | $ | 27.44 | $ | 26.26 | $ | 40.76 | $ | 31.97 | $ | 27.74 |
Total Return C | | 10.95% | | (27.12)% | | 38.11% | | 21.07% | | 12.71% |
Ratios to Average Net Assets B,D,E | | | | | | | | | | |
| Expenses before reductions | | .67% | | .92% | | 1.00% | | 1.05% | | .99% |
| Expenses net of fee waivers, if any | | .66% | | .92% | | 1.00% | | 1.05% | | .99% |
| Expenses net of all reductions | | .66% | | .92% | | 1.00% | | 1.05% | | .98% |
| Net investment income (loss) | | .70% | | .57% | | (.06)% | | .11% | | .69% |
| Supplemental Data | | | | | | | | | | |
| Net assets, end of period (000 omitted) | $ | 1,982,943 | $ | 1,899,788 | $ | 2,896,684 | $ | 2,217,129 | $ | 2,020,487 |
Portfolio turnover rate F | | 114% | | 137% | | 96% | | 112% | | 147% |
ACalculated based on average shares outstanding during the period.
BNet investment income (loss) is affected by the timing of the declaration of dividends by any underlying mutual funds or exchange-traded funds (ETFs). Net investment income (loss) of any mutual funds or ETFs is not included in the Fund's net investment income (loss) ratio.
CTotal returns would have been lower if certain expenses had not been reduced during the applicable periods shown.
DFees and expenses of any underlying mutual funds or exchange-traded funds (ETFs) are not included in the Fund's expense ratio. The Fund indirectly bears its proportionate share of these expenses. For additional expense information related to investments in Fidelity Central Funds, please refer to the "Investments in Fidelity Central Funds" note found in the Notes to Financial Statements section of the most recent Annual or Semi-Annual report.
EExpense ratios reflect operating expenses of the class. Expenses before reductions do not reflect amounts reimbursed, waived, or reduced through arrangements with the investment adviser, brokerage services, or other offset arrangements, if applicable, and do not represent the amount paid by the class during periods when reimbursements, waivers or reductions occur.
FAmount does not include the portfolio activity of any underlying mutual funds or exchange-traded funds (ETFs).
| Fidelity Advisor® Worldwide Fund Class I |
| |
| Years ended October 31, | | 2023 | | 2022 | | 2021 | | 2020 | | 2019 |
Selected Per-Share Data | | | | | | | | | | |
| Net asset value, beginning of period | $ | 26.04 | $ | 40.46 | $ | 31.77 | $ | 27.58 | $ | 26.77 |
| Income from Investment Operations | | | | | | | | | | |
Net investment income (loss) A,B | | .19 | | .17 | | (.03) | | .03 | | .18 |
| Net realized and unrealized gain (loss) | | 2.56 | | (10.01) | | 11.49 | | 5.55 | | 2.86 |
| Total from investment operations | | 2.75 | | (9.84) | | 11.46 | | 5.58 | | 3.04 |
| Distributions from net investment income | | (.19) | | (.16) | | (.02) | | (.19) | | (.09) |
| Distributions from net realized gain | | (1.37) | | (4.43) | | (2.75) | | (1.20) | | (2.14) |
| Total distributions | | (1.56) | | (4.58) C | | (2.77) | | (1.39) | | (2.23) |
| Net asset value, end of period | $ | 27.23 | $ | 26.04 | $ | 40.46 | $ | 31.77 | $ | 27.58 |
Total Return D | | 10.97% | | (27.13)% | | 38.06% | | 21.08% | | 12.70% |
Ratios to Average Net Assets B,E,F | | | | | | | | | | |
| Expenses before reductions | | .67% | | .94% | | 1.02% | | 1.06% | | .99% |
| Expenses net of fee waivers, if any | | .67% | | .93% | | 1.02% | | 1.06% | | .99% |
| Expenses net of all reductions | | .67% | | .93% | | 1.02% | | 1.05% | | .98% |
| Net investment income (loss) | | .69% | | .56% | | (.08)% | | .10% | | .69% |
| Supplemental Data | | | | | | | | | | |
| Net assets, end of period (000 omitted) | $ | 41,289 | $ | 33,226 | $ | 86,852 | $ | 64,615 | $ | 44,754 |
Portfolio turnover rate G | | 114% | | 137% | | 96% | | 112% | | 147% |
ACalculated based on average shares outstanding during the period.
BNet investment income (loss) is affected by the timing of the declaration of dividends by any underlying mutual funds or exchange-traded funds (ETFs). Net investment income (loss) of any mutual funds or ETFs is not included in the Fund's net investment income (loss) ratio.
CTotal distributions per share do not sum due to rounding.
DTotal returns would have been lower if certain expenses had not been reduced during the applicable periods shown.
EFees and expenses of any underlying mutual funds or exchange-traded funds (ETFs) are not included in the Fund's expense ratio. The Fund indirectly bears its proportionate share of these expenses. For additional expense information related to investments in Fidelity Central Funds, please refer to the "Investments in Fidelity Central Funds" note found in the Notes to Financial Statements section of the most recent Annual or Semi-Annual report.
FExpense ratios reflect operating expenses of the class. Expenses before reductions do not reflect amounts reimbursed, waived, or reduced through arrangements with the investment adviser, brokerage services, or other offset arrangements, if applicable, and do not represent the amount paid by the class during periods when reimbursements, waivers or reductions occur.
GAmount does not include the portfolio activity of any underlying mutual funds or exchange-traded funds (ETFs).
| Fidelity Advisor® Worldwide Fund Class Z |
| |
| Years ended October 31, | | 2023 | | 2022 | | 2021 | | 2020 | | 2019 |
Selected Per-Share Data | | | | | | | | | | |
| Net asset value, beginning of period | $ | 26.05 | $ | 40.48 | $ | 31.76 | $ | 27.59 | $ | 26.78 |
| Income from Investment Operations | | | | | | | | | | |
Net investment income (loss) A,B | | .22 | | .21 | | .02 | | .07 | | .22 |
| Net realized and unrealized gain (loss) | | 2.55 | | (10.01) | | 11.50 | | 5.53 | | 2.86 |
| Total from investment operations | | 2.77 | | (9.80) | | 11.52 | | 5.60 | | 3.08 |
| Distributions from net investment income | | (.25) | | (.20) | | (.05) | | (.23) | | (.13) |
| Distributions from net realized gain | | (1.37) | | (4.43) | | (2.75) | | (1.20) | | (2.14) |
| Total distributions | | (1.62) | | (4.63) | | (2.80) | | (1.43) | | (2.27) |
| Net asset value, end of period | $ | 27.20 | $ | 26.05 | $ | 40.48 | $ | 31.76 | $ | 27.59 |
Total Return C | | 11.10% | | (27.05)% | | 38.27% | | 21.19% | | 12.85% |
Ratios to Average Net Assets B,D,E | | | | | | | | | | |
| Expenses before reductions | | .55% | | .81% | | .90% | | .93% | | .85% |
| Expenses net of fee waivers, if any | | .55% | | .81% | | .90% | | .93% | | .84% |
| Expenses net of all reductions | | .55% | | .81% | | .90% | | .93% | | .84% |
| Net investment income (loss) | | .81% | | .68% | | .04% | | .23% | | .83% |
| Supplemental Data | | | | | | | | | | |
| Net assets, end of period (000 omitted) | $ | 117,232 | $ | 76,829 | $ | 115,963 | $ | 71,278 | $ | 205,197 |
Portfolio turnover rate F | | 114% | | 137% | | 96% | | 112% | | 147% |
ACalculated based on average shares outstanding during the period.
BNet investment income (loss) is affected by the timing of the declaration of dividends by any underlying mutual funds or exchange-traded funds (ETFs). Net investment income (loss) of any mutual funds or ETFs is not included in the Fund's net investment income (loss) ratio.
CTotal returns would have been lower if certain expenses had not been reduced during the applicable periods shown.
DFees and expenses of any underlying mutual funds or exchange-traded funds (ETFs) are not included in the Fund's expense ratio. The Fund indirectly bears its proportionate share of these expenses. For additional expense information related to investments in Fidelity Central Funds, please refer to the "Investments in Fidelity Central Funds" note found in the Notes to Financial Statements section of the most recent Annual or Semi-Annual report.
EExpense ratios reflect operating expenses of the class. Expenses before reductions do not reflect amounts reimbursed, waived, or reduced through arrangements with the investment adviser, brokerage services, or other offset arrangements, if applicable, and do not represent the amount paid by the class during periods when reimbursements, waivers or reductions occur.
FAmount does not include the portfolio activity of any underlying mutual funds or exchange-traded funds (ETFs).
For the period ended October 31, 2023
1. Organization.
Fidelity Worldwide Fund (the Fund) is a fund of Fidelity Investment Trust (the Trust) and is authorized to issue an unlimited number of shares. The Trust is registered under the Investment Company Act of 1940, as amended (the 1940 Act), as an open-end management investment company organized as a Massachusetts business trust. The Fund offers Class A, Class M, Class C, Worldwide, Class I and Class Z shares, each of which has equal rights as to assets and voting privileges. Class A, Class M, Class C, Class I and Class Z are Fidelity Advisor classes. Each class has exclusive voting rights with respect to matters that affect that class. Class C shares will automatically convert to Class A shares after a holding period of eight years from the initial date of purchase, with certain exceptions.
2. Investments in Fidelity Central Funds.
Funds may invest in Fidelity Central Funds, which are open-end investment companies generally available only to other investment companies and accounts managed by the investment adviser and its affiliates. The Schedule of Investments lists any Fidelity Central Funds held as an investment as of period end, but does not include the underlying holdings of each Fidelity Central Fund. An investing fund indirectly bears its proportionate share of the expenses of the underlying Fidelity Central Funds.
Based on its investment objective, each Fidelity Central Fund may invest or participate in various investment vehicles or strategies that are similar to those of the investing fund. These strategies are consistent with the investment objectives of the investing fund and may involve certain economic risks which may cause a decline in value of each of the Fidelity Central Funds and thus a decline in the value of the investing fund.
| Fidelity Central Fund | Investment Manager | Investment Objective | Investment Practices | Expense RatioA |
| Fidelity Money Market Central Funds | Fidelity Management & Research Company LLC (FMR) | Each fund seeks to obtain a high level of current income consistent with the preservation of capital and liquidity. | Short-term Investments | Less than .005% |
A Expenses expressed as a percentage of average net assets and are as of each underlying Central Fund's most recent annual or semi-annual shareholder report.
A complete unaudited list of holdings for each Fidelity Central Fund is available upon request or at the Securities and Exchange Commission website at www.sec.gov. In addition, the financial statements of the Fidelity Central Funds which contain the significant accounting policies (including investment valuation policies) of those funds, and are not covered by the Report of Independent Registered Public Accounting Firm, are available on the Securities and Exchange Commission website or upon request.
3. Significant Accounting Policies.
The Fund is an investment company and applies the accounting and reporting guidance of the Financial Accounting Standards Board (FASB) Accounting Standards Codification Topic 946 Financial Services - Investment Companies. The financial statements have been prepared in conformity with accounting principles generally accepted in the United States of America (GAAP), which require management to make certain estimates and assumptions at the date of the financial statements. Actual results could differ from those estimates. Subsequent events, if any, through the date that the financial statements were issued have been evaluated in the preparation of the financial statements. The Fund's Schedule of Investments lists any underlying mutual funds or exchange-traded funds (ETFs) but does not include the underlying holdings of these funds. The following summarizes the significant accounting policies of the Fund:
Investment Valuation. Investments are valued as of 4:00 p.m. Eastern time on the last calendar day of the period. The Board of Trustees (the Board) has designated the Fund's investment adviser as the valuation designee responsible for the fair valuation function and performing fair value determinations as needed. The investment adviser has established a Fair Value Committee (the Committee) to carry out the day-to-day fair valuation responsibilities and has adopted policies and procedures to govern the fair valuation process and the activities of the Committee. In accordance with these fair valuation policies and procedures, which have been approved by the Board, the Fund attempts to obtain prices from one or more third party pricing services or brokers to value its investments. When current market prices, quotations or currency exchange rates are not readily available or reliable, investments will be fair valued in good faith by the Committee, in accordance with the policies and procedures. Factors used in determining fair value vary by investment type and may include market or investment specific events, transaction data, estimated cash flows, and market observations of comparable investments. The frequency that the fair valuation procedures are used cannot be predicted and they may be utilized to a significant extent. The Committee manages the Fund's fair valuation practices and maintains the fair valuation policies and procedures. The Fund's investment adviser reports to the Board information regarding the fair valuation process and related material matters.
The Fund categorizes the inputs to valuation techniques used to value its investments into a disclosure hierarchy consisting of three levels as shown below:
Level 1 - unadjusted quoted prices in active markets for identical investments
Level 2 - other significant observable inputs (including quoted prices for similar investments, interest rates, prepayment speeds, etc.)
Level 3 - unobservable inputs (including the Fund's own assumptions based on the best information available)
Valuation techniques used to value the Fund's investments by major category are as follows:
Equity securities, including restricted securities, for which market quotations are readily available, are valued at the last reported sale price or official closing price as reported by a third party pricing service on the primary market or exchange on which they are traded and are categorized as Level 1 in the hierarchy. In the event there were no sales during the day or closing prices are not available, securities are valued at the last quoted bid price or may be valued using the last available price and are generally categorized as Level 2 in the hierarchy. For foreign equity securities, when market or security specific events arise, comparisons to the valuation of American Depositary Receipts (ADRs), futures contracts, Exchange-Traded Funds (ETFs) and certain indexes as well as quoted prices for similar securities may be used and would be categorized as Level 2 in the hierarchy. For equity securities, including restricted securities, where observable inputs are limited, assumptions about market activity and risk are used and these securities may be categorized as Level 3 in the hierarchy.
Investments in open-end mutual funds, including the Fidelity Central Funds, are valued at their closing net asset value (NAV) each business day and are categorized as Level 1 in the hierarchy.
Changes in valuation techniques may result in transfers in or out of an assigned level within the disclosure hierarchy. The aggregate value of investments by input level as of October 31, 2023 is included at the end of the Fund's Schedule of Investments.
Foreign Currency. Certain Funds may use foreign currency contracts to facilitate transactions in foreign-denominated securities. Gains and losses from these transactions may arise from changes in the value of the foreign currency or if the counterparties do not perform under the contracts' terms.
Foreign-denominated assets, including investment securities, and liabilities are translated into U.S. dollars at the exchange rates at period end. Purchases and sales of investment securities, income and dividends received, and expenses denominated in foreign currencies are translated into U.S. dollars at the exchange rate in effect on the transaction date.
The effects of exchange rate fluctuations on investments are included with the net realized and unrealized gain (loss) on investment securities. Other foreign currency transactions resulting in realized and unrealized gain (loss) are disclosed separately.
Investment Transactions and Income. For financial reporting purposes, the Fund's investment holdings and NAV include trades executed through the end of the last business day of the period. The NAV per share for processing shareholder transactions is calculated as of the close of business of the New York Stock Exchange (NYSE), normally 4:00 p.m. Eastern time and includes trades executed through the end of the prior business day. Gains and losses on securities sold are determined on the basis of identified cost and include proceeds received from litigation. Commissions paid to certain brokers with whom the investment adviser, or its affiliates, places trades on behalf of a fund include an amount in addition to trade execution, which may be rebated back to a fund. Any such rebates are included in net realized gain (loss) on investments in the Statement of Operations. Dividend income is recorded on the ex-dividend date, except for certain dividends from foreign securities where the ex-dividend date may have passed, which are recorded as soon as the Fund is informed of the ex-dividend date. Non-cash dividends included in dividend income, if any, are recorded at the fair market value of the securities received. Income and capital gain distributions from Fidelity Central Funds, if any, are recorded on the ex-dividend date. Investment income is recorded net of foreign taxes withheld where recovery of such taxes is uncertain. Funds may file withholding tax reclaims in certain jurisdictions to recover a portion of amounts previously withheld. Any withholding tax reclaims income is included in the Statement of Operations in foreign taxes withheld. Any receivables for withholding tax reclaims are included in the Statement of Assets and Liabilities in reclaims receivable.
Class Allocations and Expenses. Investment income, realized and unrealized capital gains and losses, common expenses of a fund, and certain fund-level expense reductions, if any, are allocated daily on a pro-rata basis to each class based on the relative net assets of each class to the total net assets of a fund. Each class differs with respect to transfer agent and distribution and service plan fees incurred, as applicable. Certain expense reductions may also differ by class, if applicable. For the reporting period, the allocated portion of income and expenses to each class as a percent of its average net assets may vary due to the timing of recording these transactions in relation to fluctuating net assets of the classes. Expenses directly attributable to a fund are charged to that fund. Expenses attributable to more than one fund are allocated among the respective funds on the basis of relative net assets or other appropriate methods. Expenses included in the accompanying financial statements reflect the expenses of that fund and do not include any expenses associated with any underlying mutual funds or exchange-traded funds (ETFs). Although not included in a fund's expenses, a fund indirectly bears its proportionate share of these expenses through the net asset value of each underlying mutual fund or exchange-traded fund (ETF). Expense estimates are accrued in the period to which they relate and adjustments are made when actual amounts are known.
Income Tax Information and Distributions to Shareholders. Each year, the Fund intends to qualify as a regulated investment company under Subchapter M of the Internal Revenue Code, including distributing substantially all of its taxable income and realized gains. As a result, no provision for U.S. Federal income taxes is required. As of October 31, 2023, the Fund did not have any unrecognized tax benefits in the financial statements; nor is the Fund aware of any tax positions for which it is reasonably possible that the total amounts of unrecognized tax benefits will significantly change in the next twelve months. The Fund files a U.S. federal tax return, in addition to state and local tax returns as required. The Fund's federal income tax returns are subject to examination by the Internal Revenue Service (IRS) for a period of three fiscal years after they are filed. State and local tax returns may be subject to examination for an additional fiscal year depending on the jurisdiction. Foreign taxes are provided for based on the Fund's understanding of the tax rules and rates that exist in the foreign markets in which it invests. The Fund is subject to a tax imposed on capital gains by certain countries in which it invests.
Distributions are declared and recorded on the ex-dividend date. Income and capital gain distributions are declared separately for each class. Income and capital gain distributions are determined in accordance with income tax regulations, which may differ from GAAP. In addition, the Fund claimed a portion of the payment made to redeeming shareholders as a distribution for income tax purposes.
Capital accounts within the financial statements are adjusted for permanent book-tax differences. These adjustments have no impact on net assets or the results of operations. Capital accounts are not adjusted for temporary book-tax differences which will reverse in a subsequent period.
Book-tax differences are primarily due to foreign currency transactions, certain foreign taxes, passive foreign investment companies (PFIC) and losses deferred due to wash sales.
As of period end, the cost and unrealized appreciation (depreciation) in securities, and derivatives if applicable, for federal income tax purposes were as follows:
| Gross unrealized appreciation | $487,872,947 |
| Gross unrealized depreciation | (136,412,978) |
| Net unrealized appreciation (depreciation) | $351,459,969 |
| Tax Cost | $1,880,418,453 |
The tax-based components of distributable earnings as of period end were as follows:
| Undistributed ordinary income | $20,464,780 |
| Net unrealized appreciation (depreciation) on securities and other investments | $351,283,677 |
The tax character of distributions paid was as follows:
| | October 31, 2023 | October 31, 2022 |
| Ordinary Income | $16,412,086 | $ 81,038,229 |
| Long-term Capital Gains | 108,424,728 | 281,092,325 |
| Total | $124,836,814 | $ 362,130,554 |
| | | |
Restricted Securities (including Private Placements). Funds may invest in securities that are subject to legal or contractual restrictions on resale. These securities generally may be resold in transactions exempt from registration or to the public if the securities are registered. Disposal of these securities may involve time-consuming negotiations and expense, and prompt sale at an acceptable price may be difficult. Information regarding restricted securities held at period end is included at the end of the Schedule of Investments, if applicable.
4. Purchases and Sales of Investments.
Purchases and sales of securities, other than short-term securities and in-kind transactions, as applicable, are noted in the table below.
| | Purchases ($) | Sales ($) |
| Fidelity Worldwide Fund | 2,551,435,027 | 2,628,995,150 |
5. Fees and Other Transactions with Affiliates.
Management Fee. Fidelity Management & Research Company LLC (the investment adviser) and its affiliates provide the Fund with investment management related services for which the Fund pays a monthly management fee. The management fee is the sum of an individual fund fee rate that is based on an annual rate of .424% of the Fund's average net assets and an annualized group fee rate that averaged .23% during the period. The group fee rate is based upon the monthly average net assets of a group of registered investment companies with which the investment adviser has management contracts. The group fee rate decreases as assets under management increase and increases as assets under management decrease. In addition, the management fee is subject to a performance adjustment (up to a maximum of +/- .20% of the Fund's average net assets over a 36 month performance period). The upward or downward adjustment to the management fee is based on the relative investment performance of the Fund as compared to its benchmark index, the MSCI World Index, over the same 36 month performance period. For the reporting period, the total annual management fee rate, including the performance adjustment, was .47% of the Fund's average net assets. The performance adjustment included in the management fee rate may be higher or lower than the maximum performance adjustment rate due to the difference between the average net assets for the reporting and performance periods.
Distribution and Service Plan Fees. In accordance with Rule 12b-1 of the 1940 Act, the Fund has adopted separate Distribution and Service Plans for each class of shares. Certain classes pay Fidelity Distributors Company LLC (FDC), an affiliate of the investment adviser, separate Distribution and Service Fees, each of which is based on an annual percentage of each class' average net assets. In addition, FDC may pay financial intermediaries for selling shares of the Fund and providing shareholder support services. For the period, the Distribution and Service Fee rates, total fees and amounts retained by FDC were as follows:
| | Distribution Fee | Service Fee | Total Fees | Retained by FDC |
| Class A | - % | .25% | $184,890 | $2,536 |
| Class M | .25% | .25% | 81,826 | 193 |
| Class C | .75% | .25% | 83,799 | 8,248 |
| | | | $350,515 | $10,977 |
Sales Load. FDC may receive a front-end sales charge of up to 5.75% for selling Class A shares and 3.50% for selling Class M shares, some of which is paid to financial intermediaries for selling shares of the Fund. Depending on the holding period, FDC may receive contingent deferred sales charges levied on Class A, Class M and Class C redemptions. The deferred sales charges are 1.00% for Class C shares, 1.00% for certain purchases of Class A shares and .25% for certain purchases of Class M shares.
For the period, sales charge amounts retained by FDC were as follows:
| | Retained by FDC |
| Class A | $ 33,299 |
| Class M | 1,274 |
Class CA | 201 |
| | $ 34,774 |
A When Class C shares are initially sold, FDC pays commissions from its own resources to financial intermediaries through which the sales are made.
Transfer Agent Fees. Fidelity Investments Institutional Operations Company LLC (FIIOC), an affiliate of the investment adviser, is the transfer, dividend disbursing and shareholder servicing agent for each class of the Fund. FIIOC receives account fees and asset-based fees that vary according to the account size and type of account of the shareholders of the respective classes of the Fund, except for Class Z. FIIOC receives an asset-based fee of Class Z's average net assets. FIIOC pays for typesetting, printing and mailing of shareholder reports, except proxy statements.
For the period, transfer agent fees for each class were as follows:
| | Amount | % of Class-Level Average Net Assets |
| Class A | $143,500 | .19 |
| Class M | 32,992 | .20 |
| Class C | 20,497 | .24 |
| Worldwide | 3,117,597 | .15 |
| Class I | 64,764 | .16 |
| Class Z | 38,866 | .04 |
| | $3,418,216 | |
During November 2023, the Board approved a change in the transfer agent fees effective December 1, 2023 to a fixed annual rate of class-level average net assets as follows:
| | % of Class-Level Average Net Assets |
| Class A | 0.1905% |
| Class M | 0.1969% |
| Class C | 0.2000% |
| Class I | 0.1651% |
| Fidelity Worldwide Fund | 0.1475% |
Accounting Fees. Fidelity Service Company, Inc. (FSC), an affiliate of the investment adviser, maintains the Fund's accounting records. The accounting fee is based on the level of average net assets for each month. For the period, the fees were equivalent to the following annual rates:
| | % of Average Net Assets |
| Fidelity Worldwide Fund | .03 |
During November 2023, the Board approved a change in the accounting fees effective December 1, 2023 to a fixed annual rate of average net assets as follows:
| | % of Average Net Assets |
| Fidelity Worldwide Fund | 0.0263% |
Brokerage Commissions. A portion of portfolio transactions were placed with brokerage firms which are affiliates of the investment adviser. Brokerage commissions are included in net realized gain (loss) and change in net unrealized appreciation (depreciation) in the Statement of Operations. The commissions paid to these affiliated firms were as follows:
| | Amount |
| Fidelity Worldwide Fund | $ 33,341 |
Interfund Trades. Funds may purchase from or sell securities to other Fidelity Funds under procedures adopted by the Board. The procedures have been designed to ensure these interfund trades are executed in accordance with Rule 17a-7 of the 1940 Act. Any interfund trades are included within the respective purchases and sales amounts shown in the Purchases and Sales of Investments note. Interfund trades during the period are noted in the table below.
| | Purchases ($) | Sales ($) | Realized Gain (Loss) ($) |
| Fidelity Worldwide Fund | 132,494,440 | 138,598,777 | (1,672,686) |
6. Committed Line of Credit.
Certain Funds participate with other funds managed by the investment adviser or an affiliate in a $4.25 billion credit facility (the "line of credit") to be utilized for temporary or emergency purposes to fund shareholder redemptions or for other short-term liquidity purposes. The participating funds have agreed to pay commitment fees on their pro-rata portion of the line of credit, which are reflected in Miscellaneous expenses on the Statement of Operations, and are listed below. During the period, there were no borrowings on this line of credit.
| | Amount |
| Fidelity Worldwide Fund | $4,051 |
7. Security Lending.
Funds lend portfolio securities from time to time in order to earn additional income. Lending agents are used, including National Financial Services (NFS), an affiliate of the investment adviser. Pursuant to a securities lending agreement, NFS will receive a fee, which is capped at 9.9% of a fund's daily lending revenue, for its services as lending agent. A fund may lend securities to certain qualified borrowers, including NFS. On the settlement date of the loan, a fund receives collateral (in the form of U.S. Treasury obligations, letters of credit and/or cash) against the loaned securities and maintains collateral in an amount not less than 100% of the market value of the loaned securities during the period of the loan. The market value of the loaned securities is determined at the close of business of a fund and any additional required collateral is delivered to a fund on the next business day. A fund or borrower may terminate the loan at any time, and if the borrower defaults on its obligation to return the securities loaned because of insolvency or other reasons, a fund may apply collateral received from the borrower against the obligation. A fund may experience delays and costs in recovering the securities loaned. Any cash collateral received is invested in the Fidelity Securities Lending Cash Central Fund. Any loaned securities are identified as such in the Schedule of Investments, and the value of loaned securities and cash collateral at period end, as applicable, are presented in the Statement of Assets and Liabilities. Security lending income represents the income earned on investing cash collateral, less rebates paid to borrowers and any lending agent fees associated with the loan, plus any premium payments received for lending certain types of securities. Security lending income is presented in the Statement of Operations as a component of income from Fidelity Central Funds. Affiliated security lending activity, if any, was as follows:
| | Total Security Lending Fees Paid to NFS | Security Lending Income From Securities Loaned to NFS | Value of Securities Loaned to NFS at Period End |
| Fidelity Worldwide Fund | $9,490 | $- | $- |
8. Expense Reductions.
Through arrangements with each class' transfer agent, credits realized as a result of certain uninvested cash balances were used to reduce the Fund's expenses. During the period, transfer agent credits reduced each class' expenses as noted in the table below
| | Expense reduction |
| Class A | $102 |
| Class M | 430 |
| Class C | 40 |
| | $ 572 |
In addition, during the period the investment adviser or an affiliate reimbursed and/or waived a portion of fund-level operating expenses in the amount of $137,760.
9. Distributions to Shareholders.
Distributions to shareholders of each class were as follows:
| | Year ended October 31, 2023 | Year ended October 31, 2022 |
| Fidelity Worldwide Fund | | |
| Distributions to shareholders | | |
| Class A | $ 3,905,043 | $11,246,925 |
| Class M | 825,955 | 2,460,774 |
| Class C | 473,638 | 1,484,213 |
| Worldwide | 112,981,740 | 323,847,724 |
| Class I | 1,950,914 | 9,721,033 |
| Class Z | 4,699,524 | 13,369,886 |
Total | $ 124,836,814 | $ 362,130,555 |
10. Share Transactions.
Share transactions for each class were as follows and may contain in-kind transactions, automatic conversions between classes or exchanges between affiliated funds:
| | Shares | Shares | Dollars | Dollars |
| | Year ended October 31, 2023 | Year ended October 31, 2022 | Year ended October 31, 2023 | Year ended October 31, 2022 |
| Fidelity Worldwide Fund | | | | |
| Class A | | | | |
| Shares sold | 398,646 | 425,346 | $10,809,786 | $13,150,315 |
| Reinvestment of distributions | 153,659 | 323,585 | 3,866,062 | 11,111,902 |
| Shares redeemed | (469,022) | (573,433) | (12,647,071) | (17,987,153) |
| Net increase (decrease) | 83,283 | 175,498 | $2,028,777 | $6,275,064 |
| Class M | | | | |
| Shares sold | 50,411 | 63,154 | $1,331,408 | $1,827,369 |
| Reinvestment of distributions | 32,920 | 71,924 | 820,689 | 2,446,862 |
| Shares redeemed | (80,267) | (109,465) | (2,112,561) | (3,332,351) |
| Net increase (decrease) | 3,064 | 25,613 | $39,536 | $941,880 |
| Class C | | | | |
| Shares sold | 30,402 | 49,629 | $765,161 | $1,443,792 |
| Reinvestment of distributions | 19,902 | 45,376 | 473,280 | 1,482,892 |
| Shares redeemed | (111,594) | (102,345) | (2,847,983) | (2,936,201) |
| Net increase (decrease) | (61,290) | (7,340) | $(1,609,542) | $(9,517) |
| Worldwide | | | | |
| Shares sold | 6,385,600 | 5,548,119 | $176,715,594 | $176,262,456 |
| Reinvestment of distributions | 4,190,088 | 8,857,534 | 107,266,234 | 309,393,660 |
| Shares redeemed | (10,673,714) | (13,126,499) | (292,505,585) | (404,042,333) |
| Net increase (decrease) | (98,026) | 1,279,154 | $(8,523,757) | $81,613,783 |
| Class I | | | | |
| Shares sold | 817,991 | 391,287 | $22,120,908 | $11,850,826 |
| Reinvestment of distributions | 75,801 | 274,142 | 1,925,343 | 9,499,030 |
| Shares redeemed | (653,340) | (1,536,108) | (17,772,257) | (45,074,681) |
| Net increase (decrease) | 240,452 | (870,679) | $6,273,994 | $(23,724,825) |
| Class Z | | | | |
| Shares sold | 1,882,153 | 785,358 | $54,181,206 | $23,797,734 |
| Reinvestment of distributions | 176,768 | 358,516 | 4,481,057 | 12,415,394 |
| Shares redeemed | (699,310) | (1,058,983) | (19,184,778) | (32,578,317) |
| Net increase (decrease) | 1,359,611 | 84,891 | $39,477,485 | $3,634,811 |
11. Other.
A fund's organizational documents provide former and current trustees and officers with a limited indemnification against liabilities arising in connection with the performance of their duties to the fund. In the normal course of business, a fund may also enter into contracts that provide general indemnifications. A fund's maximum exposure under these arrangements is unknown as this would be dependent on future claims that may be made against a fund. The risk of material loss from such claims is considered remote.
12. Risk and Uncertainties.
Many factors affect a fund's performance. Developments that disrupt global economies and financial markets, such as pandemics, epidemics, outbreaks of infectious diseases, war, terrorism, and environmental disasters, may significantly affect a fund's investment performance. The effects of these developments to a fund will be impacted by the types of securities in which a fund invests, the financial condition, industry, economic sector, and geographic location of an issuer, and a fund's level of investment in the securities of that issuer. Significant concentrations in security types, issuers, industries, sectors, and geographic locations may magnify the factors that affect a fund's performance.
To the Board of Trustees of Fidelity Investment Trust and the Shareholders of Fidelity Diversified International Fund, Fidelity International Capital Appreciation Fund, and Fidelity Worldwide Fund:
Opinion on the Financial Statements and Financial Highlights
We have audited the accompanying statements of assets and liabilities of Fidelity Diversified International Fund, Fidelity International Capital Appreciation Fund, and Fidelity Worldwide Fund (the "Funds"), each a fund of Fidelity Investment Trust, including the schedules of investments, as of October 31, 2023, the related statements of operations for the year then ended, the statements of changes in net assets for each of the two years in the period then ended, the financial highlights for each of the five years in the period then ended, and the related notes. In our opinion, the financial statements and financial highlights present fairly, in all material respects, the financial position of each of the Funds as of October 31, 2023, and the results of their operations for the year then ended, the changes in their net assets for each of the two years in the period then ended, and the financial highlights for each of the five years in the period then ended in conformity with accounting principles generally accepted in the United States of America.
Basis for Opinion
These financial statements and financial highlights are the responsibility of the Funds' management. Our responsibility is to express an opinion on the Funds' financial statements and financial highlights based on our audits. We are a public accounting firm registered with the Public Company Accounting Oversight Board (United States) (PCAOB) and are required to be independent with respect to the Funds in accordance with the U.S. federal securities laws and the applicable rules and regulations of the Securities and Exchange Commission and the PCAOB.
We conducted our audits in accordance with the standards of the PCAOB. Those standards require that we plan and perform the audit to obtain reasonable assurance about whether the financial statements and financial highlights are free of material misstatement, whether due to error or fraud. The Funds are not required to have, nor were we engaged to perform, an audit of their internal control over financial reporting. As part of our audits, we are required to obtain an understanding of internal control over financial reporting but not for the purpose of expressing an opinion on the effectiveness of the Funds' internal control over financial reporting. Accordingly, we express no such opinion.
Our audits included performing procedures to assess the risks of material misstatement of the financial statements and financial highlights, whether due to error or fraud, and performing procedures that respond to those risks. Such procedures included examining, on a test basis, evidence regarding the amounts and disclosures in the financial statements and financial highlights. Our audits also included evaluating the accounting principles used and significant estimates made by management, as well as evaluating the overall presentation of the financial statements and financial highlights. Our procedures included confirmation of securities owned as of October 31, 2023, by correspondence with the custodian and brokers; when replies were not received from brokers, we performed other auditing procedures. We believe that our audits provide a reasonable basis for our opinion.
/s/ Deloitte & Touche LLP
Boston, Massachusetts
December 14, 2023
We have served as the auditor of one or more of the Fidelity investment companies since 1999.
To the Board of Trustees of Fidelity Investment Trust and Shareholders of Fidelity Overseas Fund
Opinion on the Financial Statements
We have audited the accompanying statement of assets and liabilities, including the schedule of investments, of Fidelity Overseas Fund (one of the funds constituting Fidelity Investment Trust, referred to hereafter as the "Fund") as of October 31, 2023, the related statement of operations for the year ended October 31, 2023, the statement of changes in net assets for each of the two years in the period ended October 31, 2023, including the related notes, and the financial highlights for each of the five years in the period ended October 31, 2023 (collectively referred to as the "financial statements"). In our opinion, the financial statements present fairly, in all material respects, the financial position of the Fund as of October 31, 2023, the results of its operations for the year then ended, the changes in its net assets for each of the two years in the period ended October 31, 2023 and the financial highlights for each of the five years in the period ended October 31, 2023 in conformity with accounting principles generally accepted in the United States of America.
Basis for Opinion
These financial statements are the responsibility of the Fund's management. Our responsibility is to express an opinion on the Fund's financial statements based on our audits. We are a public accounting firm registered with the Public Company Accounting Oversight Board (United States) (PCAOB) and are required to be independent with respect to the Fund in accordance with the U.S. federal securities laws and the applicable rules and regulations of the Securities and Exchange Commission and the PCAOB.
We conducted our audits of these financial statements in accordance with the standards of the PCAOB. Those standards require that we plan and perform the audit to obtain reasonable assurance about whether the financial statements are free of material misstatement, whether due to error or fraud.
Our audits included performing procedures to assess the risks of material misstatement of the financial statements, whether due to error or fraud, and performing procedures that respond to those risks. Such procedures included examining, on a test basis, evidence regarding the amounts and disclosures in the financial statements. Our audits also included evaluating the accounting principles used and significant estimates made by management, as well as evaluating the overall presentation of the financial statements. Our procedures included confirmation of securities owned as of October 31, 2023 by correspondence with the custodian, issuers of privately offered securities and brokers; when replies were not received from brokers, we performed other auditing procedures. We believe that our audits provide a reasonable basis for our opinion.
/s/ PricewaterhouseCoopers LLP
Boston, Massachusetts
December 14, 2023
We have served as the auditor of one or more investment companies in the Fidelity group of funds since 1932.
The Trustees, Members of the Advisory Board (if any), and officers of the trust and funds, as applicable, are listed below. The Board of Trustees governs each fund and is responsible for protecting the interests of shareholders. The Trustees are experienced executives who meet periodically throughout the year to oversee each fund's activities, review contractual arrangements with companies that provide services to each fund, oversee management of the risks associated with such activities and contractual arrangements, and review each fund's performance. Except for Jonathan Chiel, each of the Trustees oversees 322 funds. Mr. Chiel oversees 191 funds.
The Trustees hold office without limit in time except that (a) any Trustee may resign; (b) any Trustee may be removed by written instrument, signed by at least two-thirds of the number of Trustees prior to such removal; (c) any Trustee who requests to be retired or who has become incapacitated by illness or injury may be retired by written instrument signed by a majority of the other Trustees; and (d) any Trustee may be removed at any special meeting of shareholders by a two-thirds vote of the outstanding voting securities of the trust. Each Trustee who is not an interested person (as defined in the 1940 Act) of the trust and the funds is referred to herein as an Independent Trustee. Each Independent Trustee shall retire not later than the last day of the calendar year in which his or her 75th birthday occurs. The Independent Trustees may waive this mandatory retirement age policy with respect to individual Trustees. Officers and Advisory Board Members hold office without limit in time, except that any officer or Advisory Board Member may resign or may be removed by a vote of a majority of the Trustees at any regular meeting or any special meeting of the Trustees. Except as indicated, each individual has held the office shown or other offices in the same company for the past five years.
The funds' Statement of Additional Information (SAI) includes more information about the Trustees. To request a free copy, call Fidelity at 1-800-544-8544 if you're an individual investing directly with Fidelity, call 1-800-835-5092 if you're a plan sponsor or participant with Fidelity as your recordkeeper or call 1-877-208-0098 on institutional accounts or if you're an advisor or invest through one.
Experience, Skills, Attributes, and Qualifications of the Trustees. The Governance and Nominating Committee has adopted a statement of policy that describes the experience, qualifications, attributes, and skills that are necessary and desirable for potential Independent Trustee candidates (Statement of Policy). The Board believes that each Trustee satisfied at the time he or she was initially elected or appointed a Trustee, and continues to satisfy, the standards contemplated by the Statement of Policy. The Governance and Nominating Committee also engages professional search firms to help identify potential Independent Trustee candidates who have the experience, qualifications, attributes, and skills consistent with the Statement of Policy. From time to time, additional criteria based on the composition and skills of the current Independent Trustees, as well as experience or skills that may be appropriate in light of future changes to board composition, business conditions, and regulatory or other developments, have also been considered by the professional search firms and the Governance and Nominating Committee. In addition, the Board takes into account the Trustees' commitment and participation in Board and committee meetings, as well as their leadership of standing and ad hoc committees throughout their tenure.
In determining that a particular Trustee was and continues to be qualified to serve as a Trustee, the Board has considered a variety of criteria, none of which, in isolation, was controlling. The Board believes that, collectively, the Trustees have balanced and diverse experience, qualifications, attributes, and skills, which allow the Board to operate effectively in governing each fund and protecting the interests of shareholders. Information about the specific experience, skills, attributes, and qualifications of each Trustee, which in each case led to the Board's conclusion that the Trustee should serve (or continue to serve) as a trustee of the funds, is provided below.
Board Structure and Oversight Function. Robert A. Lawrence is an interested person and currently serves as Chair. The Trustees have determined that an interested Chair is appropriate and benefits shareholders because an interested Chair has a personal and professional stake in the quality and continuity of services provided to the funds. Independent Trustees exercise their informed business judgment to appoint an individual of their choosing to serve as Chair, regardless of whether the Trustee happens to be independent or a member of management. The Independent Trustees have determined that they can act independently and effectively without having an Independent Trustee serve as Chair and that a key structural component for assuring that they are in a position to do so is for the Independent Trustees to constitute a substantial majority for the Board. The Independent Trustees also regularly meet in executive session. David M. Thomas serves as Lead Independent Trustee and as such (i) acts as a liaison between the Independent Trustees and management with respect to matters important to the Independent Trustees and (ii) with management prepares agendas for Board meetings.
Fidelity® funds are overseen by different Boards of Trustees. The funds' Board oversees Fidelity's high income and certain equity funds, and other Boards oversee Fidelity's alternative investment, investment-grade bond, money market, asset allocation, and other equity funds. The asset allocation funds may invest in Fidelity® funds overseen by the funds' Board. The use of separate Boards, each with its own committee structure, allows the Trustees of each group of Fidelity® funds to focus on the unique issues of the funds they oversee, including common research, investment, and operational issues. On occasion, the separate Boards establish joint committees to address issues of overlapping consequences for the Fidelity® funds overseen by each Board.
The Trustees operate using a system of committees to facilitate the timely and efficient consideration of all matters of importance to the Trustees, each fund, and fund shareholders and to facilitate compliance with legal and regulatory requirements and oversight of the funds' activities and associated risks. The Board, acting through its committees, has charged FMR and its affiliates with (i) identifying events or circumstances the occurrence of which could have demonstrably adverse effects on the funds' business and/or reputation; (ii) implementing processes and controls to lessen the possibility that such events or circumstances occur or to mitigate the effects of such events or circumstances if they do occur; and (iii) creating and maintaining a system designed to evaluate continuously business and market conditions in order to facilitate the identification and implementation processes described in (i) and (ii) above. Because the day-to-day operations and activities of the funds are carried out by or through FMR, its affiliates, and other service providers, the funds' exposure to risks is mitigated but not eliminated by the processes overseen by the Trustees. While each of the Board's committees has responsibility for overseeing different aspects of the funds' activities, oversight is exercised primarily through the Operations, Audit, and Compliance Committees. Appropriate personnel, including but not limited to the funds' Chief Compliance Officer (CCO), FMR's internal auditor, the independent accountants, the funds' Treasurer and portfolio management personnel, make periodic reports to the Board's committees, as appropriate, including an annual review of Fidelity's risk management program for the Fidelity® funds. The responsibilities of each standing committee, including their oversight responsibilities, are described further under "Standing Committees of the Trustees."
Interested Trustees*:
Correspondence intended for a Trustee who is an interested person may be sent to Fidelity Investments, 245 Summer Street, Boston, Massachusetts 02210.
Name, Year of Birth; Principal Occupations and Other Relevant Experience+
Jonathan Chiel (1957)
Year of Election or Appointment: 2016
Trustee
Mr. Chiel also serves as Trustee of other Fidelity® funds. Mr. Chiel is General Counsel (2012-present) and Head of Legal, Risk and Compliance (2022-present). Mr Chiel serves as Executive Vice President and General Counsel for FMR LLC (diversified financial services company, 2012-present) and Director and President for OH Company LLC (holding company, 2018-present). Previously, Mr. Chiel served as general counsel (2004-2012) and senior vice president and deputy general counsel (2000-2004) for John Hancock Financial Services; a partner with Choate, Hall & Stewart (1996-2000) (law firm); and an Assistant United States Attorney for the United States Attorney's Office of the District of Massachusetts (1986-95), including Chief of the Criminal Division (1993-1995). Mr. Chiel is a director on the boards of the Boston Bar Foundation and the Maimonides School.
Bettina Doulton (1964)
Year of Election or Appointment: 2021
Trustee
Ms. Doulton also serves as Trustee of other Fidelity® funds. Prior to her retirement, Ms. Doulton served in a variety of positions at Fidelity Investments, including as a managing director of research (2006-2007), portfolio manager to certain Fidelity® funds (1993-2005), equity analyst and portfolio assistant (1990-1993), and research assistant (1987-1990). Ms. Doulton currently owns and operates Phi Builders + Architects and Cellardoor Winery. Previously, Ms. Doulton served as a member of the Board of Brown Capital Management, LLC (2014-2018).
Robert A. Lawrence (1952)
Year of Election or Appointment: 2020
Trustee
Chair of the Board of Trustees
Mr. Lawrence also serves as Trustee of other funds. Previously, Mr. Lawrence served as a Trustee and Member of the Advisory Board of certain funds. Prior to his retirement in 2008, Mr. Lawrence served as Vice President of certain Fidelity® funds (2006-2008), Senior Vice President, Head of High Income Division of Fidelity Management & Research Company (investment adviser firm, 2006-2008), and President of Fidelity Strategic Investments (investment adviser firm, 2002-2005).
* Determined to be an "Interested Trustee" by virtue of, among other things, his or her affiliation with the trust or various entities under common control with FMR.
+ The information includes the Trustee's principal occupation during the last five years and other information relating to the experience, attributes, and skills relevant to the Trustee's qualifications to serve as a Trustee, which led to the conclusion that the Trustee should serve as a Trustee for each fund.
Independent Trustees:
Correspondence intended for an Independent Trustee may be sent to Fidelity Investments, P.O. Box 55235, Boston, Massachusetts 02205-5235.
Name, Year of Birth; Principal Occupations and Other Relevant Experience+
Thomas P. Bostick (1956)
Year of Election or Appointment: 2021
Trustee
Lieutenant General Bostick also serves as Trustee of other Fidelity® funds. Prior to his retirement, General Bostick (United States Army, Retired) held a variety of positions within the U.S. Army, including Commanding General and Chief of Engineers, U.S. Army Corps of Engineers (2012-2016) and Deputy Chief of Staff and Director of Human Resources, U.S. Army (2009-2012). General Bostick currently serves as a member of the Board and Finance and Governance & Sustainability Committees of CSX Corporation (transportation, 2020-present) and a member of the Board and Corporate Governance and Nominating Committee of Perma-Fix Environmental Services, Inc. (nuclear waste management, 2020-present). General Bostick serves as Chief Executive Officer of Bostick Global Strategies, LLC (consulting, 2016-present), as a member of the Board of HireVue, Inc. (video interview and assessment, 2020-present), as a member of the Board of Allonnia (biotechnology and engineering solutions, 2022-present) and on the Advisory Board of Solugen, Inc. (specialty bio-based chemicals manufacturer, 2022-present). Previously, General Bostick served as a Member of the Advisory Board of certain Fidelity® funds (2021), President, Intrexon Bioengineering (2018-2020) and Chief Operating Officer (2017-2020) and Senior Vice President of the Environment Sector (2016-2017) of Intrexon Corporation (biopharmaceutical company).
Dennis J. Dirks (1948)
Year of Election or Appointment: 2005
Trustee
Mr. Dirks also serves as Trustee of other Fidelity® funds. Prior to his retirement in May 2003, Mr. Dirks served as Chief Operating Officer and as a member of the Board of The Depository Trust & Clearing Corporation (financial markets infrastructure), President, Chief Operating Officer and a member of the Board of The Depository Trust Company (DTC), President and a member of the Board of the National Securities Clearing Corporation (NSCC), Chief Executive Officer and a member of the Board of the Government Securities Clearing Corporation and Chief Executive Officer and a member of the Board of the Mortgage-Backed Securities Clearing Corporation. Mr. Dirks currently serves as a member of the Finance Committee (2016-present) and Board (2017-present) and is Treasurer (2018-present) of the Asolo Repertory Theatre.
Donald F. Donahue (1950)
Year of Election or Appointment: 2018
Trustee
Mr. Donahue also serves as Trustee of other Fidelity® funds. Mr. Donahue serves as President and Chief Executive Officer of Miranda Partners, LLC (risk consulting for the financial services industry, 2012-present). Previously, Mr. Donahue served as Chief Executive Officer (2006-2012), Chief Operating Officer (2003-2006) and Managing Director, Customer Marketing and Development (1999-2003) of The Depository Trust & Clearing Corporation (financial markets infrastructure). Mr. Donahue currently serves as a member (2007-present) and Co-Chairman (2016-present) of the Board of United Way of New York. Mr. Donahue previously served as a member of the Advisory Board of certain Fidelity® funds (2015-2018) and as a member of the Board of The Leadership Academy (previously NYC Leadership Academy) (2012-2022).
Vicki L. Fuller (1957)
Year of Election or Appointment: 2020
Trustee
Ms. Fuller also serves as Trustee of other Fidelity® funds. Previously, Ms. Fuller served as a member of the Advisory Board of certain Fidelity® funds (2018-2020), Chief Investment Officer of the New York State Common Retirement Fund (2012-2018) and held a variety of positions at AllianceBernstein L.P. (global asset management, 1985-2012), including Managing Director (2006-2012) and Senior Vice President and Senior Portfolio Manager (2001-2006). Ms. Fuller currently serves as a member of the Board, Audit Committee and Nominating and Governance Committee of two Blackstone business development companies (2020-present), as a member of the Board of Treliant, LLC (consulting, 2019-present), as a member of the Board of Ariel Alternatives, LLC (private equity, 2022-present) and as a member of the Board and Chair of the Audit Committee of Gusto, Inc. (software, 2021-present). In addition, Ms. Fuller currently serves as a member of the Board of Roosevelt University (2019-present) and as a member of the Executive Board of New York University's Stern School of Business. Ms. Fuller previously served as a member of the Board, Audit Committee and Nominating and Governance Committee of The Williams Companies, Inc. (natural gas infrastructure, 2018-2021).
Patricia L. Kampling (1959)
Year of Election or Appointment: 2020
Trustee
Ms. Kampling also serves as Trustee of other Fidelity® funds. Prior to her retirement, Ms. Kampling served as Chairman of the Board and Chief Executive Officer (2012-2019), President and Chief Operating Officer (2011-2012) and Executive Vice President and Chief Financial Officer (2010-2011) of Alliant Energy Corporation. Ms. Kampling currently serves as a member of the Board, Finance Committee and Governance, Compensation and Nominating Committee of Xcel Energy Inc. (utilities company, 2020-present) and as a member of the Board, Audit, Finance and Risk Committee and Safety, Environmental, Technology and Operations Committee and Chair of the Executive Development and Compensation Committee of American Water Works Company, Inc. (utilities company, 2019-present). In addition, Ms. Kampling currently serves as a member of the Board of the Nature Conservancy, Wisconsin Chapter (2019-present). Previously, Ms. Kampling served as a Member of the Advisory Board of certain Fidelity® funds (2020), a member of the Board, Compensation Committee and Executive Committee and Chair of the Audit Committee of Briggs & Stratton Corporation (manufacturing, 2011-2021), a member of the Board of Interstate Power and Light Company (2012-2019) and Wisconsin Power and Light Company (2012-2019) (each a subsidiary of Alliant Energy Corporation) and as a member of the Board and Workforce Development Committee of the Business Roundtable (2018-2019).
Thomas A. Kennedy (1955)
Year of Election or Appointment: 2021
Trustee
Mr. Kennedy also serves as Trustee of other Fidelity® funds. Previously, Mr. Kennedy served as a Member of the Advisory Board of certain Fidelity® funds (2020) and held a variety of positions at Raytheon Company (aerospace and defense, 1983-2020), including Chairman and Chief Executive Officer (2014-2020) and Executive Vice President and Chief Operating Officer (2013-2014). Mr. Kennedy served as Executive Chairman of the Board of Directors of Raytheon Technologies Corporation (aerospace and defense, 2020-2021). Mr. Kennedy serves as a Director of the Board of Directors of Textron Inc. (aerospace and defense, 2023-present).
Oscar Munoz (1959)
Year of Election or Appointment: 2021
Trustee
Mr. Munoz also serves as Trustee of other Fidelity® funds. Prior to his retirement, Mr. Munoz served as Executive Chairman (2020-2021), Chief Executive Officer (2015-2020), President (2015-2016) and a member of the Board (2010-2021) of United Airlines Holdings, Inc. Mr. Munoz currently serves as a member of the Board of CBRE Group, Inc. (commercial real estate, 2020-present), a member of the Board of Univision Communications, Inc. (Hispanic media, 2020-present), a member of the Board of Archer Aviation Inc. (2021-present), a member of the Defense Business Board of the United States Department of Defense (2021-present) and a member of the Board of Salesforce.com, Inc. (cloud-based software, 2022-present). Previously, Mr. Munoz served as a Member of the Advisory Board of certain Fidelity® funds (2021).
David M. Thomas (1949)
Year of Election or Appointment: 2008
Trustee
Lead Independent Trustee
Mr. Thomas also serves as Trustee of other Fidelity® funds. Previously, Mr. Thomas served as Executive Chairman (2005-2006) and Chairman and Chief Executive Officer (2000-2005) of IMS Health, Inc. (pharmaceutical and healthcare information solutions). Mr. Thomas currently serves as a member of the Board of Fortune Brands Home and Security (home and security products, 2004-present) and as Director (2013-present) and Non-Executive Chairman of the Board (2022-present) of Interpublic Group of Companies, Inc. (marketing communication).
Susan Tomasky (1953)
Year of Election or Appointment: 2020
Trustee
Ms. Tomasky also serves as Trustee of other Fidelity® funds. Prior to her retirement, Ms. Tomasky served in various executive officer positions at American Electric Power Company, Inc. (1998-2011), including most recently as President of AEP Transmission (2007-2011). Ms. Tomasky currently serves as a member of the Board and Sustainability Committee and as Chair of the Audit Committee of Marathon Petroleum Corporation (2018-present) and as a member of the Board, Executive Committee, Corporate Governance Committee and Organization and Compensation Committee and as Lead Director of the Board of Public Service Enterprise Group, Inc. (utilities company, 2012-present) and as a member of the Board of its subsidiary company, Public Service Electric and Gas Co. (2021-present). In addition, Ms. Tomasky currently serves as a member (2009-present) and President (2020-present) of the Board of the Royal Shakespeare Company - America (2009-present), as a member of the Board of the Columbus Association for the Performing Arts (2011-present) and as a member of the Board and Kenyon in the World Committee of Kenyon College (2016-present). Previously, Ms. Tomasky served as a Member of the Advisory Board of certain Fidelity® funds (2020), as a member of the Board of the Columbus Regional Airport Authority (2007-2020), as a member of the Board (2011-2018) and Lead Independent Director (2015-2018) of Andeavor Corporation (previously Tesoro Corporation) (independent oil refiner and marketer) and as a member of the Board of Summit Midstream Partners LP (energy, 2012-2018).
Michael E. Wiley (1950)
Year of Election or Appointment: 2020
Trustee
Mr. Wiley also serves as Trustee of other Fidelity® funds. Previously, Mr. Wiley served as a member of the Advisory Board of certain Fidelity® funds (2018-2020), Chairman, President and CEO of Baker Hughes, Inc. (oilfield services, 2000-2004). Mr. Wiley also previously served as a member of the Board of Andeavor Corporation (independent oil refiner and marketer, 2005-2018), a member of the Board of Andeavor Logistics LP (natural resources logistics, 2015-2018) and a member of the Board of High Point Resources (exploration and production, 2005-2020).
+ The information includes the Trustee's principal occupation during the last five years and other information relating to the experience, attributes, and skills relevant to the Trustee's qualifications to serve as a Trustee, which led to the conclusion that the Trustee should serve as a Trustee for each fund.
Advisory Board Members and Officers:
Correspondence intended for a Member of the Advisory Board (if any) may be sent to Fidelity Investments, P.O. Box 55235, Boston, Massachusetts 02205-5235. Correspondence intended for an officer or Peter S. Lynch may be sent to Fidelity Investments, 245 Summer Street, Boston, Massachusetts 02210.
Name, Year of Birth; Principal Occupation
Vijay C. Advani (1960)
Year of Election or Appointment: 2023
Member of the Advisory Board
Mr. Advani also serves as Trustee or Member of the Advisory Board of other funds. Previously, Mr. Advani served as Executive Chairman (2020-2022), Chief Executive Officer (2017-2020) and Chief Operating Officer (2016-2017) of Nuveen (global investment manager). He also served in various capacities at Franklin Resources (global investment manager), including Co-President (2015-2016), Executive Vice President, Global Advisory Services (2008-2015), Head of Global Retail Distribution (2005-2008), Executive Managing Director, International Retail Development (2002-2005), Managing Director, Product Developments, Sales & Marketing, Asia, Eastern Europe and Africa (2000-2002) and President, Templeton Asset Management India (1995-2000). Mr. Advani also served as Senior Investment Officer of International Finance Corporation (private equity and venture capital arm of The World Bank, 1984-1995). Mr. Advani is Chairman Emeritus of the U.S. India Business Council (2018-present), a Director of The Global Impact Investing Network (2019-present), a Director of LOK Capital (Mauritius) (2022-present), a member of the Advisory Council of LOK Capital (2022-present), a Senior Advisor of Neuberger Berman (2021-present), a Senior Advisor of Seviora Holdings Pte. Ltd (Temasek-Singapore) (2021-present), a Director of Seviora Capital (Singapore) (2021-present) and an Advisor of EQUIAM (2021-present). Mr. Advani formerly served as a member of the Board of BowX Acquisition Corp. (special purpose acquisition company, 2020-2021), a member of the Board of Intellecap (advisory arm of The Aavishkaar Group, 2018-2020), a member of the Board of Nuveen Investments, Inc. (2017-2020) and a member of the Board of Docusign (software, 2016-2019).
Peter S. Lynch (1944)
Year of Election or Appointment: 2003
Member of the Advisory Board
Mr. Lynch also serves as a Member of the Advisory Board of other Fidelity® funds. Mr. Lynch is Vice Chairman and a Director of Fidelity Management & Research Company LLC (investment adviser firm). In addition, Mr. Lynch serves as a Trustee of Boston College and as the Chairman of the Inner-City Scholarship Fund. Previously, Mr. Lynch served as Vice Chairman and a Director of FMR Co., Inc. (investment adviser firm) and on the Special Olympics International Board of Directors (1997-2006).
Karen B. Peetz (1955)
Year of Election or Appointment: 2023
Member of the Advisory Board
Ms. Peetz also serves as a Member of the Advisory Board of other funds. Previously, Ms. Peetz served as Chief Administration Officer (2020-2023) of Citigroup Inc. (a diversified financial service company). She also served in various capacities at Bank of New York Mellon Corporation, including President (2013-2016), Vice Chairman, Senior Executive Vice President and Chief Executive Officer of Financial Markets & Treasury Services (2010-2013), Senior Executive Vice President and Chief Executive Officer of Global Corporate Trust (2003-2008), Senior Vice President and Division Manager of Global Payments & Trade Services (2002-2003) and Senior Vice President and Division Manager of Domestic Corporate Trust (1998-2002). Ms. Peetz also served in various capacities at Chase Manhattan Corporation (1982-1998), including Senior Vice President and Manager of Corporate Trust International Business (1996-1998), Managing Director and Manager of Corporate Trust Services (1994-1996) and Managing Director and Group Manager of Financial Institution Sales (1990-1993). Ms. Peetz currently serves as Chair of Amherst Holdings Advisory Council (2018-present), Trustee of Johns Hopkins University (2016-present), Chair of the Carey Business School Advisory Council, Member of the Johns Hopkins Medicine Board and Finance Committee and Chair of the Lyme and Tick Related Disease Institute Advisory Council. Ms. Peetz previously served as a member of the Board of Guardian Life Insurance Company of America (2019-2023), a member of the Board of Trane Technologies (2018-2022), a member of the Board of Wells Fargo Corp. (2017-2019), a member of the Board of SunCoke Energy Inc. (2012-2016), a member of the Board of Private Export Funding Corporation (2010-2016) and as a Trustee of Penn State University (2010-2014) and the United Way of New York City (2008-2010).
Heather Bonner (1977)
Year of Election or Appointment: 2023
Assistant Treasurer
Ms. Bonner also serves as an officer of other funds. Ms. Bonner is a Senior Vice President (2022-present) and is an employee of Fidelity Investments (2022-present). Ms. Bonner serves as Vice President, Treasurer, or Assistant Treasurer of certain Fidelity entities. Prior to joining Fidelity, Ms. Bonner served as Managing Director at AQR Capital Management (2013-2022) and was the Treasurer and Principal Financial Officer of the AQR Funds (2013-2022).
Craig S. Brown (1977)
Year of Election or Appointment: 2022
Deputy Treasurer
Mr. Brown also serves as an officer of other funds. Mr. Brown is a Vice President (2015-present) and is an employee of Fidelity Investments. Mr. Brown serves as Assistant Treasurer of FIMM, LLC (2021-present). Previously, Mr. Brown served as Assistant Treasurer of certain Fidelity® funds (2019-2022).
John J. Burke III (1964)
Year of Election or Appointment: 2018
Chief Financial Officer
Mr. Burke also serves as Chief Financial Officer of other funds. Mr. Burke is Head of Fidelity Fund and Investment Operations (2018-present) and is an employee of Fidelity Investments. Mr. Burke serves as President, Executive Vice President, or Director of certain Fidelity entities. Previously Mr. Burke served as head of Asset Management Investment Operations (2012-2018).
Margaret Carey (1973)
Year of Election or Appointment: 2023
Secretary and Chief Legal Officer (CLO)
Ms. Carey also serves as an officer of other funds and as CLO of certain Fidelity entities. Ms. Carey is a Senior Vice President, Deputy General Counsel (2019-present) and is an employee of Fidelity Investments.
William C. Coffey (1969)
Year of Election or Appointment: 2019
Assistant Secretary
Mr. Coffey also serves as Assistant Secretary of other funds. Mr. Coffey is a Senior Vice President, Deputy General Counsel (2010-present) and is an employee of Fidelity Investments. Previously, Mr. Coffey served as Secretary and CLO of certain funds (2018-2019); CLO, Secretary, or Senior Vice President of certain Fidelity entities and Assistant Secretary of certain funds (2009-2018).
Timothy M. Cohen (1969)
Year of Election or Appointment: 2018
Vice President
Mr. Cohen also serves as Vice President of other funds. Mr. Cohen is Co-Head of Equity (2018-present) and is an employee of Fidelity Investments. Mr. Cohen serves a Director of Fidelity Management & Research (Japan) Limited (investment adviser firm, 2016-present). Previously, Mr. Cohen served as Executive Vice President of Fidelity SelectCo, LLC (2019) and Head of Global Equity Research (2016-2018).
Jonathan Davis (1968)
Year of Election or Appointment: 2010
Assistant Treasurer
Mr. Davis also serves as an officer of other funds. Mr. Davis is a Vice President (2006-present) and is an employee of Fidelity Investments. Mr. Davis serves as Assistant Treasurer of certain Fidelity entities.
Laura M. Del Prato (1964)
Year of Election or Appointment: 2018
Assistant Treasurer
Ms. Del Prato also serves as an officer of other funds. Ms. Del Prato is a Senior Vice President (2017-present) and is an employee of Fidelity Investments. Ms. Del Prato serves as Vice President or Assistant Treasurer of certain Fidelity entities. Previously, Ms. Del Prato served as President and Treasurer of The North Carolina Capital Management Trust: Cash Portfolio and Term Portfolio (2018-2020).
Colm A. Hogan (1973)
Year of Election or Appointment: 2020
Assistant Treasurer
Mr. Hogan also serves as an officer of other funds. Mr. Hogan is a Vice President (2016-present) and is an employee of Fidelity Investments. Mr. Hogan serves as Assistant Treasurer of certain Fidelity entities. Previously, Mr. Hogan served as Deputy Treasurer of certain Fidelity® funds (2016-2020) and Assistant Treasurer of certain Fidelity® funds (2016-2018).
Pamela R. Holding (1964)
Year of Election or Appointment: 2018
Vice President
Ms. Holding also serves as Vice President of other funds. Ms. Holding is Co-Head of Equity (2018-present) and is an employee of Fidelity Investments. Previously, Ms. Holding served as Executive Vice President of Fidelity SelectCo, LLC (2019) and as Chief Investment Officer of Fidelity Institutional Asset Management (2013-2018).
Chris Maher (1972)
Year of Election or Appointment: 2020
Deputy Treasurer
Mr. Maher also serves as an officer of other funds. Mr. Maher is a Vice President (2008-present) and is an employee of Fidelity Investments. Mr. Maher serves as Assistant Treasurer of certain Fidelity entities. Previously, Mr. Maher served as Assistant Treasurer of certain funds (2013-2020).
Jason P. Pogorelec (1975)
Year of Election or Appointment: 2020
Chief Compliance Officer
Mr. Pogorelec also serves as Chief Compliance Officer of other funds. Mr. Pogorelec is a Senior Vice President of Asset Management Compliance (2020-present) and is an employee of Fidelity Investments. Mr. Pogorelec serves as Compliance Officer of Fidelity Management & Research Company LLC (investment adviser firm, 2023-present) and Ballyrock Investment Advisors LLC (2023-present). Previously, Mr. Pogorelec served as a Vice President, Associate General Counsel for Fidelity Investments (2010-2020) and Assistant Secretary of certain Fidelity® funds (2015-2020).
Brett Segaloff (1972)
Year of Election or Appointment: 2021
Anti-Money Laundering (AML) Officer
Mr. Segaloff also serves as AML Officer of other funds. Mr. Segaloff is a Vice President (2022-present) and is an employee of Fidelity Investments. Mr. Segaloff serves as Anti Money Laundering Compliance Officer or Anti Money Laundering/Bank Secrecy Act Compliance Officer of certain Fidelity entities.
Stacie M. Smith (1974)
Year of Election or Appointment: 2016
President and Treasurer
Ms. Smith also serves as an officer of other funds. Ms. Smith is a Senior Vice President (2016-present) and is an employee of Fidelity Investments. Ms. Smith serves as Assistant Treasurer of certain Fidelity entities and has served in other fund officer roles.
Jim Wegmann (1979)
Year of Election or Appointment: 2019
Assistant Treasurer
Mr. Wegmann also serves as an officer of other funds. Mr. Wegmann is a Vice President (2016-present) and is an employee of Fidelity Investments. Mr. Wegmann serves as Assistant Treasurer of FIMM, LLC (2021-present). Previously, Mr. Wegmann served as Assistant Treasurer of certain Fidelity® funds (2019-2021).
As a shareholder, you incur two types of costs: (1) transaction costs, which may include sales charges (loads) on purchase payments or redemption proceeds, as applicable and (2) ongoing costs, which generally include management fees, distribution and/or service (12b-1) fees and other Fund expenses. This Example is intended to help you understand your ongoing costs (in dollars) of investing in a fund and to compare these costs with the ongoing costs of investing in other mutual funds.
| The Example is based on an investment of $1,000 invested at the beginning of the period and held for the entire period (May 1, 2023 to October 31, 2023). |
Actual Expenses
The first line of the accompanying table provides information about actual account values and actual expenses. You may use the information in this line, together with the amount you invested, to estimate the expenses that you paid over the period. Simply divide your account value by $1,000.00 (for example, an $8,600 account value divided by $1,000.00 = 8.6), then multiply the result by the number in the first line for a class/Fund under the heading entitled "Expenses Paid During Period" to estimate the expenses you paid on your account during this period. If any fund is a shareholder of any underlying mutual funds or exchange-traded funds (ETFs) (the Underlying Funds), such fund indirectly bears its proportional share of the expenses of the Underlying Funds in addition to the direct expenses incurred presented in the table. These fees and expenses are not included in the annualized expense ratio used to calculate the expense estimate in the table below.
Hypothetical Example for Comparison Purposes
The second line of the accompanying table provides information about hypothetical account values and hypothetical expenses based on the actual expense ratio and an assumed rate of return of 5% per year before expenses, which is not the actual return. The hypothetical account values and expenses may not be used to estimate the actual ending account balance or expenses you paid for the period. You may use this information to compare the ongoing costs of investing in the Fund and other funds. To do so, compare this 5% hypothetical example with the 5% hypothetical examples that appear in the shareholder reports of the other funds. If any fund is a shareholder of any Underlying Funds, such fund indirectly bears its proportional share of the expenses of the Underlying Funds in addition to the direct expenses as presented in the table. These fees and expenses are not included in the annualized expense ratio used to calculate the expense estimate in the table below.
Please note that the expenses shown in the table are meant to highlight your ongoing costs only and do not reflect any transaction costs. Therefore, the second line of the table is useful in comparing ongoing costs only, and will not help you determine the relative total costs of owning different funds. In addition, if these transactional costs were included, your costs would have been higher.
| | | | | Annualized Expense Ratio- A | | Beginning Account Value May 1, 2023 | | Ending Account Value October 31, 2023 | | Expenses Paid During Period- C May 1, 2023 to October 31, 2023 |
| Fidelity® Diversified International Fund | | | | | | | | | | |
| Fidelity® Diversified International Fund | | | | .57% | | | | | | |
| Actual | | | | | | $ 1,000 | | $ 930.50 | | $ 2.77 |
Hypothetical-B | | | | | | $ 1,000 | | $ 1,022.33 | | $ 2.91 |
| Class K | | | | .45% | | | | | | |
| Actual | | | | | | $ 1,000 | | $ 930.90 | | $ 2.19 |
Hypothetical-B | | | | | | $ 1,000 | | $ 1,022.94 | | $ 2.29 |
| | | | | | | | | | |
| Fidelity® International Capital Appreciation Fund | | | | .73% | | | | | | |
| Actual | | | | | | $ 1,000 | | $ 949.60 | | $ 3.59 |
Hypothetical-B | | | | | | $ 1,000 | | $ 1,021.53 | | $ 3.72 |
| Fidelity® Overseas Fund | | | | | | | | | | |
| Fidelity® Overseas Fund | | | | .64% | | | | | | |
| Actual | | | | | | $ 1,000 | | $ 910.00 | | $ 3.08 |
Hypothetical-B | | | | | | $ 1,000 | | $ 1,021.98 | | $ 3.26 |
| Class K | | | | .54% | | | | | | |
| Actual | | | | | | $ 1,000 | | $ 910.40 | | $ 2.60 |
Hypothetical-B | | | | | | $ 1,000 | | $ 1,022.48 | | $ 2.75 |
| Fidelity® Worldwide Fund | | | | | | | | | | |
| Class A | | | | .90% | | | | | | |
| Actual | | | | | | $ 1,000 | | $ 1,003.60 | | $ 4.55 |
Hypothetical-B | | | | | | $ 1,000 | | $ 1,020.67 | | $ 4.58 |
| Class M | | | | 1.15% | | | | | | |
| Actual | | | | | | $ 1,000 | | $ 1,001.50 | | $ 5.80 |
Hypothetical-B | | | | | | $ 1,000 | | $ 1,019.41 | | $ 5.85 |
| Class C | | | | 1.69% | | | | | | |
| Actual | | | | | | $ 1,000 | | $ 998.80 | | $ 8.51 |
Hypothetical-B | | | | | | $ 1,000 | | $ 1,016.69 | | $ 8.59 |
| Fidelity® Worldwide Fund | | | | .61% | | | | | | |
| Actual | | | | | | $ 1,000 | | $ 1,004.00 | | $ 3.08 |
Hypothetical-B | | | | | | $ 1,000 | | $ 1,022.13 | | $ 3.11 |
| Class I | | | | .63% | | | | | | |
| Actual | | | | | | $ 1,000 | | $ 1,004.10 | | $ 3.18 |
Hypothetical-B | | | | | | $ 1,000 | | $ 1,022.03 | | $ 3.21 |
| Class Z | | | | .51% | | | | | | |
| Actual | | | | | | $ 1,000 | | $ 1,005.80 | | $ 2.58 |
Hypothetical-B | | | | | | $ 1,000 | | $ 1,022.63 | | $ 2.60 |
| |
A Annualized expense ratio reflects expenses net of applicable fee waivers.
B 5% return per year before expenses
C Expenses are equal to the annualized expense ratio, multiplied by the average account value over the period, multiplied by 184/ 365 (to reflect the one-half year period). The fees and expenses of any Underlying Funds are not included in each annualized expense ratio.
The dividend and capital gains distributions for the fund(s) are available on Fidelity.com or Institutional.Fidelity.com.
The funds hereby designate as capital gain dividend the amounts noted below for the taxable year ended October 31, 2023, or, if subsequently determined to be different, the net capital gain of such year.
| Fidelity Diversified International Fund | $280,906,946 |
| Fidelity International Capital Appreciation Fund | $0 |
| Fidelity Overseas Fund | $0 |
| Fidelity Worldwide Fund | $1,011,359 |
The funds hereby designate the amounts noted below as distributions paid during the fiscal year ended 2023 as qualifying to be taxed as section 163(j) interest dividends:
| Fidelity Diversified International Fund | $0 |
| Fidelity International Capital Appreciation Fund | $353,794 |
| Fidelity Overseas Fund | $0 |
| Fidelity Worldwide Fund | $0 |
A percentage of the dividends distributed during the fiscal year for the following funds qualify for the dividends-received deduction for corporate shareholders:
| | Class A | Class M | Class C | Retail Class | Class I | Class Z | Class K | |
| Fidelity Diversified International Fund | | | | | | | | |
| December, 2022 | - | - | - | 4% | - | - | 4% | |
| Fidelity International Capital Appreciation Fund | | | | | | | | |
| December, 2022 | - | - | - | 38% | - | - | - | |
| Fidelity Overseas Fund | | | | | | | | |
| December, 2022 | - | - | - | 7% | - | - | 7% | |
| Fidelity Worldwide Fund | | | | | | | | |
| December, 2022 | 100% | 100% | - | 100% | 100% | 100% | - | |
A percentage of the dividends distributed during the fiscal year for the following funds may be taken into account as a dividend for purposes of the maximum rate under section 1(h)(11) of the Internal Revenue Code.
| | Class A | Class M | Class C | Retail Class | Class I | Class Z | Class K |
| Fidelity Diversified International Fund | | | | | | | |
| December, 2022 | - | - | - | 100% | - | - | 100% |
Fidelity International Capital Appreciation Fund | | | | | | | |
| December, 2022 | - | - | - | 100% | - | - | - |
| Fidelity Overseas Fund | | | | | | | |
| December, 2022 | - | - | - | 100% | - | - | 100% |
| Fidelity Worldwide Fund | | | | | | | |
| December, 2022 | 100% | 100% | - | 100% | 100% | 100% | - |
The amounts per share which represent income derived from sources within, and taxes paid to, foreign countries or possessions of the United States are as follows:
| | Pay Date | Income | Taxes |
| Fidelity Diversified International Fund | | | |
| Diversified International | 12/12/22 | $0.2455 | $0.1065 |
| Class K | 12/12/22 | $0.2955 | $0.1065 |
| Fidelity International Capital Appreciation Fund | | | |
| | 12/05/22 | $0.0488 | $0.0388 |
| Fidelity Overseas Fund | | | |
| Overseas Fund | 12/05/22 | $0.5421 | $0.1521 |
| Class K | 12/05/22 | $0.5961 | $0.1521 |
The funds will notify shareholders in January 2024 of amounts for use in preparing 2023 income tax returns.
Board Approval of Investment Advisory Contracts and Management Fees
Fidelity Diversified International Fund
Fidelity International Capital Appreciation Fund
Fidelity Overseas Fund
Fidelity Worldwide Fund
Each year, the Board of Trustees, including the Independent Trustees (together, the Board), considers the renewal of each fund's management contract with Fidelity Management & Research Company LLC (FMR) and the sub-advisory agreements (together, the Advisory Contracts) for each fund. FMR and the sub-advisers are referred to herein as the Investment Advisers. The Board, assisted by the advice of fund counsel and Independent Trustees' counsel, requests and considers a broad range of information relevant to the renewal of the Advisory Contracts throughout the year.
The Board meets regularly and, at each of its meetings, covers an extensive agenda of topics and materials and considers factors that are relevant to its annual consideration of the renewal of each fund's Advisory Contracts, including the services and support provided to each fund and its shareholders. The Board, acting directly and through its Committees (each of which is composed of and chaired by Independent Trustees), requests and receives information concerning the annual consideration of the renewal of each fund's Advisory Contracts. The Board also meets as needed to review matters specifically related to the Board's annual consideration of the renewal of the Advisory Contracts. Members of the Board may also meet with trustees of other Fidelity funds through joint ad hoc committees to discuss certain matters relevant to all of the Fidelity funds.
Approval of Stub Period Continuation. At its May 2023 meeting, the Board of Trustees voted to continue each fund's management contract with FMR, and the sub-advisory agreements and sub-sub-advisory agreements, in each case, where applicable (together, the Advisory Contracts), without modification, for two months from June 1, 2023 through July 31, 2023. The Board considered that the approval of each fund's Advisory Contracts will not result in any changes in (i) the investment process or strategies employed in the management of each fund's assets; (ii) the fees and expenses paid by shareholders; (iii) the nature, extent or quality of services provided under each fund's Advisory Contracts; or (iv) the day-to-day management of each fund or the persons primarily responsible for such management. The Board also considered that since its last approval of each fund's Advisory Contracts, FMR had provided additional information on each fund in support of the annual contract renewal process, including competitive analyses on total expenses and management fees and in-depth reviews of fund performance and fund profitability information. The Board concluded that each fund's Advisory Contracts are fair and reasonable, and that each fund's Advisory Contracts should be renewed, without modification, through July 31, 2023, with the understanding that the Board would consider the annual renewal for a full one year period in July 2023.
At its July 2023 meeting, the Board unanimously determined to renew each fund's Advisory Contracts. In reaching its determination, the Board considered all factors it believed relevant, including (i) the nature, extent, and quality of the services provided to each fund and its shareholders (including the investment performance of each fund); (ii) the competitiveness relative to peer funds of each funds management fee and the total expense ratio of each fund or representative class, as applicable; (iii) the total costs of the services provided by and the profits realized by FMR and its affiliates (Fidelity) from its relationships with each fund; and (iv) the extent to which, if any, economies of scale exist and are realized as each fund grows, and whether any economies of scale are appropriately shared with fund shareholders. The Board also considered the broad range of investment choices available to shareholders from FMR's competitors and that each fund's shareholders have chosen to invest in the fund, which is part of the Fidelity family of funds. The Board's decision to renew the Advisory Contracts was not based on any single factor.
The Board reached a determination, with the assistance of fund counsel and Independent Trustees' counsel and through the exercise of its business judgment, that the renewal of the Advisory Contracts was in the best interests of each fund and its shareholders and that the compensation payable under the Advisory Contracts was fair and reasonable in light of all of the surrounding circumstances.
Nature, Extent, and Quality of Services Provided. The Board considered staffing as it relates to the funds, including the backgrounds and experience of investment personnel of the Investment Advisers, and also considered the Investment Advisers' implementation of each fund's investment program. The Independent Trustees also had discussions with senior management of Fidelity's investment operations and investment groups. The Board considered the structure of the investment personnel compensation program and whether this structure provides appropriate incentives to act in the best interests of each fund. Additionally, the Board considered the portfolio managers' investments, if any, in the funds that they manage.
Resources Dedicated to Investment Management and Support Services. The Board and the Fund Oversight and Research Committees reviewed the general qualifications and capabilities of Fidelity's investment staff, including its size, education, experience, and resources, as well as Fidelity's approach to recruiting, training, managing, and compensating investment personnel. The Board noted the resources devoted to expansion of Fidelity's global investment organization, and that Fidelity's analysts have extensive resources, tools and capabilities that allow them to conduct sophisticated quantitative and fundamental analysis, as well as credit analysis of issuers, counterparties, and guarantors. Further, the Board considered that Fidelity's investment professionals have sufficient access to global information and data so as to provide competitive investment results over time, and that those professionals also have access to sophisticated tools that permit them to assess portfolio construction and risk and performance attribution characteristics continuously, as well as to transmit new information and research conclusions rapidly around the world. Additionally, in its deliberations, the Board considered Fidelity's trading, risk management, compliance, and technology and operations capabilities and resources, which are integral parts of the investment management process.
Shareholder and Administrative Services. The Board considered (i) the nature, extent, quality, and cost of advisory, administrative, and shareholder services performed by the Investment Advisers and their affiliates under the Advisory Contracts and under separate agreements covering transfer agency, pricing and bookkeeping, and securities lending services for each fund; (ii) the nature and extent of Fidelity's supervision of third party service providers, principally custodians, subcustodians, and pricing vendors; and (iii) the resources devoted by Fidelity to, and the record of compliance with, each fund's compliance policies and procedures. The Board also reviewed the allocation of fund brokerage, including allocations to brokers affiliated with the Investment Advisers, the use of brokerage commissions to pay fund expenses, and the use of "soft" commission dollars to pay for research services. The Board also considered each fund's securities lending activities and any payments made to Fidelity relating to securities lending.
The Board noted that the growth of fund assets over time across the complex allows Fidelity to reinvest in the development of services designed to enhance the value and convenience of the Fidelity funds as investment vehicles. These services include 24-hour access to account information and market information over the Internet and through telephone representatives, investor education materials, and asset allocation tools. The Board also considered that it reviews customer service metrics such as telephone response times, continuity of services on the website and metrics addressing services at Fidelity Investor Centers.
Investment in a Large Fund Family. The Board considered the benefits to shareholders of investing in a fund that is part of a large family of funds offering a variety of investment disciplines and providing a large variety of fund investor services. The Board noted that Fidelity had taken, or had made recommendations that resulted in the Fidelity funds taking, a number of actions over the previous year that benefited particular funds and/or the Fidelity funds in general.
Investment Performance. The Board took into account discussions that occur with representatives of the Investment Advisers, and reports that it receives, at Board meetings throughout the year, relating to fund investment performance. In this regard the Board noted that as part of regularly scheduled fund reviews and other reports to the Board on fund performance, the Board considered annualized return information for each fund for different time periods, measured against an appropriate securities market index (benchmark index) and an appropriate peer group of funds with similar objectives (peer group). The Board also considered information about performance attribution. In its ongoing evaluation of fund investment performance, the Board gives particular attention to information indicating changes in performance of the funds over different time periods and discussed with the Investment Advisers the reasons for any overperformance or underperformance. Each of Fidelity Diversified International Fund, Fidelity International Capital Appreciation Fund and Fidelity Worldwide Fund underperformed its benchmark and peers for the one- and three-year periods ended February 28, 2023, and as a result, the Board continues to engage in discussions with FMR about the steps it is taking to address each fund's performance.
In addition to reviewing absolute and relative fund performance, the Independent Trustees periodically consider the appropriateness of fund performance metrics in evaluating the results achieved. The Independent Trustees generally give greater weight to fund performance over longer time periods than over shorter time periods. Depending on the circumstances, the Independent Trustees may be satisfied with a fund's performance notwithstanding that it lags its benchmark index or peer group for certain periods.
Based on its review, the Board concluded that the nature, extent, and quality of services provided to each fund under the Advisory Contracts should continue to benefit the shareholders of each fund.
Competitiveness of Management Fee and Total Expense Ratio. The Board was provided with information regarding industry trends in management fees and expenses. In its review of each fund's management fee and total expense ratio of the fund or, for Fidelity Diversified International Fund, Fidelity Overseas Fund and the Fidelity Worldwide Fund, the retail class, the Board considered each fund's management fee rate as well as other fund or class expenses, as applicable, such as transfer agent fees, pricing and bookkeeping fees, fund-paid 12b-1 fees (in the case of Fidelity Worldwide Fund), and custodial, legal, and audit fees. The Board noted that Fidelity may agree to waive fees or reimburse expenses from time to time, and the extent to which, if any, it has done so for each fund. The Board also considered information about the impact of each fund's performance adjustment.
Comparisons of Management Fees and Total Expense Ratios. Among other things, the Board reviewed data for selected groups of competitive funds and classes (referred to as "mapped groups") that were compiled by Fidelity based on combining similar investment objective categories (as classified by Lipper) that have comparable investment mandates. The data reviewed by the Board included (i) gross management fee comparisons (before taking into account expense reimbursements or caps and without taking into account each fund's performance adjustment) relative to the total universe of funds within the mapped group; (ii) gross management fee comparisons relative to a subset of non-Fidelity funds in the mapped group that are similar in size and management fee structure to each fund (referred to as the "asset size peer group"); (iii) total expense comparisons of the fund or the retail class (for Fidelity Diversified International Fund, Fidelity Overseas Fund and Fidelity Worldwide Fund), relative to funds and classes in the mapped group that have a similar sales load structure to the fund or representative class, as applicable (referred to as the "similar sales load structure group"); and (iv) total expense comparisons of the fund or the retail class (for Fidelity Diversified International Fund, Fidelity Overseas Fund and Fidelity Worldwide Fund) relative to funds and classes in the similar sales load structure group that are similar in size and management fee structure to the fund or class, as applicable (referred to as the "total expense asset size peer group"). The total expense asset size peer group comparison excludes performance adjustments and fund-paid 12b-1 fees to eliminate variability in fee structures.
The information provided to the Board indicated that each fund's management fee rate ranked below the competitive median of the mapped group for the 12-month period ended September 30, 2022 and below the competitive median of the asset size peer group for the 12-month period ended September 30, 2022.
The information provided to the Board indicated that the total expense ratio of Fidelity International Capital Appreciation Fund and of the retail class of Fidelity Worldwide Fund ranked below the competitive median of the similar sales load structure group for the 12-month period ended September 30, 2022 and below the competitive median of the asset size peer group for the 12-month period ended September 30, 2022.
For Fidelity Diversified International Fund and Fidelity Overseas Fund, the information provided to the Board indicated that the total expense ratio of the retail class of each fund ranked below the competitive median of the similar sales load structure group for the 12-month period ended September 30, 2022 and above the competitive median of the total expense asset size peer group for the 12-month period ended September 30, 2022. The Board also noted that if funds in a fund complex with a unique at-cost service model were excluded from the total expense asset size peer group, the total expense ratio for the retail class of each fund was below the total expense asset size peer group for 2022. The Board noted that each fund offers multiple classes and that the multiple structures are intended to offer pricing options for the intermediary market. The Board also noted that the total expense ratios of the classes vary primarily due to differences in transfer agent fees.
The Board also considered that, for funds subject to the group fee, FMR agreed to voluntarily waive fees over a specified period of time in amounts designed to account for assets converted from certain funds to certain collective investment trusts.
The Board also considered that each fund's management fee is subject to upward or downward adjustment depending upon whether, and to what extent, each fund's investment performance for the performance period (a rolling 36-month period) exceeds, or is exceeded by, a securities index, thus leading to a performance adjustment for the same period. The Board noted that the performance adjustment provides FMR with a strong economic incentive to seek to achieve superior long-term performance for each fund's shareholders and helps to more closely align the interests of FMR and the shareholders of each fund.
For Fidelity Diversified International Fund, Fidelity Overseas Fund and Fidelity Worldwide Fund, in connection with its consideration of each fund's performance adjustment, the Board noted that the performance of the retail class is used for purposes of determining the performance adjustment. The Board noted that to the extent the performance adjustment was based on the performance of a share class with higher total annual operating expenses, the fund would be subject to a smaller positive and larger negative performance adjustment. The Board considered the appropriateness of the use of the retail class as the basis for the performance adjustment. The Board noted that the retail class is typically the largest class (reflecting the actual investment experience for the plurality of shareholders), employs a standard expense structure, and does not include fund-paid 12b-1 fees, which Fidelity believes makes it a more appropriate measurement of Fidelity's investment skill.
Fees Charged to Other Fidelity Clients. The Board also considered Fidelity fee structures and other information with respect to clients of Fidelity, such as other funds advised or subadvised by Fidelity, pension plan clients, and other institutional clients with similar mandates. The Board noted that a joint ad hoc committee created by it and the boards of other Fidelity funds periodically reviews and compares Fidelity's institutional investment advisory business with its business of providing services to the Fidelity funds and also noted the most recent findings of the committee. The Board noted that the committee's review included a consideration of the differences in services provided, fees charged, and costs incurred, as well as competition in the markets serving the different categories of clients.
Based on its review, the Board concluded that each fund's management fee, including the use of the retail class as the basis for the performance adjustment (for Fidelity Diversified International Fund, Fidelity Overseas Fund and Fidelity Worldwide Fund), is fair and reasonable in light of the services that each fund receives and the other factors considered. Further, based on its review of total expense ratios and fees charged to other Fidelity clients, the Board concluded that the total expense ratio of Fidelity International Capital Appreciation Fund and the total expense ratio of each class of Fidelity Diversified International Fund, Fidelity Overseas Fund, and Fidelity Worldwide Fund were reasonable in light of the services that each fund and its shareholders receive and the other factors considered.
Costs of the Services and Profitability. The Board considered the revenues earned and the expenses incurred by Fidelity in conducting the business of developing, marketing, distributing, managing, administering and servicing each fund and servicing each fund's shareholders. The Board also considered the level of Fidelity's profits in respect of all the Fidelity funds.
On an annual basis, Fidelity presents to the Board information about the profitability of its relationships with each fund. Fidelity calculates profitability information for each fund, as well as aggregate profitability information for groups of Fidelity funds and all Fidelity funds, using a series of detailed revenue and cost allocation methodologies which originate with the books and records of Fidelity on which Fidelity's audited financial statements are based. The Audit Committee of the Board reviews any significant changes from the prior year's methodologies and the full Board approves such changes.
A public accounting firm has been engaged annually by the Board as part of the Board's assessment of Fidelity's profitability analysis. The engagement includes the review and assessment of the methodologies used by Fidelity in determining the revenues and expenses attributable to Fidelity's fund business, and completion of agreed-upon procedures in respect of the mathematical accuracy of certain fund profitability information and its conformity to established allocation methodologies. After considering the reports issued under the engagement and information provided by Fidelity, the Board concluded that while other allocation methods may also be reasonable, Fidelity's profitability methodologies are reasonable in all material respects.
The Board also reviewed Fidelity's non-fund businesses and potential indirect benefits such businesses may have received as a result of their association with Fidelity's fund business (i.e., fall-out benefits) as well as cases where Fidelity's affiliates may benefit from the funds' business. The Board considered areas where potential indirect benefits to the Fidelity funds from their relationships with Fidelity may exist. The Board's consideration of these matters was informed by the findings of a joint ad hoc committee created by it and the boards of other Fidelity funds to evaluate potential fall-out benefits.
The Board considered the costs of the services provided by and the profits realized by Fidelity in connection with the operation of each fund and was satisfied that the profitability was not excessive.
Economies of Scale. The Board considered whether there have been economies of scale in respect of the management of the Fidelity funds, whether the Fidelity funds (including each fund) have appropriately benefited from any such economies of scale, and whether there is potential for realization of any further economies of scale. The Board considered the extent to which each fund will benefit from economies of scale as assets grow through increased services to the fund, through waivers or reimbursements, or through fee or expense ratio reductions. The Board also noted that a committee (the Economies of Scale Committee) created by it and the boards of other Fidelity funds periodically analyzes whether Fidelity attains economies of scale in respect of the management and servicing of the Fidelity funds, whether the Fidelity funds have appropriately benefited from such economies of scale, and whether there is potential for realization of any further economies of scale.
The Board recognized that each fund's management contract incorporates a "group fee" structure, which provides for lower group fee rates as total "group assets" increase, and for higher group fee rates as total "group assets" decrease ("group assets" as defined in the management contracts). FMR calculates the group fee rates based on a tiered asset "breakpoint" schedule that varies based on asset class. The Board considered that the group fee is designed to deliver the benefits of economies of scale to fund shareholders when total Fidelity fund assets increase, even if assets of any particular fund are unchanged or have declined, because some portion of Fidelity's costs are attributable to services provided to all Fidelity funds, and all funds benefit if those costs can be allocated among more assets. The Board further considered that Fidelity agreed to impose a temporary fee waiver in the form of additional breakpoints to the current breakpoint schedule. The Board concluded that, given the group fee structure, fund shareholders will benefit from lower management fees as "group assets" increase at the fund complex level, regardless of whether Fidelity achieves any such economies of scale.
The Board concluded, taking into account the analysis of the Economies of Scale Committee, that economies of scale, if any, are being appropriately shared between fund shareholders and Fidelity.
Additional Information Requested by the Board. In order to develop fully the factual basis for consideration of the Fidelity funds' advisory contracts, the Board requested and received additional information on certain topics, including: (i) fund flow and performance trends, in particular the underperformance of certain funds and strategies, and Fidelity's long-term strategies for certain funds, including any consideration of fund liquidations or mergers; (ii) the operation of performance fees and competitor use of performance fees; (iii) Fidelity's pricing philosophy compared to competitors; (iv) fund profitability methodology and data; (v) evaluation of competitive fund data and peer group classifications and fee and expense comparisons; (vi) the management fee and expense structures for different funds and classes and information about the differences between various fee and expense structures; (vii) group fee breakpoints and related voluntary fee waivers; and (viii) information regarding other accounts managed by Fidelity and the funds' sub-advisory arrangements.
Conclusion. Based on its evaluation of all of the conclusions noted above, and after considering all factors it believed relevant, the Board, including the Independent Trustees, concluded that the advisory and sub-advisory fee arrangements are fair and reasonable in light of all of the surrounding circumstances and that each fund's Advisory Contracts should be renewed through July 31, 2024.
1.754543.123
IBD-ANN-1223
Fidelity® Global Equity Income Fund
Annual Report
October 31, 2023
Contents
To view a fund's proxy voting guidelines and proxy voting record for the 12-month period ended June 30, visit http://www.fidelity.com/proxyvotingresults or visit the Securities and Exchange Commission's (SEC) web site at http://www.sec.gov.
You may also call 1-800-544-8544 to request a free copy of the proxy voting guidelines.
Standard & Poor's, S&P and S&P 500 are registered service marks of The McGraw-Hill Companies, Inc. and have been licensed for use by Fidelity Distributors Corporation.
Other third-party marks appearing herein are the property of their respective owners.
All other marks appearing herein are registered or unregistered trademarks or service marks of FMR LLC or an affiliated company. © 2023 FMR LLC. All rights reserved.
This report and the financial statements contained herein are submitted for the general information of the shareholders of the Fund. This report is not authorized for distribution to prospective investors in the Fund unless preceded or accompanied by an effective prospectus.
A fund files its complete schedule of portfolio holdings with the SEC for the first and third quarters of each fiscal year on Form N-PORT. Forms N-PORT are available on the SEC's web site at http://www.sec.gov. A fund's Forms N-PORT may be reviewed and copied at the SEC's Public Reference Room in Washington, DC. Information regarding the operation of the SEC's Public Reference Room may be obtained by calling 1-800-SEC-0330.
For a complete list of a fund's portfolio holdings, view the most recent holdings listing, semiannual report, or annual report on Fidelity's web site at http://www.fidelity.com, http://www.institutional.fidelity.com, or http://www.401k.com, as applicable.
NOT FDIC INSURED •MAY LOSE VALUE •NO BANK GUARANTEE
Neither the Fund nor Fidelity Distributors Corporation is a bank.
Average annual total return reflects the change in the value of an investment, assuming reinvestment of distributions from dividend income and capital gains (the profits earned upon the sale of securities that have grown in value, if any) and assuming a constant rate of performance each year. The hypothetical investment and the average annual total returns do not reflect the deduction of taxes that a shareholder would pay on fund distributions or the redemption of fund shares. During periods of reimbursement by Fidelity, a fund's total return will be greater than it would be had the reimbursement not occurred. How a fund did yesterday is no guarantee of how it will do tomorrow.
| Average Annual Total Returns |
| | | | |
Periods ended October 31, 2023 | Past 1 year | Past 5 years | Past 10 years |
| Fidelity® Global Equity Income Fund | 5.36% | 8.57% | 7.41% |
| $10,000 Over 10 Years |
| |
Let's say hypothetically that $10,000 was invested in Fidelity® Global Equity Income Fund on October 31, 2013. The chart shows how the value of your investment would have changed, and also shows how the MSCI ACWI (All Country World Index) Index performed over the same period. |
|
|
Market Recap:
Global equities gained 10.91% for the 12 months ending October 31, 2023, according to the MSCI ACWI (All Country World Index) Index, as global economic expansion and a slowing in the pace of inflation in some markets provided a favorable backdrop for risk assets. After returning -18.07% in 2022, the index's upturn has been largely driven by a narrow set of companies in the information technology and communication services sectors, in part due to excitement for generative artificial intelligence applications. The index gained 18.36% year to date through July, including gains in June (+5.83%) and July (+3.68%). The rally for international equities sputtered for the next three months (-9.54%) amid a stalling pattern in disinflationary trends, heightened global recession and geopolitical risks, soaring yields on longer-term U.S. government bonds, and particularly weak economic conditions in the eurozone and China. Even still, the three-month decline left globalnon-U.S. stocks up 7.07% year to date through October. For the full 12 months, nearly all regions advanced, with Europe ex U.K. (+18%) and Japan (+17%) leading, whereas Canada (-0.38%) lagged by the widest margin, while the U.S. middled (+10%). All but three of 11 sectors advanced, with information technology (+29%) and communication services (+27%) leading. Conversely, the real estate sector (-3%) lagged most, followed by health care and utilities (-1% each).
Comments from Portfolio Manager Ramona Persaud:
For the fiscal year, the fund gained 5.36%, versus 10.91% for the benchmark MSCI All Country World Index (Net MA). From a regional standpoint, stock picks in the United States and picks and an overweight in Europe ex the U.K. detracted from the fund's performance versus the benchmark. By sector, security selection was the primary detractor, especially within communication services. Stock selection in financials, primarily within the banks industry, also hurt. Stock picking in information technology, primarily within the semiconductors & semiconductor equipment industry, also hampered the fund's result. Also detracting from our result were stock picks and an overweight in consumer staples. The largest individual relative detractor this period was avoiding Nvidia, a benchmark component that gained roughly 202%. Not owning Meta Platforms, a benchmark component that gained approximately 223%, was the second-largest relative detractor. In contrast, from a regional standpoint, picks in Canada and an underweight in Asia Pacific ex Japan contributed to the fund's performance versus the benchmark. By sector, the biggest contributor to performance versus the benchmark was security selection in industrials, primarily within the capital goods industry. Stock selection in consumer discretionary also boosted relative performance. Also lifting the fund's relative result was an underweight in financials, primarily within the financial services industry. The top individual relative contributor was an overweight in Eli Lilly (+55%). Eli Lilly was one of the fund's biggest holdings. The second-largest relative contributor was an overweight in General Electric (+80%). Notable changes in positioning include higher allocations to Japan and the United Kingdom. By sector, meaningful changes in positioning include decreased exposure to the energy sector.
The views expressed above reflect those of the portfolio manager(s) only through the end of the period as stated on the cover of this report and do not necessarily represent the views of Fidelity or any other person in the Fidelity organization. Any such views are subject to change at any time based upon market or other conditions and Fidelity disclaims any responsibility to update such views. These views may not be relied on as investment advice and, because investment decisions for a Fidelity fund are based on numerous factors, may not be relied on as an indication of trading intent on behalf of any Fidelity fund.
Top Holdings (% of Fund's net assets) |
| |
| Apple, Inc. (United States of America, Technology Hardware, Storage & Peripherals) | 5.4 | |
| Microsoft Corp. (United States of America, Software) | 5.3 | |
| Eli Lilly & Co. (United States of America, Pharmaceuticals) | 2.7 | |
| UnitedHealth Group, Inc. (United States of America, Health Care Providers & Services) | 2.1 | |
| Taiwan Semiconductor Manufacturing Co. Ltd. (Taiwan, Semiconductors & Semiconductor Equipment) | 2.0 | |
| JPMorgan Chase & Co. (United States of America, Banks) | 2.0 | |
| Exxon Mobil Corp. (United States of America, Oil, Gas & Consumable Fuels) | 1.8 | |
| Linde PLC (United States of America, Chemicals) | 1.8 | |
| Accenture PLC Class A (United States of America, IT Services) | 1.7 | |
| Cisco Systems, Inc. (United States of America, Communications Equipment) | 1.5 | |
| | 26.3 | |
| |
| Market Sectors (% of Fund's net assets) |
| |
| Information Technology | 21.5 | |
| Health Care | 13.5 | |
| Financials | 12.1 | |
| Consumer Staples | 11.3 | |
| Industrials | 9.6 | |
| Consumer Discretionary | 9.0 | |
| Communication Services | 5.6 | |
| Energy | 5.2 | |
| Materials | 5.1 | |
| Utilities | 3.9 | |
| Real Estate | 1.1 | |
| |
Asset Allocation (% of Fund's net assets) |
|
|
Geographic Diversification (% of Fund's net assets) |
|
* Includes Short-Term investments and Net Other Assets (Liabilities). Percentages are adjusted for the effect of derivatives, if applicable. |
| |
Showing Percentage of Net Assets
| Common Stocks - 97.9% |
| | | Shares | Value ($) |
| Belgium - 0.7% | | | |
| KBC Group NV | | 13,116 | 720,270 |
| UCB SA | | 3,631 | 265,326 |
TOTAL BELGIUM | | | 985,596 |
| Brazil - 0.9% | | | |
| Equatorial Energia SA | | 213,360 | 1,337,269 |
| Canada - 4.9% | | | |
| Alimentation Couche-Tard, Inc. Class A (multi-vtg.) | | 34,416 | 1,873,491 |
| Canadian Natural Resources Ltd. | | 18,636 | 1,183,404 |
| Constellation Software, Inc. | | 362 | 725,699 |
| Constellation Software, Inc. warrants 8/22/28 (a)(b) | | 362 | 0 |
| Imperial Oil Ltd. | | 18,461 | 1,052,081 |
| Metro, Inc. | | 28,700 | 1,457,817 |
| PrairieSky Royalty Ltd. | | 55,500 | 974,527 |
TOTAL CANADA | | | 7,267,019 |
| China - 1.9% | | | |
| Kweichow Moutai Co. Ltd. (A Shares) | | 1,587 | 365,572 |
| NXP Semiconductors NV | | 12,244 | 2,111,233 |
| SITC International Holdings Co. Ltd. | | 183,884 | 283,256 |
TOTAL CHINA | | | 2,760,061 |
| Denmark - 0.4% | | | |
| DSV A/S | | 4,147 | 618,486 |
| Finland - 1.0% | | | |
| Elisa Corp. (A Shares) | | 30,361 | 1,287,569 |
| Neste OYJ | | 7,706 | 258,554 |
TOTAL FINLAND | | | 1,546,123 |
| France - 4.2% | | | |
| Airbus Group NV | | 10,002 | 1,341,030 |
| Capgemini SA | | 5,752 | 1,016,544 |
| Edenred SA | | 26,053 | 1,384,950 |
| LVMH Moet Hennessy Louis Vuitton SE | | 2,876 | 2,059,016 |
| VINCI SA | | 4,228 | 467,509 |
TOTAL FRANCE | | | 6,269,049 |
| Germany - 2.5% | | | |
| Deutsche Telekom AG | | 51,183 | 1,110,859 |
| Rheinmetall AG | | 5,917 | 1,692,914 |
| Siemens AG | | 6,233 | 827,112 |
TOTAL GERMANY | | | 3,630,885 |
| Hong Kong - 0.8% | | | |
| AIA Group Ltd. | | 116,272 | 1,009,684 |
| HKBN Ltd. | | 448,630 | 155,415 |
TOTAL HONG KONG | | | 1,165,099 |
| Hungary - 0.2% | | | |
| Richter Gedeon PLC | | 15,354 | 360,009 |
| India - 0.3% | | | |
| HDFC Bank Ltd. sponsored ADR | | 5,839 | 330,195 |
| Redington (India) Ltd. | | 71,339 | 122,186 |
TOTAL INDIA | | | 452,381 |
| Japan - 6.5% | | | |
| Capcom Co. Ltd. | | 19,124 | 615,589 |
| Daiichikosho Co. Ltd. | | 51,708 | 764,320 |
| FUJIFILM Holdings Corp. | | 7,853 | 429,542 |
| Hitachi Ltd. | | 13,948 | 884,117 |
| Hoya Corp. | | 11,101 | 1,068,678 |
| Inaba Denki Sangyo Co. Ltd. | | 35,690 | 744,240 |
| Minebea Mitsumi, Inc. | | 31,666 | 496,501 |
| Renesas Electronics Corp. (a) | | 59,410 | 780,387 |
| Roland Corp. | | 17,640 | 510,042 |
| Shin-Etsu Chemical Co. Ltd. | | 35,163 | 1,051,493 |
| Sony Group Corp. | | 18,071 | 1,502,403 |
| Toyota Motor Corp. | | 46,723 | 817,360 |
TOTAL JAPAN | | | 9,664,672 |
| Kenya - 0.2% | | | |
| Safaricom Ltd. | | 3,575,246 | 295,661 |
| Korea (South) - 1.1% | | | |
| Samsung Electronics Co. Ltd. | | 33,056 | 1,642,919 |
| Luxembourg - 0.1% | | | |
| L'Occitane Ltd. | | 75,000 | 192,767 |
| Sweden - 0.3% | | | |
| HEXPOL AB (B Shares) | | 48,826 | 431,727 |
| Switzerland - 0.5% | | | |
| Sika AG | | 3,049 | 727,014 |
| Taiwan - 2.0% | | | |
| Taiwan Semiconductor Manufacturing Co. Ltd. | | 179,877 | 2,935,582 |
| United Kingdom - 6.9% | | | |
| AstraZeneca PLC sponsored ADR | | 32,062 | 2,027,280 |
| B&M European Value Retail SA | | 159,188 | 1,023,149 |
| BAE Systems PLC | | 106,785 | 1,435,872 |
| Compass Group PLC | | 40,448 | 1,019,750 |
| Diageo PLC | | 17,597 | 665,449 |
| JD Sports Fashion PLC | | 365,534 | 566,468 |
| London Stock Exchange Group PLC | | 6,500 | 655,818 |
| RELX PLC (London Stock Exchange) | | 27,096 | 946,401 |
| RS GROUP PLC | | 67,972 | 559,479 |
| Starling Bank Ltd. Series D (a)(b)(c) | | 62,800 | 224,411 |
| Unilever PLC | | 13,959 | 661,108 |
| WH Smith PLC | | 25,717 | 362,590 |
TOTAL UNITED KINGDOM | | | 10,147,775 |
| United States of America - 62.2% | | | |
| Accenture PLC Class A | | 8,462 | 2,513,976 |
| Albertsons Companies, Inc. | | 15,339 | 332,856 |
| Amdocs Ltd. | | 16,835 | 1,349,494 |
| Ameren Corp. | | 10,854 | 821,756 |
| American Tower Corp. | | 3,623 | 645,582 |
| Apple, Inc. | | 47,143 | 8,050,612 |
| AT&T, Inc. | | 29,386 | 452,544 |
| Ball Corp. | | 6,100 | 293,715 |
| Bank of America Corp. | | 68,823 | 1,812,798 |
| BJ's Wholesale Club Holdings, Inc. (a) | | 13,021 | 886,991 |
| Bristol-Myers Squibb Co. | | 16,707 | 860,912 |
| Capital One Financial Corp. | | 7,894 | 799,583 |
| Chubb Ltd. | | 5,037 | 1,081,041 |
| Cisco Systems, Inc. | | 41,329 | 2,154,481 |
| Comcast Corp. Class A | | 29,739 | 1,227,923 |
| Costco Wholesale Corp. | | 1,926 | 1,063,999 |
| Crane Co. | | 3,993 | 388,639 |
| Crane Nxt Co. | | 3,993 | 207,636 |
| Crown Holdings, Inc. | | 10,212 | 823,087 |
| Danaher Corp. | | 8,937 | 1,716,083 |
| Dollar Tree, Inc. (a) | | 11,285 | 1,253,651 |
| Eli Lilly & Co. | | 7,122 | 3,945,089 |
| Estee Lauder Companies, Inc. Class A | | 2,745 | 353,748 |
| Experian PLC | | 33,484 | 1,013,790 |
| Exxon Mobil Corp. | | 25,232 | 2,670,807 |
| Freeport-McMoRan, Inc. | | 33,497 | 1,131,529 |
| General Electric Co. | | 12,656 | 1,374,821 |
| Gilead Sciences, Inc. | | 15,904 | 1,249,100 |
| H&R Block, Inc. | | 21,814 | 895,465 |
| Hartford Financial Services Group, Inc. | | 19,373 | 1,422,947 |
| Hess Corp. | | 6,390 | 922,716 |
| Johnson Controls International PLC | | 9,742 | 477,553 |
| JPMorgan Chase & Co. | | 20,988 | 2,918,591 |
| Kenvue, Inc. | | 11,200 | 208,320 |
| Keurig Dr. Pepper, Inc. | | 26,291 | 797,406 |
| Lamar Advertising Co. Class A | | 12,117 | 996,866 |
| Linde PLC | | 6,898 | 2,636,140 |
| Lowe's Companies, Inc. | | 4,211 | 802,490 |
| M&T Bank Corp. | | 7,297 | 822,737 |
| McDonald's Corp. | | 4,936 | 1,294,071 |
| Merck & Co., Inc. | | 14,939 | 1,534,235 |
| Microsoft Corp. | | 22,981 | 7,770,106 |
| Mondelez International, Inc. | | 10,277 | 680,440 |
| MSCI, Inc. | | 927 | 437,127 |
| Nestle SA (Reg. S) | | 9,841 | 1,061,241 |
| NextEra Energy, Inc. | | 15,658 | 912,861 |
| PG&E Corp. (a) | | 17,858 | 291,085 |
| Philip Morris International, Inc. | | 8,301 | 740,117 |
| Phillips 66 Co. | | 3,035 | 346,202 |
| PNC Financial Services Group, Inc. | | 12,351 | 1,413,819 |
| Procter & Gamble Co. | | 10,864 | 1,629,926 |
| Roche Holding AG (participation certificate) | | 8,339 | 2,149,041 |
| Sanofi SA | | 17,432 | 1,582,934 |
| Southern Co. | | 13,318 | 896,301 |
| T-Mobile U.S., Inc. | | 13,498 | 1,941,822 |
| Tapestry, Inc. | | 9,542 | 262,978 |
| Target Corp. | | 3,076 | 340,790 |
| The Coca-Cola Co. | | 20,060 | 1,133,189 |
| The Travelers Companies, Inc. | | 8,020 | 1,342,869 |
| TJX Companies, Inc. | | 22,906 | 2,017,331 |
| United Parcel Service, Inc. Class B | | 4,501 | 635,766 |
| UnitedHealth Group, Inc. | | 5,907 | 3,163,553 |
| Valero Energy Corp. | | 2,433 | 308,991 |
| Veralto Corp. | | 2,979 | 205,551 |
| Verizon Communications, Inc. | | 15,659 | 550,101 |
| Vistra Corp. | | 31,150 | 1,019,228 |
| Walmart, Inc. | | 6,400 | 1,045,824 |
| WEC Energy Group, Inc. | | 5,550 | 451,715 |
| Wells Fargo & Co. | | 36,754 | 1,461,707 |
TOTAL UNITED STATES OF AMERICA | | | 91,998,395 |
| Zambia - 0.3% | | | |
| First Quantum Minerals Ltd. | | 38,907 | 450,864 |
| TOTAL COMMON STOCKS (Cost $124,062,017) | | | 144,879,353 |
| | | | |
| Money Market Funds - 2.0% |
| | | Shares | Value ($) |
Fidelity Cash Central Fund 5.40% (d) (Cost $2,909,895) | | 2,909,314 | 2,909,895 |
| | | | |
| TOTAL INVESTMENT IN SECURITIES - 99.9% (Cost $126,971,912) | 147,789,248 |
NET OTHER ASSETS (LIABILITIES) - 0.1% | 151,176 |
| NET ASSETS - 100.0% | 147,940,424 |
| | |
Legend
| (c) | Restricted securities (including private placements) - Investment in securities not registered under the Securities Act of 1933 (excluding 144A issues). At the end of the period, the value of restricted securities (excluding 144A issues) amounted to $224,411 or 0.2% of net assets. |
| (d) | Affiliated fund that is generally available only to investment companies and other accounts managed by Fidelity Investments. The rate quoted is the annualized seven-day yield of the fund at period end. A complete unaudited listing of the fund's holdings as of its most recent quarter end is available upon request. In addition, each Fidelity Central Fund's financial statements, which are not covered by the Fund's Report of Independent Registered Public Accounting Firm, are available on the SEC's website or upon request. |
| Additional information on each restricted holding is as follows: |
| Security | Acquisition Date | Acquisition Cost ($) |
| Starling Bank Ltd. Series D | 6/18/21 - 4/05/22 | 130,682 |
| | | |
Affiliated Central Funds
Fiscal year to date information regarding the Fund's investments in Fidelity Central Funds, including the ownership percentage, is presented below.
| Affiliate | Value, beginning of period ($) | Purchases ($) | Sales Proceeds ($) | Dividend Income ($) | Realized Gain (loss) ($) | Change in Unrealized appreciation (depreciation) ($) | Value, end of period ($) | % ownership, end of period |
| Fidelity Cash Central Fund 5.40% | 4,132,184 | 48,555,881 | 49,778,170 | 260,918 | - | - | 2,909,895 | 0.0% |
| Fidelity Securities Lending Cash Central Fund 5.40% | - | 4,330,885 | 4,330,885 | 5,040 | - | - | - | 0.0% |
| Total | 4,132,184 | 52,886,766 | 54,109,055 | 265,958 | - | - | 2,909,895 | |
| | | | | | | | | |
Amounts in the dividend income column in the above table include any capital gain distributions from underlying funds, which are presented in the corresponding line item in the Statement of Operations, if applicable.
Amounts in the dividend income column for Fidelity Securities Lending Cash Central Fund represents the income earned on investing cash collateral, less rebates paid to borrowers and any lending agent fees associated with the loan, plus any premium payments received for lending certain types of securities.
Amounts included in the purchases and sales proceeds columns may include in-kind transactions, if applicable.
Investment Valuation
The following is a summary of the inputs used, as of October 31, 2023, involving the Fund's assets and liabilities carried at fair value. The inputs or methodology used for valuing securities may not be an indication of the risk associated with investing in those securities. For more information on valuation inputs, and their aggregation into the levels used below, please refer to the Investment Valuation section in the accompanying Notes to Financial Statements.
| Valuation Inputs at Reporting Date: |
| Description | Total ($) | Level 1 ($) | Level 2 ($) | Level 3 ($) |
Investments in Securities: | | | | |
|
| Equities: | | | | |
Communication Services | 8,401,803 | 5,755,620 | 2,646,183 | - |
Consumer Discretionary | 13,133,113 | 7,224,542 | 5,908,571 | - |
Consumer Staples | 16,744,702 | 13,798,565 | 2,946,137 | - |
Energy | 7,717,282 | 7,717,282 | - | - |
Financials | 17,838,547 | 15,948,634 | 1,665,502 | 224,411 |
Health Care | 19,922,240 | 15,121,587 | 4,800,653 | - |
Industrials | 14,393,037 | 6,966,999 | 7,426,038 | - |
Information Technology | 31,810,397 | 24,883,237 | 6,927,160 | - |
Materials | 7,545,569 | 6,494,076 | 1,051,493 | - |
Real Estate | 1,642,448 | 1,642,448 | - | - |
Utilities | 5,730,215 | 5,730,215 | - | - |
|
| Money Market Funds | 2,909,895 | 2,909,895 | - | - |
| Total Investments in Securities: | 147,789,248 | 114,193,100 | 33,371,737 | 224,411 |
| Statement of Assets and Liabilities |
| | | | October 31, 2023 |
| | | | | |
| Assets | | | | |
| Investment in securities, at value - See accompanying schedule: | | | | |
Unaffiliated issuers (cost $124,062,017) | $ | 144,879,353 | | |
Fidelity Central Funds (cost $2,909,895) | | 2,909,895 | | |
| | | | | |
| | | | | |
| Total Investment in Securities (cost $126,971,912) | | | $ | 147,789,248 |
| Foreign currency held at value (cost $14,239) | | | | 14,010 |
| Receivable for fund shares sold | | | | 42,579 |
| Dividends receivable | | | | 175,667 |
| Reclaims receivable | | | | 160,463 |
| Distributions receivable from Fidelity Central Funds | | | | 13,341 |
| Prepaid expenses | | | | 226 |
| Other receivables | | | | 435 |
Total assets | | | | 148,195,969 |
| Liabilities | | | | |
| Payable for fund shares redeemed | $ | 78,931 | | |
| Accrued management fee | | 84,474 | | |
| Transfer agent fee payable | | 23,263 | | |
| Other affiliated payables | | 6,250 | | |
| Deferred taxes | | 12,800 | | |
| Audit fee payable | | 45,460 | | |
| Other payables and accrued expenses | | 4,367 | | |
| Total Liabilities | | | | 255,545 |
| Net Assets | | | $ | 147,940,424 |
| Net Assets consist of: | | | | |
| Paid in capital | | | $ | 137,745,372 |
| Total accumulated earnings (loss) | | | | 10,195,052 |
| Net Assets | | | $ | 147,940,424 |
Net Asset Value, offering price and redemption price per share ($147,940,424 ÷ 9,135,929 shares) | | | $ | 16.19 |
| Statement of Operations |
| | | | Year ended October 31, 2023 |
| Investment Income | | | | |
| Dividends | | | $ | 3,642,658 |
| Income from Fidelity Central Funds (including $5,040 from security lending) | | | | 265,958 |
| Income before foreign taxes withheld | | | $ | 3,908,616 |
| Less foreign taxes withheld | | | | (194,460) |
| Total Income | | | | 3,714,156 |
| Expenses | | | | |
| Management fee | $ | 1,076,937 | | |
| Transfer agent fees | | 294,987 | | |
| Accounting fees | | 79,477 | | |
| Custodian fees and expenses | | 17,697 | | |
| Independent trustees' fees and expenses | | 913 | | |
| Registration fees | | 36,894 | | |
| Audit | | 90,605 | | |
| Legal | | 1,716 | | |
| Miscellaneous | | 723 | | |
| Total expenses before reductions | | 1,599,949 | | |
| Expense reductions | | (9,733) | | |
| Total expenses after reductions | | | | 1,590,216 |
| Net Investment income (loss) | | | | 2,123,940 |
| Realized and Unrealized Gain (Loss) | | | | |
| Net realized gain (loss) on: | | | | |
| Investment Securities: | | | | |
| Unaffiliated issuers (net of foreign taxes of $11,504) | | (461,167) | | |
| Foreign currency transactions | | (41,478) | | |
| Total net realized gain (loss) | | | | (502,645) |
| Change in net unrealized appreciation (depreciation) on: | | | | |
| Investment Securities: | | | | |
| Unaffiliated issuers(net of decrease in deferred foreign taxes of $18,979) | | 6,182,310 | | |
| Assets and liabilities in foreign currencies | | 6,917 | | |
| Total change in net unrealized appreciation (depreciation) | | | | 6,189,227 |
| Net gain (loss) | | | | 5,686,582 |
| Net increase (decrease) in net assets resulting from operations | | | $ | 7,810,522 |
| Statement of Changes in Net Assets |
| |
| | Year ended October 31, 2023 | | Year ended October 31, 2022 |
| Increase (Decrease) in Net Assets | | | | |
| Operations | | | | |
| Net investment income (loss) | $ | 2,123,940 | $ | 2,066,441 |
| Net realized gain (loss) | | (502,645) | | (10,168,014) |
| Change in net unrealized appreciation (depreciation) | | 6,189,227 | | (14,280,757) |
| Net increase (decrease) in net assets resulting from operations | | 7,810,522 | | (22,382,330) |
| Distributions to shareholders | | (2,201,013) | | (11,336,009) |
| | | | | |
| Share transactions | | | | |
| Proceeds from sales of shares | | 64,120,579 | | 189,149,366 |
| Reinvestment of distributions | | 1,975,864 | | 10,521,484 |
| Cost of shares redeemed | | (63,120,560) | | (119,515,550) |
| | | | | |
Net increase (decrease) in net assets resulting from share transactions | | 2,975,883 | | 80,155,300 |
| Total increase (decrease) in net assets | | 8,585,392 | | 46,436,961 |
| | | | | |
| Net Assets | | | | |
| Beginning of period | | 139,355,032 | | 92,918,071 |
| End of period | $ | 147,940,424 | $ | 139,355,032 |
| | | | | |
| Other Information | | | | |
| Shares | | | | |
| Sold | | 3,849,023 | | 10,942,111 |
| Issued in reinvestment of distributions | | 117,757 | | 597,381 |
| Redeemed | | (3,775,132) | | (7,288,853) |
| Net increase (decrease) | | 191,648 | | 4,250,639 |
| | | | | |
Financial Highlights
| Fidelity® Global Equity Income Fund |
| |
| Years ended October 31, | | 2023 | | 2022 | | 2021 | | 2020 | | 2019 |
Selected Per-Share Data | | | | | | | | | | |
| Net asset value, beginning of period | $ | 15.58 | $ | 19.80 | $ | 15.12 | $ | 14.64 | $ | 13.53 |
| Income from Investment Operations | | | | | | | | | | |
Net investment income (loss) A,B | | .22 | | .20 | | .15 | | .16 | | .23 |
| Net realized and unrealized gain (loss) | | .62 | | (2.21) | | 5.07 | | .48 | | 1.63 |
| Total from investment operations | | .84 | | (2.01) | | 5.22 | | .64 | | 1.86 |
| Distributions from net investment income | | (.23) | | (.17) | | (.16) | | (.15) | | (.24) |
| Distributions from net realized gain | | - | | (2.04) | | (.38) | | (.01) | | (.51) |
| Total distributions | | (.23) | | (2.21) | | (.54) | | (.16) | | (.75) |
| Net asset value, end of period | $ | 16.19 | $ | 15.58 | $ | 19.80 | $ | 15.12 | $ | 14.64 |
Total Return C | | 5.36% | | (11.45)% | | 35.09% | | 4.44% | | 14.60% |
Ratios to Average Net Assets B,D,E | | | | | | | | | | |
| Expenses before reductions | | 1.00% | | .98% | | 1.02% | | 1.09% | | 1.09% |
| Expenses net of fee waivers, if any | | 1.00% | | .98% | | 1.02% | | 1.09% | | 1.09% |
| Expenses net of all reductions | | 1.00% | | .98% | | 1.02% | | 1.09% | | 1.08% |
| Net investment income (loss) | | 1.33% | | 1.22% | | .84% | | 1.08% | | 1.72% |
| Supplemental Data | | | | | | | | | | |
| Net assets, end of period (000 omitted) | $ | 147,940 | $ | 139,355 | $ | 92,918 | $ | 66,715 | $ | 67,764 |
Portfolio turnover rate F | | 30% | | 61% | | 43% | | 48% | | 20% G |
ACalculated based on average shares outstanding during the period.
BNet investment income (loss) is affected by the timing of the declaration of dividends by any underlying mutual funds or exchange-traded funds (ETFs). Net investment income (loss) of any mutual funds or ETFs is not included in the Fund's net investment income (loss) ratio.
CTotal returns would have been lower if certain expenses had not been reduced during the applicable periods shown.
DFees and expenses of any underlying mutual funds or exchange-traded funds (ETFs) are not included in the Fund's expense ratio. The Fund indirectly bears its proportionate share of these expenses. For additional expense information related to investments in Fidelity Central Funds, please refer to the "Investments in Fidelity Central Funds" note found in the Notes to Financial Statements section of the most recent Annual or Semi-Annual report.
EExpense ratios reflect operating expenses of the class. Expenses before reductions do not reflect amounts reimbursed, waived, or reduced through arrangements with the investment adviser, brokerage services, or other offset arrangements, if applicable, and do not represent the amount paid by the class during periods when reimbursements, waivers or reductions occur.
FAmount does not include the portfolio activity of any underlying mutual funds or exchange-traded funds (ETFs).
GPortfolio turnover rate excludes securities received or delivered in-kind.
For the period ended October 31, 2023
1. Organization.
Fidelity Global Equity Income Fund (the Fund) is a fund of Fidelity Investment Trust (the Trust) and is authorized to issue an unlimited number of shares. Share transactions on the Statement of Changes in Net Assets may contain exchanges between affiliated funds. The Trust is registered under the Investment Company Act of 1940, as amended (the 1940 Act), as an open-end management investment company organized as a Massachusetts business trust.
2. Investments in Fidelity Central Funds.
Funds may invest in Fidelity Central Funds, which are open-end investment companies generally available only to other investment companies and accounts managed by the investment adviser and its affiliates. The Schedule of Investments lists any Fidelity Central Funds held as an investment as of period end, but does not include the underlying holdings of each Fidelity Central Fund. An investing fund indirectly bears its proportionate share of the expenses of the underlying Fidelity Central Funds.
Based on its investment objective, each Fidelity Central Fund may invest or participate in various investment vehicles or strategies that are similar to those of the investing fund. These strategies are consistent with the investment objectives of the investing fund and may involve certain economic risks which may cause a decline in value of each of the Fidelity Central Funds and thus a decline in the value of the investing fund.
| Fidelity Central Fund | Investment Manager | Investment Objective | Investment Practices | Expense RatioA |
| Fidelity Money Market Central Funds | Fidelity Management & Research Company LLC (FMR) | Each fund seeks to obtain a high level of current income consistent with the preservation of capital and liquidity. | Short-term Investments | Less than .005% |
A Expenses expressed as a percentage of average net assets and are as of each underlying Central Fund's most recent annual or semi-annual shareholder report.
A complete unaudited list of holdings for each Fidelity Central Fund is available upon request or at the Securities and Exchange Commission website at www.sec.gov. In addition, the financial statements of the Fidelity Central Funds which contain the significant accounting policies (including investment valuation policies) of those funds, and are not covered by the Report of Independent Registered Public Accounting Firm, are available on the Securities and Exchange Commission website or upon request.
3. Significant Accounting Policies.
The Fund is an investment company and applies the accounting and reporting guidance of the Financial Accounting Standards Board (FASB) Accounting Standards Codification Topic 946 Financial Services - Investment Companies. The financial statements have been prepared in conformity with accounting principles generally accepted in the United States of America (GAAP), which require management to make certain estimates and assumptions at the date of the financial statements. Actual results could differ from those estimates. Subsequent events, if any, through the date that the financial statements were issued have been evaluated in the preparation of the financial statements. The Fund's Schedule of Investments lists any underlying mutual funds or exchange-traded funds (ETFs) but does not include the underlying holdings of these funds. The following summarizes the significant accounting policies of the Fund:
Investment Valuation. Investments are valued as of 4:00 p.m. Eastern time on the last calendar day of the period. The Board of Trustees (the Board) has designated the Fund's investment adviser as the valuation designee responsible for the fair valuation function and performing fair value determinations as needed. The investment adviser has established a Fair Value Committee (the Committee) to carry out the day-to-day fair valuation responsibilities and has adopted policies and procedures to govern the fair valuation process and the activities of the Committee. In accordance with these fair valuation policies and procedures, which have been approved by the Board, the Fund attempts to obtain prices from one or more third party pricing services or brokers to value its investments. When current market prices, quotations or currency exchange rates are not readily available or reliable, investments will be fair valued in good faith by the Committee, in accordance with the policies and procedures. Factors used in determining fair value vary by investment type and may include market or investment specific events, transaction data, estimated cash flows, and market observations of comparable investments. The frequency that the fair valuation procedures are used cannot be predicted and they may be utilized to a significant extent. The Committee manages the Fund's fair valuation practices and maintains the fair valuation policies and procedures. The Fund's investment adviser reports to the Board information regarding the fair valuation process and related material matters.
The Fund categorizes the inputs to valuation techniques used to value its investments into a disclosure hierarchy consisting of three levels as shown below:
Level 1 - unadjusted quoted prices in active markets for identical investments
Level 2 - other significant observable inputs (including quoted prices for similar investments, interest rates, prepayment speeds, etc.)
Level 3 - unobservable inputs (including the Fund's own assumptions based on the best information available)
Valuation techniques used to value the Fund's investments by major category are as follows:
Equity securities, including restricted securities, for which market quotations are readily available, are valued at the last reported sale price or official closing price as reported by a third party pricing service on the primary market or exchange on which they are traded and are categorized as Level 1 in the hierarchy. In the event there were no sales during the day or closing prices are not available, securities are valued at the last quoted bid price or may be valued using the last available price and are generally categorized as Level 2 in the hierarchy. For foreign equity securities, when market or security specific events arise, comparisons to the valuation of American Depositary Receipts (ADRs), futures contracts, ETFs and certain indexes as well as quoted prices for similar securities may be used and would be categorized as Level 2 in the hierarchy. For equity securities, including restricted securities, where observable inputs are limited, assumptions about market activity and risk are used and these securities may be categorized as Level 3 in the hierarchy.
Investments in open-end mutual funds ,including the Fidelity Central Funds, are valued at their closing net asset value (NAV) each business day and are categorized as Level 1 in the hierarchy.
Changes in valuation techniques may result in transfers in or out of an assigned level within the disclosure hierarchy. The aggregate value of investments by input level as of October 31, 2023 is included at the end of the Fund's Schedule of Investments.
Foreign Currency. Certain Funds may use foreign currency contracts to facilitate transactions in foreign-denominated securities. Gains and losses from these transactions may arise from changes in the value of the foreign currency or if the counterparties do not perform under the contracts' terms.
Foreign-denominated assets, including investment securities, and liabilities are translated into U.S. dollars at the exchange rates at period end. Purchases and sales of investment securities, income and dividends received, and expenses denominated in foreign currencies are translated into U.S. dollars at the exchange rate in effect on the transaction date.
The effects of exchange rate fluctuations on investments are included with the net realized and unrealized gain (loss) on investment securities. Other foreign currency transactions resulting in realized and unrealized gain (loss) are disclosed separately.
Investment Transactions and Income. For financial reporting purposes, the Fund's investment holdings and NAV include trades executed through the end of the last business day of the period. The NAV per share for processing shareholder transactions is calculated as of the close of business of the New York Stock Exchange (NYSE), normally 4:00 p.m. Eastern time and includes trades executed through the end of the prior business day. Gains and losses on securities sold are determined on the basis of identified cost and include proceeds received from litigation. Commissions paid to certain brokers with whom the investment adviser, or its affiliates, places trades on behalf of a fund include an amount in addition to trade execution, which may be rebated back to a fund. Any such rebates are included in net realized gain (loss) on investments in the Statement of Operations. Dividend income is recorded on the ex-dividend date, except for certain dividends from foreign securities where the ex-dividend date may have passed, which are recorded as soon as the Fund is informed of the ex-dividend date. Non-cash dividends included in dividend income, if any, are recorded at the fair market value of the securities received. Income and capital gain distributions from Fidelity Central Funds, if any, are recorded on the ex-dividend date. Certain distributions received by the Fund represent a return of capital or capital gain. The Fund determines the components of these distributions subsequent to the ex-dividend date, based upon receipt of tax filings or other correspondence relating to the underlying investment. These distributions are recorded as a reduction of cost of investments and/or as a realized gain. Investment income is recorded net of foreign taxes withheld where recovery of such taxes is uncertain. Funds may file withholding tax reclaims in certain jurisdictions to recover a portion of amounts previously withheld. Any withholding tax reclaims income is included in the Statement of Operations in foreign taxes withheld. Any receivables for withholding tax reclaims are included in the Statement of Assets and Liabilities in reclaims receivable.
Expenses. Expenses directly attributable to a fund are charged to that fund. Expenses attributable to more than one fund are allocated among the respective funds on the basis of relative net assets or other appropriate methods. Expenses included in the accompanying financial statements reflect the expenses of that fund and do not include any expenses associated with any underlying mutual funds or exchange-traded funds. Although not included in a fund's expenses, a fund indirectly bears its proportionate share of these expenses through the net asset value of each underlying mutual fund or exchange-traded fund. Expense estimates are accrued in the period to which they relate and adjustments are made when actual amounts are known.
Income Tax Information and Distributions to Shareholders. Each year, the Fund intends to qualify as a regulated investment company under Subchapter M of the Internal Revenue Code, including distributing substantially all of its taxable income and realized gains. As a result, no provision for U.S. Federal income taxes is required. As of October 31, 2023, the Fund did not have any unrecognized tax benefits in the financial statements; nor is the Fund aware of any tax positions for which it is reasonably possible that the total amounts of unrecognized tax benefits will significantly change in the next twelve months. The Fund files a U.S. federal tax return, in addition to state and local tax returns as required. The Fund's federal income tax returns are subject to examination by the Internal Revenue Service (IRS) for a period of three fiscal years after they are filed. State and local tax returns may be subject to examination for an additional fiscal year depending on the jurisdiction. Foreign taxes are provided for based on the Fund's understanding of the tax rules and rates that exist in the foreign markets in which it invests. The Fund is subject to a tax imposed on capital gains by certain countries in which it invests. An estimated deferred tax liability for net unrealized appreciation on the applicable securities is included in Deferred taxes on the Statement of Assets & Liabilities.
Distributions are declared and recorded on the ex-dividend date. Income and capital gain distributions are determined in accordance with income tax regulations, which may differ from GAAP.
Capital accounts within the financial statements are adjusted for permanent book-tax differences. These adjustments have no impact on net assets or the results of operations. Capital accounts are not adjusted for temporary book-tax differences which will reverse in a subsequent period.
Book-tax differences are primarily due to foreign currency transactions, passive foreign investment companies (PFIC), certain foreign taxes, capital loss carryforwards and losses deferred due to wash sales.
As of period end, the cost and unrealized appreciation (depreciation) in securities, and derivatives if applicable, for federal income tax purposes were as follows:
| Gross unrealized appreciation | $31,824,458 |
| Gross unrealized depreciation | (11,575,318) |
| Net unrealized appreciation (depreciation) | $20,249,140 |
| Tax Cost | $127,540,108 |
The tax-based components of distributable earnings as of period end were as follows:
| Undistributed ordinary income | $119,984 |
| Capital loss carryforward | $(10,157,487) |
| Net unrealized appreciation (depreciation) on securities and other investments | $20,245,354 |
Capital loss carryforwards are only available to offset future capital gains of the Fund to the extent provided by regulations and may be limited. The capital loss carryforward information presented below, including any applicable limitation, is estimated as of fiscal period end and is subject to adjustment.
Short-term | $(9,721,612) |
Long-term | (435,875) |
| Total capital loss carryforward | $(10,157,487) |
The tax character of distributions paid was as follows:
| | October 31, 2023 | October 31, 2022 |
| Ordinary Income | $2,201,013 | $1,785,513 |
| Long-term Capital Gains | - | 9,550,496 |
| Total | $2,201,013 | $11,336,009 |
Restricted Securities (including Private Placements). Funds may invest in securities that are subject to legal or contractual restrictions on resale. These securities generally may be resold in transactions exempt from registration or to the public if the securities are registered. Disposal of these securities may involve time-consuming negotiations and expense, and prompt sale at an acceptable price may be difficult. Information regarding restricted securities held at period end is included at the end of the Schedule of Investments, if applicable.
4. Purchases and Sales of Investments.
Purchases and sales of securities, other than short-term securities and in-kind transactions, as applicable, are noted in the table below.
| | Purchases ($) | Sales ($) |
| Fidelity Global Equity Income Fund | 50,795,208 | 46,379,309 |
5. Fees and Other Transactions with Affiliates.
Management Fee. Fidelity Management & Research Company LLC (the investment adviser) and its affiliates provide the Fund with investment management related services for which the Fund pays a monthly management fee. The management fee is the sum of an individual fund fee rate that is based on an annual rate of .45% of the Fund's average net assets and an annualized group fee rate that averaged .23% during the period. The group fee rate is based upon the monthly average net assets of a group of registered investment companies with which the investment adviser has management contracts. The group fee rate decreases as assets under management increase and increases as assets under management decrease. For the reporting period, the total annual management fee rate was .68% of the Fund's average net assets.
Transfer Agent Fees. Fidelity Investments Institutional Operations Company LLC (FIIOC), an affiliate of the investment adviser, is the Fund's transfer, dividend disbursing and shareholder servicing agent. FIIOC receives account fees and asset-based fees that vary according to account size and type of account. FIIOC pays for typesetting, printing and mailing of shareholder reports, except proxy statements. For the period, the transfer agent fees were equivalent to an annual rate of .18% of average net assets.
During November 2023, the Board approved a change in the transfer agent fees effective December 1, 2023 to a fixed annual rate of 0.1729% of average net assets.
Accounting Fees. Fidelity Service Company, Inc. (FSC), an affiliate of the investment adviser, maintains the Fund's accounting records. The accounting fee is based on the level of average net assets for each month. For the period, the fees were equivalent to the following annual rates:
| | % of Average Net Assets |
| Fidelity Global Equity Income Fund | .05 |
During November 2023, the Board approved a change in the accounting fees effective December 1, 2023 to a fixed annual rate of average net assets as follows:
| | % of Average Net Assets |
| Fidelity Global Equity Income Fund | 0.0498% |
Brokerage Commissions. A portion of portfolio transactions were placed with brokerage firms which are affiliates of the investment adviser. Brokerage commissions are included in net realized gain (loss) and change in net unrealized appreciation (depreciation) in the Statement of Operations. The commissions paid to these affiliated firms were as follows:
| | Amount |
| Fidelity Global Equity Income Fund | $491 |
Interfund Trades. Funds may purchase from or sell securities to other Fidelity Funds under procedures adopted by the Board. The procedures have been designed to ensure these interfund trades are executed in accordance with Rule 17a-7 of the 1940 Act. Any interfund trades are included within the respective purchases and sales amounts shown in the Purchases and Sales of Investments note. Interfund trades during the period are noted in the table below.
| | Purchases ($) | Sales ($) | Realized Gain (Loss) ($) |
| Fidelity Global Equity Income Fund | 4,790,567 | 7,245,026 | 93,659 |
6. Committed Line of Credit.
Certain Funds participate with other funds managed by the investment adviser or an affiliate in a $4.25 billion credit facility (the "line of credit") to be utilized for temporary or emergency purposes to fund shareholder redemptions or for other short-term liquidity purposes. The participating funds have agreed to pay commitment fees on their pro-rata portion of the line of credit, which are reflected in Miscellaneous expenses on the Statement of Operations, and are listed below. During the period, there were no borrowings on this line of credit.
| | Amount |
| Fidelity Global Equity Income Fund | $288 |
7. Security Lending.
Funds lend portfolio securities from time to time in order to earn additional income. Lending agents are used, including National Financial Services (NFS), an affiliate of the investment adviser. Pursuant to a securities lending agreement, NFS will receive a fee, which is capped at 9.9% of a fund's daily lending revenue, for its services as lending agent. A fund may lend securities to certain qualified borrowers, including NFS. On the settlement date of the loan, a fund receives collateral (in the form of U.S. Treasury obligations, letters of credit and/or cash) against the loaned securities and maintains collateral in an amount not less than 100% of the market value of the loaned securities during the period of the loan. The market value of the loaned securities is determined at the close of business of a fund and any additional required collateral is delivered to a fund on the next business day. A fund or borrower may terminate the loan at any time, and if the borrower defaults on its obligation to return the securities loaned because of insolvency or other reasons, a fund may apply collateral received from the borrower against the obligation. A fund may experience delays and costs in recovering the securities loaned. Any cash collateral received is invested in the Fidelity Securities Lending Cash Central Fund. Any loaned securities are identified as such in the Schedule of Investments, and the value of loaned securities and cash collateral at period end, as applicable, are presented in the Statement of Assets and Liabilities. Security lending income represents the income earned on investing cash collateral, less rebates paid to borrowers and any lending agent fees associated with the loan, plus any premium payments received for lending certain types of securities. Security lending income is presented in the Statement of Operations as a component of income from Fidelity Central Funds. Affiliated security lending activity, if any, was as follows:
| | Total Security Lending Fees Paid to NFS | Security Lending Income From Securities Loaned to NFS | Value of Securities Loaned to NFS at Period End |
| Fidelity Global Equity Income Fund | $491 | $- | $- |
8. Expense Reductions.
Through arrangements with the Fund's custodian, credits realized as a result of certain uninvested cash balances were used to reduce the Fund's expenses by $72.
In addition, during the period the investment adviser or an affiliate reimbursed and/or waived a portion of operating expenses in the amount of $9,661.
9. Other.
A fund's organizational documents provide former and current trustees and officers with a limited indemnification against liabilities arising in connection with the performance of their duties to the fund. In the normal course of business, a fund may also enter into contracts that provide general indemnifications. A fund's maximum exposure under these arrangements is unknown as this would be dependent on future claims that may be made against a fund. The risk of material loss from such claims is considered remote.
10. Risk and Uncertainties.
Many factors affect a fund's performance. Developments that disrupt global economies and financial markets, such as pandemics, epidemics, outbreaks of infectious diseases, war, terrorism, and environmental disasters, may significantly affect a fund's investment performance. The effects of these developments to a fund will be impacted by the types of securities in which a fund invests, the financial condition, industry, economic sector, and geographic location of an issuer, and a fund's level of investment in the securities of that issuer. Significant concentrations in security types, issuers, industries, sectors, and geographic locations may magnify the factors that affect a fund's performance.
To the Board of Trustees of Fidelity Investment Trust and the Shareholders of Fidelity Global Equity Income Fund:
Opinion on the Financial Statements and Financial Highlights
We have audited the accompanying statement of assets and liabilities of Fidelity Global Equity Income Fund (the "Fund"), a fund of Fidelity Investment Trust, including the schedule of investments, as of October 31, 2023, the related statement of operations for the year then ended, the statement of changes in net assets for each of the two years in the period then ended, the financial highlights for each of the five years in the period then ended, and the related notes. In our opinion, the financial statements and financial highlights present fairly, in all material respects, the financial position of the Fund as of October 31, 2023, and the results of its operations for the year then ended, the changes in its net assets for each of the two years in the period then ended, and the financial highlights for each of the five years in the period then ended in conformity with accounting principles generally accepted in the United States of America.
Basis for Opinion
These financial statements and financial highlights are the responsibility of the Fund's management. Our responsibility is to express an opinion on the Fund's financial statements and financial highlights based on our audits. We are a public accounting firm registered with the Public Company Accounting Oversight Board (United States) (PCAOB) and are required to be independent with respect to the Fund in accordance with the U.S. federal securities laws and the applicable rules and regulations of the Securities and Exchange Commission and the PCAOB.
We conducted our audits in accordance with the standards of the PCAOB. Those standards require that we plan and perform the audit to obtain reasonable assurance about whether the financial statements and financial highlights are free of material misstatement, whether due to error or fraud. The Fund is not required to have, nor were we engaged to perform, an audit of its internal control over financial reporting. As part of our audits we are required to obtain an understanding of internal control over financial reporting but not for the purpose of expressing an opinion on the effectiveness of the Fund's internal control over financial reporting. Accordingly, we express no such opinion.
Our audits included performing procedures to assess the risks of material misstatement of the financial statements and financial highlights, whether due to error or fraud, and performing procedures that respond to those risks. Such procedures included examining, on a test basis, evidence regarding the amounts and disclosures in the financial statements and financial highlights. Our audits also included evaluating the accounting principles used and significant estimates made by management, as well as evaluating the overall presentation of the financial statements and financial highlights. Our procedures included confirmation of securities owned as of October 31, 2023, by correspondence with the custodian and brokers; when replies were not received from brokers, we performed other auditing procedures. We believe that our audits provide a reasonable basis for our opinion.
/s/ Deloitte & Touche LLP
Boston, Massachusetts
December 12, 2023
We have served as the auditor of one or more of the Fidelity investment companies since 1999.
The Trustees, Members of the Advisory Board (if any), and officers of the trust and fund, as applicable, are listed below. The Board of Trustees governs the fund and is responsible for protecting the interests of shareholders. The Trustees are experienced executives who meet periodically throughout the year to oversee the fund's activities, review contractual arrangements with companies that provide services to the fund, oversee management of the risks associated with such activities and contractual arrangements, and review the fund's performance. Except for Jonathan Chiel, each of the Trustees oversees 322 funds. Mr. Chiel oversees 191 funds.
The Trustees hold office without limit in time except that (a) any Trustee may resign; (b) any Trustee may be removed by written instrument, signed by at least two-thirds of the number of Trustees prior to such removal; (c) any Trustee who requests to be retired or who has become incapacitated by illness or injury may be retired by written instrument signed by a majority of the other Trustees; and (d) any Trustee may be removed at any special meeting of shareholders by a two-thirds vote of the outstanding voting securities of the trust. Each Trustee who is not an interested person (as defined in the 1940 Act) of the trust and the fund is referred to herein as an Independent Trustee. Each Independent Trustee shall retire not later than the last day of the calendar year in which his or her 75th birthday occurs. The Independent Trustees may waive this mandatory retirement age policy with respect to individual Trustees. Officers and Advisory Board Members hold office without limit in time, except that any officer or Advisory Board Member may resign or may be removed by a vote of a majority of the Trustees at any regular meeting or any special meeting of the Trustees. Except as indicated, each individual has held the office shown or other offices in the same company for the past five years.
The fund's Statement of Additional Information (SAI) includes more information about the Trustees. To request a free copy, call Fidelity at 1-800-544-8544.
Experience, Skills, Attributes, and Qualifications of the Trustees. The Governance and Nominating Committee has adopted a statement of policy that describes the experience, qualifications, attributes, and skills that are necessary and desirable for potential Independent Trustee candidates (Statement of Policy). The Board believes that each Trustee satisfied at the time he or she was initially elected or appointed a Trustee, and continues to satisfy, the standards contemplated by the Statement of Policy. The Governance and Nominating Committee also engages professional search firms to help identify potential Independent Trustee candidates who have the experience, qualifications, attributes, and skills consistent with the Statement of Policy. From time to time, additional criteria based on the composition and skills of the current Independent Trustees, as well as experience or skills that may be appropriate in light of future changes to board composition, business conditions, and regulatory or other developments, have also been considered by the professional search firms and the Governance and Nominating Committee. In addition, the Board takes into account the Trustees' commitment and participation in Board and committee meetings, as well as their leadership of standing and ad hoc committees throughout their tenure.
In determining that a particular Trustee was and continues to be qualified to serve as a Trustee, the Board has considered a variety of criteria, none of which, in isolation, was controlling. The Board believes that, collectively, the Trustees have balanced and diverse experience, qualifications, attributes, and skills, which allow the Board to operate effectively in governing the fund and protecting the interests of shareholders. Information about the specific experience, skills, attributes, and qualifications of each Trustee, which in each case led to the Board's conclusion that the Trustee should serve (or continue to serve) as a trustee of the fund, is provided below.
Board Structure and Oversight Function. Robert A. Lawrence is an interested person and currently serves as Chair. The Trustees have determined that an interested Chair is appropriate and benefits shareholders because an interested Chair has a personal and professional stake in the quality and continuity of services provided to the fund. Independent Trustees exercise their informed business judgment to appoint an individual of their choosing to serve as Chair, regardless of whether the Trustee happens to be independent or a member of management. The Independent Trustees have determined that they can act independently and effectively without having an Independent Trustee serve as Chair and that a key structural component for assuring that they are in a position to do so is for the Independent Trustees to constitute a substantial majority for the Board. The Independent Trustees also regularly meet in executive session. David M. Thomas serves as Lead Independent Trustee and as such (i) acts as a liaison between the Independent Trustees and management with respect to matters important to the Independent Trustees and (ii) with management prepares agendas for Board meetings.
Fidelity® funds are overseen by different Boards of Trustees. The fund's Board oversees Fidelity's high income and certain equity funds, and other Boards oversee Fidelity's alternative investment, investment-grade bond, money market, asset allocation, and other equity funds. The asset allocation funds may invest in Fidelity® funds overseen by the fund's Board. The use of separate Boards, each with its own committee structure, allows the Trustees of each group of Fidelity® funds to focus on the unique issues of the funds they oversee, including common research, investment, and operational issues. On occasion, the separate Boards establish joint committees to address issues of overlapping consequences for the Fidelity® funds overseen by each Board.
The Trustees operate using a system of committees to facilitate the timely and efficient consideration of all matters of importance to the Trustees, the fund, and fund shareholders and to facilitate compliance with legal and regulatory requirements and oversight of the fund's activities and associated risks. The Board, acting through its committees, has charged FMR and its affiliates with (i) identifying events or circumstances the occurrence of which could have demonstrably adverse effects on the fund's business and/or reputation; (ii) implementing processes and controls to lessen the possibility that such events or circumstances occur or to mitigate the effects of such events or circumstances if they do occur; and (iii) creating and maintaining a system designed to evaluate continuously business and market conditions in order to facilitate the identification and implementation processes described in (i) and (ii) above. Because the day-to-day operations and activities of the fund are carried out by or through FMR, its affiliates, and other service providers, the fund's exposure to risks is mitigated but not eliminated by the processes overseen by the Trustees. While each of the Board's committees has responsibility for overseeing different aspects of the fund's activities, oversight is exercised primarily through the Operations, Audit, and Compliance Committees. Appropriate personnel, including but not limited to the fund's Chief Compliance Officer (CCO), FMR's internal auditor, the independent accountants, the fund's Treasurer and portfolio management personnel, make periodic reports to the Board's committees, as appropriate, including an annual review of Fidelity's risk management program for the Fidelity® funds. The responsibilities of each standing committee, including their oversight responsibilities, are described further under "Standing Committees of the Trustees."
Interested Trustees*:
Correspondence intended for a Trustee who is an interested person may be sent to Fidelity Investments, 245 Summer Street, Boston, Massachusetts 02210.
Name, Year of Birth; Principal Occupations and Other Relevant Experience+
Jonathan Chiel (1957)
Year of Election or Appointment: 2016
Trustee
Mr. Chiel also serves as Trustee of other Fidelity® funds. Mr. Chiel is General Counsel (2012-present) and Head of Legal, Risk and Compliance (2022-present). Mr Chiel serves as Executive Vice President and General Counsel for FMR LLC (diversified financial services company, 2012-present) and Director and President for OH Company LLC (holding company, 2018-present). Previously, Mr. Chiel served as general counsel (2004-2012) and senior vice president and deputy general counsel (2000-2004) for John Hancock Financial Services; a partner with Choate, Hall & Stewart (1996-2000) (law firm); and an Assistant United States Attorney for the United States Attorney's Office of the District of Massachusetts (1986-95), including Chief of the Criminal Division (1993-1995). Mr. Chiel is a director on the boards of the Boston Bar Foundation and the Maimonides School.
Bettina Doulton (1964)
Year of Election or Appointment: 2021
Trustee
Ms. Doulton also serves as Trustee of other Fidelity® funds. Prior to her retirement, Ms. Doulton served in a variety of positions at Fidelity Investments, including as a managing director of research (2006-2007), portfolio manager to certain Fidelity® funds (1993-2005), equity analyst and portfolio assistant (1990-1993), and research assistant (1987-1990). Ms. Doulton currently owns and operates Phi Builders + Architects and Cellardoor Winery. Previously, Ms. Doulton served as a member of the Board of Brown Capital Management, LLC (2014-2018).
Robert A. Lawrence (1952)
Year of Election or Appointment: 2020
Trustee
Chair of the Board of Trustees
Mr. Lawrence also serves as Trustee of other funds. Previously, Mr. Lawrence served as a Trustee and Member of the Advisory Board of certain funds. Prior to his retirement in 2008, Mr. Lawrence served as Vice President of certain Fidelity® funds (2006-2008), Senior Vice President, Head of High Income Division of Fidelity Management & Research Company (investment adviser firm, 2006-2008), and President of Fidelity Strategic Investments (investment adviser firm, 2002-2005).
* Determined to be an "Interested Trustee" by virtue of, among other things, his or her affiliation with the trust or various entities under common control with FMR.
+ The information includes the Trustee's principal occupation during the last five years and other information relating to the experience, attributes, and skills relevant to the Trustee's qualifications to serve as a Trustee, which led to the conclusion that the Trustee should serve as a Trustee for the fund.
Independent Trustees:
Correspondence intended for an Independent Trustee may be sent to Fidelity Investments, P.O. Box 55235, Boston, Massachusetts 02205-5235.
Name, Year of Birth; Principal Occupations and Other Relevant Experience+
Thomas P. Bostick (1956)
Year of Election or Appointment: 2021
Trustee
Lieutenant General Bostick also serves as Trustee of other Fidelity® funds. Prior to his retirement, General Bostick (United States Army, Retired) held a variety of positions within the U.S. Army, including Commanding General and Chief of Engineers, U.S. Army Corps of Engineers (2012-2016) and Deputy Chief of Staff and Director of Human Resources, U.S. Army (2009-2012). General Bostick currently serves as a member of the Board and Finance and Governance & Sustainability Committees of CSX Corporation (transportation, 2020-present) and a member of the Board and Corporate Governance and Nominating Committee of Perma-Fix Environmental Services, Inc. (nuclear waste management, 2020-present). General Bostick serves as Chief Executive Officer of Bostick Global Strategies, LLC (consulting, 2016-present), as a member of the Board of HireVue, Inc. (video interview and assessment, 2020-present), as a member of the Board of Allonnia (biotechnology and engineering solutions, 2022-present) and on the Advisory Board of Solugen, Inc. (specialty bio-based chemicals manufacturer, 2022-present). Previously, General Bostick served as a Member of the Advisory Board of certain Fidelity® funds (2021), President, Intrexon Bioengineering (2018-2020) and Chief Operating Officer (2017-2020) and Senior Vice President of the Environment Sector (2016-2017) of Intrexon Corporation (biopharmaceutical company).
Dennis J. Dirks (1948)
Year of Election or Appointment: 2005
Trustee
Mr. Dirks also serves as Trustee of other Fidelity® funds. Prior to his retirement in May 2003, Mr. Dirks served as Chief Operating Officer and as a member of the Board of The Depository Trust & Clearing Corporation (financial markets infrastructure), President, Chief Operating Officer and a member of the Board of The Depository Trust Company (DTC), President and a member of the Board of the National Securities Clearing Corporation (NSCC), Chief Executive Officer and a member of the Board of the Government Securities Clearing Corporation and Chief Executive Officer and a member of the Board of the Mortgage-Backed Securities Clearing Corporation. Mr. Dirks currently serves as a member of the Finance Committee (2016-present) and Board (2017-present) and is Treasurer (2018-present) of the Asolo Repertory Theatre.
Donald F. Donahue (1950)
Year of Election or Appointment: 2018
Trustee
Mr. Donahue also serves as Trustee of other Fidelity® funds. Mr. Donahue serves as President and Chief Executive Officer of Miranda Partners, LLC (risk consulting for the financial services industry, 2012-present). Previously, Mr. Donahue served as Chief Executive Officer (2006-2012), Chief Operating Officer (2003-2006) and Managing Director, Customer Marketing and Development (1999-2003) of The Depository Trust & Clearing Corporation (financial markets infrastructure). Mr. Donahue currently serves as a member (2007-present) and Co-Chairman (2016-present) of the Board of United Way of New York. Mr. Donahue previously served as a member of the Advisory Board of certain Fidelity® funds (2015-2018) and as a member of the Board of The Leadership Academy (previously NYC Leadership Academy) (2012-2022).
Vicki L. Fuller (1957)
Year of Election or Appointment: 2020
Trustee
Ms. Fuller also serves as Trustee of other Fidelity® funds. Previously, Ms. Fuller served as a member of the Advisory Board of certain Fidelity® funds (2018-2020), Chief Investment Officer of the New York State Common Retirement Fund (2012-2018) and held a variety of positions at AllianceBernstein L.P. (global asset management, 1985-2012), including Managing Director (2006-2012) and Senior Vice President and Senior Portfolio Manager (2001-2006). Ms. Fuller currently serves as a member of the Board, Audit Committee and Nominating and Governance Committee of two Blackstone business development companies (2020-present), as a member of the Board of Treliant, LLC (consulting, 2019-present), as a member of the Board of Ariel Alternatives, LLC (private equity, 2022-present) and as a member of the Board and Chair of the Audit Committee of Gusto, Inc. (software, 2021-present). In addition, Ms. Fuller currently serves as a member of the Board of Roosevelt University (2019-present) and as a member of the Executive Board of New York University's Stern School of Business. Ms. Fuller previously served as a member of the Board, Audit Committee and Nominating and Governance Committee of The Williams Companies, Inc. (natural gas infrastructure, 2018-2021).
Patricia L. Kampling (1959)
Year of Election or Appointment: 2020
Trustee
Ms. Kampling also serves as Trustee of other Fidelity® funds. Prior to her retirement, Ms. Kampling served as Chairman of the Board and Chief Executive Officer (2012-2019), President and Chief Operating Officer (2011-2012) and Executive Vice President and Chief Financial Officer (2010-2011) of Alliant Energy Corporation. Ms. Kampling currently serves as a member of the Board, Finance Committee and Governance, Compensation and Nominating Committee of Xcel Energy Inc. (utilities company, 2020-present) and as a member of the Board, Audit, Finance and Risk Committee and Safety, Environmental, Technology and Operations Committee and Chair of the Executive Development and Compensation Committee of American Water Works Company, Inc. (utilities company, 2019-present). In addition, Ms. Kampling currently serves as a member of the Board of the Nature Conservancy, Wisconsin Chapter (2019-present). Previously, Ms. Kampling served as a Member of the Advisory Board of certain Fidelity® funds (2020), a member of the Board, Compensation Committee and Executive Committee and Chair of the Audit Committee of Briggs & Stratton Corporation (manufacturing, 2011-2021), a member of the Board of Interstate Power and Light Company (2012-2019) and Wisconsin Power and Light Company (2012-2019) (each a subsidiary of Alliant Energy Corporation) and as a member of the Board and Workforce Development Committee of the Business Roundtable (2018-2019).
Thomas A. Kennedy (1955)
Year of Election or Appointment: 2021
Trustee
Mr. Kennedy also serves as Trustee of other Fidelity® funds. Previously, Mr. Kennedy served as a Member of the Advisory Board of certain Fidelity® funds (2020) and held a variety of positions at Raytheon Company (aerospace and defense, 1983-2020), including Chairman and Chief Executive Officer (2014-2020) and Executive Vice President and Chief Operating Officer (2013-2014). Mr. Kennedy served as Executive Chairman of the Board of Directors of Raytheon Technologies Corporation (aerospace and defense, 2020-2021). Mr. Kennedy serves as a Director of the Board of Directors of Textron Inc. (aerospace and defense, 2023-present).
Oscar Munoz (1959)
Year of Election or Appointment: 2021
Trustee
Mr. Munoz also serves as Trustee of other Fidelity® funds. Prior to his retirement, Mr. Munoz served as Executive Chairman (2020-2021), Chief Executive Officer (2015-2020), President (2015-2016) and a member of the Board (2010-2021) of United Airlines Holdings, Inc. Mr. Munoz currently serves as a member of the Board of CBRE Group, Inc. (commercial real estate, 2020-present), a member of the Board of Univision Communications, Inc. (Hispanic media, 2020-present), a member of the Board of Archer Aviation Inc. (2021-present), a member of the Defense Business Board of the United States Department of Defense (2021-present) and a member of the Board of Salesforce.com, Inc. (cloud-based software, 2022-present). Previously, Mr. Munoz served as a Member of the Advisory Board of certain Fidelity® funds (2021).
David M. Thomas (1949)
Year of Election or Appointment: 2008
Trustee
Lead Independent Trustee
Mr. Thomas also serves as Trustee of other Fidelity® funds. Previously, Mr. Thomas served as Executive Chairman (2005-2006) and Chairman and Chief Executive Officer (2000-2005) of IMS Health, Inc. (pharmaceutical and healthcare information solutions). Mr. Thomas currently serves as a member of the Board of Fortune Brands Home and Security (home and security products, 2004-present) and as Director (2013-present) and Non-Executive Chairman of the Board (2022-present) of Interpublic Group of Companies, Inc. (marketing communication).
Susan Tomasky (1953)
Year of Election or Appointment: 2020
Trustee
Ms. Tomasky also serves as Trustee of other Fidelity® funds. Prior to her retirement, Ms. Tomasky served in various executive officer positions at American Electric Power Company, Inc. (1998-2011), including most recently as President of AEP Transmission (2007-2011). Ms. Tomasky currently serves as a member of the Board and Sustainability Committee and as Chair of the Audit Committee of Marathon Petroleum Corporation (2018-present) and as a member of the Board, Executive Committee, Corporate Governance Committee and Organization and Compensation Committee and as Lead Director of the Board of Public Service Enterprise Group, Inc. (utilities company, 2012-present) and as a member of the Board of its subsidiary company, Public Service Electric and Gas Co. (2021-present). In addition, Ms. Tomasky currently serves as a member (2009-present) and President (2020-present) of the Board of the Royal Shakespeare Company - America (2009-present), as a member of the Board of the Columbus Association for the Performing Arts (2011-present) and as a member of the Board and Kenyon in the World Committee of Kenyon College (2016-present). Previously, Ms. Tomasky served as a Member of the Advisory Board of certain Fidelity® funds (2020), as a member of the Board of the Columbus Regional Airport Authority (2007-2020), as a member of the Board (2011-2018) and Lead Independent Director (2015-2018) of Andeavor Corporation (previously Tesoro Corporation) (independent oil refiner and marketer) and as a member of the Board of Summit Midstream Partners LP (energy, 2012-2018).
Michael E. Wiley (1950)
Year of Election or Appointment: 2020
Trustee
Mr. Wiley also serves as Trustee of other Fidelity® funds. Previously, Mr. Wiley served as a member of the Advisory Board of certain Fidelity® funds (2018-2020), Chairman, President and CEO of Baker Hughes, Inc. (oilfield services, 2000-2004). Mr. Wiley also previously served as a member of the Board of Andeavor Corporation (independent oil refiner and marketer, 2005-2018), a member of the Board of Andeavor Logistics LP (natural resources logistics, 2015-2018) and a member of the Board of High Point Resources (exploration and production, 2005-2020).
+ The information includes the Trustee's principal occupation during the last five years and other information relating to the experience, attributes, and skills relevant to the Trustee's qualifications to serve as a Trustee, which led to the conclusion that the Trustee should serve as a Trustee for the fund.
Advisory Board Members and Officers:
Correspondence intended for a Member of the Advisory Board (if any) may be sent to Fidelity Investments, P.O. Box 55235, Boston, Massachusetts 02205-5235. Correspondence intended for an officer or Peter S. Lynch may be sent to Fidelity Investments, 245 Summer Street, Boston, Massachusetts 02210.
Name, Year of Birth; Principal Occupation
Vijay C. Advani (1960)
Year of Election or Appointment: 2023
Member of the Advisory Board
Mr. Advani also serves as Trustee or Member of the Advisory Board of other funds. Previously, Mr. Advani served as Executive Chairman (2020-2022), Chief Executive Officer (2017-2020) and Chief Operating Officer (2016-2017) of Nuveen (global investment manager). He also served in various capacities at Franklin Resources (global investment manager), including Co-President (2015-2016), Executive Vice President, Global Advisory Services (2008-2015), Head of Global Retail Distribution (2005-2008), Executive Managing Director, International Retail Development (2002-2005), Managing Director, Product Developments, Sales & Marketing, Asia, Eastern Europe and Africa (2000-2002) and President, Templeton Asset Management India (1995-2000). Mr. Advani also served as Senior Investment Officer of International Finance Corporation (private equity and venture capital arm of The World Bank, 1984-1995). Mr. Advani is Chairman Emeritus of the U.S. India Business Council (2018-present), a Director of The Global Impact Investing Network (2019-present), a Director of LOK Capital (Mauritius) (2022-present), a member of the Advisory Council of LOK Capital (2022-present), a Senior Advisor of Neuberger Berman (2021-present), a Senior Advisor of Seviora Holdings Pte. Ltd (Temasek-Singapore) (2021-present), a Director of Seviora Capital (Singapore) (2021-present) and an Advisor of EQUIAM (2021-present). Mr. Advani formerly served as a member of the Board of BowX Acquisition Corp. (special purpose acquisition company, 2020-2021), a member of the Board of Intellecap (advisory arm of The Aavishkaar Group, 2018-2020), a member of the Board of Nuveen Investments, Inc. (2017-2020) and a member of the Board of Docusign (software, 2016-2019).
Peter S. Lynch (1944)
Year of Election or Appointment: 2003
Member of the Advisory Board
Mr. Lynch also serves as a Member of the Advisory Board of other Fidelity® funds. Mr. Lynch is Vice Chairman and a Director of Fidelity Management & Research Company LLC (investment adviser firm). In addition, Mr. Lynch serves as a Trustee of Boston College and as the Chairman of the Inner-City Scholarship Fund. Previously, Mr. Lynch served as Vice Chairman and a Director of FMR Co., Inc. (investment adviser firm) and on the Special Olympics International Board of Directors (1997-2006).
Karen B. Peetz (1955)
Year of Election or Appointment: 2023
Member of the Advisory Board
Ms. Peetz also serves as a Member of the Advisory Board of other funds. Previously, Ms. Peetz served as Chief Administration Officer (2020-2023) of Citigroup Inc. (a diversified financial service company). She also served in various capacities at Bank of New York Mellon Corporation, including President (2013-2016), Vice Chairman, Senior Executive Vice President and Chief Executive Officer of Financial Markets & Treasury Services (2010-2013), Senior Executive Vice President and Chief Executive Officer of Global Corporate Trust (2003-2008), Senior Vice President and Division Manager of Global Payments & Trade Services (2002-2003) and Senior Vice President and Division Manager of Domestic Corporate Trust (1998-2002). Ms. Peetz also served in various capacities at Chase Manhattan Corporation (1982-1998), including Senior Vice President and Manager of Corporate Trust International Business (1996-1998), Managing Director and Manager of Corporate Trust Services (1994-1996) and Managing Director and Group Manager of Financial Institution Sales (1990-1993). Ms. Peetz currently serves as Chair of Amherst Holdings Advisory Council (2018-present), Trustee of Johns Hopkins University (2016-present), Chair of the Carey Business School Advisory Council, Member of the Johns Hopkins Medicine Board and Finance Committee and Chair of the Lyme and Tick Related Disease Institute Advisory Council. Ms. Peetz previously served as a member of the Board of Guardian Life Insurance Company of America (2019-2023), a member of the Board of Trane Technologies (2018-2022), a member of the Board of Wells Fargo Corp. (2017-2019), a member of the Board of SunCoke Energy Inc. (2012-2016), a member of the Board of Private Export Funding Corporation (2010-2016) and as a Trustee of Penn State University (2010-2014) and the United Way of New York City (2008-2010).
Heather Bonner (1977)
Year of Election or Appointment: 2023
Assistant Treasurer
Ms. Bonner also serves as an officer of other funds. Ms. Bonner is a Senior Vice President (2022-present) and is an employee of Fidelity Investments (2022-present). Ms. Bonner serves as Vice President, Treasurer, or Assistant Treasurer of certain Fidelity entities. Prior to joining Fidelity, Ms. Bonner served as Managing Director at AQR Capital Management (2013-2022) and was the Treasurer and Principal Financial Officer of the AQR Funds (2013-2022).
Craig S. Brown (1977)
Year of Election or Appointment: 2022
Deputy Treasurer
Mr. Brown also serves as an officer of other funds. Mr. Brown is a Vice President (2015-present) and is an employee of Fidelity Investments. Mr. Brown serves as Assistant Treasurer of FIMM, LLC (2021-present). Previously, Mr. Brown served as Assistant Treasurer of certain Fidelity® funds (2019-2022).
John J. Burke III (1964)
Year of Election or Appointment: 2018
Chief Financial Officer
Mr. Burke also serves as Chief Financial Officer of other funds. Mr. Burke is Head of Fidelity Fund and Investment Operations (2018-present) and is an employee of Fidelity Investments. Mr. Burke serves as President, Executive Vice President, or Director of certain Fidelity entities. Previously Mr. Burke served as head of Asset Management Investment Operations (2012-2018).
Margaret Carey (1973)
Year of Election or Appointment: 2023
Secretary and Chief Legal Officer (CLO)
Ms. Carey also serves as an officer of other funds and as CLO of certain Fidelity entities. Ms. Carey is a Senior Vice President, Deputy General Counsel (2019-present) and is an employee of Fidelity Investments.
William C. Coffey (1969)
Year of Election or Appointment: 2019
Assistant Secretary
Mr. Coffey also serves as Assistant Secretary of other funds. Mr. Coffey is a Senior Vice President, Deputy General Counsel (2010-present) and is an employee of Fidelity Investments. Previously, Mr. Coffey served as Secretary and CLO of certain funds (2018-2019); CLO, Secretary, or Senior Vice President of certain Fidelity entities and Assistant Secretary of certain funds (2009-2018).
Timothy M. Cohen (1969)
Year of Election or Appointment: 2018
Vice President
Mr. Cohen also serves as Vice President of other funds. Mr. Cohen is Co-Head of Equity (2018-present) and is an employee of Fidelity Investments. Mr. Cohen serves a Director of Fidelity Management & Research (Japan) Limited (investment adviser firm, 2016-present). Previously, Mr. Cohen served as Executive Vice President of Fidelity SelectCo, LLC (2019) and Head of Global Equity Research (2016-2018).
Jonathan Davis (1968)
Year of Election or Appointment: 2010
Assistant Treasurer
Mr. Davis also serves as an officer of other funds. Mr. Davis is a Vice President (2006-present) and is an employee of Fidelity Investments. Mr. Davis serves as Assistant Treasurer of certain Fidelity entities.
Laura M. Del Prato (1964)
Year of Election or Appointment: 2018
Assistant Treasurer
Ms. Del Prato also serves as an officer of other funds. Ms. Del Prato is a Senior Vice President (2017-present) and is an employee of Fidelity Investments. Ms. Del Prato serves as Vice President or Assistant Treasurer of certain Fidelity entities. Previously, Ms. Del Prato served as President and Treasurer of The North Carolina Capital Management Trust: Cash Portfolio and Term Portfolio (2018-2020).
Colm A. Hogan (1973)
Year of Election or Appointment: 2020
Assistant Treasurer
Mr. Hogan also serves as an officer of other funds. Mr. Hogan is a Vice President (2016-present) and is an employee of Fidelity Investments. Mr. Hogan serves as Assistant Treasurer of certain Fidelity entities. Previously, Mr. Hogan served as Deputy Treasurer of certain Fidelity® funds (2016-2020) and Assistant Treasurer of certain Fidelity® funds (2016-2018).
Pamela R. Holding (1964)
Year of Election or Appointment: 2018
Vice President
Ms. Holding also serves as Vice President of other funds. Ms. Holding is Co-Head of Equity (2018-present) and is an employee of Fidelity Investments. Previously, Ms. Holding served as Executive Vice President of Fidelity SelectCo, LLC (2019) and as Chief Investment Officer of Fidelity Institutional Asset Management (2013-2018).
Chris Maher (1972)
Year of Election or Appointment: 2020
Deputy Treasurer
Mr. Maher also serves as an officer of other funds. Mr. Maher is a Vice President (2008-present) and is an employee of Fidelity Investments. Mr. Maher serves as Assistant Treasurer of certain Fidelity entities. Previously, Mr. Maher served as Assistant Treasurer of certain funds (2013-2020).
Jason P. Pogorelec (1975)
Year of Election or Appointment: 2020
Chief Compliance Officer
Mr. Pogorelec also serves as Chief Compliance Officer of other funds. Mr. Pogorelec is a Senior Vice President of Asset Management Compliance (2020-present) and is an employee of Fidelity Investments. Mr. Pogorelec serves as Compliance Officer of Fidelity Management & Research Company LLC (investment adviser firm, 2023-present) and Ballyrock Investment Advisors LLC (2023-present). Previously, Mr. Pogorelec served as a Vice President, Associate General Counsel for Fidelity Investments (2010-2020) and Assistant Secretary of certain Fidelity® funds (2015-2020).
Brett Segaloff (1972)
Year of Election or Appointment: 2021
Anti-Money Laundering (AML) Officer
Mr. Segaloff also serves as AML Officer of other funds. Mr. Segaloff is a Vice President (2022-present) and is an employee of Fidelity Investments. Mr. Segaloff serves as Anti Money Laundering Compliance Officer or Anti Money Laundering/Bank Secrecy Act Compliance Officer of certain Fidelity entities.
Stacie M. Smith (1974)
Year of Election or Appointment: 2016
President and Treasurer
Ms. Smith also serves as an officer of other funds. Ms. Smith is a Senior Vice President (2016-present) and is an employee of Fidelity Investments. Ms. Smith serves as Assistant Treasurer of certain Fidelity entities and has served in other fund officer roles.
Jim Wegmann (1979)
Year of Election or Appointment: 2019
Assistant Treasurer
Mr. Wegmann also serves as an officer of other funds. Mr. Wegmann is a Vice President (2016-present) and is an employee of Fidelity Investments. Mr. Wegmann serves as Assistant Treasurer of FIMM, LLC (2021-present). Previously, Mr. Wegmann served as Assistant Treasurer of certain Fidelity® funds (2019-2021).
As a shareholder, you incur two types of costs: (1) transaction costs, which may include sales charges (loads) on purchase payments or redemption proceeds, as applicable and (2) ongoing costs, which generally include management fees, distribution and/or service (12b-1) fees and other Fund expenses. This Example is intended to help you understand your ongoing costs (in dollars) of investing in a fund and to compare these costs with the ongoing costs of investing in other mutual funds.
| The Example is based on an investment of $1,000 invested at the beginning of the period and held for the entire period (May 1, 2023 to October 31, 2023). |
Actual Expenses
The first line of the accompanying table provides information about actual account values and actual expenses. You may use the information in this line, together with the amount you invested, to estimate the expenses that you paid over the period. Simply divide your account value by $1,000.00 (for example, an $8,600 account value divided by $1,000.00 = 8.6), then multiply the result by the number in the first line for a class/Fund under the heading entitled "Expenses Paid During Period" to estimate the expenses you paid on your account during this period. If any fund is a shareholder of any underlying mutual funds or exchange-traded funds (ETFs) (the Underlying Funds), such fund indirectly bears its proportional share of the expenses of the Underlying Funds in addition to the direct expenses incurred presented in the table. These fees and expenses are not included in the annualized expense ratio used to calculate the expense estimate in the table below.
Hypothetical Example for Comparison Purposes
The second line of the accompanying table provides information about hypothetical account values and hypothetical expenses based on the actual expense ratio and an assumed rate of return of 5% per year before expenses, which is not the actual return. The hypothetical account values and expenses may not be used to estimate the actual ending account balance or expenses you paid for the period. You may use this information to compare the ongoing costs of investing in the Fund and other funds. To do so, compare this 5% hypothetical example with the 5% hypothetical examples that appear in the shareholder reports of the other funds. If any fund is a shareholder of any Underlying Funds, such fund indirectly bears its proportional share of the expenses of the Underlying Funds in addition to the direct expenses as presented in the table. These fees and expenses are not included in the annualized expense ratio used to calculate the expense estimate in the table below.
Please note that the expenses shown in the table are meant to highlight your ongoing costs only and do not reflect any transaction costs. Therefore, the second line of the table is useful in comparing ongoing costs only, and will not help you determine the relative total costs of owning different funds. In addition, if these transactional costs were included, your costs would have been higher.
| | | | | Annualized Expense Ratio- A | | Beginning Account Value May 1, 2023 | | Ending Account Value October 31, 2023 | | Expenses Paid During Period- C May 1, 2023 to October 31, 2023 |
| | | | | | | | | | |
| Fidelity® Global Equity Income Fund | | | | .98% | | | | | | |
| Actual | | | | | | $ 1,000 | | $ 954.10 | | $ 4.83 |
Hypothetical-B | | | | | | $ 1,000 | | $ 1,020.27 | | $ 4.99 |
| |
A Annualized expense ratio reflects expenses net of applicable fee waivers.
B 5% return per year before expenses
C Expenses are equal to the annualized expense ratio, multiplied by the average account value over the period, multiplied by 184/ 365 (to reflect the one-half year period). The fees and expenses of any Underlying Funds are not included in each annualized expense ratio.
The dividend and capital gains distributions for the fund(s) are available on Fidelity.com or Institutional.Fidelity.com.
A total of 0.17% of the dividends distributed during the fiscal year was derived from interest on U.S. Government securities which is generally exempt from state income tax.
The fund designates $63,470 of distributions paid during the fiscal year ended 2023 as qualifying to be taxed as section 163(j) interest dividends.
The fund designates 55%, 86%, 86% and 86% of the dividends distributed in December, April, July, and October respectively during the fiscal year as qualifying for the dividends-received deduction for corporate shareholders.
The fund designates 100% of the dividends distributed during the fiscal year as amounts which may be taken into account as a dividend for the purposes of the maximum rate under section 1(h)(11) of the Internal Revenue Code.
The fund will notify shareholders in January 2024 of amounts for use in preparing 2023 income tax returns.
Board Approval of Investment Advisory Contracts and Management Fees
Fidelity Global Equity Income Fund
Each year, the Board of Trustees, including the Independent Trustees (together, the Board), considers the renewal of the fund's management contract with Fidelity Management & Research Company LLC (FMR) and the sub-advisory agreements (together, the Advisory Contracts) for the fund. FMR and the sub-advisers are referred to herein as the Investment Advisers. The Board, assisted by the advice of fund counsel and Independent Trustees' counsel, requests and considers a broad range of information relevant to the renewal of the Advisory Contracts throughout the year.
The Board meets regularly and, at each of its meetings, covers an extensive agenda of topics and materials and considers factors that are relevant to its annual consideration of the renewal of the fund's Advisory Contracts, including the services and support provided to the fund and its shareholders. The Board, acting directly and through its Committees (each of which is composed of and chaired by Independent Trustees), requests and receives information concerning the annual consideration of the renewal of the fund's Advisory Contracts. The Board also meets as needed to review matters specifically related to the Board's annual consideration of the renewal of the Advisory Contracts. Members of the Board may also meet with trustees of other Fidelity funds through joint ad hoc committees to discuss certain matters relevant to all of the Fidelity funds.
Approval of Stub Period Continuation. At its May 2023 meeting, the Board of Trustees voted to continue the fund's management contract with FMR, and the sub-advisory agreements and sub-sub-advisory agreements, in each case, where applicable (together, the Advisory Contracts), without modification, for two months from June 1, 2023 through July 31, 2023. The Board considered that the approval of the fund's Advisory Contracts will not result in any changes in (i) the investment process or strategies employed in the management of the fund's assets; (ii) the fees and expenses paid by shareholders; (iii) the nature, extent or quality of services provided under the fund's Advisory Contracts; or (iv) the day-to-day management of the fund or the persons primarily responsible for such management. The Board also considered that since its last approval of the fund's Advisory Contracts, FMR had provided additional information on the fund in support of the annual contract renewal process, including competitive analyses on total expenses and management fees and in-depth reviews of fund performance and fund profitability information. The Board concluded that the fund's Advisory Contracts are fair and reasonable, and that the fund's Advisory Contracts should be renewed, without modification, through July 31, 2023, with the understanding that the Board would consider the annual renewal for a full one year period in July 2023.
At its July 2023 meeting, the Board unanimously determined to renew the fund's Advisory Contracts. In reaching its determination, the Board considered all factors it believed relevant, including (i) the nature, extent, and quality of the services provided to the fund and its shareholders (including the investment performance of the fund); (ii) the competitiveness relative to peer funds of the fund's management fee and total expense ratio; (iii) the total costs of the services provided by and the profits realized by FMR and its affiliates (Fidelity) from its relationships with the fund; and (iv) the extent to which, if any, economies of scale exist and are realized as the fund grows, and whether any economies of scale are appropriately shared with fund shareholders. The Board also considered the broad range of investment choices available to shareholders from FMR's competitors and that the fund's shareholders have chosen to invest in the fund, which is part of the Fidelity family of funds. The Board's decision to renew the Advisory Contracts was not based on any single factor.
The Board reached a determination, with the assistance of fund counsel and Independent Trustees' counsel and through the exercise of its business judgment, that the renewal of the Advisory Contracts was in the best interests of the fund and its shareholders and that the compensation payable under the Advisory Contracts was fair and reasonable in light of all of the surrounding circumstances.
Nature, Extent, and Quality of Services Provided. The Board considered staffing as it relates to the fund, including the backgrounds and experience of investment personnel of the Investment Advisers, and also considered the Investment Advisers' implementation of the fund's investment program. The Independent Trustees also had discussions with senior management of Fidelity's investment operations and investment groups. The Board considered the structure of the investment personnel compensation program and whether this structure provides appropriate incentives to act in the best interests of the fund. Additionally, the Board considered the portfolio managers' investments, if any, in the funds that they manage.
Resources Dedicated to Investment Management and Support Services. The Board and the Fund Oversight and Research Committees reviewed the general qualifications and capabilities of Fidelity's investment staff, including its size, education, experience, and resources, as well as Fidelity's approach to recruiting, training, managing, and compensating investment personnel. The Board noted the resources devoted to expansion of Fidelity's global investment organization, and that Fidelity's analysts have extensive resources, tools, and capabilities that allow them to conduct sophisticated quantitative and fundamental analysis, as well as credit analysis of issuers, counterparties, and guarantors. Further, the Board considered that Fidelity's investment professionals have sufficient access to global information and data so as to provide competitive investment results over time, and that those professionals also have access to sophisticated tools that permit them to assess portfolio construction and risk and performance attribution characteristics continuously, as well as to transmit new information and research conclusions rapidly around the world. Additionally, in its deliberations, the Board considered Fidelity's trading, risk management, compliance, and technology and operations capabilities and resources, which are integral parts of the investment management process.
Shareholder and Administrative Services. The Board considered (i) the nature, extent, quality, and cost of advisory, administrative, and shareholder services performed by the Investment Advisers and their affiliates under the Advisory Contracts and under separate agreements covering transfer agency, pricing and bookkeeping, and securities lending services for the fund; (ii) the nature and extent of Fidelity's supervision of third party service providers, principally custodians, subcustodians, and pricing vendors; and (iii) the resources devoted by Fidelity to, and the record of compliance with, the fund's compliance policies and procedures. The Board also reviewed the allocation of fund brokerage, including allocations to brokers affiliated with the Investment Advisers, the use of brokerage commissions to pay fund expenses, and the use of "soft" commission dollars to pay for research services. The Board also considered the fund's securities lending activities and any payments made to Fidelity relating to securities lending.
The Board noted that the growth of fund assets over time across the complex allows Fidelity to reinvest in the development of services designed to enhance the value and convenience of the Fidelity funds as investment vehicles. These services include 24-hour access to account information and market information over the Internet and through telephone representatives, investor education materials, and asset allocation tools. The Board also considered that it reviews customer service metrics such as telephone response times, continuity of services on the website and metrics addressing services at Fidelity Investor Centers.
Investment in a Large Fund Family. The Board considered the benefits to shareholders of investing in a fund that is part of a large family of funds offering a variety of investment disciplines and providing a large variety of fund investor services. The Board noted that Fidelity had taken, or had made recommendations that resulted in the Fidelity funds taking, a number of actions over the previous year that benefited particular funds and/or the Fidelity funds in general.
Investment Performance. The Board took into account discussions that occur with representatives of the Investment Advisers, and reports that it receives, at Board meetings throughout the year, relating to fund investment performance. In this regard the Board noted that as part of regularly scheduled fund reviews and other reports to the Board on fund performance, the Board considered annualized return information for the fund for different time periods, measured against an appropriate securities market index (benchmark index) and an appropriate peer group of funds with similar objectives (peer group). The Board also considered information about performance attribution. In its ongoing evaluation of fund investment performance, the Board gives particular attention to information indicating changes in performance of the funds over different time periods and discussed with the Investment Advisers the reasons for any overperformance or underperformance.
In addition to reviewing absolute and relative fund performance, the Independent Trustees periodically consider the appropriateness of fund performance metrics in evaluating the results achieved. The Independent Trustees generally give greater weight to fund performance over longer time periods than over shorter time periods. Depending on the circumstances, the Independent Trustees may be satisfied with a fund's performance notwithstanding that it lags its benchmark index or peer group for certain periods.
Based on its review, the Board concluded that the nature, extent, and quality of services provided to the fund under the Advisory Contracts should continue to benefit the shareholders of the fund.
Competitiveness of Management Fee and Total Expense Ratio. The Board was provided with information regarding industry trends in management fees and expenses. In its review of the fund's management fee and total expense ratio, the Board considered the fund's management fee rate as well as other fund expenses, such as transfer agent fees, pricing and bookkeeping fees, and custodial, legal, and audit fees. The Board noted that Fidelity may agree to waive fees or reimburse expenses from time to time, and the extent to which, if any, it has done so for the fund.
Comparisons of Management Fees and Total Expense Ratios. Among other things, the Board reviewed data for selected groups of competitive funds and classes (referred to as "mapped groups") that were compiled by Fidelity based on combining similar investment objective categories (as classified by Lipper) that have comparable investment mandates. The data reviewed by the Board included (i) gross management fee comparisons (before taking into account expense reimbursements or caps) relative to the total universe of funds within the mapped group; (ii) gross management fee comparisons relative to a subset of non-Fidelity funds in the mapped group that are similar in size and management fee structure to the fund (referred to as the "asset size peer group"); (iii) total expense comparisons of the fund relative to funds and classes in the mapped group that have a similar sales load structure to the fund (referred to as the "similar sales load structure group"); and (iv) total expense comparisons of the fund relative to funds and classes in the similar sales load structure group that are similar in size and management fee structure to the fund (referred to as the "total expense asset size peer group"). The total expense asset size peer group comparison excludes performance adjustments and fund-paid 12b-1 fees to eliminate variability in fee structures.
The information provided to the Board indicated that the fund's management fee rate ranked below the competitive median of the mapped group for the 12-month period ended September 30, 2022 and below the competitive median of the asset size peer group for the 12-month period ended September 30, 2022. Further, the information provided to the Board indicated that the total expense ratio of the fund ranked below the competitive median of the similar sales load structure group for the 12-month period ended September 30, 2022 and below the competitive median of the total expense asset size peer group for the 12-month period ended September 30, 2022.
The Board also considered that, for funds subject to the group fee, FMR agreed to voluntarily waive fees over a specified period of time in amounts designed to account for assets converted from certain funds to certain collective investment trusts.
Other Contractual Arrangements. The Board further considered that FMR has contractually agreed to reimburse the fund to the extent that total operating expenses, with certain exceptions, as a percentage of its average net assets, exceed 1.05% through February 29, 2024.
Fees Charged to Other Fidelity Clients. The Board also considered Fidelity fee structures and other information with respect to clients of Fidelity, such as other funds advised or subadvised by Fidelity, pension plan clients, and other institutional clients with similar mandates. The Board noted that a joint ad hoc committee created by it and the boards of other Fidelity funds periodically reviews and compares Fidelity's institutional investment advisory business with its business of providing services to the Fidelity funds and also noted the most recent findings of the committee. The Board noted that the committee's review included a consideration of the differences in services provided, fees charged, and costs incurred, as well as competition in the markets serving the different categories of clients.
Based on its review, the Board concluded that the fund's management fee is fair and reasonable in light of the services that the fund receives and the other factors considered. Further, based on its review of total expense ratios and fees charged to other Fidelity clients, the Board concluded that the fund's total expense ratio was reasonable in light of the services that the fund and its shareholders receive and the other factors considered.
Costs of the Services and Profitability. The Board considered the revenues earned and the expenses incurred by Fidelity in conducting the business of developing, marketing, distributing, managing, administering and servicing the fund and servicing the fund's shareholders. The Board also considered the level of Fidelity's profits in respect of all the Fidelity funds.
On an annual basis, Fidelity presents to the Board information about the profitability of its relationships with the fund. Fidelity calculates profitability information for each fund, as well as aggregate profitability information for groups of Fidelity funds and all Fidelity funds, using a series of detailed revenue and cost allocation methodologies which originate with the books and records of Fidelity on which Fidelity's audited financial statements are based. The Audit Committee of the Board reviews any significant changes from the prior year's methodologies and the full Board approves such changes.
A public accounting firm has been engaged annually by the Board as part of the Board's assessment of Fidelity's profitability analysis. The engagement includes the review and assessment of the methodologies used by Fidelity in determining the revenues and expenses attributable to Fidelity's fund business, and completion of agreed-upon procedures in respect of the mathematical accuracy of certain fund profitability information and its conformity to established allocation methodologies. After considering the reports issued under the engagement and information provided by Fidelity, the Board concluded that while other allocation methods may also be reasonable, Fidelity's profitability methodologies are reasonable in all material respects.
The Board also reviewed Fidelity's non-fund businesses and potential indirect benefits such businesses may have received as a result of their association with Fidelity's fund business (i.e., fall-out benefits) as well as cases where Fidelity's affiliates may benefit from the funds' business. The Board considered areas where potential indirect benefits to the Fidelity funds from their relationships with Fidelity may exist. The Board's consideration of these matters was informed by the findings of a joint ad hoc committee created by it and the boards of other Fidelity funds to evaluate potential fall-out benefits.
The Board considered the costs of the services provided by and the profits realized by Fidelity in connection with the operation of the fund and was satisfied that the profitability was not excessive.
Economies of Scale. The Board considered whether there have been economies of scale in respect of the management of the Fidelity funds, whether the Fidelity funds (including the fund) have appropriately benefited from any such economies of scale, and whether there is potential for realization of any further economies of scale. The Board considered the extent to which the fund will benefit from economies of scale as assets grow through increased services to the fund, through waivers or reimbursements, or through fee or expense ratio reductions. The Board also noted that a committee (the Economies of Scale Committee) created by it and the boards of other Fidelity funds periodically analyzes whether Fidelity attains economies of scale in respect of the management and servicing of the Fidelity funds, whether the Fidelity funds have appropriately benefited from such economies of scale, and whether there is potential for realization of any further economies of scale.
The Board recognized that the fund's management contract incorporates a "group fee" structure, which provides for lower group fee rates as total "group assets" increase, and for higher group fee rates as total "group assets" decrease ("group assets" as defined in the management contract). FMR calculates the group fee rates based on a tiered asset "breakpoint" schedule that varies based on asset class. The Board considered that the group fee is designed to deliver the benefits of economies of scale to fund shareholders when total Fidelity fund assets increase, even if assets of any particular fund are unchanged or have declined, because some portion of Fidelity's costs are attributable to services provided to all Fidelity funds, and all funds benefit if those costs can be allocated among more assets. The Board further considered that Fidelity agreed to impose a temporary fee waiver in the form of additional breakpoints to the current breakpoint schedule. The Board concluded that, given the group fee structure, fund shareholders will benefit from lower management fees as "group assets" increase at the fund complex level, regardless of whether Fidelity achieves any such economies of scale.
The Board concluded, taking into account the analysis of the Economies of Scale Committee, that economies of scale, if any, are being appropriately shared between fund shareholders and Fidelity.
Additional Information Requested by the Board. In order to develop fully the factual basis for consideration of the Fidelity funds' advisory contracts, the Board requested and received additional information on certain topics, including: (i) fund flow and performance trends, in particular the underperformance of certain funds and strategies, and Fidelity's long-term strategies for certain funds, including any consideration of fund liquidations or mergers; (ii) the operation of performance fees and competitor use of performance fees; (iii) Fidelity's pricing philosophy compared to competitors; (iv) fund profitability methodology and data; (v) evaluation of competitive fund data and peer group classifications and fee and expense comparisons; (vi) the management fee and expense structures for different funds and classes and information about the differences between various fee and expense structures; (vii) group fee breakpoints and related voluntary fee waivers; and (viii) information regarding other accounts managed by Fidelity and the funds' sub-advisory arrangements.
Conclusion. Based on its evaluation of all of the conclusions noted above, and after considering all factors it believed relevant, the Board, including the Independent Trustees, concluded that the advisory and sub-advisory fee arrangements are fair and reasonable in light of all of the surrounding circumstances and that the fund's Advisory Contracts should be renewed through July 31, 2024.
1.938162.111
GED-ANN-1223
Fidelity® Diversified International K6 Fund
Annual Report
October 31, 2023
Contents
To view a fund's proxy voting guidelines and proxy voting record for the 12-month period ended June 30, visit http://www.fidelity.com/proxyvotingresults or visit the Securities and Exchange Commission's (SEC) web site at http://www.sec.gov.
You may also call 1-800-835-5092 to request a free copy of the proxy voting guidelines.
Standard & Poor's, S&P and S&P 500 are registered service marks of The McGraw-Hill Companies, Inc. and have been licensed for use by Fidelity Distributors Corporation.
Other third-party marks appearing herein are the property of their respective owners.
All other marks appearing herein are registered or unregistered trademarks or service marks of FMR LLC or an affiliated company. © 2023 FMR LLC. All rights reserved.
This report and the financial statements contained herein are submitted for the general information of the shareholders of the Fund. This report is not authorized for distribution to prospective investors in the Fund unless preceded or accompanied by an effective prospectus.
A fund files its complete schedule of portfolio holdings with the SEC for the first and third quarters of each fiscal year on Form N-PORT. Forms N-PORT are available on the SEC's web site at http://www.sec.gov. A fund's Forms N-PORT may be reviewed and copied at the SEC's Public Reference Room in Washington, DC. Information regarding the operation of the SEC's Public Reference Room may be obtained by calling 1-800-SEC-0330.
For a complete list of a fund's portfolio holdings, view the most recent holdings listing, semiannual report, or annual report on Fidelity's web site at http://www.fidelity.com, http://www.institutional.fidelity.com, or http://www.401k.com, as applicable.
NOT FDIC INSURED •MAY LOSE VALUE •NO BANK GUARANTEE
Neither the Fund nor Fidelity Distributors Corporation is a bank.
Average annual total return reflects the change in the value of an investment, assuming reinvestment of distributions from dividend income and capital gains (the profits earned upon the sale of securities that have grown in value, if any) and assuming a constant rate of performance each year. The hypothetical investment and the average annual total returns do not reflect the deduction of taxes that a shareholder would pay on fund distributions or the redemption of fund shares. During periods of reimbursement by Fidelity, a fund's total return will be greater than it would be had the reimbursement not occurred. How a fund did yesterday is no guarantee of how it will do tomorrow.
| Average Annual Total Returns |
| | | | |
Periods ended October 31, 2023 | Past 1 year | Past 5 years | Life of Fund A |
| Fidelity® Diversified International K6 Fund | 12.12% | 5.70% | 3.92% |
A From May 25, 2017
| $10,000 Over Life of Fund |
| |
Let's say hypothetically that $10,000 was invested in Fidelity® Diversified International K6 Fund, on May 25, 2017, when the fund started. The chart shows how the value of your investment would have changed, and also shows how the MSCI EAFE Index performed over the same period. |
|
|
Market Recap:
International (non-U.S.) equities gained 12.27% for the 12 months ending October 31, 2023, according to the MSCI ACWI (All Country World Index) ex USA Index, as global economic expansion and a slowing in the pace of inflation in some markets provided a favorable backdrop for risk assets. After returning -15.86% in 2022, the index's upturn has been largely driven by a narrow set of companies in the information technology and communication services sectors, in part due to excitement for generative artificial intelligence applications. The index gained 14.07% year to date through July, including strong gains in both June (+4.50%) and July (+4.07%). The rally for international equities sputtered for the next three months (-11.33%) amid a stalling pattern in disinflationary trends, heightened global recession and geopolitical risks, soaring yields on longer-term U.S. government bonds and particularly weak economic conditions in the eurozone and China. The three-month decline left non-U.S. stocks up 1.15% year to date through October. Currency fluctuation also helped bolster non-U.S. equity performance overall. For the full 12 months, nearly all regions advanced, with Europe ex U.K. (+18%) and Japan (+17%) leading, whereas Canada (-0.38%) lagged by the widest margin. Each of the 11 sectors advanced, with information technology (+21%) and consumer discretionary (+19%) leading the way. Energy and industrials each rose about 14%. Conversely, four defensive-oriented sectors lagged by the widest margin: real estate (+4%), health care (+6%), consumer staples (+7%) and utilities (+8%).
Comments from Portfolio Manager Bill Bower:
For the fiscal year ending October 31, 2023, the fund gained about 12%, versus 14.65% for the benchmark MSCI EAFE Index (Net MA). From a regional standpoint, stock picks in Europe ex U.K., primarily in France, and a non-benchmark allocation to Canada detracted from the fund's relative result. By sector, security selection was the primary detractor, especially within financials. Stock picking in industrials also hurt. Also hurting our result were stock selection in energy and health care. Lastly, the fund's position in cash was a notable detractor. The fund's non-benchmark stake in First Quantum Minerals returned -34% and was the biggest individual relative detractor. Not owning Mitsubishi UFJ Financial Group, a benchmark component that gained approximately 83%, was a second notable relative detractor. Another notable relative detractor this period was avoiding HSBC Holdings, a benchmark component that gained roughly 48%. In contrast, from a regional standpoint, underweights in Europe ex U.K., primarily in Switzerland, and Asia Pacific ex Japan, primarily in Australia, contributed to the fund's performance versus the benchmark. By sector, the biggest contributor to performance versus the benchmark was an underweight in consumer staples. An overweight in financials, primarily within the insurance industry, and an underweight in communication services also boosted the fund's relative performance. The fund's non-benchmark stake in B&M European Value Retail gained about 85% and was the top individual relative contributor. A second notable relative contributor was an overweight in BAE Systems (+47%). An overweight in Hitachi (+40%) also helped. Hitachi was among our biggest holdings. Notable changes in positioning include decreased exposure to the health care sector and a higher allocation to materials.
The views expressed above reflect those of the portfolio manager(s) only through the end of the period as stated on the cover of this report and do not necessarily represent the views of Fidelity or any other person in the Fidelity organization. Any such views are subject to change at any time based upon market or other conditions and Fidelity disclaims any responsibility to update such views. These views may not be relied on as investment advice and, because investment decisions for a Fidelity fund are based on numerous factors, may not be relied on as an indication of trading intent on behalf of any Fidelity fund.
Top Holdings (% of Fund's net assets) |
| |
| ASML Holding NV (depository receipt) (Netherlands, Semiconductors & Semiconductor Equipment) | 2.8 | |
| Novo Nordisk A/S Series B (Denmark, Pharmaceuticals) | 2.5 | |
| LVMH Moet Hennessy Louis Vuitton SE (France, Textiles, Apparel & Luxury Goods) | 2.4 | |
| HDFC Bank Ltd. (India, Banks) | 2.1 | |
| AstraZeneca PLC (United Kingdom) (United Kingdom, Pharmaceuticals) | 1.9 | |
| Linde PLC (United States of America, Chemicals) | 1.9 | |
| Hitachi Ltd. (Japan, Industrial Conglomerates) | 1.9 | |
| RELX PLC (Euronext N.V.) (United Kingdom, Professional Services) | 1.8 | |
| Nestle SA (Reg. S) (United States of America, Food Products) | 1.8 | |
| Shin-Etsu Chemical Co. Ltd. (Japan, Chemicals) | 1.5 | |
| | 20.6 | |
| |
| Market Sectors (% of Fund's net assets) |
| |
| Financials | 23.6 | |
| Industrials | 19.5 | |
| Information Technology | 13.9 | |
| Health Care | 9.6 | |
| Consumer Discretionary | 8.6 | |
| Materials | 7.6 | |
| Energy | 5.7 | |
| Consumer Staples | 5.6 | |
| Real Estate | 0.4 | |
| Communication Services | 0.4 | |
| |
Asset Allocation (% of Fund's net assets) |
|
|
Geographic Diversification (% of Fund's net assets) |
|
* Includes Short-Term investments and Net Other Assets (Liabilities). Percentages are adjusted for the effect of derivatives, if applicable. |
| |
Showing Percentage of Net Assets
| Common Stocks - 94.5% |
| | | Shares | Value ($) |
| Australia - 1.4% | | | |
| Aristocrat Leisure Ltd. | | 555,563 | 13,655,799 |
| Flutter Entertainment PLC (a) | | 96,200 | 15,089,338 |
| Glencore PLC | | 4,784,752 | 25,344,022 |
TOTAL AUSTRALIA | | | 54,089,159 |
| Belgium - 0.6% | | | |
| KBC Group NV | | 417,578 | 22,931,459 |
| Canada - 7.1% | | | |
| Alimentation Couche-Tard, Inc. Class A (multi-vtg.) | | 658,082 | 35,823,768 |
| Cameco Corp. | | 377,665 | 15,449,746 |
| Canadian Natural Resources Ltd. | | 781,539 | 49,628,501 |
| Canadian Pacific Kansas City Ltd. | | 282,429 | 20,043,986 |
| Constellation Software, Inc. | | 21,533 | 43,167,085 |
| Constellation Software, Inc. warrants 8/22/28 (a)(b) | | 23,868 | 2 |
| Franco-Nevada Corp. | | 180,321 | 21,936,292 |
| GFL Environmental, Inc. | | 815,655 | 23,507,177 |
| Imperial Oil Ltd. | | 374,815 | 21,360,468 |
| Ivanhoe Mines Ltd. (a) | | 1,566,714 | 11,546,290 |
| Lumine Group, Inc. | | 67,474 | 848,564 |
| MEG Energy Corp. (a) | | 685,909 | 13,552,484 |
| Thomson Reuters Corp. | | 136,904 | 16,398,863 |
| Tourmaline Oil Corp. (c) | | 183,604 | 9,708,802 |
TOTAL CANADA | | | 282,972,028 |
| China - 1.0% | | | |
| Anta Sports Products Ltd. | | 363,124 | 4,106,748 |
| Chervon Holdings Ltd. | | 1,416,248 | 3,488,289 |
| Li Ning Co. Ltd. | | 1,456,501 | 4,463,307 |
| NXP Semiconductors NV | | 161,869 | 27,911,072 |
TOTAL CHINA | | | 39,969,416 |
| Denmark - 3.7% | | | |
| Carlsberg A/S Series B | | 129,917 | 15,482,627 |
| DSV A/S | | 207,621 | 30,964,706 |
| Novo Nordisk A/S Series B | | 1,051,779 | 101,471,679 |
TOTAL DENMARK | | | 147,919,012 |
| France - 10.0% | | | |
| Air Liquide SA | | 218,870 | 37,503,867 |
| Airbus Group NV | | 231,895 | 31,091,604 |
| AXA SA | | 941,920 | 27,909,490 |
| BNP Paribas SA | | 634,829 | 36,505,223 |
| Capgemini SA | | 237,774 | 42,021,511 |
| Edenred SA | | 167,578 | 8,908,269 |
| EssilorLuxottica SA | | 222,388 | 40,153,084 |
| Legrand SA | | 245,577 | 21,243,978 |
| LVMH Moet Hennessy Louis Vuitton SE | | 133,923 | 95,879,570 |
| Pernod Ricard SA | | 249,625 | 44,241,475 |
| Sartorius Stedim Biotech | | 8,760 | 1,636,434 |
| Thales SA | | 79,918 | 11,766,696 |
| Worldline SA (a)(d) | | 155,000 | 1,964,786 |
TOTAL FRANCE | | | 400,825,987 |
| Germany - 6.2% | | | |
| Allianz SE | | 248,347 | 58,173,433 |
| Bayer AG | | 186,382 | 8,053,299 |
| Deutsche Borse AG | | 148,299 | 24,409,491 |
| DHL Group | | 859,252 | 33,421,256 |
| Hannover Reuck SE | | 126,632 | 27,909,975 |
| Infineon Technologies AG | | 562,569 | 16,432,764 |
| Merck KGaA | | 223,929 | 33,728,306 |
| Muenchener Rueckversicherungs-Gesellschaft AG in Muenchen | | 73,535 | 29,450,095 |
| SAP SE | | 30,300 | 4,064,210 |
| Siemens Healthineers AG (d) | | 254,239 | 12,460,556 |
TOTAL GERMANY | | | 248,103,385 |
| Greece - 0.1% | | | |
| Piraeus Financial Holdings SA (a) | | 1,677,838 | 4,953,144 |
| Hong Kong - 1.4% | | | |
| AIA Group Ltd. | | 6,455,989 | 56,062,569 |
| India - 3.5% | | | |
| Axis Bank Ltd. | | 1,195,509 | 14,102,591 |
| Fairfax India Holdings Corp. (a)(d) | | 598,691 | 7,298,043 |
| HDFC Bank Ltd. | | 4,825,351 | 85,598,182 |
| HDFC Standard Life Insurance Co. Ltd. (d) | | 531,100 | 3,944,195 |
| Reliance Industries Ltd. | | 1,037,211 | 28,512,533 |
TOTAL INDIA | | | 139,455,544 |
| Indonesia - 1.0% | | | |
| PT Bank Central Asia Tbk | | 37,865,723 | 20,861,009 |
| PT Bank Rakyat Indonesia (Persero) Tbk | | 66,613,980 | 20,829,119 |
TOTAL INDONESIA | | | 41,690,128 |
| Ireland - 0.9% | | | |
| Kingspan Group PLC (Ireland) | | 282,056 | 18,945,190 |
| Ryanair Holdings PLC sponsored ADR (a) | | 107,507 | 9,428,364 |
| Smurfit Kappa Group PLC | | 231,105 | 7,516,920 |
TOTAL IRELAND | | | 35,890,474 |
| Israel - 0.4% | | | |
| NICE Ltd. sponsored ADR (a) | | 91,811 | 14,171,028 |
| Italy - 1.4% | | | |
| FinecoBank SpA | | 1,573,445 | 18,504,943 |
| UniCredit SpA | | 1,477,163 | 37,031,908 |
TOTAL ITALY | | | 55,536,851 |
| Japan - 16.3% | | | |
| Bandai Namco Holdings, Inc. | | 462,156 | 9,575,187 |
| BayCurrent Consulting, Inc. | | 274,573 | 6,893,637 |
| CUC, Inc. (a)(c) | | 22,306 | 382,503 |
| Daikin Industries Ltd. | | 49,962 | 7,203,468 |
| Fast Retailing Co. Ltd. | | 18,284 | 4,048,012 |
| FUJIFILM Holdings Corp. | | 508,525 | 27,815,201 |
| Fujitsu Ltd. | | 87,118 | 11,285,923 |
| Hitachi Ltd. | | 1,169,359 | 74,121,724 |
| Hoya Corp. | | 491,893 | 47,353,861 |
| Itochu Corp. | | 1,142,349 | 41,148,589 |
| Keyence Corp. | | 107,081 | 41,453,059 |
| Marui Group Co. Ltd. | | 128,076 | 2,025,284 |
| Minebea Mitsumi, Inc. | | 1,792,123 | 28,099,240 |
| Misumi Group, Inc. | | 763,427 | 11,557,264 |
| Nomura Research Institute Ltd. | | 480,186 | 12,604,861 |
| NSD Co. Ltd. | | 71,558 | 1,245,030 |
| ORIX Corp. | | 1,565,026 | 28,462,113 |
| Persol Holdings Co. Ltd. | | 9,783,682 | 14,669,809 |
| Relo Group, Inc. | | 783,842 | 7,771,075 |
| Renesas Electronics Corp. (a) | | 415,559 | 5,458,625 |
| Resona Holdings, Inc. | | 838,003 | 4,477,720 |
| Seven & i Holdings Co. Ltd. | | 320,832 | 11,754,871 |
| Shin-Etsu Chemical Co. Ltd. | | 2,044,411 | 61,134,796 |
| SMC Corp. | | 70,713 | 32,652,656 |
| SMS Co., Ltd. | | 124,238 | 1,971,398 |
| Sony Group Corp. | | 628,762 | 52,274,572 |
| Sumitomo Mitsui Financial Group, Inc. | | 912,654 | 43,997,205 |
| Suzuki Motor Corp. | | 290,487 | 11,274,385 |
| TechnoPro Holdings, Inc. | | 378,985 | 7,508,015 |
| TIS, Inc. | | 425,160 | 9,104,739 |
| Tokyo Electron Ltd. | | 249,184 | 32,926,599 |
TOTAL JAPAN | | | 652,251,421 |
| Korea (South) - 0.8% | | | |
| Samsung Electronics Co. Ltd. | | 648,979 | 32,254,965 |
| Netherlands - 6.4% | | | |
| Argenx SE (a) | | 46,253 | 21,756,560 |
| ASML Holding NV (depository receipt) | | 189,338 | 113,377,486 |
| BE Semiconductor Industries NV | | 103,317 | 10,636,808 |
| IMCD NV | | 225,900 | 27,129,314 |
| Shell PLC (London) | | 752,082 | 24,237,236 |
| Wolters Kluwer NV | | 457,624 | 58,638,067 |
TOTAL NETHERLANDS | | | 255,775,471 |
| Norway - 0.5% | | | |
| Equinor ASA | | 608,020 | 20,382,786 |
| Spain - 1.7% | | | |
| Banco Santander SA (Spain) | | 5,179,761 | 18,996,124 |
| CaixaBank SA | | 6,354,425 | 25,834,177 |
| Industria de Diseno Textil SA (c) | | 616,105 | 21,219,368 |
TOTAL SPAIN | | | 66,049,669 |
| Sweden - 2.0% | | | |
| Autoliv, Inc. | | 106,961 | 9,802,976 |
| Indutrade AB | | 1,825,977 | 32,250,211 |
| Investor AB (B Shares) | | 2,104,083 | 38,528,689 |
| Kry International AB (a)(b)(e) | | 663 | 24,336 |
TOTAL SWEDEN | | | 80,606,212 |
| Switzerland - 2.0% | | | |
| Compagnie Financiere Richemont SA Series A | | 113,713 | 13,415,350 |
| Partners Group Holding AG | | 12,089 | 12,715,611 |
| Sika AG | | 120,184 | 28,657,076 |
| UBS Group AG | | 329,368 | 7,683,383 |
| Zurich Insurance Group Ltd. | | 36,943 | 17,487,666 |
TOTAL SWITZERLAND | | | 79,959,086 |
| Taiwan - 1.3% | | | |
| ECLAT Textile Co. Ltd. | | 293,000 | 4,659,868 |
| Taiwan Semiconductor Manufacturing Co. Ltd. sponsored ADR | | 525,964 | 45,395,953 |
TOTAL TAIWAN | | | 50,055,821 |
| United Kingdom - 13.4% | | | |
| 3i Group PLC | | 529,928 | 12,494,425 |
| AstraZeneca PLC (United Kingdom) | | 622,605 | 77,952,482 |
| B&M European Value Retail SA | | 5,335,219 | 34,291,051 |
| BAE Systems PLC | | 3,844,379 | 51,692,989 |
| Beazley PLC | | 1,790,680 | 11,198,000 |
| Big Yellow Group PLC | | 793,696 | 9,212,864 |
| Cab Payments Holdings Ltd. | | 1,161,225 | 863,783 |
| Compass Group PLC | | 1,219,995 | 30,757,765 |
| Diageo PLC | | 1,116,581 | 42,224,655 |
| Games Workshop Group PLC | | 74,962 | 8,997,366 |
| Hiscox Ltd. | | 1,739,409 | 19,830,865 |
| JD Sports Fashion PLC | | 4,800,334 | 7,439,072 |
| London Stock Exchange Group PLC | | 408,415 | 41,207,070 |
| RELX PLC (Euronext N.V.) | | 2,041,166 | 71,077,627 |
| Rentokil Initial PLC | | 5,051,782 | 25,726,153 |
| RS GROUP PLC | | 1,169,966 | 9,630,022 |
| Sage Group PLC | | 1,980,395 | 23,363,032 |
| Smith & Nephew PLC | | 1,764,794 | 19,750,046 |
| Standard Chartered PLC (United Kingdom) | | 2,014,049 | 15,422,248 |
| Starling Bank Ltd. Series D (a)(b)(e) | | 2,406,800 | 8,600,514 |
| WPP PLC | | 1,664,054 | 14,329,554 |
TOTAL UNITED KINGDOM | | | 536,061,583 |
| United States of America - 11.1% | | | |
| Aon PLC | | 56,587 | 17,508,018 |
| CRH PLC | | 441,406 | 23,718,971 |
| Experian PLC | | 577,173 | 17,474,986 |
| Ferguson PLC | | 272,478 | 40,834,911 |
| ICON PLC (a) | | 84,126 | 20,523,379 |
| Linde PLC | | 195,261 | 74,620,944 |
| Marsh & McLennan Companies, Inc. | | 219,822 | 41,689,242 |
| Marvell Technology, Inc. | | 542,203 | 25,602,826 |
| MasterCard, Inc. Class A | | 77,728 | 29,252,933 |
| Nestle SA (Reg. S) | | 646,727 | 69,742,251 |
| S&P Global, Inc. | | 96,149 | 33,585,807 |
| Sanofi SA | | 38,755 | 3,519,195 |
| Schlumberger Ltd. | | 822,478 | 45,779,125 |
TOTAL UNITED STATES OF AMERICA | | | 443,852,588 |
| Zambia - 0.3% | | | |
| First Quantum Minerals Ltd. | | 948,150 | 10,987,395 |
| TOTAL COMMON STOCKS (Cost $3,266,330,749) | | | 3,772,807,181 |
| | | | |
| Preferred Stocks - 0.4% |
| | | Shares | Value ($) |
| Convertible Preferred Stocks - 0.4% | | | |
| Estonia - 0.1% | | | |
| Bolt Technology OU Series E (a)(b)(e) | | 21,668 | 2,559,102 |
| United States of America - 0.3% | | | |
| Wasabi Holdings, Inc.: | | | |
| Series C (a)(b)(e) | | 743,562 | 8,513,785 |
| Series D (a)(b)(e) | | 304,085 | 4,555,193 |
| | | | 13,068,978 |
TOTAL CONVERTIBLE PREFERRED STOCKS | | | 15,628,080 |
| Nonconvertible Preferred Stocks - 0.0% | | | |
| Sweden - 0.0% | | | |
| Kry International AB Series E (a)(b)(e) | | 3,828 | 140,509 |
| TOTAL PREFERRED STOCKS (Cost $19,777,817) | | | 15,768,589 |
| | | | |
| Money Market Funds - 4.9% |
| | | Shares | Value ($) |
| Fidelity Cash Central Fund 5.40% (f) | | 177,705,198 | 177,740,739 |
| Fidelity Securities Lending Cash Central Fund 5.40% (f)(g) | | 18,662,558 | 18,664,424 |
| TOTAL MONEY MARKET FUNDS (Cost $196,404,541) | | | 196,405,163 |
| | | | |
| TOTAL INVESTMENT IN SECURITIES - 99.8% (Cost $3,482,513,107) | 3,984,980,933 |
NET OTHER ASSETS (LIABILITIES) - 0.2% | 6,626,620 |
| NET ASSETS - 100.0% | 3,991,607,553 |
| | |
Legend
| (c) | Security or a portion of the security is on loan at period end. |
| (d) | Security exempt from registration under Rule 144A of the Securities Act of 1933. These securities may be resold in transactions exempt from registration, normally to qualified institutional buyers. At the end of the period, the value of these securities amounted to $25,667,580 or 0.6% of net assets. |
| (e) | Restricted securities (including private placements) - Investment in securities not registered under the Securities Act of 1933 (excluding 144A issues). At the end of the period, the value of restricted securities (excluding 144A issues) amounted to $24,393,439 or 0.6% of net assets. |
| (f) | Affiliated fund that is generally available only to investment companies and other accounts managed by Fidelity Investments. The rate quoted is the annualized seven-day yield of the fund at period end. A complete unaudited listing of the fund's holdings as of its most recent quarter end is available upon request. In addition, each Fidelity Central Fund's financial statements, which are not covered by the Fund's Report of Independent Registered Public Accounting Firm, are available on the SEC's website or upon request. |
| (g) | Investment made with cash collateral received from securities on loan. |
| Additional information on each restricted holding is as follows: |
| Security | Acquisition Date | Acquisition Cost ($) |
| Bolt Technology OU Series E | 1/03/22 | 5,629,271 |
| | | |
| Kry International AB | 5/14/21 | 287,945 |
| | | |
| Kry International AB Series E | 5/14/21 | 1,750,058 |
| | | |
| Starling Bank Ltd. Series D | 6/18/21 - 4/05/22 | 4,642,638 |
| | | |
| Wasabi Holdings, Inc. Series C | 3/31/21 | 8,078,504 |
| | | |
| Wasabi Holdings, Inc. Series D | 9/09/22 | 4,319,984 |
| | | |
Affiliated Central Funds
Fiscal year to date information regarding the Fund's investments in Fidelity Central Funds, including the ownership percentage, is presented below.
| Affiliate | Value, beginning of period ($) | Purchases ($) | Sales Proceeds ($) | Dividend Income ($) | Realized Gain (loss) ($) | Change in Unrealized appreciation (depreciation) ($) | Value, end of period ($) | % ownership, end of period |
| Fidelity Cash Central Fund 5.40% | 165,418,854 | 686,636,647 | 674,314,761 | 8,326,560 | - | (1) | 177,740,739 | 0.4% |
| Fidelity Securities Lending Cash Central Fund 5.40% | 39,190,867 | 948,112,530 | 968,638,973 | 448,664 | - | - | 18,664,424 | 0.1% |
| Total | 204,609,721 | 1,634,749,177 | 1,642,953,734 | 8,775,224 | - | (1) | 196,405,163 | |
| | | | | | | | | |
Amounts in the dividend income column in the above table include any capital gain distributions from underlying funds, which are presented in the corresponding line item in the Statement of Operations, if applicable.
Amounts in the dividend income column for Fidelity Securities Lending Cash Central Fund represents the income earned on investing cash collateral, less rebates paid to borrowers and any lending agent fees associated with the loan, plus any premium payments received for lending certain types of securities.
Amounts included in the purchases and sales proceeds columns may include in-kind transactions, if applicable.
Investment Valuation
The following is a summary of the inputs used, as of October 31, 2023, involving the Fund's assets and liabilities carried at fair value. The inputs or methodology used for valuing securities may not be an indication of the risk associated with investing in those securities. For more information on valuation inputs, and their aggregation into the levels used below, please refer to the Investment Valuation section in the accompanying Notes to Financial Statements.
| Valuation Inputs at Reporting Date: |
| Description | Total ($) | Level 1 ($) | Level 2 ($) | Level 3 ($) |
Investments in Securities: | | | | |
|
| Equities: | | | | |
Communication Services | 14,329,554 | - | 14,329,554 | - |
Consumer Discretionary | 344,438,023 | 96,839,171 | 247,598,852 | - |
Consumer Staples | 219,269,647 | 80,065,243 | 139,204,404 | - |
Energy | 228,611,681 | 155,479,126 | 73,132,555 | - |
Financials | 939,208,801 | 386,683,083 | 543,925,204 | 8,600,514 |
Health Care | 388,741,384 | 108,501,759 | 280,239,625 | - |
Industrials | 777,091,900 | 421,511,376 | 355,580,524 | - |
Information Technology | 556,934,268 | 304,473,854 | 236,667,487 | 15,792,927 |
Materials | 302,966,573 | 178,983,888 | 123,982,685 | - |
Real Estate | 16,983,939 | 9,212,864 | 7,771,075 | - |
|
| Money Market Funds | 196,405,163 | 196,405,163 | - | - |
| Total Investments in Securities: | 3,984,980,933 | 1,938,155,527 | 2,022,431,965 | 24,393,441 |
| Statement of Assets and Liabilities |
| | | | October 31, 2023 |
| | | | | |
| Assets | | | | |
| Investment in securities, at value (including securities loaned of $17,417,418) - See accompanying schedule: | | | | |
Unaffiliated issuers (cost $3,286,108,566) | $ | 3,788,575,770 | | |
Fidelity Central Funds (cost $196,404,541) | | 196,405,163 | | |
| | | | | |
| | | | | |
| Total Investment in Securities (cost $3,482,513,107) | | | $ | 3,984,980,933 |
| Cash | | | | 1,297,184 |
| Receivable for investments sold | | | | 10,038,995 |
| Receivable for fund shares sold | | | | 5,399,636 |
| Dividends receivable | | | | 7,560,184 |
| Reclaims receivable | | | | 9,796,371 |
| Distributions receivable from Fidelity Central Funds | | | | 685,627 |
| Other receivables | | | | 195,082 |
Total assets | | | | 4,019,954,012 |
| Liabilities | | | | |
| Payable to custodian bank | $ | 7,987 | | |
| Payable for investments purchased | | 4,329,925 | | |
| Payable for fund shares redeemed | | 1,450,285 | | |
| Accrued management fee | | 2,018,723 | | |
| Deferred taxes | | 1,719,886 | | |
| Other payables and accrued expenses | | 155,229 | | |
| Collateral on securities loaned | | 18,664,424 | | |
| Total Liabilities | | | | 28,346,459 |
| Net Assets | | | $ | 3,991,607,553 |
| Net Assets consist of: | | | | |
| Paid in capital | | | $ | 3,761,137,493 |
| Total accumulated earnings (loss) | | | | 230,470,060 |
| Net Assets | | | $ | 3,991,607,553 |
Net Asset Value, offering price and redemption price per share ($3,991,607,553 ÷ 329,713,938 shares) | | | $ | 12.11 |
| Statement of Operations |
| | | | Year ended October 31, 2023 |
| Investment Income | | | | |
| Dividends | | | $ | 89,951,762 |
| Income from Fidelity Central Funds (including $448,664 from security lending) | | | | 8,775,224 |
| Income before foreign taxes withheld | | | $ | 98,726,986 |
| Less foreign taxes withheld | | | | (8,102,976) |
| Total Income | | | | 90,624,010 |
| Expenses | | | | |
| Management fee | $ | 25,085,776 | | |
| Independent trustees' fees and expenses | | 22,997 | | |
| Total expenses before reductions | | 25,108,773 | | |
| Expense reductions | | (780) | | |
| Total expenses after reductions | | | | 25,107,993 |
| Net Investment income (loss) | | | | 65,516,017 |
| Realized and Unrealized Gain (Loss) | | | | |
| Net realized gain (loss) on: | | | | |
| Investment Securities: | | | | |
| Unaffiliated issuers (net of foreign taxes of $830,792) | | (49,295,762) | | |
| Redemptions in-kind | | 20,002,624 | | |
| Foreign currency transactions | | (487,056) | | |
| Total net realized gain (loss) | | | | (29,780,194) |
| Change in net unrealized appreciation (depreciation) on: | | | | |
| Investment Securities: | | | | |
| Unaffiliated issuers(net of decrease in deferred foreign taxes of $1,271,800) | | 394,803,232 | | |
| Fidelity Central Funds | | (1) | | |
| Assets and liabilities in foreign currencies | | 607,280 | | |
| Total change in net unrealized appreciation (depreciation) | | | | 395,410,511 |
| Net gain (loss) | | | | 365,630,317 |
| Net increase (decrease) in net assets resulting from operations | | | $ | 431,146,334 |
| Statement of Changes in Net Assets |
| |
| | Year ended October 31, 2023 | | Year ended October 31, 2022 |
| Increase (Decrease) in Net Assets | | | | |
| Operations | | | | |
| Net investment income (loss) | $ | 65,516,017 | $ | 46,223,928 |
| Net realized gain (loss) | | (29,780,194) | | (175,880,317) |
| Change in net unrealized appreciation (depreciation) | | 395,410,511 | | (1,165,207,771) |
| Net increase (decrease) in net assets resulting from operations | | 431,146,334 | | (1,294,864,160) |
| Distributions to shareholders | | (31,800,731) | | (40,087,762) |
| | | | | |
| Share transactions | | | | |
| Proceeds from sales of shares | | 1,065,259,894 | | 1,845,177,962 |
| Reinvestment of distributions | | 31,800,731 | | 40,087,762 |
| Cost of shares redeemed | | (988,215,923) | | (1,028,832,082) |
| | | | | |
Net increase (decrease) in net assets resulting from share transactions | | 108,844,702 | | 856,433,642 |
| Total increase (decrease) in net assets | | 508,190,305 | | (478,518,280) |
| | | | | |
| Net Assets | | | | |
| Beginning of period | | 3,483,417,248 | | 3,961,935,528 |
| End of period | $ | 3,991,607,553 | $ | 3,483,417,248 |
| | | | | |
| Other Information | | | | |
| Shares | | | | |
| Sold | | 84,964,159 | | 141,560,986 |
| Issued in reinvestment of distributions | | 2,652,271 | | 2,683,250 |
| Redeemed | | (77,852,831) | | (80,800,526) |
| Net increase (decrease) | | 9,763,599 | | 63,443,710 |
| | | | | |
Financial Highlights
| Fidelity® Diversified International K6 Fund |
| |
| Years ended October 31, | | 2023 | | 2022 | | 2021 | | 2020 | | 2019 |
Selected Per-Share Data | | | | | | | | | | |
| Net asset value, beginning of period | $ | 10.89 | $ | 15.45 | $ | 11.96 | $ | 11.08 | $ | 9.69 |
| Income from Investment Operations | | | | | | | | | | |
Net investment income (loss) A,B | | .20 | | .15 | | .10 | | .08 | | .16 |
| Net realized and unrealized gain (loss) | | 1.12 | | (4.56) | | 3.47 | | .98 | | 1.36 |
| Total from investment operations | | 1.32 | | (4.41) | | 3.57 | | 1.06 | | 1.52 |
| Distributions from net investment income | | (.10) | | (.15) | | (.08) | | (.15) | | (.13) |
| Distributions from net realized gain | | - | | - | | - | | (.03) | | - |
| Total distributions | | (.10) | | (.15) | | (.08) | | (.18) | | (.13) |
| Net asset value, end of period | $ | 12.11 | $ | 10.89 | $ | 15.45 | $ | 11.96 | $ | 11.08 |
Total Return C | | 12.12% | | (28.81)% | | 30.00% | | 9.70% | | 15.89% |
Ratios to Average Net Assets B,D,E | | | | | | | | | | |
| Expenses before reductions | | .60% | | .60% | | .60% | | .60% | | .60% |
| Expenses net of fee waivers, if any | | .60% | | .60% | | .60% | | .60% | | .60% |
| Expenses net of all reductions | | .60% | | .60% | | .60% | | .59% | | .59% |
| Net investment income (loss) | | 1.57% | | 1.21% | | .73% | | .73% | | 1.59% |
| Supplemental Data | | | | | | | | | | |
| Net assets, end of period (000 omitted) | $ | 3,991,608 | $ | 3,483,417 | $ | 3,961,936 | $ | 3,102,294 | $ | 2,977,388 |
Portfolio turnover rate F | | 25% G | | 31% G | | 30% G | | 34% | | 48% G |
ACalculated based on average shares outstanding during the period.
BNet investment income (loss) is affected by the timing of the declaration of dividends by any underlying mutual funds or exchange-traded funds (ETFs). Net investment income (loss) of any mutual funds or ETFs is not included in the Fund's net investment income (loss) ratio.
CTotal returns would have been lower if certain expenses had not been reduced during the applicable periods shown.
DFees and expenses of any underlying mutual funds or exchange-traded funds (ETFs) are not included in the Fund's expense ratio. The Fund indirectly bears its proportionate share of these expenses. For additional expense information related to investments in Fidelity Central Funds, please refer to the "Investments in Fidelity Central Funds" note found in the Notes to Financial Statements section of the most recent Annual or Semi-Annual report.
EExpense ratios reflect operating expenses of the class. Expenses before reductions do not reflect amounts reimbursed, waived, or reduced through arrangements with the investment adviser, brokerage services, or other offset arrangements, if applicable, and do not represent the amount paid by the class during periods when reimbursements, waivers or reductions occur.
FAmount does not include the portfolio activity of any underlying mutual funds or exchange-traded funds (ETFs).
GPortfolio turnover rate excludes securities received or delivered in-kind.
For the period ended October 31, 2023
1. Organization.
Fidelity Diversified International K6 Fund (the Fund) is a fund of Fidelity Investment Trust (the Trust) and is authorized to issue an unlimited number of shares. Share transactions on the Statement of Changes in Net Assets may contain exchanges between affiliated funds. The Trust is registered under the Investment Company Act of 1940, as amended (the 1940 Act), as an open-end management investment company organized as a Massachusetts business trust. Shares generally are available only to employer-sponsored retirement plans that are recordkept by Fidelity, or to certain employer-sponsored retirement plans that are not recordkept by Fidelity.
2. Investments in Fidelity Central Funds.
Funds may invest in Fidelity Central Funds, which are open-end investment companies generally available only to other investment companies and accounts managed by the investment adviser and its affiliates. The Schedule of Investments lists any Fidelity Central Funds held as an investment as of period end, but does not include the underlying holdings of each Fidelity Central Fund. An investing fund indirectly bears its proportionate share of the expenses of the underlying Fidelity Central Funds.
Based on its investment objective, each Fidelity Central Fund may invest or participate in various investment vehicles or strategies that are similar to those of the investing fund. These strategies are consistent with the investment objectives of the investing fund and may involve certain economic risks which may cause a decline in value of each of the Fidelity Central Funds and thus a decline in the value of the investing fund.
| Fidelity Central Fund | Investment Manager | Investment Objective | Investment Practices | Expense RatioA |
| Fidelity Money Market Central Funds | Fidelity Management & Research Company LLC (FMR) | Each fund seeks to obtain a high level of current income consistent with the preservation of capital and liquidity. | Short-term Investments | Less than .005% |
A Expenses expressed as a percentage of average net assets and are as of each underlying Central Fund's most recent annual or semi-annual shareholder report.
A complete unaudited list of holdings for each Fidelity Central Fund is available upon request or at the Securities and Exchange Commission website at www.sec.gov. In addition, the financial statements of the Fidelity Central Funds which contain the significant accounting policies (including investment valuation policies) of those funds, and are not covered by the Report of Independent Registered Public Accounting Firm, are available on the Securities and Exchange Commission website or upon request.
3. Significant Accounting Policies.
The Fund is an investment company and applies the accounting and reporting guidance of the Financial Accounting Standards Board (FASB) Accounting Standards Codification Topic 946 Financial Services - Investment Companies. The financial statements have been prepared in conformity with accounting principles generally accepted in the United States of America (GAAP), which require management to make certain estimates and assumptions at the date of the financial statements. Actual results could differ from those estimates. Subsequent events, if any, through the date that the financial statements were issued have been evaluated in the preparation of the financial statements. The Fund's Schedule of Investments lists any underlying mutual funds or exchange-traded funds (ETFs) but does not include the underlying holdings of these funds. The following summarizes the significant accounting policies of the Fund:
Investment Valuation. Investments are valued as of 4:00 p.m. Eastern time on the last calendar day of the period. The Board of Trustees (the Board) has designated the Fund's investment adviser as the valuation designee responsible for the fair valuation function and performing fair value determinations as needed. The investment adviser has established a Fair Value Committee (the Committee) to carry out the day-to-day fair valuation responsibilities and has adopted policies and procedures to govern the fair valuation process and the activities of the Committee. In accordance with these fair valuation policies and procedures, which have been approved by the Board, the Fund attempts to obtain prices from one or more third party pricing services or brokers to value its investments. When current market prices, quotations or currency exchange rates are not readily available or reliable, investments will be fair valued in good faith by the Committee, in accordance with the policies and procedures. Factors used in determining fair value vary by investment type and may include market or investment specific events, transaction data, estimated cash flows, and market observations of comparable investments. The frequency that the fair valuation procedures are used cannot be predicted and they may be utilized to a significant extent. The Committee manages the Fund's fair valuation practices and maintains the fair valuation policies and procedures. The Fund's investment adviser reports to the Board information regarding the fair valuation process and related material matters.
The Fund categorizes the inputs to valuation techniques used to value its investments into a disclosure hierarchy consisting of three levels as shown below:
Level 1 - unadjusted quoted prices in active markets for identical investments
Level 2 - other significant observable inputs (including quoted prices for similar investments, interest rates, prepayment speeds, etc.)
Level 3 - unobservable inputs (including the Fund's own assumptions based on the best information available)
Valuation techniques used to value the Fund's investments by major category are as follows:
Equity securities, including restricted securities, for which market quotations are readily available, are valued at the last reported sale price or official closing price as reported by a third party pricing service on the primary market or exchange on which they are traded and are categorized as Level 1 in the hierarchy. In the event there were no sales during the day or closing prices are not available, securities are valued at the last quoted bid price or may be valued using the last available price and are generally categorized as Level 2 in the hierarchy. For foreign equity securities, when market or security specific events arise, comparisons to the valuation of American Depositary Receipts (ADRs), futures contracts, ETFs and certain indexes as well as quoted prices for similar securities may be used and would be categorized as Level 2 in the hierarchy. For equity securities, including restricted securities, where observable inputs are limited, assumptions about market activity and risk are used and these securities may be categorized as Level 3 in the hierarchy.
Investments in open-end mutual funds, including the Fidelity Central Funds, are valued at their closing net asset value (NAV) each business day and are categorized as Level 1 in the hierarchy.
Changes in valuation techniques may result in transfers in or out of an assigned level within the disclosure hierarchy. The aggregate value of investments by input level as of October 31, 2023 is included at the end of the Fund's Schedule of Investments.
Foreign Currency. Certain Funds may use foreign currency contracts to facilitate transactions in foreign-denominated securities. Gains and losses from these transactions may arise from changes in the value of the foreign currency or if the counterparties do not perform under the contracts' terms.
Foreign-denominated assets, including investment securities, and liabilities are translated into U.S. dollars at the exchange rates at period end. Purchases and sales of investment securities, income and dividends received, and expenses denominated in foreign currencies are translated into U.S. dollars at the exchange rate in effect on the transaction date.
The effects of exchange rate fluctuations on investments are included with the net realized and unrealized gain (loss) on investment securities. Other foreign currency transactions resulting in realized and unrealized gain (loss) are disclosed separately.
Investment Transactions and Income. For financial reporting purposes, the Fund's investment holdings and NAV include trades executed through the end of the last business day of the period. The NAV per share for processing shareholder transactions is calculated as of the close of business of the New York Stock Exchange (NYSE), normally 4:00 p.m. Eastern time and includes trades executed through the end of the prior business day. Gains and losses on securities sold are determined on the basis of identified cost and include proceeds received from litigation. Commissions paid to certain brokers with whom the investment adviser, or its affiliates, places trades on behalf of a fund include an amount in addition to trade execution, which may be rebated back to a fund. Any such rebates are included in net realized gain (loss) on investments in the Statement of Operations. Dividend income is recorded on the ex-dividend date, except for certain dividends from foreign securities where the ex-dividend date may have passed, which are recorded as soon as the Fund is informed of the ex-dividend date. Non-cash dividends included in dividend income, if any, are recorded at the fair market value of the securities received. Income and capital gain distributions from Fidelity Central Funds, if any, are recorded on the ex-dividend date. Investment income is recorded net of foreign taxes withheld where recovery of such taxes is uncertain. Funds may file withholding tax reclaims in certain jurisdictions to recover a portion of amounts previously withheld. Any withholding tax reclaims income is included in the Statement of Operations in foreign taxes withheld. Any receivables for withholding tax reclaims are included in the Statement of Assets and Liabilities in reclaims receivable. The Fund has filed tax reclaims for previously withheld taxes on dividends earned in certain European Union (EU) countries. These additional filings are subject to various administrative proceedings by the local jurisdictions' tax authorities within the EU, as well as a number of related judicial proceedings. Income recognized for EU reclaims is included with other reclaims in the Statement of Operations in foreign taxes withheld. These reclaims are recorded when the amount is known and there are no significant uncertainties on collectability.
Expenses. Expenses directly attributable to a fund are charged to that fund. Expenses attributable to more than one fund are allocated among the respective funds on the basis of relative net assets or other appropriate methods. Expenses included in the accompanying financial statements reflect the expenses of that fund and do not include any expenses associated with any underlying mutual funds or exchange-traded funds. Although not included in a fund's expenses, a fund indirectly bears its proportionate share of these expenses through the net asset value of each underlying mutual fund or exchange-traded fund. Expense estimates are accrued in the period to which they relate and adjustments are made when actual amounts are known.
Income Tax Information and Distributions to Shareholders. Each year, the Fund intends to qualify as a regulated investment company under Subchapter M of the Internal Revenue Code, including distributing substantially all of its taxable income and realized gains. As a result, no provision for U.S. Federal income taxes is required. As of October 31, 2023, the Fund did not have any unrecognized tax benefits in the financial statements; nor is the Fund aware of any tax positions for which it is reasonably possible that the total amounts of unrecognized tax benefits will significantly change in the next twelve months. The Fund files a U.S. federal tax return, in addition to state and local tax returns as required. The Fund's federal income tax returns are subject to examination by the Internal Revenue Service (IRS) for a period of three fiscal years after they are filed. State and local tax returns may be subject to examination for an additional fiscal year depending on the jurisdiction. Foreign taxes are provided for based on the Fund's understanding of the tax rules and rates that exist in the foreign markets in which it invests. The Fund is subject to a tax imposed on capital gains by certain countries in which it invests. An estimated deferred tax liability for net unrealized appreciation on the applicable securities is included in Deferred taxes on the Statement of Assets & Liabilities.
Distributions are declared and recorded on the ex-dividend date. Income and capital gain distributions are determined in accordance with income tax regulations, which may differ from GAAP.
Capital accounts within the financial statements are adjusted for permanent book-tax differences. These adjustments have no impact on net assets or the results of operations. Capital accounts are not adjusted for temporary book-tax differences which will reverse in a subsequent period.
Book-tax differences are primarily due to foreign currency transactions, certain foreign taxes, passive foreign investment companies (PFIC), redemptions in-kind, capital loss carryforwards, and losses deferred due to wash sales.
As of period end, the cost and unrealized appreciation (depreciation) in securities, and derivatives if applicable, for federal income tax purposes were as follows:
| Gross unrealized appreciation | $722,705,742 |
| Gross unrealized depreciation | (228,863,228) |
| Net unrealized appreciation (depreciation) | $493,842,514 |
| Tax Cost | $3,491,138,419 |
The tax-based components of distributable earnings as of period end were as follows:
| Undistributed ordinary income | $67,443,685 |
| Capital loss carryforward | $(328,752,646) |
| Net unrealized appreciation (depreciation) on securities and other investments | $493,498,907 |
Capital loss carryforwards are only available to offset future capital gains of the Fund to the extent provided by regulations and may be limited. The capital loss carryforward information presented below, including any applicable limitation, is estimated as of fiscal period end and is subject to adjustment.
Short-term | $(309,317,588) |
Long-term | (19,435,058) |
| Total capital loss carryforward | $(328,752,646) |
The tax character of distributions paid was as follows:
| | October 31, 2023 | October 31, 2022 |
| Ordinary Income | $31,800,731 | $40,087,762 |
Restricted Securities (including Private Placements). Funds may invest in securities that are subject to legal or contractual restrictions on resale. These securities generally may be resold in transactions exempt from registration or to the public if the securities are registered. Disposal of these securities may involve time-consuming negotiations and expense, and prompt sale at an acceptable price may be difficult. Information regarding restricted securities held at period end is included at the end of the Schedule of Investments, if applicable.
4. Purchases and Sales of Investments.
Purchases and sales of securities, other than short-term securities and in-kind transactions, as applicable, are noted in the table below.
| | Purchases ($) | Sales ($) |
| Fidelity Diversified International K6 Fund | 982,754,296 | 1,139,783,032 |
Unaffiliated Redemptions In-Kind. Shares that were redeemed in-kind for investments, including accrued interest and cash, if any, are shown in the table below. The net realized gain or loss on investments delivered through in-kind redemptions is included in the "Net realized gain (loss) on: Redemptions in-kind" line in the accompanying Statement of Operations. The amount of the in-kind redemptions is included in share transactions in the accompanying Statement of Changes in Net Assets. There was no gain or loss for federal income tax purposes.
| | Shares | Total net realized gain or loss ($) | Total Proceeds ($) |
| Fidelity Diversified International K6 Fund | 4,361,678 | 20,002,624 | 56,570,957 |
Unaffiliated Exchanges In-Kind. Shares that were exchanged for investments, including accrued interest and cash, if any, are shown in the table below. The amount of in-kind exchanges is included in share transactions in the accompanying Statement of Changes in Net Assets.
| | Shares | Total Proceeds ($) |
| Fidelity Diversified International K6 Fund | 26,855,137 | 332,235,591 |
Prior Fiscal Year Unaffiliated Redemptions In-Kind. Shares that were redeemed in-kind for investments, including accrued interest and cash, if any, are shown in the table below; along with realized gain or loss on investments delivered through in-kind redemptions. The amount of the in-kind redemptions is included in share transactions in the accompanying Statement of Changes in Net Assets. There was no gain or loss for federal income tax purposes.
| | Shares | Total net realized gain or loss ($) | Total Proceeds ($) |
| Fidelity Diversified International K6 Fund | 4,786,586 | 30,753,342 | 72,038,115 |
Prior Year Unaffiliated Exchanges In-Kind. Shares that were exchanged for investments, including accrued interest and cash, if any, are shown in the table below. The amount of in-kind exchanges is included in share transactions in the accompanying Statement of Changes in Net Assets.
| | Shares | Total Proceeds ($) |
| Fidelity Diversified International K6 Fund | 75,623,497 | 961,127,384 |
5. Fees and Other Transactions with Affiliates.
Management Fee. Fidelity Management & Research Company LLC (the investment adviser) and its affiliates provide the Fund with investment management related services for which the Fund pays a monthly management fee that is based on an annual rate of .60% of average net assets. Under the management contract, the investment adviser or an affiliate pays all other expenses of the Fund, excluding fees and expenses of the independent Trustees, and certain miscellaneous expenses such as proxy and shareholder meeting expenses.
Brokerage Commissions. A portion of portfolio transactions were placed with brokerage firms which are affiliates of the investment adviser. Brokerage commissions are included in net realized gain (loss) and change in net unrealized appreciation (depreciation) in the Statement of Operations. The commissions paid to these affiliated firms were as follows:
| | Amount |
| Fidelity Diversified International K6 Fund | $1,185 |
Interfund Trades. Funds may purchase from or sell securities to other Fidelity Funds under procedures adopted by the Board. The procedures have been designed to ensure these interfund trades are executed in accordance with Rule 17a-7 of the 1940 Act. Any interfund trades are included within the respective purchases and sales amounts shown in the Purchases and Sales of Investments note. Interfund trades during the period are noted in the table below.
| | Purchases ($) | Sales ($) | Realized Gain (Loss) ($) |
| Fidelity Diversified International K6 Fund | 26,206,163 | 42,719,919 | (3,015,409) |
6. Committed Line of Credit.
Certain Funds participate with other funds managed by the investment adviser or an affiliate in a $4.25 billion credit facility (the "line of credit") to be utilized for temporary or emergency purposes to fund shareholder redemptions or for other short-term liquidity purposes. The commitment fees on the pro-rata portion of the line of credit are borne by the investment adviser. During the period, there were no borrowings on this line of credit.
7. Security Lending.
Funds lend portfolio securities from time to time in order to earn additional income. Lending agents are used, including National Financial Services (NFS), an affiliate of the investment adviser. Pursuant to a securities lending agreement, NFS will receive a fee, which is capped at 9.9% of a fund's daily lending revenue, for its services as lending agent. A fund may lend securities to certain qualified borrowers, including NFS. On the settlement date of the loan, a fund receives collateral (in the form of U.S. Treasury obligations, letters of credit and/or cash) against the loaned securities and maintains collateral in an amount not less than 100% of the market value of the loaned securities during the period of the loan. The market value of the loaned securities is determined at the close of business of a fund and any additional required collateral is delivered to a fund on the next business day. A fund or borrower may terminate the loan at any time, and if the borrower defaults on its obligation to return the securities loaned because of insolvency or other reasons, a fund may apply collateral received from the borrower against the obligation. A fund may experience delays and costs in recovering the securities loaned. Any cash collateral received is invested in the Fidelity Securities Lending Cash Central Fund. Any loaned securities are identified as such in the Schedule of Investments, and the value of loaned securities and cash collateral at period end, as applicable, are presented in the Statement of Assets and Liabilities. Security lending income represents the income earned on investing cash collateral, less rebates paid to borrowers and any lending agent fees associated with the loan, plus any premium payments received for lending certain types of securities. Security lending income is presented in the Statement of Operations as a component of income from Fidelity Central Funds. Affiliated security lending activity, if any, was as follows:
| | Total Security Lending Fees Paid to NFS | Security Lending Income From Securities Loaned to NFS | Value of Securities Loaned to NFS at Period End |
| Fidelity Diversified International K6 Fund | $48,292 | $ - | $- |
8. Expense Reductions.
Through arrangements with the Fund's custodian, credits realized as a result of certain uninvested cash balances were used to reduce the Fund's expenses by $780.
9. Other.
A fund's organizational documents provide former and current trustees and officers with a limited indemnification against liabilities arising in connection with the performance of their duties to the fund. In the normal course of business, a fund may also enter into contracts that provide general indemnifications. A fund's maximum exposure under these arrangements is unknown as this would be dependent on future claims that may be made against a fund. The risk of material loss from such claims is considered remote.
10.Risk and Uncertainties.
Many factors affect a fund's performance. Developments that disrupt global economies and financial markets, such as pandemics, epidemics, outbreaks of infectious diseases, war, terrorism, and environmental disasters, may significantly affect a fund's investment performance. The effects of these developments to a fund will be impacted by the types of securities in which a fund invests, the financial condition, industry, economic sector, and geographic location of an issuer, and a fund's level of investment in the securities of that issuer. Significant concentrations in security types, issuers, industries, sectors, and geographic locations may magnify the factors that affect a fund's performance.
To the Board of Trustees of Fidelity Investment Trust and the Shareholders of Fidelity Diversified International K6 Fund:
Opinion on the Financial Statements and Financial Highlights
We have audited the accompanying statement of assets and liabilities of Fidelity Diversified International K6 Fund (the "Fund"), a fund of Fidelity Investment Trust, including the schedule of investments, as of October 31, 2023, the related statement of operations for the year then ended, the statement of changes in net assets for each of the two years in the period then ended, the financial highlights for each of the five years in the period then ended, and the related notes. In our opinion, the financial statements and financial highlights present fairly, in all material respects, the financial position of the Fund as of October 31, 2023, and the results of its operations for the year then ended, the changes in its net assets for each of the two years in the period then ended, and the financial highlights for each of the five years in the period then ended in conformity with accounting principles generally accepted in the United States of America.
Basis for Opinion
These financial statements and financial highlights are the responsibility of the Fund's management. Our responsibility is to express an opinion on the Fund's financial statements and financial highlights based on our audits. We are a public accounting firm registered with the Public Company Accounting Oversight Board (United States) (PCAOB) and are required to be independent with respect to the Fund in accordance with the U.S. federal securities laws and the applicable rules and regulations of the Securities and Exchange Commission and the PCAOB.
We conducted our audits in accordance with the standards of the PCAOB. Those standards require that we plan and perform the audit to obtain reasonable assurance about whether the financial statements and financial highlights are free of material misstatement, whether due to error or fraud. The Fund is not required to have, nor were we engaged to perform, an audit of its internal control over financial reporting. As part of our audits, we are required to obtain an understanding of internal control over financial reporting but not for the purpose of expressing an opinion on the effectiveness of the Fund's internal control over financial reporting. Accordingly, we express no such opinion.
Our audits included performing procedures to assess the risks of material misstatement of the financial statements and financial highlights, whether due to error or fraud, and performing procedures that respond to those risks. Such procedures included examining, on a test basis, evidence regarding the amounts and disclosures in the financial statements and financial highlights. Our audits also included evaluating the accounting principles used and significant estimates made by management, as well as evaluating the overall presentation of the financial statements and financial highlights. Our procedures included confirmation of securities owned as of October 31, 2023, by correspondence with the custodian and brokers; when replies were not received from brokers, we performed other auditing procedures. We believe that our audits provide a reasonable basis for our opinion.
/s/ Deloitte & Touche LLP
Boston, Massachusetts
December 13, 2023
We have served as the auditor of one or more of the Fidelity investment companies since 1999.
The Trustees, Members of the Advisory Board (if any), and officers of the trust and fund, as applicable, are listed below. The Board of Trustees governs the fund and is responsible for protecting the interests of shareholders. The Trustees are experienced executives who meet periodically throughout the year to oversee the fund's activities, review contractual arrangements with companies that provide services to the fund, oversee management of the risks associated with such activities and contractual arrangements, and review the fund's performance. Except for Jonathan Chiel, each of the Trustees oversees 322 funds. Mr. Chiel oversees 191 funds.
The Trustees hold office without limit in time except that (a) any Trustee may resign; (b) any Trustee may be removed by written instrument, signed by at least two-thirds of the number of Trustees prior to such removal; (c) any Trustee who requests to be retired or who has become incapacitated by illness or injury may be retired by written instrument signed by a majority of the other Trustees; and (d) any Trustee may be removed at any special meeting of shareholders by a two-thirds vote of the outstanding voting securities of the trust. Each Trustee who is not an interested person (as defined in the 1940 Act) of the trust and the fund is referred to herein as an Independent Trustee. Each Independent Trustee shall retire not later than the last day of the calendar year in which his or her 75th birthday occurs. The Independent Trustees may waive this mandatory retirement age policy with respect to individual Trustees. Officers and Advisory Board Members hold office without limit in time, except that any officer or Advisory Board Member may resign or may be removed by a vote of a majority of the Trustees at any regular meeting or any special meeting of the Trustees. Except as indicated, each individual has held the office shown or other offices in the same company for the past five years.
The fund's Statement of Additional Information (SAI) includes more information about the Trustees. To request a free copy, call Fidelity at 1-800-835-5092.
Experience, Skills, Attributes, and Qualifications of the Trustees. The Governance and Nominating Committee has adopted a statement of policy that describes the experience, qualifications, attributes, and skills that are necessary and desirable for potential Independent Trustee candidates (Statement of Policy). The Board believes that each Trustee satisfied at the time he or she was initially elected or appointed a Trustee, and continues to satisfy, the standards contemplated by the Statement of Policy. The Governance and Nominating Committee also engages professional search firms to help identify potential Independent Trustee candidates who have the experience, qualifications, attributes, and skills consistent with the Statement of Policy. From time to time, additional criteria based on the composition and skills of the current Independent Trustees, as well as experience or skills that may be appropriate in light of future changes to board composition, business conditions, and regulatory or other developments, have also been considered by the professional search firms and the Governance and Nominating Committee. In addition, the Board takes into account the Trustees' commitment and participation in Board and committee meetings, as well as their leadership of standing and ad hoc committees throughout their tenure.
In determining that a particular Trustee was and continues to be qualified to serve as a Trustee, the Board has considered a variety of criteria, none of which, in isolation, was controlling. The Board believes that, collectively, the Trustees have balanced and diverse experience, qualifications, attributes, and skills, which allow the Board to operate effectively in governing the fund and protecting the interests of shareholders. Information about the specific experience, skills, attributes, and qualifications of each Trustee, which in each case led to the Board's conclusion that the Trustee should serve (or continue to serve) as a trustee of the fund, is provided below.
Board Structure and Oversight Function. Robert A. Lawrence is an interested person and currently serves as Chair. The Trustees have determined that an interested Chair is appropriate and benefits shareholders because an interested Chair has a personal and professional stake in the quality and continuity of services provided to the fund. Independent Trustees exercise their informed business judgment to appoint an individual of their choosing to serve as Chair, regardless of whether the Trustee happens to be independent or a member of management. The Independent Trustees have determined that they can act independently and effectively without having an Independent Trustee serve as Chair and that a key structural component for assuring that they are in a position to do so is for the Independent Trustees to constitute a substantial majority for the Board. The Independent Trustees also regularly meet in executive session. David M. Thomas serves as Lead Independent Trustee and as such (i) acts as a liaison between the Independent Trustees and management with respect to matters important to the Independent Trustees and (ii) with management prepares agendas for Board meetings.
Fidelity® funds are overseen by different Boards of Trustees. The fund's Board oversees Fidelity's high income and certain equity funds, and other Boards oversee Fidelity's alternative investment, investment-grade bond, money market, asset allocation, and other equity funds. The asset allocation funds may invest in Fidelity® funds overseen by the fund's Board. The use of separate Boards, each with its own committee structure, allows the Trustees of each group of Fidelity® funds to focus on the unique issues of the funds they oversee, including common research, investment, and operational issues. On occasion, the separate Boards establish joint committees to address issues of overlapping consequences for the Fidelity® funds overseen by each Board.
The Trustees operate using a system of committees to facilitate the timely and efficient consideration of all matters of importance to the Trustees, the fund, and fund shareholders and to facilitate compliance with legal and regulatory requirements and oversight of the fund's activities and associated risks. The Board, acting through its committees, has charged FMR and its affiliates with (i) identifying events or circumstances the occurrence of which could have demonstrably adverse effects on the fund's business and/or reputation; (ii) implementing processes and controls to lessen the possibility that such events or circumstances occur or to mitigate the effects of such events or circumstances if they do occur; and (iii) creating and maintaining a system designed to evaluate continuously business and market conditions in order to facilitate the identification and implementation processes described in (i) and (ii) above. Because the day-to-day operations and activities of the fund are carried out by or through FMR, its affiliates, and other service providers, the fund's exposure to risks is mitigated but not eliminated by the processes overseen by the Trustees. While each of the Board's committees has responsibility for overseeing different aspects of the fund's activities, oversight is exercised primarily through the Operations, Audit, and Compliance Committees. Appropriate personnel, including but not limited to the fund's Chief Compliance Officer (CCO), FMR's internal auditor, the independent accountants, the fund's Treasurer and portfolio management personnel, make periodic reports to the Board's committees, as appropriate, including an annual review of Fidelity's risk management program for the Fidelity® funds. The responsibilities of each standing committee, including their oversight responsibilities, are described further under "Standing Committees of the Trustees."
Interested Trustees*:
Correspondence intended for a Trustee who is an interested person may be sent to Fidelity Investments, 245 Summer Street, Boston, Massachusetts 02210.
Name, Year of Birth; Principal Occupations and Other Relevant Experience+
Jonathan Chiel (1957)
Year of Election or Appointment: 2016
Trustee
Mr. Chiel also serves as Trustee of other Fidelity® funds. Mr. Chiel is General Counsel (2012-present) and Head of Legal, Risk and Compliance (2022-present). Mr Chiel serves as Executive Vice President and General Counsel for FMR LLC (diversified financial services company, 2012-present) and Director and President for OH Company LLC (holding company, 2018-present). Previously, Mr. Chiel served as general counsel (2004-2012) and senior vice president and deputy general counsel (2000-2004) for John Hancock Financial Services; a partner with Choate, Hall & Stewart (1996-2000) (law firm); and an Assistant United States Attorney for the United States Attorney's Office of the District of Massachusetts (1986-95), including Chief of the Criminal Division (1993-1995). Mr. Chiel is a director on the boards of the Boston Bar Foundation and the Maimonides School.
Bettina Doulton (1964)
Year of Election or Appointment: 2021
Trustee
Ms. Doulton also serves as Trustee of other Fidelity® funds. Prior to her retirement, Ms. Doulton served in a variety of positions at Fidelity Investments, including as a managing director of research (2006-2007), portfolio manager to certain Fidelity® funds (1993-2005), equity analyst and portfolio assistant (1990-1993), and research assistant (1987-1990). Ms. Doulton currently owns and operates Phi Builders + Architects and Cellardoor Winery. Previously, Ms. Doulton served as a member of the Board of Brown Capital Management, LLC (2014-2018).
Robert A. Lawrence (1952)
Year of Election or Appointment: 2020
Trustee
Chair of the Board of Trustees
Mr. Lawrence also serves as Trustee of other funds. Previously, Mr. Lawrence served as a Trustee and Member of the Advisory Board of certain funds. Prior to his retirement in 2008, Mr. Lawrence served as Vice President of certain Fidelity® funds (2006-2008), Senior Vice President, Head of High Income Division of Fidelity Management & Research Company (investment adviser firm, 2006-2008), and President of Fidelity Strategic Investments (investment adviser firm, 2002-2005).
* Determined to be an "Interested Trustee" by virtue of, among other things, his or her affiliation with the trust or various entities under common control with FMR.
+ The information includes the Trustee's principal occupation during the last five years and other information relating to the experience, attributes, and skills relevant to the Trustee's qualifications to serve as a Trustee, which led to the conclusion that the Trustee should serve as a Trustee for the fund.
Independent Trustees:
Correspondence intended for an Independent Trustee may be sent to Fidelity Investments, P.O. Box 55235, Boston, Massachusetts 02205-5235.
Name, Year of Birth; Principal Occupations and Other Relevant Experience+
Thomas P. Bostick (1956)
Year of Election or Appointment: 2021
Trustee
Lieutenant General Bostick also serves as Trustee of other Fidelity® funds. Prior to his retirement, General Bostick (United States Army, Retired) held a variety of positions within the U.S. Army, including Commanding General and Chief of Engineers, U.S. Army Corps of Engineers (2012-2016) and Deputy Chief of Staff and Director of Human Resources, U.S. Army (2009-2012). General Bostick currently serves as a member of the Board and Finance and Governance & Sustainability Committees of CSX Corporation (transportation, 2020-present) and a member of the Board and Corporate Governance and Nominating Committee of Perma-Fix Environmental Services, Inc. (nuclear waste management, 2020-present). General Bostick serves as Chief Executive Officer of Bostick Global Strategies, LLC (consulting, 2016-present), as a member of the Board of HireVue, Inc. (video interview and assessment, 2020-present), as a member of the Board of Allonnia (biotechnology and engineering solutions, 2022-present) and on the Advisory Board of Solugen, Inc. (specialty bio-based chemicals manufacturer, 2022-present). Previously, General Bostick served as a Member of the Advisory Board of certain Fidelity® funds (2021), President, Intrexon Bioengineering (2018-2020) and Chief Operating Officer (2017-2020) and Senior Vice President of the Environment Sector (2016-2017) of Intrexon Corporation (biopharmaceutical company).
Dennis J. Dirks (1948)
Year of Election or Appointment: 2005
Trustee
Mr. Dirks also serves as Trustee of other Fidelity® funds. Prior to his retirement in May 2003, Mr. Dirks served as Chief Operating Officer and as a member of the Board of The Depository Trust & Clearing Corporation (financial markets infrastructure), President, Chief Operating Officer and a member of the Board of The Depository Trust Company (DTC), President and a member of the Board of the National Securities Clearing Corporation (NSCC), Chief Executive Officer and a member of the Board of the Government Securities Clearing Corporation and Chief Executive Officer and a member of the Board of the Mortgage-Backed Securities Clearing Corporation. Mr. Dirks currently serves as a member of the Finance Committee (2016-present) and Board (2017-present) and is Treasurer (2018-present) of the Asolo Repertory Theatre.
Donald F. Donahue (1950)
Year of Election or Appointment: 2018
Trustee
Mr. Donahue also serves as Trustee of other Fidelity® funds. Mr. Donahue serves as President and Chief Executive Officer of Miranda Partners, LLC (risk consulting for the financial services industry, 2012-present). Previously, Mr. Donahue served as Chief Executive Officer (2006-2012), Chief Operating Officer (2003-2006) and Managing Director, Customer Marketing and Development (1999-2003) of The Depository Trust & Clearing Corporation (financial markets infrastructure). Mr. Donahue currently serves as a member (2007-present) and Co-Chairman (2016-present) of the Board of United Way of New York. Mr. Donahue previously served as a member of the Advisory Board of certain Fidelity® funds (2015-2018) and as a member of the Board of The Leadership Academy (previously NYC Leadership Academy) (2012-2022).
Vicki L. Fuller (1957)
Year of Election or Appointment: 2020
Trustee
Ms. Fuller also serves as Trustee of other Fidelity® funds. Previously, Ms. Fuller served as a member of the Advisory Board of certain Fidelity® funds (2018-2020), Chief Investment Officer of the New York State Common Retirement Fund (2012-2018) and held a variety of positions at AllianceBernstein L.P. (global asset management, 1985-2012), including Managing Director (2006-2012) and Senior Vice President and Senior Portfolio Manager (2001-2006). Ms. Fuller currently serves as a member of the Board, Audit Committee and Nominating and Governance Committee of two Blackstone business development companies (2020-present), as a member of the Board of Treliant, LLC (consulting, 2019-present), as a member of the Board of Ariel Alternatives, LLC (private equity, 2022-present) and as a member of the Board and Chair of the Audit Committee of Gusto, Inc. (software, 2021-present). In addition, Ms. Fuller currently serves as a member of the Board of Roosevelt University (2019-present) and as a member of the Executive Board of New York University's Stern School of Business. Ms. Fuller previously served as a member of the Board, Audit Committee and Nominating and Governance Committee of The Williams Companies, Inc. (natural gas infrastructure, 2018-2021).
Patricia L. Kampling (1959)
Year of Election or Appointment: 2020
Trustee
Ms. Kampling also serves as Trustee of other Fidelity® funds. Prior to her retirement, Ms. Kampling served as Chairman of the Board and Chief Executive Officer (2012-2019), President and Chief Operating Officer (2011-2012) and Executive Vice President and Chief Financial Officer (2010-2011) of Alliant Energy Corporation. Ms. Kampling currently serves as a member of the Board, Finance Committee and Governance, Compensation and Nominating Committee of Xcel Energy Inc. (utilities company, 2020-present) and as a member of the Board, Audit, Finance and Risk Committee and Safety, Environmental, Technology and Operations Committee and Chair of the Executive Development and Compensation Committee of American Water Works Company, Inc. (utilities company, 2019-present). In addition, Ms. Kampling currently serves as a member of the Board of the Nature Conservancy, Wisconsin Chapter (2019-present). Previously, Ms. Kampling served as a Member of the Advisory Board of certain Fidelity® funds (2020), a member of the Board, Compensation Committee and Executive Committee and Chair of the Audit Committee of Briggs & Stratton Corporation (manufacturing, 2011-2021), a member of the Board of Interstate Power and Light Company (2012-2019) and Wisconsin Power and Light Company (2012-2019) (each a subsidiary of Alliant Energy Corporation) and as a member of the Board and Workforce Development Committee of the Business Roundtable (2018-2019).
Thomas A. Kennedy (1955)
Year of Election or Appointment: 2021
Trustee
Mr. Kennedy also serves as Trustee of other Fidelity® funds. Previously, Mr. Kennedy served as a Member of the Advisory Board of certain Fidelity® funds (2020) and held a variety of positions at Raytheon Company (aerospace and defense, 1983-2020), including Chairman and Chief Executive Officer (2014-2020) and Executive Vice President and Chief Operating Officer (2013-2014). Mr. Kennedy served as Executive Chairman of the Board of Directors of Raytheon Technologies Corporation (aerospace and defense, 2020-2021). Mr. Kennedy serves as a Director of the Board of Directors of Textron Inc. (aerospace and defense, 2023-present).
Oscar Munoz (1959)
Year of Election or Appointment: 2021
Trustee
Mr. Munoz also serves as Trustee of other Fidelity® funds. Prior to his retirement, Mr. Munoz served as Executive Chairman (2020-2021), Chief Executive Officer (2015-2020), President (2015-2016) and a member of the Board (2010-2021) of United Airlines Holdings, Inc. Mr. Munoz currently serves as a member of the Board of CBRE Group, Inc. (commercial real estate, 2020-present), a member of the Board of Univision Communications, Inc. (Hispanic media, 2020-present), a member of the Board of Archer Aviation Inc. (2021-present), a member of the Defense Business Board of the United States Department of Defense (2021-present) and a member of the Board of Salesforce.com, Inc. (cloud-based software, 2022-present). Previously, Mr. Munoz served as a Member of the Advisory Board of certain Fidelity® funds (2021).
David M. Thomas (1949)
Year of Election or Appointment: 2008
Trustee
Lead Independent Trustee
Mr. Thomas also serves as Trustee of other Fidelity® funds. Previously, Mr. Thomas served as Executive Chairman (2005-2006) and Chairman and Chief Executive Officer (2000-2005) of IMS Health, Inc. (pharmaceutical and healthcare information solutions). Mr. Thomas currently serves as a member of the Board of Fortune Brands Home and Security (home and security products, 2004-present) and as Director (2013-present) and Non-Executive Chairman of the Board (2022-present) of Interpublic Group of Companies, Inc. (marketing communication).
Susan Tomasky (1953)
Year of Election or Appointment: 2020
Trustee
Ms. Tomasky also serves as Trustee of other Fidelity® funds. Prior to her retirement, Ms. Tomasky served in various executive officer positions at American Electric Power Company, Inc. (1998-2011), including most recently as President of AEP Transmission (2007-2011). Ms. Tomasky currently serves as a member of the Board and Sustainability Committee and as Chair of the Audit Committee of Marathon Petroleum Corporation (2018-present) and as a member of the Board, Executive Committee, Corporate Governance Committee and Organization and Compensation Committee and as Lead Director of the Board of Public Service Enterprise Group, Inc. (utilities company, 2012-present) and as a member of the Board of its subsidiary company, Public Service Electric and Gas Co. (2021-present). In addition, Ms. Tomasky currently serves as a member (2009-present) and President (2020-present) of the Board of the Royal Shakespeare Company - America (2009-present), as a member of the Board of the Columbus Association for the Performing Arts (2011-present) and as a member of the Board and Kenyon in the World Committee of Kenyon College (2016-present). Previously, Ms. Tomasky served as a Member of the Advisory Board of certain Fidelity® funds (2020), as a member of the Board of the Columbus Regional Airport Authority (2007-2020), as a member of the Board (2011-2018) and Lead Independent Director (2015-2018) of Andeavor Corporation (previously Tesoro Corporation) (independent oil refiner and marketer) and as a member of the Board of Summit Midstream Partners LP (energy, 2012-2018).
Michael E. Wiley (1950)
Year of Election or Appointment: 2020
Trustee
Mr. Wiley also serves as Trustee of other Fidelity® funds. Previously, Mr. Wiley served as a member of the Advisory Board of certain Fidelity® funds (2018-2020), Chairman, President and CEO of Baker Hughes, Inc. (oilfield services, 2000-2004). Mr. Wiley also previously served as a member of the Board of Andeavor Corporation (independent oil refiner and marketer, 2005-2018), a member of the Board of Andeavor Logistics LP (natural resources logistics, 2015-2018) and a member of the Board of High Point Resources (exploration and production, 2005-2020).
+ The information includes the Trustee's principal occupation during the last five years and other information relating to the experience, attributes, and skills relevant to the Trustee's qualifications to serve as a Trustee, which led to the conclusion that the Trustee should serve as a Trustee for the fund.
Advisory Board Members and Officers:
Correspondence intended for a Member of the Advisory Board (if any) may be sent to Fidelity Investments, P.O. Box 55235, Boston, Massachusetts 02205-5235. Correspondence intended for an officer or Peter S. Lynch may be sent to Fidelity Investments, 245 Summer Street, Boston, Massachusetts 02210.
Name, Year of Birth; Principal Occupation
Vijay C. Advani (1960)
Year of Election or Appointment: 2023
Member of the Advisory Board
Mr. Advani also serves as Trustee or Member of the Advisory Board of other funds. Previously, Mr. Advani served as Executive Chairman (2020-2022), Chief Executive Officer (2017-2020) and Chief Operating Officer (2016-2017) of Nuveen (global investment manager). He also served in various capacities at Franklin Resources (global investment manager), including Co-President (2015-2016), Executive Vice President, Global Advisory Services (2008-2015), Head of Global Retail Distribution (2005-2008), Executive Managing Director, International Retail Development (2002-2005), Managing Director, Product Developments, Sales & Marketing, Asia, Eastern Europe and Africa (2000-2002) and President, Templeton Asset Management India (1995-2000). Mr. Advani also served as Senior Investment Officer of International Finance Corporation (private equity and venture capital arm of The World Bank, 1984-1995). Mr. Advani is Chairman Emeritus of the U.S. India Business Council (2018-present), a Director of The Global Impact Investing Network (2019-present), a Director of LOK Capital (Mauritius) (2022-present), a member of the Advisory Council of LOK Capital (2022-present), a Senior Advisor of Neuberger Berman (2021-present), a Senior Advisor of Seviora Holdings Pte. Ltd (Temasek-Singapore) (2021-present), a Director of Seviora Capital (Singapore) (2021-present) and an Advisor of EQUIAM (2021-present). Mr. Advani formerly served as a member of the Board of BowX Acquisition Corp. (special purpose acquisition company, 2020-2021), a member of the Board of Intellecap (advisory arm of The Aavishkaar Group, 2018-2020), a member of the Board of Nuveen Investments, Inc. (2017-2020) and a member of the Board of Docusign (software, 2016-2019).
Peter S. Lynch (1944)
Year of Election or Appointment: 2003
Member of the Advisory Board
Mr. Lynch also serves as a Member of the Advisory Board of other Fidelity® funds. Mr. Lynch is Vice Chairman and a Director of Fidelity Management & Research Company LLC (investment adviser firm). In addition, Mr. Lynch serves as a Trustee of Boston College and as the Chairman of the Inner-City Scholarship Fund. Previously, Mr. Lynch served as Vice Chairman and a Director of FMR Co., Inc. (investment adviser firm) and on the Special Olympics International Board of Directors (1997-2006).
Karen B. Peetz (1955)
Year of Election or Appointment: 2023
Member of the Advisory Board
Ms. Peetz also serves as a Member of the Advisory Board of other funds. Previously, Ms. Peetz served as Chief Administration Officer (2020-2023) of Citigroup Inc. (a diversified financial service company). She also served in various capacities at Bank of New York Mellon Corporation, including President (2013-2016), Vice Chairman, Senior Executive Vice President and Chief Executive Officer of Financial Markets & Treasury Services (2010-2013), Senior Executive Vice President and Chief Executive Officer of Global Corporate Trust (2003-2008), Senior Vice President and Division Manager of Global Payments & Trade Services (2002-2003) and Senior Vice President and Division Manager of Domestic Corporate Trust (1998-2002). Ms. Peetz also served in various capacities at Chase Manhattan Corporation (1982-1998), including Senior Vice President and Manager of Corporate Trust International Business (1996-1998), Managing Director and Manager of Corporate Trust Services (1994-1996) and Managing Director and Group Manager of Financial Institution Sales (1990-1993). Ms. Peetz currently serves as Chair of Amherst Holdings Advisory Council (2018-present), Trustee of Johns Hopkins University (2016-present), Chair of the Carey Business School Advisory Council, Member of the Johns Hopkins Medicine Board and Finance Committee and Chair of the Lyme and Tick Related Disease Institute Advisory Council. Ms. Peetz previously served as a member of the Board of Guardian Life Insurance Company of America (2019-2023), a member of the Board of Trane Technologies (2018-2022), a member of the Board of Wells Fargo Corp. (2017-2019), a member of the Board of SunCoke Energy Inc. (2012-2016), a member of the Board of Private Export Funding Corporation (2010-2016) and as a Trustee of Penn State University (2010-2014) and the United Way of New York City (2008-2010).
Heather Bonner (1977)
Year of Election or Appointment: 2023
Assistant Treasurer
Ms. Bonner also serves as an officer of other funds. Ms. Bonner is a Senior Vice President (2022-present) and is an employee of Fidelity Investments (2022-present). Ms. Bonner serves as Vice President, Treasurer, or Assistant Treasurer of certain Fidelity entities. Prior to joining Fidelity, Ms. Bonner served as Managing Director at AQR Capital Management (2013-2022) and was the Treasurer and Principal Financial Officer of the AQR Funds (2013-2022).
Craig S. Brown (1977)
Year of Election or Appointment: 2022
Deputy Treasurer
Mr. Brown also serves as an officer of other funds. Mr. Brown is a Vice President (2015-present) and is an employee of Fidelity Investments. Mr. Brown serves as Assistant Treasurer of FIMM, LLC (2021-present). Previously, Mr. Brown served as Assistant Treasurer of certain Fidelity® funds (2019-2022).
John J. Burke III (1964)
Year of Election or Appointment: 2018
Chief Financial Officer
Mr. Burke also serves as Chief Financial Officer of other funds. Mr. Burke is Head of Fidelity Fund and Investment Operations (2018-present) and is an employee of Fidelity Investments. Mr. Burke serves as President, Executive Vice President, or Director of certain Fidelity entities. Previously Mr. Burke served as head of Asset Management Investment Operations (2012-2018).
Margaret Carey (1973)
Year of Election or Appointment: 2023
Secretary and Chief Legal Officer (CLO)
Ms. Carey also serves as an officer of other funds and as CLO of certain Fidelity entities. Ms. Carey is a Senior Vice President, Deputy General Counsel (2019-present) and is an employee of Fidelity Investments.
William C. Coffey (1969)
Year of Election or Appointment: 2019
Assistant Secretary
Mr. Coffey also serves as Assistant Secretary of other funds. Mr. Coffey is a Senior Vice President, Deputy General Counsel (2010-present) and is an employee of Fidelity Investments. Previously, Mr. Coffey served as Secretary and CLO of certain funds (2018-2019); CLO, Secretary, or Senior Vice President of certain Fidelity entities and Assistant Secretary of certain funds (2009-2018).
Timothy M. Cohen (1969)
Year of Election or Appointment: 2018
Vice President
Mr. Cohen also serves as Vice President of other funds. Mr. Cohen is Co-Head of Equity (2018-present) and is an employee of Fidelity Investments. Mr. Cohen serves a Director of Fidelity Management & Research (Japan) Limited (investment adviser firm, 2016-present). Previously, Mr. Cohen served as Executive Vice President of Fidelity SelectCo, LLC (2019) and Head of Global Equity Research (2016-2018).
Jonathan Davis (1968)
Year of Election or Appointment: 2010
Assistant Treasurer
Mr. Davis also serves as an officer of other funds. Mr. Davis is a Vice President (2006-present) and is an employee of Fidelity Investments. Mr. Davis serves as Assistant Treasurer of certain Fidelity entities.
Laura M. Del Prato (1964)
Year of Election or Appointment: 2018
Assistant Treasurer
Ms. Del Prato also serves as an officer of other funds. Ms. Del Prato is a Senior Vice President (2017-present) and is an employee of Fidelity Investments. Ms. Del Prato serves as Vice President or Assistant Treasurer of certain Fidelity entities. Previously, Ms. Del Prato served as President and Treasurer of The North Carolina Capital Management Trust: Cash Portfolio and Term Portfolio (2018-2020).
Colm A. Hogan (1973)
Year of Election or Appointment: 2020
Assistant Treasurer
Mr. Hogan also serves as an officer of other funds. Mr. Hogan is a Vice President (2016-present) and is an employee of Fidelity Investments. Mr. Hogan serves as Assistant Treasurer of certain Fidelity entities. Previously, Mr. Hogan served as Deputy Treasurer of certain Fidelity® funds (2016-2020) and Assistant Treasurer of certain Fidelity® funds (2016-2018).
Pamela R. Holding (1964)
Year of Election or Appointment: 2018
Vice President
Ms. Holding also serves as Vice President of other funds. Ms. Holding is Co-Head of Equity (2018-present) and is an employee of Fidelity Investments. Previously, Ms. Holding served as Executive Vice President of Fidelity SelectCo, LLC (2019) and as Chief Investment Officer of Fidelity Institutional Asset Management (2013-2018).
Chris Maher (1972)
Year of Election or Appointment: 2020
Deputy Treasurer
Mr. Maher also serves as an officer of other funds. Mr. Maher is a Vice President (2008-present) and is an employee of Fidelity Investments. Mr. Maher serves as Assistant Treasurer of certain Fidelity entities. Previously, Mr. Maher served as Assistant Treasurer of certain funds (2013-2020).
Jason P. Pogorelec (1975)
Year of Election or Appointment: 2020
Chief Compliance Officer
Mr. Pogorelec also serves as Chief Compliance Officer of other funds. Mr. Pogorelec is a Senior Vice President of Asset Management Compliance (2020-present) and is an employee of Fidelity Investments. Mr. Pogorelec serves as Compliance Officer of Fidelity Management & Research Company LLC (investment adviser firm, 2023-present) and Ballyrock Investment Advisors LLC (2023-present). Previously, Mr. Pogorelec served as a Vice President, Associate General Counsel for Fidelity Investments (2010-2020) and Assistant Secretary of certain Fidelity® funds (2015-2020).
Brett Segaloff (1972)
Year of Election or Appointment: 2021
Anti-Money Laundering (AML) Officer
Mr. Segaloff also serves as AML Officer of other funds. Mr. Segaloff is a Vice President (2022-present) and is an employee of Fidelity Investments. Mr. Segaloff serves as Anti Money Laundering Compliance Officer or Anti Money Laundering/Bank Secrecy Act Compliance Officer of certain Fidelity entities.
Stacie M. Smith (1974)
Year of Election or Appointment: 2016
President and Treasurer
Ms. Smith also serves as an officer of other funds. Ms. Smith is a Senior Vice President (2016-present) and is an employee of Fidelity Investments. Ms. Smith serves as Assistant Treasurer of certain Fidelity entities and has served in other fund officer roles.
Jim Wegmann (1979)
Year of Election or Appointment: 2019
Assistant Treasurer
Mr. Wegmann also serves as an officer of other funds. Mr. Wegmann is a Vice President (2016-present) and is an employee of Fidelity Investments. Mr. Wegmann serves as Assistant Treasurer of FIMM, LLC (2021-present). Previously, Mr. Wegmann served as Assistant Treasurer of certain Fidelity® funds (2019-2021).
As a shareholder, you incur two types of costs: (1) transaction costs, which may include sales charges (loads) on purchase payments or redemption proceeds, as applicable and (2) ongoing costs, which generally include management fees, distribution and/or service (12b-1) fees and other Fund expenses. This Example is intended to help you understand your ongoing costs (in dollars) of investing in a fund and to compare these costs with the ongoing costs of investing in other mutual funds.
| The Example is based on an investment of $1,000 invested at the beginning of the period and held for the entire period (May 1, 2023 to October 31, 2023). |
Actual Expenses
The first line of the accompanying table provides information about actual account values and actual expenses. You may use the information in this line, together with the amount you invested, to estimate the expenses that you paid over the period. Simply divide your account value by $1,000.00 (for example, an $8,600 account value divided by $1,000.00 = 8.6), then multiply the result by the number in the first line for a class/Fund under the heading entitled "Expenses Paid During Period" to estimate the expenses you paid on your account during this period. If any fund is a shareholder of any underlying mutual funds or exchange-traded funds (ETFs) (the Underlying Funds), such fund indirectly bears its proportional share of the expenses of the Underlying Funds in addition to the direct expenses incurred presented in the table. These fees and expenses are not included in the annualized expense ratio used to calculate the expense estimate in the table below.
Hypothetical Example for Comparison Purposes
The second line of the accompanying table provides information about hypothetical account values and hypothetical expenses based on the actual expense ratio and an assumed rate of return of 5% per year before expenses, which is not the actual return. The hypothetical account values and expenses may not be used to estimate the actual ending account balance or expenses you paid for the period. You may use this information to compare the ongoing costs of investing in the Fund and other funds. To do so, compare this 5% hypothetical example with the 5% hypothetical examples that appear in the shareholder reports of the other funds. If any fund is a shareholder of any Underlying Funds, such fund indirectly bears its proportional share of the expenses of the Underlying Funds in addition to the direct expenses as presented in the table. These fees and expenses are not included in the annualized expense ratio used to calculate the expense estimate in the table below.
Please note that the expenses shown in the table are meant to highlight your ongoing costs only and do not reflect any transaction costs. Therefore, the second line of the table is useful in comparing ongoing costs only, and will not help you determine the relative total costs of owning different funds. In addition, if these transactional costs were included, your costs would have been higher.
| | | | | Annualized Expense Ratio- A | | Beginning Account Value May 1, 2023 | | Ending Account Value October 31, 2023 | | Expenses Paid During Period- C May 1, 2023 to October 31, 2023 |
| | | | | | | | | | |
| Fidelity® Diversified International K6 Fund | | | | .60% | | | | | | |
| Actual | | | | | | $ 1,000 | | $ 931.50 | | $ 2.92 |
Hypothetical-B | | | | | | $ 1,000 | | $ 1,022.18 | | $ 3.06 |
| |
A Annualized expense ratio reflects expenses net of applicable fee waivers.
B 5% return per year before expenses
C Expenses are equal to the annualized expense ratio, multiplied by the average account value over the period, multiplied by 184/ 365 (to reflect the one-half year period). The fees and expenses of any Underlying Funds are not included in each annualized expense ratio.
The dividend and capital gains distributions for the fund(s) are available on Fidelity.com or Institutional.Fidelity.com.
The fund designates $420,375 of distributions paid during the fiscal year ended 2023 as qualifying to be taxed as section 163(j) interest dividends.
The fund designates 2% of the dividends distributed during the fiscal year as qualifying for the dividends-received deduction for corporate shareholders.
The fund designates 98.99% of the dividend distributed during the fiscal year as amounts which may be taken into account as a dividend for the purposes of the maximum rate under section 1(h)(11) of the Internal Revenue Code.
The amounts per share which represent income derived from sources within, and taxes paid to, foreign countries or possessions of the United States are $0.1281 and $0.0291 for the dividend paid December 12, 2022.
The fund will notify shareholders in January 2024 of amounts for use in preparing 2023 income tax returns.
Board Approval of Investment Advisory Contracts and Management Fees
Fidelity Diversified International K6 Fund
Each year, the Board of Trustees, including the Independent Trustees (together, the Board), considers the renewal of the fund's management contract with Fidelity Management & Research Company LLC (FMR) and the sub-advisory agreements (together, the Advisory Contracts) for the fund. FMR and the sub-advisers are referred to herein as the Investment Advisers. The Board, assisted by the advice of fund counsel and Independent Trustees' counsel, requests and considers a broad range of information relevant to the renewal of the Advisory Contracts throughout the year.
The Board meets regularly and, at each of its meetings, covers an extensive agenda of topics and materials and considers factors that are relevant to its annual consideration of the renewal of the fund's Advisory Contracts, including the services and support provided to the fund and its shareholders. The Board, acting directly and through its Committees (each of which is composed of and chaired by Independent Trustees), requests and receives information concerning the annual consideration of the renewal of the fund's Advisory Contracts. The Board also meets as needed to review matters specifically related to the Board's annual consideration of the renewal of the Advisory Contracts. Members of the Board may also meet with trustees of other Fidelity funds through joint ad hoc committees to discuss certain matters relevant to all of the Fidelity funds.
Approval of Stub Period Continuation. At its May 2023 meeting, the Board of Trustees voted to continue the fund's management contract with FMR, and the sub-advisory agreements and sub-sub-advisory agreements, in each case, where applicable (together, the Advisory Contracts), without modification, for two months from June 1, 2023 through July 31, 2023. The Board considered that the approval of the fund's Advisory Contracts will not result in any changes in (i) the investment process or strategies employed in the management of the fund's assets; (ii) the fees and expenses paid by shareholders; (iii) the nature, extent or quality of services provided under the fund's Advisory Contracts; or (iv) the day-to-day management of the fund or the persons primarily responsible for such management. The Board also considered that since its last approval of the fund's Advisory Contracts, FMR had provided additional information on the fund in support of the annual contract renewal process, including competitive analyses on total expenses and management fees and in-depth reviews of fund performance and fund profitability information. The Board concluded that the fund's Advisory Contracts are fair and reasonable, and that the fund's Advisory Contracts should be renewed, without modification, through July 31, 2023, with the understanding that the Board would consider the annual renewal for a full one year period in July 2023.
At its July 2023 meeting, the Board unanimously determined to renew the fund's Advisory Contracts. In reaching its determination, the Board considered all factors it believed relevant, including (i) the nature, extent, and quality of the services provided to the fund and its shareholders (including the investment performance of the fund); (ii) the competitiveness relative to peer funds of the fund's management fee and total expense ratio; (iii) the total costs of the services provided by and the profits realized by FMR and its affiliates (Fidelity) from its relationships with the fund; and (iv) the extent to which, if any, economies of scale exist and are realized as the fund grows, and whether any economies of scale are appropriately shared with fund shareholders. The Board also considered the broad range of investment choices available to shareholders from FMR's competitors and that the fund's shareholders have chosen to invest in the fund, which is part of the Fidelity family of funds. The Board's decision to renew the Advisory Contracts was not based on any single factor.
The Board reached a determination, with the assistance of fund counsel and Independent Trustees' counsel and through the exercise of its business judgment, that the renewal of the Advisory Contracts was in the best interests of the fund and its shareholders and that the compensation payable under the Advisory Contracts was fair and reasonable in light of all of the surrounding circumstances.
Nature, Extent, and Quality of Services Provided. The Board considered staffing as it relates to the fund, including the backgrounds and experience of investment personnel of the Investment Advisers, and also considered the Investment Advisers' implementation of the fund's investment program. The Independent Trustees also had discussions with senior management of Fidelity's investment operations and investment groups. The Board considered the structure of the investment personnel compensation program and whether this structure provides appropriate incentives to act in the best interests of the fund. Additionally, the Board considered the portfolio managers' investments, if any, in the funds that they manage.
Resources Dedicated to Investment Management and Support Services. The Board and the Fund Oversight and Research Committees reviewed the general qualifications and capabilities of Fidelity's investment staff, including its size, education, experience, and resources, as well as Fidelity's approach to recruiting, training, managing, and compensating investment personnel. The Board noted the resources devoted to expansion of Fidelity's global investment organization, and that Fidelity's analysts have extensive resources, tools, and capabilities that allow them to conduct sophisticated quantitative and fundamental analysis, as well as credit analysis of issuers, counterparties, and guarantors. Further, the Board considered that Fidelity's investment professionals have sufficient access to global information and data so as to provide competitive investment results over time, and that those professionals also have access to sophisticated tools that permit them to assess portfolio construction and risk and performance attribution characteristics continuously, as well as to transmit new information and research conclusions rapidly around the world. Additionally, in its deliberations, the Board considered Fidelity's trading, risk management, compliance, and technology and operations capabilities and resources, which are integral parts of the investment management process.
Shareholder and Administrative Services. The Board considered (i) the nature, extent, quality, and cost of advisory, administrative, and shareholder services performed by the Investment Advisers and their affiliates under the Advisory Contracts and under separate agreements covering transfer agency, pricing and bookkeeping, and securities lending services for the fund; (ii) the nature and extent of Fidelity's supervision of third party service providers, principally custodians, subcustodians, and pricing vendors; and (iii) the resources devoted by Fidelity to, and the record of compliance with, the fund's compliance policies and procedures. The Board also reviewed the allocation of fund brokerage, including allocations to brokers affiliated with the Investment Advisers, the use of brokerage commissions to pay fund expenses, and the use of "soft" commission dollars to pay for research services. The Board also considered the fund's securities lending activities and any payments made to Fidelity relating to securities lending.
The Board noted that the growth of fund assets over time across the complex allows Fidelity to reinvest in the development of services designed to enhance the value and convenience of the Fidelity funds as investment vehicles. These services include 24-hour access to account information and market information over the Internet and through telephone representatives, investor education materials, and asset allocation tools. The Board also considered that it reviews customer service metrics such as telephone response times, continuity of services on the website and metrics addressing services at Fidelity Investor Centers.
Investment in a Large Fund Family. The Board considered the benefits to shareholders of investing in a fund that is part of a large family of funds offering a variety of investment disciplines and providing a large variety of fund investor services. The Board noted that Fidelity had taken, or had made recommendations that resulted in the Fidelity funds taking, a number of actions over the previous year that benefited particular funds and/or the Fidelity funds in general.
Investment Performance. The Board took into account discussions that occur with representatives of the Investment Advisers, and reports that it receives, at Board meetings throughout the year, relating to fund investment performance. In this regard the Board noted that as part of regularly scheduled fund reviews and other reports to the Board on fund performance, the Board considered annualized return information for the fund for different time periods, measured against an appropriate securities market index (benchmark index) and an appropriate peer group of funds with similar objectives (peer group). The Board also considered information about performance attribution. In its ongoing evaluation of fund investment performance, the Board gives particular attention to information indicating changes in performance of the funds over different time periods and discussed with the Investment Advisers the reasons for any overperformance or underperformance. The fund underperformed its benchmark and peers for the one- and three-year periods ended February 28, 2023, and as a result, the Board continues to engage in discussions with FMR about the steps it is taking to address the fund's performance.
In addition to reviewing absolute and relative fund performance, the Independent Trustees periodically consider the appropriateness of fund performance metrics in evaluating the results achieved. The Independent Trustees generally give greater weight to fund performance over longer time periods than over shorter time periods. Depending on the circumstances, the Independent Trustees may be satisfied with a fund's performance notwithstanding that it lags its benchmark index or peer group for certain periods.
Based on its review, the Board concluded that the nature, extent, and quality of services provided to the fund under the Advisory Contracts should continue to benefit the shareholders of the fund.
Competitiveness of Management Fee and Total Expense Ratio. The Board was provided with information regarding industry trends in management fees and expenses. In its review of the fund's management fee and total expense ratio, the Board considered the fund's unitary fee rate as well as other fund expenses paid by FMR under the fund's management contract, such as transfer agent fees, pricing and bookkeeping fees, and custodial, legal, and audit fees. The Board noted that Fidelity may agree to waive fees or reimburse expenses from time to time, and the extent to which, if any, it has done so for the fund.
Comparisons of Management Fees and Total Expense Ratios. Among other things, the Board reviewed data for selected groups of competitive funds and classes (referred to as "mapped groups") that were compiled by Fidelity based on combining similar investment objective categories (as classified by Lipper) that have comparable investment mandates. The data reviewed by the Board included (i) gross management fee comparisons (before taking into account expense reimbursements or caps) relative to the total universe of funds within the mapped group; (ii) gross management fee comparisons relative to a subset of non-Fidelity funds in the mapped group that are similar in size and management fee structure to the fund (referred to as the "asset size peer group"); (iii) total expense comparisons of the fund relative to funds and classes in the mapped group that have a similar sales load structure to the fund (referred to as the "similar sales load structure group"); and (iv) total expense comparisons of the fund relative to funds and classes in the similar sales load structure group that are similar in size and management fee structure to the fund (referred to as the "total expense asset size peer group"). The total expense asset size peer group comparison excludes performance adjustments and fund-paid 12b-1 fees to eliminate variability in fee structures.
The information provided to the Board indicated that the fund's management fee rate ranked below the competitive median of the mapped group for the 12-month period ended September 30, 2022 and below the competitive median of the asset size peer group for the 12-month period ended September 30, 2022. Further, the information provided to the Board indicated that the total expense ratio of the fund ranked below the competitive median of the similar sales load structure group for the 12-month period ended September 30, 2022 and below the competitive median of the total expense asset size peer group for the 12-month period ended September 30, 2022.
The Board also considered that, for funds subject to the group fee, FMR agreed to voluntarily waive fees over a specified period of time in amounts designed to account for assets converted from certain funds to certain collective investment trusts.
Fees Charged to Other Fidelity Clients. The Board also considered Fidelity fee structures and other information with respect to clients of Fidelity, such as other funds advised or subadvised by Fidelity, pension plan clients, and other institutional clients with similar mandates. The Board noted that a joint ad hoc committee created by it and the boards of other Fidelity funds periodically reviews and compares Fidelity's institutional investment advisory business with its business of providing services to the Fidelity funds and also noted the most recent findings of the committee. The Board noted that the committee's review included a consideration of the differences in services provided, fees charged, and costs incurred, as well as competition in the markets serving the different categories of clients.
Based on its review, the Board concluded that the fund's management fee is fair and reasonable in light of the services that the fund receives and the other factors considered. Further based on its review of total expense ratios and fees charged to other Fidelity clients, the Board concluded that the fund's total expense ratio was reasonable in light of the services that the fund and its shareholders receive and the other factors considered.
Costs of the Services and Profitability. The Board considered the revenues earned and the expenses incurred by Fidelity in conducting the business of developing, marketing, distributing, managing, administering and servicing the fund and servicing the fund's shareholders. The Board also considered the level of Fidelity's profits in respect of all the Fidelity funds.
On an annual basis, Fidelity presents to the Board information about the profitability of its relationships with the fund. Fidelity calculates profitability information for each fund, as well as aggregate profitability information for groups of Fidelity funds and all Fidelity funds, using a series of detailed revenue and cost allocation methodologies which originate with the books and records of Fidelity on which Fidelity's audited financial statements are based. The Audit Committee of the Board reviews any significant changes from the prior year's methodologies and the full Board approves such changes.
A public accounting firm has been engaged annually by the Board as part of the Board's assessment of Fidelity's profitability analysis. The engagement includes the review and assessment of the methodologies used by Fidelity in determining the revenues and expenses attributable to Fidelity's fund business, and completion of agreed-upon procedures in respect of the mathematical accuracy of certain fund profitability information and its conformity to established allocation methodologies. After considering the reports issued under the engagement and information provided by Fidelity, the Board concluded that while other allocation methods may also be reasonable, Fidelity's profitability methodologies are reasonable in all material respects.
The Board also reviewed Fidelity's non-fund businesses and potential indirect benefits such businesses may have received as a result of their association with Fidelity's fund business (i.e., fall-out benefits) as well as cases where Fidelity's affiliates may benefit from the funds' business. The Board considered areas where potential indirect benefits to the Fidelity funds from their relationships with Fidelity may exist. The Board's consideration of these matters was informed by the findings of a joint ad hoc committee created by it and the boards of other Fidelity funds to evaluate potential fall-out benefits.
The Board considered the costs of the services provided by and the profits realized by Fidelity in connection with the operation of the fund and was satisfied that the profitability was not excessive.
Economies of Scale. The Board considered whether there have been economies of scale in respect of the management of the Fidelity funds, whether the Fidelity funds (including the fund) have appropriately benefited from any such economies of scale, and whether there is potential for realization of any further economies of scale. The Board considered the extent to which the fund will benefit from economies of scale as assets grow through increased services to the fund, through waivers or reimbursements, or through fee or expense ratio reductions. The Board recognized that, due to the fund's current contractual arrangements, its expense ratio will not decline if the fund's operating costs decrease as assets grow, or rise as assets decrease. The Board also noted that a committee (the Economies of Scale Committee) created by it and the boards of other Fidelity funds periodically analyzes whether Fidelity attains economies of scale in respect of the management and servicing of the Fidelity funds, whether the Fidelity funds have appropriately benefited from such economies of scale, and whether there is potential for realization of any further economies of scale.
The Board concluded, taking into account the analysis of the Economies of Scale Committee, that economies of scale, if any, are being appropriately shared between fund shareholders and Fidelity.
Additional Information Requested by the Board. In order to develop fully the factual basis for consideration of the Fidelity funds' advisory contracts, the Board requested and received additional information on certain topics, including: (i) fund flow and performance trends, in particular the underperformance of certain funds and strategies, and Fidelity's long-term strategies for certain funds, including any consideration of fund liquidations or mergers; (ii) the operation of performance fees and competitor use of performance fees; (iii) Fidelity's pricing philosophy compared to competitors; (iv) fund profitability methodology and data; (v) evaluation of competitive fund data and peer group classifications and fee and expense comparisons; (vi) the management fee and expense structures for different funds and classes and information about the differences between various fee and expense structures; (vii) group fee breakpoints and related voluntary fee waivers; and (viii) information regarding other accounts managed by Fidelity and the funds' sub-advisory arrangements.
Conclusion. Based on its evaluation of all of the conclusions noted above, and after considering all factors it believed relevant, the Board, including the Independent Trustees, concluded that the advisory and sub-advisory fee arrangements are fair and reasonable in light of all of the surrounding circumstances and that the fund's Advisory Contracts should be renewed through July 31, 2024.
1.9883987.106
DIFK6-ANN-1223
Fidelity® Series Canada Fund
Annual Report
October 31, 2023
Contents
To view a fund's proxy voting guidelines and proxy voting record for the 12-month period ended June 30, visit http://www.fidelity.com/proxyvotingresults or visit the Securities and Exchange Commission's (SEC) web site at http://www.sec.gov.
You may also call 1-800-544-8544 to request a free copy of the proxy voting guidelines.
Standard & Poor's, S&P and S&P 500 are registered service marks of The McGraw-Hill Companies, Inc. and have been licensed for use by Fidelity Distributors Corporation.
Other third-party marks appearing herein are the property of their respective owners.
All other marks appearing herein are registered or unregistered trademarks or service marks of FMR LLC or an affiliated company. © 2023 FMR LLC. All rights reserved.
This report and the financial statements contained herein are submitted for the general information of the shareholders of the Fund. This report is not authorized for distribution to prospective investors in the Fund unless preceded or accompanied by an effective prospectus.
A fund files its complete schedule of portfolio holdings with the SEC for the first and third quarters of each fiscal year on Form N-PORT. Forms N-PORT are available on the SEC's web site at http://www.sec.gov. A fund's Forms N-PORT may be reviewed and copied at the SEC's Public Reference Room in Washington, DC. Information regarding the operation of the SEC's Public Reference Room may be obtained by calling 1-800-SEC-0330.
For a complete list of a fund's portfolio holdings, view the most recent holdings listing, semiannual report, or annual report on Fidelity's web site at http://www.fidelity.com, http://www.institutional.fidelity.com, or http://www.401k.com, as applicable.
NOT FDIC INSURED •MAY LOSE VALUE •NO BANK GUARANTEE
Neither the Fund nor Fidelity Distributors Corporation is a bank.
Average annual total return reflects the change in the value of an investment, assuming reinvestment of distributions from dividend income and capital gains (the profits earned upon the sale of securities that have grown in value, if any) and assuming a constant rate of performance each year. The hypothetical investment and the average annual total returns do not reflect the deduction of taxes that a shareholder would pay on fund distributions or the redemption of fund shares. During periods of reimbursement by Fidelity, a fund's total return will be greater than it would be had the reimbursement not occurred. How a fund did yesterday is no guarantee of how it will do tomorrow.
| Average Annual Total Returns |
| | | | |
Periods ended October 31, 2023 | Past 1 year | Past 5 years | Life of Fund A |
| Fidelity® Series Canada Fund | 1.54% | 8.25% | 6.76% |
A From August 15, 2017
| $10,000 Over Life of Fund |
| |
Let's say hypothetically that $10,000 was invested in Fidelity® Series Canada Fund, on August 15, 2017, when the fund started. The chart shows how the value of your investment would have changed, and also shows how the MSCI Canada Index performed over the same period. |
|
|
Market Recap:
International (non-U.S.) equities gained 12.27% for the 12 months ending October 31, 2023, according to the MSCI ACWI (All Country World Index) ex USA Index, as global economic expansion and a slowing in the pace of inflation in some markets provided a favorable backdrop for risk assets. After returning -15.86% in 2022, the index's upturn has been largely driven by a narrow set of companies in the information technology and communication services sectors, in part due to excitement for generative artificial intelligence applications. The index gained 14.07% year to date through July, including strong gains in both June (+4.50%) and July (+4.07%). The rally for international equities sputtered for the next three months (-11.33%) amid a stalling pattern in disinflationary trends, heightened global recession and geopolitical risks, soaring yields on longer-term U.S. government bonds and particularly weak economic conditions in the eurozone and China. The three-month decline left global stocks up 1.15% year to date through October. For the full 12 months, nearly all regions advanced, with Europe ex U.K. (+18%) and Japan (+17%) leading, whereas Canada (-0.38%) lagged by the widest margin, while the U.S. middled (+10%). Each of the 11 sectors advanced, with information technology (+21%) and consumer discretionary (+19%) leading the way. Energy and industrials each rose about 14%. Conversely, four defensive-oriented sectors lagged by the widest margin: real estate (+4%), health care (+6%), consumer staples (+7%) and utilities (+8%).
Comments from Portfolio Manager Ryan Oldham:
For the fiscal year ending October 31, 2023, the fund gained 1.54%, versus -0.90% for the benchmark MSCI Canada Index (Net MA). By sector, the biggest contributor to performance versus the benchmark was stock picking in energy. Underweight positions in utilities and financials also boosted the fund's relative performance. The top individual relative contributor was an overweight in Alimentation Couche-Tard (+23%), which was among our largest holdings. A second notable contributor was our non-benchmark stake in PrairieSky Royalty (+17%), another of the fund's biggest holdings. An overweight in Constellation Software (+41%), also a top-10 fund holding, further helped. In contrast, by sector, the biggest detractor from performance versus the benchmark was stock selection in information technology. Also hurting our result were stock picks in the financials and health care sectors. Lastly, the fund's small position in cash detracted. The largest individual relative detractor this period was avoiding Fairfax Financial, a benchmark component that gained roughly 72%. The second-largest relative detractor was an underweight in Shopify (+38%). An overweight in Nutrien (-35%) also hurt. By sector, meaningful changes in positioning the past 12 months include increased exposure to the consumer staples and information technology sectors.
The views expressed above reflect those of the portfolio manager(s) only through the end of the period as stated on the cover of this report and do not necessarily represent the views of Fidelity or any other person in the Fidelity organization. Any such views are subject to change at any time based upon market or other conditions and Fidelity disclaims any responsibility to update such views. These views may not be relied on as investment advice and, because investment decisions for a Fidelity fund are based on numerous factors, may not be relied on as an indication of trading intent on behalf of any Fidelity fund.
Top Holdings (% of Fund's net assets) |
| |
| The Toronto-Dominion Bank (Banks) | 7.3 | |
| Canadian Pacific Kansas City Ltd. (Ground Transportation) | 6.3 | |
| Canadian Natural Resources Ltd. (Oil, Gas & Consumable Fuels) | 6.0 | |
| Alimentation Couche-Tard, Inc. Class A (multi-vtg.) (Consumer Staples Distribution & Retail) | 5.6 | |
| Bank of Montreal (Banks) | 4.6 | |
| Constellation Software, Inc. (Software) | 4.0 | |
| Suncor Energy, Inc. (Oil, Gas & Consumable Fuels) | 3.9 | |
| PrairieSky Royalty Ltd. (Oil, Gas & Consumable Fuels) | 3.9 | |
| Royal Bank of Canada (Banks) | 3.9 | |
| Franco-Nevada Corp. (Metals & Mining) | 3.8 | |
| | 49.3 | |
| |
| Market Sectors (% of Fund's net assets) |
| |
| Financials | 27.4 | |
| Energy | 19.5 | |
| Industrials | 13.5 | |
| Materials | 10.8 | |
| Consumer Staples | 9.0 | |
| Information Technology | 7.7 | |
| Consumer Discretionary | 6.5 | |
| Communication Services | 2.8 | |
| Health Care | 0.7 | |
| Utilities | 0.2 | |
| |
Market Sectors may include more than one industry category.
The Fund may invest up to 35% of its total assets in any industry that represents more than 20% of the Canadian market. As of October 31, 2023, the Fund did not have more than 25% of its total assets invested in any one industry.
Asset Allocation (% of Fund's net assets) |
|
|
Geographic Diversification (% of Fund's net assets) |
|
* Includes Short-Term investments and Net Other Assets (Liabilities). Percentages are adjusted for the effect of derivatives, if applicable. |
| |
Showing Percentage of Net Assets
| Common Stocks - 97.9% |
| | | Shares | Value ($) |
| COMMUNICATION SERVICES - 2.6% | | | |
| Diversified Telecommunication Services - 1.4% | | | |
| Quebecor, Inc.: | | | |
| Class A | | 2,102,000 | 45,867,330 |
| Class B (sub. vtg.) | | 968,400 | 19,979,033 |
| | | | 65,846,363 |
| Wireless Telecommunication Services - 1.2% | | | |
| Rogers Communications, Inc. Class B (non-vtg.) | | 1,422,300 | 52,697,151 |
TOTAL COMMUNICATION SERVICES | | | 118,543,514 |
| CONSUMER DISCRETIONARY - 6.5% | | | |
| Automobile Components - 0.7% | | | |
| Magna International, Inc. Class A (sub. vtg.) | | 699,000 | 33,590,308 |
| Broadline Retail - 2.8% | | | |
| Dollarama, Inc. | | 1,873,700 | 127,953,409 |
| Hotels, Restaurants & Leisure - 2.4% | | | |
| Restaurant Brands International, Inc. | | 1,582,600 | 106,305,527 |
| Specialty Retail - 0.4% | | | |
| Aritzia, Inc. (a) | | 702,700 | 10,930,044 |
| Diversified Royalty Corp. (b) | | 4,302,900 | 7,539,965 |
| | | | 18,470,009 |
| Textiles, Apparel & Luxury Goods - 0.2% | | | |
| Canada Goose Holdings, Inc. (a)(b) | | 642,323 | 7,123,799 |
TOTAL CONSUMER DISCRETIONARY | | | 293,443,052 |
| CONSUMER STAPLES - 9.0% | | | |
| Beverages - 0.1% | | | |
| GURU Organic Energy Corp. (a)(c) | | 1,628,634 | 2,630,712 |
| Consumer Staples Distribution & Retail - 8.6% | | | |
| Alimentation Couche-Tard, Inc. Class A (multi-vtg.) | | 4,647,600 | 252,999,693 |
| Metro, Inc. | | 1,974,400 | 100,289,696 |
| North West Co., Inc. | | 1,392,600 | 35,509,166 |
| | | | 388,798,555 |
| Personal Care Products - 0.3% | | | |
| Jamieson Wellness, Inc. (d) | | 855,600 | 14,048,684 |
TOTAL CONSUMER STAPLES | | | 405,477,951 |
| ENERGY - 19.5% | | | |
| Energy Equipment & Services - 0.7% | | | |
| Pason Systems, Inc. | | 3,272,200 | 31,359,321 |
| Oil, Gas & Consumable Fuels - 18.8% | | | |
| Cameco Corp. | | 1,173,500 | 48,006,241 |
| Canadian Natural Resources Ltd. | | 4,301,500 | 273,149,515 |
| Enbridge, Inc. | | 3,091,300 | 99,064,267 |
| Parkland Corp. | | 2,485,100 | 75,211,572 |
| PrairieSky Royalty Ltd. (b) | | 10,035,080 | 176,206,380 |
| Suncor Energy, Inc. (b) | | 5,479,300 | 177,447,531 |
| | | | 849,085,506 |
TOTAL ENERGY | | | 880,444,827 |
| FINANCIALS - 27.4% | | | |
| Banks - 15.8% | | | |
| Bank of Montreal (b) | | 2,744,500 | 207,388,610 |
| Royal Bank of Canada (b) | | 2,192,600 | 175,123,401 |
| The Toronto-Dominion Bank | | 5,913,230 | 330,296,589 |
| | | | 712,808,600 |
| Capital Markets - 5.2% | | | |
| Brookfield Asset Management Ltd. Class A (b) | | 2,387,672 | 68,440,571 |
| Brookfield Corp. (Canada) Class A (b) | | 3,333,888 | 97,125,708 |
| TMX Group Ltd. | | 3,258,300 | 67,856,286 |
| | | | 233,422,565 |
| Insurance - 6.4% | | | |
| Definity Financial Corp. | | 2,405,624 | 66,509,194 |
| Intact Financial Corp. | | 669,700 | 94,093,635 |
| Sun Life Financial, Inc. | | 2,848,200 | 130,091,933 |
| | | | 290,694,762 |
TOTAL FINANCIALS | | | 1,236,925,927 |
| HEALTH CARE - 0.7% | | | |
| Health Care Providers & Services - 0.7% | | | |
| Andlauer Healthcare Group, Inc. | | 934,870 | 26,183,776 |
| dentalcorp Holdings Ltd. (a) | | 1,001,569 | 3,972,331 |
| | | | 30,156,107 |
| INDUSTRIALS - 13.5% | | | |
| Commercial Services & Supplies - 2.3% | | | |
| GFL Environmental, Inc. | | 3,579,014 | 103,105,541 |
| Ground Transportation - 9.0% | | | |
| Canadian National Railway Co. | | 1,162,800 | 123,034,176 |
| Canadian Pacific Kansas City Ltd. | | 4,014,921 | 285,061,562 |
| | | | 408,095,738 |
| Professional Services - 2.2% | | | |
| Thomson Reuters Corp. (b) | | 827,900 | 99,168,898 |
TOTAL INDUSTRIALS | | | 610,370,177 |
| INFORMATION TECHNOLOGY - 7.7% | | | |
| IT Services - 2.7% | | | |
| Shopify, Inc. Class A (a) | | 2,616,800 | 123,579,760 |
| Software - 5.0% | | | |
| ApplyBoard, Inc. (a)(e)(f) | | 10,248 | 581,369 |
| ApplyBoard, Inc. (non-vtg.) (a)(e)(f) | | 2,527 | 143,357 |
| Computer Modelling Group Ltd. | | 2,248,400 | 14,851,519 |
| Constellation Software, Inc. | | 90,600 | 181,625,315 |
| Constellation Software, Inc. warrants 8/22/28 (a)(f) | | 48,000 | 3 |
| Dye & Durham Ltd. (c) | | 3,696,700 | 21,565,749 |
| Lumine Group, Inc. | | 439,640 | 5,528,986 |
| | | | 224,296,298 |
TOTAL INFORMATION TECHNOLOGY | | | 347,876,058 |
| MATERIALS - 10.8% | | | |
| Chemicals - 2.2% | | | |
| Nutrien Ltd. | | 1,868,478 | 100,352,797 |
| Containers & Packaging - 1.0% | | | |
| CCL Industries, Inc.: | | | |
| Class A | | 155,800 | 6,121,898 |
| Class B | | 984,800 | 38,504,313 |
| | | | 44,626,211 |
| Metals & Mining - 6.9% | | | |
| Franco-Nevada Corp. | | 1,411,919 | 171,761,843 |
| Lundin Mining Corp. | | 4,905,900 | 30,636,448 |
| Triple Flag Precious Metals Corp. | | 893,300 | 11,356,682 |
| Wheaton Precious Metals Corp. | | 2,390,900 | 100,980,720 |
| | | | 314,735,693 |
| Paper & Forest Products - 0.7% | | | |
| Stella-Jones, Inc. | | 572,500 | 29,988,390 |
| Western Forest Products, Inc. | | 1,709,808 | 887,732 |
| | | | 30,876,122 |
TOTAL MATERIALS | | | 490,590,823 |
| UTILITIES - 0.2% | | | |
| Independent Power and Renewable Electricity Producers - 0.2% | | | |
| Brookfield Renewable Corp. | | 336,500 | 7,658,740 |
| TOTAL COMMON STOCKS (Cost $3,438,316,068) | | | 4,421,487,176 |
| | | | |
| Nonconvertible Preferred Stocks - 0.0% |
| | | Shares | Value ($) |
| INFORMATION TECHNOLOGY - 0.0% | | | |
| Software - 0.0% | | | |
| ApplyBoard, Inc.: | | | |
| Series A1 (a)(e)(f) | | 12,606 | 715,138 |
| Series A2 (a)(e)(f) | | 9,868 | 559,812 |
| Series A3 (a)(e)(f) | | 563 | 31,939 |
| Series D (a)(e)(f) | | 27,521 | 1,561,266 |
| Series Seed (a)(e)(f) | | 3,768 | 213,759 |
| (Cost $4,705,692) | | | 3,081,914 |
| | | | |
| Convertible Bonds - 0.2% |
| | | Principal Amount (g) | Value ($) |
| COMMUNICATION SERVICES - 0.2% | | | |
| Entertainment - 0.2% | | | |
Cineplex, Inc. 5.75% 9/30/25 (d) (Cost $8,538,338) | CAD | 12,136,000 | 8,663,883 |
| | | | |
| Money Market Funds - 5.2% |
| | | Shares | Value ($) |
| Fidelity Cash Central Fund 5.40% (h) | | 11,235,482 | 11,237,729 |
| Fidelity Securities Lending Cash Central Fund 5.40% (h)(i) | | 223,136,563 | 223,158,876 |
| TOTAL MONEY MARKET FUNDS (Cost $234,396,605) | | | 234,396,605 |
| | | | |
| TOTAL INVESTMENT IN SECURITIES - 103.3% (Cost $3,685,956,703) | 4,667,629,578 |
NET OTHER ASSETS (LIABILITIES) - (3.3)% | (150,070,447) |
| NET ASSETS - 100.0% | 4,517,559,131 |
| | |
Currency Abbreviations
Legend
| (b) | Security or a portion of the security is on loan at period end. |
| (d) | Security exempt from registration under Rule 144A of the Securities Act of 1933. These securities may be resold in transactions exempt from registration, normally to qualified institutional buyers. At the end of the period, the value of these securities amounted to $22,712,567 or 0.5% of net assets. |
| (e) | Restricted securities (including private placements) - Investment in securities not registered under the Securities Act of 1933 (excluding 144A issues). At the end of the period, the value of restricted securities (excluding 144A issues) amounted to $3,806,640 or 0.1% of net assets. |
| (g) | Amount is stated in United States dollars unless otherwise noted. |
| (h) | Affiliated fund that is generally available only to investment companies and other accounts managed by Fidelity Investments. The rate quoted is the annualized seven-day yield of the fund at period end. A complete unaudited listing of the fund's holdings as of its most recent quarter end is available upon request. In addition, each Fidelity Central Fund's financial statements, which are not covered by the Fund's Report of Independent Registered Public Accounting Firm, are available on the SEC's website or upon request. |
| (i) | Investment made with cash collateral received from securities on loan. |
| Additional information on each restricted holding is as follows: |
| Security | Acquisition Date | Acquisition Cost ($) |
| ApplyBoard, Inc. | 6/04/21 - 6/30/21 | 524,312 |
| | | |
| ApplyBoard, Inc. (non-vtg.) | 6/30/21 | 269,861 |
| | | |
| ApplyBoard, Inc. Series A1 | 6/04/21 | 816,255 |
| | | |
| ApplyBoard, Inc. Series A2 | 6/04/21 | 638,966 |
| | | |
| ApplyBoard, Inc. Series A3 | 6/04/21 | 36,455 |
| | | |
| ApplyBoard, Inc. Series D | 6/04/21 | 2,970,033 |
| | | |
| ApplyBoard, Inc. Series Seed | 6/04/21 | 243,983 |
| | | |
Affiliated Central Funds
Fiscal year to date information regarding the Fund's investments in Fidelity Central Funds, including the ownership percentage, is presented below.
| Affiliate | Value, beginning of period ($) | Purchases ($) | Sales Proceeds ($) | Dividend Income ($) | Realized Gain (loss) ($) | Change in Unrealized appreciation (depreciation) ($) | Value, end of period ($) | % ownership, end of period |
| Fidelity Cash Central Fund 5.40% | 4,119,421 | 738,320,709 | 731,202,401 | 366,778 | - | - | 11,237,729 | 0.0% |
| Fidelity Securities Lending Cash Central Fund 5.40% | 772,969,944 | 6,990,429,407 | 7,540,240,475 | 2,204,704 | - | - | 223,158,876 | 0.9% |
| Total | 777,089,365 | 7,728,750,116 | 8,271,442,876 | 2,571,482 | - | - | 234,396,605 | |
| | | | | | | | | |
Amounts in the dividend income column in the above table include any capital gain distributions from underlying funds, which are presented in the corresponding line item in the Statement of Operations, if applicable.
Amounts in the dividend income column for Fidelity Securities Lending Cash Central Fund represents the income earned on investing cash collateral, less rebates paid to borrowers and any lending agent fees associated with the loan, plus any premium payments received for lending certain types of securities.
Amounts included in the purchases and sales proceeds columns may include in-kind transactions, if applicable.
Other Affiliated Issuers
An affiliated company is a company in which the Fund has ownership of at least 5% of the voting securities. Fiscal year to date transactions with companies which are or were affiliates are presented in the table below. Certain corporate actions, such as mergers, are excluded from the amounts in this table if applicable. A dash in the Value end of period ($) column means either the issuer is no longer held at period end, or the issuer is held at period end but is no longer an affiliate.
| Affiliate | Value, beginning of period ($) | Purchases ($) | Sales Proceeds ($) | Dividend Income ($) | Realized Gain (loss) ($) | Change in Unrealized appreciation (depreciation) ($) | Value, end of period ($) |
| Dye & Durham Ltd. | 30,860,121 | 8,344,466 | 4,934,864 | 121,983 | (2,815,500) | (9,888,474) | 21,565,749 |
| GURU Organic Energy Corp. | 5,007,698 | - | 444,751 | - | (2,459,782) | 527,547 | 2,630,712 |
| Total | 35,867,819 | 8,344,466 | 5,379,615 | 121,983 | (5,275,282) | (9,360,927) | 24,196,461 |
Amounts included in the purchases and sales proceeds columns may include in-kind transactions, if applicable.
Investment Valuation
The following is a summary of the inputs used, as of October 31, 2023, involving the Fund's assets and liabilities carried at fair value. The inputs or methodology used for valuing securities may not be an indication of the risk associated with investing in those securities. For more information on valuation inputs, and their aggregation into the levels used below, please refer to the Investment Valuation section in the accompanying Notes to Financial Statements.
| Valuation Inputs at Reporting Date: |
| Description | Total ($) | Level 1 ($) | Level 2 ($) | Level 3 ($) |
Investments in Securities: | | | | |
|
| Equities: | | | | |
Communication Services | 118,543,514 | 118,543,514 | - | - |
Consumer Discretionary | 293,443,052 | 293,443,052 | - | - |
Consumer Staples | 405,477,951 | 405,477,951 | - | - |
Energy | 880,444,827 | 880,444,827 | - | - |
Financials | 1,236,925,927 | 1,236,925,927 | - | - |
Health Care | 30,156,107 | 30,156,107 | - | - |
Industrials | 610,370,177 | 610,370,177 | - | - |
Information Technology | 350,957,972 | 347,151,329 | - | 3,806,643 |
Materials | 490,590,823 | 490,590,823 | - | - |
Utilities | 7,658,740 | 7,658,740 | - | - |
|
| Corporate Bonds | 8,663,883 | - | 8,663,883 | - |
|
| Money Market Funds | 234,396,605 | 234,396,605 | - | - |
| Total Investments in Securities: | 4,667,629,578 | 4,655,159,052 | 8,663,883 | 3,806,643 |
| Statement of Assets and Liabilities |
| | | | October 31, 2023 |
| | | | | |
| Assets | | | | |
| Investment in securities, at value (including securities loaned of $212,257,307) - See accompanying schedule: | | | | |
Unaffiliated issuers (cost $3,398,715,112) | $ | 4,409,036,512 | | |
Fidelity Central Funds (cost $234,396,605) | | 234,396,605 | | |
Other affiliated issuers (cost $52,844,986) | | 24,196,461 | | |
| | | | | |
| | | | | |
| Total Investment in Securities (cost $3,685,956,703) | | | $ | 4,667,629,578 |
| Cash | | | | 37,314 |
| Foreign currency held at value (cost $73,225,363) | | | | 72,079,574 |
| Receivable for investments sold | | | | 7,226,086 |
| Receivable for fund shares sold | | | | 22,257,280 |
| Dividends receivable | | | | 8,347,063 |
| Interest receivable | | | | 44,117 |
| Distributions receivable from Fidelity Central Funds | | | | 239,153 |
Total assets | | | | 4,777,860,165 |
| Liabilities | | | | |
| Payable for investments purchased | $ | 20,685,152 | | |
| Payable for fund shares redeemed | | 16,443,929 | | |
| Other payables and accrued expenses | | 14,848 | | |
| Collateral on securities loaned | | 223,157,105 | | |
| Total Liabilities | | | | 260,301,034 |
| Net Assets | | | $ | 4,517,559,131 |
| Net Assets consist of: | | | | |
| Paid in capital | | | $ | 3,449,221,498 |
| Total accumulated earnings (loss) | | | | 1,068,337,633 |
| Net Assets | | | $ | 4,517,559,131 |
Net Asset Value, offering price and redemption price per share ($4,517,559,131 ÷ 342,930,034 shares) | | | $ | 13.17 |
| Statement of Operations |
| | | | Year ended October 31, 2023 |
| Investment Income | | | | |
| Dividends (including $121,983 earned from affiliated issuers) | | | $ | 142,301,157 |
| Interest | | | | 953,131 |
| Income from Fidelity Central Funds (including $2,204,704 from security lending) | | | | 2,571,482 |
| Income before foreign taxes withheld | | | $ | 145,825,770 |
| Less foreign taxes withheld | | | | (21,443,941) |
| Total Income | | | | 124,381,829 |
| Expenses | | | | |
| Custodian fees and expenses | $ | 46,266 | | |
| Independent trustees' fees and expenses | | 29,983 | | |
| Interest | | 340,956 | | |
| Total Expenses | | | | 417,205 |
| Net Investment income (loss) | | | | 123,964,624 |
| Realized and Unrealized Gain (Loss) | | | | |
| Net realized gain (loss) on: | | | | |
| Investment Securities: | | | | |
| Unaffiliated issuers | | 82,671,610 | | |
| Redemptions in-kind | | 69,630,912 | | |
| Affiliated issuers | | (5,275,282) | | |
| Foreign currency transactions | | (7,424,764) | | |
| Total net realized gain (loss) | | | | 139,602,476 |
| Change in net unrealized appreciation (depreciation) on: | | | | |
| Investment Securities: | | | | |
| Unaffiliated issuers | | (105,822,545) | | |
| Affiliated issuers | | (9,360,926) | | |
| Assets and liabilities in foreign currencies | | (1,168,006) | | |
| Total change in net unrealized appreciation (depreciation) | | | | (116,351,477) |
| Net gain (loss) | | | | 23,250,999 |
| Net increase (decrease) in net assets resulting from operations | | | $ | 147,215,623 |
| Statement of Changes in Net Assets |
| |
| | Year ended October 31, 2023 | | Year ended October 31, 2022 |
| Increase (Decrease) in Net Assets | | | | |
| Operations | | | | |
| Net investment income (loss) | $ | 123,964,624 | $ | 133,720,673 |
| Net realized gain (loss) | | 139,602,476 | | 50,400,505 |
| Change in net unrealized appreciation (depreciation) | | (116,351,477) | | (624,986,211) |
| Net increase (decrease) in net assets resulting from operations | | 147,215,623 | | (440,865,033) |
| Distributions to shareholders | | (160,606,918) | | (132,881,856) |
| | | | | |
| Share transactions | | | | |
| Proceeds from sales of shares | | 675,016,952 | | 958,291,641 |
| Reinvestment of distributions | | 160,606,918 | | 132,881,856 |
| Cost of shares redeemed | | (1,711,870,454) | | (1,175,374,764) |
| | | | | |
Net increase (decrease) in net assets resulting from share transactions | | (876,246,584) | | (84,201,267) |
| Total increase (decrease) in net assets | | (889,637,879) | | (657,948,156) |
| | | | | |
| Net Assets | | | | |
| Beginning of period | | 5,407,197,010 | | 6,065,145,166 |
| End of period | $ | 4,517,559,131 | $ | 5,407,197,010 |
| | | | | |
| Other Information | | | | |
| Shares | | | | |
| Sold | | 49,168,680 | | 67,737,438 |
| Issued in reinvestment of distributions | | 12,084,794 | | 9,351,292 |
| Redeemed | | (122,728,311) | | (83,298,959) |
| Net increase (decrease) | | (61,474,837) | | (6,210,229) |
| | | | | |
Financial Highlights
| Fidelity® Series Canada Fund |
| |
| Years ended October 31, | | 2023 | | 2022 | | 2021 | | 2020 | | 2019 |
Selected Per-Share Data | | | | | | | | | | |
| Net asset value, beginning of period | $ | 13.37 | $ | 14.77 | $ | 9.77 | $ | 10.89 | $ | 9.99 |
| Income from Investment Operations | | | | | | | | | | |
Net investment income (loss) A,B | | .33 | | .32 | | .28 | | .27 | | .27 |
| Net realized and unrealized gain (loss) | | (.12) | | (1.40) | | 4.97 | | (1.14) | | .86 |
| Total from investment operations | | .21 | | (1.08) | | 5.25 | | (.87) | | 1.13 |
| Distributions from net investment income | | (.40) | | (.32) | | (.25) | | (.25) | | (.23) |
| Distributions from net realized gain | | (.01) | | - | | - | | - | | - |
| Total distributions | | (.41) | | (.32) | | (.25) | | (.25) | | (.23) |
| Net asset value, end of period | $ | 13.17 | $ | 13.37 | $ | 14.77 | $ | 9.77 | $ | 10.89 |
Total Return C | | 1.54% | | (7.45)% | | 54.40% | | (8.22)% | | 11.62% |
Ratios to Average Net Assets B,D,E | | | | | | | | | | |
| Expenses before reductions | | .01% | | -% F | | -% F | | -% F | | -% F |
| Expenses net of fee waivers, if any | | .01% | | -% F | | -% F | | -% F | | -% F |
| Expenses net of all reductions | | .01% | | -% F | | -% F | | -% F | | -% F |
| Net investment income (loss) | | 2.41% | | 2.29% | | 2.13% | | 2.70% | | 2.63% |
| Supplemental Data | | | | | | | | | | |
| Net assets, end of period (000 omitted) | $ | 4,517,559 | $ | 5,407,197 | $ | 6,065,145 | $ | 3,914,417 | $ | 1,916,409 |
Portfolio turnover rate G | | 15% H | | 19% H | | 19% | | 14% | | 12% H |
ACalculated based on average shares outstanding during the period.
BNet investment income (loss) is affected by the timing of the declaration of dividends by any underlying mutual funds or exchange-traded funds (ETFs). Net investment income (loss) of any mutual funds or ETFs is not included in the Fund's net investment income (loss) ratio.
CTotal returns would have been lower if certain expenses had not been reduced during the applicable periods shown.
DFees and expenses of any underlying mutual funds or exchange-traded funds (ETFs) are not included in the Fund's expense ratio. The Fund indirectly bears its proportionate share of these expenses. For additional expense information related to investments in Fidelity Central Funds, please refer to the "Investments in Fidelity Central Funds" note found in the Notes to Financial Statements section of the most recent Annual or Semi-Annual report.
EExpense ratios reflect operating expenses of the class. Expenses before reductions do not reflect amounts reimbursed, waived, or reduced through arrangements with the investment adviser, brokerage services, or other offset arrangements, if applicable, and do not represent the amount paid by the class during periods when reimbursements, waivers or reductions occur.
FAmount represents less than .005%.
GAmount does not include the portfolio activity of any underlying mutual funds or exchange-traded funds (ETFs).
HPortfolio turnover rate excludes securities received or delivered in-kind.
For the period ended October 31, 2023
1. Organization.
Fidelity Series Canada Fund (the Fund) is a fund of Fidelity Investment Trust (the Trust) and is authorized to issue an unlimited number of shares. Shares are offered only to certain other Fidelity funds, Fidelity managed 529 plans, and Fidelity managed collective investment trusts. The Trust is registered under the Investment Company Act of 1940, as amended (the 1940 Act), as an open-end management investment company organized as a Massachusetts business trust.
2. Investments in Fidelity Central Funds.
Funds may invest in Fidelity Central Funds, which are open-end investment companies generally available only to other investment companies and accounts managed by the investment adviser and its affiliates. The Schedule of Investments lists any Fidelity Central Funds held as an investment as of period end, but does not include the underlying holdings of each Fidelity Central Fund. An investing fund indirectly bears its proportionate share of the expenses of the underlying Fidelity Central Funds.
Based on its investment objective, each Fidelity Central Fund may invest or participate in various investment vehicles or strategies that are similar to those of the investing fund. These strategies are consistent with the investment objectives of the investing fund and may involve certain economic risks which may cause a decline in value of each of the Fidelity Central Funds and thus a decline in the value of the investing fund.
| Fidelity Central Fund | Investment Manager | Investment Objective | Investment Practices | Expense RatioA |
| Fidelity Money Market Central Funds | Fidelity Management & Research Company LLC (FMR) | Each fund seeks to obtain a high level of current income consistent with the preservation of capital and liquidity. | Short-term Investments | Less than .005% |
A Expenses expressed as a percentage of average net assets and are as of each underlying Central Fund's most recent annual or semi-annual shareholder report.
A complete unaudited list of holdings for each Fidelity Central Fund is available upon request or at the Securities and Exchange Commission website at www.sec.gov. In addition, the financial statements of the Fidelity Central Funds which contain the significant accounting policies (including investment valuation policies) of those funds, and are not covered by the Report of Independent Registered Public Accounting Firm, are available on the Securities and Exchange Commission website or upon request.
3. Significant Accounting Policies.
The Fund is an investment company and applies the accounting and reporting guidance of the Financial Accounting Standards Board (FASB) Accounting Standards Codification Topic 946 Financial Services - Investment Companies. The financial statements have been prepared in conformity with accounting principles generally accepted in the United States of America (GAAP), which require management to make certain estimates and assumptions at the date of the financial statements. Actual results could differ from those estimates. Subsequent events, if any, through the date that the financial statements were issued have been evaluated in the preparation of the financial statements. The Fund's Schedule of Investments lists any underlying mutual funds or exchange-traded funds (ETFs) but does not include the underlying holdings of these funds. The following summarizes the significant accounting policies of the Fund:
Investment Valuation. Investments are valued as of 4:00 p.m. Eastern time on the last calendar day of the period. The Board of Trustees (the Board) has designated the Fund's investment adviser as the valuation designee responsible for the fair valuation function and performing fair value determinations as needed. The investment adviser has established a Fair Value Committee (the Committee) to carry out the day-to-day fair valuation responsibilities and has adopted policies and procedures to govern the fair valuation process and the activities of the Committee. In accordance with these fair valuation policies and procedures, which have been approved by the Board, the Fund attempts to obtain prices from one or more third party pricing services or brokers to value its investments. When current market prices, quotations or currency exchange rates are not readily available or reliable, investments will be fair valued in good faith by the Committee, in accordance with the policies and procedures. Factors used in determining fair value vary by investment type and may include market or investment specific events, transaction data, estimated cash flows, and market observations of comparable investments. The frequency that the fair valuation procedures are used cannot be predicted and they may be utilized to a significant extent. The Committee manages the Fund's fair valuation practices and maintains the fair valuation policies and procedures. The Fund's investment adviser reports to the Board information regarding the fair valuation process and related material matters.
The Fund categorizes the inputs to valuation techniques used to value its investments into a disclosure hierarchy consisting of three levels as shown below:
Level 1 - unadjusted quoted prices in active markets for identical investments
Level 2 - other significant observable inputs (including quoted prices for similar investments, interest rates, prepayment speeds, etc.)
Level 3 - unobservable inputs (including the Fund's own assumptions based on the best information available)
Valuation techniques used to value the Fund's investments by major category are as follows:
Equity securities, including restricted securities, for which market quotations are readily available, are valued at the last reported sale price or official closing price as reported by a third party pricing service on the primary market or exchange on which they are traded and are categorized as Level 1 in the hierarchy. In the event there were no sales during the day or closing prices are not available, securities are valued at the last quoted bid price or may be valued using the last available price and are generally categorized as Level 2 in the hierarchy. For foreign equity securities, when market or security specific events arise, comparisons to the valuation of American Depositary Receipts (ADRs), futures contracts, ETFs and certain indexes as well as quoted prices for similar securities may be used and would be categorized as Level 2 in the hierarchy. For equity securities, including restricted securities, where observable inputs are limited, assumptions about market activity and risk are used and these securities may be categorized as Level 3 in the hierarchy.
Debt securities, including restricted securities, are valued based on evaluated prices received from third party pricing services or from brokers who make markets in such securities. Corporate bonds are valued by pricing services who utilize matrix pricing which considers yield or price of bonds of comparable quality, coupon, maturity and type or by broker-supplied prices. When independent prices are unavailable or unreliable, debt securities may be valued utilizing pricing methodologies which consider similar factors that would be used by third party pricing services. Debt securities are generally categorized as Level 2 in the hierarchy but may be Level 3 depending on the circumstances.
Investments in open-end mutual funds, including the Fidelity Central Funds, are valued at their closing net asset value (NAV) each business day and are categorized as Level 1 in the hierarchy.
Changes in valuation techniques may result in transfers in or out of an assigned level within the disclosure hierarchy. The aggregate value of investments by input level as of October 31, 2023 is included at the end of the Fund's Schedule of Investments.
Foreign Currency. Certain Funds may use foreign currency contracts to facilitate transactions in foreign-denominated securities. Gains and losses from these transactions may arise from changes in the value of the foreign currency or if the counterparties do not perform under the contracts' terms.
Foreign-denominated assets, including investment securities, and liabilities are translated into U.S. dollars at the exchange rates at period end. Purchases and sales of investment securities, income and dividends received, and expenses denominated in foreign currencies are translated into U.S. dollars at the exchange rate in effect on the transaction date.
The effects of exchange rate fluctuations on investments are included with the net realized and unrealized gain (loss) on investment securities. Other foreign currency transactions resulting in realized and unrealized gain (loss) are disclosed separately.
Investment Transactions and Income. For financial reporting purposes, the Fund's investment holdings and NAV include trades executed through the end of the last business day of the period. The NAV per share for processing shareholder transactions is calculated as of the close of business of the New York Stock Exchange (NYSE), normally 4:00 p.m. Eastern time and includes trades executed through the end of the prior business day. Gains and losses on securities sold are determined on the basis of identified cost. Commissions paid to certain brokers with whom the investment adviser, or its affiliates, places trades on behalf of a fund include an amount in addition to trade execution, which may be rebated back to a fund. Any such rebates are included in net realized gain (loss) on investments in the Statement of Operations. Dividend income is recorded on the ex-dividend date, except for certain dividends from foreign securities where the ex-dividend date may have passed, which are recorded as soon as the Fund is informed of the ex-dividend date. Non-cash dividends included in dividend income, if any, are recorded at the fair market value of the securities received. Income and capital gain distributions from Fidelity Central Funds, if any, are recorded on the ex-dividend date. Certain distributions received by the Fund represent a return of capital or capital gain. The Fund determines the components of these distributions subsequent to the ex-dividend date, based upon receipt of tax filings or other correspondence relating to the underlying investment. These distributions are recorded as a reduction of cost of investments and/or as a realized gain. Interest income is accrued as earned and includes coupon interest and amortization of premium and accretion of discount on debt securities as applicable. Investment income is recorded net of foreign taxes withheld where recovery of such taxes is uncertain.
Expenses. Expenses directly attributable to a fund are charged to that fund. Expenses attributable to more than one fund are allocated among the respective funds on the basis of relative net assets or other appropriate methods. Expenses included in the accompanying financial statements reflect the expenses of that fund and do not include any expenses associated with any underlying mutual funds or exchange-traded funds. Although not included in a fund's expenses, a fund indirectly bears its proportionate share of these expenses through the net asset value of each underlying mutual fund or exchange-traded fund. Expense estimates are accrued in the period to which they relate and adjustments are made when actual amounts are known.
Income Tax Information and Distributions to Shareholders. Each year, the Fund intends to qualify as a regulated investment company under Subchapter M of the Internal Revenue Code, including distributing substantially all of its taxable income and realized gains. As a result, no provision for U.S. Federal income taxes is required. As of October 31, 2023, the Fund did not have any unrecognized tax benefits in the financial statements; nor is the Fund aware of any tax positions for which it is reasonably possible that the total amounts of unrecognized tax benefits will significantly change in the next twelve months. The Fund files a U.S. federal tax return, in addition to state and local tax returns as required. The Fund's federal income tax returns are subject to examination by the Internal Revenue Service (IRS) for a period of three fiscal years after they are filed. State and local tax returns may be subject to examination for an additional fiscal year depending on the jurisdiction. Foreign taxes are provided for based on the Fund's understanding of the tax rules and rates that exist in the foreign markets in which it invests.
Distributions are declared and recorded on the ex-dividend date. Income and capital gain distributions are determined in accordance with income tax regulations, which may differ from GAAP. In addition, the Fund claimed a portion of the payment made to redeeming shareholders as a distribution for income tax purposes.
Capital accounts within the financial statements are adjusted for permanent book-tax differences. These adjustments have no impact on net assets or the results of operations. Capital accounts are not adjusted for temporary book-tax differences which will reverse in a subsequent period.
Book-tax differences are primarily due to foreign currency transactions, passive foreign investment companies (PFIC), redemptions in-kind, losses deferred due to wash sales.
As of period end, the cost and unrealized appreciation (depreciation) in securities, and derivatives if applicable, for federal income tax purposes were as follows:
| Gross unrealized appreciation | $1,120,669,428 |
| Gross unrealized depreciation | (203,558,688) |
| Net unrealized appreciation (depreciation) | $917,110,740 |
| Tax Cost | $3,750,518,838 |
The tax-based components of distributable earnings as of period end were as follows:
| Undistributed ordinary income | $110,031,867 |
| Undistributed long-term capital gain | $42,391,622 |
| Net unrealized appreciation (depreciation) on securities and other investments | $915,914,145 |
The tax character of distributions paid was as follows:
| | October 31, 2023 | October 31, 2022 |
| Ordinary Income | $157,465,462 | $132,881,856 |
| Long-term Capital Gains | 3,141,456 | - |
| Total | $160,606,918 | $132,881,856 |
Restricted Securities (including Private Placements). Funds may invest in securities that are subject to legal or contractual restrictions on resale. These securities generally may be resold in transactions exempt from registration or to the public if the securities are registered. Disposal of these securities may involve time-consuming negotiations and expense, and prompt sale at an acceptable price may be difficult. Information regarding restricted securities held at period end is included at the end of the Schedule of Investments, if applicable.
4. Purchases and Sales of Investments.
Purchases and sales of securities, other than short-term securities and in-kind transactions, as applicable, are noted in the table below.
| | Purchases ($) | Sales ($) |
| Fidelity Series Canada Fund | 744,250,273 | 1,569,551,440 |
Unaffiliated Redemptions In-Kind. Shares that were redeemed in-kind for investments, including accrued interest and cash, if any, are shown in the table below. The net realized gain or loss on investments delivered through in-kind redemptions is included in the "Net realized gain (loss) on: Redemptions in-kind" line in the accompanying Statement of Operations. The amount of the in-kind redemptions is included in share transactions in the accompanying Statement of Changes in Net Assets. There was no gain or loss for federal income tax purposes.
| | Shares | Total net realized gain or loss ($) | Total Proceeds ($) |
| Fidelity Series Canada Fund | 10,679,138 | 69,630,912 | 146,531,701 |
5. Fees and Other Transactions with Affiliates.
Management Fee. Fidelity Management & Research Company LLC (the investment adviser) and its affiliates provide the Fund with investment management related services for which the Fund does not pay a management fee. Under the management contract, the investment adviser or an affiliate pays all ordinary operating expenses of the Fund, except custody fees, fees and expenses of the independent Trustees, and certain miscellaneous expenses such as proxy and shareholder meeting expenses.
Interfund Lending Program. Pursuant to an Exemptive Order issued by the Securities and Exchange Commission (the SEC), the Fund, along with other registered investment companies having management contracts with Fidelity Management & Research Company LLC (FMR), or other affiliated entities of FMR, may participate in an interfund lending program. This program provides an alternative credit facility allowing the Fund to borrow from, or lend money to, other participating affiliated funds. At period end, there were no interfund loans outstanding. Activity in this program during the period for which loans were outstanding was as follows:
| | Borrower or Lender | Average Loan Balance | Weighted Average Interest Rate | Interest Expense |
| Fidelity Series Canada Fund | Borrower | $ 173,586,143 | 5.05% | $340,956 |
Interfund Trades. Funds may purchase from or sell securities to other Fidelity Funds under procedures adopted by the Board. The procedures have been designed to ensure these interfund trades are executed in accordance with Rule 17a-7 of the 1940 Act. Any interfund trades are included within the respective purchases and sales amounts shown in the Purchases and Sales of Investments note. Interfund trades during the period are noted in the table below.
| | Purchases ($) | Sales ($) | Realized Gain (Loss) ($) |
| Fidelity Series Canada Fund | 87,099,429 | 26,067,848 | 283,262 |
Prior Fiscal Year Affiliated Redemptions In-Kind. Shares that were redeemed in-kind for investments, including accrued interest and cash, if any, are shown in the table below; along with realized gain or loss on investments delivered through in-kind redemptions. The amount of the in-kind redemptions is included in share transactions in the accompanying Statement of Changes in Net Assets. There was no gain or loss for federal income tax purposes.
| | Shares | Total net realized gain or loss ($) | Total Proceeds ($) |
| Fidelity Series Canada Fund | 1,619,205 | 9,969,579 | 21,259,781 |
6. Committed Line of Credit.
Certain Funds participate with other funds managed by the investment adviser or an affiliate in a $4.25 billion credit facility (the "line of credit") to be utilized for temporary or emergency purposes to fund shareholder redemptions or for other short-term liquidity purposes. The commitment fees on the pro-rata portion of the line of credit are borne by the investment adviser. During the period, there were no borrowings on this line of credit.
7. Security Lending.
Funds lend portfolio securities from time to time in order to earn additional income. Lending agents are used, including National Financial Services (NFS), an affiliate of the investment adviser. Pursuant to a securities lending agreement, NFS will receive a fee, which is capped at 9.9% of a fund's daily lending revenue, for its services as lending agent. A fund may lend securities to certain qualified borrowers, including NFS. On the settlement date of the loan, a fund receives collateral (in the form of U.S. Treasury obligations, letters of credit and/or cash) against the loaned securities and maintains collateral in an amount not less than 100% of the market value of the loaned securities during the period of the loan. The market value of the loaned securities is determined at the close of business of a fund and any additional required collateral is delivered to a fund on the next business day. A fund or borrower may terminate the loan at any time, and if the borrower defaults on its obligation to return the securities loaned because of insolvency or other reasons, a fund may apply collateral received from the borrower against the obligation. A fund may experience delays and costs in recovering the securities loaned. Any cash collateral received is invested in the Fidelity Securities Lending Cash Central Fund. Any loaned securities are identified as such in the Schedule of Investments, and the value of loaned securities and cash collateral at period end, as applicable, are presented in the Statement of Assets and Liabilities. Security lending income represents the income earned on investing cash collateral, less rebates paid to borrowers and any lending agent fees associated with the loan, plus any premium payments received for lending certain types of securities. Security lending income is presented in the Statement of Operations as a component of income from Fidelity Central Funds. Affiliated security lending activity, if any, was as follows:
| | Total Security Lending Fees Paid to NFS | Security Lending Income From Securities Loaned to NFS | Value of Securities Loaned to NFS at Period End |
| Fidelity Series Canada Fund | $232,995 | $- | $- |
8. Other.
A fund's organizational documents provide former and current trustees and officers with a limited indemnification against liabilities arising in connection with the performance of their duties to the fund. In the normal course of business, a fund may also enter into contracts that provide general indemnifications. A fund's maximum exposure under these arrangements is unknown as this would be dependent on future claims that may be made against a fund. The risk of material loss from such claims is considered remote.
At the end of the period, mutual funds and accounts managed by the investment adviser or its affiliates were the owners of record of all of the outstanding shares of the Fund.
9. Risk and Uncertainties.
Many factors affect a fund's performance. Developments that disrupt global economies and financial markets, such as pandemics, epidemics, outbreaks of infectious diseases, war, terrorism, and environmental disasters, may significantly affect a fund's investment performance. The effects of these developments to a fund will be impacted by the types of securities in which a fund invests, the financial condition, industry, economic sector, and geographic location of an issuer, and a fund's level of investment in the securities of that issuer. Significant concentrations in security types, issuers, industries, sectors, and geographic locations may magnify the factors that affect a fund's performance.
To the Board of Trustees of Fidelity Investment Trust and Shareholders of Fidelity Series Canada Fund
Opinion on the Financial Statements
We have audited the accompanying statement of assets and liabilities, including the schedule of investments, of Fidelity Series Canada Fund (one of the funds constituting Fidelity Investment Trust, referred to hereafter as the "Fund") as of October 31, 2023, the related statement of operations for the year ended October 31, 2023, the statement of changes in net assets for each of the two years in the period ended October 31, 2023, including the related notes, and the financial highlights for each of the five years in the period ended October 31, 2023 (collectively referred to as the "financial statements"). In our opinion, the financial statements present fairly, in all material respects, the financial position of the Fund as of October 31, 2023, the results of its operations for the year then ended, the changes in its net assets for each of the two years in the period ended October 31, 2023 and the financial highlights for each of the five years in the period ended October 31, 2023 in conformity with accounting principles generally accepted in the United States of America.
Basis for Opinion
These financial statements are the responsibility of the Fund's management. Our responsibility is to express an opinion on the Fund's financial statements based on our audits. We are a public accounting firm registered with the Public Company Accounting Oversight Board (United States) (PCAOB) and are required to be independent with respect to the Fund in accordance with the U.S. federal securities laws and the applicable rules and regulations of the Securities and Exchange Commission and the PCAOB.
We conducted our audits of these financial statements in accordance with the standards of the PCAOB. Those standards require that we plan and perform the audit to obtain reasonable assurance about whether the financial statements are free of material misstatement, whether due to error or fraud.
Our audits included performing procedures to assess the risks of material misstatement of the financial statements, whether due to error or fraud, and performing procedures that respond to those risks. Such procedures included examining, on a test basis, evidence regarding the amounts and disclosures in the financial statements. Our audits also included evaluating the accounting principles used and significant estimates made by management, as well as evaluating the overall presentation of the financial statements. Our procedures included confirmation of securities owned as of October 31, 2023 by correspondence with the custodian, issuers of privately offered securities and brokers; when replies were not received from brokers, we performed other auditing procedures. We believe that our audits provide a reasonable basis for our opinion.
/s/ PricewaterhouseCoopers LLP
Boston, Massachusetts
December 15, 2023
We have served as the auditor of one or more investment companies in the Fidelity group of funds since 1932.
The Trustees, Members of the Advisory Board (if any), and officers of the trust and fund, as applicable, are listed below. The Board of Trustees governs the fund and is responsible for protecting the interests of shareholders. The Trustees are experienced executives who meet periodically throughout the year to oversee the fund's activities, review contractual arrangements with companies that provide services to the fund, oversee management of the risks associated with such activities and contractual arrangements, and review the fund's performance. Except for Jonathan Chiel, each of the Trustees oversees 322 funds. Mr. Chiel oversees 191 funds.
The Trustees hold office without limit in time except that (a) any Trustee may resign; (b) any Trustee may be removed by written instrument, signed by at least two-thirds of the number of Trustees prior to such removal; (c) any Trustee who requests to be retired or who has become incapacitated by illness or injury may be retired by written instrument signed by a majority of the other Trustees; and (d) any Trustee may be removed at any special meeting of shareholders by a two-thirds vote of the outstanding voting securities of the trust. Each Trustee who is not an interested person (as defined in the 1940 Act) of the trust and the fund is referred to herein as an Independent Trustee. Each Independent Trustee shall retire not later than the last day of the calendar year in which his or her 75th birthday occurs. The Independent Trustees may waive this mandatory retirement age policy with respect to individual Trustees. Officers and Advisory Board Members hold office without limit in time, except that any officer or Advisory Board Member may resign or may be removed by a vote of a majority of the Trustees at any regular meeting or any special meeting of the Trustees. Except as indicated, each individual has held the office shown or other offices in the same company for the past five years.
The fund's Statement of Additional Information (SAI) includes more information about the Trustees. To request a free copy, call Fidelity at 1-800-544-8544.
Experience, Skills, Attributes, and Qualifications of the Trustees. The Governance and Nominating Committee has adopted a statement of policy that describes the experience, qualifications, attributes, and skills that are necessary and desirable for potential Independent Trustee candidates (Statement of Policy). The Board believes that each Trustee satisfied at the time he or she was initially elected or appointed a Trustee, and continues to satisfy, the standards contemplated by the Statement of Policy. The Governance and Nominating Committee also engages professional search firms to help identify potential Independent Trustee candidates who have the experience, qualifications, attributes, and skills consistent with the Statement of Policy. From time to time, additional criteria based on the composition and skills of the current Independent Trustees, as well as experience or skills that may be appropriate in light of future changes to board composition, business conditions, and regulatory or other developments, have also been considered by the professional search firms and the Governance and Nominating Committee. In addition, the Board takes into account the Trustees' commitment and participation in Board and committee meetings, as well as their leadership of standing and ad hoc committees throughout their tenure.
In determining that a particular Trustee was and continues to be qualified to serve as a Trustee, the Board has considered a variety of criteria, none of which, in isolation, was controlling. The Board believes that, collectively, the Trustees have balanced and diverse experience, qualifications, attributes, and skills, which allow the Board to operate effectively in governing the fund and protecting the interests of shareholders. Information about the specific experience, skills, attributes, and qualifications of each Trustee, which in each case led to the Board's conclusion that the Trustee should serve (or continue to serve) as a trustee of the fund, is provided below.
Board Structure and Oversight Function. Robert A. Lawrence is an interested person and currently serves as Chair. The Trustees have determined that an interested Chair is appropriate and benefits shareholders because an interested Chair has a personal and professional stake in the quality and continuity of services provided to the fund. Independent Trustees exercise their informed business judgment to appoint an individual of their choosing to serve as Chair, regardless of whether the Trustee happens to be independent or a member of management. The Independent Trustees have determined that they can act independently and effectively without having an Independent Trustee serve as Chair and that a key structural component for assuring that they are in a position to do so is for the Independent Trustees to constitute a substantial majority for the Board. The Independent Trustees also regularly meet in executive session. David M. Thomas serves as Lead Independent Trustee and as such (i) acts as a liaison between the Independent Trustees and management with respect to matters important to the Independent Trustees and (ii) with management prepares agendas for Board meetings.
Fidelity® funds are overseen by different Boards of Trustees. The fund's Board oversees Fidelity's high income and certain equity funds, and other Boards oversee Fidelity's alternative investment, investment-grade bond, money market, asset allocation, and other equity funds. The asset allocation funds may invest in Fidelity® funds overseen by the fund's Board. The use of separate Boards, each with its own committee structure, allows the Trustees of each group of Fidelity® funds to focus on the unique issues of the funds they oversee, including common research, investment, and operational issues. On occasion, the separate Boards establish joint committees to address issues of overlapping consequences for the Fidelity® funds overseen by each Board.
The Trustees operate using a system of committees to facilitate the timely and efficient consideration of all matters of importance to the Trustees, the fund, and fund shareholders and to facilitate compliance with legal and regulatory requirements and oversight of the fund's activities and associated risks. The Board, acting through its committees, has charged FMR and its affiliates with (i) identifying events or circumstances the occurrence of which could have demonstrably adverse effects on the fund's business and/or reputation; (ii) implementing processes and controls to lessen the possibility that such events or circumstances occur or to mitigate the effects of such events or circumstances if they do occur; and (iii) creating and maintaining a system designed to evaluate continuously business and market conditions in order to facilitate the identification and implementation processes described in (i) and (ii) above. Because the day-to-day operations and activities of the fund are carried out by or through FMR, its affiliates, and other service providers, the fund's exposure to risks is mitigated but not eliminated by the processes overseen by the Trustees. While each of the Board's committees has responsibility for overseeing different aspects of the fund's activities, oversight is exercised primarily through the Operations, Audit, and Compliance Committees. Appropriate personnel, including but not limited to the fund's Chief Compliance Officer (CCO), FMR's internal auditor, the independent accountants, the fund's Treasurer and portfolio management personnel, make periodic reports to the Board's committees, as appropriate, including an annual review of Fidelity's risk management program for the Fidelity® funds. The responsibilities of each standing committee, including their oversight responsibilities, are described further under "Standing Committees of the Trustees."
Interested Trustees*:
Correspondence intended for a Trustee who is an interested person may be sent to Fidelity Investments, 245 Summer Street, Boston, Massachusetts 02210.
Name, Year of Birth; Principal Occupations and Other Relevant Experience+
Jonathan Chiel (1957)
Year of Election or Appointment: 2016
Trustee
Mr. Chiel also serves as Trustee of other Fidelity® funds. Mr. Chiel is General Counsel (2012-present) and Head of Legal, Risk and Compliance (2022-present). Mr Chiel serves as Executive Vice President and General Counsel for FMR LLC (diversified financial services company, 2012-present) and Director and President for OH Company LLC (holding company, 2018-present). Previously, Mr. Chiel served as general counsel (2004-2012) and senior vice president and deputy general counsel (2000-2004) for John Hancock Financial Services; a partner with Choate, Hall & Stewart (1996-2000) (law firm); and an Assistant United States Attorney for the United States Attorney's Office of the District of Massachusetts (1986-95), including Chief of the Criminal Division (1993-1995). Mr. Chiel is a director on the boards of the Boston Bar Foundation and the Maimonides School.
Bettina Doulton (1964)
Year of Election or Appointment: 2021
Trustee
Ms. Doulton also serves as Trustee of other Fidelity® funds. Prior to her retirement, Ms. Doulton served in a variety of positions at Fidelity Investments, including as a managing director of research (2006-2007), portfolio manager to certain Fidelity® funds (1993-2005), equity analyst and portfolio assistant (1990-1993), and research assistant (1987-1990). Ms. Doulton currently owns and operates Phi Builders + Architects and Cellardoor Winery. Previously, Ms. Doulton served as a member of the Board of Brown Capital Management, LLC (2014-2018).
Robert A. Lawrence (1952)
Year of Election or Appointment: 2020
Trustee
Chair of the Board of Trustees
Mr. Lawrence also serves as Trustee of other funds. Previously, Mr. Lawrence served as a Trustee and Member of the Advisory Board of certain funds. Prior to his retirement in 2008, Mr. Lawrence served as Vice President of certain Fidelity® funds (2006-2008), Senior Vice President, Head of High Income Division of Fidelity Management & Research Company (investment adviser firm, 2006-2008), and President of Fidelity Strategic Investments (investment adviser firm, 2002-2005).
* Determined to be an "Interested Trustee" by virtue of, among other things, his or her affiliation with the trust or various entities under common control with FMR.
+ The information includes the Trustee's principal occupation during the last five years and other information relating to the experience, attributes, and skills relevant to the Trustee's qualifications to serve as a Trustee, which led to the conclusion that the Trustee should serve as a Trustee for the fund.
Independent Trustees:
Correspondence intended for an Independent Trustee may be sent to Fidelity Investments, P.O. Box 55235, Boston, Massachusetts 02205-5235.
Name, Year of Birth; Principal Occupations and Other Relevant Experience+
Thomas P. Bostick (1956)
Year of Election or Appointment: 2021
Trustee
Lieutenant General Bostick also serves as Trustee of other Fidelity® funds. Prior to his retirement, General Bostick (United States Army, Retired) held a variety of positions within the U.S. Army, including Commanding General and Chief of Engineers, U.S. Army Corps of Engineers (2012-2016) and Deputy Chief of Staff and Director of Human Resources, U.S. Army (2009-2012). General Bostick currently serves as a member of the Board and Finance and Governance & Sustainability Committees of CSX Corporation (transportation, 2020-present) and a member of the Board and Corporate Governance and Nominating Committee of Perma-Fix Environmental Services, Inc. (nuclear waste management, 2020-present). General Bostick serves as Chief Executive Officer of Bostick Global Strategies, LLC (consulting, 2016-present), as a member of the Board of HireVue, Inc. (video interview and assessment, 2020-present), as a member of the Board of Allonnia (biotechnology and engineering solutions, 2022-present) and on the Advisory Board of Solugen, Inc. (specialty bio-based chemicals manufacturer, 2022-present). Previously, General Bostick served as a Member of the Advisory Board of certain Fidelity® funds (2021), President, Intrexon Bioengineering (2018-2020) and Chief Operating Officer (2017-2020) and Senior Vice President of the Environment Sector (2016-2017) of Intrexon Corporation (biopharmaceutical company).
Dennis J. Dirks (1948)
Year of Election or Appointment: 2005
Trustee
Mr. Dirks also serves as Trustee of other Fidelity® funds. Prior to his retirement in May 2003, Mr. Dirks served as Chief Operating Officer and as a member of the Board of The Depository Trust & Clearing Corporation (financial markets infrastructure), President, Chief Operating Officer and a member of the Board of The Depository Trust Company (DTC), President and a member of the Board of the National Securities Clearing Corporation (NSCC), Chief Executive Officer and a member of the Board of the Government Securities Clearing Corporation and Chief Executive Officer and a member of the Board of the Mortgage-Backed Securities Clearing Corporation. Mr. Dirks currently serves as a member of the Finance Committee (2016-present) and Board (2017-present) and is Treasurer (2018-present) of the Asolo Repertory Theatre.
Donald F. Donahue (1950)
Year of Election or Appointment: 2018
Trustee
Mr. Donahue also serves as Trustee of other Fidelity® funds. Mr. Donahue serves as President and Chief Executive Officer of Miranda Partners, LLC (risk consulting for the financial services industry, 2012-present). Previously, Mr. Donahue served as Chief Executive Officer (2006-2012), Chief Operating Officer (2003-2006) and Managing Director, Customer Marketing and Development (1999-2003) of The Depository Trust & Clearing Corporation (financial markets infrastructure). Mr. Donahue currently serves as a member (2007-present) and Co-Chairman (2016-present) of the Board of United Way of New York. Mr. Donahue previously served as a member of the Advisory Board of certain Fidelity® funds (2015-2018) and as a member of the Board of The Leadership Academy (previously NYC Leadership Academy) (2012-2022).
Vicki L. Fuller (1957)
Year of Election or Appointment: 2020
Trustee
Ms. Fuller also serves as Trustee of other Fidelity® funds. Previously, Ms. Fuller served as a member of the Advisory Board of certain Fidelity® funds (2018-2020), Chief Investment Officer of the New York State Common Retirement Fund (2012-2018) and held a variety of positions at AllianceBernstein L.P. (global asset management, 1985-2012), including Managing Director (2006-2012) and Senior Vice President and Senior Portfolio Manager (2001-2006). Ms. Fuller currently serves as a member of the Board, Audit Committee and Nominating and Governance Committee of two Blackstone business development companies (2020-present), as a member of the Board of Treliant, LLC (consulting, 2019-present), as a member of the Board of Ariel Alternatives, LLC (private equity, 2022-present) and as a member of the Board and Chair of the Audit Committee of Gusto, Inc. (software, 2021-present). In addition, Ms. Fuller currently serves as a member of the Board of Roosevelt University (2019-present) and as a member of the Executive Board of New York University's Stern School of Business. Ms. Fuller previously served as a member of the Board, Audit Committee and Nominating and Governance Committee of The Williams Companies, Inc. (natural gas infrastructure, 2018-2021).
Patricia L. Kampling (1959)
Year of Election or Appointment: 2020
Trustee
Ms. Kampling also serves as Trustee of other Fidelity® funds. Prior to her retirement, Ms. Kampling served as Chairman of the Board and Chief Executive Officer (2012-2019), President and Chief Operating Officer (2011-2012) and Executive Vice President and Chief Financial Officer (2010-2011) of Alliant Energy Corporation. Ms. Kampling currently serves as a member of the Board, Finance Committee and Governance, Compensation and Nominating Committee of Xcel Energy Inc. (utilities company, 2020-present) and as a member of the Board, Audit, Finance and Risk Committee and Safety, Environmental, Technology and Operations Committee and Chair of the Executive Development and Compensation Committee of American Water Works Company, Inc. (utilities company, 2019-present). In addition, Ms. Kampling currently serves as a member of the Board of the Nature Conservancy, Wisconsin Chapter (2019-present). Previously, Ms. Kampling served as a Member of the Advisory Board of certain Fidelity® funds (2020), a member of the Board, Compensation Committee and Executive Committee and Chair of the Audit Committee of Briggs & Stratton Corporation (manufacturing, 2011-2021), a member of the Board of Interstate Power and Light Company (2012-2019) and Wisconsin Power and Light Company (2012-2019) (each a subsidiary of Alliant Energy Corporation) and as a member of the Board and Workforce Development Committee of the Business Roundtable (2018-2019).
Thomas A. Kennedy (1955)
Year of Election or Appointment: 2021
Trustee
Mr. Kennedy also serves as Trustee of other Fidelity® funds. Previously, Mr. Kennedy served as a Member of the Advisory Board of certain Fidelity® funds (2020) and held a variety of positions at Raytheon Company (aerospace and defense, 1983-2020), including Chairman and Chief Executive Officer (2014-2020) and Executive Vice President and Chief Operating Officer (2013-2014). Mr. Kennedy served as Executive Chairman of the Board of Directors of Raytheon Technologies Corporation (aerospace and defense, 2020-2021). Mr. Kennedy serves as a Director of the Board of Directors of Textron Inc. (aerospace and defense, 2023-present).
Oscar Munoz (1959)
Year of Election or Appointment: 2021
Trustee
Mr. Munoz also serves as Trustee of other Fidelity® funds. Prior to his retirement, Mr. Munoz served as Executive Chairman (2020-2021), Chief Executive Officer (2015-2020), President (2015-2016) and a member of the Board (2010-2021) of United Airlines Holdings, Inc. Mr. Munoz currently serves as a member of the Board of CBRE Group, Inc. (commercial real estate, 2020-present), a member of the Board of Univision Communications, Inc. (Hispanic media, 2020-present), a member of the Board of Archer Aviation Inc. (2021-present), a member of the Defense Business Board of the United States Department of Defense (2021-present) and a member of the Board of Salesforce.com, Inc. (cloud-based software, 2022-present). Previously, Mr. Munoz served as a Member of the Advisory Board of certain Fidelity® funds (2021).
David M. Thomas (1949)
Year of Election or Appointment: 2008
Trustee
Lead Independent Trustee
Mr. Thomas also serves as Trustee of other Fidelity® funds. Previously, Mr. Thomas served as Executive Chairman (2005-2006) and Chairman and Chief Executive Officer (2000-2005) of IMS Health, Inc. (pharmaceutical and healthcare information solutions). Mr. Thomas currently serves as a member of the Board of Fortune Brands Home and Security (home and security products, 2004-present) and as Director (2013-present) and Non-Executive Chairman of the Board (2022-present) of Interpublic Group of Companies, Inc. (marketing communication).
Susan Tomasky (1953)
Year of Election or Appointment: 2020
Trustee
Ms. Tomasky also serves as Trustee of other Fidelity® funds. Prior to her retirement, Ms. Tomasky served in various executive officer positions at American Electric Power Company, Inc. (1998-2011), including most recently as President of AEP Transmission (2007-2011). Ms. Tomasky currently serves as a member of the Board and Sustainability Committee and as Chair of the Audit Committee of Marathon Petroleum Corporation (2018-present) and as a member of the Board, Executive Committee, Corporate Governance Committee and Organization and Compensation Committee and as Lead Director of the Board of Public Service Enterprise Group, Inc. (utilities company, 2012-present) and as a member of the Board of its subsidiary company, Public Service Electric and Gas Co. (2021-present). In addition, Ms. Tomasky currently serves as a member (2009-present) and President (2020-present) of the Board of the Royal Shakespeare Company - America (2009-present), as a member of the Board of the Columbus Association for the Performing Arts (2011-present) and as a member of the Board and Kenyon in the World Committee of Kenyon College (2016-present). Previously, Ms. Tomasky served as a Member of the Advisory Board of certain Fidelity® funds (2020), as a member of the Board of the Columbus Regional Airport Authority (2007-2020), as a member of the Board (2011-2018) and Lead Independent Director (2015-2018) of Andeavor Corporation (previously Tesoro Corporation) (independent oil refiner and marketer) and as a member of the Board of Summit Midstream Partners LP (energy, 2012-2018).
Michael E. Wiley (1950)
Year of Election or Appointment: 2020
Trustee
Mr. Wiley also serves as Trustee of other Fidelity® funds. Previously, Mr. Wiley served as a member of the Advisory Board of certain Fidelity® funds (2018-2020), Chairman, President and CEO of Baker Hughes, Inc. (oilfield services, 2000-2004). Mr. Wiley also previously served as a member of the Board of Andeavor Corporation (independent oil refiner and marketer, 2005-2018), a member of the Board of Andeavor Logistics LP (natural resources logistics, 2015-2018) and a member of the Board of High Point Resources (exploration and production, 2005-2020).
+ The information includes the Trustee's principal occupation during the last five years and other information relating to the experience, attributes, and skills relevant to the Trustee's qualifications to serve as a Trustee, which led to the conclusion that the Trustee should serve as a Trustee for the fund.
Advisory Board Members and Officers:
Correspondence intended for a Member of the Advisory Board (if any) may be sent to Fidelity Investments, P.O. Box 55235, Boston, Massachusetts 02205-5235. Correspondence intended for an officer or Peter S. Lynch may be sent to Fidelity Investments, 245 Summer Street, Boston, Massachusetts 02210.
Name, Year of Birth; Principal Occupation
Vijay C. Advani (1960)
Year of Election or Appointment: 2023
Member of the Advisory Board
Mr. Advani also serves as Trustee or Member of the Advisory Board of other funds. Previously, Mr. Advani served as Executive Chairman (2020-2022), Chief Executive Officer (2017-2020) and Chief Operating Officer (2016-2017) of Nuveen (global investment manager). He also served in various capacities at Franklin Resources (global investment manager), including Co-President (2015-2016), Executive Vice President, Global Advisory Services (2008-2015), Head of Global Retail Distribution (2005-2008), Executive Managing Director, International Retail Development (2002-2005), Managing Director, Product Developments, Sales & Marketing, Asia, Eastern Europe and Africa (2000-2002) and President, Templeton Asset Management India (1995-2000). Mr. Advani also served as Senior Investment Officer of International Finance Corporation (private equity and venture capital arm of The World Bank, 1984-1995). Mr. Advani is Chairman Emeritus of the U.S. India Business Council (2018-present), a Director of The Global Impact Investing Network (2019-present), a Director of LOK Capital (Mauritius) (2022-present), a member of the Advisory Council of LOK Capital (2022-present), a Senior Advisor of Neuberger Berman (2021-present), a Senior Advisor of Seviora Holdings Pte. Ltd (Temasek-Singapore) (2021-present), a Director of Seviora Capital (Singapore) (2021-present) and an Advisor of EQUIAM (2021-present). Mr. Advani formerly served as a member of the Board of BowX Acquisition Corp. (special purpose acquisition company, 2020-2021), a member of the Board of Intellecap (advisory arm of The Aavishkaar Group, 2018-2020), a member of the Board of Nuveen Investments, Inc. (2017-2020) and a member of the Board of Docusign (software, 2016-2019).
Peter S. Lynch (1944)
Year of Election or Appointment: 2003
Member of the Advisory Board
Mr. Lynch also serves as a Member of the Advisory Board of other Fidelity® funds. Mr. Lynch is Vice Chairman and a Director of Fidelity Management & Research Company LLC (investment adviser firm). In addition, Mr. Lynch serves as a Trustee of Boston College and as the Chairman of the Inner-City Scholarship Fund. Previously, Mr. Lynch served as Vice Chairman and a Director of FMR Co., Inc. (investment adviser firm) and on the Special Olympics International Board of Directors (1997-2006).
Karen B. Peetz (1955)
Year of Election or Appointment: 2023
Member of the Advisory Board
Ms. Peetz also serves as a Member of the Advisory Board of other funds. Previously, Ms. Peetz served as Chief Administration Officer (2020-2023) of Citigroup Inc. (a diversified financial service company). She also served in various capacities at Bank of New York Mellon Corporation, including President (2013-2016), Vice Chairman, Senior Executive Vice President and Chief Executive Officer of Financial Markets & Treasury Services (2010-2013), Senior Executive Vice President and Chief Executive Officer of Global Corporate Trust (2003-2008), Senior Vice President and Division Manager of Global Payments & Trade Services (2002-2003) and Senior Vice President and Division Manager of Domestic Corporate Trust (1998-2002). Ms. Peetz also served in various capacities at Chase Manhattan Corporation (1982-1998), including Senior Vice President and Manager of Corporate Trust International Business (1996-1998), Managing Director and Manager of Corporate Trust Services (1994-1996) and Managing Director and Group Manager of Financial Institution Sales (1990-1993). Ms. Peetz currently serves as Chair of Amherst Holdings Advisory Council (2018-present), Trustee of Johns Hopkins University (2016-present), Chair of the Carey Business School Advisory Council, Member of the Johns Hopkins Medicine Board and Finance Committee and Chair of the Lyme and Tick Related Disease Institute Advisory Council. Ms. Peetz previously served as a member of the Board of Guardian Life Insurance Company of America (2019-2023), a member of the Board of Trane Technologies (2018-2022), a member of the Board of Wells Fargo Corp. (2017-2019), a member of the Board of SunCoke Energy Inc. (2012-2016), a member of the Board of Private Export Funding Corporation (2010-2016) and as a Trustee of Penn State University (2010-2014) and the United Way of New York City (2008-2010).
Heather Bonner (1977)
Year of Election or Appointment: 2023
Assistant Treasurer
Ms. Bonner also serves as an officer of other funds. Ms. Bonner is a Senior Vice President (2022-present) and is an employee of Fidelity Investments (2022-present). Ms. Bonner serves as Vice President, Treasurer, or Assistant Treasurer of certain Fidelity entities. Prior to joining Fidelity, Ms. Bonner served as Managing Director at AQR Capital Management (2013-2022) and was the Treasurer and Principal Financial Officer of the AQR Funds (2013-2022).
Craig S. Brown (1977)
Year of Election or Appointment: 2022
Deputy Treasurer
Mr. Brown also serves as an officer of other funds. Mr. Brown is a Vice President (2015-present) and is an employee of Fidelity Investments. Mr. Brown serves as Assistant Treasurer of FIMM, LLC (2021-present). Previously, Mr. Brown served as Assistant Treasurer of certain Fidelity® funds (2019-2022).
John J. Burke III (1964)
Year of Election or Appointment: 2018
Chief Financial Officer
Mr. Burke also serves as Chief Financial Officer of other funds. Mr. Burke is Head of Fidelity Fund and Investment Operations (2018-present) and is an employee of Fidelity Investments. Mr. Burke serves as President, Executive Vice President, or Director of certain Fidelity entities. Previously Mr. Burke served as head of Asset Management Investment Operations (2012-2018).
Margaret Carey (1973)
Year of Election or Appointment: 2023
Secretary and Chief Legal Officer (CLO)
Ms. Carey also serves as an officer of other funds and as CLO of certain Fidelity entities. Ms. Carey is a Senior Vice President, Deputy General Counsel (2019-present) and is an employee of Fidelity Investments.
William C. Coffey (1969)
Year of Election or Appointment: 2019
Assistant Secretary
Mr. Coffey also serves as Assistant Secretary of other funds. Mr. Coffey is a Senior Vice President, Deputy General Counsel (2010-present) and is an employee of Fidelity Investments. Previously, Mr. Coffey served as Secretary and CLO of certain funds (2018-2019); CLO, Secretary, or Senior Vice President of certain Fidelity entities and Assistant Secretary of certain funds (2009-2018).
Timothy M. Cohen (1969)
Year of Election or Appointment: 2018
Vice President
Mr. Cohen also serves as Vice President of other funds. Mr. Cohen is Co-Head of Equity (2018-present) and is an employee of Fidelity Investments. Mr. Cohen serves a Director of Fidelity Management & Research (Japan) Limited (investment adviser firm, 2016-present). Previously, Mr. Cohen served as Executive Vice President of Fidelity SelectCo, LLC (2019) and Head of Global Equity Research (2016-2018).
Jonathan Davis (1968)
Year of Election or Appointment: 2010
Assistant Treasurer
Mr. Davis also serves as an officer of other funds. Mr. Davis is a Vice President (2006-present) and is an employee of Fidelity Investments. Mr. Davis serves as Assistant Treasurer of certain Fidelity entities.
Laura M. Del Prato (1964)
Year of Election or Appointment: 2018
Assistant Treasurer
Ms. Del Prato also serves as an officer of other funds. Ms. Del Prato is a Senior Vice President (2017-present) and is an employee of Fidelity Investments. Ms. Del Prato serves as Vice President or Assistant Treasurer of certain Fidelity entities. Previously, Ms. Del Prato served as President and Treasurer of The North Carolina Capital Management Trust: Cash Portfolio and Term Portfolio (2018-2020).
Colm A. Hogan (1973)
Year of Election or Appointment: 2020
Assistant Treasurer
Mr. Hogan also serves as an officer of other funds. Mr. Hogan is a Vice President (2016-present) and is an employee of Fidelity Investments. Mr. Hogan serves as Assistant Treasurer of certain Fidelity entities. Previously, Mr. Hogan served as Deputy Treasurer of certain Fidelity® funds (2016-2020) and Assistant Treasurer of certain Fidelity® funds (2016-2018).
Pamela R. Holding (1964)
Year of Election or Appointment: 2018
Vice President
Ms. Holding also serves as Vice President of other funds. Ms. Holding is Co-Head of Equity (2018-present) and is an employee of Fidelity Investments. Previously, Ms. Holding served as Executive Vice President of Fidelity SelectCo, LLC (2019) and as Chief Investment Officer of Fidelity Institutional Asset Management (2013-2018).
Chris Maher (1972)
Year of Election or Appointment: 2020
Deputy Treasurer
Mr. Maher also serves as an officer of other funds. Mr. Maher is a Vice President (2008-present) and is an employee of Fidelity Investments. Mr. Maher serves as Assistant Treasurer of certain Fidelity entities. Previously, Mr. Maher served as Assistant Treasurer of certain funds (2013-2020).
Jason P. Pogorelec (1975)
Year of Election or Appointment: 2020
Chief Compliance Officer
Mr. Pogorelec also serves as Chief Compliance Officer of other funds. Mr. Pogorelec is a Senior Vice President of Asset Management Compliance (2020-present) and is an employee of Fidelity Investments. Mr. Pogorelec serves as Compliance Officer of Fidelity Management & Research Company LLC (investment adviser firm, 2023-present) and Ballyrock Investment Advisors LLC (2023-present). Previously, Mr. Pogorelec served as a Vice President, Associate General Counsel for Fidelity Investments (2010-2020) and Assistant Secretary of certain Fidelity® funds (2015-2020).
Brett Segaloff (1972)
Year of Election or Appointment: 2021
Anti-Money Laundering (AML) Officer
Mr. Segaloff also serves as AML Officer of other funds. Mr. Segaloff is a Vice President (2022-present) and is an employee of Fidelity Investments. Mr. Segaloff serves as Anti Money Laundering Compliance Officer or Anti Money Laundering/Bank Secrecy Act Compliance Officer of certain Fidelity entities.
Stacie M. Smith (1974)
Year of Election or Appointment: 2016
President and Treasurer
Ms. Smith also serves as an officer of other funds. Ms. Smith is a Senior Vice President (2016-present) and is an employee of Fidelity Investments. Ms. Smith serves as Assistant Treasurer of certain Fidelity entities and has served in other fund officer roles.
Jim Wegmann (1979)
Year of Election or Appointment: 2019
Assistant Treasurer
Mr. Wegmann also serves as an officer of other funds. Mr. Wegmann is a Vice President (2016-present) and is an employee of Fidelity Investments. Mr. Wegmann serves as Assistant Treasurer of FIMM, LLC (2021-present). Previously, Mr. Wegmann served as Assistant Treasurer of certain Fidelity® funds (2019-2021).
As a shareholder, you incur two types of costs: (1) transaction costs, which may include sales charges (loads) on purchase payments or redemption proceeds, as applicable and (2) ongoing costs, which generally include management fees, distribution and/or service (12b-1) fees and other Fund expenses. This Example is intended to help you understand your ongoing costs (in dollars) of investing in a fund and to compare these costs with the ongoing costs of investing in other mutual funds.
| The Example is based on an investment of $1,000 invested at the beginning of the period and held for the entire period (May 1, 2023 to October 31, 2023). |
Actual Expenses
The first line of the accompanying table provides information about actual account values and actual expenses. You may use the information in this line, together with the amount you invested, to estimate the expenses that you paid over the period. Simply divide your account value by $1,000.00 (for example, an $8,600 account value divided by $1,000.00 = 8.6), then multiply the result by the number in the first line for a class/Fund under the heading entitled "Expenses Paid During Period" to estimate the expenses you paid on your account during this period. If any fund is a shareholder of any underlying mutual funds or exchange-traded funds (ETFs) (the Underlying Funds), such fund indirectly bears its proportional share of the expenses of the Underlying Funds in addition to the direct expenses incurred presented in the table. These fees and expenses are not included in the annualized expense ratio used to calculate the expense estimate in the table below.
Hypothetical Example for Comparison Purposes
The second line of the accompanying table provides information about hypothetical account values and hypothetical expenses based on the actual expense ratio and an assumed rate of return of 5% per year before expenses, which is not the actual return. The hypothetical account values and expenses may not be used to estimate the actual ending account balance or expenses you paid for the period. You may use this information to compare the ongoing costs of investing in the Fund and other funds. To do so, compare this 5% hypothetical example with the 5% hypothetical examples that appear in the shareholder reports of the other funds. If any fund is a shareholder of any Underlying Funds, such fund indirectly bears its proportional share of the expenses of the Underlying Funds in addition to the direct expenses as presented in the table. These fees and expenses are not included in the annualized expense ratio used to calculate the expense estimate in the table below.
Please note that the expenses shown in the table are meant to highlight your ongoing costs only and do not reflect any transaction costs. Therefore, the second line of the table is useful in comparing ongoing costs only, and will not help you determine the relative total costs of owning different funds. In addition, if these transactional costs were included, your costs would have been higher.
| | | | | Annualized Expense Ratio- A | | Beginning Account Value May 1, 2023 | | Ending Account Value October 31, 2023 | | Expenses Paid During Period- C May 1, 2023 to October 31, 2023 |
| | | | | | | | | | |
| Fidelity® Series Canada Fund | | | | .01% | | | | | | |
| Actual | | | | | | $ 1,000 | | $ 936.70 | | $ .05 |
Hypothetical-B | | | | | | $ 1,000 | | $ 1,025.16 | | $ .05 |
| |
A Annualized expense ratio reflects expenses net of applicable fee waivers.
B 5% return per year before expenses
C Expenses are equal to the annualized expense ratio, multiplied by the average account value over the period, multiplied by 184/ 365 (to reflect the one-half year period). The fees and expenses of any Underlying Funds are not included in each annualized expense ratio.
The dividend and capital gains distributions for the fund(s) are available on Fidelity.com or Institutional.Fidelity.com.
The fund hereby designates as a capital gain dividend with respect to the taxable year ended October 31, 2023, $69,175,177, or, if subsequently determined to be different, the net capital gain of such year.
The fund designates $1,072,419 of distributions paid during the fiscal year ended 2023 as qualifying to be taxed as section 163(j) interest dividends.
The fund designates 28.70% of the dividends distributed during the fiscal year as amounts which may be taken into account as a dividend for the purposes of the maximum rate under section 1(h)(11) of the Internal Revenue Code.
The amounts per share which represent income derived from sources within, and taxes paid to, foreign countries or possessions of the United States are $.4233 and $.0223 for the dividend paid December 12, 2022.
The fund will notify shareholders in January 2024 of amounts for use in preparing 2023 income tax returns.
Board Approval of Investment Advisory Contracts and Management Fees
Fidelity Series Canada Fund
Each year, the Board of Trustees, including the Independent Trustees (together, the Board), considers the renewal of the fund's management contract with Fidelity Management & Research Company LLC (FMR) and the sub-advisory agreements (together, the Advisory Contracts) for the fund. FMR and the sub-advisers are referred to herein as the Investment Advisers. The Board, assisted by the advice of fund counsel and Independent Trustees' counsel, requests and considers a broad range of information relevant to the renewal of the Advisory Contracts throughout the year.
The Board meets regularly and, at each of its meetings, covers an extensive agenda of topics and materials and considers factors that are relevant to its annual consideration of the renewal of the fund's Advisory Contracts, including the services and support provided to the fund and its shareholders. The Board, acting directly and through its Committees (each of which is composed of and chaired by Independent Trustees), requests and receives information concerning the annual consideration of the renewal of the fund's Advisory Contracts. The Board also meets as needed to review matters specifically related to the Board's annual consideration of the renewal of the Advisory Contracts. Members of the Board may also meet with trustees of other Fidelity funds through joint ad hoc committees to discuss certain matters relevant to all of the Fidelity funds.
Approval of Stub Period Continuation. At its May 2023 meeting, the Board of Trustees voted to continue the fund's management contract with FMR, and the sub-advisory agreements and sub-sub-advisory agreements, in each case, where applicable (together, the Advisory Contracts), without modification, for two months from June 1, 2023 through July 31, 2023. The Board considered that the approval of the fund's Advisory Contracts will not result in any changes in (i) the investment process or strategies employed in the management of the fund's assets; (ii) the fees and expenses paid by shareholders; (iii) the nature, extent or quality of services provided under the fund's Advisory Contracts; or (iv) the day-to-day management of the fund or the persons primarily responsible for such management. The Board also considered that since its last approval of the fund's Advisory Contracts, FMR had provided additional information on the fund in support of the annual contract renewal process, including competitive analyses on total expenses and management fees and in-depth reviews of fund performance and fund profitability information. The Board concluded that the fund's Advisory Contracts are fair and reasonable, and that the fund's Advisory Contracts should be renewed, without modification, through July 31, 2023, with the understanding that the Board would consider the annual renewal for a full one year period in July 2023.
At its July 2023 meeting, the Board unanimously determined to renew the fund's Advisory Contracts. The Board considered all factors it believed relevant and reached a determination, with the assistance of fund counsel and Independent Trustees' counsel and through the exercise of its business judgment, that the renewal of the Advisory Contracts was in the best interests of the fund and its shareholders and the fact that no fee is payable under the management contract was fair and reasonable in light of all of the surrounding circumstances.
Nature, Extent, and Quality of Services Provided. The Board considered staffing as it relates to the fund, including the backgrounds and experience of investment personnel of the Investment Advisers, and also considered the Investment Advisers' implementation of the fund's investment program. The Independent Trustees also had discussions with senior management of Fidelity's investment operations and investment groups. The Board considered the structure of the investment personnel compensation program and whether this structure provides appropriate incentives to act in the best interests of the fund.
Resources Dedicated to Investment Management and Support Services. The Board and the Fund Oversight and Research Committees reviewed the general qualifications and capabilities of Fidelity's investment staff, including its size, education, experience, and resources, as well as Fidelity's approach to recruiting, training, managing, and compensating investment personnel. The Board noted the resources devoted to expansion of Fidelity's global investment organization, and that Fidelity's analysts have extensive resources, tools, and capabilities that allow them to conduct sophisticated quantitative and fundamental analysis, as well as credit analysis of issuers, counterparties, and guarantors. Further, the Board considered that Fidelity's investment professionals have sufficient access to global information and data so as to provide competitive investment results over time, and that those professionals also have access to sophisticated tools that permit them to assess portfolio construction and risk and performance attribution characteristics continuously, as well as to transmit new information and research conclusions rapidly around the world. Additionally, in its deliberations, the Board considered Fidelity's trading, risk management, compliance, and technology and operations capabilities and resources, which are integral parts of the investment management process.
Administrative Services. The Board considered (i) the nature, extent, quality, and cost of advisory and administrative services performed by the Investment Advisers and their affiliates under the Advisory Contracts and under separate agreements covering transfer agency, pricing and bookkeeping, and securities lending services for the fund; (ii) the nature and extent of Fidelity's supervision of third party service providers, principally custodians, subcustodians, and pricing vendors; and (iii) the resources devoted by Fidelity to, and the record of compliance with, the fund's compliance policies and procedures. The Board also reviewed the allocation of fund brokerage, including allocations to brokers affiliated with the Investment Advisers, the use of brokerage commissions to pay fund expenses, and the use of "soft" commission dollars to pay for research services. The Board also considered the fund's securities lending activities and any payments made to Fidelity relating to securities lending.
Investment Performance. The Board reviewed the fund's absolute investment performance, as well as the fund's relative investment performance, but did not consider performance to be a material factor in its decision to renew the fund's Advisory Contracts, as the fund is not publicly offered as a stand-alone investment product. In this regard, the Board noted that the fund is designed to offer an investment option for other investment companies, 529 plans, and collective investment trusts managed by Fidelity and ultimately to enhance the performance of those investment companies, 529 plans, and collective investment trusts.
Based on its review, the Board concluded that the nature, extent, and quality of services provided to the fund under the Advisory Contracts should continue to benefit the shareholders of the fund.
Competitiveness of Management Fee and Total Expense Ratio. The Board considered that the fund does not pay FMR a management fee for investment advisory services, but that FMR receives fees for providing services to funds that invest in the fund. The Board noted that FMR or an affiliate undertakes to pay all operating expenses of the fund, except transfer agent fees, 12b-1 fees, Independent Trustee fees and expenses, custodian fees and expenses, proxy and shareholder meeting expenses, interest, taxes, and extraordinary expenses (such as litigation expenses). The Board further noted that the fund pays its non-operating expenses, including brokerage commissions and fees and expenses associated with the fund's securities lending program, if applicable.
The Board further considered that FMR has contractually agreed to reimburse the fund to the extent that total operating expenses, with certain exceptions, as a percentage of its average net assets, exceed 0.013% through February 28, 2026.
Based on its review, the Board considered that the fund does not pay a management fee and concluded that the total expense ratio of the fund was reasonable in light of the services that the fund and its shareholders receive and the other factors considered.
Costs of the Services and Profitability. The Board considered the level of Fidelity's profits in respect of all the Fidelity funds.
A public accounting firm has been engaged annually by the Board as part of the Board's assessment of Fidelity's profitability analysis. The engagement includes the review and assessment of the methodologies used by Fidelity in determining the revenues and expenses attributable to Fidelity's fund business, and completion of agreed-upon procedures in respect of the mathematical accuracy of certain fund profitability information and its conformity to established allocation methodologies. After considering the reports issued under the engagement and information provided by Fidelity, the Board concluded that while other allocation methods may also be reasonable, Fidelity's profitability methodologies are reasonable in all material respects.
The Board also reviewed Fidelity's non-fund businesses and potential indirect benefits such businesses may have received as a result of their association with Fidelity's fund business (i.e., fall-out benefits) as well as cases where Fidelity's affiliates may benefit from the funds' business. The Board considered areas where potential indirect benefits to the Fidelity funds from their relationships with Fidelity may exist. The Board's consideration of these matters was informed by the findings of a joint ad hoc committee created by it and the boards of other Fidelity funds to evaluate potential fall-out benefits.
The Board concluded that the costs of the services provided by and the profits realized by Fidelity in connection with the operation of the fund were not relevant to the renewal of the Advisory Contracts because the fund pays no advisory fees and FMR bears all expenses of the fund with certain exceptions.
Economies of Scale. The Board concluded that because the fund pays no advisory fees and FMR bears all expenses of the fund with certain exceptions, the realization of economies of scale was not a material factor in the Board's decision to renew the fund's Advisory Contracts.
Additional Information Requested by the Board. In order to develop fully the factual basis for consideration of the Fidelity funds' advisory contracts, the Board requested and received additional information on certain topics, including: (i) fund flow and performance trends, in particular the underperformance of certain funds and strategies, and Fidelity's long-term strategies for certain funds, including any consideration of fund liquidations or mergers; (ii) the operation of performance fees and competitor use of performance fees; (iii) Fidelity's pricing philosophy compared to competitors; (iv) fund profitability methodology and data; (v) evaluation of competitive fund data and peer group classifications and fee and expense comparisons; (vi) the management fee and expense structures for different funds and classes and information about the differences between various fee and expense structures; (vii) group fee breakpoints and related voluntary fee waivers; and (viii) information regarding other accounts managed by Fidelity and the funds' sub-advisory arrangements.
Conclusion. Based on its evaluation of all of the conclusions noted above, and after considering all factors it believed relevant, the Board, including the Independent Trustees, concluded that the advisory and sub-advisory fee arrangements are fair and reasonable in light of all of the surrounding circumstances and that the fund's Advisory Contracts should be renewed through July 31, 2024.
1.9883882.106
SAD-ANN-1223
Fidelity® International Discovery K6 Fund
Annual Report
October 31, 2023
Contents
To view a fund's proxy voting guidelines and proxy voting record for the 12-month period ended June 30, visit http://www.fidelity.com/proxyvotingresults or visit the Securities and Exchange Commission's (SEC) web site at http://www.sec.gov.
You may also call 1-800-835-5092 to request a free copy of the proxy voting guidelines.
Standard & Poor's, S&P and S&P 500 are registered service marks of The McGraw-Hill Companies, Inc. and have been licensed for use by Fidelity Distributors Corporation.
Other third-party marks appearing herein are the property of their respective owners.
All other marks appearing herein are registered or unregistered trademarks or service marks of FMR LLC or an affiliated company. © 2023 FMR LLC. All rights reserved.
This report and the financial statements contained herein are submitted for the general information of the shareholders of the Fund. This report is not authorized for distribution to prospective investors in the Fund unless preceded or accompanied by an effective prospectus.
A fund files its complete schedule of portfolio holdings with the SEC for the first and third quarters of each fiscal year on Form N-PORT. Forms N-PORT are available on the SEC's web site at http://www.sec.gov. A fund's Forms N-PORT may be reviewed and copied at the SEC's Public Reference Room in Washington, DC. Information regarding the operation of the SEC's Public Reference Room may be obtained by calling 1-800-SEC-0330.
For a complete list of a fund's portfolio holdings, view the most recent holdings listing, semiannual report, or annual report on Fidelity's web site at http://www.fidelity.com, http://www.institutional.fidelity.com, or http://www.401k.com, as applicable.
NOT FDIC INSURED •MAY LOSE VALUE •NO BANK GUARANTEE
Neither the Fund nor Fidelity Distributors Corporation is a bank.
Average annual total return reflects the change in the value of an investment, assuming reinvestment of distributions from dividend income and capital gains (the profits earned upon the sale of securities that have grown in value, if any) and assuming a constant rate of performance each year. The hypothetical investment and the average annual total returns do not reflect the deduction of taxes that a shareholder would pay on fund distributions or the redemption of fund shares. During periods of reimbursement by Fidelity, a fund's total return will be greater than it would be had the reimbursement not occurred. How a fund did yesterday is no guarantee of how it will do tomorrow.
| Average Annual Total Returns |
| | | | |
Periods ended October 31, 2023 | Past 1 year | Life of Fund A |
| Fidelity® International Discovery K6 Fund | 7.19% | 2.90% |
A From June 13, 2019
| $10,000 Over Life of Fund |
| |
Let's say hypothetically that $10,000 was invested in Fidelity® International Discovery K6 Fund, on June 13, 2019, when the fund started. The chart shows how the value of your investment would have changed, and also shows how the MSCI EAFE Index performed over the same period. |
|
|
Market Recap:
International (non-U.S.) equities gained 12.27% for the 12 months ending October 31, 2023, according to the MSCI ACWI (All Country World Index) ex USA Index, as global economic expansion and a slowing in the pace of inflation in some markets provided a favorable backdrop for risk assets. After returning -15.86% in 2022, the index's upturn has been largely driven by a narrow set of companies in the information technology and communication services sectors, in part due to excitement for generative artificial intelligence applications. The index gained 14.07% year to date through July, including strong gains in both June (+4.50%) and July (+4.07%). The rally for international equities sputtered for the next three months (-11.33%) amid a stalling pattern in disinflationary trends, heightened global recession and geopolitical risks, soaring yields on longer-term U.S. government bonds and particularly weak economic conditions in the eurozone and China. The three-month decline left non-U.S. stocks up 1.15% year to date through October. Currency fluctuation also helped bolster non-U.S. equity performance overall. For the full 12 months, nearly all regions advanced, with Europe ex U.K. (+18%) and Japan (+17%) leading, whereas Canada (-0.38%) lagged by the widest margin. Each of the 11 sectors advanced, with information technology (+21%) and consumer discretionary (+19%) leading the way. Energy and industrials each rose about 14%. Conversely, four defensive-oriented sectors lagged by the widest margin: real estate (+4%), health care (+6%), consumer staples (+7%) and utilities (+8%).
Comments from Portfolio Manager William Kennedy:
For the fiscal year ending October 31, 2023, the fund gained 7.19%, versus 14.65% for the benchmark MSCI EAFE Index (Net MA). From a regional standpoint, security selection in Europe, emerging markets and the U.K. detracted most from the fund's relative result. By sector, investment choices among consumer discretionary companies, along with stock picks and an underweight in energy, also hurt. Security selection in health care and financials proved detrimental as well the past 12 months. The biggest individual relative detractor was an outsized stake in Norway-based Equinor (-24%), a position that was no longer held at period end. The portfolio's non-benchmark exposure to HDFC Bank in India returned roughly -5% and was a second notable relative detractor. An overweight stake in Japan-based Olympus, which was not held at period end, returned -22% and further weighed on relative performance. In contrast, on a regional basis, security selection in the U.S., which is not in the benchmark, and an underweight in Asia Pacific ex Japan contributed to the portfolio's relative return. By sector, security selection and an underweight in information technology helped performance most versus the benchmark. The fund's non-benchmark position in U.S.-based Nvidia gained approximately 91% and was the top individual relative contributor. Outsized exposure to BE Semiconductor Industries (+70%) in the Netherlands was another plus. An overweight in Italy-based UniCredit (+33%), a top-10 holding at the end of October, also helped. Nvidia, BE Semiconductor and UniCredit were new additions to the portfolio during the reporting period. Notable changes in positioning include decreased exposure to the energy and health care sectors and higher allocations to information technology and consumer discretionary stocks.
The views expressed above reflect those of the portfolio manager(s) only through the end of the period as stated on the cover of this report and do not necessarily represent the views of Fidelity or any other person in the Fidelity organization. Any such views are subject to change at any time based upon market or other conditions and Fidelity disclaims any responsibility to update such views. These views may not be relied on as investment advice and, because investment decisions for a Fidelity fund are based on numerous factors, may not be relied on as an indication of trading intent on behalf of any Fidelity fund.
Top Holdings (% of Fund's net assets) |
| |
| Novo Nordisk A/S Series B (Denmark, Pharmaceuticals) | 3.4 | |
| AstraZeneca PLC (United Kingdom) (United Kingdom, Pharmaceuticals) | 2.8 | |
| ASML Holding NV (Netherlands) (Netherlands, Semiconductors & Semiconductor Equipment) | 2.7 | |
| Nestle SA (Reg. S) (United States of America, Food Products) | 2.5 | |
| LVMH Moet Hennessy Louis Vuitton SE (France, Textiles, Apparel & Luxury Goods) | 2.3 | |
| Taiwan Semiconductor Manufacturing Co. Ltd. (Taiwan, Semiconductors & Semiconductor Equipment) | 2.1 | |
| HDFC Bank Ltd. (India, Banks) | 2.1 | |
| Hitachi Ltd. (Japan, Industrial Conglomerates) | 2.0 | |
| Air Liquide SA (France, Chemicals) | 1.9 | |
| UniCredit SpA (Italy, Banks) | 1.8 | |
| | 23.6 | |
| |
| Market Sectors (% of Fund's net assets) |
| |
| Financials | 19.2 | |
| Information Technology | 16.4 | |
| Industrials | 15.4 | |
| Consumer Discretionary | 13.4 | |
| Health Care | 12.1 | |
| Consumer Staples | 6.4 | |
| Materials | 6.3 | |
| Energy | 3.1 | |
| Communication Services | 2.6 | |
| Real Estate | 1.1 | |
| |
Asset Allocation (% of Fund's net assets) |
|
|
Geographic Diversification (% of Fund's net assets) |
|
* Includes Short-Term investments and Net Other Assets (Liabilities). Percentages are adjusted for the effect of derivatives, if applicable. |
| |
Showing Percentage of Net Assets
| Common Stocks - 96.0% |
| | | Shares | Value ($) |
| Australia - 2.5% | | | |
| Bapcor Ltd. | | 473,339 | 1,611,176 |
| Flight Centre Travel Group Ltd. (a) | | 293,229 | 3,485,714 |
| Flutter Entertainment PLC (b) | | 25,358 | 3,977,499 |
| IperionX Ltd. (b)(c) | | 1,395,848 | 1,106,820 |
| National Storage REIT unit | | 3,516,700 | 4,483,739 |
TOTAL AUSTRALIA | | | 14,664,948 |
| Bailiwick of Jersey - 0.4% | | | |
| JTC PLC (d) | | 302,996 | 2,351,445 |
| Belgium - 1.2% | | | |
| KBC Group NV | | 36,728 | 2,016,932 |
| UCB SA | | 67,907 | 4,962,127 |
TOTAL BELGIUM | | | 6,979,059 |
| Brazil - 0.7% | | | |
| MercadoLibre, Inc. (b) | | 3,294 | 4,086,998 |
| Canada - 3.8% | | | |
| Canadian Natural Resources Ltd. | | 141,278 | 8,971,293 |
| Constellation Software, Inc. | | 4,942 | 9,907,200 |
| Constellation Software, Inc. warrants 8/22/28 (b)(c) | | 4,235 | 0 |
| Definity Financial Corp. | | 43,985 | 1,216,070 |
| Franco-Nevada Corp. | | 16,994 | 2,067,343 |
| Lumine Group, Inc. | | 12,235 | 153,869 |
TOTAL CANADA | | | 22,315,775 |
| China - 1.5% | | | |
| Alibaba Group Holding Ltd. (b) | | 146,635 | 1,509,619 |
| Chervon Holdings Ltd. | | 654,394 | 1,611,805 |
| JOYY, Inc. ADR | | 105,662 | 4,112,365 |
| Tencent Holdings Ltd. | | 46,543 | 1,722,499 |
TOTAL CHINA | | | 8,956,288 |
| Denmark - 3.9% | | | |
| DSV A/S | | 18,091 | 2,698,101 |
| Novo Nordisk A/S Series B | | 205,874 | 19,861,953 |
TOTAL DENMARK | | | 22,560,054 |
| France - 11.3% | | | |
| Air Liquide SA | | 63,996 | 10,965,859 |
| Airbus Group NV | | 41,121 | 5,513,348 |
| AXA SA | | 256,971 | 7,614,160 |
| BNP Paribas SA | | 114,269 | 6,570,927 |
| Edenred SA | | 80,288 | 4,268,025 |
| EssilorLuxottica SA | | 26,449 | 4,775,478 |
| Exclusive Networks SA (b) | | 136,612 | 2,171,128 |
| L'Oreal SA | | 16,179 | 6,800,531 |
| LVMH Moet Hennessy Louis Vuitton SE | | 18,882 | 13,518,201 |
| Pernod Ricard SA | | 22,857 | 4,050,986 |
TOTAL FRANCE | | | 66,248,643 |
| Germany - 4.3% | | | |
| Fresenius SE & Co. KGaA | | 75,086 | 1,925,832 |
| Merck KGaA | | 30,160 | 4,542,715 |
| Muenchener Rueckversicherungs-Gesellschaft AG in Muenchen | | 14,596 | 5,845,564 |
| Nexus AG | | 22,732 | 1,107,628 |
| Rheinmetall AG | | 15,658 | 4,479,914 |
| Siemens AG | | 38,174 | 5,065,646 |
| Siemens Healthineers AG (d) | | 40,819 | 2,000,588 |
| Talanx AG | | 82 | 5,158 |
TOTAL GERMANY | | | 24,973,045 |
| Hong Kong - 1.2% | | | |
| AIA Group Ltd. | | 790,826 | 6,867,381 |
| Hungary - 0.3% | | | |
| Richter Gedeon PLC | | 71,747 | 1,682,269 |
| India - 4.2% | | | |
| Avenue Supermarts Ltd. (b)(d) | | 43,209 | 1,885,986 |
| HDFC Bank Ltd. | | 324,330 | 5,753,376 |
| HDFC Bank Ltd. sponsored ADR | | 116,285 | 6,575,917 |
| ITC Ltd. | | 394,483 | 2,030,014 |
| Larsen & Toubro Ltd. | | 42,307 | 1,488,379 |
| One97 Communications Ltd. (b) | | 335,518 | 3,712,099 |
| PVR INOX Ltd. (b) | | 40,154 | 770,728 |
| Sona Blw Precision Forgings Ltd. (d) | | 234,001 | 1,522,418 |
| Star Health & Allied Insurance Co. Ltd. (b) | | 81,235 | 565,780 |
TOTAL INDIA | | | 24,304,697 |
| Ireland - 1.5% | | | |
| Cairn Homes PLC | | 2,300,191 | 2,697,915 |
| Dalata Hotel Group PLC | | 918,456 | 3,896,991 |
| Kingspan Group PLC (Ireland) | | 29,103 | 1,954,796 |
| Ryanair Holdings PLC (b) | | 3,200 | 48,070 |
TOTAL IRELAND | | | 8,597,772 |
| Italy - 4.2% | | | |
| BFF Bank SpA (d) | | 264,500 | 2,539,797 |
| Davide Campari Milano NV | | 241,637 | 2,666,702 |
| Ferrari NV | | 13,412 | 4,045,596 |
| FinecoBank SpA | | 132,867 | 1,562,620 |
| Prysmian SpA | | 66,276 | 2,474,769 |
| Recordati SpA | | 13,762 | 634,885 |
| UniCredit SpA | | 413,377 | 10,363,202 |
TOTAL ITALY | | | 24,287,571 |
| Japan - 19.2% | | | |
| Advantest Corp. | | 86,836 | 2,236,777 |
| BayCurrent Consulting, Inc. | | 47,067 | 1,181,700 |
| Capcom Co. Ltd. | | 101,354 | 3,262,517 |
| Daiichi Sankyo Kabushiki Kaisha | | 141,636 | 3,651,970 |
| Eisai Co. Ltd. | | 24,840 | 1,315,982 |
| Fast Retailing Co. Ltd. | | 23,495 | 5,201,709 |
| FUJIFILM Holdings Corp. | | 58,412 | 3,195,008 |
| Hitachi Ltd. | | 188,126 | 11,924,673 |
| Hoya Corp. | | 84,415 | 8,126,516 |
| Itochu Corp. | | 216,292 | 7,791,061 |
| JTOWER, Inc. (a)(b) | | 72,433 | 2,635,914 |
| Keyence Corp. | | 10,340 | 4,002,808 |
| Misumi Group, Inc. | | 72,437 | 1,096,599 |
| Mitsubishi UFJ Financial Group, Inc. | | 761,645 | 6,389,552 |
| NOF Corp. | | 38,640 | 1,524,385 |
| ORIX Corp. | | 344,406 | 6,263,489 |
| Outsourcing, Inc. | | 203,901 | 1,515,169 |
| Pan Pacific International Holdings Ltd. | | 160,810 | 3,114,224 |
| Persol Holdings Co. Ltd. | | 1,933,860 | 2,899,661 |
| Renesas Electronics Corp. (b) | | 495,887 | 6,513,783 |
| Shin-Etsu Chemical Co. Ltd. | | 268,836 | 8,039,105 |
| Sony Group Corp. | | 98,823 | 8,216,034 |
| Sumitomo Mitsui Financial Group, Inc. | | 101,648 | 4,900,245 |
| TechnoPro Holdings, Inc. | | 67,080 | 1,328,912 |
| TIS, Inc. | | 113,773 | 2,436,432 |
| Tokio Marine Holdings, Inc. | | 147,950 | 3,309,972 |
TOTAL JAPAN | | | 112,074,197 |
| Kazakhstan - 0.0% | | | |
| Kaspi.KZ JSC GDR (Reg. S) | | 3,300 | 298,320 |
| Korea (South) - 1.4% | | | |
| Samsung Electronics Co. Ltd. | | 160,619 | 7,982,940 |
| Netherlands - 8.1% | | | |
| ASML Holding NV (Netherlands) | | 26,272 | 15,792,635 |
| BE Semiconductor Industries NV | | 59,639 | 6,140,022 |
| IMCD NV | | 17,396 | 2,089,161 |
| ING Groep NV (Certificaten Van Aandelen) | | 327,996 | 4,205,082 |
| Shell PLC (London) | | 298,148 | 9,608,372 |
| Topicus.Com, Inc. (b) | | 8,028 | 528,600 |
| Universal Music Group NV | | 81,820 | 2,003,676 |
| Wolters Kluwer NV | | 53,405 | 6,843,098 |
TOTAL NETHERLANDS | | | 47,210,646 |
| Russia - 0.0% | | | |
| Fix Price Group Ltd. GDR (Reg. S) (b)(c) | | 38,476 | 14,210 |
| Spain - 1.4% | | | |
| CaixaBank SA | | 1,488,379 | 6,051,066 |
| Cie Automotive SA | | 88,865 | 2,262,315 |
TOTAL SPAIN | | | 8,313,381 |
| Sweden - 1.4% | | | |
| ASSA ABLOY AB (B Shares) | | 116,757 | 2,488,684 |
| Indutrade AB | | 200,188 | 3,535,699 |
| Kry International AB (b)(c)(e) | | 71 | 2,606 |
| Lagercrantz Group AB (B Shares) | | 246,641 | 2,247,122 |
TOTAL SWEDEN | | | 8,274,111 |
| Switzerland - 0.5% | | | |
| Partners Group Holding AG | | 2,547 | 2,679,019 |
| Taiwan - 2.1% | | | |
| Taiwan Semiconductor Manufacturing Co. Ltd. | | 763,041 | 12,452,783 |
| United Kingdom - 13.0% | | | |
| 3i Group PLC | | 239,263 | 5,641,245 |
| AstraZeneca PLC (United Kingdom) | | 128,848 | 16,132,253 |
| BAE Systems PLC | | 657,437 | 8,840,149 |
| Big Yellow Group PLC | | 182,476 | 2,118,099 |
| Bunzl PLC | | 185,100 | 6,596,408 |
| Cab Payments Holdings Ltd. (a) | | 315,231 | 234,486 |
| Compass Group PLC | | 398,438 | 10,045,174 |
| DCC PLC (United Kingdom) | | 253 | 14,038 |
| Diageo PLC | | 125,626 | 4,750,676 |
| Games Workshop Group PLC | | 18,235 | 2,188,668 |
| JD Sports Fashion PLC | | 1,288,320 | 1,996,508 |
| London Stock Exchange Group PLC | | 43,161 | 4,354,733 |
| RELX PLC (London Stock Exchange) | | 174,550 | 6,096,633 |
| Sage Group PLC | | 393,668 | 4,644,163 |
| Smart Metering Systems PLC | | 245,250 | 1,904,789 |
| Starling Bank Ltd. Series D (b)(c)(e) | | 137,500 | 491,346 |
| Zegona Communications PLC (b)(c) | | 23,682 | 8,981 |
TOTAL UNITED KINGDOM | | | 76,058,349 |
| United States of America - 7.8% | | | |
| CRH PLC | | 94,176 | 5,060,552 |
| Energy Recovery, Inc. (b) | | 26,097 | 396,674 |
| Globant SA (b) | | 8,421 | 1,434,012 |
| Lattice Semiconductor Corp. (b) | | 21,505 | 1,195,893 |
| Linde PLC | | 19,531 | 7,463,967 |
| Microsoft Corp. | | 16,620 | 5,619,388 |
| Nestle SA (Reg. S) | | 137,719 | 14,851,449 |
| NVIDIA Corp. | | 15,227 | 6,209,571 |
| Samsonite International SA (b)(d) | | 1,053,659 | 3,263,308 |
TOTAL UNITED STATES OF AMERICA | | | 45,494,814 |
| Zambia - 0.1% | | | |
| First Quantum Minerals Ltd. | | 40,407 | 468,246 |
| TOTAL COMMON STOCKS (Cost $550,812,747) | | | 560,196,961 |
| | | | |
| Preferred Stocks - 0.2% |
| | | Shares | Value ($) |
| Convertible Preferred Stocks - 0.2% | | | |
| China - 0.1% | | | |
| ByteDance Ltd. Series E1 (b)(c)(e) | | 1,533 | 358,185 |
| dMed Biopharmaceutical Co. Ltd. Series C (b)(c)(e) | | 8,434 | 49,676 |
| | | | 407,861 |
| Estonia - 0.1% | | | |
| Bolt Technology OU Series E (b)(c)(e) | | 3,347 | 395,298 |
| United States of America - 0.0% | | | |
| Canva, Inc.: | | | |
| Series A (c)(e) | | 85 | 90,711 |
| Series A2 (c)(e) | | 15 | 16,008 |
| | | | 106,719 |
TOTAL CONVERTIBLE PREFERRED STOCKS | | | 909,878 |
| Nonconvertible Preferred Stocks - 0.0% | | | |
| Sweden - 0.0% | | | |
| Kry International AB Series E (b)(c)(e) | | 413 | 15,159 |
| TOTAL PREFERRED STOCKS (Cost $1,452,783) | | | 925,037 |
| | | | |
| Money Market Funds - 4.3% |
| | | Shares | Value ($) |
| Fidelity Cash Central Fund 5.40% (f) | | 20,984,780 | 20,988,977 |
| Fidelity Securities Lending Cash Central Fund 5.40% (f)(g) | | 4,348,460 | 4,348,895 |
| TOTAL MONEY MARKET FUNDS (Cost $25,337,872) | | | 25,337,872 |
| | | | |
| TOTAL INVESTMENT IN SECURITIES - 100.5% (Cost $577,603,402) | 586,459,870 |
NET OTHER ASSETS (LIABILITIES) - (0.5)% | (3,076,486) |
| NET ASSETS - 100.0% | 583,383,384 |
| | |
Legend
| (a) | Security or a portion of the security is on loan at period end. |
| (d) | Security exempt from registration under Rule 144A of the Securities Act of 1933. These securities may be resold in transactions exempt from registration, normally to qualified institutional buyers. At the end of the period, the value of these securities amounted to $13,563,542 or 2.3% of net assets. |
| (e) | Restricted securities (including private placements) - Investment in securities not registered under the Securities Act of 1933 (excluding 144A issues). At the end of the period, the value of restricted securities (excluding 144A issues) amounted to $1,418,989 or 0.2% of net assets. |
| (f) | Affiliated fund that is generally available only to investment companies and other accounts managed by Fidelity Investments. The rate quoted is the annualized seven-day yield of the fund at period end. A complete unaudited listing of the fund's holdings as of its most recent quarter end is available upon request. In addition, each Fidelity Central Fund's financial statements, which are not covered by the Fund's Report of Independent Registered Public Accounting Firm, are available on the SEC's website or upon request. |
| (g) | Investment made with cash collateral received from securities on loan. |
| Additional information on each restricted holding is as follows: |
| Security | Acquisition Date | Acquisition Cost ($) |
| Bolt Technology OU Series E | 1/03/22 | 869,539 |
| | | |
| ByteDance Ltd. Series E1 | 11/18/20 | 167,977 |
| | | |
| Canva, Inc. Series A | 9/22/23 | 90,666 |
| | | |
| Canva, Inc. Series A2 | 9/22/23 | 16,000 |
| | | |
| dMed Biopharmaceutical Co. Ltd. Series C | 12/01/20 | 119,789 |
| | | |
| Kry International AB | 5/14/21 | 30,836 |
| | | |
| Kry International AB Series E | 5/14/21 | 188,812 |
| | | |
| Starling Bank Ltd. Series D | 6/18/21 - 4/05/22 | 286,270 |
| | | |
Affiliated Central Funds
Fiscal year to date information regarding the Fund's investments in Fidelity Central Funds, including the ownership percentage, is presented below.
| Affiliate | Value, beginning of period ($) | Purchases ($) | Sales Proceeds ($) | Dividend Income ($) | Realized Gain (loss) ($) | Change in Unrealized appreciation (depreciation) ($) | Value, end of period ($) | % ownership, end of period |
| Fidelity Cash Central Fund 5.40% | 27,106,527 | 182,654,271 | 188,771,821 | 947,418 | - | - | 20,988,977 | 0.0% |
| Fidelity Securities Lending Cash Central Fund 5.40% | 1,938,791 | 82,407,810 | 79,997,706 | 73,628 | - | - | 4,348,895 | 0.0% |
| Total | 29,045,318 | 265,062,081 | 268,769,527 | 1,021,046 | - | - | 25,337,872 | |
| | | | | | | | | |
Amounts in the dividend income column in the above table include any capital gain distributions from underlying funds, which are presented in the corresponding line item in the Statement of Operations, if applicable.
Amounts in the dividend income column for Fidelity Securities Lending Cash Central Fund represents the income earned on investing cash collateral, less rebates paid to borrowers and any lending agent fees associated with the loan, plus any premium payments received for lending certain types of securities.
Amounts included in the purchases and sales proceeds columns may include in-kind transactions, if applicable.
Investment Valuation
The following is a summary of the inputs used, as of October 31, 2023, involving the Fund's assets and liabilities carried at fair value. The inputs or methodology used for valuing securities may not be an indication of the risk associated with investing in those securities. For more information on valuation inputs, and their aggregation into the levels used below, please refer to the Investment Valuation section in the accompanying Notes to Financial Statements.
| Valuation Inputs at Reporting Date: |
| Description | Total ($) | Level 1 ($) | Level 2 ($) | Level 3 ($) |
Investments in Securities: | | | | |
|
| Equities: | | | | |
Communication Services | 14,874,865 | 4,112,365 | 10,395,334 | 367,166 |
Consumer Discretionary | 78,358,591 | 25,152,490 | 53,099,382 | 106,719 |
Consumer Staples | 37,050,554 | 6,717,688 | 30,318,656 | 14,210 |
Energy | 18,579,665 | 8,971,293 | 9,608,372 | - |
Financials | 112,647,008 | 29,593,353 | 82,562,309 | 491,346 |
Health Care | 70,769,872 | 21,631,522 | 49,088,674 | 49,676 |
Industrials | 90,266,131 | 32,987,447 | 57,278,684 | - |
Information Technology | 95,277,197 | 40,250,968 | 54,613,166 | 413,063 |
Materials | 36,696,277 | 15,060,108 | 20,529,349 | 1,106,820 |
Real Estate | 6,601,838 | 2,118,099 | 4,483,739 | - |
|
| Money Market Funds | 25,337,872 | 25,337,872 | - | - |
| Total Investments in Securities: | 586,459,870 | 211,933,205 | 371,977,665 | 2,549,000 |
| Statement of Assets and Liabilities |
| | | | October 31, 2023 |
| | | | | |
| Assets | | | | |
| Investment in securities, at value (including securities loaned of $4,164,989) - See accompanying schedule: | | | | |
Unaffiliated issuers (cost $552,265,530) | $ | 561,121,998 | | |
Fidelity Central Funds (cost $25,337,872) | | 25,337,872 | | |
| | | | | |
| | | | | |
| Total Investment in Securities (cost $577,603,402) | | | $ | 586,459,870 |
| Cash | | | | 51,189 |
| Foreign currency held at value (cost $152) | | | | 153 |
| Receivable for investments sold | | | | 5,630,800 |
| Receivable for fund shares sold | | | | 494,305 |
| Dividends receivable | | | | 950,704 |
| Reclaims receivable | | | | 1,045,861 |
| Distributions receivable from Fidelity Central Funds | | | | 121,302 |
Total assets | | | | 594,754,184 |
| Liabilities | | | | |
| Payable for investments purchased | $ | 6,071,535 | | |
| Payable for fund shares redeemed | | 324,261 | | |
| Accrued management fee | | 296,789 | | |
| Other payables and accrued expenses | | 329,320 | | |
| Collateral on securities loaned | | 4,348,895 | | |
| Total Liabilities | | | | 11,370,800 |
| Net Assets | | | $ | 583,383,384 |
| Net Assets consist of: | | | | |
| Paid in capital | | | $ | 684,581,540 |
| Total accumulated earnings (loss) | | | | (101,198,156) |
| Net Assets | | | $ | 583,383,384 |
Net Asset Value, offering price and redemption price per share ($583,383,384 ÷ 53,737,609 shares) | | | $ | 10.86 |
| Statement of Operations |
| | | | Year ended October 31, 2023 |
| Investment Income | | | | |
| Dividends | | | $ | 13,845,551 |
| Interest | | | | 9,887 |
| Income from Fidelity Central Funds (including $73,628 from security lending) | | | | 1,021,046 |
| Income before foreign taxes withheld | | | $ | 14,876,484 |
| Less foreign taxes withheld | | | | (1,637,036) |
| Total Income | | | | 13,239,448 |
| Expenses | | | | |
| Management fee | $ | 3,577,022 | | |
| Independent trustees' fees and expenses | | 3,183 | | |
| Total expenses before reductions | | 3,580,205 | | |
| Expense reductions | | (116) | | |
| Total expenses after reductions | | | | 3,580,089 |
| Net Investment income (loss) | | | | 9,659,359 |
| Realized and Unrealized Gain (Loss) | | | | |
| Net realized gain (loss) on: | | | | |
| Investment Securities: | | | | |
| Unaffiliated issuers (net of foreign taxes of $4,013) | | (54,722,943) | | |
| Foreign currency transactions | | 15,375 | | |
| Total net realized gain (loss) | | | | (54,707,568) |
| Change in net unrealized appreciation (depreciation) on: | | | | |
| Investment Securities: | | | | |
| Unaffiliated issuers(net of increase in deferred foreign taxes of $168,451) | | 74,737,385 | | |
| Assets and liabilities in foreign currencies | | 45,677 | | |
| Total change in net unrealized appreciation (depreciation) | | | | 74,783,062 |
| Net gain (loss) | | | | 20,075,494 |
| Net increase (decrease) in net assets resulting from operations | | | $ | 29,734,853 |
| Statement of Changes in Net Assets |
| |
| | Year ended October 31, 2023 | | Year ended October 31, 2022 |
| Increase (Decrease) in Net Assets | | | | |
| Operations | | | | |
| Net investment income (loss) | $ | 9,659,359 | $ | 9,318,000 |
| Net realized gain (loss) | | (54,707,568) | | (61,862,335) |
| Change in net unrealized appreciation (depreciation) | | 74,783,062 | | (118,418,158) |
| Net increase (decrease) in net assets resulting from operations | | 29,734,853 | | (170,962,493) |
| Distributions to shareholders | | (4,996,303) | | (8,038,015) |
| | | | | |
| Share transactions | | | | |
| Proceeds from sales of shares | | 197,751,242 | | 304,547,005 |
| Reinvestment of distributions | | 4,996,303 | | 8,038,015 |
| Cost of shares redeemed | | (112,155,117) | | (96,424,320) |
| | | | | |
Net increase (decrease) in net assets resulting from share transactions | | 90,592,428 | | 216,160,700 |
| Total increase (decrease) in net assets | | 115,330,978 | | 37,160,192 |
| | | | | |
| Net Assets | | | | |
| Beginning of period | | 468,052,406 | | 430,892,214 |
| End of period | $ | 583,383,384 | $ | 468,052,406 |
| | | | | |
| Other Information | | | | |
| Shares | | | | |
| Sold | | 17,226,620 | | 24,327,055 |
| Issued in reinvestment of distributions | | 448,904 | | 555,879 |
| Redeemed | | (9,674,096) | | (7,923,935) |
| Net increase (decrease) | | 8,001,428 | | 16,958,999 |
| | | | | |
Financial Highlights
| Fidelity® International Discovery K6 Fund |
| |
| Years ended October 31, | | 2023 | | 2022 | | 2021 | | 2020 | | 2019 A |
Selected Per-Share Data | | | | | | | | | | |
| Net asset value, beginning of period | $ | 10.23 | $ | 14.97 | $ | 11.29 | $ | 10.49 | $ | 10.00 |
| Income from Investment Operations | | | | | | | | | | |
Net investment income (loss) B,C | | .19 | | .24 | | .16 | | .12 | | .06 D |
| Net realized and unrealized gain (loss) | | .55 | | (4.70) | | 3.60 | | .77 | | .43 |
| Total from investment operations | | .74 | | (4.46) | | 3.76 | | .89 | | .49 |
| Distributions from net investment income | | (.11) | | (.28) | | (.08) | | (.04) | | - |
| Distributions from net realized gain | | - | | - | | - | | (.05) | | - |
| Total distributions | | (.11) | | (.28) | | (.08) | | (.09) | | - |
| Net asset value, end of period | $ | 10.86 | $ | 10.23 | $ | 14.97 | $ | 11.29 | $ | 10.49 |
Total Return E,F | | 7.19% | | (30.35)% | | 33.43% | | 8.51% | | 4.90% |
Ratios to Average Net Assets C,G,H | | | | | | | | | | |
| Expenses before reductions | | .60% | | .60% | | .60% | | .60% | | .60% I |
| Expenses net of fee waivers, if any | | .60% | | .60% | | .60% | | .60% | | .60% I |
| Expenses net of all reductions | | .60% | | .60% | | .60% | | .60% | | .60% I |
| Net investment income (loss) | | 1.62% | | 1.98% | | 1.11% | | 1.16% | | 1.67% D,I |
| Supplemental Data | | | | | | | | | | |
| Net assets, end of period (000 omitted) | $ | 583,383 | $ | 468,052 | $ | 430,892 | $ | 103,173 | $ | 61,421 |
Portfolio turnover rate J | | 55% K | | 50% K | | 58% K | | 42% K | | 59% K,L |
AFor the period June 13, 2019 (commencement of operations) through October 31, 2019.
BCalculated based on average shares outstanding during the period.
CNet investment income (loss) is affected by the timing of the declaration of dividends by any underlying mutual funds or exchange-traded funds (ETFs). Net investment income (loss) of any mutual funds or ETFs is not included in the Fund's net investment income (loss) ratio.
DNet investment income per share reflects one or more large, non-recurring dividend(s) which amounted to $.05 per share. Such dividends are not annualized in the ratio of net investment income (loss) to average net assets. Excluding such non-recurring dividend(s), the ratio of net investment income (loss) to average net assets would have been .43%.
ETotal returns for periods of less than one year are not annualized.
FTotal returns would have been lower if certain expenses had not been reduced during the applicable periods shown.
GFees and expenses of any underlying mutual funds or exchange-traded funds (ETFs) are not included in the Fund's expense ratio. The Fund indirectly bears its proportionate share of these expenses. For additional expense information related to investments in Fidelity Central Funds, please refer to the "Investments in Fidelity Central Funds" note found in the Notes to Financial Statements section of the most recent Annual or Semi-Annual report.
HExpense ratios reflect operating expenses of the class. Expenses before reductions do not reflect amounts reimbursed, waived, or reduced through arrangements with the investment adviser, brokerage services, or other offset arrangements, if applicable, and do not represent the amount paid by the class during periods when reimbursements, waivers or reductions occur.
IAnnualized.
JAmount does not include the portfolio activity of any underlying mutual funds or exchange-traded funds (ETFs).
KPortfolio turnover rate excludes securities received or delivered in-kind.
LAmount not annualized.
For the period ended October 31, 2023
1. Organization.
Fidelity International Discovery K6 Fund (the Fund) is a fund of Fidelity Investment Trust (the Trust) and is authorized to issue an unlimited number of shares. Share transactions on the Statement of Changes in Net Assets may contain exchanges between affiliated funds. The Trust is registered under the Investment Company Act of 1940, as amended (the 1940 Act), as an open-end management investment company organized as a Massachusetts business trust. Shares generally are available only to employer-sponsored retirement plans that are recordkept by Fidelity, or to certain employer-sponsored retirement plans that are not recordkept by Fidelity. The Fund's investments in emerging markets can be subject to social, economic, regulatory, and political uncertainties and can be extremely volatile.
2. Investments in Fidelity Central Funds.
Funds may invest in Fidelity Central Funds, which are open-end investment companies generally available only to other investment companies and accounts managed by the investment adviser and its affiliates. The Schedule of Investments lists any Fidelity Central Funds held as an investment as of period end, but does not include the underlying holdings of each Fidelity Central Fund. An investing fund indirectly bears its proportionate share of the expenses of the underlying Fidelity Central Funds.
Based on its investment objective, each Fidelity Central Fund may invest or participate in various investment vehicles or strategies that are similar to those of the investing fund. These strategies are consistent with the investment objectives of the investing fund and may involve certain economic risks which may cause a decline in value of each of the Fidelity Central Funds and thus a decline in the value of the investing fund.
| Fidelity Central Fund | Investment Manager | Investment Objective | Investment Practices | Expense RatioA |
| Fidelity Money Market Central Funds | Fidelity Management & Research Company LLC (FMR) | Each fund seeks to obtain a high level of current income consistent with the preservation of capital and liquidity. | Short-term Investments | Less than .005% |
A Expenses expressed as a percentage of average net assets and are as of each underlying Central Fund's most recent annual or semi-annual shareholder report.
A complete unaudited list of holdings for each Fidelity Central Fund is available upon request or at the Securities and Exchange Commission website at www.sec.gov. In addition, the financial statements of the Fidelity Central Funds which contain the significant accounting policies (including investment valuation policies) of those funds, and are not covered by the Report of Independent Registered Public Accounting Firm, are available on the Securities and Exchange Commission website or upon request.
3. Significant Accounting Policies.
The Fund is an investment company and applies the accounting and reporting guidance of the Financial Accounting Standards Board (FASB) Accounting Standards Codification Topic 946 Financial Services - Investment Companies. The financial statements have been prepared in conformity with accounting principles generally accepted in the United States of America (GAAP), which require management to make certain estimates and assumptions at the date of the financial statements. Actual results could differ from those estimates. Subsequent events, if any, through the date that the financial statements were issued have been evaluated in the preparation of the financial statements. The Fund's Schedule of Investments lists any underlying mutual funds or exchange-traded funds (ETFs) but does not include the underlying holdings of these funds. The following summarizes the significant accounting policies of the Fund:
Investment Valuation. Investments are valued as of 4:00 p.m. Eastern time on the last calendar day of the period. The Board of Trustees (the Board) has designated the Fund's investment adviser as the valuation designee responsible for the fair valuation function and performing fair value determinations as needed. The investment adviser has established a Fair Value Committee (the Committee) to carry out the day-to-day fair valuation responsibilities and has adopted policies and procedures to govern the fair valuation process and the activities of the Committee. In accordance with these fair valuation policies and procedures, which have been approved by the Board, the Fund attempts to obtain prices from one or more third party pricing services or brokers to value its investments. When current market prices, quotations or currency exchange rates are not readily available or reliable, investments will be fair valued in good faith by the Committee, in accordance with the policies and procedures. Factors used in determining fair value vary by investment type and may include market or investment specific events, transaction data, estimated cash flows, and market observations of comparable investments. The frequency that the fair valuation procedures are used cannot be predicted and they may be utilized to a significant extent. The Committee manages the Fund's fair valuation practices and maintains the fair valuation policies and procedures. The Fund's investment adviser reports to the Board information regarding the fair valuation process and related material matters.
The Fund categorizes the inputs to valuation techniques used to value its investments into a disclosure hierarchy consisting of three levels as shown below:
Level 1 - unadjusted quoted prices in active markets for identical investments
Level 2 - other significant observable inputs (including quoted prices for similar investments, interest rates, prepayment speeds, etc.)
Level 3 - unobservable inputs (including the Fund's own assumptions based on the best information available)
Valuation techniques used to value the Fund's investments by major category are as follows:
Equity securities, including restricted securities, for which market quotations are readily available, are valued at the last reported sale price or official closing price as reported by a third party pricing service on the primary market or exchange on which they are traded and are categorized as Level 1 in the hierarchy. In the event there were no sales during the day or closing prices are not available, securities are valued at the last quoted bid price or may be valued using the last available price and are generally categorized as Level 2 in the hierarchy. For foreign equity securities, when market or security specific events arise, comparisons to the valuation of American Depositary Receipts (ADRs), futures contracts, ETFs and certain indexes as well as quoted prices for similar securities may be used and would be categorized as Level 2 in the hierarchy. For equity securities, including restricted securities, where observable inputs are limited, assumptions about market activity and risk are used and these securities may be categorized as Level 3 in the hierarchy.
Investments in open-end mutual funds, including the Fidelity Central Funds, are valued at their closing net asset value (NAV) each business day and are categorized as Level 1 in the hierarchy.
Changes in valuation techniques may result in transfers in or out of an assigned level within the disclosure hierarchy. The aggregate value of investments by input level as of October 31, 2023 is included at the end of the Fund's Schedule of Investments.
Foreign Currency. Certain Funds may use foreign currency contracts to facilitate transactions in foreign-denominated securities. Gains and losses from these transactions may arise from changes in the value of the foreign currency or if the counterparties do not perform under the contracts' terms.
Foreign-denominated assets, including investment securities, and liabilities are translated into U.S. dollars at the exchange rates at period end. Purchases and sales of investment securities, income and dividends received, and expenses denominated in foreign currencies are translated into U.S. dollars at the exchange rate in effect on the transaction date.
The effects of exchange rate fluctuations on investments are included with the net realized and unrealized gain (loss) on investment securities. Other foreign currency transactions resulting in realized and unrealized gain (loss) are disclosed separately.
Investment Transactions and Income. For financial reporting purposes, the Fund's investment holdings and NAV include trades executed through the end of the last business day of the period. The NAV per share for processing shareholder transactions is calculated as of the close of business of the New York Stock Exchange (NYSE), normally 4:00 p.m. Eastern time and includes trades executed through the end of the prior business day. Gains and losses on securities sold are determined on the basis of identified cost. Commissions paid to certain brokers with whom the investment adviser, or its affiliates, places trades on behalf of a fund include an amount in addition to trade execution, which may be rebated back to a fund. Any such rebates are included in net realized gain (loss) on investments in the Statement of Operations. Dividend income is recorded on the ex-dividend date, except for certain dividends from foreign securities where the ex-dividend date may have passed, which are recorded as soon as the Fund is informed of the ex-dividend date. Non-cash dividends included in dividend income, if any, are recorded at the fair market value of the securities received. Income and capital gain distributions from Fidelity Central Funds, if any, are recorded on the ex-dividend date. Interest income is accrued as earned and includes coupon interest and amortization of premium and accretion of discount on debt securities as applicable. Investment income is recorded net of foreign taxes withheld where recovery of such taxes is uncertain. Funds may file withholding tax reclaims in certain jurisdictions to recover a portion of amounts previously withheld. Any withholding tax reclaims income is included in the Statement of Operations in foreign taxes withheld. Any receivables for withholding tax reclaims are included in the Statement of Assets and Liabilities in reclaims receivable. The Fund has filed tax reclaims for previously withheld taxes on dividends earned in certain European Union (EU) countries. These additional filings are subject to various administrative proceedings by the local jurisdictions' tax authorities within the EU, as well as a number of related judicial proceedings. Income recognized for EU reclaims is included with other reclaims in the Statement of Operations in foreign taxes withheld. These reclaims are recorded when the amount is known and there are no significant uncertainties on collectability.
Expenses. Expenses directly attributable to a fund are charged to that fund. Expenses attributable to more than one fund are allocated among the respective funds on the basis of relative net assets or other appropriate methods. Expenses included in the accompanying financial statements reflect the expenses of that fund and do not include any expenses associated with any underlying mutual funds or exchange-traded funds. Although not included in a fund's expenses, a fund indirectly bears its proportionate share of these expenses through the net asset value of each underlying mutual fund or exchange-traded fund. Expense estimates are accrued in the period to which they relate and adjustments are made when actual amounts are known.
Income Tax Information and Distributions to Shareholders. Each year, the Fund intends to qualify as a regulated investment company under Subchapter M of the Internal Revenue Code, including distributing substantially all of its taxable income and realized gains. As a result, no provision for U.S. Federal income taxes is required. As of October 31, 2023, the Fund did not have any unrecognized tax benefits in the financial statements; nor is the Fund aware of any tax positions for which it is reasonably possible that the total amounts of unrecognized tax benefits will significantly change in the next twelve months. The Fund files a U.S. federal tax return, in addition to state and local tax returns as required. The Fund's federal income tax returns are subject to examination by the Internal Revenue Service (IRS) for a period of three fiscal years after they are filed. State and local tax returns may be subject to examination for an additional fiscal year depending on the jurisdiction. Foreign taxes are provided for based on the Fund's understanding of the tax rules and rates that exist in the foreign markets in which it invests. The Fund is subject to a tax imposed on capital gains by certain countries in which it invests. An estimated deferred tax liability for net unrealized appreciation on the applicable securities is included in Other payables and accrued expenses on the Statement of Assets & Liabilities.
Distributions are declared and recorded on the ex-dividend date. Income and capital gain distributions are determined in accordance with income tax regulations, which may differ from GAAP.
Capital accounts within the financial statements are adjusted for permanent book-tax differences. These adjustments have no impact on net assets or the results of operations. Capital accounts are not adjusted for temporary book-tax differences which will reverse in a subsequent period.
Book-tax differences are primarily due to foreign currency transactions, certain foreign taxes, passive foreign investment companies (PFIC), capital loss carryforwards and losses deferred due to wash sales.
As of period end, the cost and unrealized appreciation (depreciation) in securities, and derivatives if applicable, for federal income tax purposes were as follows:
| Gross unrealized appreciation | $51,062,270 |
| Gross unrealized depreciation | (44,552,196) |
| Net unrealized appreciation (depreciation) | $6,510,074 |
| Tax Cost | $579,949,796 |
The tax-based components of distributable earnings as of period end were as follows:
| Undistributed ordinary income | $10,977,096 |
| Capital loss carryforward | $(118,325,907) |
| Net unrealized appreciation (depreciation) on securities and other investments | $6,479,975 |
Capital loss carryforwards are only available to offset future capital gains of the Fund to the extent provided by regulations and may be limited. The capital loss carryforward information presented below, including any applicable limitation, is estimated as of fiscal period end and is subject to adjustment.
| Short-term | $(80,207,263) |
| Long-term | (38,118,644) |
| Total capital loss carryforward | $(118,325,907) |
Due to large subscriptions in a prior period, approximately $75,073,225 of the Fund's realized capital losses are subject to limitation. Due to this limitation, the Fund will only be permitted to use approximately $11,985,573 of those capital losses per year to offset capital gains. Additionally, the Fund is subject to an annual limit on its use of some of its unrealized capital losses to offset capital gains in future periods. If those losses are realized and the limitation prevents the Fund from using any of those losses in a future period, those capital losses will be available to offset capital gains in subsequent periods.
The tax character of distributions paid was as follows:
| | October 31, 2023 | October 31, 2022 |
| Ordinary Income | $4,996,303 | $8,038,015 |
Restricted Securities (including Private Placements). Funds may invest in securities that are subject to legal or contractual restrictions on resale. These securities generally may be resold in transactions exempt from registration or to the public if the securities are registered. Disposal of these securities may involve time-consuming negotiations and expense, and prompt sale at an acceptable price may be difficult. Information regarding restricted securities held at period end is included at the end of the Schedule of Investments, if applicable.
4. Purchases and Sales of Investments.
Purchases and sales of securities, other than short-term securities and in-kind transactions, as applicable, are noted in the table below.
| | Purchases ($) | Sales ($) |
| Fidelity International Discovery K6 Fund | 314,233,206 | 307,453,263 |
Unaffiliated Exchanges In-Kind. Shares that were exchanged for investments, including accrued interest and cash, if any, are shown in the table below. The amount of in-kind exchanges is included in share transactions in the accompanying Statement of Changes in Net Assets.
| | Shares | Total Proceeds ($) |
| Fidelity International Discovery K6 Fund | 8,198,739 | 94,487,059 |
Prior Year Unaffiliated Exchanges In-Kind. Shares that were exchanged for investments, including accrued interest and cash, if any, are shown in the table below. The amount of in-kind exchanges is included in share transactions in the accompanying Statement of Changes in Net Assets.
| | Shares | Total Proceeds ($) |
| Fidelity International Discovery K6 Fund | 15,540,854 | 197,763,447 |
5. Fees and Other Transactions with Affiliates.
Management Fee. Fidelity Management & Research Company LLC (the investment adviser) and its affiliates provide the Fund with investment management related services for which the Fund pays a monthly management fee that is based on an annual rate of .60% of average net assets. Under the management contract, the investment adviser or an affiliate pays all other expenses of the Fund, excluding fees and expenses of the independent Trustees, and certain miscellaneous expenses such as proxy and shareholder meeting expenses.
Brokerage Commissions. A portion of portfolio transactions were placed with brokerage firms which are affiliates of the investment adviser. Brokerage commissions are included in net realized gain (loss) and change in net unrealized appreciation (depreciation) in the Statement of Operations. The commissions paid to these affiliated firms were as follows:
| | Amount |
| Fidelity International Discovery K6 Fund | $ 348 |
Interfund Trades. Funds may purchase from or sell securities to other Fidelity Funds under procedures adopted by the Board. The procedures have been designed to ensure these interfund trades are executed in accordance with Rule 17a-7 of the 1940 Act. Any interfund trades are included within the respective purchases and sales amounts shown in the Purchases and Sales of Investments note. Interfund trades during the period are noted in the table below.
| | Purchases ($) | Sales ($) | Realized Gain (Loss) ($) |
| Fidelity International Discovery K6 Fund | 9,930,939 | 5,687,152 | (1,175,844) |
6. Committed Line of Credit.
Certain Funds participate with other funds managed by the investment adviser or an affiliate in a $4.25 billion credit facility (the "line of credit") to be utilized for temporary or emergency purposes to fund shareholder redemptions or for other short-term liquidity purposes. The commitment fees on the pro-rata portion of the line of credit are borne by the investment adviser. During the period, there were no borrowings on this line of credit.
7. Security Lending.
Funds lend portfolio securities from time to time in order to earn additional income. Lending agents are used, including National Financial Services (NFS), an affiliate of the investment adviser. Pursuant to a securities lending agreement, NFS will receive a fee, which is capped at 9.9% of a fund's daily lending revenue, for its services as lending agent. A fund may lend securities to certain qualified borrowers, including NFS. On the settlement date of the loan, a fund receives collateral (in the form of U.S. Treasury obligations, letters of credit and/or cash) against the loaned securities and maintains collateral in an amount not less than 100% of the market value of the loaned securities during the period of the loan. The market value of the loaned securities is determined at the close of business of a fund and any additional required collateral is delivered to a fund on the next business day. A fund or borrower may terminate the loan at any time, and if the borrower defaults on its obligation to return the securities loaned because of insolvency or other reasons, a fund may apply collateral received from the borrower against the obligation. A fund may experience delays and costs in recovering the securities loaned. Any cash collateral received is invested in the Fidelity Securities Lending Cash Central Fund. Any loaned securities are identified as such in the Schedule of Investments, and the value of loaned securities and cash collateral at period end, as applicable, are presented in the Statement of Assets and Liabilities. Security lending income represents the income earned on investing cash collateral, less rebates paid to borrowers and any lending agent fees associated with the loan, plus any premium payments received for lending certain types of securities. Security lending income is presented in the Statement of Operations as a component of income from Fidelity Central Funds. Affiliated security lending activity, if any, was as follows:
| | Total Security Lending Fees Paid to NFS | Security Lending Income From Securities Loaned to NFS | Value of Securities Loaned to NFS at Period End |
| Fidelity International Discovery K6 Fund | $7,980 | $- | $- |
8. Expense Reductions.
Through arrangements with the Fund's custodian, credits realized as a result of certain uninvested cash balances were used to reduce the Fund's expenses by $116.
9. Other.
A fund's organizational documents provide former and current trustees and officers with a limited indemnification against liabilities arising in connection with the performance of their duties to the fund. In the normal course of business, a fund may also enter into contracts that provide general indemnifications. A fund's maximum exposure under these arrangements is unknown as this would be dependent on future claims that may be made against a fund. The risk of material loss from such claims is considered remote.
10. Risk and Uncertainties.
Many factors affect a fund's performance. Developments that disrupt global economies and financial markets, such as pandemics, epidemics, outbreaks of infectious diseases, war, terrorism, and environmental disasters, may significantly affect a fund's investment performance. The effects of these developments to a fund will be impacted by the types of securities in which a fund invests, the financial condition, industry, economic sector, and geographic location of an issuer, and a fund's level of investment in the securities of that issuer. Significant concentrations in security types, issuers, industries, sectors, and geographic locations may magnify the factors that affect a fund's performance.
To the Board of Trustees of Fidelity Investment Trust and the Shareholders of Fidelity International Discovery K6 Fund:
Opinion on the Financial Statements and Financial Highlights
We have audited the accompanying statement of assets and liabilities of Fidelity International Discovery K6 Fund (the "Fund"), a fund of Fidelity Investment Trust, including the schedule of investments, as of October 31, 2023, the related statement of operations for the year then ended, the statement of changes in net assets for each of the two years in the period then ended, the financial highlights for each of the four years in the period then ended and for the period from June 13, 2019 (commencement of operations) through October 31, 2019, and the related notes. In our opinion, the financial statements and financial highlights present fairly, in all material respects, the financial position of the Fund as of October 31, 2023, and the results of its operations for the year then ended, the changes in its net assets for each of the two years in the period then ended, and the financial highlights for each of the four years in the period then ended and for the period from June 13, 2019 (commencement of operations) through October 31, 2019, in conformity with accounting principles generally accepted in the United States of America.
Basis for Opinion
These financial statements and financial highlights are the responsibility of the Fund's management. Our responsibility is to express an opinion on the Fund's financial statements and financial highlights based on our audits. We are a public accounting firm registered with the Public Company Accounting Oversight Board (United States) (PCAOB) and are required to be independent with respect to the Fund in accordance with the U.S. federal securities laws and the applicable rules and regulations of the Securities and Exchange Commission and the PCAOB.
We conducted our audits in accordance with the standards of the PCAOB. Those standards require that we plan and perform the audit to obtain reasonable assurance about whether the financial statements and financial highlights are free of material misstatement, whether due to error or fraud. The Fund is not required to have, nor were we engaged to perform, an audit of its internal control over financial reporting. As part of our audits we are required to obtain an understanding of internal control over financial reporting but not for the purpose of expressing an opinion on the effectiveness of the Fund's internal control over financial reporting. Accordingly, we express no such opinion.
Our audits included performing procedures to assess the risks of material misstatement of the financial statements and financial highlights, whether due to error or fraud, and performing procedures that respond to those risks. Such procedures included examining, on a test basis, evidence regarding the amounts and disclosures in the financial statements and financial highlights. Our audits also included evaluating the accounting principles used and significant estimates made by management, as well as evaluating the overall presentation of the financial statements and financial highlights. Our procedures included confirmation of securities owned as of October 31, 2023, by correspondence with the custodian and brokers; when replies were not received from brokers, we performed other auditing procedures. We believe that our audits provide a reasonable basis for our opinion.
/s/ Deloitte & Touche LLP
Boston, Massachusetts
December 13, 2023
We have served as the auditor of one or more of the Fidelity investment companies since 1999.
The Trustees, Members of the Advisory Board (if any), and officers of the trust and fund, as applicable, are listed below. The Board of Trustees governs the fund and is responsible for protecting the interests of shareholders. The Trustees are experienced executives who meet periodically throughout the year to oversee the fund's activities, review contractual arrangements with companies that provide services to the fund, oversee management of the risks associated with such activities and contractual arrangements, and review the fund's performance. Except for Jonathan Chiel, each of the Trustees oversees 322 funds. Mr. Chiel oversees 191 funds.
The Trustees hold office without limit in time except that (a) any Trustee may resign; (b) any Trustee may be removed by written instrument, signed by at least two-thirds of the number of Trustees prior to such removal; (c) any Trustee who requests to be retired or who has become incapacitated by illness or injury may be retired by written instrument signed by a majority of the other Trustees; and (d) any Trustee may be removed at any special meeting of shareholders by a two-thirds vote of the outstanding voting securities of the trust. Each Trustee who is not an interested person (as defined in the 1940 Act) of the trust and the fund is referred to herein as an Independent Trustee. Each Independent Trustee shall retire not later than the last day of the calendar year in which his or her 75th birthday occurs. The Independent Trustees may waive this mandatory retirement age policy with respect to individual Trustees. Officers and Advisory Board Members hold office without limit in time, except that any officer or Advisory Board Member may resign or may be removed by a vote of a majority of the Trustees at any regular meeting or any special meeting of the Trustees. Except as indicated, each individual has held the office shown or other offices in the same company for the past five years.
The fund's Statement of Additional Information (SAI) includes more information about the Trustees. To request a free copy, call Fidelity at 1-800-835-5092.
Experience, Skills, Attributes, and Qualifications of the Trustees. The Governance and Nominating Committee has adopted a statement of policy that describes the experience, qualifications, attributes, and skills that are necessary and desirable for potential Independent Trustee candidates (Statement of Policy). The Board believes that each Trustee satisfied at the time he or she was initially elected or appointed a Trustee, and continues to satisfy, the standards contemplated by the Statement of Policy. The Governance and Nominating Committee also engages professional search firms to help identify potential Independent Trustee candidates who have the experience, qualifications, attributes, and skills consistent with the Statement of Policy. From time to time, additional criteria based on the composition and skills of the current Independent Trustees, as well as experience or skills that may be appropriate in light of future changes to board composition, business conditions, and regulatory or other developments, have also been considered by the professional search firms and the Governance and Nominating Committee. In addition, the Board takes into account the Trustees' commitment and participation in Board and committee meetings, as well as their leadership of standing and ad hoc committees throughout their tenure.
In determining that a particular Trustee was and continues to be qualified to serve as a Trustee, the Board has considered a variety of criteria, none of which, in isolation, was controlling. The Board believes that, collectively, the Trustees have balanced and diverse experience, qualifications, attributes, and skills, which allow the Board to operate effectively in governing the fund and protecting the interests of shareholders. Information about the specific experience, skills, attributes, and qualifications of each Trustee, which in each case led to the Board's conclusion that the Trustee should serve (or continue to serve) as a trustee of the fund, is provided below.
Board Structure and Oversight Function. Robert A. Lawrence is an interested person and currently serves as Chair. The Trustees have determined that an interested Chair is appropriate and benefits shareholders because an interested Chair has a personal and professional stake in the quality and continuity of services provided to the fund. Independent Trustees exercise their informed business judgment to appoint an individual of their choosing to serve as Chair, regardless of whether the Trustee happens to be independent or a member of management. The Independent Trustees have determined that they can act independently and effectively without having an Independent Trustee serve as Chair and that a key structural component for assuring that they are in a position to do so is for the Independent Trustees to constitute a substantial majority for the Board. The Independent Trustees also regularly meet in executive session. David M. Thomas serves as Lead Independent Trustee and as such (i) acts as a liaison between the Independent Trustees and management with respect to matters important to the Independent Trustees and (ii) with management prepares agendas for Board meetings.
Fidelity® funds are overseen by different Boards of Trustees. The fund's Board oversees Fidelity's high income and certain equity funds, and other Boards oversee Fidelity's alternative investment, investment-grade bond, money market, asset allocation, and other equity funds. The asset allocation funds may invest in Fidelity® funds overseen by the fund's Board. The use of separate Boards, each with its own committee structure, allows the Trustees of each group of Fidelity® funds to focus on the unique issues of the funds they oversee, including common research, investment, and operational issues. On occasion, the separate Boards establish joint committees to address issues of overlapping consequences for the Fidelity® funds overseen by each Board.
The Trustees operate using a system of committees to facilitate the timely and efficient consideration of all matters of importance to the Trustees, the fund, and fund shareholders and to facilitate compliance with legal and regulatory requirements and oversight of the fund's activities and associated risks. The Board, acting through its committees, has charged FMR and its affiliates with (i) identifying events or circumstances the occurrence of which could have demonstrably adverse effects on the fund's business and/or reputation; (ii) implementing processes and controls to lessen the possibility that such events or circumstances occur or to mitigate the effects of such events or circumstances if they do occur; and (iii) creating and maintaining a system designed to evaluate continuously business and market conditions in order to facilitate the identification and implementation processes described in (i) and (ii) above. Because the day-to-day operations and activities of the fund are carried out by or through FMR, its affiliates, and other service providers, the fund's exposure to risks is mitigated but not eliminated by the processes overseen by the Trustees. While each of the Board's committees has responsibility for overseeing different aspects of the fund's activities, oversight is exercised primarily through the Operations, Audit, and Compliance Committees. Appropriate personnel, including but not limited to the fund's Chief Compliance Officer (CCO), FMR's internal auditor, the independent accountants, the fund's Treasurer and portfolio management personnel, make periodic reports to the Board's committees, as appropriate, including an annual review of Fidelity's risk management program for the Fidelity® funds. The responsibilities of each standing committee, including their oversight responsibilities, are described further under "Standing Committees of the Trustees."
Interested Trustees*:
Correspondence intended for a Trustee who is an interested person may be sent to Fidelity Investments, 245 Summer Street, Boston, Massachusetts 02210.
Name, Year of Birth; Principal Occupations and Other Relevant Experience+
Jonathan Chiel (1957)
Year of Election or Appointment: 2016
Trustee
Mr. Chiel also serves as Trustee of other Fidelity® funds. Mr. Chiel is General Counsel (2012-present) and Head of Legal, Risk and Compliance (2022-present). Mr Chiel serves as Executive Vice President and General Counsel for FMR LLC (diversified financial services company, 2012-present) and Director and President for OH Company LLC (holding company, 2018-present). Previously, Mr. Chiel served as general counsel (2004-2012) and senior vice president and deputy general counsel (2000-2004) for John Hancock Financial Services; a partner with Choate, Hall & Stewart (1996-2000) (law firm); and an Assistant United States Attorney for the United States Attorney's Office of the District of Massachusetts (1986-95), including Chief of the Criminal Division (1993-1995). Mr. Chiel is a director on the boards of the Boston Bar Foundation and the Maimonides School.
Bettina Doulton (1964)
Year of Election or Appointment: 2021
Trustee
Ms. Doulton also serves as Trustee of other Fidelity® funds. Prior to her retirement, Ms. Doulton served in a variety of positions at Fidelity Investments, including as a managing director of research (2006-2007), portfolio manager to certain Fidelity® funds (1993-2005), equity analyst and portfolio assistant (1990-1993), and research assistant (1987-1990). Ms. Doulton currently owns and operates Phi Builders + Architects and Cellardoor Winery. Previously, Ms. Doulton served as a member of the Board of Brown Capital Management, LLC (2014-2018).
Robert A. Lawrence (1952)
Year of Election or Appointment: 2020
Trustee
Chair of the Board of Trustees
Mr. Lawrence also serves as Trustee of other funds. Previously, Mr. Lawrence served as a Trustee and Member of the Advisory Board of certain funds. Prior to his retirement in 2008, Mr. Lawrence served as Vice President of certain Fidelity® funds (2006-2008), Senior Vice President, Head of High Income Division of Fidelity Management & Research Company (investment adviser firm, 2006-2008), and President of Fidelity Strategic Investments (investment adviser firm, 2002-2005).
* Determined to be an "Interested Trustee" by virtue of, among other things, his or her affiliation with the trust or various entities under common control with FMR.
+ The information includes the Trustee's principal occupation during the last five years and other information relating to the experience, attributes, and skills relevant to the Trustee's qualifications to serve as a Trustee, which led to the conclusion that the Trustee should serve as a Trustee for the fund.
Independent Trustees:
Correspondence intended for an Independent Trustee may be sent to Fidelity Investments, P.O. Box 55235, Boston, Massachusetts 02205-5235.
Name, Year of Birth; Principal Occupations and Other Relevant Experience+
Thomas P. Bostick (1956)
Year of Election or Appointment: 2021
Trustee
Lieutenant General Bostick also serves as Trustee of other Fidelity® funds. Prior to his retirement, General Bostick (United States Army, Retired) held a variety of positions within the U.S. Army, including Commanding General and Chief of Engineers, U.S. Army Corps of Engineers (2012-2016) and Deputy Chief of Staff and Director of Human Resources, U.S. Army (2009-2012). General Bostick currently serves as a member of the Board and Finance and Governance & Sustainability Committees of CSX Corporation (transportation, 2020-present) and a member of the Board and Corporate Governance and Nominating Committee of Perma-Fix Environmental Services, Inc. (nuclear waste management, 2020-present). General Bostick serves as Chief Executive Officer of Bostick Global Strategies, LLC (consulting, 2016-present), as a member of the Board of HireVue, Inc. (video interview and assessment, 2020-present), as a member of the Board of Allonnia (biotechnology and engineering solutions, 2022-present) and on the Advisory Board of Solugen, Inc. (specialty bio-based chemicals manufacturer, 2022-present). Previously, General Bostick served as a Member of the Advisory Board of certain Fidelity® funds (2021), President, Intrexon Bioengineering (2018-2020) and Chief Operating Officer (2017-2020) and Senior Vice President of the Environment Sector (2016-2017) of Intrexon Corporation (biopharmaceutical company).
Dennis J. Dirks (1948)
Year of Election or Appointment: 2005
Trustee
Mr. Dirks also serves as Trustee of other Fidelity® funds. Prior to his retirement in May 2003, Mr. Dirks served as Chief Operating Officer and as a member of the Board of The Depository Trust & Clearing Corporation (financial markets infrastructure), President, Chief Operating Officer and a member of the Board of The Depository Trust Company (DTC), President and a member of the Board of the National Securities Clearing Corporation (NSCC), Chief Executive Officer and a member of the Board of the Government Securities Clearing Corporation and Chief Executive Officer and a member of the Board of the Mortgage-Backed Securities Clearing Corporation. Mr. Dirks currently serves as a member of the Finance Committee (2016-present) and Board (2017-present) and is Treasurer (2018-present) of the Asolo Repertory Theatre.
Donald F. Donahue (1950)
Year of Election or Appointment: 2018
Trustee
Mr. Donahue also serves as Trustee of other Fidelity® funds. Mr. Donahue serves as President and Chief Executive Officer of Miranda Partners, LLC (risk consulting for the financial services industry, 2012-present). Previously, Mr. Donahue served as Chief Executive Officer (2006-2012), Chief Operating Officer (2003-2006) and Managing Director, Customer Marketing and Development (1999-2003) of The Depository Trust & Clearing Corporation (financial markets infrastructure). Mr. Donahue currently serves as a member (2007-present) and Co-Chairman (2016-present) of the Board of United Way of New York. Mr. Donahue previously served as a member of the Advisory Board of certain Fidelity® funds (2015-2018) and as a member of the Board of The Leadership Academy (previously NYC Leadership Academy) (2012-2022).
Vicki L. Fuller (1957)
Year of Election or Appointment: 2020
Trustee
Ms. Fuller also serves as Trustee of other Fidelity® funds. Previously, Ms. Fuller served as a member of the Advisory Board of certain Fidelity® funds (2018-2020), Chief Investment Officer of the New York State Common Retirement Fund (2012-2018) and held a variety of positions at AllianceBernstein L.P. (global asset management, 1985-2012), including Managing Director (2006-2012) and Senior Vice President and Senior Portfolio Manager (2001-2006). Ms. Fuller currently serves as a member of the Board, Audit Committee and Nominating and Governance Committee of two Blackstone business development companies (2020-present), as a member of the Board of Treliant, LLC (consulting, 2019-present), as a member of the Board of Ariel Alternatives, LLC (private equity, 2022-present) and as a member of the Board and Chair of the Audit Committee of Gusto, Inc. (software, 2021-present). In addition, Ms. Fuller currently serves as a member of the Board of Roosevelt University (2019-present) and as a member of the Executive Board of New York University's Stern School of Business. Ms. Fuller previously served as a member of the Board, Audit Committee and Nominating and Governance Committee of The Williams Companies, Inc. (natural gas infrastructure, 2018-2021).
Patricia L. Kampling (1959)
Year of Election or Appointment: 2020
Trustee
Ms. Kampling also serves as Trustee of other Fidelity® funds. Prior to her retirement, Ms. Kampling served as Chairman of the Board and Chief Executive Officer (2012-2019), President and Chief Operating Officer (2011-2012) and Executive Vice President and Chief Financial Officer (2010-2011) of Alliant Energy Corporation. Ms. Kampling currently serves as a member of the Board, Finance Committee and Governance, Compensation and Nominating Committee of Xcel Energy Inc. (utilities company, 2020-present) and as a member of the Board, Audit, Finance and Risk Committee and Safety, Environmental, Technology and Operations Committee and Chair of the Executive Development and Compensation Committee of American Water Works Company, Inc. (utilities company, 2019-present). In addition, Ms. Kampling currently serves as a member of the Board of the Nature Conservancy, Wisconsin Chapter (2019-present). Previously, Ms. Kampling served as a Member of the Advisory Board of certain Fidelity® funds (2020), a member of the Board, Compensation Committee and Executive Committee and Chair of the Audit Committee of Briggs & Stratton Corporation (manufacturing, 2011-2021), a member of the Board of Interstate Power and Light Company (2012-2019) and Wisconsin Power and Light Company (2012-2019) (each a subsidiary of Alliant Energy Corporation) and as a member of the Board and Workforce Development Committee of the Business Roundtable (2018-2019).
Thomas A. Kennedy (1955)
Year of Election or Appointment: 2021
Trustee
Mr. Kennedy also serves as Trustee of other Fidelity® funds. Previously, Mr. Kennedy served as a Member of the Advisory Board of certain Fidelity® funds (2020) and held a variety of positions at Raytheon Company (aerospace and defense, 1983-2020), including Chairman and Chief Executive Officer (2014-2020) and Executive Vice President and Chief Operating Officer (2013-2014). Mr. Kennedy served as Executive Chairman of the Board of Directors of Raytheon Technologies Corporation (aerospace and defense, 2020-2021). Mr. Kennedy serves as a Director of the Board of Directors of Textron Inc. (aerospace and defense, 2023-present).
Oscar Munoz (1959)
Year of Election or Appointment: 2021
Trustee
Mr. Munoz also serves as Trustee of other Fidelity® funds. Prior to his retirement, Mr. Munoz served as Executive Chairman (2020-2021), Chief Executive Officer (2015-2020), President (2015-2016) and a member of the Board (2010-2021) of United Airlines Holdings, Inc. Mr. Munoz currently serves as a member of the Board of CBRE Group, Inc. (commercial real estate, 2020-present), a member of the Board of Univision Communications, Inc. (Hispanic media, 2020-present), a member of the Board of Archer Aviation Inc. (2021-present), a member of the Defense Business Board of the United States Department of Defense (2021-present) and a member of the Board of Salesforce.com, Inc. (cloud-based software, 2022-present). Previously, Mr. Munoz served as a Member of the Advisory Board of certain Fidelity® funds (2021).
David M. Thomas (1949)
Year of Election or Appointment: 2008
Trustee
Lead Independent Trustee
Mr. Thomas also serves as Trustee of other Fidelity® funds. Previously, Mr. Thomas served as Executive Chairman (2005-2006) and Chairman and Chief Executive Officer (2000-2005) of IMS Health, Inc. (pharmaceutical and healthcare information solutions). Mr. Thomas currently serves as a member of the Board of Fortune Brands Home and Security (home and security products, 2004-present) and as Director (2013-present) and Non-Executive Chairman of the Board (2022-present) of Interpublic Group of Companies, Inc. (marketing communication).
Susan Tomasky (1953)
Year of Election or Appointment: 2020
Trustee
Ms. Tomasky also serves as Trustee of other Fidelity® funds. Prior to her retirement, Ms. Tomasky served in various executive officer positions at American Electric Power Company, Inc. (1998-2011), including most recently as President of AEP Transmission (2007-2011). Ms. Tomasky currently serves as a member of the Board and Sustainability Committee and as Chair of the Audit Committee of Marathon Petroleum Corporation (2018-present) and as a member of the Board, Executive Committee, Corporate Governance Committee and Organization and Compensation Committee and as Lead Director of the Board of Public Service Enterprise Group, Inc. (utilities company, 2012-present) and as a member of the Board of its subsidiary company, Public Service Electric and Gas Co. (2021-present). In addition, Ms. Tomasky currently serves as a member (2009-present) and President (2020-present) of the Board of the Royal Shakespeare Company - America (2009-present), as a member of the Board of the Columbus Association for the Performing Arts (2011-present) and as a member of the Board and Kenyon in the World Committee of Kenyon College (2016-present). Previously, Ms. Tomasky served as a Member of the Advisory Board of certain Fidelity® funds (2020), as a member of the Board of the Columbus Regional Airport Authority (2007-2020), as a member of the Board (2011-2018) and Lead Independent Director (2015-2018) of Andeavor Corporation (previously Tesoro Corporation) (independent oil refiner and marketer) and as a member of the Board of Summit Midstream Partners LP (energy, 2012-2018).
Michael E. Wiley (1950)
Year of Election or Appointment: 2020
Trustee
Mr. Wiley also serves as Trustee of other Fidelity® funds. Previously, Mr. Wiley served as a member of the Advisory Board of certain Fidelity® funds (2018-2020), Chairman, President and CEO of Baker Hughes, Inc. (oilfield services, 2000-2004). Mr. Wiley also previously served as a member of the Board of Andeavor Corporation (independent oil refiner and marketer, 2005-2018), a member of the Board of Andeavor Logistics LP (natural resources logistics, 2015-2018) and a member of the Board of High Point Resources (exploration and production, 2005-2020).
+ The information includes the Trustee's principal occupation during the last five years and other information relating to the experience, attributes, and skills relevant to the Trustee's qualifications to serve as a Trustee, which led to the conclusion that the Trustee should serve as a Trustee for the fund.
Advisory Board Members and Officers:
Correspondence intended for a Member of the Advisory Board (if any) may be sent to Fidelity Investments, P.O. Box 55235, Boston, Massachusetts 02205-5235. Correspondence intended for an officer or Peter S. Lynch may be sent to Fidelity Investments, 245 Summer Street, Boston, Massachusetts 02210.
Name, Year of Birth; Principal Occupation
Vijay C. Advani (1960)
Year of Election or Appointment: 2023
Member of the Advisory Board
Mr. Advani also serves as Trustee or Member of the Advisory Board of other funds. Previously, Mr. Advani served as Executive Chairman (2020-2022), Chief Executive Officer (2017-2020) and Chief Operating Officer (2016-2017) of Nuveen (global investment manager). He also served in various capacities at Franklin Resources (global investment manager), including Co-President (2015-2016), Executive Vice President, Global Advisory Services (2008-2015), Head of Global Retail Distribution (2005-2008), Executive Managing Director, International Retail Development (2002-2005), Managing Director, Product Developments, Sales & Marketing, Asia, Eastern Europe and Africa (2000-2002) and President, Templeton Asset Management India (1995-2000). Mr. Advani also served as Senior Investment Officer of International Finance Corporation (private equity and venture capital arm of The World Bank, 1984-1995). Mr. Advani is Chairman Emeritus of the U.S. India Business Council (2018-present), a Director of The Global Impact Investing Network (2019-present), a Director of LOK Capital (Mauritius) (2022-present), a member of the Advisory Council of LOK Capital (2022-present), a Senior Advisor of Neuberger Berman (2021-present), a Senior Advisor of Seviora Holdings Pte. Ltd (Temasek-Singapore) (2021-present), a Director of Seviora Capital (Singapore) (2021-present) and an Advisor of EQUIAM (2021-present). Mr. Advani formerly served as a member of the Board of BowX Acquisition Corp. (special purpose acquisition company, 2020-2021), a member of the Board of Intellecap (advisory arm of The Aavishkaar Group, 2018-2020), a member of the Board of Nuveen Investments, Inc. (2017-2020) and a member of the Board of Docusign (software, 2016-2019).
Peter S. Lynch (1944)
Year of Election or Appointment: 2003
Member of the Advisory Board
Mr. Lynch also serves as a Member of the Advisory Board of other Fidelity® funds. Mr. Lynch is Vice Chairman and a Director of Fidelity Management & Research Company LLC (investment adviser firm). In addition, Mr. Lynch serves as a Trustee of Boston College and as the Chairman of the Inner-City Scholarship Fund. Previously, Mr. Lynch served as Vice Chairman and a Director of FMR Co., Inc. (investment adviser firm) and on the Special Olympics International Board of Directors (1997-2006).
Karen B. Peetz (1955)
Year of Election or Appointment: 2023
Member of the Advisory Board
Ms. Peetz also serves as a Member of the Advisory Board of other funds. Previously, Ms. Peetz served as Chief Administration Officer (2020-2023) of Citigroup Inc. (a diversified financial service company). She also served in various capacities at Bank of New York Mellon Corporation, including President (2013-2016), Vice Chairman, Senior Executive Vice President and Chief Executive Officer of Financial Markets & Treasury Services (2010-2013), Senior Executive Vice President and Chief Executive Officer of Global Corporate Trust (2003-2008), Senior Vice President and Division Manager of Global Payments & Trade Services (2002-2003) and Senior Vice President and Division Manager of Domestic Corporate Trust (1998-2002). Ms. Peetz also served in various capacities at Chase Manhattan Corporation (1982-1998), including Senior Vice President and Manager of Corporate Trust International Business (1996-1998), Managing Director and Manager of Corporate Trust Services (1994-1996) and Managing Director and Group Manager of Financial Institution Sales (1990-1993). Ms. Peetz currently serves as Chair of Amherst Holdings Advisory Council (2018-present), Trustee of Johns Hopkins University (2016-present), Chair of the Carey Business School Advisory Council, Member of the Johns Hopkins Medicine Board and Finance Committee and Chair of the Lyme and Tick Related Disease Institute Advisory Council. Ms. Peetz previously served as a member of the Board of Guardian Life Insurance Company of America (2019-2023), a member of the Board of Trane Technologies (2018-2022), a member of the Board of Wells Fargo Corp. (2017-2019), a member of the Board of SunCoke Energy Inc. (2012-2016), a member of the Board of Private Export Funding Corporation (2010-2016) and as a Trustee of Penn State University (2010-2014) and the United Way of New York City (2008-2010).
Heather Bonner (1977)
Year of Election or Appointment: 2023
Assistant Treasurer
Ms. Bonner also serves as an officer of other funds. Ms. Bonner is a Senior Vice President (2022-present) and is an employee of Fidelity Investments (2022-present). Ms. Bonner serves as Vice President, Treasurer, or Assistant Treasurer of certain Fidelity entities. Prior to joining Fidelity, Ms. Bonner served as Managing Director at AQR Capital Management (2013-2022) and was the Treasurer and Principal Financial Officer of the AQR Funds (2013-2022).
Craig S. Brown (1977)
Year of Election or Appointment: 2022
Deputy Treasurer
Mr. Brown also serves as an officer of other funds. Mr. Brown is a Vice President (2015-present) and is an employee of Fidelity Investments. Mr. Brown serves as Assistant Treasurer of FIMM, LLC (2021-present). Previously, Mr. Brown served as Assistant Treasurer of certain Fidelity® funds (2019-2022).
John J. Burke III (1964)
Year of Election or Appointment: 2018
Chief Financial Officer
Mr. Burke also serves as Chief Financial Officer of other funds. Mr. Burke is Head of Fidelity Fund and Investment Operations (2018-present) and is an employee of Fidelity Investments. Mr. Burke serves as President, Executive Vice President, or Director of certain Fidelity entities. Previously Mr. Burke served as head of Asset Management Investment Operations (2012-2018).
Margaret Carey (1973)
Year of Election or Appointment: 2023
Secretary and Chief Legal Officer (CLO)
Ms. Carey also serves as an officer of other funds and as CLO of certain Fidelity entities. Ms. Carey is a Senior Vice President, Deputy General Counsel (2019-present) and is an employee of Fidelity Investments.
William C. Coffey (1969)
Year of Election or Appointment: 2019
Assistant Secretary
Mr. Coffey also serves as Assistant Secretary of other funds. Mr. Coffey is a Senior Vice President, Deputy General Counsel (2010-present) and is an employee of Fidelity Investments. Previously, Mr. Coffey served as Secretary and CLO of certain funds (2018-2019); CLO, Secretary, or Senior Vice President of certain Fidelity entities and Assistant Secretary of certain funds (2009-2018).
Timothy M. Cohen (1969)
Year of Election or Appointment: 2018
Vice President
Mr. Cohen also serves as Vice President of other funds. Mr. Cohen is Co-Head of Equity (2018-present) and is an employee of Fidelity Investments. Mr. Cohen serves a Director of Fidelity Management & Research (Japan) Limited (investment adviser firm, 2016-present). Previously, Mr. Cohen served as Executive Vice President of Fidelity SelectCo, LLC (2019) and Head of Global Equity Research (2016-2018).
Jonathan Davis (1968)
Year of Election or Appointment: 2010
Assistant Treasurer
Mr. Davis also serves as an officer of other funds. Mr. Davis is a Vice President (2006-present) and is an employee of Fidelity Investments. Mr. Davis serves as Assistant Treasurer of certain Fidelity entities.
Laura M. Del Prato (1964)
Year of Election or Appointment: 2018
Assistant Treasurer
Ms. Del Prato also serves as an officer of other funds. Ms. Del Prato is a Senior Vice President (2017-present) and is an employee of Fidelity Investments. Ms. Del Prato serves as Vice President or Assistant Treasurer of certain Fidelity entities. Previously, Ms. Del Prato served as President and Treasurer of The North Carolina Capital Management Trust: Cash Portfolio and Term Portfolio (2018-2020).
Colm A. Hogan (1973)
Year of Election or Appointment: 2020
Assistant Treasurer
Mr. Hogan also serves as an officer of other funds. Mr. Hogan is a Vice President (2016-present) and is an employee of Fidelity Investments. Mr. Hogan serves as Assistant Treasurer of certain Fidelity entities. Previously, Mr. Hogan served as Deputy Treasurer of certain Fidelity® funds (2016-2020) and Assistant Treasurer of certain Fidelity® funds (2016-2018).
Pamela R. Holding (1964)
Year of Election or Appointment: 2018
Vice President
Ms. Holding also serves as Vice President of other funds. Ms. Holding is Co-Head of Equity (2018-present) and is an employee of Fidelity Investments. Previously, Ms. Holding served as Executive Vice President of Fidelity SelectCo, LLC (2019) and as Chief Investment Officer of Fidelity Institutional Asset Management (2013-2018).
Chris Maher (1972)
Year of Election or Appointment: 2020
Deputy Treasurer
Mr. Maher also serves as an officer of other funds. Mr. Maher is a Vice President (2008-present) and is an employee of Fidelity Investments. Mr. Maher serves as Assistant Treasurer of certain Fidelity entities. Previously, Mr. Maher served as Assistant Treasurer of certain funds (2013-2020).
Jason P. Pogorelec (1975)
Year of Election or Appointment: 2020
Chief Compliance Officer
Mr. Pogorelec also serves as Chief Compliance Officer of other funds. Mr. Pogorelec is a Senior Vice President of Asset Management Compliance (2020-present) and is an employee of Fidelity Investments. Mr. Pogorelec serves as Compliance Officer of Fidelity Management & Research Company LLC (investment adviser firm, 2023-present) and Ballyrock Investment Advisors LLC (2023-present). Previously, Mr. Pogorelec served as a Vice President, Associate General Counsel for Fidelity Investments (2010-2020) and Assistant Secretary of certain Fidelity® funds (2015-2020).
Brett Segaloff (1972)
Year of Election or Appointment: 2021
Anti-Money Laundering (AML) Officer
Mr. Segaloff also serves as AML Officer of other funds. Mr. Segaloff is a Vice President (2022-present) and is an employee of Fidelity Investments. Mr. Segaloff serves as Anti Money Laundering Compliance Officer or Anti Money Laundering/Bank Secrecy Act Compliance Officer of certain Fidelity entities.
Stacie M. Smith (1974)
Year of Election or Appointment: 2016
President and Treasurer
Ms. Smith also serves as an officer of other funds. Ms. Smith is a Senior Vice President (2016-present) and is an employee of Fidelity Investments. Ms. Smith serves as Assistant Treasurer of certain Fidelity entities and has served in other fund officer roles.
Jim Wegmann (1979)
Year of Election or Appointment: 2019
Assistant Treasurer
Mr. Wegmann also serves as an officer of other funds. Mr. Wegmann is a Vice President (2016-present) and is an employee of Fidelity Investments. Mr. Wegmann serves as Assistant Treasurer of FIMM, LLC (2021-present). Previously, Mr. Wegmann served as Assistant Treasurer of certain Fidelity® funds (2019-2021).
As a shareholder, you incur two types of costs: (1) transaction costs, which may include sales charges (loads) on purchase payments or redemption proceeds, as applicable and (2) ongoing costs, which generally include management fees, distribution and/or service (12b-1) fees and other Fund expenses. This Example is intended to help you understand your ongoing costs (in dollars) of investing in a fund and to compare these costs with the ongoing costs of investing in other mutual funds.
| The Example is based on an investment of $1,000 invested at the beginning of the period and held for the entire period (May 1, 2023 to October 31, 2023). |
Actual Expenses
The first line of the accompanying table provides information about actual account values and actual expenses. You may use the information in this line, together with the amount you invested, to estimate the expenses that you paid over the period. Simply divide your account value by $1,000.00 (for example, an $8,600 account value divided by $1,000.00 = 8.6), then multiply the result by the number in the first line for a class/Fund under the heading entitled "Expenses Paid During Period" to estimate the expenses you paid on your account during this period. If any fund is a shareholder of any underlying mutual funds or exchange-traded funds (ETFs) (the Underlying Funds), such fund indirectly bears its proportional share of the expenses of the Underlying Funds in addition to the direct expenses incurred presented in the table. These fees and expenses are not included in the annualized expense ratio used to calculate the expense estimate in the table below.
Hypothetical Example for Comparison Purposes
The second line of the accompanying table provides information about hypothetical account values and hypothetical expenses based on the actual expense ratio and an assumed rate of return of 5% per year before expenses, which is not the actual return. The hypothetical account values and expenses may not be used to estimate the actual ending account balance or expenses you paid for the period. You may use this information to compare the ongoing costs of investing in the Fund and other funds. To do so, compare this 5% hypothetical example with the 5% hypothetical examples that appear in the shareholder reports of the other funds. If any fund is a shareholder of any Underlying Funds, such fund indirectly bears its proportional share of the expenses of the Underlying Funds in addition to the direct expenses as presented in the table. These fees and expenses are not included in the annualized expense ratio used to calculate the expense estimate in the table below.
Please note that the expenses shown in the table are meant to highlight your ongoing costs only and do not reflect any transaction costs. Therefore, the second line of the table is useful in comparing ongoing costs only, and will not help you determine the relative total costs of owning different funds. In addition, if these transactional costs were included, your costs would have been higher.
| | | | | Annualized Expense Ratio- A | | Beginning Account Value May 1, 2023 | | Ending Account Value October 31, 2023 | | Expenses Paid During Period- C May 1, 2023 to October 31, 2023 |
| | | | | | | | | | |
| Fidelity® International Discovery K6 Fund | | | | .60% | | | | | | |
| Actual | | | | | | $ 1,000 | | $ 916.50 | | $ 2.90 |
Hypothetical-B | | | | | | $ 1,000 | | $ 1,022.18 | | $ 3.06 |
| |
A Annualized expense ratio reflects expenses net of applicable fee waivers.
B 5% return per year before expenses
C Expenses are equal to the annualized expense ratio, multiplied by the average account value over the period, multiplied by 184/ 365 (to reflect the one-half year period). The fees and expenses of any Underlying Funds are not included in each annualized expense ratio.
The dividend and capital gains distributions for the fund(s) are available on Fidelity.com or Institutional.Fidelity.com.
The fund designates $184,519 of distributions paid during the fiscal year ended 2023 as qualifying to be taxed as section 163(j) interest dividends.
The fund designates 100% of the dividend distributed during the fiscal year as amounts which may be taken into account as a dividend for the purposes of the maximum rate under section 1(h)(11) of the Internal Revenue Code.
The amounts per share which represent income derived from sources within, and taxes paid to, foreign countries or possessions of the United States are $0.1320 and $0.0240 for the dividend paid December 12, 2022.
The fund will notify shareholders in January 2024 of amounts for use in preparing 2023 income tax returns.
Board Approval of Investment Advisory Contracts and Management Fees
Fidelity International Discovery K6 Fund
Each year, the Board of Trustees, including the Independent Trustees (together, the Board), considers the renewal of the fund's management contract with Fidelity Management & Research Company LLC (FMR) and the sub-advisory agreements (together, the Advisory Contracts) for the fund. FMR and the sub-advisers are referred to herein as the Investment Advisers. The Board, assisted by the advice of fund counsel and Independent Trustees' counsel, requests and considers a broad range of information relevant to the renewal of the Advisory Contracts throughout the year.
The Board meets regularly and, at each of its meetings, covers an extensive agenda of topics and materials and considers factors that are relevant to its annual consideration of the renewal of the fund's Advisory Contracts, including the services and support provided to the fund and its shareholders. The Board, acting directly and through its Committees (each of which is composed of and chaired by Independent Trustees), requests and receives information concerning the annual consideration of the renewal of the fund's Advisory Contracts. The Board also meets as needed to review matters specifically related to the Board's annual consideration of the renewal of the Advisory Contracts. Members of the Board may also meet with trustees of other Fidelity funds through joint ad hoc committees to discuss certain matters relevant to all of the Fidelity funds.
Approval of Stub Period Continuation. At its May 2023 meeting, the Board of Trustees voted to continue the fund's management contract with FMR, and the sub-advisory agreements and sub-sub-advisory agreements, in each case, where applicable (together, the Advisory Contracts), without modification, for two months from June 1, 2023 through July 31, 2023. The Board considered that the approval of the fund's Advisory Contracts will not result in any changes in (i) the investment process or strategies employed in the management of the fund's assets; (ii) the fees and expenses paid by shareholders; (iii) the nature, extent or quality of services provided under the fund's Advisory Contracts; or (iv) the day-to-day management of the fund or the persons primarily responsible for such management. The Board also considered that since its last approval of the fund's Advisory Contracts, FMR had provided additional information on the fund in support of the annual contract renewal process, including competitive analyses on total expenses and management fees and in-depth reviews of fund performance and fund profitability information. The Board concluded that the fund's Advisory Contracts are fair and reasonable, and that the fund's Advisory Contracts should be renewed, without modification, through July 31, 2023, with the understanding that the Board would consider the annual renewal for a full one year period in July 2023.
At its July 2023 meeting, the Board unanimously determined to renew the fund's Advisory Contracts. In reaching its determination, the Board considered all factors it believed relevant, including (i) the nature, extent, and quality of the services provided to the fund and its shareholders (including the investment performance of the fund); (ii) the competitiveness relative to peer funds of the fund's management fee and total expense ratio; (iii) the total costs of the services provided by and the profits realized by FMR and its affiliates (Fidelity) from its relationships with the fund; and (iv) the extent to which, if any, economies of scale exist and are realized as the fund grows, and whether any economies of scale are appropriately shared with fund shareholders. The Board also considered the broad range of investment choices available to shareholders from FMR's competitors and that the fund's shareholders have chosen to invest in the fund, which is part of the Fidelity family of funds. The Board's decision to renew the Advisory Contracts was not based on any single factor.
The Board reached a determination, with the assistance of fund counsel and Independent Trustees' counsel and through the exercise of its business judgment, that the renewal of the Advisory Contracts was in the best interests of the fund and its shareholders and that the compensation payable under the Advisory Contracts was fair and reasonable in light of all of the surrounding circumstances.
Nature, Extent, and Quality of Services Provided. The Board considered staffing as it relates to the fund, including the backgrounds and experience of investment personnel of the Investment Advisers, and also considered the Investment Advisers' implementation of the fund's investment program. The Independent Trustees also had discussions with senior management of Fidelity's investment operations and investment groups. The Board considered the structure of the investment personnel compensation program and whether this structure provides appropriate incentives to act in the best interests of the fund. Additionally, the Board considered the portfolio managers' investments, if any, in the funds that they manage.
Resources Dedicated to Investment Management and Support Services. The Board and the Fund Oversight and Research Committees reviewed the general qualifications and capabilities of Fidelity's investment staff, including its size, education, experience, and resources, as well as Fidelity's approach to recruiting, training, managing, and compensating investment personnel. The Board noted the resources devoted to expansion of Fidelity's global investment organization, and that Fidelity's analysts have extensive resources, tools, and capabilities that allow them to conduct sophisticated quantitative and fundamental analysis, as well as credit analysis of issuers, counterparties, and guarantors. Further, the Board considered that Fidelity's investment professionals have sufficient access to global information and data so as to provide competitive investment results over time, and that those professionals also have access to sophisticated tools that permit them to assess portfolio construction and risk and performance attribution characteristics continuously, as well as to transmit new information and research conclusions rapidly around the world. Additionally, in its deliberations, the Board considered Fidelity's trading, risk management, compliance, and technology and operations capabilities and resources, which are integral parts of the investment management process.
Shareholder and Administrative Services. The Board considered (i) the nature, extent, quality, and cost of advisory, administrative, and shareholder services performed by the Investment Advisers and their affiliates under the Advisory Contracts and under separate agreements covering transfer agency, pricing and bookkeeping, and securities lending services for the fund; (ii) the nature and extent of Fidelity's supervision of third party service providers, principally custodians, subcustodians, and pricing vendors; and (iii) the resources devoted by Fidelity to, and the record of compliance with, the fund's compliance policies and procedures. The Board also reviewed the allocation of fund brokerage, including allocations to brokers affiliated with the Investment Advisers, the use of brokerage commissions to pay fund expenses, and the use of "soft" commission dollars to pay for research services. The Board also considered the fund's securities lending activities and any payments made to Fidelity relating to securities lending.
The Board noted that the growth of fund assets over time across the complex allows Fidelity to reinvest in the development of services designed to enhance the value and convenience of the Fidelity funds as investment vehicles. These services include 24-hour access to account information and market information over the Internet and through telephone representatives, investor education materials, and asset allocation tools. The Board also considered that it reviews customer service metrics such as telephone response times, continuity of services on the website and metrics addressing services at Fidelity Investor Centers.
Investment in a Large Fund Family. The Board considered the benefits to shareholders of investing in a fund that is part of a large family of funds offering a variety of investment disciplines and providing a large variety of fund investor services. The Board noted that Fidelity had taken, or had made recommendations that resulted in the Fidelity funds taking, a number of actions over the previous year that benefited particular funds and/or the Fidelity funds in general.
Investment Performance. The Board took into account discussions that occur with representatives of the Investment Advisers, and reports that it receives, at Board meetings throughout the year, relating to fund investment performance. In this regard the Board noted that as part of regularly scheduled fund reviews and other reports to the Board on fund performance, the Board considered annualized return information for the fund for different time periods, measured against an appropriate securities market index (benchmark index) and an appropriate peer group of funds with similar objectives (peer group). The Board also considered information about performance attribution. In its ongoing evaluation of fund investment performance, the Board gives particular attention to information indicating changes in performance of the funds over different time periods and discussed with the Investment Advisers the reasons for any overperformance or underperformance. The fund underperformed its benchmark and peers for the one- and three-year periods ended February 28, 2023, and as a result, the Board continues to engage in discussions with FMR about the steps it is taking to address the fund's performance.
In addition to reviewing absolute and relative fund performance, the Independent Trustees periodically consider the appropriateness of fund performance metrics in evaluating the results achieved. The Independent Trustees generally give greater weight to fund performance over longer time periods than over shorter time periods. Depending on the circumstances, the Independent Trustees may be satisfied with a fund's performance notwithstanding that it lags its benchmark index or peer group for certain periods.
Based on its review, the Board concluded that the nature, extent, and quality of services provided to the fund under the Advisory Contracts should continue to benefit the shareholders of the fund.
Competitiveness of Management Fee and Total Expense Ratio. The Board was provided with information regarding industry trends in management fees and expenses. In its review of the fund's management fee and total expense ratio, the Board considered the fund's unitary fee rate as well as other fund expenses paid by FMR under the fund's management contract, such as transfer agent fees, pricing and bookkeeping fees, and custodial, legal, and audit fees. The Board noted that Fidelity may agree to waive fees or reimburse expenses from time to time, and the extent to which, if any, it has done so for the fund.
Comparisons of Management Fees and Total Expense Ratios. Among other things, the Board reviewed data for selected groups of competitive funds and classes (referred to as "mapped groups") that were compiled by Fidelity based on combining similar investment objective categories (as classified by Lipper) that have comparable investment mandates. The data reviewed by the Board included (i) gross management fee comparisons (before taking into account expense reimbursements or caps) relative to the total universe of funds within the mapped group; (ii) gross management fee comparisons relative to a subset of non-Fidelity funds in the mapped group that are similar in size and management fee structure to the fund (referred to as the "asset size peer group"); (iii) total expense comparisons of the fund relative to funds and classes in the mapped group that have a similar sales load structure to the fund (referred to as the "similar sales load structure group"); and (iv) total expense comparisons of the fund relative to funds and classes in the similar sales load structure group that are similar in size and management fee structure to the fund (referred to as the "total expense asset size peer group"). The total expense asset size peer group comparison excludes performance adjustments and fund-paid 12b-1 fees to eliminate variability in fee structures.
The information provided to the Board indicated that the fund's management fee rate ranked below the competitive median of the mapped group for the 12-month period ended September 30, 2022 and below the competitive median of the asset size peer group for the 12-month period ended September 30, 2022. Further, the information provided to the Board indicated that the total expense ratio of the fund ranked below the competitive median of the similar sales load structure group for the 12-month period ended September 30, 2022 and below the competitive median of the total expense asset size peer group for the 12-month period ended September 30, 2022.
Fees Charged to Other Fidelity Clients. The Board also considered Fidelity fee structures and other information with respect to clients of Fidelity, such as other funds advised or subadvised by Fidelity, pension plan clients, and other institutional clients with similar mandates. The Board noted that a joint ad hoc committee created by it and the boards of other Fidelity funds periodically reviews and compares Fidelity's institutional investment advisory business with its business of providing services to the Fidelity funds and also noted the most recent findings of the committee. The Board noted that the committee's review included a consideration of the differences in services provided, fees charged, and costs incurred, as well as competition in the markets serving the different categories of clients.
Based on its review, the Board concluded that the fund's management fee is fair and reasonable in light of the services that the fund receives and the other factors considered. Further, based on its review of total expense ratios and fees charged to other Fidelity clients, the Board concluded that the fund's total expense ratio was reasonable in light of the services that the fund and its shareholders receive and the other factors considered.
Costs of the Services and Profitability. The Board considered the revenues earned and the expenses incurred by Fidelity in conducting the business of developing, marketing, distributing, managing, administering and servicing the fund and servicing the fund's shareholders. The Board also considered the level of Fidelity's profits in respect of all the Fidelity funds.
On an annual basis, Fidelity presents to the Board information about the profitability of its relationships with the fund. Fidelity calculates profitability information for each fund, as well as aggregate profitability information for groups of Fidelity funds and all Fidelity funds, using a series of detailed revenue and cost allocation methodologies which originate with the books and records of Fidelity on which Fidelity's audited financial statements are based. The Audit Committee of the Board reviews any significant changes from the prior year's methodologies and the full Board approves such changes.
A public accounting firm has been engaged annually by the Board as part of the Board's assessment of Fidelity's profitability analysis. The engagement includes the review and assessment of the methodologies used by Fidelity in determining the revenues and expenses attributable to Fidelity's fund business, and completion of agreed-upon procedures in respect of the mathematical accuracy of certain fund profitability information and its conformity to established allocation methodologies. After considering the reports issued under the engagement and information provided by Fidelity, the Board concluded that while other allocation methods may also be reasonable, Fidelity's profitability methodologies are reasonable in all material respects.
The Board also reviewed Fidelity's non-fund businesses and potential indirect benefits such businesses may have received as a result of their association with Fidelity's fund business (i.e., fall-out benefits) as well as cases where Fidelity's affiliates may benefit from the funds' business. The Board considered areas where potential indirect benefits to the Fidelity funds from their relationships with Fidelity may exist. The Board's consideration of these matters was informed by the findings of a joint ad hoc committee created by it and the boards of other Fidelity funds to evaluate potential fall-out benefits.
The Board considered the costs of the services provided by and the profits realized by Fidelity in connection with the operation of the fund and was satisfied that the profitability was not excessive.
Economies of Scale. The Board considered whether there have been economies of scale in respect of the management of the Fidelity funds, whether the Fidelity funds (including the fund) have appropriately benefited from any such economies of scale, and whether there is potential for realization of any further economies of scale. The Board considered the extent to which the fund will benefit from economies of scale as assets grow through increased services to the fund, through waivers or reimbursements, or through fee or expense ratio reductions. The Board recognized that, due to the fund's current contractual arrangements, its expense ratio will not decline if the fund's operating costs decrease as assets grow, or rise as assets decrease. The Board also noted that a committee (the Economies of Scale Committee) created by it and the boards of other Fidelity funds periodically analyzes whether Fidelity attains economies of scale in respect of the management and servicing of the Fidelity funds, whether the Fidelity funds have appropriately benefited from such economies of scale, and whether there is potential for realization of any further economies of scale.
The Board concluded, taking into account the analysis of the Economies of Scale Committee, that economies of scale, if any, are being appropriately shared between fund shareholders and Fidelity.
Additional Information Requested by the Board. In order to develop fully the factual basis for consideration of the Fidelity funds' advisory contracts, the Board requested and received additional information on certain topics, including: (i) fund flow and performance trends, in particular the underperformance of certain funds and strategies, and Fidelity's long-term strategies for certain funds, including any consideration of fund liquidations or mergers; (ii) the operation of performance fees and competitor use of performance fees; (iii) Fidelity's pricing philosophy compared to competitors; (iv) fund profitability methodology and data; (v) evaluation of competitive fund data and peer group classifications and fee and expense comparisons; (vi) the management fee and expense structures for different funds and classes and information about the differences between various fee and expense structures; (vii) group fee breakpoints and related voluntary fee waivers; and (viii) information regarding other accounts managed by Fidelity and the funds' sub-advisory arrangements.
Conclusion. Based on its evaluation of all of the conclusions noted above, and after considering all factors it believed relevant, the Board, including the Independent Trustees, concluded that the advisory and sub-advisory fee arrangements are fair and reasonable in light of all of the surrounding circumstances and that the fund's Advisory Contracts should be renewed through July 31, 2024.
1.9893917.104
IGI-K6-ANN-1223
Fidelity® SAI International SMA Completion Fund
Annual Report
October 31, 2023
Offered exclusively to certain clients of the Adviser, or its affiliates, including Strategic Advisers LLC (Strategic Advisers) - not available for sale to the general public. Fidelity® SAI is a product name of Fidelity® funds dedicated to certain programs affiliated with Strategic Advisers.
Contents
To view a fund's proxy voting guidelines and proxy voting record for the 12-month period ended June 30, visit http://www.fidelity.com/proxyvotingresults or visit the Securities and Exchange Commission's (SEC) web site at http://www.sec.gov.
You may also call 1-800-544-3455 to request a free copy of the proxy voting guidelines.
Standard & Poor's, S&P and S&P 500 are registered service marks of The McGraw-Hill Companies, Inc. and have been licensed for use by Fidelity Distributors Corporation.
Other third-party marks appearing herein are the property of their respective owners.
All other marks appearing herein are registered or unregistered trademarks or service marks of FMR LLC or an affiliated company. © 2023 FMR LLC. All rights reserved.
This report and the financial statements contained herein are submitted for the general information of the shareholders of the Fund. This report is not authorized for distribution to prospective investors in the Fund unless preceded or accompanied by an effective prospectus.
A fund files its complete schedule of portfolio holdings with the SEC for the first and third quarters of each fiscal year on Form N-PORT. Forms N-PORT are available on the SEC's web site at http://www.sec.gov. A fund's Forms N-PORT may be reviewed and copied at the SEC's Public Reference Room in Washington, DC. Information regarding the operation of the SEC's Public Reference Room may be obtained by calling 1-800-SEC-0330.
For a complete list of a fund's portfolio holdings, view the most recent holdings listing, semiannual report, or annual report on Fidelity's web site at http://www.fidelity.com, http://www.institutional.fidelity.com, or http://www.401k.com, as applicable.
NOT FDIC INSURED •MAY LOSE VALUE •NO BANK GUARANTEE
Neither the Fund nor Fidelity Distributors Corporation is a bank.
Average annual total return reflects the change in the value of an investment, assuming reinvestment of distributions from dividend income and capital gains (the profits earned upon the sale of securities that have grown in value, if any) and assuming a constant rate of performance each year. The hypothetical investment and the average annual total returns do not reflect the deduction of taxes that a shareholder would pay on fund distributions or the redemption of fund shares. During periods of reimbursement by Fidelity, a fund's total return will be greater than it would be had the reimbursement not occurred. How a fund did yesterday is no guarantee of how it will do tomorrow.
| Average Annual Total Returns |
| | | | |
Periods ended October 31, 2023 | Past 1 year | Life of Fund A |
| Fidelity® SAI International SMA Completion Fund | 6.61% | 2.10% |
A From April 11, 2019
| $10,000 Over Life of Fund |
| |
Let's say hypothetically that $10,000 was invested in Fidelity® SAI International SMA Completion Fund, on April 11, 2019, when the fund started. The chart shows how the value of your investment would have changed, and also shows how the MSCI EAFE Index performed over the same period. |
|
|
Market Recap:
International (non-U.S.) equities gained 12.27% for the 12 months ending October 31, 2023, according to the MSCI ACWI (All Country World Index) ex USA Index, as global economic expansion and a slowing in the pace of inflation in some markets provided a favorable backdrop for risk assets. After returning -15.86% in 2022, the index's upturn has been largely driven by a narrow set of companies in the information technology and communication services sectors, in part due to excitement for generative artificial intelligence applications. The index gained 14.07% year to date through July, including strong gains in both June (+4.50%) and July (+4.07%). The rally for international equities sputtered for the next three months (-11.33%) amid a stalling pattern in disinflationary trends, heightened global recession and geopolitical risks, soaring yields on longer-term U.S. government bonds and particularly weak economic conditions in the eurozone and China. The three-month decline left non-U.S. stocks up 1.15% year to date through October. Currency fluctuation also helped bolster non-U.S. equity performance overall. For the full 12 months, nearly all regions advanced, with Europe ex U.K. (+18%) and Japan (+17%) leading, whereas Canada (-0.38%) lagged by the widest margin. Each of the 11 sectors advanced, with information technology (+21%) and consumer discretionary (+19%) leading the way. Energy and industrials each rose about 14%. Conversely, four defensive-oriented sectors lagged by the widest margin: real estate (+4%), health care (+6%), consumer staples (+7%) and utilities (+8%).
Comments from Co-Portfolio Managers Bill Bower and Tim Gannon:
For the fiscal year ending October 31, 2023, the fund gained 6.61%, versus 14.65% for the benchmark MSCI EAFE Index (Net MA). From a regional standpoint, picks in Europe ex U.K., primarily in France, and Japan detracted from the fund's relative result. By sector, security selection was the primary detractor, especially within industrials, where our stock selection in commercial & professional services hurt most. Stock picking in financials, primarily within the banks industry, also hurt. Also hurting our result were stock selection in health care and energy. The biggest individual relative detractor was our stake in Teleperformance (-38%). Teleperformance was not held at period end. The second-largest relative detractor was an overweight in Tis (-21%). An overweight in Sartorius Stedim Biotech (-40%) also hurt, and we trimmed the fund's stake. In contrast, from a regional standpoint, picks and an underweight in the U.K. and an underweight in Europe ex U.K., primarily in Switzerland, contributed to the fund's performance versus the benchmark. By sector, the biggest contributor to performance versus the benchmark was an underweight in health care, primarily within the pharmaceuticals, biotechnology & life sciences industry. Security selection in consumer discretionary, primarily within the consumer discretionary distribution & retail industry, also boosted relative performance. Also lifting the fund's relative result was an underweight in consumer staples, primarily within the food, beverage & tobacco industry. The top individual relative contributor was our non-benchmark stake in B&M European Value Retail (+85%). B&M was among the fund's largest holdings. A second notable relative contributor was an overweight in Itochu (+41%). Itochu was the fund's top holding as of period end. A non-benchmark stake in Constellation Software gained approximately 41% and notably helped. Constellation Software was among our biggest holdings. Notable changes in positioning include decreased exposure to the communication services sector and a higher allocation to financials.
The views expressed above reflect those of the portfolio manager(s) only through the end of the period as stated on the cover of this report and do not necessarily represent the views of Fidelity or any other person in the Fidelity organization. Any such views are subject to change at any time based upon market or other conditions and Fidelity disclaims any responsibility to update such views. These views may not be relied on as investment advice and, because investment decisions for a Fidelity fund are based on numerous factors, may not be relied on as an indication of trading intent on behalf of any Fidelity fund.
Top Holdings (% of Fund's net assets) |
| |
| Itochu Corp. (Japan, Trading Companies & Distributors) | 5.2 | |
| Keyence Corp. (Japan, Electronic Equipment, Instruments & Components) | 4.9 | |
| Constellation Software, Inc. (Canada, Software) | 4.1 | |
| Investor AB (B Shares) (Sweden, Financial Services) | 4.0 | |
| Hannover Reuck SE (Germany, Insurance) | 3.9 | |
| Minebea Mitsumi, Inc. (Japan, Machinery) | 3.8 | |
| Sika AG (Switzerland, Chemicals) | 3.6 | |
| B&M European Value Retail SA (United Kingdom, Broadline Retail) | 3.4 | |
| Reliance Industries Ltd. (India, Oil, Gas & Consumable Fuels) | 3.1 | |
| Tourmaline Oil Corp. (Canada, Oil, Gas & Consumable Fuels) | 3.0 | |
| | 39.0 | |
| |
| Market Sectors (% of Fund's net assets) |
| |
| Financials | 26.4 | |
| Information Technology | 20.3 | |
| Industrials | 17.5 | |
| Consumer Discretionary | 8.9 | |
| Energy | 6.1 | |
| Materials | 4.2 | |
| Health Care | 2.3 | |
| Real Estate | 0.9 | |
| |
Asset Allocation (% of Fund's net assets) |
|
|
Geographic Diversification (% of Fund's net assets) |
|
* Includes Short-Term investments and Net Other Assets (Liabilities). Percentages are adjusted for the effect of derivatives, if applicable. |
| |
Showing Percentage of Net Assets
| Common Stocks - 86.6% |
| | | Shares | Value ($) |
| Australia - 1.7% | | | |
| Aristocrat Leisure Ltd. | | 359,137 | 8,827,626 |
| Canada - 7.1% | | | |
| Constellation Software, Inc. | | 10,836 | 21,722,869 |
| Constellation Software, Inc. warrants 8/22/28 (a)(b) | | 10,836 | 1 |
| Tourmaline Oil Corp. | | 302,879 | 16,015,949 |
TOTAL CANADA | | | 37,738,819 |
| China - 0.2% | | | |
| Chervon Holdings Ltd. | | 526,600 | 1,297,042 |
| France - 3.4% | | | |
| Capgemini SA | | 51,685 | 9,134,228 |
| Edenred SA | | 83,406 | 4,433,775 |
| Sartorius Stedim Biotech | | 22,279 | 4,161,886 |
TOTAL FRANCE | | | 17,729,889 |
| Germany - 3.9% | | | |
| Hannover Reuck SE | | 93,982 | 20,713,842 |
| India - 7.7% | | | |
| Axis Bank Ltd. | | 594,078 | 7,007,926 |
| HDFC Bank Ltd. | | 897,778 | 15,925,922 |
| Jio Financial Services Ltd. | | 584,671 | 1,551,272 |
| Reliance Industries Ltd. | | 584,671 | 16,072,382 |
TOTAL INDIA | | | 40,557,502 |
| Indonesia - 3.9% | | | |
| PT Bank Central Asia Tbk | | 18,643,987 | 10,271,358 |
| PT Bank Rakyat Indonesia (Persero) Tbk | | 32,421,538 | 10,137,693 |
TOTAL INDONESIA | | | 20,409,051 |
| Ireland - 2.1% | | | |
| Kingspan Group PLC (Ireland) | | 166,007 | 11,150,389 |
| Italy - 1.0% | | | |
| FinecoBank SpA | | 438,676 | 5,159,173 |
| Japan - 21.7% | | | |
| Bandai Namco Holdings, Inc. | | 370,400 | 7,674,139 |
| BayCurrent Consulting, Inc. | | 143,000 | 3,590,266 |
| Itochu Corp. | | 763,666 | 27,508,035 |
| Keyence Corp. | | 66,324 | 25,675,262 |
| Minebea Mitsumi, Inc. | | 1,267,536 | 19,874,081 |
| Misumi Group, Inc. | | 117,474 | 1,778,399 |
| Nomura Research Institute Ltd. | | 249,371 | 6,545,978 |
| Relo Group, Inc. | | 152,001 | 1,506,951 |
| Resona Holdings, Inc. | | 1,075,300 | 5,745,675 |
| TechnoPro Holdings, Inc. | | 190,800 | 3,779,910 |
| TIS, Inc. | | 513,891 | 11,004,900 |
TOTAL JAPAN | | | 114,683,596 |
| Korea (South) - 2.0% | | | |
| Samsung Electronics Co. Ltd. | | 207,004 | 10,288,325 |
| Luxembourg - 1.5% | | | |
| Eurofins Scientific SA | | 158,493 | 8,021,160 |
| Netherlands - 4.2% | | | |
| BE Semiconductor Industries NV | | 115,700 | 11,911,677 |
| IMCD NV | | 86,510 | 10,389,362 |
TOTAL NETHERLANDS | | | 22,301,039 |
| Spain - 2.7% | | | |
| CaixaBank SA | | 3,543,505 | 14,406,265 |
| Sweden - 6.7% | | | |
| Indutrade AB | | 815,006 | 14,394,549 |
| Investor AB (B Shares) | | 1,144,704 | 20,961,124 |
TOTAL SWEDEN | | | 35,355,673 |
| Switzerland - 5.1% | | | |
| Partners Group Holding AG | | 7,370 | 7,752,010 |
| Sika AG | | 80,704 | 19,243,333 |
TOTAL SWITZERLAND | | | 26,995,343 |
| United Kingdom - 11.1% | | | |
| B&M European Value Retail SA | | 2,796,687 | 17,975,145 |
| Beazley PLC | | 1,069,096 | 6,685,581 |
| Big Yellow Group PLC | | 290,900 | 3,376,636 |
| Games Workshop Group PLC | | 32,300 | 3,876,830 |
| JD Sports Fashion PLC | | 4,935,057 | 7,647,852 |
| London Stock Exchange Group PLC | | 4,800 | 484,296 |
| Sage Group PLC | | 944,300 | 11,140,056 |
| Standard Chartered PLC (United Kingdom) | | 997,700 | 7,639,723 |
TOTAL UNITED KINGDOM | | | 58,826,119 |
| Zambia - 0.6% | | | |
| First Quantum Minerals Ltd. | | 294,268 | 3,410,050 |
| TOTAL COMMON STOCKS (Cost $471,876,439) | | | 457,870,903 |
| | | | |
| Money Market Funds - 12.9% |
| | | Shares | Value ($) |
Fidelity Cash Central Fund 5.40% (c) (Cost $68,161,995) | | 68,148,365 | 68,161,995 |
| | | | |
| TOTAL INVESTMENT IN SECURITIES - 99.5% (Cost $540,038,434) | 526,032,898 |
NET OTHER ASSETS (LIABILITIES) - 0.5% | 2,427,427 |
| NET ASSETS - 100.0% | 528,460,325 |
| | |
Legend
| (c) | Affiliated fund that is generally available only to investment companies and other accounts managed by Fidelity Investments. The rate quoted is the annualized seven-day yield of the fund at period end. A complete unaudited listing of the fund's holdings as of its most recent quarter end is available upon request. In addition, each Fidelity Central Fund's financial statements, which are not covered by the Fund's Report of Independent Registered Public Accounting Firm, are available on the SEC's website or upon request. |
Affiliated Central Funds
Fiscal year to date information regarding the Fund's investments in Fidelity Central Funds, including the ownership percentage, is presented below.
| Affiliate | Value, beginning of period ($) | Purchases ($) | Sales Proceeds ($) | Dividend Income ($) | Realized Gain (loss) ($) | Change in Unrealized appreciation (depreciation) ($) | Value, end of period ($) | % ownership, end of period |
| Fidelity Cash Central Fund 5.40% | 43,600,978 | 159,593,550 | 135,032,533 | 2,439,453 | - | - | 68,161,995 | 0.1% |
| Total | 43,600,978 | 159,593,550 | 135,032,533 | 2,439,453 | - | - | 68,161,995 | |
| | | | | | | | | |
Amounts in the dividend income column in the above table include any capital gain distributions from underlying funds, which are presented in the corresponding line item in the Statement of Operations, if applicable.
Amounts included in the purchases and sales proceeds columns may include in-kind transactions, if applicable.
Investment Valuation
The following is a summary of the inputs used, as of October 31, 2023, involving the Fund's assets and liabilities carried at fair value. The inputs or methodology used for valuing securities may not be an indication of the risk associated with investing in those securities. For more information on valuation inputs, and their aggregation into the levels used below, please refer to the Investment Valuation section in the accompanying Notes to Financial Statements.
| Valuation Inputs at Reporting Date: |
| Description | Total ($) | Level 1 ($) | Level 2 ($) | Level 3 ($) |
Investments in Securities: | | | | |
|
| Equities: | | | | |
Consumer Discretionary | 47,298,634 | 29,499,827 | 17,798,807 | - |
Energy | 32,088,331 | 16,015,949 | 16,072,382 | - |
Financials | 138,875,635 | 73,345,228 | 65,530,407 | - |
Health Care | 12,183,046 | 12,183,046 | - | - |
Industrials | 92,464,991 | 35,934,300 | 56,530,691 | - |
Information Technology | 107,423,296 | 44,774,602 | 62,648,693 | 1 |
Materials | 22,653,383 | 22,653,383 | - | - |
Real Estate | 4,883,587 | 3,376,636 | 1,506,951 | - |
|
| Money Market Funds | 68,161,995 | 68,161,995 | - | - |
| Total Investments in Securities: | 526,032,898 | 305,944,966 | 220,087,931 | 1 |
| Statement of Assets and Liabilities |
| | | | October 31, 2023 |
| | | | | |
| Assets | | | | |
| Investment in securities, at value - See accompanying schedule: | | | | |
Unaffiliated issuers (cost $471,876,439) | $ | 457,870,903 | | |
Fidelity Central Funds (cost $68,161,995) | | 68,161,995 | | |
| | | | | |
| | | | | |
| Total Investment in Securities (cost $540,038,434) | | | $ | 526,032,898 |
| Foreign currency held at value (cost $1,321) | | | | 1,325 |
| Receivable for fund shares sold | | | | 1,186,354 |
| Dividends receivable | | | | 1,027,463 |
| Reclaims receivable | | | | 516,476 |
| Distributions receivable from Fidelity Central Funds | | | | 282,740 |
| Other receivables | | | | 36,424 |
Total assets | | | | 529,083,680 |
| Liabilities | | | | |
| Payable for fund shares redeemed | $ | 502,097 | | |
| Deferred taxes | | 121,186 | | |
| Other payables and accrued expenses | | 72 | | |
| Total Liabilities | | | | 623,355 |
| Net Assets | | | $ | 528,460,325 |
| Net Assets consist of: | | | | |
| Paid in capital | | | $ | 609,805,556 |
| Total accumulated earnings (loss) | | | | (81,345,231) |
| Net Assets | | | $ | 528,460,325 |
Net Asset Value, offering price and redemption price per share ($528,460,325 ÷ 52,272,670 shares) | | | $ | 10.11 |
| Statement of Operations |
| | | | Year ended October 31, 2023 |
| Investment Income | | | | |
| Dividends | | | $ | 11,134,131 |
| Income from Fidelity Central Funds | | | | 2,439,453 |
| Income before foreign taxes withheld | | | $ | 13,573,584 |
| Less foreign taxes withheld | | | | (1,512,446) |
| Total Income | | | | 12,061,138 |
| Expenses | | | | |
| Independent trustees' fees and expenses | $ | 2,831 | | |
| Total expenses before reductions | | 2,831 | | |
| Expense reductions | | (115) | | |
| Total expenses after reductions | | | | 2,716 |
| Net Investment income (loss) | | | | 12,058,422 |
| Realized and Unrealized Gain (Loss) | | | | |
| Net realized gain (loss) on: | | | | |
| Investment Securities: | | | | |
| Unaffiliated issuers | | (33,737,748) | | |
| Foreign currency transactions | | (102,101) | | |
| Total net realized gain (loss) | | | | (33,839,849) |
| Change in net unrealized appreciation (depreciation) on: | | | | |
| Investment Securities: | | | | |
| Unaffiliated issuers(net of decrease in deferred foreign taxes of $75,078) | | 45,981,885 | | |
| Assets and liabilities in foreign currencies | | 58,570 | | |
| Total change in net unrealized appreciation (depreciation) | | | | 46,040,455 |
| Net gain (loss) | | | | 12,200,606 |
| Net increase (decrease) in net assets resulting from operations | | | $ | 24,259,028 |
| Statement of Changes in Net Assets |
| |
| | Year ended October 31, 2023 | | Year ended October 31, 2022 |
| Increase (Decrease) in Net Assets | | | | |
| Operations | | | | |
| Net investment income (loss) | $ | 12,058,422 | $ | 7,825,590 |
| Net realized gain (loss) | | (33,839,849) | | (43,209,211) |
| Change in net unrealized appreciation (depreciation) | | 46,040,455 | | (176,966,374) |
| Net increase (decrease) in net assets resulting from operations | | 24,259,028 | | (212,349,995) |
| Distributions to shareholders | | (6,168,818) | | (34,086,499) |
| | | | | |
| Share transactions | | | | |
| Proceeds from sales of shares | | 179,578,134 | | 318,466,891 |
| Reinvestment of distributions | | 1,847,861 | | 10,192,289 |
| Cost of shares redeemed | | (109,762,922) | | (227,226,081) |
| | | | | |
Net increase (decrease) in net assets resulting from share transactions | | 71,663,073 | | 101,433,099 |
| Total increase (decrease) in net assets | | 89,753,283 | | (145,003,395) |
| | | | | |
| Net Assets | | | | |
| Beginning of period | | 438,707,042 | | 583,710,437 |
| End of period | $ | 528,460,325 | $ | 438,707,042 |
| | | | | |
| Other Information | | | | |
| Shares | | | | |
| Sold | | 16,763,788 | | 28,001,783 |
| Issued in reinvestment of distributions | | 177,850 | | 704,861 |
| Redeemed | | (10,338,376) | | (20,788,845) |
| Net increase (decrease) | | 6,603,262 | | 7,917,799 |
| | | | | |
Financial Highlights
| Fidelity® SAI International SMA Completion Fund |
| |
| Years ended October 31, | | 2023 | | 2022 | | 2021 | | 2020 | | 2019 A |
Selected Per-Share Data | | | | | | | | | | |
| Net asset value, beginning of period | $ | 9.61 | $ | 15.46 | $ | 12.38 | $ | 10.47 | $ | 10.00 |
| Income from Investment Operations | | | | | | | | | | |
Net investment income (loss) B,C | | .25 | | .18 | | .19 | | .17 D | | .08 |
| Net realized and unrealized gain (loss) | | .39 | | (5.16) | | 3.01 | | 1.77 | | .39 |
| Total from investment operations | | .64 | | (4.98) | | 3.20 | | 1.94 | | .47 |
| Distributions from net investment income | | (.14) | | (.16) | | (.12) | | (.03) | | - |
| Distributions from net realized gain | | - | | (.71) | | - | | - | | - |
| Total distributions | | (.14) | | (.87) | | (.12) | | (.03) | | - |
| Net asset value, end of period | $ | 10.11 | $ | 9.61 | $ | 15.46 | $ | 12.38 | $ | 10.47 |
Total Return E,F | | 6.61% | | (34.09)% | | 26.03% | | 18.57% | | 4.70% |
Ratios to Average Net Assets C,G,H | | | | | | | | | | |
Expenses before reductions I | | -% | | -% | | -% | | -% | | -% J |
Expenses net of fee waivers, if any I | | -% | | -% | | -% | | -% | | -% J |
Expenses net of all reductions I | | -% | | -% | | -% | | -% | | -% J |
| Net investment income (loss) | | 2.36% | | 1.56% | | 1.30% | | 1.45% D | | 1.41% J |
| Supplemental Data | | | | | | | | | | |
| Net assets, end of period (000 omitted) | $ | 528,460 | $ | 438,707 | $ | 583,710 | $ | 318,362 | $ | 46,836 |
Portfolio turnover rate K | | 31% | | 40% | | 37% | | 17% | | 24% J |
AFor the period April 11, 2019 (commencement of operations) through October 31, 2019.
BCalculated based on average shares outstanding during the period.
CNet investment income (loss) is affected by the timing of the declaration of dividends by any underlying mutual funds or exchange-traded funds (ETFs). Net investment income (loss) of any mutual funds or ETFs is not included in the Fund's net investment income (loss) ratio.
DNet investment income per share reflects one or more large, non-recurring dividend(s) which amounted to $.02 per share. Excluding such non-recurring dividend(s), the ratio of net investment income (loss) to average net assets would have been 1.28%.
ETotal returns for periods of less than one year are not annualized.
FTotal returns would have been lower if certain expenses had not been reduced during the applicable periods shown.
GFees and expenses of any underlying mutual funds or exchange-traded funds (ETFs) are not included in the Fund's expense ratio. The Fund indirectly bears its proportionate share of these expenses. For additional expense information related to investments in Fidelity Central Funds, please refer to the "Investments in Fidelity Central Funds" note found in the Notes to Financial Statements section of the most recent Annual or Semi-Annual report.
HExpense ratios reflect operating expenses of the class. Expenses before reductions do not reflect amounts reimbursed, waived, or reduced through arrangements with the investment adviser, brokerage services, or other offset arrangements, if applicable, and do not represent the amount paid by the class during periods when reimbursements, waivers or reductions occur.
IAmount represents less than .005%.
JAnnualized.
KAmount does not include the portfolio activity of any underlying mutual funds or exchange-traded funds (ETFs).
For the period ended October 31, 2023
1. Organization.
Fidelity SAI International SMA Completion Fund (the Fund) is a non-diversified fund of Fidelity Investment Trust (the Trust) and is authorized to issue an unlimited number of shares. Shares are offered exclusively to certain clients of Fidelity Management & Research Company LLC (FMR) or its affiliates. The Trust is registered under the Investment Company Act of 1940, as amended (the 1940 Act), as an open-end management investment company organized as a Massachusetts business trust. The Fund's investments in emerging markets can be subject to social, economic, regulatory, and political uncertainties and can be extremely volatile.
2. Investments in Fidelity Central Funds.
Funds may invest in Fidelity Central Funds, which are open-end investment companies generally available only to other investment companies and accounts managed by the investment adviser and its affiliates. The Schedule of Investments lists any Fidelity Central Funds held as an investment as of period end, but does not include the underlying holdings of each Fidelity Central Fund. An investing fund indirectly bears its proportionate share of the expenses of the underlying Fidelity Central Funds.
Based on its investment objective, each Fidelity Central Fund may invest or participate in various investment vehicles or strategies that are similar to those of the investing fund. These strategies are consistent with the investment objectives of the investing fund and may involve certain economic risks which may cause a decline in value of each of the Fidelity Central Funds and thus a decline in the value of the investing fund.
| Fidelity Central Fund | Investment Manager | Investment Objective | Investment Practices | Expense RatioA |
| Fidelity Money Market Central Funds | Fidelity Management & Research Company LLC (FMR) | Each fund seeks to obtain a high level of current income consistent with the preservation of capital and liquidity. | Short-term Investments | Less than .005% |
A Expenses expressed as a percentage of average net assets and are as of each underlying Central Fund's most recent annual or semi-annual shareholder report.
A complete unaudited list of holdings for each Fidelity Central Fund is available upon request or at the Securities and Exchange Commission website at www.sec.gov. In addition, the financial statements of the Fidelity Central Funds which contain the significant accounting policies (including investment valuation policies) of those funds, and are not covered by the Report of Independent Registered Public Accounting Firm, are available on the Securities and Exchange Commission website or upon request.
3. Significant Accounting Policies.
The Fund is an investment company and applies the accounting and reporting guidance of the Financial Accounting Standards Board (FASB) Accounting Standards Codification Topic 946 Financial Services - Investment Companies. The financial statements have been prepared in conformity with accounting principles generally accepted in the United States of America (GAAP), which require management to make certain estimates and assumptions at the date of the financial statements. Actual results could differ from those estimates. Subsequent events, if any, through the date that the financial statements were issued have been evaluated in the preparation of the financial statements. The Fund's Schedule of Investments lists any underlying mutual funds or exchange-traded funds (ETFs) but does not include the underlying holdings of these funds. The following summarizes the significant accounting policies of the Fund:
Investment Valuation. Investments are valued as of 4:00 p.m. Eastern time on the last calendar day of the period. The Board of Trustees (the Board) has designated the Fund's investment adviser as the valuation designee responsible for the fair valuation function and performing fair value determinations as needed. The investment adviser has established a Fair Value Committee (the Committee) to carry out the day-to-day fair valuation responsibilities and has adopted policies and procedures to govern the fair valuation process and the activities of the Committee. In accordance with these fair valuation policies and procedures, which have been approved by the Board, the Fund attempts to obtain prices from one or more third party pricing services or brokers to value its investments. When current market prices, quotations or currency exchange rates are not readily available or reliable, investments will be fair valued in good faith by the Committee, in accordance with the policies and procedures. Factors used in determining fair value vary by investment type and may include market or investment specific events, transaction data, estimated cash flows, and market observations of comparable investments. The frequency that the fair valuation procedures are used cannot be predicted and they may be utilized to a significant extent. The Committee manages the Fund's fair valuation practices and maintains the fair valuation policies and procedures. The Fund's investment adviser reports to the Board information regarding the fair valuation process and related material matters.
The Fund categorizes the inputs to valuation techniques used to value its investments into a disclosure hierarchy consisting of three levels as shown below:
Level 1 - unadjusted quoted prices in active markets for identical investments
Level 2 - other significant observable inputs (including quoted prices for similar investments, interest rates, prepayment speeds, etc.)
Level 3 - unobservable inputs (including the Fund's own assumptions based on the best information available)
Valuation techniques used to value the Fund's investments by major category are as follows:
Equity securities, including restricted securities, for which market quotations are readily available, are valued at the last reported sale price or official closing price as reported by a third party pricing service on the primary market or exchange on which they are traded and are categorized as Level 1 in the hierarchy. In the event there were no sales during the day or closing prices are not available, securities are valued at the last quoted bid price or may be valued using the last available price and are generally categorized as Level 2 in the hierarchy. For foreign equity securities, when market or security specific events arise, comparisons to the valuation of American Depositary Receipts (ADRs), futures contracts, Exchange-Traded Funds (ETFs) and certain indexes as well as quoted prices for similar securities may be used and would be categorized as Level 2 in the hierarchy. For equity securities, including restricted securities, where observable inputs are limited, assumptions about market activity and risk are used and these securities may be categorized as Level 3 in the hierarchy.
Investments in open-end mutual funds, including the Fidelity Central Funds, are valued at their closing net asset value (NAV) each business day and are categorized as Level 1 in the hierarchy.
Changes in valuation techniques may result in transfers in or out of an assigned level within the disclosure hierarchy. The aggregate value of investments by input level as of October 31, 2023 is included at the end of the Fund's Schedule of Investments.
Foreign Currency. Certain Funds may use foreign currency contracts to facilitate transactions in foreign-denominated securities. Gains and losses from these transactions may arise from changes in the value of the foreign currency or if the counterparties do not perform under the contracts' terms.
Foreign-denominated assets, including investment securities, and liabilities are translated into U.S. dollars at the exchange rates at period end. Purchases and sales of investment securities, income and dividends received, and expenses denominated in foreign currencies are translated into U.S. dollars at the exchange rate in effect on the transaction date.
The effects of exchange rate fluctuations on investments are included with the net realized and unrealized gain (loss) on investment securities. Other foreign currency transactions resulting in realized and unrealized gain (loss) are disclosed separately.
Investment Transactions and Income. For financial reporting purposes, the Fund's investment holdings and NAV include trades executed through the end of the last business day of the period. The NAV per share for processing shareholder transactions is calculated as of the close of business of the New York Stock Exchange (NYSE), normally 4:00 p.m. Eastern time and includes trades executed through the end of the prior business day. Gains and losses on securities sold are determined on the basis of identified cost. Commissions paid to certain brokers with whom the investment adviser, or its affiliates, places trades on behalf of a fund include an amount in addition to trade execution, which may be rebated back to a fund. Any such rebates are included in net realized gain (loss) on investments in the Statement of Operations. Dividend income is recorded on the ex-dividend date, except for certain dividends from foreign securities where the ex-dividend date may have passed, which are recorded as soon as the Fund is informed of the ex-dividend date. Non-cash dividends included in dividend income, if any, are recorded at the fair market value of the securities received. Income and capital gain distributions from Fidelity Central Funds, if any, are recorded on the ex-dividend date. Investment income is recorded net of foreign taxes withheld where recovery of such taxes is uncertain. Funds may file withholding tax reclaims in certain jurisdictions to recover a portion of amounts previously withheld. Any withholding tax reclaims income is included in the Statement of Operations in foreign taxes withheld. Any receivables for withholding tax reclaims are included in the Statement of Assets and Liabilities in reclaims receivable.
Expenses. Expenses directly attributable to a fund are charged to that fund. Expenses attributable to more than one fund are allocated among the respective funds on the basis of relative net assets or other appropriate methods. Expenses included in the accompanying financial statements reflect the expenses of that fund and do not include any expenses associated with any underlying mutual funds or exchange-traded funds. Although not included in a fund's expenses, a fund indirectly bears its proportionate share of these expenses through the net asset value of each underlying mutual fund or exchange-traded fund. Expense estimates are accrued in the period to which they relate and adjustments are made when actual amounts are known.
Income Tax Information and Distributions to Shareholders. Each year, the Fund intends to qualify as a regulated investment company under Subchapter M of the Internal Revenue Code, including distributing substantially all of its taxable income and realized gains. As a result, no provision for U.S. Federal income taxes is required. As of October 31, 2023, the Fund did not have any unrecognized tax benefits in the financial statements; nor is the Fund aware of any tax positions for which it is reasonably possible that the total amounts of unrecognized tax benefits will significantly change in the next twelve months. The Fund files a U.S. federal tax return, in addition to state and local tax returns as required. The Fund's federal income tax returns are subject to examination by the Internal Revenue Service (IRS) for a period of three fiscal years after they are filed. State and local tax returns may be subject to examination for an additional fiscal year depending on the jurisdiction. Foreign taxes are provided for based on the Fund's understanding of the tax rules and rates that exist in the foreign markets in which it invests. The Fund is subject to a tax imposed on capital gains by certain countries in which it invests. An estimated deferred tax liability for net unrealized appreciation on the applicable securities is included in Deferred taxes on the Statement of Assets & Liabilities.
Distributions are declared and recorded on the ex-dividend date. Income and capital gain distributions are determined in accordance with income tax regulations, which may differ from GAAP. In addition, the Fund claimed a portion of the payment made to redeeming shareholders as a distribution for income tax purposes.
Capital accounts within the financial statements are adjusted for permanent book-tax differences. These adjustments have no impact on net assets or the results of operations. Capital accounts are not adjusted for temporary book-tax differences which will reverse in a subsequent period.
Book-tax differences are primarily due to foreign currency transactions, certain foreign taxes, passive foreign investment companies (PFIC), capital loss carryforwards and losses deferred due to wash sales.
As of period end, the cost and unrealized appreciation (depreciation) in securities, and derivatives if applicable, for federal income tax purposes were as follows:
| Gross unrealized appreciation | $49,589,335 |
| Gross unrealized depreciation | (66,804,680) |
| Net unrealized appreciation (depreciation) | $(17,215,345) |
| Tax Cost | $543,248,243 |
The tax-based components of distributable earnings as of period end were as follows:
| Undistributed ordinary income | $10,025,696 |
| Capital loss carryforward | $(73,980,543) |
| Net unrealized appreciation (depreciation) on securities and other investments | $(17,269,199) |
Capital loss carryforwards are only available to offset future capital gains of the Fund to the extent provided by regulations and may be limited. The capital loss carryforward information presented below, including any applicable limitation, is estimated as of fiscal period end and is subject to adjustment.
Short-term | $(20,563,814) |
Long-term | (53,416,729) |
| Total capital loss carryforward | $(73,980,543) |
The tax character of distributions paid was as follows:
| | October 31, 2023 | October 31, 2022 |
| Ordinary Income | $6,168,818 | $16,945,636 |
| Long-term Capital Gains | - | 17,140,863 |
| Total | $6,168,818 | $34,086,499 |
4. Purchases and Sales of Investments.
Purchases and sales of securities, other than short-term securities and in-kind transactions, as applicable, are noted in the table below.
| | Purchases ($) | Sales ($) |
| Fidelity SAI International SMA Completion Fund | 178,944,419 | 141,032,504 |
5. Fees and Other Transactions with Affiliates.
Management Fee. Fidelity Management & Research Company LLC (the investment adviser) and its affiliates provide the Fund with investment management related services and the Fund does not pay any fees for these services. Under the management contract, the investment adviser or an affiliate pays all other expenses of the Fund, excluding fees and expenses of the independent Trustees, and certain miscellaneous expenses such as proxy and shareholder meeting expenses.
Interfund Trades. Funds may purchase from or sell securities to other Fidelity Funds under procedures adopted by the Board. The procedures have been designed to ensure these interfund trades are executed in accordance with Rule 17a-7 of the 1940 Act. Any interfund trades are included within the respective purchases and sales amounts shown in the Purchases and Sales of Investments note. Interfund trades during the period are noted in the table below.
| | Purchases ($) | Sales ($) | Realized Gain (Loss) ($) |
| Fidelity SAI International SMA Completion Fund | 14,803,589 | 7,814,173 | (1,677,073) |
6. Committed Line of Credit.
Certain Funds participate with other funds managed by the investment adviser or an affiliate in a $4.25 billion credit facility (the "line of credit") to be utilized for temporary or emergency purposes to fund shareholder redemptions or for other short-term liquidity purposes. The commitment fees on the pro-rata portion of the line of credit are borne by the investment adviser. During the period, there were no borrowings on this line of credit.
7. Expense Reductions.
Through arrangements with the Fund's custodian, credits realized as a result of certain uninvested cash balances were used to reduce the Fund's expenses by $115.
8. Other.
A fund's organizational documents provide former and current trustees and officers with a limited indemnification against liabilities arising in connection with the performance of their duties to the fund. In the normal course of business, a fund may also enter into contracts that provide general indemnifications. A fund's maximum exposure under these arrangements is unknown as this would be dependent on future claims that may be made against a fund. The risk of material loss from such claims is considered remote.
9. Risk and Uncertainties.
Many factors affect a fund's performance. Developments that disrupt global economies and financial markets, such as pandemics, epidemics, outbreaks of infectious diseases, war, terrorism, and environmental disasters, may significantly affect a fund's investment performance. The effects of these developments to a fund will be impacted by the types of securities in which a fund invests, the financial condition, industry, economic sector, and geographic location of an issuer, and a fund's level of investment in the securities of that issuer. Significant concentrations in security types, issuers, industries, sectors, and geographic locations may magnify the factors that affect a fund's performance.
To the Board of Trustees of Fidelity Investment Trust and the Shareholders of Fidelity SAI International SMA Completion Fund:
Opinion on the Financial Statements and Financial Highlights
We have audited the accompanying statement of assets and liabilities of Fidelity SAI International SMA Completion Fund (the "Fund"), a fund of Fidelity Investment Trust, including the schedule of investments, as of October 31, 2023, the related statement of operations for the year then ended, the statement of changes in net assets for each of the two years in the period then ended, the financial highlights for each of the four years in the period then ended and for the period from April 11, 2019 (commencement of operations) through October 31, 2019, and the related notes. In our opinion, the financial statements and financial highlights present fairly, in all material respects, the financial position of the Fund as of October 31, 2023, and the results of its operations for the year then ended, the changes in its net assets for each of the two years in the period then ended, and the financial highlights for each of the four years in the period then ended and for the period from April 11, 2019 (commencement of operations) through October 31, 2019, in conformity with accounting principles generally accepted in the United States of America.
Basis for Opinion
These financial statements and financial highlights are the responsibility of the Fund's management. Our responsibility is to express an opinion on the Fund's financial statements and financial highlights based on our audits. We are a public accounting firm registered with the Public Company Accounting Oversight Board (United States) (PCAOB) and are required to be independent with respect to the Fund in accordance with the U.S. federal securities laws and the applicable rules and regulations of the Securities and Exchange Commission and the PCAOB.
We conducted our audits in accordance with the standards of the PCAOB. Those standards require that we plan and perform the audit to obtain reasonable assurance about whether the financial statements and financial highlights are free of material misstatement, whether due to error or fraud. The Fund is not required to have, nor were we engaged to perform, an audit of its internal control over financial reporting. As part of our audits we are required to obtain an understanding of internal control over financial reporting but not for the purpose of expressing an opinion on the effectiveness of the Fund's internal control over financial reporting. Accordingly, we express no such opinion.
Our audits included performing procedures to assess the risks of material misstatement of the financial statements and financial highlights, whether due to error or fraud, and performing procedures that respond to those risks. Such procedures included examining, on a test basis, evidence regarding the amounts and disclosures in the financial statements and financial highlights. Our audits also included evaluating the accounting principles used and significant estimates made by management, as well as evaluating the overall presentation of the financial statements and financial highlights. Our procedures included confirmation of securities owned as of October 31, 2023, by correspondence with the custodian and brokers; when replies were not received from brokers, we performed other auditing procedures. We believe that our audits provide a reasonable basis for our opinion.
/s/ Deloitte & Touche LLP
Boston, Massachusetts
December 13, 2023
We have served as the auditor of one or more of the Fidelity investment companies since 1999.
The Trustees, Members of the Advisory Board (if any), and officers of the trust and fund, as applicable, are listed below. The Board of Trustees governs the fund and is responsible for protecting the interests of shareholders. The Trustees are experienced executives who meet periodically throughout the year to oversee the fund's activities, review contractual arrangements with companies that provide services to the fund, oversee management of the risks associated with such activities and contractual arrangements, and review the fund's performance. Except for Jonathan Chiel, each of the Trustees oversees 322 funds. Mr. Chiel oversees 191 funds.
The Trustees hold office without limit in time except that (a) any Trustee may resign; (b) any Trustee may be removed by written instrument, signed by at least two-thirds of the number of Trustees prior to such removal; (c) any Trustee who requests to be retired or who has become incapacitated by illness or injury may be retired by written instrument signed by a majority of the other Trustees; and (d) any Trustee may be removed at any special meeting of shareholders by a two-thirds vote of the outstanding voting securities of the trust. Each Trustee who is not an interested person (as defined in the 1940 Act) of the trust and the fund is referred to herein as an Independent Trustee. Each Independent Trustee shall retire not later than the last day of the calendar year in which his or her 75th birthday occurs. The Independent Trustees may waive this mandatory retirement age policy with respect to individual Trustees. Officers and Advisory Board Members hold office without limit in time, except that any officer or Advisory Board Member may resign or may be removed by a vote of a majority of the Trustees at any regular meeting or any special meeting of the Trustees. Except as indicated, each individual has held the office shown or other offices in the same company for the past five years.
The fund's Statement of Additional Information (SAI) includes more information about the Trustees. To request a free copy, call Fidelity at 1-800-544-3455.
Experience, Skills, Attributes, and Qualifications of the Trustees. The Governance and Nominating Committee has adopted a statement of policy that describes the experience, qualifications, attributes, and skills that are necessary and desirable for potential Independent Trustee candidates (Statement of Policy). The Board believes that each Trustee satisfied at the time he or she was initially elected or appointed a Trustee, and continues to satisfy, the standards contemplated by the Statement of Policy. The Governance and Nominating Committee also engages professional search firms to help identify potential Independent Trustee candidates who have the experience, qualifications, attributes, and skills consistent with the Statement of Policy. From time to time, additional criteria based on the composition and skills of the current Independent Trustees, as well as experience or skills that may be appropriate in light of future changes to board composition, business conditions, and regulatory or other developments, have also been considered by the professional search firms and the Governance and Nominating Committee. In addition, the Board takes into account the Trustees' commitment and participation in Board and committee meetings, as well as their leadership of standing and ad hoc committees throughout their tenure.
In determining that a particular Trustee was and continues to be qualified to serve as a Trustee, the Board has considered a variety of criteria, none of which, in isolation, was controlling. The Board believes that, collectively, the Trustees have balanced and diverse experience, qualifications, attributes, and skills, which allow the Board to operate effectively in governing the fund and protecting the interests of shareholders. Information about the specific experience, skills, attributes, and qualifications of each Trustee, which in each case led to the Board's conclusion that the Trustee should serve (or continue to serve) as a trustee of the fund, is provided below.
Board Structure and Oversight Function. Robert A. Lawrence is an interested person and currently serves as Chair. The Trustees have determined that an interested Chair is appropriate and benefits shareholders because an interested Chair has a personal and professional stake in the quality and continuity of services provided to the fund. Independent Trustees exercise their informed business judgment to appoint an individual of their choosing to serve as Chair, regardless of whether the Trustee happens to be independent or a member of management. The Independent Trustees have determined that they can act independently and effectively without having an Independent Trustee serve as Chair and that a key structural component for assuring that they are in a position to do so is for the Independent Trustees to constitute a substantial majority for the Board. The Independent Trustees also regularly meet in executive session. David M. Thomas serves as Lead Independent Trustee and as such (i) acts as a liaison between the Independent Trustees and management with respect to matters important to the Independent Trustees and (ii) with management prepares agendas for Board meetings.
Fidelity® funds are overseen by different Boards of Trustees. The fund's Board oversees Fidelity's high income and certain equity funds, and other Boards oversee Fidelity's alternative investment, investment-grade bond, money market, asset allocation, and other equity funds. The asset allocation funds may invest in Fidelity® funds overseen by the fund's Board. The use of separate Boards, each with its own committee structure, allows the Trustees of each group of Fidelity® funds to focus on the unique issues of the funds they oversee, including common research, investment, and operational issues. On occasion, the separate Boards establish joint committees to address issues of overlapping consequences for the Fidelity® funds overseen by each Board.
The Trustees operate using a system of committees to facilitate the timely and efficient consideration of all matters of importance to the Trustees, the fund, and fund shareholders and to facilitate compliance with legal and regulatory requirements and oversight of the fund's activities and associated risks. The Board, acting through its committees, has charged FMR and its affiliates with (i) identifying events or circumstances the occurrence of which could have demonstrably adverse effects on the fund's business and/or reputation; (ii) implementing processes and controls to lessen the possibility that such events or circumstances occur or to mitigate the effects of such events or circumstances if they do occur; and (iii) creating and maintaining a system designed to evaluate continuously business and market conditions in order to facilitate the identification and implementation processes described in (i) and (ii) above. Because the day-to-day operations and activities of the fund are carried out by or through FMR, its affiliates, and other service providers, the fund's exposure to risks is mitigated but not eliminated by the processes overseen by the Trustees. While each of the Board's committees has responsibility for overseeing different aspects of the fund's activities, oversight is exercised primarily through the Operations, Audit, and Compliance Committees. Appropriate personnel, including but not limited to the fund's Chief Compliance Officer (CCO), FMR's internal auditor, the independent accountants, the fund's Treasurer and portfolio management personnel, make periodic reports to the Board's committees, as appropriate, including an annual review of Fidelity's risk management program for the Fidelity® funds. The responsibilities of each standing committee, including their oversight responsibilities, are described further under "Standing Committees of the Trustees."
Interested Trustees*:
Correspondence intended for a Trustee who is an interested person may be sent to Fidelity Investments, 245 Summer Street, Boston, Massachusetts 02210.
Name, Year of Birth; Principal Occupations and Other Relevant Experience+
Jonathan Chiel (1957)
Year of Election or Appointment: 2016
Trustee
Mr. Chiel also serves as Trustee of other Fidelity® funds. Mr. Chiel is General Counsel (2012-present) and Head of Legal, Risk and Compliance (2022-present). Mr Chiel serves as Executive Vice President and General Counsel for FMR LLC (diversified financial services company, 2012-present) and Director and President for OH Company LLC (holding company, 2018-present). Previously, Mr. Chiel served as general counsel (2004-2012) and senior vice president and deputy general counsel (2000-2004) for John Hancock Financial Services; a partner with Choate, Hall & Stewart (1996-2000) (law firm); and an Assistant United States Attorney for the United States Attorney's Office of the District of Massachusetts (1986-95), including Chief of the Criminal Division (1993-1995). Mr. Chiel is a director on the boards of the Boston Bar Foundation and the Maimonides School.
Bettina Doulton (1964)
Year of Election or Appointment: 2021
Trustee
Ms. Doulton also serves as Trustee of other Fidelity® funds. Prior to her retirement, Ms. Doulton served in a variety of positions at Fidelity Investments, including as a managing director of research (2006-2007), portfolio manager to certain Fidelity® funds (1993-2005), equity analyst and portfolio assistant (1990-1993), and research assistant (1987-1990). Ms. Doulton currently owns and operates Phi Builders + Architects and Cellardoor Winery. Previously, Ms. Doulton served as a member of the Board of Brown Capital Management, LLC (2014-2018).
Robert A. Lawrence (1952)
Year of Election or Appointment: 2020
Trustee
Chair of the Board of Trustees
Mr. Lawrence also serves as Trustee of other funds. Previously, Mr. Lawrence served as a Trustee and Member of the Advisory Board of certain funds. Prior to his retirement in 2008, Mr. Lawrence served as Vice President of certain Fidelity® funds (2006-2008), Senior Vice President, Head of High Income Division of Fidelity Management & Research Company (investment adviser firm, 2006-2008), and President of Fidelity Strategic Investments (investment adviser firm, 2002-2005).
* Determined to be an "Interested Trustee" by virtue of, among other things, his or her affiliation with the trust or various entities under common control with FMR.
+ The information includes the Trustee's principal occupation during the last five years and other information relating to the experience, attributes, and skills relevant to the Trustee's qualifications to serve as a Trustee, which led to the conclusion that the Trustee should serve as a Trustee for the fund.
Independent Trustees:
Correspondence intended for an Independent Trustee may be sent to Fidelity Investments, P.O. Box 55235, Boston, Massachusetts 02205-5235.
Name, Year of Birth; Principal Occupations and Other Relevant Experience+
Thomas P. Bostick (1956)
Year of Election or Appointment: 2021
Trustee
Lieutenant General Bostick also serves as Trustee of other Fidelity® funds. Prior to his retirement, General Bostick (United States Army, Retired) held a variety of positions within the U.S. Army, including Commanding General and Chief of Engineers, U.S. Army Corps of Engineers (2012-2016) and Deputy Chief of Staff and Director of Human Resources, U.S. Army (2009-2012). General Bostick currently serves as a member of the Board and Finance and Governance & Sustainability Committees of CSX Corporation (transportation, 2020-present) and a member of the Board and Corporate Governance and Nominating Committee of Perma-Fix Environmental Services, Inc. (nuclear waste management, 2020-present). General Bostick serves as Chief Executive Officer of Bostick Global Strategies, LLC (consulting, 2016-present), as a member of the Board of HireVue, Inc. (video interview and assessment, 2020-present), as a member of the Board of Allonnia (biotechnology and engineering solutions, 2022-present) and on the Advisory Board of Solugen, Inc. (specialty bio-based chemicals manufacturer, 2022-present). Previously, General Bostick served as a Member of the Advisory Board of certain Fidelity® funds (2021), President, Intrexon Bioengineering (2018-2020) and Chief Operating Officer (2017-2020) and Senior Vice President of the Environment Sector (2016-2017) of Intrexon Corporation (biopharmaceutical company).
Dennis J. Dirks (1948)
Year of Election or Appointment: 2005
Trustee
Mr. Dirks also serves as Trustee of other Fidelity® funds. Prior to his retirement in May 2003, Mr. Dirks served as Chief Operating Officer and as a member of the Board of The Depository Trust & Clearing Corporation (financial markets infrastructure), President, Chief Operating Officer and a member of the Board of The Depository Trust Company (DTC), President and a member of the Board of the National Securities Clearing Corporation (NSCC), Chief Executive Officer and a member of the Board of the Government Securities Clearing Corporation and Chief Executive Officer and a member of the Board of the Mortgage-Backed Securities Clearing Corporation. Mr. Dirks currently serves as a member of the Finance Committee (2016-present) and Board (2017-present) and is Treasurer (2018-present) of the Asolo Repertory Theatre.
Donald F. Donahue (1950)
Year of Election or Appointment: 2018
Trustee
Mr. Donahue also serves as Trustee of other Fidelity® funds. Mr. Donahue serves as President and Chief Executive Officer of Miranda Partners, LLC (risk consulting for the financial services industry, 2012-present). Previously, Mr. Donahue served as Chief Executive Officer (2006-2012), Chief Operating Officer (2003-2006) and Managing Director, Customer Marketing and Development (1999-2003) of The Depository Trust & Clearing Corporation (financial markets infrastructure). Mr. Donahue currently serves as a member (2007-present) and Co-Chairman (2016-present) of the Board of United Way of New York. Mr. Donahue previously served as a member of the Advisory Board of certain Fidelity® funds (2015-2018) and as a member of the Board of The Leadership Academy (previously NYC Leadership Academy) (2012-2022).
Vicki L. Fuller (1957)
Year of Election or Appointment: 2020
Trustee
Ms. Fuller also serves as Trustee of other Fidelity® funds. Previously, Ms. Fuller served as a member of the Advisory Board of certain Fidelity® funds (2018-2020), Chief Investment Officer of the New York State Common Retirement Fund (2012-2018) and held a variety of positions at AllianceBernstein L.P. (global asset management, 1985-2012), including Managing Director (2006-2012) and Senior Vice President and Senior Portfolio Manager (2001-2006). Ms. Fuller currently serves as a member of the Board, Audit Committee and Nominating and Governance Committee of two Blackstone business development companies (2020-present), as a member of the Board of Treliant, LLC (consulting, 2019-present), as a member of the Board of Ariel Alternatives, LLC (private equity, 2022-present) and as a member of the Board and Chair of the Audit Committee of Gusto, Inc. (software, 2021-present). In addition, Ms. Fuller currently serves as a member of the Board of Roosevelt University (2019-present) and as a member of the Executive Board of New York University's Stern School of Business. Ms. Fuller previously served as a member of the Board, Audit Committee and Nominating and Governance Committee of The Williams Companies, Inc. (natural gas infrastructure, 2018-2021).
Patricia L. Kampling (1959)
Year of Election or Appointment: 2020
Trustee
Ms. Kampling also serves as Trustee of other Fidelity® funds. Prior to her retirement, Ms. Kampling served as Chairman of the Board and Chief Executive Officer (2012-2019), President and Chief Operating Officer (2011-2012) and Executive Vice President and Chief Financial Officer (2010-2011) of Alliant Energy Corporation. Ms. Kampling currently serves as a member of the Board, Finance Committee and Governance, Compensation and Nominating Committee of Xcel Energy Inc. (utilities company, 2020-present) and as a member of the Board, Audit, Finance and Risk Committee and Safety, Environmental, Technology and Operations Committee and Chair of the Executive Development and Compensation Committee of American Water Works Company, Inc. (utilities company, 2019-present). In addition, Ms. Kampling currently serves as a member of the Board of the Nature Conservancy, Wisconsin Chapter (2019-present). Previously, Ms. Kampling served as a Member of the Advisory Board of certain Fidelity® funds (2020), a member of the Board, Compensation Committee and Executive Committee and Chair of the Audit Committee of Briggs & Stratton Corporation (manufacturing, 2011-2021), a member of the Board of Interstate Power and Light Company (2012-2019) and Wisconsin Power and Light Company (2012-2019) (each a subsidiary of Alliant Energy Corporation) and as a member of the Board and Workforce Development Committee of the Business Roundtable (2018-2019).
Thomas A. Kennedy (1955)
Year of Election or Appointment: 2021
Trustee
Mr. Kennedy also serves as Trustee of other Fidelity® funds. Previously, Mr. Kennedy served as a Member of the Advisory Board of certain Fidelity® funds (2020) and held a variety of positions at Raytheon Company (aerospace and defense, 1983-2020), including Chairman and Chief Executive Officer (2014-2020) and Executive Vice President and Chief Operating Officer (2013-2014). Mr. Kennedy served as Executive Chairman of the Board of Directors of Raytheon Technologies Corporation (aerospace and defense, 2020-2021). Mr. Kennedy serves as a Director of the Board of Directors of Textron Inc. (aerospace and defense, 2023-present).
Oscar Munoz (1959)
Year of Election or Appointment: 2021
Trustee
Mr. Munoz also serves as Trustee of other Fidelity® funds. Prior to his retirement, Mr. Munoz served as Executive Chairman (2020-2021), Chief Executive Officer (2015-2020), President (2015-2016) and a member of the Board (2010-2021) of United Airlines Holdings, Inc. Mr. Munoz currently serves as a member of the Board of CBRE Group, Inc. (commercial real estate, 2020-present), a member of the Board of Univision Communications, Inc. (Hispanic media, 2020-present), a member of the Board of Archer Aviation Inc. (2021-present), a member of the Defense Business Board of the United States Department of Defense (2021-present) and a member of the Board of Salesforce.com, Inc. (cloud-based software, 2022-present). Previously, Mr. Munoz served as a Member of the Advisory Board of certain Fidelity® funds (2021).
David M. Thomas (1949)
Year of Election or Appointment: 2008
Trustee
Lead Independent Trustee
Mr. Thomas also serves as Trustee of other Fidelity® funds. Previously, Mr. Thomas served as Executive Chairman (2005-2006) and Chairman and Chief Executive Officer (2000-2005) of IMS Health, Inc. (pharmaceutical and healthcare information solutions). Mr. Thomas currently serves as a member of the Board of Fortune Brands Home and Security (home and security products, 2004-present) and as Director (2013-present) and Non-Executive Chairman of the Board (2022-present) of Interpublic Group of Companies, Inc. (marketing communication).
Susan Tomasky (1953)
Year of Election or Appointment: 2020
Trustee
Ms. Tomasky also serves as Trustee of other Fidelity® funds. Prior to her retirement, Ms. Tomasky served in various executive officer positions at American Electric Power Company, Inc. (1998-2011), including most recently as President of AEP Transmission (2007-2011). Ms. Tomasky currently serves as a member of the Board and Sustainability Committee and as Chair of the Audit Committee of Marathon Petroleum Corporation (2018-present) and as a member of the Board, Executive Committee, Corporate Governance Committee and Organization and Compensation Committee and as Lead Director of the Board of Public Service Enterprise Group, Inc. (utilities company, 2012-present) and as a member of the Board of its subsidiary company, Public Service Electric and Gas Co. (2021-present). In addition, Ms. Tomasky currently serves as a member (2009-present) and President (2020-present) of the Board of the Royal Shakespeare Company - America (2009-present), as a member of the Board of the Columbus Association for the Performing Arts (2011-present) and as a member of the Board and Kenyon in the World Committee of Kenyon College (2016-present). Previously, Ms. Tomasky served as a Member of the Advisory Board of certain Fidelity® funds (2020), as a member of the Board of the Columbus Regional Airport Authority (2007-2020), as a member of the Board (2011-2018) and Lead Independent Director (2015-2018) of Andeavor Corporation (previously Tesoro Corporation) (independent oil refiner and marketer) and as a member of the Board of Summit Midstream Partners LP (energy, 2012-2018).
Michael E. Wiley (1950)
Year of Election or Appointment: 2020
Trustee
Mr. Wiley also serves as Trustee of other Fidelity® funds. Previously, Mr. Wiley served as a member of the Advisory Board of certain Fidelity® funds (2018-2020), Chairman, President and CEO of Baker Hughes, Inc. (oilfield services, 2000-2004). Mr. Wiley also previously served as a member of the Board of Andeavor Corporation (independent oil refiner and marketer, 2005-2018), a member of the Board of Andeavor Logistics LP (natural resources logistics, 2015-2018) and a member of the Board of High Point Resources (exploration and production, 2005-2020).
+ The information includes the Trustee's principal occupation during the last five years and other information relating to the experience, attributes, and skills relevant to the Trustee's qualifications to serve as a Trustee, which led to the conclusion that the Trustee should serve as a Trustee for the fund.
Advisory Board Members and Officers:
Correspondence intended for a Member of the Advisory Board (if any) may be sent to Fidelity Investments, P.O. Box 55235, Boston, Massachusetts 02205-5235. Correspondence intended for an officer or Peter S. Lynch may be sent to Fidelity Investments, 245 Summer Street, Boston, Massachusetts 02210.
Name, Year of Birth; Principal Occupation
Vijay C. Advani (1960)
Year of Election or Appointment: 2023
Member of the Advisory Board
Mr. Advani also serves as Trustee or Member of the Advisory Board of other funds. Previously, Mr. Advani served as Executive Chairman (2020-2022), Chief Executive Officer (2017-2020) and Chief Operating Officer (2016-2017) of Nuveen (global investment manager). He also served in various capacities at Franklin Resources (global investment manager), including Co-President (2015-2016), Executive Vice President, Global Advisory Services (2008-2015), Head of Global Retail Distribution (2005-2008), Executive Managing Director, International Retail Development (2002-2005), Managing Director, Product Developments, Sales & Marketing, Asia, Eastern Europe and Africa (2000-2002) and President, Templeton Asset Management India (1995-2000). Mr. Advani also served as Senior Investment Officer of International Finance Corporation (private equity and venture capital arm of The World Bank, 1984-1995). Mr. Advani is Chairman Emeritus of the U.S. India Business Council (2018-present), a Director of The Global Impact Investing Network (2019-present), a Director of LOK Capital (Mauritius) (2022-present), a member of the Advisory Council of LOK Capital (2022-present), a Senior Advisor of Neuberger Berman (2021-present), a Senior Advisor of Seviora Holdings Pte. Ltd (Temasek-Singapore) (2021-present), a Director of Seviora Capital (Singapore) (2021-present) and an Advisor of EQUIAM (2021-present). Mr. Advani formerly served as a member of the Board of BowX Acquisition Corp. (special purpose acquisition company, 2020-2021), a member of the Board of Intellecap (advisory arm of The Aavishkaar Group, 2018-2020), a member of the Board of Nuveen Investments, Inc. (2017-2020) and a member of the Board of Docusign (software, 2016-2019).
Peter S. Lynch (1944)
Year of Election or Appointment: 2003
Member of the Advisory Board
Mr. Lynch also serves as a Member of the Advisory Board of other Fidelity® funds. Mr. Lynch is Vice Chairman and a Director of Fidelity Management & Research Company LLC (investment adviser firm). In addition, Mr. Lynch serves as a Trustee of Boston College and as the Chairman of the Inner-City Scholarship Fund. Previously, Mr. Lynch served as Vice Chairman and a Director of FMR Co., Inc. (investment adviser firm) and on the Special Olympics International Board of Directors (1997-2006).
Karen B. Peetz (1955)
Year of Election or Appointment: 2023
Member of the Advisory Board
Ms. Peetz also serves as a Member of the Advisory Board of other funds. Previously, Ms. Peetz served as Chief Administration Officer (2020-2023) of Citigroup Inc. (a diversified financial service company). She also served in various capacities at Bank of New York Mellon Corporation, including President (2013-2016), Vice Chairman, Senior Executive Vice President and Chief Executive Officer of Financial Markets & Treasury Services (2010-2013), Senior Executive Vice President and Chief Executive Officer of Global Corporate Trust (2003-2008), Senior Vice President and Division Manager of Global Payments & Trade Services (2002-2003) and Senior Vice President and Division Manager of Domestic Corporate Trust (1998-2002). Ms. Peetz also served in various capacities at Chase Manhattan Corporation (1982-1998), including Senior Vice President and Manager of Corporate Trust International Business (1996-1998), Managing Director and Manager of Corporate Trust Services (1994-1996) and Managing Director and Group Manager of Financial Institution Sales (1990-1993). Ms. Peetz currently serves as Chair of Amherst Holdings Advisory Council (2018-present), Trustee of Johns Hopkins University (2016-present), Chair of the Carey Business School Advisory Council, Member of the Johns Hopkins Medicine Board and Finance Committee and Chair of the Lyme and Tick Related Disease Institute Advisory Council. Ms. Peetz previously served as a member of the Board of Guardian Life Insurance Company of America (2019-2023), a member of the Board of Trane Technologies (2018-2022), a member of the Board of Wells Fargo Corp. (2017-2019), a member of the Board of SunCoke Energy Inc. (2012-2016), a member of the Board of Private Export Funding Corporation (2010-2016) and as a Trustee of Penn State University (2010-2014) and the United Way of New York City (2008-2010).
Heather Bonner (1977)
Year of Election or Appointment: 2023
Assistant Treasurer
Ms. Bonner also serves as an officer of other funds. Ms. Bonner is a Senior Vice President (2022-present) and is an employee of Fidelity Investments (2022-present). Ms. Bonner serves as Vice President, Treasurer, or Assistant Treasurer of certain Fidelity entities. Prior to joining Fidelity, Ms. Bonner served as Managing Director at AQR Capital Management (2013-2022) and was the Treasurer and Principal Financial Officer of the AQR Funds (2013-2022).
Craig S. Brown (1977)
Year of Election or Appointment: 2022
Deputy Treasurer
Mr. Brown also serves as an officer of other funds. Mr. Brown is a Vice President (2015-present) and is an employee of Fidelity Investments. Mr. Brown serves as Assistant Treasurer of FIMM, LLC (2021-present). Previously, Mr. Brown served as Assistant Treasurer of certain Fidelity® funds (2019-2022).
John J. Burke III (1964)
Year of Election or Appointment: 2018
Chief Financial Officer
Mr. Burke also serves as Chief Financial Officer of other funds. Mr. Burke is Head of Fidelity Fund and Investment Operations (2018-present) and is an employee of Fidelity Investments. Mr. Burke serves as President, Executive Vice President, or Director of certain Fidelity entities. Previously Mr. Burke served as head of Asset Management Investment Operations (2012-2018).
Margaret Carey (1973)
Year of Election or Appointment: 2023
Secretary and Chief Legal Officer (CLO)
Ms. Carey also serves as an officer of other funds and as CLO of certain Fidelity entities. Ms. Carey is a Senior Vice President, Deputy General Counsel (2019-present) and is an employee of Fidelity Investments.
William C. Coffey (1969)
Year of Election or Appointment: 2019
Assistant Secretary
Mr. Coffey also serves as Assistant Secretary of other funds. Mr. Coffey is a Senior Vice President, Deputy General Counsel (2010-present) and is an employee of Fidelity Investments. Previously, Mr. Coffey served as Secretary and CLO of certain funds (2018-2019); CLO, Secretary, or Senior Vice President of certain Fidelity entities and Assistant Secretary of certain funds (2009-2018).
Timothy M. Cohen (1969)
Year of Election or Appointment: 2018
Vice President
Mr. Cohen also serves as Vice President of other funds. Mr. Cohen is Co-Head of Equity (2018-present) and is an employee of Fidelity Investments. Mr. Cohen serves a Director of Fidelity Management & Research (Japan) Limited (investment adviser firm, 2016-present). Previously, Mr. Cohen served as Executive Vice President of Fidelity SelectCo, LLC (2019) and Head of Global Equity Research (2016-2018).
Jonathan Davis (1968)
Year of Election or Appointment: 2010
Assistant Treasurer
Mr. Davis also serves as an officer of other funds. Mr. Davis is a Vice President (2006-present) and is an employee of Fidelity Investments. Mr. Davis serves as Assistant Treasurer of certain Fidelity entities.
Laura M. Del Prato (1964)
Year of Election or Appointment: 2018
Assistant Treasurer
Ms. Del Prato also serves as an officer of other funds. Ms. Del Prato is a Senior Vice President (2017-present) and is an employee of Fidelity Investments. Ms. Del Prato serves as Vice President or Assistant Treasurer of certain Fidelity entities. Previously, Ms. Del Prato served as President and Treasurer of The North Carolina Capital Management Trust: Cash Portfolio and Term Portfolio (2018-2020).
Colm A. Hogan (1973)
Year of Election or Appointment: 2020
Assistant Treasurer
Mr. Hogan also serves as an officer of other funds. Mr. Hogan is a Vice President (2016-present) and is an employee of Fidelity Investments. Mr. Hogan serves as Assistant Treasurer of certain Fidelity entities. Previously, Mr. Hogan served as Deputy Treasurer of certain Fidelity® funds (2016-2020) and Assistant Treasurer of certain Fidelity® funds (2016-2018).
Pamela R. Holding (1964)
Year of Election or Appointment: 2018
Vice President
Ms. Holding also serves as Vice President of other funds. Ms. Holding is Co-Head of Equity (2018-present) and is an employee of Fidelity Investments. Previously, Ms. Holding served as Executive Vice President of Fidelity SelectCo, LLC (2019) and as Chief Investment Officer of Fidelity Institutional Asset Management (2013-2018).
Chris Maher (1972)
Year of Election or Appointment: 2020
Deputy Treasurer
Mr. Maher also serves as an officer of other funds. Mr. Maher is a Vice President (2008-present) and is an employee of Fidelity Investments. Mr. Maher serves as Assistant Treasurer of certain Fidelity entities. Previously, Mr. Maher served as Assistant Treasurer of certain funds (2013-2020).
Jason P. Pogorelec (1975)
Year of Election or Appointment: 2020
Chief Compliance Officer
Mr. Pogorelec also serves as Chief Compliance Officer of other funds. Mr. Pogorelec is a Senior Vice President of Asset Management Compliance (2020-present) and is an employee of Fidelity Investments. Mr. Pogorelec serves as Compliance Officer of Fidelity Management & Research Company LLC (investment adviser firm, 2023-present) and Ballyrock Investment Advisors LLC (2023-present). Previously, Mr. Pogorelec served as a Vice President, Associate General Counsel for Fidelity Investments (2010-2020) and Assistant Secretary of certain Fidelity® funds (2015-2020).
Brett Segaloff (1972)
Year of Election or Appointment: 2021
Anti-Money Laundering (AML) Officer
Mr. Segaloff also serves as AML Officer of other funds. Mr. Segaloff is a Vice President (2022-present) and is an employee of Fidelity Investments. Mr. Segaloff serves as Anti Money Laundering Compliance Officer or Anti Money Laundering/Bank Secrecy Act Compliance Officer of certain Fidelity entities.
Stacie M. Smith (1974)
Year of Election or Appointment: 2016
President and Treasurer
Ms. Smith also serves as an officer of other funds. Ms. Smith is a Senior Vice President (2016-present) and is an employee of Fidelity Investments. Ms. Smith serves as Assistant Treasurer of certain Fidelity entities and has served in other fund officer roles.
Jim Wegmann (1979)
Year of Election or Appointment: 2019
Assistant Treasurer
Mr. Wegmann also serves as an officer of other funds. Mr. Wegmann is a Vice President (2016-present) and is an employee of Fidelity Investments. Mr. Wegmann serves as Assistant Treasurer of FIMM, LLC (2021-present). Previously, Mr. Wegmann served as Assistant Treasurer of certain Fidelity® funds (2019-2021).
As a shareholder, you incur two types of costs: (1) transaction costs, which may include sales charges (loads) on purchase payments or redemption proceeds, as applicable and (2) ongoing costs, which generally include management fees, distribution and/or service (12b-1) fees and other Fund expenses. This Example is intended to help you understand your ongoing costs (in dollars) of investing in a fund and to compare these costs with the ongoing costs of investing in other mutual funds.
| The Example is based on an investment of $1,000 invested at the beginning of the period and held for the entire period (May 1, 2023 to October 31, 2023). |
Actual Expenses
The first line of the accompanying table provides information about actual account values and actual expenses. You may use the information in this line, together with the amount you invested, to estimate the expenses that you paid over the period. Simply divide your account value by $1,000.00 (for example, an $8,600 account value divided by $1,000.00 = 8.6), then multiply the result by the number in the first line for a class/Fund under the heading entitled "Expenses Paid During Period" to estimate the expenses you paid on your account during this period. If any fund is a shareholder of any underlying mutual funds or exchange-traded funds (ETFs) (the Underlying Funds), such fund indirectly bears its proportional share of the expenses of the Underlying Funds in addition to the direct expenses incurred presented in the table. These fees and expenses are not included in the annualized expense ratio used to calculate the expense estimate in the table below.
Hypothetical Example for Comparison Purposes
The second line of the accompanying table provides information about hypothetical account values and hypothetical expenses based on the actual expense ratio and an assumed rate of return of 5% per year before expenses, which is not the actual return. The hypothetical account values and expenses may not be used to estimate the actual ending account balance or expenses you paid for the period. You may use this information to compare the ongoing costs of investing in the Fund and other funds. To do so, compare this 5% hypothetical example with the 5% hypothetical examples that appear in the shareholder reports of the other funds. If any fund is a shareholder of any Underlying Funds, such fund indirectly bears its proportional share of the expenses of the Underlying Funds in addition to the direct expenses as presented in the table. These fees and expenses are not included in the annualized expense ratio used to calculate the expense estimate in the table below.
Please note that the expenses shown in the table are meant to highlight your ongoing costs only and do not reflect any transaction costs. Therefore, the second line of the table is useful in comparing ongoing costs only, and will not help you determine the relative total costs of owning different funds. In addition, if these transactional costs were included, your costs would have been higher.
| | | | | Annualized Expense Ratio- A | | Beginning Account Value May 1, 2023 | | Ending Account Value October 31, 2023 | | Expenses Paid During Period- C May 1, 2023 to October 31, 2023 |
| | | | | | | | | | |
| Fidelity® SAI International SMA Completion Fund | | | | -%-D | | | | | | |
| Actual | | | | | | $ 1,000 | | $ 919.90 | | $-E |
Hypothetical-B | | | | | | $ 1,000 | | $ 1,025.21 | | $-E |
| |
A Annualized expense ratio reflects expenses net of applicable fee waivers.
B 5% return per year before expenses
C Expenses are equal to the annualized expense ratio, multiplied by the average account value over the period, multiplied by 184/ 365 (to reflect the one-half year period). The fees and expenses of any Underlying Funds are not included in each annualized expense ratio.
D Amount represents less than .005%.
E Amount represents less than $.005.
The dividend and capital gains distributions for the fund(s) are available on Fidelity.com or Institutional.Fidelity.com.
The fund designates $579,618 of distributions paid during the fiscal year ended 2023 as qualifying to be taxed as section 163(j) interest dividends.
The fund designates 91.69% of the dividend distributed during the fiscal year as amounts which may be taken into account as a dividend for the purposes of the maximum rate under section 1(h)(11) of the Internal Revenue Code.
The amounts per share which represent income derived from sources within, and taxes paid to, foreign countries or possessions of the United States are $0.1667 and $0.0277 for the dividend paid December 12, 2022.
The fund will notify shareholders in January 2024 of amounts for use in preparing 2023 income tax returns.
Board Approval of Investment Advisory Contracts and Management Fees
Fidelity SAI International SMA Completion Fund
Each year, the Board of Trustees, including the Independent Trustees (together, the Board), considers the renewal of the fund's management contract with Fidelity Management & Research Company LLC (FMR) and the sub-advisory agreements (together, the Advisory Contracts) for the fund. FMR and the sub-advisers are referred to herein as the Investment Advisers. The Board, assisted by the advice of fund counsel and Independent Trustees' counsel, requests and considers a broad range of information relevant to the renewal of the Advisory Contracts throughout the year.
The Board meets regularly and, at each of its meetings, covers an extensive agenda of topics and materials and considers factors that are relevant to its annual consideration of the renewal of the fund's Advisory Contracts, including the services and support provided to the fund and its shareholders. The Board, acting directly and through its Committees (each of which is composed of and chaired by Independent Trustees), requests and receives information concerning the annual consideration of the renewal of the fund's Advisory Contracts. The Board also meets as needed to review matters specifically related to the Board's annual consideration of the renewal of the Advisory Contracts. Members of the Board may also meet with trustees of other Fidelity funds through joint ad hoc committees to discuss certain matters relevant to all of the Fidelity funds.
Approval of Stub Period Continuation. At its May 2023 meeting, the Board of Trustees voted to continue the fund's management contract with FMR, and the sub-advisory agreements and sub-sub-advisory agreements, in each case, where applicable (together, the Advisory Contracts), without modification, for two months from June 1, 2023 through July 31, 2023. The Board considered that the approval of the fund's Advisory Contracts will not result in any changes in (i) the investment process or strategies employed in the management of the fund's assets; (ii) the fees and expenses paid by shareholders; (iii) the nature, extent or quality of services provided under the fund's Advisory Contracts; or (iv) the day-to-day management of the fund or the persons primarily responsible for such management. The Board also considered that since its last approval of the fund's Advisory Contracts, FMR had provided additional information on the fund in support of the annual contract renewal process, including competitive analyses on total expenses and management fees and in-depth reviews of fund performance and fund profitability information. The Board concluded that the fund's Advisory Contracts are fair and reasonable, and that the fund's Advisory Contracts should be renewed, without modification, through July 31, 2023, with the understanding that the Board would consider the annual renewal for a full one year period in July 2023.
At its July 2023 meeting, the Board unanimously determined to renew the fund's Advisory Contracts. In considering whether to renew the Advisory Contracts for the fund, the Board considered all factors it believed relevant and reached a determination, with the assistance of fund counsel and Independent Trustees' counsel and through the exercise of its business judgment, that the renewal of the Advisory Contracts was in the best interests of the fund and its shareholders and the fact that no fee is payable under the management contract was fair and reasonable in light of all of the surrounding circumstances.
Nature, Extent, and Quality of Services Provided. The Board considered staffing as it relates to the fund, including the backgrounds and experience of investment personnel of the Investment Advisers, and also considered the Investment Advisers' implementation of the fund's investment program. The Independent Trustees also had discussions with senior management of Fidelity's investment operations and investment groups. The Board considered the structure of the investment personnel compensation program and whether this structure provides appropriate incentives to act in the best interests of the fund. Additionally, the Board considered the portfolio managers' investments, if any, in the funds that they manage.
Resources Dedicated to Investment Management and Support Services. The Board and the Fund Oversight and Research Committees reviewed the general qualifications and capabilities of Fidelity's investment staff, including its size, education, experience, and resources, as well as Fidelity's approach to recruiting, training, managing, and compensating investment personnel. The Board noted the resources devoted to expansion of Fidelity's global investment organization, and that Fidelity's analysts have extensive resources, tools, and capabilities that allow them to conduct sophisticated quantitative and fundamental analysis, as well as credit analysis of issuers, counterparties, and guarantors. Further, the Board considered that Fidelity's investment professionals have sufficient access to global information and data so as to provide competitive investment results over time, and that those professionals also have access to sophisticated tools that permit them to assess portfolio construction and risk and performance attribution characteristics continuously, as well as to transmit new information and research conclusions rapidly around the world. Additionally, in its deliberations, the Board considered Fidelity's trading, risk management, compliance, and technology and operations capabilities and resources, which are integral parts of the investment management process.
Shareholder and Administrative Services. The Board considered (i) the nature, extent, quality, and cost of advisory, administrative, and shareholder services performed by the Investment Advisers and their affiliates under the Advisory Contracts and under separate agreements covering transfer agency, pricing and bookkeeping, and securities lending services for the fund; (ii) the nature and extent of Fidelity's supervision of third party service providers, principally custodians, subcustodians, and pricing vendors; and (iii) the resources devoted by Fidelity to, and the record of compliance with, the fund's compliance policies and procedures. The Board also reviewed the allocation of fund brokerage, including allocations to brokers affiliated with the Investment Advisers, the use of brokerage commissions to pay fund expenses, and the use of "soft" commission dollars to pay for research services. The Board also considered the fund's securities lending activities and any payments made to Fidelity relating to securities lending.
The Board noted that the growth of fund assets over time across the complex allows Fidelity to reinvest in the development of services designed to enhance the value and convenience of the Fidelity funds as investment vehicles. These services include 24-hour access to account information and market information over the Internet and through telephone representatives, investor education materials, and asset allocation tools. The Board also considered that it reviews customer service metrics such as telephone response times, continuity of services on the website and metrics addressing services at Fidelity Investor Centers.
Investment in a Large Fund Family. The Board considered the benefits to shareholders of investing in a fund that is part of a large family of funds offering a variety of investment disciplines and providing a large variety of fund investor services. The Board noted that Fidelity had taken, or had made recommendations that resulted in the Fidelity funds taking, a number of actions over the previous year that benefited particular funds and/or the Fidelity funds in general.
Investment Performance. The Board reviewed the fund's absolute investment performance, as well as the fund's relative investment performance, and considered the fund's underperformance for different time periods ended February 28, 2023. The Board did not consider performance to be a material factor in its decision to renew the fund's Advisory Contracts, as the fund is not publicly offered as a stand-alone investment product.
Based on its review, the Board concluded that the nature, extent, and quality of services provided to the fund under the Advisory Contracts should continue to benefit the shareholders of the fund.
Competitiveness of Management Fee and Total Expense Ratio. The Board considered that the fund does not pay FMR a management fee for investment advisory services. The Board also considered that the fund is available through fee-based programs and products offered by Fidelity and that FMR is compensated for its services out of such fees. The Board also noted that FMR or an affiliate undertakes to pay all operating expenses of the fund with limited exceptions.
Based on its review, the Board considered that the fund does not pay a management fee and concluded that the total expense ratio of the fund was reasonable in light of the services that the fund and its shareholders receive and the other factors considered.
Costs of the Services and Profitability. The Board considered the level of Fidelity's profits in respect of all the Fidelity funds.
A public accounting firm has been engaged annually by the Board as part of the Board's assessment of Fidelity's profitability analysis. The engagement includes the review and assessment of the methodologies used by Fidelity in determining the revenues and expenses attributable to Fidelity's fund business, and completion of agreed-upon procedures in respect of the mathematical accuracy of certain fund profitability information and its conformity to established allocation methodologies. After considering the reports issued under the engagement and information provided by Fidelity, the Board concluded that while other allocation methods may also be reasonable, Fidelity's profitability methodologies are reasonable in all material respects.
The Board also reviewed Fidelity's non-fund businesses and potential indirect benefits such businesses may have received as a result of their association with Fidelity's fund business (i.e., fall-out benefits) as well as cases where Fidelity's affiliates may benefit from the funds' business. The Board considered areas where potential indirect benefits to the Fidelity funds from their relationships with Fidelity may exist. The Board's consideration of these matters was informed by the findings of a joint ad hoc committee created by it and the boards of other Fidelity funds to evaluate potential fall-out benefits.
The Board concluded that the costs of the services provided by and the profits realized by Fidelity in connection with the operation of the fund were not relevant to the renewal of the Advisory Contracts because the fund pays no advisory fees and FMR or an affiliate bears all expenses of the fund with limited exceptions.
Economies of Scale. The Board concluded that because the fund pays no advisory fees and FMR bears all expenses of the fund with limited exceptions, the realization of economies of scale was not a material factor in the Board's decision to renew the fund's Advisory Contract.
Additional Information Requested by the Board. In order to develop fully the factual basis for consideration of the Fidelity funds' advisory contracts, the Board requested and received additional information on certain topics, including: (i) fund flow and performance trends, in particular the underperformance of certain funds and strategies, and Fidelity's long-term strategies for certain funds, including any consideration of fund liquidations or mergers; (ii) the operation of performance fees and competitor use of performance fees; (iii) Fidelity's pricing philosophy compared to competitors; (iv) fund profitability methodology and data; (v) evaluation of competitive fund data and peer group classifications and fee and expense comparisons; (vi) the management fee and expense structures for different funds and classes and information about the differences between various fee and expense structures; (vii) group fee breakpoints and related voluntary fee waivers; and (viii) information regarding other accounts managed by Fidelity and the funds' sub-advisory arrangements.
Conclusion. Based on its evaluation of all of the conclusions noted above, and after considering all factors it believed relevant, the Board, including the Independent Trustees, concluded that the advisory and sub-advisory fee arrangements are fair and reasonable in light of all of the surrounding circumstances and that the fund's Advisory Contracts should be renewed through July 31, 2024.
1.9893098.104
ISM-ANN-1223
Fidelity® International Capital Appreciation K6 Fund
Annual Report
October 31, 2023
Contents
To view a fund's proxy voting guidelines and proxy voting record for the 12-month period ended June 30, visit http://www.fidelity.com/proxyvotingresults or visit the Securities and Exchange Commission's (SEC) web site at http://www.sec.gov.
You may also call 1-800-835-5092 to request a free copy of the proxy voting guidelines.
Standard & Poor's, S&P and S&P 500 are registered service marks of The McGraw-Hill Companies, Inc. and have been licensed for use by Fidelity Distributors Corporation.
Other third-party marks appearing herein are the property of their respective owners.
All other marks appearing herein are registered or unregistered trademarks or service marks of FMR LLC or an affiliated company. © 2023 FMR LLC. All rights reserved.
This report and the financial statements contained herein are submitted for the general information of the shareholders of the Fund. This report is not authorized for distribution to prospective investors in the Fund unless preceded or accompanied by an effective prospectus.
A fund files its complete schedule of portfolio holdings with the SEC for the first and third quarters of each fiscal year on Form N-PORT. Forms N-PORT are available on the SEC's web site at http://www.sec.gov. A fund's Forms N-PORT may be reviewed and copied at the SEC's Public Reference Room in Washington, DC. Information regarding the operation of the SEC's Public Reference Room may be obtained by calling 1-800-SEC-0330.
For a complete list of a fund's portfolio holdings, view the most recent holdings listing, semiannual report, or annual report on Fidelity's web site at http://www.fidelity.com, http://www.institutional.fidelity.com, or http://www.401k.com, as applicable.
NOT FDIC INSURED •MAY LOSE VALUE •NO BANK GUARANTEE
Neither the Fund nor Fidelity Distributors Corporation is a bank.
Average annual total return reflects the change in the value of an investment, assuming reinvestment of distributions from dividend income and capital gains (the profits earned upon the sale of securities that have grown in value, if any) and assuming a constant rate of performance each year. The hypothetical investment and the average annual total returns do not reflect the deduction of taxes that a shareholder would pay on fund distributions or the redemption of fund shares. During periods of reimbursement by Fidelity, a fund's total return will be greater than it would be had the reimbursement not occurred. How a fund did yesterday is no guarantee of how it will do tomorrow.
| Average Annual Total Returns |
| | | | |
Periods ended October 31, 2023 | Past 1 year | Past 5 years | Life of Fund A |
| Fidelity® International Capital Appreciation K6 Fund | 16.02% | 7.51% | 6.11% |
A From May 25, 2017
| $10,000 Over Life of Fund |
| |
Let's say hypothetically that $10,000 was invested in Fidelity® International Capital Appreciation K6 Fund, on May 25, 2017, when the fund started. The chart shows how the value of your investment would have changed, and also shows how the MSCI ACWI (All Country World Index) ex USA Index performed over the same period. |
|
|
Market Recap:
International (non-U.S.) equities gained 12.27% for the 12 months ending October 31, 2023, according to the MSCI ACWI (All Country World Index) ex USA Index, as global economic expansion and a slowing in the pace of inflation in some markets provided a favorable backdrop for risk assets. After returning -15.86% in 2022, the index's upturn has been largely driven by a narrow set of companies in the information technology and communication services sectors, in part due to excitement for generative artificial intelligence applications. The index gained 14.07% year to date through July, including strong gains in both June (+4.50%) and July (+4.07%). The rally for international equities sputtered for the next three months (-11.33%) amid a stalling pattern in disinflationary trends, heightened global recession and geopolitical risks, soaring yields on longer-term U.S. government bonds and particularly weak economic conditions in the eurozone and China. The three-month decline left non-U.S. stocks up 1.15% year to date through October. Currency fluctuation also helped bolster non-U.S. equity performance overall. For the full 12 months, nearly all regions advanced, with Europe ex U.K. (+18%) and Japan (+17%) leading, whereas Canada (-0.38%) lagged by the widest margin. Each of the 11 sectors advanced, with information technology (+21%) and consumer discretionary (+19%) leading the way. Energy and industrials each rose about 14%. Conversely, four defensive-oriented sectors lagged by the widest margin: real estate (+4%), health care (+6%), consumer staples (+7%) and utilities (+8%).
Comments from Portfolio Manager Sammy Simnegar:
For the fiscal year ending October 31, 2023, the fund gained 16.02%, versus 12.27% for the benchmark MSCI All Country World ex US Index (Net MA). From a regional standpoint, stock picks and an overweight in Europe ex-U.K., along with an underweight in emerging markets and security selection in Canada, meaningfully aided the fund's performance versus the benchmark. By sector, investment choices in consumer discretionary contributed most on a relative basis. Picks among health care stocks also boosted relative performance. The top individual relative contributor was an overweight stake in ASM International (+85%), followed by outsized exposure to Novo-Nordisk (+78%), one of our biggest holdings this period. A larger-than-benchmark position in Ferrari (+55%) was another plus. In contrast, on a regional basis, stock selection and a notable underweight in Japan, in addition to subpar picks and an overweight in the U.K., detracted from the fund's relative result. By sector, picks among industrials and financials stocks meaningfully detracted this period. The fund's stake in Brookfield returned approximately -28% and was the largest individual relative detractor. A non-benchmark stake in SolarEdge Technologies (-19%) pressured relative performance as well. Untimely ownership of Siemens (-20%) also detracted. Neither SolarEdge Technologies nor Siemens was held by the fund at period end. Notable changes in positioning include increased exposure to equity markets in India and a lower allocation to Switzerland. By sector, meaningful changes in positioning include increased exposure to financials and materials.
The views expressed above reflect those of the portfolio manager(s) only through the end of the period as stated on the cover of this report and do not necessarily represent the views of Fidelity or any other person in the Fidelity organization. Any such views are subject to change at any time based upon market or other conditions and Fidelity disclaims any responsibility to update such views. These views may not be relied on as investment advice and, because investment decisions for a Fidelity fund are based on numerous factors, may not be relied on as an indication of trading intent on behalf of any Fidelity fund.
Top Holdings (% of Fund's net assets) |
| |
| Taiwan Semiconductor Manufacturing Co. Ltd. (Taiwan, Semiconductors & Semiconductor Equipment) | 3.1 | |
| Novo Nordisk A/S Series B (Denmark, Pharmaceuticals) | 2.9 | |
| ASML Holding NV (Netherlands) (Netherlands, Semiconductors & Semiconductor Equipment) | 2.6 | |
| LVMH Moet Hennessy Louis Vuitton SE (France, Textiles, Apparel & Luxury Goods) | 2.5 | |
| AstraZeneca PLC (United Kingdom) (United Kingdom, Pharmaceuticals) | 2.3 | |
| L'Oreal SA (France, Personal Care Products) | 2.0 | |
| RELX PLC (London Stock Exchange) (United Kingdom, Professional Services) | 1.9 | |
| Dassault Systemes SA (France, Software) | 1.8 | |
| Keyence Corp. (Japan, Electronic Equipment, Instruments & Components) | 1.8 | |
| Air Liquide SA (France, Chemicals) | 1.8 | |
| | 22.7 | |
| |
| Market Sectors (% of Fund's net assets) |
| |
| Information Technology | 22.7 | |
| Industrials | 22.0 | |
| Financials | 18.1 | |
| Consumer Discretionary | 14.1 | |
| Health Care | 8.1 | |
| Materials | 7.8 | |
| Consumer Staples | 5.3 | |
| |
Asset Allocation (% of Fund's net assets) |
|
|
Geographic Diversification (% of Fund's net assets) |
|
* Includes Short-Term investments and Net Other Assets (Liabilities). Percentages are adjusted for the effect of derivatives, if applicable. |
| |
Showing Percentage of Net Assets
| Common Stocks - 98.1% |
| | | Shares | Value ($) |
| Brazil - 1.5% | | | |
| MercadoLibre, Inc. (a) | | 12,805 | 15,887,676 |
| Canada - 10.7% | | | |
| Alimentation Couche-Tard, Inc. Class A (multi-vtg.) | | 358,279 | 19,503,502 |
| Brookfield Asset Management Ltd. Class A | | 486,600 | 13,950,822 |
| Canadian National Railway Co. | | 154,886 | 16,388,262 |
| Canadian Pacific Kansas City Ltd. | | 246,437 | 17,497,160 |
| CGI, Inc. Class A (sub. vtg.) (a) | | 147,090 | 14,200,403 |
| Constellation Software, Inc. | | 9,566 | 19,176,907 |
| Constellation Software, Inc. warrants 8/22/28 (a)(b) | | 9,222 | 1 |
| Thomson Reuters Corp. (c) | | 137,623 | 16,484,988 |
TOTAL CANADA | | | 117,202,045 |
| China - 1.6% | | | |
| PDD Holdings, Inc. ADR (a) | | 175,433 | 17,792,415 |
| Denmark - 4.5% | | | |
| DSV A/S | | 115,542 | 17,231,995 |
| Novo Nordisk A/S Series B | | 335,865 | 32,402,991 |
TOTAL DENMARK | | | 49,634,986 |
| France - 13.0% | | | |
| Air Liquide SA | | 114,682 | 19,651,019 |
| Capgemini SA | | 98,383 | 17,387,109 |
| Dassault Systemes SA | | 487,225 | 20,070,440 |
| Hermes International SCA | | 10,104 | 18,811,958 |
| L'Oreal SA | | 51,319 | 21,570,952 |
| LVMH Moet Hennessy Louis Vuitton SE | | 37,389 | 26,767,928 |
| Safran SA | | 111,164 | 17,365,990 |
TOTAL FRANCE | | | 141,625,396 |
| Germany - 2.3% | | | |
| Infineon Technologies AG | | 554,822 | 16,206,473 |
| SAP SE | | 67,587 | 9,065,602 |
TOTAL GERMANY | | | 25,272,075 |
| India - 9.6% | | | |
| Axis Bank Ltd. | | 1,240,721 | 14,635,926 |
| HCL Technologies Ltd. | | 1,223,770 | 18,765,131 |
| HDFC Bank Ltd. | | 1,057,204 | 18,754,022 |
| ICICI Bank Ltd. | | 1,721,605 | 18,935,130 |
| ITC Ltd. | | 3,093,849 | 15,920,980 |
| Larsen & Toubro Ltd. | | 504,546 | 17,750,153 |
TOTAL INDIA | | | 104,761,342 |
| Indonesia - 1.5% | | | |
| PT Bank Central Asia Tbk | | 30,441,582 | 16,770,896 |
| Ireland - 1.5% | | | |
| Kingspan Group PLC (Ireland) | | 243,292 | 16,341,483 |
| Italy - 1.7% | | | |
| Ferrari NV (Italy) | | 60,343 | 18,228,869 |
| Japan - 6.4% | | | |
| Hoya Corp. | | 129,352 | 12,452,539 |
| Keyence Corp. | | 51,411 | 19,902,160 |
| Shin-Etsu Chemical Co. Ltd. | | 587,136 | 17,557,350 |
| Tokyo Electron Ltd. | | 146,891 | 19,409,838 |
TOTAL JAPAN | | | 69,321,887 |
| Netherlands - 6.0% | | | |
| ASM International NV (Netherlands) | | 42,580 | 17,503,439 |
| ASML Holding NV (Netherlands) | | 48,310 | 29,040,127 |
| Wolters Kluwer NV | | 150,020 | 19,222,949 |
TOTAL NETHERLANDS | | | 65,766,515 |
| Sweden - 1.6% | | | |
| Atlas Copco AB (A Shares) | | 1,327,267 | 17,186,809 |
| Switzerland - 5.0% | | | |
| Compagnie Financiere Richemont SA Series A | | 160,770 | 18,966,924 |
| Sika AG | | 68,758 | 16,394,888 |
| UBS Group AG | | 812,383 | 18,950,989 |
TOTAL SWITZERLAND | | | 54,312,801 |
| Taiwan - 3.1% | | | |
| Taiwan Semiconductor Manufacturing Co. Ltd. | | 2,102,866 | 34,318,645 |
| United Kingdom - 10.1% | | | |
| Ashtead Group PLC | | 272,035 | 15,553,538 |
| AstraZeneca PLC (United Kingdom) | | 198,122 | 24,805,618 |
| BAE Systems PLC | | 943,148 | 12,681,928 |
| Compass Group PLC | | 777,411 | 19,599,609 |
| London Stock Exchange Group PLC | | 166,324 | 16,781,276 |
| RELX PLC (London Stock Exchange) | | 602,679 | 21,050,201 |
TOTAL UNITED KINGDOM | | | 110,472,170 |
| United States of America - 18.0% | | | |
| Aon PLC | | 5,132 | 1,587,841 |
| AutoZone, Inc. (a) | | 6,354 | 15,739,684 |
| Linde PLC | | 47,593 | 18,188,141 |
| Marsh & McLennan Companies, Inc. | | 84,950 | 16,110,768 |
| Martin Marietta Materials, Inc. | | 33,057 | 13,518,330 |
| MasterCard, Inc. Class A | | 38,700 | 14,564,745 |
| Moody's Corp. | | 53,557 | 16,495,556 |
| NVIDIA Corp. | | 37,020 | 15,096,756 |
| S&P Global, Inc. | | 44,929 | 15,694,149 |
| Schneider Electric SA | | 125,490 | 19,307,549 |
| UnitedHealth Group, Inc. | | 35,241 | 18,873,670 |
| Visa, Inc. Class A | | 65,660 | 15,436,666 |
| Waste Connections, Inc. (Canada) | | 121,134 | 15,684,746 |
TOTAL UNITED STATES OF AMERICA | | | 196,298,601 |
| TOTAL COMMON STOCKS (Cost $928,714,781) | | | 1,071,194,611 |
| | | | |
| Money Market Funds - 1.6% |
| | | Shares | Value ($) |
| Fidelity Cash Central Fund 5.40% (d) | | 17,208,109 | 17,211,551 |
| Fidelity Securities Lending Cash Central Fund 5.40% (d)(e) | | 505,749 | 505,800 |
| TOTAL MONEY MARKET FUNDS (Cost $17,717,351) | | | 17,717,351 |
| | | | |
| TOTAL INVESTMENT IN SECURITIES - 99.7% (Cost $946,432,132) | 1,088,911,962 |
NET OTHER ASSETS (LIABILITIES) - 0.3% | 3,430,336 |
| NET ASSETS - 100.0% | 1,092,342,298 |
| | |
Legend
| (c) | Security or a portion of the security is on loan at period end. |
| (d) | Affiliated fund that is generally available only to investment companies and other accounts managed by Fidelity Investments. The rate quoted is the annualized seven-day yield of the fund at period end. A complete unaudited listing of the fund's holdings as of its most recent quarter end is available upon request. In addition, each Fidelity Central Fund's financial statements, which are not covered by the Fund's Report of Independent Registered Public Accounting Firm, are available on the SEC's website or upon request. |
| (e) | Investment made with cash collateral received from securities on loan. |
Affiliated Central Funds
Fiscal year to date information regarding the Fund's investments in Fidelity Central Funds, including the ownership percentage, is presented below.
| Affiliate | Value, beginning of period ($) | Purchases ($) | Sales Proceeds ($) | Dividend Income ($) | Realized Gain (loss) ($) | Change in Unrealized appreciation (depreciation) ($) | Value, end of period ($) | % ownership, end of period |
| Fidelity Cash Central Fund 5.40% | 9,866,092 | 465,925,713 | 458,580,254 | 735,025 | - | - | 17,211,551 | 0.0% |
| Fidelity Securities Lending Cash Central Fund 5.40% | 13,243,268 | 179,237,812 | 191,975,280 | 13,532 | - | - | 505,800 | 0.0% |
| Total | 23,109,360 | 645,163,525 | 650,555,534 | 748,557 | - | - | 17,717,351 | |
| | | | | | | | | |
Amounts in the dividend income column in the above table include any capital gain distributions from underlying funds, which are presented in the corresponding line item in the Statement of Operations, if applicable.
Amounts in the dividend income column for Fidelity Securities Lending Cash Central Fund represents the income earned on investing cash collateral, less rebates paid to borrowers and any lending agent fees associated with the loan, plus any premium payments received for lending certain types of securities.
Amounts included in the purchases and sales proceeds columns may include in-kind transactions, if applicable.
Investment Valuation
The following is a summary of the inputs used, as of October 31, 2023, involving the Fund's assets and liabilities carried at fair value. The inputs or methodology used for valuing securities may not be an indication of the risk associated with investing in those securities. For more information on valuation inputs, and their aggregation into the levels used below, please refer to the Investment Valuation section in the accompanying Notes to Financial Statements.
| Valuation Inputs at Reporting Date: |
| Description | Total ($) | Level 1 ($) | Level 2 ($) | Level 3 ($) |
Investments in Securities: | | | | |
|
| Equities: | | | | |
Consumer Discretionary | 151,795,063 | 86,460,602 | 65,334,461 | - |
Consumer Staples | 56,995,434 | 19,503,502 | 37,491,932 | - |
Financials | 198,668,786 | 112,791,536 | 85,877,250 | - |
Health Care | 88,534,818 | 18,873,670 | 69,661,148 | - |
Industrials | 239,747,751 | 134,405,121 | 105,342,630 | - |
Information Technology | 250,143,031 | 65,977,505 | 184,165,525 | 1 |
Materials | 85,309,728 | 48,101,359 | 37,208,369 | - |
|
| Money Market Funds | 17,717,351 | 17,717,351 | - | - |
| Total Investments in Securities: | 1,088,911,962 | 503,830,646 | 585,081,315 | 1 |
| Statement of Assets and Liabilities |
| | | | October 31, 2023 |
| | | | | |
| Assets | | | | |
| Investment in securities, at value (including securities loaned of $478,617) - See accompanying schedule: | | | | |
Unaffiliated issuers (cost $928,714,781) | $ | 1,071,194,611 | | |
Fidelity Central Funds (cost $17,717,351) | | 17,717,351 | | |
| | | | | |
| | | | | |
| Total Investment in Securities (cost $946,432,132) | | | $ | 1,088,911,962 |
| Foreign currency held at value (cost $343,010) | | | | 342,917 |
| Receivable for investments sold | | | | 7,533,130 |
| Receivable for fund shares sold | | | | 904,117 |
| Dividends receivable | | | | 475,280 |
| Reclaims receivable | | | | 1,028,274 |
| Interest receivable | | | | 3,239 |
| Distributions receivable from Fidelity Central Funds | | | | 116,245 |
| Other receivables | | | | 164,568 |
Total assets | | | | 1,099,479,732 |
| Liabilities | | | | |
| Payable for investments purchased | $ | 3,943,368 | | |
| Payable for fund shares redeemed | | 476,469 | | |
| Accrued management fee | | 584,300 | | |
| Deferred taxes | | 1,625,928 | | |
| Other payables and accrued expenses | | 1,569 | | |
| Collateral on securities loaned | | 505,800 | | |
| Total Liabilities | | | | 7,137,434 |
| Net Assets | | | $ | 1,092,342,298 |
| Net Assets consist of: | | | | |
| Paid in capital | | | $ | 1,011,708,466 |
| Total accumulated earnings (loss) | | | | 80,633,832 |
| Net Assets | | | $ | 1,092,342,298 |
Net Asset Value, offering price and redemption price per share ($1,092,342,298 ÷ 83,717,907 shares) | | | $ | 13.05 |
| Statement of Operations |
| | | | Year ended October 31, 2023 |
| Investment Income | | | | |
| Dividends | | | $ | 13,150,058 |
| Interest | | | | 4,022 |
| Income from Fidelity Central Funds (including $13,532 from security lending) | | | | 748,557 |
| Income before foreign taxes withheld | | | $ | 13,902,637 |
| Less foreign taxes withheld | | | | (1,613,501) |
| Total Income | | | | 12,289,136 |
| Expenses | | | | |
| Management fee | $ | 6,450,454 | | |
| Independent trustees' fees and expenses | | 5,300 | | |
| Interest | | 22,775 | | |
| Total expenses before reductions | | 6,478,529 | | |
| Expense reductions | | (256) | | |
| Total expenses after reductions | | | | 6,478,273 |
| Net Investment income (loss) | | | | 5,810,863 |
| Realized and Unrealized Gain (Loss) | | | | |
| Net realized gain (loss) on: | | | | |
| Investment Securities: | | | | |
| Unaffiliated issuers (net of foreign taxes of $144,611) | | 7,974,414 | | |
| Foreign currency transactions | | (45,350) | | |
| Total net realized gain (loss) | | | | 7,929,064 |
| Change in net unrealized appreciation (depreciation) on: | | | | |
| Investment Securities: | | | | |
| Unaffiliated issuers(net of increase in deferred foreign taxes of $1,421,907) | | 104,099,849 | | |
| Assets and liabilities in foreign currencies | | 72,953 | | |
| Total change in net unrealized appreciation (depreciation) | | | | 104,172,802 |
| Net gain (loss) | | | | 112,101,866 |
| Net increase (decrease) in net assets resulting from operations | | | $ | 117,912,729 |
| Statement of Changes in Net Assets |
| |
| | Year ended October 31, 2023 | | Year ended October 31, 2022 |
| Increase (Decrease) in Net Assets | | | | |
| Operations | | | | |
| Net investment income (loss) | $ | 5,810,863 | $ | 3,648,889 |
| Net realized gain (loss) | | 7,929,064 | | (72,374,973) |
| Change in net unrealized appreciation (depreciation) | | 104,172,802 | | (233,838,244) |
| Net increase (decrease) in net assets resulting from operations | | 117,912,729 | | (302,564,328) |
| Distributions to shareholders | | (3,323,601) | | (75,709,685) |
| | | | | |
| Share transactions | | | | |
| Proceeds from sales of shares | | 427,602,334 | | 376,598,093 |
| Reinvestment of distributions | | 3,323,601 | | 75,709,685 |
| Cost of shares redeemed | | (216,290,497) | | (234,149,001) |
| | | | | |
Net increase (decrease) in net assets resulting from share transactions | | 214,635,438 | | 218,158,777 |
| Total increase (decrease) in net assets | | 329,224,566 | | (160,115,236) |
| | | | | |
| Net Assets | | | | |
| Beginning of period | | 763,117,732 | | 923,232,968 |
| End of period | $ | 1,092,342,298 | $ | 763,117,732 |
| | | | | |
| Other Information | | | | |
| Shares | | | | |
| Sold | | 31,934,138 | | 28,863,775 |
| Issued in reinvestment of distributions | | 258,445 | | 4,794,787 |
| Redeemed | | (16,055,471) | | (17,893,097) |
| Net increase (decrease) | | 16,137,112 | | 15,765,465 |
| | | | | |
Financial Highlights
| Fidelity® International Capital Appreciation K6 Fund |
| |
| Years ended October 31, | | 2023 | | 2022 | | 2021 | | 2020 | | 2019 |
Selected Per-Share Data | | | | | | | | | | |
| Net asset value, beginning of period | $ | 11.29 | $ | 17.82 | $ | 13.99 | $ | 12.40 | $ | 10.17 |
| Income from Investment Operations | | | | | | | | | | |
Net investment income (loss) A,B | | .08 | | .06 | | .05 | | .08 | | .13 C |
| Net realized and unrealized gain (loss) | | 1.73 | | (5.14) | | 3.85 | | 1.62 | | 2.18 |
| Total from investment operations | | 1.81 | | (5.08) | | 3.90 | | 1.70 | | 2.31 |
| Distributions from net investment income | | (.05) | | (.04) | | (.07) | | (.11) | | (.08) |
| Distributions from net realized gain | | - | | (1.41) | | - | | - | | - |
| Total distributions | | (.05) | | (1.45) | | (.07) | | (.11) | | (.08) |
| Net asset value, end of period | $ | 13.05 | $ | 11.29 | $ | 17.82 | $ | 13.99 | $ | 12.40 |
Total Return D | | 16.02% | | (30.83)% | | 27.93% | | 13.82% | | 22.90% |
Ratios to Average Net Assets B,E,F | | | | | | | | | | |
| Expenses before reductions | | .65% | | .65% | | .65% | | .65% | | .65% |
| Expenses net of fee waivers, if any | | .65% | | .65% | | .65% | | .65% | | .65% |
| Expenses net of all reductions | | .65% | | .65% | | .65% | | .61% | | .63% |
| Net investment income (loss) | | .59% | | .44% | | .29% | | .62% | | 1.16% C |
| Supplemental Data | | | | | | | | | | |
| Net assets, end of period (000 omitted) | $ | 1,092,342 | $ | 763,118 | $ | 923,233 | $ | 760,960 | $ | 524,353 |
Portfolio turnover rate G | | 78% | | 119% H | | 149% | | 138% | | 144% H |
ACalculated based on average shares outstanding during the period.
BNet investment income (loss) is affected by the timing of the declaration of dividends by any underlying mutual funds or exchange-traded funds (ETFs). Net investment income (loss) of any mutual funds or ETFs is not included in the Fund's net investment income (loss) ratio.
CNet investment income per share reflects one or more large, non-recurring dividend(s) which amounted to $.05 per share. Excluding such non-recurring dividend(s), the ratio of net investment income (loss) to average net assets would have been .75%.
DTotal returns would have been lower if certain expenses had not been reduced during the applicable periods shown.
EFees and expenses of any underlying mutual funds or exchange-traded funds (ETFs) are not included in the Fund's expense ratio. The Fund indirectly bears its proportionate share of these expenses. For additional expense information related to investments in Fidelity Central Funds, please refer to the "Investments in Fidelity Central Funds" note found in the Notes to Financial Statements section of the most recent Annual or Semi-Annual report.
FExpense ratios reflect operating expenses of the class. Expenses before reductions do not reflect amounts reimbursed, waived, or reduced through arrangements with the investment adviser, brokerage services, or other offset arrangements, if applicable, and do not represent the amount paid by the class during periods when reimbursements, waivers or reductions occur.
GAmount does not include the portfolio activity of any underlying mutual funds or exchange-traded funds (ETFs).
HPortfolio turnover rate excludes securities received or delivered in-kind.
For the period ended October 31, 2023
1. Organization.
Fidelity International Capital Appreciation K6 Fund (the Fund) is a fund of Fidelity Investment Trust (the Trust) and is authorized to issue an unlimited number of shares. Share transactions on the Statement of Changes in Net Assets may contain exchanges between affiliated funds. The Trust is registered under the Investment Company Act of 1940, as amended (the 1940 Act), as an open-end management investment company organized as a Massachusetts business trust. Shares generally are available only to employer-sponsored retirement plans that are recordkept by Fidelity, or to certain employer-sponsored retirement plans that are not recordkept by Fidelity. The Fund's investments in emerging markets can be subject to social, economic, regulatory, and political uncertainties and can be extremely volatile.
2. Investments in Fidelity Central Funds.
Funds may invest in Fidelity Central Funds, which are open-end investment companies generally available only to other investment companies and accounts managed by the investment adviser and its affiliates. The Schedule of Investments lists any Fidelity Central Funds held as an investment as of period end, but does not include the underlying holdings of each Fidelity Central Fund. An investing fund indirectly bears its proportionate share of the expenses of the underlying Fidelity Central Funds.
Based on its investment objective, each Fidelity Central Fund may invest or participate in various investment vehicles or strategies that are similar to those of the investing fund. These strategies are consistent with the investment objectives of the investing fund and may involve certain economic risks which may cause a decline in value of each of the Fidelity Central Funds and thus a decline in the value of the investing fund.
| Fidelity Central Fund | Investment Manager | Investment Objective | Investment Practices | Expense RatioA |
| Fidelity Money Market Central Funds | Fidelity Management & Research Company LLC (FMR) | Each fund seeks to obtain a high level of current income consistent with the preservation of capital and liquidity. | Short-term Investments | Less than .005% |
A Expenses expressed as a percentage of average net assets and are as of each underlying Central Fund's most recent annual or semi-annual shareholder report.
A complete unaudited list of holdings for each Fidelity Central Fund is available upon request or at the Securities and Exchange Commission website at www.sec.gov. In addition, the financial statements of the Fidelity Central Funds which contain the significant accounting policies (including investment valuation policies) of those funds, and are not covered by the Report of Independent Registered Public Accounting Firm, are available on the Securities and Exchange Commission website or upon request.
3. Significant Accounting Policies.
The Fund is an investment company and applies the accounting and reporting guidance of the Financial Accounting Standards Board (FASB) Accounting Standards Codification Topic 946 Financial Services - Investment Companies. The financial statements have been prepared in conformity with accounting principles generally accepted in the United States of America (GAAP), which require management to make certain estimates and assumptions at the date of the financial statements. Actual results could differ from those estimates. Subsequent events, if any, through the date that the financial statements were issued have been evaluated in the preparation of the financial statements. The Fund's Schedule of Investments lists any underlying mutual funds or exchange-traded funds (ETFs) but does not include the underlying holdings of these funds. The following summarizes the significant accounting policies of the Fund:
Investment Valuation. Investments are valued as of 4:00 p.m. Eastern time on the last calendar day of the period. The Board of Trustees (the Board) has designated the Fund's investment adviser as the valuation designee responsible for the fair valuation function and performing fair value determinations as needed. The investment adviser has established a Fair Value Committee (the Committee) to carry out the day-to-day fair valuation responsibilities and has adopted policies and procedures to govern the fair valuation process and the activities of the Committee. In accordance with these fair valuation policies and procedures, which have been approved by the Board, the Fund attempts to obtain prices from one or more third party pricing services or brokers to value its investments. When current market prices, quotations or currency exchange rates are not readily available or reliable, investments will be fair valued in good faith by the Committee, in accordance with the policies and procedures. Factors used in determining fair value vary by investment type and may include market or investment specific events, transaction data, estimated cash flows, and market observations of comparable investments. The frequency that the fair valuation procedures are used cannot be predicted and they may be utilized to a significant extent. The Committee manages the Fund's fair valuation practices and maintains the fair valuation policies and procedures. The Fund's investment adviser reports to the Board information regarding the fair valuation process and related material matters.
The Fund categorizes the inputs to valuation techniques used to value its investments into a disclosure hierarchy consisting of three levels as shown below:
Level 1 - unadjusted quoted prices in active markets for identical investments
Level 2 - other significant observable inputs (including quoted prices for similar investments, interest rates, prepayment speeds, etc.)
Level 3 - unobservable inputs (including the Fund's own assumptions based on the best information available)
Valuation techniques used to value the Fund's investments by major category are as follows:
Equity securities, including restricted securities, for which market quotations are readily available, are valued at the last reported sale price or official closing price as reported by a third party pricing service on the primary market or exchange on which they are traded and are categorized as Level 1 in the hierarchy. In the event there were no sales during the day or closing prices are not available, securities are valued at the last quoted bid price or may be valued using the last available price and are generally categorized as Level 2 in the hierarchy. For foreign equity securities, when market or security specific events arise, comparisons to the valuation of American Depositary Receipts (ADRs), futures contracts, Exchange-Traded Funds (ETFs) and certain indexes as well as quoted prices for similar securities may be used and would be categorized as Level 2 in the hierarchy. For equity securities, including restricted securities, where observable inputs are limited, assumptions about market activity and risk are used and these securities may be categorized as Level 3 in the hierarchy.
Investments in open-end mutual funds, including the Fidelity Central Funds, are valued at their closing net asset value (NAV) each business day and are categorized as Level 1 in the hierarchy.
Changes in valuation techniques may result in transfers in or out of an assigned level within the disclosure hierarchy. The aggregate value of investments by input level as of October 31, 2023 is included at the end of the Fund's Schedule of Investments.
Foreign Currency. Certain Funds may use foreign currency contracts to facilitate transactions in foreign-denominated securities. Gains and losses from these transactions may arise from changes in the value of the foreign currency or if the counterparties do not perform under the contracts' terms.
Foreign-denominated assets, including investment securities, and liabilities are translated into U.S. dollars at the exchange rates at period end. Purchases and sales of investment securities, income and dividends received, and expenses denominated in foreign currencies are translated into U.S. dollars at the exchange rate in effect on the transaction date.
The effects of exchange rate fluctuations on investments are included with the net realized and unrealized gain (loss) on investment securities. Other foreign currency transactions resulting in realized and unrealized gain (loss) are disclosed separately.
Investment Transactions and Income. For financial reporting purposes, the Fund's investment holdings and NAV include trades executed through the end of the last business day of the period. The NAV per share for processing shareholder transactions is calculated as of the close of business of the New York Stock Exchange (NYSE), normally 4:00 p.m. Eastern time and includes trades executed through the end of the prior business day. Gains and losses on securities sold are determined on the basis of identified cost and include proceeds received from litigation. Commissions paid to certain brokers with whom the investment adviser, or its affiliates, places trades on behalf of a fund include an amount in addition to trade execution, which may be rebated back to a fund. Any such rebates are included in net realized gain (loss) on investments in the Statement of Operations. Dividend income is recorded on the ex-dividend date, except for certain dividends from foreign securities where the ex-dividend date may have passed, which are recorded as soon as the Fund is informed of the ex-dividend date. Non-cash dividends included in dividend income, if any, are recorded at the fair market value of the securities received. Income and capital gain distributions from Fidelity Central Funds, if any, are recorded on the ex-dividend date. Certain distributions received by the Fund represent a return of capital or capital gain. The Fund determines the components of these distributions subsequent to the ex-dividend date, based upon receipt of tax filings or other correspondence relating to the underlying investment. These distributions are recorded as a reduction of cost of investments and/or as a realized gain. Interest income is accrued as earned and includes coupon interest and amortization of premium and accretion of discount on debt securities as applicable. Investment income is recorded net of foreign taxes withheld where recovery of such taxes is uncertain. Funds may file withholding tax reclaims in certain jurisdictions to recover a portion of amounts previously withheld. Any withholding tax reclaims income is included in the Statement of Operations in foreign taxes withheld. Any receivables for withholding tax reclaims are included in the Statement of Assets and Liabilities in reclaims receivable.
Expenses. Expenses directly attributable to a fund are charged to that fund. Expenses attributable to more than one fund are allocated among the respective funds on the basis of relative net assets or other appropriate methods. Expenses included in the accompanying financial statements reflect the expenses of that fund and do not include any expenses associated with any underlying mutual funds or exchange-traded funds. Although not included in a fund's expenses, a fund indirectly bears its proportionate share of these expenses through the net asset value of each underlying mutual fund or exchange-traded fund. Expense estimates are accrued in the period to which they relate and adjustments are made when actual amounts are known.
Income Tax Information and Distributions to Shareholders. Each year, the Fund intends to qualify as a regulated investment company under Subchapter M of the Internal Revenue Code, including distributing substantially all of its taxable income and realized gains. As a result, no provision for U.S. Federal income taxes is required. As of October 31, 2023, the Fund did not have any unrecognized tax benefits in the financial statements; nor is the Fund aware of any tax positions for which it is reasonably possible that the total amounts of unrecognized tax benefits will significantly change in the next twelve months. The Fund files a U.S. federal tax return, in addition to state and local tax returns as required. The Fund's federal income tax returns are subject to examination by the Internal Revenue Service (IRS) for a period of three fiscal years after they are filed. State and local tax returns may be subject to examination for an additional fiscal year depending on the jurisdiction. Foreign taxes are provided for based on the Fund's understanding of the tax rules and rates that exist in the foreign markets in which it invests. The Fund is subject to a tax imposed on capital gains by certain countries in which it invests. An estimated deferred tax liability for net unrealized appreciation on the applicable securities is included in Deferred taxes on the Statement of Assets & Liabilities.
Distributions are declared and recorded on the ex-dividend date. Income and capital gain distributions are determined in accordance with income tax regulations, which may differ from GAAP.
Capital accounts within the financial statements are adjusted for permanent book-tax differences. These adjustments have no impact on net assets or the results of operations. Capital accounts are not adjusted for temporary book-tax differences which will reverse in a subsequent period.
Book-tax differences are primarily due to foreign currency transactions, certain foreign taxes, capital loss carryforwards, and losses deferred due to wash sales.
As of period end, the cost and unrealized appreciation (depreciation) in securities, and derivatives if applicable, for federal income tax purposes were as follows:
| Gross unrealized appreciation | $165,992,610 |
| Gross unrealized depreciation | (27,626,239) |
| Net unrealized appreciation (depreciation) | $138,366,371 |
| Tax Cost | $950,545,591 |
The tax-based components of distributable earnings as of period end were as follows:
| Undistributed ordinary income | $5,496,384 |
| Capital loss carryforward | $(61,559,404) |
| Net unrealized appreciation (depreciation) on securities and other investments | $138,322,151 |
Capital loss carryforwards are only available to offset future capital gains of the Fund to the extent provided by regulations and may be limited. The capital loss carryforward information presented below, including any applicable limitation, is estimated as of fiscal period end and is subject to adjustment.
| Short-term | $(61,559,404) |
| Total capital loss carryforward | $(61,559,404) |
The tax character of distributions paid was as follows:
| | October 31, 2023 | October 31, 2022 |
| Ordinary Income | $3,323,601 | $25,306,280 |
| Long-term Capital Gains | - | 50,403,405 |
| Total | $3,323,601 | $75,709,685 |
4. Purchases and Sales of Investments.
Purchases and sales of securities, other than short-term securities and in-kind transactions, as applicable, are noted in the table below.
| | Purchases ($) | Sales ($) |
| Fidelity International Capital Appreciation K6 Fund | 967,894,267 | 763,368,771 |
Prior Year Unaffiliated Exchanges In-Kind. Shares that were exchanged for investments, including accrued interest and cash, if any, are shown in the table below. The amount of in-kind exchanges is included in share transactions in the accompanying Statement of Changes in Net Assets.
| | Shares | Total Proceeds ($) |
| Fidelity International Capital Appreciation K6 Fund | 6,790,346 | 84,381,011 |
5. Fees and Other Transactions with Affiliates.
Management Fee. Fidelity Management & Research Company LLC (the investment adviser) and its affiliates provide the Fund with investment management related services for which the Fund pays a monthly management fee that is based on an annual rate of .65% of average net assets. Under the management contract, the investment adviser or an affiliate pays all other expenses of the Fund, excluding fees and expenses of the independent Trustees, and certain miscellaneous expenses such as proxy and shareholder meeting expenses.
Brokerage Commissions. A portion of portfolio transactions were placed with brokerage firms which are affiliates of the investment adviser. Brokerage commissions are included in net realized gain (loss) and change in net unrealized appreciation (depreciation) in the Statement of Operations. The commissions paid to these affiliated firms were as follows:
| | Amount |
| Fidelity International Capital Appreciation K6 Fund | $987 |
Interfund Lending Program. Pursuant to an Exemptive Order issued by the Securities and Exchange Commission (the SEC), the Fund, along with other registered investment companies having management contracts with Fidelity Management & Research Company LLC (FMR), or other affiliated entities of FMR, may participate in an interfund lending program. This program provides an alternative credit facility allowing the Fund to borrow from, or lend money to, other participating affiliated funds. At period end, there were no interfund loans outstanding. Activity in this program during the period for which loans were outstanding was as follows:
| | Borrower or Lender | Average Loan Balance | Weighted Average Interest Rate | Interest Expense |
Fidelity International Capital Appreciation K6 Fund | Borrower | $7,746,636 | 4.81% | $22,775 |
Interfund Trades. Funds may purchase from or sell securities to other Fidelity Funds under procedures adopted by the Board. The procedures have been designed to ensure these interfund trades are executed in accordance with Rule 17a-7 of the 1940 Act. Any interfund trades are included within the respective purchases and sales amounts shown in the Purchases and Sales of Investments note. Interfund trades during the period are noted in the table below.
| | Purchases ($) | Sales ($) | Realized Gain (Loss) ($) |
| Fidelity International Capital Appreciation K6 Fund | 77,884,580 | 31,369,621 | (578,135) |
6. Committed Line of Credit.
Certain Funds participate with other funds managed by the investment adviser or an affiliate in a $4.25 billion credit facility (the "line of credit") to be utilized for temporary or emergency purposes to fund shareholder redemptions or for other short-term liquidity purposes. The commitment fees on the pro-rata portion of the line of credit are borne by the investment adviser. During the period, there were no borrowings on this line of credit.
7. Security Lending.
Funds lend portfolio securities from time to time in order to earn additional income. Lending agents are used, including National Financial Services (NFS), an affiliate of the investment adviser. Pursuant to a securities lending agreement, NFS will receive a fee, which is capped at 9.9% of a fund's daily lending revenue, for its services as lending agent. A fund may lend securities to certain qualified borrowers, including NFS. On the settlement date of the loan, a fund receives collateral (in the form of U.S. Treasury obligations, letters of credit and/or cash) against the loaned securities and maintains collateral in an amount not less than 100% of the market value of the loaned securities during the period of the loan. The market value of the loaned securities is determined at the close of business of a fund and any additional required collateral is delivered to a fund on the next business day. A fund or borrower may terminate the loan at any time, and if the borrower defaults on its obligation to return the securities loaned because of insolvency or other reasons, a fund may apply collateral received from the borrower against the obligation. A fund may experience delays and costs in recovering the securities loaned. Any cash collateral received is invested in the Fidelity Securities Lending Cash Central Fund. Any loaned securities are identified as such in the Schedule of Investments, and the value of loaned securities and cash collateral at period end, as applicable, are presented in the Statement of Assets and Liabilities. Security lending income represents the income earned on investing cash collateral, less rebates paid to borrowers and any lending agent fees associated with the loan, plus any premium payments received for lending certain types of securities. Security lending income is presented in the Statement of Operations as a component of income from Fidelity Central Funds. Affiliated security lending activity, if any, was as follows:
| | Total Security Lending Fees Paid to NFS | Security Lending Income From Securities Loaned to NFS | Value of Securities Loaned to NFS at Period End |
| Fidelity International Capital Appreciation K6 Fund | $1,447 | $- | $- |
8. Expense Reductions.
Through arrangements with the Fund's custodian, credits realized as a result of certain uninvested cash balances were used to reduce the Fund's expenses by $256.
9. Other.
A fund's organizational documents provide former and current trustees and officers with a limited indemnification against liabilities arising in connection with the performance of their duties to the fund. In the normal course of business, a fund may also enter into contracts that provide general indemnifications. A fund's maximum exposure under these arrangements is unknown as this would be dependent on future claims that may be made against a fund. The risk of material loss from such claims is considered remote.
10. Risk and Uncertainties.
Many factors affect a fund's performance. Developments that disrupt global economies and financial markets, such as pandemics, epidemics, outbreaks of infectious diseases, war, terrorism, and environmental disasters, may significantly affect a fund's investment performance. The effects of these developments to a fund will be impacted by the types of securities in which a fund invests, the financial condition, industry, economic sector, and geographic location of an issuer, and a fund's level of investment in the securities of that issuer. Significant concentrations in security types, issuers, industries, sectors, and geographic locations may magnify the factors that affect a fund's performance.
To the Board of Trustees of Fidelity Investment Trust and the Shareholders of Fidelity International Capital Appreciation K6 Fund:
Opinion on the Financial Statements and Financial Highlights
We have audited the accompanying statement of assets and liabilities of Fidelity International Capital Appreciation K6 Fund (the "Fund"), a fund of Fidelity Investment Trust, including the schedule of investments, as of October 31, 2023, the related statement of operations for the year then ended, the statement of changes in net assets for each of the two years in the period then ended, the financial highlights for each of the five years in the period then ended, and the related notes. In our opinion, the financial statements and financial highlights present fairly, in all material respects, the financial position of the Fund as of October 31, 2023, and the results of its operations for the year then ended, the changes in its net assets for each of the two years in the period then ended, and the financial highlights for each of the five years in the period then ended in conformity with accounting principles generally accepted in the United States of America.
Basis for Opinion
These financial statements and financial highlights are the responsibility of the Fund's management. Our responsibility is to express an opinion on the Fund's financial statements and financial highlights based on our audits. We are a public accounting firm registered with the Public Company Accounting Oversight Board (United States) (PCAOB) and are required to be independent with respect to the Fund in accordance with the U.S. federal securities laws and the applicable rules and regulations of the Securities and Exchange Commission and the PCAOB.
We conducted our audits in accordance with the standards of the PCAOB. Those standards require that we plan and perform the audit to obtain reasonable assurance about whether the financial statements and financial highlights are free of material misstatement, whether due to error or fraud. The Fund is not required to have, nor were we engaged to perform, an audit of its internal control over financial reporting. As part of our audits we are required to obtain an understanding of internal control over financial reporting but not for the purpose of expressing an opinion on the effectiveness of the Fund's internal control over financial reporting. Accordingly, we express no such opinion.
Our audits included performing procedures to assess the risks of material misstatement of the financial statements and financial highlights, whether due to error or fraud, and performing procedures that respond to those risks. Such procedures included examining, on a test basis, evidence regarding the amounts and disclosures in the financial statements and financial highlights. Our audits also included evaluating the accounting principles used and significant estimates made by management, as well as evaluating the overall presentation of the financial statements and financial highlights. Our procedures included confirmation of securities owned as of October 31, 2023, by correspondence with the custodian and brokers; when replies were not received from brokers, we performed other auditing procedures. We believe that our audits provide a reasonable basis for our opinion.
/s/ Deloitte & Touche LLP
Boston, Massachusetts
December 13, 2023
We have served as the auditor of one or more of the Fidelity investment companies since 1999.
The Trustees, Members of the Advisory Board (if any), and officers of the trust and fund, as applicable, are listed below. The Board of Trustees governs the fund and is responsible for protecting the interests of shareholders. The Trustees are experienced executives who meet periodically throughout the year to oversee the fund's activities, review contractual arrangements with companies that provide services to the fund, oversee management of the risks associated with such activities and contractual arrangements, and review the fund's performance. Except for Jonathan Chiel, each of the Trustees oversees 322 funds. Mr. Chiel oversees 191 funds.
The Trustees hold office without limit in time except that (a) any Trustee may resign; (b) any Trustee may be removed by written instrument, signed by at least two-thirds of the number of Trustees prior to such removal; (c) any Trustee who requests to be retired or who has become incapacitated by illness or injury may be retired by written instrument signed by a majority of the other Trustees; and (d) any Trustee may be removed at any special meeting of shareholders by a two-thirds vote of the outstanding voting securities of the trust. Each Trustee who is not an interested person (as defined in the 1940 Act) of the trust and the fund is referred to herein as an Independent Trustee. Each Independent Trustee shall retire not later than the last day of the calendar year in which his or her 75th birthday occurs. The Independent Trustees may waive this mandatory retirement age policy with respect to individual Trustees. Officers and Advisory Board Members hold office without limit in time, except that any officer or Advisory Board Member may resign or may be removed by a vote of a majority of the Trustees at any regular meeting or any special meeting of the Trustees. Except as indicated, each individual has held the office shown or other offices in the same company for the past five years.
The fund's Statement of Additional Information (SAI) includes more information about the Trustees. To request a free copy, call Fidelity at 1-800-835-5092.
Experience, Skills, Attributes, and Qualifications of the Trustees. The Governance and Nominating Committee has adopted a statement of policy that describes the experience, qualifications, attributes, and skills that are necessary and desirable for potential Independent Trustee candidates (Statement of Policy). The Board believes that each Trustee satisfied at the time he or she was initially elected or appointed a Trustee, and continues to satisfy, the standards contemplated by the Statement of Policy. The Governance and Nominating Committee also engages professional search firms to help identify potential Independent Trustee candidates who have the experience, qualifications, attributes, and skills consistent with the Statement of Policy. From time to time, additional criteria based on the composition and skills of the current Independent Trustees, as well as experience or skills that may be appropriate in light of future changes to board composition, business conditions, and regulatory or other developments, have also been considered by the professional search firms and the Governance and Nominating Committee. In addition, the Board takes into account the Trustees' commitment and participation in Board and committee meetings, as well as their leadership of standing and ad hoc committees throughout their tenure.
In determining that a particular Trustee was and continues to be qualified to serve as a Trustee, the Board has considered a variety of criteria, none of which, in isolation, was controlling. The Board believes that, collectively, the Trustees have balanced and diverse experience, qualifications, attributes, and skills, which allow the Board to operate effectively in governing the fund and protecting the interests of shareholders. Information about the specific experience, skills, attributes, and qualifications of each Trustee, which in each case led to the Board's conclusion that the Trustee should serve (or continue to serve) as a trustee of the fund, is provided below.
Board Structure and Oversight Function. Robert A. Lawrence is an interested person and currently serves as Chair. The Trustees have determined that an interested Chair is appropriate and benefits shareholders because an interested Chair has a personal and professional stake in the quality and continuity of services provided to the fund. Independent Trustees exercise their informed business judgment to appoint an individual of their choosing to serve as Chair, regardless of whether the Trustee happens to be independent or a member of management. The Independent Trustees have determined that they can act independently and effectively without having an Independent Trustee serve as Chair and that a key structural component for assuring that they are in a position to do so is for the Independent Trustees to constitute a substantial majority for the Board. The Independent Trustees also regularly meet in executive session. David M. Thomas serves as Lead Independent Trustee and as such (i) acts as a liaison between the Independent Trustees and management with respect to matters important to the Independent Trustees and (ii) with management prepares agendas for Board meetings.
Fidelity® funds are overseen by different Boards of Trustees. The fund's Board oversees Fidelity's high income and certain equity funds, and other Boards oversee Fidelity's alternative investment, investment-grade bond, money market, asset allocation, and other equity funds. The asset allocation funds may invest in Fidelity® funds overseen by the fund's Board. The use of separate Boards, each with its own committee structure, allows the Trustees of each group of Fidelity® funds to focus on the unique issues of the funds they oversee, including common research, investment, and operational issues. On occasion, the separate Boards establish joint committees to address issues of overlapping consequences for the Fidelity® funds overseen by each Board.
The Trustees operate using a system of committees to facilitate the timely and efficient consideration of all matters of importance to the Trustees, the fund, and fund shareholders and to facilitate compliance with legal and regulatory requirements and oversight of the fund's activities and associated risks. The Board, acting through its committees, has charged FMR and its affiliates with (i) identifying events or circumstances the occurrence of which could have demonstrably adverse effects on the fund's business and/or reputation; (ii) implementing processes and controls to lessen the possibility that such events or circumstances occur or to mitigate the effects of such events or circumstances if they do occur; and (iii) creating and maintaining a system designed to evaluate continuously business and market conditions in order to facilitate the identification and implementation processes described in (i) and (ii) above. Because the day-to-day operations and activities of the fund are carried out by or through FMR, its affiliates, and other service providers, the fund's exposure to risks is mitigated but not eliminated by the processes overseen by the Trustees. While each of the Board's committees has responsibility for overseeing different aspects of the fund's activities, oversight is exercised primarily through the Operations, Audit, and Compliance Committees. Appropriate personnel, including but not limited to the fund's Chief Compliance Officer (CCO), FMR's internal auditor, the independent accountants, the fund's Treasurer and portfolio management personnel, make periodic reports to the Board's committees, as appropriate, including an annual review of Fidelity's risk management program for the Fidelity® funds. The responsibilities of each standing committee, including their oversight responsibilities, are described further under "Standing Committees of the Trustees."
Interested Trustees*:
Correspondence intended for a Trustee who is an interested person may be sent to Fidelity Investments, 245 Summer Street, Boston, Massachusetts 02210.
Name, Year of Birth; Principal Occupations and Other Relevant Experience+
Jonathan Chiel (1957)
Year of Election or Appointment: 2016
Trustee
Mr. Chiel also serves as Trustee of other Fidelity® funds. Mr. Chiel is General Counsel (2012-present) and Head of Legal, Risk and Compliance (2022-present). Mr Chiel serves as Executive Vice President and General Counsel for FMR LLC (diversified financial services company, 2012-present) and Director and President for OH Company LLC (holding company, 2018-present). Previously, Mr. Chiel served as general counsel (2004-2012) and senior vice president and deputy general counsel (2000-2004) for John Hancock Financial Services; a partner with Choate, Hall & Stewart (1996-2000) (law firm); and an Assistant United States Attorney for the United States Attorney's Office of the District of Massachusetts (1986-95), including Chief of the Criminal Division (1993-1995). Mr. Chiel is a director on the boards of the Boston Bar Foundation and the Maimonides School.
Bettina Doulton (1964)
Year of Election or Appointment: 2021
Trustee
Ms. Doulton also serves as Trustee of other Fidelity® funds. Prior to her retirement, Ms. Doulton served in a variety of positions at Fidelity Investments, including as a managing director of research (2006-2007), portfolio manager to certain Fidelity® funds (1993-2005), equity analyst and portfolio assistant (1990-1993), and research assistant (1987-1990). Ms. Doulton currently owns and operates Phi Builders + Architects and Cellardoor Winery. Previously, Ms. Doulton served as a member of the Board of Brown Capital Management, LLC (2014-2018).
Robert A. Lawrence (1952)
Year of Election or Appointment: 2020
Trustee
Chair of the Board of Trustees
Mr. Lawrence also serves as Trustee of other funds. Previously, Mr. Lawrence served as a Trustee and Member of the Advisory Board of certain funds. Prior to his retirement in 2008, Mr. Lawrence served as Vice President of certain Fidelity® funds (2006-2008), Senior Vice President, Head of High Income Division of Fidelity Management & Research Company (investment adviser firm, 2006-2008), and President of Fidelity Strategic Investments (investment adviser firm, 2002-2005).
* Determined to be an "Interested Trustee" by virtue of, among other things, his or her affiliation with the trust or various entities under common control with FMR.
+ The information includes the Trustee's principal occupation during the last five years and other information relating to the experience, attributes, and skills relevant to the Trustee's qualifications to serve as a Trustee, which led to the conclusion that the Trustee should serve as a Trustee for the fund.
Independent Trustees:
Correspondence intended for an Independent Trustee may be sent to Fidelity Investments, P.O. Box 55235, Boston, Massachusetts 02205-5235.
Name, Year of Birth; Principal Occupations and Other Relevant Experience+
Thomas P. Bostick (1956)
Year of Election or Appointment: 2021
Trustee
Lieutenant General Bostick also serves as Trustee of other Fidelity® funds. Prior to his retirement, General Bostick (United States Army, Retired) held a variety of positions within the U.S. Army, including Commanding General and Chief of Engineers, U.S. Army Corps of Engineers (2012-2016) and Deputy Chief of Staff and Director of Human Resources, U.S. Army (2009-2012). General Bostick currently serves as a member of the Board and Finance and Governance & Sustainability Committees of CSX Corporation (transportation, 2020-present) and a member of the Board and Corporate Governance and Nominating Committee of Perma-Fix Environmental Services, Inc. (nuclear waste management, 2020-present). General Bostick serves as Chief Executive Officer of Bostick Global Strategies, LLC (consulting, 2016-present), as a member of the Board of HireVue, Inc. (video interview and assessment, 2020-present), as a member of the Board of Allonnia (biotechnology and engineering solutions, 2022-present) and on the Advisory Board of Solugen, Inc. (specialty bio-based chemicals manufacturer, 2022-present). Previously, General Bostick served as a Member of the Advisory Board of certain Fidelity® funds (2021), President, Intrexon Bioengineering (2018-2020) and Chief Operating Officer (2017-2020) and Senior Vice President of the Environment Sector (2016-2017) of Intrexon Corporation (biopharmaceutical company).
Dennis J. Dirks (1948)
Year of Election or Appointment: 2005
Trustee
Mr. Dirks also serves as Trustee of other Fidelity® funds. Prior to his retirement in May 2003, Mr. Dirks served as Chief Operating Officer and as a member of the Board of The Depository Trust & Clearing Corporation (financial markets infrastructure), President, Chief Operating Officer and a member of the Board of The Depository Trust Company (DTC), President and a member of the Board of the National Securities Clearing Corporation (NSCC), Chief Executive Officer and a member of the Board of the Government Securities Clearing Corporation and Chief Executive Officer and a member of the Board of the Mortgage-Backed Securities Clearing Corporation. Mr. Dirks currently serves as a member of the Finance Committee (2016-present) and Board (2017-present) and is Treasurer (2018-present) of the Asolo Repertory Theatre.
Donald F. Donahue (1950)
Year of Election or Appointment: 2018
Trustee
Mr. Donahue also serves as Trustee of other Fidelity® funds. Mr. Donahue serves as President and Chief Executive Officer of Miranda Partners, LLC (risk consulting for the financial services industry, 2012-present). Previously, Mr. Donahue served as Chief Executive Officer (2006-2012), Chief Operating Officer (2003-2006) and Managing Director, Customer Marketing and Development (1999-2003) of The Depository Trust & Clearing Corporation (financial markets infrastructure). Mr. Donahue currently serves as a member (2007-present) and Co-Chairman (2016-present) of the Board of United Way of New York. Mr. Donahue previously served as a member of the Advisory Board of certain Fidelity® funds (2015-2018) and as a member of the Board of The Leadership Academy (previously NYC Leadership Academy) (2012-2022).
Vicki L. Fuller (1957)
Year of Election or Appointment: 2020
Trustee
Ms. Fuller also serves as Trustee of other Fidelity® funds. Previously, Ms. Fuller served as a member of the Advisory Board of certain Fidelity® funds (2018-2020), Chief Investment Officer of the New York State Common Retirement Fund (2012-2018) and held a variety of positions at AllianceBernstein L.P. (global asset management, 1985-2012), including Managing Director (2006-2012) and Senior Vice President and Senior Portfolio Manager (2001-2006). Ms. Fuller currently serves as a member of the Board, Audit Committee and Nominating and Governance Committee of two Blackstone business development companies (2020-present), as a member of the Board of Treliant, LLC (consulting, 2019-present), as a member of the Board of Ariel Alternatives, LLC (private equity, 2022-present) and as a member of the Board and Chair of the Audit Committee of Gusto, Inc. (software, 2021-present). In addition, Ms. Fuller currently serves as a member of the Board of Roosevelt University (2019-present) and as a member of the Executive Board of New York University's Stern School of Business. Ms. Fuller previously served as a member of the Board, Audit Committee and Nominating and Governance Committee of The Williams Companies, Inc. (natural gas infrastructure, 2018-2021).
Patricia L. Kampling (1959)
Year of Election or Appointment: 2020
Trustee
Ms. Kampling also serves as Trustee of other Fidelity® funds. Prior to her retirement, Ms. Kampling served as Chairman of the Board and Chief Executive Officer (2012-2019), President and Chief Operating Officer (2011-2012) and Executive Vice President and Chief Financial Officer (2010-2011) of Alliant Energy Corporation. Ms. Kampling currently serves as a member of the Board, Finance Committee and Governance, Compensation and Nominating Committee of Xcel Energy Inc. (utilities company, 2020-present) and as a member of the Board, Audit, Finance and Risk Committee and Safety, Environmental, Technology and Operations Committee and Chair of the Executive Development and Compensation Committee of American Water Works Company, Inc. (utilities company, 2019-present). In addition, Ms. Kampling currently serves as a member of the Board of the Nature Conservancy, Wisconsin Chapter (2019-present). Previously, Ms. Kampling served as a Member of the Advisory Board of certain Fidelity® funds (2020), a member of the Board, Compensation Committee and Executive Committee and Chair of the Audit Committee of Briggs & Stratton Corporation (manufacturing, 2011-2021), a member of the Board of Interstate Power and Light Company (2012-2019) and Wisconsin Power and Light Company (2012-2019) (each a subsidiary of Alliant Energy Corporation) and as a member of the Board and Workforce Development Committee of the Business Roundtable (2018-2019).
Thomas A. Kennedy (1955)
Year of Election or Appointment: 2021
Trustee
Mr. Kennedy also serves as Trustee of other Fidelity® funds. Previously, Mr. Kennedy served as a Member of the Advisory Board of certain Fidelity® funds (2020) and held a variety of positions at Raytheon Company (aerospace and defense, 1983-2020), including Chairman and Chief Executive Officer (2014-2020) and Executive Vice President and Chief Operating Officer (2013-2014). Mr. Kennedy served as Executive Chairman of the Board of Directors of Raytheon Technologies Corporation (aerospace and defense, 2020-2021). Mr. Kennedy serves as a Director of the Board of Directors of Textron Inc. (aerospace and defense, 2023-present).
Oscar Munoz (1959)
Year of Election or Appointment: 2021
Trustee
Mr. Munoz also serves as Trustee of other Fidelity® funds. Prior to his retirement, Mr. Munoz served as Executive Chairman (2020-2021), Chief Executive Officer (2015-2020), President (2015-2016) and a member of the Board (2010-2021) of United Airlines Holdings, Inc. Mr. Munoz currently serves as a member of the Board of CBRE Group, Inc. (commercial real estate, 2020-present), a member of the Board of Univision Communications, Inc. (Hispanic media, 2020-present), a member of the Board of Archer Aviation Inc. (2021-present), a member of the Defense Business Board of the United States Department of Defense (2021-present) and a member of the Board of Salesforce.com, Inc. (cloud-based software, 2022-present). Previously, Mr. Munoz served as a Member of the Advisory Board of certain Fidelity® funds (2021).
David M. Thomas (1949)
Year of Election or Appointment: 2008
Trustee
Lead Independent Trustee
Mr. Thomas also serves as Trustee of other Fidelity® funds. Previously, Mr. Thomas served as Executive Chairman (2005-2006) and Chairman and Chief Executive Officer (2000-2005) of IMS Health, Inc. (pharmaceutical and healthcare information solutions). Mr. Thomas currently serves as a member of the Board of Fortune Brands Home and Security (home and security products, 2004-present) and as Director (2013-present) and Non-Executive Chairman of the Board (2022-present) of Interpublic Group of Companies, Inc. (marketing communication).
Susan Tomasky (1953)
Year of Election or Appointment: 2020
Trustee
Ms. Tomasky also serves as Trustee of other Fidelity® funds. Prior to her retirement, Ms. Tomasky served in various executive officer positions at American Electric Power Company, Inc. (1998-2011), including most recently as President of AEP Transmission (2007-2011). Ms. Tomasky currently serves as a member of the Board and Sustainability Committee and as Chair of the Audit Committee of Marathon Petroleum Corporation (2018-present) and as a member of the Board, Executive Committee, Corporate Governance Committee and Organization and Compensation Committee and as Lead Director of the Board of Public Service Enterprise Group, Inc. (utilities company, 2012-present) and as a member of the Board of its subsidiary company, Public Service Electric and Gas Co. (2021-present). In addition, Ms. Tomasky currently serves as a member (2009-present) and President (2020-present) of the Board of the Royal Shakespeare Company - America (2009-present), as a member of the Board of the Columbus Association for the Performing Arts (2011-present) and as a member of the Board and Kenyon in the World Committee of Kenyon College (2016-present). Previously, Ms. Tomasky served as a Member of the Advisory Board of certain Fidelity® funds (2020), as a member of the Board of the Columbus Regional Airport Authority (2007-2020), as a member of the Board (2011-2018) and Lead Independent Director (2015-2018) of Andeavor Corporation (previously Tesoro Corporation) (independent oil refiner and marketer) and as a member of the Board of Summit Midstream Partners LP (energy, 2012-2018).
Michael E. Wiley (1950)
Year of Election or Appointment: 2020
Trustee
Mr. Wiley also serves as Trustee of other Fidelity® funds. Previously, Mr. Wiley served as a member of the Advisory Board of certain Fidelity® funds (2018-2020), Chairman, President and CEO of Baker Hughes, Inc. (oilfield services, 2000-2004). Mr. Wiley also previously served as a member of the Board of Andeavor Corporation (independent oil refiner and marketer, 2005-2018), a member of the Board of Andeavor Logistics LP (natural resources logistics, 2015-2018) and a member of the Board of High Point Resources (exploration and production, 2005-2020).
+ The information includes the Trustee's principal occupation during the last five years and other information relating to the experience, attributes, and skills relevant to the Trustee's qualifications to serve as a Trustee, which led to the conclusion that the Trustee should serve as a Trustee for the fund.
Advisory Board Members and Officers:
Correspondence intended for a Member of the Advisory Board (if any) may be sent to Fidelity Investments, P.O. Box 55235, Boston, Massachusetts 02205-5235. Correspondence intended for an officer or Peter S. Lynch may be sent to Fidelity Investments, 245 Summer Street, Boston, Massachusetts 02210.
Name, Year of Birth; Principal Occupation
Vijay C. Advani (1960)
Year of Election or Appointment: 2023
Member of the Advisory Board
Mr. Advani also serves as Trustee or Member of the Advisory Board of other funds. Previously, Mr. Advani served as Executive Chairman (2020-2022), Chief Executive Officer (2017-2020) and Chief Operating Officer (2016-2017) of Nuveen (global investment manager). He also served in various capacities at Franklin Resources (global investment manager), including Co-President (2015-2016), Executive Vice President, Global Advisory Services (2008-2015), Head of Global Retail Distribution (2005-2008), Executive Managing Director, International Retail Development (2002-2005), Managing Director, Product Developments, Sales & Marketing, Asia, Eastern Europe and Africa (2000-2002) and President, Templeton Asset Management India (1995-2000). Mr. Advani also served as Senior Investment Officer of International Finance Corporation (private equity and venture capital arm of The World Bank, 1984-1995). Mr. Advani is Chairman Emeritus of the U.S. India Business Council (2018-present), a Director of The Global Impact Investing Network (2019-present), a Director of LOK Capital (Mauritius) (2022-present), a member of the Advisory Council of LOK Capital (2022-present), a Senior Advisor of Neuberger Berman (2021-present), a Senior Advisor of Seviora Holdings Pte. Ltd (Temasek-Singapore) (2021-present), a Director of Seviora Capital (Singapore) (2021-present) and an Advisor of EQUIAM (2021-present). Mr. Advani formerly served as a member of the Board of BowX Acquisition Corp. (special purpose acquisition company, 2020-2021), a member of the Board of Intellecap (advisory arm of The Aavishkaar Group, 2018-2020), a member of the Board of Nuveen Investments, Inc. (2017-2020) and a member of the Board of Docusign (software, 2016-2019).
Peter S. Lynch (1944)
Year of Election or Appointment: 2003
Member of the Advisory Board
Mr. Lynch also serves as a Member of the Advisory Board of other Fidelity® funds. Mr. Lynch is Vice Chairman and a Director of Fidelity Management & Research Company LLC (investment adviser firm). In addition, Mr. Lynch serves as a Trustee of Boston College and as the Chairman of the Inner-City Scholarship Fund. Previously, Mr. Lynch served as Vice Chairman and a Director of FMR Co., Inc. (investment adviser firm) and on the Special Olympics International Board of Directors (1997-2006).
Karen B. Peetz (1955)
Year of Election or Appointment: 2023
Member of the Advisory Board
Ms. Peetz also serves as a Member of the Advisory Board of other funds. Previously, Ms. Peetz served as Chief Administration Officer (2020-2023) of Citigroup Inc. (a diversified financial service company). She also served in various capacities at Bank of New York Mellon Corporation, including President (2013-2016), Vice Chairman, Senior Executive Vice President and Chief Executive Officer of Financial Markets & Treasury Services (2010-2013), Senior Executive Vice President and Chief Executive Officer of Global Corporate Trust (2003-2008), Senior Vice President and Division Manager of Global Payments & Trade Services (2002-2003) and Senior Vice President and Division Manager of Domestic Corporate Trust (1998-2002). Ms. Peetz also served in various capacities at Chase Manhattan Corporation (1982-1998), including Senior Vice President and Manager of Corporate Trust International Business (1996-1998), Managing Director and Manager of Corporate Trust Services (1994-1996) and Managing Director and Group Manager of Financial Institution Sales (1990-1993). Ms. Peetz currently serves as Chair of Amherst Holdings Advisory Council (2018-present), Trustee of Johns Hopkins University (2016-present), Chair of the Carey Business School Advisory Council, Member of the Johns Hopkins Medicine Board and Finance Committee and Chair of the Lyme and Tick Related Disease Institute Advisory Council. Ms. Peetz previously served as a member of the Board of Guardian Life Insurance Company of America (2019-2023), a member of the Board of Trane Technologies (2018-2022), a member of the Board of Wells Fargo Corp. (2017-2019), a member of the Board of SunCoke Energy Inc. (2012-2016), a member of the Board of Private Export Funding Corporation (2010-2016) and as a Trustee of Penn State University (2010-2014) and the United Way of New York City (2008-2010).
Heather Bonner (1977)
Year of Election or Appointment: 2023
Assistant Treasurer
Ms. Bonner also serves as an officer of other funds. Ms. Bonner is a Senior Vice President (2022-present) and is an employee of Fidelity Investments (2022-present). Ms. Bonner serves as Vice President, Treasurer, or Assistant Treasurer of certain Fidelity entities. Prior to joining Fidelity, Ms. Bonner served as Managing Director at AQR Capital Management (2013-2022) and was the Treasurer and Principal Financial Officer of the AQR Funds (2013-2022).
Craig S. Brown (1977)
Year of Election or Appointment: 2022
Deputy Treasurer
Mr. Brown also serves as an officer of other funds. Mr. Brown is a Vice President (2015-present) and is an employee of Fidelity Investments. Mr. Brown serves as Assistant Treasurer of FIMM, LLC (2021-present). Previously, Mr. Brown served as Assistant Treasurer of certain Fidelity® funds (2019-2022).
John J. Burke III (1964)
Year of Election or Appointment: 2018
Chief Financial Officer
Mr. Burke also serves as Chief Financial Officer of other funds. Mr. Burke is Head of Fidelity Fund and Investment Operations (2018-present) and is an employee of Fidelity Investments. Mr. Burke serves as President, Executive Vice President, or Director of certain Fidelity entities. Previously Mr. Burke served as head of Asset Management Investment Operations (2012-2018).
Margaret Carey (1973)
Year of Election or Appointment: 2023
Secretary and Chief Legal Officer (CLO)
Ms. Carey also serves as an officer of other funds and as CLO of certain Fidelity entities. Ms. Carey is a Senior Vice President, Deputy General Counsel (2019-present) and is an employee of Fidelity Investments.
William C. Coffey (1969)
Year of Election or Appointment: 2019
Assistant Secretary
Mr. Coffey also serves as Assistant Secretary of other funds. Mr. Coffey is a Senior Vice President, Deputy General Counsel (2010-present) and is an employee of Fidelity Investments. Previously, Mr. Coffey served as Secretary and CLO of certain funds (2018-2019); CLO, Secretary, or Senior Vice President of certain Fidelity entities and Assistant Secretary of certain funds (2009-2018).
Timothy M. Cohen (1969)
Year of Election or Appointment: 2018
Vice President
Mr. Cohen also serves as Vice President of other funds. Mr. Cohen is Co-Head of Equity (2018-present) and is an employee of Fidelity Investments. Mr. Cohen serves a Director of Fidelity Management & Research (Japan) Limited (investment adviser firm, 2016-present). Previously, Mr. Cohen served as Executive Vice President of Fidelity SelectCo, LLC (2019) and Head of Global Equity Research (2016-2018).
Jonathan Davis (1968)
Year of Election or Appointment: 2010
Assistant Treasurer
Mr. Davis also serves as an officer of other funds. Mr. Davis is a Vice President (2006-present) and is an employee of Fidelity Investments. Mr. Davis serves as Assistant Treasurer of certain Fidelity entities.
Laura M. Del Prato (1964)
Year of Election or Appointment: 2018
Assistant Treasurer
Ms. Del Prato also serves as an officer of other funds. Ms. Del Prato is a Senior Vice President (2017-present) and is an employee of Fidelity Investments. Ms. Del Prato serves as Vice President or Assistant Treasurer of certain Fidelity entities. Previously, Ms. Del Prato served as President and Treasurer of The North Carolina Capital Management Trust: Cash Portfolio and Term Portfolio (2018-2020).
Colm A. Hogan (1973)
Year of Election or Appointment: 2020
Assistant Treasurer
Mr. Hogan also serves as an officer of other funds. Mr. Hogan is a Vice President (2016-present) and is an employee of Fidelity Investments. Mr. Hogan serves as Assistant Treasurer of certain Fidelity entities. Previously, Mr. Hogan served as Deputy Treasurer of certain Fidelity® funds (2016-2020) and Assistant Treasurer of certain Fidelity® funds (2016-2018).
Pamela R. Holding (1964)
Year of Election or Appointment: 2018
Vice President
Ms. Holding also serves as Vice President of other funds. Ms. Holding is Co-Head of Equity (2018-present) and is an employee of Fidelity Investments. Previously, Ms. Holding served as Executive Vice President of Fidelity SelectCo, LLC (2019) and as Chief Investment Officer of Fidelity Institutional Asset Management (2013-2018).
Chris Maher (1972)
Year of Election or Appointment: 2020
Deputy Treasurer
Mr. Maher also serves as an officer of other funds. Mr. Maher is a Vice President (2008-present) and is an employee of Fidelity Investments. Mr. Maher serves as Assistant Treasurer of certain Fidelity entities. Previously, Mr. Maher served as Assistant Treasurer of certain funds (2013-2020).
Jason P. Pogorelec (1975)
Year of Election or Appointment: 2020
Chief Compliance Officer
Mr. Pogorelec also serves as Chief Compliance Officer of other funds. Mr. Pogorelec is a Senior Vice President of Asset Management Compliance (2020-present) and is an employee of Fidelity Investments. Mr. Pogorelec serves as Compliance Officer of Fidelity Management & Research Company LLC (investment adviser firm, 2023-present) and Ballyrock Investment Advisors LLC (2023-present). Previously, Mr. Pogorelec served as a Vice President, Associate General Counsel for Fidelity Investments (2010-2020) and Assistant Secretary of certain Fidelity® funds (2015-2020).
Brett Segaloff (1972)
Year of Election or Appointment: 2021
Anti-Money Laundering (AML) Officer
Mr. Segaloff also serves as AML Officer of other funds. Mr. Segaloff is a Vice President (2022-present) and is an employee of Fidelity Investments. Mr. Segaloff serves as Anti Money Laundering Compliance Officer or Anti Money Laundering/Bank Secrecy Act Compliance Officer of certain Fidelity entities.
Stacie M. Smith (1974)
Year of Election or Appointment: 2016
President and Treasurer
Ms. Smith also serves as an officer of other funds. Ms. Smith is a Senior Vice President (2016-present) and is an employee of Fidelity Investments. Ms. Smith serves as Assistant Treasurer of certain Fidelity entities and has served in other fund officer roles.
Jim Wegmann (1979)
Year of Election or Appointment: 2019
Assistant Treasurer
Mr. Wegmann also serves as an officer of other funds. Mr. Wegmann is a Vice President (2016-present) and is an employee of Fidelity Investments. Mr. Wegmann serves as Assistant Treasurer of FIMM, LLC (2021-present). Previously, Mr. Wegmann served as Assistant Treasurer of certain Fidelity® funds (2019-2021).
As a shareholder, you incur two types of costs: (1) transaction costs, which may include sales charges (loads) on purchase payments or redemption proceeds, as applicable and (2) ongoing costs, which generally include management fees, distribution and/or service (12b-1) fees and other Fund expenses. This Example is intended to help you understand your ongoing costs (in dollars) of investing in a fund and to compare these costs with the ongoing costs of investing in other mutual funds.
| The Example is based on an investment of $1,000 invested at the beginning of the period and held for the entire period (May 1, 2023 to October 31, 2023). |
Actual Expenses
The first line of the accompanying table provides information about actual account values and actual expenses. You may use the information in this line, together with the amount you invested, to estimate the expenses that you paid over the period. Simply divide your account value by $1,000.00 (for example, an $8,600 account value divided by $1,000.00 = 8.6), then multiply the result by the number in the first line for a class/Fund under the heading entitled "Expenses Paid During Period" to estimate the expenses you paid on your account during this period. If any fund is a shareholder of any underlying mutual funds or exchange-traded funds (ETFs) (the Underlying Funds), such fund indirectly bears its proportional share of the expenses of the Underlying Funds in addition to the direct expenses incurred presented in the table. These fees and expenses are not included in the annualized expense ratio used to calculate the expense estimate in the table below.
Hypothetical Example for Comparison Purposes
The second line of the accompanying table provides information about hypothetical account values and hypothetical expenses based on the actual expense ratio and an assumed rate of return of 5% per year before expenses, which is not the actual return. The hypothetical account values and expenses may not be used to estimate the actual ending account balance or expenses you paid for the period. You may use this information to compare the ongoing costs of investing in the Fund and other funds. To do so, compare this 5% hypothetical example with the 5% hypothetical examples that appear in the shareholder reports of the other funds. If any fund is a shareholder of any Underlying Funds, such fund indirectly bears its proportional share of the expenses of the Underlying Funds in addition to the direct expenses as presented in the table. These fees and expenses are not included in the annualized expense ratio used to calculate the expense estimate in the table below.
Please note that the expenses shown in the table are meant to highlight your ongoing costs only and do not reflect any transaction costs. Therefore, the second line of the table is useful in comparing ongoing costs only, and will not help you determine the relative total costs of owning different funds. In addition, if these transactional costs were included, your costs would have been higher.
| | | | | Annualized Expense Ratio- A | | Beginning Account Value May 1, 2023 | | Ending Account Value October 31, 2023 | | Expenses Paid During Period- C May 1, 2023 to October 31, 2023 |
| | | | | | | | | | |
| Fidelity® International Capital Appreciation K6 Fund | | | | .65% | | | | | | |
| Actual | | | | | | $ 1,000 | | $ 949.80 | | $ 3.19 |
Hypothetical-B | | | | | | $ 1,000 | | $ 1,021.93 | | $ 3.31 |
| |
A Annualized expense ratio reflects expenses net of applicable fee waivers.
B 5% return per year before expenses
C Expenses are equal to the annualized expense ratio, multiplied by the average account value over the period, multiplied by 184/ 365 (to reflect the one-half year period). The fees and expenses of any Underlying Funds are not included in each annualized expense ratio.
The dividend and capital gains distributions for the fund(s) are available on Fidelity.com or Institutional.Fidelity.com.
The fund designates 14% of the dividends distributed during the fiscal year as qualifying for the dividends-received deduction for corporate shareholders.
The fund designates 99.52% of the dividends distributed during the fiscal year as amounts which may be taken into account as a dividend for the purposes of the maximum rate under section 1(h)(11) of the Internal Revenue Code.
The amounts per share which represent income derived from sources within, and taxes paid to, foreign countries or possessions of the United States are $0.0662 and $0.0182 for the dividend paid December 5, 2022.
The fund will notify shareholders in January 2024 of amounts for use in preparing 2023 income tax returns.
Board Approval of Investment Advisory Contracts and Management Fees
Fidelity International Capital Appreciation K6 Fund
Each year, the Board of Trustees, including the Independent Trustees (together, the Board), considers the renewal of the fund's management contract with Fidelity Management & Research Company LLC (FMR) and the sub-advisory agreements (together, the Advisory Contracts) for the fund. FMR and the sub-advisers are referred to herein as the Investment Advisers. The Board, assisted by the advice of fund counsel and Independent Trustees' counsel, requests and considers a broad range of information relevant to the renewal of the Advisory Contracts throughout the year.
The Board meets regularly and, at each of its meetings, covers an extensive agenda of topics and materials and considers factors that are relevant to its annual consideration of the renewal of the fund's Advisory Contracts, including the services and support provided to the fund and its shareholders. The Board, acting directly and through its Committees (each of which is composed of and chaired by Independent Trustees), requests and receives information concerning the annual consideration of the renewal of the fund's Advisory Contracts. The Board also meets as needed to review matters specifically related to the Board's annual consideration of the renewal of the Advisory Contracts. Members of the Board may also meet with trustees of other Fidelity funds through joint ad hoc committees to discuss certain matters relevant to all of the Fidelity funds.
Approval of Stub Period Continuation. At its May 2023 meeting, the Board of Trustees voted to continue the fund's management contract with FMR, and the sub-advisory agreements and sub-sub-advisory agreements, in each case, where applicable (together, the Advisory Contracts), without modification, for two months from June 1, 2023 through July 31, 2023. The Board considered that the approval of the fund's Advisory Contracts will not result in any changes in (i) the investment process or strategies employed in the management of the fund's assets; (ii) the fees and expenses paid by shareholders; (iii) the nature, extent or quality of services provided under the fund's Advisory Contracts; or (iv) the day-to-day management of the fund or the persons primarily responsible for such management. The Board also considered that since its last approval of the fund's Advisory Contracts, FMR had provided additional information on the fund in support of the annual contract renewal process, including competitive analyses on total expenses and management fees and in-depth reviews of fund performance and fund profitability information. The Board concluded that the fund's Advisory Contracts are fair and reasonable, and that the fund's Advisory Contracts should be renewed, without modification, through July 31, 2023, with the understanding that the Board would consider the annual renewal for a full one year period in July 2023.
At its July 2023 meeting, the Board unanimously determined to renew the fund's Advisory Contracts. In reaching its determination, the Board considered all factors it believed relevant, including (i) the nature, extent, and quality of the services provided to the fund and its shareholders (including the investment performance of the fund); (ii) the competitiveness relative to peer funds of the fund's management fee and total expense ratio; (iii) the total costs of the services provided by and the profits realized by FMR and its affiliates (Fidelity) from its relationships with the fund; and (iv) the extent to which, if any, economies of scale exist and are realized as the fund grows, and whether any economies of scale are appropriately shared with fund shareholders. The Board also considered the broad range of investment choices available to shareholders from FMR's competitors and that the fund's shareholders have chosen to invest in the fund, which is part of the Fidelity family of funds. The Board's decision to renew the Advisory Contracts was not based on any single factor.
The Board reached a determination, with the assistance of fund counsel and Independent Trustees' counsel and through the exercise of its business judgment, that the renewal of the Advisory Contracts was in the best interests of the fund and its shareholders and that the compensation payable under the Advisory Contracts was fair and reasonable in light of all of the surrounding circumstances.
Nature, Extent, and Quality of Services Provided. The Board considered staffing as it relates to the fund, including the backgrounds and experience of investment personnel of the Investment Advisers, and also considered the Investment Advisers' implementation of the fund's investment program. The Independent Trustees also had discussions with senior management of Fidelity's investment operations and investment groups. The Board considered the structure of the investment personnel compensation program and whether this structure provides appropriate incentives to act in the best interests of the fund. Additionally, the Board considered the portfolio managers' investments, if any, in the funds that they manage.
Resources Dedicated to Investment Management and Support Services. The Board and the Fund Oversight and Research Committees reviewed the general qualifications and capabilities of Fidelity's investment staff, including its size, education, experience, and resources, as well as Fidelity's approach to recruiting, training, managing, and compensating investment personnel. The Board noted the resources devoted to expansion of Fidelity's global investment organization, and that Fidelity's analysts have extensive resources, tools, and capabilities that allow them to conduct sophisticated quantitative and fundamental analysis, as well as credit analysis of issuers, counterparties, and guarantors. Further, the Board considered that Fidelity's investment professionals have sufficient access to global information and data so as to provide competitive investment results over time, and that those professionals also have access to sophisticated tools that permit them to assess portfolio construction and risk and performance attribution characteristics continuously, as well as to transmit new information and research conclusions rapidly around the world. Additionally, in its deliberations, the Board considered Fidelity's trading, risk management, compliance, and technology and operations capabilities and resources, which are integral parts of the investment management process.
Shareholder and Administrative Services. The Board considered (i) the nature, extent, quality, and cost of advisory, administrative, and shareholder services performed by the Investment Advisers and their affiliates under the Advisory Contracts and under separate agreements covering transfer agency, pricing and bookkeeping, and securities lending services for the fund; (ii) the nature and extent of Fidelity's supervision of third party service providers, principally custodians, subcustodians, and pricing vendors; and (iii) the resources devoted by Fidelity to, and the record of compliance with, the fund's compliance policies and procedures. The Board also reviewed the allocation of fund brokerage, including allocations to brokers affiliated with the Investment Advisers, the use of brokerage commissions to pay fund expenses, and the use of "soft" commission dollars to pay for research services. The Board also considered the fund's securities lending activities and any payments made to Fidelity relating to securities lending.
The Board noted that the growth of fund assets over time across the complex allows Fidelity to reinvest in the development of services designed to enhance the value and convenience of the Fidelity funds as investment vehicles. These services include 24-hour access to account information and market information over the Internet and through telephone representatives, investor education materials, and asset allocation tools. The Board also considered that it reviews customer service metrics such as telephone response times, continuity of services on the website and metrics addressing services at Fidelity Investor Centers.
Investment in a Large Fund Family. The Board considered the benefits to shareholders of investing in a fund that is part of a large family of funds offering a variety of investment disciplines and providing a large variety of fund investor services. The Board noted that Fidelity had taken, or had made recommendations that resulted in the Fidelity funds taking, a number of actions over the previous year that benefited particular funds and/or the Fidelity funds in general.
Investment Performance. The Board took into account discussions that occur with representatives of the Investment Advisers, and reports that it receives, at Board meetings throughout the year, relating to fund investment performance. In this regard the Board noted that as part of regularly scheduled fund reviews and other reports to the Board on fund performance, the Board considered annualized return information for the fund for different time periods, measured against an appropriate securities market index (benchmark index) and an appropriate peer group of funds with similar objectives (peer group). The Board also considered information about performance attribution. In its ongoing evaluation of fund investment performance, the Board gives particular attention to information indicating changes in performance of the funds over different time periods and discussed with the Investment Advisers the reasons for any overperformance or underperformance.
In addition to reviewing absolute and relative fund performance, the Independent Trustees periodically consider the appropriateness of fund performance metrics in evaluating the results achieved. The Independent Trustees generally give greater weight to fund performance over longer time periods than over shorter time periods. Depending on the circumstances, the Independent Trustees may be satisfied with a fund's performance notwithstanding that it lags its benchmark index or peer group for certain periods.
Based on its review, the Board concluded that the nature, extent, and quality of services provided to the fund under the Advisory Contracts should continue to benefit the shareholders of the fund.
Competitiveness of Management Fee and Total Expense Ratio. The Board was provided with information regarding industry trends in management fees and expenses. In its review of the fund's management fee and total expense ratio, the Board considered the fund's unitary fee rate as well as other fund expenses paid by FMR under the fund's management contract, such as transfer agent fees, pricing and bookkeeping fees, and custodial, legal, and audit fees. The Board noted that Fidelity may agree to waive fees or reimburse expenses from time to time, and the extent to which, if any, it has done so for the fund.
Comparisons of Management Fees and Total Expense Ratios. Among other things, the Board reviewed data for selected groups of competitive funds and classes (referred to as "mapped groups") that were compiled by Fidelity based on combining similar investment objective categories (as classified by Lipper) that have comparable investment mandates. The data reviewed by the Board included (i) gross management fee comparisons (before taking into account expense reimbursements or caps) relative to the total universe of funds within the mapped group; (ii) gross management fee comparisons relative to a subset of non-Fidelity funds in the mapped group that are similar in size and management fee structure to the fund (referred to as the "asset size peer group"); (iii) total expense comparisons of the fund relative to funds and classes in the mapped group that have a similar sales load structure to the fund (referred to as the "similar sales load structure group"); and (iv) total expense comparisons of the fund relative to funds and classes in the similar sales load structure group that are similar in size and management fee structure to the fund (referred to as the "total expense asset size peer group"). The total expense asset size peer group comparison excludes performance adjustments and fund-paid 12b-1 fees to eliminate variability in fee structures.
The information provided to the Board indicated that the fund's management fee rate ranked below the competitive median of the mapped group for the 12-month period ended September 30, 2022 and below the competitive median of the asset size peer group for the 12-month period ended September 30, 2022. Further, the information provided to the Board indicated that the total expense ratio of the fund ranked below the competitive median of the similar sales load structure group for the 12-month period ended September 30, 2022 and below the competitive median of the total expense asset size peer group for the 12-month period ended September 30, 2022.
Fees Charged to Other Fidelity Clients. The Board also considered Fidelity fee structures and other information with respect to clients of Fidelity, such as other funds advised or subadvised by Fidelity, pension plan clients, and other institutional clients with similar mandates. The Board noted that a joint ad hoc committee created by it and the boards of other Fidelity funds periodically reviews and compares Fidelity's institutional investment advisory business with its business of providing services to the Fidelity funds and also noted the most recent findings of the committee. The Board noted that the committee's review included a consideration of the differences in services provided, fees charged, and costs incurred, as well as competition in the markets serving the different categories of clients.
Based on its review, the Board concluded that the fund's management fee is fair and reasonable in light of the services that the fund receives and the other factors considered. Further, based on its review of total expense ratios and fees charged to other Fidelity clients, the Board concluded that the fund's total expense ratio was reasonable in light of the services that the fund and its shareholders receive and the other factors considered.
Costs of the Services and Profitability. The Board considered the revenues earned and the expenses incurred by Fidelity in conducting the business of developing, marketing, distributing, managing, administering and servicing the fund and servicing the fund's shareholders. The Board also considered the level of Fidelity's profits in respect of all the Fidelity funds.
On an annual basis, Fidelity presents to the Board information about the profitability of its relationships with the fund. Fidelity calculates profitability information for each fund, as well as aggregate profitability information for groups of Fidelity funds and all Fidelity funds, using a series of detailed revenue and cost allocation methodologies which originate with the books and records of Fidelity on which Fidelity's audited financial statements are based. The Audit Committee of the Board reviews any significant changes from the prior year's methodologies and the full Board approves such changes.
A public accounting firm has been engaged annually by the Board as part of the Board's assessment of Fidelity's profitability analysis. The engagement includes the review and assessment of the methodologies used by Fidelity in determining the revenues and expenses attributable to Fidelity's fund business, and completion of agreed-upon procedures in respect of the mathematical accuracy of certain fund profitability information and its conformity to established allocation methodologies. After considering the reports issued under the engagement and information provided by Fidelity, the Board concluded that while other allocation methods may also be reasonable, Fidelity's profitability methodologies are reasonable in all material respects.
The Board also reviewed Fidelity's non-fund businesses and potential indirect benefits such businesses may have received as a result of their association with Fidelity's fund business (i.e., fall-out benefits) as well as cases where Fidelity's affiliates may benefit from the funds' business. The Board considered areas where potential indirect benefits to the Fidelity funds from their relationships with Fidelity may exist. The Board's consideration of these matters was informed by the findings of a joint ad hoc committee created by it and the boards of other Fidelity funds to evaluate potential fall-out benefits.
The Board considered the costs of the services provided by and the profits realized by Fidelity in connection with the operation of the fund and was satisfied that the profitability was not excessive.
Economies of Scale. The Board considered whether there have been economies of scale in respect of the management of the Fidelity funds, whether the Fidelity funds (including the fund) have appropriately benefited from any such economies of scale, and whether there is potential for realization of any further economies of scale. The Board considered the extent to which the fund will benefit from economies of scale as assets grow through increased services to the fund, through waivers or reimbursements, or through fee or expense ratio reductions. The Board recognized that, due to the fund's current contractual arrangements, its expense ratio will not decline if the fund's operating costs decrease as assets grow, or rise as assets decrease. The Board also noted that a committee (the Economies of Scale Committee) created by it and the boards of other Fidelity funds periodically analyzes whether Fidelity attains economies of scale in respect of the management and servicing of the Fidelity funds, whether the Fidelity funds have appropriately benefited from such economies of scale, and whether there is potential for realization of any further economies of scale.
The Board concluded, taking into account the analysis of the Economies of Scale Committee, that economies of scale, if any, are being appropriately shared between fund shareholders and Fidelity.
Additional Information Requested by the Board. In order to develop fully the factual basis for consideration of the Fidelity funds' advisory contracts, the Board requested and received additional information on certain topics, including: (i) fund flow and performance trends, in particular the underperformance of certain funds and strategies, and Fidelity's long-term strategies for certain funds, including any consideration of fund liquidations or mergers; (ii) the operation of performance fees and competitor use of performance fees; (iii) Fidelity's pricing philosophy compared to competitors; (iv) fund profitability methodology and data; (v) evaluation of competitive fund data and peer group classifications and fee and expense comparisons; (vi) the management fee and expense structures for different funds and classes and information about the differences between various fee and expense structures; (vii) group fee breakpoints and related voluntary fee waivers; and (viii) information regarding other accounts managed by Fidelity and the funds' sub-advisory arrangements.
Conclusion. Based on its evaluation of all of the conclusions noted above, and after considering all factors it believed relevant, the Board, including the Independent Trustees, concluded that the advisory and sub-advisory fee arrangements are fair and reasonable in light of all of the surrounding circumstances and that the fund's Advisory Contracts should be renewed through July 31, 2024.
1.9883991.106
IVFK6-ANN-1223
Item 2.
Code of Ethics
As of the end of the period, October 31, 2023, Fidelity Investment Trust (the trust) has adopted a code of ethics, as defined in Item 2 of Form N-CSR, that applies to its President and Treasurer and its Chief Financial Officer. A copy of the code of ethics is filed as an exhibit to this Form N-CSR.
Item 3.
Audit Committee Financial Expert
The Board of Trustees of the trust has determined that Donald F. Donahue is an audit committee financial expert, as defined in Item 3 of Form N-CSR. Mr. Donahue is independent for purposes of Item 3 of Form N-CSR.
Item 4.
Principal Accountant Fees and Services
Fees and Services
The following table presents fees billed by Deloitte & Touche LLP, the member firms of Deloitte Touche Tohmatsu, and their respective affiliates (collectively, “Deloitte Entities”) in each of the last two fiscal years for services rendered to Fidelity Diversified International Fund, Fidelity Diversified International K6 Fund, Fidelity Global Equity Income Fund, Fidelity International Capital Appreciation Fund, Fidelity International Capital Appreciation K6 Fund, Fidelity International Discovery K6 Fund, Fidelity International Small Cap Fund, Fidelity International Small Cap Opportunities Fund, Fidelity International Value Fund, Fidelity SAI International SMA Completion Fund, Fidelity SAI Sustainable Emerging Markets Equity Fund, Fidelity SAI Sustainable International Equity Fund, Fidelity Series Emerging Markets Fund, Fidelity Series Emerging Markets Opportunities Fund, Fidelity Series International Small Cap Fund, Fidelity Series International Value Fund, Fidelity Series Overseas Fund, Fidelity Series Select International Small Cap Fund, Fidelity Series Sustainable Emerging Markets Fund, Fidelity Series Sustainable Non-U.S. Developed Markets Fund, Fidelity Sustainable International Equity Fund, Fidelity Total International Equity Fund and Fidelity Worldwide Fund (the “Fund(s)”):
Services Billed by Deloitte Entities
October 31, 2023 FeesA,C
| | | | |
| Audit Fees | Audit-Related Fees | Tax Fees | All Other Fees |
Fidelity Diversified International Fund | $53,600 | $- | $12,300 | $1,400 |
Fidelity Diversified International K6 Fund | $50,700 | $- | $12,500 | $1,300 |
Fidelity Global Equity Income Fund | $44,500 | $- | $10,000 | $1,200 |
Fidelity International Capital Appreciation Fund | $49,800 | $- | $12,000 | $1,300 |
Fidelity International Capital Appreciation K6 Fund | $49,300 | $- | $11,900 | $1,300 |
Fidelity International Discovery K6 Fund | $46,200 | $- | $12,300 | $1,200 |
Fidelity International Small Cap Fund | $56,000 | $- | $12,000 | $1,500 |
Fidelity International Small Cap Opportunities Fund | $49,900 | $- | $9,700 | $1,300 |
Fidelity International Value Fund | $48,600 | $- | $9,400 | $1,200 |
Fidelity SAI International SMA Completion Fund | $46,300 | $- | $12,200 | $1,300 |
Fidelity SAI Sustainable Emerging Markets Equity Fund | $39,500 | $- | $10,600 | $1,000 |
Fidelity SAI Sustainable International Equity Fund | $33,800 | $- | $10,000 | $900 |
Fidelity Series Emerging Markets Fund | $42,900 | $- | $12,300 | $1,200 |
Fidelity Series Emerging Markets Opportunities Fund | $43,200 | $- | $12,300 | $1,200 |
Fidelity Series International Small Cap Fund | $41,500 | $- | $9,400 | $1,100 |
Fidelity Series International Value Fund | $43,100 | $- | $9,400 | $1,100 |
Fidelity Series Overseas Fund | $44,500 | $- | $10,000 | $1,200 |
Fidelity Series Select International Small Cap Fund | $36,100 | $- | $9,600 | $900 |
Fidelity Series Sustainable Emerging Markets Fund | $35,200 | $- | $10,100 | $400 |
Fidelity Series Sustainable Non-U.S. Developed Markets Fund | $35,300 | $- | $10,100 | $400 |
Fidelity Sustainable International Equity Fund | $47,400 | $- | $12,300 | $1,200 |
Fidelity Total International Equity Fund | $52,300 | $- | $11,800 | $1,400 |
Fidelity Worldwide Fund | $49,700 | $- | $9,700 | $1,300 |
October 31, 2022 FeesA,B,C
| | | | |
| Audit Fees | Audit-Related Fees | Tax Fees | All Other Fees |
Fidelity Diversified International Fund | $71,100 | $- | $11,400 | $1,300 |
Fidelity Diversified International K6 Fund | $65,200 | $- | $11,400 | $1,200 |
Fidelity Global Equity Income Fund | $44,100 | $- | $9,300 | $1,100 |
Fidelity International Capital Appreciation Fund | $49,100 | $- | $11,200 | $1,200 |
Fidelity International Capital Appreciation K6 Fund | $49,400 | $- | $11,100 | $1,200 |
Fidelity International Discovery K6 Fund | $59,200 | $- | $11,200 | $1,100 |
Fidelity International Small Cap Fund | $55,500 | $- | $11,200 | $1,300 |
Fidelity International Small Cap Opportunities Fund | $50,100 | $- | $8,800 | $1,200 |
Fidelity International Value Fund | $51,200 | $- | $8,800 | $1,100 |
Fidelity SAI International SMA Completion Fund | $45,700 | $- | $11,400 | $1,200 |
Fidelity SAI Sustainable Emerging Markets Equity Fund | $33,700 | $- | $9,000 | $500 |
Fidelity SAI Sustainable International Equity Fund | $28,600 | $- | $9,000 | $400 |
Fidelity Series Emerging Markets Fund | $44,300 | $- | $11,200 | $1,100 |
Fidelity Series Emerging Markets Opportunities Fund | $42,900 | $- | $11,200 | $1,100 |
Fidelity Series International Small Cap Fund | $41,800 | $- | $8,800 | $1,000 |
Fidelity Series International Value Fund | $41,800 | $- | $8,800 | $1,000 |
Fidelity Series Overseas Fund | $44,100 | $- | $9,300 | $1,100 |
Fidelity Series Select International Small Cap Fund | $- | $- | $- | $- |
Fidelity Series Sustainable Emerging Markets Fund | $- | $- | $- | $- |
Fidelity Series Sustainable Non-U.S. Developed Markets Fund | $- | $- | $- | $- |
Fidelity Sustainable International Equity Fund | $39,300 | $- | $11,200 | $700 |
Fidelity Total International Equity Fund | $52,400 | $- | $10,700 | $1,300 |
Fidelity Worldwide Fund | $49,700 | $- | $8,800 | $1,200 |
A Amounts may reflect rounding
B Fidelity Sustainable International Equity Fund commenced operations on February 10, 2022. Fidelity SAI Sustainable Emerging Markets Equity Fund and Fidelity SAI Sustainable International Equity Fund commenced operations on April 14, 2022.
C Fidelity Series Select International Small Cap Fund commenced operations on November 4, 2022. Fidelity Series Sustainable Emerging Markets Fund and Fidelity Series Sustainable Non-U.S. Developed Markets Fund commenced operations on May 11, 2023.
The following table presents fees billed by PricewaterhouseCoopers LLP (“PwC”) in each of the last two fiscal years for services rendered to Fidelity Canada Fund, Fidelity China Region Fund, Fidelity Emerging Asia Fund, Emerging Markets Discovery Fund, Fidelity Emerging Markets Fund, Fidelity Enduring Opportunities Fund, Fidelity Europe Fund, Fidelity Global Commodity Stock Fund, Fidelity Infrastructure Fund, Fidelity International Discovery Fund, Fidelity International Growth Fund, Fidelity Japan Fund, Fidelity Japan Smaller Companies Fund, Fidelity Latin America Fund, Fidelity Nordic Fund, Fidelity Overseas Fund, Fidelity Pacific Basin Fund, Fidelity Series Canada Fund, Fidelity Series International Growth Fund, Fidelity Sustainable Emerging Markets Equity Fund, and Fidelity Total Emerging Markets Fund (the “Fund(s)”):
Services Billed by PwC
October 31, 2023 FeesA
| | | | |
| Audit Fees | Audit-Related Fees | Tax Fees | All Other Fees |
Fidelity Canada Fund | $51,400 | $4,700 | $11,500 | $1,600 |
Fidelity China Region Fund | $63,300 | $5,600 | $11,500 | $1,900 |
Fidelity Emerging Asia Fund | $55,400 | $5,000 | $11,500 | $1,700 |
Fidelity Emerging Markets Discovery Fund | $51,700 | $4,700 | $11,500 | $1,600 |
Fidelity Emerging Markets Fund | $54,700 | $5,200 | $12,700 | $1,700 |
Fidelity Enduring Opportunities Fund | $29,700 | $2,700 | $6,800 | $900 |
Fidelity Europe Fund | $58,900 | $5,300 | $19,900 | $1,800 |
Fidelity Global Commodity Stock Fund | $37,300 | $3,300 | $6,500 | $1,100 |
Fidelity Infrastructure Fund | $38,300 | $3,500 | $8,500 | $1,200 |
Fidelity International Discovery Fund | $87,400 | $5,900 | $51,500 | $2,000 |
Fidelity International Growth Fund | $50,300 | $4,600 | $16,200 | $1,600 |
Fidelity Japan Fund | $54,200 | $5,000 | $11,500 | $1,700 |
Fidelity Japan Smaller Companies Fund | $45,400 | $4,300 | $11,500 | $1,400 |
Fidelity Latin America Fund | $56,500 | $5,100 | $11,500 | $1,700 |
Fidelity Nordic Fund | $44,800 | $4,200 | $28,500 | $1,400 |
Fidelity Overseas Fund | $57,600 | $5,300 | $23,700 | $1,800 |
Fidelity Pacific Basin Fund | $55,100 | $5,200 | $14,300 | $1,700 |
Fidelity Series Canada Fund | $51,400 | $4,400 | $17,100 | $1,500 |
Fidelity Series International Growth Fund | $47,100 | $3,900 | $47,400 | $1,300 |
Fidelity Sustainable Emerging Markets Equity Fund | $50,500 | $4,600 | $14,400 | $1,600 |
Fidelity Total Emerging Markets Fund | $62,700 | $5,400 | $10,600 | $1,800 |
| | | | |
| Audit Fees | Audit-Related Fees | Tax Fees | All Other Fees |
Fidelity Canada Fund | $48,900 | $4,500 | $10,900 | $1,500 |
Fidelity China Region Fund | $60,300 | $5,400 | $10,900 | $1,800 |
Fidelity Emerging Asia Fund | $52,800 | $4,800 | $11,800 | $1,600 |
Fidelity Emerging Markets Discovery Fund | $46,300 | $4,300 | $10,900 | $1,500 |
Fidelity Emerging Markets Fund | $77,300 | $5,800 | $13,300 | $2,000 |
Fidelity Enduring Opportunities Fund | $28,400 | $2,600 | $6,500 | $900 |
Fidelity Europe Fund | $58,400 | $5,100 | $12,300 | $1,700 |
Fidelity Global Commodity Stock Fund | $35,500 | $3,100 | $6,000 | $1,100 |
Fidelity Infrastructure Fund | $36,700 | $3,300 | $7,600 | $1,100 |
Fidelity International Discovery Fund | $102,300 | $5,600 | $39,100 | $1,900 |
Fidelity International Growth Fund | $50,800 | $4,400 | $11,400 | $1,500 |
Fidelity Japan Fund | $51,800 | $4,800 | $10,900 | $1,600 |
Fidelity Japan Smaller Companies Fund | $43,300 | $4,100 | $10,900 | $1,400 |
Fidelity Latin America Fund | $54,000 | $4,900 | $10,900 | $1,700 |
Fidelity Nordic Fund | $42,700 | $4,000 | $12,300 | $1,400 |
Fidelity Overseas Fund | $77,600 | $5,100 | $15,400 | $1,700 |
Fidelity Pacific Basin Fund | $52,500 | $4,900 | $12,700 | $1,700 |
Fidelity Series Canada Fund | $43,400 | $4,100 | $11,000 | $1,400 |
Fidelity Series International Growth Fund | $52,600 | $3,700 | $13,200 | $1,300 |
Fidelity Sustainable Emerging Markets Equity Fund | $40,600 | $2,900 | $11,300 | $1,000 |
Fidelity Total Emerging Markets Fund | $53,200 | $4,800 | $10,100 | $1,600 |
A Amounts may reflect rounding.
B Fidelity Sustainable Emerging Markets Equity Fund commenced operations on February 10, 2022
The following table(s) present(s) fees billed by Deloitte Entities and PwC that were required to be approved by the Audit Committee for services that relate directly to the operations and financial reporting of the Fund(s) and that are rendered on behalf of Fidelity Management & Research Company LLC ("FMR") and entities controlling, controlled by, or under common control with FMR (not including any sub-adviser whose
role is primarily portfolio management and is subcontracted with or overseen by another investment adviser) that provide ongoing services to the Fund(s) (“Fund Service Providers”):
Services Billed by Deloitte Entities
| | |
| October 31, 2023A,C | October 31, 2022A,B,C |
Audit-Related Fees | $- | $- |
Tax Fees | $- | $- |
All Other Fees | $- | $- |
A Amounts may reflect rounding.
B May include amounts billed prior to the Fidelity SAI Sustainable Emerging Markets Equity Fund, Fidelity SAI Sustainable International Equity Fund and Fidelity Sustainable International Equity Funds’ commencement of operations.
C Fidelity Series Select International Small Cap Fund, Fidelity Series Sustainable Emerging Markets Fund and Fidelity Series Sustainable Non-U.S. Developed Markets Funds’ commencement of operations.
Services Billed by PwC
| | |
| October 31, 2023A | October 31, 2022A,B |
Audit-Related Fees | $8,284,200 | $7,914,600 |
Tax Fees | $1,000 | $1,000 |
All Other Fees | $- | $- |
A Amounts may reflect rounding
B May include amounts billed prior to the Fidelity Sustainable Emerging Markets Equity Fund’s commencement of operations.
“Audit-Related Fees” represent fees billed for assurance and related services that are reasonably related to the performance of the fund audit or the review of the fund's financial statements and that are not reported under Audit Fees.
“Tax Fees” represent fees billed for tax compliance, tax advice or tax planning that relate directly to the operations and financial reporting of the fund.
“All Other Fees” represent fees billed for services provided to the fund or Fund Service Provider, a significant portion of which are assurance related, that relate directly to the operations and financial reporting of the fund, excluding those services that are reported under Audit Fees, Audit-Related Fees or Tax Fees.
Assurance services must be performed by an independent public accountant.
* * *
The aggregate non-audit fees billed by Deloitte Entities and PwC for services rendered to the Fund(s), FMR (not including any sub-adviser whose role is primarily portfolio management and is subcontracted with or overseen by another investment adviser), and any Fund Service Provider for each of the last two fiscal years of the Fund(s) are as follows:
| | |
Billed By | October 31, 2023A,C | October 31, 2022A,B,C |
Deloitte Entities | $520,800 | $682,700 |
PwC | $14,077,300 | $13,266,000 |
A Amounts may reflect rounding.
B May include amounts billed prior to the Fidelity SAI Sustainable Emerging Markets Equity Fund, Fidelity SAI Sustainable International Equity Fund, Fidelity Sustainable Emerging Markets Equity Fund and Fidelity Sustainable International Equity Funds’ commencement of operations.
C Fidelity Series Select International Small Cap Fund, Fidelity Series Sustainable Emerging Markets Fund and Fidelity Series Sustainable Non-U.S. Developed Markets Funds’ commencement of operations.
The trust's Audit Committee has considered non-audit services that were not pre-approved that were provided by Deloitte Entities and PwC to Fund Service Providers to be compatible with maintaining the independence of Deloitte Entities and PwC in its(their) audit of the Fund(s), taking into account representations from Deloitte Entities and PwC, in accordance with Public Company Accounting Oversight Board rules, regarding its independence from the Fund(s) and its(their) related entities and FMR’s review of the appropriateness and permissibility under applicable law of such non-audit services prior to their provision to the Fund(s) Service Providers.
Audit Committee Pre-Approval Policies and Procedures
The trust’s Audit Committee must pre-approve all audit and non-audit services provided by a fund’s independent registered public accounting firm relating to the operations or financial reporting of the fund. Prior to the commencement of any audit or non-audit services to a fund, the Audit Committee reviews the services to determine whether they are appropriate and permissible under applicable law.
The Audit Committee has adopted policies and procedures to, among other purposes, provide a framework for the Committee’s consideration of non-audit services by the audit firms that audit the Fidelity funds. The policies and procedures require that any non-audit
service provided by a fund audit firm to a Fidelity fund and any non-audit service provided by a fund auditor to a Fund Service Provider that relates directly to the operations and financial reporting of a Fidelity fund (“Covered Service”) are subject to approval by the Audit Committee before such service is provided.
All Covered Services must be approved in advance of provision of the service either: (i) by formal resolution of the Audit Committee, or (ii) by oral or written approval of the service by the Chair of the Audit Committee (or if the Chair is unavailable, such other member of the Audit Committee as may be designated by the Chair to act in the Chair’s absence). The approval contemplated by (ii) above is permitted where the Treasurer determines that action on such an engagement is necessary before the next meeting of the Audit Committee.
Non-audit services provided by a fund audit firm to a Fund Service Provider that do not relate directly to the operations and financial reporting of a Fidelity fund are reported to the Audit Committee periodically.
Non-Audit Services Approved Pursuant to Rule 2-01(c)(7)(i)(C) and (ii) of Regulation S-X (“De Minimis Exception”)
There were no non-audit services approved or required to be approved by the Audit Committee pursuant to the De Minimis Exception during the Fund’s(s’) last two fiscal years relating to services provided to (i) the Fund(s) or (ii) any Fund Service Provider that relate directly to the operations and financial reporting of the Fund(s).
The Registrant has not retained, for the preparation of the audit report on the financial statements included in the Form N-CSR, a registered public accounting firm that has a branch or office that is located in a foreign jurisdiction and that the Public Company Accounting Oversight Board (the “PCAOB”) has determined that the PCAOB is unable to inspect or investigate completely because of a position taken by an authority in the foreign jurisdiction.
The Registrant is not a “foreign issuer,” as defined in 17 CFR 240.3b-4.
Item 5.
Audit Committee of Listed Registrants
Not applicable.
Item 6.
Investments
(a)
Not applicable.
(b)
Not applicable.
Item 7.
Disclosure of Proxy Voting Policies and Procedures for Closed-End Management Investment Companies
Not applicable.
Item 8.
Portfolio Managers of Closed-End Management Investment Companies
Not applicable.
Item 9.
Purchase of Equity Securities by Closed-End Management Investment Company and Affiliated Purchasers
Not applicable.
Item 10.
Submission of Matters to a Vote of Security Holders
There were no material changes to the procedures by which shareholders may recommend nominees to the trust’s Board of Trustees.
Item 11.
Controls and Procedures
(a)(i) The President and Treasurer and the Chief Financial Officer have concluded that the trust’s disclosure controls and procedures (as defined in Rule 30a-3(c) under the Investment Company Act) provide reasonable assurances that material information relating to the trust is made known to them by the appropriate persons, based on their evaluation of these controls and procedures as of a date within 90 days of the filing date of this report.
(a)(ii) There was no change in the trust’s internal control over financial reporting (as defined in Rule 30a-3(d) under the Investment Company Act) that occurred during the period covered by this report that has materially affected, or is reasonably likely to materially affect, the trust’s internal control over financial reporting.
Item 12.
Disclosure of Securities Lending Activities for Closed-End Management
Investment Companies
Not applicable.
Item 18.
Recovery of Erroneously Awarded Compensation
(a)
Not applicable.
(b)
Not applicable.
Item 19.
Exhibits
SIGNATURES
Pursuant to the requirements of the Securities Exchange Act of 1934 and the Investment Company Act of 1940, the registrant has duly caused this report to be signed on its behalf by the undersigned, thereunto duly authorized.
Fidelity Investment Trust
| |
By: | /s/Stacie M. Smith |
| Stacie M. Smith |
| President and Treasurer |
|
|
Date: | December 21, 2023 |
Pursuant to the requirements of the Securities Exchange Act of 1934 and the Investment Company Act of 1940, this report has been signed below by the following persons on behalf of the registrant and in the capacities and on the dates indicated.
| |
By: | /s/Stacie M. Smith |
| Stacie M. Smith |
| President and Treasurer |
|
|
Date: | December 21, 2023 |
| |
By: | /s/John J. Burke III |
| John J. Burke III |
| Chief Financial Officer |
|
|
Date: | December 21, 2023 |