0000744822fmr:C000234203Membercountry:MX2024-10-31
UNITED STATES
SECURITIES AND EXCHANGE COMMISSION
Washington, D.C. 20549
FORM N-CSR
CERTIFIED SHAREHOLDER REPORT OF REGISTERED
MANAGEMENT INVESTMENT COMPANIES
Investment Company Act file number 811-04008
Fidelity Investment Trust
(Exact name of registrant as specified in charter)
245 Summer St., Boston, Massachusetts 02210
(Address of principal executive offices) (Zip code)
Nicole Macarchuk, Secretary
245 Summer St.
Boston, Massachusetts 02210
(Name and address of agent for service)
Registrant's telephone number, including area code:
617-563-7000
| |
Date of fiscal year end: | October 31 |
|
|
Date of reporting period: | October 31, 2024 |
This report on Form N-CSR relates solely to the Registrant’s Fidelity Enduring Opportunities Fund, Fidelity Global Commodity Stock Fund, Fidelity Infrastructure Fund, Fidelity SAI International SMA Completion Fund, Fidelity SAI Sustainable Emerging Markets Equity Fund, Fidelity SAI Sustainable International Equity Fund, Fidelity Series Canada Fund, Fidelity Series Emerging Markets Fund, Fidelity Series Emerging Markets Opportunities Fund, Fidelity Series International Growth Fund, Fidelity Series International Small Cap Fund, Fidelity Series International Value Fund, Fidelity Series Overseas Fund, Fidelity Series Select International Small Cap Fund, Fidelity Series Sustainable Emerging Markets Fund, Fidelity Series Sustainable Non-U.S. Developed Markets Fund, Fidelity Sustainable Emerging Markets Equity Fund, and Fidelity Sustainable International Equity Fund (the “Funds”).
Item 1.
Reports to Stockholders
| |
| | ANNUAL SHAREHOLDER REPORT | AS OF OCTOBER 31, 2024 | This report describes changes to the Fund that occurred during the reporting period. |
| | Fidelity® Sustainable International Equity Fund Fidelity Advisor® Sustainable International Equity Fund Class A : FSQAX |
| | | |
This annual shareholder report contains information about Fidelity® Sustainable International Equity Fund for the period November 1, 2023 to October 31, 2024. You can find additional information about the Fund at fundresearch.fidelity.com/prospectus/sec. You can also request this information by contacting us at 1-877-208-0098 or by sending an e-mail to fidfunddocuments@fidelity.com.
What were your Fund costs for the last year?(based on hypothetical $10,000 investment)
FUND COST (PREVIOUS YEAR)
| | Costs of a $10,000 investment | Costs paid as a percentage of a $10,000 investment | |
| Class A | $ 147 | 1.30% | |
What affected the Fund's performance this period?
•International stocks achieved a strong gain for the 12 months ending October 31, 2024. Resilient global economic growth and a slowing in the pace of inflation in certain regions, as well as a shift to global monetary easing, contributed to a favorable backdrop, despite persistent geopolitical risk.
•Against this backdrop, security selection in Japan and the U.K. contributed to the fund's performance versus the MSCI EAFE Index (Net MA) for the fiscal year.
•By sector, the biggest contributor to performance versus the benchmark was stock picking in industrials, primarily within the capital goods industry. Stock picks in materials also boosted the fund's relative performance. Also bolstering our relative result was an underweight in energy.
•The top individual relative contributor was an overweight in Hitachi (+108%), the fund's biggest holding at period end. The second-largest relative contributor was our non-benchmark stake in Taiwan Semiconductor (+95%). The stock was among the fund's largest holdings. An overweight in UCB (+165%) also helped.
•In contrast, from a regional standpoint, security selection and an underweight in Asia Pacific ex Japan, primarily in Hong Kong, and an underweight in Japan detracted from the fund's relative result.
•By sector, the biggest detractor from performance versus the benchmark was stock selection in financials. Stock selection in consumer staples also hampered the fund's result. Also detracting from our result was an underweight in industrials, primarily within the capital goods industry. Lastly, the fund's position in cash detracted.
•The largest individual relative detractor was an overweight in Sony (+10%), which was among the fund's biggest holdings. The second-largest relative detractor was an overweight in AIA (-6%). Another notable relative detractor was an overweight in L'Oréal (-9%).
•Notable changes in positioning include decreased exposure to Germany and a higher allocation to Japan. By sector, meaningful changes in positioning include increased exposure to industrials and a lower allocation to consumer staples.
Application of FMR's environmental, social and governance ratings process and/or its sustainable investing exclusion criteria may affect the fund's exposure to certain issuers, sectors, regions and countries, and may affect the fund's performance.
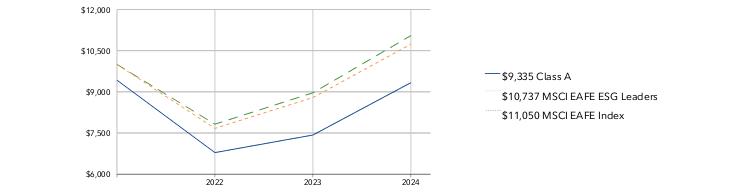
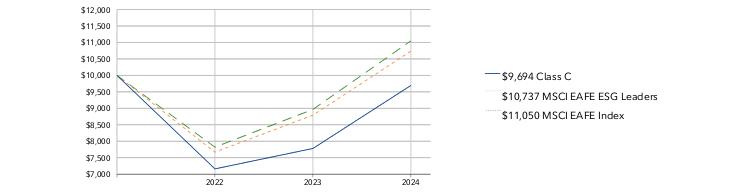
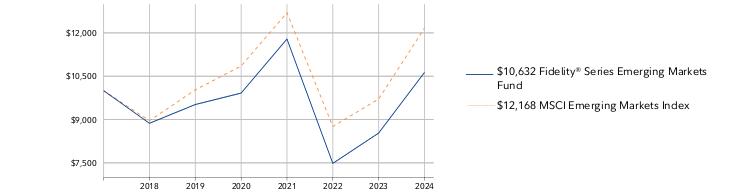
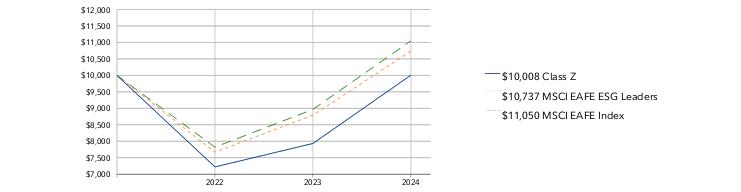
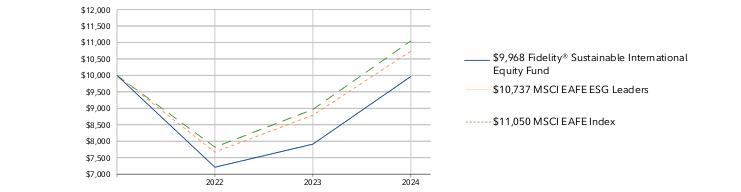
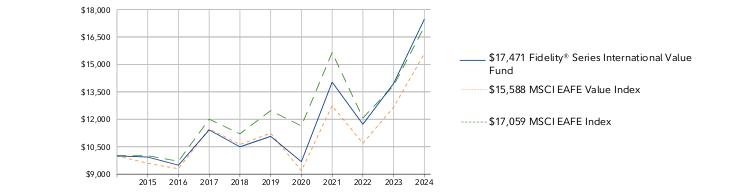
How did the Fund perform over the life of Fund?
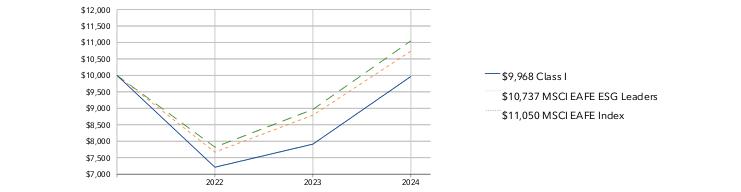
CUMULATIVE PERFORMANCE
February 10, 2022 through October 31, 2024.
Initial investment of $10,000 and the current sales charge was paid.
Class A | $9,425 | $6,786 | $7,426 |
MSCI EAFE ESG Leaders | $10,000 | $7,669 | $8,792 |
MSCI EAFE Index | $10,000 | $7,820 | $8,966 |
| | 2022 | 2023 | 2024 |
AVERAGE ANNUAL TOTAL RETURNS:| | 1 Year | Life of Fund A |
| Class A (incl. 5.75% sales charge) | 18.48% | -2.49% |
| Class A (without 5.75% sales charge) | 25.71% | -0.35% |
| MSCI EAFE ESG Leaders | 22.13% | 2.65% |
| MSCI EAFE Index | 23.25% | 3.74% |
A From February 10, 2022
Visit institutional.fidelity.com for more recent performance information. |
The Fund's past performance is not a good predictor of the Fund's future performance. The graph and table do not reflect the deduction of taxes that a shareholder would pay on fund distributions or redemption of fund shares. |
Key Fund Statistics(as of October 31, 2024)
KEY FACTS | | |
| Fund Size | $10,747,030 | |
| Number of Holdings | 83 | |
| Total Advisory Fee | $67,920 | |
| Portfolio Turnover | 50% | |
What did the Fund invest in?
(as of October 31, 2024)
MARKET SECTORS (% of Fund's net assets) | | |
| Financials | 25.6 | |
| Industrials | 21.7 | |
| Health Care | 13.0 | |
| Consumer Discretionary | 11.0 | |
| Information Technology | 9.0 | |
| Materials | 6.5 | |
| Consumer Staples | 4.5 | |
| Utilities | 3.0 | |
| Communication Services | 2.1 | |
| Real Estate | 1.1 | |
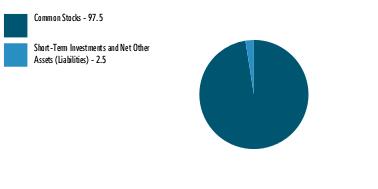
| |
| Common Stocks | 97.5 |
| Short-Term Investments and Net Other Assets (Liabilities) | 2.5 |
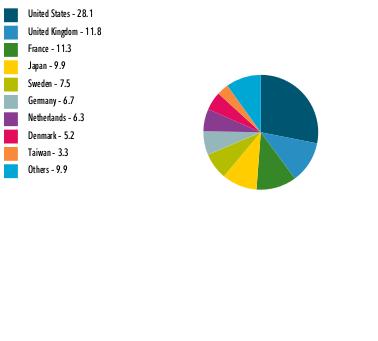
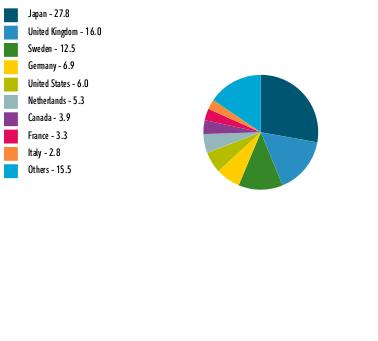
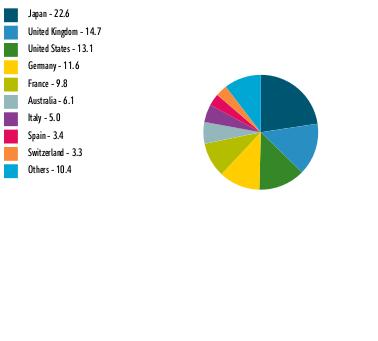
ASSET ALLOCATION (% of Fund's net assets) |
|
|
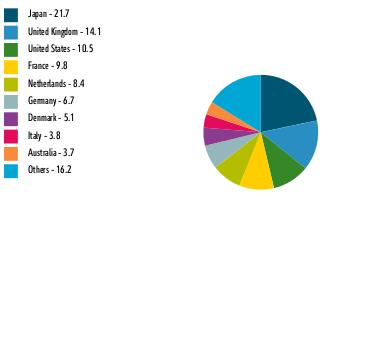
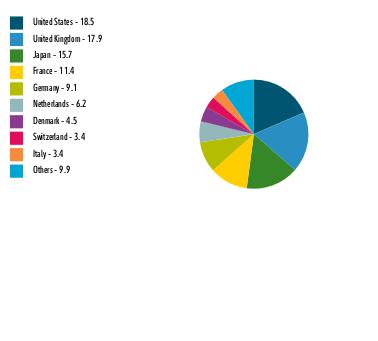
| Japan | 21.7 |
| United Kingdom | 14.1 |
| United States | 10.5 |
| France | 9.8 |
| Netherlands | 8.4 |
| Germany | 6.7 |
| Denmark | 5.1 |
| Italy | 3.8 |
| Australia | 3.7 |
| Others | 16.2 |
GEOGRAPHIC DIVERSIFICATION (% of Fund's net assets) |
|
| |
|
TOP HOLDINGS(% of Fund's net assets) | | |
| Novo Nordisk A/S Series B | 4.4 | |
| Hitachi Ltd | 4.3 | |
| ITOCHU Corp | 3.5 | |
| CRH PLC (United Kingdom) | 2.9 | |
| ORIX Corp | 2.8 | |
| ASML Holding NV | 2.7 | |
| Sony Group Corp | 2.6 | |
| Schneider Electric SE | 2.6 | |
| Taiwan Semiconductor Manufacturing Co Ltd | 2.5 | |
| Unilever PLC | 2.4 | |
| | 30.7 | |
How has the Fund changed?
This is a summary of certain changes to the Fund since November 1, 2023. For more complete information, you may review the Fund's next prospectus, which we expect to be available by December 30, 2024 at fundresearch.fidelity.com/prospectus/sec or upon request at 1-877-208-0098 or by sending an e-mail to fidfunddocuments@fidelity.com.
The fund's transfer agent and pricing & bookkeeping fees were changed to a fixed rate effective December 1, 2023, through February 29, 2024, in anticipation of the transition to a new management fee structure. Effective March 1, 2024, the fund's management contract was amended to incorporate administrative services previously covered under separate services agreements (transfer agent and pricing & bookkeeping). The amended contract incorporates a basic fee rate that may vary by class (subject to a performance adjustment). The Adviser or an affiliate pays certain expenses of managing and operating the fund out of each class's management fee. | |
| Fidelity, the Fidelity Investments Logo and all other Fidelity trademarks or service marks used herein are trademarks or service marks of FMR LLC. Any third-party marks that are used herein are trademarks or service marks of their respective owners. © 2024 FMR LLC. All rights reserved. |
| | For additional information about the Fund; including its prospectus, financial information, holdings and proxy information, scan the QR code or visit fundresearch.fidelity.com/prospectus/sec 1.9914019.100 6463-TSRA-1224 |
| |
| | ANNUAL SHAREHOLDER REPORT | AS OF OCTOBER 31, 2024 | This report describes changes to the Fund that occurred during the reporting period. |
| | Fidelity® SAI Sustainable International Equity Fund Fidelity® SAI Sustainable International Equity Fund : FSSEX |
| | | |
This annual shareholder report contains information about Fidelity® SAI Sustainable International Equity Fund for the period November 1, 2023 to October 31, 2024. You can find additional information about the Fund at fundresearch.fidelity.com/prospectus/sec. You can also request this information by contacting us at 1-800-544-3455 or by sending an e-mail to fidfunddocuments@fidelity.com.
What were your Fund costs for the last year?(based on hypothetical $10,000 investment)
FUND COST (PREVIOUS YEAR)
| | Costs of a $10,000 investment | Costs paid as a percentage of a $10,000 investment | |
| Fidelity® SAI Sustainable International Equity Fund | $ 84 | 0.75% | |
What affected the Fund's performance this period?
•International stocks achieved a strong gain for the 12 months ending October 31, 2024. Resilient global economic growth and a slowing in the pace of inflation in certain regions, as well as a shift to global monetary easing, contributed to a favorable backdrop.
•Against this backdrop, stock picks in Japan and stock picks and an overweight in Europe ex U.K. contributed to the fund's performance versus the MSCI EAFE Index (Net MA) for the fiscal year.
•By sector, the biggest contributor to performance versus the benchmark was stock picking in industrials, primarily within the capital goods industry. Stock choices in materials and an underweight in energy also boosted relative performance.
•The top individual relative contributor was an overweight in Hitachi (+108%). This period we increased our stake in Hitachi, one of our biggest holdings. A non-benchmark stake in Taiwan Semiconductor gained 95% and was the second-largest relative contributor. This period we increased our stake in Taiwan Semiconductor, and the stock was among our biggest holdings. An overweight in UCB (+165%) also helped.
•In contrast, from a regional standpoint, stock picking and an underweight in Asia Pacific ex Japan and an underweight in Japan detracted from the fund's relative result.
•By sector, the biggest detractor from performance versus the benchmark was security selection in financials. Stock picks in consumer staples also hampered the fund's result. Also detracting from our result was an underweight in industrials, primarily within the capital goods industry. Lastly, the fund's position in cash detracted.
•The largest individual relative detractor was an overweight in Sony (+10%). This period we increased our position in Sony, which was among our largest holdings. The second-largest relative detractor was an overweight in L'Oréal (-10%). This period we increased our position in L'Oréal. Another notable relative detractor was an overweight in AIA (-6%). This period we increased our position in AIA.
•Notable changes in positioning include increased exposure to Ireland and Japan. By sector, meaningful changes in positioning include increased exposure to industrials and a lower allocation to consumer staples.
Application of FMR's environmental, social and governance ratings process and/or its sustainable investing exclusion criteria may affect the fund's exposure to certain issuers, sectors, regions and countries, and may affect the fund's performance.
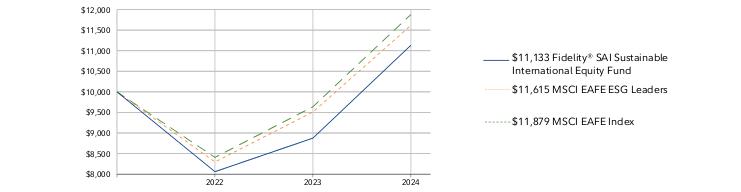
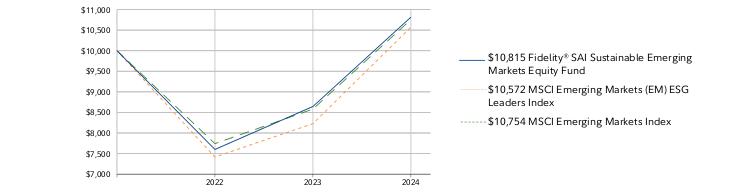
How did the Fund perform over the life of Fund?
CUMULATIVE PERFORMANCE
April 14, 2022 through October 31, 2024.
Initial investment of $10,000.
Fidelity® SAI Sustainable International Equity Fund | $10,000 | $8,060 | $8,875 |
MSCI EAFE ESG Leaders | $10,000 | $8,296 | $9,511 |
MSCI EAFE Index | $10,000 | $8,407 | $9,638 |
| | 2022 | 2023 | 2024 |
AVERAGE ANNUAL TOTAL RETURNS:| | 1 Year | Life of Fund A |
| Fidelity® SAI Sustainable International Equity Fund | 25.43% | 4.30% |
| MSCI EAFE ESG Leaders | 22.13% | 6.05% |
| MSCI EAFE Index | 23.25% | 6.98% |
A From April 14, 2022
Visit www.fidelity.com for more recent performance information. |
The Fund's past performance is not a good predictor of the Fund's future performance. The graph and table do not reflect the deduction of taxes that a shareholder would pay on fund distributions or redemption of fund shares. |
Key Fund Statistics(as of October 31, 2024)
KEY FACTS | | |
| Fund Size | $59,251,472 | |
| Number of Holdings | 83 | |
| Total Advisory Fee | $229,265 | |
| Portfolio Turnover | 45% | |
What did the Fund invest in?
(as of October 31, 2024)
MARKET SECTORS (% of Fund's net assets) | | |
| Financials | 25.4 | |
| Industrials | 21.6 | |
| Health Care | 12.8 | |
| Consumer Discretionary | 10.9 | |
| Information Technology | 8.7 | |
| Materials | 6.6 | |
| Consumer Staples | 4.5 | |
| Utilities | 3.0 | |
| Communication Services | 2.1 | |
| Real Estate | 1.2 | |
| |
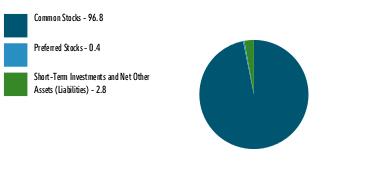
| Common Stocks | 96.8 |
| Short-Term Investments and Net Other Assets (Liabilities) | 3.2 |
ASSET ALLOCATION (% of Fund's net assets) |
|
|
| Japan | 21.6 |
| United Kingdom | 14.0 |
| United States | 11.2 |
| France | 9.7 |
| Netherlands | 8.3 |
| Germany | 6.7 |
| Denmark | 5.1 |
| Italy | 3.8 |
| Australia | 3.6 |
| Others | 16.0 |
GEOGRAPHIC DIVERSIFICATION (% of Fund's net assets) |
|
| |
|
TOP HOLDINGS(% of Fund's net assets) | | |
| Novo Nordisk A/S Series B | 4.4 | |
| Hitachi Ltd | 4.3 | |
| ITOCHU Corp | 3.5 | |
| CRH PLC (United Kingdom) | 3.0 | |
| ORIX Corp | 2.8 | |
| ASML Holding NV | 2.7 | |
| Sony Group Corp | 2.6 | |
| Schneider Electric SE | 2.6 | |
| Taiwan Semiconductor Manufacturing Co Ltd | 2.4 | |
| Unilever PLC | 2.4 | |
| | 30.7 | |
How has the Fund changed?
This is a summary of certain changes to the Fund since November 1, 2023. For more complete information, you may review the Fund's next prospectus, which we expect to be available by December 30, 2024 at fundresearch.fidelity.com/prospectus/sec or upon request at 1-800-544-3455 or by sending an e-mail to fidfunddocuments@fidelity.com.
The fund's contractual management fee was reduced during the reporting period. | |
| Fidelity, the Fidelity Investments Logo and all other Fidelity trademarks or service marks used herein are trademarks or service marks of FMR LLC. Any third-party marks that are used herein are trademarks or service marks of their respective owners. © 2024 FMR LLC. All rights reserved. |
| | For additional information about the Fund; including its prospectus, financial information, holdings and proxy information, scan the QR code or visit fundresearch.fidelity.com/prospectus/sec 1.9914031.100 6549-TSRA-1224 |
| |
| | ANNUAL SHAREHOLDER REPORT | AS OF OCTOBER 31, 2024 | This report describes changes to the Fund that occurred during the reporting period. |
| | Fidelity® SAI International SMA Completion Fund Fidelity® SAI International SMA Completion Fund : FISZX |
| | | |
This annual shareholder report contains information about Fidelity® SAI International SMA Completion Fund for the period November 1, 2023 to October 31, 2024. You can find additional information about the Fund at fundresearch.fidelity.com/prospectus/sec. You can also request this information by contacting us at 1-800-544-3455 or by sending an e-mail to fidfunddocuments@fidelity.com.
What were your Fund costs for the last year?(based on hypothetical $10,000 investment)
FUND COST (PREVIOUS YEAR)
| | Costs of a $10,000 investment | Costs paid as a percentage of a $10,000 investment | |
| Fidelity® SAI International SMA Completion Fund | $ 0 A | 0.00%B | |
A Amount represents less than $.50
B Amount represents less than 0.005%
What affected the Fund's performance this period?
•International stocks achieved a strong gain for the 12 months ending October 31, 2024. Resilient global economic growth and a slowing in the pace of inflation in certain regions, as well as a shift to global monetary easing, contributed to a favorable backdrop, despite persistent geopolitical risk.
•Against this backdrop, picks in the U.K. and a non-benchmark allocation to emerging markets detracted from the fund's performance versus the MSCI EAFE Index (Net MA) for the fiscal year.
•By sector, the biggest detractor from performance versus the benchmark was security selection in information technology, primarily within the software & services industry. Also hurting our result were picks in financials, primarily within the banks industry, and consumer staples, primarily within the consumer staples distribution & retail industry. Lastly, the fund's position in cash detracted.
•The largest individual relative detractor was our non-benchmark stake in B&M European Value Retail (-17%). This period we decreased our investment in B&M. A second notable relative detractor was an overweight in Renesas Electronics (-18%). This was a stake we established this period. A non-benchmark stake in Tourmaline Oil returned -8% and notably hurt. The stock was not held at period end.
•In contrast, from a regional standpoint, security selection in Japan and positioning in Europe ex U.K. contributed to the fund's relative result.
•By sector, the biggest contributors to performance versus the benchmark were picks and an overweight in industrials, primarily within the capital goods industry. An underweight in consumer staples, primarily within the food, beverage & tobacco industry, also boosted relative performance. Also contributing to our result was stock selection in materials.
•The top individual relative contributor was an overweight in Mitsubishi Heavy Industries (+83%). This was a position we established this period. The stock was the fund's largest holding at period end. The second-largest relative contributor was an overweight in Investor (+57%). The company was among the fund's largest holdings.
•Notable changes in positioning include increased exposure to Australia and Sweden. By sector, meaningful changes in positioning include increased exposure to health care and industrials.
How did the Fund perform over the life of Fund?
CUMULATIVE PERFORMANCE
April 11, 2019 through October 31, 2024.
Initial investment of $10,000.
Fidelity® SAI International SMA Completion Fund | $10,000 | $10,470 | $12,415 | $15,646 | $10,313 | $10,994 |
MSCI EAFE Index | $10,000 | $10,437 | $9,739 | $13,094 | $10,103 | $11,583 |
| | 2019 | 2020 | 2021 | 2022 | 2023 | 2024 |
AVERAGE ANNUAL TOTAL RETURNS:| | 1 Year | 5 Year | Life of Fund A |
| Fidelity® SAI International SMA Completion Fund | 22.95% | 5.24% | 5.57% |
| MSCI EAFE Index | 23.25% | 6.46% | 6.61% |
A From April 11, 2019
Visit www.fidelity.com for more recent performance information. |
The Fund's past performance is not a good predictor of the Fund's future performance. The graph and table do not reflect the deduction of taxes that a shareholder would pay on fund distributions or redemption of fund shares. |
Key Fund Statistics(as of October 31, 2024)
KEY FACTS | | |
| Fund Size | $808,201,287 | |
| Number of Holdings | 52 | |
| Total Advisory Fee | $0 | |
| Portfolio Turnover | 33% | |
What did the Fund invest in?
(as of October 31, 2024)
MARKET SECTORS (% of Fund's net assets) | | |
| Industrials | 33.5 | |
| Financials | 20.1 | |
| Information Technology | 13.3 | |
| Consumer Discretionary | 7.1 | |
| Materials | 6.4 | |
| Health Care | 5.4 | |
| Energy | 3.8 | |
| Consumer Staples | 3.5 | |
| Communication Services | 1.8 | |
| Real Estate | 0.8 | |
| |
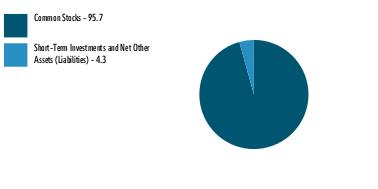
| Common Stocks | 95.7 |
| Short-Term Investments and Net Other Assets (Liabilities) | 4.3 |
ASSET ALLOCATION (% of Fund's net assets) |
|
|
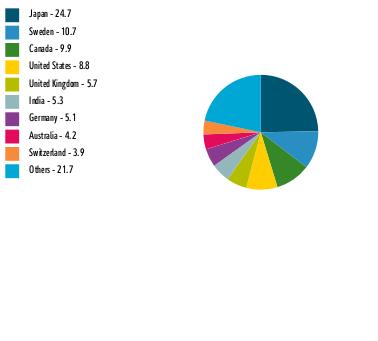
| Japan | 24.7 |
| Sweden | 10.7 |
| Canada | 9.9 |
| United States | 8.8 |
| United Kingdom | 5.7 |
| India | 5.3 |
| Germany | 5.1 |
| Australia | 4.2 |
| Switzerland | 3.9 |
| Others | 21.7 |
GEOGRAPHIC DIVERSIFICATION (% of Fund's net assets) |
|
| |
|
TOP HOLDINGS(% of Fund's net assets) | | |
| Mitsubishi Heavy Industries Ltd | 6.0 | |
| Investor AB B Shares | 5.0 | |
| ITOCHU Corp | 4.7 | |
| Constellation Software Inc/Canada | 4.4 | |
| Indutrade AB | 4.1 | |
| Schneider Electric SE | 3.4 | |
| CaixaBank SA | 3.3 | |
| Keyence Corp | 3.2 | |
| Hannover Rueck SE | 3.1 | |
| Kingspan Group PLC | 2.9 | |
| | 40.1 | |
How has the Fund changed?
This is a summary of certain changes to the Fund since November 1, 2023. For more complete information, you may review the Fund's next prospectus, which we expect to be available by December 30, 2024 at fundresearch.fidelity.com/prospectus/sec or upon request at 1-800-544-3455 or by sending an e-mail to fidfunddocuments@fidelity.com.
The fund changed its classification from non-diversified to diversified and modified its principal investment strategies and risks to reflect the change during the reporting period. | |
| Fidelity, the Fidelity Investments Logo and all other Fidelity trademarks or service marks used herein are trademarks or service marks of FMR LLC. Any third-party marks that are used herein are trademarks or service marks of their respective owners. © 2024 FMR LLC. All rights reserved. |
| | For additional information about the Fund; including its prospectus, financial information, holdings and proxy information, scan the QR code or visit fundresearch.fidelity.com/prospectus/sec 1.9914008.100 3358-TSRA-1224 |
| |
| | ANNUAL SHAREHOLDER REPORT | AS OF OCTOBER 31, 2024 | This report describes changes to the Fund that occurred during the reporting period. |
| | Fidelity® Series Canada Fund Fidelity® Series Canada Fund : FCNSX |
| | | |
This annual shareholder report contains information about Fidelity® Series Canada Fund for the period November 1, 2023 to October 31, 2024. You can find additional information about the Fund at fundresearch.fidelity.com/prospectus/sec. You can also request this information by contacting us at 1-800-544-8544.
What were your Fund costs for the last year?(based on hypothetical $10,000 investment)
FUND COST (PREVIOUS YEAR)
| | Costs of a $10,000 investment | Costs paid as a percentage of a $10,000 investment | |
| Fidelity® Series Canada Fund | $ 0 A | 0.00%B | |
A Amount represents less than $.50
B Amount represents less than 0.005%
What affected the Fund's performance this period?
•International stocks achieved a strong gain for the 12 months ending October 31, 2024. Resilient global economic growth and a slowing in the pace of inflation in certain regions, as well as a shift to global monetary easing, contributed to a favorable backdrop, despite persistent geopolitical risk.
•Against this backdrop, stock selection and an underweight in Canada's financials sector, primarily within the banks industry, and stock picks in materials and energy, detracted from the fund's performance versus the MSCI Canada Index (Net MA) for the fiscal year.
•The biggest individual relative detractor was an overweight in Alimentation Couche-Tard (-3%). The stock was among the fund's biggest holdings. Not owning Manulife Financial, a benchmark component that gained 76%, was the second-largest relative detractor. Avoiding Agnico Eagle Mines, a benchmark component that gained 89%, also hurt.
•In contrast, by sector, the biggest contributor to performance versus the benchmark was stock picking in information technology, primarily within the software & services industry. Security selection in consumer discretionary and industrials, and an underweight in utilities, also boosted the fund's relative performance.
•Not owning Cenovus Energy, a benchmark component that returned -13%, was the top individual relative contributor. A second notable relative contributor was an overweight in Brookfield Asset Management (+91%). A non-benchmark stake in Dye & Durham (+135%) helped as well.
•By sector, meaningful changes in positioning include increased exposure to information technology.
How did the Fund perform over the life of Fund?
CUMULATIVE PERFORMANCE
August 15, 2017 through October 31, 2024.
Initial investment of $10,000.
Fidelity® Series Canada Fund | $10,000 | $10,660 | $10,100 | $11,273 | $10,346 | $15,974 | $14,784 | $15,011 |
MSCI Canada Index | $10,000 | $10,602 | $10,012 | $11,195 | $10,553 | $15,773 | $13,617 | $13,495 |
| | 2017 | 2018 | 2019 | 2020 | 2021 | 2022 | 2023 | 2024 |
AVERAGE ANNUAL TOTAL RETURNS:| | 1 Year | 5 Year | Life of Fund A |
| Fidelity® Series Canada Fund | 27.38% | 11.15% | 9.40% |
| MSCI Canada Index | 31.60% | 9.67% | 8.28% |
A From August 15, 2017
Visit www.fidelity.com for more recent performance information. |
The Fund's past performance is not a good predictor of the Fund's future performance. The graph and table do not reflect the deduction of taxes that a shareholder would pay on fund distributions or redemption of fund shares. |
Key Fund Statistics(as of October 31, 2024)
KEY FACTS | | |
| Fund Size | $5,728,681,179 | |
| Number of Holdings | 63 | |
| Total Advisory Fee | $0 | |
| Portfolio Turnover | 9% | |
What did the Fund invest in?
(as of October 31, 2024)
MARKET SECTORS (% of Fund's net assets) | | |
| Financials | 30.3 | |
| Energy | 17.9 | |
| Industrials | 12.3 | |
| Materials | 10.7 | |
| Information Technology | 10.3 | |
| Consumer Staples | 8.7 | |
| Consumer Discretionary | 6.7 | |
| Communication Services | 2.1 | |
| Health Care | 0.6 | |
| |
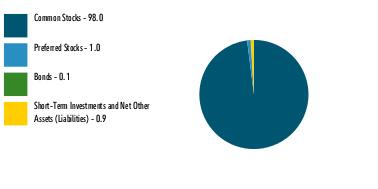
| Common Stocks | 99.6 |
| Bonds | 0.1 |
| Preferred Stocks | 0.0 |
| Short-Term Investments and Net Other Assets (Liabilities) | 0.3 |
ASSET ALLOCATION (% of Fund's net assets) |
|
|
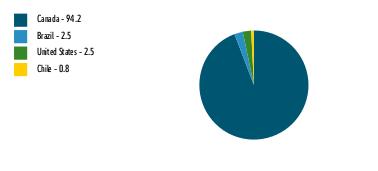
| Canada | 94.2 |
| Brazil | 2.5 |
| United States | 2.5 |
| Chile | 0.8 |
GEOGRAPHIC DIVERSIFICATION (% of Fund's net assets) |
|
| |
|
TOP HOLDINGS(% of Fund's net assets) | | |
| Royal Bank of Canada | 5.6 | |
| Canadian Pacific Kansas City Ltd | 5.5 | |
| Bank of Montreal | 5.3 | |
| Canadian Natural Resources Ltd | 5.2 | |
| Alimentation Couche-Tard Inc | 5.1 | |
| Constellation Software Inc/Canada | 4.8 | |
| Shopify Inc Class A | 3.8 | |
| Toronto-Dominion Bank/The | 3.8 | |
| Franco-Nevada Corp | 3.8 | |
| Suncor Energy Inc | 3.6 | |
| | 46.5 | |
How has the Fund changed?
This is a summary of certain changes to the Fund since November 1, 2023. For more complete information, you may review the Fund's next prospectus, which we expect to be available by December 30, 2024 at fundresearch.fidelity.com/prospectus/sec or upon request at 1-800-544-8544 .
The fees associated with this class changed during the reporting year.The variations in class fees are primarily the result of the following changes: | |
| Fidelity, the Fidelity Investments Logo and all other Fidelity trademarks or service marks used herein are trademarks or service marks of FMR LLC. Any third-party marks that are used herein are trademarks or service marks of their respective owners. © 2024 FMR LLC. All rights reserved. |
| | For additional information about the Fund; including its prospectus, financial information, holdings and proxy information, scan the QR code or visit fundresearch.fidelity.com/prospectus/sec 1.9913995.100 3036-TSRA-1224 |
| |
| | ANNUAL SHAREHOLDER REPORT | AS OF OCTOBER 31, 2024 | This report describes changes to the Fund that occurred during the reporting period. |
| | Fidelity® Enduring Opportunities Fund Fidelity® Enduring Opportunities Fund : FEOPX |
| | | |
This annual shareholder report contains information about Fidelity® Enduring Opportunities Fund for the period November 1, 2023 to October 31, 2024. You can find additional information about the Fund at fundresearch.fidelity.com/prospectus/sec. You can also request this information by contacting us at 1-800-544-8544 or by sending an e-mail to fidfunddocuments@fidelity.com.
What were your Fund costs for the last year?(based on hypothetical $10,000 investment)
FUND COST (PREVIOUS YEAR)
| | Costs of a $10,000 investment | Costs paid as a percentage of a $10,000 investment | |
| Fidelity® Enduring Opportunities Fund | $ 112 | 0.95% | |
What affected the Fund's performance this period?
•Global equities posted a strong advance for the 12 months ending October 31, 2024. Resilient economic growth and a slowing in the pace of inflation in certain regions, as well as a shift to global monetary easing, contributed to a favorable backdrop, despite persistent geopolitical risk.
•Against this backdrop, stock picks in the United States and Europe ex U.K., particularly Sweden and Switzerland, contributed to the fund's performance versus the MSCI All Country World Index (Net MA) for the fiscal year.
•By sector, security selection was the primary contributor, especially within consumer discretionary. Stock selection in communication services, and an underweight in energy, also boosted relative performance.
•The top individual relative contributor was our non-benchmark stake in Carvana (+811%). This period we decreased our stake in the stock. The second-largest relative contributor was an overweight in Nvidia (+226%). The stock was the fund's biggest holding at period end. A non-benchmark stake in Wingstop gained 101% and also notably helped. The stock was not held at period end.
•In contrast, from a regional standpoint, stock selection in emerging markets, primarily in China, and an overweight in Japan detracted from the fund's relative result.
•By sector, the biggest detractors from performance versus the benchmark were stock choices and an underweight in financials. Stock selection in industrials also hampered the fund's result, as did an overweight in consumer discretionary, primarily within the consumer durables & apparel industry.
•The largest individual relative detractor this period was avoiding Broadcom, a benchmark component that gained 105%. The second-largest relative detractor was an underweight in Tesla (+24%). The stock was not held at period end. An overweight in lululemon athletica (-24%) also hurt.
•Notable changes in positioning by region include a lower allocation to Japan. By sector, meaningful changes in positioning include decreased exposure to materials and a higher allocation to communication services.
How did the Fund perform over the life of Fund?
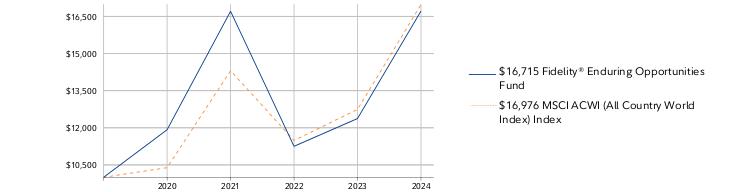
CUMULATIVE PERFORMANCE
November 5, 2019 through October 31, 2024.
Initial investment of $10,000.
Fidelity® Enduring Opportunities Fund | $10,000 | $11,922 | $16,706 | $11,252 | $12,373 | $16,715 |
MSCI ACWI (All Country World Index) Index | $10,000 | $10,388 | $14,305 | $11,489 | $12,742 | $16,976 |
| | 2019 | 2020 | 2021 | 2022 | 2023 | 2024 |
AVERAGE ANNUAL TOTAL RETURNS:| | 1 Year | Life of Fund A |
| Fidelity® Enduring Opportunities Fund | 35.09% | 10.84% |
| MSCI ACWI (All Country World Index) Index | 33.23% | 11.18% |
A From November 5, 2019
Visit www.fidelity.com for more recent performance information. |
The Fund's past performance is not a good predictor of the Fund's future performance. The graph and table do not reflect the deduction of taxes that a shareholder would pay on fund distributions or redemption of fund shares. |
Key Fund Statistics(as of October 31, 2024)
KEY FACTS | | |
| Fund Size | $14,559,977 | |
| Number of Holdings | 283 | |
| Total Advisory Fee | $64,944 | |
| Portfolio Turnover | 18% | |
What did the Fund invest in?
(as of October 31, 2024)
MARKET SECTORS (% of Fund's net assets) | | |
| Information Technology | 22.6 | |
| Consumer Discretionary | 16.2 | |
| Industrials | 14.8 | |
| Financials | 11.9 | |
| Health Care | 9.0 | |
| Communication Services | 8.8 | |
| Consumer Staples | 5.0 | |
| Real Estate | 4.7 | |
| Materials | 3.5 | |
| Energy | 1.8 | |
| Utilities | 0.8 | |
| |
| Common Stocks | 99.1 |
| Short-Term Investments and Net Other Assets (Liabilities) | 0.9 |
ASSET ALLOCATION (% of Fund's net assets) |
|
|
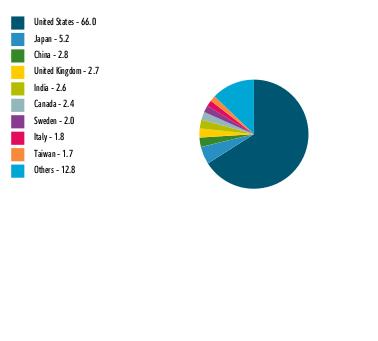
| United States | 66.0 |
| Japan | 5.2 |
| China | 2.8 |
| United Kingdom | 2.7 |
| India | 2.6 |
| Canada | 2.4 |
| Sweden | 2.0 |
| Italy | 1.8 |
| Taiwan | 1.7 |
| Others | 12.8 |
GEOGRAPHIC DIVERSIFICATION (% of Fund's net assets) |
|
| |
|
TOP HOLDINGS(% of Fund's net assets) | | |
| NVIDIA Corp | 4.9 | |
| Microsoft Corp | 4.2 | |
| Amazon.com Inc | 2.6 | |
| Meta Platforms Inc Class A | 2.1 | |
| Alphabet Inc Class A | 1.6 | |
| Alphabet Inc Class C | 1.4 | |
| Taiwan Semiconductor Manufacturing Co Ltd | 1.4 | |
| JPMorgan Chase & Co | 1.2 | |
| Eli Lilly & Co | 1.1 | |
| UnitedHealth Group Inc | 0.9 | |
| | 21.4 | |
How has the Fund changed?
This is a summary of certain changes to the Fund since November 1, 2023. For more complete information, you may review the Fund's next prospectus, which we expect to be available by December 30, 2024 at fundresearch.fidelity.com/prospectus/sec or upon request at 1-800-544-8544 or by sending an e-mail to fidfunddocuments@fidelity.com.
The fund's transfer agent and pricing & bookkeeping fees were changed to a fixed rate effective December 1, 2023, through February 29, 2024, in anticipation of the transition to a new management fee structure. Effective March 1, 2024, the fund's management contract was amended to incorporate administrative services previously covered under separate services agreements (transfer agent and pricing & bookkeeping). The amended contract incorporates a basic fee rate that may vary by class (subject to a performance adjustment). The Adviser or an affiliate pays certain expenses of managing and operating the fund out of each class's management fee. | |
| Fidelity, the Fidelity Investments Logo and all other Fidelity trademarks or service marks used herein are trademarks or service marks of FMR LLC. Any third-party marks that are used herein are trademarks or service marks of their respective owners. © 2024 FMR LLC. All rights reserved. |
| | For additional information about the Fund; including its prospectus, financial information, holdings and proxy information, scan the QR code or visit fundresearch.fidelity.com/prospectus/sec 1.9914012.100 5031-TSRA-1224 |
| |
| | ANNUAL SHAREHOLDER REPORT | AS OF OCTOBER 31, 2024 | This report describes changes to the Fund that occurred during the reporting period. |
| | Fidelity® Sustainable Emerging Markets Equity Fund Fidelity Advisor® Sustainable Emerging Markets Equity Fund Class M : FSYNX |
| | | |
This annual shareholder report contains information about Fidelity® Sustainable Emerging Markets Equity Fund for the period November 1, 2023 to October 31, 2024. You can find additional information about the Fund at fundresearch.fidelity.com/prospectus/sec. You can also request this information by contacting us at 1-877-208-0098 or by sending an e-mail to fidfunddocuments@fidelity.com.
What were your Fund costs for the last year?(based on hypothetical $10,000 investment)
FUND COST (PREVIOUS YEAR)
| | Costs of a $10,000 investment | Costs paid as a percentage of a $10,000 investment | |
| Class M | $ 197 | 1.75% | |
What affected the Fund's performance this period?
•International stocks achieved a strong gain for the 12 months ending October 31, 2024. Resilient global economic growth and a slowing in the pace of inflation in certain regions, as well as a shift to global monetary easing, contributed to a favorable backdrop, despite persistent geopolitical risk.
•Against this backdrop, stock selection in China and Taiwan dominated among contributors to the fund's performance versus the MSCI Emerging Markets Index for the fiscal year.
•By sector, security selection in consumer discretionary was the primary contributor. Picks and an overweight in information technology, also boosted the fund's relative performance.
•The top individual relative contributor was an overweight in Taiwan Semiconductor Manufacturing (+128%). The stock was the fund's largest holding. A second notable relative contributor was an overweight in Zomato (+93%). This was a stake we established this period. Another notable relative contributor was our non-benchmark stake in International Games System (+83%). The stock was not held at period end.
•In contrast, from a regional standpoint, stock selection and an overweight in Latin America detracted from the fund's relative result.
•By sector, the biggest detractor from performance versus the benchmark was stock selection in financials. Security selection in industrials also hampered the fund's result. Also hurting our result were picks and an overweight in health care.
•The biggest individual relative detractor was an overweight in Samsung Electronics (-12%). The company was one of our biggest holdings. A non-benchmark stake in Vamos Locacao de Caminhoes returned -42% and was the second-largest relative detractor. This was a stake we established this period. An overweight in Grupo Financiero Banorte (-9%) also detracted. The stock was among the fund's biggest holdings this period.
•Notable changes in positioning include increased exposure to South Africa and a lower allocation to South Korea. By sector, meaningful changes in positioning include lower allocations to consumer staples and communication services.
Application of FMR's environmental, social and governance ratings process and/or its sustainable investing exclusion criteria may affect the fund's exposure to certain issuers, sectors, regions and countries, and may affect the fund's performance.
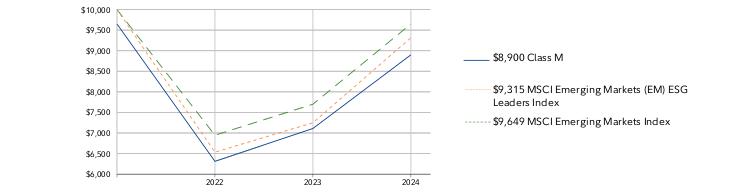
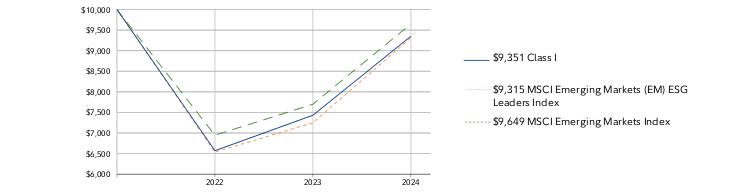
How did the Fund perform over the life of Fund?
CUMULATIVE PERFORMANCE
February 10, 2022 through October 31, 2024.
Initial investment of $10,000 and the current sales charge was paid.
Class M | $9,650 | $6,311 | $7,110 |
MSCI Emerging Markets (EM) ESG Leaders Index | $10,000 | $6,534 | $7,249 |
MSCI Emerging Markets Index | $10,000 | $6,946 | $7,699 |
| | 2022 | 2023 | 2024 |
AVERAGE ANNUAL TOTAL RETURNS:| | 1 Year | Life of Fund A |
| Class M (incl. 3.50% sales charge) | 20.80% | -4.19% |
| Class M (without 3.50% sales charge) | 25.18% | -2.93% |
| MSCI Emerging Markets (EM) ESG Leaders Index | 28.51% | -2.57% |
| MSCI Emerging Markets Index | 25.33% | -1.30% |
A From February 10, 2022
Visit institutional.fidelity.com for more recent performance information. |
The Fund's past performance is not a good predictor of the Fund's future performance. The graph and table do not reflect the deduction of taxes that a shareholder would pay on fund distributions or redemption of fund shares. |
Key Fund Statistics(as of October 31, 2024)
KEY FACTS | | |
| Fund Size | $6,416,219 | |
| Number of Holdings | 119 | |
| Total Advisory Fee | $47,275 | |
| Portfolio Turnover | 108% | |
What did the Fund invest in?
(as of October 31, 2024)
MARKET SECTORS (% of Fund's net assets) | | |
| Financials | 24.8 | |
| Information Technology | 24.6 | |
| Consumer Discretionary | 17.3 | |
| Communication Services | 9.1 | |
| Industrials | 5.1 | |
| Health Care | 4.4 | |
| Materials | 3.7 | |
| Consumer Staples | 3.0 | |
| Energy | 2.2 | |
| Real Estate | 1.2 | |
| Utilities | 0.7 | |
| |
| Common Stocks | 96.1 |
| Short-Term Investments and Net Other Assets (Liabilities) | 3.9 |
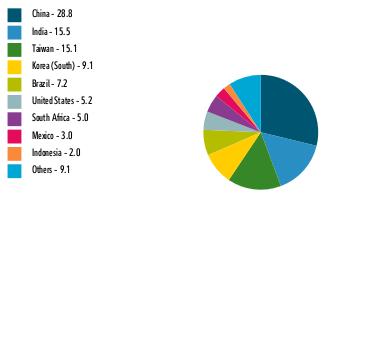
ASSET ALLOCATION (% of Fund's net assets) |
|
|
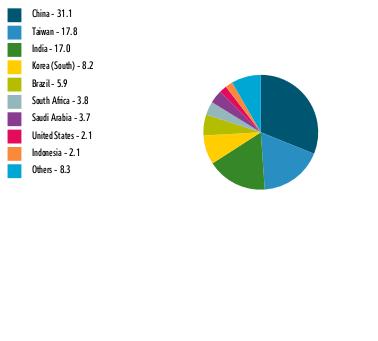
| China | 30.9 |
| Taiwan | 15.9 |
| India | 13.3 |
| Korea (South) | 9.7 |
| Brazil | 6.3 |
| South Africa | 5.2 |
| United States | 3.9 |
| Mexico | 3.5 |
| Indonesia | 2.3 |
| Others | 9.0 |
GEOGRAPHIC DIVERSIFICATION (% of Fund's net assets) |
|
| |
|
TOP HOLDINGS(% of Fund's net assets) | | |
| Taiwan Semiconductor Manufacturing Co Ltd | 10.5 | |
| Tencent Holdings Ltd | 6.2 | |
| Alibaba Group Holding Ltd | 4.2 | |
| Samsung Electronics Co Ltd | 4.2 | |
| Hon Hai Precision Industry Co Ltd | 2.0 | |
| Bank Central Asia Tbk PT | 1.9 | |
| SK Hynix Inc | 1.8 | |
| Bharti Airtel Ltd | 1.7 | |
| China Construction Bank Corp H Shares | 1.7 | |
| HDFC Bank Ltd | 1.7 | |
| | 35.9 | |
How has the Fund changed?
This is a summary of certain changes to the Fund since November 1, 2023. For more complete information, you may review the Fund's next prospectus, which we expect to be available by December 30, 2024 at fundresearch.fidelity.com/prospectus/sec or upon request at 1-877-208-0098 or by sending an e-mail to fidfunddocuments@fidelity.com.
The fund's transfer agent and pricing & bookkeeping fees were changed to a fixed rate effective December 1, 2023, through February 29, 2024, in anticipation of the transition to a new management fee structure. Effective March 1, 2024, the fund's management contract was amended to incorporate administrative services previously covered under separate services agreements (transfer agent and pricing & bookkeeping). The amended contract incorporates a basic fee rate that may vary by class (subject to a performance adjustment). The Adviser or an affiliate pays certain expenses of managing and operating the fund out of each class's management fee. | |
| Fidelity, the Fidelity Investments Logo and all other Fidelity trademarks or service marks used herein are trademarks or service marks of FMR LLC. Any third-party marks that are used herein are trademarks or service marks of their respective owners. © 2024 FMR LLC. All rights reserved. |
| | For additional information about the Fund; including its prospectus, financial information, holdings and proxy information, scan the QR code or visit fundresearch.fidelity.com/prospectus/sec 1.9914027.100 6471-TSRA-1224 |
| |
| | ANNUAL SHAREHOLDER REPORT | AS OF OCTOBER 31, 2024 | This report describes changes to the Fund that occurred during the reporting period. |
| | Fidelity® Sustainable Emerging Markets Equity Fund Fidelity Advisor® Sustainable Emerging Markets Equity Fund Class A : FSWAX |
| | | |
This annual shareholder report contains information about Fidelity® Sustainable Emerging Markets Equity Fund for the period November 1, 2023 to October 31, 2024. You can find additional information about the Fund at fundresearch.fidelity.com/prospectus/sec. You can also request this information by contacting us at 1-877-208-0098 or by sending an e-mail to fidfunddocuments@fidelity.com.
What were your Fund costs for the last year?(based on hypothetical $10,000 investment)
FUND COST (PREVIOUS YEAR)
| | Costs of a $10,000 investment | Costs paid as a percentage of a $10,000 investment | |
| Class A | $ 169 | 1.50% | |
What affected the Fund's performance this period?
•International stocks achieved a strong gain for the 12 months ending October 31, 2024. Resilient global economic growth and a slowing in the pace of inflation in certain regions, as well as a shift to global monetary easing, contributed to a favorable backdrop, despite persistent geopolitical risk.
•Against this backdrop, stock selection in China and Taiwan dominated among contributors to the fund's performance versus the MSCI Emerging Markets Index for the fiscal year.
•By sector, security selection in consumer discretionary was the primary contributor. Picks and an overweight in information technology, also boosted the fund's relative performance.
•The top individual relative contributor was an overweight in Taiwan Semiconductor Manufacturing (+128%). The stock was the fund's largest holding. A second notable relative contributor was an overweight in Zomato (+93%). This was a stake we established this period. Another notable relative contributor was our non-benchmark stake in International Games System (+83%). The stock was not held at period end.
•In contrast, from a regional standpoint, stock selection and an overweight in Latin America detracted from the fund's relative result.
•By sector, the biggest detractor from performance versus the benchmark was stock selection in financials. Security selection in industrials also hampered the fund's result. Also hurting our result were picks and an overweight in health care.
•The biggest individual relative detractor was an overweight in Samsung Electronics (-12%). The company was one of our biggest holdings. A non-benchmark stake in Vamos Locacao de Caminhoes returned -42% and was the second-largest relative detractor. This was a stake we established this period. An overweight in Grupo Financiero Banorte (-9%) also detracted. The stock was among the fund's biggest holdings this period.
•Notable changes in positioning include increased exposure to South Africa and a lower allocation to South Korea. By sector, meaningful changes in positioning include lower allocations to consumer staples and communication services.
Application of FMR's environmental, social and governance ratings process and/or its sustainable investing exclusion criteria may affect the fund's exposure to certain issuers, sectors, regions and countries, and may affect the fund's performance.
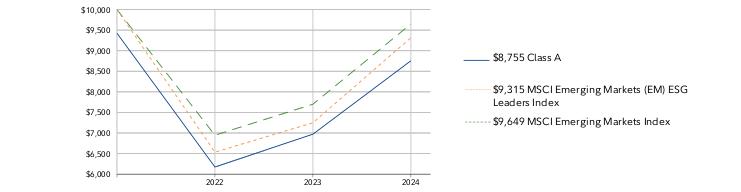
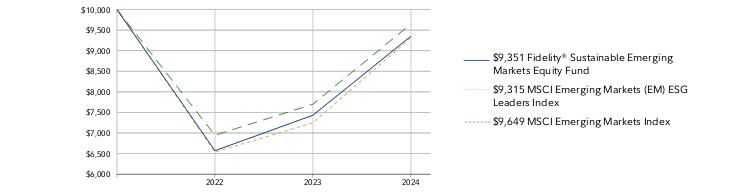
How did the Fund perform over the life of Fund?
CUMULATIVE PERFORMANCE
February 10, 2022 through October 31, 2024.
Initial investment of $10,000 and the current sales charge was paid.
Class A | $9,425 | $6,173 | $6,972 |
MSCI Emerging Markets (EM) ESG Leaders Index | $10,000 | $6,534 | $7,249 |
MSCI Emerging Markets Index | $10,000 | $6,946 | $7,699 |
| | 2022 | 2023 | 2024 |
AVERAGE ANNUAL TOTAL RETURNS:| | 1 Year | Life of Fund A |
| Class A (incl. 5.75% sales charge) | 18.36% | -4.76% |
| Class A (without 5.75% sales charge) | 25.58% | -2.67% |
| MSCI Emerging Markets (EM) ESG Leaders Index | 28.51% | -2.57% |
| MSCI Emerging Markets Index | 25.33% | -1.30% |
A From February 10, 2022
Visit institutional.fidelity.com for more recent performance information. |
The Fund's past performance is not a good predictor of the Fund's future performance. The graph and table do not reflect the deduction of taxes that a shareholder would pay on fund distributions or redemption of fund shares. |
Key Fund Statistics(as of October 31, 2024)
KEY FACTS | | |
| Fund Size | $6,416,219 | |
| Number of Holdings | 119 | |
| Total Advisory Fee | $47,275 | |
| Portfolio Turnover | 108% | |
What did the Fund invest in?
(as of October 31, 2024)
MARKET SECTORS (% of Fund's net assets) | | |
| Financials | 24.8 | |
| Information Technology | 24.6 | |
| Consumer Discretionary | 17.3 | |
| Communication Services | 9.1 | |
| Industrials | 5.1 | |
| Health Care | 4.4 | |
| Materials | 3.7 | |
| Consumer Staples | 3.0 | |
| Energy | 2.2 | |
| Real Estate | 1.2 | |
| Utilities | 0.7 | |
| |
| Common Stocks | 96.1 |
| Short-Term Investments and Net Other Assets (Liabilities) | 3.9 |
ASSET ALLOCATION (% of Fund's net assets) |
|
|
| China | 30.9 |
| Taiwan | 15.9 |
| India | 13.3 |
| Korea (South) | 9.7 |
| Brazil | 6.3 |
| South Africa | 5.2 |
| United States | 3.9 |
| Mexico | 3.5 |
| Indonesia | 2.3 |
| Others | 9.0 |
GEOGRAPHIC DIVERSIFICATION (% of Fund's net assets) |
|
| |
|
TOP HOLDINGS(% of Fund's net assets) | | |
| Taiwan Semiconductor Manufacturing Co Ltd | 10.5 | |
| Tencent Holdings Ltd | 6.2 | |
| Alibaba Group Holding Ltd | 4.2 | |
| Samsung Electronics Co Ltd | 4.2 | |
| Hon Hai Precision Industry Co Ltd | 2.0 | |
| Bank Central Asia Tbk PT | 1.9 | |
| SK Hynix Inc | 1.8 | |
| Bharti Airtel Ltd | 1.7 | |
| China Construction Bank Corp H Shares | 1.7 | |
| HDFC Bank Ltd | 1.7 | |
| | 35.9 | |
How has the Fund changed?
This is a summary of certain changes to the Fund since November 1, 2023. For more complete information, you may review the Fund's next prospectus, which we expect to be available by December 30, 2024 at fundresearch.fidelity.com/prospectus/sec or upon request at 1-877-208-0098 or by sending an e-mail to fidfunddocuments@fidelity.com.
The fund's transfer agent and pricing & bookkeeping fees were changed to a fixed rate effective December 1, 2023, through February 29, 2024, in anticipation of the transition to a new management fee structure. Effective March 1, 2024, the fund's management contract was amended to incorporate administrative services previously covered under separate services agreements (transfer agent and pricing & bookkeeping). The amended contract incorporates a basic fee rate that may vary by class (subject to a performance adjustment). The Adviser or an affiliate pays certain expenses of managing and operating the fund out of each class's management fee. | |
| Fidelity, the Fidelity Investments Logo and all other Fidelity trademarks or service marks used herein are trademarks or service marks of FMR LLC. Any third-party marks that are used herein are trademarks or service marks of their respective owners. © 2024 FMR LLC. All rights reserved. |
| | For additional information about the Fund; including its prospectus, financial information, holdings and proxy information, scan the QR code or visit fundresearch.fidelity.com/prospectus/sec 1.9914025.100 6469-TSRA-1224 |
| |
| | ANNUAL SHAREHOLDER REPORT | AS OF OCTOBER 31, 2024 | This report describes changes to the Fund that occurred during the reporting period. |
| | Fidelity® Global Commodity Stock Fund Fidelity Advisor® Global Commodity Stock Fund Class I : FFGIX |
| | | |
This annual shareholder report contains information about Fidelity® Global Commodity Stock Fund for the period November 1, 2023 to October 31, 2024. You can find additional information about the Fund at fundresearch.fidelity.com/prospectus/sec. You can also request this information by contacting us at 1-877-208-0098 or by sending an e-mail to fidfunddocuments@fidelity.com.
What were your Fund costs for the last year?(based on hypothetical $10,000 investment)
FUND COST (PREVIOUS YEAR)
| | Costs of a $10,000 investment | Costs paid as a percentage of a $10,000 investment | |
| Class I | $ 95 | 0.90% | |
What affected the Fund's performance this period?
•Global equities posted a strong advance for the 12 months ending October 31, 2024. Resilient economic growth and a slowing in the pace of inflation in certain regions, as well as a shift to global monetary easing, contributed to a favorable backdrop, despite persistent geopolitical risk.
•Against this backdrop, security selection in the United States and an overweight in Canada contributed to the fund's performance versus the MSCI AC World Commodity Producers Sector Capped Index for the fiscal year.
•By industry, security selection was the primary contributor, led by our choices in the oil & gas storage & transportation industry. Stock picking and an underweight in agricultural products & services also boosted the fund's relative performance. Also lifting the fund's relative result was out-of-benchmark exposure to the packaged foods & meats category.
•The top individual relative contributor was our stake in Archer Daniels Midland (+0%). This was a stake we established this period. The stock was one of our biggest holdings. The second-largest relative contributor was an overweight in Wheaton Precious Metals (+58%). We reduced the position, but the stock was still one of the fund's biggest holdings as of October 31. An overweight in Teck Resources (+33%) also helped. We also trimmed this position, but it too was among the fund's largest holdings at period end.
•In contrast, from a regional standpoint, stock picking in Asia Pacific ex Japan, primarily in Australia, detracted from the fund's relative result, as did an underweight in emerging markets, primarily in China and India.
•By industry, notable detractors from performance versus the benchmark included picks and an overweight in oil & gas exploration & production. Stock selection and an underweight in diversified metals & mining also hampered the fund's relative result. Also detracting from our result was a small non-benchmark position in pharmaceuticals.
•The largest individual relative detractor was an underweight in Corteva (+28%). This period we decreased our investment in Corteva. The second-largest relative detractor was an underweight in Agnico Eagle Mines (+89%). The stock was not held at period end. Another notable relative detractor was an overweight in Cenovus Energy (-13%). The stock was one of the fund's largest holdings.
•Notable changes in positioning include increased exposure to South Africa and a lower allocation to Australia. By sector, meaningful changes in positioning include increased exposure to oil & gas equipment & services and packaged foods & meats.
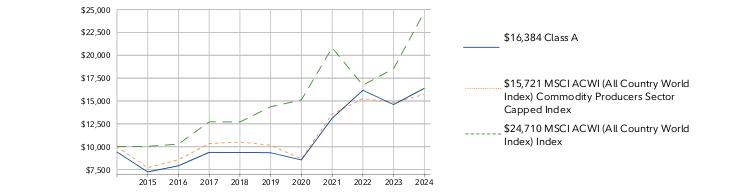
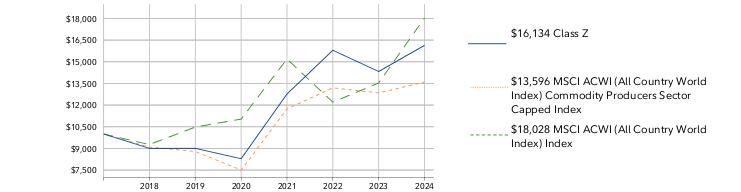
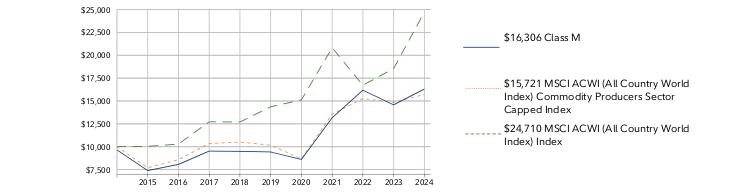
How did the Fund perform over the past 10 years?
CUMULATIVE PERFORMANCE
October 31, 2014 through October 31, 2024.
Initial investment of $10,000.
Class I | $10,000 | $7,707 | $8,449 | $10,054 | $10,084 | $10,078 | $9,261 | $14,259 | $17,619 | $15,958 | $17,945 |
MSCI ACWI (All Country World Index) Commodity Producers Sector Capped Index | $10,000 | $7,702 | $8,581 | $10,342 | $10,510 | $10,163 | $8,673 | $13,570 | $15,259 | $14,850 | $15,721 |
MSCI ACWI (All Country World Index) Index | $10,000 | $10,035 | $10,284 | $12,721 | $12,703 | $14,362 | $15,121 | $20,822 | $16,723 | $18,547 | $24,710 |
| | 2014 | 2015 | 2016 | 2017 | 2018 | 2019 | 2020 | 2021 | 2022 | 2023 | 2024 |
AVERAGE ANNUAL TOTAL RETURNS:| | 1 Year | 5 Year | 10 Year |
| Class I | 12.45% | 12.23% | 6.02% |
| MSCI ACWI (All Country World Index) Commodity Producers Sector Capped Index | 5.86% | 9.12% | 4.63% |
| MSCI ACWI (All Country World Index) Index | 33.23% | 11.46% | 9.47% |
Visit institutional.fidelity.com for more recent performance information. |
The Fund's past performance is not a good predictor of the Fund's future performance. The graph and table do not reflect the deduction of taxes that a shareholder would pay on fund distributions or redemption of fund shares. |
Key Fund Statistics(as of October 31, 2024)
KEY FACTS | | |
| Fund Size | $929,592,306 | |
| Number of Holdings | 61 | |
| Total Advisory Fee | $7,667,954 | |
| Portfolio Turnover | 49% | |
What did the Fund invest in?
(as of October 31, 2024)
TOP INDUSTRIES (% of Fund's net assets) |
| Oil, Gas & Consumable Fuels | 35.2 | |
| Metals & Mining | 30.1 | |
| Food Products | 10.3 | |
| Paper & Forest Products | 10.2 | |
| Energy Equipment & Services | 6.0 | |
| Chemicals | 4.9 | |
| Containers & Packaging | 1.6 | |
| Construction Materials | 0.6 | |
| Construction & Engineering | 0.2 | |
| Others | 0.1 | |
| |
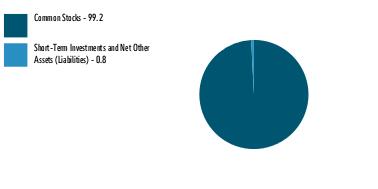
| Common Stocks | 99.2 |
| Short-Term Investments and Net Other Assets (Liabilities) | 0.8 |
ASSET ALLOCATION (% of Fund's net assets) |
|
|
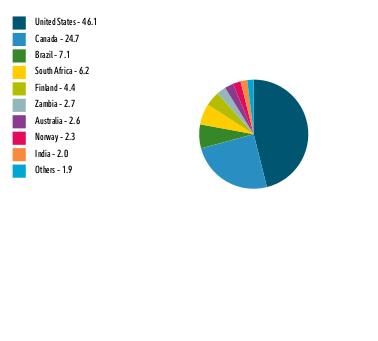
| United States | 46.1 |
| Canada | 24.7 |
| Brazil | 7.1 |
| South Africa | 6.2 |
| Finland | 4.4 |
| Zambia | 2.7 |
| Australia | 2.6 |
| Norway | 2.3 |
| India | 2.0 |
| Others | 1.9 |
GEOGRAPHIC DIVERSIFICATION (% of Fund's net assets) |
|
| |
|
TOP HOLDINGS(% of Fund's net assets) | | |
| Exxon Mobil Corp | 7.0 | |
| Shell PLC | 5.8 | |
| Archer-Daniels-Midland Co | 4.9 | |
| Wheaton Precious Metals Corp | 4.5 | |
| Teck Resources Ltd Class B | 4.2 | |
| Cenovus Energy Inc | 3.9 | |
| Energy Transfer LP | 3.4 | |
| JBS S/A | 3.3 | |
| UPM-Kymmene Oyj | 3.2 | |
| Antero Resources Corp | 3.2 | |
| | 43.4 | |
How has the Fund changed?
This is a summary of certain changes to the Fund since November 1, 2023. For more complete information, you may review the Fund's next prospectus, which we expect to be available by December 30, 2024 at fundresearch.fidelity.com/prospectus/sec or upon request at 1-877-208-0098 or by sending an e-mail to fidfunddocuments@fidelity.com.
The fund's transfer agent and pricing & bookkeeping fees were changed to a fixed rate effective December 1, 2023, through February 29, 2024, in anticipation of the transition to a new management fee structure. Effective March 1, 2024, the fund's management contract was amended to incorporate administrative services previously covered under separate services agreements (transfer agent and pricing & bookkeeping). The amended contract incorporates a management fee rate that may vary by class. The Adviser or an affiliate pays certain expenses of managing and operating the fund out of each class's management fee. | The fund's sub-advisory agreement with FIL Investments (Japan) Limited was not renewed.
|
| Fidelity, the Fidelity Investments Logo and all other Fidelity trademarks or service marks used herein are trademarks or service marks of FMR LLC. Any third-party marks that are used herein are trademarks or service marks of their respective owners. © 2024 FMR LLC. All rights reserved. |
| | For additional information about the Fund; including its prospectus, financial information, holdings and proxy information, scan the QR code or visit fundresearch.fidelity.com/prospectus/sec 1.9913959.100 2125-TSRA-1224 |
| |
| | ANNUAL SHAREHOLDER REPORT | AS OF OCTOBER 31, 2024 | This report describes changes to the Fund that occurred during the reporting period. |
| | Fidelity® Global Commodity Stock Fund Fidelity® Global Commodity Stock Fund : FFGCX |
| | | |
This annual shareholder report contains information about Fidelity® Global Commodity Stock Fund for the period November 1, 2023 to October 31, 2024. You can find additional information about the Fund at fundresearch.fidelity.com/prospectus/sec. You can also request this information by contacting us at 1-800-544-8544 or by sending an e-mail to fidfunddocuments@fidelity.com.
What were your Fund costs for the last year?(based on hypothetical $10,000 investment)
FUND COST (PREVIOUS YEAR)
| | Costs of a $10,000 investment | Costs paid as a percentage of a $10,000 investment | |
| Fidelity® Global Commodity Stock Fund | $ 94 | 0.89% | |
What affected the Fund's performance this period?
•Global equities posted a strong advance for the 12 months ending October 31, 2024. Resilient economic growth and a slowing in the pace of inflation in certain regions, as well as a shift to global monetary easing, contributed to a favorable backdrop, despite persistent geopolitical risk.
•Against this backdrop, security selection in the United States and an overweight in Canada contributed to the fund's performance versus the MSCI AC World Commodity Producers Sector Capped Index for the fiscal year.
•By industry, security selection was the primary contributor, led by our choices in the oil & gas storage & transportation industry. Stock picking and an underweight in agricultural products & services also boosted the fund's relative performance. Also lifting the fund's relative result was out-of-benchmark exposure to the packaged foods & meats category.
•The top individual relative contributor was our stake in Archer Daniels Midland (+0%). This was a stake we established this period. The stock was one of our biggest holdings. The second-largest relative contributor was an overweight in Wheaton Precious Metals (+58%). We reduced the position, but the stock was still one of the fund's biggest holdings as of October 31. An overweight in Teck Resources (+33%) also helped. We also trimmed this position, but it too was among the fund's largest holdings at period end.
•In contrast, from a regional standpoint, stock picking in Asia Pacific ex Japan, primarily in Australia, detracted from the fund's relative result, as did an underweight in emerging markets, primarily in China and India.
•By industry, notable detractors from performance versus the benchmark included picks and an overweight in oil & gas exploration & production. Stock selection and an underweight in diversified metals & mining also hampered the fund's relative result. Also detracting from our result was a small non-benchmark position in pharmaceuticals.
•The largest individual relative detractor was an underweight in Corteva (+28%). This period we decreased our investment in Corteva. The second-largest relative detractor was an underweight in Agnico Eagle Mines (+89%). The stock was not held at period end. Another notable relative detractor was an overweight in Cenovus Energy (-13%). The stock was one of the fund's largest holdings.
•Notable changes in positioning include increased exposure to South Africa and a lower allocation to Australia. By sector, meaningful changes in positioning include increased exposure to oil & gas equipment & services and packaged foods & meats.
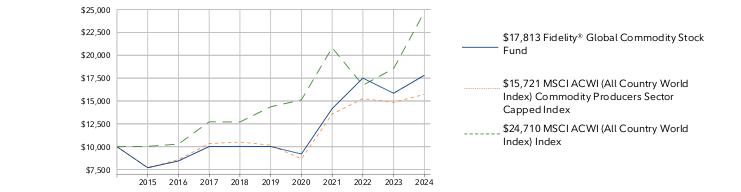
How did the Fund perform over the past 10 years?
CUMULATIVE PERFORMANCE
October 31, 2014 through October 31, 2024.
Initial investment of $10,000.
Fidelity® Global Commodity Stock Fund | $10,000 | $7,703 | $8,444 | $10,018 | $10,042 | $10,018 | $9,200 | $14,164 | $17,502 | $15,846 | $17,813 |
MSCI ACWI (All Country World Index) Commodity Producers Sector Capped Index | $10,000 | $7,702 | $8,581 | $10,342 | $10,510 | $10,163 | $8,673 | $13,570 | $15,259 | $14,850 | $15,721 |
MSCI ACWI (All Country World Index) Index | $10,000 | $10,035 | $10,284 | $12,721 | $12,703 | $14,362 | $15,121 | $20,822 | $16,723 | $18,547 | $24,710 |
| | 2014 | 2015 | 2016 | 2017 | 2018 | 2019 | 2020 | 2021 | 2022 | 2023 | 2024 |
AVERAGE ANNUAL TOTAL RETURNS:| | 1 Year | 5 Year | 10 Year |
| Fidelity® Global Commodity Stock Fund | 12.42% | 12.20% | 5.94% |
| MSCI ACWI (All Country World Index) Commodity Producers Sector Capped Index | 5.86% | 9.12% | 4.63% |
| MSCI ACWI (All Country World Index) Index | 33.23% | 11.46% | 9.47% |
Visit www.fidelity.com for more recent performance information. |
The Fund's past performance is not a good predictor of the Fund's future performance. The graph and table do not reflect the deduction of taxes that a shareholder would pay on fund distributions or redemption of fund shares. |
Key Fund Statistics(as of October 31, 2024)
KEY FACTS | | |
| Fund Size | $929,592,306 | |
| Number of Holdings | 61 | |
| Total Advisory Fee | $7,667,954 | |
| Portfolio Turnover | 49% | |
What did the Fund invest in?
(as of October 31, 2024)
TOP INDUSTRIES (% of Fund's net assets) |
| Oil, Gas & Consumable Fuels | 35.2 | |
| Metals & Mining | 30.1 | |
| Food Products | 10.3 | |
| Paper & Forest Products | 10.2 | |
| Energy Equipment & Services | 6.0 | |
| Chemicals | 4.9 | |
| Containers & Packaging | 1.6 | |
| Construction Materials | 0.6 | |
| Construction & Engineering | 0.2 | |
| Others | 0.1 | |
| |
| Common Stocks | 99.2 |
| Short-Term Investments and Net Other Assets (Liabilities) | 0.8 |
ASSET ALLOCATION (% of Fund's net assets) |
|
|
| United States | 46.1 |
| Canada | 24.7 |
| Brazil | 7.1 |
| South Africa | 6.2 |
| Finland | 4.4 |
| Zambia | 2.7 |
| Australia | 2.6 |
| Norway | 2.3 |
| India | 2.0 |
| Others | 1.9 |
GEOGRAPHIC DIVERSIFICATION (% of Fund's net assets) |
|
| |
|
TOP HOLDINGS(% of Fund's net assets) | | |
| Exxon Mobil Corp | 7.0 | |
| Shell PLC | 5.8 | |
| Archer-Daniels-Midland Co | 4.9 | |
| Wheaton Precious Metals Corp | 4.5 | |
| Teck Resources Ltd Class B | 4.2 | |
| Cenovus Energy Inc | 3.9 | |
| Energy Transfer LP | 3.4 | |
| JBS S/A | 3.3 | |
| UPM-Kymmene Oyj | 3.2 | |
| Antero Resources Corp | 3.2 | |
| | 43.4 | |
How has the Fund changed?
This is a summary of certain changes to the Fund since November 1, 2023. For more complete information, you may review the Fund's next prospectus, which we expect to be available by December 30, 2024 at fundresearch.fidelity.com/prospectus/sec or upon request at 1-800-544-8544 or by sending an e-mail to fidfunddocuments@fidelity.com.
The fees associated with this class changed during the reporting year.The variations in class fees are primarily the result of the following changes: - Management fee
- Operating expenses
- Expense reductions
The fund's transfer agent and pricing & bookkeeping fees were changed to a fixed rate effective December 1, 2023, through February 29, 2024, in anticipation of the transition to a new management fee structure. Effective March 1, 2024, the fund's management contract was amended to incorporate administrative services previously covered under separate services agreements (transfer agent and pricing & bookkeeping). The amended contract incorporates a management fee rate that may vary by class. The Adviser or an affiliate pays certain expenses of managing and operating the fund out of each class's management fee. | The fund's sub-advisory agreement with FIL Investments (Japan) Limited was not renewed.
|
| Fidelity, the Fidelity Investments Logo and all other Fidelity trademarks or service marks used herein are trademarks or service marks of FMR LLC. Any third-party marks that are used herein are trademarks or service marks of their respective owners. © 2024 FMR LLC. All rights reserved. |
| | For additional information about the Fund; including its prospectus, financial information, holdings and proxy information, scan the QR code or visit fundresearch.fidelity.com/prospectus/sec 1.9913955.100 2120-TSRA-1224 |
| |
| | ANNUAL SHAREHOLDER REPORT | AS OF OCTOBER 31, 2024 | |
| | Fidelity® Series Sustainable Non-U.S. Developed Markets Fund Fidelity® Series Sustainable Non-U.S. Developed Markets Fund : FNDMX |
| | | |
This annual shareholder report contains information about Fidelity® Series Sustainable Non-U.S. Developed Markets Fund for the period November 1, 2023 to October 31, 2024. You can find additional information about the Fund at fundresearch.fidelity.com/prospectus/sec. You can also request this information by contacting us at 1-800-544-8544.
What were your Fund costs for the last year?(based on hypothetical $10,000 investment)
FUND COST (PREVIOUS YEAR)
| | Costs of a $10,000 investment | Costs paid as a percentage of a $10,000 investment | |
| Fidelity® Series Sustainable Non-U.S. Developed Markets Fund | $ 2 | 0.01% | |
What affected the Fund's performance this period?
•International stocks achieved a strong gain for the 12 months ending October 31, 2024. Resilient global economic growth and a slowing in the pace of inflation in certain regions, as well as a shift to global monetary easing, contributed to a favorable backdrop, despite persistent geopolitical risk.
•Against this backdrop, an overweight in the United States and stock selection in Japan contributed to the fund's performance for the fiscal year.
•By sector, market selection was the primary contributor, especially an underweight in consumer staples, where an underweight in food, beverage & tobacco helped most. Stock picking and an overweight in industrials, primarily within the capital goods industry, also boosted the fund's relative performance. Also bolstering our relative result were picks in materials.
•The top individual relative contributor was an overweight in CRH (+81%). The company was among our biggest holdings. A second notable relative contributor was an overweight in Mitsubishi Heavy Industries (+183%). This period we increased our position in Mitsubishi Heavy Industries. An underweight in Samsung Electronics (-12%) also contributed.
•In contrast, from a regional standpoint, picks in the United States and Canada detracted from the fund's relative result.
•By sector, the biggest detractor from performance versus the benchmark was stock selection in information technology, primarily within the semiconductors & semiconductor equipment industry. Also hurting our result was stock picking in consumer discretionary and energy.
•The biggest individual relative detractor was an underweight in Taiwan Semiconductor (+101%). A second notable relative detractor was an overweight in TotalEnergies (-2%). The company was among the fund's biggest holdings this period. Another notable relative detractor was an overweight in LVMH Moet Hennessy Louis Vuitton (-6%). The stock was among the fund's biggest holdings.
•Notable changes in positioning include increased exposure to Germany and a lower allocation to France. By sector, meaningful changes in positioning include decreased exposure to energy and consumer discretionary.
Application of FMR's environmental, social, and governance (ESG) ratings process and/or its sustainable investing exclusion criteria may affect the Fund's exposure to certain issuers, sectors, regions, and countries and may affect the Fund's performance.
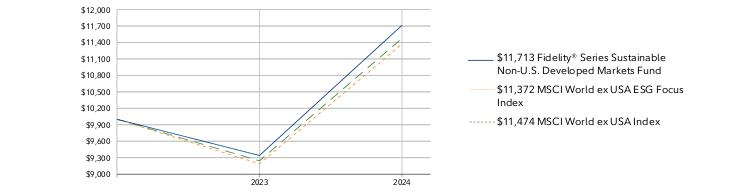
How did the Fund perform over the life of Fund?
CUMULATIVE PERFORMANCE
May 11, 2023 through October 31, 2024.
Initial investment of $10,000.
Fidelity® Series Sustainable Non-U.S. Developed Markets Fund | $10,000 | $9,340 |
MSCI World ex USA ESG Focus Index | $10,000 | $9,188 |
MSCI World ex USA Index | $10,000 | $9,244 |
| | 2023 | 2024 |
AVERAGE ANNUAL TOTAL RETURNS:| | 1 Year | Life of Fund A |
| Fidelity® Series Sustainable Non-U.S. Developed Markets Fund | 25.41% | 11.30% |
| MSCI World ex USA ESG Focus Index | 23.77% | 9.10% |
| MSCI World ex USA Index | 24.13% | 9.76% |
A From May 11, 2023
Visit www.fidelity.com for more recent performance information. |
The Fund's past performance is not a good predictor of the Fund's future performance. The graph and table do not reflect the deduction of taxes that a shareholder would pay on fund distributions or redemption of fund shares. |
Key Fund Statistics(as of October 31, 2024)
KEY FACTS | | |
| Fund Size | $15,731,574 | |
| Number of Holdings | 389 | |
| Total Advisory Fee | $0 | |
| Portfolio Turnover | 33% | |
What did the Fund invest in?
(as of October 31, 2024)
MARKET SECTORS (% of Fund's net assets) | | |
| Financials | 23.4 | |
| Industrials | 22.6 | |
| Information Technology | 12.7 | |
| Materials | 8.5 | |
| Consumer Discretionary | 8.3 | |
| Health Care | 6.9 | |
| Energy | 4.4 | |
| Consumer Staples | 4.2 | |
| Communication Services | 1.6 | |
| Real Estate | 0.7 | |
| Utilities | 0.5 | |
| |
| Common Stocks | 93.7 |
| Preferred Stocks | 0.1 |
| Short-Term Investments and Net Other Assets (Liabilities) | 6.2 |
ASSET ALLOCATION (% of Fund's net assets) |
|
|
| United States | 16.9 |
| Japan | 15.3 |
| United Kingdom | 14.0 |
| Canada | 12.0 |
| France | 7.9 |
| Germany | 7.1 |
| Netherlands | 3.9 |
| Switzerland | 3.7 |
| Sweden | 3.3 |
| Others | 15.9 |
GEOGRAPHIC DIVERSIFICATION (% of Fund's net assets) |
|
| |
|
TOP HOLDINGS(% of Fund's net assets) | | |
| SAP SE | 2.5 | |
| Novo Nordisk A/S Series B | 2.3 | |
| ASML Holding NV | 2.3 | |
| CRH PLC | 1.8 | |
| BAE Systems PLC | 1.5 | |
| Linde PLC | 1.5 | |
| Hitachi Ltd | 1.3 | |
| RELX PLC | 1.3 | |
| LVMH Moet Hennessy Louis Vuitton SE | 1.2 | |
| Schneider Electric SE | 1.0 | |
| | 16.7 | |
| Fidelity, the Fidelity Investments Logo and all other Fidelity trademarks or service marks used herein are trademarks or service marks of FMR LLC. Any third-party marks that are used herein are trademarks or service marks of their respective owners. © 2024 FMR LLC. All rights reserved. |
| | For additional information about the Fund; including its prospectus, financial information, holdings and proxy information, scan the QR code or visit fundresearch.fidelity.com/prospectus/sec 1.9914034.100 7318-TSRA-1224 |
| |
| | ANNUAL SHAREHOLDER REPORT | AS OF OCTOBER 31, 2024 | |
| | Fidelity® Series Emerging Markets Opportunities Fund Fidelity® Series Emerging Markets Opportunities Fund : FEMSX |
| | | |
This annual shareholder report contains information about Fidelity® Series Emerging Markets Opportunities Fund for the period November 1, 2023 to October 31, 2024. You can find additional information about the Fund at fundresearch.fidelity.com/prospectus/sec. You can also request this information by contacting us at 1-800-544-8544.
What were your Fund costs for the last year?(based on hypothetical $10,000 investment)
FUND COST (PREVIOUS YEAR)
| | Costs of a $10,000 investment | Costs paid as a percentage of a $10,000 investment | |
| Fidelity® Series Emerging Markets Opportunities Fund | $ 2 | 0.01% | |
What affected the Fund's performance this period?
•International stocks achieved a strong gain for the 12 months ending October 31, 2024. Resilient global economic growth and a slowing in the pace of inflation in certain regions, as well as a shift to global monetary easing, contributed to a favorable backdrop, despite persistent geopolitical risk.
•Against this backdrop, security selection and an underweight in Emerging Asia and stock selection in Emerging Europe contributed to the fund's performance versus the MSCI Emerging Markets Net MA (29-Jun-2018) Linked Index for the fiscal year.
•By sector, security selection in communication services was the primary contributor. Stock picking in consumer discretionary and materials also boosted the fund's relative performance.
•The fund's non-benchmark stake in Sea gained roughly 123% and was the top individual relative contributor. The company was one of our biggest holdings this period. The second-largest relative contributor was an overweight in Zomato (+125%). Another notable relative contributor was an overweight in Taiwan Semiconductor (+101%). The stock was the fund's largest holding.
•In contrast, from a regional standpoint, security selection in Latin America, primarily in Brazil, and a non-benchmark allocation to developed markets detracted from the fund's relative result.
•By sector, the biggest detractor from performance versus the benchmark was security selection in financials. Picks in health care, primarily within the pharmaceuticals, biotechnology & life sciences industry, also hampered the fund's result. Also hurting our result were stock picking and an underweight in information technology, primarily within the technology hardware & equipment industry.
•The largest individual relative detractor was our stake in Hon Hai Precision Industry (+51%). This period we increased our position in Hon Hai Precision Industry. A second notable relative detractor was an overweight in XP (-10%). An underweight in MediaTek (+63%) also detracted. This was a position we established this period.
•Notable changes in positioning include higher allocations to Taiwan and South Africa. By sector, meaningful changes in positioning include increased exposure to information technology and a lower allocation to consumer staples.
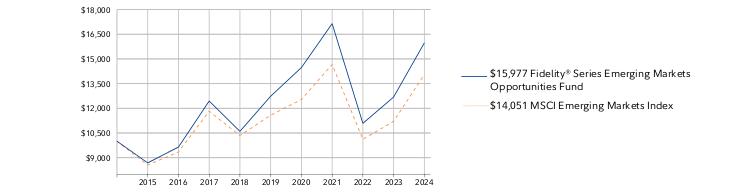
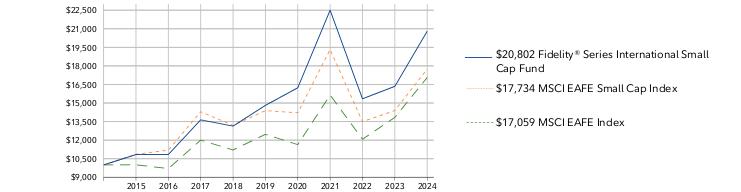
How did the Fund perform over the past 10 years?
CUMULATIVE PERFORMANCE
October 31, 2014 through October 31, 2024.
Initial investment of $10,000.
Fidelity® Series Emerging Markets Opportunities Fund | $10,000 | $8,686 | $9,643 | $12,443 | $10,600 | $12,734 | $14,474 | $17,142 | $11,086 | $12,683 | $15,977 |
MSCI Emerging Markets Index | $10,000 | $8,550 | $9,346 | $11,823 | $10,347 | $11,577 | $12,535 | $14,663 | $10,115 | $11,211 | $14,051 |
| | 2014 | 2015 | 2016 | 2017 | 2018 | 2019 | 2020 | 2021 | 2022 | 2023 | 2024 |
AVERAGE ANNUAL TOTAL RETURNS:| | 1 Year | 5 Year | 10 Year |
| Fidelity® Series Emerging Markets Opportunities Fund | 25.97% | 4.64% | 4.80% |
| MSCI Emerging Markets Index | 25.33% | 3.95% | 3.46% |
Visit www.fidelity.com for more recent performance information. |
The Fund's past performance is not a good predictor of the Fund's future performance. The graph and table do not reflect the deduction of taxes that a shareholder would pay on fund distributions or redemption of fund shares. |
Key Fund Statistics(as of October 31, 2024)
KEY FACTS | | |
| Fund Size | $23,808,570,285 | |
| Number of Holdings | 274 | |
| Total Advisory Fee | $0 | |
| Portfolio Turnover | 49% | |
What did the Fund invest in?
(as of October 31, 2024)
MARKET SECTORS (% of Fund's net assets) | | |
| Information Technology | 22.9 | |
| Financials | 21.9 | |
| Consumer Discretionary | 15.6 | |
| Communication Services | 9.3 | |
| Materials | 6.5 | |
| Industrials | 5.8 | |
| Consumer Staples | 5.3 | |
| Energy | 4.5 | |
| Health Care | 3.0 | |
| Utilities | 3.0 | |
| Real Estate | 1.2 | |
| |
| Common Stocks | 98.0 |
| Preferred Stocks | 1.0 |
| Bonds | 0.1 |
| Short-Term Investments and Net Other Assets (Liabilities) | 0.9 |
ASSET ALLOCATION (% of Fund's net assets) |
|
|
| China | 31.1 |
| Taiwan | 17.8 |
| India | 17.0 |
| Korea (South) | 8.2 |
| Brazil | 5.9 |
| South Africa | 3.8 |
| Saudi Arabia | 3.7 |
| United States | 2.1 |
| Indonesia | 2.1 |
| Others | 8.3 |
GEOGRAPHIC DIVERSIFICATION (% of Fund's net assets) |
|
| |
|
TOP HOLDINGS(% of Fund's net assets) | | |
| Taiwan Semiconductor Manufacturing Co Ltd | 11.7 | |
| Tencent Holdings Ltd | 5.3 | |
| Samsung Electronics Co Ltd | 3.1 | |
| Alibaba Group Holding Ltd | 2.5 | |
| HDFC Bank Ltd | 2.4 | |
| PDD Holdings Inc Class A ADR | 1.9 | |
| China Construction Bank Corp H Shares | 1.9 | |
| Meituan B Shares | 1.8 | |
| SK Hynix Inc | 1.7 | |
| Sea Ltd Class A ADR | 1.3 | |
| | 33.6 | |
| Fidelity, the Fidelity Investments Logo and all other Fidelity trademarks or service marks used herein are trademarks or service marks of FMR LLC. Any third-party marks that are used herein are trademarks or service marks of their respective owners. © 2024 FMR LLC. All rights reserved. |
| | For additional information about the Fund; including its prospectus, financial information, holdings and proxy information, scan the QR code or visit fundresearch.fidelity.com/prospectus/sec 1.9913954.100 2117-TSRA-1224 |
| |
| | ANNUAL SHAREHOLDER REPORT | AS OF OCTOBER 31, 2024 | This report describes changes to the Fund that occurred during the reporting period. |
| | Fidelity® Sustainable International Equity Fund Fidelity Advisor® Sustainable International Equity Fund Class C : FSYCX |
| | | |
This annual shareholder report contains information about Fidelity® Sustainable International Equity Fund for the period November 1, 2023 to October 31, 2024. You can find additional information about the Fund at fundresearch.fidelity.com/prospectus/sec. You can also request this information by contacting us at 1-877-208-0098 or by sending an e-mail to fidfunddocuments@fidelity.com.
What were your Fund costs for the last year?(based on hypothetical $10,000 investment)
FUND COST (PREVIOUS YEAR)
| | Costs of a $10,000 investment | Costs paid as a percentage of a $10,000 investment | |
| Class C | $ 230 | 2.05% | |
What affected the Fund's performance this period?
•International stocks achieved a strong gain for the 12 months ending October 31, 2024. Resilient global economic growth and a slowing in the pace of inflation in certain regions, as well as a shift to global monetary easing, contributed to a favorable backdrop, despite persistent geopolitical risk.
•Against this backdrop, security selection in Japan and the U.K. contributed to the fund's performance versus the MSCI EAFE Index (Net MA) for the fiscal year.
•By sector, the biggest contributor to performance versus the benchmark was stock picking in industrials, primarily within the capital goods industry. Stock picks in materials also boosted the fund's relative performance. Also bolstering our relative result was an underweight in energy.
•The top individual relative contributor was an overweight in Hitachi (+108%), the fund's biggest holding at period end. The second-largest relative contributor was our non-benchmark stake in Taiwan Semiconductor (+95%). The stock was among the fund's largest holdings. An overweight in UCB (+165%) also helped.
•In contrast, from a regional standpoint, security selection and an underweight in Asia Pacific ex Japan, primarily in Hong Kong, and an underweight in Japan detracted from the fund's relative result.
•By sector, the biggest detractor from performance versus the benchmark was stock selection in financials. Stock selection in consumer staples also hampered the fund's result. Also detracting from our result was an underweight in industrials, primarily within the capital goods industry. Lastly, the fund's position in cash detracted.
•The largest individual relative detractor was an overweight in Sony (+10%), which was among the fund's biggest holdings. The second-largest relative detractor was an overweight in AIA (-6%). Another notable relative detractor was an overweight in L'Oréal (-9%).
•Notable changes in positioning include decreased exposure to Germany and a higher allocation to Japan. By sector, meaningful changes in positioning include increased exposure to industrials and a lower allocation to consumer staples.
Application of FMR's environmental, social and governance ratings process and/or its sustainable investing exclusion criteria may affect the fund's exposure to certain issuers, sectors, regions and countries, and may affect the fund's performance.
How did the Fund perform over the life of Fund?
CUMULATIVE PERFORMANCE
February 10, 2022 through October 31, 2024.
Initial investment of $10,000.
Class C | $10,000 | $7,160 | $7,780 |
MSCI EAFE ESG Leaders | $10,000 | $7,669 | $8,792 |
MSCI EAFE Index | $10,000 | $7,820 | $8,966 |
| | 2022 | 2023 | 2024 |
AVERAGE ANNUAL TOTAL RETURNS:| | 1 Year | Life of Fund A |
| Class C (incl. contingent deferred sales charge) | 23.60% | -1.14% |
| Class C | 24.60% | -1.14% |
| MSCI EAFE ESG Leaders | 22.13% | 2.65% |
| MSCI EAFE Index | 23.25% | 3.74% |
A From February 10, 2022
Visit institutional.fidelity.com for more recent performance information. |
The Fund's past performance is not a good predictor of the Fund's future performance. The graph and table do not reflect the deduction of taxes that a shareholder would pay on fund distributions or redemption of fund shares. |
Key Fund Statistics(as of October 31, 2024)
KEY FACTS | | |
| Fund Size | $10,747,030 | |
| Number of Holdings | 83 | |
| Total Advisory Fee | $67,920 | |
| Portfolio Turnover | 50% | |
What did the Fund invest in?
(as of October 31, 2024)
MARKET SECTORS (% of Fund's net assets) | | |
| Financials | 25.6 | |
| Industrials | 21.7 | |
| Health Care | 13.0 | |
| Consumer Discretionary | 11.0 | |
| Information Technology | 9.0 | |
| Materials | 6.5 | |
| Consumer Staples | 4.5 | |
| Utilities | 3.0 | |
| Communication Services | 2.1 | |
| Real Estate | 1.1 | |
| |
| Common Stocks | 97.5 |
| Short-Term Investments and Net Other Assets (Liabilities) | 2.5 |
ASSET ALLOCATION (% of Fund's net assets) |
|
|
| Japan | 21.7 |
| United Kingdom | 14.1 |
| United States | 10.5 |
| France | 9.8 |
| Netherlands | 8.4 |
| Germany | 6.7 |
| Denmark | 5.1 |
| Italy | 3.8 |
| Australia | 3.7 |
| Others | 16.2 |
GEOGRAPHIC DIVERSIFICATION (% of Fund's net assets) |
|
| |
|
TOP HOLDINGS(% of Fund's net assets) | | |
| Novo Nordisk A/S Series B | 4.4 | |
| Hitachi Ltd | 4.3 | |
| ITOCHU Corp | 3.5 | |
| CRH PLC (United Kingdom) | 2.9 | |
| ORIX Corp | 2.8 | |
| ASML Holding NV | 2.7 | |
| Sony Group Corp | 2.6 | |
| Schneider Electric SE | 2.6 | |
| Taiwan Semiconductor Manufacturing Co Ltd | 2.5 | |
| Unilever PLC | 2.4 | |
| | 30.7 | |
How has the Fund changed?
This is a summary of certain changes to the Fund since November 1, 2023. For more complete information, you may review the Fund's next prospectus, which we expect to be available by December 30, 2024 at fundresearch.fidelity.com/prospectus/sec or upon request at 1-877-208-0098 or by sending an e-mail to fidfunddocuments@fidelity.com.
The fund's transfer agent and pricing & bookkeeping fees were changed to a fixed rate effective December 1, 2023, through February 29, 2024, in anticipation of the transition to a new management fee structure. Effective March 1, 2024, the fund's management contract was amended to incorporate administrative services previously covered under separate services agreements (transfer agent and pricing & bookkeeping). The amended contract incorporates a basic fee rate that may vary by class (subject to a performance adjustment). The Adviser or an affiliate pays certain expenses of managing and operating the fund out of each class's management fee. | |
| Fidelity, the Fidelity Investments Logo and all other Fidelity trademarks or service marks used herein are trademarks or service marks of FMR LLC. Any third-party marks that are used herein are trademarks or service marks of their respective owners. © 2024 FMR LLC. All rights reserved. |
| | For additional information about the Fund; including its prospectus, financial information, holdings and proxy information, scan the QR code or visit fundresearch.fidelity.com/prospectus/sec 1.9914020.100 6464-TSRA-1224 |
| |
| | ANNUAL SHAREHOLDER REPORT | AS OF OCTOBER 31, 2024 | This report describes changes to the Fund that occurred during the reporting period. |
| | Fidelity® SAI Sustainable Emerging Markets Equity Fund Fidelity® SAI Sustainable Emerging Markets Equity Fund : FSSGX |
| | | |
This annual shareholder report contains information about Fidelity® SAI Sustainable Emerging Markets Equity Fund for the period November 1, 2023 to October 31, 2024. You can find additional information about the Fund at fundresearch.fidelity.com/prospectus/sec. You can also request this information by contacting us at 1-800-544-3455 or by sending an e-mail to fidfunddocuments@fidelity.com.
What were your Fund costs for the last year?(based on hypothetical $10,000 investment)
FUND COST (PREVIOUS YEAR)
| | Costs of a $10,000 investment | Costs paid as a percentage of a $10,000 investment | |
| Fidelity® SAI Sustainable Emerging Markets Equity Fund | $ 107 | 0.95% | |
What affected the Fund's performance this period?
•International stocks achieved a strong gain for the 12 months ending October 31, 2024. Resilient global economic growth and a slowing in the pace of inflation in certain regions, as well as a shift to global monetary easing, contributed to a favorable backdrop, despite persistent geopolitical risk.
•Against this backdrop, stock selection in China dominated among contributors to the fund's performance versus the MSCI Emerging Markets Index for the fiscal year. By sector, security selection in consumer discretionary was the primary contributor.
•The top individual relative contributor was an out-of-benchmark stake in SK Hynix (+60%), which was one of the fund's largest holdings at period end. Non-benchmark exposure to Meituan (+68%) also lifted the fund's relative result. We added to the position. A non-benchmark stake in International Games System gained approximately 80% and notably helped. The stock was not held at period end.
•In contrast, from a regional standpoint, overweight exposure and stock selection in Latin America, especially Brazil and Mexico, detracted from the fund's relative result. Positioning in South Korea and a sizable underweight in Taiwan also worked against the fund's relative performance. By sector, the biggest detractor from performance versus the benchmark was security selection in information technology.
•The biggest individual relative detractor was an overweight in Samsung Electronics (-12%). The stock was one of our biggest holdings. Underweighting Taiwan Semiconductor Manufacturing (+100%) - the portfolio's largest holding as of period end - also held back the fund's relative result. A non-benchmark stake in Vamos Locacao de Caminhoes returned -43% and was the third-largest relative detractor. This was an investment we established this period.
•Notable changes in positioning include increased exposure to South Africa and a lower allocation to South Korea. By sector, meaningful changes in positioning include decreased exposure to consumer staples and a higher allocation to financials.
Application of FMR's environmental, social and governance ratings process and/or its sustainable investing exclusion criteria may affect the fund's exposure to certain issuers, sectors, regions and countries, and may affect the fund's performance.
How did the Fund perform over the life of Fund?
CUMULATIVE PERFORMANCE
April 14, 2022 through October 31, 2024.
Initial investment of $10,000.
Fidelity® SAI Sustainable Emerging Markets Equity Fund | $10,000 | $7,600 | $8,644 |
MSCI Emerging Markets (EM) ESG Leaders Index | $10,000 | $7,416 | $8,227 |
MSCI Emerging Markets Index | $10,000 | $7,742 | $8,581 |
| | 2022 | 2023 | 2024 |
AVERAGE ANNUAL TOTAL RETURNS:| | 1 Year | Life of Fund A |
| Fidelity® SAI Sustainable Emerging Markets Equity Fund | 25.12% | 3.12% |
| MSCI Emerging Markets (EM) ESG Leaders Index | 28.51% | 2.21% |
| MSCI Emerging Markets Index | 25.33% | 2.89% |
A From April 14, 2022
Visit www.fidelity.com for more recent performance information. |
The Fund's past performance is not a good predictor of the Fund's future performance. The graph and table do not reflect the deduction of taxes that a shareholder would pay on fund distributions or redemption of fund shares. |
Key Fund Statistics(as of October 31, 2024)
KEY FACTS | | |
| Fund Size | $38,790,601 | |
| Number of Holdings | 126 | |
| Total Advisory Fee | $178,506 | |
| Portfolio Turnover | 103% | |
What did the Fund invest in?
(as of October 31, 2024)
MARKET SECTORS (% of Fund's net assets) | | |
| Financials | 24.7 | |
| Information Technology | 24.5 | |
| Consumer Discretionary | 17.5 | |
| Communication Services | 8.9 | |
| Industrials | 5.2 | |
| Health Care | 4.2 | |
| Materials | 3.6 | |
| Consumer Staples | 2.9 | |
| Energy | 2.2 | |
| Real Estate | 1.3 | |
| Utilities | 0.7 | |
| |
| Common Stocks | 95.7 |
| Short-Term Investments and Net Other Assets (Liabilities) | 4.3 |
ASSET ALLOCATION (% of Fund's net assets) |
|
|
| China | 31.1 |
| Taiwan | 15.9 |
| India | 13.2 |
| Korea (South) | 9.6 |
| Brazil | 6.3 |
| South Africa | 5.1 |
| United States | 4.3 |
| Mexico | 3.5 |
| Indonesia | 2.3 |
| Others | 8.7 |
GEOGRAPHIC DIVERSIFICATION (% of Fund's net assets) |
|
| |
|
TOP HOLDINGS(% of Fund's net assets) | | |
| Taiwan Semiconductor Manufacturing Co Ltd | 10.5 | |
| Tencent Holdings Ltd | 6.3 | |
| Alibaba Group Holding Ltd | 4.3 | |
| Samsung Electronics Co Ltd | 4.2 | |
| Hon Hai Precision Industry Co Ltd | 2.0 | |
| Bank Central Asia Tbk PT | 2.0 | |
| SK Hynix Inc | 1.8 | |
| China Construction Bank Corp H Shares | 1.7 | |
| HDFC Bank Ltd | 1.7 | |
| Bharti Airtel Ltd | 1.6 | |
| | 36.1 | |
How has the Fund changed?
This is a summary of certain changes to the Fund since November 1, 2023. For more complete information, you may review the Fund's next prospectus, which we expect to be available by December 30, 2024 at fundresearch.fidelity.com/prospectus/sec or upon request at 1-800-544-3455 or by sending an e-mail to fidfunddocuments@fidelity.com.
The fund's contractual management fee was reduced during the reporting period. | |
| Fidelity, the Fidelity Investments Logo and all other Fidelity trademarks or service marks used herein are trademarks or service marks of FMR LLC. Any third-party marks that are used herein are trademarks or service marks of their respective owners. © 2024 FMR LLC. All rights reserved. |
| | For additional information about the Fund; including its prospectus, financial information, holdings and proxy information, scan the QR code or visit fundresearch.fidelity.com/prospectus/sec 1.9914030.100 6548-TSRA-1224 |
| |
| | ANNUAL SHAREHOLDER REPORT | AS OF OCTOBER 31, 2024 | This report describes changes to the Fund that occurred during the reporting period. |
| | Fidelity® Global Commodity Stock Fund Fidelity Advisor® Global Commodity Stock Fund Class A : FFGAX |
| | | |
This annual shareholder report contains information about Fidelity® Global Commodity Stock Fund for the period November 1, 2023 to October 31, 2024. You can find additional information about the Fund at fundresearch.fidelity.com/prospectus/sec. You can also request this information by contacting us at 1-877-208-0098 or by sending an e-mail to fidfunddocuments@fidelity.com.
What were your Fund costs for the last year?(based on hypothetical $10,000 investment)
FUND COST (PREVIOUS YEAR)
| | Costs of a $10,000 investment | Costs paid as a percentage of a $10,000 investment | |
| Class A | $ 123 | 1.16% | |
What affected the Fund's performance this period?
•Global equities posted a strong advance for the 12 months ending October 31, 2024. Resilient economic growth and a slowing in the pace of inflation in certain regions, as well as a shift to global monetary easing, contributed to a favorable backdrop, despite persistent geopolitical risk.
•Against this backdrop, security selection in the United States and an overweight in Canada contributed to the fund's performance versus the MSCI AC World Commodity Producers Sector Capped Index for the fiscal year.
•By industry, security selection was the primary contributor, led by our choices in the oil & gas storage & transportation industry. Stock picking and an underweight in agricultural products & services also boosted the fund's relative performance. Also lifting the fund's relative result was out-of-benchmark exposure to the packaged foods & meats category.
•The top individual relative contributor was our stake in Archer Daniels Midland (+0%). This was a stake we established this period. The stock was one of our biggest holdings. The second-largest relative contributor was an overweight in Wheaton Precious Metals (+58%). We reduced the position, but the stock was still one of the fund's biggest holdings as of October 31. An overweight in Teck Resources (+33%) also helped. We also trimmed this position, but it too was among the fund's largest holdings at period end.
•In contrast, from a regional standpoint, stock picking in Asia Pacific ex Japan, primarily in Australia, detracted from the fund's relative result, as did an underweight in emerging markets, primarily in China and India.
•By industry, notable detractors from performance versus the benchmark included picks and an overweight in oil & gas exploration & production. Stock selection and an underweight in diversified metals & mining also hampered the fund's relative result. Also detracting from our result was a small non-benchmark position in pharmaceuticals.
•The largest individual relative detractor was an underweight in Corteva (+28%). This period we decreased our investment in Corteva. The second-largest relative detractor was an underweight in Agnico Eagle Mines (+89%). The stock was not held at period end. Another notable relative detractor was an overweight in Cenovus Energy (-13%). The stock was one of the fund's largest holdings.
•Notable changes in positioning include increased exposure to South Africa and a lower allocation to Australia. By sector, meaningful changes in positioning include increased exposure to oil & gas equipment & services and packaged foods & meats.
How did the Fund perform over the past 10 years?
CUMULATIVE PERFORMANCE
October 31, 2014 through October 31, 2024.
Initial investment of $10,000 and the current sales charge was paid.
Class A | $9,425 | $7,242 | $7,915 | $9,382 | $9,377 | $9,336 | $8,553 | $13,118 | $16,170 | $14,611 | $16,384 |
MSCI ACWI (All Country World Index) Commodity Producers Sector Capped Index | $10,000 | $7,702 | $8,581 | $10,342 | $10,510 | $10,163 | $8,673 | $13,570 | $15,259 | $14,850 | $15,721 |
MSCI ACWI (All Country World Index) Index | $10,000 | $10,035 | $10,284 | $12,721 | $12,703 | $14,362 | $15,121 | $20,822 | $16,723 | $18,547 | $24,710 |
| | 2014 | 2015 | 2016 | 2017 | 2018 | 2019 | 2020 | 2021 | 2022 | 2023 | 2024 |
AVERAGE ANNUAL TOTAL RETURNS:| | 1 Year | 5 Year | 10 Year |
| Class A (incl. 5.75% sales charge) | 5.68% | 10.59% | 5.06% |
| Class A (without 5.75% sales charge) | 12.13% | 11.91% | 5.69% |
| MSCI ACWI (All Country World Index) Commodity Producers Sector Capped Index | 5.86% | 9.12% | 4.63% |
| MSCI ACWI (All Country World Index) Index | 33.23% | 11.46% | 9.47% |
Visit institutional.fidelity.com for more recent performance information. |
The Fund's past performance is not a good predictor of the Fund's future performance. The graph and table do not reflect the deduction of taxes that a shareholder would pay on fund distributions or redemption of fund shares. |
Key Fund Statistics(as of October 31, 2024)
KEY FACTS | | |
| Fund Size | $929,592,306 | |
| Number of Holdings | 61 | |
| Total Advisory Fee | $7,667,954 | |
| Portfolio Turnover | 49% | |
What did the Fund invest in?
(as of October 31, 2024)
TOP INDUSTRIES (% of Fund's net assets) |
| Oil, Gas & Consumable Fuels | 35.2 | |
| Metals & Mining | 30.1 | |
| Food Products | 10.3 | |
| Paper & Forest Products | 10.2 | |
| Energy Equipment & Services | 6.0 | |
| Chemicals | 4.9 | |
| Containers & Packaging | 1.6 | |
| Construction Materials | 0.6 | |
| Construction & Engineering | 0.2 | |
| Others | 0.1 | |
| |
| Common Stocks | 99.2 |
| Short-Term Investments and Net Other Assets (Liabilities) | 0.8 |
ASSET ALLOCATION (% of Fund's net assets) |
|
|
| United States | 46.1 |
| Canada | 24.7 |
| Brazil | 7.1 |
| South Africa | 6.2 |
| Finland | 4.4 |
| Zambia | 2.7 |
| Australia | 2.6 |
| Norway | 2.3 |
| India | 2.0 |
| Others | 1.9 |
GEOGRAPHIC DIVERSIFICATION (% of Fund's net assets) |
|
| |
|
TOP HOLDINGS(% of Fund's net assets) | | |
| Exxon Mobil Corp | 7.0 | |
| Shell PLC | 5.8 | |
| Archer-Daniels-Midland Co | 4.9 | |
| Wheaton Precious Metals Corp | 4.5 | |
| Teck Resources Ltd Class B | 4.2 | |
| Cenovus Energy Inc | 3.9 | |
| Energy Transfer LP | 3.4 | |
| JBS S/A | 3.3 | |
| UPM-Kymmene Oyj | 3.2 | |
| Antero Resources Corp | 3.2 | |
| | 43.4 | |
How has the Fund changed?
This is a summary of certain changes to the Fund since November 1, 2023. For more complete information, you may review the Fund's next prospectus, which we expect to be available by December 30, 2024 at fundresearch.fidelity.com/prospectus/sec or upon request at 1-877-208-0098 or by sending an e-mail to fidfunddocuments@fidelity.com.
The fund's transfer agent and pricing & bookkeeping fees were changed to a fixed rate effective December 1, 2023, through February 29, 2024, in anticipation of the transition to a new management fee structure. Effective March 1, 2024, the fund's management contract was amended to incorporate administrative services previously covered under separate services agreements (transfer agent and pricing & bookkeeping). The amended contract incorporates a management fee rate that may vary by class. The Adviser or an affiliate pays certain expenses of managing and operating the fund out of each class's management fee. | The fund's sub-advisory agreement with FIL Investments (Japan) Limited was not renewed.
|
| Fidelity, the Fidelity Investments Logo and all other Fidelity trademarks or service marks used herein are trademarks or service marks of FMR LLC. Any third-party marks that are used herein are trademarks or service marks of their respective owners. © 2024 FMR LLC. All rights reserved. |
| | For additional information about the Fund; including its prospectus, financial information, holdings and proxy information, scan the QR code or visit fundresearch.fidelity.com/prospectus/sec 1.9913956.100 2121-TSRA-1224 |
| |
| | ANNUAL SHAREHOLDER REPORT | AS OF OCTOBER 31, 2024 | This report describes changes to the Fund that occurred during the reporting period. |
| | Fidelity® Series Sustainable Emerging Markets Fund Fidelity® Series Sustainable Emerging Markets Fund : FEMYX |
| | | |
This annual shareholder report contains information about Fidelity® Series Sustainable Emerging Markets Fund for the period November 1, 2023 to October 31, 2024. You can find additional information about the Fund at fundresearch.fidelity.com/prospectus/sec. You can also request this information by contacting us at 1-800-544-8544.
What were your Fund costs for the last year?(based on hypothetical $10,000 investment)
FUND COST (PREVIOUS YEAR)
| | Costs of a $10,000 investment | Costs paid as a percentage of a $10,000 investment | |
| Fidelity® Series Sustainable Emerging Markets Fund | $ 1 | 0.01% | |
What affected the Fund's performance this period?
•International stocks achieved a strong gain for the 12 months ending October 31, 2024. Resilient global economic growth and a slowing in the pace of inflation in certain regions, as well as a shift to global monetary easing, contributed to a favorable backdrop, despite persistent geopolitical risk.
•Against this backdrop, stock selection in emerging markets, primarily in India, and a non-benchmark allocation to the United States detracted from the fund's performance for the fiscal year.
•By sector, security selection was the primary detractor, especially within financials. Also hurting our result was stock selection in health care and utilities.
•The largest individual relative detractor was an underweight in Hon Hai Precision Industry (+128%). This was a stake we established this period. A second notable relative detractor was an overweight in HDFC Bank (+13%). The stock was among our largest holdings. Another notable relative detractor was an overweight in Li Auto (-20%).
•In contrast, from a regional standpoint, an underweight in emerging markets, primarily in China, and a non-benchmark allocation to the U.K. contributed to the fund's relative result.
•By sector, the biggest contributors to performance versus the benchmark were picks and an underweight in materials. Stock picking and an overweight in consumer discretionary and stock picks and an underweight in consumer staples, primarily within the food, beverage & tobacco industry, also boosted the fund's relative performance.
•The top individual relative contributor was an overweight in Capitec Bank Holdings (+105%). A second notable relative contributor was an overweight in Taiwan Semiconductor (+90%). The stock was the fund's biggest holding. Another notable relative contributor was an overweight in Trip.com (+91%).
•Notable changes in positioning include higher allocations to South Africa and Taiwan. By sector, meaningful changes in positioning include decreased exposure to consumer staples and communication services.
Application of FMR's environmental, social, and governance (ESG) ratings process and/or its sustainable investing exclusion criteria may affect the Fund's exposure to certain issuers, sectors, regions, and countries and may affect the Fund's performance.
How did the Fund perform over the life of Fund?
CUMULATIVE PERFORMANCE
May 11, 2023 through October 31, 2024.
Initial investment of $10,000.
Fidelity® Series Sustainable Emerging Markets Fund | $10,000 | $9,620 |
MSCI Emerging Markets ESG Focus Index | $10,000 | $9,561 |
MSCI Emerging Markets Index | $10,000 | $9,509 |
| | 2023 | 2024 |
AVERAGE ANNUAL TOTAL RETURNS:| | 1 Year | Life of Fund A |
| Fidelity® Series Sustainable Emerging Markets Fund | 23.47% | 12.36% |
| MSCI Emerging Markets ESG Focus Index | 23.58% | 11.96% |
| MSCI Emerging Markets Index | 25.33% | 12.61% |
A From May 11, 2023
Visit www.fidelity.com for more recent performance information. |
The Fund's past performance is not a good predictor of the Fund's future performance. The graph and table do not reflect the deduction of taxes that a shareholder would pay on fund distributions or redemption of fund shares. |
Key Fund Statistics(as of October 31, 2024)
KEY FACTS | | |
| Fund Size | $9,757,678 | |
| Number of Holdings | 184 | |
| Total Advisory Fee | $0 | |
| Portfolio Turnover | 47% | |
What did the Fund invest in?
(as of October 31, 2024)
MARKET SECTORS (% of Fund's net assets) | | |
| Financials | 23.2 | |
| Information Technology | 22.9 | |
| Consumer Discretionary | 15.8 | |
| Communication Services | 7.4 | |
| Industrials | 5.5 | |
| Energy | 4.5 | |
| Consumer Staples | 3.7 | |
| Health Care | 3.0 | |
| Materials | 2.9 | |
| Utilities | 2.1 | |
| Real Estate | 1.9 | |
| |
| Common Stocks | 92.6 |
| Preferred Stocks | 0.3 |
| Short-Term Investments and Net Other Assets (Liabilities) | 7.1 |
ASSET ALLOCATION (% of Fund's net assets) |
|
|
| China | 28.8 |
| Taiwan | 17.5 |
| India | 13.4 |
| Korea (South) | 8.1 |
| United States | 7.6 |
| Brazil | 6.1 |
| South Africa | 3.8 |
| Saudi Arabia | 2.9 |
| Indonesia | 2.2 |
| Others | 9.6 |
GEOGRAPHIC DIVERSIFICATION (% of Fund's net assets) |
|
| |
|
TOP HOLDINGS(% of Fund's net assets) | | |
| Taiwan Semiconductor Manufacturing Co Ltd | 12.1 | |
| Tencent Holdings Ltd | 5.1 | |
| Reliance Industries Ltd GDR | 3.6 | |
| Samsung Electronics Co Ltd | 3.0 | |
| ICICI Bank Ltd ADR | 2.8 | |
| Alibaba Group Holding Ltd | 2.6 | |
| Meituan B Shares | 2.2 | |
| China Construction Bank Corp H Shares | 2.1 | |
| HDFC Bank Ltd ADR | 2.1 | |
| Infosys Ltd ADR | 1.9 | |
| | 37.5 | |
How has the Fund changed?
This is a summary of certain changes to the Fund since November 1, 2023. For more complete information, you may review the Fund's next prospectus, which we expect to be available by December 30, 2024 at fundresearch.fidelity.com/prospectus/sec or upon request at 1-800-544-8544 .
The fees associated with this class changed during the reporting year.The variations in class fees are primarily the result of the following changes: - Operating expenses
- Expense reductions
| |
| Fidelity, the Fidelity Investments Logo and all other Fidelity trademarks or service marks used herein are trademarks or service marks of FMR LLC. Any third-party marks that are used herein are trademarks or service marks of their respective owners. © 2024 FMR LLC. All rights reserved. |
| | For additional information about the Fund; including its prospectus, financial information, holdings and proxy information, scan the QR code or visit fundresearch.fidelity.com/prospectus/sec 1.9914033.100 7317-TSRA-1224 |
| |
| | ANNUAL SHAREHOLDER REPORT | AS OF OCTOBER 31, 2024 | This report describes changes to the Fund that occurred during the reporting period. |
| | Fidelity® Sustainable International Equity Fund Fidelity Advisor® Sustainable International Equity Fund Class I : FSQIX |
| | | |
This annual shareholder report contains information about Fidelity® Sustainable International Equity Fund for the period November 1, 2023 to October 31, 2024. You can find additional information about the Fund at fundresearch.fidelity.com/prospectus/sec. You can also request this information by contacting us at 1-877-208-0098 or by sending an e-mail to fidfunddocuments@fidelity.com.
What were your Fund costs for the last year?(based on hypothetical $10,000 investment)
FUND COST (PREVIOUS YEAR)
| | Costs of a $10,000 investment | Costs paid as a percentage of a $10,000 investment | |
| Class I | $ 119 | 1.05% | |
What affected the Fund's performance this period?
•International stocks achieved a strong gain for the 12 months ending October 31, 2024. Resilient global economic growth and a slowing in the pace of inflation in certain regions, as well as a shift to global monetary easing, contributed to a favorable backdrop, despite persistent geopolitical risk.
•Against this backdrop, security selection in Japan and the U.K. contributed to the fund's performance versus the MSCI EAFE Index (Net MA) for the fiscal year.
•By sector, the biggest contributor to performance versus the benchmark was stock picking in industrials, primarily within the capital goods industry. Stock picks in materials also boosted the fund's relative performance. Also bolstering our relative result was an underweight in energy.
•The top individual relative contributor was an overweight in Hitachi (+108%), the fund's biggest holding at period end. The second-largest relative contributor was our non-benchmark stake in Taiwan Semiconductor (+95%). The stock was among the fund's largest holdings. An overweight in UCB (+165%) also helped.
•In contrast, from a regional standpoint, security selection and an underweight in Asia Pacific ex Japan, primarily in Hong Kong, and an underweight in Japan detracted from the fund's relative result.
•By sector, the biggest detractor from performance versus the benchmark was stock selection in financials. Stock selection in consumer staples also hampered the fund's result. Also detracting from our result was an underweight in industrials, primarily within the capital goods industry. Lastly, the fund's position in cash detracted.
•The largest individual relative detractor was an overweight in Sony (+10%), which was among the fund's biggest holdings. The second-largest relative detractor was an overweight in AIA (-6%). Another notable relative detractor was an overweight in L'Oréal (-9%).
•Notable changes in positioning include decreased exposure to Germany and a higher allocation to Japan. By sector, meaningful changes in positioning include increased exposure to industrials and a lower allocation to consumer staples.
Application of FMR's environmental, social and governance ratings process and/or its sustainable investing exclusion criteria may affect the fund's exposure to certain issuers, sectors, regions and countries, and may affect the fund's performance.
How did the Fund perform over the life of Fund?
CUMULATIVE PERFORMANCE
February 10, 2022 through October 31, 2024.
Initial investment of $10,000.
Class I | $10,000 | $7,210 | $7,912 |
MSCI EAFE ESG Leaders | $10,000 | $7,669 | $8,792 |
MSCI EAFE Index | $10,000 | $7,820 | $8,966 |
| | 2022 | 2023 | 2024 |
AVERAGE ANNUAL TOTAL RETURNS:| | 1 Year | Life of Fund A |
| Class I | 25.98% | -0.12% |
| MSCI EAFE ESG Leaders | 22.13% | 2.65% |
| MSCI EAFE Index | 23.25% | 3.74% |
A From February 10, 2022
Visit institutional.fidelity.com for more recent performance information. |
The Fund's past performance is not a good predictor of the Fund's future performance. The graph and table do not reflect the deduction of taxes that a shareholder would pay on fund distributions or redemption of fund shares. |
Key Fund Statistics(as of October 31, 2024)
KEY FACTS | | |
| Fund Size | $10,747,030 | |
| Number of Holdings | 83 | |
| Total Advisory Fee | $67,920 | |
| Portfolio Turnover | 50% | |
What did the Fund invest in?
(as of October 31, 2024)
MARKET SECTORS (% of Fund's net assets) | | |
| Financials | 25.6 | |
| Industrials | 21.7 | |
| Health Care | 13.0 | |
| Consumer Discretionary | 11.0 | |
| Information Technology | 9.0 | |
| Materials | 6.5 | |
| Consumer Staples | 4.5 | |
| Utilities | 3.0 | |
| Communication Services | 2.1 | |
| Real Estate | 1.1 | |
| |
| Common Stocks | 97.5 |
| Short-Term Investments and Net Other Assets (Liabilities) | 2.5 |
ASSET ALLOCATION (% of Fund's net assets) |
|
|
| Japan | 21.7 |
| United Kingdom | 14.1 |
| United States | 10.5 |
| France | 9.8 |
| Netherlands | 8.4 |
| Germany | 6.7 |
| Denmark | 5.1 |
| Italy | 3.8 |
| Australia | 3.7 |
| Others | 16.2 |
GEOGRAPHIC DIVERSIFICATION (% of Fund's net assets) |
|
| |
|
TOP HOLDINGS(% of Fund's net assets) | | |
| Novo Nordisk A/S Series B | 4.4 | |
| Hitachi Ltd | 4.3 | |
| ITOCHU Corp | 3.5 | |
| CRH PLC (United Kingdom) | 2.9 | |
| ORIX Corp | 2.8 | |
| ASML Holding NV | 2.7 | |
| Sony Group Corp | 2.6 | |
| Schneider Electric SE | 2.6 | |
| Taiwan Semiconductor Manufacturing Co Ltd | 2.5 | |
| Unilever PLC | 2.4 | |
| | 30.7 | |
How has the Fund changed?
This is a summary of certain changes to the Fund since November 1, 2023. For more complete information, you may review the Fund's next prospectus, which we expect to be available by December 30, 2024 at fundresearch.fidelity.com/prospectus/sec or upon request at 1-877-208-0098 or by sending an e-mail to fidfunddocuments@fidelity.com.
The fund's transfer agent and pricing & bookkeeping fees were changed to a fixed rate effective December 1, 2023, through February 29, 2024, in anticipation of the transition to a new management fee structure. Effective March 1, 2024, the fund's management contract was amended to incorporate administrative services previously covered under separate services agreements (transfer agent and pricing & bookkeeping). The amended contract incorporates a basic fee rate that may vary by class (subject to a performance adjustment). The Adviser or an affiliate pays certain expenses of managing and operating the fund out of each class's management fee. | |
| Fidelity, the Fidelity Investments Logo and all other Fidelity trademarks or service marks used herein are trademarks or service marks of FMR LLC. Any third-party marks that are used herein are trademarks or service marks of their respective owners. © 2024 FMR LLC. All rights reserved. |
| | For additional information about the Fund; including its prospectus, financial information, holdings and proxy information, scan the QR code or visit fundresearch.fidelity.com/prospectus/sec 1.9914022.100 6466-TSRA-1224 |
| |
| | ANNUAL SHAREHOLDER REPORT | AS OF OCTOBER 31, 2024 | This report describes changes to the Fund that occurred during the reporting period. |
| | Fidelity® Sustainable Emerging Markets Equity Fund Fidelity Advisor® Sustainable Emerging Markets Equity Fund Class Z : FSZZX |
| | | |
This annual shareholder report contains information about Fidelity® Sustainable Emerging Markets Equity Fund for the period November 1, 2023 to October 31, 2024. You can find additional information about the Fund at fundresearch.fidelity.com/prospectus/sec. You can also request this information by contacting us at 1-877-208-0098 or by sending an e-mail to fidfunddocuments@fidelity.com.
What were your Fund costs for the last year?(based on hypothetical $10,000 investment)
FUND COST (PREVIOUS YEAR)
| | Costs of a $10,000 investment | Costs paid as a percentage of a $10,000 investment | |
| Class Z | $ 124 | 1.10% | |
What affected the Fund's performance this period?
•International stocks achieved a strong gain for the 12 months ending October 31, 2024. Resilient global economic growth and a slowing in the pace of inflation in certain regions, as well as a shift to global monetary easing, contributed to a favorable backdrop, despite persistent geopolitical risk.
•Against this backdrop, stock selection in China and Taiwan dominated among contributors to the fund's performance versus the MSCI Emerging Markets Index for the fiscal year.
•By sector, security selection in consumer discretionary was the primary contributor. Picks and an overweight in information technology, also boosted the fund's relative performance.
•The top individual relative contributor was an overweight in Taiwan Semiconductor Manufacturing (+128%). The stock was the fund's largest holding. A second notable relative contributor was an overweight in Zomato (+93%). This was a stake we established this period. Another notable relative contributor was our non-benchmark stake in International Games System (+83%). The stock was not held at period end.
•In contrast, from a regional standpoint, stock selection and an overweight in Latin America detracted from the fund's relative result.
•By sector, the biggest detractor from performance versus the benchmark was stock selection in financials. Security selection in industrials also hampered the fund's result. Also hurting our result were picks and an overweight in health care.
•The biggest individual relative detractor was an overweight in Samsung Electronics (-12%). The company was one of our biggest holdings. A non-benchmark stake in Vamos Locacao de Caminhoes returned -42% and was the second-largest relative detractor. This was a stake we established this period. An overweight in Grupo Financiero Banorte (-9%) also detracted. The stock was among the fund's biggest holdings this period.
•Notable changes in positioning include increased exposure to South Africa and a lower allocation to South Korea. By sector, meaningful changes in positioning include lower allocations to consumer staples and communication services.
Application of FMR's environmental, social and governance ratings process and/or its sustainable investing exclusion criteria may affect the fund's exposure to certain issuers, sectors, regions and countries, and may affect the fund's performance.
How did the Fund perform over the life of Fund?
CUMULATIVE PERFORMANCE
February 10, 2022 through October 31, 2024.
Initial investment of $10,000.
Class Z | $10,000 | $6,570 | $7,452 |
MSCI Emerging Markets (EM) ESG Leaders Index | $10,000 | $6,534 | $7,249 |
MSCI Emerging Markets Index | $10,000 | $6,946 | $7,699 |
| | 2022 | 2023 | 2024 |
AVERAGE ANNUAL TOTAL RETURNS:| | 1 Year | Life of Fund A |
| Class Z | 26.04% | -2.28% |
| MSCI Emerging Markets (EM) ESG Leaders Index | 28.51% | -2.57% |
| MSCI Emerging Markets Index | 25.33% | -1.30% |
A From February 10, 2022
Visit institutional.fidelity.com for more recent performance information. |
The Fund's past performance is not a good predictor of the Fund's future performance. The graph and table do not reflect the deduction of taxes that a shareholder would pay on fund distributions or redemption of fund shares. |
Key Fund Statistics(as of October 31, 2024)
KEY FACTS | | |
| Fund Size | $6,416,219 | |
| Number of Holdings | 119 | |
| Total Advisory Fee | $47,275 | |
| Portfolio Turnover | 108% | |
What did the Fund invest in?
(as of October 31, 2024)
MARKET SECTORS (% of Fund's net assets) | | |
| Financials | 24.8 | |
| Information Technology | 24.6 | |
| Consumer Discretionary | 17.3 | |
| Communication Services | 9.1 | |
| Industrials | 5.1 | |
| Health Care | 4.4 | |
| Materials | 3.7 | |
| Consumer Staples | 3.0 | |
| Energy | 2.2 | |
| Real Estate | 1.2 | |
| Utilities | 0.7 | |
| |
| Common Stocks | 96.1 |
| Short-Term Investments and Net Other Assets (Liabilities) | 3.9 |
ASSET ALLOCATION (% of Fund's net assets) |
|
|
| China | 30.9 |
| Taiwan | 15.9 |
| India | 13.3 |
| Korea (South) | 9.7 |
| Brazil | 6.3 |
| South Africa | 5.2 |
| United States | 3.9 |
| Mexico | 3.5 |
| Indonesia | 2.3 |
| Others | 9.0 |
GEOGRAPHIC DIVERSIFICATION (% of Fund's net assets) |
|
| |
|
TOP HOLDINGS(% of Fund's net assets) | | |
| Taiwan Semiconductor Manufacturing Co Ltd | 10.5 | |
| Tencent Holdings Ltd | 6.2 | |
| Alibaba Group Holding Ltd | 4.2 | |
| Samsung Electronics Co Ltd | 4.2 | |
| Hon Hai Precision Industry Co Ltd | 2.0 | |
| Bank Central Asia Tbk PT | 1.9 | |
| SK Hynix Inc | 1.8 | |
| Bharti Airtel Ltd | 1.7 | |
| China Construction Bank Corp H Shares | 1.7 | |
| HDFC Bank Ltd | 1.7 | |
| | 35.9 | |
How has the Fund changed?
This is a summary of certain changes to the Fund since November 1, 2023. For more complete information, you may review the Fund's next prospectus, which we expect to be available by December 30, 2024 at fundresearch.fidelity.com/prospectus/sec or upon request at 1-877-208-0098 or by sending an e-mail to fidfunddocuments@fidelity.com.
The fund's transfer agent and pricing & bookkeeping fees were changed to a fixed rate effective December 1, 2023, through February 29, 2024, in anticipation of the transition to a new management fee structure. Effective March 1, 2024, the fund's management contract was amended to incorporate administrative services previously covered under separate services agreements (transfer agent and pricing & bookkeeping). The amended contract incorporates a basic fee rate that may vary by class (subject to a performance adjustment). The Adviser or an affiliate pays certain expenses of managing and operating the fund out of each class's management fee. | |
| Fidelity, the Fidelity Investments Logo and all other Fidelity trademarks or service marks used herein are trademarks or service marks of FMR LLC. Any third-party marks that are used herein are trademarks or service marks of their respective owners. © 2024 FMR LLC. All rights reserved. |
| | For additional information about the Fund; including its prospectus, financial information, holdings and proxy information, scan the QR code or visit fundresearch.fidelity.com/prospectus/sec 1.9914029.100 6473-TSRA-1224 |
| |
| | ANNUAL SHAREHOLDER REPORT | AS OF OCTOBER 31, 2024 | |
| | Fidelity® Series Overseas Fund Fidelity® Series Overseas Fund : FSOSX |
| | | |
This annual shareholder report contains information about Fidelity® Series Overseas Fund for the period November 1, 2023 to October 31, 2024. You can find additional information about the Fund at fundresearch.fidelity.com/prospectus/sec. You can also request this information by contacting us at 1-800-544-8544.
What were your Fund costs for the last year?(based on hypothetical $10,000 investment)
FUND COST (PREVIOUS YEAR)
| | Costs of a $10,000 investment | Costs paid as a percentage of a $10,000 investment | |
| Fidelity® Series Overseas Fund | $ 1 | 0.01% | |
What affected the Fund's performance this period?
•International stocks achieved a strong gain for the 12 months ending October 31, 2024. Resilient global economic growth and a slowing in the pace of inflation in certain regions, as well as a shift to global monetary easing, contributed to a favorable backdrop, despite persistent geopolitical risk.
•Against this backdrop, stock picking in the U.K. and Japan contributed to the fund's performance versus the MSCI EAFE Index (Net MA) for the fiscal year.
•By sector, market selection was the primary contributor, led by an underweights in energy and consumer staples. Stock picks and an overweight in industrials, primarily within the capital goods industry, also boosted the fund's relative performance.
•The top individual relative contributor was an overweight in Mitsubishi Heavy Industries (+156%). This was a stake we established this period. The second-largest relative contributor was an overweight in Tokio Marine Holdings (+70%). Although we reduced the fund's stake, the company was one of our largest holdings. Another notable relative contributor was our non-benchmark stake in Taiwan Semiconductor Manufacturing (+101%).
•In contrast, from a regional standpoint, stock selection in the United States and underweights in Japan and Asia Pacific ex Japan detracted from the fund's relative result.
•By sector, the biggest detractor from performance versus the benchmark was stock selection in consumer staples. Also hurting our result were stock picks in consumer discretionary, primarily within the consumer durables & apparel industry. Choices in information technology, primarily within the software & services industry, also hurt. Lastly, the fund's position in cash detracted.
•The largest individual relative detractor was our stake in Diageo (-11%). The stock was not held at period end. A non-benchmark stake in Alten returned approximately -27% and was the second-largest relative detractor. Our overweight stake in Sony Group (+1%) also hurt. The stock was not held at period end.
•Notable changes in positioning include increased exposure to Japan and the United States, and a lower allocation to Sweden. By sector, meaningful changes in positioning include decreased exposure to consumer staples and energy, and a higher allocation to industrials and materials.
How did the Fund perform over the life of Fund?
CUMULATIVE PERFORMANCE
June 21, 2019 through October 31, 2024.
Initial investment of $10,000.
Fidelity® Series Overseas Fund | $10,000 | $10,200 | $10,660 | $14,805 | $10,562 | $12,046 |
MSCI EAFE Index | $10,000 | $10,320 | $9,630 | $12,947 | $9,989 | $11,453 |
| | 2019 | 2020 | 2021 | 2022 | 2023 | 2024 |
AVERAGE ANNUAL TOTAL RETURNS:| | 1 Year | 5 Year | Life of Fund A |
| Fidelity® Series Overseas Fund | 26.24% | 8.32% | 8.12% |
| MSCI EAFE Index | 23.25% | 6.46% | 6.63% |
A From June 21, 2019
Visit www.fidelity.com for more recent performance information. |
The Fund's past performance is not a good predictor of the Fund's future performance. The graph and table do not reflect the deduction of taxes that a shareholder would pay on fund distributions or redemption of fund shares. |
Key Fund Statistics(as of October 31, 2024)
KEY FACTS | | |
| Fund Size | $14,911,127,952 | |
| Number of Holdings | 90 | |
| Total Advisory Fee | $0 | |
| Portfolio Turnover | 36% | |
What did the Fund invest in?
(as of October 31, 2024)
MARKET SECTORS (% of Fund's net assets) | | |
| Industrials | 25.9 | |
| Financials | 23.0 | |
| Information Technology | 16.3 | |
| Health Care | 13.4 | |
| Materials | 9.0 | |
| Consumer Discretionary | 7.1 | |
| Consumer Staples | 2.3 | |
| Communication Services | 0.4 | |
| |
| Common Stocks | 97.4 |
| Short-Term Investments and Net Other Assets (Liabilities) | 2.6 |
ASSET ALLOCATION (% of Fund's net assets) |
|
|
| United States | 18.5 |
| United Kingdom | 17.9 |
| Japan | 15.7 |
| France | 11.4 |
| Germany | 9.1 |
| Netherlands | 6.2 |
| Denmark | 4.5 |
| Switzerland | 3.4 |
| Italy | 3.4 |
| Others | 9.9 |
GEOGRAPHIC DIVERSIFICATION (% of Fund's net assets) |
|
| |
|
TOP HOLDINGS(% of Fund's net assets) | | |
| Novo Nordisk A/S Series B | 3.1 | |
| SAP SE | 3.0 | |
| ASML Holding NV | 3.0 | |
| Hitachi Ltd | 2.3 | |
| RELX PLC | 2.2 | |
| Astrazeneca PLC | 2.2 | |
| Safran SA | 2.2 | |
| Compass Group PLC | 2.1 | |
| London Stock Exchange Group PLC | 2.1 | |
| Wolters Kluwer NV | 2.0 | |
| | 24.2 | |
| Fidelity, the Fidelity Investments Logo and all other Fidelity trademarks or service marks used herein are trademarks or service marks of FMR LLC. Any third-party marks that are used herein are trademarks or service marks of their respective owners. © 2024 FMR LLC. All rights reserved. |
| | For additional information about the Fund; including its prospectus, financial information, holdings and proxy information, scan the QR code or visit fundresearch.fidelity.com/prospectus/sec 1.9914010.100 3468-TSRA-1224 |
| |
| | ANNUAL SHAREHOLDER REPORT | AS OF OCTOBER 31, 2024 | This report describes changes to the Fund that occurred during the reporting period. |
| | Fidelity® Global Commodity Stock Fund Fidelity Advisor® Global Commodity Stock Fund Class Z : FIQRX |
| | | |
This annual shareholder report contains information about Fidelity® Global Commodity Stock Fund for the period November 1, 2023 to October 31, 2024. You can find additional information about the Fund at fundresearch.fidelity.com/prospectus/sec. You can also request this information by contacting us at 1-877-208-0098 or by sending an e-mail to fidfunddocuments@fidelity.com.
What were your Fund costs for the last year?(based on hypothetical $10,000 investment)
FUND COST (PREVIOUS YEAR)
| | Costs of a $10,000 investment | Costs paid as a percentage of a $10,000 investment | |
| Class Z | $ 81 | 0.76% | |
What affected the Fund's performance this period?
•Global equities posted a strong advance for the 12 months ending October 31, 2024. Resilient economic growth and a slowing in the pace of inflation in certain regions, as well as a shift to global monetary easing, contributed to a favorable backdrop, despite persistent geopolitical risk.
•Against this backdrop, security selection in the United States and an overweight in Canada contributed to the fund's performance versus the MSCI AC World Commodity Producers Sector Capped Index for the fiscal year.
•By industry, security selection was the primary contributor, led by our choices in the oil & gas storage & transportation industry. Stock picking and an underweight in agricultural products & services also boosted the fund's relative performance. Also lifting the fund's relative result was out-of-benchmark exposure to the packaged foods & meats category.
•The top individual relative contributor was our stake in Archer Daniels Midland (+0%). This was a stake we established this period. The stock was one of our biggest holdings. The second-largest relative contributor was an overweight in Wheaton Precious Metals (+58%). We reduced the position, but the stock was still one of the fund's biggest holdings as of October 31. An overweight in Teck Resources (+33%) also helped. We also trimmed this position, but it too was among the fund's largest holdings at period end.
•In contrast, from a regional standpoint, stock picking in Asia Pacific ex Japan, primarily in Australia, detracted from the fund's relative result, as did an underweight in emerging markets, primarily in China and India.
•By industry, notable detractors from performance versus the benchmark included picks and an overweight in oil & gas exploration & production. Stock selection and an underweight in diversified metals & mining also hampered the fund's relative result. Also detracting from our result was a small non-benchmark position in pharmaceuticals.
•The largest individual relative detractor was an underweight in Corteva (+28%). This period we decreased our investment in Corteva. The second-largest relative detractor was an underweight in Agnico Eagle Mines (+89%). The stock was not held at period end. Another notable relative detractor was an overweight in Cenovus Energy (-13%). The stock was one of the fund's largest holdings.
•Notable changes in positioning include increased exposure to South Africa and a lower allocation to Australia. By sector, meaningful changes in positioning include increased exposure to oil & gas equipment & services and packaged foods & meats.
How did the Fund perform over the life of Fund?
CUMULATIVE PERFORMANCE
October 2, 2018 through October 31, 2024.
Initial investment of $10,000.
Class Z | $10,000 | $9,003 | $9,005 | $8,286 | $12,767 | $15,796 | $14,327 |
MSCI ACWI (All Country World Index) Commodity Producers Sector Capped Index | $10,000 | $9,089 | $8,789 | $7,500 | $11,735 | $13,197 | $12,843 |
MSCI ACWI (All Country World Index) Index | $10,000 | $9,268 | $10,478 | $11,032 | $15,191 | $12,201 | $13,531 |
| | 2018 | 2019 | 2020 | 2021 | 2022 | 2023 | 2024 |
AVERAGE ANNUAL TOTAL RETURNS:| | 1 Year | 5 Year | Life of Fund A |
| Class Z | 12.62% | 12.37% | 8.18% |
| MSCI ACWI (All Country World Index) Commodity Producers Sector Capped Index | 5.86% | 9.12% | 5.18% |
| MSCI ACWI (All Country World Index) Index | 33.23% | 11.46% | 10.17% |
A From October 2, 2018
Visit institutional.fidelity.com for more recent performance information. |
The Fund's past performance is not a good predictor of the Fund's future performance. The graph and table do not reflect the deduction of taxes that a shareholder would pay on fund distributions or redemption of fund shares. |
Key Fund Statistics(as of October 31, 2024)
KEY FACTS | | |
| Fund Size | $929,592,306 | |
| Number of Holdings | 61 | |
| Total Advisory Fee | $7,667,954 | |
| Portfolio Turnover | 49% | |
What did the Fund invest in?
(as of October 31, 2024)
TOP INDUSTRIES (% of Fund's net assets) |
| Oil, Gas & Consumable Fuels | 35.2 | |
| Metals & Mining | 30.1 | |
| Food Products | 10.3 | |
| Paper & Forest Products | 10.2 | |
| Energy Equipment & Services | 6.0 | |
| Chemicals | 4.9 | |
| Containers & Packaging | 1.6 | |
| Construction Materials | 0.6 | |
| Construction & Engineering | 0.2 | |
| Others | 0.1 | |
| |
| Common Stocks | 99.2 |
| Short-Term Investments and Net Other Assets (Liabilities) | 0.8 |
ASSET ALLOCATION (% of Fund's net assets) |
|
|
| United States | 46.1 |
| Canada | 24.7 |
| Brazil | 7.1 |
| South Africa | 6.2 |
| Finland | 4.4 |
| Zambia | 2.7 |
| Australia | 2.6 |
| Norway | 2.3 |
| India | 2.0 |
| Others | 1.9 |
GEOGRAPHIC DIVERSIFICATION (% of Fund's net assets) |
|
| |
|
TOP HOLDINGS(% of Fund's net assets) | | |
| Exxon Mobil Corp | 7.0 | |
| Shell PLC | 5.8 | |
| Archer-Daniels-Midland Co | 4.9 | |
| Wheaton Precious Metals Corp | 4.5 | |
| Teck Resources Ltd Class B | 4.2 | |
| Cenovus Energy Inc | 3.9 | |
| Energy Transfer LP | 3.4 | |
| JBS S/A | 3.3 | |
| UPM-Kymmene Oyj | 3.2 | |
| Antero Resources Corp | 3.2 | |
| | 43.4 | |
How has the Fund changed?
This is a summary of certain changes to the Fund since November 1, 2023. For more complete information, you may review the Fund's next prospectus, which we expect to be available by December 30, 2024 at fundresearch.fidelity.com/prospectus/sec or upon request at 1-877-208-0098 or by sending an e-mail to fidfunddocuments@fidelity.com.
The fund's transfer agent and pricing & bookkeeping fees were changed to a fixed rate effective December 1, 2023, through February 29, 2024, in anticipation of the transition to a new management fee structure. Effective March 1, 2024, the fund's management contract was amended to incorporate administrative services previously covered under separate services agreements (transfer agent and pricing & bookkeeping). The amended contract incorporates a management fee rate that may vary by class. The Adviser or an affiliate pays certain expenses of managing and operating the fund out of each class's management fee. | The fund's sub-advisory agreement with FIL Investments (Japan) Limited was not renewed.
|
| Fidelity, the Fidelity Investments Logo and all other Fidelity trademarks or service marks used herein are trademarks or service marks of FMR LLC. Any third-party marks that are used herein are trademarks or service marks of their respective owners. © 2024 FMR LLC. All rights reserved. |
| | For additional information about the Fund; including its prospectus, financial information, holdings and proxy information, scan the QR code or visit fundresearch.fidelity.com/prospectus/sec 1.9913960.100 3276-TSRA-1224 |
| |
| | ANNUAL SHAREHOLDER REPORT | AS OF OCTOBER 31, 2024 | This report describes changes to the Fund that occurred during the reporting period. |
| | Fidelity® Sustainable Emerging Markets Equity Fund Fidelity Advisor® Sustainable Emerging Markets Equity Fund Class I : FSZIX |
| | | |
This annual shareholder report contains information about Fidelity® Sustainable Emerging Markets Equity Fund for the period November 1, 2023 to October 31, 2024. You can find additional information about the Fund at fundresearch.fidelity.com/prospectus/sec. You can also request this information by contacting us at 1-877-208-0098 or by sending an e-mail to fidfunddocuments@fidelity.com.
What were your Fund costs for the last year?(based on hypothetical $10,000 investment)
FUND COST (PREVIOUS YEAR)
| | Costs of a $10,000 investment | Costs paid as a percentage of a $10,000 investment | |
| Class I | $ 141 | 1.25% | |
What affected the Fund's performance this period?
•International stocks achieved a strong gain for the 12 months ending October 31, 2024. Resilient global economic growth and a slowing in the pace of inflation in certain regions, as well as a shift to global monetary easing, contributed to a favorable backdrop, despite persistent geopolitical risk.
•Against this backdrop, stock selection in China and Taiwan dominated among contributors to the fund's performance versus the MSCI Emerging Markets Index for the fiscal year.
•By sector, security selection in consumer discretionary was the primary contributor. Picks and an overweight in information technology, also boosted the fund's relative performance.
•The top individual relative contributor was an overweight in Taiwan Semiconductor Manufacturing (+128%). The stock was the fund's largest holding. A second notable relative contributor was an overweight in Zomato (+93%). This was a stake we established this period. Another notable relative contributor was our non-benchmark stake in International Games System (+83%). The stock was not held at period end.
•In contrast, from a regional standpoint, stock selection and an overweight in Latin America detracted from the fund's relative result.
•By sector, the biggest detractor from performance versus the benchmark was stock selection in financials. Security selection in industrials also hampered the fund's result. Also hurting our result were picks and an overweight in health care.
•The biggest individual relative detractor was an overweight in Samsung Electronics (-12%). The company was one of our biggest holdings. A non-benchmark stake in Vamos Locacao de Caminhoes returned -42% and was the second-largest relative detractor. This was a stake we established this period. An overweight in Grupo Financiero Banorte (-9%) also detracted. The stock was among the fund's biggest holdings this period.
•Notable changes in positioning include increased exposure to South Africa and a lower allocation to South Korea. By sector, meaningful changes in positioning include lower allocations to consumer staples and communication services.
Application of FMR's environmental, social and governance ratings process and/or its sustainable investing exclusion criteria may affect the fund's exposure to certain issuers, sectors, regions and countries, and may affect the fund's performance.
How did the Fund perform over the life of Fund?
CUMULATIVE PERFORMANCE
February 10, 2022 through October 31, 2024.
Initial investment of $10,000.
Class I | $10,000 | $6,570 | $7,431 |
MSCI Emerging Markets (EM) ESG Leaders Index | $10,000 | $6,534 | $7,249 |
MSCI Emerging Markets Index | $10,000 | $6,946 | $7,699 |
| | 2022 | 2023 | 2024 |
AVERAGE ANNUAL TOTAL RETURNS:| | 1 Year | Life of Fund A |
| Class I | 25.84% | -2.43% |
| MSCI Emerging Markets (EM) ESG Leaders Index | 28.51% | -2.57% |
| MSCI Emerging Markets Index | 25.33% | -1.30% |
A From February 10, 2022
Visit institutional.fidelity.com for more recent performance information. |
The Fund's past performance is not a good predictor of the Fund's future performance. The graph and table do not reflect the deduction of taxes that a shareholder would pay on fund distributions or redemption of fund shares. |
Key Fund Statistics(as of October 31, 2024)
KEY FACTS | | |
| Fund Size | $6,416,219 | |
| Number of Holdings | 119 | |
| Total Advisory Fee | $47,275 | |
| Portfolio Turnover | 108% | |
What did the Fund invest in?
(as of October 31, 2024)
MARKET SECTORS (% of Fund's net assets) | | |
| Financials | 24.8 | |
| Information Technology | 24.6 | |
| Consumer Discretionary | 17.3 | |
| Communication Services | 9.1 | |
| Industrials | 5.1 | |
| Health Care | 4.4 | |
| Materials | 3.7 | |
| Consumer Staples | 3.0 | |
| Energy | 2.2 | |
| Real Estate | 1.2 | |
| Utilities | 0.7 | |
| |
| Common Stocks | 96.1 |
| Short-Term Investments and Net Other Assets (Liabilities) | 3.9 |
ASSET ALLOCATION (% of Fund's net assets) |
|
|
| China | 30.9 |
| Taiwan | 15.9 |
| India | 13.3 |
| Korea (South) | 9.7 |
| Brazil | 6.3 |
| South Africa | 5.2 |
| United States | 3.9 |
| Mexico | 3.5 |
| Indonesia | 2.3 |
| Others | 9.0 |
GEOGRAPHIC DIVERSIFICATION (% of Fund's net assets) |
|
| |
|
TOP HOLDINGS(% of Fund's net assets) | | |
| Taiwan Semiconductor Manufacturing Co Ltd | 10.5 | |
| Tencent Holdings Ltd | 6.2 | |
| Alibaba Group Holding Ltd | 4.2 | |
| Samsung Electronics Co Ltd | 4.2 | |
| Hon Hai Precision Industry Co Ltd | 2.0 | |
| Bank Central Asia Tbk PT | 1.9 | |
| SK Hynix Inc | 1.8 | |
| Bharti Airtel Ltd | 1.7 | |
| China Construction Bank Corp H Shares | 1.7 | |
| HDFC Bank Ltd | 1.7 | |
| | 35.9 | |
How has the Fund changed?
This is a summary of certain changes to the Fund since November 1, 2023. For more complete information, you may review the Fund's next prospectus, which we expect to be available by December 30, 2024 at fundresearch.fidelity.com/prospectus/sec or upon request at 1-877-208-0098 or by sending an e-mail to fidfunddocuments@fidelity.com.
The fund's transfer agent and pricing & bookkeeping fees were changed to a fixed rate effective December 1, 2023, through February 29, 2024, in anticipation of the transition to a new management fee structure. Effective March 1, 2024, the fund's management contract was amended to incorporate administrative services previously covered under separate services agreements (transfer agent and pricing & bookkeeping). The amended contract incorporates a basic fee rate that may vary by class (subject to a performance adjustment). The Adviser or an affiliate pays certain expenses of managing and operating the fund out of each class's management fee. | |
| Fidelity, the Fidelity Investments Logo and all other Fidelity trademarks or service marks used herein are trademarks or service marks of FMR LLC. Any third-party marks that are used herein are trademarks or service marks of their respective owners. © 2024 FMR LLC. All rights reserved. |
| | For additional information about the Fund; including its prospectus, financial information, holdings and proxy information, scan the QR code or visit fundresearch.fidelity.com/prospectus/sec 1.9914028.100 6472-TSRA-1224 |
| |
| | ANNUAL SHAREHOLDER REPORT | AS OF OCTOBER 31, 2024 | |
| | Fidelity® Series International Growth Fund Fidelity® Series International Growth Fund : FIGSX |
| | | |
This annual shareholder report contains information about Fidelity® Series International Growth Fund for the period November 1, 2023 to October 31, 2024. You can find additional information about the Fund at fundresearch.fidelity.com/prospectus/sec. You can also request this information by contacting us at 1-800-544-8544.
What were your Fund costs for the last year?(based on hypothetical $10,000 investment)
FUND COST (PREVIOUS YEAR)
| | Costs of a $10,000 investment | Costs paid as a percentage of a $10,000 investment | |
| Fidelity® Series International Growth Fund | $ 1 | 0.01% | |
What affected the Fund's performance this period?
•International stocks achieved a strong gain for the 12 months ending October 31, 2024. Resilient global economic growth and a slowing in the pace of inflation in certain regions, as well as a shift to global monetary easing, contributed to a favorable backdrop, despite persistent geopolitical risk.
•Against this backdrop, security selection and an overweight in the United States and security selection in the U.K. contributed to the fund's performance versus the MSCI EAFE Growth Index (Net MA) for the fiscal year.
•By sector, an underweight in consumer staples was the primary contributor. Security selection in materials also boosted relative performance. Also contributing to our result was an overweight in industrials, primarily within the capital goods industry.
•The top individual relative contributor was our non-benchmark stake in Taiwan Semiconductor (+100%). The company was one of the fund's biggest holdings. A second notable relative contributor was an overweight in CRH (+83%). The stock was among our biggest holdings. A non-benchmark stake in GE Vernova gained about 99% and notably helped. This was a position we established this period.
•In contrast, from a regional standpoint, an underweight in Asia Pacific ex Japan and a non-benchmark allocation to Canada detracted from the fund's relative result.
•By sector, the biggest detractor from performance versus the benchmark was security selection in financials. Also hurting our result was stock selection in industrials, primarily within the capital goods industry, and energy. Lastly, the fund's position in cash detracted.
•The largest individual relative detractor was an overweight in Edenred (-38%). Not owning Schneider Electric, a benchmark component that gained about 71%, was a second notable relative detractor. Another notable relative detractor this period was avoiding Commonwealth Bank of Australia, a benchmark component that gained approximately 59%.
•Notable changes in positioning include increased exposure to Germany and the United Kingdom. By sector, meaningful changes in positioning include decreased exposure to consumer staples and health care.
How did the Fund perform over the past 10 years?
CUMULATIVE PERFORMANCE
October 31, 2014 through October 31, 2024.
Initial investment of $10,000.
Fidelity® Series International Growth Fund | $10,000 | $10,365 | $10,044 | $12,496 | $11,894 | $14,580 | $15,949 | $21,229 | $15,432 | $17,177 | $21,687 |
MSCI EAFE Growth Index | $10,000 | $10,428 | $10,108 | $12,517 | $11,783 | $13,766 | $14,502 | $18,876 | $13,312 | $14,769 | $18,234 |
MSCI EAFE Index | $10,000 | $10,008 | $9,705 | $12,004 | $11,206 | $12,472 | $11,638 | $15,647 | $12,073 | $13,841 | $17,059 |
| | 2014 | 2015 | 2016 | 2017 | 2018 | 2019 | 2020 | 2021 | 2022 | 2023 | 2024 |
AVERAGE ANNUAL TOTAL RETURNS:| | 1 Year | 5 Year | 10 Year |
| Fidelity® Series International Growth Fund | 26.26% | 8.27% | 8.05% |
| MSCI EAFE Growth Index | 23.46% | 5.78% | 6.19% |
| MSCI EAFE Index | 23.25% | 6.46% | 5.49% |
Visit www.fidelity.com for more recent performance information. |
The Fund's past performance is not a good predictor of the Fund's future performance. The graph and table do not reflect the deduction of taxes that a shareholder would pay on fund distributions or redemption of fund shares. |
Key Fund Statistics(as of October 31, 2024)
KEY FACTS | | |
| Fund Size | $14,973,945,299 | |
| Number of Holdings | 73 | |
| Total Advisory Fee | $0 | |
| Portfolio Turnover | 26% | |
What did the Fund invest in?
(as of October 31, 2024)
MARKET SECTORS (% of Fund's net assets) | | |
| Industrials | 32.3 | |
| Information Technology | 20.0 | |
| Financials | 16.2 | |
| Materials | 10.7 | |
| Consumer Discretionary | 10.4 | |
| Health Care | 6.2 | |
| Consumer Staples | 1.1 | |
| Energy | 0.7 | |
| Communication Services | 0.5 | |
| |
| Common Stocks | 97.8 |
| Preferred Stocks | 0.3 |
| Short-Term Investments and Net Other Assets (Liabilities) | 1.9 |
ASSET ALLOCATION (% of Fund's net assets) |
|
|
| United States | 28.1 |
| United Kingdom | 11.8 |
| France | 11.3 |
| Japan | 9.9 |
| Sweden | 7.5 |
| Germany | 6.7 |
| Netherlands | 6.3 |
| Denmark | 5.2 |
| Taiwan | 3.3 |
| Others | 9.9 |
GEOGRAPHIC DIVERSIFICATION (% of Fund's net assets) |
|
| |
|
TOP HOLDINGS(% of Fund's net assets) | | |
| SAP SE | 5.3 | |
| Novo Nordisk A/S Series B | 5.2 | |
| ASML Holding NV | 4.9 | |
| Safran SA | 4.0 | |
| CRH PLC | 3.9 | |
| Linde PLC | 3.8 | |
| Atlas Copco AB A Shares | 3.5 | |
| Taiwan Semiconductor Manufacturing Co Ltd | 3.3 | |
| Recruit Holdings Co Ltd | 3.0 | |
| LVMH Moet Hennessy Louis Vuitton SE | 2.7 | |
| | 39.6 | |
| Fidelity, the Fidelity Investments Logo and all other Fidelity trademarks or service marks used herein are trademarks or service marks of FMR LLC. Any third-party marks that are used herein are trademarks or service marks of their respective owners. © 2024 FMR LLC. All rights reserved. |
| | For additional information about the Fund; including its prospectus, financial information, holdings and proxy information, scan the QR code or visit fundresearch.fidelity.com/prospectus/sec 1.9913962.100 2282-TSRA-1224 |
| |
| | ANNUAL SHAREHOLDER REPORT | AS OF OCTOBER 31, 2024 | This report describes changes to the Fund that occurred during the reporting period. |
| | Fidelity® Global Commodity Stock Fund Fidelity Advisor® Global Commodity Stock Fund Class C : FCGCX |
| | | |
This annual shareholder report contains information about Fidelity® Global Commodity Stock Fund for the period November 1, 2023 to October 31, 2024. You can find additional information about the Fund at fundresearch.fidelity.com/prospectus/sec. You can also request this information by contacting us at 1-877-208-0098 or by sending an e-mail to fidfunddocuments@fidelity.com.
What were your Fund costs for the last year?(based on hypothetical $10,000 investment)
FUND COST (PREVIOUS YEAR)
| | Costs of a $10,000 investment | Costs paid as a percentage of a $10,000 investment | |
| Class C | $ 202 | 1.91% | |
What affected the Fund's performance this period?
•Global equities posted a strong advance for the 12 months ending October 31, 2024. Resilient economic growth and a slowing in the pace of inflation in certain regions, as well as a shift to global monetary easing, contributed to a favorable backdrop, despite persistent geopolitical risk.
•Against this backdrop, security selection in the United States and an overweight in Canada contributed to the fund's performance versus the MSCI AC World Commodity Producers Sector Capped Index for the fiscal year.
•By industry, security selection was the primary contributor, led by our choices in the oil & gas storage & transportation industry. Stock picking and an underweight in agricultural products & services also boosted the fund's relative performance. Also lifting the fund's relative result was out-of-benchmark exposure to the packaged foods & meats category.
•The top individual relative contributor was our stake in Archer Daniels Midland (+0%). This was a stake we established this period. The stock was one of our biggest holdings. The second-largest relative contributor was an overweight in Wheaton Precious Metals (+58%). We reduced the position, but the stock was still one of the fund's biggest holdings as of October 31. An overweight in Teck Resources (+33%) also helped. We also trimmed this position, but it too was among the fund's largest holdings at period end.
•In contrast, from a regional standpoint, stock picking in Asia Pacific ex Japan, primarily in Australia, detracted from the fund's relative result, as did an underweight in emerging markets, primarily in China and India.
•By industry, notable detractors from performance versus the benchmark included picks and an overweight in oil & gas exploration & production. Stock selection and an underweight in diversified metals & mining also hampered the fund's relative result. Also detracting from our result was a small non-benchmark position in pharmaceuticals.
•The largest individual relative detractor was an underweight in Corteva (+28%). This period we decreased our investment in Corteva. The second-largest relative detractor was an underweight in Agnico Eagle Mines (+89%). The stock was not held at period end. Another notable relative detractor was an overweight in Cenovus Energy (-13%). The stock was one of the fund's largest holdings.
•Notable changes in positioning include increased exposure to South Africa and a lower allocation to Australia. By sector, meaningful changes in positioning include increased exposure to oil & gas equipment & services and packaged foods & meats.
How did the Fund perform over the past 10 years?
CUMULATIVE PERFORMANCE
October 31, 2014 through October 31, 2024.
Initial investment of $10,000.
Class C | $10,000 | $7,626 | $8,272 | $9,727 | $9,661 | $9,549 | $8,679 | $13,219 | $16,172 | $14,613 | $16,386 |
MSCI ACWI (All Country World Index) Commodity Producers Sector Capped Index | $10,000 | $7,702 | $8,581 | $10,342 | $10,510 | $10,163 | $8,673 | $13,570 | $15,259 | $14,850 | $15,721 |
MSCI ACWI (All Country World Index) Index | $10,000 | $10,035 | $10,284 | $12,721 | $12,703 | $14,362 | $15,121 | $20,822 | $16,723 | $18,547 | $24,710 |
| | 2014 | 2015 | 2016 | 2017 | 2018 | 2019 | 2020 | 2021 | 2022 | 2023 | 2024 |
AVERAGE ANNUAL TOTAL RETURNS:| | 1 Year | 5 Year | 10 Year |
| Class C (incl. contingent deferred sales charge) | 10.34% | 11.07% | 5.06% |
| Class C | 11.34% | 11.07% | 5.06% |
| MSCI ACWI (All Country World Index) Commodity Producers Sector Capped Index | 5.86% | 9.12% | 4.63% |
| MSCI ACWI (All Country World Index) Index | 33.23% | 11.46% | 9.47% |
Visit institutional.fidelity.com for more recent performance information. |
The Fund's past performance is not a good predictor of the Fund's future performance. The graph and table do not reflect the deduction of taxes that a shareholder would pay on fund distributions or redemption of fund shares. |
Key Fund Statistics(as of October 31, 2024)
KEY FACTS | | |
| Fund Size | $929,592,306 | |
| Number of Holdings | 61 | |
| Total Advisory Fee | $7,667,954 | |
| Portfolio Turnover | 49% | |
What did the Fund invest in?
(as of October 31, 2024)
TOP INDUSTRIES (% of Fund's net assets) |
| Oil, Gas & Consumable Fuels | 35.2 | |
| Metals & Mining | 30.1 | |
| Food Products | 10.3 | |
| Paper & Forest Products | 10.2 | |
| Energy Equipment & Services | 6.0 | |
| Chemicals | 4.9 | |
| Containers & Packaging | 1.6 | |
| Construction Materials | 0.6 | |
| Construction & Engineering | 0.2 | |
| Others | 0.1 | |
| |
| Common Stocks | 99.2 |
| Short-Term Investments and Net Other Assets (Liabilities) | 0.8 |
ASSET ALLOCATION (% of Fund's net assets) |
|
|
| United States | 46.1 |
| Canada | 24.7 |
| Brazil | 7.1 |
| South Africa | 6.2 |
| Finland | 4.4 |
| Zambia | 2.7 |
| Australia | 2.6 |
| Norway | 2.3 |
| India | 2.0 |
| Others | 1.9 |
GEOGRAPHIC DIVERSIFICATION (% of Fund's net assets) |
|
| |
|
TOP HOLDINGS(% of Fund's net assets) | | |
| Exxon Mobil Corp | 7.0 | |
| Shell PLC | 5.8 | |
| Archer-Daniels-Midland Co | 4.9 | |
| Wheaton Precious Metals Corp | 4.5 | |
| Teck Resources Ltd Class B | 4.2 | |
| Cenovus Energy Inc | 3.9 | |
| Energy Transfer LP | 3.4 | |
| JBS S/A | 3.3 | |
| UPM-Kymmene Oyj | 3.2 | |
| Antero Resources Corp | 3.2 | |
| | 43.4 | |
How has the Fund changed?
This is a summary of certain changes to the Fund since November 1, 2023. For more complete information, you may review the Fund's next prospectus, which we expect to be available by December 30, 2024 at fundresearch.fidelity.com/prospectus/sec or upon request at 1-877-208-0098 or by sending an e-mail to fidfunddocuments@fidelity.com.
The fund's transfer agent and pricing & bookkeeping fees were changed to a fixed rate effective December 1, 2023, through February 29, 2024, in anticipation of the transition to a new management fee structure. Effective March 1, 2024, the fund's management contract was amended to incorporate administrative services previously covered under separate services agreements (transfer agent and pricing & bookkeeping). The amended contract incorporates a management fee rate that may vary by class. The Adviser or an affiliate pays certain expenses of managing and operating the fund out of each class's management fee. | The fund's sub-advisory agreement with FIL Investments (Japan) Limited was not renewed.
|
| Fidelity, the Fidelity Investments Logo and all other Fidelity trademarks or service marks used herein are trademarks or service marks of FMR LLC. Any third-party marks that are used herein are trademarks or service marks of their respective owners. © 2024 FMR LLC. All rights reserved. |
| | For additional information about the Fund; including its prospectus, financial information, holdings and proxy information, scan the QR code or visit fundresearch.fidelity.com/prospectus/sec 1.9913957.100 2123-TSRA-1224 |
| |
| | ANNUAL SHAREHOLDER REPORT | AS OF OCTOBER 31, 2024 | |
| | Fidelity® Series Emerging Markets Fund Fidelity® Series Emerging Markets Fund : FHKFX |
| | | |
This annual shareholder report contains information about Fidelity® Series Emerging Markets Fund for the period November 1, 2023 to October 31, 2024. You can find additional information about the Fund at fundresearch.fidelity.com/prospectus/sec. You can also request this information by contacting us at 1-800-544-8544.
What were your Fund costs for the last year?(based on hypothetical $10,000 investment)
FUND COST (PREVIOUS YEAR)
| | Costs of a $10,000 investment | Costs paid as a percentage of a $10,000 investment | |
| Fidelity® Series Emerging Markets Fund | $ 2 | 0.01% | |
What affected the Fund's performance this period?
•International stocks achieved a strong gain for the 12 months ending October 31, 2024. Resilient global economic growth and a slowing in the pace of inflation in certain regions, as well as a shift to global monetary easing, contributed to a favorable backdrop, despite persistent geopolitical risk.
•Against this backdrop, positioning in Mexico and Brazil notably detracted from the fund's performance versus the MSCI Emerging Markets (Net MA) Index for the fiscal year.
•By sector, the biggest detractor from performance versus the benchmark was security selection in financials. Also hurting our result were picks in health care and consumer staples.
•The biggest individual relative detractor was an overweight in Alchip Technologies (-19%). This period we decreased our position in Alchip Technologies. The second-largest relative detractor was our non-benchmark stake in Vamos Locacao De Caminhoes (-45%). This was a stake we established this period. An overweight in Grupo Financiero Banorte (-9%) also hurt. The company was among the fund's biggest holdings this period.
•In contrast, from a regional standpoint, picks in China and India notably contributed to the fund's relative result.
•By sector, the biggest contributor to performance versus the benchmark was stock picking in consumer discretionary. Stock picks and an underweight in materials also boosted the fund's relative performance. Also helping our relative result were picks in industrials, primarily within the capital goods industry.
•The top individual relative contributor was an overweight in Hindustan Aeronautics (+135%). A second notable relative contributor was an overweight in Taiwan Semiconductor Manufacturing (+101%). The company was the fund's largest holding. An overweight in Zomato (+92%) also helped. This was an investment we established this period.
•Notable changes in positioning include higher allocations to South Africa and Brazil. By sector, meaningful changes in positioning include increased exposure to materials and a lower allocation to energy.
How did the Fund perform over the life of Fund?
CUMULATIVE PERFORMANCE
August 29, 2018 through October 31, 2024.
Initial investment of $10,000.
Fidelity® Series Emerging Markets Fund | $10,000 | $8,870 | $9,520 | $9,916 | $11,788 | $7,482 | $8,532 |
MSCI Emerging Markets Index | $10,000 | $8,960 | $10,026 | $10,855 | $12,697 | $8,759 | $9,709 |
| | 2018 | 2019 | 2020 | 2021 | 2022 | 2023 | 2024 |
AVERAGE ANNUAL TOTAL RETURNS:| | 1 Year | 5 Year | Life of Fund A |
| Fidelity® Series Emerging Markets Fund | 24.61% | 2.23% | 1.00% |
| MSCI Emerging Markets Index | 25.33% | 3.95% | 3.23% |
A From August 29, 2018
Visit www.fidelity.com for more recent performance information. |
The Fund's past performance is not a good predictor of the Fund's future performance. The graph and table do not reflect the deduction of taxes that a shareholder would pay on fund distributions or redemption of fund shares. |
Key Fund Statistics(as of October 31, 2024)
KEY FACTS | | |
| Fund Size | $5,945,184,813 | |
| Number of Holdings | 141 | |
| Total Advisory Fee | $0 | |
| Portfolio Turnover | 91% | |
What did the Fund invest in?
(as of October 31, 2024)
MARKET SECTORS (% of Fund's net assets) | | |
| Information Technology | 23.6 | |
| Financials | 22.8 | |
| Consumer Discretionary | 15.9 | |
| Communication Services | 8.2 | |
| Industrials | 6.4 | |
| Materials | 5.9 | |
| Consumer Staples | 3.6 | |
| Health Care | 3.4 | |
| Energy | 2.7 | |
| Utilities | 1.3 | |
| Real Estate | 1.0 | |
| |
| Common Stocks | 94.8 |
| Short-Term Investments and Net Other Assets (Liabilities) | 5.2 |
ASSET ALLOCATION (% of Fund's net assets) |
|
|
| China | 28.8 |
| India | 15.5 |
| Taiwan | 15.1 |
| Korea (South) | 9.1 |
| Brazil | 7.2 |
| United States | 5.2 |
| South Africa | 5.0 |
| Mexico | 3.0 |
| Indonesia | 2.0 |
| Others | 9.1 |
GEOGRAPHIC DIVERSIFICATION (% of Fund's net assets) |
|
| |
|
TOP HOLDINGS(% of Fund's net assets) | | |
| Taiwan Semiconductor Manufacturing Co Ltd | 10.7 | |
| Tencent Holdings Ltd | 5.5 | |
| Samsung Electronics Co Ltd | 3.6 | |
| Alibaba Group Holding Ltd | 3.3 | |
| HDFC Bank Ltd | 2.3 | |
| Hon Hai Precision Industry Co Ltd | 1.9 | |
| SK Hynix Inc | 1.7 | |
| ICICI Bank Ltd | 1.7 | |
| Bank Central Asia Tbk PT | 1.7 | |
| Xiaomi Corp B Shares | 1.5 | |
| | 33.9 | |
| Fidelity, the Fidelity Investments Logo and all other Fidelity trademarks or service marks used herein are trademarks or service marks of FMR LLC. Any third-party marks that are used herein are trademarks or service marks of their respective owners. © 2024 FMR LLC. All rights reserved. |
| | For additional information about the Fund; including its prospectus, financial information, holdings and proxy information, scan the QR code or visit fundresearch.fidelity.com/prospectus/sec 1.9913999.100 3225-TSRA-1224 |
| |
| | ANNUAL SHAREHOLDER REPORT | AS OF OCTOBER 31, 2024 | This report describes changes to the Fund that occurred during the reporting period. |
| | Fidelity® Sustainable International Equity Fund Fidelity Advisor® Sustainable International Equity Fund Class Z : FSQZX |
| | | |
This annual shareholder report contains information about Fidelity® Sustainable International Equity Fund for the period November 1, 2023 to October 31, 2024. You can find additional information about the Fund at fundresearch.fidelity.com/prospectus/sec. You can also request this information by contacting us at 1-877-208-0098 or by sending an e-mail to fidfunddocuments@fidelity.com.
What were your Fund costs for the last year?(based on hypothetical $10,000 investment)
FUND COST (PREVIOUS YEAR)
| | Costs of a $10,000 investment | Costs paid as a percentage of a $10,000 investment | |
| Class Z | $ 102 | 0.90% | |
What affected the Fund's performance this period?
•International stocks achieved a strong gain for the 12 months ending October 31, 2024. Resilient global economic growth and a slowing in the pace of inflation in certain regions, as well as a shift to global monetary easing, contributed to a favorable backdrop, despite persistent geopolitical risk.
•Against this backdrop, security selection in Japan and the U.K. contributed to the fund's performance versus the MSCI EAFE Index (Net MA) for the fiscal year.
•By sector, the biggest contributor to performance versus the benchmark was stock picking in industrials, primarily within the capital goods industry. Stock picks in materials also boosted the fund's relative performance. Also bolstering our relative result was an underweight in energy.
•The top individual relative contributor was an overweight in Hitachi (+108%), the fund's biggest holding at period end. The second-largest relative contributor was our non-benchmark stake in Taiwan Semiconductor (+95%). The stock was among the fund's largest holdings. An overweight in UCB (+165%) also helped.
•In contrast, from a regional standpoint, security selection and an underweight in Asia Pacific ex Japan, primarily in Hong Kong, and an underweight in Japan detracted from the fund's relative result.
•By sector, the biggest detractor from performance versus the benchmark was stock selection in financials. Stock selection in consumer staples also hampered the fund's result. Also detracting from our result was an underweight in industrials, primarily within the capital goods industry. Lastly, the fund's position in cash detracted.
•The largest individual relative detractor was an overweight in Sony (+10%), which was among the fund's biggest holdings. The second-largest relative detractor was an overweight in AIA (-6%). Another notable relative detractor was an overweight in L'Oréal (-9%).
•Notable changes in positioning include decreased exposure to Germany and a higher allocation to Japan. By sector, meaningful changes in positioning include increased exposure to industrials and a lower allocation to consumer staples.
Application of FMR's environmental, social and governance ratings process and/or its sustainable investing exclusion criteria may affect the fund's exposure to certain issuers, sectors, regions and countries, and may affect the fund's performance.
How did the Fund perform over the life of Fund?
CUMULATIVE PERFORMANCE
February 10, 2022 through October 31, 2024.
Initial investment of $10,000.
Class Z | $10,000 | $7,220 | $7,932 |
MSCI EAFE ESG Leaders | $10,000 | $7,669 | $8,792 |
MSCI EAFE Index | $10,000 | $7,820 | $8,966 |
| | 2022 | 2023 | 2024 |
AVERAGE ANNUAL TOTAL RETURNS:| | 1 Year | Life of Fund A |
| Class Z | 26.18% | 0.03% |
| MSCI EAFE ESG Leaders | 22.13% | 2.65% |
| MSCI EAFE Index | 23.25% | 3.74% |
A From February 10, 2022
Visit institutional.fidelity.com for more recent performance information. |
The Fund's past performance is not a good predictor of the Fund's future performance. The graph and table do not reflect the deduction of taxes that a shareholder would pay on fund distributions or redemption of fund shares. |
Key Fund Statistics(as of October 31, 2024)
KEY FACTS | | |
| Fund Size | $10,747,030 | |
| Number of Holdings | 83 | |
| Total Advisory Fee | $67,920 | |
| Portfolio Turnover | 50% | |
What did the Fund invest in?
(as of October 31, 2024)
MARKET SECTORS (% of Fund's net assets) | | |
| Financials | 25.6 | |
| Industrials | 21.7 | |
| Health Care | 13.0 | |
| Consumer Discretionary | 11.0 | |
| Information Technology | 9.0 | |
| Materials | 6.5 | |
| Consumer Staples | 4.5 | |
| Utilities | 3.0 | |
| Communication Services | 2.1 | |
| Real Estate | 1.1 | |
| |
| Common Stocks | 97.5 |
| Short-Term Investments and Net Other Assets (Liabilities) | 2.5 |
ASSET ALLOCATION (% of Fund's net assets) |
|
|
| Japan | 21.7 |
| United Kingdom | 14.1 |
| United States | 10.5 |
| France | 9.8 |
| Netherlands | 8.4 |
| Germany | 6.7 |
| Denmark | 5.1 |
| Italy | 3.8 |
| Australia | 3.7 |
| Others | 16.2 |
GEOGRAPHIC DIVERSIFICATION (% of Fund's net assets) |
|
| |
|
TOP HOLDINGS(% of Fund's net assets) | | |
| Novo Nordisk A/S Series B | 4.4 | |
| Hitachi Ltd | 4.3 | |
| ITOCHU Corp | 3.5 | |
| CRH PLC (United Kingdom) | 2.9 | |
| ORIX Corp | 2.8 | |
| ASML Holding NV | 2.7 | |
| Sony Group Corp | 2.6 | |
| Schneider Electric SE | 2.6 | |
| Taiwan Semiconductor Manufacturing Co Ltd | 2.5 | |
| Unilever PLC | 2.4 | |
| | 30.7 | |
How has the Fund changed?
This is a summary of certain changes to the Fund since November 1, 2023. For more complete information, you may review the Fund's next prospectus, which we expect to be available by December 30, 2024 at fundresearch.fidelity.com/prospectus/sec or upon request at 1-877-208-0098 or by sending an e-mail to fidfunddocuments@fidelity.com.
The fund's transfer agent and pricing & bookkeeping fees were changed to a fixed rate effective December 1, 2023, through February 29, 2024, in anticipation of the transition to a new management fee structure. Effective March 1, 2024, the fund's management contract was amended to incorporate administrative services previously covered under separate services agreements (transfer agent and pricing & bookkeeping). The amended contract incorporates a basic fee rate that may vary by class (subject to a performance adjustment). The Adviser or an affiliate pays certain expenses of managing and operating the fund out of each class's management fee. | |
| Fidelity, the Fidelity Investments Logo and all other Fidelity trademarks or service marks used herein are trademarks or service marks of FMR LLC. Any third-party marks that are used herein are trademarks or service marks of their respective owners. © 2024 FMR LLC. All rights reserved. |
| | For additional information about the Fund; including its prospectus, financial information, holdings and proxy information, scan the QR code or visit fundresearch.fidelity.com/prospectus/sec 1.9914023.100 6467-TSRA-1224 |
| |
| | ANNUAL SHAREHOLDER REPORT | AS OF OCTOBER 31, 2024 | This report describes changes to the Fund that occurred during the reporting period. |
| | Fidelity® Sustainable Emerging Markets Equity Fund Fidelity Advisor® Sustainable Emerging Markets Equity Fund Class C : FSYKX |
| | | |
This annual shareholder report contains information about Fidelity® Sustainable Emerging Markets Equity Fund for the period November 1, 2023 to October 31, 2024. You can find additional information about the Fund at fundresearch.fidelity.com/prospectus/sec. You can also request this information by contacting us at 1-877-208-0098 or by sending an e-mail to fidfunddocuments@fidelity.com.
What were your Fund costs for the last year?(based on hypothetical $10,000 investment)
FUND COST (PREVIOUS YEAR)
| | Costs of a $10,000 investment | Costs paid as a percentage of a $10,000 investment | |
| Class C | $ 253 | 2.25% | |
What affected the Fund's performance this period?
•International stocks achieved a strong gain for the 12 months ending October 31, 2024. Resilient global economic growth and a slowing in the pace of inflation in certain regions, as well as a shift to global monetary easing, contributed to a favorable backdrop, despite persistent geopolitical risk.
•Against this backdrop, stock selection in China and Taiwan dominated among contributors to the fund's performance versus the MSCI Emerging Markets Index for the fiscal year.
•By sector, security selection in consumer discretionary was the primary contributor. Picks and an overweight in information technology, also boosted the fund's relative performance.
•The top individual relative contributor was an overweight in Taiwan Semiconductor Manufacturing (+128%). The stock was the fund's largest holding. A second notable relative contributor was an overweight in Zomato (+93%). This was a stake we established this period. Another notable relative contributor was our non-benchmark stake in International Games System (+83%). The stock was not held at period end.
•In contrast, from a regional standpoint, stock selection and an overweight in Latin America detracted from the fund's relative result.
•By sector, the biggest detractor from performance versus the benchmark was stock selection in financials. Security selection in industrials also hampered the fund's result. Also hurting our result were picks and an overweight in health care.
•The biggest individual relative detractor was an overweight in Samsung Electronics (-12%). The company was one of our biggest holdings. A non-benchmark stake in Vamos Locacao de Caminhoes returned -42% and was the second-largest relative detractor. This was a stake we established this period. An overweight in Grupo Financiero Banorte (-9%) also detracted. The stock was among the fund's biggest holdings this period.
•Notable changes in positioning include increased exposure to South Africa and a lower allocation to South Korea. By sector, meaningful changes in positioning include lower allocations to consumer staples and communication services.
Application of FMR's environmental, social and governance ratings process and/or its sustainable investing exclusion criteria may affect the fund's exposure to certain issuers, sectors, regions and countries, and may affect the fund's performance.
How did the Fund perform over the life of Fund?
CUMULATIVE PERFORMANCE
February 10, 2022 through October 31, 2024.
Initial investment of $10,000.
Class C | $10,000 | $6,520 | $7,300 |
MSCI Emerging Markets (EM) ESG Leaders Index | $10,000 | $6,534 | $7,249 |
MSCI Emerging Markets Index | $10,000 | $6,946 | $7,699 |
| | 2022 | 2023 | 2024 |
AVERAGE ANNUAL TOTAL RETURNS:| | 1 Year | Life of Fund A |
| Class C (incl. contingent deferred sales charge) | 23.71% | -3.39% |
| Class C | 24.71% | -3.39% |
| MSCI Emerging Markets (EM) ESG Leaders Index | 28.51% | -2.57% |
| MSCI Emerging Markets Index | 25.33% | -1.30% |
A From February 10, 2022
Visit institutional.fidelity.com for more recent performance information. |
The Fund's past performance is not a good predictor of the Fund's future performance. The graph and table do not reflect the deduction of taxes that a shareholder would pay on fund distributions or redemption of fund shares. |
Key Fund Statistics(as of October 31, 2024)
KEY FACTS | | |
| Fund Size | $6,416,219 | |
| Number of Holdings | 119 | |
| Total Advisory Fee | $47,275 | |
| Portfolio Turnover | 108% | |
What did the Fund invest in?
(as of October 31, 2024)
MARKET SECTORS (% of Fund's net assets) | | |
| Financials | 24.8 | |
| Information Technology | 24.6 | |
| Consumer Discretionary | 17.3 | |
| Communication Services | 9.1 | |
| Industrials | 5.1 | |
| Health Care | 4.4 | |
| Materials | 3.7 | |
| Consumer Staples | 3.0 | |
| Energy | 2.2 | |
| Real Estate | 1.2 | |
| Utilities | 0.7 | |
| |
| Common Stocks | 96.1 |
| Short-Term Investments and Net Other Assets (Liabilities) | 3.9 |
ASSET ALLOCATION (% of Fund's net assets) |
|
|
| China | 30.9 |
| Taiwan | 15.9 |
| India | 13.3 |
| Korea (South) | 9.7 |
| Brazil | 6.3 |
| South Africa | 5.2 |
| United States | 3.9 |
| Mexico | 3.5 |
| Indonesia | 2.3 |
| Others | 9.0 |
GEOGRAPHIC DIVERSIFICATION (% of Fund's net assets) |
|
| |
|
TOP HOLDINGS(% of Fund's net assets) | | |
| Taiwan Semiconductor Manufacturing Co Ltd | 10.5 | |
| Tencent Holdings Ltd | 6.2 | |
| Alibaba Group Holding Ltd | 4.2 | |
| Samsung Electronics Co Ltd | 4.2 | |
| Hon Hai Precision Industry Co Ltd | 2.0 | |
| Bank Central Asia Tbk PT | 1.9 | |
| SK Hynix Inc | 1.8 | |
| Bharti Airtel Ltd | 1.7 | |
| China Construction Bank Corp H Shares | 1.7 | |
| HDFC Bank Ltd | 1.7 | |
| | 35.9 | |
How has the Fund changed?
This is a summary of certain changes to the Fund since November 1, 2023. For more complete information, you may review the Fund's next prospectus, which we expect to be available by December 30, 2024 at fundresearch.fidelity.com/prospectus/sec or upon request at 1-877-208-0098 or by sending an e-mail to fidfunddocuments@fidelity.com.
The fund's transfer agent and pricing & bookkeeping fees were changed to a fixed rate effective December 1, 2023, through February 29, 2024, in anticipation of the transition to a new management fee structure. Effective March 1, 2024, the fund's management contract was amended to incorporate administrative services previously covered under separate services agreements (transfer agent and pricing & bookkeeping). The amended contract incorporates a basic fee rate that may vary by class (subject to a performance adjustment). The Adviser or an affiliate pays certain expenses of managing and operating the fund out of each class's management fee. | |
| Fidelity, the Fidelity Investments Logo and all other Fidelity trademarks or service marks used herein are trademarks or service marks of FMR LLC. Any third-party marks that are used herein are trademarks or service marks of their respective owners. © 2024 FMR LLC. All rights reserved. |
| | For additional information about the Fund; including its prospectus, financial information, holdings and proxy information, scan the QR code or visit fundresearch.fidelity.com/prospectus/sec 1.9914026.100 6470-TSRA-1224 |
| |
| | ANNUAL SHAREHOLDER REPORT | AS OF OCTOBER 31, 2024 | This report describes changes to the Fund that occurred during the reporting period. |
| | Fidelity® Sustainable International Equity Fund Fidelity® Sustainable International Equity Fund : FSYRX |
| | | |
This annual shareholder report contains information about Fidelity® Sustainable International Equity Fund for the period November 1, 2023 to October 31, 2024. You can find additional information about the Fund at fundresearch.fidelity.com/prospectus/sec. You can also request this information by contacting us at 1-800-544-8544 or by sending an e-mail to fidfunddocuments@fidelity.com.
What were your Fund costs for the last year?(based on hypothetical $10,000 investment)
FUND COST (PREVIOUS YEAR)
| | Costs of a $10,000 investment | Costs paid as a percentage of a $10,000 investment | |
| Fidelity® Sustainable International Equity Fund | $ 118 | 1.05% | |
What affected the Fund's performance this period?
•International stocks achieved a strong gain for the 12 months ending October 31, 2024. Resilient global economic growth and a slowing in the pace of inflation in certain regions, as well as a shift to global monetary easing, contributed to a favorable backdrop, despite persistent geopolitical risk.
•Against this backdrop, security selection in Japan and the U.K. contributed to the fund's performance versus the MSCI EAFE Index (Net MA) for the fiscal year.
•By sector, the biggest contributor to performance versus the benchmark was stock picking in industrials, primarily within the capital goods industry. Stock picks in materials also boosted the fund's relative performance. Also bolstering our relative result was an underweight in energy.
•The top individual relative contributor was an overweight in Hitachi (+108%), the fund's biggest holding at period end. The second-largest relative contributor was our non-benchmark stake in Taiwan Semiconductor (+95%). The stock was among the fund's largest holdings. An overweight in UCB (+165%) also helped.
•In contrast, from a regional standpoint, security selection and an underweight in Asia Pacific ex Japan, primarily in Hong Kong, and an underweight in Japan detracted from the fund's relative result.
•By sector, the biggest detractor from performance versus the benchmark was stock selection in financials. Stock selection in consumer staples also hampered the fund's result. Also detracting from our result was an underweight in industrials, primarily within the capital goods industry. Lastly, the fund's position in cash detracted.
•The largest individual relative detractor was an overweight in Sony (+10%), which was among the fund's biggest holdings. The second-largest relative detractor was an overweight in AIA (-6%). Another notable relative detractor was an overweight in L'Oréal (-9%).
•Notable changes in positioning include decreased exposure to Germany and a higher allocation to Japan. By sector, meaningful changes in positioning include increased exposure to industrials and a lower allocation to consumer staples.
Application of FMR's environmental, social and governance ratings process and/or its sustainable investing exclusion criteria may affect the fund's exposure to certain issuers, sectors, regions and countries, and may affect the fund's performance.
How did the Fund perform over the life of Fund?
CUMULATIVE PERFORMANCE
February 10, 2022 through October 31, 2024.
Initial investment of $10,000.
Fidelity® Sustainable International Equity Fund | $10,000 | $7,210 | $7,912 |
MSCI EAFE ESG Leaders | $10,000 | $7,669 | $8,792 |
MSCI EAFE Index | $10,000 | $7,820 | $8,966 |
| | 2022 | 2023 | 2024 |
AVERAGE ANNUAL TOTAL RETURNS:| | 1 Year | Life of Fund A |
| Fidelity® Sustainable International Equity Fund | 25.98% | -0.12% |
| MSCI EAFE ESG Leaders | 22.13% | 2.65% |
| MSCI EAFE Index | 23.25% | 3.74% |
A From February 10, 2022
Visit www.fidelity.com for more recent performance information. |
The Fund's past performance is not a good predictor of the Fund's future performance. The graph and table do not reflect the deduction of taxes that a shareholder would pay on fund distributions or redemption of fund shares. |
Key Fund Statistics(as of October 31, 2024)
KEY FACTS | | |
| Fund Size | $10,747,030 | |
| Number of Holdings | 83 | |
| Total Advisory Fee | $67,920 | |
| Portfolio Turnover | 50% | |
What did the Fund invest in?
(as of October 31, 2024)
MARKET SECTORS (% of Fund's net assets) | | |
| Financials | 25.6 | |
| Industrials | 21.7 | |
| Health Care | 13.0 | |
| Consumer Discretionary | 11.0 | |
| Information Technology | 9.0 | |
| Materials | 6.5 | |
| Consumer Staples | 4.5 | |
| Utilities | 3.0 | |
| Communication Services | 2.1 | |
| Real Estate | 1.1 | |
| |
| Common Stocks | 97.5 |
| Short-Term Investments and Net Other Assets (Liabilities) | 2.5 |
ASSET ALLOCATION (% of Fund's net assets) |
|
|
| Japan | 21.7 |
| United Kingdom | 14.1 |
| United States | 10.5 |
| France | 9.8 |
| Netherlands | 8.4 |
| Germany | 6.7 |
| Denmark | 5.1 |
| Italy | 3.8 |
| Australia | 3.7 |
| Others | 16.2 |
GEOGRAPHIC DIVERSIFICATION (% of Fund's net assets) |
|
| |
|
TOP HOLDINGS(% of Fund's net assets) | | |
| Novo Nordisk A/S Series B | 4.4 | |
| Hitachi Ltd | 4.3 | |
| ITOCHU Corp | 3.5 | |
| CRH PLC (United Kingdom) | 2.9 | |
| ORIX Corp | 2.8 | |
| ASML Holding NV | 2.7 | |
| Sony Group Corp | 2.6 | |
| Schneider Electric SE | 2.6 | |
| Taiwan Semiconductor Manufacturing Co Ltd | 2.5 | |
| Unilever PLC | 2.4 | |
| | 30.7 | |
How has the Fund changed?
This is a summary of certain changes to the Fund since November 1, 2023. For more complete information, you may review the Fund's next prospectus, which we expect to be available by December 30, 2024 at fundresearch.fidelity.com/prospectus/sec or upon request at 1-800-544-8544 or by sending an e-mail to fidfunddocuments@fidelity.com.
The fund's transfer agent and pricing & bookkeeping fees were changed to a fixed rate effective December 1, 2023, through February 29, 2024, in anticipation of the transition to a new management fee structure. Effective March 1, 2024, the fund's management contract was amended to incorporate administrative services previously covered under separate services agreements (transfer agent and pricing & bookkeeping). The amended contract incorporates a basic fee rate that may vary by class (subject to a performance adjustment). The Adviser or an affiliate pays certain expenses of managing and operating the fund out of each class's management fee. | |
| Fidelity, the Fidelity Investments Logo and all other Fidelity trademarks or service marks used herein are trademarks or service marks of FMR LLC. Any third-party marks that are used herein are trademarks or service marks of their respective owners. © 2024 FMR LLC. All rights reserved. |
| | For additional information about the Fund; including its prospectus, financial information, holdings and proxy information, scan the QR code or visit fundresearch.fidelity.com/prospectus/sec 1.9914018.100 6462-TSRA-1224 |
| |
| | ANNUAL SHAREHOLDER REPORT | AS OF OCTOBER 31, 2024 | This report describes changes to the Fund that occurred during the reporting period. |
| | Fidelity® Global Commodity Stock Fund Fidelity Advisor® Global Commodity Stock Fund Class M : FFGTX |
| | | |
This annual shareholder report contains information about Fidelity® Global Commodity Stock Fund for the period November 1, 2023 to October 31, 2024. You can find additional information about the Fund at fundresearch.fidelity.com/prospectus/sec. You can also request this information by contacting us at 1-877-208-0098 or by sending an e-mail to fidfunddocuments@fidelity.com.
What were your Fund costs for the last year?(based on hypothetical $10,000 investment)
FUND COST (PREVIOUS YEAR)
| | Costs of a $10,000 investment | Costs paid as a percentage of a $10,000 investment | |
| Class M | $ 150 | 1.41% | |
What affected the Fund's performance this period?
•Global equities posted a strong advance for the 12 months ending October 31, 2024. Resilient economic growth and a slowing in the pace of inflation in certain regions, as well as a shift to global monetary easing, contributed to a favorable backdrop, despite persistent geopolitical risk.
•Against this backdrop, security selection in the United States and an overweight in Canada contributed to the fund's performance versus the MSCI AC World Commodity Producers Sector Capped Index for the fiscal year.
•By industry, security selection was the primary contributor, led by our choices in the oil & gas storage & transportation industry. Stock picking and an underweight in agricultural products & services also boosted the fund's relative performance. Also lifting the fund's relative result was out-of-benchmark exposure to the packaged foods & meats category.
•The top individual relative contributor was our stake in Archer Daniels Midland (+0%). This was a stake we established this period. The stock was one of our biggest holdings. The second-largest relative contributor was an overweight in Wheaton Precious Metals (+58%). We reduced the position, but the stock was still one of the fund's biggest holdings as of October 31. An overweight in Teck Resources (+33%) also helped. We also trimmed this position, but it too was among the fund's largest holdings at period end.
•In contrast, from a regional standpoint, stock picking in Asia Pacific ex Japan, primarily in Australia, detracted from the fund's relative result, as did an underweight in emerging markets, primarily in China and India.
•By industry, notable detractors from performance versus the benchmark included picks and an overweight in oil & gas exploration & production. Stock selection and an underweight in diversified metals & mining also hampered the fund's relative result. Also detracting from our result was a small non-benchmark position in pharmaceuticals.
•The largest individual relative detractor was an underweight in Corteva (+28%). This period we decreased our investment in Corteva. The second-largest relative detractor was an underweight in Agnico Eagle Mines (+89%). The stock was not held at period end. Another notable relative detractor was an overweight in Cenovus Energy (-13%). The stock was one of the fund's largest holdings.
•Notable changes in positioning include increased exposure to South Africa and a lower allocation to Australia. By sector, meaningful changes in positioning include increased exposure to oil & gas equipment & services and packaged foods & meats.
How did the Fund perform over the past 10 years?
CUMULATIVE PERFORMANCE
October 31, 2014 through October 31, 2024.
Initial investment of $10,000 and the current sales charge was paid.
Class M | $9,650 | $7,392 | $8,063 | $9,522 | $9,493 | $9,427 | $8,605 | $13,164 | $16,182 | $14,579 | $16,306 |
MSCI ACWI (All Country World Index) Commodity Producers Sector Capped Index | $10,000 | $7,702 | $8,581 | $10,342 | $10,510 | $10,163 | $8,673 | $13,570 | $15,259 | $14,850 | $15,721 |
MSCI ACWI (All Country World Index) Index | $10,000 | $10,035 | $10,284 | $12,721 | $12,703 | $14,362 | $15,121 | $20,822 | $16,723 | $18,547 | $24,710 |
| | 2014 | 2015 | 2016 | 2017 | 2018 | 2019 | 2020 | 2021 | 2022 | 2023 | 2024 |
AVERAGE ANNUAL TOTAL RETURNS:| | 1 Year | 5 Year | 10 Year |
| Class M (incl. 3.50% sales charge) | 7.93% | 10.79% | 5.01% |
| Class M (without 3.50% sales charge) | 11.85% | 11.58% | 5.39% |
| MSCI ACWI (All Country World Index) Commodity Producers Sector Capped Index | 5.86% | 9.12% | 4.63% |
| MSCI ACWI (All Country World Index) Index | 33.23% | 11.46% | 9.47% |
Visit institutional.fidelity.com for more recent performance information. |
The Fund's past performance is not a good predictor of the Fund's future performance. The graph and table do not reflect the deduction of taxes that a shareholder would pay on fund distributions or redemption of fund shares. |
Key Fund Statistics(as of October 31, 2024)
KEY FACTS | | |
| Fund Size | $929,592,306 | |
| Number of Holdings | 61 | |
| Total Advisory Fee | $7,667,954 | |
| Portfolio Turnover | 49% | |
What did the Fund invest in?
(as of October 31, 2024)
TOP INDUSTRIES (% of Fund's net assets) |
| Oil, Gas & Consumable Fuels | 35.2 | |
| Metals & Mining | 30.1 | |
| Food Products | 10.3 | |
| Paper & Forest Products | 10.2 | |
| Energy Equipment & Services | 6.0 | |
| Chemicals | 4.9 | |
| Containers & Packaging | 1.6 | |
| Construction Materials | 0.6 | |
| Construction & Engineering | 0.2 | |
| Others | 0.1 | |
| |
| Common Stocks | 99.2 |
| Short-Term Investments and Net Other Assets (Liabilities) | 0.8 |
ASSET ALLOCATION (% of Fund's net assets) |
|
|
| United States | 46.1 |
| Canada | 24.7 |
| Brazil | 7.1 |
| South Africa | 6.2 |
| Finland | 4.4 |
| Zambia | 2.7 |
| Australia | 2.6 |
| Norway | 2.3 |
| India | 2.0 |
| Others | 1.9 |
GEOGRAPHIC DIVERSIFICATION (% of Fund's net assets) |
|
| |
|
TOP HOLDINGS(% of Fund's net assets) | | |
| Exxon Mobil Corp | 7.0 | |
| Shell PLC | 5.8 | |
| Archer-Daniels-Midland Co | 4.9 | |
| Wheaton Precious Metals Corp | 4.5 | |
| Teck Resources Ltd Class B | 4.2 | |
| Cenovus Energy Inc | 3.9 | |
| Energy Transfer LP | 3.4 | |
| JBS S/A | 3.3 | |
| UPM-Kymmene Oyj | 3.2 | |
| Antero Resources Corp | 3.2 | |
| | 43.4 | |
How has the Fund changed?
This is a summary of certain changes to the Fund since November 1, 2023. For more complete information, you may review the Fund's next prospectus, which we expect to be available by December 30, 2024 at fundresearch.fidelity.com/prospectus/sec or upon request at 1-877-208-0098 or by sending an e-mail to fidfunddocuments@fidelity.com.
The fund's transfer agent and pricing & bookkeeping fees were changed to a fixed rate effective December 1, 2023, through February 29, 2024, in anticipation of the transition to a new management fee structure. Effective March 1, 2024, the fund's management contract was amended to incorporate administrative services previously covered under separate services agreements (transfer agent and pricing & bookkeeping). The amended contract incorporates a management fee rate that may vary by class. The Adviser or an affiliate pays certain expenses of managing and operating the fund out of each class's management fee. | The fund's sub-advisory agreement with FIL Investments (Japan) Limited was not renewed.
|
| Fidelity, the Fidelity Investments Logo and all other Fidelity trademarks or service marks used herein are trademarks or service marks of FMR LLC. Any third-party marks that are used herein are trademarks or service marks of their respective owners. © 2024 FMR LLC. All rights reserved. |
| | For additional information about the Fund; including its prospectus, financial information, holdings and proxy information, scan the QR code or visit fundresearch.fidelity.com/prospectus/sec 1.9913958.100 2124-TSRA-1224 |
| |
| | ANNUAL SHAREHOLDER REPORT | AS OF OCTOBER 31, 2024 | This report describes changes to the Fund that occurred during the reporting period. |
| | Fidelity® Sustainable Emerging Markets Equity Fund Fidelity® Sustainable Emerging Markets Equity Fund : FSYJX |
| | | |
This annual shareholder report contains information about Fidelity® Sustainable Emerging Markets Equity Fund for the period November 1, 2023 to October 31, 2024. You can find additional information about the Fund at fundresearch.fidelity.com/prospectus/sec. You can also request this information by contacting us at 1-800-544-8544 or by sending an e-mail to fidfunddocuments@fidelity.com.
What were your Fund costs for the last year?(based on hypothetical $10,000 investment)
FUND COST (PREVIOUS YEAR)
| | Costs of a $10,000 investment | Costs paid as a percentage of a $10,000 investment | |
| Fidelity® Sustainable Emerging Markets Equity Fund | $ 141 | 1.25% | |
What affected the Fund's performance this period?
•International stocks achieved a strong gain for the 12 months ending October 31, 2024. Resilient global economic growth and a slowing in the pace of inflation in certain regions, as well as a shift to global monetary easing, contributed to a favorable backdrop, despite persistent geopolitical risk.
•Against this backdrop, stock selection in China and Taiwan dominated among contributors to the fund's performance versus the MSCI Emerging Markets Index for the fiscal year.
•By sector, security selection in consumer discretionary was the primary contributor. Picks and an overweight in information technology, also boosted the fund's relative performance.
•The top individual relative contributor was an overweight in Taiwan Semiconductor Manufacturing (+128%). The stock was the fund's largest holding. A second notable relative contributor was an overweight in Zomato (+93%). This was a stake we established this period. Another notable relative contributor was our non-benchmark stake in International Games System (+83%). The stock was not held at period end.
•In contrast, from a regional standpoint, stock selection and an overweight in Latin America detracted from the fund's relative result.
•By sector, the biggest detractor from performance versus the benchmark was stock selection in financials. Security selection in industrials also hampered the fund's result. Also hurting our result were picks and an overweight in health care.
•The biggest individual relative detractor was an overweight in Samsung Electronics (-12%). The company was one of our biggest holdings. A non-benchmark stake in Vamos Locacao de Caminhoes returned -42% and was the second-largest relative detractor. This was a stake we established this period. An overweight in Grupo Financiero Banorte (-9%) also detracted. The stock was among the fund's biggest holdings this period.
•Notable changes in positioning include increased exposure to South Africa and a lower allocation to South Korea. By sector, meaningful changes in positioning include lower allocations to consumer staples and communication services.
Application of FMR's environmental, social and governance ratings process and/or its sustainable investing exclusion criteria may affect the fund's exposure to certain issuers, sectors, regions and countries, and may affect the fund's performance.
How did the Fund perform over the life of Fund?
CUMULATIVE PERFORMANCE
February 10, 2022 through October 31, 2024.
Initial investment of $10,000.
Fidelity® Sustainable Emerging Markets Equity Fund | $10,000 | $6,570 | $7,431 |
MSCI Emerging Markets (EM) ESG Leaders Index | $10,000 | $6,534 | $7,249 |
MSCI Emerging Markets Index | $10,000 | $6,946 | $7,699 |
| | 2022 | 2023 | 2024 |
AVERAGE ANNUAL TOTAL RETURNS:| | 1 Year | Life of Fund A |
| Fidelity® Sustainable Emerging Markets Equity Fund | 25.84% | -2.43% |
| MSCI Emerging Markets (EM) ESG Leaders Index | 28.51% | -2.57% |
| MSCI Emerging Markets Index | 25.33% | -1.30% |
A From February 10, 2022
Visit www.fidelity.com for more recent performance information. |
The Fund's past performance is not a good predictor of the Fund's future performance. The graph and table do not reflect the deduction of taxes that a shareholder would pay on fund distributions or redemption of fund shares. |
Key Fund Statistics(as of October 31, 2024)
KEY FACTS | | |
| Fund Size | $6,416,219 | |
| Number of Holdings | 119 | |
| Total Advisory Fee | $47,275 | |
| Portfolio Turnover | 108% | |
What did the Fund invest in?
(as of October 31, 2024)
MARKET SECTORS (% of Fund's net assets) | | |
| Financials | 24.8 | |
| Information Technology | 24.6 | |
| Consumer Discretionary | 17.3 | |
| Communication Services | 9.1 | |
| Industrials | 5.1 | |
| Health Care | 4.4 | |
| Materials | 3.7 | |
| Consumer Staples | 3.0 | |
| Energy | 2.2 | |
| Real Estate | 1.2 | |
| Utilities | 0.7 | |
| |
| Common Stocks | 96.1 |
| Short-Term Investments and Net Other Assets (Liabilities) | 3.9 |
ASSET ALLOCATION (% of Fund's net assets) |
|
|
| China | 30.9 |
| Taiwan | 15.9 |
| India | 13.3 |
| Korea (South) | 9.7 |
| Brazil | 6.3 |
| South Africa | 5.2 |
| United States | 3.9 |
| Mexico | 3.5 |
| Indonesia | 2.3 |
| Others | 9.0 |
GEOGRAPHIC DIVERSIFICATION (% of Fund's net assets) |
|
| |
|
TOP HOLDINGS(% of Fund's net assets) | | |
| Taiwan Semiconductor Manufacturing Co Ltd | 10.5 | |
| Tencent Holdings Ltd | 6.2 | |
| Alibaba Group Holding Ltd | 4.2 | |
| Samsung Electronics Co Ltd | 4.2 | |
| Hon Hai Precision Industry Co Ltd | 2.0 | |
| Bank Central Asia Tbk PT | 1.9 | |
| SK Hynix Inc | 1.8 | |
| Bharti Airtel Ltd | 1.7 | |
| China Construction Bank Corp H Shares | 1.7 | |
| HDFC Bank Ltd | 1.7 | |
| | 35.9 | |
How has the Fund changed?
This is a summary of certain changes to the Fund since November 1, 2023. For more complete information, you may review the Fund's next prospectus, which we expect to be available by December 30, 2024 at fundresearch.fidelity.com/prospectus/sec or upon request at 1-800-544-8544 or by sending an e-mail to fidfunddocuments@fidelity.com.
The fund's transfer agent and pricing & bookkeeping fees were changed to a fixed rate effective December 1, 2023, through February 29, 2024, in anticipation of the transition to a new management fee structure. Effective March 1, 2024, the fund's management contract was amended to incorporate administrative services previously covered under separate services agreements (transfer agent and pricing & bookkeeping). The amended contract incorporates a basic fee rate that may vary by class (subject to a performance adjustment). The Adviser or an affiliate pays certain expenses of managing and operating the fund out of each class's management fee. | |
| Fidelity, the Fidelity Investments Logo and all other Fidelity trademarks or service marks used herein are trademarks or service marks of FMR LLC. Any third-party marks that are used herein are trademarks or service marks of their respective owners. © 2024 FMR LLC. All rights reserved. |
| | For additional information about the Fund; including its prospectus, financial information, holdings and proxy information, scan the QR code or visit fundresearch.fidelity.com/prospectus/sec 1.9914024.100 6468-TSRA-1224 |
| |
| | ANNUAL SHAREHOLDER REPORT | AS OF OCTOBER 31, 2024 | This report describes changes to the Fund that occurred during the reporting period. |
| | Fidelity® Sustainable International Equity Fund Fidelity Advisor® Sustainable International Equity Fund Class M : FSYMX |
| | | |
This annual shareholder report contains information about Fidelity® Sustainable International Equity Fund for the period November 1, 2023 to October 31, 2024. You can find additional information about the Fund at fundresearch.fidelity.com/prospectus/sec. You can also request this information by contacting us at 1-877-208-0098 or by sending an e-mail to fidfunddocuments@fidelity.com.
What were your Fund costs for the last year?(based on hypothetical $10,000 investment)
FUND COST (PREVIOUS YEAR)
| | Costs of a $10,000 investment | Costs paid as a percentage of a $10,000 investment | |
| Class M | $ 175 | 1.55% | |
What affected the Fund's performance this period?
•International stocks achieved a strong gain for the 12 months ending October 31, 2024. Resilient global economic growth and a slowing in the pace of inflation in certain regions, as well as a shift to global monetary easing, contributed to a favorable backdrop, despite persistent geopolitical risk.
•Against this backdrop, security selection in Japan and the U.K. contributed to the fund's performance versus the MSCI EAFE Index (Net MA) for the fiscal year.
•By sector, the biggest contributor to performance versus the benchmark was stock picking in industrials, primarily within the capital goods industry. Stock picks in materials also boosted the fund's relative performance. Also bolstering our relative result was an underweight in energy.
•The top individual relative contributor was an overweight in Hitachi (+108%), the fund's biggest holding at period end. The second-largest relative contributor was our non-benchmark stake in Taiwan Semiconductor (+95%). The stock was among the fund's largest holdings. An overweight in UCB (+165%) also helped.
•In contrast, from a regional standpoint, security selection and an underweight in Asia Pacific ex Japan, primarily in Hong Kong, and an underweight in Japan detracted from the fund's relative result.
•By sector, the biggest detractor from performance versus the benchmark was stock selection in financials. Stock selection in consumer staples also hampered the fund's result. Also detracting from our result was an underweight in industrials, primarily within the capital goods industry. Lastly, the fund's position in cash detracted.
•The largest individual relative detractor was an overweight in Sony (+10%), which was among the fund's biggest holdings. The second-largest relative detractor was an overweight in AIA (-6%). Another notable relative detractor was an overweight in L'Oréal (-9%).
•Notable changes in positioning include decreased exposure to Germany and a higher allocation to Japan. By sector, meaningful changes in positioning include increased exposure to industrials and a lower allocation to consumer staples.
Application of FMR's environmental, social and governance ratings process and/or its sustainable investing exclusion criteria may affect the fund's exposure to certain issuers, sectors, regions and countries, and may affect the fund's performance.
How did the Fund perform over the life of Fund?
CUMULATIVE PERFORMANCE
February 10, 2022 through October 31, 2024.
Initial investment of $10,000 and the current sales charge was paid.
Class M | $9,650 | $6,938 | $7,568 |
MSCI EAFE ESG Leaders | $10,000 | $7,669 | $8,792 |
MSCI EAFE Index | $10,000 | $7,820 | $8,966 |
| | 2022 | 2023 | 2024 |
AVERAGE ANNUAL TOTAL RETURNS:| | 1 Year | Life of Fund A |
| Class M (incl. 3.50% sales charge) | 21.02% | -1.90% |
| Class M (without 3.50% sales charge) | 25.40% | -0.61% |
| MSCI EAFE ESG Leaders | 22.13% | 2.65% |
| MSCI EAFE Index | 23.25% | 3.74% |
A From February 10, 2022
Visit institutional.fidelity.com for more recent performance information. |
The Fund's past performance is not a good predictor of the Fund's future performance. The graph and table do not reflect the deduction of taxes that a shareholder would pay on fund distributions or redemption of fund shares. |
Key Fund Statistics(as of October 31, 2024)
KEY FACTS | | |
| Fund Size | $10,747,030 | |
| Number of Holdings | 83 | |
| Total Advisory Fee | $67,920 | |
| Portfolio Turnover | 50% | |
What did the Fund invest in?
(as of October 31, 2024)
MARKET SECTORS (% of Fund's net assets) | | |
| Financials | 25.6 | |
| Industrials | 21.7 | |
| Health Care | 13.0 | |
| Consumer Discretionary | 11.0 | |
| Information Technology | 9.0 | |
| Materials | 6.5 | |
| Consumer Staples | 4.5 | |
| Utilities | 3.0 | |
| Communication Services | 2.1 | |
| Real Estate | 1.1 | |
| |
| Common Stocks | 97.5 |
| Short-Term Investments and Net Other Assets (Liabilities) | 2.5 |
ASSET ALLOCATION (% of Fund's net assets) |
|
|
| Japan | 21.7 |
| United Kingdom | 14.1 |
| United States | 10.5 |
| France | 9.8 |
| Netherlands | 8.4 |
| Germany | 6.7 |
| Denmark | 5.1 |
| Italy | 3.8 |
| Australia | 3.7 |
| Others | 16.2 |
GEOGRAPHIC DIVERSIFICATION (% of Fund's net assets) |
|
| |
|
TOP HOLDINGS(% of Fund's net assets) | | |
| Novo Nordisk A/S Series B | 4.4 | |
| Hitachi Ltd | 4.3 | |
| ITOCHU Corp | 3.5 | |
| CRH PLC (United Kingdom) | 2.9 | |
| ORIX Corp | 2.8 | |
| ASML Holding NV | 2.7 | |
| Sony Group Corp | 2.6 | |
| Schneider Electric SE | 2.6 | |
| Taiwan Semiconductor Manufacturing Co Ltd | 2.5 | |
| Unilever PLC | 2.4 | |
| | 30.7 | |
How has the Fund changed?
This is a summary of certain changes to the Fund since November 1, 2023. For more complete information, you may review the Fund's next prospectus, which we expect to be available by December 30, 2024 at fundresearch.fidelity.com/prospectus/sec or upon request at 1-877-208-0098 or by sending an e-mail to fidfunddocuments@fidelity.com.
The fund's transfer agent and pricing & bookkeeping fees were changed to a fixed rate effective December 1, 2023, through February 29, 2024, in anticipation of the transition to a new management fee structure. Effective March 1, 2024, the fund's management contract was amended to incorporate administrative services previously covered under separate services agreements (transfer agent and pricing & bookkeeping). The amended contract incorporates a basic fee rate that may vary by class (subject to a performance adjustment). The Adviser or an affiliate pays certain expenses of managing and operating the fund out of each class's management fee. | |
| Fidelity, the Fidelity Investments Logo and all other Fidelity trademarks or service marks used herein are trademarks or service marks of FMR LLC. Any third-party marks that are used herein are trademarks or service marks of their respective owners. © 2024 FMR LLC. All rights reserved. |
| | For additional information about the Fund; including its prospectus, financial information, holdings and proxy information, scan the QR code or visit fundresearch.fidelity.com/prospectus/sec 1.9914021.100 6465-TSRA-1224 |
| |
| | ANNUAL SHAREHOLDER REPORT | AS OF OCTOBER 31, 2024 | |
| | Fidelity® Series International Small Cap Fund Fidelity® Series International Small Cap Fund : FSTSX |
| | | |
This annual shareholder report contains information about Fidelity® Series International Small Cap Fund for the period November 1, 2023 to October 31, 2024. You can find additional information about the Fund at fundresearch.fidelity.com/prospectus/sec. You can also request this information by contacting us at 1-800-544-8544.
What were your Fund costs for the last year?(based on hypothetical $10,000 investment)
FUND COST (PREVIOUS YEAR)
| | Costs of a $10,000 investment | Costs paid as a percentage of a $10,000 investment | |
| Fidelity® Series International Small Cap Fund | $ 1 | 0.01% | |
What affected the Fund's performance this period?
•International stocks achieved a strong gain for the 12 months ending October 31, 2024. Resilient global economic growth and a slowing in the pace of inflation in certain regions, as well as a shift to global monetary easing, contributed to a favorable backdrop, despite persistent geopolitical risk.
•Against this backdrop, stock selection in Europe ex U.K. and a non-benchmark allocation to the United States contributed to the fund's performance versus the MSCI EAFE Small Cap Index (Net MA) for the fiscal year.
•By sector, security selection in communication services was the primary contributor, where our stock picks in media & entertainment helped most. Security selection and an overweight in industrials, primarily within the capital goods industry, also boosted the fund's relative performance. Also lifting the fund's relative result was stock picking in consumer discretionary, primarily within the consumer services industry.
•The fund's non-benchmark stake in Lagercrantz gained about 116% and was the top individual relative contributor. The company was the fund's biggest holding. A second notable relative contributor was our non-benchmark stake in Kongsberg Gruppen (+155%). This period we decreased our investment in Kongsberg Gruppen. The company was one of the fund's biggest holdings. An overweight in Addtech (+91%) also contributed. The stock was among our largest holdings.
•In contrast, from a regional standpoint, picks in the U.K. and a non-benchmark allocation to Canada detracted from the fund's relative result.
•By sector, the biggest detractor from performance versus the benchmark was security selection in health care. Stock picking and an underweight in financials also hampered the fund's result. Also hurting our result was security selection in consumer staples. Lastly, the fund's position in cash detracted.
•The largest individual relative detractor was an overweight in Spectris (-12%). The stock was one of our biggest holdings. A non-benchmark stake in Richelieu Hardware returned -11% and was the second-largest relative detractor. An overweight in Stabilus (-36%) also hurt.
•Notable changes in positioning include higher allocations to Sweden and the United Kingdom. By sector, meaningful changes in positioning include increased exposure to materials and a lower allocation to health care.
How did the Fund perform over the past 10 years?
CUMULATIVE PERFORMANCE
October 31, 2014 through October 31, 2024.
Initial investment of $10,000.
Fidelity® Series International Small Cap Fund | $10,000 | $10,836 | $10,838 | $13,642 | $13,134 | $14,811 | $16,233 | $22,499 | $15,340 | $16,348 | $20,802 |
MSCI EAFE Small Cap Index | $10,000 | $10,855 | $11,194 | $14,295 | $13,198 | $14,385 | $14,210 | $19,320 | $13,494 | $14,394 | $17,734 |
MSCI EAFE Index | $10,000 | $10,008 | $9,705 | $12,004 | $11,206 | $12,472 | $11,638 | $15,647 | $12,073 | $13,841 | $17,059 |
| | 2014 | 2015 | 2016 | 2017 | 2018 | 2019 | 2020 | 2021 | 2022 | 2023 | 2024 |
AVERAGE ANNUAL TOTAL RETURNS:| | 1 Year | 5 Year | 10 Year |
| Fidelity® Series International Small Cap Fund | 27.24% | 7.03% | 7.60% |
| MSCI EAFE Small Cap Index | 23.20% | 4.27% | 5.90% |
| MSCI EAFE Index | 23.25% | 6.46% | 5.49% |
Visit www.fidelity.com for more recent performance information. |
The Fund's past performance is not a good predictor of the Fund's future performance. The graph and table do not reflect the deduction of taxes that a shareholder would pay on fund distributions or redemption of fund shares. |
Key Fund Statistics(as of October 31, 2024)
KEY FACTS | | |
| Fund Size | $3,907,046,437 | |
| Number of Holdings | 285 | |
| Total Advisory Fee | $0 | |
| Portfolio Turnover | 30% | |
What did the Fund invest in?
(as of October 31, 2024)
MARKET SECTORS (% of Fund's net assets) | | |
| Industrials | 30.0 | |
| Information Technology | 18.3 | |
| Consumer Discretionary | 11.3 | |
| Communication Services | 7.9 | |
| Financials | 7.7 | |
| Materials | 6.3 | |
| Health Care | 5.3 | |
| Consumer Staples | 4.3 | |
| Real Estate | 3.2 | |
| Energy | 2.3 | |
| Utilities | 0.1 | |
| |
| Common Stocks | 96.7 |
| International Equity Funds | 0.4 |
| Short-Term Investments and Net Other Assets (Liabilities) | 2.9 |
ASSET ALLOCATION (% of Fund's net assets) |
|
|
| Japan | 27.8 |
| United Kingdom | 16.0 |
| Sweden | 12.5 |
| Germany | 6.9 |
| United States | 6.0 |
| Netherlands | 5.3 |
| Canada | 3.9 |
| France | 3.3 |
| Italy | 2.8 |
| Others | 15.5 |
GEOGRAPHIC DIVERSIFICATION (% of Fund's net assets) |
|
| |
|
TOP HOLDINGS(% of Fund's net assets) | | |
| Lagercrantz Group AB B Shares | 3.9 | |
| CTS Eventim AG & Co KGaA | 3.2 | |
| AddTech AB B Shares | 3.0 | |
| Azbil Corp | 2.7 | |
| Spectris PLC | 2.2 | |
| Aalberts NV | 2.1 | |
| Interpump Group SpA | 2.1 | |
| Morningstar Inc | 2.0 | |
| Howden Joinery Group PLC | 1.5 | |
| Kongsberg Gruppen ASA | 1.5 | |
| | 24.2 | |
| Fidelity, the Fidelity Investments Logo and all other Fidelity trademarks or service marks used herein are trademarks or service marks of FMR LLC. Any third-party marks that are used herein are trademarks or service marks of their respective owners. © 2024 FMR LLC. All rights reserved. |
| | For additional information about the Fund; including its prospectus, financial information, holdings and proxy information, scan the QR code or visit fundresearch.fidelity.com/prospectus/sec 1.9913964.100 2284-TSRA-1224 |
| |
| | ANNUAL SHAREHOLDER REPORT | AS OF OCTOBER 31, 2024 | |
| | Fidelity® Series International Value Fund Fidelity® Series International Value Fund : FINVX |
| | | |
This annual shareholder report contains information about Fidelity® Series International Value Fund for the period November 1, 2023 to October 31, 2024. You can find additional information about the Fund at fundresearch.fidelity.com/prospectus/sec. You can also request this information by contacting us at 1-800-544-8544.
What were your Fund costs for the last year?(based on hypothetical $10,000 investment)
FUND COST (PREVIOUS YEAR)
| | Costs of a $10,000 investment | Costs paid as a percentage of a $10,000 investment | |
| Fidelity® Series International Value Fund | $ 1 | 0.01% | |
What affected the Fund's performance this period?
•International stocks achieved a strong gain for the 12 months ending October 31, 2024. Resilient global economic growth and a slowing in the pace of inflation in certain regions, as well as a shift to global monetary easing, contributed to a favorable backdrop, despite persistent geopolitical risk.
•Against this backdrop, security selection in Japan and stock picking and an overweight in the United States contributed to the fund's performance versus the MSCI EAFE Value Index (Net MA) for the fiscal year.
•By sector, security selection in industrials was the primary contributor, where our stock picks in capital goods helped most. Stock selection in materials also boosted the fund's relative performance. Also contributing to our result was an overweight in financials.
•The top individual relative contributor was an overweight in Hitachi (+110%). The stock was among the fund's biggest holdings. The second-largest relative contributor was an overweight in Mitsubishi Heavy Industries (+162%). This was a stake we established this period. An overweight in CRH (+83%) also helped. The company was among the fund's largest holdings at period end.
•In contrast, from a regional standpoint, stock picking in the U.K. and Asia Pacific ex Japan, primarily in Australia, detracted from the fund's relative result.
•By sector, the biggest detractor from performance versus the benchmark was security selection in information technology. Stock picking in financials also hampered the fund's result. Also hurting our result was an overweight in energy.
•The biggest individual relative detractor was an overweight in GSK (-11%). This was a position we established this period. The second-largest relative detractor was an overweight in BHP (+4%). The stock was among our largest holdings. A non-benchmark stake in Prudential returned approximately -18% and notably hurt.
•Notable changes in positioning include decreased exposure to France and Australia. By sector, meaningful changes in positioning include lower allocations to consumer discretionary and energy.
How did the Fund perform over the past 10 years?
CUMULATIVE PERFORMANCE
October 31, 2014 through October 31, 2024.
Initial investment of $10,000.
Fidelity® Series International Value Fund | $10,000 | $9,935 | $9,489 | $11,418 | $10,492 | $11,068 | $9,679 | $14,030 | $11,728 | $13,955 | $17,471 |
MSCI EAFE Value Index | $10,000 | $9,591 | $9,294 | $11,477 | $10,621 | $11,237 | $9,189 | $12,742 | $10,687 | $12,659 | $15,588 |
MSCI EAFE Index | $10,000 | $10,008 | $9,705 | $12,004 | $11,206 | $12,472 | $11,638 | $15,647 | $12,073 | $13,841 | $17,059 |
| | 2014 | 2015 | 2016 | 2017 | 2018 | 2019 | 2020 | 2021 | 2022 | 2023 | 2024 |
AVERAGE ANNUAL TOTAL RETURNS:| | 1 Year | 5 Year | 10 Year |
| Fidelity® Series International Value Fund | 25.19% | 9.56% | 5.74% |
| MSCI EAFE Value Index | 23.14% | 6.76% | 4.54% |
| MSCI EAFE Index | 23.25% | 6.46% | 5.49% |
Visit www.fidelity.com for more recent performance information. |
The Fund's past performance is not a good predictor of the Fund's future performance. The graph and table do not reflect the deduction of taxes that a shareholder would pay on fund distributions or redemption of fund shares. |
Key Fund Statistics(as of October 31, 2024)
KEY FACTS | | |
| Fund Size | $15,015,233,252 | |
| Number of Holdings | 101 | |
| Total Advisory Fee | $0 | |
| Portfolio Turnover | 33% | |
What did the Fund invest in?
(as of October 31, 2024)
MARKET SECTORS (% of Fund's net assets) | | |
| Financials | 35.0 | |
| Industrials | 18.1 | |
| Materials | 13.0 | |
| Energy | 8.3 | |
| Consumer Discretionary | 5.1 | |
| Health Care | 4.8 | |
| Information Technology | 4.3 | |
| Consumer Staples | 3.9 | |
| Communication Services | 3.0 | |
| Real Estate | 0.9 | |
| Utilities | 0.6 | |
| |
| Common Stocks | 96.5 |
| Preferred Stocks | 0.5 |
| Short-Term Investments and Net Other Assets (Liabilities) | 3.0 |
ASSET ALLOCATION (% of Fund's net assets) |
|
|
| Japan | 22.6 |
| United Kingdom | 14.7 |
| United States | 13.1 |
| Germany | 11.6 |
| France | 9.8 |
| Australia | 6.1 |
| Italy | 5.0 |
| Spain | 3.4 |
| Switzerland | 3.3 |
| Others | 10.4 |
GEOGRAPHIC DIVERSIFICATION (% of Fund's net assets) |
|
| |
|
TOP HOLDINGS(% of Fund's net assets) | | |
| Shell PLC ADR | 3.7 | |
| Hitachi Ltd | 2.7 | |
| Banco Santander SA | 2.4 | |
| AXA SA | 2.3 | |
| CRH PLC | 2.2 | |
| Rheinmetall AG | 2.2 | |
| BAE Systems PLC | 2.1 | |
| BHP Group Ltd | 2.1 | |
| TotalEnergies SE | 2.0 | |
| Mitsubishi UFJ Financial Group Inc | 2.0 | |
| | 23.7 | |
| Fidelity, the Fidelity Investments Logo and all other Fidelity trademarks or service marks used herein are trademarks or service marks of FMR LLC. Any third-party marks that are used herein are trademarks or service marks of their respective owners. © 2024 FMR LLC. All rights reserved. |
| | For additional information about the Fund; including its prospectus, financial information, holdings and proxy information, scan the QR code or visit fundresearch.fidelity.com/prospectus/sec 1.9913963.100 2283-TSRA-1224 |
| |
| | ANNUAL SHAREHOLDER REPORT | AS OF OCTOBER 31, 2024 | This report describes changes to the Fund that occurred during the reporting period. |
| | Fidelity® Infrastructure Fund Fidelity® Infrastructure Fund : FNSTX |
| | | |
This annual shareholder report contains information about Fidelity® Infrastructure Fund for the period November 1, 2023 to October 31, 2024. You can find additional information about the Fund at fundresearch.fidelity.com/prospectus/sec. You can also request this information by contacting us at 1-800-544-8544 or by sending an e-mail to fidfunddocuments@fidelity.com.
What were your Fund costs for the last year?(based on hypothetical $10,000 investment)
FUND COST (PREVIOUS YEAR)
| | Costs of a $10,000 investment | Costs paid as a percentage of a $10,000 investment | |
| Fidelity® Infrastructure Fund | $ 110 | 0.95% | |
What affected the Fund's performance this period?
•Global equities posted a strong advance for the 12 months ending October 31, 2024. Resilient economic growth and a slowing in the pace of inflation in certain regions, as well as a shift to global monetary easing, contributed to a favorable backdrop, despite persistent geopolitical risk.
•Against this backdrop, stock picking in the United States and Europe ex U.K. detracted from the fund's performance versus the S&P Global Infrastructure Index for the fiscal year.
•By sector, market selection was the primary detractor, especially an underweight in energy. Stock picking and an underweight in utilities also hampered the fund's result. Also hurting our result were stock picks in real estate, primarily within the equity real estate investment trusts industry.
•The largest individual relative detractor was an underweight in sizable benchmark component Grupo Aeroportuario Del Pacifico (+55%). This was an investment we established this period. A second notable relative detractor was an overweight in Cheniere Energy (+16%). The company was one of the fund's biggest holdings. Another notable relative detractor this period was avoiding TC Energy, a benchmark component that gained 59%.
•In contrast, from a regional standpoint, an underweight in Europe ex U.K. and Asia Pacific ex Japan contributed to the fund's relative result.
•By sector, the biggest contributors to performance versus the benchmark were stock picking and an underweight in industrials, primarily within the transportation industry. Stock picks in communication services also boosted the fund's relative performance.
•The top individual relative contributor was an overweight in Targa Resources (+103%). The stock was among our largest holdings. A second notable relative contributor this period was avoiding Japan Airport Terminal, a benchmark component that returned about -14%. Another notable relative contributor this period was avoiding Auckland Intl Airport, a benchmark component that gained 4%.
•Notable changes in positioning include decreased exposure to Spain and a higher allocation to the United States. By sector, meaningful changes in positioning include increased exposure to communication services and a lower allocation to utilities.
How did the Fund perform over the life of Fund?
CUMULATIVE PERFORMANCE
November 5, 2019 through October 31, 2024.
Initial investment of $10,000.
Fidelity® Infrastructure Fund | $10,000 | $10,479 | $12,780 | $11,509 | $11,229 | $14,725 |
S&P® Global Infrastructure Index | $10,000 | $8,403 | $10,830 | $10,324 | $10,189 | $13,577 |
MSCI ACWI (All Country World Index) Index | $10,000 | $10,388 | $14,305 | $11,489 | $12,742 | $16,976 |
| | 2019 | 2020 | 2021 | 2022 | 2023 | 2024 |
AVERAGE ANNUAL TOTAL RETURNS:| | 1 Year | Life of Fund A |
| Fidelity® Infrastructure Fund | 31.13% | 8.06% |
| S&P® Global Infrastructure Index | 33.26% | 6.32% |
| MSCI ACWI (All Country World Index) Index | 33.23% | 11.18% |
A From November 5, 2019
Visit www.fidelity.com for more recent performance information. |
The Fund's past performance is not a good predictor of the Fund's future performance. The graph and table do not reflect the deduction of taxes that a shareholder would pay on fund distributions or redemption of fund shares. |
Key Fund Statistics(as of October 31, 2024)
KEY FACTS | | |
| Fund Size | $45,167,267 | |
| Number of Holdings | 48 | |
| Total Advisory Fee | $331,166 | |
| Portfolio Turnover | 74% | |
What did the Fund invest in?
(as of October 31, 2024)
MARKET SECTORS (% of Fund's net assets) | | |
| Utilities | 29.5 | |
| Industrials | 26.7 | |
| Energy | 17.9 | |
| Real Estate | 11.2 | |
| Communication Services | 6.5 | |
| Information Technology | 3.8 | |
| |
| Common Stocks | 95.6 |
| Short-Term Investments and Net Other Assets (Liabilities) | 4.4 |
ASSET ALLOCATION (% of Fund's net assets) |
|
|
| United States | 80.6 |
| Spain | 8.7 |
| United Kingdom | 5.1 |
| Mexico | 2.8 |
| Canada | 1.3 |
| China | 0.8 |
| Tanzania | 0.7 |
GEOGRAPHIC DIVERSIFICATION (% of Fund's net assets) |
|
| |
|
TOP HOLDINGS(% of Fund's net assets) | | |
| Aena SME SA | 6.6 | |
| Southern Co/The | 6.2 | |
| NextEra Energy Inc | 5.9 | |
| Williams Cos Inc/The | 5.2 | |
| Cheniere Energy Inc | 4.8 | |
| Sempra | 4.4 | |
| Targa Resources Corp | 4.3 | |
| National Grid PLC | 3.7 | |
| GFL Environmental Inc Subordinate Voting Shares (United States) | 2.8 | |
| Constellation Energy Corp | 2.7 | |
| | 46.6 | |
How has the Fund changed?
This is a summary of certain changes to the Fund since November 1, 2023. For more complete information, you may review the Fund's next prospectus, which we expect to be available by December 30, 2024 at fundresearch.fidelity.com/prospectus/sec or upon request at 1-800-544-8544 or by sending an e-mail to fidfunddocuments@fidelity.com.
The fund's transfer agent and pricing & bookkeeping fees were changed to a fixed rate effective December 1, 2023, through February 29, 2024, in anticipation of the transition to a new management fee structure. Effective March 1, 2024, the fund's management contract was amended to incorporate administrative services previously covered under separate services agreements (transfer agent and pricing & bookkeeping). The amended contract incorporates a management fee rate that may vary by class. The Adviser or an affiliate pays certain expenses of managing and operating the fund out of each class's management fee. | |
| Fidelity, the Fidelity Investments Logo and all other Fidelity trademarks or service marks used herein are trademarks or service marks of FMR LLC. Any third-party marks that are used herein are trademarks or service marks of their respective owners. © 2024 FMR LLC. All rights reserved. |
| | For additional information about the Fund; including its prospectus, financial information, holdings and proxy information, scan the QR code or visit fundresearch.fidelity.com/prospectus/sec 1.9914011.100 3488-TSRA-1224 |
| |
| | ANNUAL SHAREHOLDER REPORT | AS OF OCTOBER 31, 2024 | |
| | Fidelity® Series Select International Small Cap Fund Fidelity® Series Select International Small Cap Fund : FSSJX |
| | | |
This annual shareholder report contains information about Fidelity® Series Select International Small Cap Fund for the period November 1, 2023 to October 31, 2024. You can find additional information about the Fund at fundresearch.fidelity.com/prospectus/sec. You can also request this information by contacting us at 1-800-544-8544.
What were your Fund costs for the last year?(based on hypothetical $10,000 investment)
FUND COST (PREVIOUS YEAR)
| | Costs of a $10,000 investment | Costs paid as a percentage of a $10,000 investment | |
| Fidelity® Series Select International Small Cap Fund | $ 1 | 0.01% | |
What affected the Fund's performance this period?
•International stocks achieved a strong gain for the 12 months ending October 31, 2024. Resilient global economic growth and a slowing in the pace of inflation in certain regions, as well as a shift to global monetary easing, contributed to a favorable backdrop, despite persistent geopolitical risk.
•Against this backdrop, security selection in the U.K. and an underweight in Europe ex U.K. detracted from the fund's performance versus the MSCI EAFE Small Cap Index (Net MA) for the fiscal year.
•By sector, security selection in consumer discretionary was the primary detractor. Also hurting our result were picks in financials, primarily within the insurance industry, and health care, primarily within the pharmaceuticals, biotechnology & life sciences industry. Lastly, the fund's position in cash detracted.
•The biggest individual relative detractor was an overweight in Stabilus (-36%). A second notable relative detractor this period was avoiding Fujikura, a benchmark component that gained 443%. Another notable relative detractor was an overweight in Ubisoft Entertainment (-48%).
•In contrast, from a regional standpoint, picks in Japan and Europe ex U.K., primarily in France, contributed to the fund's relative result.
•By sector, the biggest contributor to performance versus the benchmark was stock selection in consumer staples, primarily within the food, beverage & tobacco industry. Picks in communication services, primarily within the media & entertainment industry, also boosted relative performance. Also lifting the fund's relative result was an underweight in real estate, primarily within the equity real estate investment trusts industry.
•The top individual relative contributor was an overweight in SWCC (+167%). A second notable relative contributor was an overweight in Nova Measuring Instruments (+100%). The stock was one of the fund's largest holdings this period. An overweight in Sanwa Holdings (+99%) also contributed. The company was one of the fund's biggest holdings at period end.
•Notable changes in positioning include lower allocations to Germany and Sweden. By sector, meaningful changes in positioning include lower allocations to communication services and consumer staples.
How did the Fund perform over the life of Fund?
CUMULATIVE PERFORMANCE
November 4, 2022 through October 31, 2024.
Initial investment of $10,000.
Fidelity® Series Select International Small Cap Fund | $10,000 | $10,803 | $12,809 |
MSCI EAFE Small Cap Index | $10,000 | $10,593 | $13,051 |
MSCI EAFE Index | $10,000 | $11,332 | $13,967 |
| | 2022 | 2023 | 2024 |
AVERAGE ANNUAL TOTAL RETURNS:| | 1 Year | Life of Fund A |
| Fidelity® Series Select International Small Cap Fund | 18.56% | 13.23% |
| MSCI EAFE Small Cap Index | 23.20% | 14.30% |
| MSCI EAFE Index | 23.25% | 18.26% |
A From November 4, 2022
Visit www.fidelity.com for more recent performance information. |
The Fund's past performance is not a good predictor of the Fund's future performance. The graph and table do not reflect the deduction of taxes that a shareholder would pay on fund distributions or redemption of fund shares. |
Key Fund Statistics(as of October 31, 2024)
KEY FACTS | | |
| Fund Size | $1,280,635 | |
| Number of Holdings | 196 | |
| Total Advisory Fee | $0 | |
| Portfolio Turnover | 18% | |
What did the Fund invest in?
(as of October 31, 2024)
MARKET SECTORS (% of Fund's net assets) | | |
| Industrials | 26.4 | |
| Consumer Discretionary | 12.8 | |
| Financials | 11.4 | |
| Materials | 9.6 | |
| Real Estate | 8.5 | |
| Information Technology | 8.2 | |
| Health Care | 6.5 | |
| Consumer Staples | 4.6 | |
| Communication Services | 3.8 | |
| Energy | 3.3 | |
| Utilities | 2.1 | |
| |
| Common Stocks | 96.8 |
| Preferred Stocks | 0.4 |
| Short-Term Investments and Net Other Assets (Liabilities) | 2.8 |
ASSET ALLOCATION (% of Fund's net assets) |
|
|
| Japan | 38.6 |
| United Kingdom | 12.6 |
| Australia | 7.7 |
| France | 5.4 |
| Sweden | 4.6 |
| Germany | 4.3 |
| Switzerland | 3.1 |
| United States | 2.8 |
| Spain | 2.6 |
| Others | 18.3 |
GEOGRAPHIC DIVERSIFICATION (% of Fund's net assets) |
|
| |
|
TOP HOLDINGS(% of Fund's net assets) | | |
| VZ Holding AG | 1.2 | |
| Sanwa Holdings Corp | 1.1 | |
| Lancashire Holdings Ltd | 1.0 | |
| Mitie Group PLC | 1.0 | |
| Banca Generali SpA | 1.0 | |
| Rexel SA | 0.9 | |
| Steadfast Group Ltd | 0.9 | |
| Suruga Bank Ltd | 0.9 | |
| Vistry Group PLC | 0.8 | |
| Inaba Denki Sangyo Co Ltd | 0.8 | |
| | 9.6 | |
| Fidelity, the Fidelity Investments Logo and all other Fidelity trademarks or service marks used herein are trademarks or service marks of FMR LLC. Any third-party marks that are used herein are trademarks or service marks of their respective owners. © 2024 FMR LLC. All rights reserved. |
| | For additional information about the Fund; including its prospectus, financial information, holdings and proxy information, scan the QR code or visit fundresearch.fidelity.com/prospectus/sec 1.9914032.100 6955-TSRA-1224 |
Item 2.
Code of Ethics
As of the end of the period, October 31, 2024, Fidelity Investment Trust (the trust) has adopted a code of ethics, as defined in Item 2 of Form N-CSR, that applies to its President and Treasurer and its Chief Financial Officer. A copy of the code of ethics is filed as an exhibit to this Form N-CSR.
Item 3.
Audit Committee Financial Expert
The Board of Trustees of the trust has determined that Donald F. Donahue is an audit committee financial expert, as defined in Item 3 of Form N-CSR. Mr. Donahue is independent for purposes of Item 3 of Form N-CSR.
Item 4.
Principal Accountant Fees and Services
Fees and Services
The following table presents fees billed by Deloitte & Touche LLP, the member firms of Deloitte Touche Tohmatsu, and their respective affiliates (collectively, “Deloitte Entities”) in each of the last two fiscal years for services rendered to Fidelity SAI International SMA Completion Fund, Fidelity SAI Sustainable Emerging Markets Equity Fund, Fidelity SAI Sustainable International Equity Fund, Fidelity Series Emerging Markets Fund, Fidelity Series Emerging Markets Opportunities Fund, Fidelity Series International Small Cap Fund, Fidelity Series International Value Fund, Fidelity Series Overseas Fund, Fidelity Series Select International Small Cap Fund, Fidelity Series Sustainable Emerging Markets Fund, Fidelity Series Sustainable Non-U.S. Developed Markets Fund, and Fidelity Sustainable International Equity Fund (the “Fund(s)”):
Services Billed by Deloitte Entities
October 31, 2024 FeesA
| | | | |
| Audit Fees | Audit-Related Fees | Tax Fees | All Other Fees |
Fidelity SAI International SMA Completion Fund | $46,100 | $- | $12,200 | $1,100 |
Fidelity SAI Sustainable Emerging Markets Equity Fund | $41,500 | $- | $10,600 | $1,000 |
Fidelity SAI Sustainable International Equity Fund | $35,800 | $- | $10,000 | $800 |
Fidelity Series Emerging Markets Fund | $42,800 | $- | $12,300 | $1,100 |
Fidelity Series Emerging Markets Opportunities Fund | $43,000 | $- | $12,300 | $1,100 |
Fidelity Series International Small Cap Fund | $41,300 | $- | $9,400 | $1,000 |
Fidelity Series International Value Fund | $55,500 | $- | $9,400 | $1,000 |
Fidelity Series Overseas Fund | $57,200 | $- | $10,300 | $1,000 |
Fidelity Series Select International Small Cap Fund | $41,700 | $- | $10,100 | $1,000 |
Fidelity Series Sustainable Emerging Markets Fund | $40,700 | $- | $10,300 | $1,000 |
Fidelity Series Sustainable Non-U.S. Developed Markets Fund | $40,800 | $- | $10,300 | $1,000 |
Fidelity Sustainable International Equity Fund | $47,100 | $- | $12,300 | $1,100 |
| | | | |
| Audit Fees | Audit-Related Fees | Tax Fees | All Other Fees |
Fidelity SAI International SMA Completion Fund | $46,300 | $- | $12,200 | $1,300 |
Fidelity SAI Sustainable Emerging Markets Equity Fund | $39,500 | $- | $10,600 | $1,000 |
Fidelity SAI Sustainable International Equity Fund | $33,800 | $- | $10,000 | $900 |
Fidelity Series Emerging Markets Fund | $42,900 | $- | $12,300 | $1,200 |
Fidelity Series Emerging Markets Opportunities Fund | $43,200 | $- | $12,300 | $1,200 |
Fidelity Series International Small Cap Fund | $41,500 | $- | $9,400 | $1,100 |
Fidelity Series International Value Fund | $43,100 | $- | $9,400 | $1,100 |
Fidelity Series Overseas Fund | $44,500 | $- | $10,000 | $1,200 |
Fidelity Series Select International Small Cap Fund | $36,100 | $- | $9,600 | $900 |
Fidelity Series Sustainable Emerging Markets Fund | $35,200 | $- | $10,100 | $400 |
Fidelity Series Sustainable Non-U.S. Developed Markets Fund | $35,300 | $- | $10,100 | $400 |
Fidelity Sustainable International Equity Fund | $47,400 | $- | $12,300 | $1,200 |
A Amounts may reflect rounding
B Fidelity Series Select International Small Cap Fund commenced operations on November 4, 2022. Fidelity Series Sustainable Emerging Markets Fund and Fidelity Series Sustainable Non-U.S. Developed Markets Fund commenced operations on May 11, 2023.
The following table presents fees billed by PricewaterhouseCoopers LLP (“PwC”) in each of the last two fiscal years for services rendered to Fidelity Enduring Opportunities Fund, Fidelity Global Commodity Stock Fund, Fidelity Infrastructure Fund, Fidelity Series Canada Fund, Fidelity Series International Growth Fund, and Fidelity Sustainable Emerging Markets Equity Fund (the “Fund(s)”):
Services Billed by PwC
October 31, 2024 FeesA
| | | | |
| Audit Fees | Audit-Related Fees | Tax Fees | All Other Fees |
Fidelity Enduring Opportunities Fund | $29,600 | $2,700 | $6,800 | $900 |
Fidelity Global Commodity Stock Fund | $37,100 | $3,200 | $6,300 | $1,100 |
Fidelity Infrastructure Fund | $38,200 | $3,400 | $7,700 | $1,200 |
Fidelity Series Canada Fund | $69,600 | $4,300 | $34,600 | $1,500 |
Fidelity Series International Growth Fund | $65,500 | $3,900 | $33,800 | $1,300 |
Fidelity Sustainable Emerging Markets Equity Fund | $50,300 | $4,600 | $12,200 | $1,600 |
| | | | |
| Audit Fees | Audit-Related Fees | Tax Fees | All Other Fees |
Fidelity Enduring Opportunities Fund | $29,700 | $2,700 | $6,800 | $900 |
Fidelity Global Commodity Stock Fund | $37,300 | $3,300 | $6,500 | $1,100 |
Fidelity Infrastructure Fund | $38,300 | $3,500 | $8,500 | $1,200 |
Fidelity Series Canada Fund | $51,400 | $4,400 | $17,100 | $1,500 |
Fidelity Series International Growth Fund | $47,100 | $3,900 | $47,400 | $1,300 |
Fidelity Sustainable Emerging Markets Equity Fund | $50,500 | $4,600 | $14,400 | $1,600 |
A Amounts may reflect rounding.
The following table(s) present(s) fees billed by Deloitte Entities and PwC that were required to be approved by the Audit Committee for services that relate directly to the operations and financial reporting of the Fund(s) and that are rendered on behalf of Fidelity Management & Research Company LLC ("FMR") and entities controlling, controlled by, or under common control with FMR (not including any sub-adviser whose role is primarily portfolio management and is subcontracted with or overseen by another investment adviser) that provide ongoing services to the Fund(s) (“Fund Service Providers”):
Services Billed by Deloitte Entities
| | |
| October 31, 2024A | October 31, 2023A,B |
Audit-Related Fees | $125,000 | $75,000 |
Tax Fees | $- | $- |
All Other Fees | $2,929,500 | $- |
A Amounts may reflect rounding.
B Fidelity Series Select International Small Cap Fund, Fidelity Series Sustainable Emerging Markets Fund and Fidelity Series Sustainable Non-U.S. Developed Markets Funds’ commencement of operations.
Services Billed by PwC
| | |
| October 31, 2024A | October 31, 2023A |
Audit-Related Fees | $9,701,800 | $8,881,200 |
Tax Fees | $61,000 | $1,000 |
All Other Fees | $35,000 | $- |
A Amounts may reflect rounding
“Audit-Related Fees” represent fees billed for assurance and related services that are reasonably related to the performance of the fund audit or the review of the fund's financial statements and that are not reported under Audit Fees.
“Tax Fees” represent fees billed for tax compliance, tax advice or tax planning that relate directly to the operations and financial reporting of the fund.
“All Other Fees” represent fees billed for services provided to the fund or Fund Service Provider, a significant portion of which are assurance related, that relate directly to the operations and financial reporting of the fund, excluding those services that are reported under Audit Fees, Audit-Related Fees or Tax Fees.
Assurance services must be performed by an independent public accountant.
* * *
The aggregate non-audit fees billed by Deloitte Entities and PwC for services rendered to the Fund(s), FMR (not including any sub-adviser whose role is primarily portfolio management and is subcontracted with or overseen by another investment adviser), and any Fund Service Provider for each of the last two fiscal years of the Fund(s) are as follows:
| | |
Billed By | October 31, 2024A | October 31, 2023A,B |
Deloitte Entities | $3,627,600 | $6,085,300 |
PwC | $15,740,000 | $14,885,800 |
A Amounts may reflect rounding.
B Fidelity Series Select International Small Cap Fund, Fidelity Series Sustainable Emerging Markets Fund and Fidelity Series Sustainable Non-U.S. Developed Markets Funds’ commencement of operations.
The trust's Audit Committee has considered non-audit services that were not pre-approved that were provided by Deloitte Entities and PwC to Fund Service Providers to be compatible with maintaining the independence of Deloitte Entities and PwC in its(their) audit of the Fund(s), taking into account representations from Deloitte Entities and PwC, in accordance with Public Company Accounting Oversight Board rules, regarding its independence from the Fund(s) and its(their) related entities and FMR’s review of the appropriateness and permissibility under applicable law of such non-audit services prior to their provision to the Fund(s) Service Providers.
Audit Committee Pre-Approval Policies and Procedures
The trust’s Audit Committee must pre-approve all audit and non-audit services provided by a fund’s independent registered public accounting firm relating to the operations or financial reporting of the fund. Prior to the commencement of any audit or non-audit services to a fund, the Audit Committee reviews the services to determine whether they are appropriate and permissible under applicable law.
The Audit Committee has adopted policies and procedures to, among other purposes, provide a framework for the Committee’s consideration of non-audit services by the audit firms that audit the Fidelity funds. The policies and procedures require that any non-audit service provided by a fund audit firm to a Fidelity fund and any non-audit service provided by a fund auditor to a Fund Service Provider that relates directly to the operations and financial reporting of a Fidelity fund (“Covered Service”) are subject to approval by the Audit Committee before such service is provided.
All Covered Services must be approved in advance of provision of the service either: (i) by formal resolution of the Audit Committee, or (ii) by oral or written approval of the service by the Chair of the Audit Committee (or if the Chair is unavailable, such other member of the Audit Committee as may be designated by the Chair to act in the Chair’s absence). The approval contemplated by (ii) above is permitted where the Treasurer determines that action on such an engagement is necessary before the next meeting of the Audit Committee.
Non-audit services provided by a fund audit firm to a Fund Service Provider that do not relate directly to the operations and financial reporting of a Fidelity fund are reported to the Audit Committee periodically.
Non-Audit Services Approved Pursuant to Rule 2-01(c)(7)(i)(C) and (ii) of Regulation S-X (“De Minimis Exception”)
There were no non-audit services approved or required to be approved by the Audit Committee pursuant to the De Minimis Exception during the Fund’s(s’) last two fiscal years relating to services provided to (i) the Fund(s) or (ii) any Fund Service Provider that relate directly to the operations and financial reporting of the Fund(s).
The Registrant has not retained, for the preparation of the audit report on the financial statements included in the Form N-CSR, a registered public accounting firm that has a branch or office that is located in a foreign jurisdiction and that the Public Company Accounting Oversight Board (the “PCAOB”) has determined that the PCAOB is unable to inspect or investigate completely because of a position taken by an authority in the foreign jurisdiction.
The Registrant is not a “foreign issuer,” as defined in 17 CFR 240.3b-4.
Item 5.
Audit Committee of Listed Registrants
Not applicable.
Item 6.
Investments
(a)
Not applicable.
(b)
Not applicable.
Item 7.
Financial Statements and Financial Highlights for Open-End Management Investment Companies
Fidelity® Series Emerging Markets Fund
Fidelity® Series Emerging Markets Opportunities Fund
Fidelity® Series International Growth Fund
Fidelity® Series International Small Cap Fund
Fidelity® Series International Value Fund
Annual Report
October 31, 2024
Contents
To view a fund's proxy voting guidelines and proxy voting record for the 12-month period ended June 30, visit http://www.fidelity.com/proxyvotingresults or visit the Securities and Exchange Commission's (SEC) web site at http://www.sec.gov.
You may also call 1-800-544-8544 to request a free copy of the proxy voting guidelines.
Standard & Poor's, S&P and S&P 500 are registered service marks of The McGraw-Hill Companies, Inc. and have been licensed for use by Fidelity Distributors Corporation.
Other third-party marks appearing herein are the property of their respective owners.
All other marks appearing herein are registered or unregistered trademarks or service marks of FMR LLC or an affiliated company. © 2024 FMR LLC. All rights reserved.
This report and the financial statements contained herein are submitted for the general information of the shareholders of the Funds. This report is not authorized for distribution to prospective investors in the Funds unless preceded or accompanied by an effective prospectus.
A fund files its complete schedule of portfolio holdings with the SEC for the first and third quarters of each fiscal year on Form N-PORT. Forms N-PORT are available on the SEC's web site at http://www.sec.gov. A fund's Forms N-PORT may be reviewed and copied at the SEC's Public Reference Room in Washington, DC. Information regarding the operation of the SEC's Public Reference Room may be obtained by calling 1-800-SEC-0330.
For a complete list of a fund's portfolio holdings, view the most recent holdings listing, semiannual report, or annual report on Fidelity's web site at http://www.fidelity.com, http://www.institutional.fidelity.com, or http://www.401k.com, as applicable.
NOT FDIC INSURED •MAY LOSE VALUE •NO BANK GUARANTEE
Neither the Funds nor Fidelity Distributors Corporation is a bank.
Item 7: Financial Statements and Financial Highlights for Open-End Management Investment Companies (Annual Report)
Fidelity® Series Emerging Markets Fund
Schedule of Investments October 31, 2024
Showing Percentage of Net Assets
| Common Stocks - 94.7% |
| | | Shares | Value ($) |
| Brazil - 7.2% | | | |
| Banco Bradesco SA | | 3,921,000 | 8,641,135 |
| Banco BTG Pactual SA unit | | 7,360,834 | 41,407,795 |
| Banco do Brasil SA | | 3,021,876 | 13,763,600 |
| Gerdau SA sponsored ADR | | 11,176,949 | 34,872,081 |
| Hapvida Participacoes e Investimentos SA (a)(b) | | 18,453,729 | 11,236,507 |
| Itau Unibanco Holding SA | | 6,966,924 | 42,204,791 |
| Localiza Rent a Car SA | | 5,347,136 | 38,867,072 |
| Nu Holdings Ltd. Class A (a) | | 3,965,592 | 59,840,783 |
| Petroleo Brasileiro SA - Petrobras sponsored ADR | | 1,568,280 | 21,093,366 |
| Raia Drogasil SA | | 2,678,399 | 11,277,177 |
| Vale SA | | 967,379 | 10,385,155 |
| Vale SA sponsored ADR | | 6,133,673 | 65,630,301 |
| Vamos Locacao de Caminhoes Maquinas e Equipamentos SA | | 21,744,431 | 23,659,373 |
| Weg SA | | 4,759,310 | 44,547,780 |
TOTAL BRAZIL | | | 427,426,916 |
| China - 28.8% | | | |
| Airtac International Group | | 532,773 | 14,795,153 |
| Alibaba Group Holding Ltd. | | 15,759,670 | 192,777,251 |
| BYD Co. Ltd. (H Shares) | | 1,499,871 | 54,173,269 |
| China Construction Bank Corp. (H Shares) | | 48,134,160 | 37,363,494 |
| China Life Insurance Co. Ltd. (H Shares) | | 30,577,697 | 64,816,848 |
| China Merchants Bank Co. Ltd. (H Shares) | | 7,349,000 | 35,962,538 |
| China Pacific Insurance (Group) Co. Ltd. (H Shares) | | 786,600 | 2,731,747 |
| China Resources Beverage Holdings Co. Ltd. | | 6,480,788 | 12,569,933 |
| Contemporary Amperex Technology Co. Ltd. | | 1,725,886 | 59,879,198 |
| Flat Glass Group Co. Ltd. (c) | | 4,292,943 | 8,748,460 |
| Flat Glass Group Co. Ltd. (A Shares) | | 1,042,700 | 4,215,258 |
| Fuyao Glass Industries Group Co. Ltd. (A Shares) | | 2,314,949 | 18,516,374 |
| Haier Smart Home Co. Ltd. | | 16,181,000 | 58,724,514 |
| Innovent Biologics, Inc. (a)(b) | | 3,650,962 | 15,871,375 |
| JD.com, Inc.: | | | |
| Class A | | 432,000 | 8,760,626 |
| sponsored ADR | | 1,864,341 | 75,729,531 |
| KE Holdings, Inc. ADR | | 905,501 | 19,857,637 |
| Kweichow Moutai Co. Ltd. (A Shares) | | 52,525 | 11,277,357 |
| Li Auto, Inc. Class A (a) | | 3,144,900 | 39,547,424 |
| Meituan Class B (a)(b) | | 3,782,258 | 89,376,168 |
| Midea Group Co. Ltd. (H Shares) (c) | | 2,070,911 | 19,303,818 |
| NAURA Technology Group Co. Ltd. | | 596,594 | 32,829,592 |
| New Oriental Education & Technology Group, Inc. sponsored ADR | | 502,051 | 31,428,393 |
| PDD Holdings, Inc. ADR (a) | | 675,133 | 81,414,288 |
| Ping An Insurance Group Co. of China Ltd. (H Shares) | | 12,952,970 | 80,253,814 |
| Shenzhen Mindray Bio-Medical Electronics Co. Ltd. (A Shares) | | 504,553 | 18,896,871 |
| Shenzhou International Group Holdings Ltd. | | 1,112,100 | 8,587,648 |
| Sinotruk Hong Kong Ltd. | | 9,952,487 | 26,862,560 |
| Tencent Holdings Ltd. | | 6,229,200 | 324,803,762 |
| Trip.com Group Ltd. ADR (a) | | 860,983 | 55,447,305 |
| Xiaomi Corp. Class B (a)(b) | | 26,648,445 | 91,401,398 |
| Yum China Holdings, Inc. | | 537,400 | 23,704,714 |
| Zai Lab Ltd. ADR (a) | | 936,600 | 28,304,052 |
| Zijin Mining Group Co. Ltd. (H Shares) | | 30,188,724 | 64,304,149 |
TOTAL CHINA | | | 1,713,236,519 |
| Greece - 0.2% | | | |
| OPAP SA | | 608,273 | 10,374,656 |
| Hungary - 1.3% | | | |
| OTP Bank PLC | | 983,818 | 48,971,988 |
| Richter Gedeon PLC | | 1,087,333 | 31,408,554 |
TOTAL HUNGARY | | | 80,380,542 |
| India - 15.5% | | | |
| Axis Bank Ltd. | | 4,707,344 | 64,663,813 |
| Bharti Airtel Ltd. | | 4,531,392 | 86,730,735 |
| Computer Age Management Services Private Ltd. | | 524,208 | 27,617,592 |
| HDFC Bank Ltd. | | 6,614,591 | 135,957,383 |
| HDFC Standard Life Insurance Co. Ltd. (b) | | 2,660,665 | 22,725,495 |
| Hindustan Aeronautics Ltd. | | 863,275 | 43,440,491 |
| Hyundai Motor India Ltd. | | 267,703 | 5,750,025 |
| Hyundai Motor India Ltd. (i) | | 51,201 | 1,099,752 |
| Hyundai Motor India Ltd. (i) | | 51,202 | 1,099,774 |
| ICICI Bank Ltd. | | 6,617,499 | 101,506,772 |
| Infosys Ltd. | | 2,006,497 | 41,863,724 |
| ITC Ltd. | | 3,055,946 | 17,729,800 |
| Jindal Steel & Power Ltd. | | 782,600 | 8,540,901 |
| Larsen & Toubro Ltd. | | 719,550 | 30,908,681 |
| Mankind Pharma Ltd. (a) | | 880,475 | 27,861,850 |
| Max Healthcare Institute Ltd. | | 1,788,000 | 21,583,039 |
| NTPC Ltd. | | 13,537,921 | 65,475,553 |
| Reliance Industries Ltd. | | 2,640,712 | 41,753,756 |
| Reliance Industries Ltd. (a) | | 2,574,824 | 40,420,820 |
| Tata Consultancy Services Ltd. | | 933,999 | 43,931,435 |
| Tata Steel Ltd. | | 5,488,999 | 9,646,787 |
| Zomato Ltd. (a) | | 27,558,106 | 79,062,284 |
TOTAL INDIA | | | 919,370,462 |
| Indonesia - 2.0% | | | |
| PT Bank Central Asia Tbk | | 153,246,255 | 99,180,449 |
| PT Bank Mandiri (Persero) Tbk | | 42,650,055 | 18,105,764 |
| PT Bank Rakyat Indonesia (Persero) Tbk | | 3,739,845 | 1,140,107 |
TOTAL INDONESIA | | | 118,426,320 |
| Korea (South) - 9.1% | | | |
| BGF Retail Co. Ltd. | | 159,880 | 13,421,004 |
| Coupang, Inc. Class A (a) | | 362,400 | 9,346,296 |
| Hana Financial Group, Inc. | | 222,870 | 9,647,107 |
| Hyundai Motor Co. Ltd. | | 151,111 | 23,351,933 |
| KB Financial Group, Inc. | | 523,287 | 34,161,179 |
| Korea Aerospace Industries Ltd. | | 584,099 | 24,715,392 |
| KT Corp. | | 104,248 | 3,334,847 |
| KT&G Corp. | | 316,264 | 25,204,465 |
| NAVER Corp. | | 185,814 | 22,803,543 |
| Samsung Biologics Co. Ltd. (a)(b) | | 73,406 | 53,264,076 |
| Samsung Electronics Co. Ltd. | | 4,845,656 | 206,425,224 |
| Samsung Fire & Marine Insurance Co. Ltd. | | 46,067 | 11,205,100 |
| SK Hynix, Inc. | | 783,457 | 102,901,280 |
TOTAL KOREA (SOUTH) | | | 539,781,446 |
| Malaysia - 0.8% | | | |
| CIMB Group Holdings Bhd | | 17,806,300 | 32,288,692 |
| MR DIY Group M Sdn Bhd (b) | | 6,158,200 | 3,068,946 |
| Tenaga Nasional Bhd | | 3,677,700 | 11,765,481 |
TOTAL MALAYSIA | | | 47,123,119 |
| Mexico - 3.0% | | | |
| America Movil S.A.B. de CV Series L | | 16,026,574 | 12,662,992 |
| Corporacion Inmobiliaria Vesta S.A.B. de CV ADR | | 515,549 | 13,435,207 |
| Fomento Economico Mexicano S.A.B. de CV sponsored ADR | | 198,238 | 19,207,280 |
| Gruma S.A.B. de CV Series B | | 2,230,633 | 38,531,497 |
| Grupo Financiero Banorte S.A.B. de CV | | 8,697,814 | 60,564,553 |
| Grupo Mexico SA de CV Series B | | 2,965,500 | 15,515,540 |
| Wal-Mart de Mexico SA de CV Series V | | 7,668,034 | 21,084,746 |
TOTAL MEXICO | | | 181,001,815 |
| Peru - 0.4% | | | |
| Credicorp Ltd. (United States) | | 117,964 | 21,720,711 |
| Philippines - 1.3% | | | |
| Ayala Land, Inc. | | 55,074,328 | 30,771,261 |
| BDO Unibank, Inc. | | 3,175,000 | 8,276,229 |
| International Container Terminal Services, Inc. | | 6,098,672 | 41,278,855 |
TOTAL PHILIPPINES | | | 80,326,345 |
| Poland - 1.0% | | | |
| Allegro.eu SA (a)(b) | | 2,692,253 | 23,621,741 |
| Powszechna Kasa Oszczednosci Bank SA | | 2,502,535 | 34,886,379 |
TOTAL POLAND | | | 58,508,120 |
| Russia - 0.0% | | | |
| LUKOIL PJSC (a)(d) | | 568,462 | 0 |
| Sberbank of Russia (a)(d) | | 5,098,115 | 1 |
TOTAL RUSSIA | | | 1 |
| Saudi Arabia - 1.6% | | | |
| Al Rajhi Bank | | 2,092,487 | 49,029,171 |
| Alinma Bank | | 2,012,492 | 15,057,386 |
| The Saudi National Bank | | 3,875,754 | 34,209,667 |
TOTAL SAUDI ARABIA | | | 98,296,224 |
| Singapore - 0.4% | | | |
| Sea Ltd. ADR Class A (a) | | 241,700 | 22,731,885 |
| South Africa - 5.0% | | | |
| Absa Group Ltd. | | 1,099,509 | 10,537,294 |
| African Rainbow Minerals Ltd. (c) | | 1,837,786 | 18,503,931 |
| Capitec Bank Holdings Ltd. | | 281,304 | 50,817,818 |
| FirstRand Ltd. | | 5,061,585 | 22,239,061 |
| Impala Platinum Holdings Ltd. (a) | | 5,698,051 | 37,610,157 |
| MTN Group Ltd. | | 3,039,916 | 15,097,881 |
| Naspers Ltd. Class N | | 75,393 | 17,818,943 |
| Northam Platinum Holdings Ltd. | | 3,547,046 | 26,242,746 |
| Pepkor Holdings Ltd. (b) | | 13,291,948 | 17,253,920 |
| Shoprite Holdings Ltd. (c) | | 2,372,151 | 40,968,005 |
| Standard Bank Group Ltd. | | 2,850,445 | 39,243,581 |
TOTAL SOUTH AFRICA | | | 296,333,337 |
| Taiwan - 15.1% | | | |
| Alchip Technologies Ltd. | | 287,794 | 17,884,977 |
| Chailease Holding Co. Ltd. | | 6,192,485 | 29,092,500 |
| E Ink Holdings, Inc. | | 2,700,882 | 25,360,442 |
| Hon Hai Precision Industry Co. Ltd. (Foxconn) | | 17,423,561 | 112,043,905 |
| MediaTek, Inc. | | 1,373,925 | 53,658,597 |
| Taiwan Semiconductor Manufacturing Co. Ltd. | | 20,202,771 | 635,611,716 |
| Yageo Corp. | | 1,546,538 | 26,389,822 |
TOTAL TAIWAN | | | 900,041,959 |
| Thailand - 0.3% | | | |
| CP ALL PCL (For. Reg.) | | 4,855,600 | 9,094,504 |
| PTT Exploration and Production PCL (For. Reg.) | | 2,746,526 | 10,307,850 |
TOTAL THAILAND | | | 19,402,354 |
| United Arab Emirates - 0.8% | | | |
| ADNOC Drilling Co. PJSC | | 32,488,300 | 44,844,388 |
| United Kingdom - 0.9% | | | |
| AngloGold Ashanti PLC (c) | | 1,939,812 | 53,926,774 |
| TOTAL COMMON STOCKS (Cost $4,583,618,347) | | | 5,633,253,893 |
| | | | |
| Government Obligations - 0.1% |
| | | Principal Amount (e) | Value ($) |
| United States of America - 0.1% | | | |
U.S. Treasury Bills, yield at date of purchase 4.55% to 5.13% 11/7/24 to 1/23/25 (f) (Cost $4,242,814) | | 4,260,000 | 4,243,110 |
| | | | |
| Money Market Funds - 6.9% |
| | | Shares | Value ($) |
| Fidelity Cash Central Fund 4.87% (g) | | 345,558,634 | 345,627,746 |
| Fidelity Securities Lending Cash Central Fund 4.87% (g)(h) | | 61,564,149 | 61,570,305 |
| TOTAL MONEY MARKET FUNDS (Cost $407,198,051) | | | 407,198,051 |
| | | | |
| TOTAL INVESTMENT IN SECURITIES - 101.7% (Cost $4,995,059,212) | 6,044,695,054 |
NET OTHER ASSETS (LIABILITIES) - (1.7)% | (99,510,241) |
| NET ASSETS - 100.0% | 5,945,184,813 |
| | |
| Futures Contracts |
| | Number of contracts | Expiration Date | Notional Amount ($) | Value ($) | Unrealized Appreciation/ (Depreciation) ($) |
| Purchased | | | | | |
| | | | | | |
| Equity Index Contracts | | | | | |
| ICE E-mini MSCI Emerging Markets Index Contracts (United States) | 1,592 | Dec 2024 | 89,669,400 | (2,301,276) | (2,301,276) |
| | | | | | |
| The notional amount of futures purchased as a percentage of Net Assets is 1.5% |
Legend
| (b) | Security exempt from registration under Rule 144A of the Securities Act of 1933. These securities may be resold in transactions exempt from registration, normally to qualified institutional buyers. At the end of the period, the value of these securities amounted to $327,819,626 or 5.5% of net assets. |
| (c) | Security or a portion of the security is on loan at period end. |
| (e) | Amount is stated in United States dollars unless otherwise noted. |
| (f) | Security or a portion of the security was pledged to cover margin requirements for futures contracts. At period end, the value of securities pledged amounted to $2,934,127. |
| (g) | Affiliated fund that is generally available only to investment companies and other accounts managed by Fidelity Investments. The rate quoted is the annualized seven-day yield of the fund at period end. A complete unaudited listing of the fund's holdings as of its most recent quarter end is available upon request. In addition, each Fidelity Central Fund's financial statements, which are not covered by the Fund's Report of Independent Registered Public Accounting Firm, are available on the SEC's website or upon request. |
| (h) | Investment made with cash collateral received from securities on loan. |
| (i) | Equity security is subject to lock-up or market standoff agreement. Fair value is based on the unadjusted market price of the equivalent equity security. As of period end, the total fair value of unadjusted equity securities subject to contractual sale restrictions is $2,199,526 and all restrictions are set to expire on or before January 31, 2025. Under normal market conditions, there are no circumstances that could cause the restrictions to lapse. |
Affiliated Central Funds
Fiscal year to date information regarding the Fund's investments in Fidelity Central Funds, including the ownership percentage, is presented below.
| Affiliate | Value, beginning of period ($) | Purchases ($) | Sales Proceeds ($) | Dividend Income ($) | Realized Gain (loss) ($) | Change in Unrealized appreciation (depreciation) ($) | Value, end of period ($) | % ownership, end of period |
| Fidelity Cash Central Fund 4.87% | 315,028,737 | 2,011,513,464 | 1,980,913,538 | 16,086,815 | (917) | - | 345,627,746 | 0.7% |
| Fidelity Securities Lending Cash Central Fund 4.87% | 48,137,657 | 651,249,884 | 637,817,236 | 506,216 | - | - | 61,570,305 | 0.3% |
| Total | 363,166,394 | 2,662,763,348 | 2,618,730,774 | 16,593,031 | (917) | - | 407,198,051 | |
| | | | | | | | | |
Amounts in the dividend income column in the above table include any capital gain distributions from underlying funds, which are presented in the corresponding line item in the Statement of Operations, if applicable.
Amounts in the dividend income column for Fidelity Securities Lending Cash Central Fund represents the income earned on investing cash collateral, less rebates paid to borrowers and any lending agent fees associated with the loan, plus any premium payments received for lending certain types of securities.
Amounts included in the purchases and sales proceeds columns may include in-kind transactions, if applicable.
Investment Valuation
The following is a summary of the inputs used, as of October 31, 2024, involving the Fund's assets and liabilities carried at fair value. The inputs or methodology used for valuing securities may not be an indication of the risk associated with investing in those securities. For more information on valuation inputs, and their aggregation into the levels used below, please refer to the Investment Valuation section in the accompanying Notes to Financial Statements.
| Valuation Inputs at Reporting Date: |
| Description | Total ($) | Level 1 ($) | Level 2 ($) | Level 3 ($) |
Investments in Securities: | | | | |
|
| Equities: | | | | |
Communication Services | 488,165,645 | 35,394,877 | 452,770,768 | - |
Consumer Discretionary | 949,339,593 | 311,066,924 | 638,272,669 | - |
Consumer Staples | 220,365,768 | 90,100,700 | 130,265,068 | - |
Energy | 158,420,180 | 65,937,754 | 92,482,426 | - |
Financials | 1,342,214,745 | 430,297,959 | 911,916,785 | 1 |
Health Care | 208,426,324 | 70,949,113 | 137,477,211 | - |
Industrials | 376,572,147 | 107,074,225 | 269,497,922 | - |
Information Technology | 1,403,265,830 | - | 1,403,265,830 | - |
Materials | 345,178,522 | 180,329,851 | 164,848,671 | - |
Real Estate | 64,064,105 | 33,292,844 | 30,771,261 | - |
Utilities | 77,241,034 | - | 77,241,034 | - |
|
| Government Obligations | 4,243,110 | - | 4,243,110 | - |
|
| Money Market Funds | 407,198,051 | 407,198,051 | - | - |
| Total Investments in Securities: | 6,044,695,054 | 1,731,642,298 | 4,313,052,755 | 1 |
Derivative Instruments: Liabilities | | | | |
Futures Contracts | (2,301,276) | (2,301,276) | - | - |
| Total Liabilities | (2,301,276) | (2,301,276) | - | - |
| Total Derivative Instruments: | (2,301,276) | (2,301,276) | - | - |
Value of Derivative Instruments
The following table is a summary of the Fund's value of derivative instruments by primary risk exposure as of October 31, 2024. For additional information on derivative instruments, please refer to the Derivative Instruments section in the accompanying Notes to Financial Statements.
Primary Risk Exposure / Derivative Type | Value |
| Asset ($) | Liability ($) |
| Equity Risk | | |
Futures Contracts (a) | 0 | (2,301,276) |
| Total Equity Risk | 0 | (2,301,276) |
| Total Value of Derivatives | 0 | (2,301,276) |
(a)Reflects gross cumulative appreciation (depreciation) on futures contracts as presented in the Schedule of Investments. In the Statement of Assets and Liabilities, the period end daily variation margin is included in receivable or payable for daily variation margin on futures contracts, and the net cumulative appreciation (depreciation) is included in Total accumulated earnings (loss).
Fidelity® Series Emerging Markets Fund
Financial Statements
| Statement of Assets and Liabilities |
As of October 31, 2024 |
| Assets | | | | |
| Investment in securities, at value (including securities loaned of $58,480,169) - See accompanying schedule: | | | | |
Unaffiliated issuers (cost $4,587,861,161) | $ | 5,637,497,003 | | |
Fidelity Central Funds (cost $407,198,051) | | 407,198,051 | | |
| | | | | |
| | | | | |
| Total Investment in Securities (cost $4,995,059,212) | | | $ | 6,044,695,054 |
| Cash | | | | 188,000 |
| Foreign currency held at value (cost $429,350) | | | | 406,585 |
| Receivable for investments sold | | | | 37,214,111 |
| Receivable for fund shares sold | | | | 53,770,332 |
| Dividends receivable | | | | 5,210,455 |
| Distributions receivable from Fidelity Central Funds | | | | 1,319,588 |
| Receivable from investment adviser for expense reductions | | | | 73,489 |
| Other receivables | | | | 222,622 |
Total assets | | | | 6,143,100,236 |
| Liabilities | | | | |
| Payable for investments purchased | $ | 58,192,082 | | |
| Payable for fund shares redeemed | | 46,212,054 | | |
| Payable for daily variation margin on futures contracts | | 413,920 | | |
| Deferred taxes | | 30,720,109 | | |
| Other payables and accrued expenses | | 806,953 | | |
| Collateral on securities loaned | | 61,570,305 | | |
| Total liabilities | | | | 197,915,423 |
| Net Assets | | | $ | 5,945,184,813 |
| Net Assets consist of: | | | | |
| Paid in capital | | | $ | 5,358,941,170 |
| Total accumulated earnings (loss) | | | | 586,243,643 |
| Net Assets | | | $ | 5,945,184,813 |
Net Asset Value, offering price and redemption price per share ($5,945,184,813 ÷ 633,691,332 shares) | | | $ | 9.38 |
| Statement of Operations |
| Year ended October 31, 2024 |
| Investment Income | | | | |
| Dividends | | | $ | 146,187,165 |
| Interest | | | | 223,431 |
| Income from Fidelity Central Funds (including $506,216 from security lending) | | | | 16,593,031 |
| Income before foreign taxes withheld | | | $ | 163,003,627 |
| Less foreign taxes withheld | | | | (16,941,989) |
| Total income | | | | 146,061,638 |
| Expenses | | | | |
| Custodian fees and expenses | $ | 1,763,004 | | |
| Independent trustees' fees and expenses | | 25,374 | | |
| Miscellaneous | | 86 | | |
| Total expenses before reductions | | 1,788,464 | | |
| Expense reductions | | (1,017,388) | | |
| Total expenses after reductions | | | | 771,076 |
| Net Investment income (loss) | | | | 145,290,562 |
| Realized and Unrealized Gain (Loss) | | | | |
| Net realized gain (loss) on: | | | | |
| Investment Securities: | | | | |
| Unaffiliated issuers (net of foreign taxes of $24,863,797) | | 84,134,024 | | |
| Fidelity Central Funds | | (917) | | |
| Foreign currency transactions | | (3,278,701) | | |
| Futures contracts | | 23,339,690 | | |
| Total net realized gain (loss) | | | | 104,194,096 |
| Change in net unrealized appreciation (depreciation) on: | | | | |
| Investment Securities: | | | | |
| Unaffiliated issuers (net of increase in deferred foreign taxes of $24,128,316) | | 968,495,732 | | |
| Assets and liabilities in foreign currencies | | (20,938) | | |
| Futures contracts | | 1,441,597 | | |
| Total change in net unrealized appreciation (depreciation) | | | | 969,916,391 |
| Net gain (loss) | | | | 1,074,110,487 |
| Net increase (decrease) in net assets resulting from operations | | | $ | 1,219,401,049 |
| Statement of Changes in Net Assets |
| |
| | Year ended October 31, 2024 | | Year ended October 31, 2023 |
| Increase (Decrease) in Net Assets | | | | |
| Operations | | | | |
| Net investment income (loss) | $ | 145,290,562 | $ | 107,004,651 |
| Net realized gain (loss) | | 104,194,096 | | (280,722,691) |
| Change in net unrealized appreciation (depreciation) | | 969,916,391 | | 420,518,956 |
| Net increase (decrease) in net assets resulting from operations | | 1,219,401,049 | | 246,800,916 |
| Distributions to shareholders | | (133,767,184) | | (65,273,730) |
| | | | | |
| Share transactions | | | | |
| Proceeds from sales of shares | | 960,571,633 | | 2,785,308,852 |
| Reinvestment of distributions | | 133,767,184 | | 65,273,730 |
| Cost of shares redeemed | | (1,139,645,880) | | (563,995,467) |
| | | | | |
Net increase (decrease) in net assets resulting from share transactions | | (45,307,063) | | 2,286,587,115 |
| Total increase (decrease) in net assets | | 1,040,326,802 | | 2,468,114,301 |
| | | | | |
| Net Assets | | | | |
| Beginning of period | | 4,904,858,011 | | 2,436,743,710 |
| End of period | $ | 5,945,184,813 | $ | 4,904,858,011 |
| | | | | |
| Other Information | | | | |
| Shares | | | | |
| Sold | | 108,896,488 | | 345,359,955 |
| Issued in reinvestment of distributions | | 16,596,425 | | 8,304,546 |
| Redeemed | | (127,545,724) | | (69,208,198) |
| Net increase (decrease) | | (2,052,811) | | 284,456,303 |
| | | | | |
Financial Highlights
Fidelity® Series Emerging Markets Fund |
| |
| Years ended October 31, | | 2024 | | 2023 | | 2022 | | 2021 | | 2020 |
Selected Per-Share Data | | | | | | | | | | |
| Net asset value, beginning of period | $ | 7.72 | $ | 6.94 | $ | 11.31 | $ | 9.65 | $ | 9.48 |
| Income from Investment Operations | | | | | | | | | | |
Net investment income (loss) A,B | | .22 | | .24 | | .23 | | .20 | | .17 |
| Net realized and unrealized gain (loss) | | 1.65 | | .74 | | (4.24) | | 1.62 | | .22 |
| Total from investment operations | | 1.87 | | .98 | | (4.01) | | 1.82 | | .39 |
| Distributions from net investment income | | (.21) | | (.20) | | (.30) | | (.16) | | (.22) |
| Distributions from net realized gain | | - | | - | | (.07) | | - | | - |
| Total distributions | | (.21) | | (.20) | | (.36) C | | (.16) | | (.22) |
| Net asset value, end of period | $ | 9.38 | $ | 7.72 | $ | 6.94 | $ | 11.31 | $ | 9.65 |
Total Return D | | | | 14.04% | | (36.53)% | | 18.88% | | 4.16% |
Ratios to Average Net Assets B,E,F | | | | | | | | | | |
| Expenses before reductions | | .03% | | .03% | | .04% | | .04% | | .05% |
| Expenses net of fee waivers, if any | | | | .01% | | .01% | | .01% | | .01% |
| Expenses net of all reductions | | .01% | | .01% | | .01% | | .01% | | .01% |
| Net investment income (loss) | | 2.52% | | 2.96% | | 2.61% | | 1.70% | | 1.86% |
| Supplemental Data | | | | | | | | | | |
| Net assets, end of period (000 omitted) | $ | 5,945,185 | $ | 4,904,858 | $ | 2,436,744 | $ | 3,239,693 | $ | 2,995,875 |
Portfolio turnover rate G | | | | 90% | | 65% | | 78% | | 117% H |
ACalculated based on average shares outstanding during the period.
BNet investment income (loss) is affected by the timing of the declaration of dividends by any underlying mutual funds or exchange-traded funds (ETFs). Net investment income (loss) of any mutual funds or ETFs is not included in the Fund's net investment income (loss) ratio.
CTotal distributions per share do not sum due to rounding.
DTotal returns would have been lower if certain expenses had not been reduced during the applicable periods shown.
EFees and expenses of any underlying mutual funds or exchange-traded funds (ETFs) are not included in the Fund's expense ratio. The Fund indirectly bears its proportionate share of these expenses. For additional expense information related to investments in Fidelity Central Funds, please refer to the "Investments in Fidelity Central Funds" note found in the Notes to Financial Statements section of the most recent Annual or Semi-Annual report.
FExpense ratios reflect operating expenses of the class. Expenses before reductions do not reflect amounts reimbursed, waived, or reduced through arrangements with the investment adviser, brokerage services, or other offset arrangements, if applicable, and do not represent the amount paid by the class during periods when reimbursements, waivers or reductions occur.
GAmount does not include the portfolio activity of any underlying mutual funds or exchange-traded funds (ETFs).
HPortfolio turnover rate excludes securities received or delivered in-kind.
Fidelity® Series Emerging Markets Opportunities Fund
Schedule of Investments October 31, 2024
Showing Percentage of Net Assets
| Common Stocks - 98.0% |
| | | Shares | Value ($) |
| Australia - 0.0% | | | |
| Paladin Energy Ltd. (Australia) (a) | | 995,100 | 6,551,346 |
| Brazil - 5.9% | | | |
| Companhia de Saneamento Basico do Estado de Sao Paulo (SABESP) | | 1,051,400 | 16,747,031 |
| Companhia de Transmissao de Energia Eletrica Paulista (PN) | | 6,449,700 | 27,100,142 |
| Cury Construtora e Incorporado SA | | 2,713,700 | 11,472,751 |
| Cyrela Brazil Realty SA | | 964,100 | 3,625,652 |
| Dexco SA (a) | | 29,311,511 | 41,982,963 |
| ENGIE Brasil Energia SA | | 4,942,000 | 35,452,047 |
| Equatorial Energia SA | | 13,556,867 | 75,325,048 |
| Hapvida Participacoes e Investimentos SA (a)(b) | | 26,697,200 | 16,255,971 |
| Hypera SA (a) | | 2,337,700 | 8,936,873 |
| Itau Unibanco Holding SA sponsored ADR | | 35,158,200 | 212,707,110 |
| Localiza Rent a Car SA | | 13,313,940 | 96,775,893 |
| LOG Commercial Properties e Participacoes SA | | 2,941,451 | 11,509,561 |
| MercadoLibre, Inc. (a) | | 18,387 | 37,457,629 |
| Metalurgica Gerdau SA (PN) | | 48,272,722 | 85,758,421 |
| Petroleo Brasileiro SA - Petrobras: | | | |
| (PN) sponsored ADR (non-vtg.) | | 4,772,000 | 59,029,640 |
| sponsored ADR | | 4,092,235 | 55,040,561 |
| PRIO SA | | 9,356,800 | 66,329,060 |
| Raia Drogasil SA | | 27,050,292 | 113,893,011 |
| Rumo SA | | 22,472,500 | 77,358,673 |
| Transmissora Alianca de Energia Eletrica SA | | 4,849,100 | 29,375,267 |
| Vale SA sponsored ADR | | 17,817,970 | 190,652,279 |
| XP, Inc. Class A | | 6,583,665 | 114,950,791 |
TOTAL BRAZIL | | | 1,387,736,374 |
| Canada - 0.6% | | | |
| Barrick Gold Corp. | | 7,815,000 | 150,985,800 |
| Chile - 0.5% | | | |
| Antofagasta PLC | | 5,132,944 | 114,635,445 |
| China - 30.5% | | | |
| Advanced Micro-Fabrication Equipment, Inc., China (A Shares) | | 2,542,711 | 68,656,445 |
| Aier Eye Hospital Group Co. Ltd. (A Shares) | | 3,717,300 | 7,560,068 |
| Airtac International Group | | 2,242,000 | 62,260,537 |
| Akeso, Inc. (a)(b) | | 2,927,000 | 23,591,471 |
| Alibaba Group Holding Ltd. | | 46,825,910 | 572,789,290 |
| Angelalign Technology, Inc. (b) | | 713,600 | 5,606,826 |
| Baidu, Inc. Class A (a) | | 1,567,045 | 17,881,285 |
| Bank of Ningbo Co. Ltd. (A Shares) | | 16,634,300 | 59,784,367 |
| BeiGene Ltd. ADR (a) | | 195,391 | 39,594,032 |
| Beijing Enlight Media Co. Ltd. (A Shares) | | 11,681,676 | 14,531,371 |
| Bilibili, Inc. ADR (a)(c) | | 1,059,780 | 23,442,334 |
| BYD Co. Ltd.: | | | |
| (A Shares) | | 947,671 | 39,034,701 |
| (H Shares) | | 3,947,194 | 142,567,196 |
| C&S Paper Co. Ltd. (A Shares) | | 22,938,100 | 22,906,939 |
| China Communications Services Corp. Ltd. (H Shares) | | 76,630,000 | 41,169,372 |
| China Construction Bank Corp. (H Shares) | | 575,330,000 | 446,592,176 |
| China Gas Holdings Ltd. | | 38,739,927 | 33,268,067 |
| China Jushi Co. Ltd. (A Shares) | | 59,489,300 | 94,498,648 |
| China Life Insurance Co. Ltd. (H Shares) | | 87,243,690 | 184,934,169 |
| China Medical System Holdings Ltd. | | 3,275,000 | 3,275,823 |
| China Merchants Bank Co. Ltd. (H Shares) | | 35,097,000 | 171,748,155 |
| China Overseas Land and Investment Ltd. | | 7,281,900 | 13,914,386 |
| China Petroleum & Chemical Corp. (H Shares) | | 174,984,000 | 98,566,815 |
| China Resources Beer Holdings Co. Ltd. | | 13,330,666 | 49,380,729 |
| China Resources Land Ltd. | | 12,998,220 | 43,328,734 |
| China Tower Corp. Ltd. (H Shares) (b) | | 93,148,479 | 12,568,623 |
| ENN Energy Holdings Ltd. | | 8,821,400 | 62,149,369 |
| ESR Group Ltd. (b)(c) | | 7,052,600 | 9,561,319 |
| Eyebright Medical Technology Beijing Co. Ltd. (A Shares) | | 591,100 | 7,878,571 |
| Flat Glass Group Co. Ltd. (A Shares) | | 11,028,200 | 44,583,014 |
| Foxconn Industrial Internet Co. Ltd. (A Shares) | | 10,683,900 | 35,820,083 |
| Fuyao Glass Industries Group Co. Ltd. (A Shares) | | 6,704,000 | 53,622,681 |
| Glodon Co. Ltd. (A Shares) | | 3,742,300 | 7,445,498 |
| Guangdong Investment Ltd. | | 47,012,000 | 29,926,780 |
| H World Group Ltd. ADR | | 105,053 | 3,854,395 |
| Haier Smart Home Co. Ltd. | | 36,190,216 | 131,342,492 |
| Haier Smart Home Co. Ltd. (A Shares) | | 10,857,800 | 44,606,258 |
| Haitian International Holdings Ltd. | | 17,388,306 | 48,095,732 |
| Hansoh Pharmaceutical Group Co. Ltd. (b) | | 9,359,918 | 21,823,120 |
| Innovent Biologics, Inc. (a)(b) | | 5,356,362 | 23,285,050 |
| JD.com, Inc.: | | | |
| Class A | | 8,793,974 | 178,334,999 |
| sponsored ADR | | 2,514,149 | 102,124,732 |
| Kanzhun Ltd. ADR | | 987,541 | 14,368,722 |
| KE Holdings, Inc. ADR | | 2,330,100 | 51,099,093 |
| Kuaishou Technology Class B (a)(b) | | 5,736,483 | 33,805,142 |
| Kunlun Energy Co. Ltd. | | 57,386,000 | 54,422,705 |
| Kweichow Moutai Co. Ltd. (A Shares) | | 504,610 | 108,342,064 |
| Lenovo Group Ltd. | | 46,560,683 | 61,396,641 |
| Li Auto, Inc.: | | | |
| ADR (a)(c) | | 2,389,754 | 59,767,748 |
| Class A (a) | | 2,119,100 | 26,647,889 |
| Li Ning Co. Ltd. | | 24,018,532 | 49,007,626 |
| Longfor Properties Co. Ltd. (b) | | 6,530,500 | 10,579,454 |
| Medlive Technology Co. Ltd. (b) | | 7,905,965 | 8,606,129 |
| Meituan Class B (a)(b) | | 18,240,715 | 431,034,900 |
| Midea Group Co. Ltd. (H Shares) (c) | | 1,597,100 | 14,887,229 |
| NAURA Technology Group Co. Ltd. | | 763,556 | 42,017,237 |
| NetEase, Inc. ADR | | 588,432 | 47,374,660 |
| New Oriental Education & Technology Group, Inc. sponsored ADR | | 834,378 | 52,232,063 |
| PDD Holdings, Inc. ADR (a) | | 3,720,939 | 448,708,034 |
| Ping An Insurance Group Co. of China Ltd. (H Shares) | | 49,872,000 | 308,996,177 |
| Proya Cosmetics Co. Ltd. (A Shares) | | 6,645,722 | 89,577,729 |
| Shenzhen Inovance Technology Co. Ltd. (A Shares) | | 12,244,600 | 95,570,680 |
| Shenzhen Mindray Bio-Medical Electronics Co. Ltd. (A Shares) | | 1,090,739 | 40,851,118 |
| Sichuan Kelun-Biotech Biopharmaceutical Co. Ltd. (H Shares) (a) | | 356,900 | 7,924,519 |
| Sinopec Engineering Group Co. Ltd. (H Shares) | | 49,991,887 | 34,712,720 |
| Sinopharm Group Co. Ltd. (H Shares) | | 10,614,400 | 26,443,563 |
| Sinotruk Hong Kong Ltd. | | 16,663,661 | 44,976,556 |
| Tencent Holdings Ltd. | | 24,278,303 | 1,265,922,452 |
| Tongdao Liepin Group (a) | | 5,570,432 | 1,633,104 |
| TravelSky Technology Ltd. (H Shares) | | 23,095,000 | 32,369,628 |
| Trip.com Group Ltd. (a) | | 140,000 | 9,009,631 |
| Trip.com Group Ltd. ADR (a) | | 2,664,653 | 171,603,653 |
| Tsingtao Brewery Co. Ltd. (H Shares) | | 11,249,084 | 72,433,851 |
| Uni-President China Holdings Ltd. | | 36,316,000 | 33,989,996 |
| Xiaomi Corp. Class B (a)(b) | | 39,759,705 | 136,371,658 |
| Yifeng Pharmacy Chain Co. Ltd. | | 4,773,960 | 15,919,418 |
| Zai Lab Ltd. (a)(c) | | 10,153,300 | 30,958,658 |
| Zai Lab Ltd. ADR (a) | | 308,859 | 9,333,719 |
| Zeekr Intelligent Technology Holding Ltd. ADR (c) | | 1,145,817 | 28,771,465 |
| Zhejiang Shuanghuan Driveline Co. Ltd. | | 8,471,886 | 33,440,263 |
| Zhongji Innolight Co. Ltd. (A Shares) | | 1,630,800 | 32,212,240 |
| ZTO Express, Inc. sponsored ADR Class A | | 5,494,000 | 126,966,340 |
TOTAL CHINA | | | 7,262,193,126 |
| Greece - 0.7% | | | |
| Alpha Services and Holdings SA | | 64,577,326 | 96,901,579 |
| Piraeus Financial Holdings SA | | 16,698,256 | 62,446,209 |
TOTAL GREECE | | | 159,347,788 |
| Hong Kong - 0.3% | | | |
| ASMPT Ltd. | | 3,437,356 | 37,263,829 |
| Huanxi Media Group Ltd. (a) | | 129,191,425 | 9,776,642 |
| Kerry Properties Ltd. | | 5,303,000 | 11,201,102 |
TOTAL HONG KONG | | | 58,241,573 |
| Hungary - 0.1% | | | |
| Richter Gedeon PLC | | 958,200 | 27,678,436 |
| India - 16.8% | | | |
| Akums Drugs & Pharmaceutical Ltd. | | 354,539 | 3,517,722 |
| Apollo Hospitals Enterprise Ltd. | | 464,500 | 38,696,087 |
| Bajaj Auto Ltd. | | 400,346 | 46,756,830 |
| Bajaj Finance Ltd. | | 2,320,277 | 189,516,719 |
| Bharat Electronics Ltd. | | 37,737,200 | 127,382,204 |
| Bharti Airtel Ltd. | | 9,558,726 | 182,953,787 |
| Coal India Ltd. | | 17,931,500 | 96,181,237 |
| Divi's Laboratories Ltd. | | 641,852 | 44,858,165 |
| Embassy Office Parks (REIT) | | 2,832,520 | 13,301,092 |
| Godrej Properties Ltd. (a) | | 383,900 | 13,066,008 |
| HDFC Bank Ltd. | | 26,847,397 | 551,825,779 |
| HDFC Standard Life Insurance Co. Ltd. (b) | | 19,888,241 | 169,871,111 |
| Hindustan Aeronautics Ltd. | | 2,665,800 | 134,144,577 |
| Hyundai Motor India Ltd. | | 134,343 | 2,885,570 |
| Hyundai Motor India Ltd. (k) | | 206,332 | 4,431,830 |
| Hyundai Motor India Ltd. (k) | | 206,332 | 4,431,830 |
| ICICI Bank Ltd. | | 19,052,196 | 292,244,385 |
| Indraprastha Gas Ltd. | | 8,632,894 | 43,045,407 |
| Infosys Ltd. | | 2,678,500 | 55,884,452 |
| ITC Ltd. | | 21,087,354 | 122,343,317 |
| JK Cement Ltd. | | 2,430,821 | 124,622,414 |
| Kalyan Jewellers India Ltd. | | 1,966,100 | 15,335,471 |
| Larsen & Toubro Ltd. | | 4,078,916 | 175,212,166 |
| Mahanagar Gas Ltd. | | 2,553,434 | 43,660,794 |
| Mahindra & Mahindra Ltd. | | 2,153,083 | 69,526,469 |
| MakeMyTrip Ltd. (a)(c) | | 565,545 | 57,397,162 |
| Mankind Pharma Ltd. (a) | | 703,184 | 22,251,634 |
| Max Healthcare Institute Ltd. | | 576,400 | 6,957,754 |
| NTPC Ltd. | | 23,876,945 | 115,479,783 |
| Ola Electric Mobility Ltd. (a)(k) | | 3,778,710 | 3,601,818 |
| Petronet LNG Ltd. | | 9,635,380 | 38,021,099 |
| Pine Labs Private Ltd. (a)(d)(e) | | 9,606 | 3,575,641 |
| Power Grid Corp. of India Ltd. | | 28,266,472 | 107,522,223 |
| Reliance Industries Ltd. | | 12,126,092 | 191,732,339 |
| Reliance Industries Ltd. (a) | | 12,126,092 | 190,361,200 |
| Shree Cement Ltd. | | 188,368 | 56,027,198 |
| Shriram Finance Ltd. | | 2,708,700 | 100,563,821 |
| Sun Pharmaceutical Industries Ltd. | | 3,325,700 | 72,981,414 |
| Sunteck Realty Ltd. | | 1,280,900 | 8,383,509 |
| Tata Consultancy Services Ltd. | | 1,215,400 | 57,167,370 |
| Tata Steel Ltd. | | 55,430,600 | 97,417,979 |
| Torrent Pharmaceuticals Ltd. | | 829,872 | 31,543,126 |
| Trent Ltd. | | 412,500 | 34,856,532 |
| Zomato Ltd. (a) | | 80,632,004 | 231,327,595 |
TOTAL INDIA | | | 3,992,864,620 |
| Indonesia - 2.1% | | | |
| First Resources Ltd. | | 53,106,746 | 58,482,969 |
| PT Bank Central Asia Tbk | | 348,112,760 | 225,297,381 |
| PT Bank Rakyat Indonesia (Persero) Tbk | | 355,543,939 | 108,389,039 |
| PT Sumber Alfaria Trijaya Tbk | | 418,976,900 | 87,829,518 |
| PT Telkom Indonesia Persero Tbk | | 62,826,700 | 11,229,819 |
TOTAL INDONESIA | | | 491,228,726 |
| Korea (South) - 7.9% | | | |
| AMOREPACIFIC Corp. | | 747,590 | 63,308,006 |
| Celltrion, Inc. | | 361,320 | 47,663,349 |
| Coupang, Inc. Class A (a) | | 550,500 | 14,197,395 |
| Coway Co. Ltd. | | 1,088,000 | 49,870,314 |
| Delivery Hero AG (a)(b)(c) | | 432,339 | 18,353,709 |
| HLB, Inc. (a) | | 145,000 | 6,901,871 |
| Hyundai Motor Co. Ltd. | | 227,522 | 35,160,104 |
| Kakao Corp. | | 695,632 | 18,575,339 |
| Kakao Pay Corp. (a) | | 271,829 | 4,809,276 |
| KB Financial Group, Inc. | | 2,311,110 | 150,873,694 |
| LG Corp. | | 1,043,328 | 57,200,080 |
| LS Electric Co. Ltd. | | 391,530 | 41,169,015 |
| NAVER Corp. | | 703,377 | 86,320,123 |
| Samsung Biologics Co. Ltd. (a)(b) | | 97,368 | 70,651,126 |
| Samsung Electronics Co. Ltd. | | 17,495,962 | 745,328,985 |
| Samsung Life Insurance Co. Ltd. | | 869,586 | 63,839,905 |
| SK Hynix, Inc. | | 3,068,207 | 402,986,286 |
| Webtoon Entertainment, Inc. | | 890,662 | 9,262,885 |
TOTAL KOREA (SOUTH) | | | 1,886,471,462 |
| Kuwait - 0.1% | | | |
| Kuwait Finance House KSCP | | 11,974,007 | 28,158,053 |
| Mauritius - 0.0% | | | |
| Jumo World Holding Ltd. (a)(d)(e) | | 2,024,724 | 3,846,976 |
| Jumo World Ltd. (a)(e) | | 2,021 | 0 |
TOTAL MAURITIUS | | | 3,846,976 |
| Mexico - 1.6% | | | |
| CEMEX S.A.B. de CV sponsored ADR | | 14,402,500 | 75,181,050 |
| Corporacion Inmobiliaria Vesta S.A.B. de CV | | 4,323,684 | 11,298,905 |
| Fibra Uno Administracion SA de CV | | 12,695,600 | 14,618,387 |
| Grupo Financiero Banorte S.A.B. de CV | | 27,442,878 | 191,090,042 |
| Wal-Mart de Mexico SA de CV Series V | | 35,070,900 | 96,434,240 |
TOTAL MEXICO | | | 388,622,624 |
| Netherlands - 0.0% | | | |
| CTP BV (b) | | 561,077 | 9,349,972 |
| Panama - 0.3% | | | |
| Copa Holdings SA Class A | | 715,075 | 69,576,798 |
| Peru - 0.6% | | | |
| Credicorp Ltd. (United States) | | 763,722 | 140,624,132 |
| Philippines - 0.4% | | | |
| Ayala Land, Inc. | | 53,392,024 | 29,831,320 |
| SM Investments Corp. | | 2,394,000 | 38,447,500 |
| SM Prime Holdings, Inc. | | 34,525,200 | 18,086,832 |
TOTAL PHILIPPINES | | | 86,365,652 |
| Poland - 0.5% | | | |
| Allegro.eu SA (a)(b) | | 4,986,922 | 43,755,094 |
| CD Projekt SA (c) | | 693,896 | 27,866,787 |
| Dino Polska SA (a)(b) | | 437,900 | 36,287,910 |
| LPP SA | | 5,500 | 19,937,543 |
TOTAL POLAND | | | 127,847,334 |
| Puerto Rico - 0.1% | | | |
| Liberty Latin America Ltd. Class C (a) | | 1,779,200 | 17,222,656 |
| Romania - 0.1% | | | |
| Societatea de Producere A Energiei Electrice in Hidrocentrale Hidroelectrica SA | | 483,600 | 12,794,350 |
| Russia - 0.0% | | | |
| Gazprom OAO sponsored ADR (Reg. S) (a)(e) | | 10,986,900 | 110 |
| LSR Group OJSC (a)(e) | | 98,230 | 0 |
| Sberbank of Russia (a)(e) | | 12,899,053 | 1 |
| Sberbank of Russia sponsored ADR (a)(e) | | 19,633,994 | 196 |
| Severstal PAO GDR (Reg. S) (a)(e) | | 6,035,400 | 60 |
TOTAL RUSSIA | | | 367 |
| Saudi Arabia - 3.7% | | | |
| Al Rajhi Bank | | 10,847,015 | 254,156,967 |
| Alinma Bank | | 17,289,750 | 129,361,231 |
| Bupa Arabia for Cooperative Insurance Co. | | 1,448,232 | 77,661,668 |
| Dr Sulaiman Al Habib Medical Services Group Co. | | 184,731 | 14,077,272 |
| Sabic Agriculture-Nutrients Co. | | 2,068,300 | 62,670,751 |
| Saudi Arabian Oil Co. (b) | | 20,852,600 | 149,910,856 |
| The Saudi National Bank | | 22,270,216 | 196,569,923 |
TOTAL SAUDI ARABIA | | | 884,408,668 |
| Singapore - 1.3% | | | |
| Sea Ltd. ADR Class A (a) | | 3,348,698 | 314,945,047 |
| South Africa - 3.8% | | | |
| Bidvest Group Ltd./The | | 2,946,600 | 47,682,277 |
| Capitec Bank Holdings Ltd. (c) | | 1,018,061 | 183,913,625 |
| FirstRand Ltd. | | 29,034,000 | 127,566,542 |
| Impala Platinum Holdings Ltd. (a) | | 18,906,802 | 124,794,917 |
| Naspers Ltd. Class N | | 984,289 | 232,634,190 |
| Pick 'n Pay Stores Ltd. (a) | | 36,546,987 | 52,968,877 |
| Shoprite Holdings Ltd. (c) | | 7,723,676 | 133,391,000 |
TOTAL SOUTH AFRICA | | | 902,951,428 |
| Taiwan - 17.7% | | | |
| Accton Technology Corp. | | 1,484,041 | 25,018,561 |
| ASE Technology Holding Co. Ltd. | | 16,021,719 | 75,801,218 |
| Asia Vital Components Co. Ltd. | | 3,013,475 | 57,916,268 |
| AURAS Technology Co. Ltd. | | 1,215,000 | 24,493,073 |
| BizLink Holding, Inc. | | 4,996,327 | 72,259,228 |
| Cathay Financial Holding Co. Ltd. | | 67,839,000 | 143,738,877 |
| CTBC Financial Holding Co. Ltd. | | 121,191,000 | 134,786,806 |
| Delta Electronics, Inc. | | 3,066,529 | 37,997,674 |
| E Ink Holdings, Inc. | | 3,357,799 | 31,528,688 |
| eMemory Technology, Inc. | | 814,116 | 79,418,254 |
| Formosa Plastics Corp. | | 22,480,000 | 33,074,318 |
| Hon Hai Precision Industry Co. Ltd. (Foxconn) | | 47,459,239 | 305,191,257 |
| King Yuan Electronics Co. Ltd. | | 12,187,712 | 46,083,845 |
| MediaTek, Inc. | | 3,450,480 | 134,758,386 |
| PharmaEssentia Corp. (a) | | 1,052,000 | 20,640,691 |
| Taiwan Semiconductor Manufacturing Co. Ltd. | | 88,185,260 | 2,774,450,309 |
| Uni-President Enterprises Corp. | | 35,655,000 | 100,173,394 |
| Unimicron Technology Corp. | | 7,828,665 | 38,358,050 |
| Wiwynn Corp. | | 977,973 | 55,781,204 |
| Yageo Corp. | | 847,810 | 14,466,864 |
TOTAL TAIWAN | | | 4,205,936,965 |
| Tanzania - 0.0% | | | |
| Helios Towers PLC (a) | | 4,757,300 | 6,526,896 |
| Thailand - 0.3% | | | |
| PTT Global Chemical PCL (For. Reg.) | | 90,870,400 | 69,990,704 |
| Supalai PCL (For. Reg.) | | 17,051,000 | 9,894,131 |
TOTAL THAILAND | | | 79,884,835 |
| United Arab Emirates - 0.6% | | | |
| Abu Dhabi Commercial Bank PJSC | | 3,951,082 | 9,616,714 |
| Abu Dhabi Islamic Bank | | 2,012,207 | 6,902,658 |
| ADNOC Drilling Co. PJSC | | 39,905,441 | 55,082,448 |
| Aldar Properties PJSC | | 6,438,600 | 13,357,328 |
| Dubai Islamic Bank Pakistan Ltd. | | 3,355,049 | 5,708,895 |
| Emaar Properties PJSC | | 22,599,135 | 53,466,869 |
TOTAL UNITED ARAB EMIRATES | | | 144,134,912 |
| United Kingdom - 0.3% | | | |
| AngloGold Ashanti PLC | | 2,784,700 | 77,690,715 |
| United States of America - 1.2% | | | |
| Legend Biotech Corp. ADR (a) | | 975,400 | 43,912,508 |
| Tenaris SA sponsored ADR (c) | | 2,211,600 | 72,717,408 |
| Titan Cement International Trading SA (f) | | 4,455,436 | 157,508,017 |
TOTAL UNITED STATES OF AMERICA | | | 274,137,933 |
| TOTAL COMMON STOCKS (Cost $17,308,901,384) | | | 23,312,961,009 |
| | | | |
| Preferred Stocks - 1.0% |
| | | Shares | Value ($) |
| Convertible Preferred Stocks - 0.7% | | | |
| China - 0.4% | | | |
| ByteDance Ltd. Series E1 (a)(d)(e) | | 399,541 | 99,553,631 |
| dMed Biopharmaceutical Co. Ltd. Series C (a)(d)(e) | | 769,712 | 4,171,839 |
| | | | 103,725,470 |
| India - 0.3% | | | |
| Meesho: | | | |
| Series D2 (d)(e) | | 141,313 | 7,847,111 |
| Series E (d)(e) | | 23,538 | 1,307,065 |
| Series E1 (d)(e) | | 31,950 | 1,774,184 |
| Series F (a)(d)(e) | | 453,122 | 25,601,393 |
| Pine Labs Private Ltd.: | | | |
| Series 1 (a)(d)(e) | | 22,959 | 8,546,029 |
| Series A (a)(d)(e) | | 5,737 | 2,135,484 |
| Series B (a)(d)(e) | | 6,242 | 2,323,460 |
| Series B2 (a)(d)(e) | | 5,049 | 1,879,389 |
| Series C (a)(d)(e) | | 9,391 | 3,495,612 |
| Series C1 (a)(d)(e) | | 1,978 | 736,271 |
| Series D (a)(d)(e) | | 2,116 | 787,639 |
| | | | 56,433,637 |
| United States of America - 0.0% | | | |
| Gupshup, Inc. (a)(d)(e) | | 566,129 | 4,863,048 |
TOTAL CONVERTIBLE PREFERRED STOCKS | | | 165,022,155 |
| Nonconvertible Preferred Stocks - 0.3% | | | |
| Korea (South) - 0.3% | | | |
| Hyundai Motor Co. Ltd. Series 2 | | 692,638 | 80,286,843 |
| TOTAL PREFERRED STOCKS (Cost $173,904,466) | | | 245,308,998 |
| | | | |
| Convertible Bonds - 0.1% |
| | | Principal Amount (g) | Value ($) |
| Brazil - 0.1% | | | |
Creditas Financial Solutions Ltd. 5% 7/28/27 (d)(e) (Cost $33,309,389) | | 33,309,389 | 31,217,559 |
| | | | |
| Government Obligations - 0.0% |
| | | Principal Amount (g) | Value ($) |
| United States of America - 0.0% | | | |
U.S. Treasury Bills, yield at date of purchase 4.58% to 5.16% 11/7/24 to 1/16/25 (h) (Cost $2,853,563) | | 2,860,000 | 2,853,808 |
| | | | |
| Money Market Funds - 3.0% |
| | | Shares | Value ($) |
| Fidelity Cash Central Fund 4.87% (i) | | 418,859,122 | 418,942,894 |
| Fidelity Securities Lending Cash Central Fund 4.87% (i)(j) | | 296,802,442 | 296,832,122 |
| TOTAL MONEY MARKET FUNDS (Cost $715,772,150) | | | 715,775,016 |
| | | | |
| TOTAL INVESTMENT IN SECURITIES - 102.1% (Cost $18,234,740,952) | 24,308,116,390 |
NET OTHER ASSETS (LIABILITIES) - (2.1)% | (499,546,105) |
| NET ASSETS - 100.0% | 23,808,570,285 |
| | |
| Futures Contracts |
| | Number of contracts | Expiration Date | Notional Amount ($) | Value ($) | Unrealized Appreciation/ (Depreciation) ($) |
| Purchased | | | | | |
| | | | | | |
| Equity Index Contracts | | | | | |
| ICE E-mini MSCI Emerging Markets Index Contracts (United States) | 1,355 | Dec 2024 | 76,320,375 | (2,519,757) | (2,519,757) |
| | | | | | |
| The notional amount of futures purchased as a percentage of Net Assets is 0.3% |
Legend
| (b) | Security exempt from registration under Rule 144A of the Securities Act of 1933. These securities may be resold in transactions exempt from registration, normally to qualified institutional buyers. At the end of the period, the value of these securities amounted to $1,231,269,441 or 5.2% of net assets. |
| (c) | Security or a portion of the security is on loan at period end. |
| (d) | Restricted securities (including private placements) - Investment in securities not registered under the Securities Act of 1933 (excluding 144A issues). At the end of the period, the value of restricted securities (excluding 144A issues) amounted to $203,662,331 or 0.9% of net assets. |
| (g) | Amount is stated in United States dollars unless otherwise noted. |
| (h) | Security or a portion of the security was pledged to cover margin requirements for futures contracts. At period end, the value of securities pledged amounted to $2,482,097. |
| (i) | Affiliated fund that is generally available only to investment companies and other accounts managed by Fidelity Investments. The rate quoted is the annualized seven-day yield of the fund at period end. A complete unaudited listing of the fund's holdings as of its most recent quarter end is available upon request. In addition, each Fidelity Central Fund's financial statements, which are not covered by the Fund's Report of Independent Registered Public Accounting Firm, are available on the SEC's website or upon request. |
| (j) | Investment made with cash collateral received from securities on loan. |
| (k) | Equity security is subject to lock-up or market standoff agreement. Fair value is based on the unadjusted market price of the equivalent equity security. As of period end, the total fair value of unadjusted equity securities subject to contractual sale restrictions is $46,884,759 and all restrictions are set to expire on or before January 31, 2025. Under normal market conditions, there are no circumstances that could cause the restrictions to lapse. |
| Additional information on each restricted holding is as follows: |
| Security | Acquisition Date | Acquisition Cost ($) |
| ByteDance Ltd. Series E1 | 11/18/20 | 43,779,377 |
| | | |
| Creditas Financial Solutions Ltd. 5% 7/28/27 | 1/28/22 - 7/28/23 | 33,309,389 |
| | | |
| dMed Biopharmaceutical Co. Ltd. Series C | 12/01/20 | 10,932,333 |
| | | |
| Gupshup, Inc. | 6/08/21 | 12,944,653 |
| | | |
| Jumo World Holding Ltd. | 9/06/23 | 2,024,724 |
| | | |
| Meesho Series D2 | 7/15/24 | 7,913,528 |
| | | |
| Meesho Series E | 7/15/24 | 1,318,128 |
| | | |
| Meesho Series E1 | 4/18/24 | 1,789,200 |
| | | |
| Meesho Series F | 9/21/21 - 7/15/24 | 34,290,258 |
| | | |
| Pine Labs Private Ltd. | 6/30/21 | 3,581,693 |
| | | |
| Pine Labs Private Ltd. Series 1 | 6/30/21 | 8,560,493 |
| | | |
| Pine Labs Private Ltd. Series A | 6/30/21 | 2,139,098 |
| | | |
| Pine Labs Private Ltd. Series B | 6/30/21 | 2,327,392 |
| | | |
| Pine Labs Private Ltd. Series B2 | 6/30/21 | 1,882,570 |
| | | |
| Pine Labs Private Ltd. Series C | 6/30/21 | 3,501,528 |
| | | |
| Pine Labs Private Ltd. Series C1 | 6/30/21 | 737,517 |
| | | |
| Pine Labs Private Ltd. Series D | 6/30/21 | 788,972 |
| | | |
Affiliated Central Funds
Fiscal year to date information regarding the Fund's investments in Fidelity Central Funds, including the ownership percentage, is presented below.
| Affiliate | Value, beginning of period ($) | Purchases ($) | Sales Proceeds ($) | Dividend Income ($) | Realized Gain (loss) ($) | Change in Unrealized appreciation (depreciation) ($) | Value, end of period ($) | % ownership, end of period |
| Fidelity Cash Central Fund 4.87% | 355,908,574 | 6,628,255,712 | 6,565,222,210 | 25,592,418 | 2,108 | (1,290) | 418,942,894 | 0.8% |
| Fidelity Securities Lending Cash Central Fund 4.87% | 380,133,200 | 3,017,878,946 | 3,101,180,024 | 2,471,446 | - | - | 296,832,122 | 1.2% |
| Total | 736,041,774 | 9,646,134,658 | 9,666,402,234 | 28,063,864 | 2,108 | (1,290) | 715,775,016 | |
| | | | | | | | | |
Amounts in the dividend income column in the above table include any capital gain distributions from underlying funds, which are presented in the corresponding line item in the Statement of Operations, if applicable.
Amounts in the dividend income column for Fidelity Securities Lending Cash Central Fund represents the income earned on investing cash collateral, less rebates paid to borrowers and any lending agent fees associated with the loan, plus any premium payments received for lending certain types of securities.
Amounts included in the purchases and sales proceeds columns may include in-kind transactions, if applicable.
Other Affiliated Issuers
An affiliated company is a company in which the Fund has ownership of at least 5% of the voting securities. Fiscal year to date transactions with companies which are or were affiliates are presented in the table below. Certain corporate actions, such as mergers, are excluded from the amounts in this table if applicable. A dash in the Value end of period ($) column means either the issuer is no longer held at period end, or the issuer is held at period end but is no longer an affiliate.
| Affiliate | Value, beginning of period ($) | Purchases ($) | Sales Proceeds ($) | Dividend Income ($) | Realized Gain (loss) ($) | Change in Unrealized appreciation (depreciation) ($) | Value, end of period ($) |
| Titan Cement International Trading SA | 86,321,617 | - | 3,417,190 | 4,060,134 | 926,250 | 73,677,340 | 157,508,017 |
| Zai Lab Ltd. | 26,836,407 | 27,789,911 | 21,984,819 | - | (15,796,339) | 14,113,498 | - |
| Total | 113,158,024 | 27,789,911 | 25,402,009 | 4,060,134 | (14,870,089) | 87,790,838 | 157,508,017 |
Amounts included in the purchases and sales proceeds columns may include in-kind transactions, if applicable.
Investment Valuation
The following is a summary of the inputs used, as of October 31, 2024, involving the Fund's assets and liabilities carried at fair value. The inputs or methodology used for valuing securities may not be an indication of the risk associated with investing in those securities. For more information on valuation inputs, and their aggregation into the levels used below, please refer to the Investment Valuation section in the accompanying Notes to Financial Statements.
| Valuation Inputs at Reporting Date: |
| Description | Total ($) | Level 1 ($) | Level 2 ($) | Level 3 ($) |
Investments in Securities: | | | | |
|
| Equities: | | | | |
Communication Services | 2,215,761,305 | 461,009,987 | 1,655,197,687 | 99,553,631 |
Consumer Discretionary | 3,679,588,957 | 1,054,905,316 | 2,588,153,888 | 36,529,753 |
Consumer Staples | 1,257,662,968 | 246,615,161 | 1,011,047,807 | - |
Energy | 1,079,524,119 | 458,109,973 | 621,414,036 | 110 |
Financials | 5,149,995,149 | 1,526,855,972 | 3,619,292,004 | 3,847,173 |
Health Care | 738,428,505 | 159,788,811 | 574,467,855 | 4,171,839 |
Industrials | 1,390,960,348 | 370,677,704 | 1,020,282,644 | - |
Information Technology | 5,456,739,962 | - | 5,428,397,389 | 28,342,573 |
Materials | 1,557,491,679 | 879,374,726 | 678,116,893 | 60 |
Real Estate | 345,848,002 | 164,700,115 | 181,147,887 | - |
Utilities | 686,269,013 | 196,793,885 | 489,475,128 | - |
|
| Corporate Bonds | 31,217,559 | - | - | 31,217,559 |
|
| Government Obligations | 2,853,808 | - | 2,853,808 | - |
|
| Money Market Funds | 715,775,016 | 715,775,016 | - | - |
| Total Investments in Securities: | 24,308,116,390 | 6,234,606,666 | 17,869,847,026 | 203,662,698 |
Derivative Instruments: Liabilities | | | | |
Futures Contracts | (2,519,757) | (2,519,757) | - | - |
| Total Liabilities | (2,519,757) | (2,519,757) | - | - |
| Total Derivative Instruments: | (2,519,757) | (2,519,757) | - | - |
The following is a reconciliation of Investments in Securities for which Level 3 inputs were used in determining value:
| |
| Investments in Securities: | |
| Beginning Balance | $ | 420,207,786 | |
| Net Realized Gain (Loss) on Investment Securities | | (437,347,441) | |
| Net Unrealized Gain (Loss) on Investment Securities | | 611,237,551 | |
| Cost of Purchases | | 12,244,344 | |
| Proceeds of Sales | | (402,679,542) | |
| Amortization/Accretion | | - | |
| Transfers into Level 3 | | - | |
| Transfers out of Level 3 | | - | |
| Ending Balance | $ | 203,662,698 | |
| The change in unrealized gain (loss) for the period attributable to Level 3 securities held at October 31, 2024 | $ | (826,376) | |
| The information used in the above reconciliation represents fiscal year to date activity for any Investments in Securities identified as using Level 3 inputs at either the beginning or the end of the current fiscal period. Cost of purchases and proceeds of sales may include securities received and/or delivered through in-kind transactions, corporate actions or exchanges. Transfers into Level 3 were attributable to a lack of observable market data resulting from decreases in market activity, decreases in liquidity, security restructurings or corporate actions. Transfers out of Level 3 were attributable to observable market data becoming available for those securities. Transfers in or out of Level 3 represent the beginning value of any Security or Instrument where a change in the pricing level occurred from the beginning to the end of the period. Realized and unrealized gains (losses) disclosed in the reconciliation are included in Net Gain (Loss) on the Fund's Statement of Operations. | |
Value of Derivative Instruments
The following table is a summary of the Fund's value of derivative instruments by primary risk exposure as of October 31, 2024. For additional information on derivative instruments, please refer to the Derivative Instruments section in the accompanying Notes to Financial Statements.
Primary Risk Exposure / Derivative Type | Value |
| Asset ($) | Liability ($) |
| Equity Risk | | |
Futures Contracts (a) | 0 | (2,519,757) |
| Total Equity Risk | 0 | (2,519,757) |
| Total Value of Derivatives | 0 | (2,519,757) |
(a)Reflects gross cumulative appreciation (depreciation) on futures contracts as presented in the Schedule of Investments. In the Statement of Assets and Liabilities, the period end daily variation margin is included in receivable or payable for daily variation margin on futures contracts, and the net cumulative appreciation (depreciation) is included in Total accumulated earnings (loss).
Fidelity® Series Emerging Markets Opportunities Fund
Financial Statements
| Statement of Assets and Liabilities |
As of October 31, 2024 |
| Assets | | | | |
| Investment in securities, at value (including securities loaned of $275,686,110) - See accompanying schedule: | | | | |
Unaffiliated issuers (cost $17,440,825,609) | $ | 23,434,833,357 | | |
Fidelity Central Funds (cost $715,772,150) | | 715,775,016 | | |
Other affiliated issuers (cost $78,143,193) | | 157,508,017 | | |
| | | | | |
| | | | | |
| Total Investment in Securities (cost $18,234,740,952) | | | $ | 24,308,116,390 |
| Foreign currency held at value (cost $17,022,796) | | | | 17,021,254 |
| Receivable for investments sold | | | | 131,047,848 |
| Receivable for fund shares sold | | | | 109,073,983 |
| Dividends receivable | | | | 17,431,841 |
| Interest receivable | | | | 2,103,114 |
| Distributions receivable from Fidelity Central Funds | | | | 1,491,937 |
| Receivable from investment adviser for expense reductions | | | | 205,654 |
| Other receivables | | | | 5,521,173 |
Total assets | | | | 24,592,013,194 |
| Liabilities | | | | |
| Payable to custodian bank | $ | 374,553 | | |
| Payable for investments purchased | | 203,005,207 | | |
| Payable for fund shares redeemed | | 56,344,758 | | |
| Payable for daily variation margin on futures contracts | | 352,300 | | |
| Deferred taxes | | 221,453,121 | | |
| Other payables and accrued expenses | | 5,085,944 | | |
| Collateral on securities loaned | | 296,827,026 | | |
| Total liabilities | | | | 783,442,909 |
| Net Assets | | | $ | 23,808,570,285 |
| Net Assets consist of: | | | | |
| Paid in capital | | | $ | 19,999,637,948 |
| Total accumulated earnings (loss) | | | | 3,808,932,337 |
| Net Assets | | | $ | 23,808,570,285 |
Net Asset Value, offering price and redemption price per share ($23,808,570,285 ÷ 1,228,791,366 shares) | | | $ | 19.38 |
| Statement of Operations |
| Year ended October 31, 2024 |
| Investment Income | | | | |
| Dividends (including $4,060,134 earned from affiliated issuers) | | | $ | 574,912,465 |
| Interest | | | | 2,373,414 |
| Income from Fidelity Central Funds (including $2,471,446 from security lending) | | | | 28,063,864 |
| Income before foreign taxes withheld | | | $ | 605,349,743 |
| Less foreign taxes withheld | | | | (63,067,890) |
| Total income | | | | 542,281,853 |
| Expenses | | | | |
| Custodian fees and expenses | $ | 6,954,429 | | |
| Independent trustees' fees and expenses | | 103,780 | | |
| Interest | | 137,431 | | |
| Miscellaneous | | 4,810 | | |
| Total expenses before reductions | | 7,200,450 | | |
| Expense reductions | | (3,943,546) | | |
| Total expenses after reductions | | | | 3,256,904 |
| Net Investment income (loss) | | | | 539,024,949 |
| Realized and Unrealized Gain (Loss) | | | | |
| Net realized gain (loss) on: | | | | |
| Investment Securities: | | | | |
| Unaffiliated issuers (net of foreign taxes of $89,388,754) | | (218,093,247) | | |
| Fidelity Central Funds | | 2,108 | | |
| Other affiliated issuers | | (14,870,089) | | |
| Foreign currency transactions | | (11,140,924) | | |
| Futures contracts | | 20,686,368 | | |
| Total net realized gain (loss) | | | | (223,415,784) |
| Change in net unrealized appreciation (depreciation) on: | | | | |
| Investment Securities: | | | | |
| Unaffiliated issuers (net of increase in deferred foreign taxes of $126,188,167) | | 4,788,992,969 | | |
| Fidelity Central Funds | | (1,290) | | |
| Other affiliated issuers | | 87,790,838 | | |
| Assets and liabilities in foreign currencies | | (978,787) | | |
| Futures contracts | | (2,509,306) | | |
| Total change in net unrealized appreciation (depreciation) | | | | 4,873,294,424 |
| Net gain (loss) | | | | 4,649,878,640 |
| Net increase (decrease) in net assets resulting from operations | | | $ | 5,188,903,589 |
| Statement of Changes in Net Assets |
| |
| | Year ended October 31, 2024 | | Year ended October 31, 2023 |
| Increase (Decrease) in Net Assets | | | | |
| Operations | | | | |
| Net investment income (loss) | $ | 539,024,949 | $ | 648,322,848 |
| Net realized gain (loss) | | (223,415,784) | | (781,171,593) |
| Change in net unrealized appreciation (depreciation) | | 4,873,294,424 | | 3,586,638,840 |
| Net increase (decrease) in net assets resulting from operations | | 5,188,903,589 | | 3,453,790,095 |
| Distributions to shareholders | | (625,661,951) | | (559,062,771) |
| | | | | |
| Share transactions | | | | |
| Proceeds from sales of shares | | 3,520,958,422 | | 1,881,171,940 |
| Reinvestment of distributions | | 625,661,951 | | 559,062,771 |
| Cost of shares redeemed | | (5,067,004,063) | | (7,499,526,249) |
| | | | | |
Net increase (decrease) in net assets resulting from share transactions | | (920,383,690) | | (5,059,291,538) |
| Total increase (decrease) in net assets | | 3,642,857,948 | | (2,164,564,214) |
| | | | | |
| Net Assets | | | | |
| Beginning of period | | 20,165,712,337 | | 22,330,276,551 |
| End of period | $ | 23,808,570,285 | $ | 20,165,712,337 |
| | | | | |
| Other Information | | | | |
| Shares | | | | |
| Sold | | 194,453,520 | | 114,358,773 |
| Issued in reinvestment of distributions | | 37,987,975 | | 35,117,008 |
| Redeemed | | (276,531,924) | | (452,937,950) |
| Net increase (decrease) | | (44,090,429) | | (303,462,169) |
| | | | | |
Financial Highlights
Fidelity® Series Emerging Markets Opportunities Fund |
| |
| Years ended October 31, | | 2024 | | 2023 | | 2022 | | 2021 | | 2020 |
Selected Per-Share Data | | | | | | | | | | |
| Net asset value, beginning of period | $ | 15.84 | $ | 14.17 | $ | 24.69 | $ | 21.49 | $ | 19.39 |
| Income from Investment Operations | | | | | | | | | | |
Net investment income (loss) A,B | | .42 | | .46 | | .48 | | .47 | | .35 |
| Net realized and unrealized gain (loss) | | 3.61 | | 1.58 | | (8.30) | | 3.48 | | 2.26 |
| Total from investment operations | | 4.03 | | 2.04 | | (7.82) | | 3.95 | | 2.61 |
| Distributions from net investment income | | (.49) | | (.37) | | (.68) | | (.33) | | (.50) |
| Distributions from net realized gain | | - | | - | | (2.01) | | (.41) | | (.02) |
| Total distributions | | (.49) | | (.37) | | (2.70) C | | (.75) C | | (.51) C |
| Net asset value, end of period | $ | 19.38 | $ | 15.84 | $ | 14.17 | $ | 24.69 | $ | 21.49 |
Total Return D | | | | 14.40% | | (35.33)% | | 18.44% | | 13.66% |
Ratios to Average Net Assets B,E,F | | | | | | | | | | |
| Expenses before reductions | | .03% | | .03% | | .03% | | .03% | | .04% |
| Expenses net of fee waivers, if any | | | | .01% | | .01% | | .01% | | .01% |
| Expenses net of all reductions | | .01% | | .01% | | .01% | | .01% | | .01% |
| Net investment income (loss) | | 2.32% | | 2.82% | | 2.64% | | 1.82% | | 1.78% |
| Supplemental Data | | | | | | | | | | |
| Net assets, end of period (000 omitted) | $ | 23,808,570 | $ | 20,165,712 | $ | 22,330,277 | $ | 29,188,538 | $ | 26,829,783 |
Portfolio turnover rate G | | | | 41% | | 37% | | 69% | | 42% H |
ACalculated based on average shares outstanding during the period.
BNet investment income (loss) is affected by the timing of the declaration of dividends by any underlying mutual funds or exchange-traded funds (ETFs). Net investment income (loss) of any mutual funds or ETFs is not included in the Fund's net investment income (loss) ratio.
CTotal distributions per share do not sum due to rounding.
DTotal returns would have been lower if certain expenses had not been reduced during the applicable periods shown.
EFees and expenses of any underlying mutual funds or exchange-traded funds (ETFs) are not included in the Fund's expense ratio. The Fund indirectly bears its proportionate share of these expenses. For additional expense information related to investments in Fidelity Central Funds, please refer to the "Investments in Fidelity Central Funds" note found in the Notes to Financial Statements section of the most recent Annual or Semi-Annual report.
FExpense ratios reflect operating expenses of the class. Expenses before reductions do not reflect amounts reimbursed, waived, or reduced through arrangements with the investment adviser, brokerage services, or other offset arrangements, if applicable, and do not represent the amount paid by the class during periods when reimbursements, waivers or reductions occur.
GAmount does not include the portfolio activity of any underlying mutual funds or exchange-traded funds (ETFs).
HPortfolio turnover rate excludes securities received or delivered in-kind.
Fidelity® Series International Growth Fund
Schedule of Investments October 31, 2024
Showing Percentage of Net Assets
| Common Stocks - 97.8% |
| | | Shares | Value ($) |
| Belgium - 0.3% | | | |
| Azelis Group NV | | 2,555,510 | 50,674,952 |
| Canada - 3.0% | | | |
| CAE, Inc. (a) | | 1,669,200 | 29,371,494 |
| Canadian Pacific Kansas City Ltd. | | 4,010,140 | 309,354,069 |
| Franco-Nevada Corp. | | 845,628 | 112,248,333 |
TOTAL CANADA | | | 450,973,896 |
| Denmark - 5.2% | | | |
| Novo Nordisk A/S Series B | | 6,891,700 | 773,007,613 |
| Finland - 0.6% | | | |
| Kone OYJ (B Shares) | | 1,561,000 | 85,340,362 |
| France - 11.3% | | | |
| Airbus Group NV | | 2,057,900 | 313,914,599 |
| Edenred SA | | 2,622,755 | 84,303,247 |
| EssilorLuxottica SA | | 24,900 | 5,834,104 |
| Lectra | | 994,888 | 27,595,830 |
| Legrand SA | | 2,194,144 | 247,649,620 |
| LVMH Moet Hennessy Louis Vuitton SE | | 611,023 | 406,770,568 |
| Safran SA | | 2,660,500 | 602,245,954 |
TOTAL FRANCE | | | 1,688,313,922 |
| Germany - 6.7% | | | |
| Deutsche Borse AG | | 904,245 | 210,036,492 |
| SAP SE | | 3,407,800 | 795,670,522 |
TOTAL GERMANY | | | 1,005,707,014 |
| India - 1.2% | | | |
| HDFC Bank Ltd. | | 3,503,496 | 72,011,428 |
| Jio Financial Services Ltd. (a) | | 2,607,200 | 9,971,805 |
| Reliance Industries Ltd. | | 2,047,800 | 32,378,897 |
| Reliance Industries Ltd. (a) | | 2,047,800 | 32,147,345 |
| Reliance Industries Ltd. GDR (b) | | 558,300 | 34,949,580 |
TOTAL INDIA | | | 181,459,055 |
| Italy - 1.3% | | | |
| Interpump Group SpA | | 1,615,820 | 71,780,719 |
| Prada SpA | | 16,064,100 | 123,332,317 |
TOTAL ITALY | | | 195,113,036 |
| Japan - 9.9% | | | |
| Azbil Corp. | | 18,301,320 | 142,310,383 |
| DENSO Corp. | | 5,943,820 | 84,423,017 |
| Hoya Corp. | | 1,135,900 | 151,976,658 |
| Keyence Corp. | | 877,143 | 395,954,351 |
| Komatsu Ltd. | | 3,206,100 | 82,990,870 |
| Misumi Group, Inc. | | 2,319,506 | 37,751,254 |
| OSG Corp. | | 1,699,846 | 20,063,325 |
| Recruit Holdings Co. Ltd. | | 7,222,605 | 441,030,528 |
| SHO-BOND Holdings Co. Ltd. | | 1,883,600 | 66,262,310 |
| USS Co. Ltd. | | 6,253,458 | 52,371,290 |
TOTAL JAPAN | | | 1,475,133,986 |
| Netherlands - 6.3% | | | |
| Aalberts Industries NV | | 647,863 | 23,368,282 |
| ASML Holding NV (Netherlands) | | 1,075,046 | 726,419,655 |
| BE Semiconductor Industries NV | | 692,235 | 73,746,726 |
| IMCD NV | | 718,654 | 114,169,606 |
TOTAL NETHERLANDS | | | 937,704,269 |
| Spain - 0.6% | | | |
| Amadeus IT Holding SA Class A | | 1,339,164 | 97,014,598 |
| Sweden - 7.5% | | | |
| AddTech AB (B Shares) | | 921,000 | 25,534,950 |
| ASSA ABLOY AB (B Shares) | | 7,580,337 | 237,436,940 |
| Atlas Copco AB (A Shares) | | 30,934,644 | 510,527,333 |
| Autoliv, Inc. | | 1,104,134 | 102,551,966 |
| Epiroc AB (A Shares) | | 10,298,655 | 201,135,900 |
| Lagercrantz Group AB (B Shares) | | 2,606,400 | 50,833,674 |
TOTAL SWEDEN | | | 1,128,020,763 |
| Switzerland - 2.6% | | | |
| Schindler Holding AG: | | | |
| (participation certificate) | | 250,231 | 72,848,212 |
| (Reg.) | | 144,272 | 41,098,850 |
| UBS Group AG | | 8,718,765 | 267,959,033 |
TOTAL SWITZERLAND | | | 381,906,095 |
| Taiwan - 3.3% | | | |
| Taiwan Semiconductor Manufacturing Co. Ltd. | | 15,796,885 | 496,995,445 |
| United Kingdom - 11.8% | | | |
| 3i Group PLC | | 1,739,500 | 71,332,925 |
| BAE Systems PLC | | 17,789,500 | 286,718,875 |
| Compass Group PLC | | 11,786,600 | 382,786,625 |
| InterContinental Hotel Group PLC ADR (c) | | 2,773,530 | 309,109,919 |
| London Stock Exchange Group PLC | | 2,069,600 | 280,505,086 |
| RELX PLC (London Stock Exchange) | | 4,878,600 | 223,731,154 |
| Rightmove PLC | | 4,026,676 | 30,571,658 |
| Sage Group PLC | | 7,287,900 | 91,098,227 |
| Spectris PLC | | 2,927,478 | 94,974,886 |
TOTAL UNITED KINGDOM | | | 1,770,829,355 |
| United States of America - 26.2% | | | |
| CRH PLC | | 6,137,440 | 585,695,899 |
| Experian PLC | | 7,334,289 | 357,198,404 |
| GE Vernova LLC | | 836,300 | 252,278,258 |
| Linde PLC | | 1,247,401 | 569,001,966 |
| Marsh & McLennan Companies, Inc. | | 1,462,515 | 319,179,274 |
| MasterCard, Inc. Class A | | 509,931 | 254,756,428 |
| Microsoft Corp. | | 250,700 | 101,871,945 |
| Moody's Corp. | | 678,859 | 308,229,140 |
| Nestle SA (Reg. S) | | 1,401,360 | 132,418,211 |
| Otis Worldwide Corp. | | 1,145,400 | 112,478,280 |
| PriceSmart, Inc. | | 433,627 | 36,025,731 |
| S&P Global, Inc. | | 615,980 | 295,892,153 |
| Sherwin-Williams Co. | | 963,741 | 345,761,359 |
| Visa, Inc. Class A | | 889,370 | 257,783,895 |
TOTAL UNITED STATES OF AMERICA | | | 3,928,570,943 |
| TOTAL COMMON STOCKS (Cost $8,721,968,437) | | | 14,646,765,304 |
| | | | |
| Convertible Preferred Stocks - 0.3% |
| | | Shares | Value ($) |
| China - 0.3% | | | |
ByteDance Ltd. Series E1 (a)(d)(e) (Cost $18,859,141) | | 172,113 | 42,885,396 |
| | | | |
| Money Market Funds - 1.6% |
| | | Shares | Value ($) |
| Fidelity Cash Central Fund 4.87% (f) | | 223,971,584 | 224,016,378 |
| Fidelity Securities Lending Cash Central Fund 4.87% (f)(g) | | 13,130,848 | 13,132,161 |
| TOTAL MONEY MARKET FUNDS (Cost $237,148,539) | | | 237,148,539 |
| | | | |
| TOTAL INVESTMENT IN SECURITIES - 99.7% (Cost $8,977,976,117) | 14,926,799,239 |
NET OTHER ASSETS (LIABILITIES) - 0.3% | 47,146,060 |
| NET ASSETS - 100.0% | 14,973,945,299 |
| | |
Legend
| (b) | Security exempt from registration under Rule 144A of the Securities Act of 1933. These securities may be resold in transactions exempt from registration, normally to qualified institutional buyers. At the end of the period, the value of these securities amounted to $34,949,580 or 0.2% of net assets. |
| (c) | Security or a portion of the security is on loan at period end. |
| (d) | Restricted securities (including private placements) - Investment in securities not registered under the Securities Act of 1933 (excluding 144A issues). At the end of the period, the value of restricted securities (excluding 144A issues) amounted to $42,885,396 or 0.3% of net assets. |
| (f) | Affiliated fund that is generally available only to investment companies and other accounts managed by Fidelity Investments. The rate quoted is the annualized seven-day yield of the fund at period end. A complete unaudited listing of the fund's holdings as of its most recent quarter end is available upon request. In addition, each Fidelity Central Fund's financial statements, which are not covered by the Fund's Report of Independent Registered Public Accounting Firm, are available on the SEC's website or upon request. |
| (g) | Investment made with cash collateral received from securities on loan. |
| Additional information on each restricted holding is as follows: |
| Security | Acquisition Date | Acquisition Cost ($) |
| ByteDance Ltd. Series E1 | 11/18/20 | 18,859,141 |
| | | |
Affiliated Central Funds
Fiscal year to date information regarding the Fund's investments in Fidelity Central Funds, including the ownership percentage, is presented below.
| Affiliate | Value, beginning of period ($) | Purchases ($) | Sales Proceeds ($) | Dividend Income ($) | Realized Gain (loss) ($) | Change in Unrealized appreciation (depreciation) ($) | Value, end of period ($) | % ownership, end of period |
| Fidelity Cash Central Fund 4.87% | 270,608,875 | 3,405,073,756 | 3,451,694,625 | 16,342,106 | 28,372 | - | 224,016,378 | 0.4% |
| Fidelity Securities Lending Cash Central Fund 4.87% | 67,864,785 | 1,420,592,890 | 1,475,325,514 | 198,910 | - | - | 13,132,161 | 0.1% |
| Total | 338,473,660 | 4,825,666,646 | 4,927,020,139 | 16,541,016 | 28,372 | - | 237,148,539 | |
| | | | | | | | | |
Amounts in the dividend income column in the above table include any capital gain distributions from underlying funds, which are presented in the corresponding line item in the Statement of Operations, if applicable.
Amounts in the dividend income column for Fidelity Securities Lending Cash Central Fund represents the income earned on investing cash collateral, less rebates paid to borrowers and any lending agent fees associated with the loan, plus any premium payments received for lending certain types of securities.
Amounts included in the purchases and sales proceeds columns may include in-kind transactions, if applicable.
Investment Valuation
The following is a summary of the inputs used, as of October 31, 2024, involving the Fund's assets and liabilities carried at fair value. The inputs or methodology used for valuing securities may not be an indication of the risk associated with investing in those securities. For more information on valuation inputs, and their aggregation into the levels used below, please refer to the Investment Valuation section in the accompanying Notes to Financial Statements.
| Valuation Inputs at Reporting Date: |
| Description | Total ($) | Level 1 ($) | Level 2 ($) | Level 3 ($) |
Investments in Securities: | | | | |
|
| Equities: | | | | |
Communication Services | 73,457,054 | 30,571,658 | - | 42,885,396 |
Consumer Discretionary | 1,558,360,300 | 508,676,483 | 1,049,683,817 | - |
Consumer Staples | 168,443,942 | 36,025,731 | 132,418,211 | - |
Energy | 99,475,822 | 34,949,580 | 64,526,242 | - |
Financials | 2,431,960,906 | 1,788,103,170 | 643,857,736 | - |
Health Care | 930,818,375 | 5,834,104 | 924,984,271 | - |
Industrials | 4,816,955,100 | 1,545,496,438 | 3,271,458,662 | - |
Information Technology | 2,997,471,644 | 1,166,540,943 | 1,830,930,701 | - |
Materials | 1,612,707,557 | 1,612,707,557 | - | - |
|
| Money Market Funds | 237,148,539 | 237,148,539 | - | - |
| Total Investments in Securities: | 14,926,799,239 | 6,966,054,203 | 7,917,859,640 | 42,885,396 |
Fidelity® Series International Growth Fund
Financial Statements
| Statement of Assets and Liabilities |
As of October 31, 2024 |
| Assets | | | | |
| Investment in securities, at value (including securities loaned of $12,699,170) - See accompanying schedule: | | | | |
Unaffiliated issuers (cost $8,740,827,578) | $ | 14,689,650,700 | | |
Fidelity Central Funds (cost $237,148,539) | | 237,148,539 | | |
| | | | | |
| | | | | |
| Total Investment in Securities (cost $8,977,976,117) | | | $ | 14,926,799,239 |
| Foreign currency held at value (cost $26,840) | | | | 26,881 |
| Receivable for investments sold | | | | 58,730,208 |
| Receivable for fund shares sold | | | | 26,730,792 |
| Dividends receivable | | | | 12,707,465 |
| Reclaims receivable | | | | 35,535,440 |
| Distributions receivable from Fidelity Central Funds | | | | 532,811 |
| Other receivables | | | | 59,389 |
Total assets | | | | 15,061,122,225 |
| Liabilities | | | | |
| Payable for investments purchased | $ | 8,449,265 | | |
| Payable for fund shares redeemed | | 62,040,134 | | |
| Other payables and accrued expenses | | 3,555,366 | | |
| Collateral on securities loaned | | 13,132,161 | | |
| Total liabilities | | | | 87,176,926 |
| Net Assets | | | $ | 14,973,945,299 |
| Net Assets consist of: | | | | |
| Paid in capital | | | $ | 8,509,070,877 |
| Total accumulated earnings (loss) | | | | 6,464,874,422 |
| Net Assets | | | $ | 14,973,945,299 |
Net Asset Value, offering price and redemption price per share ($14,973,945,299 ÷ 812,034,808 shares) | | | $ | 18.44 |
| Statement of Operations |
| Year ended October 31, 2024 |
| Investment Income | | | | |
| Dividends | | | $ | 215,354,050 |
| Income from Fidelity Central Funds (including $198,910 from security lending) | | | | 16,541,016 |
| Income before foreign taxes withheld | | | $ | 231,895,066 |
| Less foreign taxes withheld | | | | (13,772,306) |
| Total income | | | | 218,122,760 |
| Expenses | | | | |
| Custodian fees and expenses | $ | 766,724 | | |
| Independent trustees' fees and expenses | | 67,241 | | |
| Miscellaneous | | 86 | | |
| Total expenses before reductions | | 834,051 | | |
| Expense reductions | | (785) | | |
| Total expenses after reductions | | | | 833,266 |
| Net Investment income (loss) | | | | 217,289,494 |
| Realized and Unrealized Gain (Loss) | | | | |
| Net realized gain (loss) on: | | | | |
| Investment Securities: | | | | |
| Unaffiliated issuers (net of foreign taxes of $559,645) | | 659,411,153 | | |
| Redemptions in-kind | | 338,431,291 | | |
| Fidelity Central Funds | | 28,372 | | |
| Foreign currency transactions | | (258,525) | | |
| Total net realized gain (loss) | | | | 997,612,291 |
| Change in net unrealized appreciation (depreciation) on: | | | | |
| Investment Securities: | | | | |
| Unaffiliated issuers (net of increase in deferred foreign taxes of $2,616,915) | | 2,105,754,692 | | |
| Assets and liabilities in foreign currencies | | 1,343,075 | | |
| Total change in net unrealized appreciation (depreciation) | | | | 2,107,097,767 |
| Net gain (loss) | | | | 3,104,710,058 |
| Net increase (decrease) in net assets resulting from operations | | | $ | 3,321,999,552 |
| Statement of Changes in Net Assets |
| |
| | Year ended October 31, 2024 | | Year ended October 31, 2023 |
| Increase (Decrease) in Net Assets | | | | |
| Operations | | | | |
| Net investment income (loss) | $ | 217,289,494 | $ | 190,486,775 |
| Net realized gain (loss) | | 997,612,291 | | 18,909,853 |
| Change in net unrealized appreciation (depreciation) | | 2,107,097,767 | | 1,208,323,184 |
| Net increase (decrease) in net assets resulting from operations | | 3,321,999,552 | | 1,417,719,812 |
| Distributions to shareholders | | (186,414,240) | | (434,836,481) |
| | | | | |
| Share transactions | | | | |
| Proceeds from sales of shares | | 2,548,527,172 | | 2,142,973,065 |
| Reinvestment of distributions | | 186,414,240 | | 434,836,481 |
| Cost of shares redeemed | | (3,744,668,063) | | (3,104,776,773) |
| | | | | |
Net increase (decrease) in net assets resulting from share transactions | | (1,009,726,651) | | (526,967,227) |
| Total increase (decrease) in net assets | | 2,125,858,661 | | 455,916,104 |
| | | | | |
| Net Assets | | | | |
| Beginning of period | | 12,848,086,638 | | 12,392,170,534 |
| End of period | $ | 14,973,945,299 | $ | 12,848,086,638 |
| | | | | |
| Other Information | | | | |
| Shares | | | | |
| Sold | | 141,532,404 | | 138,038,506 |
| Issued in reinvestment of distributions | | 11,408,460 | | 29,420,601 |
| Redeemed | | (208,810,528) | | (200,541,435) |
| Net increase (decrease) | | (55,869,664) | | (33,082,328) |
| | | | | |
Financial Highlights
Fidelity® Series International Growth Fund |
| |
| Years ended October 31, | | 2024 | | 2023 | | 2022 | | 2021 | | 2020 |
Selected Per-Share Data | | | | | | | | | | |
| Net asset value, beginning of period | $ | 14.80 | $ | 13.75 | $ | 20.51 | $ | 18.01 | $ | 17.07 |
| Income from Investment Operations | | | | | | | | | | |
Net investment income (loss) A,B | | .26 | | .22 | | .21 | | .20 | | .20 |
| Net realized and unrealized gain (loss) | | 3.60 | | 1.33 | | (5.38) | | 5.19 | | 1.38 |
| Total from investment operations | | 3.86 | | 1.55 | | (5.17) | | 5.39 | | 1.58 |
| Distributions from net investment income | | (.22) | | (.20) | | (.28) | | (.24) | | (.37) |
| Distributions from net realized gain | | - | | (.30) | | (1.31) | | (2.65) | | (.27) |
| Total distributions | | (.22) | | (.50) | | (1.59) | | (2.89) | | (.64) |
| Net asset value, end of period | $ | 18.44 | $ | 14.80 | $ | 13.75 | $ | 20.51 | $ | 18.01 |
Total Return C | | | | 11.31% | | (27.31)% | | 33.10% | | 9.39% |
Ratios to Average Net Assets B,D,E | | | | | | | | | | |
| Expenses before reductions | | .01% | | .01% | | .01% | | .01% | | .01% |
| Expenses net of fee waivers, if any | | | | .01% | | .01% | | .01% | | .01% |
| Expenses net of all reductions | | .01% | | .01% | | .01% | | .01% | | .01% |
| Net investment income (loss) | | 1.44% | | 1.42% | | 1.32% | | 1.06% | | 1.18% |
| Supplemental Data | | | | | | | | | | |
| Net assets, end of period (000 omitted) | $ | 14,973,945 | $ | 12,848,087 | $ | 12,392,171 | $ | 15,467,124 | $ | 11,557,995 |
Portfolio turnover rate F | | | | 19% G | | 22% G | | 24% | | 16% G |
ACalculated based on average shares outstanding during the period.
BNet investment income (loss) is affected by the timing of the declaration of dividends by any underlying mutual funds or exchange-traded funds (ETFs). Net investment income (loss) of any mutual funds or ETFs is not included in the Fund's net investment income (loss) ratio.
CTotal returns would have been lower if certain expenses had not been reduced during the applicable periods shown.
DFees and expenses of any underlying mutual funds or exchange-traded funds (ETFs) are not included in the Fund's expense ratio. The Fund indirectly bears its proportionate share of these expenses. For additional expense information related to investments in Fidelity Central Funds, please refer to the "Investments in Fidelity Central Funds" note found in the Notes to Financial Statements section of the most recent Annual or Semi-Annual report.
EExpense ratios reflect operating expenses of the class. Expenses before reductions do not reflect amounts reimbursed, waived, or reduced through arrangements with the investment adviser, brokerage services, or other offset arrangements, if applicable, and do not represent the amount paid by the class during periods when reimbursements, waivers or reductions occur.
FAmount does not include the portfolio activity of any underlying mutual funds or exchange-traded funds (ETFs).
GPortfolio turnover rate excludes securities received or delivered in-kind.
Fidelity® Series International Small Cap Fund
Schedule of Investments October 31, 2024
Showing Percentage of Net Assets
| Common Stocks - 96.7% |
| | | Shares | Value ($) |
| Australia - 2.2% | | | |
| Dominos Pizza Enterprises Ltd. | | 188,911 | 4,134,422 |
| Imdex Ltd. | | 15,040,232 | 25,550,821 |
| NIB Holdings Ltd. | | 972,683 | 3,681,945 |
| Silex Systems Ltd. (a) | | 550,000 | 1,866,300 |
| Steadfast Group Ltd. | | 9,293,721 | 33,470,950 |
| Vulcan Energy Resources Ltd. (a)(b) | | 1,500,000 | 5,031,736 |
| Whitehaven Coal Ltd. | | 2,575,000 | 11,516,391 |
TOTAL AUSTRALIA | | | 85,252,565 |
| Austria - 0.0% | | | |
| AT&S Austria Technologie & Systemtechnik AG (a)(b) | | 105,000 | 1,919,933 |
| Bailiwick of Jersey - 0.4% | | | |
| JTC PLC (c) | | 1,115,000 | 14,779,934 |
| Belgium - 2.0% | | | |
| Azelis Group NV | | 1,156,754 | 22,938,065 |
| Fagron NV | | 227,500 | 4,587,966 |
| Galapagos NV (a) | | 85,000 | 2,269,203 |
| Ion Beam Applications SA | | 140,000 | 2,086,305 |
| KBC Ancora | | 738,579 | 37,277,264 |
| Melexis NV | | 25,000 | 1,622,107 |
| Montea SICAFI SCA | | 50,000 | 3,643,963 |
| Warehouses de Pauw | | 138,500 | 3,287,257 |
TOTAL BELGIUM | | | 77,712,130 |
| Brazil - 0.0% | | | |
| Vamos Locacao de Caminhoes Maquinas e Equipamentos SA | | 1,901,500 | 2,068,957 |
| Canada - 3.9% | | | |
| CAE, Inc. (a) | | 560,900 | 9,869,681 |
| ECN Capital Corp. | | 533,950 | 847,509 |
| Lumine Group, Inc. (a) | | 360,000 | 8,382,375 |
| McCoy Global, Inc. | | 736,750 | 1,926,075 |
| MTY Food Group, Inc. (b) | | 118,300 | 3,801,301 |
| North West Co., Inc. | | 120,000 | 4,516,968 |
| Onex Corp. (sub. vtg.) | | 50,000 | 3,598,951 |
| Osisko Gold Royalties Ltd. | | 1,499,700 | 30,180,338 |
| Parkland Corp. | | 182,500 | 4,246,777 |
| Pason Systems, Inc. | | 2,091,500 | 20,233,781 |
| Real Matters, Inc. (a) | | 950,000 | 4,810,213 |
| Richelieu Hardware Ltd. | | 1,820,420 | 47,970,129 |
| South Bow Corp. | | 450,000 | 11,237,476 |
TOTAL CANADA | | | 151,621,574 |
| China - 0.6% | | | |
| China Resources Mixc Lifestyle Services Ltd. (c) | | 1,000,000 | 4,125,418 |
| Chlitina Holding Ltd. | | 2,206,670 | 9,709,410 |
| Consun Pharmaceutical Group Ltd. | | 3,000,000 | 3,197,134 |
| Flat Glass Group Co. Ltd. (b) | | 900,000 | 1,834,083 |
| Sinopharm Group Co. Ltd. (H Shares) | | 550,000 | 1,370,210 |
| Zai Lab Ltd. (a)(b) | | 850,000 | 2,591,754 |
TOTAL CHINA | | | 22,828,009 |
| Denmark - 0.6% | | | |
| Cadeler A/S (a) | | 700,000 | 4,702,642 |
| Spar Nord Bank A/S | | 1,069,694 | 20,589,786 |
TOTAL DENMARK | | | 25,292,428 |
| Egypt - 0.2% | | | |
| Integrated Diagnostics Holdings PLC (a)(c) | | 15,331,734 | 7,635,204 |
| Finland - 0.2% | | | |
| Huhtamaki Oyj | | 136,689 | 5,358,552 |
| Nanoform Finland PLC (a) | | 500,000 | 730,968 |
TOTAL FINLAND | | | 6,089,520 |
| France - 3.3% | | | |
| ARGAN SA | | 105,600 | 7,810,915 |
| Elis SA | | 440,000 | 9,955,088 |
| Exail Technologies SA (a)(b) | | 220,290 | 4,313,168 |
| Laurent-Perrier Group SA | | 97,649 | 10,674,879 |
| Lectra | | 969,210 | 26,883,584 |
| LISI | | 454,088 | 11,014,733 |
| Maisons du Monde SA (c) | | 259,100 | 1,125,935 |
| SEB SA | | 30,000 | 3,145,773 |
| Stef SA | | 75,000 | 11,209,264 |
| Thermador Groupe SA | | 82,100 | 6,376,325 |
| Vallourec SA (a) | | 694,300 | 11,366,134 |
| Vetoquinol SA | | 298,648 | 25,955,864 |
TOTAL FRANCE | | | 129,831,662 |
| Germany - 6.9% | | | |
| Aixtron AG (b) | | 90,000 | 1,426,367 |
| Auto1 Group SE (a)(b)(c) | | 950,000 | 9,708,441 |
| CTS Eventim AG | | 1,175,470 | 123,322,657 |
| Gerresheimer AG | | 35,000 | 2,950,522 |
| Nexus AG | | 548,816 | 28,744,327 |
| NORMA Group AG | | 107,000 | 1,485,127 |
| Rheinmetall AG | | 88,600 | 45,604,484 |
| Scout24 AG (c) | | 345,500 | 29,745,965 |
| Stabilus Se | | 547,029 | 21,629,369 |
| Wacker Chemie AG (b) | | 76,300 | 6,418,858 |
TOTAL GERMANY | | | 271,036,117 |
| Greece - 0.2% | | | |
| Athens International Airport SA | | 872,400 | 7,449,282 |
| Hungary - 0.3% | | | |
| Richter Gedeon PLC | | 363,700 | 10,505,789 |
| Indonesia - 0.2% | | | |
| PT Selamat Sempurna Tbk | | 50,000,000 | 6,093,119 |
| Ireland - 1.5% | | | |
| AerCap Holdings NV | | 366,000 | 34,239,300 |
| Cairn Homes PLC | | 5,341,234 | 12,369,508 |
| Irish Residential Properties REIT PLC | | 10,949,300 | 10,361,788 |
| Mincon Group PLC | | 3,809,284 | 1,823,161 |
TOTAL IRELAND | | | 58,793,757 |
| Israel - 1.1% | | | |
| Energean PLC | | 200,000 | 2,594,373 |
| Ituran Location & Control Ltd. | | 893,735 | 23,889,537 |
| Tel Aviv Stock Exchange Ltd. | | 1,620,557 | 16,290,384 |
TOTAL ISRAEL | | | 42,774,294 |
| Italy - 2.8% | | | |
| Banca Generali SpA | | 140,000 | 6,204,091 |
| BFF Bank SpA (c) | | 529,000 | 5,164,392 |
| Brembo N.V. (b) | | 325,000 | 3,407,567 |
| Davide Campari Milano NV | | 450,000 | 3,021,194 |
| Dovalue SpA (a)(b)(c) | | 239,999 | 1,331,400 |
| Generalfinance SpA | | 250,179 | 3,129,520 |
| Generalfinance SpA rights (a) | | 256,737 | 20 |
| Industrie de Nora SpA (b) | | 198,400 | 1,865,674 |
| Intercos SpA | | 310,900 | 4,984,795 |
| Interpump Group SpA | | 1,768,512 | 78,563,864 |
| Sesa SpA | | 33,000 | 2,868,070 |
| Sesa SpA rights (a) | | 33,000 | 0 |
TOTAL ITALY | | | 110,540,587 |
| Japan - 27.8% | | | |
| Ai Holdings Corp. | | 416,292 | 6,343,696 |
| Air Water, Inc. | | 250,000 | 3,144,765 |
| Arealink Co. Ltd. | | 300,000 | 3,583,031 |
| Artnature, Inc. | | 1,214,900 | 6,612,899 |
| As One Corp. | | 243,000 | 4,544,311 |
| ASKUL Corp. | | 450,000 | 5,674,433 |
| Aucnet, Inc. | | 757,060 | 11,816,068 |
| AZ-Com Maruwa Holdings, Inc. | | 400,000 | 2,699,075 |
| Azbil Corp. | | 13,516,360 | 105,102,712 |
| BayCurrent Consulting, Inc. | | 281,800 | 9,158,237 |
| Belc Co. Ltd. | | 130,000 | 5,563,858 |
| Broadleaf Co. Ltd. | | 4,655,173 | 17,225,595 |
| Central Automotive Products Ltd. | | 230,779 | 6,950,770 |
| Chiba Bank Ltd. | | 556,900 | 4,064,098 |
| CKD Corp. | | 267,000 | 4,494,363 |
| Comture Corp. | | 100,000 | 1,510,508 |
| CTS Co. Ltd. | | 300,000 | 1,786,174 |
| Curves Holdings Co. Ltd. (d) | | 5,304,859 | 28,078,149 |
| Daiei Kankyo Co. Ltd. | | 586,100 | 12,088,862 |
| Daiichikosho Co. Ltd. | | 1,206,928 | 15,081,372 |
| Daikokutenbussan Co. Ltd. | | 179,300 | 12,423,293 |
| Daiwabo Holdings Co. Ltd. | | 220,000 | 3,960,301 |
| Dexerials Corp. | | 452,400 | 6,907,051 |
| Digital Hearts Holdings Co. Ltd. | | 1,055,950 | 5,630,118 |
| Ebara Corp. | | 250,000 | 3,757,101 |
| Fuji Electric Co. Ltd. | | 74,200 | 3,778,851 |
| Fujitec Co. Ltd. | | 880,300 | 31,675,113 |
| Funai Soken Holdings, Inc. | | 433,957 | 6,907,189 |
| Fuyo General Lease Co. Ltd. | | 28,800 | 2,037,982 |
| Gift Holdings, Inc. (b) | | 545,900 | 11,505,984 |
| Goldcrest Co. Ltd. | | 1,347,300 | 26,259,735 |
| Hamamatsu Photonics K.K. | | 210,000 | 2,776,756 |
| Hokuhoku Financial Group, Inc. | | 501,500 | 5,241,420 |
| Inaba Denki Sangyo Co. Ltd. | | 216,300 | 5,425,210 |
| Intermestic, Inc. | | 222,100 | 2,969,992 |
| Iwatani Corp. | | 520,000 | 6,778,723 |
| Iwatsuka Confectionary Co. Ltd. | | 211,600 | 3,599,734 |
| Japan Elevator Service Holdings Co. Ltd. | | 146,300 | 2,801,264 |
| JEOL Ltd. | | 80,000 | 2,967,642 |
| JINS Holdings, Inc. | | 123,200 | 5,021,483 |
| Justsystems Corp. | | 140,000 | 3,130,323 |
| Kamigumi Co. Ltd. | | 175,800 | 3,669,227 |
| Kansai Paint Co. Ltd. | | 1,085,800 | 17,684,044 |
| Katitas Co. Ltd. | | 350,000 | 4,437,666 |
| Kato Sangyo | | 110,000 | 2,978,007 |
| Kobe Bussan Co. Ltd. | | 82,300 | 2,018,794 |
| Koshidaka Holdings Co. Ltd. (d) | | 5,227,659 | 41,006,495 |
| Kotobuki Spirits Co. Ltd. | | 432,600 | 5,841,273 |
| Kuraray Co. Ltd. | | 429,900 | 5,825,777 |
| Kusuri No Aoki Holdings Co. Ltd. | | 888,874 | 18,499,881 |
| Kyoritsu Maintenance Co. Ltd. (b) | | 237,600 | 3,814,625 |
| Kyoto Financial Group, Inc. | | 241,812 | 3,548,924 |
| m-up Holdings, Inc. | | 250,000 | 2,157,462 |
| Maeda Kosen Co. Ltd. | | 449,600 | 5,204,023 |
| Maruwa Ceramic Co. Ltd. | | 25,900 | 7,144,972 |
| MCJ Co. Ltd. | | 850,000 | 7,964,417 |
| Medikit Co. Ltd. | | 658,800 | 12,110,079 |
| Meitec Group Holdings, Inc. | | 201,000 | 3,851,817 |
| Miroku Jyoho Service Co., Ltd. | | 618,891 | 7,371,130 |
| Misumi Group, Inc. | | 652,000 | 10,611,664 |
| Mitani Shoji Co. Ltd. | | 350,000 | 4,304,458 |
| Mitsuboshi Belting Ltd. | | 272,952 | 7,006,831 |
| Nagaileben Co. Ltd. | | 1,528,000 | 22,925,899 |
| Net One Systems Co. Ltd. | | 600,000 | 14,567,306 |
| Nihon Parkerizing Co. Ltd. | | 3,681,918 | 31,033,885 |
| Nippon Concept Corp. | | 145,000 | 1,711,748 |
| NOF Corp. | | 1,060,700 | 17,232,662 |
| NS Tool Co. Ltd. (d) | | 1,444,000 | 6,974,922 |
| NSD Co. Ltd. | | 1,934,580 | 41,783,051 |
| OBIC Co. Ltd. | | 623,000 | 20,358,040 |
| Osaka Soda Co. Ltd. | | 425,500 | 4,469,135 |
| OSG Corp. | | 1,236,475 | 14,594,146 |
| Paramount Bed Holdings Co. Ltd. | | 536,612 | 9,273,266 |
| Park24 Co. Ltd. (a) | | 300,000 | 3,728,652 |
| Prestige International, Inc. | | 1,100,000 | 4,917,329 |
| ProNexus, Inc. | | 1,142,477 | 9,697,059 |
| Qol Holdings Co. Ltd. | | 510,000 | 4,746,158 |
| Relo Group, Inc. | | 275,000 | 3,345,203 |
| Renesas Electronics Corp. | | 265,000 | 3,550,555 |
| Rohto Pharmaceutical Co. Ltd. | | 407,200 | 9,156,855 |
| San-Ai Obbli Co. Ltd. | | 1,156,272 | 14,116,851 |
| SHO-BOND Holdings Co. Ltd. | | 1,323,800 | 46,569,360 |
| Shoei Co. Ltd. | | 505,500 | 7,757,345 |
| SK Kaken Co. Ltd. | | 526,920 | 30,606,894 |
| Softcreate Co. Ltd. | | 200,000 | 2,834,044 |
| Software Service, Inc. | | 178,500 | 14,834,877 |
| Sumco Corp. | | 768,400 | 7,346,997 |
| SWCC Showa Holdings Co. Ltd. | | 199,600 | 6,999,814 |
| Taiyo Yuden Co. Ltd. | | 103,600 | 1,811,939 |
| Takeuchi Manufacturing Co. Ltd. | | 50,000 | 1,558,181 |
| Techno Medica Co. Ltd. | | 283,000 | 3,349,998 |
| The Monogatari Corp. | | 925,488 | 21,765,696 |
| TIS, Inc. | | 978,936 | 24,411,203 |
| Tocalo Co. Ltd. | | 1,479,649 | 17,212,037 |
| Toyo Suisan Kaisha Ltd. | | 135,000 | 7,930,412 |
| USS Co. Ltd. | | 2,204,200 | 18,459,674 |
| Visional, Inc. (a) | | 146,500 | 7,839,083 |
| WealthNavi, Inc. (a)(b) | | 200,000 | 1,453,122 |
| WingArc1st, Inc. | | 371,303 | 7,909,759 |
| YAKUODO Holdings Co. Ltd. | | 918,800 | 12,778,930 |
| Yaoko Co. Ltd. | | 80,500 | 4,893,416 |
| YONEX Co. Ltd. | | 840,000 | 10,511,019 |
TOTAL JAPAN | | | 1,085,146,329 |
| Korea (South) - 0.4% | | | |
| BGF Retail Co. Ltd. | | 157,318 | 13,205,939 |
| Soulbrain Co. Ltd. | | 18,000 | 2,631,392 |
TOTAL KOREA (SOUTH) | | | 15,837,331 |
| Netherlands - 5.3% | | | |
| Aalberts Industries NV | | 2,236,135 | 80,656,920 |
| BE Semiconductor Industries NV | | 370,751 | 39,497,674 |
| IMCD NV | | 324,929 | 51,620,134 |
| Koninklijke Heijmans NV (Certificaten Van Aandelen) | | 390,050 | 10,500,853 |
| TKH Group NV (bearer) (depositary receipt) | | 252,600 | 10,248,759 |
| Van Lanschot Kempen NV (Bearer) | | 305,761 | 13,985,474 |
TOTAL NETHERLANDS | | | 206,509,814 |
| New Zealand - 0.1% | | | |
| Contact Energy Ltd. | | 552,000 | 2,808,595 |
| Norway - 2.1% | | | |
| Europris ASA (c) | | 794,000 | 4,915,492 |
| Kongsberg Gruppen ASA | | 532,308 | 55,407,416 |
| Medistim ASA | | 440,375 | 6,405,338 |
| Norconsult A/S | | 1,491,300 | 5,246,569 |
| Selvaag Bolig ASA | | 840,200 | 2,516,735 |
| Sparebanken Midt-Norge | | 356,800 | 5,266,272 |
| TGS ASA | | 360,000 | 3,269,395 |
TOTAL NORWAY | | | 83,027,217 |
| Oman - 0.0% | | | |
| OQ Exploration & Production SAOG | | 2,000,000 | 1,896,104 |
| Philippines - 0.3% | | | |
| International Container Terminal Services, Inc. | | 1,555,000 | 10,525,016 |
| Poland - 0.1% | | | |
| Allegro.eu SA (a)(c) | | 300,000 | 2,632,190 |
| Sygnity SA (a) | | 81,669 | 1,342,532 |
TOTAL POLAND | | | 3,974,722 |
| Puerto Rico - 0.1% | | | |
| Liberty Latin America Ltd. Class C (a) | | 390,000 | 3,775,200 |
| Singapore - 0.2% | | | |
| Boustead Singapore Ltd. | | 9,400,000 | 7,316,659 |
| Spain - 0.9% | | | |
| Cie Automotive SA | | 66,585 | 1,781,725 |
| Fluidra SA | | 574,020 | 15,434,927 |
| Logista Integral SA | | 407,000 | 12,440,270 |
| Neinor Homes SLU (c) | | 322,500 | 5,290,055 |
TOTAL SPAIN | | | 34,946,977 |
| Sweden - 12.5% | | | |
| Addlife AB B Shares | | 1,383,651 | 17,583,694 |
| AddTech AB (B Shares) | | 4,147,896 | 115,001,429 |
| Alligo AB (B Shares) | | 500,000 | 5,912,967 |
| Autoliv, Inc. | | 405,900 | 37,699,992 |
| Bergman & Beving AB (B Shares) | | 1,406,054 | 39,524,257 |
| Betsson AB (B Shares) (a) | | 540,000 | 7,182,734 |
| BHG Group AB (a) | | 1,953,200 | 3,272,275 |
| Dometic Group AB (c) | | 491,200 | 2,667,022 |
| Hemnet Group AB | | 1,534,200 | 48,151,868 |
| HEXPOL AB (B Shares) | | 375,500 | 3,556,035 |
| INVISIO AB | | 853,872 | 21,477,932 |
| JM AB | | 315,300 | 5,306,023 |
| John Mattson Fastighetsforetagen AB (a) | | 2,484,706 | 15,344,961 |
| Lagercrantz Group AB (B Shares) | | 7,806,599 | 152,255,258 |
| Prisma Properties AB | | 1,394,232 | 3,277,336 |
| Rusta AB | | 1,250,000 | 8,382,569 |
TOTAL SWEDEN | | | 486,596,352 |
| Switzerland - 0.6% | | | |
| Tecan Group AG | | 73,160 | 18,468,971 |
| VZ Holding AG | | 31,122 | 5,023,921 |
TOTAL SWITZERLAND | | | 23,492,892 |
| Taiwan - 1.2% | | | |
| Addcn Technology Co. Ltd. (d) | | 3,559,432 | 20,624,736 |
| eMemory Technology, Inc. | | 200,000 | 19,510,304 |
| International Games Systems Co. Ltd. | | 228,000 | 7,217,343 |
TOTAL TAIWAN | | | 47,352,383 |
| United Kingdom - 16.0% | | | |
| B&M European Value Retail SA | | 1,383,231 | 6,913,262 |
| Baltic Classifieds Group PLC | | 11,221,800 | 45,652,692 |
| Berkeley Group Holdings PLC | | 71,788 | 4,096,570 |
| Big Yellow Group PLC | | 450,000 | 7,009,450 |
| Bodycote PLC | | 5,506,061 | 39,332,838 |
| Cab Payments Holdings Ltd. (a)(b) | | 2,070,900 | 2,985,420 |
| Clarkson PLC | | 508,634 | 23,053,413 |
| DCC PLC (United Kingdom) | | 175,000 | 11,066,060 |
| Diploma PLC | | 365,000 | 20,040,245 |
| Domino's Pizza UK & IRL PLC | | 1,017,300 | 3,951,014 |
| Dowlais Group PLC | | 3,320,487 | 2,097,129 |
| DP Poland PLC (a) | | 42,210,188 | 5,987,072 |
| Dunelm Group PLC | | 313,000 | 4,483,972 |
| Games Workshop Group PLC | | 254,277 | 39,214,146 |
| GlobalData PLC (b) | | 1,200,000 | 3,141,100 |
| Grainger Trust PLC | | 1,156,700 | 3,385,720 |
| H&T Group PLC | | 600,000 | 2,854,842 |
| Harbour Energy PLC | | 875,800 | 3,121,386 |
| Hill & Smith Holdings PLC | | 515,514 | 13,527,246 |
| Howden Joinery Group PLC | | 5,297,682 | 57,517,829 |
| Inchcape PLC | | 960,300 | 8,865,933 |
| InterContinental Hotel Group PLC ADR | | 459,000 | 51,155,550 |
| J.D. Wetherspoon PLC | | 333,500 | 2,640,394 |
| Lancashire Holdings Ltd. | | 1,661,924 | 13,522,127 |
| LSL Property Services PLC | | 694,900 | 2,697,077 |
| On The Beach Group PLC (c) | | 2,387,000 | 4,462,980 |
| Oxford Instruments PLC | | 705,000 | 19,544,838 |
| Petershill Partners PLC (c) | | 2,473,300 | 6,920,557 |
| Pets At Home Group PLC | | 1,341,900 | 5,125,187 |
| Pinewood Technologies Group PLC | | 959,406 | 4,107,192 |
| Premier Foods PLC | | 2,661,300 | 6,465,159 |
| Raspberry Pi Ltd. (b) | | 350,000 | 1,578,674 |
| Rightmove PLC | | 2,124,463 | 16,129,521 |
| RS GROUP PLC | | 1,133,987 | 10,162,426 |
| Sabre Insurance Group PLC (c) | | 4,222,347 | 7,448,083 |
| Sage Group PLC | | 1,525,000 | 19,062,391 |
| SigmaRoc PLC (a) | | 21,000,000 | 21,121,191 |
| Softcat PLC | | 280,945 | 6,140,384 |
| Spectris PLC | | 2,671,706 | 86,676,988 |
| Spirax-Sarco Engineering PLC | | 57,897 | 4,818,999 |
| Synthomer PLC (a)(b) | | 1,675,895 | 3,889,769 |
| Unite Group PLC | | 1,599,074 | 18,052,162 |
| Vistry Group PLC (a) | | 527,500 | 6,186,281 |
TOTAL UNITED KINGDOM | | | 626,205,269 |
| United States of America - 2.7% | | | |
| Morningstar, Inc. | | 242,746 | 79,632,825 |
| PriceSmart, Inc. | | 209,112 | 17,373,025 |
| Ramaco Resources, Inc. Class A (b) | | 370,000 | 3,755,500 |
| Smurfit Westrock PLC | | 120,000 | 6,212,570 |
TOTAL UNITED STATES OF AMERICA | | | 106,973,920 |
| TOTAL COMMON STOCKS (Cost $2,819,287,533) | | | 3,778,609,641 |
| | | | |
| Investment Companies - 0.4% |
| | | Shares | Value ($) |
| United States of America - 0.4% | | | |
iShares MSCI EAFE Small-Cap ETF (Cost $12,360,813) | | 225,000 | 14,278,500 |
| | | | |
| Money Market Funds - 3.4% |
| | | Shares | Value ($) |
| Fidelity Cash Central Fund 4.87% (e) | | 105,718,429 | 105,739,573 |
| Fidelity Securities Lending Cash Central Fund 4.87% (e)(f) | | 28,488,175 | 28,491,024 |
| TOTAL MONEY MARKET FUNDS (Cost $134,229,703) | | | 134,230,597 |
| | | | |
| TOTAL INVESTMENT IN SECURITIES - 100.5% (Cost $2,965,878,049) | 3,927,118,738 |
NET OTHER ASSETS (LIABILITIES) - (0.5)% | (20,072,301) |
| NET ASSETS - 100.0% | 3,907,046,437 |
| | |
Security Type Abbreviations
Legend
| (b) | Security or a portion of the security is on loan at period end. |
| (c) | Security exempt from registration under Rule 144A of the Securities Act of 1933. These securities may be resold in transactions exempt from registration, normally to qualified institutional buyers. At the end of the period, the value of these securities amounted to $107,953,068 or 2.8% of net assets. |
| (e) | Affiliated fund that is generally available only to investment companies and other accounts managed by Fidelity Investments. The rate quoted is the annualized seven-day yield of the fund at period end. A complete unaudited listing of the fund's holdings as of its most recent quarter end is available upon request. In addition, each Fidelity Central Fund's financial statements, which are not covered by the Fund's Report of Independent Registered Public Accounting Firm, are available on the SEC's website or upon request. |
| (f) | Investment made with cash collateral received from securities on loan. |
Affiliated Central Funds
Fiscal year to date information regarding the Fund's investments in Fidelity Central Funds, including the ownership percentage, is presented below.
| Affiliate | Value, beginning of period ($) | Purchases ($) | Sales Proceeds ($) | Dividend Income ($) | Realized Gain (loss) ($) | Change in Unrealized appreciation (depreciation) ($) | Value, end of period ($) | % ownership, end of period |
| Fidelity Cash Central Fund 4.87% | 133,243,313 | 923,031,788 | 950,535,328 | 4,094,140 | (133) | (67) | 105,739,573 | 0.2% |
| Fidelity Securities Lending Cash Central Fund 4.87% | 25,436,981 | 495,764,326 | 492,710,283 | 664,566 | - | - | 28,491,024 | 0.1% |
| Total | 158,680,294 | 1,418,796,114 | 1,443,245,611 | 4,758,706 | (133) | (67) | 134,230,597 | |
| | | | | | | | | |
Amounts in the dividend income column in the above table include any capital gain distributions from underlying funds, which are presented in the corresponding line item in the Statement of Operations, if applicable.
Amounts in the dividend income column for Fidelity Securities Lending Cash Central Fund represents the income earned on investing cash collateral, less rebates paid to borrowers and any lending agent fees associated with the loan, plus any premium payments received for lending certain types of securities.
Amounts included in the purchases and sales proceeds columns may include in-kind transactions, if applicable.
Other Affiliated Issuers
An affiliated company is a company in which the Fund has ownership of at least 5% of the voting securities. Fiscal year to date transactions with companies which are or were affiliates are presented in the table below. Certain corporate actions, such as mergers, are excluded from the amounts in this table if applicable. A dash in the Value end of period ($) column means either the issuer is no longer held at period end, or the issuer is held at period end but is no longer an affiliate.
| Affiliate | Value, beginning of period ($) | Purchases ($) | Sales Proceeds ($) | Dividend Income ($) | Realized Gain (loss) ($) | Change in Unrealized appreciation (depreciation) ($) | Value, end of period ($) |
| Addcn Technology Co. Ltd. | 13,841,044 | 6,731,918 | - | 743,509 | - | 51,774 | 20,624,736 |
| Broadleaf Co. Ltd. | 22,027,448 | - | 5,989,477 | 49,541 | (2,749,092) | 3,936,716 | - |
| Curves Holdings Co. Ltd. | 25,681,624 | 266,743 | 3,283,693 | 539,626 | (1,985,048) | 7,398,523 | 28,078,149 |
| Digital Hearts Holdings Co. Ltd. | 7,796,576 | 521,550 | 1,749,671 | 157,824 | (3,162,949) | 2,224,612 | - |
| Koshidaka Holdings Co. Ltd. | 31,643,463 | 5,702,170 | - | 575,681 | - | 3,660,862 | 41,006,495 |
| NS Tool Co. Ltd. | 10,284,096 | 346,467 | 246,387 | 247,364 | (364,028) | (3,045,226) | 6,974,922 |
| YAKUODO Holdings Co. Ltd. | 15,137,096 | 3,336,020 | 1,620,671 | 141,585 | (654,810) | (3,418,705) | - |
| Total | 126,411,347 | 16,904,868 | 12,889,899 | 2,455,130 | (8,915,927) | 10,808,556 | 96,684,302 |
Amounts included in the purchases and sales proceeds columns may include in-kind transactions, if applicable.
Investment Valuation
The following is a summary of the inputs used, as of October 31, 2024, involving the Fund's assets and liabilities carried at fair value. The inputs or methodology used for valuing securities may not be an indication of the risk associated with investing in those securities. For more information on valuation inputs, and their aggregation into the levels used below, please refer to the Investment Valuation section in the accompanying Notes to Financial Statements.
| Valuation Inputs at Reporting Date: |
| Description | Total ($) | Level 1 ($) | Level 2 ($) | Level 3 ($) |
Investments in Securities: | | | | |
|
| Equities: | | | | |
Communication Services | 309,701,354 | 266,777,903 | 42,923,451 | - |
Consumer Discretionary | 443,427,366 | 253,771,522 | 189,655,844 | - |
Consumer Staples | 166,994,879 | 44,014,826 | 122,980,053 | - |
Energy | 92,303,466 | 59,891,501 | 32,411,965 | - |
Financials | 299,019,813 | 245,521,352 | 53,498,461 | - |
Health Care | 202,121,679 | 125,654,948 | 76,466,731 | - |
Industrials | 1,172,540,798 | 917,015,056 | 255,525,742 | - |
Information Technology | 723,307,868 | 397,197,904 | 326,109,964 | - |
Materials | 242,435,193 | 94,020,059 | 148,415,134 | - |
Real Estate | 123,948,630 | 82,197,577 | 41,751,053 | - |
Utilities | 2,808,595 | - | 2,808,595 | - |
|
| Investment Companies | 14,278,500 | 14,278,500 | - | - |
|
| Money Market Funds | 134,230,597 | 134,230,597 | - | - |
| Total Investments in Securities: | 3,927,118,738 | 2,634,571,745 | 1,292,546,993 | - |
Fidelity® Series International Small Cap Fund
Financial Statements
| Statement of Assets and Liabilities |
As of October 31, 2024 |
| Assets | | | | |
| Investment in securities, at value (including securities loaned of $26,645,361) - See accompanying schedule: | | | | |
Unaffiliated issuers (cost $2,743,293,557) | $ | 3,696,203,839 | | |
Fidelity Central Funds (cost $134,229,703) | | 134,230,597 | | |
Other affiliated issuers (cost $88,354,789) | | 96,684,302 | | |
| | | | | |
| | | | | |
| Total Investment in Securities (cost $2,965,878,049) | | | $ | 3,927,118,738 |
| Cash | | | | 401,504 |
| Foreign currency held at value (cost $5,693) | | | | 5,693 |
| Receivable for investments sold | | | | 20,503,776 |
| Receivable for fund shares sold | | | | 277,757 |
| Dividends receivable | | | | 11,282,567 |
| Reclaims receivable | | | | 5,173,888 |
| Distributions receivable from Fidelity Central Funds | | | | 396,394 |
| Other receivables | | | | 10,274 |
Total assets | | | | 3,965,170,591 |
| Liabilities | | | | |
| Payable for investments purchased | $ | 9,817,017 | | |
| Payable for fund shares redeemed | | 19,709,331 | | |
| Other payables and accrued expenses | | 106,782 | | |
| Collateral on securities loaned | | 28,491,024 | | |
| Total liabilities | | | | 58,124,154 |
| Net Assets | | | $ | 3,907,046,437 |
| Net Assets consist of: | | | | |
| Paid in capital | | | $ | 2,649,524,094 |
| Total accumulated earnings (loss) | | | | 1,257,522,343 |
| Net Assets | | | $ | 3,907,046,437 |
Net Asset Value, offering price and redemption price per share ($3,907,046,437 ÷ 218,986,066 shares) | | | $ | 17.84 |
| Statement of Operations |
| Year ended October 31, 2024 |
| Investment Income | | | | |
| Dividends (including $2,455,130 earned from affiliated issuers) | | | $ | 95,388,280 |
| Income from Fidelity Central Funds (including $664,566 from security lending) | | | | 4,758,706 |
| Income before foreign taxes withheld | | | $ | 100,146,986 |
| Less foreign taxes withheld | | | | (8,208,156) |
| Total income | | | | 91,938,830 |
| Expenses | | | | |
| Custodian fees and expenses | $ | 309,955 | | |
| Independent trustees' fees and expenses | | 17,720 | | |
| Interest | | 3,840 | | |
| Miscellaneous | | 86 | | |
| Total expenses | | | | 331,601 |
| Net Investment income (loss) | | | | 91,607,229 |
| Realized and Unrealized Gain (Loss) | | | | |
| Net realized gain (loss) on: | | | | |
| Investment Securities: | | | | |
| Unaffiliated issuers (net of foreign taxes of $42,573) | | 278,345,846 | | |
| Fidelity Central Funds | | (133) | | |
| Other affiliated issuers | | (8,915,927) | | |
| Foreign currency transactions | | (405,085) | | |
| Total net realized gain (loss) | | | | 269,024,701 |
| Change in net unrealized appreciation (depreciation) on: | | | | |
| Investment Securities: | | | | |
| Unaffiliated issuers (net of increase in deferred foreign taxes of $152,968) | | 551,881,261 | | |
| Fidelity Central Funds | | (67) | | |
| Other affiliated issuers | | 10,808,556 | | |
| Assets and liabilities in foreign currencies | | (417,981) | | |
| Total change in net unrealized appreciation (depreciation) | | | | 562,271,769 |
| Net gain (loss) | | | | 831,296,470 |
| Net increase (decrease) in net assets resulting from operations | | | $ | 922,903,699 |
| Statement of Changes in Net Assets |
| |
| | Year ended October 31, 2024 | | Year ended October 31, 2023 |
| Increase (Decrease) in Net Assets | | | | |
| Operations | | | | |
| Net investment income (loss) | $ | 91,607,229 | $ | 74,884,949 |
| Net realized gain (loss) | | 269,024,701 | | 47,300,034 |
| Change in net unrealized appreciation (depreciation) | | 562,271,769 | | 93,637,886 |
| Net increase (decrease) in net assets resulting from operations | | 922,903,699 | | 215,822,869 |
| Distributions to shareholders | | (133,792,393) | | (211,666,578) |
| | | | | |
| Share transactions | | | | |
| Proceeds from sales of shares | | 459,760,468 | | 786,276,246 |
| Reinvestment of distributions | | 133,792,393 | | 211,666,578 |
| Cost of shares redeemed | | (893,921,187) | | (830,053,983) |
| | | | | |
Net increase (decrease) in net assets resulting from share transactions | | (300,368,326) | | 167,888,841 |
| Total increase (decrease) in net assets | | 488,742,980 | | 172,045,132 |
| | | | | |
| Net Assets | | | | |
| Beginning of period | | 3,418,303,457 | | 3,246,258,325 |
| End of period | $ | 3,907,046,437 | $ | 3,418,303,457 |
| | | | | |
| Other Information | | | | |
| Shares | | | | |
| Sold | | 26,690,757 | | 51,964,278 |
| Issued in reinvestment of distributions | | 8,425,214 | | 14,026,944 |
| Redeemed | | (51,491,124) | | (54,776,134) |
| Net increase (decrease) | | (16,375,153) | | 11,215,088 |
| | | | | |
Financial Highlights
Fidelity® Series International Small Cap Fund |
| |
| Years ended October 31, | | 2024 | | 2023 | | 2022 | | 2021 | | 2020 |
Selected Per-Share Data | | | | | | | | | | |
| Net asset value, beginning of period | $ | 14.52 | $ | 14.48 | $ | 24.12 | $ | 17.55 | $ | 16.71 |
| Income from Investment Operations | | | | | | | | | | |
Net investment income (loss) A,B | | .40 | | .32 | | .35 | | .29 | | .22 |
| Net realized and unrealized gain (loss) | | 3.49 | | .67 | | (7.16) | | 6.45 | | 1.36 |
| Total from investment operations | | 3.89 | | .99 | | (6.81) | | 6.74 | | 1.58 |
| Distributions from net investment income | | (.37) | | (.21) | | (.47) | | (.17) | | (.36) |
| Distributions from net realized gain | | (.20) | | (.73) | | (2.35) | | - | | (.38) |
| Total distributions | | (.57) | | (.95) C | | (2.83) C | | (.17) | | (.74) |
| Net asset value, end of period | $ | 17.84 | $ | 14.52 | $ | 14.48 | $ | 24.12 | $ | 17.55 |
Total Return D | | | | 6.57% | | (31.82)% | | 38.60% | | 9.60% |
Ratios to Average Net Assets B,E,F | | | | | | | | | | |
| Expenses before reductions | | .01% | | .01% | | .01% | | .01% | | .01% |
| Expenses net of fee waivers, if any | | | | .01% | | .01% | | .01% | | .01% |
| Expenses net of all reductions | | .01% | | .01% | | .01% | | .01% | | .01% |
| Net investment income (loss) | | 2.32% | | 2.02% | | 2.03% | | 1.34% | | 1.36% |
| Supplemental Data | | | | | | | | | | |
| Net assets, end of period (000 omitted) | $ | 3,907,046 | $ | 3,418,303 | $ | 3,246,258 | $ | 4,847,936 | $ | 3,653,041 |
Portfolio turnover rate G | | | | 26% | | 25% | | 32% | | 24% H |
ACalculated based on average shares outstanding during the period.
BNet investment income (loss) is affected by the timing of the declaration of dividends by any underlying mutual funds or exchange-traded funds (ETFs). Net investment income (loss) of any mutual funds or ETFs is not included in the Fund's net investment income (loss) ratio.
CTotal distributions per share do not sum due to rounding.
DTotal returns would have been lower if certain expenses had not been reduced during the applicable periods shown.
EFees and expenses of any underlying mutual funds or exchange-traded funds (ETFs) are not included in the Fund's expense ratio. The Fund indirectly bears its proportionate share of these expenses. For additional expense information related to investments in Fidelity Central Funds, please refer to the "Investments in Fidelity Central Funds" note found in the Notes to Financial Statements section of the most recent Annual or Semi-Annual report.
FExpense ratios reflect operating expenses of the class. Expenses before reductions do not reflect amounts reimbursed, waived, or reduced through arrangements with the investment adviser, brokerage services, or other offset arrangements, if applicable, and do not represent the amount paid by the class during periods when reimbursements, waivers or reductions occur.
GAmount does not include the portfolio activity of any underlying mutual funds or exchange-traded funds (ETFs).
HPortfolio turnover rate excludes securities received or delivered in-kind.
Fidelity® Series International Value Fund
Schedule of Investments October 31, 2024
Showing Percentage of Net Assets
| Common Stocks - 96.5% |
| | | Shares | Value ($) |
| Australia - 6.1% | | | |
| BHP Group Ltd. | | 11,357,239 | 315,533,402 |
| Commonwealth Bank of Australia | | 905,087 | 84,421,453 |
| Glencore PLC | | 48,671,427 | 255,264,141 |
| Macquarie Group Ltd. | | 1,278,323 | 193,469,555 |
| Woodside Energy Group Ltd. | | 4,119,514 | 64,834,803 |
TOTAL AUSTRALIA | | | 913,523,354 |
| Belgium - 1.9% | | | |
| KBC Group NV | | 1,786,087 | 129,546,980 |
| UCB SA | | 844,200 | 162,351,648 |
TOTAL BELGIUM | | | 291,898,628 |
| Denmark - 0.4% | | | |
| DSV A/S | | 280,640 | 60,995,796 |
| Finland - 1.1% | | | |
| Mandatum Holding OY | | 2,643,387 | 12,202,961 |
| Sampo Oyj (A Shares) | | 3,458,467 | 153,111,262 |
TOTAL FINLAND | | | 165,314,223 |
| France - 9.8% | | | |
| Air Liquide SA | | 1,093,388 | 196,046,003 |
| Alten SA | | 502,708 | 42,487,963 |
| AXA SA | | 9,182,579 | 344,797,853 |
| BNP Paribas SA | | 2,908,070 | 198,603,823 |
| Capgemini SA | | 477,028 | 82,755,222 |
| Danone SA | | 2,695,200 | 192,541,172 |
| TotalEnergies SE | | 4,755,067 | 298,407,570 |
| Vivendi SA | | 11,146,955 | 118,753,232 |
TOTAL FRANCE | | | 1,474,392,838 |
| Germany - 11.1% | | | |
| Bayer AG | | 1,103,282 | 29,730,069 |
| Bayerische Motoren Werke AG (BMW) | | 586,400 | 46,129,789 |
| Commerzbank AG | | 914,500 | 16,244,225 |
| Covestro AG (a)(b) | | 715,100 | 45,270,871 |
| Daimler Truck Holding AG | | 1,252,800 | 51,797,489 |
| Deutsche Post AG ADR | | 3,029,907 | 121,709,943 |
| Fresenius SE & Co. KGaA (a) | | 3,414,700 | 124,504,674 |
| Hannover Reuck SE | | 612,463 | 160,888,901 |
| Muenchener Rueckversicherungs-Gesellschaft AG in Muenchen | | 479,991 | 245,457,923 |
| Rheinmetall AG | | 617,681 | 317,934,803 |
| RWE AG | | 2,947,500 | 95,446,881 |
| Siemens AG | | 1,372,087 | 266,939,342 |
| Vonovia SE | | 4,235,470 | 138,951,116 |
TOTAL GERMANY | | | 1,661,006,026 |
| Hong Kong - 0.7% | | | |
| Prudential PLC | | 11,934,876 | 99,356,053 |
| India - 0.6% | | | |
| Reliance Industries Ltd. GDR (b) | | 1,535,800 | 96,141,080 |
| Indonesia - 0.6% | | | |
| PT Bank Central Asia Tbk | | 147,482,400 | 95,450,102 |
| Ireland - 0.4% | | | |
| Bank of Ireland Group PLC | | 6,655,900 | 61,264,501 |
| Italy - 5.0% | | | |
| Eni SpA | | 11,691,700 | 178,101,869 |
| Mediobanca SpA | | 12,384,455 | 204,357,966 |
| Prysmian SpA | | 1,746,200 | 123,120,991 |
| Ryanair Holdings PLC sponsored ADR (c) | | 1,672,000 | 74,002,720 |
| UniCredit SpA | | 3,700,700 | 163,716,059 |
TOTAL ITALY | | | 743,299,605 |
| Japan - 22.6% | | | |
| DENSO Corp. | | 11,502,584 | 163,376,893 |
| Eisai Co. Ltd. | | 541,200 | 18,335,919 |
| FUJIFILM Holdings Corp. | | 5,747,047 | 136,712,599 |
| Fujitsu Ltd. | | 6,431,600 | 123,652,919 |
| Hitachi Ltd. | | 16,369,500 | 411,281,398 |
| Hoya Corp. | | 515,609 | 68,985,415 |
| Ibiden Co. Ltd. | | 1,568,944 | 49,837,046 |
| INPEX Corp. | | 5,141,200 | 67,771,587 |
| Itochu Corp. | | 5,853,253 | 289,547,727 |
| LY Corp. | | 11,627,600 | 31,717,617 |
| Minebea Mitsumi, Inc. | | 2,551,651 | 44,920,487 |
| Mitsubishi Heavy Industries Ltd. | | 17,213,800 | 243,006,385 |
| Mitsubishi UFJ Financial Group, Inc. | | 27,905,444 | 294,130,185 |
| Mitsui & Co. Ltd. | | 3,290,300 | 67,081,483 |
| Nintendo Co. Ltd. | | 1,096,100 | 57,899,273 |
| NOF Corp. | | 3,095,400 | 50,289,413 |
| ORIX Corp. | | 7,646,533 | 161,111,544 |
| Renesas Electronics Corp. | | 8,722,560 | 116,867,658 |
| Shin-Etsu Chemical Co. Ltd. | | 6,064,610 | 222,231,353 |
| SoftBank Group Corp. | | 1,709,737 | 101,931,940 |
| Sony Group Corp. | | 5,101,025 | 89,765,373 |
| Sumitomo Forestry Co. Ltd. | | 1,649,400 | 63,541,270 |
| Sumitomo Mitsui Financial Group, Inc. | | 13,291,249 | 281,967,756 |
| TIS, Inc. | | 2,250,456 | 56,118,417 |
| Tokio Marine Holdings, Inc. | | 5,199,525 | 187,266,950 |
TOTAL JAPAN | | | 3,399,348,607 |
| Korea (South) - 0.3% | | | |
| Samsung Electronics Co. Ltd. | | 1,187,513 | 50,588,122 |
| Netherlands - 0.3% | | | |
| Universal Music Group NV | | 1,800,853 | 45,320,619 |
| Singapore - 1.2% | | | |
| United Overseas Bank Ltd. | | 7,313,689 | 177,788,840 |
| South Africa - 1.1% | | | |
| Anglo American PLC (United Kingdom) | | 5,350,545 | 165,869,133 |
| Thungela Resources Ltd. | | 707,874 | 5,056,735 |
TOTAL SOUTH AFRICA | | | 170,925,868 |
| Spain - 3.4% | | | |
| Banco Santander SA (Spain) | | 73,590,572 | 359,576,266 |
| Bankinter SA | | 7,724,300 | 62,931,784 |
| Cellnex Telecom SA (b) | | 2,392,638 | 87,707,350 |
TOTAL SPAIN | | | 510,215,400 |
| Sweden - 1.8% | | | |
| Investor AB (B Shares) | | 9,519,260 | 269,329,153 |
| Switzerland - 3.3% | | | |
| Swiss Life Holding AG | | 161,700 | 131,899,114 |
| UBS Group AG (c) | | 2,341,129 | 71,825,838 |
| Zurich Insurance Group Ltd. | | 488,250 | 287,874,750 |
TOTAL SWITZERLAND | | | 491,599,702 |
| United Kingdom - 14.7% | | | |
| AstraZeneca PLC (United Kingdom) | | 1,219,859 | 173,578,133 |
| B&M European Value Retail SA | | 6,535,900 | 32,665,828 |
| BAE Systems PLC | | 19,623,109 | 316,271,719 |
| Barratt Developments PLC | | 36,274,224 | 208,798,234 |
| Beazley PLC | | 8,566,017 | 83,448,379 |
| Bunzl PLC | | 1,878,600 | 82,650,949 |
| Flutter Entertainment PLC (a) | | 199,200 | 46,594,121 |
| HSBC Holdings PLC (United Kingdom) | | 23,915,600 | 219,497,933 |
| Imperial Brands PLC | | 4,519,914 | 136,402,086 |
| JD Sports Fashion PLC | | 23,537,300 | 37,634,213 |
| Lloyds Banking Group PLC | | 281,987,400 | 193,556,249 |
| London Stock Exchange Group PLC | | 916,800 | 124,259,307 |
| Rolls-Royce Holdings PLC (a) | | 17,110,800 | 118,071,343 |
| Standard Chartered PLC (United Kingdom) | | 15,274,022 | 177,123,435 |
| Unilever PLC | | 4,210,279 | 256,835,567 |
TOTAL UNITED KINGDOM | | | 2,207,387,496 |
| United States of America - 10.1% | | | |
| CRH PLC | | 3,394,128 | 323,901,635 |
| Ferguson Enterprises, Inc. | | 584,295 | 115,423,819 |
| GSK PLC | | 7,450,198 | 134,539,963 |
| Holcim AG | | 1,938,960 | 191,033,196 |
| Linde PLC | | 406,714 | 185,522,591 |
| Shell PLC ADR | | 8,299,148 | 560,607,448 |
TOTAL UNITED STATES OF AMERICA | | | 1,511,028,652 |
| TOTAL COMMON STOCKS (Cost $10,327,912,023) | | | 14,496,174,665 |
| | | | |
| Nonconvertible Preferred Stocks - 0.5% |
| | | Shares | Value ($) |
| Germany - 0.5% | | | |
Porsche Automobil Holding SE (Germany) (Cost $121,392,882) | | 1,868,477 | 77,622,634 |
| | | | |
| Money Market Funds - 2.3% |
| | | Shares | Value ($) |
| Fidelity Cash Central Fund 4.87% (d) | | 315,580,093 | 315,643,209 |
| Fidelity Securities Lending Cash Central Fund 4.87% (d)(e) | | 24,878,428 | 24,880,916 |
| TOTAL MONEY MARKET FUNDS (Cost $340,524,125) | | | 340,524,125 |
| | | | |
| TOTAL INVESTMENT IN SECURITIES - 99.3% (Cost $10,789,829,030) | 14,914,321,424 |
NET OTHER ASSETS (LIABILITIES) - 0.7% | 100,911,828 |
| NET ASSETS - 100.0% | 15,015,233,252 |
| | |
Legend
| (b) | Security exempt from registration under Rule 144A of the Securities Act of 1933. These securities may be resold in transactions exempt from registration, normally to qualified institutional buyers. At the end of the period, the value of these securities amounted to $229,119,301 or 1.5% of net assets. |
| (c) | Security or a portion of the security is on loan at period end. |
| (d) | Affiliated fund that is generally available only to investment companies and other accounts managed by Fidelity Investments. The rate quoted is the annualized seven-day yield of the fund at period end. A complete unaudited listing of the fund's holdings as of its most recent quarter end is available upon request. In addition, each Fidelity Central Fund's financial statements, which are not covered by the Fund's Report of Independent Registered Public Accounting Firm, are available on the SEC's website or upon request. |
| (e) | Investment made with cash collateral received from securities on loan. |
Affiliated Central Funds
Fiscal year to date information regarding the Fund's investments in Fidelity Central Funds, including the ownership percentage, is presented below.
| Affiliate | Value, beginning of period ($) | Purchases ($) | Sales Proceeds ($) | Dividend Income ($) | Realized Gain (loss) ($) | Change in Unrealized appreciation (depreciation) ($) | Value, end of period ($) | % ownership, end of period |
| Fidelity Cash Central Fund 4.87% | 292,175,622 | 2,918,084,372 | 2,894,616,486 | 15,676,759 | (299) | - | 315,643,209 | 0.6% |
| Fidelity Securities Lending Cash Central Fund 4.87% | 171,028,158 | 1,851,455,624 | 1,997,602,866 | 711,338 | - | - | 24,880,916 | 0.1% |
| Total | 463,203,780 | 4,769,539,996 | 4,892,219,352 | 16,388,097 | (299) | - | 340,524,125 | |
| | | | | | | | | |
Amounts in the dividend income column in the above table include any capital gain distributions from underlying funds, which are presented in the corresponding line item in the Statement of Operations, if applicable.
Amounts in the dividend income column for Fidelity Securities Lending Cash Central Fund represents the income earned on investing cash collateral, less rebates paid to borrowers and any lending agent fees associated with the loan, plus any premium payments received for lending certain types of securities.
Amounts included in the purchases and sales proceeds columns may include in-kind transactions, if applicable.
Investment Valuation
The following is a summary of the inputs used, as of October 31, 2024, involving the Fund's assets and liabilities carried at fair value. The inputs or methodology used for valuing securities may not be an indication of the risk associated with investing in those securities. For more information on valuation inputs, and their aggregation into the levels used below, please refer to the Investment Valuation section in the accompanying Notes to Financial Statements.
| Valuation Inputs at Reporting Date: |
| Description | Total ($) | Level 1 ($) | Level 2 ($) | Level 3 ($) |
Investments in Securities: | | | | |
|
| Equities: | | | | |
Communication Services | 443,330,031 | 206,460,582 | 236,869,449 | - |
Consumer Discretionary | 766,128,355 | 371,822,185 | 394,306,170 | - |
Consumer Staples | 585,778,825 | - | 585,778,825 | - |
Energy | 1,270,921,092 | 661,805,263 | 609,115,829 | - |
Financials | 5,246,477,100 | 2,061,425,183 | 3,185,051,917 | - |
Health Care | 712,025,821 | 286,856,322 | 425,169,499 | - |
Industrials | 2,704,756,394 | 825,926,567 | 1,878,829,827 | - |
Information Technology | 659,019,946 | 42,487,963 | 616,531,983 | - |
Materials | 1,950,961,738 | 745,728,293 | 1,205,233,445 | - |
Real Estate | 138,951,116 | 138,951,116 | - | - |
Utilities | 95,446,881 | 95,446,881 | - | - |
|
| Money Market Funds | 340,524,125 | 340,524,125 | - | - |
| Total Investments in Securities: | 14,914,321,424 | 5,777,434,480 | 9,136,886,944 | - |
Fidelity® Series International Value Fund
Financial Statements
| Statement of Assets and Liabilities |
As of October 31, 2024 |
| Assets | | | | |
| Investment in securities, at value (including securities loaned of $23,871,587) - See accompanying schedule: | | | | |
Unaffiliated issuers (cost $10,449,304,905) | $ | 14,573,797,299 | | |
Fidelity Central Funds (cost $340,524,125) | | 340,524,125 | | |
| | | | | |
| | | | | |
| Total Investment in Securities (cost $10,789,829,030) | | | $ | 14,914,321,424 |
| Cash | | | | 652,895 |
| Foreign currency held at value (cost $35,076) | | | | 35,078 |
| Receivable for investments sold | | | | 26,183,270 |
| Receivable for fund shares sold | | | | 64,818,901 |
| Dividends receivable | | | | 48,606,274 |
| Reclaims receivable | | | | 42,343,758 |
| Distributions receivable from Fidelity Central Funds | | | | 1,182,005 |
| Other receivables | | | | 154,138 |
Total assets | | | | 15,098,297,743 |
| Liabilities | | | | |
| Payable for investments purchased | $ | 24,188,046 | | |
| Payable for fund shares redeemed | | 33,662,167 | | |
| Other payables and accrued expenses | | 333,362 | | |
| Collateral on securities loaned | | 24,880,916 | | |
| Total liabilities | | | | 83,064,491 |
| Net Assets | | | $ | 15,015,233,252 |
| Net Assets consist of: | | | | |
| Paid in capital | | | $ | 11,101,709,583 |
| Total accumulated earnings (loss) | | | | 3,913,523,669 |
| Net Assets | | | $ | 15,015,233,252 |
Net Asset Value, offering price and redemption price per share ($15,015,233,252 ÷ 1,165,844,679 shares) | | | $ | 12.88 |
| Statement of Operations |
| Year ended October 31, 2024 |
| Investment Income | | | | |
| Dividends | | | $ | 499,567,694 |
| Income from Fidelity Central Funds (including $711,338 from security lending) | | | | 16,388,097 |
| Income before foreign taxes withheld | | | $ | 515,955,791 |
| Less foreign taxes withheld | | | | (25,529,362) |
| Total income | | | | 490,426,429 |
| Expenses | | | | |
| Custodian fees and expenses | $ | 797,711 | | |
| Independent trustees' fees and expenses | | 66,982 | | |
| Interest | | 6,993 | | |
| Miscellaneous | | 86 | | |
| Total expenses before reductions | | 871,772 | | |
| Expense reductions | | (2,251) | | |
| Total expenses after reductions | | | | 869,521 |
| Net Investment income (loss) | | | | 489,556,908 |
| Realized and Unrealized Gain (Loss) | | | | |
| Net realized gain (loss) on: | | | | |
| Investment Securities: | | | | |
| Unaffiliated issuers | | 623,833,092 | | |
| Redemptions in-kind | | 252,285,154 | | |
| Fidelity Central Funds | | (299) | | |
| Foreign currency transactions | | (1,780,233) | | |
| Total net realized gain (loss) | | | | 874,337,714 |
| Change in net unrealized appreciation (depreciation) on: | | | | |
| Investment Securities: | | | | |
| Unaffiliated issuers | | 1,872,543,282 | | |
| Assets and liabilities in foreign currencies | | 400,663 | | |
| Total change in net unrealized appreciation (depreciation) | | | | 1,872,943,945 |
| Net gain (loss) | | | | 2,747,281,659 |
| Net increase (decrease) in net assets resulting from operations | | | $ | 3,236,838,567 |
| Statement of Changes in Net Assets |
| |
| | Year ended October 31, 2024 | | Year ended October 31, 2023 |
| Increase (Decrease) in Net Assets | | | | |
| Operations | | | | |
| Net investment income (loss) | $ | 489,556,908 | $ | 459,683,466 |
| Net realized gain (loss) | | 874,337,714 | | 190,312,862 |
| Change in net unrealized appreciation (depreciation) | | 1,872,943,945 | | 1,675,747,717 |
| Net increase (decrease) in net assets resulting from operations | | 3,236,838,567 | | 2,325,744,045 |
| Distributions to shareholders | | (464,306,298) | | (425,784,758) |
| | | | | |
| Share transactions | | | | |
| Proceeds from sales of shares | | 2,566,225,333 | | 1,992,285,965 |
| Reinvestment of distributions | | 464,306,298 | | 425,784,758 |
| Cost of shares redeemed | | (3,574,593,160) | | (3,899,245,756) |
| | | | | |
Net increase (decrease) in net assets resulting from share transactions | | (544,061,529) | | (1,481,175,033) |
| Total increase (decrease) in net assets | | 2,228,470,740 | | 418,784,254 |
| | | | | |
| Net Assets | | | | |
| Beginning of period | | 12,786,762,512 | | 12,367,978,258 |
| End of period | $ | 15,015,233,252 | $ | 12,786,762,512 |
| | | | | |
| Other Information | | | | |
| Shares | | | | |
| Sold | | 209,265,440 | | 187,826,877 |
| Issued in reinvestment of distributions | | 41,345,609 | | 42,493,489 |
| Redeemed | | (286,259,687) | | (368,035,186) |
| Net increase (decrease) | | (35,648,638) | | (137,714,820) |
| | | | | |
Financial Highlights
Fidelity® Series International Value Fund |
| |
| Years ended October 31, | | 2024 | | 2023 | | 2022 | | 2021 | | 2020 |
Selected Per-Share Data | | | | | | | | | | |
| Net asset value, beginning of period | $ | 10.64 | $ | 9.24 | $ | 11.62 | $ | 8.25 | $ | 9.82 |
| Income from Investment Operations | | | | | | | | | | |
Net investment income (loss) A,B | | .40 | | .37 | | .42 | | .43 C | | .26 |
| Net realized and unrealized gain (loss) | | 2.22 | | 1.36 | | (2.24) | | 3.23 | | (1.43) |
| Total from investment operations | | 2.62 | | 1.73 | | (1.82) | | 3.66 | | (1.17) |
| Distributions from net investment income | | (.38) | | (.33) | | (.56) | | (.29) | | (.36) |
| Distributions from net realized gain | | - | | - | | - | | - | | (.04) |
| Total distributions | | (.38) | | (.33) | | (.56) | | (.29) | | (.40) |
| Net asset value, end of period | $ | 12.88 | $ | 10.64 | $ | 9.24 | $ | 11.62 | $ | 8.25 |
Total Return D | | | | 18.99% | | (16.40)% | | 44.95% | | (12.55)% |
Ratios to Average Net Assets B,E,F | | | | | | | | | | |
| Expenses before reductions | | .01% | | .01% | | .01% | | .01% | | .01% |
| Expenses net of fee waivers, if any | | | | .01% | | .01% | | .01% | | .01% |
| Expenses net of all reductions | | .01% | | .01% | | .01% | | .01% | | .01% |
| Net investment income (loss) | | 3.25% | | 3.42% | | 4.09% | | 3.97% C | | 2.92% |
| Supplemental Data | | | | | | | | | | |
| Net assets, end of period (000 omitted) | $ | 15,015,233 | $ | 12,786,763 | $ | 12,367,978 | $ | 15,330,482 | $ | 11,605,710 |
Portfolio turnover rate G | | | | 30% H | | 31% H | | 34% | | 36% H |
ACalculated based on average shares outstanding during the period.
BNet investment income (loss) is affected by the timing of the declaration of dividends by any underlying mutual funds or exchange-traded funds (ETFs). Net investment income (loss) of any mutual funds or ETFs is not included in the Fund's net investment income (loss) ratio.
CNet investment income per share reflects one or more large, non-recurring dividend(s) which amounted to $.11 per share. Excluding such non-recurring dividend(s), the ratio of net investment income (loss) to average net assets would have been 3.00%.
DTotal returns would have been lower if certain expenses had not been reduced during the applicable periods shown.
EFees and expenses of any underlying mutual funds or exchange-traded funds (ETFs) are not included in the Fund's expense ratio. The Fund indirectly bears its proportionate share of these expenses. For additional expense information related to investments in Fidelity Central Funds, please refer to the "Investments in Fidelity Central Funds" note found in the Notes to Financial Statements section of the most recent Annual or Semi-Annual report.
FExpense ratios reflect operating expenses of the class. Expenses before reductions do not reflect amounts reimbursed, waived, or reduced through arrangements with the investment adviser, brokerage services, or other offset arrangements, if applicable, and do not represent the amount paid by the class during periods when reimbursements, waivers or reductions occur.
GAmount does not include the portfolio activity of any underlying mutual funds or exchange-traded funds (ETFs).
HPortfolio turnover rate excludes securities received or delivered in-kind.
Notes to Financial Statements
For the period ended October 31, 2024
1. Organization.
Fidelity Series Emerging Markets Fund, Fidelity Series Emerging Markets Opportunities Fund, Fidelity Series International Growth Fund, Fidelity Series International Small Cap Fund and Fidelity Series International Value Fund (the Funds) are funds of Fidelity Investment Trust (the Trust). The Trust is registered under the Investment Company Act of 1940, as amended (the 1940 Act), as an open-end management investment company organized as a Massachusetts business trust. Each Fund is authorized to issue an unlimited number of shares. Shares are offered only to certain other Fidelity funds, Fidelity managed 529 plans, and Fidelity managed collective investment trusts. Investments in emerging markets, if applicable, can be subject to social, economic, regulatory, and political uncertainties and can be extremely volatile.
2. Investments in Fidelity Central Funds.
Funds may invest in Fidelity Central Funds, which are open-end investment companies generally available only to other investment companies and accounts managed by the investment adviser and its affiliates. The Schedule of Investments lists any Fidelity Central Funds held as an investment as of period end, but does not include the underlying holdings of each Fidelity Central Fund. An investing fund indirectly bears its proportionate share of the expenses of the underlying Fidelity Central Funds.
Based on its investment objective, each Fidelity Central Fund may invest or participate in various investment vehicles or strategies that are similar to those of the investing fund. These strategies are consistent with the investment objectives of the investing fund and may involve certain economic risks which may cause a decline in value of each of the Fidelity Central Funds and thus a decline in the value of the investing fund.
| Fidelity Central Fund | Investment Manager | Investment Objective | Investment Practices | Expense RatioA |
| Fidelity Money Market Central Funds | Fidelity Management & Research Company LLC (FMR) | Each fund seeks to obtain a high level of current income consistent with the preservation of capital and liquidity. | Short-term Investments | Less than .005% |
A Expenses expressed as a percentage of average net assets and are as of each underlying Central Fund's most recent annual or semi-annual shareholder report.
A complete unaudited list of holdings for each Fidelity Central Fund is available upon request or at the Securities and Exchange Commission website at www.sec.gov. In addition, the financial statements of the Fidelity Central Funds which contain the significant accounting policies (including investment valuation policies) of those funds, and are not covered by the Report of Independent Registered Public Accounting Firm, are available on the Securities and Exchange Commission website or upon request.
3. Significant Accounting Policies.
Each Fund is an investment company and applies the accounting and reporting guidance of the Financial Accounting Standards Board (FASB) Accounting Standards Codification Topic 946 Financial Services - Investment Companies. The financial statements have been prepared in conformity with accounting principles generally accepted in the United States of America (GAAP), which require management to make certain estimates and assumptions at the date of the financial statements. Actual results could differ from those estimates. Subsequent events, if any, through the date that the financial statements were issued have been evaluated in the preparation of the financial statements. Each Fund's Schedule of Investments lists any underlying mutual funds or exchange-traded funds (ETFs) but does not include the underlying holdings of these funds. The following summarizes the significant accounting policies of each Fund:
Investment Valuation. Investments are valued as of 4:00 p.m. Eastern time on the last calendar day of the period. The Board of Trustees (the Board) has designated each Fund's investment adviser as the valuation designee responsible for the fair valuation function and performing fair value determinations as needed. The investment adviser has established a Fair Value Committee (the Committee) to carry out the day-to-day fair valuation responsibilities and has adopted policies and procedures to govern the fair valuation process and the activities of the Committee. In accordance with these fair valuation policies and procedures, which have been approved by the Board, each Fund attempts to obtain prices from one or more third party pricing services or brokers to value its investments. When current market prices, quotations or currency exchange rates are not readily available or reliable, investments will be fair valued in good faith by the Committee, in accordance with the policies and procedures. Factors used in determining fair value vary by investment type and may include market or investment specific events, transaction data, estimated cash flows, and market observations of comparable investments. The frequency that the fair valuation procedures are used cannot be predicted and they may be utilized to a significant extent. The Committee manages each Fund's fair valuation practices and maintains the fair valuation policies and procedures. Each Fund's investment adviser reports to the Board information regarding the fair valuation process and related material matters.
Each Fund categorizes the inputs to valuation techniques used to value its investments into a disclosure hierarchy consisting of three levels as shown below:
Level 1 - unadjusted quoted prices in active markets for identical investments
Level 2 - other significant observable inputs (including quoted prices for similar investments, interest rates, prepayment speeds, etc.)
Level 3 - unobservable inputs (including the Fund's own assumptions based on the best information available)
Valuation techniques used to value each Fund's investments by major category are as follows:
Equity securities, including restricted securities, for which market quotations are readily available, are valued at the last reported sale price or official closing price as reported by a third party pricing service on the primary market or exchange on which they are traded and are categorized as Level 1 in the hierarchy. In the event there were no sales during the day or closing prices are not available, securities are valued at the last quoted bid price or may be valued using the last available price and are generally categorized as Level 2 in the hierarchy. For foreign equity securities, when market or security specific events arise, comparisons to the valuation of American Depositary Receipts (ADRs), futures contracts, Exchange-Traded Funds (ETFs) and certain indexes as well as quoted prices for similar securities may be used and would be categorized as Level 2 in the hierarchy. For equity securities, including restricted securities, where observable inputs are limited, assumptions about market activity and risk are used and these securities may be categorized as Level 3 in the hierarchy.
Debt securities, including restricted securities, are valued based on evaluated prices received from third party pricing services or from brokers who make markets in such securities. Corporate bonds and U.S. government and government agency obligations are valued by pricing services who utilize matrix pricing which considers yield or price of bonds of comparable quality, coupon, maturity and type or by broker-supplied prices. When independent prices are unavailable or unreliable, debt securities may be valued utilizing pricing methodologies which consider similar factors that would be used by third party pricing services. Debt securities are generally categorized as Level 2 in the hierarchy but may be Level 3 depending on the circumstances. Exchange-Traded Funds (ETFs) are valued at their last sale price or official closing price as reported by a third party pricing service on the primary market or exchange on which they are traded and are categorized as Level 1 in the hierarchy. In the event there were no sales during the day but the exchange reports a closing bid level, ETFs are valued at the closing bid and would be categorized as Level 1 in the hierarchy. In the event there was no closing bid, ETFs may be valued by another method that the Board believes reflects fair value in accordance with the Board's fair value pricing policies and may be categorized as Level 2 in the hierarchy.
Futures contracts are valued at the settlement price established each day by the board of trade or exchange on which they are traded and are categorized as Level 1 in the hierarchy.
Investments in open-end mutual funds, including the Fidelity Central Funds, are valued at their closing net asset value (NAV) each business day and are categorized as Level 1 in the hierarchy.
Changes in valuation techniques may result in transfers in or out of an assigned level within the disclosure hierarchy. The aggregate value of investments by input level as of October 31, 2024, as well as a roll forward of Level 3 investments, is included at the end of each Fund's Schedule of Investments.
Foreign Currency. Certain Funds may use foreign currency contracts to facilitate transactions in foreign-denominated securities. Gains and losses from these transactions may arise from changes in the value of the foreign currency or if the counterparties do not perform under the contracts' terms.
Foreign-denominated assets, including investment securities, and liabilities are translated into U.S. dollars at the exchange rates at period end. Purchases and sales of investment securities, income and dividends received, and expenses denominated in foreign currencies are translated into U.S. dollars at the exchange rate in effect on the transaction date.
The effects of exchange rate fluctuations on investments are included with the net realized and unrealized gain (loss) on investment securities. Other foreign currency transactions resulting in realized and unrealized gain (loss) are disclosed separately.
Investment Transactions and Income. For financial reporting purposes, the Funds' investment holdings and NAV include trades executed through the end of the last business day of the period. The NAV per share for processing shareholder transactions is calculated as of the close of business of the New York Stock Exchange (NYSE), normally 4:00 p.m. Eastern time and includes trades executed through the end of the prior business day. Gains and losses on securities sold are determined on the basis of identified cost and for certain Funds include proceeds received from litigation. Commissions paid to certain brokers with whom the investment adviser, or its affiliates, places trades on behalf of a fund include an amount in addition to trade execution, which may be rebated back to a fund. Any such rebates are included in net realized gain (loss) on investments in the Statement of Operations. Dividend income is recorded on the ex-dividend date, except for certain dividends from foreign securities where the ex-dividend date may have passed, which are recorded as soon as the Funds are informed of the ex-dividend date. Non-cash dividends included in dividend income, if any, are recorded at the fair market value of the securities received. Income and capital gain distributions from Fidelity Central Funds, if any, are recorded on the ex-dividend date. Certain distributions received by the Funds represent a return of capital or capital gain. The Funds determine the components of these distributions subsequent to the ex-dividend date, based upon receipt of tax filings or other correspondence relating to the underlying investment. These distributions are recorded as a reduction of cost of investments and/or as a realized gain. Interest income is accrued as earned and includes coupon interest and amortization of premium and accretion of discount on debt securities as applicable. Investment income is recorded net of foreign taxes withheld where recovery of such taxes is uncertain. Funds may file withholding tax reclaims in certain jurisdictions to recover a portion of amounts previously withheld. Any withholding tax reclaims income is included in the Statement of Operations in foreign taxes withheld. Any receivables for withholding tax reclaims are included in the Statement of Assets and Liabilities in dividends receivable or reclaims receivable, as applicable. Fidelity Series International Growth Fund, Fidelity Series International Value Fund and Fidelity Series International Small Cap Fund have filed tax reclaims for previously withheld taxes on dividends earned in certain European Union (EU) countries. These additional filings are subject to various administrative proceedings by the local jurisdictions' tax authorities within the EU, as well as a number of related judicial proceedings. Income recognized for EU reclaims is included with other reclaims in the Statement of Operations in foreign taxes withheld. These reclaims are recorded when the amount is known and there are no significant uncertainties on collectability. Fidelity Series Emerging Markets Fund did not recognize dividend income during the period on certain Russian securities due to restrictions imposed by the Russian government on these dividend payments. There is uncertainty regarding the timeline for these restrictions to be lifted and the collectability of these and future dividend payments on Russian securities.
Expenses. Expenses directly attributable to a fund are charged to that fund. Expenses attributable to more than one fund are allocated among the respective funds on the basis of relative net assets or other appropriate methods. Expenses included in the accompanying financial statements reflect the expenses of that fund and do not include any expenses associated with any underlying mutual funds or exchange-traded funds. Although not included in a fund's expenses, a fund indirectly bears its proportionate share of these expenses through the net asset value of each underlying mutual fund or exchange-traded fund. Expense estimates are accrued in the period to which they relate and adjustments are made when actual amounts are known.
Income Tax Information and Distributions to Shareholders. Each year, each Fund intends to qualify as a regulated investment company under Subchapter M of the Internal Revenue Code, including distributing substantially all of its taxable income and realized gains. As a result, no provision for U.S. Federal income taxes is required. As of October 31, 2024, each Fund did not have any unrecognized tax benefits in the financial statements; nor is each Fund aware of any tax positions for which it is reasonably possible that the total amounts of unrecognized tax benefits will significantly change in the next twelve months. Each Fund files a U.S. federal tax return, in addition to state and local tax returns as required. Each Fund's federal income tax returns are subject to examination by the Internal Revenue Service (IRS) for a period of three fiscal years after they are filed. State and local tax returns may be subject to examination for an additional fiscal year depending on the jurisdiction. Foreign taxes are provided for based on each Fund's understanding of the tax rules and rates that exist in the foreign markets in which it invests. Fidelity Series Emerging Markets Fund, Fidelity Series Emerging Markets Opportunities Fund, Fidelity Series International Growth Fund and Fidelity Series International Small Cap Fund are subject to a tax imposed on capital gains by certain countries in which they invest. An estimated deferred tax liability for net unrealized appreciation on the applicable securities is included in Other payables and accrued expenses or Deferred taxes on each applicable Fund's Statement of Assets and Liabilities.
Distributions are declared and recorded on the ex-dividend date. Income and capital gain distributions are determined in accordance with income tax regulations, which may differ from GAAP. In addition, the Funds claimed a portion of the payment made to redeeming shareholders as a distribution for income tax purposes.
Capital accounts within the financial statements are adjusted for permanent book-tax differences. These adjustments have no impact on net assets or the results of operations. Capital accounts are not adjusted for temporary book-tax differences which will reverse in a subsequent period.
Book-tax differences are primarily due to futures contracts, foreign currency transactions, certain foreign taxes, passive foreign investment companies (PFIC), redemptions in-kind, capital loss carryforwards and losses deferred due to wash sales.
As of period end, the cost and unrealized appreciation (depreciation) in securities, and derivatives if applicable, for federal income tax purposes were as follows for each Fund:
| | Tax cost ($) | Gross unrealized appreciation ($) | Gross unrealized depreciation ($) | Net unrealized appreciation (depreciation)($) |
| Fidelity Series Emerging Markets Fund | 5,040,066,629 | 1,244,061,187 | (239,432,762) | 1,004,628,425 |
Fidelity Series Emerging Markets Opportunities Fund | 18,493,335,330 | 7,715,760,534 | (1,900,979,474) | 5,814,781,060 |
Fidelity Series International Growth Fund | 9,015,223,524 | 6,125,238,140 | (213,662,425) | 5,911,575,715 |
Fidelity Series International Small Cap Fund | 3,013,184,312 | 1,197,430,598 | (283,496,172) | 913,934,426 |
| Fidelity Series International Value Fund | 11,091,487,610 | 4,293,978,661 | (471,143,457) | 3,822,835,204 |
The tax-based components of distributable earnings as of period end were as follows for each Fund:
| | Undistributed ordinary income ($) | Undistributed long-term capital gain ($) | Capital loss carryforward ($) | Net unrealized appreciation (depreciation) on securities and other investments ($) |
| Fidelity Series Emerging Markets Fund | 126,771,876 | - | (514,289,584) | 1,004,481,459 |
Fidelity Series Emerging Markets Opportunities Fund | 357,553,902 | - | (2,140,293,194) | 5,813,214,750 |
Fidelity Series International Growth Fund | 192,736,274 | 363,144,880 | - | 5,912,233,219 |
Fidelity Series International Small Cap Fund | 108,426,692 | 235,798,510 | - | 913,297,142 |
| Fidelity Series International Value Fund | 511,226,088 | - | (418,212,570) | 3,820,510,152 |
Capital loss carryforwards are only available to offset future capital gains of the Funds to the extent provided by regulations and may be limited. The capital loss carryforward information presented below, including any applicable limitation, is estimated as of fiscal period end and is subject to adjustment.
| | Short-term ($) | Long-term ($) | Total capital loss carryforward ($) |
| Fidelity Series Emerging Markets Fund | (496,537,375) | (17,752,209) | (514,289,584) |
Fidelity Series Emerging Markets Opportunities Fund | (1,195,026,240) | (945,266,954) | (2,140,293,194) |
| | | | |
| | | | |
| Fidelity Series International Value Fund | (418,212,570) | - | (418,212,570) |
| | | | |
| | | | |
The tax character of distributions paid was as follows:
| October 31, 2024 | | | |
| | Ordinary Income ($) | Long-term Capital Gains ($) | Total ($) |
| Fidelity Series Emerging Markets Fund | 133,767,184 | - | 133,767,184 |
Fidelity Series Emerging Markets Opportunities Fund | 625,661,951 | - | 625,661,951 |
Fidelity Series International Growth Fund | 186,414,240 | - | 186,414,240 |
Fidelity Series International Small Cap Fund | 87,461,459 | 46,330,934 | 133,792,393 |
| Fidelity Series International Value Fund | 464,306,298 | - | 464,306,298 |
| October 31, 2023 | | | |
| | Ordinary Income ($) | Long-term Capital Gains ($) | Total ($) |
| Fidelity Series Emerging Markets Fund | 65,273,730 | - | 65,273,730 |
Fidelity Series Emerging Markets Opportunities Fund | 559,062,771 | - | 559,062,771 |
Fidelity Series International Growth Fund | 172,554,159 | 262,282,322 | 434,836,481 |
Fidelity Series International Small Cap Fund | 47,608,217 | 164,058,361 | 211,666,578 |
| Fidelity Series International Value Fund | 425,784,758 | - | 425,784,758 |
Restricted Securities (including Private Placements). Funds may invest in securities that are subject to legal or contractual restrictions on resale. These securities generally may be resold in transactions exempt from registration or to the public if the securities are registered. Disposal of these securities may involve time-consuming negotiations and expense, and prompt sale at an acceptable price may be difficult. Information regarding restricted securities held at period end is included at the end of the Schedule of Investments, if applicable.
New Accounting Pronouncement. In November 2023, the FASB issued Accounting Standards Update (ASU) 2023-07 Segment Reporting (Topic 280): Improvements to Reportable Segment Disclosures. Effective for fiscal years beginning after December 15, 2023 and interim periods within fiscal years beginning after December 15, 2024, the amendments enhance required disclosures of segment information for public entities on an annual and interim basis. The ASU allows for early adoption with updates applied retrospectively. Management is currently evaluating the impact of the ASU but does not expect this guidance to materially impact the financial statements.
4. Derivative Instruments.
Risk Exposures and the Use of Derivative Instruments. Each Fund's investment objectives allow for various types of derivative instruments, including futures contracts. Derivatives are investments whose value is primarily derived from underlying assets, indices or reference rates and may be transacted on an exchange or over-the-counter (OTC). Derivatives may involve a future commitment to buy or sell a specified asset based on specified terms, to exchange future cash flows at periodic intervals based on a notional principal amount, or for one party to make one or more payments upon the occurrence of specified events in exchange for periodic payments from the other party.
Derivatives were used to increase returns and to manage exposure to certain risks as defined below. The success of any strategy involving derivatives depends on analysis of numerous economic factors, and if the strategies for investment do not work as intended, the objectives may not be achieved.
Derivatives were used to increase or decrease exposure to the following risk(s):
| | |
| Equity Risk | Equity risk relates to the fluctuations in the value of financial instruments as a result of changes in market prices (other than those arising from interest rate risk or foreign exchange risk), whether caused by factors specific to an individual investment, its issuer, or all factors affecting all instruments traded in a market or market segment. |
Funds are also exposed to additional risks from investing in derivatives, such as liquidity risk and counterparty credit risk. Liquidity risk is the risk that a fund will be unable to close out the derivative in the open market in a timely manner. Counterparty credit risk is the risk that the counterparty will not be able to fulfill its obligation to a fund. Counterparty credit risk related to exchange-traded contracts may be mitigated by the protection provided by the exchange on which they trade.
Investing in derivatives may involve greater risks than investing in the underlying assets directly and, to varying degrees, may involve risk of loss in excess of any initial investment and collateral received and amounts recognized in the Statement of Assets and Liabilities. In addition, there may be the risk that the change in value of the derivative contract does not correspond to the change in value of the underlying instrument.
Futures Contracts. A futures contract is an agreement between two parties to buy or sell a specified underlying instrument for a fixed price at a specified future date. Futures contracts were used to manage exposure to the stock market.
Upon entering into a futures contract, a fund is required to deposit either cash or securities (initial margin) with a clearing broker in an amount equal to a certain percentage of the face value of the contract. Futures contracts are marked-to-market daily and subsequent daily payments are made or received by a fund depending on the daily fluctuations in the value of the futures contracts and are recorded as unrealized appreciation or (depreciation). This receivable and/or payable, if any, is included in daily variation margin on futures contracts in the Statement of Assets and Liabilities. Realized gain or (loss) is recorded upon the expiration or closing of a futures contract. The net realized gain (loss) and change in net unrealized appreciation (depreciation) on futures contracts during the period is presented in the Statement of Operations.
Any open futures contracts at period end are presented in the Schedule of Investments under the caption "Futures Contracts". The notional amount at value reflects each contract's exposure to the underlying instrument or index at period end, and is representative of volume of activity during the period unless an average notional amount is presented. Any securities deposited to meet initial margin requirements are identified in the Schedule of Investments. Any cash deposited to meet initial margin requirements is presented as segregated cash with brokers for derivative instruments in the Statement of Assets and Liabilities.
5. Purchases and Sales of Investments.
Purchases and sales of securities, other than short-term securities, U.S. government securities and in-kind transactions, as applicable, are noted in the table below.
| | Purchases ($) | Sales ($) |
| Fidelity Series Emerging Markets Fund | 4,991,712,764 | 4,955,406,382 |
| Fidelity Series Emerging Markets Opportunities Fund | 11,085,356,115 | 12,217,022,079 |
| Fidelity Series International Growth Fund | 3,742,365,611 | 4,048,759,584 |
| Fidelity Series International Small Cap Fund | 1,145,998,067 | 1,437,818,069 |
| Fidelity Series International Value Fund | 4,897,148,377 | 4,845,795,101 |
Unaffiliated Redemptions In-Kind. Shares that were redeemed in-kind for investments, including accrued interest and cash, if any, are shown in the table below. The net realized gain or loss on investments delivered through in-kind redemptions is included in the "Net realized gain (loss) on: Redemptions in-kind" line in the accompanying Statement of Operations. The amount of the in-kind redemptions is included in share transactions in the accompanying Statement of Changes in Net Assets. There was no gain or loss for federal income tax purposes.
| | Shares | Total net realized gain or loss ($) | Total Proceeds ($) |
| Fidelity Series International Growth Fund | 35,969,890 | 338,431,291 | 643,426,122 |
| Fidelity Series International Value Fund | 52,080,465 | 252,285,154 | 642,076,082 |
Prior Fiscal Year Unaffiliated Redemptions In-Kind. Shares that were redeemed in-kind for investments, including accrued interest and cash, if any, are shown in the table below; along with realized gain or loss on investments delivered through in-kind redemptions. The amount of the in-kind redemptions is included in share transactions in the accompanying Statement of Changes in Net Assets. There was no gain or loss for federal income tax purposes.
| | Shares | Total net realized gain or loss ($) | Total Proceeds ($) |
| Fidelity Series International Growth Fund | 24,781,944 | 187,812,495 | 380,697,437 |
| Fidelity Series International Value Fund | 36,205,694 | 125,106,946 | 383,424,293 |
6. Fees and Other Transactions with Affiliates.
Management Fee. Fidelity Management & Research Company LLC (the investment adviser) and its affiliates provide the Funds with investment management related services for which the Funds do not pay a management fee. Under the management contract, the investment adviser or an affiliate pays all ordinary operating expenses of the Funds, except custody fees, fees and expenses of the independent Trustees, and certain miscellaneous expenses such as proxy and shareholder meeting expenses.
Brokerage Commissions. A portion of portfolio transactions were placed with brokerage firms which are affiliates of the investment adviser. Brokerage commissions are included in net realized gain (loss) and change in net unrealized appreciation (depreciation) in the Statement of Operations. The commissions paid to these affiliated firms were as follows:
| | Amount ($) |
| Fidelity Series Emerging Markets Fund | 413 |
| Fidelity Series Emerging Markets Opportunities Fund | 32,321 |
| Fidelity Series International Growth Fund | 6,978 |
| Fidelity Series International Small Cap Fund | 848 |
| Fidelity Series International Value Fund | 1,555 |
Interfund Lending Program. Pursuant to an Exemptive Order issued by the Securities and Exchange Commission (the SEC), each Fund, along with other registered investment companies having management contracts with Fidelity Management & Research Company LLC (FMR), or other affiliated entities of FMR, may participate in an interfund lending program. This program provides an alternative credit facility allowing each Fund to borrow from, or lend money to, other participating affiliated funds at rates that are beneficial to both the borrowing and lending fund. Borrowings under the program are generally for temporary or emergency purposes, including meeting fund shareholder redemptions. The interfund loan rate is determined, as specified in the Exemptive Order, by averaging, (1) the higher of the overnight time deposit rate and the current overnight repurchase agreement rate, and (2) a benchmark rate representing the lowest bank loan rate available to the funds. At period end, there were no interfund loans outstanding. Activity in this program during the period for which loans were outstanding was as follows:
| | Borrower or Lender | Average Loan Balance ($) | Weighted Average Interest Rate | Interest Expense ($) |
Fidelity Series Emerging Markets Opportunities Fund | Borrower | 86,008,727 | 5.23% | 137,431 |
Fidelity Series International Small Cap Fund | Borrower | 24,754,000 | 5.59% | 3,840 |
| Fidelity Series International Value Fund | Borrower | 15,023,000 | 5.59% | 6,993 |
Interfund Trades. Funds may purchase from or sell securities to other Fidelity Funds under procedures adopted by the Board. The procedures have been designed to ensure these interfund trades are executed in accordance with Rule 17a-7 of the 1940 Act. Any interfund trades are included within the respective purchases and sales amounts shown in the Purchases and Sales of Investments note. Interfund trades during the period are noted in the table below.
| | Purchases ($) | Sales ($) | Realized Gain (Loss)($) |
| Fidelity Series Emerging Markets Fund | 27,861,150 | 61,884,455 | 444,283 |
| Fidelity Series Emerging Markets Opportunities Fund | 32,838,438 | 145,455,948 | 20,910,905 |
| Fidelity Series International Growth Fund | 224,704,657 | 60,683,576 | 23,374,706 |
| Fidelity Series International Small Cap Fund | 37,285,962 | 69,948,666 | 9,513,357 |
| Fidelity Series International Value Fund | 101,898,427 | 286,732,792 | 101,141,256 |
Sub-Advisory Arrangements. Effective March 1, 2024, each Fund's sub-advisory agreements with FMR Investment Management (UK) Limited, Fidelity Management & Research (Hong Kong) Limited, and Fidelity Management & Research (Japan) Limited were amended to provide that the investment adviser pays each sub-adviser monthly fees equal to 110% of the sub-adviser's costs for providing sub-advisory services.
Other. During the period, the investment adviser reimbursed the Funds for certain losses as follows:
| | Amount ($) |
| Fidelity Series Emerging Markets Opportunities Fund | 16,920 |
| Fidelity Series International Small Cap Fund | 19,711 |
7. Committed Line of Credit.
Certain Funds participate with other funds managed by the investment adviser or an affiliate in a $4.25 billion credit facility (the "line of credit") to be utilized for temporary or emergency purposes to fund shareholder redemptions or for other short-term liquidity purposes. The commitment fees on the pro-rata portion of the line of credit are borne by the investment adviser. During the period, there were no borrowings on this line of credit.
8. Security Lending.
Funds lend portfolio securities from time to time in order to earn additional income. Lending agents are used, including National Financial Services (NFS), an affiliate of the investment adviser. Pursuant to a securities lending agreement, NFS will receive a fee, which is capped at 9.9% of a fund's daily lending revenue, for its services as lending agent. A fund may lend securities to certain qualified borrowers, including NFS. On the settlement date of the loan, a fund receives collateral (in the form of U.S. Treasury obligations, letters of credit and/or cash) against the loaned securities and maintains collateral in an amount not less than 100% of the market value of the loaned securities during the period of the loan. The market value of the loaned securities is determined at the close of business of a fund and any additional required collateral is delivered to a fund on the next business day. A fund or borrower may terminate the loan at any time, and if the borrower defaults on its obligation to return the securities loaned because of insolvency or other reasons, a fund may apply collateral received from the borrower against the obligation. A fund may experience delays and costs in recovering the securities loaned. Any cash collateral received is invested in the Fidelity Securities Lending Cash Central Fund. Any loaned securities are identified as such in the Schedule of Investments, and the value of loaned securities and cash collateral at period end, as applicable, are presented in the Statement of Assets and Liabilities. Security lending income represents the income earned on investing cash collateral, less rebates paid to borrowers and any lending agent fees associated with the loan, plus any premium payments received for lending certain types of securities. Security lending income is presented in the Statement of Operations as a component of income from Fidelity Central Funds. Affiliated security lending activity, if any, was as follows:
| | Total Security Lending Fees Paid to NFS ($) | Security Lending Income From Securities Loaned to NFS ($) | Value of Securities Loaned to NFS at Period End ($) |
| Fidelity Series Emerging Markets Fund | 55,147 | - | - |
| Fidelity Series Emerging Markets Opportunities Fund | 271,738 | 5 | - |
| Fidelity Series International Growth Fund | 21,731 | - | - |
| Fidelity Series International Small Cap Fund | 72,155 | 1 | - |
| Fidelity Series International Value Fund | 76,853 | - | - |
9. Expense Reductions.
The investment adviser contractually agreed to reimburse each Fund to the extent annual operating expenses exceeded certain levels of average net assets as noted in the table below. This reimbursement will remain in place through February 28, 2028. Some expenses, for example the compensation of the independent Trustees, and certain other expenses such as interest expense, are excluded from this reimbursement.
The following Funds were in reimbursement during the period:
| | Expense Limitations | Reimbursement ($) |
| Fidelity Series Emerging Markets Fund | .013% | 1,012,843 |
| Fidelity Series Emerging Markets Opportunities Fund | .013% | 3,939,744 |
Through arrangements with each applicable Fund's custodian, credits realized as a result of certain uninvested cash balances were used to reduce each applicable Fund's expenses. All of the applicable expense reductions are noted in the table below.
| | Custodian credits ($) |
Fidelity Series Emerging Markets Fund | 4,545 |
Fidelity Series Emerging Markets Opportunities Fund | 3,802 |
Fidelity Series International Growth Fund | 785 |
Fidelity Series International Value Fund | 2,251 |
10. Other.
A fund's organizational documents provide former and current trustees and officers with a limited indemnification against liabilities arising in connection with the performance of their duties to the fund. In the normal course of business, a fund may also enter into contracts that provide general indemnifications. A fund's maximum exposure under these arrangements is unknown as this would be dependent on future claims that may be made against a fund. The risk of material loss from such claims is considered remote.
At the end of the period, mutual funds and accounts managed by the investment adviser or its affiliates were the owners of record of all of the outstanding shares of the Funds.
11. Risk and Uncertainties.
Many factors affect a fund's performance. Developments that disrupt global economies and financial markets, such as pandemics, epidemics, outbreaks of infectious diseases, war, terrorism, and environmental disasters, may significantly affect a fund's investment performance. The effects of these developments to a fund will be impacted by the types of securities in which a fund invests, the financial condition, industry, economic sector, and geographic location of an issuer, and a fund's level of investment in the securities of that issuer. Significant concentrations in security types, issuers, industries, sectors, and geographic locations may magnify the factors that affect a fund's performance.
Report of Independent Registered Public Accounting Firm
To the Board of Trustees of Fidelity Investment Trust and the Shareholders of Fidelity Series Emerging Markets Fund, Fidelity Series Emerging Markets Opportunities Fund, Fidelity Series International Small Cap Fund and Fidelity Series International Value Fund:
Opinion on the Financial Statements and Financial Highlights
We have audited the accompanying statements of assets and liabilities of Fidelity Series Emerging Markets Fund, Fidelity Series Emerging Markets Opportunities Fund, Fidelity Series International Small Cap Fund and Fidelity Series International Value Fund (the "Funds"), each a fund of Fidelity Investment Trust, including the schedules of investments, as of October 31, 2024, the related statements of operations for the year then ended, the statements of changes in net assets for each of the two years in the period then ended, the financial highlights for each of the five years in the period then ended, and the related notes. In our opinion, the financial statements and financial highlights present fairly, in all material respects, the financial position of each of the Funds as of October 31, 2024, and the results of their operations for the year then ended, the changes in their net assets for each of the two years in the period then ended, and the financial highlights for each of the five years in the period then ended in conformity with accounting principles generally accepted in the United States of America.
Basis for Opinion
These financial statements and financial highlights are the responsibility of the Funds' management. Our responsibility is to express an opinion on the Funds' financial statements and financial highlights based on our audits. We are a public accounting firm registered with the Public Company Accounting Oversight Board (United States) (PCAOB) and are required to be independent with respect to the Funds in accordance with the U.S. federal securities laws and the applicable rules and regulations of the Securities and Exchange Commission and the PCAOB.
We conducted our audits in accordance with the standards of the PCAOB. Those standards require that we plan and perform the audit to obtain reasonable assurance about whether the financial statements and financial highlights are free of material misstatement, whether due to error or fraud. The Funds are not required to have, nor were we engaged to perform, an audit of their internal control over financial reporting. As part of our audits, we are required to obtain an understanding of internal control over financial reporting but not for the purpose of expressing an opinion on the effectiveness of the Funds' internal control over financial reporting. Accordingly, we express no such opinion.
Our audits included performing procedures to assess the risks of material misstatement of the financial statements and financial highlights, whether due to error or fraud, and performing procedures that respond to those risks. Such procedures included examining, on a test basis, evidence regarding the amounts and disclosures in the financial statements and financial highlights. Our audits also included evaluating the accounting principles used and significant estimates made by management, as well as evaluating the overall presentation of the financial statements and financial highlights. Our procedures included confirmation of securities owned as of October 31, 2024, by correspondence with the custodian and brokers; when replies were not received from brokers, we performed other auditing procedures. We believe that our audits provide a reasonable basis for our opinion.
/s/ Deloitte & Touche LLP
Boston, Massachusetts
December 17, 2024
We have served as the auditor of one or more of the Fidelity investment companies since 1999.
Report of Independent Registered Public Accounting Firm
To the Board of Trustees of Fidelity Investment Trust and Shareholders of Fidelity Series International Growth Fund
Opinion on the Financial Statements
We have audited the accompanying statement of assets and liabilities, including the schedule of investments, of Fidelity Series International Growth Fund (one of the funds constituting Fidelity Investment Trust, referred to hereafter as the "Fund") as of October 31, 2024, the related statement of operations for the year ended October 31, 2024, the statement of changes in net assets for each of the two years in the period ended October 31, 2024, including the related notes, and the financial highlights for each of the five years in the period ended October 31, 2024 (collectively referred to as the "financial statements"). In our opinion, the financial statements present fairly, in all material respects, the financial position of the Fund as of October 31, 2024, the results of its operations for the year then ended, the changes in its net assets for each of the two years in the period ended October 31, 2024 and the financial highlights for each of the five years in the period ended October 31, 2024 in conformity with accounting principles generally accepted in the United States of America.
Basis for Opinion
These financial statements are the responsibility of the Fund's management. Our responsibility is to express an opinion on the Fund's financial statements based on our audits. We are a public accounting firm registered with the Public Company Accounting Oversight Board (United States) (PCAOB) and are required to be independent with respect to the Fund in accordance with the U.S. federal securities laws and the applicable rules and regulations of the Securities and Exchange Commission and the PCAOB.
We conducted our audits of these financial statements in accordance with the standards of the PCAOB. Those standards require that we plan and perform the audit to obtain reasonable assurance about whether the financial statements are free of material misstatement, whether due to error or fraud.
Our audits included performing procedures to assess the risks of material misstatement of the financial statements, whether due to error or fraud, and performing procedures that respond to those risks. Such procedures included examining, on a test basis, evidence regarding the amounts and disclosures in the financial statements. Our audits also included evaluating the accounting principles used and significant estimates made by management, as well as evaluating the overall presentation of the financial statements. Our procedures included confirmation of securities owned as of October 31, 2024 by correspondence with the custodian, issuers of privately offered securities and brokers; when replies were not received from brokers, we performed other auditing procedures. We believe that our audits provide a reasonable basis for our opinion.
/s/ PricewaterhouseCoopers LLP
Boston, Massachusetts
December 17, 2024
We have served as the auditor of one or more investment companies in the Fidelity group of funds since 1932.
Distributions
(Unaudited)The dividend and capital gains distributions for the fund(s) are available on Fidelity.com or Institutional.Fidelity.com.
The funds hereby designate as capital gain dividend the amounts noted below for the taxable year ended October 31, 2024, or, if subsequently determined to be different, the net capital gain of such year.
Fidelity Series International Growth Fund | $463,867,505 |
Fidelity Series International Small Cap Fund | $249,314,645 |
A percentage of the dividends distributed during the fiscal year for the following funds qualify for the dividends-received deduction for corporate shareholders:
| Fidelity Series International Growth Fund | |
| December 08, 2023 | 12% |
| Fidelity Series International Small Cap Fund | |
| December 08, 2023 | 2% |
A percentage of the dividends distributed during the fiscal year for the following funds may be taken into account as a dividend for purposes of the maximum rate under section 1(h)(11) of the Internal Revenue Code.
| Fidelity Series Emerging Markets Fund | |
| December 08, 2023 | 49.73% |
| Fidelity Series Emerging Markets Opportunities Fund | |
| December 08, 2023 | 50.01% |
| Fidelity Series International Growth Fund | |
| December 08, 2023 | 83.54% |
| Fidelity Series International Small Cap Fund | |
| December 08, 2023 | 70.55% |
| Fidelity Series International Value Fund | |
| December 08, 2023 | 70.68% |
| December 27, 2023 | 65.97% |
The funds hereby designate the amounts noted below as distributions paid during the fiscal year ended 2024 as qualifying to be taxed as section 163(j) interest dividends:
| Fidelity Series Emerging Markets Fund | $13,173,340 |
| Fidelity Series Emerging Markets Opportunities Fund | $19,526,750 |
| Fidelity Series International Growth Fund | $13,593,127 |
| Fidelity Series International Small Cap Fund | $7,836,650 |
| Fidelity Series International Value Fund | $13,609,741 |
The amounts per share which represent income derived from sources within, and taxes paid to, foreign countries or possessions of the United States are as follows:
| | Pay Date | Income | Taxes |
| Fidelity Series Emerging Markets Fund | 12/11/23 | $0.2146 | $0.0288 |
| Fidelity Series Emerging Markets Opportunities Fund | 12/11/23 | $0.5441 | $0.0739 |
| Fidelity Series International Growth Fund | 12/11/23 | $0.1922 | $0.0164 |
| Fidelity Series International Small Cap Fund | 12/11/23 | $0.3717 | $0.0449 |
| Fidelity Series International Value Fund | 12/11/23 | $0.3829 | $0.0192 |
| | 12/28/23 | $0.0000 | $0.0000 |
The funds will notify shareholders in January 2025 of amounts for use in preparing 2024 income tax returns.
Item 8: Changes in and Disagreements with Accountants for Open-End Management Investment Companies
(Unaudited)
Note: This is not applicable for any fund included in this document.
Item 9: Proxy Disclosures for Open-End Management Investment Companies
(Unaudited)
| A special meeting of shareholders was held on July 16, 2024. The results of votes taken among shareholders on the proposal before them are reported below. Each vote reported represents one dollar of net asset value held on the record date for the meeting. |
| Proposal 1 |
| To elect a Board of Trustees. |
| | # of Votes | % of Votes |
| Bettina Doulton |
| Affirmative | 128,529,177,643.56 | 98.18 |
| Withheld | 2,378,037,364.30 | 1.82 |
| TOTAL | 130,907,215,007.85 | 100.00 |
| Robert A. Lawrence |
| Affirmative | 128,253,389,899.05 | 97.97 |
| Withheld | 2,653,825,108.81 | 2.03 |
| TOTAL | 130,907,215,007.85 | 100.00 |
| Vijay C. Advani |
| Affirmative | 128,531,418,228.19 | 98.19 |
| Withheld | 2,375,796,779.66 | 1.81 |
| TOTAL | 130,907,215,007.85 | 100.00 |
| Thomas P. Bostick |
| Affirmative | 128,495,261,591.41 | 98.16 |
| Withheld | 2,411,953,416.44 | 1.84 |
| TOTAL | 130,907,215,007.85 | 100.00 |
| Donald F. Donahue |
| Affirmative | 128,407,878,996.00 | 98.09 |
| Withheld | 2,499,336,011.85 | 1.91 |
| TOTAL | 130,907,215,007.85 | 100.00 |
| Vicki L. Fuller |
| Affirmative | 128,625,540,095.19 | 98.26 |
| Withheld | 2,281,674,912.66 | 1.74 |
| TOTAL | 130,907,215,007.85 | 100.00 |
| Patricia L. Kampling |
| Affirmative | 128,668,729,281.34 | 98.29 |
| Withheld | 2,238,485,726.51 | 1.71 |
| TOTAL | 130,907,215,007.85 | 100.00 |
| Thomas A. Kennedy |
| Affirmative | 128,499,824,239.79 | 98.16 |
| Withheld | 2,407,390,768.06 | 1.84 |
| TOTAL | 130,907,215,007.85 | 100.00 |
| Oscar Munoz |
| Affirmative | 128,386,109,391.05 | 98.07 |
| Withheld | 2,521,105,616.80 | 1.93 |
| TOTAL | 130,907,215,007.85 | 100.00 |
| Karen B. Peetz |
| Affirmative | 128,603,731,113.82 | 98.24 |
| Withheld | 2,303,483,894.03 | 1.76 |
| TOTAL | 130,907,215,007.85 | 100.00 |
| David M. Thomas |
| Affirmative | 128,384,899,342.98 | 98.07 |
| Withheld | 2,522,315,664.88 | 1.93 |
| TOTAL | 130,907,215,007.85 | 100.00 |
| Susan Tomasky |
| Affirmative | 128,556,148,461.60 | 98.20 |
| Withheld | 2,351,066,546.25 | 1.80 |
| TOTAL | 130,907,215,007.85 | 100.00 |
| Michael E. Wiley |
| Affirmative | 128,264,934,978.34 | 97.98 |
| Withheld | 2,642,280,029.51 | 2.02 |
| TOTAL | 130,907,215,007.85 | 100.00 |
| | | |
| Proposal 1 reflects trust-wide proposal and voting results. |
Item 10: Remuneration Paid to Directors, Officers, and others of Open-End Management Investment Companies
(Unaudited)
Note: This information is disclosed as part of the financial statements for each Fund as part of Item 7: Financial Statements and Financial Highlights for Open-End Management Investment companies.
Item 11: Statement Regarding Basis for Approval of Investment Advisory Contract
(Unaudited)
Board Approval of Investment Advisory Contracts and Management Fees
Fidelity Series Emerging Markets Fund
Fidelity Series Emerging Markets Opportunities Fund
Fidelity Series International Growth Fund
Fidelity Series International Small Cap Fund
Fidelity Series International Value Fund
Each year, the Board of Trustees, including the Independent Trustees (together, the Board), considers the renewal of each fund's management contract with Fidelity Management & Research Company LLC (FMR) and the sub-advisory agreements (together, the Advisory Contracts) for each fund. FMR and the sub-advisers are referred to herein as the Investment Advisers. The Board, assisted by the advice of fund counsel and Independent Trustees' counsel, requests and considers a broad range of information relevant to the renewal of the Advisory Contracts throughout the year.
The Board meets regularly and, at each of its meetings, covers an extensive agenda of topics and materials and considers factors that are relevant to its annual consideration of the renewal of the fund's Advisory Contracts, including the services and support provided to each fund and its shareholders. The Board, acting directly and through its Committees (each of which is composed of and chaired by Independent Trustees), requests and receives information concerning the annual consideration of the renewal of each fund's Advisory Contracts. The Board also meets as needed to review matters specifically related to the Board's annual consideration of the renewal of the Advisory Contracts. Members of the Board may also meet with trustees of other Fidelity funds through joint ad hoc committees to discuss certain matters relevant to all of the Fidelity funds.
At its May 2024 meeting, the Board unanimously determined to renew each fund's Advisory Contracts. The Board considered all factors it believed relevant and reached a determination, with the assistance of fund counsel and Independent Trustees' counsel and through the exercise of its business judgment, that the renewal of the Advisory Contracts was in the best interests of each fund and its shareholders and the fact that no fee is payable under the management contracts was fair and reasonable in light of all of the surrounding circumstances.
Nature, Extent, and Quality of Services Provided. The Board considered staffing as it relates to the funds, including the backgrounds and experience of investment personnel of the Investment Advisers, and also considered the Investment Advisers' implementation of each fund's investment program. The Independent Trustees also had discussions with senior management of Fidelity's investment operations and investment groups. The Board considered the structure of the investment personnel compensation program and whether this structure provides appropriate incentives to act in the best interests of each fund.
Resources Dedicated to Investment Management and Support Services. The Board and the Fund Oversight and Research Committees reviewed the general qualifications and capabilities of Fidelity's investment staff, including its size, education, experience, and resources, as well as Fidelity's approach to recruiting, training, managing, and compensating investment personnel. The Board noted the resources devoted to expansion of Fidelity's global investment organization, and that Fidelity's analysts have extensive resources, tools, and capabilities that allow them to conduct sophisticated quantitative and fundamental analysis, as well as credit analysis of issuers, counterparties, and guarantors. Further, the Board considered that Fidelity's investment professionals have sufficient access to global information and data so as to provide competitive investment results over time, and that those professionals also have access to sophisticated tools that permit them to assess portfolio construction and risk and performance attribution characteristics continuously, as well as to transmit new information and research conclusions rapidly around the world. Additionally, in its deliberations, the Board considered Fidelity's trading, risk management, compliance, and technology and operations capabilities and resources, which are integral parts of the investment management process.
Administrative Services. The Board considered (i) the nature, extent, quality, and cost of advisory and administrative services performed by the Investment Advisers and their affiliates under the Advisory Contracts and under separate agreements covering transfer agency and pricing and bookkeeping services for each fund; (ii) the nature and extent of Fidelity's supervision of third party service providers, principally custodians, subcustodians, and pricing vendors; and (iii) the resources devoted by Fidelity to, and the record of compliance with, each fund's compliance policies and procedures. The Board also reviewed the allocation of fund brokerage, including allocations to brokers affiliated with the Investment Advisers, the use of brokerage commissions to pay fund expenses, and the use of "soft" commission dollars to pay for research services. The Board also considered each fund's securities lending activities and any payments made to Fidelity relating to securities lending under a separate agreement.
Investment Performance. The Board reviewed each fund's absolute investment performance, as well as each fund's relative investment performance and noted that the funds are not publicly offered as a stand-alone investment product. In this regard, the Board noted that each fund is designed to offer an investment option for other investment companies, 529 plans, and collective investment trusts managed by Fidelity and ultimately to enhance the performance of those investment companies, 529 plans, and collective investment trusts.
Based on its review, the Board concluded that the nature, extent, and quality of services provided to each fund under the Advisory Contracts should continue to benefit the shareholders of each fund.
Competitiveness of Management Fee and Total Expense Ratio. The Board considered that each fund does not pay FMR a management fee for investment advisory services, but that FMR receives fees for providing services to funds that invest in each fund. The Board noted that FMR or an affiliate undertakes to pay all operating expenses of each fund, except transfer agent fees, 12b-1 fees, Independent Trustee fees and expenses, custodian fees and expenses, proxy and shareholder meeting expenses, interest, taxes, and extraordinary expenses (such as litigation expenses). The Board further noted that each fund pays its non-operating expenses, including brokerage commissions and fees and expenses associated with the fund's securities lending program, if applicable.
The Board further considered that FMR has contractually agreed to reimburse each fund to the extent that total operating expenses, with certain exceptions, as a percentage of its average net assets, exceed 0.013% through February 28, 2027.
Based on its review, the Board considered that each fund does not pay a management fee and concluded that the total expense ratio of each fund was reasonable in light of the services that each fund and its shareholders receive and the other factors considered.
Costs of the Services and Profitability. The Board considered the level of Fidelity's profits in respect of all the Fidelity funds.
A public accounting firm has been engaged annually by the Board as part of the Board's assessment of Fidelity's profitability analysis. The engagement includes the review and assessment of the methodologies used by Fidelity in determining the revenues and expenses attributable to Fidelity's fund business, and completion of agreed-upon procedures in respect of the mathematical accuracy of certain fund profitability information and its conformity to established allocation methodologies. After considering the reports issued under the engagement and information provided by Fidelity, the Board concluded that while other allocation methods may also be reasonable, Fidelity's profitability methodologies are reasonable in all material respects.
The Board also reviewed Fidelity's non-fund businesses and potential indirect benefits such businesses may have received as a result of their association with Fidelity's fund business (i.e., fall-out benefits) as well as cases where Fidelity's affiliates may benefit from the funds' business. The Board considered areas where potential indirect benefits to the Fidelity funds from their relationships with Fidelity may exist. The Board's consideration of these matters was informed by the findings of a joint ad hoc committee created by it and the boards of other Fidelity funds to evaluate potential fall-out benefits.
The Board concluded that the costs of the services provided by and the profits realized by Fidelity in connection with the operation of each fund were not relevant to the renewal of the Advisory Contracts because each fund pays no advisory fees and FMR bears all expenses of each fund with certain exceptions.
Economies of Scale. The Board concluded that because each fund pays no advisory fees and FMR bears all expenses of each fund with certain exceptions, the realization of economies of scale was not a material factor in the Board's decision to renew each fund's Advisory Contracts.
Additional Information Requested by the Board. In order to develop fully the factual basis for consideration of the Fidelity funds' advisory contracts, the Board requested and received additional information on certain topics, including but not limited to: (i) fund flow and performance trends, in particular the underperformance of certain funds and strategies, and Fidelity's long-term strategies for certain funds; (ii) the operation of performance fees and the rationale for implementing performance fees on certain categories of funds but not others; (iii) Fidelity's pricing philosophy compared to competitors; (iv) fund profitability methodology and data; (v) evaluation of competitive fund data and peer group classifications and fee and expense comparisons; (vi) the management fee and expense structures for different funds and classes and information about the differences between various fee and expense structures; (vii) the variable management fee implemented for certain funds effective March 1, 2024; and (viii) information regarding other accounts managed by Fidelity and the funds' sub-advisory arrangements.
Conclusion. Based on its evaluation of all of the conclusions noted above, and after considering all factors it believed relevant, the Board, including the Independent Trustees, concluded that the advisory and sub-advisory fee arrangements are fair and reasonable in light of all of the surrounding circumstances, and that each fund's Advisory Contracts should be renewed through May 31, 2025.
1.907943.114
GSV-S-ANN-1224
Fidelity® Global Commodity Stock Fund
Annual Report
October 31, 2024
Includes Fidelity and Fidelity Advisor share classes
Contents
To view a fund's proxy voting guidelines and proxy voting record for the 12-month period ended June 30, visit http://www.fidelity.com/proxyvotingresults or visit the Securities and Exchange Commission's (SEC) web site at http://www.sec.gov.
You may also call 1-800-544-8544 if you're an individual investing directly with Fidelity, call 1-800-835-5092 if you're a plan sponsor or participant with Fidelity as your recordkeeper or call 1-877-208-0098 on institutional accounts or if you're an advisor or invest through one to request a free copy of the proxy voting guidelines.
Standard & Poor's, S&P and S&P 500 are registered service marks of The McGraw-Hill Companies, Inc. and have been licensed for use by Fidelity Distributors Corporation.
Other third-party marks appearing herein are the property of their respective owners.
All other marks appearing herein are registered or unregistered trademarks or service marks of FMR LLC or an affiliated company. © 2024 FMR LLC. All rights reserved.
This report and the financial statements contained herein are submitted for the general information of the shareholders of the Fund. This report is not authorized for distribution to prospective investors in the Fund unless preceded or accompanied by an effective prospectus.
A fund files its complete schedule of portfolio holdings with the SEC for the first and third quarters of each fiscal year on Form N-PORT. Forms N-PORT are available on the SEC's web site at http://www.sec.gov. A fund's Forms N-PORT may be reviewed and copied at the SEC's Public Reference Room in Washington, DC. Information regarding the operation of the SEC's Public Reference Room may be obtained by calling 1-800-SEC-0330.
For a complete list of a fund's portfolio holdings, view the most recent holdings listing, semiannual report, or annual report on Fidelity's web site at http://www.fidelity.com, http://www.institutional.fidelity.com, or http://www.401k.com, as applicable.
NOT FDIC INSURED •MAY LOSE VALUE •NO BANK GUARANTEE
Neither the Fund nor Fidelity Distributors Corporation is a bank.
Item 7: Financial Statements and Financial Highlights for Open-End Management Investment Companies (Annual Report)
Fidelity® Global Commodity Stock Fund
Schedule of Investments October 31, 2024
Showing Percentage of Net Assets
| Common Stocks - 99.2% |
| | | Shares | Value ($) |
| Chemicals - 5.0% | | | |
| Fertilizers & Agricultural Chemicals - 5.0% | | | |
| CF Industries Holdings, Inc. | | 62,700 | 5,155,821 |
| Corteva, Inc. | | 304,800 | 18,568,416 |
| FMC Corp. | | 67,700 | 4,399,823 |
| Nutrien Ltd. | | 359,683 | 17,150,396 |
| OCI NV | | 144,200 | 1,751,270 |
| | | | 47,025,726 |
| Construction & Engineering - 0.2% | | | |
| Construction & Engineering - 0.2% | | | |
| Centuri Holdings, Inc. | | 88,600 | 1,663,022 |
| Construction Materials - 0.6% | | | |
| Construction Materials - 0.6% | | | |
| Ultratech Cement Ltd. | | 44,300 | 5,817,138 |
| Containers & Packaging - 1.6% | | | |
| Paper & Plastic Packaging Products & Materials - 1.6% | | | |
| Billerud AB | | 321,900 | 2,850,544 |
| International Paper Co. | | 10,000 | 555,400 |
| Smurfit Westrock PLC | | 221,100 | 11,446,660 |
| | | | 14,852,604 |
| Electrical Equipment - 0.1% | | | |
| Electrical Components & Equipment - 0.1% | | | |
| GrafTech International Ltd. (a) | | 683,684 | 1,162,263 |
| Energy Equipment & Services - 6.0% | | | |
| Oil & Gas Equipment & Services - 6.0% | | | |
| Archrock, Inc. (b) | | 354,600 | 7,099,092 |
| DOF Group ASA (a) | | 2,660,500 | 21,138,497 |
| Kodiak Gas Services, Inc. | | 852,300 | 27,171,324 |
| | | | 55,408,913 |
| Food Products - 10.3% | | | |
| Agricultural Products & Services - 4.9% | | | |
| Archer Daniels Midland Co. | | 818,100 | 45,167,301 |
| Packaged Foods & Meats - 5.4% | | | |
| JBS SA | | 4,918,500 | 30,637,995 |
| Lamb Weston Holdings, Inc. | | 123,000 | 9,555,870 |
| The J.M. Smucker Co. | | 52,600 | 5,970,626 |
| Tyson Foods, Inc. Class A | | 76,400 | 4,476,276 |
| | | | 50,640,767 |
TOTAL FOOD PRODUCTS | | | 95,808,068 |
| Metals & Mining - 29.9% | | | |
| Aluminum - 0.1% | | | |
| Norsk Hydro ASA | | 77,100 | 478,587 |
| Copper - 3.6% | | | |
| ERO Copper Corp. (a) | | 480,640 | 8,826,778 |
| First Quantum Minerals Ltd. (a) | | 1,922,271 | 24,836,898 |
| | | | 33,663,676 |
| Diversified Metals & Mining - 7.1% | | | |
| Anglo American PLC (United Kingdom) | | 549,600 | 17,037,830 |
| Sigma Lithium Corp. (a)(b) | | 493,800 | 6,705,804 |
| Sumitomo Metal Mining Co. Ltd. | | 103,200 | 2,853,334 |
| Teck Resources Ltd. Class B (sub. vtg.) | | 840,600 | 39,109,468 |
| | | | 65,706,436 |
| Gold - 7.2% | | | |
| Alamos Gold, Inc. Class A | | 564,500 | 11,404,737 |
| Franco-Nevada Corp. | | 109,471 | 14,531,138 |
| Wheaton Precious Metals Corp. | | 621,500 | 41,043,506 |
| | | | 66,979,381 |
| Precious Metals & Minerals - 4.4% | | | |
| Anglo American Platinum Ltd. (b) | | 121,912 | 4,792,046 |
| Impala Platinum Holdings Ltd. (a) | | 1,786,000 | 11,788,547 |
| IperionX Ltd. (a) | | 423,066 | 911,709 |
| Northam Platinum Holdings Ltd. | | 3,211,300 | 23,758,736 |
| | | | 41,251,038 |
| Steel - 7.5% | | | |
| Algoma Steel Group, Inc. (b) | | 1,304,743 | 13,504,090 |
| Arch Resources, Inc. Class A, | | 67,758 | 9,944,164 |
| Champion Iron Ltd. (b) | | 5,523,400 | 21,302,588 |
| Reliance, Inc. | | 54,700 | 15,662,798 |
| Tata Steel Ltd. | | 5,362,200 | 9,423,941 |
| | | | 69,837,581 |
TOTAL METALS & MINING | | | 277,916,699 |
| Oil, Gas & Consumable Fuels - 35.2% | | | |
| Coal & Consumable Fuels - 2.6% | | | |
| Alliance Resource Partners LP | | 365,800 | 9,572,986 |
| Coal India Ltd. | | 592,300 | 3,176,987 |
| CONSOL Energy, Inc. | | 89,631 | 9,941,871 |
| Whitehaven Coal Ltd. | | 358,608 | 1,603,833 |
| | | | 24,295,677 |
| Integrated Oil & Gas - 16.5% | | | |
| Cenovus Energy, Inc. (Canada) | | 2,195,400 | 35,303,628 |
| Exxon Mobil Corp. | | 556,200 | 64,953,035 |
| Shell PLC (London) | | 1,602,973 | 53,518,973 |
| | | | 153,775,636 |
| Oil & Gas Exploration & Production - 8.7% | | | |
| Antero Resources Corp. (a) | | 1,139,012 | 29,477,631 |
| Canadian Natural Resources Ltd. | | 801,800 | 27,267,016 |
| Mach Natural Resources LP | | 635,867 | 10,237,459 |
| MEG Energy Corp. | | 734,600 | 13,427,349 |
| | | | 80,409,455 |
| Oil & Gas Storage & Transportation - 7.4% | | | |
| Energy Transfer LP | | 1,920,700 | 31,653,136 |
| Plains GP Holdings LP Class A | | 745,400 | 12,820,880 |
| South Bow Corp. | | 970,431 | 24,233,767 |
| | | | 68,707,783 |
TOTAL OIL, GAS & CONSUMABLE FUELS | | | 327,188,551 |
| Paper & Forest Products - 10.3% | | | |
| Forest Products - 4.8% | | | |
| Interfor Corp. (a)(b) | | 1,194,600 | 16,464,520 |
| Svenska Cellulosa AB SCA (B Shares) | | 853,900 | 11,288,305 |
| West Fraser Timber Co. Ltd. | | 186,500 | 16,843,735 |
| | | | 44,596,560 |
| Paper Products - 5.5% | | | |
| Mondi PLC | | 196 | 3,172 |
| Stora Enso Oyj (R Shares) | | 1,052,400 | 11,699,326 |
| Suzano SA | | 914,700 | 9,457,285 |
| UPM-Kymmene Corp. | | 1,012,600 | 29,662,201 |
| | | | 50,821,984 |
TOTAL PAPER & FOREST PRODUCTS | | | 95,418,544 |
| TOTAL COMMON STOCKS (Cost $796,830,515) | | | 922,261,528 |
| | | | |
| Money Market Funds - 2.6% |
| | | Shares | Value ($) |
| Fidelity Cash Central Fund 4.87% (c) | | 6,116,401 | 6,117,624 |
| Fidelity Securities Lending Cash Central Fund 4.87% (c)(d) | | 18,319,437 | 18,321,269 |
| TOTAL MONEY MARKET FUNDS (Cost $24,438,893) | | | 24,438,893 |
| | | | |
| TOTAL INVESTMENT IN SECURITIES - 101.8% (Cost $821,269,408) | 946,700,421 |
NET OTHER ASSETS (LIABILITIES) - (1.8)% | (17,108,115) |
| NET ASSETS - 100.0% | 929,592,306 |
| | |
Legend
| (b) | Security or a portion of the security is on loan at period end. |
| (c) | Affiliated fund that is generally available only to investment companies and other accounts managed by Fidelity Investments. The rate quoted is the annualized seven-day yield of the fund at period end. A complete unaudited listing of the fund's holdings as of its most recent quarter end is available upon request. In addition, each Fidelity Central Fund's financial statements, which are not covered by the Fund's Report of Independent Registered Public Accounting Firm, are available on the SEC's website or upon request. |
| (d) | Investment made with cash collateral received from securities on loan. |
Affiliated Central Funds
Fiscal year to date information regarding the Fund's investments in Fidelity Central Funds, including the ownership percentage, is presented below.
| Affiliate | Value, beginning of period ($) | Purchases ($) | Sales Proceeds ($) | Dividend Income ($) | Realized Gain (loss) ($) | Change in Unrealized appreciation (depreciation) ($) | Value, end of period ($) | % ownership, end of period |
| Fidelity Cash Central Fund 4.87% | 9,510,122 | 282,981,348 | 286,374,024 | 253,404 | 178 | - | 6,117,624 | 0.0% |
| Fidelity Securities Lending Cash Central Fund 4.87% | 16,678,557 | 515,954,831 | 514,312,119 | 715,097 | - | - | 18,321,269 | 0.1% |
| Total | 26,188,679 | 798,936,179 | 800,686,143 | 968,501 | 178 | - | 24,438,893 | |
| | | | | | | | | |
Amounts in the dividend income column in the above table include any capital gain distributions from underlying funds, which are presented in the corresponding line item in the Statement of Operations, if applicable.
Amounts in the dividend income column for Fidelity Securities Lending Cash Central Fund represents the income earned on investing cash collateral, less rebates paid to borrowers and any lending agent fees associated with the loan, plus any premium payments received for lending certain types of securities.
Amounts included in the purchases and sales proceeds columns may include in-kind transactions, if applicable.
Investment Valuation
The following is a summary of the inputs used, as of October 31, 2024, involving the Fund's assets and liabilities carried at fair value. The inputs or methodology used for valuing securities may not be an indication of the risk associated with investing in those securities. For more information on valuation inputs, and their aggregation into the levels used below, please refer to the Investment Valuation section in the accompanying Notes to Financial Statements.
| Valuation Inputs at Reporting Date: |
| Description | Total ($) | Level 1 ($) | Level 2 ($) | Level 3 ($) |
Investments in Securities: | | | | |
|
| Common Stocks | 922,261,528 | 787,099,867 | 135,161,661 | - |
|
| Money Market Funds | 24,438,893 | 24,438,893 | - | - |
| Total Investments in Securities: | 946,700,421 | 811,538,760 | 135,161,661 | - |
Financial Statements
| Statement of Assets and Liabilities |
As of October 31, 2024 |
| Assets | | | | |
| Investment in securities, at value (including securities loaned of $17,182,198) - See accompanying schedule: | | | | |
Unaffiliated issuers (cost $796,830,515) | $ | 922,261,528 | | |
Fidelity Central Funds (cost $24,438,893) | | 24,438,893 | | |
| | | | | |
| | | | | |
| Total Investment in Securities (cost $821,269,408) | | | $ | 946,700,421 |
| Cash | | | | 432,254 |
| Foreign currency held at value (cost $6,237) | | | | 6,216 |
| Receivable for investments sold | | | | 120,750 |
| Receivable for fund shares sold | | | | 572,825 |
| Dividends receivable | | | | 3,506,454 |
| Distributions receivable from Fidelity Central Funds | | | | 148,600 |
| Prepaid expenses | | | | 1,194 |
| Other receivables | | | | 4,782 |
Total assets | | | | 951,493,496 |
| Liabilities | | | | |
| Payable for investments purchased | $ | 1,112,284 | | |
| Payable for fund shares redeemed | | 1,491,217 | | |
| Accrued management fee | | 657,799 | | |
| Distribution and service plan fees payable | | 40,719 | | |
| Other payables and accrued expenses | | 277,902 | | |
| Collateral on securities loaned | | 18,321,269 | | |
| Total liabilities | | | | 21,901,190 |
| Net Assets | | | $ | 929,592,306 |
| Net Assets consist of: | | | | |
| Paid in capital | | | $ | 966,245,500 |
| Total accumulated earnings (loss) | | | | (36,653,194) |
| Net Assets | | | $ | 929,592,306 |
| | | | | |
| Net Asset Value and Maximum Offering Price | | | | |
| Class A : | | | | |
Net Asset Value and redemption price per share ($87,346,870 ÷ 4,580,315 shares)(a) | | | $ | 19.07 |
| Maximum offering price per share (100/94.25 of $19.07) | | | $ | 20.23 |
| Class M : | | | | |
Net Asset Value and redemption price per share ($14,821,453 ÷ 778,819 shares)(a) | | | $ | 19.03 |
| Maximum offering price per share (100/96.50 of $19.03) | | | $ | 19.72 |
| Class C : | | | | |
Net Asset Value and offering price per share ($18,117,928 ÷ 959,230 shares)(a) | | | $ | 18.89 |
| Global Commodity Stock : | | | | |
Net Asset Value, offering price and redemption price per share ($356,626,558 ÷ 18,638,002 shares) | | | $ | 19.13 |
| Class I : | | | | |
Net Asset Value, offering price and redemption price per share ($260,234,664 ÷ 13,618,078 shares) | | | $ | 19.11 |
| Class Z : | | | | |
Net Asset Value, offering price and redemption price per share ($192,444,833 ÷ 10,078,274 shares) | | | $ | 19.10 |
(a)Redemption price per share is equal to net asset value less any applicable contingent deferred sales charge. |
| Statement of Operations |
| Year ended October 31, 2024 |
| Investment Income | | | | |
| Dividends | | | $ | 29,679,077 |
| Interest | | | | 19,993 |
| Income from Fidelity Central Funds (including $715,097 from security lending) | | | | 968,501 |
| Income before foreign taxes withheld | | | $ | 30,667,571 |
| Less foreign taxes withheld | | | | (1,388,443) |
| Total income | | | | 29,279,128 |
| Expenses | | | | |
| Management fee | $ | 7,712,600 | | |
| Transfer agent fees | | 565,438 | | |
| Distribution and service plan fees | | 516,948 | | |
| Accounting fees | | 148,518 | | |
| Custodian fees and expenses | | 55,163 | | |
| Independent trustees' fees and expenses | | 4,770 | | |
| Registration fees | | 119,288 | | |
| Audit fees | | 55,360 | | |
| Legal | | 4,477 | | |
| Interest | | 24,442 | | |
| Miscellaneous | | 41,870 | | |
| Total expenses before reductions | | 9,248,874 | | |
| Expense reductions | | (44,655) | | |
| Total expenses after reductions | | | | 9,204,219 |
| Net Investment income (loss) | | | | 20,074,909 |
| Realized and Unrealized Gain (Loss) | | | | |
| Net realized gain (loss) on: | | | | |
| Investment Securities: | | | | |
| Unaffiliated issuers (net of foreign taxes of $2,329) | | 38,403,862 | | |
| Fidelity Central Funds | | 178 | | |
| Foreign currency transactions | | (113,068) | | |
| Total net realized gain (loss) | | | | 38,290,972 |
| Change in net unrealized appreciation (depreciation) on: | | | | |
| Investment Securities: | | | | |
| Unaffiliated issuers (net of increase in deferred foreign taxes of $206,382) | | 56,247,419 | | |
| Assets and liabilities in foreign currencies | | 1,558 | | |
| Total change in net unrealized appreciation (depreciation) | | | | 56,248,977 |
| Net gain (loss) | | | | 94,539,949 |
| Net increase (decrease) in net assets resulting from operations | | | $ | 114,614,858 |
| Statement of Changes in Net Assets |
| |
| | Year ended October 31, 2024 | | Year ended October 31, 2023 |
| Increase (Decrease) in Net Assets | | | | |
| Operations | | | | |
| Net investment income (loss) | $ | 20,074,909 | $ | 33,167,763 |
| Net realized gain (loss) | | 38,290,972 | | (8,892,001) |
| Change in net unrealized appreciation (depreciation) | | 56,248,977 | | (190,350,465) |
| Net increase (decrease) in net assets resulting from operations | | 114,614,858 | | (166,074,703) |
| Distributions to shareholders | | (21,790,381) | | (34,691,564) |
| | | | | |
| Share transactions - net increase (decrease) | | (268,013,410) | | (509,569,294) |
| Total increase (decrease) in net assets | | (175,188,933) | | (710,335,561) |
| | | | | |
| Net Assets | | | | |
| Beginning of period | | 1,104,781,239 | | 1,815,116,800 |
| End of period | $ | 929,592,306 | $ | 1,104,781,239 |
| | | | | |
| | | | | |
Financial Highlights
Fidelity Advisor® Global Commodity Stock Fund Class A |
| |
| Years ended October 31, | | 2024 | | 2023 | | 2022 | | 2021 | | 2020 |
Selected Per-Share Data | | | | | | | | | | |
| Net asset value, beginning of period | $ | 17.33 | $ | 19.50 | $ | 16.35 | $ | 10.80 | $ | 12.14 |
| Income from Investment Operations | | | | | | | | | | |
Net investment income (loss) A,B | | .33 | | .35 | | .47 | | .48 | | .28 |
| Net realized and unrealized gain (loss) | | 1.73 | | (2.20) | | 3.19 | | 5.24 | | (1.26) |
| Total from investment operations | | 2.06 | | (1.85) | | 3.66 | | 5.72 | | (.98) |
| Distributions from net investment income | | (.32) | | (.32) | | (.51) | | (.17) | | (.36) |
| Total distributions | | (.32) | | (.32) | | (.51) | | (.17) | | (.36) |
| Net asset value, end of period | $ | 19.07 | $ | 17.33 | $ | 19.50 | $ | 16.35 | $ | 10.80 |
Total Return C,D | | | | (9.64)% | | 23.27% | | 53.37% | | (8.39)% |
Ratios to Average Net Assets B,E,F | | | | | | | | | | |
| Expenses before reductions | | 1.16% | | 1.19% | | 1.19% | | 1.23% | | 1.31% |
| Expenses net of fee waivers, if any | | | | 1.18% | | 1.19% | | 1.22% | | 1.31% |
| Expenses net of all reductions | | 1.16% | | 1.18% | | 1.19% | | 1.22% | | 1.29% |
| Net investment income (loss) | | 1.76% | | 1.88% | | 2.53% | | 3.18% | | 2.53% |
| Supplemental Data | | | | | | | | | | |
| Net assets, end of period (000 omitted) | $ | 87,347 | $ | 95,290 | $ | 128,363 | $ | 45,343 | $ | 20,453 |
Portfolio turnover rate G | | | | 113% | | 42% | | 37% | | 40% |
ACalculated based on average shares outstanding during the period.
BNet investment income (loss) is affected by the timing of the declaration of dividends by any underlying mutual funds or exchange-traded funds (ETFs). Net investment income (loss) of any mutual funds or ETFs is not included in the Fund's net investment income (loss) ratio.
CTotal returns would have been lower if certain expenses had not been reduced during the applicable periods shown.
DTotal returns do not include the effect of the sales charges.
EFees and expenses of any underlying mutual funds or exchange-traded funds (ETFs) are not included in the Fund's expense ratio. The Fund indirectly bears its proportionate share of these expenses.
FExpense ratios reflect operating expenses of the class. Expenses before reductions do not reflect amounts reimbursed, waived, or reduced through arrangements with the investment adviser, brokerage services, or other offset arrangements, if applicable, and do not represent the amount paid by the class during periods when reimbursements, waivers or reductions occur.
GAmount does not include the portfolio activity of any underlying mutual funds or exchange-traded funds (ETFs).
Fidelity Advisor® Global Commodity Stock Fund Class M |
| |
| Years ended October 31, | | 2024 | | 2023 | | 2022 | | 2021 | | 2020 |
Selected Per-Share Data | | | | | | | | | | |
| Net asset value, beginning of period | $ | 17.28 | $ | 19.46 | $ | 16.32 | $ | 10.78 | $ | 12.12 |
| Income from Investment Operations | | | | | | | | | | |
Net investment income (loss) A,B | | .28 | | .30 | | .42 | | .44 | | .25 |
| Net realized and unrealized gain (loss) | | 1.73 | | (2.20) | | 3.19 | | 5.24 | | (1.27) |
| Total from investment operations | | 2.01 | | (1.90) | | 3.61 | | 5.68 | | (1.02) |
| Distributions from net investment income | | (.26) | | (.28) | | (.47) | | (.14) | | (.32) |
| Total distributions | | (.26) | | (.28) | | (.47) | | (.14) | | (.32) |
| Net asset value, end of period | $ | 19.03 | $ | 17.28 | $ | 19.46 | $ | 16.32 | $ | 10.78 |
Total Return C,D | | | | (9.90)% | | 22.93% | | 52.97% | | (8.72)% |
Ratios to Average Net Assets B,E,F | | | | | | | | | | |
| Expenses before reductions | | 1.42% | | 1.47% | | 1.46% | | 1.52% | | 1.59% |
| Expenses net of fee waivers, if any | | | | 1.45% | | 1.46% | | 1.52% | | 1.59% |
| Expenses net of all reductions | | 1.41% | | 1.45% | | 1.46% | | 1.52% | | 1.58% |
| Net investment income (loss) | | 1.51% | | 1.62% | | 2.26% | | 2.88% | | 2.24% |
| Supplemental Data | | | | | | | | | | |
| Net assets, end of period (000 omitted) | $ | 14,821 | $ | 17,928 | $ | 24,513 | $ | 8,888 | $ | 4,378 |
Portfolio turnover rate G | | | | 113% | | 42% | | 37% | | 40% |
ACalculated based on average shares outstanding during the period.
BNet investment income (loss) is affected by the timing of the declaration of dividends by any underlying mutual funds or exchange-traded funds (ETFs). Net investment income (loss) of any mutual funds or ETFs is not included in the Fund's net investment income (loss) ratio.
CTotal returns would have been lower if certain expenses had not been reduced during the applicable periods shown.
DTotal returns do not include the effect of the sales charges.
EFees and expenses of any underlying mutual funds or exchange-traded funds (ETFs) are not included in the Fund's expense ratio. The Fund indirectly bears its proportionate share of these expenses.
FExpense ratios reflect operating expenses of the class. Expenses before reductions do not reflect amounts reimbursed, waived, or reduced through arrangements with the investment adviser, brokerage services, or other offset arrangements, if applicable, and do not represent the amount paid by the class during periods when reimbursements, waivers or reductions occur.
GAmount does not include the portfolio activity of any underlying mutual funds or exchange-traded funds (ETFs).
Fidelity Advisor® Global Commodity Stock Fund Class C |
| |
| Years ended October 31, | | 2024 | | 2023 | | 2022 | | 2021 | | 2020 |
Selected Per-Share Data | | | | | | | | | | |
| Net asset value, beginning of period | $ | 17.11 | $ | 19.29 | $ | 16.17 | $ | 10.68 | $ | 11.99 |
| Income from Investment Operations | | | | | | | | | | |
Net investment income (loss) A,B | | .18 | | .21 | | .33 | | .37 | | .20 |
| Net realized and unrealized gain (loss) | | 1.74 | | (2.18) | | 3.18 | | 5.20 | | (1.26) |
| Total from investment operations | | 1.92 | | (1.97) | | 3.51 | | 5.57 | | (1.06) |
| Distributions from net investment income | | (.14) | | (.21) | | (.39) | | (.08) | | (.25) |
| Total distributions | | (.14) | | (.21) | | (.39) | | (.08) | | (.25) |
| Net asset value, end of period | $ | 18.89 | $ | 17.11 | $ | 19.29 | $ | 16.17 | $ | 10.68 |
Total Return C,D | | | | (10.34)% | | 22.34% | | 52.30% | | (9.11)% |
Ratios to Average Net Assets B,E,F | | | | | | | | | | |
| Expenses before reductions | | 1.91% | | 1.94% | | 1.94% | | 1.97% | | 2.05% |
| Expenses net of fee waivers, if any | | | | 1.93% | | 1.93% | | 1.96% | | 2.04% |
| Expenses net of all reductions | | 1.91% | | 1.93% | | 1.93% | | 1.96% | | 2.03% |
| Net investment income (loss) | | 1.01% | | 1.13% | | 1.78% | | 2.44% | | 1.79% |
| Supplemental Data | | | | | | | | | | |
| Net assets, end of period (000 omitted) | $ | 18,118 | $ | 23,853 | $ | 34,984 | $ | 11,020 | $ | 7,871 |
Portfolio turnover rate G | | | | 113% | | 42% | | 37% | | 40% |
ACalculated based on average shares outstanding during the period.
BNet investment income (loss) is affected by the timing of the declaration of dividends by any underlying mutual funds or exchange-traded funds (ETFs). Net investment income (loss) of any mutual funds or ETFs is not included in the Fund's net investment income (loss) ratio.
CTotal returns would have been lower if certain expenses had not been reduced during the applicable periods shown.
DTotal returns do not include the effect of the contingent deferred sales charge.
EFees and expenses of any underlying mutual funds or exchange-traded funds (ETFs) are not included in the Fund's expense ratio. The Fund indirectly bears its proportionate share of these expenses.
FExpense ratios reflect operating expenses of the class. Expenses before reductions do not reflect amounts reimbursed, waived, or reduced through arrangements with the investment adviser, brokerage services, or other offset arrangements, if applicable, and do not represent the amount paid by the class during periods when reimbursements, waivers or reductions occur.
GAmount does not include the portfolio activity of any underlying mutual funds or exchange-traded funds (ETFs).
Fidelity® Global Commodity Stock Fund |
| |
| Years ended October 31, | | 2024 | | 2023 | | 2022 | | 2021 | | 2020 |
Selected Per-Share Data | | | | | | | | | | |
| Net asset value, beginning of period | $ | 17.38 | $ | 19.55 | $ | 16.39 | $ | 10.82 | $ | 12.15 |
| Income from Investment Operations | | | | | | | | | | |
Net investment income (loss) A,B | | .38 | | .40 | | .52 | | .53 | | .31 |
| Net realized and unrealized gain (loss) | | 1.73 | | (2.21) | | 3.19 | | 5.26 | | (1.26) |
| Total from investment operations | | 2.11 | | (1.81) | | 3.71 | | 5.79 | | (.95) |
| Distributions from net investment income | | (.36) | | (.36) | | (.55) | | (.22) | | (.38) |
| Total distributions | | (.36) | | (.36) | | (.55) | | (.22) | | (.38) |
| Net asset value, end of period | $ | 19.13 | $ | 17.38 | $ | 19.55 | $ | 16.39 | $ | 10.82 |
Total Return C | | | | (9.47)% | | 23.57% | | 53.95% | | (8.16)% |
Ratios to Average Net Assets B,D,E | | | | | | | | | | |
| Expenses before reductions | | .89% | | .97% | | .94% | | .94% | | 1.02% |
| Expenses net of fee waivers, if any | | | | .95% | | .94% | | .94% | | 1.02% |
| Expenses net of all reductions | | .89% | | .95% | | .94% | | .94% | | 1.00% |
| Net investment income (loss) | | 2.03% | | 2.12% | | 2.78% | | 3.46% | | 2.82% |
| Supplemental Data | | | | | | | | | | |
| Net assets, end of period (000 omitted) | $ | 356,627 | $ | 428,912 | $ | 893,636 | $ | 546,863 | $ | 176,718 |
Portfolio turnover rate F | | | | 113% | | 42% | | 37% | | 40% |
ACalculated based on average shares outstanding during the period.
BNet investment income (loss) is affected by the timing of the declaration of dividends by any underlying mutual funds or exchange-traded funds (ETFs). Net investment income (loss) of any mutual funds or ETFs is not included in the Fund's net investment income (loss) ratio.
CTotal returns would have been lower if certain expenses had not been reduced during the applicable periods shown.
DFees and expenses of any underlying mutual funds or exchange-traded funds (ETFs) are not included in the Fund's expense ratio. The Fund indirectly bears its proportionate share of these expenses.
EExpense ratios reflect operating expenses of the class. Expenses before reductions do not reflect amounts reimbursed, waived, or reduced through arrangements with the investment adviser, brokerage services, or other offset arrangements, if applicable, and do not represent the amount paid by the class during periods when reimbursements, waivers or reductions occur.
FAmount does not include the portfolio activity of any underlying mutual funds or exchange-traded funds (ETFs).
Fidelity Advisor® Global Commodity Stock Fund Class I |
| |
| Years ended October 31, | | 2024 | | 2023 | | 2022 | | 2021 | | 2020 |
Selected Per-Share Data | | | | | | | | | | |
| Net asset value, beginning of period | $ | 17.37 | $ | 19.54 | $ | 16.39 | $ | 10.81 | $ | 12.16 |
| Income from Investment Operations | | | | | | | | | | |
Net investment income (loss) A,B | | .37 | | .40 | | .52 | | .53 | | .32 |
| Net realized and unrealized gain (loss) | | 1.74 | | (2.20) | | 3.19 | | 5.25 | | (1.26) |
| Total from investment operations | | 2.11 | | (1.80) | | 3.71 | | 5.78 | | (.94) |
| Distributions from net investment income | | (.37) | | (.37) | | (.56) | | (.20) | | (.41) |
| Total distributions | | (.37) | | (.37) | | (.56) | | (.20) | | (.41) |
| Net asset value, end of period | $ | 19.11 | $ | 17.37 | $ | 19.54 | $ | 16.39 | $ | 10.81 |
Total Return C | | | | (9.42)% | | 23.56% | | 53.97% | | (8.11)% |
Ratios to Average Net Assets B,D,E | | | | | | | | | | |
| Expenses before reductions | | .90% | | .92% | | .92% | | .93% | | .95% |
| Expenses net of fee waivers, if any | | | | .91% | | .92% | | .93% | | .95% |
| Expenses net of all reductions | | .90% | | .91% | | .92% | | .93% | | .93% |
| Net investment income (loss) | | 2.02% | | 2.15% | | 2.80% | | 3.48% | | 2.88% |
| Supplemental Data | | | | | | | | | | |
| Net assets, end of period (000 omitted) | $ | 260,235 | $ | 351,709 | $ | 499,191 | $ | 85,252 | $ | 33,185 |
Portfolio turnover rate F | | | | 113% | | 42% | | 37% | | 40% |
ACalculated based on average shares outstanding during the period.
BNet investment income (loss) is affected by the timing of the declaration of dividends by any underlying mutual funds or exchange-traded funds (ETFs). Net investment income (loss) of any mutual funds or ETFs is not included in the Fund's net investment income (loss) ratio.
CTotal returns would have been lower if certain expenses had not been reduced during the applicable periods shown.
DFees and expenses of any underlying mutual funds or exchange-traded funds (ETFs) are not included in the Fund's expense ratio. The Fund indirectly bears its proportionate share of these expenses.
EExpense ratios reflect operating expenses of the class. Expenses before reductions do not reflect amounts reimbursed, waived, or reduced through arrangements with the investment adviser, brokerage services, or other offset arrangements, if applicable, and do not represent the amount paid by the class during periods when reimbursements, waivers or reductions occur.
FAmount does not include the portfolio activity of any underlying mutual funds or exchange-traded funds (ETFs).
Fidelity Advisor® Global Commodity Stock Fund Class Z |
| |
| Years ended October 31, | | 2024 | | 2023 | | 2022 | | 2021 | | 2020 |
Selected Per-Share Data | | | | | | | | | | |
| Net asset value, beginning of period | $ | 17.37 | $ | 19.53 | $ | 16.38 | $ | 10.81 | $ | 12.16 |
| Income from Investment Operations | | | | | | | | | | |
Net investment income (loss) A,B | | .40 | | .43 | | .54 | | .56 | | .34 |
| Net realized and unrealized gain (loss) | | 1.74 | | (2.21) | | 3.19 | | 5.23 | | (1.26) |
| Total from investment operations | | 2.14 | | (1.78) | | 3.73 | | 5.79 | | (.92) |
| Distributions from net investment income | | (.41) | | (.38) | | (.58) | | (.22) | | (.43) |
| Total distributions | | (.41) | | (.38) | | (.58) | | (.22) | | (.43) |
| Net asset value, end of period | $ | 19.10 | $ | 17.37 | $ | 19.53 | $ | 16.38 | $ | 10.81 |
Total Return C | | | | (9.30)% | | 23.72% | | 54.07% | | (7.99)% |
Ratios to Average Net Assets B,D,E | | | | | | | | | | |
| Expenses before reductions | | .77% | | .79% | | .79% | | .80% | | .85% |
| Expenses net of fee waivers, if any | | | | .78% | | .79% | | .80% | | .84% |
| Expenses net of all reductions | | .76% | | .78% | | .79% | | .80% | | .83% |
| Net investment income (loss) | | 2.16% | | 2.29% | | 2.93% | | 3.60% | | 2.99% |
| Supplemental Data | | | | | | | | | | |
| Net assets, end of period (000 omitted) | $ | 192,445 | $ | 187,090 | $ | 234,430 | $ | 60,837 | $ | 16,505 |
Portfolio turnover rate F | | | | 113% | | 42% | | 37% | | 40% |
ACalculated based on average shares outstanding during the period.
BNet investment income (loss) is affected by the timing of the declaration of dividends by any underlying mutual funds or exchange-traded funds (ETFs). Net investment income (loss) of any mutual funds or ETFs is not included in the Fund's net investment income (loss) ratio.
CTotal returns would have been lower if certain expenses had not been reduced during the applicable periods shown.
DFees and expenses of any underlying mutual funds or exchange-traded funds (ETFs) are not included in the Fund's expense ratio. The Fund indirectly bears its proportionate share of these expenses.
EExpense ratios reflect operating expenses of the class. Expenses before reductions do not reflect amounts reimbursed, waived, or reduced through arrangements with the investment adviser, brokerage services, or other offset arrangements, if applicable, and do not represent the amount paid by the class during periods when reimbursements, waivers or reductions occur.
FAmount does not include the portfolio activity of any underlying mutual funds or exchange-traded funds (ETFs).
Notes to Financial Statements
For the period ended October 31, 2024
1. Organization.
Fidelity Global Commodity Stock Fund (the Fund) is a non-diversified fund of Fidelity Investment Trust (the Trust) and is authorized to issue an unlimited number of shares. The Trust is registered under the Investment Company Act of 1940, as amended (the 1940 Act), as an open-end management investment company organized as a Massachusetts business trust. The Fund offers Class A, Class M, Class C, Global Commodity Stock Class I and Class Z shares, each of which has equal rights as to assets and voting privileges. Class A, Class M, Class C, Class I and Class Z are Fidelity Advisor classes. Each class has exclusive voting rights with respect to matters that affect that class. Class C shares will automatically convert to Class A shares after a holding period of eight years from the initial date of purchase, with certain exceptions.
2. Investments in Fidelity Central Funds.
Funds may invest in Fidelity Central Funds, which are open-end investment companies generally available only to other investment companies and accounts managed by the investment adviser and its affiliates. The Schedule of Investments lists any Fidelity Central Funds held as an investment as of period end, but does not include the underlying holdings of each Fidelity Central Fund. An investing fund indirectly bears its proportionate share of the expenses of the underlying Fidelity Central Funds.
Based on its investment objective, each Fidelity Central Fund may invest or participate in various investment vehicles or strategies that are similar to those of the investing fund. These strategies are consistent with the investment objectives of the investing fund and may involve certain economic risks which may cause a decline in value of each of the Fidelity Central Funds and thus a decline in the value of the investing fund.
| Fidelity Central Fund | Investment Manager | Investment Objective | Investment Practices | Expense RatioA |
| Fidelity Money Market Central Funds | Fidelity Management & Research Company LLC (FMR) | Each fund seeks to obtain a high level of current income consistent with the preservation of capital and liquidity. | Short-term Investments | Less than .005% |
A Expenses expressed as a percentage of average net assets and are as of each underlying Central Fund's most recent annual or semi-annual shareholder report.
A complete unaudited list of holdings for each Fidelity Central Fund is available upon request or at the Securities and Exchange Commission website at www.sec.gov. In addition, the financial statements of the Fidelity Central Funds which contain the significant accounting policies (including investment valuation policies) of those funds, and are not covered by the Report of Independent Registered Public Accounting Firm, are available on the Securities and Exchange Commission website or upon request.
3. Significant Accounting Policies.
The Fund is an investment company and applies the accounting and reporting guidance of the Financial Accounting Standards Board (FASB) Accounting Standards Codification Topic 946 Financial Services - Investment Companies. The financial statements have been prepared in conformity with accounting principles generally accepted in the United States of America (GAAP), which require management to make certain estimates and assumptions at the date of the financial statements. Actual results could differ from those estimates. Subsequent events, if any, through the date that the financial statements were issued have been evaluated in the preparation of the financial statements. The Fund's Schedule of Investments lists any underlying mutual funds or exchange-traded funds (ETFs) but does not include the underlying holdings of these funds. The following summarizes the significant accounting policies of the Fund:
Investment Valuation. Investments are valued as of 4:00 p.m. Eastern time on the last calendar day of the period. The Board of Trustees (the Board) has designated the Fund's investment adviser as the valuation designee responsible for the fair valuation function and performing fair value determinations as needed. The investment adviser has established a Fair Value Committee (the Committee) to carry out the day-to-day fair valuation responsibilities and has adopted policies and procedures to govern the fair valuation process and the activities of the Committee. In accordance with these fair valuation policies and procedures, which have been approved by the Board, the Fund attempts to obtain prices from one or more third party pricing services or brokers to value its investments. When current market prices, quotations or currency exchange rates are not readily available or reliable, investments will be fair valued in good faith by the Committee, in accordance with the policies and procedures. Factors used in determining fair value vary by investment type and may include market or investment specific events, transaction data, estimated cash flows, and market observations of comparable investments. The frequency that the fair valuation procedures are used cannot be predicted and they may be utilized to a significant extent. The Committee manages the Fund's fair valuation practices and maintains the fair valuation policies and procedures. The Fund's investment adviser reports to the Board information regarding the fair valuation process and related material matters.
The Fund categorizes the inputs to valuation techniques used to value its investments into a disclosure hierarchy consisting of three levels as shown below:
Level 1 - unadjusted quoted prices in active markets for identical investments
Level 2 - other significant observable inputs (including quoted prices for similar investments, interest rates, prepayment speeds, etc.)
Level 3 - unobservable inputs (including the Fund's own assumptions based on the best information available)
Valuation techniques used to value the Fund's investments by major category are as follows:
Equity securities, including restricted securities, for which market quotations are readily available, are valued at the last reported sale price or official closing price as reported by a third party pricing service on the primary market or exchange on which they are traded and are categorized as Level 1 in the hierarchy. In the event there were no sales during the day or closing prices are not available, securities are valued at the last quoted bid price or may be valued using the last available price and are generally categorized as Level 2 in the hierarchy. For foreign equity securities, when market or security specific events arise, comparisons to the valuation of American Depositary Receipts (ADRs), futures contracts, Exchange-Traded Funds (ETFs) and certain indexes as well as quoted prices for similar securities may be used and would be categorized as Level 2 in the hierarchy. For equity securities, including restricted securities, where observable inputs are limited, assumptions about market activity and risk are used and these securities may be categorized as Level 3 in the hierarchy.
Investments in open-end mutual funds, including the Fidelity Central Funds, are valued at their closing net asset value (NAV) each business day and are categorized as Level 1 in the hierarchy.
Changes in valuation techniques may result in transfers in or out of an assigned level within the disclosure hierarchy. The aggregate value of investments by input level as of October 31, 2024 is included at the end of the Fund's Schedule of Investments.
Foreign Currency. Certain Funds may use foreign currency contracts to facilitate transactions in foreign-denominated securities. Gains and losses from these transactions may arise from changes in the value of the foreign currency or if the counterparties do not perform under the contracts' terms.
Foreign-denominated assets, including investment securities, and liabilities are translated into U.S. dollars at the exchange rates at period end. Purchases and sales of investment securities, income and dividends received, and expenses denominated in foreign currencies are translated into U.S. dollars at the exchange rate in effect on the transaction date.
The effects of exchange rate fluctuations on investments are included with the net realized and unrealized gain (loss) on investment securities. Other foreign currency transactions resulting in realized and unrealized gain (loss) are disclosed separately.
Investment Transactions and Income. For financial reporting purposes, the Fund's investment holdings and NAV include trades executed through the end of the last business day of the period. The NAV per share for processing shareholder transactions is calculated as of the close of business of the New York Stock Exchange (NYSE), normally 4:00 p.m. Eastern time and includes trades executed through the end of the prior business day. Gains and losses on securities sold are determined on the basis of identified cost and include proceeds received from litigation. Commissions paid to certain brokers with whom the investment adviser, or its affiliates, places trades on behalf of a fund include an amount in addition to trade execution, which may be rebated back to a fund. Any such rebates are included in net realized gain (loss) on investments in the Statement of Operations. Dividend income is recorded on the ex-dividend date, except for certain dividends from foreign securities where the ex-dividend date may have passed, which are recorded as soon as the Fund is informed of the ex-dividend date. Non-cash dividends included in dividend income, if any, are recorded at the fair market value of the securities received. Income and capital gain distributions from Fidelity Central Funds, if any, are recorded on the ex-dividend date. Certain distributions received by the Fund represent a return of capital or capital gain. The Fund determines the components of these distributions subsequent to the ex-dividend date, based upon receipt of tax filings or other correspondence relating to the underlying investment. These distributions are recorded as a reduction of cost of investments and/or as a realized gain. Interest income is accrued as earned and includes coupon interest and amortization of premium and accretion of discount on debt securities as applicable. Investment income is recorded net of foreign taxes withheld where recovery of such taxes is uncertain. Funds may file withholding tax reclaims in certain jurisdictions to recover a portion of amounts previously withheld. Any withholding tax reclaims income is included in the Statement of Operations in foreign taxes withheld. Any receivables for withholding tax reclaims are included in the Statement of Assets and Liabilities in dividends receivable. The Fund, has filed tax reclaims for previously withheld taxes on dividends earned in certain European Union (EU) countries. These additional filings are subject to various administrative proceedings by the local jurisdictions' tax authorities within the EU, as well as a number of related judicial proceedings. Income recognized for EU reclaims is included with other reclaims in the Statement of Operations in foreign taxes withheld. These reclaims are recorded when the amount is known and there are no significant uncertainties on collectability.
Class Allocations and Expenses. Investment income, realized and unrealized capital gains and losses, common expenses of a fund, and certain fund-level expense reductions, if any, are allocated daily on a pro-rata basis to each class based on the relative net assets of each class to the total net assets of a fund. Each class differs with respect to transfer agent and distribution and service plan fees incurred, as applicable. Certain expense reductions may also differ by class, if applicable. For the reporting period, the allocated portion of income and expenses to each class as a percent of its average net assets may vary due to the timing of recording these transactions in relation to fluctuating net assets of the classes. Expenses directly attributable to a fund are charged to that fund. Expenses attributable to more than one fund are allocated among the respective funds on the basis of relative net assets or other appropriate methods. Expenses included in the accompanying financial statements reflect the expenses of that fund and do not include any expenses associated with any underlying mutual funds or exchange-traded funds (ETFs). Although not included in a fund's expenses, a fund indirectly bears its proportionate share of these expenses through the net asset value of each underlying mutual fund or exchange-traded fund (ETF). Expense estimates are accrued in the period to which they relate and adjustments are made when actual amounts are known.
Income Tax Information and Distributions to Shareholders. Each year, the Fund intends to qualify as a regulated investment company under Subchapter M of the Internal Revenue Code, including distributing substantially all of its taxable income and realized gains. As a result, no provision for U.S. Federal income taxes is required. As of October 31, 2024, the Fund did not have any unrecognized tax benefits in the financial statements; nor is the Fund aware of any tax positions for which it is reasonably possible that the total amounts of unrecognized tax benefits will significantly change in the next twelve months. The Fund files a U.S. federal tax return, in addition to state and local tax returns as required. The Fund's federal income tax returns are subject to examination by the Internal Revenue Service (IRS) for a period of three fiscal years after they are filed. State and local tax returns may be subject to examination for an additional fiscal year depending on the jurisdiction. Foreign taxes are provided for based on the Fund's understanding of the tax rules and rates that exist in the foreign markets in which it invests. The Fund is subject to a tax imposed on capital gains by certain countries in which it invests. An estimated deferred tax liability for net unrealized appreciation on the applicable securities is included in Other payables and accrued expenses on the Statement of Assets and Liabilities.
Distributions are declared and recorded on the ex-dividend date. Income and capital gain distributions are declared separately for each class. Income and capital gain distributions are determined in accordance with income tax regulations, which may differ from GAAP. In addition, the Fund claimed a portion of the payment made to redeeming shareholders as a distribution for income tax purposes
Capital accounts within the financial statements are adjusted for permanent book-tax differences. These adjustments have no impact on net assets or the results of operations. Capital accounts are not adjusted for temporary book-tax differences which will reverse in a subsequent period.
Book-tax differences are primarily due to foreign currency transactions, certain foreign taxes, passive foreign investment companies (PFIC), partnerships, capital loss carryforwards and losses deferred due to wash sales.
As of period end, the cost and unrealized appreciation (depreciation) in securities, and derivatives if applicable, for federal income tax purposes were as follows:
| Gross unrealized appreciation | $161,353,116 |
| Gross unrealized depreciation | (37,904,398) |
| Net unrealized appreciation (depreciation) | $123,448,718 |
| Tax Cost | $823,251,703 |
The tax-based components of distributable earnings as of period end were as follows:
| Undistributed ordinary income | $17,715,820 |
| Capital loss carryforward | $(176,525,955) |
| Net unrealized appreciation (depreciation) on securities and other investments | $122,363,322 |
Capital loss carryforwards are only available to offset future capital gains of the Fund to the extent provided by regulations and may be limited. The capital loss carryforward information presented below, including any applicable limitation, is estimated as of fiscal period end and is subject to adjustment.
Short-term | $(176,525,955) |
| Total capital loss carryforward | $(176,525,955) |
The tax character of distributions paid was as follows:
| | October 31, 2024 | October 31, 2023 |
| Ordinary Income | $21,790,381 | $34,691,564 |
New Accounting Pronouncement. In November 2023, the FASB issued Accounting Standards Update (ASU) 2023-07 Segment Reporting (Topic 280): Improvements to Reportable Segment Disclosures. Effective for fiscal years beginning after December 15, 2023 and interim periods within fiscal years beginning after December 15, 2024, the amendments enhance required disclosures of segment information for public entities on an annual and interim basis. The ASU allows for early adoption with updates applied retrospectively. Management is currently evaluating the impact of the ASU but does not expect this guidance to materially impact the financial statements.
4. Purchases and Sales of Investments.
Purchases and sales of securities, other than short-term securities and in-kind transactions, as applicable, are noted in the table below.
| | Purchases ($) | Sales ($) |
| Fidelity Global Commodity Stock Fund | 496,358,721 | 760,339,395 |
5. Fees and Other Transactions with Affiliates.
Management Fee. Fidelity Management & Research Company LLC (the investment adviser) and its affiliates provide the Fund with investment management related services for which the Fund pays a monthly management fee.
Effective March 1, 2024, the Fund's management contract was amended to incorporate administrative services previously covered under separate services agreements (Transfer Agent and Accounting agreements). The amended contract incorporates a management fee rate that may vary by class. The investment adviser or an affiliate pays certain expenses of managing and operating the Fund out of each class's management fee. Each class of the Fund pays a management fee to the investment adviser. The management fee is calculated and paid to the investment adviser every month. When determining a class's management fee, a mandate rate is calculated based on the monthly average net assets of a group of funds advised by FMR within a designated asset class. A discount rate is subtracted from the mandate rate once the Fund's monthly average net assets reach a certain level. The mandate rate and discount rate may vary by class. The annual management fee rate for a class of shares of the Fund is the lesser of (1) the class's mandate rate reduced by the class's discount rate (if applicable) or (2) the amount set forth in the following table.
| | Maximum Management Fee Rate % |
| Class A | .88 |
| Class M | .89 |
| Class C | .88 |
| Global Commodity Stock | .89 |
| Class I | .86 |
| Class Z | .73 |
One-twelfth of the management fee rate for a class is applied to the average net assets of the class for the month, giving a dollar amount which is the management fee for the class for that month. A different management fee rate may be applicable to each class of the Fund. The difference between classes is the result of separate arrangements for class-level services and/or waivers of certain expenses. It is not the result of any difference in advisory or custodial fees or other expenses related to the management of the Fund's assets, which do not vary by class. For the portion of the reporting period on or after March 1, 2024, the total annualized management fee rates were as follows:
| | Total Management Fee Rate % |
| Class A | .87 |
| Class M | .87 |
| Class C | .87 |
| Global Commodity Stock | .83 |
| Class I | .86 |
| Class Z | .73 |
Prior to March 1, 2024, the management fee was the sum of an individual fund fee rate that was based on an annual rate of .45% of the Fund's average net assets and an annualized group fee rate that averaged .22% during the period. The group fee rate was based upon the monthly average net assets of a group of registered investment companies with which the investment adviser has management contracts. The group fee rate decreased as assets under management increased and increased as assets under management decreased. For the portion of the reporting period prior to March 1, 2024, the total annualized management fee rate was .67%.
Effective March 1, 2024, the Fund's sub-advisory agreements with FMR Investment Management (UK) Limited, Fidelity Management & Research (Hong Kong) Limited, and Fidelity Management & Research (Japan) Limited were amended to provide that the investment adviser pays each sub-adviser monthly fees equal to 110% of the sub-adviser's costs for providing sub-advisory services.
Effective March 1, 2024, the Fund's sub-advisory agreement with FIL Investment Advisors (FIA) was amended to provide that the investment adviser pays FIA monthly fees at an annual rate of 0.38% with respect to the average daily net assets of the Fund managed by FIA. FIA in turn pays FIA(UK).
Distribution and Service Plan Fees. In accordance with Rule 12b-1 of the 1940 Act, the Fund has adopted separate Distribution and Service Plans for each class of shares. Certain classes pay Fidelity Distributors Company LLC (FDC), an affiliate of the investment adviser, separate Distribution and Service Fees, each of which is based on an annual percentage of each class' average net assets. In addition, FDC may pay financial intermediaries for selling shares of the Fund and providing shareholder support services. For the period, the Distribution and Service Fee rates, total fees and amounts retained by FDC were as follows:
| | Distribution Fee | Service Fee | Total Fees ($) | Retained by FDC ($) |
| Class A | - % | .25% | 227,273 | 5,639 |
| Class M | .25% | .25% | 86,208 | - |
| Class C | .75% | .25% | 203,467 | 14,640 |
| | | | 516,948 | 20,279 |
Sales Load. FDC may receive a front-end sales charge of up to 5.75% for selling Class A shares and 3.50% for selling Class M shares, some of which is paid to financial intermediaries for selling shares of the Fund. Depending on the holding period, FDC may receive contingent deferred sales charges levied on Class A, Class M and Class C redemptions. The deferred sales charges are 1.00% for Class C shares, 1.00% for certain purchases of Class A shares and .25% for certain purchases of Class M shares.
For the period, sales charge amounts retained by FDC were as follows:
| | Retained by FDC ($) |
| Class A | 20,568 |
| Class M | 1,018 |
Class CA | 158 |
| | 21,744 |
A When Class C shares are initially sold, FDC pays commissions from its own resources to financial intermediaries through which the sales are made.
Transfer Agent Fees. Fidelity Investments Institutional Operations Company LLC (FIIOC), an affiliate of the investment adviser, is the transfer, dividend disbursing and shareholder servicing agent for each class of the Fund. Effective March 1, 2024, the Fund's management contract was amended to incorporate transfer agent services and associated fees previously covered under a separate services agreement. FIIOC pays for typesetting, printing and mailing of shareholder reports, except proxy statements.
During the period December 1, 2023 through February 29, 2024, the transfer agent fees for each class were a fixed annual rate of class-level average net assets as follows:
| | % of Class-Level Average Net Assets |
| Class A | .1937 |
| Class M | .2000 |
| Class C | .1930 |
| Global Commodity Stock | .2000 |
| Class I | .1745 |
| Class Z | .0420 |
| | |
Prior to December 1, 2023, FIIOC received account fees and asset-based fees that varied according to the account size and type of account of the shareholders of the respective classes of the Fund, except for Class Z. FIIOC received an asset-based fee of Class Z's average net assets. For the portion of the reporting period prior to March 1, 2024, the fees were equivalent to the following annualized rates:
| | Amount ($) | % of Class-Level Average Net Assets |
| Class A | 58,488 | .19 |
| Class M | 11,957 | .21 |
| Class C | 13,923 | .19 |
| Global Commodity Stock | 273,849 | .21 |
| Class I | 181,788 | .17 |
| Class Z | 25,433 | .04 |
| 565,438 | |
Accounting Fees. Fidelity Service Company, Inc. (FSC), an affiliate of the investment adviser, maintains the Fund's accounting records. Effective March 1, 2024, the Fund's management contract was amended to incorporate accounting services and associated fees previously covered under a separate services agreement.
During the period December 1, 2023 through February 29, 2024, the accounting fees were a fixed annual rate of average net assets as follows:
| | % of Average Net Assets |
| Fidelity Global Commodity Stock Fund | .0435 |
Prior to December 1, 2023, the accounting fee was based on the level of average net assets for each month. For the portion of the reporting period prior to March 1, 2024, the fees were equivalent to the following annualized rates:
| | % of Average Net Assets |
| Fidelity Global Commodity Stock Fund | .04 |
Brokerage Commissions. A portion of portfolio transactions were placed with brokerage firms which are affiliates of the investment adviser. Brokerage commissions are included in net realized gain (loss) and change in net unrealized appreciation (depreciation) in the Statement of Operations. The commissions paid to these affiliated firms were as follows:
| | Amount ($) |
| Fidelity Global Commodity Stock Fund | 12,632 |
Interfund Lending Program. Pursuant to an Exemptive Order issued by the Securities and Exchange Commission (the SEC), the Fund, along with other registered investment companies having management contracts with Fidelity Management & Research Company LLC (FMR), or other affiliated entities of FMR, may participate in an interfund lending program. This program provides an alternative credit facility allowing the Fund to borrow from, or lend money to, other participating affiliated funds at rates that are beneficial to both the borrowing and lending fund. Borrowings under the program are generally for temporary or emergency purposes, including meeting fund shareholder redemptions. The interfund loan rate is determined, as specified in the Exemptive Order, by averaging, (1) the higher of the overnight time deposit rate and the current overnight repurchase agreement rate, and (2) a benchmark rate representing the lowest bank loan rate available to the funds. At period end, there were no interfund loans outstanding. Activity in this program during the period for which loans were outstanding was as follows:
| | Borrower or Lender | Average Loan Balance ($) | Weighted Average Interest Rate | Interest Expense ($) |
| Fidelity Global Commodity Stock Fund | Borrower | 10,590,800 | 5.54% | 24,442 |
Interfund Trades. Funds may purchase from or sell securities to other Fidelity Funds under procedures adopted by the Board. The procedures have been designed to ensure these interfund trades are executed in accordance with Rule 17a-7 of the 1940 Act. Any interfund trades are included within the respective purchases and sales amounts shown in the Purchases and Sales of Investments note. Interfund trades during the period are noted in the table below.
| | Purchases ($) | Sales ($) | Realized Gain (Loss)($) |
| Fidelity Global Commodity Stock Fund | 15,421,848 | 29,850,993 | 2,914,457 |
6. Committed Line of Credit.
Certain Funds participate with other funds managed by the investment adviser or an affiliate in a $4.25 billion credit facility (the "line of credit") to be utilized for temporary or emergency purposes to fund shareholder redemptions or for other short-term liquidity purposes. The participating funds have agreed to pay commitment fees on their pro-rata portion of the line of credit, which are reflected in Miscellaneous expenses on the Statement of Operations, and are listed below. During the period, there were no borrowings on this line of credit.
| | Amount ($) |
| Fidelity Global Commodity Stock Fund | 1,635 |
7. Security Lending.
Funds lend portfolio securities from time to time in order to earn additional income. Lending agents are used, including National Financial Services (NFS), an affiliate of the investment adviser. Pursuant to a securities lending agreement, NFS will receive a fee, which is capped at 9.9% of a fund's daily lending revenue, for its services as lending agent. A fund may lend securities to certain qualified borrowers, including NFS. On the settlement date of the loan, a fund receives collateral (in the form of U.S. Treasury obligations, letters of credit and/or cash) against the loaned securities and maintains collateral in an amount not less than 100% of the market value of the loaned securities during the period of the loan. The market value of the loaned securities is determined at the close of business of a fund and any additional required collateral is delivered to a fund on the next business day. A fund or borrower may terminate the loan at any time, and if the borrower defaults on its obligation to return the securities loaned because of insolvency or other reasons, a fund may apply collateral received from the borrower against the obligation. A fund may experience delays and costs in recovering the securities loaned. Any cash collateral received is invested in the Fidelity Securities Lending Cash Central Fund. Any loaned securities are identified as such in the Schedule of Investments, and the value of loaned securities and cash collateral at period end, as applicable, are presented in the Statement of Assets and Liabilities. Security lending income represents the income earned on investing cash collateral, less rebates paid to borrowers and any lending agent fees associated with the loan, plus any premium payments received for lending certain types of securities. Security lending income is presented in the Statement of Operations as a component of income from Fidelity Central Funds. Affiliated security lending activity, if any, was as follows:
| | Total Security Lending Fees Paid to NFS ($) | Security Lending Income From Securities Loaned to NFS ($) | Value of Securities Loaned to NFS at Period End ($) |
| Fidelity Global Commodity Stock Fund | 77,848 | 1,315 | - |
8. Expense Reductions.
Through arrangements with each class' transfer agent, credits realized as a result of certain uninvested cash balances were used to reduce the Fund's expenses. During the period, transfer agent credits reduced each class' expenses as noted in the table below.
| | Expense reduction ($) |
| | |
| Class M | 9 |
In addition, during the period the investment adviser or an affiliate reimbursed and/or waived a portion of fund-level operating expenses in the amount of $44,646.
9. Distributions to Shareholders.
Distributions to shareholders of each class were as follows:
| | Year ended October 31, 2024 | Year ended October 31, 2023 |
| Fidelity Global Commodity Stock Fund | | |
| Distributions to shareholders | | |
| Class A | $1,698,169 | $2,247,696 |
| Class M | 265,430 | 366,393 |
| Class C | 186,222 | 382,649 |
| Global Commodity Stock | 8,378,578 | 16,441,380 |
| Class I | 6,995,782 | 10,386,346 |
| Class Z | 4,266,200 | 4,867,100 |
Total | $21,790,381 | $34,691,564 |
10. Share Transactions.
Share transactions for each class were as follows and may contain in-kind transactions, automatic conversions between classes or exchanges between affiliated funds:
| | Shares | Shares | Dollars | Dollars |
| | Year ended October 31, 2024 | Year ended October 31, 2023 | Year ended October 31, 2024 | Year ended October 31, 2023 |
| Fidelity Global Commodity Stock Fund | | | | |
| Class A | | | | |
| Shares sold | 523,157 | 1,706,240 | $9,660,014 | $32,590,913 |
| Reinvestment of distributions | 100,271 | 115,956 | 1,689,564 | 2,236,781 |
| Shares redeemed | (1,542,491) | (2,904,311) | (27,969,357) | (53,206,144) |
| Net increase (decrease) | (919,063) | (1,082,115) | $(16,619,779) | $(18,378,450) |
| Class M | | | | |
| Shares sold | 100,713 | 226,865 | $1,821,540 | $4,326,151 |
| Reinvestment of distributions | 15,582 | 18,802 | 262,558 | 362,695 |
| Shares redeemed | (375,083) | (467,728) | (6,871,873) | (8,507,986) |
| Net increase (decrease) | (258,788) | (222,061) | $(4,787,775) | $(3,819,140) |
| Class C | | | | |
| Shares sold | 58,180 | 305,614 | $1,066,004 | $5,884,407 |
| Reinvestment of distributions | 11,025 | 19,865 | 185,217 | 381,017 |
| Shares redeemed | (503,897) | (744,797) | (8,965,890) | (13,548,223) |
| Net increase (decrease) | (434,692) | (419,318) | $(7,714,669) | $(7,282,799) |
| Global Commodity Stock | | | | |
| Shares sold | 3,386,920 | 13,188,745 | $62,722,588 | $254,817,434 |
| Reinvestment of distributions | 386,388 | 741,996 | 6,514,507 | 14,327,947 |
| Shares redeemed | (9,815,498) | (34,967,438) | (177,639,908) | (645,744,516) |
| Net increase (decrease) | (6,042,190) | (21,036,697) | $(108,402,813) | $(376,599,135) |
| Class I | | | | |
| Shares sold | 4,918,020 | 16,503,819 | $90,248,750 | $315,987,478 |
| Reinvestment of distributions | 410,245 | 528,030 | 6,908,516 | 10,190,979 |
| Shares redeemed | (11,957,742) | (22,329,926) | (213,017,775) | (410,703,798) |
| Net increase (decrease) | (6,629,477) | (5,298,077) | $(115,860,509) | $(84,525,341) |
| Class Z | | | | |
| Shares sold | 4,848,464 | 5,798,355 | $87,565,055 | $110,033,314 |
| Reinvestment of distributions | 198,997 | 213,545 | 3,345,144 | 4,115,012 |
| Shares redeemed | (5,740,185) | (7,243,382) | (105,538,064) | (133,112,755) |
| Net increase (decrease) | (692,724) | (1,231,482) | $(14,627,865) | $(18,964,429) |
11. Other.
A fund's organizational documents provide former and current trustees and officers with a limited indemnification against liabilities arising in connection with the performance of their duties to the fund. In the normal course of business, a fund may also enter into contracts that provide general indemnifications. A fund's maximum exposure under these arrangements is unknown as this would be dependent on future claims that may be made against a fund. The risk of material loss from such claims is considered remote.
12. Risk and Uncertainties.
Many factors affect a fund's performance. Developments that disrupt global economies and financial markets, such as pandemics, epidemics, outbreaks of infectious diseases, war, terrorism, and environmental disasters, may significantly affect a fund's investment performance. The effects of these developments to a fund will be impacted by the types of securities in which a fund invests, the financial condition, industry, economic sector, and geographic location of an issuer, and a fund's level of investment in the securities of that issuer. Significant concentrations in security types, issuers, industries, sectors, and geographic locations may magnify the factors that affect a fund's performance.
Report of Independent Registered Public Accounting Firm
To the Board of Trustees of Fidelity Investment Trust and Shareholders of Fidelity Global Commodity Stock Fund
Opinion on the Financial Statements
We have audited the accompanying statement of assets and liabilities, including the schedule of investments, of Fidelity Global Commodity Stock Fund (one of the funds constituting Fidelity Investment Trust, referred to hereafter as the "Fund") as of October 31, 2024, the related statement of operations for the year ended October 31, 2024, the statement of changes in net assets for each of the two years in the period ended October 31, 2024, including the related notes, and the financial highlights for each of the five years in the period ended October 31, 2024 (collectively referred to as the "financial statements"). In our opinion, the financial statements present fairly, in all material respects, the financial position of the Fund as of October 31, 2024, the results of its operations for the year then ended, the changes in its net assets for each of the two years in the period ended October 31, 2024 and the financial highlights for each of the five years in the period ended October 31, 2024 in conformity with accounting principles generally accepted in the United States of America.
Basis for Opinion
These financial statements are the responsibility of the Fund's management. Our responsibility is to express an opinion on the Fund's financial statements based on our audits. We are a public accounting firm registered with the Public Company Accounting Oversight Board (United States) (PCAOB) and are required to be independent with respect to the Fund in accordance with the U.S. federal securities laws and the applicable rules and regulations of the Securities and Exchange Commission and the PCAOB.
We conducted our audits of these financial statements in accordance with the standards of the PCAOB. Those standards require that we plan and perform the audit to obtain reasonable assurance about whether the financial statements are free of material misstatement, whether due to error or fraud.
Our audits included performing procedures to assess the risks of material misstatement of the financial statements, whether due to error or fraud, and performing procedures that respond to those risks. Such procedures included examining, on a test basis, evidence regarding the amounts and disclosures in the financial statements. Our audits also included evaluating the accounting principles used and significant estimates made by management, as well as evaluating the overall presentation of the financial statements. Our procedures included confirmation of securities owned as of October 31, 2024 by correspondence with the custodian and brokers; when replies were not received from brokers, we performed other auditing procedures. We believe that our audits provide a reasonable basis for our opinion.
/s/ PricewaterhouseCoopers LLP
Boston, Massachusetts
December 13, 2024
We have served as the auditor of one or more investment companies in the Fidelity group of funds since 1932.
Distributions
(Unaudited)The dividend and capital gains distributions for the fund(s) are available on Fidelity.com or Institutional.Fidelity.com.
The fund designates $341,354 of distributions paid during the fiscal year ended 2024 as qualifying to be taxed as section 163(j) interest dividends.
Class A designates 45%; Class M designates 53%; Class C designates 91%; Global Commodity Stock designates 40%; Class I designates 39% and Class Z designates 36% of the dividend distributed in December during the fiscal year as qualifying for the dividends-received deduction for corporate shareholders.
Class A, Class M, Class C, Global Commodity Stock, Class I and Class Z designate 100% of dividend distributed in December during the fiscal year as amounts which may be taken into account as a dividend for purposes of the maximum rate under section 1(h)(11) of the Internal Revenue Code.
The amounts per share which represent income derived from sources within, and taxes paid to, foreign countries or possessions of the United States are as follows:
| | Pay Date | Income | Taxes |
Fidelity Global Commodity Stock Fund | | | |
| Class A | 12/11/2023 | $0.2323 | $0.0288 |
| Class M | 12/11/2023 | $0.1944 | $0.0288 |
| Class C | 12/11/2023 | $0.1138 | $0.0288 |
| Global Commodity Stock | 12/11/2023 | $0.2590 | $0.0288 |
| Class I | 12/11/2023 | $0.2670 | $0.0288 |
| Class Z | 12/11/2023 | $0.2896 | $0.0288 |
The fund will notify shareholders in January 2025 of amounts for use in preparing 2024 income tax returns.
Item 8: Changes in and Disagreements with Accountants for Open-End Management Investment Companies
(Unaudited)
Note: This is not applicable for any fund included in this document.
Item 9: Proxy Disclosures for Open-End Management Investment Companies
(Unaudited)
| A special meeting of shareholders was held on July 16, 2024. The results of votes taken among shareholders on the proposal before them are reported below. Each vote reported represents one dollar of net asset value held on the record date for the meeting. |
| Proposal 1 |
| To elect a Board of Trustees. |
| | # of Votes | % of Votes |
| Bettina Doulton |
| Affirmative | 128,529,177,643.56 | 98.18 |
| Withheld | 2,378,037,364.30 | 1.82 |
| TOTAL | 130,907,215,007.85 | 100.00 |
| Robert A. Lawrence |
| Affirmative | 128,253,389,899.05 | 97.97 |
| Withheld | 2,653,825,108.81 | 2.03 |
| TOTAL | 130,907,215,007.85 | 100.00 |
| Vijay C. Advani |
| Affirmative | 128,531,418,228.19 | 98.19 |
| Withheld | 2,375,796,779.66 | 1.81 |
| TOTAL | 130,907,215,007.85 | 100.00 |
| Thomas P. Bostick |
| Affirmative | 128,495,261,591.41 | 98.16 |
| Withheld | 2,411,953,416.44 | 1.84 |
| TOTAL | 130,907,215,007.85 | 100.00 |
| Donald F. Donahue |
| Affirmative | 128,407,878,996.00 | 98.09 |
| Withheld | 2,499,336,011.85 | 1.91 |
| TOTAL | 130,907,215,007.85 | 100.00 |
| Vicki L. Fuller |
| Affirmative | 128,625,540,095.19 | 98.26 |
| Withheld | 2,281,674,912.66 | 1.74 |
| TOTAL | 130,907,215,007.85 | 100.00 |
| Patricia L. Kampling |
| Affirmative | 128,668,729,281.34 | 98.29 |
| Withheld | 2,238,485,726.51 | 1.71 |
| TOTAL | 130,907,215,007.85 | 100.00 |
| Thomas A. Kennedy |
| Affirmative | 128,499,824,239.79 | 98.16 |
| Withheld | 2,407,390,768.06 | 1.84 |
| TOTAL | 130,907,215,007.85 | 100.00 |
| Oscar Munoz |
| Affirmative | 128,386,109,391.05 | 98.07 |
| Withheld | 2,521,105,616.80 | 1.93 |
| TOTAL | 130,907,215,007.85 | 100.00 |
| Karen B. Peetz |
| Affirmative | 128,603,731,113.82 | 98.24 |
| Withheld | 2,303,483,894.03 | 1.76 |
| TOTAL | 130,907,215,007.85 | 100.00 |
| David M. Thomas |
| Affirmative | 128,384,899,342.98 | 98.07 |
| Withheld | 2,522,315,664.88 | 1.93 |
| TOTAL | 130,907,215,007.85 | 100.00 |
| Susan Tomasky |
| Affirmative | 128,556,148,461.60 | 98.20 |
| Withheld | 2,351,066,546.25 | 1.80 |
| TOTAL | 130,907,215,007.85 | 100.00 |
| Michael E. Wiley |
| Affirmative | 128,264,934,978.34 | 97.98 |
| Withheld | 2,642,280,029.51 | 2.02 |
| TOTAL | 130,907,215,007.85 | 100.00 |
| | | |
| Proposal 1 reflects trust-wide proposal and voting results. |
Item 10: Remuneration Paid to Directors, Officers, and others of Open-End Management Investment Companies
(Unaudited)
Note: This information is disclosed as part of the financial statements for each Fund as part of Item 7: Financial Statements and Financial Highlights for Open-End Management Investment companies.
Item 11: Statement Regarding Basis for Approval of Investment Advisory Contract
(Unaudited)
Board Approval of Investment Advisory Contracts and Management Fees
Fidelity Global Commodity Stock Fund
Each year, the Board of Trustees, including the Independent Trustees (together, the Board), considers the renewal of the fund's management contract with Fidelity Management & Research Company LLC (FMR) and certain affiliates and the sub-advisory agreements (together, the Advisory Contracts) for the fund. FMR and the sub-advisers are referred to herein as the Investment Advisers. The Board, assisted by the advice of fund counsel and Independent Trustees' counsel, requests and considers a broad range of information relevant to the renewal of the Advisory Contracts throughout the year.
The Board meets regularly and, at each of its meetings, covers an extensive agenda of topics and materials and considers factors that are relevant to its annual consideration of the renewal of the fund's Advisory Contracts, including the services and support provided to the fund and its shareholders. The Board, acting directly and through its Committees (each of which is composed of and chaired by Independent Trustees), requests and receives information concerning the annual consideration of the renewal of the fund's Advisory Contracts. The Board also meets as needed to review matters specifically related to the Board's annual consideration of the renewal of the Advisory Contracts. Members of the Board may also meet with trustees of other Fidelity funds through joint ad hoc committees to discuss certain matters relevant to all of the Fidelity funds.
At its May 2024 meeting, the Board unanimously determined to renew the fund's Advisory Contracts. In reaching its determination, the Board considered all factors it believed relevant, including (i) the nature, extent, and quality of the services provided to the fund and its shareholders (including the investment performance of the fund); (ii) the competitiveness relative to peer funds of the fund's management fee and the total expense ratio of a representative class (the retail class, which was selected because it was the largest class without 12b-1 fees); (iii) the total costs of the services provided by and the profits realized by FMR and its affiliates (Fidelity) from its relationships with the fund; and (iv) the extent to which, if any, economies of scale exist and are realized as the fund grows, and whether any economies of scale are appropriately shared with fund shareholders. The Board also considered the broad range of investment choices available to shareholders from FMR's competitors and that the fund's shareholders have chosen to invest in the fund, which is part of the Fidelity family of funds. The Board's decision to renew the Advisory Contracts was not based on any single factor.
The Board reached a determination, with the assistance of fund counsel and Independent Trustees' counsel and through the exercise of its business judgment, that the renewal of the Advisory Contracts was in the best interests of the fund and its shareholders and that the compensation payable under the Advisory Contracts was fair and reasonable in light of all of the surrounding circumstances.
Nature, Extent, and Quality of Services Provided. The Board considered staffing as it relates to the fund, including the backgrounds and experience of investment personnel of the Investment Advisers, and also considered the Investment Advisers' implementation of the fund's investment program. The Independent Trustees also had discussions with senior management of Fidelity's investment operations and investment groups. The Board considered the structure of the investment personnel compensation program and whether this structure provides appropriate incentives to act in the best interests of the fund. Additionally, the Board considered the portfolio managers' investments, if any, in the funds that they manage.
Resources Dedicated to Investment Management and Support Services. The Board and the Fund Oversight and Research Committees reviewed the general qualifications and capabilities of Fidelity's investment staff, including its size, education, experience, and resources, as well as Fidelity's approach to recruiting, training, managing, and compensating investment personnel. The Board noted the resources devoted to expansion of Fidelity's global investment organization, and that Fidelity's analysts have extensive resources, tools, and capabilities that allow them to conduct sophisticated quantitative and fundamental analysis, as well as credit analysis of issuers, counterparties, and guarantors. Further, the Board considered that Fidelity's investment professionals have sufficient access to global information and data so as to provide competitive investment results over time, and that those professionals also have access to sophisticated tools that permit them to assess portfolio construction and risk and performance attribution characteristics continuously, as well as to transmit new information and research conclusions rapidly around the world. Additionally, in its deliberations, the Board considered Fidelity's trading, risk management, compliance, and technology and operations capabilities and resources, which are integral parts of the investment management process.
Shareholder and Administrative Services. The Board considered (i) the nature, extent, quality, and cost of advisory, administrative, shareholder, transfer agency, and pricing and bookkeeping services performed by the Investment Advisers and their affiliates under the Advisory Contracts; (ii) the nature and extent of Fidelity's supervision of third party service providers, principally custodians, subcustodians, and pricing vendors; and (iii) the resources devoted by Fidelity to, and the record of compliance with, the fund's compliance policies and procedures. The Board also reviewed the allocation of fund brokerage, including allocations to brokers affiliated with the Investment Advisers, the use of brokerage commissions to pay fund expenses, and the use of "soft" commission dollars to pay for research services. The Board also considered the fund's securities lending activities and any payments made to Fidelity relating to securities lending under a separate agreement.
The Board noted that the growth of fund assets over time across the complex allows Fidelity to reinvest in the development of services designed to enhance the value and convenience of the Fidelity funds as investment vehicles. These services include 24-hour access to account information and market information over the Internet and through telephone representatives, investor education materials, and asset allocation tools. The Board also considered that it reviews customer service metrics such as telephone response times, continuity of services on the website and metrics addressing services at Fidelity Investor Centers.
Investment in a Large Fund Family. The Board considered the benefits to shareholders of investing in a fund that is part of a large family of funds offering a variety of investment disciplines and providing a large variety of fund investor services. The Board noted that Fidelity had taken, or had made recommendations that resulted in the Fidelity funds taking, a number of actions over the previous year that benefited particular funds and/or the Fidelity funds in general.
Investment Performance. The Board took into account discussions that occur with representatives of the Investment Advisers, and reports that it receives, at Board meetings throughout the year, relating to fund investment performance. In this regard the Board noted that as part of regularly scheduled fund reviews and other reports to the Board on fund performance, the Board considered annualized return information for the fund for different time periods, measured against an appropriate securities market index (benchmark index) and an appropriate peer group of funds with similar objectives (peer group). The Board also considered information about performance attribution. In its ongoing evaluation of fund investment performance, the Board gives particular attention to information indicating changes in performance of the funds over different time periods and discussed with the Investment Advisers the reasons for any overperformance or underperformance.
In addition to reviewing absolute and relative fund performance, the Independent Trustees periodically consider the appropriateness of fund performance metrics in evaluating the results achieved. The Independent Trustees generally give greater weight to fund performance over longer time periods than over shorter time periods. Depending on the circumstances, the Independent Trustees may be satisfied with a fund's performance notwithstanding that it lags its benchmark index or peer group for certain periods.
Based on its review, the Board concluded that the nature, extent, and quality of services provided to the fund under the Advisory Contracts should continue to benefit the shareholders of the fund.
Competitiveness of Management Fee and Total Expense Ratio. The Board was provided with information regarding industry trends in management fees and expenses. The Board considered that, effective March 1, 2024, an amended Advisory Contract with FMR went into effect with class-level management fees based on tiered schedules and subject to a maximum class-level rate (the management fee). The Board also considered that in exchange for the variable management fee, each class of the fund receives investment advisory, management, administrative, transfer agent, and pricing and bookkeeping services. In its review of the management fee and total expense ratio of the retail class, the Board considered a pro forma management fee rate for the retail class as if it had been in effect for the 12-month period ended September 30, 2023, as well as other third-party fund expenses, as applicable, such as custodial, legal, and audit fees and any fund-paid 12b-1 fees. The Board noted that Fidelity may agree to waive fees or reimburse expenses from time to time, and the extent to which, if any, it has done so for the fund.
Comparisons of Management Fees and Total Expense Ratios. Among other things, the Board reviewed data for selected groups of competitive funds and classes (referred to as "mapped groups") that were compiled by Fidelity based on combining similar investment objective categories (as classified by Morningstar) that have comparable investment mandates. The data reviewed by the Board included (i) gross management fee comparisons (before taking into account expense reimbursements or caps) relative to the total universe of funds within the mapped group; (ii) gross management fee comparisons relative to a subset of non-Fidelity funds in the mapped group that are similar in size and management fee structure to the fund (referred to as the "asset size peer group"); (iii) total expense comparisons of the retail class of the fund relative to funds and classes in the mapped group that have a similar sales load structure to the retail class of the fund (referred to as the "similar sales load structure group"); and (iv) total expense comparisons of the retail class of the fund relative to funds and classes in the similar sales load structure group that are similar in size and management fee structure to the fund (referred to as the "total expense asset size peer group"). The total expense asset size peer group comparison excludes performance adjustments and fund-paid 12b-1 fees to eliminate variability in fee structures.
The information provided to the Board indicated that the fund's management fee rate ranked above the competitive median of the mapped group for the 12-month period ended September 30, 2023 and above the competitive median of the asset size peer group for the 12-month period ended September 30, 2023. Further, the information provided to the Board indicated that the total expense ratio of the retail class of the fund ranked below the competitive median of the similar sales load structure group for the 12-month period ended September 30, 2023 and below the competitive median of the total expense asset size peer group for the 12-month period ended September 30, 2023. The Board considered that the fund has a variable unified management fee that covers expenses for services beyond portfolio management.
The Board noted that a different variable management fee rate is applicable to each class of the fund. The Board considered that the difference in management fee rates between classes is the result of separate arrangements for class-level services and/or waivers of certain expenses and not the result of any difference in advisory or custodial fees or other expenses related to the management of the fund's assets, which do not vary by class.
Fees Charged to Other Fidelity Clients. The Board also considered Fidelity fee structures and other information with respect to clients of Fidelity, such as other funds advised or subadvised by Fidelity, pension plan clients, and other institutional clients with similar mandates. The Board noted that a joint ad hoc committee created by it and the boards of other Fidelity funds periodically reviews and compares Fidelity's institutional investment advisory business with its business of providing services to the Fidelity funds and also noted the most recent findings of the committee. The Board noted that the committee's review included a consideration of the differences in services provided, fees charged, and costs incurred, as well as competition in the markets serving the different categories of clients.
Based on its review, the Board concluded that the fund's management fee is fair and reasonable in light of the services that the fund receives and the other factors considered. Further, based on its review of total expense ratios and fees charged to other Fidelity clients, the Board concluded that the total expense ratio of each class of the fund was reasonable in light of the services that the fund and its shareholders receive and the other factors considered.
Costs of the Services and Profitability. The Board considered the revenues earned and the expenses incurred by Fidelity in conducting the business of developing, marketing, distributing, managing, administering and servicing the fund and servicing the fund's shareholders. The Board also considered the level of Fidelity's profits in respect of all the Fidelity funds.
On an annual basis, Fidelity presents to the Board information about the profitability of its relationships with the fund. Fidelity calculates profitability information for each fund, as well as aggregate profitability information for groups of Fidelity funds and all Fidelity funds, using a series of detailed revenue and cost allocation methodologies which originate with the books and records of Fidelity on which Fidelity's audited financial statements are based. The Audit Committee of the Board reviews any significant changes from the prior year's methodologies.
A public accounting firm has been engaged annually by the Board as part of the Board's assessment of Fidelity's profitability analysis. The engagement includes the review and assessment of the methodologies used by Fidelity in determining the revenues and expenses attributable to Fidelity's fund business, and completion of agreed-upon procedures in respect of the mathematical accuracy of certain fund profitability information and its conformity to established allocation methodologies. After considering the reports issued under the engagement and information provided by Fidelity, the Board concluded that while other allocation methods may also be reasonable, Fidelity's profitability methodologies are reasonable in all material respects.
The Board also reviewed Fidelity's non-fund businesses and potential indirect benefits such businesses may have received as a result of their association with Fidelity's fund business (i.e., fall-out benefits) as well as cases where Fidelity's affiliates may benefit from the funds' business. The Board considered areas where potential indirect benefits to the Fidelity funds from their relationships with Fidelity may exist. The Board's consideration of these matters was informed by the findings of a joint ad hoc committee created by it and the boards of other Fidelity funds to evaluate potential fall-out benefits.
The Board considered the costs of the services provided by and the profits realized by Fidelity in connection with the operation of the fund and was satisfied that the profitability was not excessive.
Economies of Scale. The Board considered whether there have been economies of scale in respect of the management of the Fidelity funds, whether the Fidelity funds (including the fund) have appropriately benefited from any such economies of scale, and whether there is potential for realization of any further economies of scale. The Board considered the extent to which the fund will benefit from economies of scale as assets grow through increased services to the fund, through waivers or reimbursements, or through fee or expense ratio reductions. The Board also noted that a committee created by it and the boards of other Fidelity funds periodically analyzes whether Fidelity attains economies of scale in respect of the management and servicing of the Fidelity funds, whether the Fidelity funds have appropriately benefited from such economies of scale, and whether there is potential for realization of any further economies of scale.
The Board recognized that the fund's management contract incorporates a variable management fee structure, which provides breakpoints as a way to share, in part, any potential economies of scale that may exist at the asset class level and through a discount that considers both fund size and total assets of the four applicable asset classes. The Board considered that the variable management fee is designed to deliver the benefits of economies of scale to fund shareholders even if assets of any particular fund are unchanged or have declined, because some portion of Fidelity's costs are attributable to services provided to all funds subject to the variable management fee, and all such funds benefit if those costs can be allocated among more assets. The Board concluded that, given the variable management fee structure, fund shareholders will benefit from lower management fees due to the application of the breakpoints and discount factor, regardless of whether Fidelity achieves any such economies of scale.
The Board concluded, taking into account the analysis of the committee, that economies of scale, if any, are being appropriately shared between fund shareholders and Fidelity.
Additional Information Requested by the Board. In order to develop fully the factual basis for consideration of the Fidelity funds' advisory contracts, the Board requested and received additional information on certain topics, including but not limited to: (i) fund flow and performance trends, in particular the underperformance of certain funds and strategies, and Fidelity's long-term strategies for certain funds; (ii) the operation of performance fees and the rationale for implementing performance fees on certain categories of funds but not others; (iii) Fidelity's pricing philosophy compared to competitors; (iv) fund profitability methodology and data; (v) evaluation of competitive fund data and peer group classifications and fee and expense comparisons; (vi) the management fee and expense structures for different funds and classes and information about the differences between various fee and expense structures; (vii) the variable management fee implemented for certain funds effective March 1, 2024; and (viii) information regarding other accounts managed by Fidelity and the funds' sub-advisory arrangements.
Conclusion. Based on its evaluation of all of the conclusions noted above, and after considering all factors it believed relevant, the Board, including the Independent Trustees, concluded that the advisory and sub-advisory fee arrangements are fair and reasonable in light of all of the surrounding circumstances and that the fund's Advisory Contracts should be renewed through May 31, 2025.
1.879380.115
GCS-ANN-1224
Fidelity® Sustainable Emerging Markets Equity Fund
Annual Report
October 31, 2024
Includes Fidelity and Fidelity Advisor share classes
Contents
To view a fund's proxy voting guidelines and proxy voting record for the 12-month period ended June 30, visit http://www.fidelity.com/proxyvotingresults or visit the Securities and Exchange Commission's (SEC) web site at http://www.sec.gov.
You may also call 1-800-544-8544 if you're an individual investing directly with Fidelity, call 1-800-835-5092 if you're a plan sponsor or participant with Fidelity as your recordkeeper or call 1-877-208-0098 on institutional accounts or if you're an advisor or invest through one to request a free copy of the proxy voting guidelines.
Standard & Poor's, S&P and S&P 500 are registered service marks of The McGraw-Hill Companies, Inc. and have been licensed for use by Fidelity Distributors Corporation.
Other third-party marks appearing herein are the property of their respective owners.
All other marks appearing herein are registered or unregistered trademarks or service marks of FMR LLC or an affiliated company. © 2024 FMR LLC. All rights reserved.
This report and the financial statements contained herein are submitted for the general information of the shareholders of the Fund. This report is not authorized for distribution to prospective investors in the Fund unless preceded or accompanied by an effective prospectus.
A fund files its complete schedule of portfolio holdings with the SEC for the first and third quarters of each fiscal year on Form N-PORT. Forms N-PORT are available on the SEC's web site at http://www.sec.gov. A fund's Forms N-PORT may be reviewed and copied at the SEC's Public Reference Room in Washington, DC. Information regarding the operation of the SEC's Public Reference Room may be obtained by calling 1-800-SEC-0330.
For a complete list of a fund's portfolio holdings, view the most recent holdings listing, semiannual report, or annual report on Fidelity's web site at http://www.fidelity.com, http://www.institutional.fidelity.com, or http://www.401k.com, as applicable.
NOT FDIC INSURED •MAY LOSE VALUE •NO BANK GUARANTEE
Neither the Fund nor Fidelity Distributors Corporation is a bank.
Item 7: Financial Statements and Financial Highlights for Open-End Management Investment Companies (Annual Report)
Fidelity® Sustainable Emerging Markets Equity Fund
Schedule of Investments October 31, 2024
Showing Percentage of Net Assets
| Common Stocks - 96.1% |
| | | Shares | Value ($) |
| Brazil - 6.2% | | | |
| Banco Bradesco SA | | 4,145 | 9,135 |
| Banco BTG Pactual SA unit | | 7,042 | 39,614 |
| Banco do Brasil SA | | 3,805 | 17,330 |
| Gerdau SA sponsored ADR | | 9,990 | 31,169 |
| Hapvida Participacoes e Investimentos SA (a)(b) | | 12,811 | 7,801 |
| Itau Unibanco Holding SA | | 13,084 | 79,261 |
| Localiza Rent a Car SA | | 5,973 | 43,416 |
| Nu Holdings Ltd. Class A (a) | | 4,761 | 71,843 |
| Raia Drogasil SA | | 3,855 | 16,231 |
| Vale SA sponsored ADR | | 1,206 | 12,904 |
| Vamos Locacao de Caminhoes Maquinas e Equipamentos SA | | 24,769 | 26,950 |
| Weg SA | | 5,061 | 47,372 |
TOTAL BRAZIL | | | 403,026 |
| China - 30.9% | | | |
| Airtac International Group | | 352 | 9,775 |
| Alibaba Group Holding Ltd. | | 22,091 | 270,224 |
| BYD Co. Ltd. (H Shares) | | 2,062 | 74,477 |
| China Construction Bank Corp. (H Shares) | | 136,999 | 106,344 |
| China Life Insurance Co. Ltd. (H Shares) | | 26,419 | 56,001 |
| China Merchants Bank Co. Ltd. (H Shares) | | 8,533 | 41,756 |
| China Pacific Insurance (Group) Co. Ltd. (H Shares) | | 1,343 | 4,664 |
| China Resources Beverage Holdings Co. Ltd. | | 9,163 | 17,772 |
| Contemporary Amperex Technology Co. Ltd. | | 2,175 | 75,461 |
| Flat Glass Group Co. Ltd. | | 3,195 | 6,511 |
| Flat Glass Group Co. Ltd. (A Shares) | | 1,700 | 6,872 |
| Fuyao Glass Industries Group Co. Ltd. (A Shares) | | 1,373 | 10,982 |
| Haier Smart Home Co. Ltd. | | 18,084 | 65,631 |
| Innovent Biologics, Inc. (a)(b) | | 3,754 | 16,319 |
| JD.com, Inc.: | | | |
| Class A | | 618 | 12,533 |
| sponsored ADR | | 1,886 | 76,609 |
| KE Holdings, Inc. ADR | | 1,144 | 25,088 |
| Kweichow Moutai Co. Ltd. (A Shares) | | 34 | 7,300 |
| Li Auto, Inc. Class A (a) | | 3,866 | 48,615 |
| Meituan Class B (a)(b) | | 3,816 | 90,174 |
| Midea Group Co. Ltd. (H Shares) | | 3,600 | 33,557 |
| NAURA Technology Group Co. Ltd. | | 416 | 22,892 |
| New Oriental Education & Technology Group, Inc. sponsored ADR | | 462 | 28,921 |
| PDD Holdings, Inc. ADR (a) | | 732 | 88,272 |
| Ping An Insurance Group Co. of China Ltd. (H Shares) | | 15,711 | 97,342 |
| Shenzhen Mindray Bio-Medical Electronics Co. Ltd. (A Shares) | | 584 | 21,872 |
| Shenzhou International Group Holdings Ltd. | | 1,224 | 9,452 |
| Tencent Holdings Ltd. | | 7,689 | 400,921 |
| Trip.com Group Ltd. ADR (a) | | 589 | 37,932 |
| Xiaomi Corp. Class B (a)(b) | | 28,430 | 97,512 |
| Yum China Holdings, Inc. | | 673 | 29,686 |
| Zai Lab Ltd. ADR (a) | | 1,081 | 32,668 |
| Zijin Mining Group Co. Ltd. (H Shares) | | 27,331 | 58,217 |
TOTAL CHINA | | | 1,982,352 |
| Greece - 0.3% | | | |
| OPAP SA | | 1,081 | 18,437 |
| Hungary - 1.7% | | | |
| OTP Bank PLC | | 1,265 | 62,969 |
| Richter Gedeon PLC | | 1,698 | 49,048 |
TOTAL HUNGARY | | | 112,017 |
| India - 13.3% | | | |
| Axis Bank Ltd. | | 6,487 | 89,111 |
| Bharti Airtel Ltd. | | 5,702 | 109,136 |
| Computer Age Management Services Private Ltd. | | 564 | 29,714 |
| HDFC Bank Ltd. | | 5,039 | 103,572 |
| HDFC Bank Ltd. sponsored ADR | | 607 | 38,259 |
| HDFC Standard Life Insurance Co. Ltd. (b) | | 3,146 | 26,871 |
| Hyundai Motor India Ltd. | | 298 | 6,401 |
| ICICI Bank Ltd. | | 4,145 | 63,581 |
| Infosys Ltd. sponsored ADR | | 1,706 | 35,672 |
| Larsen & Toubro Ltd. | | 837 | 35,954 |
| Mankind Pharma Ltd. (a) | | 900 | 28,480 |
| NTPC Ltd. | | 9,139 | 44,200 |
| Reliance Industries Ltd. (a) | | 3,107 | 48,775 |
| Reliance Industries Ltd. | | 3,107 | 49,126 |
| Tata Consultancy Services Ltd. | | 985 | 46,330 |
| Tata Steel Ltd. | | 4,794 | 8,425 |
| Zomato Ltd. (a) | | 31,599 | 90,655 |
TOTAL INDIA | | | 854,262 |
| Indonesia - 2.3% | | | |
| PT Bank Central Asia Tbk | | 192,898 | 124,843 |
| PT Bank Mandiri (Persero) Tbk | | 58,246 | 24,727 |
TOTAL INDONESIA | | | 149,570 |
| Korea (South) - 9.7% | | | |
| BGF Retail Co. Ltd. | | 249 | 20,902 |
| Coupang, Inc. Class A (a) | | 417 | 10,754 |
| Hana Financial Group, Inc. | | 262 | 11,341 |
| Hyundai Motor Co. Ltd. | | 108 | 16,690 |
| KB Financial Group, Inc. | | 549 | 35,840 |
| KT Corp. | | 624 | 19,961 |
| NAVER Corp. | | 157 | 19,267 |
| Samsung Biologics Co. Ltd. (a)(b) | | 115 | 83,445 |
| Samsung Electronics Co. Ltd. | | 6,266 | 266,932 |
| Samsung Fire & Marine Insurance Co. Ltd. | | 81 | 19,702 |
| SK Hynix, Inc. | | 858 | 112,692 |
| SK Square Co. Ltd. (a) | | 96 | 5,816 |
TOTAL KOREA (SOUTH) | | | 623,342 |
| Malaysia - 0.7% | | | |
| CIMB Group Holdings Bhd | | 18,990 | 34,435 |
| MR DIY Group M Sdn Bhd (b) | | 19,194 | 9,565 |
TOTAL MALAYSIA | | | 44,000 |
| Mexico - 3.5% | | | |
| Corporacion Inmobiliaria Vesta S.A.B. de CV ADR | | 771 | 20,092 |
| Fomento Economico Mexicano S.A.B. de CV sponsored ADR | | 133 | 12,886 |
| Genomma Lab Internacional SA de CV | | 40,752 | 54,419 |
| Grupo Financiero Banorte S.A.B. de CV | | 12,781 | 88,997 |
| Wal-Mart de Mexico SA de CV Series V | | 18,317 | 50,366 |
TOTAL MEXICO | | | 226,760 |
| Peru - 0.7% | | | |
| Credicorp Ltd. (United States) | | 240 | 44,191 |
| Philippines - 1.4% | | | |
| Ayala Land, Inc. | | 54,880 | 30,663 |
| International Container Terminal Services, Inc. | | 8,641 | 58,487 |
TOTAL PHILIPPINES | | | 89,150 |
| Poland - 1.0% | | | |
| Allegro.eu SA (a)(b) | | 2,400 | 21,058 |
| Powszechna Kasa Oszczednosci Bank SA | | 2,888 | 40,260 |
TOTAL POLAND | | | 61,318 |
| Saudi Arabia - 1.1% | | | |
| Al Rajhi Bank | | 1,678 | 39,317 |
| Alinma Bank | | 1,112 | 8,320 |
| The Saudi National Bank | | 2,343 | 20,681 |
TOTAL SAUDI ARABIA | | | 68,318 |
| Singapore - 0.5% | | | |
| Sea Ltd. ADR Class A (a) | | 336 | 31,601 |
| South Africa - 5.2% | | | |
| Absa Group Ltd. | | 1,318 | 12,631 |
| Capitec Bank Holdings Ltd. | | 256 | 46,247 |
| FirstRand Ltd. | | 6,538 | 28,726 |
| Impala Platinum Holdings Ltd. (a) | | 6,725 | 44,389 |
| MTN Group Ltd. | | 2,594 | 12,883 |
| Naspers Ltd. Class N | | 193 | 45,615 |
| Northam Platinum Holdings Ltd. | | 4,185 | 30,963 |
| Pepkor Holdings Ltd. (b) | | 16,886 | 21,919 |
| Shoprite Holdings Ltd. | | 2,863 | 49,445 |
| Standard Bank Group Ltd. | | 3,051 | 42,005 |
TOTAL SOUTH AFRICA | | | 334,823 |
| Taiwan - 15.9% | | | |
| Alchip Technologies Ltd. | | 190 | 11,808 |
| Chailease Holding Co. Ltd. | | 7,057 | 33,154 |
| E Ink Holdings, Inc. | | 3,453 | 32,423 |
| E.SUN Financial Holdings Co. Ltd. | | 17,468 | 14,902 |
| Hon Hai Precision Industry Co. Ltd. (Foxconn) | | 19,898 | 127,956 |
| MediaTek, Inc. | | 2,551 | 99,629 |
| Taiwan Semiconductor Manufacturing Co. Ltd. | | 21,357 | 671,929 |
| Yageo Corp. | | 1,502 | 25,630 |
TOTAL TAIWAN | | | 1,017,431 |
| Thailand - 0.4% | | | |
| CP ALL PCL (For. Reg.) | | 5,455 | 10,217 |
| PTT Exploration and Production PCL (For. Reg.) | | 3,497 | 13,124 |
TOTAL THAILAND | | | 23,341 |
| United Arab Emirates - 0.5% | | | |
| ADNOC Drilling Co. PJSC | | 23,982 | 33,103 |
| United Kingdom - 0.8% | | | |
| AngloGold Ashanti PLC | | 1,734 | 48,205 |
| TOTAL COMMON STOCKS (Cost $5,550,536) | | | 6,165,247 |
| | | | |
| Money Market Funds - 5.0% |
| | | Shares | Value ($) |
Fidelity Cash Central Fund 4.87% (c) (Cost $323,002) | | 322,937 | 323,002 |
| | | | |
| TOTAL INVESTMENT IN SECURITIES - 101.1% (Cost $5,873,538) | 6,488,249 |
NET OTHER ASSETS (LIABILITIES) - (1.1)% | (72,030) |
| NET ASSETS - 100.0% | 6,416,219 |
| | |
| Futures Contracts |
| | Number of contracts | Expiration Date | Notional Amount ($) | Value ($) | Unrealized Appreciation/ (Depreciation) ($) |
| Purchased | | | | | |
| | | | | | |
| Equity Index Contracts | | | | | |
| ICE E-mini MSCI Emerging Markets Index Contracts (United States) | 1 | Dec 2024 | 56,325 | (2,487) | (2,487) |
| | | | | | |
| The notional amount of futures purchased as a percentage of Net Assets is 0.9% |
Legend
| (b) | Security exempt from registration under Rule 144A of the Securities Act of 1933. These securities may be resold in transactions exempt from registration, normally to qualified institutional buyers. At the end of the period, the value of these securities amounted to $374,664 or 5.8% of net assets. |
| (c) | Affiliated fund that is generally available only to investment companies and other accounts managed by Fidelity Investments. The rate quoted is the annualized seven-day yield of the fund at period end. A complete unaudited listing of the fund's holdings as of its most recent quarter end is available upon request. In addition, each Fidelity Central Fund's financial statements, which are not covered by the Fund's Report of Independent Registered Public Accounting Firm, are available on the SEC's website or upon request. |
Affiliated Central Funds
Fiscal year to date information regarding the Fund's investments in Fidelity Central Funds, including the ownership percentage, is presented below.
| Affiliate | Value, beginning of period ($) | Purchases ($) | Sales Proceeds ($) | Dividend Income ($) | Realized Gain (loss) ($) | Change in Unrealized appreciation (depreciation) ($) | Value, end of period ($) | % ownership, end of period |
| Fidelity Cash Central Fund 4.87% | 151,488 | 3,483,337 | 3,311,818 | 18,671 | (5) | - | 323,002 | 0.0% |
| Total | 151,488 | 3,483,337 | 3,311,818 | 18,671 | (5) | - | 323,002 | |
| | | | | | | | | |
Amounts in the dividend income column in the above table include any capital gain distributions from underlying funds, which are presented in the corresponding line item in the Statement of Operations, if applicable.
Amounts included in the purchases and sales proceeds columns may include in-kind transactions, if applicable.
Investment Valuation
The following is a summary of the inputs used, as of October 31, 2024, involving the Fund's assets and liabilities carried at fair value. The inputs or methodology used for valuing securities may not be an indication of the risk associated with investing in those securities. For more information on valuation inputs, and their aggregation into the levels used below, please refer to the Investment Valuation section in the accompanying Notes to Financial Statements.
| Valuation Inputs at Reporting Date: |
| Description | Total ($) | Level 1 ($) | Level 2 ($) | Level 3 ($) |
Investments in Securities: | | | | |
|
| Equities: | | | | |
Communication Services | 593,769 | 31,601 | 562,168 | - |
Consumer Discretionary | 1,118,159 | 311,669 | 806,490 | - |
Consumer Staples | 185,119 | 79,483 | 105,636 | - |
Energy | 144,128 | 33,103 | 111,025 | - |
Financials | 1,577,972 | 560,177 | 1,017,795 | - |
Health Care | 294,052 | 143,936 | 150,116 | - |
Industrials | 332,945 | 117,738 | 215,207 | - |
Information Technology | 1,564,788 | 35,672 | 1,529,116 | - |
Materials | 234,272 | 92,278 | 141,994 | - |
Real Estate | 75,843 | 45,180 | 30,663 | - |
Utilities | 44,200 | - | 44,200 | - |
|
| Money Market Funds | 323,002 | 323,002 | - | - |
| Total Investments in Securities: | 6,488,249 | 1,773,839 | 4,714,410 | - |
Derivative Instruments: Liabilities | | | | |
Futures Contracts | (2,487) | (2,487) | - | - |
| Total Liabilities | (2,487) | (2,487) | - | - |
| Total Derivative Instruments: | (2,487) | (2,487) | - | - |
Value of Derivative Instruments
The following table is a summary of the Fund's value of derivative instruments by primary risk exposure as of October 31, 2024. For additional information on derivative instruments, please refer to the Derivative Instruments section in the accompanying Notes to Financial Statements.
Primary Risk Exposure / Derivative Type | Value |
| Asset ($) | Liability ($) |
| Equity Risk | | |
Futures Contracts (a) | 0 | (2,487) |
| Total Equity Risk | 0 | (2,487) |
| Total Value of Derivatives | 0 | (2,487) |
(a)Reflects gross cumulative appreciation (depreciation) on futures contracts as presented in the Schedule of Investments. In the Statement of Assets and Liabilities, the period end daily variation margin is included in receivable or payable for daily variation margin on futures contracts, and the net cumulative appreciation (depreciation) is included in Total accumulated earnings (loss).
Financial Statements
| Statement of Assets and Liabilities |
As of October 31, 2024 |
| Assets | | | | |
| Investment in securities, at value - See accompanying schedule: | | | | |
Unaffiliated issuers (cost $5,550,536) | $ | 6,165,247 | | |
Fidelity Central Funds (cost $323,002) | | 323,002 | | |
| | | | | |
| | | | | |
| Total Investment in Securities (cost $5,873,538) | | | $ | 6,488,249 |
| Segregated cash with brokers for derivative instruments | | | | 14,574 |
| Cash | | | | 18,376 |
| Foreign currency held at value (cost $752) | | | | 752 |
| Receivable for investments sold | | | | 25,718 |
| Receivable for fund shares sold | | | | 4,424 |
| Dividends receivable | | | | 4,391 |
| Distributions receivable from Fidelity Central Funds | | | | 2,275 |
| Prepaid expenses | | | | 7 |
| Receivable from investment adviser for expense reductions | | | | 7,969 |
| Other receivables | | | | 22 |
Total assets | | | | 6,566,757 |
| Liabilities | | | | |
| Payable for investments purchased | $ | 51,994 | | |
| Payable for fund shares redeemed | | 5 | | |
| Accrued management fee | | 4,958 | | |
| Distribution and service plan fees payable | | 371 | | |
| Payable for daily variation margin on futures contracts | | 260 | | |
| Deferred taxes | | 20,345 | | |
| Audit fee payable | | 57,142 | | |
| Custody fee payable | | 13,566 | | |
| Other payables and accrued expenses | | 1,897 | | |
| Total liabilities | | | | 150,538 |
| Net Assets | | | $ | 6,416,219 |
| Net Assets consist of: | | | | |
| Paid in capital | | | $ | 6,289,369 |
| Total accumulated earnings (loss) | | | | 126,850 |
| Net Assets | | | $ | 6,416,219 |
| | | | | |
| Net Asset Value and Maximum Offering Price | | | | |
| Class A : | | | | |
Net Asset Value and redemption price per share ($307,580 ÷ 33,800 shares)(a) | | | $ | 9.10 |
| Maximum offering price per share (100/94.25 of $9.10) | | | $ | 9.66 |
| Class M : | | | | |
Net Asset Value and redemption price per share ($244,655 ÷ 26,930 shares)(a) | | | $ | 9.08 |
| Maximum offering price per share (100/96.50 of $9.08) | | | $ | 9.41 |
| Class C : | | | | |
Net Asset Value and offering price per share ($230,919 ÷ 25,575 shares)(a) | | | $ | 9.03 |
| Fidelity Sustainable Emerging Markets Equity Fund : | | | | |
Net Asset Value, offering price and redemption price per share ($4,724,355 ÷ 517,930 shares) | | | $ | 9.12 |
| Class I : | | | | |
Net Asset Value, offering price and redemption price per share ($256,176 ÷ 28,081 shares) | | | $ | 9.12 |
| Class Z : | | | | |
Net Asset Value, offering price and redemption price per share ($652,534 ÷ 71,256 shares) | | | $ | 9.16 |
(a)Redemption price per share is equal to net asset value less any applicable contingent deferred sales charge. |
| Statement of Operations |
| Year ended October 31, 2024 |
| Investment Income | | | | |
| Dividends | | | $ | 133,086 |
| Income from Fidelity Central Funds | | | | 18,671 |
| Income before foreign taxes withheld | | | $ | 151,757 |
| Less foreign taxes withheld | | | | (15,119) |
| Total income | | | | 136,638 |
| Expenses | | | | |
| Management fee | | | | |
| Basic fee | $ | 47,611 | | |
| Performance adjustment | | (120) | | |
| Transfer agent fees | | 2,956 | | |
| Distribution and service plan fees | | 4,000 | | |
| Accounting fees and expenses | | 786 | | |
| Custodian fees and expenses | | 34,882 | | |
| Independent trustees' fees and expenses | | 24 | | |
| Registration fees | | 77,536 | | |
| Audit fees | | 88,783 | | |
| Legal | | 4 | | |
| Miscellaneous | | 342 | | |
| Total expenses before reductions | | 256,804 | | |
| Expense reductions | | (185,692) | | |
| Total expenses after reductions | | | | 71,112 |
| Net Investment income (loss) | | | | 65,526 |
| Realized and Unrealized Gain (Loss) | | | | |
| Net realized gain (loss) on: | | | | |
| Investment Securities: | | | | |
| Unaffiliated issuers (net of foreign taxes of $15,249) | | 340,946 | | |
| Fidelity Central Funds | | (5) | | |
| Foreign currency transactions | | (3,303) | | |
| Futures contracts | | (12,533) | | |
| Total net realized gain (loss) | | | | 325,105 |
| Change in net unrealized appreciation (depreciation) on: | | | | |
| Investment Securities: | | | | |
| Unaffiliated issuers (net of increase in deferred foreign taxes of $15,673) | | 719,120 | | |
| Assets and liabilities in foreign currencies | | (126) | | |
| Futures contracts | | (2,320) | | |
| Total change in net unrealized appreciation (depreciation) | | | | 716,674 |
| Net gain (loss) | | | | 1,041,779 |
| Net increase (decrease) in net assets resulting from operations | | | $ | 1,107,305 |
| Statement of Changes in Net Assets |
| |
| | Year ended October 31, 2024 | | Year ended October 31, 2023 |
| Increase (Decrease) in Net Assets | | | | |
| Operations | | | | |
| Net investment income (loss) | $ | 65,526 | $ | 55,252 |
| Net realized gain (loss) | | 325,105 | | (415,154) |
| Change in net unrealized appreciation (depreciation) | | 716,674 | | 636,341 |
| Net increase (decrease) in net assets resulting from operations | | 1,107,305 | | 276,439 |
| Distributions to shareholders | | (77,705) | | (23,630) |
| | | | | |
| Share transactions - net increase (decrease) | | 1,255,113 | | 866,372 |
| Total increase (decrease) in net assets | | 2,284,713 | | 1,119,181 |
| | | | | |
| Net Assets | | | | |
| Beginning of period | | 4,131,506 | | 3,012,325 |
| End of period | $ | 6,416,219 | $ | 4,131,506 |
| | | | | |
| | | | | |
Financial Highlights
Fidelity Advisor® Sustainable Emerging Markets Equity Fund Class A |
| |
| Years ended October 31, | | 2024 | | 2023 | | 2022 A |
Selected Per-Share Data | | | | | | |
| Net asset value, beginning of period | $ | 7.36 | $ | 6.55 | $ | 10.00 |
| Income from Investment Operations | | | | | | |
Net investment income (loss) B,C | | .09 | | .08 | | .03 |
| Net realized and unrealized gain (loss) | | 1.77 | | .77 | | (3.48) |
| Total from investment operations | | 1.86 | | .85 | | (3.45) |
| Distributions from net investment income | | (.12) | | (.04) | | - |
| Total distributions | | (.12) | | (.04) | | - |
| Net asset value, end of period | $ | 9.10 | $ | 7.36 | $ | 6.55 |
Total Return D,E,F | | | | 12.93% | | (34.50)% |
Ratios to Average Net Assets C,G,H | | | | | | |
| Expenses before reductions | | 4.98% | | 6.44% | | 8.77% I,J |
| Expenses net of fee waivers, if any | | | | 1.49% | | 1.57% I |
| Expenses net of all reductions | | 1.49% | | 1.48% | | 1.56% I |
| Net investment income (loss) | | 1.01% | | 1.06% | | .51% I |
| Supplemental Data | | | | | | |
| Net assets, end of period (000 omitted) | $ | 308 | $ | 224 | $ | 164 |
Portfolio turnover rate K | | | | 119% | | 84% I |
AFor the period February 10, 2022 (commencement of operations) through October 31, 2022
BCalculated based on average shares outstanding during the period.
CNet investment income (loss) is affected by the timing of the declaration of dividends by any underlying mutual funds or exchange-traded funds (ETFs). Net investment income (loss) of any mutual funds or ETFs is not included in the Fund's net investment income (loss) ratio.
DTotal returns for periods of less than one year are not annualized.
ETotal returns would have been lower if certain expenses had not been reduced during the applicable periods shown.
FTotal returns do not include the effect of the sales charges.
GFees and expenses of any underlying mutual funds or exchange-traded funds (ETFs) are not included in the Fund's expense ratio. The Fund indirectly bears its proportionate share of these expenses. For additional expense information related to investments in Fidelity Central Funds, please refer to the "Investments in Fidelity Central Funds" note found in the Notes to Financial Statements section of the most recent Annual or Semi-Annual report.
HExpense ratios reflect operating expenses of the class. Expenses before reductions do not reflect amounts reimbursed, waived, or reduced through arrangements with the investment adviser, brokerage services, or other offset arrangements, if applicable, and do not represent the amount paid by the class during periods when reimbursements, waivers or reductions occur.
IAnnualized.
JAudit fees are not annualized.
KAmount does not include the portfolio activity of any underlying mutual funds or exchange-traded funds (ETFs).
Fidelity Advisor® Sustainable Emerging Markets Equity Fund Class M |
| |
| Years ended October 31, | | 2024 | | 2023 | | 2022 A |
Selected Per-Share Data | | | | | | |
| Net asset value, beginning of period | $ | 7.35 | $ | 6.54 | $ | 10.00 |
| Income from Investment Operations | | | | | | |
Net investment income (loss) B,C | | .06 | | .06 | | .01 |
| Net realized and unrealized gain (loss) | | 1.77 | | .77 | | (3.47) |
| Total from investment operations | | 1.83 | | .83 | | (3.46) |
| Distributions from net investment income | | (.10) | | (.02) | | - |
| Total distributions | | (.10) | | (.02) | | - |
| Net asset value, end of period | $ | 9.08 | $ | 7.35 | $ | 6.54 |
Total Return D,E,F | | | | 12.65% | | (34.60)% |
Ratios to Average Net Assets C,G,H | | | | | | |
| Expenses before reductions | | 5.14% | | 6.57% | | 9.01% I,J |
| Expenses net of fee waivers, if any | | | | 1.74% | | 1.82% I |
| Expenses net of all reductions | | 1.74% | | 1.73% | | 1.82% I |
| Net investment income (loss) | | .76% | | .81% | | .26% I |
| Supplemental Data | | | | | | |
| Net assets, end of period (000 omitted) | $ | 245 | $ | 184 | $ | 164 |
Portfolio turnover rate K | | | | 119% | | 84% I |
AFor the period February 10, 2022 (commencement of operations) through October 31, 2022
BCalculated based on average shares outstanding during the period.
CNet investment income (loss) is affected by the timing of the declaration of dividends by any underlying mutual funds or exchange-traded funds (ETFs). Net investment income (loss) of any mutual funds or ETFs is not included in the Fund's net investment income (loss) ratio.
DTotal returns for periods of less than one year are not annualized.
ETotal returns would have been lower if certain expenses had not been reduced during the applicable periods shown.
FTotal returns do not include the effect of the sales charges.
GFees and expenses of any underlying mutual funds or exchange-traded funds (ETFs) are not included in the Fund's expense ratio. The Fund indirectly bears its proportionate share of these expenses. For additional expense information related to investments in Fidelity Central Funds, please refer to the "Investments in Fidelity Central Funds" note found in the Notes to Financial Statements section of the most recent Annual or Semi-Annual report.
HExpense ratios reflect operating expenses of the class. Expenses before reductions do not reflect amounts reimbursed, waived, or reduced through arrangements with the investment adviser, brokerage services, or other offset arrangements, if applicable, and do not represent the amount paid by the class during periods when reimbursements, waivers or reductions occur.
IAnnualized.
JAudit fees are not annualized.
KAmount does not include the portfolio activity of any underlying mutual funds or exchange-traded funds (ETFs).
Fidelity Advisor® Sustainable Emerging Markets Equity Fund Class C |
| |
| Years ended October 31, | | 2024 | | 2023 | | 2022 A |
Selected Per-Share Data | | | | | | |
| Net asset value, beginning of period | $ | 7.30 | $ | 6.52 | $ | 10.00 |
| Income from Investment Operations | | | | | | |
Net investment income (loss) B,C | | .02 | | .02 | | (.01) |
| Net realized and unrealized gain (loss) | | 1.77 | | .76 | | (3.47) |
| Total from investment operations | | 1.79 | | .78 | | (3.48) |
| Distributions from net investment income | | (.06) | | - | | - |
| Total distributions | | (.06) | | - | | - |
| Net asset value, end of period | $ | 9.03 | $ | 7.30 | $ | 6.52 |
Total Return D,E,F | | | | 11.96% | | (34.80)% |
Ratios to Average Net Assets C,G,H | | | | | | |
| Expenses before reductions | | 5.70% | | 7.07% | | 9.51% I,J |
| Expenses net of fee waivers, if any | | | | 2.25% | | 2.32% I |
| Expenses net of all reductions | | 2.24% | | 2.24% | | 2.32% I |
| Net investment income (loss) | | .26% | | .31% | | (.24)% I |
| Supplemental Data | | | | | | |
| Net assets, end of period (000 omitted) | $ | 231 | $ | 185 | $ | 163 |
Portfolio turnover rate K | | | | 119% | | 84% I |
AFor the period February 10, 2022 (commencement of operations) through October 31, 2022
BCalculated based on average shares outstanding during the period.
CNet investment income (loss) is affected by the timing of the declaration of dividends by any underlying mutual funds or exchange-traded funds (ETFs). Net investment income (loss) of any mutual funds or ETFs is not included in the Fund's net investment income (loss) ratio.
DTotal returns for periods of less than one year are not annualized.
ETotal returns would have been lower if certain expenses had not been reduced during the applicable periods shown.
FTotal returns do not include the effect of the contingent deferred sales charge.
GFees and expenses of any underlying mutual funds or exchange-traded funds (ETFs) are not included in the Fund's expense ratio. The Fund indirectly bears its proportionate share of these expenses. For additional expense information related to investments in Fidelity Central Funds, please refer to the "Investments in Fidelity Central Funds" note found in the Notes to Financial Statements section of the most recent Annual or Semi-Annual report.
HExpense ratios reflect operating expenses of the class. Expenses before reductions do not reflect amounts reimbursed, waived, or reduced through arrangements with the investment adviser, brokerage services, or other offset arrangements, if applicable, and do not represent the amount paid by the class during periods when reimbursements, waivers or reductions occur.
IAnnualized.
JAudit fees are not annualized.
KAmount does not include the portfolio activity of any underlying mutual funds or exchange-traded funds (ETFs).
Fidelity® Sustainable Emerging Markets Equity Fund |
| |
| Years ended October 31, | | 2024 | | 2023 | | 2022 A |
Selected Per-Share Data | | | | | | |
| Net asset value, beginning of period | $ | 7.38 | $ | 6.57 | $ | 10.00 |
| Income from Investment Operations | | | | | | |
Net investment income (loss) B,C | | .11 | | .10 | | .05 |
| Net realized and unrealized gain (loss) | | 1.77 | | .76 | | (3.48) |
| Total from investment operations | | 1.88 | | .86 | | (3.43) |
| Distributions from net investment income | | (.14) | | (.05) | | - |
| Total distributions | | (.14) | | (.05) | | - |
| Net asset value, end of period | $ | 9.12 | $ | 7.38 | $ | 6.57 |
Total Return D,E | | | | 13.11% | | (34.30)% |
Ratios to Average Net Assets C,F,G | | | | | | |
| Expenses before reductions | | 4.63% | | 6.16% | | 8.07% H,I |
| Expenses net of fee waivers, if any | | | | 1.25% | | 1.25% H |
| Expenses net of all reductions | | 1.24% | | 1.24% | | 1.25% H |
| Net investment income (loss) | | 1.26% | | 1.31% | | .83% H |
| Supplemental Data | | | | | | |
| Net assets, end of period (000 omitted) | $ | 4,724 | $ | 2,947 | $ | 2,082 |
Portfolio turnover rate J | | | | 119% | | 84% H |
AFor the period February 10, 2022 (commencement of operations) through October 31, 2022
BCalculated based on average shares outstanding during the period.
CNet investment income (loss) is affected by the timing of the declaration of dividends by any underlying mutual funds or exchange-traded funds (ETFs). Net investment income (loss) of any mutual funds or ETFs is not included in the Fund's net investment income (loss) ratio.
DTotal returns for periods of less than one year are not annualized.
ETotal returns would have been lower if certain expenses had not been reduced during the applicable periods shown.
FFees and expenses of any underlying mutual funds or exchange-traded funds (ETFs) are not included in the Fund's expense ratio. The Fund indirectly bears its proportionate share of these expenses. For additional expense information related to investments in Fidelity Central Funds, please refer to the "Investments in Fidelity Central Funds" note found in the Notes to Financial Statements section of the most recent Annual or Semi-Annual report.
GExpense ratios reflect operating expenses of the class. Expenses before reductions do not reflect amounts reimbursed, waived, or reduced through arrangements with the investment adviser, brokerage services, or other offset arrangements, if applicable, and do not represent the amount paid by the class during periods when reimbursements, waivers or reductions occur.
HAnnualized.
IAudit fees are not annualized.
JAmount does not include the portfolio activity of any underlying mutual funds or exchange-traded funds (ETFs).
Fidelity Advisor® Sustainable Emerging Markets Equity Fund Class I |
| |
| Years ended October 31, | | 2024 | | 2023 | | 2022 A |
Selected Per-Share Data | | | | | | |
| Net asset value, beginning of period | $ | 7.38 | $ | 6.57 | $ | 10.00 |
| Income from Investment Operations | | | | | | |
Net investment income (loss) B,C | | .11 | | .10 | | .04 |
| Net realized and unrealized gain (loss) | | 1.77 | | .76 | | (3.47) |
| Total from investment operations | | 1.88 | | .86 | | (3.43) |
| Distributions from net investment income | | (.14) | | (.05) | | - |
| Total distributions | | (.14) | | (.05) | | - |
| Net asset value, end of period | $ | 9.12 | $ | 7.38 | $ | 6.57 |
Total Return D,E | | | | 13.11% | | (34.30)% |
Ratios to Average Net Assets C,F,G | | | | | | |
| Expenses before reductions | | 4.70% | | 6.00% | | 8.50% H,I |
| Expenses net of fee waivers, if any | | | | 1.24% | | 1.31% H |
| Expenses net of all reductions | | 1.24% | | 1.23% | | 1.31% H |
| Net investment income (loss) | | 1.26% | | 1.31% | | .76% H |
| Supplemental Data | | | | | | |
| Net assets, end of period (000 omitted) | $ | 256 | $ | 201 | $ | 164 |
Portfolio turnover rate J | | | | 119% | | 84% H |
AFor the period February 10, 2022 (commencement of operations) through October 31, 2022
BCalculated based on average shares outstanding during the period.
CNet investment income (loss) is affected by the timing of the declaration of dividends by any underlying mutual funds or exchange-traded funds (ETFs). Net investment income (loss) of any mutual funds or ETFs is not included in the Fund's net investment income (loss) ratio.
DTotal returns for periods of less than one year are not annualized.
ETotal returns would have been lower if certain expenses had not been reduced during the applicable periods shown.
FFees and expenses of any underlying mutual funds or exchange-traded funds (ETFs) are not included in the Fund's expense ratio. The Fund indirectly bears its proportionate share of these expenses. For additional expense information related to investments in Fidelity Central Funds, please refer to the "Investments in Fidelity Central Funds" note found in the Notes to Financial Statements section of the most recent Annual or Semi-Annual report.
GExpense ratios reflect operating expenses of the class. Expenses before reductions do not reflect amounts reimbursed, waived, or reduced through arrangements with the investment adviser, brokerage services, or other offset arrangements, if applicable, and do not represent the amount paid by the class during periods when reimbursements, waivers or reductions occur.
HAnnualized.
IAudit fees are not annualized.
JAmount does not include the portfolio activity of any underlying mutual funds or exchange-traded funds (ETFs).
Fidelity Advisor® Sustainable Emerging Markets Equity Fund Class Z |
| |
| Years ended October 31, | | 2024 | | 2023 | | 2022 A |
Selected Per-Share Data | | | | | | |
| Net asset value, beginning of period | $ | 7.40 | $ | 6.57 | $ | 10.00 |
| Income from Investment Operations | | | | | | |
Net investment income (loss) B,C | | .12 | | .11 | | .05 |
| Net realized and unrealized gain (loss) | | 1.78 | | .77 | | (3.48) |
| Total from investment operations | | 1.90 | | .88 | | (3.43) |
| Distributions from net investment income | | (.14) | | (.05) | | - |
| Total distributions | | (.14) | | (.05) | | - |
| Net asset value, end of period | $ | 9.16 | $ | 7.40 | $ | 6.57 |
Total Return D,E | | | | 13.42% | | (34.30)% |
Ratios to Average Net Assets C,F,G | | | | | | |
| Expenses before reductions | | 4.45% | | 5.87% | | 8.23% H,I |
| Expenses net of fee waivers, if any | | | | 1.09% | | 1.15% H |
| Expenses net of all reductions | | 1.09% | | 1.09% | | 1.15% H |
| Net investment income (loss) | | 1.41% | | 1.46% | | .93% H |
| Supplemental Data | | | | | | |
| Net assets, end of period (000 omitted) | $ | 653 | $ | 390 | $ | 276 |
Portfolio turnover rate J | | | | 119% | | 84% H |
AFor the period February 10, 2022 (commencement of operations) through October 31, 2022
BCalculated based on average shares outstanding during the period.
CNet investment income (loss) is affected by the timing of the declaration of dividends by any underlying mutual funds or exchange-traded funds (ETFs). Net investment income (loss) of any mutual funds or ETFs is not included in the Fund's net investment income (loss) ratio.
DTotal returns for periods of less than one year are not annualized.
ETotal returns would have been lower if certain expenses had not been reduced during the applicable periods shown.
FFees and expenses of any underlying mutual funds or exchange-traded funds (ETFs) are not included in the Fund's expense ratio. The Fund indirectly bears its proportionate share of these expenses. For additional expense information related to investments in Fidelity Central Funds, please refer to the "Investments in Fidelity Central Funds" note found in the Notes to Financial Statements section of the most recent Annual or Semi-Annual report.
GExpense ratios reflect operating expenses of the class. Expenses before reductions do not reflect amounts reimbursed, waived, or reduced through arrangements with the investment adviser, brokerage services, or other offset arrangements, if applicable, and do not represent the amount paid by the class during periods when reimbursements, waivers or reductions occur.
HAnnualized.
IAudit fees are not annualized.
JAmount does not include the portfolio activity of any underlying mutual funds or exchange-traded funds (ETFs).
Notes to Financial Statements
For the period ended October 31, 2024
1. Organization.
Fidelity Sustainable Emerging Markets Equity Fund (the Fund) is a fund of Fidelity Investment Trust (the Trust) and is authorized to issue an unlimited number of shares. The Trust is registered under the Investment Company Act of 1940, as amended (the 1940 Act), as an open-end management investment company organized as a Massachusetts business trust. The Fund offers Class A, Class M, Class C, Fidelity Sustainable Emerging Markets Equity Fund, Class I and Class Z shares, each of which has equal rights as to assets and voting privileges. Class A, Class M, Class C, Class I and Class Z are Fidelity Advisor classes. Each class has exclusive voting rights with respect to matters that affect that class. Class C shares will automatically convert to Class A shares after a holding period of eight years from the initial date of purchase, with certain exceptions. The Fund's investments in emerging markets can be subject to social, economic, regulatory, and political uncertainties and can be extremely volatile.
2. Investments in Fidelity Central Funds.
Funds may invest in Fidelity Central Funds, which are open-end investment companies generally available only to other investment companies and accounts managed by the investment adviser and its affiliates. The Schedule of Investments lists any Fidelity Central Funds held as an investment as of period end, but does not include the underlying holdings of each Fidelity Central Fund. An investing fund indirectly bears its proportionate share of the expenses of the underlying Fidelity Central Funds.
Based on its investment objective, each Fidelity Central Fund may invest or participate in various investment vehicles or strategies that are similar to those of the investing fund. These strategies are consistent with the investment objectives of the investing fund and may involve certain economic risks which may cause a decline in value of each of the Fidelity Central Funds and thus a decline in the value of the investing fund.
| Fidelity Central Fund | Investment Manager | Investment Objective | Investment Practices | Expense RatioA |
| Fidelity Money Market Central Funds | Fidelity Management & Research Company LLC (FMR) | Each fund seeks to obtain a high level of current income consistent with the preservation of capital and liquidity. | Short-term Investments | Less than .005% |
A Expenses expressed as a percentage of average net assets and are as of each underlying Central Fund's most recent annual or semi-annual shareholder report.
A complete unaudited list of holdings for each Fidelity Central Fund is available upon request or at the Securities and Exchange Commission website at www.sec.gov. In addition, the financial statements of the Fidelity Central Funds which contain the significant accounting policies (including investment valuation policies) of those funds, and are not covered by the Report of Independent Registered Public Accounting Firm, are available on the Securities and Exchange Commission website or upon request.
3. Significant Accounting Policies.
The Fund is an investment company and applies the accounting and reporting guidance of the Financial Accounting Standards Board (FASB) Accounting Standards Codification Topic 946 Financial Services - Investment Companies. The financial statements have been prepared in conformity with accounting principles generally accepted in the United States of America (GAAP), which require management to make certain estimates and assumptions at the date of the financial statements. Actual results could differ from those estimates. Subsequent events, if any, through the date that the financial statements were issued have been evaluated in the preparation of the financial statements. The Fund's Schedule of Investments lists any underlying mutual funds or exchange-traded funds (ETFs) but does not include the underlying holdings of these funds. The following summarizes the significant accounting policies of the Fund:
Investment Valuation. Investments are valued as of 4:00 p.m. Eastern time on the last calendar day of the period. The Board of Trustees (the Board) has designated the Fund's investment adviser as the valuation designee responsible for the fair valuation function and performing fair value determinations as needed. The investment adviser has established a Fair Value Committee (the Committee) to carry out the day-to-day fair valuation responsibilities and has adopted policies and procedures to govern the fair valuation process and the activities of the Committee. In accordance with these fair valuation policies and procedures, which have been approved by the Board, the Fund attempts to obtain prices from one or more third party pricing services or brokers to value its investments. When current market prices, quotations or currency exchange rates are not readily available or reliable, investments will be fair valued in good faith by the Committee, in accordance with the policies and procedures. Factors used in determining fair value vary by investment type and may include market or investment specific events, transaction data, estimated cash flows, and market observations of comparable investments. The frequency that the fair valuation procedures are used cannot be predicted and they may be utilized to a significant extent. The Committee manages the Fund's fair valuation practices and maintains the fair valuation policies and procedures. The Fund's investment adviser reports to the Board information regarding the fair valuation process and related material matters.
The Fund categorizes the inputs to valuation techniques used to value its investments into a disclosure hierarchy consisting of three levels as shown below:
Level 1 - unadjusted quoted prices in active markets for identical investments
Level 2 - other significant observable inputs (including quoted prices for similar investments, interest rates, prepayment speeds, etc.)
Level 3 - unobservable inputs (including the Fund's own assumptions based on the best information available)
Valuation techniques used to value the Fund's investments by major category are as follows:
Equity securities, including restricted securities, for which market quotations are readily available, are valued at the last reported sale price or official closing price as reported by a third party pricing service on the primary market or exchange on which they are traded and are categorized as Level 1 in the hierarchy. In the event there were no sales during the day or closing prices are not available, securities are valued at the last quoted bid price or may be valued using the last available price and are generally categorized as Level 2 in the hierarchy. For foreign equity securities, when market or security specific events arise, comparisons to the valuation of American Depositary Receipts (ADRs), futures contracts, Exchange-Traded Funds (ETFs) and certain indexes as well as quoted prices for similar securities may be used and would be categorized as Level 2 in the hierarchy. For equity securities, including restricted securities, where observable inputs are limited, assumptions about market activity and risk are used and these securities may be categorized as Level 3 in the hierarchy.
Futures contracts are valued at the settlement price established each day by the board of trade or exchange on which they are traded and are categorized as Level 1 in the hierarchy. Investments in open-end mutual funds ,including the Fidelity Central Funds, are valued at their closing net asset value (NAV) each business day and are categorized as Level 1 in the hierarchy.
Changes in valuation techniques may result in transfers in or out of an assigned level within the disclosure hierarchy. The aggregate value of investments by input level as of October 31, 2024 is included at the end of the Fund's Schedule of Investments.
Foreign Currency. Certain Funds may use foreign currency contracts to facilitate transactions in foreign-denominated securities. Gains and losses from these transactions may arise from changes in the value of the foreign currency or if the counterparties do not perform under the contracts' terms.
Foreign-denominated assets, including investment securities, and liabilities are translated into U.S. dollars at the exchange rates at period end. Purchases and sales of investment securities, income and dividends received, and expenses denominated in foreign currencies are translated into U.S. dollars at the exchange rate in effect on the transaction date.
The effects of exchange rate fluctuations on investments are included with the net realized and unrealized gain (loss) on investment securities. Other foreign currency transactions resulting in realized and unrealized gain (loss) are disclosed separately.
Investment Transactions and Income. For financial reporting purposes, the Fund's investment holdings and NAV include trades executed through the end of the last business day of the period. The NAV per share for processing shareholder transactions is calculated as of the close of business of the New York Stock Exchange (NYSE), normally 4:00 p.m. Eastern time and includes trades executed through the end of the prior business day. Gains and losses on securities sold are determined on the basis of identified cost. Commissions paid to certain brokers with whom the investment adviser, or its affiliates, places trades on behalf of a fund include an amount in addition to trade execution, which may be rebated back to a fund. Any such rebates are included in net realized gain (loss) on investments in the Statement of Operations. Dividend income is recorded on the ex-dividend date, except for certain dividends from foreign securities where the ex-dividend date may have passed, which are recorded as soon as the Fund is informed of the ex-dividend date. Non-cash dividends included in dividend income, if any, are recorded at the fair market value of the securities received. Income and capital gain distributions from Fidelity Central Funds, if any, are recorded on the ex-dividend date. Investment income is recorded net of foreign taxes withheld where recovery of such taxes is uncertain.
Class Allocations and Expenses. Investment income, realized and unrealized capital gains and losses, common expenses of a fund, and certain fund-level expense reductions, if any, are allocated daily on a pro-rata basis to each class based on the relative net assets of each class to the total net assets of a fund. Each class differs with respect to transfer agent and distribution and service plan fees incurred, as applicable. Certain expense reductions may also differ by class, if applicable. For the reporting period, the allocated portion of income and expenses to each class as a percent of its average net assets may vary due to the timing of recording these transactions in relation to fluctuating net assets of the classes. Expenses directly attributable to a fund are charged to that fund. Expenses attributable to more than one fund are allocated among the respective funds on the basis of relative net assets or other appropriate methods. Expenses included in the accompanying financial statements reflect the expenses of that fund and do not include any expenses associated with any underlying mutual funds or exchange-traded funds (ETFs). Although not included in a fund's expenses, a fund indirectly bears its proportionate share of these expenses through the net asset value of each underlying mutual fund or exchange-traded fund (ETF). Expense estimates are accrued in the period to which they relate and adjustments are made when actual amounts are known.
Income Tax Information and Distributions to Shareholders. Each year, the Fund intends to qualify as a regulated investment company under Subchapter M of the Internal Revenue Code, including distributing substantially all of its taxable income and realized gains. As a result, no provision for U.S. Federal income taxes is required. As of October 31, 2024, the Fund did not have any unrecognized tax benefits in the financial statements; nor is the Fund aware of any tax positions for which it is reasonably possible that the total amounts of unrecognized tax benefits will significantly change in the next twelve months. The Fund files a U.S. federal tax return, in addition to state and local tax returns as required. The Fund's federal income tax returns are subject to examination by the Internal Revenue Service (IRS) for a period of three fiscal years after they are filed. State and local tax returns may be subject to examination for an additional fiscal year depending on the jurisdiction. Foreign taxes are provided for based on the Fund's understanding of the tax rules and rates that exist in the foreign markets in which it invests. The Fund is subject to a tax imposed on capital gains by certain countries in which it invests. An estimated deferred tax liability for net unrealized appreciation on the applicable securities is included in Deferred taxes on the Statement of Assets and Liabilities.
Distributions are declared and recorded on the ex-dividend date. Income and capital gain distributions are declared separately for each class. Income and capital gain distributions are determined in accordance with income tax regulations, which may differ from GAAP.
Capital accounts within the financial statements are adjusted for permanent book-tax differences. These adjustments have no impact on net assets or the results of operations. Capital accounts are not adjusted for temporary book-tax differences which will reverse in a subsequent period.
Book-tax differences are primarily due to futures contracts, foreign currency transactions, certain foreign taxes, passive foreign investment companies (PFIC), capital loss carryforwards and losses deferred due to wash sales.
As of period end, the cost and unrealized appreciation (depreciation) in securities, and derivatives if applicable, for federal income tax purposes were as follows:
| Gross unrealized appreciation | $791,917 |
| Gross unrealized depreciation | (241,457) |
| Net unrealized appreciation (depreciation) | $550,460 |
| Tax Cost | $5,937,789 |
The tax-based components of distributable earnings as of period end were as follows:
| Undistributed ordinary income | $64,892 |
| Capital loss carryforward | $(468,031) |
| Net unrealized appreciation (depreciation) on securities and other investments | $550,334 |
Capital loss carryforwards are only available to offset future capital gains of the Fund to the extent provided by regulations and may be limited. The capital loss carryforward information presented below, including any applicable limitation, is estimated as of fiscal period end and is subject to adjustment.
Short-term | $(468,031) |
Long-term | (-) |
| Total capital loss carryforward | $(468,031) |
The tax character of distributions paid was as follows:
| | October 31, 2024 | October 31, 2023 |
| Ordinary Income | $77,705 | $ 23,630 |
| Total | $77,705 | $ 23,630 |
Restricted Securities (including Private Placements). Funds may invest in securities that are subject to legal or contractual restrictions on resale. These securities generally may be resold in transactions exempt from registration or to the public if the securities are registered. Disposal of these securities may involve time-consuming negotiations and expense, and prompt sale at an acceptable price may be difficult. Information regarding restricted securities held at period end is included at the end of the Schedule of Investments, if applicable.
New Accounting Pronouncement. In November 2023, the FASB issued Accounting Standards Update (ASU) 2023-07 Segment Reporting (Topic 280): Improvements to Reportable Segment Disclosures. Effective for fiscal years beginning after December 15, 2023 and interim periods within fiscal years beginning after December 15, 2024, the amendments enhance required disclosures of segment information for public entities on an annual and interim basis. The ASU allows for early adoption with updates applied retrospectively. Management is currently evaluating the impact of the ASU but does not expect this guidance to materially impact the financial statements.
4. Derivative Instruments.
Risk Exposures and the Use of Derivative Instruments. The Fund's investment objectives allow for various types of derivative instruments, including futures contracts. Derivatives are investments whose value is primarily derived from underlying assets, indices or reference rates and may be transacted on an exchange or over-the-counter (OTC). Derivatives may involve a future commitment to buy or sell a specified asset based on specified terms, to exchange future cash flows at periodic intervals based on a notional principal amount, or for one party to make one or more payments upon the occurrence of specified events in exchange for periodic payments from the other party.
Derivatives were used to increase returns and to manage exposure to certain risks as defined below. The success of any strategy involving derivatives depends on analysis of numerous economic factors, and if the strategies for investment do not work as intended, the objectives may not be achieved.
Derivatives were used to increase or decrease exposure to the following risk(s):
| | |
| Equity Risk | Equity risk relates to the fluctuations in the value of financial instruments as a result of changes in market prices (other than those arising from interest rate risk or foreign exchange risk), whether caused by factors specific to an individual investment, its issuer, or all factors affecting all instruments traded in a market or market segment. |
Funds are also exposed to additional risks from investing in derivatives, such as liquidity risk and counterparty credit risk. Liquidity risk is the risk that a fund will be unable to close out the derivative in the open market in a timely manner. Counterparty credit risk is the risk that the counterparty will not be able to fulfill its obligation to a fund. Counterparty credit risk related to exchange-traded contracts may be mitigated by the protection provided by the exchange on which they trade.
Investing in derivatives may involve greater risks than investing in the underlying assets directly and, to varying degrees, may involve risk of loss in excess of any initial investment and collateral received and amounts recognized in the Statement of Assets and Liabilities. In addition, there may be the risk that the change in value of the derivative contract does not correspond to the change in value of the underlying instrument.
Futures Contracts. A futures contract is an agreement between two parties to buy or sell a specified underlying instrument for a fixed price at a specified future date. Futures contracts were used to manage exposure to the stock market.
Upon entering into a futures contract, a fund is required to deposit either cash or securities (initial margin) with a clearing broker in an amount equal to a certain percentage of the face value of the contract. Futures contracts are marked-to-market daily and subsequent daily payments are made or received by a fund depending on the daily fluctuations in the value of the futures contracts and are recorded as unrealized appreciation or (depreciation). This receivable and/or payable, if any, is included in daily variation margin on futures contracts in the Statement of Assets and Liabilities. Realized gain or (loss) is recorded upon the expiration or closing of a futures contract. The net realized gain (loss) and change in net unrealized appreciation (depreciation) on futures contracts during the period is presented in the Statement of Operations.
Any open futures contracts at period end are presented in the Schedule of Investments under the caption "Futures Contracts". The notional amount at value reflects each contract's exposure to the underlying instrument or index at period end, and is representative of volume of activity during the period unless an average notional amount is presented. Any securities deposited to meet initial margin requirements are identified in the Schedule of Investments. Any cash deposited to meet initial margin requirements is presented as segregated cash with brokers for derivative instruments in the Statement of Assets and Liabilities.
5. Purchases and Sales of Investments.
Purchases and sales of securities, other than short-term securities and in-kind transactions, as applicable, are noted in the table below.
| | Purchases ($) | Sales ($) |
| Fidelity Sustainable Emerging Markets Equity Fund | 6,552,643 | 5,497,925 |
6. Fees and Other Transactions with Affiliates.
Management Fee. Fidelity Management & Research Company LLC (the investment adviser) and its affiliates provide the Fund with investment management related services for which the Fund pays a monthly management fee.
Effective March 1, 2024, the Fund's management contract was amended to incorporate administrative services previously covered under separate services agreements (Transfer Agent and Accounting agreements). The amended contract incorporates a basic fee rate that may vary by class (subject to a performance adjustment). The investment adviser or an affiliate pays certain expenses of managing and operating the Fund out of each class's management fee. Each class of the Fund pays a management fee to the investment adviser. The management fee is calculated and paid to the investment adviser every month. The management fee is determined by calculating a basic fee and then applying a performance adjustment. When determining a class's basic fee, a mandate rate is calculated based on the monthly average net assets of a group of funds advised by FMR within a designated asset class. A discount rate is subtracted from the mandate rate once the Fund's monthly average net assets reach a certain level. The mandate rate and discount rate may vary by class. The annual basic fee rate for a class of shares of the Fund is the lesser of (1) the class's mandate rate reduced by the class's discount rate (if applicable) or (2) the amount set forth in the following table.
| | Maximum Management Fee Rate % |
| Class A | .98 |
| Class M | .90 |
| Class C | .90 |
| Fidelity Sustainable Emerging Markets Equity Fund | .98 |
| Class I | .90 |
| Class Z | .83 |
One-twelfth of the basic fee rate for a class is applied to the average net assets of the class for the month, giving a dollar amount which is the basic fee for the class for that month. A different management fee rate may be applicable to each class of the Fund. The difference between classes is the result of separate arrangements for class-level services and/or waivers of certain expenses. It is not the result of any difference in advisory or custodial fees or other expenses related to the management of the Fund's assets, which do not vary by class. For the portion of the reporting period on or after March 1, 2024, the total annualized management fee rates were as follows:
| | Total Management Fee Rate % |
| Class A | .97 |
| Class M | .90 |
| Class C | .90 |
| Fidelity Sustainable Emerging Markets Equity Fund | .92 |
| Class I | .90 |
| Class Z | .83 |
Prior to March 1, 2024, the management fee was the sum of an individual fund fee rate that was based on an annual rate of .55% of the Fund's average net assets and an annualized group fee rate that averaged .22% during the period. The group fee rate was based upon the monthly average net assets of a group of registered investment companies with which the investment adviser has management contracts. The group fee rate decreased as assets under management increased and increased as assets under management decreased. For the portion of the reporting period prior to March 1, 2024, the total annualized management fee rate was .77%.
The performance adjustment rate is calculated monthly by comparing over the performance period the Fund's performance to that of the performance adjustment index listed below.
| | Performance Adjustment Index |
| Fidelity Sustainable Emerging Markets Equity Fund | MSCI Emerging Markets Index |
For the purposes of calculating the performance adjustment for the Fund, the Fund's investment performance is based on the performance of Fidelity Sustainable Emerging Markets Equity Fund. To the extent that other classes of the Fund have higher expenses, this could result in those classes bearing a larger positive performance adjustment and smaller negative performance adjustment than would be the case if each class's own performance were considered. The performance period is the most recent 36 month period. The maximum annualized performance adjustment rate is ±.10% of the Fund's average net assets over the performance period. The performance adjustment rate is divided by twelve and multiplied by the Fund's average net assets over the performance period, and the resulting dollar amount is proportionately added to or subtracted from a class's basic fee. For the entire reporting period, the total annual performance adjustment was (.002)%.
Effective March 1, 2024, the Fund's sub-advisory agreements with FMR Investment Management (UK) Limited, Fidelity Management & Research (Hong Kong) Limited, and Fidelity Management & Research (Japan) Limited were amended to provide that the investment adviser pays each sub-adviser monthly fees equal to 110% of the sub-adviser's costs for providing sub-advisory services.
Distribution and Service Plan Fees. In accordance with Rule 12b-1 of the 1940 Act, the Fund has adopted separate Distribution and Service Plans for each class of shares. Certain classes pay Fidelity Distributors Company LLC (FDC), an affiliate of the investment adviser, separate Distribution and Service Fees, each of which is based on an annual percentage of each class' average net assets. In addition, FDC may pay financial intermediaries for selling shares of the Fund and providing shareholder support services. For the period, the Distribution and Service Fee rates, total fees and amounts retained by FDC were as follows:
| | Distribution Fee | Service Fee | Total Fees ($) | Retained by FDC ($) |
| Class A | - % | .25% | 704 | 546 |
| Class M | .25% | .25% | 1,120 | 1,084 |
| Class C | .75% | .25% | 2,176 | 2,145 |
| | | | 4,000 | 3,775 |
Sales Load. FDC may receive a front-end sales charge of up to 5.75% for selling Class A shares and 3.50% for selling Class M shares, some of which is paid to financial intermediaries for selling shares of the Fund. Depending on the holding period, FDC may receive contingent deferred sales charges levied on Class A, Class M and Class C redemptions. The deferred sales charges are 1.00% for Class C shares, 1.00% for certain purchases of Class A shares and .25% for certain purchases of Class M shares.
For the period, sales charge amounts retained by FDC were as follows:
| | Retained by FDC ($) |
| Class A | 27 |
| Class M | 26 |
| | 53 |
Transfer Agent Fees. Fidelity Investments Institutional Operations Company LLC (FIIOC), an affiliate of the investment adviser, is the transfer, dividend disbursing and shareholder servicing agent for each class of the Fund. Effective March 1, 2024, the Fund's management contract was amended to incorporate transfer agent services and associated fees previously covered under a separate services agreement. FIIOC pays for typesetting, printing and mailing of shareholder reports, except proxy statements.
During the period December 1, 2023 through February 29, 2024, the transfer agent fees for each class were a fixed annual rate of class-level average net assets as follows:
| | % of Class-Level Average Net Assets |
| Class A | .1963 |
| Class M | .1153 |
| Class C | .1151 |
| Fidelity Sustainable Emerging Markets Equity Fund | .2000 |
| Class I | .1217 |
| Class z | .0420 |
Prior to December 1, 2023, FIIOC received account fees and asset-based fees that varied according to the account size and type of account of the shareholders of the respective classes of the Fund, except for Class Z. FIIOC received an asset-based fee of Class Z's average net assets. For the portion of the reporting period prior to March 1, 2024, the fees were equivalent to the following annualized rates:
| | Amount ($) | % of Class-Level Average Net Assets |
| Class A | 195 | .23 |
| Class M | 81 | .12 |
| Class C | 79 | .12 |
| Fidelity Sustainable Emerging Markets Equity Fund | 2,450 | .21 |
| Class I | 92 | .13 |
| Class Z | 59 | .04 |
| 2,956 | |
Accounting Fees. Fidelity Service Company, Inc. (FSC), an affiliate of the investment adviser, maintains the Fund's accounting records. Effective March 1, 2024, the Fund's management contract was amended to incorporate accounting services and associated fees previously covered under a separate services agreement.
During the period December 1, 2023 through February 29, 2024, the accounting fees were a fixed annual rate of average net assets as follows:
| | % of Average Net Assets |
| Fidelity Sustainable Emerging Markets Equity Fund | .0498 |
Prior to December 1, 2023, the accounting fee was based on the level of average net assets for each month. For the portion of the reporting period prior to March 1, 2024, the fees were equivalent to the following annualized rates:
| | % of Average Net Assets |
| Fidelity Sustainable Emerging Markets Equity Fund | .05 |
Brokerage Commissions. A portion of portfolio transactions were placed with brokerage firms which are affiliates of the investment adviser. Brokerage commissions are included in net realized gain (loss) and change in net unrealized appreciation (depreciation) in the Statement of Operations. The commissions paid to these affiliated firms were as follows:
| | Amount ($) |
| Fidelity Sustainable Emerging Markets Equity Fund | 3 |
Interfund Trades. Funds may purchase from or sell securities to other Fidelity Funds under procedures adopted by the Board. The procedures have been designed to ensure these interfund trades are executed in accordance with Rule 17a-7 of the 1940 Act. Any interfund trades are included within the respective purchases and sales amounts shown in the Purchases and Sales of Investments note. Interfund trades during the period are noted in the table below.
| | Purchases ($) | Sales ($) | Realized Gain (Loss)($) |
| Fidelity Sustainable Emerging Markets Equity Fund | 58,717 | 157,134 | (739) |
7. Committed Line of Credit.
Certain Funds participate with other funds managed by the investment adviser or an affiliate in a $4.25 billion credit facility (the "line of credit") to be utilized for temporary or emergency purposes to fund shareholder redemptions or for other short-term liquidity purposes. The participating funds have agreed to pay commitment fees on their pro-rata portion of the line of credit, which are reflected in Miscellaneous expenses on the Statement of Operations, and are listed below. During the period, there were no borrowings on this line of credit.
| | Amount ($) |
| Fidelity Sustainable Emerging Markets Equity Fund | 8 |
8. Expense Reductions.
The investment adviser contractually agreed to reimburse expenses of each class to the extent annual operating expenses exceeded certain levels of class-level average net assets as noted in the table below. This reimbursement will remain in place through February 28, 2026. Some expenses, for example the compensation of the independent Trustees, and certain miscellaneous expenses such as proxy and shareholder meeting expenses, are excluded from this reimbursement.
The following classes were in reimbursement during the period:
| | Expense Limitations | Reimbursement ($) |
| Class A | 1.50% | 9,788 |
| Class M | 1.75% | 7,595 |
| Class C | 2.25% | 7,497 |
| Fidelity Sustainable Emerging Markets Equity Fund | 1.25% | 135,457 |
| Class I | 1.25% | 8,087 |
| Class Z | 1.10% | 16,486 |
| | | 184,910 |
Through arrangements with the Fund's custodian, credits realized as a result of certain uninvested cash balances were used to reduce the Fund's expenses. During the period, custodian credits reduced the Fund's expenses by $566.
In addition, during the period the investment adviser or an affiliate reimbursed and/or waived a portion of fund-level operating expenses in the amount of $216.
9. Distributions to Shareholders.
Distributions to shareholders of each class were as follows:
| | Year ended October 31, 2024 | Year ended October 31, 2023 |
| Fidelity Sustainable Emerging Markets Equity Fund | | |
| Distributions to shareholders | | |
| Class A | $3,751 | $1,114 |
| Class M | 2,609 | 450 |
| Class C | 1,624 | - |
| Fidelity Sustainable Emerging Markets Equity Fund | 59,025 | 18,515 |
| Class I | 3,903 | 1,326 |
| Class Z | 6,793 | 2,225 |
Total | $77,705 | $23,630 |
10. Share Transactions.
Share transactions for each class were as follows and may contain in-kind transactions, automatic conversions between classes or exchanges between affiliated funds:
| | Shares | Shares | Dollars | Dollars |
| | Year ended October 31, 2024 | Year ended October 31, 2023 | Year ended October 31, 2024 | Year ended October 31, 2023 |
| Fidelity Sustainable Emerging Markets Equity Fund | | | | |
| Class A | | | | |
| Shares sold | 3,670 | 8,323 | $31,365 | $64,307 |
| Reinvestment of distributions | 479 | 147 | 3,751 | 1,114 |
| Shares redeemed | (769) | (3,050) | (7,013) | (25,227) |
| Net increase (decrease) | 3,380 | 5,420 | $28,103 | $40,194 |
| Class M | | | | |
| Shares sold | 1,527 | 11 | $12,598 | $89 |
| Reinvestment of distributions | 333 | 59 | 2,609 | 450 |
| Net increase (decrease) | 1,860 | 70 | $15,207 | $539 |
| Class C | | | | |
| Shares sold | 52 | 848 | $409 | $6,892 |
| Reinvestment of distributions | 207 | - | 1,624 | - |
| Shares redeemed | - | (532) | - | (4,129) |
| Net increase (decrease) | 259 | 316 | $2,033 | $2,763 |
| Fidelity Sustainable Emerging Markets Equity Fund | | | | |
| Shares sold | 264,312 | 371,692 | $2,290,939 | $2,989,168 |
| Reinvestment of distributions | 6,946 | 2,252 | 54,391 | 17,120 |
| Shares redeemed | (152,780) | (291,557) | (1,305,836) | (2,290,199) |
| Net increase (decrease) | 118,478 | 82,387 | $1,039,494 | $716,089 |
| Class I | | | | |
| Shares sold | 1,183 | 2,102 | $10,008 | $17,000 |
| Reinvestment of distributions | 498 | 174 | 3,903 | 1,326 |
| Shares redeemed | (876) | - | (7,101) | - |
| Net increase (decrease) | 805 | 2,276 | $6,810 | $18,326 |
| Class Z | | | | |
| Shares sold | 31,252 | 14,147 | $268,600 | $113,210 |
| Reinvestment of distributions | 462 | 174 | 3,624 | 1,326 |
| Shares redeemed | (13,226) | (3,509) | (108,758) | (26,075) |
| Net increase (decrease) | 18,488 | 10,812 | $163,466 | $88,461 |
11. Other.
A fund's organizational documents provide former and current trustees and officers with a limited indemnification against liabilities arising in connection with the performance of their duties to the fund. In the normal course of business, a fund may also enter into contracts that provide general indemnifications. A fund's maximum exposure under these arrangements is unknown as this would be dependent on future claims that may be made against a fund. The risk of material loss from such claims is considered remote.
At the end of the period, the investment adviser or its affiliates were owners of record of more than 10% of the outstanding shares as follows:
| Fund | Affiliated % |
Fidelity Sustainable Emerging Markets Equity Fund | 23% |
In addition, at the end of the period, the following mutual funds managed by the investment adviser or its affiliates were the owners of record of 10% or more of the total outstanding shares.
| | Fidelity Sustainable Multi-Asset Fund |
| Fidelity Sustainable Emerging Markets Equity Fund | 30% |
12. Risk and Uncertainties.
Many factors affect a fund's performance. Developments that disrupt global economies and financial markets, such as pandemics, epidemics, outbreaks of infectious diseases, war, terrorism, and environmental disasters, may significantly affect a fund's investment performance. The effects of these developments to a fund will be impacted by the types of securities in which a fund invests, the financial condition, industry, economic sector, and geographic location of an issuer, and a fund's level of investment in the securities of that issuer. Significant concentrations in security types, issuers, industries, sectors, and geographic locations may magnify the factors that affect a fund's performance.
Report of Independent Registered Public Accounting Firm
To the Board of Trustees of Fidelity Investment Trust and Shareholders of Fidelity Sustainable Emerging Markets Equity Fund
Opinion on the Financial Statements
We have audited the accompanying statement of assets and liabilities, including the schedule of investments, of Fidelity Sustainable Emerging Markets Equity Fund (one of the funds constituting Fidelity Investment Trust, referred to hereafter as the "Fund") as of October 31, 2024, the related statement of operations for the year ended October 31, 2024, the statement of changes in net assets for each of the two years in the period ended October 31, 2024, including the related notes, and the financial highlights for each of the two years in the period ended October 31, 2024 and for the period February 10, 2022 (commencement of operations) through October 31, 2022 (collectively referred to as the "financial statements"). In our opinion, the financial statements present fairly, in all material respects, the financial position of the Fund as of October 31, 2024, the results of its operations for the year then ended, the changes in its net assets for each of the two years in the period ended October 31, 2024 and the financial highlights for each of the two years in the period ended October 31, 2024 and for the period February 10, 2022 (commencement of operations) through October 31, 2022 in conformity with accounting principles generally accepted in the United States of America.
Basis for Opinion
These financial statements are the responsibility of the Fund's management. Our responsibility is to express an opinion on the Fund's financial statements based on our audits. We are a public accounting firm registered with the Public Company Accounting Oversight Board (United States) (PCAOB) and are required to be independent with respect to the Fund in accordance with the U.S. federal securities laws and the applicable rules and regulations of the Securities and Exchange Commission and the PCAOB.
We conducted our audits of these financial statements in accordance with the standards of the PCAOB. Those standards require that we plan and perform the audit to obtain reasonable assurance about whether the financial statements are free of material misstatement, whether due to error or fraud.
Our audits included performing procedures to assess the risks of material misstatement of the financial statements, whether due to error or fraud, and performing procedures that respond to those risks. Such procedures included examining, on a test basis, evidence regarding the amounts and disclosures in the financial statements. Our audits also included evaluating the accounting principles used and significant estimates made by management, as well as evaluating the overall presentation of the financial statements. Our procedures included confirmation of securities owned as of October 31, 2024 by correspondence with the custodian and brokers; when replies were not received from brokers, we performed other auditing procedures. We believe that our audits provide a reasonable basis for our opinion.
/s/ PricewaterhouseCoopers LLP
Boston, Massachusetts
December 16, 2024
We have served as the auditor of one or more investment companies in the Fidelity group of funds since 1932.
Distributions
(Unaudited)The dividend and capital gains distributions for the fund(s) are available on Fidelity.com or Institutional.Fidelity.com.
The fund designates $2,642 of distributions paid during the fiscal year ended 2024 as qualifying to be taxed as section 163(j) interest dividends.
Class A designates 89.04% and 97.01%; Class M designates 100% and 97.01%; Class C designates 100% and 97.01%; Fidelity Sustainable Emerging Markets Equity Fund designates 78.17% and 97.01%; Class I designates 78.17% and 97.01%; and Class Z designates 78.17% and 97.01%; of each dividend distributed in December, respectively during the fiscal year as amounts which may be taken into account as a dividend for purposes of the maximum rate under section 1(h)(11) of the Internal Revenue Code.
The amounts per share which represent income derived from sources within, and taxes paid to, foreign countries or possessions of the United States are as follows:
| | Pay Date | Income | Taxes |
| Fidelity Sustainable Emerging Markets Equity Fund | | | |
| Class A | 12/11/23 | $0.1324 | $0.0259 |
| | 12/28/23 | $0.0000 | $0.0000 |
| Class M | 12/11/23 | $0.1149 | $0.0259 |
| | 12/28/23 | $0.0000 | $0.0000 |
| Class C | 12/11/23 | $0.0781 | $0.0259 |
| | 12/28/23 | $0.0000 | $0.0000 |
| Fidelity Sustainable Emerging Markets Equity Fund | 12/11/23 | $0.1508 | $0.0259 |
| | 12/28/23 | $0.0000 | $0.0000 |
| Class I | 12/11/23 | $0.1508 | $0.0259 |
| | 12/28/23 | $0.0000 | $0.0000 |
| Class Z | 12/11/23 | $0.1508 | $0.0259 |
| | 12/28/23 | $0.0000 | $0.0000 |
The fund will notify shareholders in January 2025 of amounts for use in preparing 2024 income tax returns.
Item 8: Changes in and Disagreements with Accountants for Open-End Management Investment Companies
(Unaudited)
Note: This is not applicable for any fund included in this document.
Item 9: Proxy Disclosures for Open-End Management Investment Companies
(Unaudited)
| A special meeting of shareholders was held on July 16, 2024. The results of votes taken among shareholders on the proposal before them are reported below. Each vote reported represents one dollar of net asset value held on the record date for the meeting. |
| Proposal 1 |
| To elect a Board of Trustees. |
| | # of Votes | % of Votes |
| Bettina Doulton |
| Affirmative | 128,529,177,643.56 | 98.18 |
| Withheld | 2,378,037,364.30 | 1.82 |
| TOTAL | 130,907,215,007.85 | 100.00 |
| Robert A. Lawrence |
| Affirmative | 128,253,389,899.05 | 97.97 |
| Withheld | 2,653,825,108.81 | 2.03 |
| TOTAL | 130,907,215,007.85 | 100.00 |
| Vijay C. Advani |
| Affirmative | 128,531,418,228.19 | 98.19 |
| Withheld | 2,375,796,779.66 | 1.81 |
| TOTAL | 130,907,215,007.85 | 100.00 |
| Thomas P. Bostick |
| Affirmative | 128,495,261,591.41 | 98.16 |
| Withheld | 2,411,953,416.44 | 1.84 |
| TOTAL | 130,907,215,007.85 | 100.00 |
| Donald F. Donahue |
| Affirmative | 128,407,878,996.00 | 98.09 |
| Withheld | 2,499,336,011.85 | 1.91 |
| TOTAL | 130,907,215,007.85 | 100.00 |
| Vicki L. Fuller |
| Affirmative | 128,625,540,095.19 | 98.26 |
| Withheld | 2,281,674,912.66 | 1.74 |
| TOTAL | 130,907,215,007.85 | 100.00 |
| Patricia L. Kampling |
| Affirmative | 128,668,729,281.34 | 98.29 |
| Withheld | 2,238,485,726.51 | 1.71 |
| TOTAL | 130,907,215,007.85 | 100.00 |
| Thomas A. Kennedy |
| Affirmative | 128,499,824,239.79 | 98.16 |
| Withheld | 2,407,390,768.06 | 1.84 |
| TOTAL | 130,907,215,007.85 | 100.00 |
| Oscar Munoz |
| Affirmative | 128,386,109,391.05 | 98.07 |
| Withheld | 2,521,105,616.80 | 1.93 |
| TOTAL | 130,907,215,007.85 | 100.00 |
| Karen B. Peetz |
| Affirmative | 128,603,731,113.82 | 98.24 |
| Withheld | 2,303,483,894.03 | 1.76 |
| TOTAL | 130,907,215,007.85 | 100.00 |
| David M. Thomas |
| Affirmative | 128,384,899,342.98 | 98.07 |
| Withheld | 2,522,315,664.88 | 1.93 |
| TOTAL | 130,907,215,007.85 | 100.00 |
| Susan Tomasky |
| Affirmative | 128,556,148,461.60 | 98.20 |
| Withheld | 2,351,066,546.25 | 1.80 |
| TOTAL | 130,907,215,007.85 | 100.00 |
| Michael E. Wiley |
| Affirmative | 128,264,934,978.34 | 97.98 |
| Withheld | 2,642,280,029.51 | 2.02 |
| TOTAL | 130,907,215,007.85 | 100.00 |
| | | |
| Proposal 1 reflects trust-wide proposal and voting results. |
Item 10: Remuneration Paid to Directors, Officers, and others of Open-End Management Investment Companies
(Unaudited)
Note: This information is disclosed as part of the financial statements for each Fund as part of Item 7: Financial Statements and Financial Highlights for Open-End Management Investment companies.
Item 11: Statement Regarding Basis for Approval of Investment Advisory Contract
(Unaudited)
Board Approval of Investment Advisory Contracts and Management Fees
Fidelity Sustainable Emerging Markets Equity Fund
Each year, the Board of Trustees, including the Independent Trustees (together, the Board), considers the renewal of the fund's management contract with Fidelity Management & Research Company LLC (FMR) and certain affiliates and the sub-advisory agreements (together, the Advisory Contracts) for the fund. FMR and the sub-advisers are referred to herein as the Investment Advisers. The Board, assisted by the advice of fund counsel and Independent Trustees' counsel, requests and considers a broad range of information relevant to the renewal of the Advisory Contracts throughout the year.
The Board meets regularly and, at each of its meetings, covers an extensive agenda of topics and materials and considers factors that are relevant to its annual consideration of the renewal of the fund's Advisory Contracts, including the services and support provided to the fund and its shareholders. The Board, acting directly and through its Committees (each of which is composed of and chaired by Independent Trustees), requests and receives information concerning the annual consideration of the renewal of the fund's Advisory Contracts. The Board also meets as needed to review matters specifically related to the Board's annual consideration of the renewal of the Advisory Contracts. Members of the Board may also meet with trustees of other Fidelity funds through joint ad hoc committees to discuss certain matters relevant to all of the Fidelity funds.
At its May 2024 meeting, the Board unanimously determined to renew the fund's Advisory Contracts. In reaching its determination, the Board considered all factors it believed relevant, including (i) the nature, extent, and quality of the services provided to the fund and its shareholders (including the investment performance of the fund); (ii) the competitiveness relative to peer funds of the fund's management fee and the total expense ratio of a representative class (the retail class, which was selected because it was the largest class without 12b-1 fees); (iii) the total costs of the services provided by and the profits realized by FMR and its affiliates (Fidelity) from its relationships with the fund; and (iv) the extent to which, if any, economies of scale exist and are realized as the fund grows, and whether any economies of scale are appropriately shared with fund shareholders. The Board also considered the broad range of investment choices available to shareholders from FMR's competitors and that the fund's shareholders have chosen to invest in the fund, which is part of the Fidelity family of funds. The Board's decision to renew the Advisory Contracts was not based on any single factor.
The Board reached a determination, with the assistance of fund counsel and Independent Trustees' counsel and through the exercise of its business judgment, that the renewal of the Advisory Contracts was in the best interests of the fund and its shareholders and that the compensation payable under the Advisory Contracts was fair and reasonable in light of all of the surrounding circumstances.
Nature, Extent, and Quality of Services Provided. The Board considered staffing as it relates to the fund, including the backgrounds and experience of investment personnel of the Investment Advisers, and also considered the Investment Advisers' implementation of the fund's investment program. The Independent Trustees also had discussions with senior management of Fidelity's investment operations and investment groups. The Board considered the structure of the investment personnel compensation program and whether this structure provides appropriate incentives to act in the best interests of the fund. Additionally, the Board considered the portfolio managers' investments, if any, in the funds that they manage.
Resources Dedicated to Investment Management and Support Services. The Board and the Fund Oversight and Research Committees reviewed the general qualifications and capabilities of Fidelity's investment staff, including its size, education, experience, and resources, as well as Fidelity's approach to recruiting, training, managing, and compensating investment personnel. The Board noted the resources devoted to expansion of Fidelity's global investment organization, and that Fidelity's analysts have extensive resources, tools, and capabilities that allow them to conduct sophisticated quantitative and fundamental analysis, as well as credit analysis of issuers, counterparties, and guarantors. Further, the Board considered that Fidelity's investment professionals have sufficient access to global information and data so as to provide competitive investment results over time, and that those professionals also have access to sophisticated tools that permit them to assess portfolio construction and risk and performance attribution characteristics continuously, as well as to transmit new information and research conclusions rapidly around the world. Additionally, in its deliberations, the Board considered Fidelity's trading, risk management, compliance, and technology and operations capabilities and resources, which are integral parts of the investment management process.
Shareholder and Administrative Services. The Board considered (i) the nature, extent, quality, and cost of advisory, administrative, shareholder, transfer agency, and pricing and bookkeeping services performed by the Investment Advisers and their affiliates under the Advisory Contracts; (ii) the nature and extent of Fidelity's supervision of third party service providers, principally custodians, subcustodians, and pricing vendors; and (iii) the resources devoted by Fidelity to, and the record of compliance with, the fund's compliance policies and procedures. The Board also reviewed the allocation of fund brokerage, including allocations to brokers affiliated with the Investment Advisers, the use of brokerage commissions to pay fund expenses, and the use of "soft" commission dollars to pay for research services. The Board also considered the fund's securities lending activities and any payments made to Fidelity relating to securities lending under a separate agreement.
The Board noted that the growth of fund assets over time across the complex allows Fidelity to reinvest in the development of services designed to enhance the value and convenience of the Fidelity funds as investment vehicles. These services include 24-hour access to account information and market information over the Internet and through telephone representatives, investor education materials, and asset allocation tools. The Board also considered that it reviews customer service metrics such as telephone response times, continuity of services on the website and metrics addressing services at Fidelity Investor Centers.
Investment in a Large Fund Family. The Board considered the benefits to shareholders of investing in a fund that is part of a large family of funds offering a variety of investment disciplines and providing a large variety of fund investor services. The Board noted that Fidelity had taken, or had made recommendations that resulted in the Fidelity funds taking, a number of actions over the previous year that benefited particular funds and/or the Fidelity funds in general.
Investment Performance. The Board took into account discussions that occur with representatives of the Investment Advisers, and reports that it receives, at Board meetings throughout the year, relating to fund investment performance. In this regard the Board noted that as part of regularly scheduled fund reviews and other reports to the Board on fund performance, the Board considered annualized return information for the fund for different time periods, measured against an appropriate securities market index (benchmark index). The Board also considered information about performance attribution. In its ongoing evaluation of fund investment performance, the Board gives particular attention to information indicating changes in performance of the funds over different time periods and discussed with the Investment Advisers the reasons for any overperformance or underperformance.
In addition to reviewing absolute and relative fund performance, the Independent Trustees periodically consider the appropriateness of fund performance metrics in evaluating the results achieved. The Independent Trustees generally give greater weight to fund performance over longer time periods than over shorter time periods. Depending on the circumstances, the Independent Trustees may be satisfied with a fund's performance notwithstanding that it lags its benchmark index for certain periods.
Based on its review, the Board concluded that the nature, extent, and quality of services provided to the fund under the Advisory Contracts should continue to benefit the shareholders of the fund.
Competitiveness of Management Fee and Total Expense Ratio. The Board was provided with information regarding industry trends in management fees and expenses. The Board considered that, effective March 1, 2024, an amended Advisory Contract with FMR went into effect with class-level management fees based on tiered schedules and subject to a maximum class-level rate (the management fee). The Board also considered that in exchange for the variable management fee, each class of the fund receives investment advisory, management, administrative, transfer agent, and pricing and bookkeeping services. In its review of the management fee and total expense ratio of the retail class, the Board considered a pro forma management fee rate for the retail class as if it had been in effect for the 12-month period ended September 30, 2023, as well as other third-party fund expenses, as applicable, such as custodial, legal, and audit fees and any fund-paid 12b-1 fees. The Board noted that Fidelity may agree to waive fees or reimburse expenses from time to time, and the extent to which, if any, it has done so for the fund. The Board also considered information about the impact of the fund's performance adjustment.
Comparisons of Management Fees and Total Expense Ratios. Among other things, the Board reviewed data for selected groups of competitive funds and classes (referred to as "mapped groups") that were compiled by Fidelity based on combining similar investment objective categories (as classified by Morningstar) that have comparable investment mandates. The data reviewed by the Board included (i) gross management fee comparisons (before taking into account expense reimbursements or caps and without taking into account the fund's performance adjustment) relative to the total universe of funds within the mapped group; (ii) gross management fee comparisons relative to a subset of non-Fidelity funds in the mapped group that are similar in size and management fee structure to the fund (referred to as the "asset size peer group"); (iii) total expense comparisons of the retail class of the fund relative to funds and classes in the mapped group that have a similar sales load structure to the retail class of the fund (referred to as the "similar sales load structure group"); and (iv) total expense comparisons of the retail class of the fund relative to funds and classes in the similar sales load structure group that are similar in size and management fee structure to the fund (referred to as the "total expense asset size peer group"). The total expense asset size peer group comparison excludes performance adjustments and fund-paid 12b-1 fees to eliminate variability in fee structures.
The information provided to the Board indicated that the fund's management fee rate ranked below the competitive median of the mapped group for the period ended September 30, 2023 and below the competitive median of the asset size peer group for the period ended September 30, 2023. Further, the information provided to the Board indicated that the total expense ratio of the retail class of the fund ranked below the competitive median of the similar sales load structure group for the period ended September 30, 2023 and above the competitive median of the total expense asset size peer group for the period ended September 30, 2023. The Board considered that there are only three thematic competitors within the fund's similar sales load structure group, of which the fund ranked second.
The Board noted that a different variable management fee rate is applicable to each class of the fund. The Board considered that the difference in management fee rates between classes is the result of separate arrangements for class-level services and/or waivers of certain expenses and not the result of any difference in advisory or custodial fees or other expenses related to the management of the fund's assets, which do not vary by class.
The Board also considered that the fund's management fee is subject to upward or downward adjustment depending upon whether, and to what extent, the fund's investment performance for the performance period (a rolling 36-month period) exceeds, or is exceeded by, a securities index, thus leading to a performance adjustment for the same period. The Board noted that the performance adjustment provides FMR with a strong economic incentive to seek to achieve superior long-term performance for the fund's shareholders and helps to more closely align the interests of FMR and the shareholders of the fund.
In connection with its consideration of the fund's performance adjustment, the Board noted that the performance of the retail class is used for purposes of determining the performance adjustment. The Board noted that to the extent the performance adjustment was based on the performance of a share class with higher total annual operating expenses, the fund would be subject to a smaller positive and larger negative performance adjustment. The Board considered the appropriateness of the use of the retail class as the basis for the performance adjustment. The Board noted that the retail class is typically the largest class (reflecting the actual investment experience for the plurality of shareholders), employs a standard expense structure, and does not include fund-paid 12b-1 fees, which Fidelity believes makes it a more appropriate measurement of Fidelity's investment skill.
Other Contractual Arrangements. The Board further considered that FMR has contractually agreed to reimburse Class A, Class M, Class C, Class I, Class Z, and the retail class of the fund to the extent that total operating expenses, with certain exceptions, as a percentage of their respective average net assets, exceed 1.50%, 1.75%, 2.25%, 1.25%, 1.10%, and 1.25% through February 28, 2025.
Fees Charged to Other Fidelity Clients. The Board also considered Fidelity fee structures and other information with respect to clients of Fidelity, such as other funds advised or subadvised by Fidelity, pension plan clients, and other institutional clients with similar mandates. The Board noted that a joint ad hoc committee created by it and the boards of other Fidelity funds periodically reviews and compares Fidelity's institutional investment advisory business with its business of providing services to the Fidelity funds and also noted the most recent findings of the committee. The Board noted that the committee's review included a consideration of the differences in services provided, fees charged, and costs incurred, as well as competition in the markets serving the different categories of clients.
Based on its review, the Board concluded that the fund's management fee, including the use of the retail class as the basis for the performance adjustment, is fair and reasonable in light of the services that the fund receives and the other factors considered. Further, based on its review of total expense ratios and fees charged to other Fidelity clients, the Board concluded that the total expense ratio of each class of the fund was reasonable in light of the services that the fund and its shareholders receive and the other factors considered.
Costs of the Services and Profitability. The Board considered the revenues earned and the expenses incurred by Fidelity in conducting the business of developing, marketing, distributing, managing, administering and servicing the fund and servicing the fund's shareholders. The Board also considered the level of Fidelity's profits in respect of all the Fidelity funds.
On an annual basis, Fidelity presents to the Board information about the profitability of its relationships with the fund. Fidelity calculates profitability information for each fund, as well as aggregate profitability information for groups of Fidelity funds and all Fidelity funds, using a series of detailed revenue and cost allocation methodologies which originate with the books and records of Fidelity on which Fidelity's audited financial statements are based. The Audit Committee of the Board reviews any significant changes from the prior year's methodologies.
A public accounting firm has been engaged annually by the Board as part of the Board's assessment of Fidelity's profitability analysis. The engagement includes the review and assessment of the methodologies used by Fidelity in determining the revenues and expenses attributable to Fidelity's fund business, and completion of agreed-upon procedures in respect of the mathematical accuracy of certain fund profitability information and its conformity to established allocation methodologies. After considering the reports issued under the engagement and information provided by Fidelity, the Board concluded that while other allocation methods may also be reasonable, Fidelity's profitability methodologies are reasonable in all material respects.
The Board also reviewed Fidelity's non-fund businesses and potential indirect benefits such businesses may have received as a result of their association with Fidelity's fund business (i.e., fall-out benefits) as well as cases where Fidelity's affiliates may benefit from the funds' business. The Board considered areas where potential indirect benefits to the Fidelity funds from their relationships with Fidelity may exist. The Board's consideration of these matters was informed by the findings of a joint ad hoc committee created by it and the boards of other Fidelity funds to evaluate potential fall-out benefits.
The Board considered the costs of the services provided by and the profits realized by Fidelity in connection with the operation of the fund and was satisfied that the profitability was not excessive.
Economies of Scale. The Board considered whether there have been economies of scale in respect of the management of the Fidelity funds, whether the Fidelity funds (including the fund) have appropriately benefited from any such economies of scale, and whether there is potential for realization of any further economies of scale. The Board considered the extent to which the fund will benefit from economies of scale as assets grow through increased services to the fund, through waivers or reimbursements, or through fee or expense ratio reductions. The Board also noted that a committee created by it and the boards of other Fidelity funds periodically analyzes whether Fidelity attains economies of scale in respect of the management and servicing of the Fidelity funds, whether the Fidelity funds have appropriately benefited from such economies of scale, and whether there is potential for realization of any further economies of scale.
The Board recognized that the fund's management contract incorporates a variable management fee structure, which provides breakpoints as a way to share, in part, any potential economies of scale that may exist at the asset class level and through a discount that considers both fund size and total assets of the four applicable asset classes. The Board considered that the variable management fee is designed to deliver the benefits of economies of scale to fund shareholders even if assets of any particular fund are unchanged or have declined, because some portion of Fidelity's costs are attributable to services provided to all funds subject to the variable management fee, and all such funds benefit if those costs can be allocated among more assets. The Board concluded that, given the variable management fee structure, fund shareholders will benefit from lower management fees due to the application of the breakpoints and discount factor, regardless of whether Fidelity achieves any such economies of scale.
The Board concluded, taking into account the analysis of the committee, that economies of scale, if any, are being appropriately shared between fund shareholders and Fidelity.
Additional Information Requested by the Board. In order to develop fully the factual basis for consideration of the Fidelity funds' advisory contracts, the Board requested and received additional information on certain topics, including but not limited to: (i) fund flow and performance trends, in particular the underperformance of certain funds and strategies, and Fidelity's long-term strategies for certain funds; (ii) the operation of performance fees and the rationale for implementing performance fees on certain categories of funds but not others; (iii) Fidelity's pricing philosophy compared to competitors; (iv) fund profitability methodology and data; (v) evaluation of competitive fund data and peer group classifications and fee and expense comparisons; (vi) the management fee and expense structures for different funds and classes and information about the differences between various fee and expense structures; (vii) the variable management fee implemented for certain funds effective March 1, 2024; and (viii) information regarding other accounts managed by Fidelity and the funds' sub-advisory arrangements.
Conclusion. Based on its evaluation of all of the conclusions noted above, and after considering all factors it believed relevant, the Board, including the Independent Trustees, concluded that the advisory and sub-advisory fee arrangements are fair and reasonable in light of all of the surrounding circumstances and that the fund's Advisory Contracts should be renewed through May 31, 2025.
1.9905243.102
MAR-ANN-1224
Fidelity® Sustainable International Equity Fund
Annual Report
October 31, 2024
Includes Fidelity and Fidelity Advisor share classes
Contents
To view a fund's proxy voting guidelines and proxy voting record for the 12-month period ended June 30, visit http://www.fidelity.com/proxyvotingresults or visit the Securities and Exchange Commission's (SEC) web site at http://www.sec.gov.
You may also call 1-800-544-8544 if you're an individual investing directly with Fidelity, call 1-800-835-5092 if you're a plan sponsor or participant with Fidelity as your recordkeeper or call 1-877-208-0098 on institutional accounts or if you're an advisor or invest through one to request a free copy of the proxy voting guidelines.
Standard & Poor's, S&P and S&P 500 are registered service marks of The McGraw-Hill Companies, Inc. and have been licensed for use by Fidelity Distributors Corporation.
Other third-party marks appearing herein are the property of their respective owners.
All other marks appearing herein are registered or unregistered trademarks or service marks of FMR LLC or an affiliated company. © 2024 FMR LLC. All rights reserved.
This report and the financial statements contained herein are submitted for the general information of the shareholders of the Fund. This report is not authorized for distribution to prospective investors in the Fund unless preceded or accompanied by an effective prospectus.
A fund files its complete schedule of portfolio holdings with the SEC for the first and third quarters of each fiscal year on Form N-PORT. Forms N-PORT are available on the SEC's web site at http://www.sec.gov. A fund's Forms N-PORT may be reviewed and copied at the SEC's Public Reference Room in Washington, DC. Information regarding the operation of the SEC's Public Reference Room may be obtained by calling 1-800-SEC-0330.
For a complete list of a fund's portfolio holdings, view the most recent holdings listing, semiannual report, or annual report on Fidelity's web site at http://www.fidelity.com, http://www.institutional.fidelity.com, or http://www.401k.com, as applicable.
NOT FDIC INSURED •MAY LOSE VALUE •NO BANK GUARANTEE
Neither the Fund nor Fidelity Distributors Corporation is a bank.
Item 7: Financial Statements and Financial Highlights for Open-End Management Investment Companies (Annual Report)
Fidelity® Sustainable International Equity Fund
Schedule of Investments October 31, 2024
Showing Percentage of Net Assets
| Common Stocks - 97.5% |
| | | Shares | Value ($) |
| Australia - 3.7% | | | |
| Brambles Ltd. | | 7,279 | 87,639 |
| IperionX Ltd. (a) | | 24,615 | 53,045 |
| Macquarie Group Ltd. | | 1,021 | 154,525 |
| QBE Insurance Group Ltd. | | 8,639 | 97,535 |
TOTAL AUSTRALIA | | | 392,744 |
| Austria - 0.8% | | | |
| Wienerberger AG | | 2,868 | 86,415 |
| Belgium - 2.4% | | | |
| KBC Group NV | | 879 | 63,755 |
| UCB SA | | 991 | 190,583 |
TOTAL BELGIUM | | | 254,338 |
| Canada - 0.5% | | | |
| Alimentation Couche-Tard, Inc. (multi-vtg.) | | 1,055 | 55,017 |
| Denmark - 5.1% | | | |
| Novo Nordisk A/S Series B | | 4,233 | 474,796 |
| Tryg A/S | | 2,182 | 51,386 |
| Vestas Wind Systems A/S (a) | | 1,206 | 22,983 |
TOTAL DENMARK | | | 549,165 |
| France - 9.8% | | | |
| Air Liquide SA | | 668 | 119,773 |
| Amundi SA (b) | | 1,699 | 122,898 |
| AXA SA | | 6,356 | 238,662 |
| BNP Paribas SA | | 1,703 | 116,305 |
| Danone SA | | 1,158 | 82,726 |
| EssilorLuxottica SA | | 419 | 98,172 |
| Hermes International SCA | | 70 | 157,920 |
| L'Oreal SA | | 221 | 82,913 |
| LVMH Moet Hennessy Louis Vuitton SE | | 51 | 33,952 |
TOTAL FRANCE | | | 1,053,321 |
| Germany - 6.7% | | | |
| adidas AG | | 338 | 80,948 |
| Deutsche Post AG ADR | | 1,874 | 75,278 |
| Gerresheimer AG | | 207 | 17,450 |
| Instone Real Estate Group BV (b) | | 7,289 | 65,015 |
| Merck KGaA | | 1,046 | 172,944 |
| Muenchener Rueckversicherungs-Gesellschaft AG in Muenchen | | 273 | 139,607 |
| SAP SE | | 457 | 106,703 |
| Siemens AG | | 320 | 62,256 |
TOTAL GERMANY | | | 720,201 |
| Hong Kong - 1.8% | | | |
| AIA Group Ltd. | | 24,859 | 196,195 |
| India - 1.0% | | | |
| HDFC Bank Ltd. sponsored ADR | | 1,612 | 101,604 |
| Ireland - 1.3% | | | |
| Dalata Hotel Group PLC | | 4,512 | 21,006 |
| Kingspan Group PLC (Ireland) | | 1,289 | 113,080 |
TOTAL IRELAND | | | 134,086 |
| Italy - 3.8% | | | |
| Prysmian SpA | | 2,154 | 151,874 |
| UniCredit SpA | | 5,833 | 258,047 |
TOTAL ITALY | | | 409,921 |
| Japan - 21.6% | | | |
| Fast Retailing Co. Ltd. | | 358 | 114,460 |
| Fuji Electric Co. Ltd. | | 900 | 45,835 |
| Hitachi Ltd. | | 18,567 | 466,493 |
| Hoya Corp. | | 1,278 | 170,989 |
| Itochu Corp. | | 7,559 | 373,927 |
| Net One Systems Co. Ltd. | | 5,005 | 121,516 |
| ORIX Corp. | | 14,309 | 301,489 |
| Pan Pacific International Holdings Ltd. | | 3 | 74 |
| Recruit Holdings Co. Ltd. | | 2,590 | 158,152 |
| Renesas Electronics Corp. | | 1,800 | 24,117 |
| Sony Group Corp. | | 15,857 | 279,044 |
| Sumitomo Mitsui Financial Group, Inc. | | 8,889 | 188,576 |
| Tokio Marine Holdings, Inc. | | 2,104 | 75,778 |
TOTAL JAPAN | | | 2,320,450 |
| Korea (South) - 0.4% | | | |
| SK Hynix, Inc. | | 355 | 46,627 |
| Netherlands - 8.4% | | | |
| ASML Holding NV (Netherlands) | | 422 | 285,150 |
| BE Semiconductor Industries NV | | 360 | 38,352 |
| ING Groep NV (Certificaten Van Aandelen) | | 11,189 | 189,882 |
| Koninklijke KPN NV | | 58,144 | 227,243 |
| Wolters Kluwer NV | | 987 | 166,087 |
TOTAL NETHERLANDS | | | 906,714 |
| New Zealand - 1.0% | | | |
| Contact Energy Ltd. | | 21,385 | 108,808 |
| Spain - 1.6% | | | |
| CaixaBank SA | | 9,008 | 54,893 |
| EDP Renovaveis SA | | 269 | 3,622 |
| Iberdrola SA | | 7,248 | 107,577 |
| Puig Brands SA Class B | | 400 | 9,224 |
TOTAL SPAIN | | | 175,316 |
| Sweden - 2.3% | | | |
| ASSA ABLOY AB (B Shares) | | 2,577 | 80,719 |
| Investor AB (B Shares) | | 4,329 | 122,481 |
| Lagercrantz Group AB (B Shares) | | 2,316 | 45,170 |
TOTAL SWEDEN | | | 248,370 |
| Switzerland - 0.8% | | | |
| Compagnie Financiere Richemont SA Series A | | 572 | 83,283 |
| Taiwan - 2.5% | | | |
| Taiwan Semiconductor Manufacturing Co. Ltd. | | 8,455 | 266,008 |
| United Kingdom - 14.0% | | | |
| 3i Group PLC | | 2,451 | 100,510 |
| AstraZeneca PLC (United Kingdom) | | 1,623 | 230,943 |
| Bellway PLC | | 3,591 | 131,319 |
| Berkeley Group Holdings PLC | | 1,927 | 109,964 |
| Big Yellow Group PLC | | 1,361 | 21,200 |
| Compass Group PLC | | 5,207 | 169,105 |
| Direct Line Insurance Group PLC | | 25,036 | 53,040 |
| Grainger Trust PLC | | 13,200 | 38,637 |
| London Stock Exchange Group PLC | | 843 | 114,257 |
| National Grid PLC | | 8,251 | 103,601 |
| RELX PLC (London Stock Exchange) | | 2,812 | 128,957 |
| Renewi PLC | | 2,622 | 20,556 |
| Sage Group PLC | | 2,214 | 27,675 |
| Unilever PLC | | 4,254 | 259,503 |
TOTAL UNITED KINGDOM | | | 1,509,267 |
| United States of America - 8.0% | | | |
| Alcon, Inc. (Switzerland) | | 410 | 37,783 |
| CRH PLC | | 3,250 | 309,861 |
| Ferguson Enterprises, Inc. | | 523 | 103,315 |
| Linde PLC | | 294 | 134,108 |
| Schneider Electric SA | | 1,072 | 277,700 |
TOTAL UNITED STATES OF AMERICA | | | 862,767 |
| TOTAL COMMON STOCKS (Cost $8,704,378) | | | 10,480,617 |
| | | | |
| Money Market Funds - 2.3% |
| | | Shares | Value ($) |
Fidelity Cash Central Fund 4.87% (c) (Cost $245,315) | | 245,266 | 245,315 |
| | | | |
| TOTAL INVESTMENT IN SECURITIES - 99.8% (Cost $8,949,693) | 10,725,932 |
NET OTHER ASSETS (LIABILITIES) - 0.2% | 21,098 |
| NET ASSETS - 100.0% | 10,747,030 |
| | |
Legend
| (b) | Security exempt from registration under Rule 144A of the Securities Act of 1933. These securities may be resold in transactions exempt from registration, normally to qualified institutional buyers. At the end of the period, the value of these securities amounted to $187,913 or 1.7% of net assets. |
| (c) | Affiliated fund that is generally available only to investment companies and other accounts managed by Fidelity Investments. The rate quoted is the annualized seven-day yield of the fund at period end. A complete unaudited listing of the fund's holdings as of its most recent quarter end is available upon request. In addition, each Fidelity Central Fund's financial statements, which are not covered by the Fund's Report of Independent Registered Public Accounting Firm, are available on the SEC's website or upon request. |
Affiliated Central Funds
Fiscal year to date information regarding the Fund's investments in Fidelity Central Funds, including the ownership percentage, is presented below.
| Affiliate | Value, beginning of period ($) | Purchases ($) | Sales Proceeds ($) | Dividend Income ($) | Realized Gain (loss) ($) | Change in Unrealized appreciation (depreciation) ($) | Value, end of period ($) | % ownership, end of period |
| Fidelity Cash Central Fund 4.87% | 226,885 | 3,685,789 | 3,667,359 | 17,098 | - | - | 245,315 | 0.0% |
| Total | 226,885 | 3,685,789 | 3,667,359 | 17,098 | - | - | 245,315 | |
| | | | | | | | | |
Amounts in the dividend income column in the above table include any capital gain distributions from underlying funds, which are presented in the corresponding line item in the Statement of Operations, if applicable.
Amounts included in the purchases and sales proceeds columns may include in-kind transactions, if applicable.
Investment Valuation
The following is a summary of the inputs used, as of October 31, 2024, involving the Fund's assets and liabilities carried at fair value. The inputs or methodology used for valuing securities may not be an indication of the risk associated with investing in those securities. For more information on valuation inputs, and their aggregation into the levels used below, please refer to the Investment Valuation section in the accompanying Notes to Financial Statements.
| Valuation Inputs at Reporting Date: |
| Description | Total ($) | Level 1 ($) | Level 2 ($) | Level 3 ($) |
Investments in Securities: | | | | |
|
| Equities: | | | | |
Communication Services | 227,243 | 227,243 | - | - |
Consumer Discretionary | 1,181,075 | 310,245 | 870,830 | - |
Consumer Staples | 489,383 | 64,241 | 425,142 | - |
Financials | 2,741,425 | 753,826 | 1,987,599 | - |
Health Care | 1,393,660 | 516,932 | 876,728 | - |
Industrials | 2,334,851 | 554,912 | 1,779,939 | - |
Information Technology | 961,318 | 396,347 | 564,971 | - |
Materials | 703,202 | 530,384 | 172,818 | - |
Real Estate | 124,852 | 124,852 | - | - |
Utilities | 323,608 | 111,199 | 212,409 | - |
|
| Money Market Funds | 245,315 | 245,315 | - | - |
| Total Investments in Securities: | 10,725,932 | 3,835,496 | 6,890,436 | - |
Financial Statements
| Statement of Assets and Liabilities |
As of October 31, 2024 |
| Assets | | | | |
| Investment in securities, at value - See accompanying schedule: | | | | |
Unaffiliated issuers (cost $8,704,378) | $ | 10,480,617 | | |
Fidelity Central Funds (cost $245,315) | | 245,315 | | |
| | | | | |
| | | | | |
| Total Investment in Securities (cost $8,949,693) | | | $ | 10,725,932 |
| Cash | | | | 31,795 |
| Foreign currency held at value (cost $73) | | | | 73 |
| Receivable for fund shares sold | | | | 9,165 |
| Dividends receivable | | | | 20,231 |
| Reclaims receivable | | | | 16,964 |
| Distributions receivable from Fidelity Central Funds | | | | 1,463 |
| Prepaid expenses | | | | 13 |
| Receivable from investment adviser for expense reductions | | | | 3,262 |
Total assets | | | | 10,808,898 |
| Liabilities | | | | |
| Payable for fund shares redeemed | $ | 41 | | |
| Accrued management fee | | 7,053 | | |
| Distribution and service plan fees payable | | 404 | | |
| Audit fee payable | | 47,904 | | |
| Custody fee payable | | 6,241 | | |
| Other payables and accrued expenses | | 225 | | |
| Total liabilities | | | | 61,868 |
| Net Assets | | | $ | 10,747,030 |
| Net Assets consist of: | | | | |
| Paid in capital | | | $ | 9,582,029 |
| Total accumulated earnings (loss) | | | | 1,165,001 |
| Net Assets | | | $ | 10,747,030 |
| | | | | |
| Net Asset Value and Maximum Offering Price | | | | |
| Class A : | | | | |
Net Asset Value and redemption price per share ($303,990 ÷ 31,258 shares)(a) | | | $ | 9.73 |
| Maximum offering price per share (100/94.25 of $9.73) | | | $ | 10.32 |
| Class M : | | | | |
Net Asset Value and redemption price per share ($270,187 ÷ 27,838 shares)(a) | | | $ | 9.71 |
| Maximum offering price per share (100/96.50 of $9.71) | | | $ | 10.06 |
| Class C : | | | | |
Net Asset Value and offering price per share ($259,552 ÷ 26,914 shares)(a) | | | $ | 9.64 |
| Fidelity Sustainable International Equity Fund : | | | | |
Net Asset Value, offering price and redemption price per share ($9,325,889 ÷ 956,561 shares) | | | $ | 9.75 |
| Class I : | | | | |
Net Asset Value, offering price and redemption price per share ($249,169 ÷ 25,559 shares) | | | $ | 9.75 |
| Class Z : | | | | |
Net Asset Value, offering price and redemption price per share ($338,243 ÷ 34,556 shares) | | | $ | 9.79 |
(a)Redemption price per share is equal to net asset value less any applicable contingent deferred sales charge. |
| Statement of Operations |
| Year ended October 31, 2024 |
| Investment Income | | | | |
| Dividends | | | $ | 242,697 |
| Income from Fidelity Central Funds | | | | 17,098 |
| Income before foreign taxes withheld | | | $ | 259,795 |
| Less foreign taxes withheld | | | | (22,643) |
| Total income | | | | 237,152 |
| Expenses | | | | |
| Management fee | | | | |
| Basic fee | $ | 73,844 | | |
| Performance adjustment | | (5,565) | | |
| Transfer agent fees | | 5,045 | | |
| Distribution and service plan fees | | 4,638 | | |
| Accounting fees and expenses | | 1,297 | | |
| Custodian fees and expenses | | 16,953 | | |
| Independent trustees' fees and expenses | | 40 | | |
| Registration fees | | 79,028 | | |
| Audit fees | | 71,963 | | |
| Legal | | 6 | | |
| Miscellaneous | | 290 | | |
| Total expenses before reductions | | 247,539 | | |
| Expense reductions | | (144,403) | | |
| Total expenses after reductions | | | | 103,136 |
| Net Investment income (loss) | | | | 134,016 |
| Realized and Unrealized Gain (Loss) | | | | |
| Net realized gain (loss) on: | | | | |
| Investment Securities: | | | | |
| Unaffiliated issuers | | (143,747) | | |
| Foreign currency transactions | | (1,660) | | |
| Total net realized gain (loss) | | | | (145,407) |
| Change in net unrealized appreciation (depreciation) on: | | | | |
| Investment Securities: | | | | |
| Unaffiliated issuers | | 1,875,444 | | |
| Assets and liabilities in foreign currencies | | (714) | | |
| Total change in net unrealized appreciation (depreciation) | | | | 1,874,730 |
| Net gain (loss) | | | | 1,729,323 |
| Net increase (decrease) in net assets resulting from operations | | | $ | 1,863,339 |
| Statement of Changes in Net Assets |
| |
| | Year ended October 31, 2024 | | Year ended October 31, 2023 |
| Increase (Decrease) in Net Assets | | | | |
| Operations | | | | |
| Net investment income (loss) | $ | 134,016 | $ | 98,930 |
| Net realized gain (loss) | | (145,407) | | (273,187) |
| Change in net unrealized appreciation (depreciation) | | 1,874,730 | | 561,529 |
| Net increase (decrease) in net assets resulting from operations | | 1,863,339 | | 387,272 |
| Distributions to shareholders | | (119,018) | | (29,290) |
| | | | | |
| Share transactions - net increase (decrease) | | 2,209,473 | | 1,623,323 |
| Total increase (decrease) in net assets | | 3,953,794 | | 1,981,305 |
| | | | | |
| Net Assets | | | | |
| Beginning of period | | 6,793,236 | | 4,811,931 |
| End of period | $ | 10,747,030 | $ | 6,793,236 |
| | | | | |
| | | | | |
Financial Highlights
Fidelity Advisor® Sustainable International Equity Fund Class A |
| |
| Years ended October 31, | | 2024 | | 2023 | | 2022 A |
Selected Per-Share Data | | | | | | |
| Net asset value, beginning of period | $ | 7.85 | $ | 7.20 | $ | 10.00 |
| Income from Investment Operations | | | | | | |
Net investment income (loss) B,C | | .11 | | .10 | | .07 |
| Net realized and unrealized gain (loss) | | 1.89 | | .58 | | (2.87) |
| Total from investment operations | | 2.00 | | .68 | | (2.80) |
| Distributions from net investment income | | (.12) | | (.03) | | - |
| Total distributions | | (.12) | | (.03) | | - |
| Net asset value, end of period | $ | 9.73 | $ | 7.85 | $ | 7.20 |
Total Return D,E,F | | | | 9.43% | | (28.00)% |
Ratios to Average Net Assets C,G,H | | | | | | |
| Expenses before reductions | | 3.09% | | 3.91% | | 7.77% I,J |
| Expenses net of fee waivers, if any | | | | 1.29% | | 1.30% I |
| Expenses net of all reductions | | 1.29% | | 1.29% | | 1.28% I |
| Net investment income (loss) | | 1.20% | | 1.23% | | 1.18% I |
| Supplemental Data | | | | | | |
| Net assets, end of period (000 omitted) | $ | 304 | $ | 353 | $ | 185 |
Portfolio turnover rate K | | | | 36% | | 43% I |
AFor the period February 10, 2022 (commencement of operations) through October 31, 2022
BCalculated based on average shares outstanding during the period.
CNet investment income (loss) is affected by the timing of the declaration of dividends by any underlying mutual funds or exchange-traded funds (ETFs). Net investment income (loss) of any mutual funds or ETFs is not included in the Fund's net investment income (loss) ratio.
DTotal returns for periods of less than one year are not annualized.
ETotal returns would have been lower if certain expenses had not been reduced during the applicable periods shown.
FTotal returns do not include the effect of the sales charges.
GFees and expenses of any underlying mutual funds or exchange-traded funds (ETFs) are not included in the Fund's expense ratio. The Fund indirectly bears its proportionate share of these expenses. For additional expense information related to investments in Fidelity Central Funds, please refer to the "Investments in Fidelity Central Funds" note found in the Notes to Financial Statements section of the most recent Annual or Semi-Annual report.
HExpense ratios reflect operating expenses of the class. Expenses before reductions do not reflect amounts reimbursed, waived, or reduced through arrangements with the investment adviser, brokerage services, or other offset arrangements, if applicable, and do not represent the amount paid by the class during periods when reimbursements, waivers or reductions occur.
IAnnualized.
JAudit fees are not annualized.
KAmount does not include the portfolio activity of any underlying mutual funds or exchange-traded funds (ETFs).
Fidelity Advisor® Sustainable International Equity Fund Class M |
| |
| Years ended October 31, | | 2024 | | 2023 | | 2022 A |
Selected Per-Share Data | | | | | | |
| Net asset value, beginning of period | $ | 7.83 | $ | 7.19 | $ | 10.00 |
| Income from Investment Operations | | | | | | |
Net investment income (loss) B,C | | .09 | | .08 | | .05 |
| Net realized and unrealized gain (loss) | | 1.89 | | .57 | | (2.86) |
| Total from investment operations | | 1.98 | | .65 | | (2.81) |
| Distributions from net investment income | | (.10) | | (.01) | | - |
| Total distributions | | (.10) | | (.01) | | - |
| Net asset value, end of period | $ | 9.71 | $ | 7.83 | $ | 7.19 |
Total Return D,E,F | | | | 9.08% | | (28.10)% |
Ratios to Average Net Assets C,G,H | | | | | | |
| Expenses before reductions | | 3.06% | | 4.24% | | 8.02% I,J |
| Expenses net of fee waivers, if any | | | | 1.55% | | 1.55% I |
| Expenses net of all reductions | | 1.54% | | 1.54% | | 1.55% I |
| Net investment income (loss) | | .95% | | .98% | | .91% I |
| Supplemental Data | | | | | | |
| Net assets, end of period (000 omitted) | $ | 270 | $ | 196 | $ | 180 |
Portfolio turnover rate K | | | | 36% | | 43% I |
AFor the period February 10, 2022 (commencement of operations) through October 31, 2022
BCalculated based on average shares outstanding during the period.
CNet investment income (loss) is affected by the timing of the declaration of dividends by any underlying mutual funds or exchange-traded funds (ETFs). Net investment income (loss) of any mutual funds or ETFs is not included in the Fund's net investment income (loss) ratio.
DTotal returns for periods of less than one year are not annualized.
ETotal returns would have been lower if certain expenses had not been reduced during the applicable periods shown.
FTotal returns do not include the effect of the sales charges.
GFees and expenses of any underlying mutual funds or exchange-traded funds (ETFs) are not included in the Fund's expense ratio. The Fund indirectly bears its proportionate share of these expenses. For additional expense information related to investments in Fidelity Central Funds, please refer to the "Investments in Fidelity Central Funds" note found in the Notes to Financial Statements section of the most recent Annual or Semi-Annual report.
HExpense ratios reflect operating expenses of the class. Expenses before reductions do not reflect amounts reimbursed, waived, or reduced through arrangements with the investment adviser, brokerage services, or other offset arrangements, if applicable, and do not represent the amount paid by the class during periods when reimbursements, waivers or reductions occur.
IAnnualized.
JAudit fees are not annualized.
KAmount does not include the portfolio activity of any underlying mutual funds or exchange-traded funds (ETFs).
Fidelity Advisor® Sustainable International Equity Fund Class C |
| |
| Years ended October 31, | | 2024 | | 2023 | | 2022 A |
Selected Per-Share Data | | | | | | |
| Net asset value, beginning of period | $ | 7.78 | $ | 7.16 | $ | 10.00 |
| Income from Investment Operations | | | | | | |
Net investment income (loss) B,C | | .04 | | .04 | | .02 |
| Net realized and unrealized gain (loss) | | 1.87 | | .58 | | (2.86) |
| Total from investment operations | | 1.91 | | .62 | | (2.84) |
| Distributions from net investment income | | (.05) | | - | | - |
| Total distributions | | (.05) | | - | | - |
| Net asset value, end of period | $ | 9.64 | $ | 7.78 | $ | 7.16 |
Total Return D,E,F | | | | 8.66% | | (28.40)% |
Ratios to Average Net Assets C,G,H | | | | | | |
| Expenses before reductions | | 3.53% | | 4.73% | | 8.51% I,J |
| Expenses net of fee waivers, if any | | | | 2.04% | | 2.05% I |
| Expenses net of all reductions | | 2.04% | | 2.04% | | 2.05% I |
| Net investment income (loss) | | .45% | | .48% | | .41% I |
| Supplemental Data | | | | | | |
| Net assets, end of period (000 omitted) | $ | 260 | $ | 194 | $ | 179 |
Portfolio turnover rate K | | | | 36% | | 43% I |
AFor the period February 10, 2022 (commencement of operations) through October 31, 2022
BCalculated based on average shares outstanding during the period.
CNet investment income (loss) is affected by the timing of the declaration of dividends by any underlying mutual funds or exchange-traded funds (ETFs). Net investment income (loss) of any mutual funds or ETFs is not included in the Fund's net investment income (loss) ratio.
DTotal returns for periods of less than one year are not annualized.
ETotal returns would have been lower if certain expenses had not been reduced during the applicable periods shown.
FTotal returns do not include the effect of the contingent deferred sales charge.
GFees and expenses of any underlying mutual funds or exchange-traded funds (ETFs) are not included in the Fund's expense ratio. The Fund indirectly bears its proportionate share of these expenses. For additional expense information related to investments in Fidelity Central Funds, please refer to the "Investments in Fidelity Central Funds" note found in the Notes to Financial Statements section of the most recent Annual or Semi-Annual report.
HExpense ratios reflect operating expenses of the class. Expenses before reductions do not reflect amounts reimbursed, waived, or reduced through arrangements with the investment adviser, brokerage services, or other offset arrangements, if applicable, and do not represent the amount paid by the class during periods when reimbursements, waivers or reductions occur.
IAnnualized.
JAudit fees are not annualized.
KAmount does not include the portfolio activity of any underlying mutual funds or exchange-traded funds (ETFs).
Fidelity® Sustainable International Equity Fund |
| |
| Years ended October 31, | | 2024 | | 2023 | | 2022 A |
Selected Per-Share Data | | | | | | |
| Net asset value, beginning of period | $ | 7.87 | $ | 7.21 | $ | 10.00 |
| Income from Investment Operations | | | | | | |
Net investment income (loss) B,C | | .14 | | .12 | | .08 |
| Net realized and unrealized gain (loss) | | 1.88 | | .58 | | (2.87) |
| Total from investment operations | | 2.02 | | .70 | | (2.79) |
| Distributions from net investment income | | (.14) | | (.04) | | - |
| Total distributions | | (.14) | | (.04) | | - |
| Net asset value, end of period | $ | 9.75 | $ | 7.87 | $ | 7.21 |
Total Return D,E | | | | 9.73% | | (27.90)% |
Ratios to Average Net Assets C,F,G | | | | | | |
| Expenses before reductions | | 2.55% | | 3.72% | | 7.64% H,I |
| Expenses net of fee waivers, if any | | | | 1.04% | | 1.05% H |
| Expenses net of all reductions | | 1.04% | | 1.04% | | 1.01% H |
| Net investment income (loss) | | 1.45% | | 1.48% | | 1.45% H |
| Supplemental Data | | | | | | |
| Net assets, end of period (000 omitted) | $ | 9,326 | $ | 5,563 | $ | 3,908 |
Portfolio turnover rate J | | | | 36% | | 43% H |
AFor the period February 10, 2022 (commencement of operations) through October 31, 2022
BCalculated based on average shares outstanding during the period.
CNet investment income (loss) is affected by the timing of the declaration of dividends by any underlying mutual funds or exchange-traded funds (ETFs). Net investment income (loss) of any mutual funds or ETFs is not included in the Fund's net investment income (loss) ratio.
DTotal returns for periods of less than one year are not annualized.
ETotal returns would have been lower if certain expenses had not been reduced during the applicable periods shown.
FFees and expenses of any underlying mutual funds or exchange-traded funds (ETFs) are not included in the Fund's expense ratio. The Fund indirectly bears its proportionate share of these expenses. For additional expense information related to investments in Fidelity Central Funds, please refer to the "Investments in Fidelity Central Funds" note found in the Notes to Financial Statements section of the most recent Annual or Semi-Annual report.
GExpense ratios reflect operating expenses of the class. Expenses before reductions do not reflect amounts reimbursed, waived, or reduced through arrangements with the investment adviser, brokerage services, or other offset arrangements, if applicable, and do not represent the amount paid by the class during periods when reimbursements, waivers or reductions occur.
HAnnualized.
IAudit fees are not annualized.
JAmount does not include the portfolio activity of any underlying mutual funds or exchange-traded funds (ETFs).
Fidelity Advisor® Sustainable International Equity Fund Class I |
| |
| Years ended October 31, | | 2024 | | 2023 | | 2022 A |
Selected Per-Share Data | | | | | | |
| Net asset value, beginning of period | $ | 7.87 | $ | 7.21 | $ | 10.00 |
| Income from Investment Operations | | | | | | |
Net investment income (loss) B,C | | .14 | | .12 | | .08 |
| Net realized and unrealized gain (loss) | | 1.88 | | .58 | | (2.87) |
| Total from investment operations | | 2.02 | | .70 | | (2.79) |
| Distributions from net investment income | | (.14) | | (.04) | | - |
| Total distributions | | (.14) | | (.04) | | - |
| Net asset value, end of period | $ | 9.75 | $ | 7.87 | $ | 7.21 |
Total Return D,E | | | | 9.73% | | (27.90)% |
Ratios to Average Net Assets C,F,G | | | | | | |
| Expenses before reductions | | 2.60% | | 3.74% | | 7.52% H,I |
| Expenses net of fee waivers, if any | | | | 1.04% | | 1.05% H |
| Expenses net of all reductions | | 1.04% | | 1.04% | | 1.03% H |
| Net investment income (loss) | | 1.45% | | 1.48% | | 1.43% H |
| Supplemental Data | | | | | | |
| Net assets, end of period (000 omitted) | $ | 249 | $ | 199 | $ | 180 |
Portfolio turnover rate J | | | | 36% | | 43% H |
AFor the period February 10, 2022 (commencement of operations) through October 31, 2022
BCalculated based on average shares outstanding during the period.
CNet investment income (loss) is affected by the timing of the declaration of dividends by any underlying mutual funds or exchange-traded funds (ETFs). Net investment income (loss) of any mutual funds or ETFs is not included in the Fund's net investment income (loss) ratio.
DTotal returns for periods of less than one year are not annualized.
ETotal returns would have been lower if certain expenses had not been reduced during the applicable periods shown.
FFees and expenses of any underlying mutual funds or exchange-traded funds (ETFs) are not included in the Fund's expense ratio. The Fund indirectly bears its proportionate share of these expenses. For additional expense information related to investments in Fidelity Central Funds, please refer to the "Investments in Fidelity Central Funds" note found in the Notes to Financial Statements section of the most recent Annual or Semi-Annual report.
GExpense ratios reflect operating expenses of the class. Expenses before reductions do not reflect amounts reimbursed, waived, or reduced through arrangements with the investment adviser, brokerage services, or other offset arrangements, if applicable, and do not represent the amount paid by the class during periods when reimbursements, waivers or reductions occur.
HAnnualized.
IAudit fees are not annualized.
JAmount does not include the portfolio activity of any underlying mutual funds or exchange-traded funds (ETFs).
Fidelity Advisor® Sustainable International Equity Fund Class Z |
| |
| Years ended October 31, | | 2024 | | 2023 | | 2022 A |
Selected Per-Share Data | | | | | | |
| Net asset value, beginning of period | $ | 7.89 | $ | 7.22 | $ | 10.00 |
| Income from Investment Operations | | | | | | |
Net investment income (loss) B,C | | .15 | | .14 | | .09 |
| Net realized and unrealized gain (loss) | | 1.89 | | .57 | | (2.87) |
| Total from investment operations | | 2.04 | | .71 | | (2.78) |
| Distributions from net investment income | | (.14) | | (.04) | | - |
| Total distributions | | (.14) | | (.04) | | - |
| Net asset value, end of period | $ | 9.79 | $ | 7.89 | $ | 7.22 |
Total Return D,E | | | | 9.86% | | (27.80)% |
Ratios to Average Net Assets C,F,G | | | | | | |
| Expenses before reductions | | 2.48% | | 3.56% | | 7.46% H,I |
| Expenses net of fee waivers, if any | | | | .89% | | .90% H |
| Expenses net of all reductions | | .89% | | .89% | | .90% H |
| Net investment income (loss) | | 1.60% | | 1.63% | | 1.56% H |
| Supplemental Data | | | | | | |
| Net assets, end of period (000 omitted) | $ | 338 | $ | 287 | $ | 181 |
Portfolio turnover rate J | | | | 36% | | 43% H |
AFor the period February 10, 2022 (commencement of operations) through October 31, 2022
BCalculated based on average shares outstanding during the period.
CNet investment income (loss) is affected by the timing of the declaration of dividends by any underlying mutual funds or exchange-traded funds (ETFs). Net investment income (loss) of any mutual funds or ETFs is not included in the Fund's net investment income (loss) ratio.
DTotal returns for periods of less than one year are not annualized.
ETotal returns would have been lower if certain expenses had not been reduced during the applicable periods shown.
FFees and expenses of any underlying mutual funds or exchange-traded funds (ETFs) are not included in the Fund's expense ratio. The Fund indirectly bears its proportionate share of these expenses. For additional expense information related to investments in Fidelity Central Funds, please refer to the "Investments in Fidelity Central Funds" note found in the Notes to Financial Statements section of the most recent Annual or Semi-Annual report.
GExpense ratios reflect operating expenses of the class. Expenses before reductions do not reflect amounts reimbursed, waived, or reduced through arrangements with the investment adviser, brokerage services, or other offset arrangements, if applicable, and do not represent the amount paid by the class during periods when reimbursements, waivers or reductions occur.
HAnnualized.
IAudit fees are not annualized.
JAmount does not include the portfolio activity of any underlying mutual funds or exchange-traded funds (ETFs).
Notes to Financial Statements
For the period ended October 31, 2024
1. Organization.
Fidelity Sustainable International Equity Fund (the Fund) is a fund of Fidelity Investment Trust (the Trust) and is authorized to issue an unlimited number of shares. The Trust is registered under the Investment Company Act of 1940, as amended (the 1940 Act), as an open-end management investment company organized as a Massachusetts business trust. The Fund offers Class A, Class M, Class C, Fidelity Sustainable International Equity Fund, Class I and Class Z shares, each of which has equal rights as to assets and voting privileges. Class A, Class M, Class C, Class I and Class Z are Fidelity Advisor classes. Each class has exclusive voting rights with respect to matters that affect that class. Class C shares will automatically convert to Class A shares after a holding period of eight years from the initial date of purchase, with certain exceptions.
2. Investments in Fidelity Central Funds.
Funds may invest in Fidelity Central Funds, which are open-end investment companies generally available only to other investment companies and accounts managed by the investment adviser and its affiliates. The Schedule of Investments lists any Fidelity Central Funds held as an investment as of period end, but does not include the underlying holdings of each Fidelity Central Fund. An investing fund indirectly bears its proportionate share of the expenses of the underlying Fidelity Central Funds.
Based on its investment objective, each Fidelity Central Fund may invest or participate in various investment vehicles or strategies that are similar to those of the investing fund. These strategies are consistent with the investment objectives of the investing fund and may involve certain economic risks which may cause a decline in value of each of the Fidelity Central Funds and thus a decline in the value of the investing fund.
| Fidelity Central Fund | Investment Manager | Investment Objective | Investment Practices | Expense RatioA |
| Fidelity Money Market Central Funds | Fidelity Management & Research Company LLC (FMR) | Each fund seeks to obtain a high level of current income consistent with the preservation of capital and liquidity. | Short-term Investments | Less than .005% |
A Expenses expressed as a percentage of average net assets and are as of each underlying Central Fund's most recent annual or semi-annual shareholder report.
A complete unaudited list of holdings for each Fidelity Central Fund is available upon request or at the Securities and Exchange Commission website at www.sec.gov. In addition, the financial statements of the Fidelity Central Funds which contain the significant accounting policies (including investment valuation policies) of those funds, and are not covered by the Report of Independent Registered Public Accounting Firm, are available on the Securities and Exchange Commission website or upon request.
3. Significant Accounting Policies.
The Fund is an investment company and applies the accounting and reporting guidance of the Financial Accounting Standards Board (FASB) Accounting Standards Codification Topic 946 Financial Services - Investment Companies. The financial statements have been prepared in conformity with accounting principles generally accepted in the United States of America (GAAP), which require management to make certain estimates and assumptions at the date of the financial statements. Actual results could differ from those estimates. Subsequent events, if any, through the date that the financial statements were issued have been evaluated in the preparation of the financial statements. The Fund's Schedule of Investments lists any underlying mutual funds or exchange-traded funds (ETFs) but does not include the underlying holdings of these funds. The following summarizes the significant accounting policies of the Fund:
Investment Valuation. Investments are valued as of 4:00 p.m. Eastern time on the last calendar day of the period. The Board of Trustees (the Board) has designated the Fund's investment adviser as the valuation designee responsible for the fair valuation function and performing fair value determinations as needed. The investment adviser has established a Fair Value Committee (the Committee) to carry out the day-to-day fair valuation responsibilities and has adopted policies and procedures to govern the fair valuation process and the activities of the Committee. In accordance with these fair valuation policies and procedures, which have been approved by the Board, the Fund attempts to obtain prices from one or more third party pricing services or brokers to value its investments. When current market prices, quotations or currency exchange rates are not readily available or reliable, investments will be fair valued in good faith by the Committee, in accordance with the policies and procedures. Factors used in determining fair value vary by investment type and may include market or investment specific events, transaction data, estimated cash flows, and market observations of comparable investments. The frequency that the fair valuation procedures are used cannot be predicted and they may be utilized to a significant extent. The Committee manages the Fund's fair valuation practices and maintains the fair valuation policies and procedures. The Fund's investment adviser reports to the Board information regarding the fair valuation process and related material matters.
The Fund categorizes the inputs to valuation techniques used to value its investments into a disclosure hierarchy consisting of three levels as shown below:
Level 1 - unadjusted quoted prices in active markets for identical investments
Level 2 - other significant observable inputs (including quoted prices for similar investments, interest rates, prepayment speeds, etc.)
Level 3 - unobservable inputs (including the Fund's own assumptions based on the best information available)
Valuation techniques used to value the Fund's investments by major category are as follows:
Equity securities, including restricted securities, for which market quotations are readily available, are valued at the last reported sale price or official closing price as reported by a third party pricing service on the primary market or exchange on which they are traded and are categorized as Level 1 in the hierarchy. In the event there were no sales during the day or closing prices are not available, securities are valued at the last quoted bid price or may be valued using the last available price and are generally categorized as Level 2 in the hierarchy. For foreign equity securities, when market or security specific events arise, comparisons to the valuation of American Depositary Receipts (ADRs), futures contracts, Exchange-Traded Funds (ETFs) and certain indexes as well as quoted prices for similar securities may be used and would be categorized as Level 2 in the hierarchy. For equity securities, including restricted securities, where observable inputs are limited, assumptions about market activity and risk are used and these securities may be categorized as Level 3 in the hierarchy.
Investments in open-end mutual funds ,including the Fidelity Central Funds, are valued at their closing net asset value (NAV) each business day and are categorized as Level 1 in the hierarchy.
Changes in valuation techniques may result in transfers in or out of an assigned level within the disclosure hierarchy. The aggregate value of investments by input level as of October 31, 2024 is included at the end of the Fund's Schedule of Investments.
Foreign Currency. Certain Funds may use foreign currency contracts to facilitate transactions in foreign-denominated securities. Gains and losses from these transactions may arise from changes in the value of the foreign currency or if the counterparties do not perform under the contracts' terms.
Foreign-denominated assets, including investment securities, and liabilities are translated into U.S. dollars at the exchange rates at period end. Purchases and sales of investment securities, income and dividends received, and expenses denominated in foreign currencies are translated into U.S. dollars at the exchange rate in effect on the transaction date.
The effects of exchange rate fluctuations on investments are included with the net realized and unrealized gain (loss) on investment securities. Other foreign currency transactions resulting in realized and unrealized gain (loss) are disclosed separately.
Investment Transactions and Income. For financial reporting purposes, the Fund's investment holdings and NAV include trades executed through the end of the last business day of the period. The NAV per share for processing shareholder transactions is calculated as of the close of business of the New York Stock Exchange (NYSE), normally 4:00 p.m. Eastern time and includes trades executed through the end of the prior business day. Gains and losses on securities sold are determined on the basis of identified cost. Commissions paid to certain brokers with whom the investment adviser, or its affiliates, places trades on behalf of a fund include an amount in addition to trade execution, which may be rebated back to a fund. Any such rebates are included in net realized gain (loss) on investments in the Statement of Operations. Dividend income is recorded on the ex-dividend date, except for certain dividends from foreign securities where the ex-dividend date may have passed, which are recorded as soon as the Fund is informed of the ex-dividend date. Non-cash dividends included in dividend income, if any, are recorded at the fair market value of the securities received. Income and capital gain distributions from Fidelity Central Funds, if any, are recorded on the ex-dividend date. Investment income is recorded net of foreign taxes withheld where recovery of such taxes is uncertain. Funds may file withholding tax reclaims in certain jurisdictions to recover a portion of amounts previously withheld. Any withholding tax reclaims income is included in the Statement of Operations in foreign taxes withheld. Any receivables for withholding tax reclaims are included in the Statement of Assets and Liabilities in reclaims receivable.
Class Allocations and Expenses. Investment income, realized and unrealized capital gains and losses, common expenses of a fund, and certain fund-level expense reductions, if any, are allocated daily on a pro-rata basis to each class based on the relative net assets of each class to the total net assets of a fund. Each class differs with respect to transfer agent and distribution and service plan fees incurred, as applicable. Certain expense reductions may also differ by class, if applicable. For the reporting period, the allocated portion of income and expenses to each class as a percent of its average net assets may vary due to the timing of recording these transactions in relation to fluctuating net assets of the classes. Expenses directly attributable to a fund are charged to that fund. Expenses attributable to more than one fund are allocated among the respective funds on the basis of relative net assets or other appropriate methods. Expenses included in the accompanying financial statements reflect the expenses of that fund and do not include any expenses associated with any underlying mutual funds or exchange-traded funds (ETFs). Although not included in a fund's expenses, a fund indirectly bears its proportionate share of these expenses through the net asset value of each underlying mutual fund or exchange-traded fund (ETF). Expense estimates are accrued in the period to which they relate and adjustments are made when actual amounts are known.
Income Tax Information and Distributions to Shareholders. Each year, the Fund intends to qualify as a regulated investment company under Subchapter M of the Internal Revenue Code, including distributing substantially all of its taxable income and realized gains. As a result, no provision for U.S. Federal income taxes is required. As of October 31, 2024, the Fund did not have any unrecognized tax benefits in the financial statements; nor is the Fund aware of any tax positions for which it is reasonably possible that the total amounts of unrecognized tax benefits will significantly change in the next twelve months. The Fund files a U.S. federal tax return, in addition to state and local tax returns as required. The Fund's federal income tax returns are subject to examination by the Internal Revenue Service (IRS) for a period of three fiscal years after they are filed. State and local tax returns may be subject to examination for an additional fiscal year depending on the jurisdiction. Foreign taxes are provided for based on the Fund's understanding of the tax rules and rates that exist in the foreign markets in which it invests.
Distributions are declared and recorded on the ex-dividend date. Income and capital gain distributions are declared separately for each class. Income and capital gain distributions are determined in accordance with income tax regulations, which may differ from GAAP. In addition, the Fund claimed a portion of the payment made to redeeming shareholders as a distribution for income tax purposes.
Capital accounts within the financial statements are adjusted for permanent book-tax differences. These adjustments have no impact on net assets or the results of operations. Capital accounts are not adjusted for temporary book-tax differences which will reverse in a subsequent period.
Book-tax differences are primarily due to foreign currency transactions, passive foreign investment companies (PFIC), capital loss carryforwards and losses deferred due to wash sales.
As of period end, the cost and unrealized appreciation (depreciation) in securities, and derivatives if applicable, for federal income tax purposes were as follows:
| Gross unrealized appreciation | $1,857,768 |
| Gross unrealized depreciation | (211,922) |
| Net unrealized appreciation (depreciation) | $1,645,846 |
| Tax Cost | $9,080,086 |
The tax-based components of distributable earnings as of period end were as follows:
| Undistributed ordinary income | $197,906 |
| Capital loss carryforward | $(677,675) |
| Net unrealized appreciation (depreciation) on securities and other investments | $1,644,769 |
Capital loss carryforwards are only available to offset future capital gains of the Fund to the extent provided by regulations and may be limited. The capital loss carryforward information presented below, including any applicable limitation, is estimated as of fiscal period end and is subject to adjustment.
Short-term | $(413,102) |
Long-term | (264,573) |
| Total capital loss carryforward | $(677,675) |
Due to large subscriptions in a prior period, approximately $234,418 of the Fund's realized capital losses are subject to limitation. Due to this limitation, the Fund will only be permitted to use approximately $74,614 of those capital losses per year to offset capital gains. Additionally, the Fund is subject to an annual limit on its use of some of its unrealized capital losses to offset capital gains in future periods. If those losses are realized and the limitation prevents the Fund from using any of those losses in a future period, those capital losses will be available to offset capital gains in subsequent periods.
The tax character of distributions paid was as follows:
| | October 31, 2024 | October 31, 2023 |
| Ordinary Income | $119,018 | $ 29,290 |
| Total | $119,018 | $ 29,290 |
Restricted Securities (including Private Placements). Funds may invest in securities that are subject to legal or contractual restrictions on resale. These securities generally may be resold in transactions exempt from registration or to the public if the securities are registered. Disposal of these securities may involve time-consuming negotiations and expense, and prompt sale at an acceptable price may be difficult. Information regarding restricted securities held at period end is included at the end of the Schedule of Investments, if applicable.
New Accounting Pronouncement. In November 2023, the FASB issued Accounting Standards Update (ASU) 2023-07 Segment Reporting (Topic 280): Improvements to Reportable Segment Disclosures. Effective for fiscal years beginning after December 15, 2023 and interim periods within fiscal years beginning after December 15, 2024, the amendments enhance required disclosures of segment information for public entities on an annual and interim basis. The ASU allows for early adoption with updates applied retrospectively. Management is currently evaluating the impact of the ASU but does not expect this guidance to materially impact the financial statements.
4. Purchases and Sales of Investments.
Purchases and sales of securities, other than short-term securities and in-kind transactions, as applicable, are noted in the table below.
| | Purchases ($) | Sales ($) |
| Fidelity Sustainable International Equity Fund | 6,704,604 | 4,545,663 |
5. Fees and Other Transactions with Affiliates.
Management Fee. Fidelity Management & Research Company LLC (the investment adviser) and its affiliates provide the Fund with investment management related services for which the Fund pays a monthly management fee.
Effective March 1, 2024, the Fund's management contract was amended to incorporate administrative services previously covered under separate services agreements (Transfer Agent and Accounting agreements). The amended contract incorporates a basic fee rate that may vary by class (subject to a performance adjustment). The investment adviser or an affiliate pays certain expenses of managing and operating the Fund out of each class's management fee. Each class of the Fund pays a management fee to the investment adviser. The management fee is calculated and paid to the investment adviser every month. The management fee is determined by calculating a basic fee and then applying a performance adjustment. When determining a class's basic fee, a mandate rate is calculated based on the monthly average net assets of a group of funds advised by FMR within a designated asset class. A discount rate is subtracted from the mandate rate once the Fund's monthly average net assets reach a certain level. The mandate rate and discount rate may vary by class. The annual basic fee rate for a class of shares of the Fund is the lesser of (1) the class's mandate rate reduced by the class's discount rate (if applicable) or (2) the amount set forth in the following table.
| | Maximum Management Fee Rate % |
| Class A | .82 |
| Class M | .79 |
| Class C | .78 |
| Fidelity Sustainable International Equity Fund | .88 |
| Class I | .79 |
| Class Z | .73 |
One-twelfth of the basic fee rate for a class is applied to the average net assets of the class for the month, giving a dollar amount which is the basic fee for the class for that month. A different management fee rate may be applicable to each class of the Fund. The difference between classes is the result of separate arrangements for class-level services and/or waivers of certain expenses. It is not the result of any difference in advisory or custodial fees or other expenses related to the management of the Fund's assets, which do not vary by class. For the portion of the reporting period on or after March 1, 2024, the total annualized management fee rates were as follows:
| | Total Management Fee Rate % |
| Class A | .82 |
| Class M | .79 |
| Class C | .78 |
| Fidelity Sustainable International Equity Fund | .83 |
| Class I | .79 |
| Class Z | .73 |
Prior to March 1, 2024, the management fee was the sum of an individual fund fee rate that was based on an annual rate of .45% of the Fund's average net assets and an annualized group fee rate that averaged .22% during the period. The group fee rate was based upon the monthly average net assets of a group of registered investment companies with which the investment adviser has management contracts. The group fee rate decreased as assets under management increased and increased as assets under management decreased. For the portion of the reporting period prior to March 1, 2024, the total annualized management fee rate was .67%.
The performance adjustment rate is calculated monthly by comparing over the performance period the Fund's performance to that of the performance adjustment index listed below.
| | Performance Adjustment Index |
| Fidelity Sustainable International Equity Fund | MSCI EAFE Index |
For the purposes of calculating the performance adjustment for the Fund, the Fund's investment performance is based on the performance of Fidelity Sustainable International Equity Fund. To the extent that other classes of the Fund have higher expenses, this could result in those classes bearing a larger positive performance adjustment and smaller negative performance adjustment than would be the case if each class's own performance were considered. The performance period is the most recent 36 month period. The maximum annualized performance adjustment rate is ±.10% of the Fund's average net assets over the performance period. The performance adjustment rate is divided by twelve and multiplied by the Fund's average net assets over the performance period, and the resulting dollar amount is proportionately added to or subtracted from a class's basic fee. For the entire reporting period, the total annual performance adjustment was (.06)%.
Effective March 1, 2024, the Fund's sub-advisory agreements with FMR Investment Management (UK) Limited, Fidelity Management & Research (Hong Kong) Limited, and Fidelity Management & Research (Japan) Limited were amended to provide that the investment adviser pays each sub-adviser monthly fees equal to 110% of the sub-adviser's costs for providing sub-advisory services.
Distribution and Service Plan Fees. In accordance with Rule 12b-1 of the 1940 Act, the Fund has adopted separate Distribution and Service Plans for each class of shares. Certain classes pay Fidelity Distributors Company LLC (FDC), an affiliate of the investment adviser, separate Distribution and Service Fees, each of which is based on an annual percentage of each class' average net assets. In addition, FDC may pay financial intermediaries for selling shares of the Fund and providing shareholder support services. For the period, the Distribution and Service Fee rates, total fees and amounts retained by FDC were as follows:
| | Distribution Fee | Service Fee | Total Fees ($) | Retained by FDC ($) |
| Class A | - % | .25% | 835 | 598 |
| Class M | .25% | .25% | 1,246 | 1,182 |
| Class C | .75% | .25% | 2,557 | 2,418 |
| | | | 4,638 | 4,198 |
Sales Load. FDC may receive a front-end sales charge of up to 5.75% for selling Class A shares and 3.50% for selling Class M shares, some of which is paid to financial intermediaries for selling shares of the Fund. Depending on the holding period, FDC may receive contingent deferred sales charges levied on Class A, Class M and Class C redemptions. The deferred sales charges are 1.00% for Class C shares, 1.00% for certain purchases of Class A shares and .25% for certain purchases of Class M shares.
For the period, sales charge amounts retained by FDC were as follows:
| | Retained by FDC ($) |
| Class A | 85 |
| Class M | 64 |
| | 149 |
Transfer Agent Fees. Fidelity Investments Institutional Operations Company LLC (FIIOC), an affiliate of the investment adviser, is the transfer, dividend disbursing and shareholder servicing agent for each class of the Fund. Effective March 1, 2024, the Fund's management contract was amended to incorporate transfer agent services and associated fees previously covered under a separate services agreement. FIIOC pays for typesetting, printing and mailing of shareholder reports, except proxy statements.
During the period December 1, 2023 through February 29, 2024, the transfer agent fees for each class were a fixed annual rate of class-level average net assets as follows:
| | % of Class-Level Average Net Assets |
| Class A | .1367 |
| Class M | .1048 |
| Class C | .0960 |
| Fidelity Sustainable International Equity Fund | .2000 |
| Class I | .1047 |
| Class Z | .0420 |
Prior to December 1, 2023, FIIOC received account fees and asset-based fees that varied according to the account size and type of account of the shareholders of the respective classes of the Fund, except for Class Z. FIIOC received an asset-based fee of Class Z's average net assets. For the portion of the reporting period prior to March 1, 2024, the fees were equivalent to the following annualized rates:
| | Amount ($) | % of Class-Level Average Net Assets |
| Class A | 199 | .16 |
| Class M | 78 | .11 |
| Class C | 69 | .09 |
| Fidelity Sustainable International Equity Fund | 4,582 | .21 |
| Class I | 78 | .11 |
| Class Z | 39 | .04 |
| 5,045 | |
Accounting Fees. Fidelity Service Company, Inc. (FSC), an affiliate of the investment adviser, maintains the Fund's accounting records. Effective March 1, 2024, the Fund's management contract was amended to incorporate accounting services and associated fees previously covered under a separate services agreement.
During the period December 1, 2023 through February 29, 2024, the accounting fees were a fixed annual rate of average net assets as follows:
| | % of Average Net Assets |
| Fidelity Sustainable International Equity Fund | .0498 |
Prior to December 1, 2023, the accounting fee was based on the level of average net assets for each month. For the portion of the reporting period prior to March 1, 2024, the fees were equivalent to the following annualized rates:
| | % of Average Net Assets |
| Fidelity Sustainable International Equity Fund | .05 |
Interfund Trades. Funds may purchase from or sell securities to other Fidelity Funds under procedures adopted by the Board. The procedures have been designed to ensure these interfund trades are executed in accordance with Rule 17a-7 of the 1940 Act. Any interfund trades are included within the respective purchases and sales amounts shown in the Purchases and Sales of Investments note. Interfund trades during the period are noted in the table below.
| | Purchases ($) | Sales ($) | Realized Gain (Loss)($) |
| Fidelity Sustainable International Equity Fund | 507,705 | 430,599 | (5,942) |
6. Committed Line of Credit.
Certain Funds participate with other funds managed by the investment adviser or an affiliate in a $4.25 billion credit facility (the "line of credit") to be utilized for temporary or emergency purposes to fund shareholder redemptions or for other short-term liquidity purposes. The participating funds have agreed to pay commitment fees on their pro-rata portion of the line of credit, which are reflected in Miscellaneous expenses on the Statement of Operations, and are listed below. During the period, there were no borrowings on this line of credit.
| | Amount ($) |
| Fidelity Sustainable International Equity Fund | 15 |
7. Expense Reductions.
The investment adviser contractually agreed to reimburse expenses of each class to the extent annual operating expenses exceeded certain levels of class-level average net assets as noted in the table below. This reimbursement will remain in place through February 28, 2026. Some expenses, for example the compensation of the independent Trustees, and certain miscellaneous expenses such as proxy and shareholder meeting expenses, are excluded from this reimbursement.
The following classes were in reimbursement during the period:
| | Expense Limitations | Reimbursement ($) |
| Class A | 1.30% | 5,951 |
| Class M | 1.55% | 3,754 |
| Class C | 2.05% | 3,787 |
| Fidelity Sustainable International Equity Fund | 1.05% | 121,250 |
| Class I | 1.05% | 3,721 |
| Class Z | .90% | 4,937 |
| | | 143,400 |
Through arrangements with the Fund's custodian, credits realized as a result of certain uninvested cash balances were used to reduce the Fund's expenses. During the period, custodian credits reduced the Fund's expenses by $644.
In addition, during the period the investment adviser or an affiliate reimbursed and/or waived a portion of fund-level operating expenses in the amount of $359.
8. Distributions to Shareholders.
Distributions to shareholders of each class were as follows:
| | Year ended October 31, 2024 | Year ended October 31, 2023 |
| Fidelity Sustainable International Equity Fund | | |
| Distributions to shareholders | | |
| Class A | $5,401 | $863 |
| Class M | 2,380 | 325 |
| Class C | 1,175 | - |
| Fidelity Sustainable International Equity Fund | 101,474 | 25,952 |
| Class I | 3,624 | 1,075 |
| Class Z | 4,964 | 1,075 |
Total | $119,018 | $29,290 |
9. Share Transactions.
Share transactions for each class were as follows and may contain in-kind transactions, automatic conversions between classes or exchanges between affiliated funds:
| | Shares | Shares | Dollars | Dollars |
| | Year ended October 31, 2024 | Year ended October 31, 2023 | Year ended October 31, 2024 | Year ended October 31, 2023 |
| Fidelity Sustainable International Equity Fund | | | | |
| Class A | | | | |
| Shares sold | 1,441 | 19,860 | $13,785 | $158,247 |
| Reinvestment of distributions | 639 | 107 | 5,401 | 863 |
| Shares redeemed | (15,789) | (633) | (146,263) | (5,146) |
| Net increase (decrease) | (13,709) | 19,334 | $(127,077) | $153,964 |
| Class M | | | | |
| Shares sold | 2,507 | 9 | $22,745 | $77 |
| Reinvestment of distributions | 282 | 40 | 2,380 | 325 |
| Net increase (decrease) | 2,789 | 49 | $25,125 | $402 |
| Class C | | | | |
| Shares sold | 3,893 | - | $35,587 | $ - |
| Reinvestment of distributions | 139 | - | 1,175 | - |
| Shares redeemed | (2,118) | - | (21,010) | - |
| Net increase (decrease) | 1,914 | - | $15,752 | $ - |
| Fidelity Sustainable International Equity Fund | | | | |
| Shares sold | 418,526 | 397,160 | $3,910,879 | $3,312,938 |
| Reinvestment of distributions | 10,727 | 2,932 | 90,641 | 23,779 |
| Shares redeemed | (179,394) | (235,082) | (1,694,395) | (1,968,118) |
| Net increase (decrease) | 249,859 | 165,010 | $2,307,125 | $1,368,599 |
| Class I | | | | |
| Shares sold | - | 211 | $ - | $1,800 |
| Reinvestment of distributions | 429 | 133 | 3,624 | 1,075 |
| Shares redeemed | (210) | (4) | (1,824) | (30) |
| Net increase (decrease) | 219 | 340 | $1,800 | $2,845 |
| Class Z | | | | |
| Shares sold | 3,678 | 12,333 | $34,253 | $104,463 |
| Reinvestment of distributions | 424 | 132 | 3,594 | 1,075 |
| Shares redeemed | (5,981) | (1,030) | (51,099) | (8,025) |
| Net increase (decrease) | (1,879) | 11,435 | $(13,252) | $97,513 |
10. Other.
A fund's organizational documents provide former and current trustees and officers with a limited indemnification against liabilities arising in connection with the performance of their duties to the fund. In the normal course of business, a fund may also enter into contracts that provide general indemnifications. A fund's maximum exposure under these arrangements is unknown as this would be dependent on future claims that may be made against a fund. The risk of material loss from such claims is considered remote.
At the end of the period, the investment adviser or its affiliates were owners of record of more than 10% of the outstanding shares as follows:
| Fund | Affiliated % |
Fidelity Sustainable International Equity Fund | 15% |
In addition, at the end of the period, the following mutual funds managed by the investment adviser or its affiliates were the owners of record of 10% or more of the total outstanding shares.| | Fidelity Sustainable Multi-Asset Fund |
| Fidelity Sustainable International Equity Fund | 35% |
11. Risk and Uncertainties.
Many factors affect a fund's performance. Developments that disrupt global economies and financial markets, such as pandemics, epidemics, outbreaks of infectious diseases, war, terrorism, and environmental disasters, may significantly affect a fund's investment performance. The effects of these developments to a fund will be impacted by the types of securities in which a fund invests, the financial condition, industry, economic sector, and geographic location of an issuer, and a fund's level of investment in the securities of that issuer. Significant concentrations in security types, issuers, industries, sectors, and geographic locations may magnify the factors that affect a fund's performance.
Report of Independent Registered Public Accounting Firm
To the Board of Trustees of Fidelity Investment Trust and the Shareholders of Fidelity Sustainable International Equity Fund:
Opinion on the Financial Statements and Financial Highlights
We have audited the accompanying statement of assets and liabilities of Fidelity Sustainable International Equity Fund (the "Fund"), a fund of Fidelity Investment Trust, including the schedule of investments, as of October 31, 2024, the related statement of operations for the year then ended, the statement of changes in net assets for each of the two years in the period then ended, the financial highlights for each of the two years in the period then ended and for the period from February 10, 2022 (commencement of operations) through October 31, 2022, and the related notes. In our opinion, the financial statements and financial highlights present fairly, in all material respects, the financial position of the Fund as of October 31, 2024, and the results of its operations for the year then ended, the changes in its net assets for each of the two years in the period then ended, and the financial highlights for each of the two years in the period then ended and for the period from February 10, 2022 (commencement of operations) through October 31, 2022, in conformity with accounting principles generally accepted in the United States of America.
Basis for Opinion
These financial statements and financial highlights are the responsibility of the Fund's management. Our responsibility is to express an opinion on the Fund's financial statements and financial highlights based on our audits. We are a public accounting firm registered with the Public Company Accounting Oversight Board (United States) (PCAOB) and are required to be independent with respect to the Fund in accordance with the U.S. federal securities laws and the applicable rules and regulations of the Securities and Exchange Commission and the PCAOB.
We conducted our audits in accordance with the standards of the PCAOB. Those standards require that we plan and perform the audit to obtain reasonable assurance about whether the financial statements and financial highlights are free of material misstatement, whether due to error or fraud. The Fund is not required to have, nor were we engaged to perform, an audit of its internal control over financial reporting. As part of our audits, we are required to obtain an understanding of internal control over financial reporting but not for the purpose of expressing an opinion on the effectiveness of the Fund's internal control over financial reporting. Accordingly, we express no such opinion.
Our audits included performing procedures to assess the risks of material misstatement of the financial statements and financial highlights, whether due to error or fraud, and performing procedures that respond to those risks. Such procedures included examining, on a test basis, evidence regarding the amounts and disclosures in the financial statements and financial highlights. Our audits also included evaluating the accounting principles used and significant estimates made by management, as well as evaluating the overall presentation of the financial statements and financial highlights. Our procedures included confirmation of securities owned as of October 31, 2024, by correspondence with the custodian and brokers; when replies were not received from brokers, we performed other auditing procedures. We believe that our audits provide a reasonable basis for our opinion.
/s/ Deloitte & Touche LLP
Boston, Massachusetts
December 16, 2024
We have served as the auditor of one or more of the Fidelity investment companies since 1999.
Distributions
(Unaudited)The dividend and capital gains distributions for the fund(s) are available on Fidelity.com or Institutional.Fidelity.com.
The fund designates $2,728 of distributions paid during the fiscal year ended 2024 as qualifying to be taxed as section 163(j) interest dividends.
Class A, Class M, Class C, Fidelity Sustainable International Equity Fund, Class I and Class Z designate 100% of the dividends distributed during the fiscal year as amounts which may be taken into account as a dividend for purposes of the maximum rate under section 1(h)(11) of the Internal Revenue Code.
The amounts per share which represent income derived from sources within, and taxes paid to, foreign countries or possessions of the United States are as follows:
| | Pay Date | Income | Taxes |
| | | | |
| Class A | 12/11/23 | $0.1352 | $0.0226 |
| Class M | 12/11/23 | $0.1115 | $0.0226 |
| Class C | 12/11/23 | $0.0660 | $0.0226 |
Fidelity Sustainable International Equity Fund Class I Class Z | 12/11/23 12/11/23 12/11/23 | $0.1570 $0.1570 $0.1570 | $0.0226 $0.0226 $0.0226 |
The fund will notify shareholders in January 2025 of amounts for use in preparing 2024 income tax returns.
Item 8: Changes in and Disagreements with Accountants for Open-End Management Investment Companies
(Unaudited)
Note: This is not applicable for any fund included in this document.
Item 9: Proxy Disclosures for Open-End Management Investment Companies
(Unaudited)
| A special meeting of shareholders was held on July 16, 2024. The results of votes taken among shareholders on the proposal before them are reported below. Each vote reported represents one dollar of net asset value held on the record date for the meeting. |
| Proposal 1 |
| To elect a Board of Trustees. |
| | # of Votes | % of Votes |
| Bettina Doulton |
| Affirmative | 128,529,177,643.56 | 98.18 |
| Withheld | 2,378,037,364.30 | 1.82 |
| TOTAL | 130,907,215,007.85 | 100.00 |
| Robert A. Lawrence |
| Affirmative | 128,253,389,899.05 | 97.97 |
| Withheld | 2,653,825,108.81 | 2.03 |
| TOTAL | 130,907,215,007.85 | 100.00 |
| Vijay C. Advani |
| Affirmative | 128,531,418,228.19 | 98.19 |
| Withheld | 2,375,796,779.66 | 1.81 |
| TOTAL | 130,907,215,007.85 | 100.00 |
| Thomas P. Bostick |
| Affirmative | 128,495,261,591.41 | 98.16 |
| Withheld | 2,411,953,416.44 | 1.84 |
| TOTAL | 130,907,215,007.85 | 100.00 |
| Donald F. Donahue |
| Affirmative | 128,407,878,996.00 | 98.09 |
| Withheld | 2,499,336,011.85 | 1.91 |
| TOTAL | 130,907,215,007.85 | 100.00 |
| Vicki L. Fuller |
| Affirmative | 128,625,540,095.19 | 98.26 |
| Withheld | 2,281,674,912.66 | 1.74 |
| TOTAL | 130,907,215,007.85 | 100.00 |
| Patricia L. Kampling |
| Affirmative | 128,668,729,281.34 | 98.29 |
| Withheld | 2,238,485,726.51 | 1.71 |
| TOTAL | 130,907,215,007.85 | 100.00 |
| Thomas A. Kennedy |
| Affirmative | 128,499,824,239.79 | 98.16 |
| Withheld | 2,407,390,768.06 | 1.84 |
| TOTAL | 130,907,215,007.85 | 100.00 |
| Oscar Munoz |
| Affirmative | 128,386,109,391.05 | 98.07 |
| Withheld | 2,521,105,616.80 | 1.93 |
| TOTAL | 130,907,215,007.85 | 100.00 |
| Karen B. Peetz |
| Affirmative | 128,603,731,113.82 | 98.24 |
| Withheld | 2,303,483,894.03 | 1.76 |
| TOTAL | 130,907,215,007.85 | 100.00 |
| David M. Thomas |
| Affirmative | 128,384,899,342.98 | 98.07 |
| Withheld | 2,522,315,664.88 | 1.93 |
| TOTAL | 130,907,215,007.85 | 100.00 |
| Susan Tomasky |
| Affirmative | 128,556,148,461.60 | 98.20 |
| Withheld | 2,351,066,546.25 | 1.80 |
| TOTAL | 130,907,215,007.85 | 100.00 |
| Michael E. Wiley |
| Affirmative | 128,264,934,978.34 | 97.98 |
| Withheld | 2,642,280,029.51 | 2.02 |
| TOTAL | 130,907,215,007.85 | 100.00 |
| | | |
| Proposal 1 reflects trust-wide proposal and voting results. |
Item 10: Remuneration Paid to Directors, Officers, and others of Open-End Management Investment Companies
(Unaudited)
Note: This information is disclosed as part of the financial statements for each Fund as part of Item 7: Financial Statements and Financial Highlights for Open-End Management Investment companies.
Item 11: Statement Regarding Basis for Approval of Investment Advisory Contract
(Unaudited)
Board Approval of Investment Advisory Contracts and Management Fees
Fidelity Sustainable International Equity Fund
Each year, the Board of Trustees, including the Independent Trustees (together, the Board), considers the renewal of the fund's management contract with Fidelity Management & Research Company LLC (FMR) and certain affiliates and the sub-advisory agreements (together, the Advisory Contracts) for the fund. FMR and the sub-advisers are referred to herein as the Investment Advisers. The Board, assisted by the advice of fund counsel and Independent Trustees' counsel, requests and considers a broad range of information relevant to the renewal of the Advisory Contracts throughout the year.
The Board meets regularly and, at each of its meetings, covers an extensive agenda of topics and materials and considers factors that are relevant to its annual consideration of the renewal of the fund's Advisory Contracts, including the services and support provided to the fund and its shareholders. The Board, acting directly and through its Committees (each of which is composed of and chaired by Independent Trustees), requests and receives information concerning the annual consideration of the renewal of the fund's Advisory Contracts. The Board also meets as needed to review matters specifically related to the Board's annual consideration of the renewal of the Advisory Contracts. Members of the Board may also meet with trustees of other Fidelity funds through joint ad hoc committees to discuss certain matters relevant to all of the Fidelity funds.
At its May 2024 meeting, the Board unanimously determined to renew the fund's Advisory Contracts. In reaching its determination, the Board considered all factors it believed relevant, including (i) the nature, extent, and quality of the services provided to the fund and its shareholders (including the investment performance of the fund); (ii) the competitiveness relative to peer funds of the fund's management fee and the total expense ratio of a representative class (the retail class, which was selected because it was the largest class without 12b-1 fees); (iii) the total costs of the services provided by and the profits realized by FMR and its affiliates (Fidelity) from its relationships with the fund; and (iv) the extent to which, if any, economies of scale exist and are realized as the fund grows, and whether any economies of scale are appropriately shared with fund shareholders. The Board also considered the broad range of investment choices available to shareholders from FMR's competitors and that the fund's shareholders have chosen to invest in the fund, which is part of the Fidelity family of funds. The Board's decision to renew the Advisory Contracts was not based on any single factor.
The Board reached a determination, with the assistance of fund counsel and Independent Trustees' counsel and through the exercise of its business judgment, that the renewal of the Advisory Contracts was in the best interests of the fund and its shareholders and that the compensation payable under the Advisory Contracts was fair and reasonable in light of all of the surrounding circumstances.
Nature, Extent, and Quality of Services Provided. The Board considered staffing as it relates to the fund, including the backgrounds and experience of investment personnel of the Investment Advisers, and also considered the Investment Advisers' implementation of the fund's investment program. The Independent Trustees also had discussions with senior management of Fidelity's investment operations and investment groups. The Board considered the structure of the investment personnel compensation program and whether this structure provides appropriate incentives to act in the best interests of the fund. Additionally, the Board considered the portfolio managers' investments, if any, in the funds that they manage.
Resources Dedicated to Investment Management and Support Services. The Board and the Fund Oversight and Research Committees reviewed the general qualifications and capabilities of Fidelity's investment staff, including its size, education, experience, and resources, as well as Fidelity's approach to recruiting, training, managing, and compensating investment personnel. The Board noted the resources devoted to expansion of Fidelity's global investment organization, and that Fidelity's analysts have extensive resources, tools, and capabilities that allow them to conduct sophisticated quantitative and fundamental analysis, as well as credit analysis of issuers, counterparties, and guarantors. Further, the Board considered that Fidelity's investment professionals have sufficient access to global information and data so as to provide competitive investment results over time, and that those professionals also have access to sophisticated tools that permit them to assess portfolio construction and risk and performance attribution characteristics continuously, as well as to transmit new information and research conclusions rapidly around the world. Additionally, in its deliberations, the Board considered Fidelity's trading, risk management, compliance, and technology and operations capabilities and resources, which are integral parts of the investment management process.
Shareholder and Administrative Services. The Board considered (i) the nature, extent, quality, and cost of advisory, administrative, shareholder, transfer agency, and pricing and bookkeeping services performed by the Investment Advisers and their affiliates under the Advisory Contracts; (ii) the nature and extent of Fidelity's supervision of third party service providers, principally custodians, subcustodians, and pricing vendors; and (iii) the resources devoted by Fidelity to, and the record of compliance with, the fund's compliance policies and procedures. The Board also reviewed the allocation of fund brokerage, including allocations to brokers affiliated with the Investment Advisers, the use of brokerage commissions to pay fund expenses, and the use of "soft" commission dollars to pay for research services. The Board also considered the fund's securities lending activities and any payments made to Fidelity relating to securities lending under a separate agreement.
The Board noted that the growth of fund assets over time across the complex allows Fidelity to reinvest in the development of services designed to enhance the value and convenience of the Fidelity funds as investment vehicles. These services include 24-hour access to account information and market information over the Internet and through telephone representatives, investor education materials, and asset allocation tools. The Board also considered that it reviews customer service metrics such as telephone response times, continuity of services on the website and metrics addressing services at Fidelity Investor Centers.
Investment in a Large Fund Family. The Board considered the benefits to shareholders of investing in a fund that is part of a large family of funds offering a variety of investment disciplines and providing a large variety of fund investor services. The Board noted that Fidelity had taken, or had made recommendations that resulted in the Fidelity funds taking, a number of actions over the previous year that benefited particular funds and/or the Fidelity funds in general.
Investment Performance. The Board took into account discussions that occur with representatives of the Investment Advisers, and reports that it receives, at Board meetings throughout the year, relating to fund investment performance. In this regard the Board noted that as part of regularly scheduled fund reviews and other reports to the Board on fund performance, the Board considered annualized return information for the fund for different time periods, measured against an appropriate securities market index (benchmark index). The Board also considered information about performance attribution. In its ongoing evaluation of fund investment performance, the Board gives particular attention to information indicating changes in performance of the funds over different time periods and discussed with the Investment Advisers the reasons for any overperformance or underperformance.
In addition to reviewing absolute and relative fund performance, the Independent Trustees periodically consider the appropriateness of fund performance metrics in evaluating the results achieved. The Independent Trustees generally give greater weight to fund performance over longer time periods than over shorter time periods. Depending on the circumstances, the Independent Trustees may be satisfied with a fund's performance notwithstanding that it lags its benchmark index for certain periods.
Based on its review, the Board concluded that the nature, extent, and quality of services provided to the fund under the Advisory Contracts should continue to benefit the shareholders of the fund.
Competitiveness of Management Fee and Total Expense Ratio. The Board was provided with information regarding industry trends in management fees and expenses. The Board considered that, effective March 1, 2024, an amended Advisory Contract with FMR went into effect with class-level management fees based on tiered schedules and subject to a maximum class-level rate (the management fee). The Board also considered that in exchange for the variable management fee, each class of the fund receives investment advisory, management, administrative, transfer agent, and pricing and bookkeeping services. In its review of the management fee and total expense ratio of the retail class, the Board considered a pro forma management fee rate for the retail class as if it had been in effect for the 12-month period ended September 30, 2023, as well as other third-party fund expenses, as applicable, such as custodial, legal, and audit fees and any fund-paid 12b-1 fees. The Board noted that Fidelity may agree to waive fees or reimburse expenses from time to time, and the extent to which, if any, it has done so for the fund. The Board also considered information about the impact of the fund's performance adjustment.
Comparisons of Management Fees and Total Expense Ratios. Among other things, the Board reviewed data for selected groups of competitive funds and classes (referred to as "mapped groups") that were compiled by Fidelity based on combining similar investment objective categories (as classified by Morningstar) that have comparable investment mandates. The data reviewed by the Board included (i) gross management fee comparisons (before taking into account expense reimbursements or caps and without taking into account the fund's performance adjustment) relative to the total universe of funds within the mapped group; (ii) gross management fee comparisons relative to a subset of non-Fidelity funds in the mapped group that are similar in size and management fee structure to the fund (referred to as the "asset size peer group"); (iii) total expense comparisons of the retail class of the fund relative to funds and classes in the mapped group that have a similar sales load structure to the retail class of the fund (referred to as the "similar sales load structure group"); and (iv) total expense comparisons of the retail class of the fund relative to funds and classes in the similar sales load structure group that are similar in size and management fee structure to the fund (referred to as the "total expense asset size peer group"). The total expense asset size peer group comparison excludes performance adjustments and fund-paid 12b-1 fees to eliminate variability in fee structures.
The information provided to the Board indicated that the fund's management fee rate ranked above the competitive median of the mapped group for the 12-month period ended September 30, 2023 and below the competitive median of the asset size peer group for the 12-month period ended September 30, 2023. Further, the information provided to the Board indicated that the total expense ratio of the retail class of the fund ranked above the competitive median of the similar sales load structure group for the 12-month period ended September 30, 2023 and above the competitive median of the total expense asset size peer group for the 12-month period ended September 30, 2023. The Board noted that Fidelity has stated that it believes the management fee rate and total expense ratio are reasonable for the overall value of the nature and quality of services that they cover.
The Board noted that a different variable management fee rate is applicable to each class of the fund. The Board considered that the difference in management fee rates between classes is the result of separate arrangements for class-level services and/or waivers of certain expenses and not the result of any difference in advisory or custodial fees or other expenses related to the management of the fund's assets, which do not vary by class.
The Board also considered that the fund's management fee is subject to upward or downward adjustment depending upon whether, and to what extent, the fund's investment performance for the performance period (a rolling 36-month period) exceeds, or is exceeded by, a securities index, thus leading to a performance adjustment for the same period. The Board noted that the performance adjustment provides FMR with a strong economic incentive to seek to achieve superior long-term performance for the fund's shareholders and helps to more closely align the interests of FMR and the shareholders of the fund.
In connection with its consideration of the fund's performance adjustment, the Board noted that the performance of the retail class is used for purposes of determining the performance adjustment. The Board noted that to the extent the performance adjustment was based on the performance of a share class with higher total annual operating expenses, the fund would be subject to a smaller positive and larger negative performance adjustment. The Board considered the appropriateness of the use of the retail class as the basis for the performance adjustment. The Board noted that the retail class is typically the largest class (reflecting the actual investment experience for the plurality of shareholders), employs a standard expense structure, and does not include fund-paid 12b-1 fees, which Fidelity believes makes it a more appropriate measurement of Fidelity's investment skill.
Other Contractual Arrangements. The Board further considered that FMR has contractually agreed to reimburse Class A, Class M, Class C, Class I, Class Z, and the retail class of the fund to the extent that total operating expenses, with certain exceptions, as a percentage of their respective average net assets, exceed 1.30%, 1.55%, 2.05%, 1.05%, 0.90%, and 1.05% through February 28, 2025.
Fees Charged to Other Fidelity Clients. The Board also considered Fidelity fee structures and other information with respect to clients of Fidelity, such as other funds advised or subadvised by Fidelity, pension plan clients, and other institutional clients with similar mandates. The Board noted that a joint ad hoc committee created by it and the boards of other Fidelity funds periodically reviews and compares Fidelity's institutional investment advisory business with its business of providing services to the Fidelity funds and also noted the most recent findings of the committee. The Board noted that the committee's review included a consideration of the differences in services provided, fees charged, and costs incurred, as well as competition in the markets serving the different categories of clients.
Based on its review, the Board concluded that the fund's management fee, including the use of the retail class as the basis for the performance adjustment, is fair and reasonable in light of the services that the fund receives and the other factors considered. Further, based on its review of total expense ratios and fees charged to other Fidelity clients, the Board concluded that the total expense ratio of each class of the fund was reasonable in light of the services that the fund and its shareholders receive and the other factors considered.
Costs of the Services and Profitability. The Board considered the revenues earned and the expenses incurred by Fidelity in conducting the business of developing, marketing, distributing, managing, administering and servicing the fund and servicing the fund's shareholders. The Board also considered the level of Fidelity's profits in respect of all the Fidelity funds.
On an annual basis, Fidelity presents to the Board information about the profitability of its relationships with the fund. Fidelity calculates profitability information for each fund, as well as aggregate profitability information for groups of Fidelity funds and all Fidelity funds, using a series of detailed revenue and cost allocation methodologies which originate with the books and records of Fidelity on which Fidelity's audited financial statements are based. The Audit Committee of the Board reviews any significant changes from the prior year's methodologies.
A public accounting firm has been engaged annually by the Board as part of the Board's assessment of Fidelity's profitability analysis. The engagement includes the review and assessment of the methodologies used by Fidelity in determining the revenues and expenses attributable to Fidelity's fund business, and completion of agreed-upon procedures in respect of the mathematical accuracy of certain fund profitability information and its conformity to established allocation methodologies. After considering the reports issued under the engagement and information provided by Fidelity, the Board concluded that while other allocation methods may also be reasonable, Fidelity's profitability methodologies are reasonable in all material respects.
The Board also reviewed Fidelity's non-fund businesses and potential indirect benefits such businesses may have received as a result of their association with Fidelity's fund business (i.e., fall-out benefits) as well as cases where Fidelity's affiliates may benefit from the funds' business. The Board considered areas where potential indirect benefits to the Fidelity funds from their relationships with Fidelity may exist. The Board's consideration of these matters was informed by the findings of a joint ad hoc committee created by it and the boards of other Fidelity funds to evaluate potential fall-out benefits.
The Board considered the costs of the services provided by and the profits realized by Fidelity in connection with the operation of the fund and was satisfied that the profitability was not excessive.
Economies of Scale. The Board considered whether there have been economies of scale in respect of the management of the Fidelity funds, whether the Fidelity funds (including the fund) have appropriately benefited from any such economies of scale, and whether there is potential for realization of any further economies of scale. The Board considered the extent to which the fund will benefit from economies of scale as assets grow through increased services to the fund, through waivers or reimbursements, or through fee or expense ratio reductions. The Board also noted that a committee created by it and the boards of other Fidelity funds periodically analyzes whether Fidelity attains economies of scale in respect of the management and servicing of the Fidelity funds, whether the Fidelity funds have appropriately benefited from such economies of scale, and whether there is potential for realization of any further economies of scale.
The Board recognized that the fund's management contract incorporates a variable management fee structure, which provides breakpoints as a way to share, in part, any potential economies of scale that may exist at the asset class level and through a discount that considers both fund size and total assets of the four applicable asset classes. The Board considered that the variable management fee is designed to deliver the benefits of economies of scale to fund shareholders even if assets of any particular fund are unchanged or have declined, because some portion of Fidelity's costs are attributable to services provided to all funds subject to the variable management fee, and all such funds benefit if those costs can be allocated among more assets. The Board concluded that, given the variable management fee structure, fund shareholders will benefit from lower management fees due to the application of the breakpoints and discount factor, regardless of whether Fidelity achieves any such economies of scale.
The Board concluded, taking into account the analysis of the committee, that economies of scale, if any, are being appropriately shared between fund shareholders and Fidelity.
Additional Information Requested by the Board. In order to develop fully the factual basis for consideration of the Fidelity funds' advisory contracts, the Board requested and received additional information on certain topics, including but not limited to: (i) fund flow and performance trends, in particular the underperformance of certain funds and strategies, and Fidelity's long-term strategies for certain funds; (ii) the operation of performance fees and the rationale for implementing performance fees on certain categories of funds but not others; (iii) Fidelity's pricing philosophy compared to competitors; (iv) fund profitability methodology and data; (v) evaluation of competitive fund data and peer group classifications and fee and expense comparisons; (vi) the management fee and expense structures for different funds and classes and information about the differences between various fee and expense structures; (vii) the variable management fee implemented for certain funds effective March 1, 2024; and (viii) information regarding other accounts managed by Fidelity and the funds' sub-advisory arrangements.
Conclusion. Based on its evaluation of all of the conclusions noted above, and after considering all factors it believed relevant, the Board, including the Independent Trustees, concluded that the advisory and sub-advisory fee arrangements are fair and reasonable in light of all of the surrounding circumstances and that the fund's Advisory Contracts should be renewed through May 31, 2025.
1.9904429.102
SIC-ANN-1224
Fidelity® Series Overseas Fund
Annual Report
October 31, 2024
Contents
To view a fund's proxy voting guidelines and proxy voting record for the 12-month period ended June 30, visit http://www.fidelity.com/proxyvotingresults or visit the Securities and Exchange Commission's (SEC) web site at http://www.sec.gov.
You may also call 1-800-544-8544 to request a free copy of the proxy voting guidelines.
Standard & Poor's, S&P and S&P 500 are registered service marks of The McGraw-Hill Companies, Inc. and have been licensed for use by Fidelity Distributors Corporation.
Other third-party marks appearing herein are the property of their respective owners.
All other marks appearing herein are registered or unregistered trademarks or service marks of FMR LLC or an affiliated company. © 2024 FMR LLC. All rights reserved.
This report and the financial statements contained herein are submitted for the general information of the shareholders of the Fund. This report is not authorized for distribution to prospective investors in the Fund unless preceded or accompanied by an effective prospectus.
A fund files its complete schedule of portfolio holdings with the SEC for the first and third quarters of each fiscal year on Form N-PORT. Forms N-PORT are available on the SEC's web site at http://www.sec.gov. A fund's Forms N-PORT may be reviewed and copied at the SEC's Public Reference Room in Washington, DC. Information regarding the operation of the SEC's Public Reference Room may be obtained by calling 1-800-SEC-0330.
For a complete list of a fund's portfolio holdings, view the most recent holdings listing, semiannual report, or annual report on Fidelity's web site at http://www.fidelity.com, http://www.institutional.fidelity.com, or http://www.401k.com, as applicable.
NOT FDIC INSURED •MAY LOSE VALUE •NO BANK GUARANTEE
Neither the Fund nor Fidelity Distributors Corporation is a bank.
Item 7: Financial Statements and Financial Highlights for Open-End Management Investment Companies (Annual Report)
Fidelity® Series Overseas Fund
Schedule of Investments October 31, 2024
Showing Percentage of Net Assets
| Common Stocks - 97.4% |
| | | Shares | Value ($) |
| Belgium - 0.8% | | | |
| Azelis Group NV | | 1,607,143 | 31,869,135 |
| KBC Group NV | | 1,241,065 | 90,015,896 |
TOTAL BELGIUM | | | 121,885,031 |
| Canada - 1.6% | | | |
| Constellation Software, Inc. | | 74,070 | 223,379,820 |
| Constellation Software, Inc. warrants 3/31/40 (a)(b) | | 105,870 | 8 |
| Lumine Group, Inc. (a) | | 781,050 | 18,186,261 |
TOTAL CANADA | | | 241,566,089 |
| Denmark - 4.5% | | | |
| DSV A/S | | 966,500 | 210,064,270 |
| Novo Nordisk A/S Series B | | 4,050,600 | 454,335,599 |
TOTAL DENMARK | | | 664,399,869 |
| France - 11.5% | | | |
| Accor SA | | 3,317,200 | 150,321,124 |
| Air Liquide SA | | 1,522,626 | 273,008,979 |
| Alten SA | | 886,201 | 74,900,091 |
| Capgemini SA | | 1,027,262 | 178,210,282 |
| Dassault Systemes SA | | 4,144,900 | 141,859,949 |
| EssilorLuxottica SA | | 836,316 | 195,949,968 |
| LVMH Moet Hennessy Louis Vuitton SE | | 386,712 | 257,442,126 |
| Safran SA | | 1,404,000 | 317,817,448 |
| Thales SA | | 717,306 | 115,593,978 |
TOTAL FRANCE | | | 1,705,103,945 |
| Germany - 9.1% | | | |
| Allianz SE | | 764,233 | 240,584,648 |
| Deutsche Borse AG | | 996,160 | 231,386,352 |
| Hannover Reuck SE | | 877,216 | 230,437,296 |
| Merck KGaA | | 830,620 | 137,333,050 |
| SAP SE | | 1,916,700 | 447,520,890 |
| Siemens Healthineers AG (c) | | 1,336,000 | 69,711,635 |
TOTAL GERMANY | | | 1,356,973,871 |
| India - 0.8% | | | |
| HDFC Bank Ltd. | | 5,841,800 | 120,073,310 |
| Indonesia - 1.0% | | | |
| PT Bank Central Asia Tbk | | 217,440,200 | 140,726,549 |
| Ireland - 1.0% | | | |
| Kingspan Group PLC (Ireland) | | 1,723,056 | 151,158,598 |
| Italy - 3.4% | | | |
| FinecoBank SpA | | 8,189,185 | 130,810,837 |
| GVS SpA (a)(c) | | 822,038 | 5,508,099 |
| Industrie de Nora SpA (d) | | 588,900 | 5,537,779 |
| Interpump Group SpA | | 184,819 | 8,210,346 |
| Recordati SpA | | 2,314,221 | 131,151,012 |
| UniCredit SpA | | 5,063,967 | 224,025,919 |
TOTAL ITALY | | | 505,243,992 |
| Japan - 15.7% | | | |
| Ajinomoto Co., Inc. | | 4,644,100 | 178,406,590 |
| BayCurrent Consulting, Inc. | | 1,581,500 | 51,397,274 |
| Capcom Co. Ltd. | | 3,950,800 | 78,180,264 |
| DENSO Corp. | | 4,592,400 | 65,228,130 |
| Disco Corp. | | 58,500 | 16,645,286 |
| Ebara Corp. | | 49,400 | 742,403 |
| Fuji Electric Co. Ltd. | | 509,063 | 25,925,513 |
| FUJIFILM Holdings Corp. | | 6,725,800 | 159,995,490 |
| Hitachi Ltd. | | 13,359,600 | 335,658,081 |
| Hoya Corp. | | 1,524,160 | 203,923,535 |
| Mitsubishi Heavy Industries Ltd. | | 18,786,000 | 265,201,057 |
| Renesas Electronics Corp. | | 8,037,926 | 107,694,712 |
| Rohto Pharmaceutical Co. Ltd. | | 2,108,200 | 47,407,863 |
| Shin-Etsu Chemical Co. Ltd. | | 7,267,940 | 266,326,135 |
| Suzuki Motor Corp. | | 8,095,880 | 80,338,136 |
| TIS, Inc. | | 1,684,376 | 42,002,383 |
| Tokio Marine Holdings, Inc. | | 8,110,700 | 292,116,309 |
| Tokyo Electron Ltd. | | 844,400 | 124,256,042 |
TOTAL JAPAN | | | 2,341,445,203 |
| Netherlands - 6.2% | | | |
| ASML Holding NV (Netherlands) | | 659,228 | 445,447,150 |
| IMCD NV | | 1,040,451 | 165,292,172 |
| Topicus.Com, Inc. | | 180,377 | 15,440,898 |
| Wolters Kluwer NV | | 1,771,008 | 298,016,238 |
TOTAL NETHERLANDS | | | 924,196,458 |
| Spain - 1.2% | | | |
| CaixaBank SA | | 30,050,662 | 183,121,625 |
| Sweden - 2.2% | | | |
| Atlas Copco AB (A Shares) | | 9,616,700 | 158,708,411 |
| Indutrade AB | | 6,208,975 | 168,182,625 |
| Kry International AB (a)(b)(e) | | 206,997 | 4,338,852 |
TOTAL SWEDEN | | | 331,229,888 |
| Switzerland - 3.4% | | | |
| ABB Ltd. (Reg.) | | 572,400 | 31,808,920 |
| Galderma Group AG (a) | | 693,170 | 64,866,039 |
| Partners Group Holding AG | | 153,140 | 211,563,916 |
| Sika AG | | 727,512 | 202,613,208 |
TOTAL SWITZERLAND | | | 510,852,083 |
| Taiwan - 1.4% | | | |
| Taiwan Semiconductor Manufacturing Co. Ltd. | | 6,777,684 | 213,236,855 |
| United Kingdom - 17.8% | | | |
| 3i Group PLC | | 5,427,091 | 222,552,617 |
| AstraZeneca PLC (United Kingdom) | | 2,332,500 | 331,899,831 |
| BAE Systems PLC | | 11,722,500 | 188,935,159 |
| Compass Group PLC | | 9,504,587 | 308,675,002 |
| Diploma PLC | | 1,482,131 | 81,376,078 |
| Halma PLC | | 3,548,795 | 113,255,844 |
| InterContinental Hotel Group PLC | | 1,832,298 | 202,097,981 |
| Lloyds Banking Group PLC | | 221,930,615 | 152,333,251 |
| London Stock Exchange Group PLC | | 2,155,600 | 292,161,173 |
| RELX PLC (London Stock Exchange) | | 7,246,855 | 332,338,628 |
| Rolls-Royce Holdings PLC (a) | | 28,000,500 | 193,214,615 |
| Sage Group PLC | | 9,168,200 | 114,601,842 |
| Tesco PLC | | 25,858,000 | 114,180,441 |
TOTAL UNITED KINGDOM | | | 2,647,622,462 |
| United States of America - 15.8% | | | |
| Alcon, Inc. (Switzerland) | | 2,252,350 | 207,564,140 |
| CDW Corp. | | 60,747 | 11,434,408 |
| CRH PLC | | 1,704,400 | 162,650,892 |
| Experian PLC | | 4,323,200 | 210,550,762 |
| Ferguson Enterprises, Inc. | | 1,002,000 | 197,938,827 |
| Holcim AG | | 1,887,059 | 185,919,726 |
| ICON PLC (a) | | 360,354 | 80,038,227 |
| Linde PLC | | 546,700 | 249,377,205 |
| Marsh & McLennan Companies, Inc. | | 1,180,528 | 257,638,431 |
| S&P Global, Inc. | | 473,651 | 227,522,994 |
| Schneider Electric SA | | 1,089,331 | 282,189,841 |
| Thermo Fisher Scientific, Inc. | | 217,300 | 118,715,336 |
| Visa, Inc. Class A | | 584,900 | 169,533,265 |
TOTAL UNITED STATES OF AMERICA | | | 2,361,074,054 |
| TOTAL COMMON STOCKS (Cost $10,591,155,224) | | | 14,519,909,882 |
| | | | |
| Money Market Funds - 1.7% |
| | | Shares | Value ($) |
| Fidelity Cash Central Fund 4.87% (f) | | 262,703,017 | 262,755,557 |
| Fidelity Securities Lending Cash Central Fund 4.87% (f)(g) | | 1,105,230 | 1,105,340 |
| TOTAL MONEY MARKET FUNDS (Cost $263,860,897) | | | 263,860,897 |
| | | | |
| TOTAL INVESTMENT IN SECURITIES - 99.1% (Cost $10,855,016,121) | 14,783,770,779 |
NET OTHER ASSETS (LIABILITIES) - 0.9% | 127,357,173 |
| NET ASSETS - 100.0% | 14,911,127,952 |
| | |
Legend
| (c) | Security exempt from registration under Rule 144A of the Securities Act of 1933. These securities may be resold in transactions exempt from registration, normally to qualified institutional buyers. At the end of the period, the value of these securities amounted to $75,219,734 or 0.5% of net assets. |
| (d) | Security or a portion of the security is on loan at period end. |
| (e) | Restricted securities (including private placements) - Investment in securities not registered under the Securities Act of 1933 (excluding 144A issues). At the end of the period, the value of restricted securities (excluding 144A issues) amounted to $4,338,852 or 0.0% of net assets. |
| (f) | Affiliated fund that is generally available only to investment companies and other accounts managed by Fidelity Investments. The rate quoted is the annualized seven-day yield of the fund at period end. A complete unaudited listing of the fund's holdings as of its most recent quarter end is available upon request. In addition, each Fidelity Central Fund's financial statements, which are not covered by the Fund's Report of Independent Registered Public Accounting Firm, are available on the SEC's website or upon request. |
| (g) | Investment made with cash collateral received from securities on loan. |
| Additional information on each restricted holding is as follows: |
| Security | Acquisition Date | Acquisition Cost ($) |
| Kry International AB | 5/14/21 - 10/30/24 | 13,688,300 |
| | | |
Affiliated Central Funds
Fiscal year to date information regarding the Fund's investments in Fidelity Central Funds, including the ownership percentage, is presented below.
| Affiliate | Value, beginning of period ($) | Purchases ($) | Sales Proceeds ($) | Dividend Income ($) | Realized Gain (loss) ($) | Change in Unrealized appreciation (depreciation) ($) | Value, end of period ($) | % ownership, end of period |
| Fidelity Cash Central Fund 4.87% | 329,038,521 | 2,838,282,521 | 2,904,593,155 | 6,347,772 | 27,670 | - | 262,755,557 | 0.5% |
| Fidelity Securities Lending Cash Central Fund 4.87% | - | 129,958,456 | 128,853,116 | 209,214 | - | - | 1,105,340 | 0.0% |
| Total | 329,038,521 | 2,968,240,977 | 3,033,446,271 | 6,556,986 | 27,670 | - | 263,860,897 | |
| | | | | | | | | |
Amounts in the dividend income column in the above table include any capital gain distributions from underlying funds, which are presented in the corresponding line item in the Statement of Operations, if applicable.
Amounts in the dividend income column for Fidelity Securities Lending Cash Central Fund represents the income earned on investing cash collateral, less rebates paid to borrowers and any lending agent fees associated with the loan, plus any premium payments received for lending certain types of securities.
Amounts included in the purchases and sales proceeds columns may include in-kind transactions, if applicable.
Investment Valuation
The following is a summary of the inputs used, as of October 31, 2024, involving the Fund's assets and liabilities carried at fair value. The inputs or methodology used for valuing securities may not be an indication of the risk associated with investing in those securities. For more information on valuation inputs, and their aggregation into the levels used below, please refer to the Investment Valuation section in the accompanying Notes to Financial Statements.
| Valuation Inputs at Reporting Date: |
| Description | Total ($) | Level 1 ($) | Level 2 ($) | Level 3 ($) |
Investments in Securities: | | | | |
|
| Equities: | | | | |
Communication Services | 78,180,264 | - | 78,180,264 | - |
Consumer Discretionary | 1,064,102,499 | 150,321,124 | 913,781,375 | - |
Consumer Staples | 339,994,894 | - | 339,994,894 | - |
Financials | 3,416,604,388 | 1,317,522,635 | 2,099,081,753 | - |
Health Care | 1,995,488,372 | 1,005,329,407 | 990,158,965 | - |
Industrials | 3,833,236,257 | 1,649,298,907 | 2,183,937,350 | - |
Information Technology | 2,452,407,063 | 1,016,646,314 | 1,431,421,889 | 4,338,860 |
Materials | 1,339,896,145 | 800,561,031 | 539,335,114 | - |
|
| Money Market Funds | 263,860,897 | 263,860,897 | - | - |
| Total Investments in Securities: | 14,783,770,779 | 6,203,540,315 | 8,575,891,604 | 4,338,860 |
Financial Statements
| Statement of Assets and Liabilities |
As of October 31, 2024 |
| Assets | | | | |
| Investment in securities, at value (including securities loaned of $1,007,058) - See accompanying schedule: | | | | |
Unaffiliated issuers (cost $10,591,155,224) | $ | 14,519,909,882 | | |
Fidelity Central Funds (cost $263,860,897) | | 263,860,897 | | |
| | | | | |
| | | | | |
| Total Investment in Securities (cost $10,855,016,121) | | | $ | 14,783,770,779 |
| Foreign currency held at value (cost $114,718) | | | | 114,721 |
| Receivable for investments sold | | | | 116,527,660 |
| Receivable for fund shares sold | | | | 187,303,139 |
| Dividends receivable | | | | 22,888,307 |
| Reclaims receivable | | | | 44,875,729 |
| Distributions receivable from Fidelity Central Funds | | | | 571,291 |
| Other receivables | | | | 82,820 |
Total assets | | | | 15,156,134,446 |
| Liabilities | | | | |
| Payable for investments purchased | $ | 236,142,894 | | |
| Payable for fund shares redeemed | | 5,730,965 | | |
| Other payables and accrued expenses | | 2,027,295 | | |
| Collateral on securities loaned | | 1,105,340 | | |
| Total liabilities | | | | 245,006,494 |
| Net Assets | | | $ | 14,911,127,952 |
| Net Assets consist of: | | | | |
| Paid in capital | | | $ | 10,942,738,313 |
| Total accumulated earnings (loss) | | | | 3,968,389,639 |
| Net Assets | | | $ | 14,911,127,952 |
Net Asset Value, offering price and redemption price per share ($14,911,127,952 ÷ 1,061,150,123 shares) | | | $ | 14.05 |
| Statement of Operations |
| Year ended October 31, 2024 |
| Investment Income | | | | |
| Dividends | | | $ | 289,137,105 |
| Interest | | | | 115,088 |
| Income from Fidelity Central Funds (including $209,214 from security lending) | | | | 6,556,986 |
| Income before foreign taxes withheld | | | $ | 295,809,179 |
| Less foreign taxes withheld | | | | (25,039,417) |
| Total income | | | | 270,769,762 |
| Expenses | | | | |
| Custodian fees and expenses | $ | 1,019,680 | | |
| Independent trustees' fees and expenses | | 67,133 | | |
| Interest | | 137,628 | | |
| Miscellaneous | | 86 | | |
| Total expenses before reductions | | 1,224,527 | | |
| Expense reductions | | (1,142) | | |
| Total expenses after reductions | | | | 1,223,385 |
| Net Investment income (loss) | | | | 269,546,377 |
| Realized and Unrealized Gain (Loss) | | | | |
| Net realized gain (loss) on: | | | | |
| Investment Securities: | | | | |
| Unaffiliated issuers (net of foreign taxes of $4,933,904) | | 465,179,501 | | |
| Redemptions in-kind | | 242,444,479 | | |
| Fidelity Central Funds | | 27,670 | | |
| Foreign currency transactions | | (282,641) | | |
| Total net realized gain (loss) | | | | 707,369,009 |
| Change in net unrealized appreciation (depreciation) on: | | | | |
| Investment Securities: | | | | |
| Unaffiliated issuers (net of decrease in deferred foreign taxes of $2,123,872) | | 2,356,188,057 | | |
| Assets and liabilities in foreign currencies | | 895,315 | | |
| Total change in net unrealized appreciation (depreciation) | | | | 2,357,083,372 |
| Net gain (loss) | | | | 3,064,452,381 |
| Net increase (decrease) in net assets resulting from operations | | | $ | 3,333,998,758 |
| Statement of Changes in Net Assets |
| |
| | Year ended October 31, 2024 | | Year ended October 31, 2023 |
| Increase (Decrease) in Net Assets | | | | |
| Operations | | | | |
| Net investment income (loss) | $ | 269,546,377 | $ | 254,211,804 |
| Net realized gain (loss) | | 707,369,009 | | 90,465,610 |
| Change in net unrealized appreciation (depreciation) | | 2,357,083,372 | | 1,370,046,952 |
| Net increase (decrease) in net assets resulting from operations | | 3,333,998,758 | | 1,714,724,366 |
| Distributions to shareholders | | (237,159,965) | | (228,975,390) |
| | | | | |
| Share transactions | | | | |
| Proceeds from sales of shares | | 2,365,173,907 | | 1,971,571,393 |
| Reinvestment of distributions | | 237,159,965 | | 228,975,390 |
| Cost of shares redeemed | | (3,632,944,341) | | (3,158,640,518) |
| | | | | |
Net increase (decrease) in net assets resulting from share transactions | | (1,030,610,469) | | (958,093,735) |
| Total increase (decrease) in net assets | | 2,066,228,324 | | 527,655,241 |
| | | | | |
| Net Assets | | | | |
| Beginning of period | | 12,844,899,628 | | 12,317,244,387 |
| End of period | $ | 14,911,127,952 | $ | 12,844,899,628 |
| | | | | |
| Other Information | | | | |
| Shares | | | | |
| Sold | | 172,632,035 | | 166,640,804 |
| Issued in reinvestment of distributions | | 19,172,188 | | 20,554,344 |
| Redeemed | | (265,148,072) | | (271,702,575) |
| Net increase (decrease) | | (73,343,849) | | (84,507,427) |
| | | | | |
Financial Highlights
Fidelity® Series Overseas Fund |
| |
| Years ended October 31, | | 2024 | | 2023 | | 2022 | | 2021 | | 2020 |
Selected Per-Share Data | | | | | | | | | | |
| Net asset value, beginning of period | $ | 11.32 | $ | 10.10 | $ | 14.58 | $ | 10.62 | $ | 10.20 |
| Income from Investment Operations | | | | | | | | | | |
Net investment income (loss) A,B | | .25 | | .22 | | .21 | | .17 | | .14 |
| Net realized and unrealized gain (loss) | | 2.69 | | 1.20 | | (4.27) | | 3.93 | | .32 |
| Total from investment operations | | 2.94 | | 1.42 | | (4.06) | | 4.10 | | .46 |
| Distributions from net investment income | | (.21) | | (.20) | | (.17) | | (.14) | | (.04) |
| Distributions from net realized gain | | - | | - | | (.25) | | - | | - |
| Total distributions | | (.21) | | (.20) | | (.42) | | (.14) | | (.04) |
| Net asset value, end of period | $ | 14.05 | $ | 11.32 | $ | 10.10 | $ | 14.58 | $ | 10.62 |
Total Return C | | | | 14.05% | | (28.66)% | | 38.89% | | 4.51% |
Ratios to Average Net Assets B,D,E | | | | | | | | | | |
| Expenses before reductions | | .01% | | .01% | | .01% | | .01% | | .01% |
| Expenses net of fee waivers, if any | | | | .01% | | .01% | | .01% | | .01% |
| Expenses net of all reductions | | .01% | | .01% | | .01% | | .01% | | .01% |
| Net investment income (loss) | | 1.79% | | 1.90% | | 1.79% | | 1.29% | | 1.35% |
| Supplemental Data | | | | | | | | | | |
| Net assets, end of period (000 omitted) | $ | 14,911,128 | $ | 12,844,900 | $ | 12,317,244 | $ | 15,419,200 | $ | 11,508,376 |
Portfolio turnover rate F | | | | 38% G | | 28% G | | 33% | | 50% |
ACalculated based on average shares outstanding during the period.
BNet investment income (loss) is affected by the timing of the declaration of dividends by any underlying mutual funds or exchange-traded funds (ETFs). Net investment income (loss) of any mutual funds or ETFs is not included in the Fund's net investment income (loss) ratio.
CTotal returns would have been lower if certain expenses had not been reduced during the applicable periods shown.
DFees and expenses of any underlying mutual funds or exchange-traded funds (ETFs) are not included in the Fund's expense ratio. The Fund indirectly bears its proportionate share of these expenses. For additional expense information related to investments in Fidelity Central Funds, please refer to the "Investments in Fidelity Central Funds" note found in the Notes to Financial Statements section of the most recent Annual or Semi-Annual report.
EExpense ratios reflect operating expenses of the class. Expenses before reductions do not reflect amounts reimbursed, waived, or reduced through arrangements with the investment adviser, brokerage services, or other offset arrangements, if applicable, and do not represent the amount paid by the class during periods when reimbursements, waivers or reductions occur.
FAmount does not include the portfolio activity of any underlying mutual funds or exchange-traded funds (ETFs).
GPortfolio turnover rate excludes securities received or delivered in-kind.
Notes to Financial Statements
For the period ended October 31, 2024
1. Organization.
Fidelity Series Overseas Fund (the Fund) is a fund of Fidelity Investment Trust (the Trust) and is authorized to issue an unlimited number of shares. Shares are offered only to certain other Fidelity funds, Fidelity managed 529 plans, and Fidelity managed collective investment trusts. The Trust is registered under the Investment Company Act of 1940, as amended (the 1940 Act), as an open-end management investment company organized as a Massachusetts business trust.
2. Investments in Fidelity Central Funds.
Funds may invest in Fidelity Central Funds, which are open-end investment companies generally available only to other investment companies and accounts managed by the investment adviser and its affiliates. The Schedule of Investments lists any Fidelity Central Funds held as an investment as of period end, but does not include the underlying holdings of each Fidelity Central Fund. An investing fund indirectly bears its proportionate share of the expenses of the underlying Fidelity Central Funds.
Based on its investment objective, each Fidelity Central Fund may invest or participate in various investment vehicles or strategies that are similar to those of the investing fund. These strategies are consistent with the investment objectives of the investing fund and may involve certain economic risks which may cause a decline in value of each of the Fidelity Central Funds and thus a decline in the value of the investing fund.
| Fidelity Central Fund | Investment Manager | Investment Objective | Investment Practices | Expense RatioA |
| Fidelity Money Market Central Funds | Fidelity Management & Research Company LLC (FMR) | Each fund seeks to obtain a high level of current income consistent with the preservation of capital and liquidity. | Short-term Investments | Less than .005% |
A Expenses expressed as a percentage of average net assets and are as of each underlying Central Fund's most recent annual or semi-annual shareholder report.
A complete unaudited list of holdings for each Fidelity Central Fund is available upon request or at the Securities and Exchange Commission website at www.sec.gov. In addition, the financial statements of the Fidelity Central Funds which contain the significant accounting policies (including investment valuation policies) of those funds, and are not covered by the Report of Independent Registered Public Accounting Firm, are available on the Securities and Exchange Commission website or upon request.
3. Significant Accounting Policies.
The Fund is an investment company and applies the accounting and reporting guidance of the Financial Accounting Standards Board (FASB) Accounting Standards Codification Topic 946 Financial Services - Investment Companies. The financial statements have been prepared in conformity with accounting principles generally accepted in the United States of America (GAAP), which require management to make certain estimates and assumptions at the date of the financial statements. Actual results could differ from those estimates. Subsequent events, if any, through the date that the financial statements were issued have been evaluated in the preparation of the financial statements. The Fund's Schedule of Investments lists any underlying mutual funds or exchange-traded funds (ETFs) but does not include the underlying holdings of these funds. The following summarizes the significant accounting policies of the Fund:
Investment Valuation. Investments are valued as of 4:00 p.m. Eastern time on the last calendar day of the period. The Board of Trustees (the Board) has designated the Fund's investment adviser as the valuation designee responsible for the fair valuation function and performing fair value determinations as needed. The investment adviser has established a Fair Value Committee (the Committee) to carry out the day-to-day fair valuation responsibilities and has adopted policies and procedures to govern the fair valuation process and the activities of the Committee. In accordance with these fair valuation policies and procedures, which have been approved by the Board, the Fund attempts to obtain prices from one or more third party pricing services or brokers to value its investments. When current market prices, quotations or currency exchange rates are not readily available or reliable, investments will be fair valued in good faith by the Committee, in accordance with the policies and procedures. Factors used in determining fair value vary by investment type and may include market or investment specific events, transaction data, estimated cash flows, and market observations of comparable investments. The frequency that the fair valuation procedures are used cannot be predicted and they may be utilized to a significant extent. The Committee manages the Fund's fair valuation practices and maintains the fair valuation policies and procedures. The Fund's investment adviser reports to the Board information regarding the fair valuation process and related material matters.
The Fund categorizes the inputs to valuation techniques used to value its investments into a disclosure hierarchy consisting of three levels as shown below:
Level 1 - unadjusted quoted prices in active markets for identical investments
Level 2 - other significant observable inputs (including quoted prices for similar investments, interest rates, prepayment speeds, etc.)
Level 3 - unobservable inputs (including the Fund's own assumptions based on the best information available)
Valuation techniques used to value the Fund's investments by major category are as follows:
Equity securities, including restricted securities, for which market quotations are readily available, are valued at the last reported sale price or official closing price as reported by a third party pricing service on the primary market or exchange on which they are traded and are categorized as Level 1 in the hierarchy. In the event there were no sales during the day or closing prices are not available, securities are valued at the last quoted bid price or may be valued using the last available price and are generally categorized as Level 2 in the hierarchy. For foreign equity securities, when market or security specific events arise, comparisons to the valuation of American Depositary Receipts (ADRs), futures contracts, Exchange-Traded Funds (ETFs) and certain indexes as well as quoted prices for similar securities may be used and would be categorized as Level 2 in the hierarchy. For equity securities, including restricted securities, where observable inputs are limited, assumptions about market activity and risk are used and these securities may be categorized as Level 3 in the hierarchy.
Investments in open-end mutual funds, including the Fidelity Central Funds, are valued at their closing net asset value (NAV) each business day and are categorized as Level 1 in the hierarchy.
Changes in valuation techniques may result in transfers in or out of an assigned level within the disclosure hierarchy. The aggregate value of investments by input level as of October 31, 2024 is included at the end of the Fund's Schedule of Investments.
Foreign Currency. Certain Funds may use foreign currency contracts to facilitate transactions in foreign-denominated securities. Gains and losses from these transactions may arise from changes in the value of the foreign currency or if the counterparties do not perform under the contracts' terms.
Foreign-denominated assets, including investment securities, and liabilities are translated into U.S. dollars at the exchange rates at period end. Purchases and sales of investment securities, income and dividends received, and expenses denominated in foreign currencies are translated into U.S. dollars at the exchange rate in effect on the transaction date.
The effects of exchange rate fluctuations on investments are included with the net realized and unrealized gain (loss) on investment securities. Other foreign currency transactions resulting in realized and unrealized gain (loss) are disclosed separately.
Investment Transactions and Income. For financial reporting purposes, the Fund's investment holdings and NAV include trades executed through the end of the last business day of the period. The NAV per share for processing shareholder transactions is calculated as of the close of business of the New York Stock Exchange (NYSE), normally 4:00 p.m. Eastern time and includes trades executed through the end of the prior business day. Gains and losses on securities sold are determined on the basis of identified cost. Commissions paid to certain brokers with whom the investment adviser, or its affiliates, places trades on behalf of a fund include an amount in addition to trade execution, which may be rebated back to a fund. Any such rebates are included in net realized gain (loss) on investments in the Statement of Operations. Dividend income is recorded on the ex-dividend date, except for certain dividends from foreign securities where the ex-dividend date may have passed, which are recorded as soon as the Fund is informed of the ex-dividend date. Non-cash dividends included in dividend income, if any, are recorded at the fair market value of the securities received. Income and capital gain distributions from Fidelity Central Funds, if any, are recorded on the ex-dividend date. Interest income is accrued as earned and includes coupon interest and amortization of premium and accretion of discount on debt securities if applicable. Investment income is recorded net of foreign taxes withheld where recovery of such taxes is uncertain. Funds may file withholding tax reclaims in certain jurisdictions to recover a portion of amounts previously withheld. Any withholding tax reclaims income is included in the Statement of Operations in foreign taxes withheld. Any receivables for withholding tax reclaims are included in the Statement of Assets and Liabilities in reclaims receivable. The Fund has filed tax reclaims for previously withheld taxes on dividends earned in certain European Union (EU) countries. These additional filings are subject to various administrative proceedings by the local jurisdictions' tax authorities within the EU, as well as a number of related judicial proceedings. Income recognized for EU reclaims is included with other reclaims in the Statement of Operations in foreign taxes withheld. These reclaims are recorded when the amount is known and there are no significant uncertainties on collectability.
Expenses. Expenses directly attributable to a fund are charged to that fund. Expenses attributable to more than one fund are allocated among the respective funds on the basis of relative net assets or other appropriate methods. Expenses included in the accompanying financial statements reflect the expenses of that fund and do not include any expenses associated with any underlying mutual funds or exchange-traded funds. Although not included in a fund's expenses, a fund indirectly bears its proportionate share of these expenses through the net asset value of each underlying mutual fund or exchange-traded fund. Expense estimates are accrued in the period to which they relate and adjustments are made when actual amounts are known.
Income Tax Information and Distributions to Shareholders. Each year, the Fund intends to qualify as a regulated investment company under Subchapter M of the Internal Revenue Code, including distributing substantially all of its taxable income and realized gains. As a result, no provision for U.S. Federal income taxes is required. As of October 31, 2024, the Fund did not have any unrecognized tax benefits in the financial statements; nor is the Fund aware of any tax positions for which it is reasonably possible that the total amounts of unrecognized tax benefits will significantly change in the next twelve months. The Fund files a U.S. federal tax return, in addition to state and local tax returns as required. The Fund's federal income tax returns are subject to examination by the Internal Revenue Service (IRS) for a period of three fiscal years after they are filed. State and local tax returns may be subject to examination for an additional fiscal year depending on the jurisdiction. Foreign taxes are provided for based on the Fund's understanding of the tax rules and rates that exist in the foreign markets in which it invests. The Fund is subject to a tax imposed on capital gains by certain countries in which it invests. An estimated deferred tax liability for net unrealized appreciation on the applicable securities is included in Other payables and accrued expenses on the Statement of Assets and Liabilities.
Distributions are declared and recorded on the ex-dividend date. Income and capital gain distributions are determined in accordance with income tax regulations, which may differ from GAAP. In addition, the Fund claimed a portion of the payment made to redeeming shareholders as a distribution for income tax purposes.
Capital accounts within the financial statements are adjusted for permanent book-tax differences. These adjustments have no impact on net assets or the results of operations. Capital accounts are not adjusted for temporary book-tax differences which will reverse in a subsequent period.
Book-tax differences are primarily due to foreign currency transactions, certain foreign taxes, passive foreign investment companies (PFIC), redemptions in-kind, capital loss carryforwards and losses deferred due to wash sales.
As of period end, the cost and unrealized appreciation (depreciation) in securities, and derivatives if applicable, for federal income tax purposes were as follows:
| Gross unrealized appreciation | $4,015,903,282 |
| Gross unrealized depreciation | (185,861,544) |
| Net unrealized appreciation (depreciation) | $3,830,041,738 |
| Tax Cost | $10,953,729,041 |
The tax-based components of distributable earnings as of period end were as follows:
| Undistributed ordinary income | $284,685,482 |
| Capital loss carryforward | $(144,485,780) |
| Net unrealized appreciation (depreciation) on securities and other investments | $3,829,865,281 |
Capital loss carryforwards are only available to offset future capital gains of the Fund to the extent provided by regulations and may be limited. The capital loss carryforward information presented below, including any applicable limitation, is estimated as of fiscal period end and is subject to adjustment.
The tax character of distributions paid was as follows:
| | October 31, 2024 | October 31, 2023 |
| Ordinary Income | $237,159,965 | $228,975,390 |
| Total | $237,159,965 | $228,975,390 |
Restricted Securities (including Private Placements). Funds may invest in securities that are subject to legal or contractual restrictions on resale. These securities generally may be resold in transactions exempt from registration or to the public if the securities are registered. Disposal of these securities may involve time-consuming negotiations and expense, and prompt sale at an acceptable price may be difficult. Information regarding restricted securities held at period end is included at the end of the Schedule of Investments, if applicable.
New Accounting Pronouncement. In November 2023, the FASB issued Accounting Standards Update (ASU) 2023-07 Segment Reporting (Topic 280): Improvements to Reportable Segment Disclosures. Effective for fiscal years beginning after December 15, 2023 and interim periods within fiscal years beginning after December 15, 2024, the amendments enhance required disclosures of segment information for public entities on an annual and interim basis. The ASU allows for early adoption with updates applied retrospectively. Management is currently evaluating the impact of the ASU but does not expect this guidance to materially impact the financial statements.
4. Purchases and Sales of Investments.
Purchases and sales of securities, other than short-term securities and in-kind transactions, as applicable, are noted in the table below.
| | Purchases ($) | Sales ($) |
| Fidelity Series Overseas Fund | 5,347,631,152 | 5,739,988,216 |
Unaffiliated Redemptions In-Kind. Shares that were redeemed in-kind for investments, including accrued interest and cash, if any, are shown in the table below. The net realized gain or loss on investments delivered through in-kind redemptions is included in the "Net realized gain (loss) on: Redemptions in-kind" line in the accompanying Statement of Operations. The amount of the in-kind redemptions is included in share transactions in the accompanying Statement of Changes in Net Assets. There was no gain or loss for federal income tax purposes.
| | Shares | Total net realized gain or loss ($) | Total Proceeds ($) |
| Fidelity Series Overseas Fund | 46,946,466 | 242,444,479 | 642,139,814 |
Prior Fiscal Year Unaffiliated Redemptions In-Kind. Shares that were redeemed in-kind for investments, including accrued interest and cash, if any, are shown in the table below; along with realized gain or loss on investments delivered through in-kind redemptions. The amount of the in-kind redemptions is included in share transactions in the accompanying Statement of Changes in Net Assets. There was no gain or loss for federal income tax purposes.
| | Shares | Total net realized gain or loss ($) | Total Proceeds ($) |
| Fidelity Series Overseas Fund | 32,698,280 | 121,959,420 | 380,570,728 |
5. Fees and Other Transactions with Affiliates.
Management Fee. Fidelity Management & Research Company LLC (the investment adviser) and its affiliates provide the Fund with investment management related services for which the Fund does not pay a management fee. Under the management contract, the investment adviser or an affiliate pays all ordinary operating expenses of the Fund, except custody fees, fees and expenses of the independent Trustees, and certain miscellaneous expenses such as proxy and shareholder meeting expenses.
Brokerage Commissions. A portion of portfolio transactions were placed with brokerage firms which are affiliates of the investment adviser. Brokerage commissions are included in net realized gain (loss) and change in net unrealized appreciation (depreciation) in the Statement of Operations. The commissions paid to these affiliated firms were as follows:
| | Amount ($) |
| Fidelity Series Overseas Fund | 2,216 |
Interfund Lending Program. Pursuant to an Exemptive Order issued by the Securities and Exchange Commission (the SEC), the Fund, along with other registered investment companies having management contracts with Fidelity Management & Research Company LLC (FMR), or other affiliated entities of FMR, may participate in an interfund lending program. This program provides an alternative credit facility allowing the Fund to borrow from, or lend money to, other participating affiliated funds at rates that are beneficial to both the borrowing and lending fund. Borrowings under the program are generally for temporary or emergency purposes, including meeting fund shareholder redemptions. The interfund loan rate is determined, as specified in the Exemptive Order, by averaging, (1) the higher of the overnight time deposit rate and the current overnight repurchase agreement rate, and (2) a benchmark rate representing the lowest bank loan rate available to the funds. At period end, there were no interfund loans outstanding. Activity in this program during the period for which loans were outstanding was as follows:
| | Borrower or Lender | Average Loan Balance ($) | Weighted Average Interest Rate | Interest Expense ($) |
| Fidelity Series Overseas Fund | Borrower | 24,785,171 | 5.53% | 133,351 |
Interfund Trades. Funds may purchase from or sell securities to other Fidelity Funds under procedures adopted by the Board. The procedures have been designed to ensure these interfund trades are executed in accordance with Rule 17a-7 of the 1940 Act. Any interfund trades are included within the respective purchases and sales amounts shown in the Purchases and Sales of Investments note. Interfund trades during the period are noted in the table below.
| | Purchases ($) | Sales ($) | Realized Gain (Loss) ($) |
| Fidelity Series Overseas Fund | 150,787,403 | 142,354,150 | 23,078,540 |
Sub-Advisory Arrangements. Effective March 1, 2024, the Fund's sub-advisory agreements with FMR Investment Management (UK) Limited, Fidelity Management & Research (Hong Kong) Limited, and Fidelity Management & Research (Japan) Limited were amended to provide that the investment adviser pays each sub-adviser monthly fees equal to 110% of the sub-adviser's costs for providing sub-advisory services.
6. Committed Line of Credit.
Certain Funds participate with other funds managed by the investment adviser or an affiliate in a $4.25 billion credit facility (the "line of credit") to be utilized for temporary or emergency purposes to fund shareholder redemptions or for other short-term liquidity purposes. The commitment fees on the pro-rata portion of the line of credit are borne by the investment adviser. During the period, there were no borrowings on this line of credit.
7. Security Lending.
Funds lend portfolio securities from time to time in order to earn additional income. Lending agents are used, including National Financial Services (NFS), an affiliate of the investment adviser. Pursuant to a securities lending agreement, NFS will receive a fee, which is capped at 9.9% of a fund's daily lending revenue, for its services as lending agent. A fund may lend securities to certain qualified borrowers, including NFS. On the settlement date of the loan, a fund receives collateral (in the form of U.S. Treasury obligations, letters of credit and/or cash) against the loaned securities and maintains collateral in an amount not less than 100% of the market value of the loaned securities during the period of the loan. The market value of the loaned securities is determined at the close of business of a fund and any additional required collateral is delivered to a fund on the next business day. A fund or borrower may terminate the loan at any time, and if the borrower defaults on its obligation to return the securities loaned because of insolvency or other reasons, a fund may apply collateral received from the borrower against the obligation. A fund may experience delays and costs in recovering the securities loaned. Any cash collateral received is invested in the Fidelity Securities Lending Cash Central Fund. Any loaned securities are identified as such in the Schedule of Investments, and the value of loaned securities and cash collateral at period end, as applicable, are presented in the Statement of Assets and Liabilities. Security lending income represents the income earned on investing cash collateral, less rebates paid to borrowers and any lending agent fees associated with the loan, plus any premium payments received for lending certain types of securities. Security lending income is presented in the Statement of Operations as a component of income from Fidelity Central Funds. Affiliated security lending activity, if any, was as follows:
| | Total Security Lending Fees Paid to NFS ($) | Security Lending Income From Securities Loaned to NFS ($) | Value of Securities Loaned to NFS at Period End ($) |
| Fidelity Series Overseas Fund | 22,207 | - | - |
8. Bank Borrowings.
The Fund is permitted to have bank borrowings for temporary or emergency purposes to fund shareholder redemptions or for other short-term liquidity requirements. The Fund has established borrowing arrangements with certain banks. The interest rate on the borrowings is the bank's base rate, as revised from time to time. Any open loans, including accrued interest, at period end are presented under the caption "Notes payable" in the Statement of Assets and Liabilities, if applicable. Activity in this program during the period for which loans were outstanding was as follows:
| | Average Loan Balance ($) | Weighted Average Interest Rate | Interest Expense ($) |
| Fidelity Series Overseas Fund | 6,602,000 | 5.83% | 4,277 |
9. Expense Reductions.
Through arrangements with the Fund's custodian, credits realized as a result of certain uninvested cash balances were used to reduce the Fund's expenses by $1,142.
10. Other.
A fund's organizational documents provide former and current trustees and officers with a limited indemnification against liabilities arising in connection with the performance of their duties to the fund. In the normal course of business, a fund may also enter into contracts that provide general indemnifications. A fund's maximum exposure under these arrangements is unknown as this would be dependent on future claims that may be made against a fund. The risk of material loss from such claims is considered remote.
At the end of the period, mutual funds and accounts managed by the investment adviser or its affiliates were the owners of record of all of the outstanding shares of the Fund.
11. Risk and Uncertainties.
Many factors affect a fund's performance. Developments that disrupt global economies and financial markets, such as pandemics, epidemics, outbreaks of infectious diseases, war, terrorism, and environmental disasters, may significantly affect a fund's investment performance. The effects of these developments to a fund will be impacted by the types of securities in which a fund invests, the financial condition, industry, economic sector, and geographic location of an issuer, and a fund's level of investment in the securities of that issuer. Significant concentrations in security types, issuers, industries, sectors, and geographic locations may magnify the factors that affect a fund's performance.
Report of Independent Registered Public Accounting Firm
To the Board of Trustees of Fidelity Investment Trust and the Shareholders of Fidelity Series Overseas Fund:
Opinion on the Financial Statements and Financial Highlights
We have audited the accompanying statement of assets and liabilities of Fidelity Series Overseas Fund (the "Fund"), a fund of Fidelity Investment Trust, including the schedule of investments, as of October 31, 2024, the related statement of operations for the year then ended, the statement of changes in net assets for each of the two years in the period then ended, the financial highlights for each of the five years in the period then ended, and the related notes. In our opinion, the financial statements and financial highlights present fairly, in all material respects, the financial position of the Fund as of October 31, 2024, and the results of its operations for the year then ended, the changes in its net assets for each of the two years in the period then ended, and the financial highlights for each of the five years in the period then ended in conformity with accounting principles generally accepted in the United States of America.
Basis for Opinion
These financial statements and financial highlights are the responsibility of the Fund's management. Our responsibility is to express an opinion on the Fund's financial statements and financial highlights based on our audits. We are a public accounting firm registered with the Public Company Accounting Oversight Board (United States) (PCAOB) and are required to be independent with respect to the Fund in accordance with the U.S. federal securities laws and the applicable rules and regulations of the Securities and Exchange Commission and the PCAOB.
We conducted our audits in accordance with the standards of the PCAOB. Those standards require that we plan and perform the audit to obtain reasonable assurance about whether the financial statements and financial highlights are free of material misstatement, whether due to error or fraud. The Fund is not required to have, nor were we engaged to perform, an audit of its internal control over financial reporting. As part of our audits, we are required to obtain an understanding of internal control over financial reporting but not for the purpose of expressing an opinion on the effectiveness of the Fund's internal control over financial reporting. Accordingly, we express no such opinion.
Our audits included performing procedures to assess the risks of material misstatement of the financial statements and financial highlights, whether due to error or fraud, and performing procedures that respond to those risks. Such procedures included examining, on a test basis, evidence regarding the amounts and disclosures in the financial statements and financial highlights. Our audits also included evaluating the accounting principles used and significant estimates made by management, as well as evaluating the overall presentation of the financial statements and financial highlights. Our procedures included confirmation of securities owned as of October 31, 2024, by correspondence with the custodian and brokers; when replies were not received from brokers, we performed other auditing procedures. We believe that our audits provide a reasonable basis for our opinion.
/s/ Deloitte & Touche LLP
Boston, Massachusetts
December 17, 2024
We have served as the auditor of one or more of the Fidelity investment companies since 1999.
Distributions
(Unaudited)
The dividend and capital gains distributions for the fund(s) are available on Fidelity.com or Institutional.Fidelity.com.
The fund designates $9,130,268 of distributions paid during the fiscal year ended 2024 as qualifying to be taxed as section 163(j) interest dividends.
The fund designates 2% of the dividend distributed during the fiscal year as qualifying for the dividends-received deduction for corporate shareholders.
The fund designates 93.19% of the dividend distributed during the fiscal year as amounts which may be taken into account as a dividend for the purposes of the maximum rate under section 1(h)(11) of the Internal Revenue Code.
The amounts per share which represent income derived from sources within, and taxes paid to, foreign countries or possessions of the United States are $0.2201 and $.0.0215 for the dividend paid December 11, 2023.
The fund will notify shareholders in January 2025 of amounts for use in preparing 2024 income tax returns.
Item 8: Changes in and Disagreements with Accountants for Open-End Management Investment Companies
(Unaudited)
Note: This is not applicable for any fund included in this document.
Item 9: Proxy Disclosures for Open-End Management Investment Companies
(Unaudited)
| A special meeting of shareholders was held on July 16, 2024. The results of votes taken among shareholders on the proposal before them are reported below. Each vote reported represents one dollar of net asset value held on the record date for the meeting. |
| Proposal 1 |
| To elect a Board of Trustees. |
| | # of Votes | % of Votes |
| Bettina Doulton |
| Affirmative | 128,529,177,643.56 | 98.18 |
| Withheld | 2,378,037,364.30 | 1.82 |
| TOTAL | 130,907,215,007.85 | 100.00 |
| Robert A. Lawrence |
| Affirmative | 128,253,389,899.05 | 97.97 |
| Withheld | 2,653,825,108.81 | 2.03 |
| TOTAL | 130,907,215,007.85 | 100.00 |
| Vijay C. Advani |
| Affirmative | 128,531,418,228.19 | 98.19 |
| Withheld | 2,375,796,779.66 | 1.81 |
| TOTAL | 130,907,215,007.85 | 100.00 |
| Thomas P. Bostick |
| Affirmative | 128,495,261,591.41 | 98.16 |
| Withheld | 2,411,953,416.44 | 1.84 |
| TOTAL | 130,907,215,007.85 | 100.00 |
| Donald F. Donahue |
| Affirmative | 128,407,878,996.00 | 98.09 |
| Withheld | 2,499,336,011.85 | 1.91 |
| TOTAL | 130,907,215,007.85 | 100.00 |
| Vicki L. Fuller |
| Affirmative | 128,625,540,095.19 | 98.26 |
| Withheld | 2,281,674,912.66 | 1.74 |
| TOTAL | 130,907,215,007.85 | 100.00 |
| Patricia L. Kampling |
| Affirmative | 128,668,729,281.34 | 98.29 |
| Withheld | 2,238,485,726.51 | 1.71 |
| TOTAL | 130,907,215,007.85 | 100.00 |
| Thomas A. Kennedy |
| Affirmative | 128,499,824,239.79 | 98.16 |
| Withheld | 2,407,390,768.06 | 1.84 |
| TOTAL | 130,907,215,007.85 | 100.00 |
| Oscar Munoz |
| Affirmative | 128,386,109,391.05 | 98.07 |
| Withheld | 2,521,105,616.80 | 1.93 |
| TOTAL | 130,907,215,007.85 | 100.00 |
| Karen B. Peetz |
| Affirmative | 128,603,731,113.82 | 98.24 |
| Withheld | 2,303,483,894.03 | 1.76 |
| TOTAL | 130,907,215,007.85 | 100.00 |
| David M. Thomas |
| Affirmative | 128,384,899,342.98 | 98.07 |
| Withheld | 2,522,315,664.88 | 1.93 |
| TOTAL | 130,907,215,007.85 | 100.00 |
| Susan Tomasky |
| Affirmative | 128,556,148,461.60 | 98.20 |
| Withheld | 2,351,066,546.25 | 1.80 |
| TOTAL | 130,907,215,007.85 | 100.00 |
| Michael E. Wiley |
| Affirmative | 128,264,934,978.34 | 97.98 |
| Withheld | 2,642,280,029.51 | 2.02 |
| TOTAL | 130,907,215,007.85 | 100.00 |
| | | |
| Proposal 1 reflects trust-wide proposal and voting results. |
Item 10: Remuneration Paid to Directors, Officers, and others of Open-End Management Investment Companies
(Unaudited)
Note: This information is disclosed as part of the financial statements for each Fund as part of Item 7: Financial Statements and Financial Highlights for Open-End Management Investment companies.
Item 11: Statement Regarding Basis for Approval of Investment Advisory Contract
(Unaudited)
Board Approval of Investment Advisory Contracts and Management Fees
Fidelity Series Overseas Fund
Each year, the Board of Trustees, including the Independent Trustees (together, the Board), considers the renewal of the fund's management contract with Fidelity Management & Research Company LLC (FMR) and the sub-advisory agreements (together, the Advisory Contracts) for the fund. FMR and the sub-advisers are referred to herein as the Investment Advisers. The Board, assisted by the advice of fund counsel and Independent Trustees' counsel, requests and considers a broad range of information relevant to the renewal of the Advisory Contracts throughout the year.
The Board meets regularly and, at each of its meetings, covers an extensive agenda of topics and materials and considers factors that are relevant to its annual consideration of the renewal of the fund's Advisory Contracts, including the services and support provided to the fund and its shareholders. The Board, acting directly and through its Committees (each of which is composed of and chaired by Independent Trustees), requests and receives information concerning the annual consideration of the renewal of the fund's Advisory Contracts. The Board also meets as needed to review matters specifically related to the Board's annual consideration of the renewal of the Advisory Contracts. Members of the Board may also meet with trustees of other Fidelity funds through joint ad hoc committees to discuss certain matters relevant to all of the Fidelity funds.
At its May 2024 meeting, the Board unanimously determined to renew the fund's Advisory Contracts. The Board considered all factors it believed relevant and reached a determination, with the assistance of fund counsel and Independent Trustees' counsel and through the exercise of its business judgment, that the renewal of the Advisory Contracts was in the best interests of the fund and its shareholders and the fact that no fee is payable under the management contract was fair and reasonable in light of all of the surrounding circumstances.
Nature, Extent, and Quality of Services Provided. The Board considered staffing as it relates to the fund, including the backgrounds and experience of investment personnel of the Investment Advisers, and also considered the Investment Advisers' implementation of the fund's investment program. The Independent Trustees also had discussions with senior management of Fidelity's investment operations and investment groups. The Board considered the structure of the investment personnel compensation program and whether this structure provides appropriate incentives to act in the best interests of the fund.
Resources Dedicated to Investment Management and Support Services. The Board and the Fund Oversight and Research Committees reviewed the general qualifications and capabilities of Fidelity's investment staff, including its size, education, experience, and resources, as well as Fidelity's approach to recruiting, training, managing, and compensating investment personnel. The Board noted the resources devoted to expansion of Fidelity's global investment organization, and that Fidelity's analysts have extensive resources, tools, and capabilities that allow them to conduct sophisticated quantitative and fundamental analysis, as well as credit analysis of issuers, counterparties, and guarantors. Further, the Board considered that Fidelity's investment professionals have sufficient access to global information and data so as to provide competitive investment results over time, and that those professionals also have access to sophisticated tools that permit them to assess portfolio construction and risk and performance attribution characteristics continuously, as well as to transmit new information and research conclusions rapidly around the world. Additionally, in its deliberations, the Board considered Fidelity's trading, risk management, compliance, and technology and operations capabilities and resources, which are integral parts of the investment management process.
Administrative Services. The Board considered (i) the nature, extent, quality, and cost of advisory and administrative services performed by the Investment Advisers and their affiliates under the Advisory Contracts and under separate agreements covering transfer agency and pricing and bookkeeping services for the fund; (ii) the nature and extent of Fidelity's supervision of third party service providers, principally custodians, subcustodians, and pricing vendors; and (iii) the resources devoted by Fidelity to, and the record of compliance with, the fund's compliance policies and procedures. The Board also reviewed the allocation of fund brokerage, including allocations to brokers affiliated with the Investment Advisers, the use of brokerage commissions to pay fund expenses, and the use of "soft" commission dollars to pay for research services. The Board also considered the fund's securities lending activities and any payments made to Fidelity relating to securities lending under a separate agreement.
Investment Performance. The Board reviewed the fund's absolute investment performance, as well as the fund's relative investment performance and noted that the fund is not publicly offered as a stand-alone investment product. In this regard, the Board noted that the fund is designed to offer an investment option for other investment companies, 529 plans, and collective investment trusts managed by Fidelity and ultimately to enhance the performance of those investment companies, 529 plans, and collective investment trusts.
Based on its review, the Board concluded that the nature, extent, and quality of services provided to the fund under the Advisory Contracts should continue to benefit the shareholders of the fund.
Competitiveness of Management Fee and Total Expense Ratio. The Board considered that the fund does not pay FMR a management fee for investment advisory services, but that FMR receives fees for providing services to funds that invest in the fund. The Board noted that FMR or an affiliate undertakes to pay all operating expenses of the fund, except transfer agent fees, 12b-1 fees, Independent Trustee fees and expenses, custodian fees and expenses, proxy and shareholder meeting expenses, interest, taxes, and extraordinary expenses (such as litigation expenses). The Board further noted that the fund pays its non-operating expenses, including brokerage commissions and fees and expenses associated with the fund's securities lending program, if applicable.
The Board further considered that FMR has contractually agreed to reimburse the fund to the extent that total operating expenses, with certain exceptions, as a percentage of its average net assets, exceed 0.013% through February 28, 2027.
Based on its review, the Board considered that the fund does not pay a management fee and concluded that the total expense ratio of the fund was reasonable in light of the services that the fund and its shareholders receive and the other factors considered.
Costs of the Services and Profitability. The Board considered the level of Fidelity's profits in respect of all the Fidelity funds.
A public accounting firm has been engaged annually by the Board as part of the Board's assessment of Fidelity's profitability analysis. The engagement includes the review and assessment of the methodologies used by Fidelity in determining the revenues and expenses attributable to Fidelity's fund business, and completion of agreed-upon procedures in respect of the mathematical accuracy of certain fund profitability information and its conformity to established allocation methodologies. After considering the reports issued under the engagement and information provided by Fidelity, the Board concluded that while other allocation methods may also be reasonable, Fidelity's profitability methodologies are reasonable in all material respects.
The Board also reviewed Fidelity's non-fund businesses and potential indirect benefits such businesses may have received as a result of their association with Fidelity's fund business (i.e., fall-out benefits) as well as cases where Fidelity's affiliates may benefit from the funds' business. The Board considered areas where potential indirect benefits to the Fidelity funds from their relationships with Fidelity may exist. The Board's consideration of these matters was informed by the findings of a joint ad hoc committee created by it and the boards of other Fidelity funds to evaluate potential fall-out benefits.
The Board concluded that the costs of the services provided by and the profits realized by Fidelity in connection with the operation of the fund were not relevant to the renewal of the Advisory Contracts because the fund pays no advisory fees and FMR bears all expenses of the fund with certain exceptions.
Economies of Scale. The Board concluded that because the fund pays no advisory fees and FMR bears all expenses of the fund with certain exceptions, the realization of economies of scale was not a material factor in the Board's decision to renew the fund's Advisory Contracts.
Additional Information Requested by the Board. In order to develop fully the factual basis for consideration of the Fidelity funds' advisory contracts, the Board requested and received additional information on certain topics, including but not limited to: (i) fund flow and performance trends, in particular the underperformance of certain funds and strategies, and Fidelity's long-term strategies for certain funds; (ii) the operation of performance fees and the rationale for implementing performance fees on certain categories of funds but not others; (iii) Fidelity's pricing philosophy compared to competitors; (iv) fund profitability methodology and data; (v) evaluation of competitive fund data and peer group classifications and fee and expense comparisons; (vi) the management fee and expense structures for different funds and classes and information about the differences between various fee and expense structures; (vii) the variable management fee implemented for certain funds effective March 1, 2024; and (viii) information regarding other accounts managed by Fidelity and the funds' sub-advisory arrangements.
Conclusion. Based on its evaluation of all of the conclusions noted above, and after considering all factors it believed relevant, the Board, including the Independent Trustees, concluded that the advisory and sub-advisory fee arrangements are fair and reasonable in light of all of the surrounding circumstances and that the fund's Advisory Contracts should be renewed through May 31, 2025.
1.9894003.105
SOV-ANN-1224
Fidelity® SAI Sustainable International Equity Fund
Annual Report
October 31, 2024
Offered exclusively to certain clients of the Adviser, or its affiliates, including Strategic Advisers LLC (Strategic Advisers) - not available for sale to the general public. Fidelity® SAI is a product name of Fidelity® funds dedicated to certain programs affiliated with Strategic Advisers.
Contents
To view a fund's proxy voting guidelines and proxy voting record for the 12-month period ended June 30, visit http://www.fidelity.com/proxyvotingresults or visit the Securities and Exchange Commission's (SEC) web site at http://www.sec.gov.
You may also call 1-800-544-3455 to request a free copy of the proxy voting guidelines.
Standard & Poor's, S&P and S&P 500 are registered service marks of The McGraw-Hill Companies, Inc. and have been licensed for use by Fidelity Distributors Corporation.
Other third-party marks appearing herein are the property of their respective owners.
All other marks appearing herein are registered or unregistered trademarks or service marks of FMR LLC or an affiliated company. © 2024 FMR LLC. All rights reserved.
This report and the financial statements contained herein are submitted for the general information of the shareholders of the Fund. This report is not authorized for distribution to prospective investors in the Fund unless preceded or accompanied by an effective prospectus.
A fund files its complete schedule of portfolio holdings with the SEC for the first and third quarters of each fiscal year on Form N-PORT. Forms N-PORT are available on the SEC's web site at http://www.sec.gov. A fund's Forms N-PORT may be reviewed and copied at the SEC's Public Reference Room in Washington, DC. Information regarding the operation of the SEC's Public Reference Room may be obtained by calling 1-800-SEC-0330.
For a complete list of a fund's portfolio holdings, view the most recent holdings listing, semiannual report, or annual report on Fidelity's web site at http://www.fidelity.com, http://www.institutional.fidelity.com, or http://www.401k.com, as applicable.
NOT FDIC INSURED •MAY LOSE VALUE •NO BANK GUARANTEE
Neither the Fund nor Fidelity Distributors Corporation is a bank.
Item 7: Financial Statements and Financial Highlights for Open-End Management Investment Companies (Annual Report)
Fidelity® SAI Sustainable International Equity Fund
Schedule of Investments October 31, 2024
Showing Percentage of Net Assets
| Common Stocks - 96.8% |
| | | Shares | Value ($) |
| Australia - 3.6% | | | |
| Brambles Ltd. | | 39,925 | 480,698 |
| IperionX Ltd. (a) | | 135,013 | 290,953 |
| Macquarie Group Ltd. | | 5,600 | 847,540 |
| QBE Insurance Group Ltd. | | 47,385 | 534,982 |
TOTAL AUSTRALIA | | | 2,154,173 |
| Austria - 0.8% | | | |
| Wienerberger AG | | 15,731 | 473,986 |
| Belgium - 2.3% | | | |
| KBC Group NV | | 4,840 | 351,051 |
| UCB SA | | 5,328 | 1,024,650 |
TOTAL BELGIUM | | | 1,375,701 |
| Canada - 0.5% | | | |
| Alimentation Couche-Tard, Inc. (multi-vtg.) | | 5,787 | 301,788 |
| Denmark - 5.1% | | | |
| Novo Nordisk A/S Series B | | 23,218 | 2,604,245 |
| Tryg A/S | | 11,968 | 281,846 |
| Vestas Wind Systems A/S (a) | | 6,542 | 124,673 |
TOTAL DENMARK | | | 3,010,764 |
| France - 9.7% | | | |
| Air Liquide SA | | 3,664 | 656,960 |
| Amundi SA (b) | | 9,319 | 674,093 |
| AXA SA | | 34,863 | 1,309,075 |
| BNP Paribas SA | | 9,341 | 637,935 |
| Danone SA | | 6,352 | 453,778 |
| EssilorLuxottica SA | | 2,298 | 538,425 |
| Hermes International SCA | | 384 | 866,302 |
| L'Oreal SA | | 1,164 | 436,698 |
| LVMH Moet Hennessy Louis Vuitton SE | | 280 | 186,402 |
TOTAL FRANCE | | | 5,759,668 |
| Germany - 6.7% | | | |
| adidas AG | | 1,854 | 444,017 |
| Deutsche Post AG ADR | | 10,279 | 412,903 |
| Gerresheimer AG | | 1,160 | 97,789 |
| Instone Real Estate Group BV (b) | | 39,980 | 356,604 |
| Merck KGaA | | 5,737 | 948,544 |
| Muenchener Rueckversicherungs-Gesellschaft AG in Muenchen | | 1,497 | 765,536 |
| SAP SE | | 2,507 | 585,347 |
| Siemens AG | | 1,762 | 342,797 |
TOTAL GERMANY | | | 3,953,537 |
| Hong Kong - 1.8% | | | |
| AIA Group Ltd. | | 136,352 | 1,076,133 |
| India - 1.0% | | | |
| HDFC Bank Ltd. sponsored ADR | | 8,842 | 557,311 |
| Ireland - 1.2% | | | |
| Dalata Hotel Group PLC | | 20,291 | 94,466 |
| Kingspan Group PLC (Ireland) | | 7,070 | 620,230 |
TOTAL IRELAND | | | 714,696 |
| Italy - 3.8% | | | |
| Prysmian SpA | | 11,815 | 833,051 |
| UniCredit SpA | | 31,994 | 1,415,389 |
TOTAL ITALY | | | 2,248,440 |
| Japan - 21.5% | | | |
| Fast Retailing Co. Ltd. | | 1,964 | 627,933 |
| Fuji Electric Co. Ltd. | | 5,282 | 269,001 |
| Hitachi Ltd. | | 101,840 | 2,558,716 |
| Hoya Corp. | | 7,010 | 937,896 |
| Itochu Corp. | | 41,461 | 2,050,986 |
| Net One Systems Co. Ltd. | | 27,453 | 666,527 |
| ORIX Corp. | | 78,485 | 1,653,670 |
| Pan Pacific International Holdings Ltd. | | 12 | 298 |
| Recruit Holdings Co. Ltd. | | 14,206 | 867,454 |
| Renesas Electronics Corp. | | 10,004 | 134,037 |
| Sony Group Corp. | | 86,976 | 1,530,562 |
| Sumitomo Mitsui Financial Group, Inc. | | 48,756 | 1,034,336 |
| Tokio Marine Holdings, Inc. | | 11,541 | 415,663 |
TOTAL JAPAN | | | 12,747,079 |
| Korea (South) - 0.4% | | | |
| SK Hynix, Inc. | | 1,947 | 255,724 |
| Netherlands - 8.3% | | | |
| ASML Holding NV (Netherlands) | | 2,315 | 1,564,269 |
| BE Semiconductor Industries NV | | 1,320 | 140,625 |
| ING Groep NV (Certificaten Van Aandelen) | | 61,372 | 1,041,507 |
| Koninklijke KPN NV | | 318,921 | 1,246,434 |
| Wolters Kluwer NV | | 5,414 | 911,040 |
TOTAL NETHERLANDS | | | 4,903,875 |
| New Zealand - 1.0% | | | |
| Contact Energy Ltd. | | 117,297 | 596,811 |
| Spain - 1.6% | | | |
| CaixaBank SA | | 49,409 | 301,087 |
| EDP Renovaveis SA | | 1,657 | 22,314 |
| Iberdrola SA | | 39,755 | 590,058 |
| Puig Brands SA Class B | | 2,033 | 46,882 |
TOTAL SPAIN | | | 960,341 |
| Sweden - 2.3% | | | |
| ASSA ABLOY AB (B Shares) | | 14,135 | 442,747 |
| Investor AB (B Shares) | | 23,745 | 671,819 |
| Lagercrantz Group AB (B Shares) | | 12,703 | 247,752 |
TOTAL SWEDEN | | | 1,362,318 |
| Switzerland - 0.8% | | | |
| Compagnie Financiere Richemont SA Series A | | 3,137 | 456,749 |
| Taiwan - 2.4% | | | |
| Taiwan Semiconductor Manufacturing Co. Ltd. | | 45,456 | 1,430,119 |
| United Kingdom - 14.0% | | | |
| 3i Group PLC | | 13,444 | 551,308 |
| AstraZeneca PLC (United Kingdom) | | 8,902 | 1,266,698 |
| Bellway PLC | | 19,697 | 720,296 |
| Berkeley Group Holdings PLC | | 10,570 | 603,175 |
| Big Yellow Group PLC | | 7,591 | 118,242 |
| Compass Group PLC | | 28,560 | 927,527 |
| Direct Line Insurance Group PLC | | 137,323 | 290,928 |
| Grainger Trust PLC | | 73,129 | 214,052 |
| London Stock Exchange Group PLC | | 4,624 | 626,718 |
| National Grid PLC | | 45,257 | 568,254 |
| RELX PLC (London Stock Exchange) | | 15,424 | 707,340 |
| Renewi PLC | | 13,947 | 109,342 |
| Sage Group PLC | | 12,003 | 150,037 |
| Unilever PLC | | 23,333 | 1,423,360 |
TOTAL UNITED KINGDOM | | | 8,277,277 |
| United States of America - 8.0% | | | |
| Alcon, Inc. (Switzerland) | | 2,170 | 199,975 |
| CRH PLC | | 17,826 | 1,699,565 |
| Ferguson Enterprises, Inc. | | 2,869 | 566,753 |
| Linde PLC | | 1,612 | 735,314 |
| Schneider Electric SA | | 5,880 | 1,523,207 |
TOTAL UNITED STATES OF AMERICA | | | 4,724,814 |
| TOTAL COMMON STOCKS (Cost $53,257,435) | | | 57,341,304 |
| | | | |
| Money Market Funds - 4.8% |
| | | Shares | Value ($) |
Fidelity Cash Central Fund 4.87% (c) (Cost $2,884,419) | | 2,883,842 | 2,884,419 |
| | | | |
| TOTAL INVESTMENT IN SECURITIES - 101.6% (Cost $56,141,854) | 60,225,723 |
NET OTHER ASSETS (LIABILITIES) - (1.6)% | (974,251) |
| NET ASSETS - 100.0% | 59,251,472 |
| | |
Legend
| (b) | Security exempt from registration under Rule 144A of the Securities Act of 1933. These securities may be resold in transactions exempt from registration, normally to qualified institutional buyers. At the end of the period, the value of these securities amounted to $1,030,697 or 1.7% of net assets. |
| (c) | Affiliated fund that is generally available only to investment companies and other accounts managed by Fidelity Investments. The rate quoted is the annualized seven-day yield of the fund at period end. A complete unaudited listing of the fund's holdings as of its most recent quarter end is available upon request. In addition, each Fidelity Central Fund's financial statements, which are not covered by the Fund's Report of Independent Registered Public Accounting Firm, are available on the SEC's website or upon request. |
Affiliated Central Funds
Fiscal year to date information regarding the Fund's investments in Fidelity Central Funds, including the ownership percentage, is presented below.
| Affiliate | Value, beginning of period ($) | Purchases ($) | Sales Proceeds ($) | Dividend Income ($) | Realized Gain (loss) ($) | Change in Unrealized appreciation (depreciation) ($) | Value, end of period ($) | % ownership, end of period |
| Fidelity Cash Central Fund 4.87% | 712,258 | 27,076,720 | 24,904,539 | 80,855 | (20) | - | 2,884,419 | 0.0% |
| Total | 712,258 | 27,076,720 | 24,904,539 | 80,855 | (20) | - | 2,884,419 | |
| | | | | | | | | |
Amounts in the dividend income column in the above table include any capital gain distributions from underlying funds, which are presented in the corresponding line item in the Statement of Operations, if applicable.
Amounts included in the purchases and sales proceeds columns may include in-kind transactions, if applicable.
Investment Valuation
The following is a summary of the inputs used, as of October 31, 2024, involving the Fund's assets and liabilities carried at fair value. The inputs or methodology used for valuing securities may not be an indication of the risk associated with investing in those securities. For more information on valuation inputs, and their aggregation into the levels used below, please refer to the Investment Valuation section in the accompanying Notes to Financial Statements.
| Valuation Inputs at Reporting Date: |
| Description | Total ($) | Level 1 ($) | Level 2 ($) | Level 3 ($) |
Investments in Securities: | | | | |
|
| Equities: | | | | |
Communication Services | 1,246,434 | 1,246,434 | - | - |
Consumer Discretionary | 6,457,727 | 1,681,064 | 4,776,663 | - |
Consumer Staples | 2,662,506 | 348,670 | 2,313,836 | - |
Financials | 15,037,927 | 4,136,123 | 10,901,804 | - |
Health Care | 7,618,222 | 2,809,383 | 4,808,839 | - |
Industrials | 12,820,938 | 3,040,416 | 9,780,522 | - |
Information Technology | 5,174,437 | 2,102,683 | 3,071,754 | - |
Materials | 3,856,778 | 2,908,865 | 947,913 | - |
Real Estate | 688,898 | 688,898 | - | - |
Utilities | 1,777,437 | 612,372 | 1,165,065 | - |
|
| Money Market Funds | 2,884,419 | 2,884,419 | - | - |
| Total Investments in Securities: | 60,225,723 | 22,459,327 | 37,766,396 | - |
Financial Statements
| Statement of Assets and Liabilities |
As of October 31, 2024 |
| Assets | | | | |
| Investment in securities, at value - See accompanying schedule: | | | | |
Unaffiliated issuers (cost $53,257,435) | $ | 57,341,304 | | |
Fidelity Central Funds (cost $2,884,419) | | 2,884,419 | | |
| | | | | |
| | | | | |
| Total Investment in Securities (cost $56,141,854) | | | $ | 60,225,723 |
| Foreign currency held at value (cost $345) | | | | 344 |
| Receivable for fund shares sold | | | | 142,546 |
| Dividends receivable | | | | 100,731 |
| Reclaims receivable | | | | 44,635 |
| Distributions receivable from Fidelity Central Funds | | | | 9,661 |
| Prepaid expenses | | | | 53 |
| Receivable from investment adviser for expense reductions | | | | 2,501 |
Total assets | | | | 60,526,194 |
| Liabilities | | | | |
| Payable for investments purchased | $ | 1,122,817 | | |
| Payable for fund shares redeemed | | 64,450 | | |
| Accrued management fee | | 31,149 | | |
| Other payables and accrued expenses | | 56,306 | | |
| Total liabilities | | | | 1,274,722 |
| Net Assets | | | $ | 59,251,472 |
| Net Assets consist of: | | | | |
| Paid in capital | | | $ | 55,481,320 |
| Total accumulated earnings (loss) | | | | 3,770,152 |
| Net Assets | | | $ | 59,251,472 |
Net Asset Value, offering price and redemption price per share ($59,251,472 ÷ 5,398,117 shares) | | | $ | 10.98 |
| Statement of Operations |
| Year ended October 31, 2024 |
| Investment Income | | | | |
| Dividends | | | $ | 922,336 |
| Interest | | | | 163 |
| Income from Fidelity Central Funds | | | | 80,855 |
| Income before foreign taxes withheld | | | $ | 1,003,354 |
| Less foreign taxes withheld | | | | (82,412) |
| Total income | | | | 920,942 |
| Expenses | | | | |
| Management fee | $ | 230,169 | | |
| Custodian fees and expenses | | 54,181 | | |
| Independent trustees' fees and expenses | | 124 | | |
| Registration fees | | 23,482 | | |
| Audit fees | | 57,411 | | |
| Legal | | 15 | | |
| Miscellaneous | | 895 | | |
| Total expenses before reductions | | 366,277 | | |
| Expense reductions | | (100,384) | | |
| Total expenses after reductions | | | | 265,893 |
| Net Investment income (loss) | | | | 655,049 |
| Realized and Unrealized Gain (Loss) | | | | |
| Net realized gain (loss) on: | | | | |
| Investment Securities: | | | | |
| Unaffiliated issuers | | (626,256) | | |
| Fidelity Central Funds | | (20) | | |
| Foreign currency transactions | | (7,267) | | |
| Total net realized gain (loss) | | | | (633,543) |
| Change in net unrealized appreciation (depreciation) on: | | | | |
| Investment Securities: | | | | |
| Unaffiliated issuers | | 4,419,833 | | |
| Assets and liabilities in foreign currencies | | (5,272) | | |
| Total change in net unrealized appreciation (depreciation) | | | | 4,414,561 |
| Net gain (loss) | | | | 3,781,018 |
| Net increase (decrease) in net assets resulting from operations | | | $ | 4,436,067 |
| Statement of Changes in Net Assets |
| |
| | Year ended October 31, 2024 | | Year ended October 31, 2023 |
| Increase (Decrease) in Net Assets | | | | |
| Operations | | | | |
| Net investment income (loss) | $ | 655,049 | $ | 85,246 |
| Net realized gain (loss) | | (633,543) | | (148,535) |
| Change in net unrealized appreciation (depreciation) | | 4,414,561 | | (15,876) |
| Net increase (decrease) in net assets resulting from operations | | 4,436,067 | | (79,165) |
| Distributions to shareholders | | (117,788) | | (17,379) |
| | | | | |
| Share transactions | | | | |
| Proceeds from sales of shares | | 52,460,375 | | 8,192,591 |
| Reinvestment of distributions | | 98,381 | | 16,766 |
| Cost of shares redeemed | | (7,330,520) | | (593,538) |
| | | | | |
Net increase (decrease) in net assets resulting from share transactions | | 45,228,236 | | 7,615,819 |
| Total increase (decrease) in net assets | | 49,546,515 | | 7,519,275 |
| | | | | |
| Net Assets | | | | |
| Beginning of period | | 9,704,957 | | 2,185,682 |
| End of period | $ | 59,251,472 | $ | 9,704,957 |
| | | | | |
| Other Information | | | | |
| Shares | | | | |
| Sold | | 4,968,846 | | 892,144 |
| Issued in reinvestment of distributions | | 10,323 | | 1,851 |
| Redeemed | | (681,881) | | (64,420) |
| Net increase (decrease) | | 4,297,288 | | 829,575 |
| | | | | |
Financial Highlights
Fidelity® SAI Sustainable International Equity Fund |
| |
| Years ended October 31, | | 2024 | | 2023 | | 2022 A |
Selected Per-Share Data | | | | | | |
| Net asset value, beginning of period | $ | 8.82 | $ | 8.06 | $ | 10.00 |
| Income from Investment Operations | | | | | | |
Net investment income (loss) B,C | | .20 | | .17 | | .08 |
| Net realized and unrealized gain (loss) | | 2.03 | | .65 D | | (2.02) |
| Total from investment operations | | 2.23 | | .82 | | (1.94) |
| Distributions from net investment income | | (.07) | | (.06) | | - |
| Total distributions | | (.07) | | (.06) | | - |
| Net asset value, end of period | $ | 10.98 | $ | 8.82 | $ | 8.06 |
Total Return E,F | | | | 10.12% | | (19.40)% |
Ratios to Average Net Assets C,G,H | | | | | | |
| Expenses before reductions | | 1.03% | | 3.13% | | 5.78% I,J |
| Expenses net of fee waivers, if any | | | | .75% | | .75% I |
| Expenses net of all reductions | | .75% | | .73% | | .68% I |
| Net investment income (loss) | | 1.84% | | 1.84% | | 1.79% I |
| Supplemental Data | | | | | | |
| Net assets, end of period (000 omitted) | $ | 59,251 | $ | 9,705 | $ | 2,186 |
Portfolio turnover rate K | | | | 27% | | 51% I |
AFor the period April 14, 2022 (commencement of operations) through October 31, 2022.
BCalculated based on average shares outstanding during the period.
CNet investment income (loss) is affected by the timing of the declaration of dividends by any underlying mutual funds or exchange-traded funds (ETFs). Net investment income (loss) of any mutual funds or ETFs is not included in the Fund's net investment income (loss) ratio.
DThe amount shown for a share outstanding does not correspond with the aggregate net gain (loss) on investments for the period due to the timing of sales and repurchases of shares in relation to fluctuating market values of the investments of the Fund.
ETotal returns for periods of less than one year are not annualized.
FTotal returns would have been lower if certain expenses had not been reduced during the applicable periods shown.
GFees and expenses of any underlying mutual funds or exchange-traded funds (ETFs) are not included in the Fund's expense ratio. The Fund indirectly bears its proportionate share of these expenses. For additional expense information related to investments in Fidelity Central Funds, please refer to the "Investments in Fidelity Central Funds" note found in the Notes to Financial Statements section of the most recent Annual or Semi-Annual report.
HExpense ratios reflect operating expenses of the class. Expenses before reductions do not reflect amounts reimbursed, waived, or reduced through arrangements with the investment adviser, brokerage services, or other offset arrangements, if applicable, and do not represent the amount paid by the class during periods when reimbursements, waivers or reductions occur.
IAnnualized.
JAudit fees are not annualized.
KAmount does not include the portfolio activity of any underlying mutual funds or exchange-traded funds (ETFs).
Notes to Financial Statements
For the period ended October 31, 2024
1. Organization.
Fidelity SAI Sustainable International Equity Fund (the Fund) is a fund of Fidelity Investment Trust (the Trust) and is authorized to issue an unlimited number of shares. Shares are offered exclusively to certain clients of Fidelity Management & Research Company LLC (FMR) or its affiliates. The Trust is registered under the Investment Company Act of 1940, as amended (the 1940 Act), as an open-end management investment company organized as a Massachusetts business trust.
2. Investments in Fidelity Central Funds.
Funds may invest in Fidelity Central Funds, which are open-end investment companies generally available only to other investment companies and accounts managed by the investment adviser and its affiliates. The Schedule of Investments lists any Fidelity Central Funds held as an investment as of period end, but does not include the underlying holdings of each Fidelity Central Fund. An investing fund indirectly bears its proportionate share of the expenses of the underlying Fidelity Central Funds.
Based on its investment objective, each Fidelity Central Fund may invest or participate in various investment vehicles or strategies that are similar to those of the investing fund. These strategies are consistent with the investment objectives of the investing fund and may involve certain economic risks which may cause a decline in value of each of the Fidelity Central Funds and thus a decline in the value of the investing fund.
| Fidelity Central Fund | Investment Manager | Investment Objective | Investment Practices | Expense RatioA |
| Fidelity Money Market Central Funds | Fidelity Management & Research Company LLC (FMR) | Each fund seeks to obtain a high level of current income consistent with the preservation of capital and liquidity. | Short-term Investments | Less than .005% |
A Expenses expressed as a percentage of average net assets and are as of each underlying Central Fund's most recent annual or semi-annual shareholder report.
A complete unaudited list of holdings for each Fidelity Central Fund is available upon request or at the Securities and Exchange Commission website at www.sec.gov. In addition, the financial statements of the Fidelity Central Funds which contain the significant accounting policies (including investment valuation policies) of those funds, and are not covered by the Report of Independent Registered Public Accounting Firm, are available on the Securities and Exchange Commission website or upon request.
3. Significant Accounting Policies.
The Fund is an investment company and applies the accounting and reporting guidance of the Financial Accounting Standards Board (FASB) Accounting Standards Codification Topic 946 Financial Services - Investment Companies. The financial statements have been prepared in conformity with accounting principles generally accepted in the United States of America (GAAP), which require management to make certain estimates and assumptions at the date of the financial statements. Actual results could differ from those estimates. Subsequent events, if any, through the date that the financial statements were issued have been evaluated in the preparation of the financial statements. The Fund's Schedule of Investments lists any underlying mutual funds or exchange-traded funds (ETFs) but does not include the underlying holdings of these funds. The following summarizes the significant accounting policies of the Fund:
Investment Valuation. Investments are valued as of 4:00 p.m. Eastern time on the last calendar day of the period. The Board of Trustees (the Board) has designated the Fund's investment adviser as the valuation designee responsible for the fair valuation function and performing fair value determinations as needed. The investment adviser has established a Fair Value Committee (the Committee) to carry out the day-to-day fair valuation responsibilities and has adopted policies and procedures to govern the fair valuation process and the activities of the Committee. In accordance with these fair valuation policies and procedures, which have been approved by the Board, the Fund attempts to obtain prices from one or more third party pricing services or brokers to value its investments. When current market prices, quotations or currency exchange rates are not readily available or reliable, investments will be fair valued in good faith by the Committee, in accordance with the policies and procedures. Factors used in determining fair value vary by investment type and may include market or investment specific events, transaction data, estimated cash flows, and market observations of comparable investments. The frequency that the fair valuation procedures are used cannot be predicted and they may be utilized to a significant extent. The Committee manages the Fund's fair valuation practices and maintains the fair valuation policies and procedures. The Fund's investment adviser reports to the Board information regarding the fair valuation process and related material matters.
The Fund categorizes the inputs to valuation techniques used to value its investments into a disclosure hierarchy consisting of three levels as shown below:
Level 1 - unadjusted quoted prices in active markets for identical investments
Level 2 - other significant observable inputs (including quoted prices for similar investments, interest rates, prepayment speeds, etc.)
Level 3 - unobservable inputs (including the Fund's own assumptions based on the best information available)
Valuation techniques used to value the Fund's investments by major category are as follows:
Equity securities, including restricted securities, for which market quotations are readily available, are valued at the last reported sale price or official closing price as reported by a third party pricing service on the primary market or exchange on which they are traded and are categorized as Level 1 in the hierarchy. In the event there were no sales during the day or closing prices are not available, securities are valued at the last quoted bid price or may be valued using the last available price and are generally categorized as Level 2 in the hierarchy. For foreign equity securities, when market or security specific events arise, comparisons to the valuation of American Depositary Receipts (ADRs), futures contracts, Exchange-Traded Funds (ETFs) and certain indexes as well as quoted prices for similar securities may be used and would be categorized as Level 2 in the hierarchy. For equity securities, including restricted securities, where observable inputs are limited, assumptions about market activity and risk are used and these securities may be categorized as Level 3 in the hierarchy.
Investments in open-end mutual funds, including the Fidelity Central Funds, are valued at their closing net asset value (NAV) each business day and are categorized as Level 1 in the hierarchy.
Changes in valuation techniques may result in transfers in or out of an assigned level within the disclosure hierarchy. The aggregate value of investments by input level as of October 31, 2024 is included at the end of the Fund's Schedule of Investments.
Foreign Currency. Certain Funds may use foreign currency contracts to facilitate transactions in foreign-denominated securities. Gains and losses from these transactions may arise from changes in the value of the foreign currency or if the counterparties do not perform under the contracts' terms.
Foreign-denominated assets, including investment securities, and liabilities are translated into U.S. dollars at the exchange rates at period end. Purchases and sales of investment securities, income and dividends received, and expenses denominated in foreign currencies are translated into U.S. dollars at the exchange rate in effect on the transaction date.
The effects of exchange rate fluctuations on investments are included with the net realized and unrealized gain (loss) on investment securities. Other foreign currency transactions resulting in realized and unrealized gain (loss) are disclosed separately.
Investment Transactions and Income. For financial reporting purposes, the Fund's investment holdings and NAV include trades executed through the end of the last business day of the period. The NAV per share for processing shareholder transactions is calculated as of the close of business of the New York Stock Exchange (NYSE), normally 4:00 p.m. Eastern time and includes trades executed through the end of the prior business day. Gains and losses on securities sold are determined on the basis of identified cost. Commissions paid to certain brokers with whom the investment adviser, or its affiliates, places trades on behalf of a fund include an amount in addition to trade execution, which may be rebated back to a fund. Any such rebates are included in net realized gain (loss) on investments in the Statement of Operations. Dividend income is recorded on the ex-dividend date, except for certain dividends from foreign securities where the ex-dividend date may have passed, which are recorded as soon as the Fund is informed of the ex-dividend date. Non-cash dividends included in dividend income, if any, are recorded at the fair market value of the securities received. Income and capital gain distributions from Fidelity Central Funds, if any, are recorded on the ex-dividend date. Interest income is accrued as earned and includes coupon interest and amortization of premium and accretion of discount on debt securities as applicable. Investment income is recorded net of foreign taxes withheld where recovery of such taxes is uncertain. Funds may file withholding tax reclaims in certain jurisdictions to recover a portion of amounts previously withheld. Any withholding tax reclaims income is included in the Statement of Operations in foreign taxes withheld. Any receivables for withholding tax reclaims are included in the Statement of Assets and Liabilities in reclaims receivable.
Expenses. Expenses directly attributable to a fund are charged to that fund. Expenses attributable to more than one fund are allocated among the respective funds on the basis of relative net assets or other appropriate methods. Expenses included in the accompanying financial statements reflect the expenses of that fund and do not include any expenses associated with any underlying mutual funds or exchange-traded funds. Although not included in a fund's expenses, a fund indirectly bears its proportionate share of these expenses through the net asset value of each underlying mutual fund or exchange-traded fund. Expense estimates are accrued in the period to which they relate and adjustments are made when actual amounts are known.
Income Tax Information and Distributions to Shareholders. Each year, the Fund intends to qualify as a regulated investment company under Subchapter M of the Internal Revenue Code, including distributing substantially all of its taxable income and realized gains. As a result, no provision for U.S. Federal income taxes is required. As of October 31, 2024, the Fund did not have any unrecognized tax benefits in the financial statements; nor is the Fund aware of any tax positions for which it is reasonably possible that the total amounts of unrecognized tax benefits will significantly change in the next twelve months. The Fund files a U.S. federal tax return, in addition to state and local tax returns as required. The Fund's federal income tax returns are subject to examination by the Internal Revenue Service (IRS) for a period of three fiscal years after they are filed. State and local tax returns may be subject to examination for an additional fiscal year depending on the jurisdiction. Foreign taxes are provided for based on the Fund's understanding of the tax rules and rates that exist in the foreign markets in which it invests.
Distributions are declared and recorded on the ex-dividend date. Income and capital gain distributions are determined in accordance with income tax regulations, which may differ from GAAP. In addition, the Fund claim a portion of the payment made to redeeming shareholders as a distribution for income tax purposes.
Capital accounts within the financial statements are adjusted for permanent book-tax differences. These adjustments have no impact on net assets or the results of operations. Capital accounts are not adjusted for temporary book-tax differences which will reverse in a subsequent period.
Book-tax differences are primarily due to foreign currency transactions, passive foreign investment companies (PFIC), capital loss carryforwards, and losses deferred due to wash sales.
As of period end, the cost and unrealized appreciation (depreciation) in securities, and derivatives if applicable, for federal income tax purposes were as follows:
| Gross unrealized appreciation | $5,455,920 |
| Gross unrealized depreciation | (1,921,407) |
| Net unrealized appreciation (depreciation) | $3,534,513 |
| Tax Cost | $56,691,210 |
The tax-based components of distributable earnings as of period end were as follows:
| Undistributed ordinary income | $821,941 |
| Capital loss carryforward | $(580,252) |
| Net unrealized appreciation (depreciation) on securities and other investments | $3,528,463 |
Capital loss carryforwards are only available to offset future capital gains of the Fund to the extent provided by regulations and may be limited. The capital loss carryforward information presented below, including any applicable limitation, is estimated as of fiscal period end and is subject to adjustment.
Short-term | $(444,947) |
Long-term | (135,305) |
| Total capital loss carryforward | $(580,252) |
The tax character of distributions paid was as follows:
| | October 31, 2024 | October 31, 2023 |
| Ordinary Income | $117,788 | $ 17,379 |
Restricted Securities (including Private Placements). Funds may invest in securities that are subject to legal or contractual restrictions on resale. These securities generally may be resold in transactions exempt from registration or to the public if the securities are registered. Disposal of these securities may involve time-consuming negotiations and expense, and prompt sale at an acceptable price may be difficult. Information regarding restricted securities held at period end is included at the end of the Schedule of Investments, if applicable.
New Accounting Pronouncement. In November 2023, the FASB issued Accounting Standards Update (ASU) 2023-07 Segment Reporting (Topic 280): Improvements to Reportable Segment Disclosures. Effective for fiscal years beginning after December 15, 2023 and interim periods within fiscal years beginning after December 15, 2024, the amendments enhance required disclosures of segment information for public entities on an annual and interim basis. The ASU allows for early adoption with updates applied retrospectively. Management is currently evaluating the impact of the ASU but does not expect this guidance to materially impact the financial statements.
4. Purchases and Sales of Investments.
Purchases and sales of securities, other than short-term securities and in-kind transactions, as applicable, are noted in the table below.
| | Purchases ($) | Sales ($) |
| Fidelity SAI Sustainable International Equity Fund | 59,591,767 | 15,226,630 |
5. Fees and Other Transactions with Affiliates.
Management Fee. Fidelity Management & Research Company LLC (the investment adviser) and its affiliates provide the Fund with investment management related services for which the Fund pays a monthly management fee. Effective March 1, 2024, the Fund pays a monthly management fee that is based on an annual rate of .648% of the Fund's average net assets.
Prior to March 1, 2024, the management fee was the sum of an individual fund fee rate that was based on an annual rate of .45% of the Fund's average net assets and an annualized group fee rate that averaged .22% during the period. The group fee rate was based upon the monthly average net assets of a group of registered investment companies with which the investment adviser has management contracts. The group fee rate decreased as assets under management increased and increased as assets under management decreased.
For the reporting period, the total annual management fee rate was .65% of the Fund's average net assets.
Brokerage Commissions. A portion of portfolio transactions were placed with brokerage firms which are affiliates of the investment adviser. Brokerage commissions are included in net realized gain (loss) and change in net unrealized appreciation (depreciation) in the Statement of Operations. The commissions paid to these affiliated firms were as follows:
| | Amount ($) |
| Fidelity SAI Sustainable International Equity Fund | 5 |
Interfund Trades. Funds may purchase from or sell securities to other Fidelity Funds under procedures adopted by the Board. The procedures have been designed to ensure these interfund trades are executed in accordance with Rule 17a-7 of the 1940 Act. Any interfund trades are included within the respective purchases and sales amounts shown in the Purchases and Sales of Investments note. Interfund trades during the period are noted in the table below.
| | Purchases ($) | Sales ($) | Realized Gain (Loss)($) |
| Fidelity SAI Sustainable International Equity Fund | 4,473,091 | 675,688 | (38,353) |
Sub-Advisory Arrangements. Effective March 1, 2024, the Fund's sub-advisory agreements with FMR Investment Management (UK) Limited, Fidelity Management & Research (Hong Kong) Limited, and Fidelity Management & Research (Japan) Limited were amended to provide that the investment adviser pays each sub-adviser monthly fees equal to 110% of the sub-adviser's costs for providing sub-advisory services.
6. Committed Line of Credit.
Certain Funds participate with other funds managed by the investment adviser or an affiliate in a $4.25 billion credit facility (the "line of credit") to be utilized for temporary or emergency purposes to fund shareholder redemptions or for other short-term liquidity purposes. The participating funds have agreed to pay commitment fees on their pro-rata portion of the line of credit, which are reflected in Miscellaneous expenses on the Statement of Operations, and are listed below. During the period, there were no borrowings on this line of credit.
| | Amount ($) |
| Fidelity SAI Sustainable International Equity Fund | 47 |
7. Expense Reductions.
The investment adviser contractually agreed to reimburse the Fund to the extent annual operating expenses exceeded .75% of average net assets. This reimbursement will remain in place through February 28, 2026. Some expenses, for example the compensation of the independent Trustees, and certain miscellaneous expenses such as proxy and shareholder meeting expenses, are excluded from this reimbursement. During the period this reimbursement reduced the Fund's expenses by $99,216.
Through arrangements with the Fund's custodian, credits realized as a result of certain uninvested cash balances were used to reduce the Fund's expenses by $264.
In addition, during the period the investment adviser or an affiliate reimbursed and/or waived a portion of operating expenses in the amount of $904.
8. Other.
A fund's organizational documents provide former and current trustees and officers with a limited indemnification against liabilities arising in connection with the performance of their duties to the fund. In the normal course of business, a fund may also enter into contracts that provide general indemnifications. A fund's maximum exposure under these arrangements is unknown as this would be dependent on future claims that may be made against a fund. The risk of material loss from such claims is considered remote.
9. Risk and Uncertainties.
Many factors affect a fund's performance. Developments that disrupt global economies and financial markets, such as pandemics, epidemics, outbreaks of infectious diseases, war, terrorism, and environmental disasters, may significantly affect a fund's investment performance. The effects of these developments to a fund will be impacted by the types of securities in which a fund invests, the financial condition, industry, economic sector, and geographic location of an issuer, and a fund's level of investment in the securities of that issuer. Significant concentrations in security types, issuers, industries, sectors, and geographic locations may magnify the factors that affect a fund's performance.
Report of Independent Registered Public Accounting Firm
To the Board of Trustees of Fidelity Investment Trust and the Shareholders of Fidelity SAI Sustainable International Equity Fund:
Opinion on the Financial Statements and Financial Highlights
We have audited the accompanying statement of assets and liabilities of Fidelity SAI Sustainable International Equity Fund (the "Fund"), a fund of Fidelity Investment Trust, including the schedule of investments, as of October 31, 2024, the related statement of operations for the year then ended, the statement of changes in net assets for each of the two years in the period then ended, the financial highlights for each of the two years in the period then ended and for the period from April 14, 2022 (commencement of operations) through October 31, 2022, and the related notes. In our opinion, the financial statements and financial highlights present fairly, in all material respects, the financial position of the Fund as of October 31, 2024, and the results of its operations for the year then ended, the changes in its net assets for each of the two years in the period then ended, and the financial highlights for each of the two years in the period then ended and for the period from April 14, 2022 (commencement of operations) through October 31, 2022, in conformity with accounting principles generally accepted in the United States of America.
Basis for Opinion
These financial statements and financial highlights are the responsibility of the Fund's management. Our responsibility is to express an opinion on the Fund's financial statements and financial highlights based on our audits. We are a public accounting firm registered with the Public Company Accounting Oversight Board (United States) (PCAOB) and are required to be independent with respect to the Fund in accordance with the U.S. federal securities laws and the applicable rules and regulations of the Securities and Exchange Commission and the PCAOB.
We conducted our audits in accordance with the standards of the PCAOB. Those standards require that we plan and perform the audit to obtain reasonable assurance about whether the financial statements and financial highlights are free of material misstatement, whether due to error or fraud. The Fund is not required to have, nor were we engaged to perform, an audit of its internal control over financial reporting. As part of our audits, we are required to obtain an understanding of internal control over financial reporting but not for the purpose of expressing an opinion on the effectiveness of the Fund's internal control over financial reporting. Accordingly, we express no such opinion.
Our audits included performing procedures to assess the risks of material misstatement of the financial statements and financial highlights, whether due to error or fraud, and performing procedures that respond to those risks. Such procedures included examining, on a test basis, evidence regarding the amounts and disclosures in the financial statements and financial highlights. Our audits also included evaluating the accounting principles used and significant estimates made by management, as well as evaluating the overall presentation of the financial statements and financial highlights. Our procedures included confirmation of securities owned as of October 31, 2024, by correspondence with the custodian and brokers; when replies were not received from brokers, we performed other auditing procedures. We believe that our audits provide a reasonable basis for our opinion.
/s/ Deloitte & Touche LLP
Boston, Massachusetts
December 16, 2024
We have served as the auditor of one or more of the Fidelity investment companies since 1999.
Distributions
(Unaudited)
The dividend and capital gains distributions for the fund(s) are available on Fidelity.com or Institutional.Fidelity.com.
The fund designates $6,968 of distributions paid during the fiscal year ended 2024 as qualifying to be taxed as section 163(j) interest dividends.
The fund designates 95.91% of the dividend distributed during the fiscal year as amounts which may be taken into account as a dividend for the purposes of the maximum rate under section 1(h)(11) of the Internal Revenue Code.
The amounts per share which represent income derived from sources within, and taxes paid to, foreign countries or possessions of the United States are $0.0720 and $0.0061 for the dividend paid December 2023.
The fund will notify shareholders in January 2025 of amounts for use in preparing 2024 income tax returns.
Item 8: Changes in and Disagreements with Accountants for Open-End Management Investment Companies
(Unaudited)
Note: This is not applicable for any fund included in this document.
Item 9: Proxy Disclosures for Open-End Management Investment Companies
(Unaudited)
| A special meeting of shareholders was held on July 16, 2024. The results of votes taken among shareholders on the proposal before them are reported below. Each vote reported represents one dollar of net asset value held on the record date for the meeting. |
| Proposal 1 |
| To elect a Board of Trustees. |
| | # of Votes | % of Votes |
| Bettina Doulton |
| Affirmative | 128,529,177,643.56 | 98.18 |
| Withheld | 2,378,037,364.30 | 1.82 |
| TOTAL | 130,907,215,007.85 | 100.00 |
| Robert A. Lawrence |
| Affirmative | 128,253,389,899.05 | 97.97 |
| Withheld | 2,653,825,108.81 | 2.03 |
| TOTAL | 130,907,215,007.85 | 100.00 |
| Vijay C. Advani |
| Affirmative | 128,531,418,228.19 | 98.19 |
| Withheld | 2,375,796,779.66 | 1.81 |
| TOTAL | 130,907,215,007.85 | 100.00 |
| Thomas P. Bostick |
| Affirmative | 128,495,261,591.41 | 98.16 |
| Withheld | 2,411,953,416.44 | 1.84 |
| TOTAL | 130,907,215,007.85 | 100.00 |
| Donald F. Donahue |
| Affirmative | 128,407,878,996.00 | 98.09 |
| Withheld | 2,499,336,011.85 | 1.91 |
| TOTAL | 130,907,215,007.85 | 100.00 |
| Vicki L. Fuller |
| Affirmative | 128,625,540,095.19 | 98.26 |
| Withheld | 2,281,674,912.66 | 1.74 |
| TOTAL | 130,907,215,007.85 | 100.00 |
| Patricia L. Kampling |
| Affirmative | 128,668,729,281.34 | 98.29 |
| Withheld | 2,238,485,726.51 | 1.71 |
| TOTAL | 130,907,215,007.85 | 100.00 |
| Thomas A. Kennedy |
| Affirmative | 128,499,824,239.79 | 98.16 |
| Withheld | 2,407,390,768.06 | 1.84 |
| TOTAL | 130,907,215,007.85 | 100.00 |
| Oscar Munoz |
| Affirmative | 128,386,109,391.05 | 98.07 |
| Withheld | 2,521,105,616.80 | 1.93 |
| TOTAL | 130,907,215,007.85 | 100.00 |
| Karen B. Peetz |
| Affirmative | 128,603,731,113.82 | 98.24 |
| Withheld | 2,303,483,894.03 | 1.76 |
| TOTAL | 130,907,215,007.85 | 100.00 |
| David M. Thomas |
| Affirmative | 128,384,899,342.98 | 98.07 |
| Withheld | 2,522,315,664.88 | 1.93 |
| TOTAL | 130,907,215,007.85 | 100.00 |
| Susan Tomasky |
| Affirmative | 128,556,148,461.60 | 98.20 |
| Withheld | 2,351,066,546.25 | 1.80 |
| TOTAL | 130,907,215,007.85 | 100.00 |
| Michael E. Wiley |
| Affirmative | 128,264,934,978.34 | 97.98 |
| Withheld | 2,642,280,029.51 | 2.02 |
| TOTAL | 130,907,215,007.85 | 100.00 |
| | | |
| Proposal 1 reflects trust-wide proposal and voting results. |
Item 10: Remuneration Paid to Directors, Officers, and others of Open-End Management Investment Companies
(Unaudited)
Note: This information is disclosed as part of the financial statements for each Fund as part of Item 7: Financial Statements and Financial Highlights for Open-End Management Investment companies.
Item 11: Statement Regarding Basis for Approval of Investment Advisory Contract
(Unaudited)
Board Approval of Investment Advisory Contracts and Management Fees
Fidelity SAI Sustainable International Equity Fund
Each year, the Board of Trustees, including the Independent Trustees (together, the Board), considers the renewal of the fund's management contract with Fidelity Management & Research Company LLC (FMR) and the sub-advisory agreements (together, the Advisory Contracts) for the fund. FMR and the sub-advisers are referred to herein as the Investment Advisers. The Board, assisted by the advice of fund counsel and Independent Trustees' counsel, requests and considers a broad range of information relevant to the renewal of the Advisory Contracts throughout the year.
The Board meets regularly and, at each of its meetings, covers an extensive agenda of topics and materials and considers factors that are relevant to its annual consideration of the renewal of the fund's Advisory Contracts, including the services and support provided to the fund and its shareholders. The Board, acting directly and through its Committees (each of which is composed of and chaired by Independent Trustees), requests and receives information concerning the annual consideration of the renewal of the fund's Advisory Contracts. The Board also meets as needed to review matters specifically related to the Board's annual consideration of the renewal of the Advisory Contracts. Members of the Board may also meet with trustees of other Fidelity funds through joint ad hoc committees to discuss certain matters relevant to all of the Fidelity funds.
At its May 2024 meeting, the Board unanimously determined to renew the fund's Advisory Contracts. In reaching its determination, the Board considered all factors it believed relevant, including (i) the nature, extent, and quality of the services provided to the fund and its shareholders (including the investment performance of the fund); (ii) the competitiveness relative to peer funds of the fund's management fee and total expense ratio; (iii) the total costs of the services provided by and the profits realized by FMR and its affiliates (Fidelity) from its relationships with the fund; and (iv) the extent to which, if any, economies of scale exist and are realized as the fund grows, and whether any economies of scale are appropriately shared with fund shareholders. The Board also considered the broad range of investment choices available to shareholders from FMR's competitors and that the fund's shareholders have chosen to invest in the fund, which is part of the Fidelity family of funds. The Board's decision to renew the Advisory Contracts was not based on any single factor.
The Board reached a determination, with the assistance of fund counsel and Independent Trustees' counsel and through the exercise of its business judgment, that the renewal of the Advisory Contracts was in the best interests of the fund and its shareholders and that the compensation payable under the Advisory Contracts was fair and reasonable in light of all of the surrounding circumstances.
Nature, Extent, and Quality of Services Provided. The Board considered staffing as it relates to the fund, including the backgrounds and experience of investment personnel of the Investment Advisers, and also considered the Investment Advisers' implementation of the fund's investment program. The Independent Trustees also had discussions with senior management of Fidelity's investment operations and investment groups. The Board considered the structure of the investment personnel compensation program and whether this structure provides appropriate incentives to act in the best interests of the fund. Additionally, the Board considered the portfolio managers' investments, if any, in the funds that they manage.
Resources Dedicated to Investment Management and Support Services. The Board and the Fund Oversight and Research Committees reviewed the general qualifications and capabilities of Fidelity's investment staff, including its size, education, experience, and resources, as well as Fidelity's approach to recruiting, training, managing, and compensating investment personnel. The Board noted the resources devoted to expansion of Fidelity's global investment organization, and that Fidelity's analysts have extensive resources, tools, and capabilities that allow them to conduct sophisticated quantitative and fundamental analysis, as well as credit analysis of issuers, counterparties, and guarantors. Further, the Board considered that Fidelity's investment professionals have sufficient access to global information and data so as to provide competitive investment results over time, and that those professionals also have access to sophisticated tools that permit them to assess portfolio construction and risk and performance attribution characteristics continuously, as well as to transmit new information and research conclusions rapidly around the world. Additionally, in its deliberations, the Board considered Fidelity's trading, risk management, compliance, and technology and operations capabilities and resources, which are integral parts of the investment management process.
Shareholder and Administrative Services. The Board considered (i) the nature, extent, quality, and cost of advisory, administrative, and shareholder services performed by the Investment Advisers and their affiliates under the Advisory Contracts and under separate agreements covering transfer agency and pricing and bookkeeping services for the fund; (ii) the nature and extent of Fidelity's supervision of third party service providers, principally custodians, subcustodians, and pricing vendors; and (iii) the resources devoted by Fidelity to, and the record of compliance with, the fund's compliance policies and procedures. The Board also reviewed the allocation of fund brokerage, including allocations to brokers affiliated with the Investment Advisers, the use of brokerage commissions to pay fund expenses, and the use of "soft" commission dollars to pay for research services. The Board also considered the fund's securities lending activities and any payments made to Fidelity relating to securities lending under a separate agreement.
The Board noted that the growth of fund assets over time across the complex allows Fidelity to reinvest in the development of services designed to enhance the value and convenience of the Fidelity funds as investment vehicles. These services include 24-hour access to account information and market information over the Internet and through telephone representatives, investor education materials, and asset allocation tools. The Board also considered that it reviews customer service metrics such as telephone response times, continuity of services on the website and metrics addressing services at Fidelity Investor Centers.
Investment in a Large Fund Family. The Board considered the benefits to shareholders of investing in a fund that is part of a large family of funds offering a variety of investment disciplines and providing a large variety of fund investor services. The Board noted that Fidelity had taken, or had made recommendations that resulted in the Fidelity funds taking, a number of actions over the previous year that benefited particular funds and/or the Fidelity funds in general.
Investment Performance. The Board took into account discussions that occur with representatives of the Investment Advisers, and reports that it receives, at Board meetings throughout the year, relating to fund investment performance. In this regard the Board noted that as part of regularly scheduled fund reviews and other reports to the Board on fund performance, the Board considered annualized return information for the fund for different time periods, measured against an appropriate securities market index (benchmark index). The Board also considered information about performance attribution. In its ongoing evaluation of fund investment performance, the Board gives particular attention to information indicating changes in performance of the funds over different time periods and discussed with the Investment Advisers the reasons for any overperformance or underperformance.
In addition to reviewing absolute and relative fund performance, the Independent Trustees periodically consider the appropriateness of fund performance metrics in evaluating the results achieved. The Independent Trustees generally give greater weight to fund performance over longer time periods than over shorter time periods. Depending on the circumstances, the Independent Trustees may be satisfied with a fund's performance notwithstanding that it lags its benchmark index for certain periods.
Based on its review, the Board concluded that the nature, extent, and quality of services provided to the fund under the Advisory Contracts should continue to benefit the shareholders of the fund.
Competitiveness of Management Fee and Total Expense Ratio. The Board was provided with information regarding industry trends in management fees and expenses. The Board considered that, effective March 1, 2024, an amended Advisory Contract with FMR went into effect with a flat management fee that replaced the prior management fee structure. In its review of the fund's management fee and total expense ratio, the Board considered the fund's pro forma management fee rate as if it had been in effect for the 12-month period ended September 30, 2023, as well as other fund expenses. The Board noted that Fidelity may agree to waive fees or reimburse expenses from time to time, and the extent to which, if any, it has done so for the fund.
Comparisons of Management Fees and Total Expense Ratios. Among other things, the Board reviewed data for selected groups of competitive funds and classes (referred to as "mapped groups") that were compiled by Fidelity based on combining similar investment objective categories (as classified by Lipper) that have comparable investment mandates. The data reviewed by the Board included (i) gross management fee comparisons (before taking into account expense reimbursements or caps) relative to the total universe of funds within the mapped group; (ii) gross management fee comparisons relative to a subset of non-Fidelity funds in the mapped group that are similar in size and management fee structure to the fund (referred to as the "asset size peer group"); (iii) total expense comparisons of the fund relative to funds and classes in the mapped group that have a similar sales load structure to the fund (referred to as the "similar sales load structure group"); and (iv) total expense comparisons of the fund relative to funds and classes in the similar sales load structure group that are similar in size and management fee structure to the fund (referred to as the "total expense asset size peer group"). The total expense asset size peer group comparison excludes performance adjustments and fund-paid 12b-1 fees to eliminate variability in fee structures.
The information provided to the Board indicated that the fund's management fee rate ranked below the competitive median of the mapped group for the period ended September 30, 2023 and below the competitive median of the asset size peer group for the period ended September 30, 2023. Further, the information provided to the Board indicated that the total expense ratio of the fund ranked below the competitive median of the similar sales load structure group for the period ended September 30, 2023 and below the competitive median of the total expense asset size peer group for the period ended September 30, 2023.
Other Contractual Arrangements. The Board further considered that FMR has contractually agreed to reimburse the fund to the extent that total operating expenses, with certain exceptions, as a percentage of its average net assets, exceed 0.75% through February 28, 2025.
Fees Charged to Other Fidelity Clients. The Board also considered Fidelity fee structures and other information with respect to clients of Fidelity, such as other funds advised or subadvised by Fidelity, pension plan clients, and other institutional clients with similar mandates. The Board noted that a joint ad hoc committee created by it and the boards of other Fidelity funds periodically reviews and compares Fidelity's institutional investment advisory business with its business of providing services to the Fidelity funds and also noted the most recent findings of the committee. The Board noted that the committee's review included a consideration of the differences in services provided, fees charged, and costs incurred, as well as competition in the markets serving the different categories of clients.
Based on its review, the Board concluded that the fund's management fee is fair and reasonable in light of the services that the fund receives and the other factors considered. Further, based on its review of total expense ratios and fees charged to other Fidelity clients, the Board concluded that the fund's total expense ratio was reasonable in light of the services that the fund and its shareholders receive and the other factors considered.
Costs of the Services and Profitability. The Board considered the revenues earned and the expenses incurred by Fidelity in conducting the business of developing, marketing, distributing, managing, administering and servicing the fund and servicing the fund's shareholders. The Board also considered the level of Fidelity's profits in respect of all the Fidelity funds.
On an annual basis, Fidelity presents to the Board information about the profitability of its relationships with the fund. Fidelity calculates profitability information for each fund, as well as aggregate profitability information for groups of Fidelity funds and all Fidelity funds, using a series of detailed revenue and cost allocation methodologies which originate with the books and records of Fidelity on which Fidelity's audited financial statements are based. The Audit Committee of the Board reviews any significant changes from the prior year's methodologies.
A public accounting firm has been engaged annually by the Board as part of the Board's assessment of Fidelity's profitability analysis. The engagement includes the review and assessment of the methodologies used by Fidelity in determining the revenues and expenses attributable to Fidelity's fund business, and completion of agreed-upon procedures in respect of the mathematical accuracy of certain fund profitability information and its conformity to established allocation methodologies. After considering the reports issued under the engagement and information provided by Fidelity, the Board concluded that while other allocation methods may also be reasonable, Fidelity's profitability methodologies are reasonable in all material respects.
The Board also reviewed Fidelity's non-fund businesses and potential indirect benefits such businesses may have received as a result of their association with Fidelity's fund business (i.e., fall-out benefits) as well as cases where Fidelity's affiliates may benefit from the funds' business. The Board considered areas where potential indirect benefits to the Fidelity funds from their relationships with Fidelity may exist. The Board's consideration of these matters was informed by the findings of a joint ad hoc committee created by it and the boards of other Fidelity funds to evaluate potential fall-out benefits.
The Board considered the costs of the services provided by and the profits realized by Fidelity in connection with the operation of the fund and was satisfied that the profitability was not excessive.
Economies of Scale. The Board considered whether there have been economies of scale in respect of the management of the Fidelity funds, whether the Fidelity funds (including the fund) have appropriately benefited from any such economies of scale, and whether there is potential for realization of any further economies of scale. The Board considered the extent to which the fund will benefit from economies of scale as assets grow through increased services to the fund, through waivers or reimbursements, or through fee or expense ratio reductions. The Board also noted that a committee created by it and the boards of other Fidelity funds periodically analyzes whether Fidelity attains economies of scale in respect of the management and servicing of the Fidelity funds, whether the Fidelity funds have appropriately benefited from such economies of scale, and whether there is potential for realization of any further economies of scale.
The Board concluded, taking into account the analysis of the committee, that economies of scale, if any, are being appropriately shared between fund shareholders and Fidelity.
Additional Information Requested by the Board. In order to develop fully the factual basis for consideration of the Fidelity funds' advisory contracts, the Board requested and received additional information on certain topics, including but not limited to: (i) fund flow and performance trends, in particular the underperformance of certain funds and strategies, and Fidelity's long-term strategies for certain funds; (ii) the operation of performance fees and the rationale for implementing performance fees on certain categories of funds but not others; (iii) Fidelity's pricing philosophy compared to competitors; (iv) fund profitability methodology and data; (v) evaluation of competitive fund data and peer group classifications and fee and expense comparisons; (vi) the management fee and expense structures for different funds and classes and information about the differences between various fee and expense structures; (vii) the variable management fee implemented for certain funds effective March 1, 2024; and (viii) information regarding other accounts managed by Fidelity and the funds' sub-advisory arrangements.
Conclusion. Based on its evaluation of all of the conclusions noted above, and after considering all factors it believed relevant, the Board, including the Independent Trustees, concluded that the advisory and sub-advisory fee arrangements are fair and reasonable in light of all of the surrounding circumstances and that the fund's Advisory Contracts should be renewed through May 31, 2025.
1.9904871.102
IEE-ANN-1224
Fidelity® Series Canada Fund
Annual Report
October 31, 2024
Contents
To view a fund's proxy voting guidelines and proxy voting record for the 12-month period ended June 30, visit http://www.fidelity.com/proxyvotingresults or visit the Securities and Exchange Commission's (SEC) web site at http://www.sec.gov.
You may also call 1-800-544-8544 to request a free copy of the proxy voting guidelines.
Standard & Poor's, S&P and S&P 500 are registered service marks of The McGraw-Hill Companies, Inc. and have been licensed for use by Fidelity Distributors Corporation.
Other third-party marks appearing herein are the property of their respective owners.
All other marks appearing herein are registered or unregistered trademarks or service marks of FMR LLC or an affiliated company. © 2024 FMR LLC. All rights reserved.
This report and the financial statements contained herein are submitted for the general information of the shareholders of the Fund. This report is not authorized for distribution to prospective investors in the Fund unless preceded or accompanied by an effective prospectus.
A fund files its complete schedule of portfolio holdings with the SEC for the first and third quarters of each fiscal year on Form N-PORT. Forms N-PORT are available on the SEC's web site at http://www.sec.gov. A fund's Forms N-PORT may be reviewed and copied at the SEC's Public Reference Room in Washington, DC. Information regarding the operation of the SEC's Public Reference Room may be obtained by calling 1-800-SEC-0330.
For a complete list of a fund's portfolio holdings, view the most recent holdings listing, semiannual report, or annual report on Fidelity's web site at http://www.fidelity.com, http://www.institutional.fidelity.com, or http://www.401k.com, as applicable.
NOT FDIC INSURED •MAY LOSE VALUE •NO BANK GUARANTEE
Neither the Fund nor Fidelity Distributors Corporation is a bank.
Item 7: Financial Statements and Financial Highlights for Open-End Management Investment Companies (Annual Report)
Fidelity® Series Canada Fund
Schedule of Investments October 31, 2024
Showing Percentage of Net Assets
| Common Stocks - 99.5% |
| | | Shares | Value ($) |
| COMMUNICATION SERVICES - 2.1% | | | |
| Diversified Telecommunication Services - 1.2% | | | |
| Quebecor, Inc.: | | | |
| Class A | | 1,956,190 | 47,768,492 |
| Class B (sub. vtg.) (a) | | 856,500 | 21,327,148 |
| | | | 69,095,640 |
| Wireless Telecommunication Services - 0.9% | | | |
| Rogers Communications, Inc. Class B (non-vtg.) | | 1,445,700 | 52,507,666 |
TOTAL COMMUNICATION SERVICES | | | 121,603,306 |
| CONSUMER DISCRETIONARY - 6.7% | | | |
| Broadline Retail - 3.2% | | | |
| Dollarama, Inc. | | 1,771,200 | 184,313,691 |
| Hotels, Restaurants & Leisure - 2.0% | | | |
| Restaurant Brands International, Inc. | | 1,648,200 | 114,634,746 |
| Specialty Retail - 1.4% | | | |
| Aritzia, Inc. (b) | | 927,200 | 29,853,396 |
| Diversified Royalty Corp. (a)(c) | | 10,495,100 | 22,311,557 |
| Pet Valu Holdings Ltd. (a) | | 1,367,700 | 25,019,082 |
| | | | 77,184,035 |
| Textiles, Apparel & Luxury Goods - 0.1% | | | |
| Canada Goose Holdings, Inc. (a)(b) | | 593,132 | 5,836,110 |
TOTAL CONSUMER DISCRETIONARY | | | 381,968,582 |
| CONSUMER STAPLES - 8.7% | | | |
| Beverages - 0.1% | | | |
| GURU Organic Energy Corp. (b)(c) | | 1,561,134 | 1,805,168 |
| Consumer Staples Distribution & Retail - 8.2% | | | |
| Alimentation Couche-Tard, Inc. (multi-vtg.) | | 5,479,140 | 285,733,009 |
| Metro, Inc. | | 2,209,900 | 131,243,316 |
| North West Co., Inc. | | 1,416,700 | 53,326,568 |
| | | | 470,302,893 |
| Personal Care Products - 0.4% | | | |
| Jamieson Wellness, Inc. (d) | | 1,033,000 | 24,609,193 |
TOTAL CONSUMER STAPLES | | | 496,717,254 |
| ENERGY - 17.9% | | | |
| Energy Equipment & Services - 0.6% | | | |
| Pason Systems, Inc. | | 3,554,800 | 34,390,172 |
| Oil, Gas & Consumable Fuels - 17.3% | | | |
| Cameco Corp. | | 1,669,900 | 87,263,924 |
| Canadian Natural Resources Ltd. | | 8,700,000 | 295,863,109 |
| Enbridge, Inc. (a) | | 2,004,200 | 80,953,933 |
| MEG Energy Corp. | | 177,929 | 3,252,266 |
| Parkland Corp. | | 2,307,100 | 53,686,243 |
| PrairieSky Royalty Ltd. | | 9,619,380 | 192,477,414 |
| South Bow Corp. | | 2,839,100 | 70,898,486 |
| Suncor Energy, Inc. | | 5,437,200 | 205,249,565 |
| | | | 989,644,940 |
TOTAL ENERGY | | | 1,024,035,112 |
| FINANCIALS - 30.2% | | | |
| Banks - 16.7% | | | |
| Bank of Montreal (a) | | 3,347,400 | 305,036,889 |
| Canadian Imperial Bank of Commerce | | 1,925,200 | 120,446,850 |
| Royal Bank of Canada (a) | | 2,606,100 | 315,180,220 |
| The Toronto-Dominion Bank | | 3,945,730 | 218,122,482 |
| | | | 958,786,441 |
| Capital Markets - 6.7% | | | |
| Brookfield Asset Management Ltd. Class A (a) | | 2,424,572 | 128,633,701 |
| Brookfield Corp. (Canada) Class A | | 2,838,588 | 150,517,436 |
| TMX Group Ltd. | | 3,318,400 | 103,650,099 |
| | | | 382,801,236 |
| Insurance - 6.8% | | | |
| Definity Financial Corp. | | 2,465,324 | 95,135,461 |
| Intact Financial Corp. | | 682,000 | 130,242,971 |
| Sun Life Financial, Inc. | | 2,954,600 | 163,820,246 |
| | | | 389,198,678 |
TOTAL FINANCIALS | | | 1,730,786,355 |
| HEALTH CARE - 0.6% | | | |
| Health Care Providers & Services - 0.6% | | | |
| Andlauer Healthcare Group, Inc. | | 1,228,132 | 36,226,079 |
| INDUSTRIALS - 12.4% | | | |
| Commercial Services & Supplies - 2.2% | | | |
| GFL Environmental, Inc. | | 3,034,614 | 126,955,338 |
| Ground Transportation - 7.8% | | | |
| Canadian National Railway Co. | | 1,184,200 | 127,873,358 |
| Canadian Pacific Kansas City Ltd. | | 4,088,921 | 315,431,468 |
| | | | 443,304,826 |
| Professional Services - 2.4% | | | |
| Thomson Reuters Corp. | | 843,100 | 138,004,755 |
TOTAL INDUSTRIALS | | | 708,264,919 |
| INFORMATION TECHNOLOGY - 10.2% | | | |
| Electronic Equipment, Instruments & Components - 0.1% | | | |
| Celestica, Inc. (sub. vtg.) (b) | | 63,100 | 4,318,001 |
| IT Services - 3.8% | | | |
| Shopify, Inc. Class A (b) | | 2,805,300 | 219,451,486 |
| Software - 6.3% | | | |
| ApplyBoard, Inc. (b)(e)(f) | | 10,248 | 322,710 |
| ApplyBoard, Inc. (non-vtg.) (b)(e)(f) | | 2,527 | 79,575 |
| Computer Modelling Group Ltd. | | 1,907,000 | 15,668,532 |
| Constellation Software, Inc. | | 90,000 | 271,421,410 |
| Constellation Software, Inc. warrants 3/31/40 (b)(f) | | 47,800 | 3 |
| Dye & Durham Ltd. (c) | | 4,266,200 | 58,339,102 |
| Lumine Group, Inc. (b) | | 769,240 | 17,911,273 |
| | | | 363,742,605 |
TOTAL INFORMATION TECHNOLOGY | | | 587,512,092 |
| MATERIALS - 10.7% | | | |
| Chemicals - 1.6% | | | |
| Nutrien Ltd. | | 1,902,978 | 90,737,752 |
| Containers & Packaging - 1.2% | | | |
| CCL Industries, Inc.: | | | |
| Class A | | 149,000 | 8,613,502 |
| Class B | | 1,000,700 | 58,373,867 |
| | | | 66,987,369 |
| Metals & Mining - 7.3% | | | |
| Franco-Nevada Corp. | | 1,636,919 | 217,283,994 |
| Lundin Mining Corp. (a) | | 4,526,100 | 44,014,360 |
| Triple Flag Precious Metals Corp. (a) | | 900,630 | 15,433,642 |
| Wheaton Precious Metals Corp. | | 2,190,700 | 144,672,579 |
| | | | 421,404,575 |
| Paper & Forest Products - 0.6% | | | |
| Stella-Jones, Inc. | | 582,000 | 35,187,101 |
TOTAL MATERIALS | | | 614,316,797 |
| TOTAL COMMON STOCKS (Cost $3,756,261,301) | | | 5,701,430,496 |
| | | | |
| Nonconvertible Preferred Stocks - 0.1% |
| | | Shares | Value ($) |
| INFORMATION TECHNOLOGY - 0.1% | | | |
| Software - 0.1% | | | |
| ApplyBoard, Inc.: | | | |
| Series A1 (b)(e)(f) | | 12,606 | 397,845 |
| Series A2 (b)(e)(f) | | 9,868 | 311,631 |
| Series A3 (b)(e)(f) | | 563 | 17,791 |
| Series D (b)(e)(f) | | 27,521 | 1,282,479 |
| Series Seed (b)(e)(f) | | 3,768 | 118,730 |
| (Cost $4,705,692) | | | 2,128,476 |
| | | | |
| Convertible Bonds - 0.1% |
| | | Principal Amount (g) | Value ($) |
| COMMUNICATION SERVICES - 0.1% | | | |
| Entertainment - 0.1% | | | |
Cineplex, Inc. 7.75% 3/1/30 (d) (Cost $5,386,687) | CAD | 7,986,000 | 6,940,108 |
| | | | |
| Money Market Funds - 3.5% |
| | | Shares | Value ($) |
| Fidelity Cash Central Fund 4.87% (h) | | 2,620,007 | 2,620,532 |
| Fidelity Securities Lending Cash Central Fund 4.87% (h)(i) | | 198,469,981 | 198,489,828 |
| TOTAL MONEY MARKET FUNDS (Cost $201,110,360) | | | 201,110,360 |
| | | | |
| TOTAL INVESTMENT IN SECURITIES - 103.2% (Cost $3,967,464,040) | 5,911,609,440 |
NET OTHER ASSETS (LIABILITIES) - (3.2)% | (182,928,261) |
| NET ASSETS - 100.0% | 5,728,681,179 |
| | |
Currency Abbreviations
Legend
| (a) | Security or a portion of the security is on loan at period end. |
| (d) | Security exempt from registration under Rule 144A of the Securities Act of 1933. These securities may be resold in transactions exempt from registration, normally to qualified institutional buyers. At the end of the period, the value of these securities amounted to $31,549,301 or 0.6% of net assets. |
| (e) | Restricted securities (including private placements) - Investment in securities not registered under the Securities Act of 1933 (excluding 144A issues). At the end of the period, the value of restricted securities (excluding 144A issues) amounted to $2,530,761 or 0.0% of net assets. |
| (g) | Amount is stated in United States dollars unless otherwise noted. |
| (h) | Affiliated fund that is generally available only to investment companies and other accounts managed by Fidelity Investments. The rate quoted is the annualized seven-day yield of the fund at period end. A complete unaudited listing of the fund's holdings as of its most recent quarter end is available upon request. In addition, each Fidelity Central Fund's financial statements, which are not covered by the Fund's Report of Independent Registered Public Accounting Firm, are available on the SEC's website or upon request. |
| (i) | Investment made with cash collateral received from securities on loan. |
| Additional information on each restricted holding is as follows: |
| Security | Acquisition Date | Acquisition Cost ($) |
| ApplyBoard, Inc. | 6/04/21 - 6/30/21 | 524,312 |
| | | |
| ApplyBoard, Inc. (non-vtg.) | 6/30/21 | 269,861 |
| | | |
| ApplyBoard, Inc. Series A1 | 6/04/21 | 816,255 |
| | | |
| ApplyBoard, Inc. Series A2 | 6/04/21 | 638,966 |
| | | |
| ApplyBoard, Inc. Series A3 | 6/04/21 | 36,455 |
| | | |
| ApplyBoard, Inc. Series D | 6/04/21 | 2,970,033 |
| | | |
| ApplyBoard, Inc. Series Seed | 6/04/21 | 243,983 |
| | | |
Affiliated Central Funds
Fiscal year to date information regarding the Fund's investments in Fidelity Central Funds, including the ownership percentage, is presented below.
| Affiliate | Value, beginning of period ($) | Purchases ($) | Sales Proceeds ($) | Dividend Income ($) | Realized Gain (loss) ($) | Change in Unrealized appreciation (depreciation) ($) | Value, end of period ($) | % ownership, end of period |
| Fidelity Cash Central Fund 4.87% | 11,237,729 | 348,518,239 | 357,135,810 | 393,250 | 374 | - | 2,620,532 | 0.0% |
| Fidelity Securities Lending Cash Central Fund 4.87% | 223,158,876 | 7,194,656,938 | 7,219,325,986 | 2,516,967 | - | - | 198,489,828 | 0.8% |
| Total | 234,396,605 | 7,543,175,177 | 7,576,461,796 | 2,910,217 | 374 | - | 201,110,360 | |
| | | | | | | | | |
Amounts in the dividend income column in the above table include any capital gain distributions from underlying funds, which are presented in the corresponding line item in the Statement of Operations, if applicable.
Amounts in the dividend income column for Fidelity Securities Lending Cash Central Fund represents the income earned on investing cash collateral, less rebates paid to borrowers and any lending agent fees associated with the loan, plus any premium payments received for lending certain types of securities.
Amounts included in the purchases and sales proceeds columns may include in-kind transactions, if applicable.
Other Affiliated Issuers
An affiliated company is a company in which the Fund has ownership of at least 5% of the voting securities. Fiscal year to date transactions with companies which are or were affiliates are presented in the table below. Certain corporate actions, such as mergers, are excluded from the amounts in this table if applicable. A dash in the Value end of period ($) column means either the issuer is no longer held at period end, or the issuer is held at period end but is no longer an affiliate.
| Affiliate | Value, beginning of period ($) | Purchases ($) | Sales Proceeds ($) | Dividend Income ($) | Realized Gain (loss) ($) | Change in Unrealized appreciation (depreciation) ($) | Value, end of period ($) |
| Diversified Royalty Corp. | 7,539,965 | 12,949,743 | 712,636 | 1,302,461 | 243,719 | 2,290,766 | 22,311,557 |
| Dye & Durham Ltd. | 21,565,749 | 7,670,617 | 1,709,838 | 185,931 | 788,795 | 30,023,779 | 58,339,102 |
| GURU Organic Energy Corp. | 2,630,712 | - | 111,007 | - | (163,814) | (550,723) | 1,805,168 |
| Total | 31,736,426 | 20,620,360 | 2,533,481 | 1,488,392 | 868,700 | 31,763,822 | 82,455,827 |
Amounts included in the purchases and sales proceeds columns may include in-kind transactions, if applicable.
Investment Valuation
The following is a summary of the inputs used, as of October 31, 2024, involving the Fund's assets and liabilities carried at fair value. The inputs or methodology used for valuing securities may not be an indication of the risk associated with investing in those securities. For more information on valuation inputs, and their aggregation into the levels used below, please refer to the Investment Valuation section in the accompanying Notes to Financial Statements.
| Valuation Inputs at Reporting Date: |
| Description | Total ($) | Level 1 ($) | Level 2 ($) | Level 3 ($) |
Investments in Securities: | | | | |
|
| Equities: | | | | |
Communication Services | 121,603,306 | 121,603,306 | - | - |
Consumer Discretionary | 381,968,582 | 381,968,582 | - | - |
Consumer Staples | 496,717,254 | 496,717,254 | - | - |
Energy | 1,024,035,112 | 1,024,035,112 | - | - |
Financials | 1,730,786,355 | 1,730,786,355 | - | - |
Health Care | 36,226,079 | 36,226,079 | - | - |
Industrials | 708,264,919 | 708,264,919 | - | - |
Information Technology | 589,640,568 | 587,109,804 | - | 2,530,764 |
Materials | 614,316,797 | 614,316,797 | - | - |
|
| Corporate Bonds | 6,940,108 | - | 6,940,108 | - |
|
| Money Market Funds | 201,110,360 | 201,110,360 | - | - |
| Total Investments in Securities: | 5,911,609,440 | 5,902,138,568 | 6,940,108 | 2,530,764 |
Financial Statements
| Statement of Assets and Liabilities |
As of October 31, 2024 |
| Assets | | | | |
| Investment in securities, at value (including securities loaned of $186,479,584) - See accompanying schedule: | | | | |
Unaffiliated issuers (cost $3,685,909,885) | $ | 5,628,043,253 | | |
Fidelity Central Funds (cost $201,110,360) | | 201,110,360 | | |
Other affiliated issuers (cost $80,443,795) | | 82,455,827 | | |
| | | | | |
| | | | | |
| Total Investment in Securities (cost $3,967,464,040) | | | $ | 5,911,609,440 |
| Foreign currency held at value (cost $60,216,357) | | | | 59,388,210 |
| Receivable for fund shares sold | | | | 5,142,244 |
| Dividends receivable | | | | 8,372,917 |
| Interest receivable | | | | 38,971 |
| Distributions receivable from Fidelity Central Funds | | | | 311,522 |
Total assets | | | | 5,984,863,304 |
| Liabilities | | | | |
| Payable for fund shares redeemed | $ | 57,675,660 | | |
| Other payables and accrued expenses | | 18,408 | | |
| Collateral on securities loaned | | 198,488,057 | | |
| Total liabilities | | | | 256,182,125 |
| Net Assets | | | $ | 5,728,681,179 |
| Net Assets consist of: | | | | |
| Paid in capital | | | $ | 3,725,859,285 |
| Total accumulated earnings (loss) | | | | 2,002,821,894 |
| Net Assets | | | $ | 5,728,681,179 |
Net Asset Value, offering price and redemption price per share ($5,728,681,179 ÷ 353,794,819 shares) | | | $ | 16.19 |
| Statement of Operations |
| Year ended October 31, 2024 |
| Investment Income | | | | |
| Dividends (including $1,488,392 earned from affiliated issuers) | | | $ | 133,642,290 |
| Interest | | | | 473,015 |
| Income from Fidelity Central Funds (including $2,516,967 from security lending) | | | | 2,910,217 |
| Income before foreign taxes withheld | | | $ | 137,025,522 |
| Less foreign taxes withheld | | | | (20,728,000) |
| Total income | | | | 116,297,522 |
| Expenses | | | | |
| Custodian fees and expenses | $ | 43,843 | | |
| Independent trustees' fees and expenses | | 23,928 | | |
| Interest | | 10,365 | | |
| Miscellaneous | | 86 | | |
| Total expenses | | | | 78,222 |
| Net Investment income (loss) | | | | 116,219,300 |
| Realized and Unrealized Gain (Loss) | | | | |
| Net realized gain (loss) on: | | | | |
| Investment Securities: | | | | |
| Unaffiliated issuers | | 39,970,926 | | |
| Redemptions in-kind | | 115,673,311 | | |
| Fidelity Central Funds | | 374 | | |
| Other affiliated issuers | | 868,700 | | |
| Foreign currency transactions | | 2,074,035 | | |
| Total net realized gain (loss) | | | | 158,587,346 |
| Change in net unrealized appreciation (depreciation) on: | | | | |
| Investment Securities: | | | | |
| Unaffiliated issuers | | 930,708,703 | | |
| Affiliated issuers | | 31,763,822 | | |
| Assets and liabilities in foreign currencies | | 345,078 | | |
| Total change in net unrealized appreciation (depreciation) | | | | 962,817,603 |
| Net gain (loss) | | | | 1,121,404,949 |
| Net increase (decrease) in net assets resulting from operations | | | $ | 1,237,624,249 |
| Statement of Changes in Net Assets |
| |
| | Year ended October 31, 2024 | | Year ended October 31, 2023 |
| Increase (Decrease) in Net Assets | | | | |
| Operations | | | | |
| Net investment income (loss) | $ | 116,219,300 | $ | 123,964,624 |
| Net realized gain (loss) | | 158,587,346 | | 139,602,476 |
| Change in net unrealized appreciation (depreciation) | | 962,817,603 | | (116,351,477) |
| Net increase (decrease) in net assets resulting from operations | | 1,237,624,249 | | 147,215,623 |
| Distributions to shareholders | | (173,039,225) | | (160,606,918) |
| | | | | |
| Share transactions | | | | |
| Proceeds from sales of shares | | 1,098,707,709 | | 675,016,952 |
| Reinvestment of distributions | | 173,039,225 | | 160,606,918 |
| Cost of shares redeemed | | (1,125,209,910) | | (1,711,870,454) |
| | | | | |
Net increase (decrease) in net assets resulting from share transactions | | 146,537,024 | | (876,246,584) |
| Total increase (decrease) in net assets | | 1,211,122,048 | | (889,637,879) |
| | | | | |
| Net Assets | | | | |
| Beginning of period | | 4,517,559,131 | | 5,407,197,010 |
| End of period | $ | 5,728,681,179 | $ | 4,517,559,131 |
| | | | | |
| Other Information | | | | |
| Shares | | | | |
| Sold | | 71,855,728 | | 49,168,680 |
| Issued in reinvestment of distributions | | 12,457,828 | | 12,084,794 |
| Redeemed | | (73,448,771) | | (122,728,311) |
| Net increase (decrease) | | 10,864,785 | | (61,474,837) |
| | | | | |
Financial Highlights
Fidelity® Series Canada Fund |
| |
| Years ended October 31, | | 2024 | | 2023 | | 2022 | | 2021 | | 2020 |
Selected Per-Share Data | | | | | | | | | | |
| Net asset value, beginning of period | $ | 13.17 | $ | 13.37 | $ | 14.77 | $ | 9.77 | $ | 10.89 |
| Income from Investment Operations | | | | | | | | | | |
Net investment income (loss) A,B | | .33 | | .33 | | .32 | | .28 | | .27 |
| Net realized and unrealized gain (loss) | | 3.19 | | (.12) | | (1.40) | | 4.97 | | (1.14) |
| Total from investment operations | | 3.52 | | .21 | | (1.08) | | 5.25 | | (.87) |
| Distributions from net investment income | | (.38) | | (.40) | | (.32) | | (.25) | | (.25) |
| Distributions from net realized gain | | (.12) | | (.01) | | - | | - | | - |
| Total distributions | | (.50) | | (.41) | | (.32) | | (.25) | | (.25) |
| Net asset value, end of period | $ | 16.19 | $ | 13.17 | $ | 13.37 | $ | 14.77 | $ | 9.77 |
Total Return C | | | | 1.54% | | (7.45)% | | 54.40% | | (8.22)% |
Ratios to Average Net Assets B,D,E | | | | | | | | | | |
| Expenses before reductions | | -% F | | .01% | | -% F | | -% F | | -% F |
| Expenses net of fee waivers, if any | | | | .01% | | -% F | | -% F | | -% F |
| Expenses net of all reductions | | -% F | | .01% | | -% F | | -% F | | -% F |
| Net investment income (loss) | | 2.15% | | 2.41% | | 2.29% | | 2.13% | | 2.70% |
| Supplemental Data | | | | | | | | | | |
| Net assets, end of period (000 omitted) | $ | 5,728,681 | $ | 4,517,559 | $ | 5,407,197 | $ | 6,065,145 | $ | 3,914,417 |
Portfolio turnover rate G | | | | 15% H | | 19% H | | 19% | | 14% |
ACalculated based on average shares outstanding during the period.
BNet investment income (loss) is affected by the timing of the declaration of dividends by any underlying mutual funds or exchange-traded funds (ETFs). Net investment income (loss) of any mutual funds or ETFs is not included in the Fund's net investment income (loss) ratio.
CTotal returns would have been lower if certain expenses had not been reduced during the applicable periods shown.
DFees and expenses of any underlying mutual funds or exchange-traded funds (ETFs) are not included in the Fund's expense ratio. The Fund indirectly bears its proportionate share of these expenses. For additional expense information related to investments in Fidelity Central Funds, please refer to the "Investments in Fidelity Central Funds" note found in the Notes to Financial Statements section of the most recent Annual or Semi-Annual report.
EExpense ratios reflect operating expenses of the class. Expenses before reductions do not reflect amounts reimbursed, waived, or reduced through arrangements with the investment adviser, brokerage services, or other offset arrangements, if applicable, and do not represent the amount paid by the class during periods when reimbursements, waivers or reductions occur.
FAmount represents less than .005%.
GAmount does not include the portfolio activity of any underlying mutual funds or exchange-traded funds (ETFs).
HPortfolio turnover rate excludes securities received or delivered in-kind.
Notes to Financial Statements
For the period ended October 31, 2024
1. Organization.
Fidelity Series Canada Fund (the Fund) is a fund of Fidelity Investment Trust (the Trust) and is authorized to issue an unlimited number of shares. Shares are offered only to certain other Fidelity funds, Fidelity managed 529 plans, and Fidelity managed collective investment trusts. The Trust is registered under the Investment Company Act of 1940, as amended (the 1940 Act), as an open-end management investment company organized as a Massachusetts business trust.
2. Investments in Fidelity Central Funds.
Funds may invest in Fidelity Central Funds, which are open-end investment companies generally available only to other investment companies and accounts managed by the investment adviser and its affiliates. The Schedule of Investments lists any Fidelity Central Funds held as an investment as of period end, but does not include the underlying holdings of each Fidelity Central Fund. An investing fund indirectly bears its proportionate share of the expenses of the underlying Fidelity Central Funds.
Based on its investment objective, each Fidelity Central Fund may invest or participate in various investment vehicles or strategies that are similar to those of the investing fund. These strategies are consistent with the investment objectives of the investing fund and may involve certain economic risks which may cause a decline in value of each of the Fidelity Central Funds and thus a decline in the value of the investing fund.
| Fidelity Central Fund | Investment Manager | Investment Objective | Investment Practices | Expense RatioA |
| Fidelity Money Market Central Funds | Fidelity Management & Research Company LLC (FMR) | Each fund seeks to obtain a high level of current income consistent with the preservation of capital and liquidity. | Short-term Investments | Less than .005% |
A Expenses expressed as a percentage of average net assets and are as of each underlying Central Fund's most recent annual or semi-annual shareholder report.
A complete unaudited list of holdings for each Fidelity Central Fund is available upon request or at the Securities and Exchange Commission website at www.sec.gov. In addition, the financial statements of the Fidelity Central Funds which contain the significant accounting policies (including investment valuation policies) of those funds, and are not covered by the Report of Independent Registered Public Accounting Firm, are available on the Securities and Exchange Commission website or upon request.
3. Significant Accounting Policies.
The Fund is an investment company and applies the accounting and reporting guidance of the Financial Accounting Standards Board (FASB) Accounting Standards Codification Topic 946 Financial Services - Investment Companies. The financial statements have been prepared in conformity with accounting principles generally accepted in the United States of America (GAAP), which require management to make certain estimates and assumptions at the date of the financial statements. Actual results could differ from those estimates. Subsequent events, if any, through the date that the financial statements were issued have been evaluated in the preparation of the financial statements. The Fund's Schedule of Investments lists any underlying mutual funds or exchange-traded funds (ETFs) but does not include the underlying holdings of these funds. The following summarizes the significant accounting policies of the Fund:
Investment Valuation. Investments are valued as of 4:00 p.m. Eastern time on the last calendar day of the period. The Board of Trustees (the Board) has designated the Fund's investment adviser as the valuation designee responsible for the fair valuation function and performing fair value determinations as needed. The investment adviser has established a Fair Value Committee (the Committee) to carry out the day-to-day fair valuation responsibilities and has adopted policies and procedures to govern the fair valuation process and the activities of the Committee. In accordance with these fair valuation policies and procedures, which have been approved by the Board, the Fund attempts to obtain prices from one or more third party pricing services or brokers to value its investments. When current market prices, quotations or currency exchange rates are not readily available or reliable, investments will be fair valued in good faith by the Committee, in accordance with the policies and procedures. Factors used in determining fair value vary by investment type and may include market or investment specific events, transaction data, estimated cash flows, and market observations of comparable investments. The frequency that the fair valuation procedures are used cannot be predicted and they may be utilized to a significant extent. The Committee manages the Fund's fair valuation practices and maintains the fair valuation policies and procedures. The Fund's investment adviser reports to the Board information regarding the fair valuation process and related material matters.
The Fund categorizes the inputs to valuation techniques used to value its investments into a disclosure hierarchy consisting of three levels as shown below:
Level 1 - unadjusted quoted prices in active markets for identical investments
Level 2 - other significant observable inputs (including quoted prices for similar investments, interest rates, prepayment speeds, etc.)
Level 3 - unobservable inputs (including the Fund's own assumptions based on the best information available)
Valuation techniques used to value the Fund's investments by major category are as follows:
Equity securities, including restricted securities, for which market quotations are readily available, are valued at the last reported sale price or official closing price as reported by a third party pricing service on the primary market or exchange on which they are traded and are categorized as Level 1 in the hierarchy. In the event there were no sales during the day or closing prices are not available, securities are valued at the last quoted bid price or may be valued using the last available price and are generally categorized as Level 2 in the hierarchy. For foreign equity securities, when market or security specific events arise, comparisons to the valuation of American Depositary Receipts (ADRs), futures contracts, Exchange-Traded Funds (ETFs) and certain indexes as well as quoted prices for similar securities may be used and would be categorized as Level 2 in the hierarchy. For equity securities, including restricted securities, where observable inputs are limited, assumptions about market activity and risk are used and these securities may be categorized as Level 3 in the hierarchy.
Debt securities, including restricted securities, are valued based on evaluated prices received from third party pricing services or from brokers who make markets in such securities. Corporate bonds are valued by pricing services who utilize matrix pricing which considers yield or price of bonds of comparable quality, coupon, maturity and type or by broker-supplied prices. When independent prices are unavailable or unreliable, debt securities may be valued utilizing pricing methodologies which consider similar factors that would be used by third party pricing services. Debt securities are generally categorized as Level 2 in the hierarchy but may be Level 3 depending on the circumstances.
Investments in open-end mutual funds, including the Fidelity Central Funds, are valued at their closing net asset value (NAV) each business day and are categorized as Level 1 in the hierarchy.
Changes in valuation techniques may result in transfers in or out of an assigned level within the disclosure hierarchy. The aggregate value of investments by input level as of October 31, 2024 is included at the end of the Fund's Schedule of Investments.
Foreign Currency. Certain Funds may use foreign currency contracts to facilitate transactions in foreign-denominated securities. Gains and losses from these transactions may arise from changes in the value of the foreign currency or if the counterparties do not perform under the contracts' terms.
Foreign-denominated assets, including investment securities, and liabilities are translated into U.S. dollars at the exchange rates at period end. Purchases and sales of investment securities, income and dividends received, and expenses denominated in foreign currencies are translated into U.S. dollars at the exchange rate in effect on the transaction date.
The effects of exchange rate fluctuations on investments are included with the net realized and unrealized gain (loss) on investment securities. Other foreign currency transactions resulting in realized and unrealized gain (loss) are disclosed separately.
Investment Transactions and Income. For financial reporting purposes, the Fund's investment holdings and NAV include trades executed through the end of the last business day of the period. The NAV per share for processing shareholder transactions is calculated as of the close of business of the New York Stock Exchange (NYSE), normally 4:00 p.m. Eastern time and includes trades executed through the end of the prior business day. Gains and losses on securities sold are determined on the basis of identified cost. Commissions paid to certain brokers with whom the investment adviser, or its affiliates, places trades on behalf of a fund include an amount in addition to trade execution, which may be rebated back to a fund. Any such rebates are included in net realized gain (loss) on investments in the Statement of Operations. Dividend income is recorded on the ex-dividend date, except for certain dividends from foreign securities where the ex-dividend date may have passed, which are recorded as soon as the Fund is informed of the ex-dividend date. Non-cash dividends included in dividend income, if any, are recorded at the fair market value of the securities received. Income and capital gain distributions from Fidelity Central Funds, if any, are recorded on the ex-dividend date. Certain distributions received by the Fund represent a return of capital or capital gain. The Fund determines the components of these distributions subsequent to the ex-dividend date, based upon receipt of tax filings or other correspondence relating to the underlying investment. These distributions are recorded as a reduction of cost of investments and/or as a realized gain. Interest income is accrued as earned and includes coupon interest and amortization of premium and accretion of discount on debt securities as applicable. Investment income is recorded net of foreign taxes withheld where recovery of such taxes is uncertain.
Expenses. Expenses directly attributable to a fund are charged to that fund. Expenses attributable to more than one fund are allocated among the respective funds on the basis of relative net assets or other appropriate methods. Expenses included in the accompanying financial statements reflect the expenses of that fund and do not include any expenses associated with any underlying mutual funds or exchange-traded funds. Although not included in a fund's expenses, a fund indirectly bears its proportionate share of these expenses through the net asset value of each underlying mutual fund or exchange-traded fund. Expense estimates are accrued in the period to which they relate and adjustments are made when actual amounts are known.
Income Tax Information and Distributions to Shareholders. Each year, the Fund intends to qualify as a regulated investment company under Subchapter M of the Internal Revenue Code, including distributing substantially all of its taxable income and realized gains. As a result, no provision for U.S. Federal income taxes is required. As of October 31, 2024, the Fund did not have any unrecognized tax benefits in the financial statements; nor is the Fund aware of any tax positions for which it is reasonably possible that the total amounts of unrecognized tax benefits will significantly change in the next twelve months. The Fund files a U.S. federal tax return, in addition to state and local tax returns as required. The Fund's federal income tax returns are subject to examination by the Internal Revenue Service (IRS) for a period of three fiscal years after they are filed. State and local tax returns may be subject to examination for an additional fiscal year depending on the jurisdiction. Foreign taxes are provided for based on the Fund's understanding of the tax rules and rates that exist in the foreign markets in which it invests.
Distributions are declared and recorded on the ex-dividend date. Income and capital gain distributions are determined in accordance with income tax regulations, which may differ from GAAP. In addition, the Fund claimed a portion of the payment made to redeeming shareholders as a distribution for income tax purposes.
Capital accounts within the financial statements are adjusted for permanent book-tax differences. These adjustments have no impact on net assets or the results of operations. Capital accounts are not adjusted for temporary book-tax differences which will reverse in a subsequent period.
Book-tax differences are primarily due to foreign currency transactions, passive foreign investment companies (PFIC), redemptions in-kind, and losses deferred due to wash sales.
As of period end, the cost and unrealized appreciation (depreciation) in securities, and derivatives if applicable, for federal income tax purposes were as follows:
| Gross unrealized appreciation | $1,954,021,272 |
| Gross unrealized depreciation | (92,584,204) |
| Net unrealized appreciation (depreciation) | $1,861,437,068 |
| Tax Cost | $4,050,172,372 |
The tax-based components of distributable earnings as of period end were as follows:
| Undistributed ordinary income | $120,874,234 |
| Undistributed long-term capital gain | $21,360,927 |
| Net unrealized appreciation (depreciation) on securities and other investments | $1,860,586,734 |
The tax character of distributions paid was as follows:
| | October 31, 2024 | October 31, 2023 |
| Ordinary Income | $130,381,444 | $ 157,465,462 |
| Long-term Capital Gains | 42,657,781 | 3,141,456 |
| Total | $173,039,225 | $ 160,606,918 |
Restricted Securities (including Private Placements). Funds may invest in securities that are subject to legal or contractual restrictions on resale. These securities generally may be resold in transactions exempt from registration or to the public if the securities are registered. Disposal of these securities may involve time-consuming negotiations and expense, and prompt sale at an acceptable price may be difficult. Information regarding restricted securities held at period end is included at the end of the Schedule of Investments, if applicable.
New Accounting Pronouncement. In November 2023, the FASB issued Accounting Standards Update (ASU) 2023-07 Segment Reporting (Topic 280): Improvements to Reportable Segment Disclosures. Effective for fiscal years beginning after December 15, 2023 and interim periods within fiscal years beginning after December 15, 2024, the amendments enhance required disclosures of segment information for public entities on an annual and interim basis. The ASU allows for early adoption with updates applied retrospectively. Management is currently evaluating the impact of the ASU but does not expect this guidance to materially impact the financial statements.
4. Purchases and Sales of Investments.
Purchases and sales of securities, other than short-term securities and in-kind transactions, as applicable, are noted in the table below.
| | Purchases ($) | Sales ($) |
| Fidelity Series Canada Fund | 842,708,976 | 455,719,398 |
Unaffiliated Redemptions In-Kind. Shares that were redeemed in-kind for investments, including accrued interest and cash, if any, are shown in the table below. The net realized gain or loss on investments delivered through in-kind redemptions is included in the "Net realized gain (loss) on: Redemptions in-kind" line in the accompanying Statement of Operations. The amount of the in-kind redemptions is included in share transactions in the accompanying Statement of Changes in Net Assets. There was no gain or loss for federal income tax purposes.
| | Shares | Total net realized gain or loss ($) | Total Proceeds ($) |
| Fidelity Series Canada Fund | 15,127,360 | 115,673,311 | 230,383,973 |
Prior Fiscal Year Unaffiliated Redemptions In-Kind. Shares that were redeemed in-kind for investments, including accrued interest and cash, if any, are shown in the table below; along with realized gain or loss on investments delivered through in-kind redemptions. The amount of the in-kind redemptions is included in share transactions in the accompanying Statement of Changes in Net Assets. There was no gain or loss for federal income tax purposes.
| | Shares | Total net realized gain or loss ($) | Total Proceeds ($) |
| Fidelity Series Canada Fund | 10,679,138 | 69,630,912 | 146,531,701 |
5. Fees and Other Transactions with Affiliates.
Management Fee. Fidelity Management & Research Company LLC (the investment adviser) and its affiliates provide the Fund with investment management related services for which the Fund does not pay a management fee. Under the management contract, the investment adviser or an affiliate pays all ordinary operating expenses of the Fund, except custody fees, fees and expenses of the independent Trustees, and certain miscellaneous expenses such as proxy and shareholder meeting expenses.
Interfund Lending Program. Pursuant to an Exemptive Order issued by the Securities and Exchange Commission (the SEC), the Fund, along with other registered investment companies having management contracts with Fidelity Management & Research Company LLC (FMR), or other affiliated entities of FMR, may participate in an interfund lending program. This program provides an alternative credit facility allowing the Fund to borrow from, or lend money to, other participating affiliated funds at rates that are beneficial to both the borrowing and lending fund. Borrowings under the program are generally for temporary or emergency purposes, including meeting fund shareholder redemptions. The interfund loan rate is determined, as specified in the Exemptive Order, by averaging, (1) the higher of the overnight time deposit rate and the current overnight repurchase agreement rate, and (2) a benchmark rate representing the lowest bank loan rate available to the funds. At period end, there were no interfund loans outstanding. Activity in this program during the period for which loans were outstanding was as follows:
| | Borrower or Lender | Average Loan Balance ($) | Weighted Average Interest Rate | Interest Expense ($) |
| Fidelity Series Canada Fund | Borrower | 22,284,667 | 5.58% | 10,365 |
Interfund Trades. Funds may purchase from or sell securities to other Fidelity Funds under procedures adopted by the Board. The procedures have been designed to ensure these interfund trades are executed in accordance with Rule 17a-7 of the 1940 Act. Any interfund trades are included within the respective purchases and sales amounts shown in the Purchases and Sales of Investments note. Interfund trades during the period are noted in the table below.
| | Purchases ($) | Sales ($) | Realized Gain (Loss)($) |
| Fidelity Series Canada Fund | 56,228,513 | 16,709,831 | 2,805,247 |
Sub-Advisory Arrangements. Effective March 1, 2024, the Fund's sub-advisory agreements with FMR Investment Management (UK) Limited, Fidelity Management & Research (Hong Kong) Limited, and Fidelity Management & Research (Japan) Limited were amended to provide that the investment adviser pays each sub-adviser monthly fees equal to 110% of the sub-adviser's costs for providing sub-advisory services.
6. Committed Line of Credit.
Certain Funds participate with other funds managed by the investment adviser or an affiliate in a $4.25 billion credit facility (the "line of credit") to be utilized for temporary or emergency purposes to fund shareholder redemptions or for other short-term liquidity purposes. The commitment fees on the pro-rata portion of the line of credit are borne by the investment adviser. During the period, there were no borrowings on this line of credit.
7. Security Lending.
Funds lend portfolio securities from time to time in order to earn additional income. Lending agents are used, including National Financial Services (NFS), an affiliate of the investment adviser. Pursuant to a securities lending agreement, NFS will receive a fee, which is capped at 9.9% of a fund's daily lending revenue, for its services as lending agent. A fund may lend securities to certain qualified borrowers, including NFS. On the settlement date of the loan, a fund receives collateral (in the form of U.S. Treasury obligations, letters of credit and/or cash) against the loaned securities and maintains collateral in an amount not less than 100% of the market value of the loaned securities during the period of the loan. The market value of the loaned securities is determined at the close of business of a fund and any additional required collateral is delivered to a fund on the next business day. A fund or borrower may terminate the loan at any time, and if the borrower defaults on its obligation to return the securities loaned because of insolvency or other reasons, a fund may apply collateral received from the borrower against the obligation. A fund may experience delays and costs in recovering the securities loaned. Any cash collateral received is invested in the Fidelity Securities Lending Cash Central Fund. Any loaned securities are identified as such in the Schedule of Investments, and the value of loaned securities and cash collateral at period end, as applicable, are presented in the Statement of Assets and Liabilities. Security lending income represents the income earned on investing cash collateral, less rebates paid to borrowers and any lending agent fees associated with the loan, plus any premium payments received for lending certain types of securities. Security lending income is presented in the Statement of Operations as a component of income from Fidelity Central Funds. Affiliated security lending activity, if any, was as follows:
| | Total Security Lending Fees Paid to NFS ($) | Security Lending Income From Securities Loaned to NFS ($) | Value of Securities Loaned to NFS at Period End ($) |
| Fidelity Series Canada Fund | 276,023 | - | - |
8. Other.
A fund's organizational documents provide former and current trustees and officers with a limited indemnification against liabilities arising in connection with the performance of their duties to the fund. In the normal course of business, a fund may also enter into contracts that provide general indemnifications. A fund's maximum exposure under these arrangements is unknown as this would be dependent on future claims that may be made against a fund. The risk of material loss from such claims is considered remote.
At the end of the period, mutual funds and accounts managed by the investment adviser or its affiliates were the owners of record of all of the outstanding shares of the Fund.
9. Risk and Uncertainties.
Many factors affect a fund's performance. Developments that disrupt global economies and financial markets, such as pandemics, epidemics, outbreaks of infectious diseases, war, terrorism, and environmental disasters, may significantly affect a fund's investment performance. The effects of these developments to a fund will be impacted by the types of securities in which a fund invests, the financial condition, industry, economic sector, and geographic location of an issuer, and a fund's level of investment in the securities of that issuer. Significant concentrations in security types, issuers, industries, sectors, and geographic locations may magnify the factors that affect a fund's performance.
Report of Independent Registered Public Accounting Firm
To the Board of Trustees of Fidelity Investment Trust and Shareholders of Fidelity Series Canada Fund
Opinion on the Financial Statements
We have audited the accompanying statement of assets and liabilities, including the schedule of investments, of Fidelity Series Canada Fund (one of the funds constituting Fidelity Investment Trust, referred to hereafter as the "Fund") as of October 31, 2024, the related statement of operations for the year ended October 31, 2024, the statement of changes in net assets for each of the two years in the period ended October 31, 2024, including the related notes, and the financial highlights for each of the five years in the period ended October 31, 2024 (collectively referred to as the "financial statements"). In our opinion, the financial statements present fairly, in all material respects, the financial position of the Fund as of October 31, 2024, the results of its operations for the year then ended, the changes in its net assets for each of the two years in the period ended October 31, 2024 and the financial highlights for each of the five years in the period ended October 31, 2024 in conformity with accounting principles generally accepted in the United States of America.
Basis for Opinion
These financial statements are the responsibility of the Fund's management. Our responsibility is to express an opinion on the Fund's financial statements based on our audits. We are a public accounting firm registered with the Public Company Accounting Oversight Board (United States) (PCAOB) and are required to be independent with respect to the Fund in accordance with the U.S. federal securities laws and the applicable rules and regulations of the Securities and Exchange Commission and the PCAOB.
We conducted our audits of these financial statements in accordance with the standards of the PCAOB. Those standards require that we plan and perform the audit to obtain reasonable assurance about whether the financial statements are free of material misstatement, whether due to error or fraud.
Our audits included performing procedures to assess the risks of material misstatement of the financial statements, whether due to error or fraud, and performing procedures that respond to those risks. Such procedures included examining, on a test basis, evidence regarding the amounts and disclosures in the financial statements. Our audits also included evaluating the accounting principles used and significant estimates made by management, as well as evaluating the overall presentation of the financial statements. Our procedures included confirmation of securities owned as of October 31, 2024 by correspondence with the custodian, issuers of privately offered securities and brokers. We believe that our audits provide a reasonable basis for our opinion.
/s/ PricewaterhouseCoopers LLP
Boston, Massachusetts
December 17, 2024
We have served as the auditor of one or more investment companies in the Fidelity group of funds since 1932.
Distributions
(Unaudited)
The dividend and capital gains distributions for the fund(s) are available on Fidelity.com or Institutional.Fidelity.com.
The fund hereby designates as a capital gain dividend with respect to the taxable year ended October 31, 2024, $28,179,519, or, if subsequently determined to be different, the net capital gain of such year.
The fund designates $1,633,194 of distributions paid during the fiscal year ended 2024 as qualifying to be taxed as section 163(j) interest dividends.
The fund designates 31.48% of the dividends distributed during the fiscal year as amounts which may be taken into account as a dividend for the purposes of the maximum rate under section 1(h)(11) of the Internal Revenue Code.
The amounts per share which represent income derived from sources within, and taxes paid to, foreign countries or possessions of the United States are $.3916 and $.0199 for the dividend paid December 11, 2023.
The fund will notify shareholders in January 2025 of amounts for use in preparing 2024 income tax returns.
Item 8: Changes in and Disagreements with Accountants for Open-End Management Investment Companies
(Unaudited)
Note: This is not applicable for any fund included in this document.
Item 9: Proxy Disclosures for Open-End Management Investment Companies
(Unaudited)
| A special meeting of shareholders was held on July 16, 2024. The results of votes taken among shareholders on the proposal before them are reported below. Each vote reported represents one dollar of net asset value held on the record date for the meeting. |
| Proposal 1 |
| To elect a Board of Trustees. |
| | # of Votes | % of Votes |
| Bettina Doulton |
| Affirmative | 128,529,177,643.56 | 98.18 |
| Withheld | 2,378,037,364.30 | 1.82 |
| TOTAL | 130,907,215,007.85 | 100.00 |
| Robert A. Lawrence |
| Affirmative | 128,253,389,899.05 | 97.97 |
| Withheld | 2,653,825,108.81 | 2.03 |
| TOTAL | 130,907,215,007.85 | 100.00 |
| Vijay C. Advani |
| Affirmative | 128,531,418,228.19 | 98.19 |
| Withheld | 2,375,796,779.66 | 1.81 |
| TOTAL | 130,907,215,007.85 | 100.00 |
| Thomas P. Bostick |
| Affirmative | 128,495,261,591.41 | 98.16 |
| Withheld | 2,411,953,416.44 | 1.84 |
| TOTAL | 130,907,215,007.85 | 100.00 |
| Donald F. Donahue |
| Affirmative | 128,407,878,996.00 | 98.09 |
| Withheld | 2,499,336,011.85 | 1.91 |
| TOTAL | 130,907,215,007.85 | 100.00 |
| Vicki L. Fuller |
| Affirmative | 128,625,540,095.19 | 98.26 |
| Withheld | 2,281,674,912.66 | 1.74 |
| TOTAL | 130,907,215,007.85 | 100.00 |
| Patricia L. Kampling |
| Affirmative | 128,668,729,281.34 | 98.29 |
| Withheld | 2,238,485,726.51 | 1.71 |
| TOTAL | 130,907,215,007.85 | 100.00 |
| Thomas A. Kennedy |
| Affirmative | 128,499,824,239.79 | 98.16 |
| Withheld | 2,407,390,768.06 | 1.84 |
| TOTAL | 130,907,215,007.85 | 100.00 |
| Oscar Munoz |
| Affirmative | 128,386,109,391.05 | 98.07 |
| Withheld | 2,521,105,616.80 | 1.93 |
| TOTAL | 130,907,215,007.85 | 100.00 |
| Karen B. Peetz |
| Affirmative | 128,603,731,113.82 | 98.24 |
| Withheld | 2,303,483,894.03 | 1.76 |
| TOTAL | 130,907,215,007.85 | 100.00 |
| David M. Thomas |
| Affirmative | 128,384,899,342.98 | 98.07 |
| Withheld | 2,522,315,664.88 | 1.93 |
| TOTAL | 130,907,215,007.85 | 100.00 |
| Susan Tomasky |
| Affirmative | 128,556,148,461.60 | 98.20 |
| Withheld | 2,351,066,546.25 | 1.80 |
| TOTAL | 130,907,215,007.85 | 100.00 |
| Michael E. Wiley |
| Affirmative | 128,264,934,978.34 | 97.98 |
| Withheld | 2,642,280,029.51 | 2.02 |
| TOTAL | 130,907,215,007.85 | 100.00 |
| | | |
| Proposal 1 reflects trust-wide proposal and voting results. |
Item 10: Remuneration Paid to Directors, Officers, and others of Open-End Management Investment Companies
(Unaudited)
Note: This information is disclosed as part of the financial statements for each Fund as part of Item 7: Financial Statements and Financial Highlights for Open-End Management Investment companies.
Item 11: Statement Regarding Basis for Approval of Investment Advisory Contract
(Unaudited)
Board Approval of Investment Advisory Contracts and Management Fees
Fidelity Series Canada Fund
Each year, the Board of Trustees, including the Independent Trustees (together, the Board), considers the renewal of the fund's management contract with Fidelity Management & Research Company LLC (FMR) and the sub-advisory agreements (together, the Advisory Contracts) for the fund. FMR and the sub-advisers are referred to herein as the Investment Advisers. The Board, assisted by the advice of fund counsel and Independent Trustees' counsel, requests and considers a broad range of information relevant to the renewal of the Advisory Contracts throughout the year.
The Board meets regularly and, at each of its meetings, covers an extensive agenda of topics and materials and considers factors that are relevant to its annual consideration of the renewal of the fund's Advisory Contracts, including the services and support provided to the fund and its shareholders. The Board, acting directly and through its Committees (each of which is composed of and chaired by Independent Trustees), requests and receives information concerning the annual consideration of the renewal of the fund's Advisory Contracts. The Board also meets as needed to review matters specifically related to the Board's annual consideration of the renewal of the Advisory Contracts. Members of the Board may also meet with trustees of other Fidelity funds through joint ad hoc committees to discuss certain matters relevant to all of the Fidelity funds.
At its May 2024 meeting, the Board unanimously determined to renew the fund's Advisory Contracts. The Board considered all factors it believed relevant and reached a determination, with the assistance of fund counsel and Independent Trustees' counsel and through the exercise of its business judgment, that the renewal of the Advisory Contracts was in the best interests of the fund and its shareholders and the fact that no fee is payable under the management contract was fair and reasonable in light of all of the surrounding circumstances.
Nature, Extent, and Quality of Services Provided. The Board considered staffing as it relates to the fund, including the backgrounds and experience of investment personnel of the Investment Advisers, and also considered the Investment Advisers' implementation of the fund's investment program. The Independent Trustees also had discussions with senior management of Fidelity's investment operations and investment groups. The Board considered the structure of the investment personnel compensation program and whether this structure provides appropriate incentives to act in the best interests of the fund.
Resources Dedicated to Investment Management and Support Services. The Board and the Fund Oversight and Research Committees reviewed the general qualifications and capabilities of Fidelity's investment staff, including its size, education, experience, and resources, as well as Fidelity's approach to recruiting, training, managing, and compensating investment personnel. The Board noted the resources devoted to expansion of Fidelity's global investment organization, and that Fidelity's analysts have extensive resources, tools, and capabilities that allow them to conduct sophisticated quantitative and fundamental analysis, as well as credit analysis of issuers, counterparties, and guarantors. Further, the Board considered that Fidelity's investment professionals have sufficient access to global information and data so as to provide competitive investment results over time, and that those professionals also have access to sophisticated tools that permit them to assess portfolio construction and risk and performance attribution characteristics continuously, as well as to transmit new information and research conclusions rapidly around the world. Additionally, in its deliberations, the Board considered Fidelity's trading, risk management, compliance, and technology and operations capabilities and resources, which are integral parts of the investment management process.
Administrative Services. The Board considered (i) the nature, extent, quality, and cost of advisory and administrative services performed by the Investment Advisers and their affiliates under the Advisory Contracts and under separate agreements covering transfer agency and pricing and bookkeeping services for the fund; (ii) the nature and extent of Fidelity's supervision of third party service providers, principally custodians, subcustodians, and pricing vendors; and (iii) the resources devoted by Fidelity to, and the record of compliance with, the fund's compliance policies and procedures. The Board also reviewed the allocation of fund brokerage, including allocations to brokers affiliated with the Investment Advisers, the use of brokerage commissions to pay fund expenses, and the use of "soft" commission dollars to pay for research services. The Board also considered the fund's securities lending activities and any payments made to Fidelity relating to securities lending under a separate agreement.
Investment Performance. The Board reviewed the fund's absolute investment performance, as well as the fund's relative investment performance and noted that the fund is not publicly offered as a stand-alone investment product. In this regard, the Board noted that the fund is designed to offer an investment option for other investment companies, 529 plans, and collective investment trusts managed by Fidelity and ultimately to enhance the performance of those investment companies, 529 plans, and collective investment trusts.
Based on its review, the Board concluded that the nature, extent, and quality of services provided to the fund under the Advisory Contracts should continue to benefit the shareholders of the fund.
Competitiveness of Management Fee and Total Expense Ratio. The Board considered that the fund does not pay FMR a management fee for investment advisory services, but that FMR receives fees for providing services to funds that invest in the fund. The Board noted that FMR or an affiliate undertakes to pay all operating expenses of the fund, except transfer agent fees, 12b-1 fees, Independent Trustee fees and expenses, custodian fees and expenses, proxy and shareholder meeting expenses, interest, taxes, and extraordinary expenses (such as litigation expenses). The Board further noted that the fund pays its non-operating expenses, including brokerage commissions and fees and expenses associated with the fund's securities lending program, if applicable.
The Board further considered that FMR has contractually agreed to reimburse the fund to the extent that total operating expenses, with certain exceptions, as a percentage of its average net assets, exceed 0.013% through February 28, 2027.
Based on its review, the Board considered that the fund does not pay a management fee and concluded that the total expense ratio of the fund was reasonable in light of the services that the fund and its shareholders receive and the other factors considered.
Costs of the Services and Profitability. The Board considered the level of Fidelity's profits in respect of all the Fidelity funds.
A public accounting firm has been engaged annually by the Board as part of the Board's assessment of Fidelity's profitability analysis. The engagement includes the review and assessment of the methodologies used by Fidelity in determining the revenues and expenses attributable to Fidelity's fund business, and completion of agreed-upon procedures in respect of the mathematical accuracy of certain fund profitability information and its conformity to established allocation methodologies. After considering the reports issued under the engagement and information provided by Fidelity, the Board concluded that while other allocation methods may also be reasonable, Fidelity's profitability methodologies are reasonable in all material respects.
The Board also reviewed Fidelity's non-fund businesses and potential indirect benefits such businesses may have received as a result of their association with Fidelity's fund business (i.e., fall-out benefits) as well as cases where Fidelity's affiliates may benefit from the funds' business. The Board considered areas where potential indirect benefits to the Fidelity funds from their relationships with Fidelity may exist. The Board's consideration of these matters was informed by the findings of a joint ad hoc committee created by it and the boards of other Fidelity funds to evaluate potential fall-out benefits.
The Board concluded that the costs of the services provided by and the profits realized by Fidelity in connection with the operation of the fund were not relevant to the renewal of the Advisory Contracts because the fund pays no advisory fees and FMR bears all expenses of the fund with certain exceptions.
Economies of Scale. The Board concluded that because the fund pays no advisory fees and FMR bears all expenses of the fund with certain exceptions, the realization of economies of scale was not a material factor in the Board's decision to renew the fund's Advisory Contracts.
Additional Information Requested by the Board. In order to develop fully the factual basis for consideration of the Fidelity funds' advisory contracts, the Board requested and received additional information on certain topics, including but not limited to: (i) fund flow and performance trends, in particular the underperformance of certain funds and strategies, and Fidelity's long-term strategies for certain funds; (ii) the operation of performance fees and the rationale for implementing performance fees on certain categories of funds but not others; (iii) Fidelity's pricing philosophy compared to competitors; (iv) fund profitability methodology and data; (v) evaluation of competitive fund data and peer group classifications and fee and expense comparisons; (vi) the management fee and expense structures for different funds and classes and information about the differences between various fee and expense structures; (vii) the variable management fee implemented for certain funds effective March 1, 2024; and (viii) information regarding other accounts managed by Fidelity and the funds' sub-advisory arrangements.
Conclusion. Based on its evaluation of all of the conclusions noted above, and after considering all factors it believed relevant, the Board, including the Independent Trustees, concluded that the advisory and sub-advisory fee arrangements are fair and reasonable in light of all of the surrounding circumstances and that the fund's Advisory Contracts should be renewed through May 31, 2025.
1.9883882.107
SAD-ANN-1224
Fidelity® SAI International SMA Completion Fund
Annual Report
October 31, 2024
Offered exclusively to certain clients of the Adviser, or its affiliates, including Strategic Advisers LLC (Strategic Advisers) - not available for sale to the general public. Fidelity® SAI is a product name of Fidelity® funds dedicated to certain programs affiliated with Strategic Advisers.
Contents
To view a fund's proxy voting guidelines and proxy voting record for the 12-month period ended June 30, visit http://www.fidelity.com/proxyvotingresults or visit the Securities and Exchange Commission's (SEC) web site at http://www.sec.gov.
You may also call 1-800-544-3455 to request a free copy of the proxy voting guidelines.
Standard & Poor's, S&P and S&P 500 are registered service marks of The McGraw-Hill Companies, Inc. and have been licensed for use by Fidelity Distributors Corporation.
Other third-party marks appearing herein are the property of their respective owners.
All other marks appearing herein are registered or unregistered trademarks or service marks of FMR LLC or an affiliated company. © 2024 FMR LLC. All rights reserved.
This report and the financial statements contained herein are submitted for the general information of the shareholders of the Fund. This report is not authorized for distribution to prospective investors in the Fund unless preceded or accompanied by an effective prospectus.
A fund files its complete schedule of portfolio holdings with the SEC for the first and third quarters of each fiscal year on Form N-PORT. Forms N-PORT are available on the SEC's web site at http://www.sec.gov. A fund's Forms N-PORT may be reviewed and copied at the SEC's Public Reference Room in Washington, DC. Information regarding the operation of the SEC's Public Reference Room may be obtained by calling 1-800-SEC-0330.
For a complete list of a fund's portfolio holdings, view the most recent holdings listing, semiannual report, or annual report on Fidelity's web site at http://www.fidelity.com, http://www.institutional.fidelity.com, or http://www.401k.com, as applicable.
NOT FDIC INSURED •MAY LOSE VALUE •NO BANK GUARANTEE
Neither the Fund nor Fidelity Distributors Corporation is a bank.
Item 7: Financial Statements and Financial Highlights for Open-End Management Investment Companies (Annual Report)
Fidelity® SAI International SMA Completion Fund
Schedule of Investments October 31, 2024
Showing Percentage of Net Assets
| Common Stocks - 95.7% |
| | | Shares | Value ($) |
| Australia - 4.2% | | | |
| Aristocrat Leisure Ltd. | | 560,343 | 22,548,008 |
| CAR Group Ltd. | | 225,961 | 5,565,653 |
| Steadfast Group Ltd. | | 1,618,882 | 5,830,336 |
TOTAL AUSTRALIA | | | 33,943,997 |
| Belgium - 2.9% | | | |
| UCB SA | | 121,600 | 23,385,407 |
| Canada - 9.8% | | | |
| Alimentation Couche-Tard, Inc. (multi-vtg.) | | 445,100 | 23,211,629 |
| Constellation Software, Inc. | | 11,636 | 35,091,773 |
| Constellation Software, Inc. warrants 3/31/40 (a)(b) | | 10,836 | 1 |
| Ivanhoe Mines Ltd. (a)(c) | | 1,427,400 | 18,873,440 |
| MEG Energy Corp. | | 133,500 | 2,440,173 |
TOTAL CANADA | | | 79,617,016 |
| France - 3.9% | | | |
| Capgemini SA | | 25,285 | 4,386,463 |
| Sartorius Stedim Biotech | | 19,300 | 3,848,122 |
| Thales SA | | 143,389 | 23,107,161 |
TOTAL FRANCE | | | 31,341,746 |
| Germany - 5.1% | | | |
| Fresenius SE & Co. KGaA (a) | | 444,500 | 16,207,083 |
| Hannover Reuck SE | | 93,982 | 24,688,284 |
TOTAL GERMANY | | | 40,895,367 |
| India - 5.3% | | | |
| Axis Bank Ltd. | | 730,378 | 10,033,052 |
| HDFC Bank Ltd. | | 480,778 | 9,881,989 |
| Reliance Industries Ltd. (a) | | 717,571 | 11,264,773 |
| Reliance Industries Ltd. | | 717,571 | 11,345,911 |
TOTAL INDIA | | | 42,525,725 |
| Indonesia - 2.2% | | | |
| PT Bank Central Asia Tbk | | 27,812,287 | 18,000,016 |
| Ireland - 2.9% | | | |
| Kingspan Group PLC (Ireland) | | 270,807 | 23,757,096 |
| Italy - 1.7% | | | |
| FinecoBank SpA | | 438,676 | 7,007,239 |
| Prysmian SpA | | 96,800 | 6,825,170 |
TOTAL ITALY | | | 13,832,409 |
| Japan - 24.7% | | | |
| BayCurrent Consulting, Inc. | | 280,100 | 9,102,989 |
| Capcom Co. Ltd. | | 451,300 | 8,930,534 |
| Fast Retailing Co. Ltd. | | 73,900 | 23,627,420 |
| Fuji Electric Co. Ltd. | | 356,500 | 18,155,799 |
| IHI Corp. | | 66,100 | 3,519,093 |
| Itochu Corp. | | 763,666 | 37,776,900 |
| Kansai Paint Co. Ltd. | | 205,500 | 3,346,906 |
| Keyence Corp. | | 56,724 | 25,605,990 |
| Mitsubishi Heavy Industries Ltd. | | 3,377,100 | 47,674,356 |
| Renesas Electronics Corp. | | 1,284,800 | 17,214,163 |
| Rohto Pharmaceutical Co. Ltd. | | 211,800 | 4,762,824 |
TOTAL JAPAN | | | 199,716,974 |
| Luxembourg - 1.1% | | | |
| CVC Capital Partners PLC (d) | | 421,900 | 8,852,600 |
| Netherlands - 3.0% | | | |
| BE Semiconductor Industries NV | | 99,600 | 10,610,810 |
| IMCD NV | | 86,510 | 13,743,488 |
TOTAL NETHERLANDS | | | 24,354,298 |
| Portugal - 0.8% | | | |
| Galp Energia SGPS SA | | 370,200 | 6,310,075 |
| Spain - 3.3% | | | |
| CaixaBank SA | | 4,370,005 | 26,629,777 |
| Sweden - 10.7% | | | |
| Atlas Copco AB (A Shares) | | 785,700 | 12,966,735 |
| Indutrade AB | | 1,213,506 | 32,870,260 |
| Investor AB (B Shares) | | 1,436,104 | 40,631,801 |
TOTAL SWEDEN | | | 86,468,796 |
| Switzerland - 3.9% | | | |
| Partners Group Holding AG | | 7,370 | 10,181,703 |
| Sika AG | | 76,384 | 21,273,061 |
TOTAL SWITZERLAND | | | 31,454,764 |
| United Kingdom - 5.7% | | | |
| B&M European Value Retail SA | | 973,787 | 4,866,898 |
| Big Yellow Group PLC | | 429,000 | 6,682,343 |
| Games Workshop Group PLC | | 42,200 | 6,508,009 |
| RS GROUP PLC | | 1,520,200 | 13,623,542 |
| Sage Group PLC | | 1,134,000 | 14,174,919 |
TOTAL UNITED KINGDOM | | | 45,855,711 |
| United States of America - 4.5% | | | |
| CRH PLC | | 100,900 | 9,628,887 |
| Schneider Electric SA | | 104,700 | 27,122,405 |
TOTAL UNITED STATES OF AMERICA | | | 36,751,292 |
| TOTAL COMMON STOCKS (Cost $652,981,434) | | | 773,693,066 |
| | | | |
| Money Market Funds - 6.3% |
| | | Shares | Value ($) |
| Fidelity Cash Central Fund 4.87% (e) | | 34,218,465 | 34,225,309 |
| Fidelity Securities Lending Cash Central Fund 4.87% (e)(f) | | 16,666,493 | 16,668,160 |
| TOTAL MONEY MARKET FUNDS (Cost $50,893,469) | | | 50,893,469 |
| | | | |
| TOTAL INVESTMENT IN SECURITIES - 102.0% (Cost $703,874,903) | 824,586,535 |
NET OTHER ASSETS (LIABILITIES) - (2.0)% | (16,385,248) |
| NET ASSETS - 100.0% | 808,201,287 |
| | |
Legend
| (c) | Security or a portion of the security is on loan at period end. |
| (d) | Security exempt from registration under Rule 144A of the Securities Act of 1933. These securities may be resold in transactions exempt from registration, normally to qualified institutional buyers. At the end of the period, the value of these securities amounted to $8,852,600 or 1.1% of net assets. |
| (e) | Affiliated fund that is generally available only to investment companies and other accounts managed by Fidelity Investments. The rate quoted is the annualized seven-day yield of the fund at period end. A complete unaudited listing of the fund's holdings as of its most recent quarter end is available upon request. In addition, each Fidelity Central Fund's financial statements, which are not covered by the Fund's Report of Independent Registered Public Accounting Firm, are available on the SEC's website or upon request. |
| (f) | Investment made with cash collateral received from securities on loan. |
Affiliated Central Funds
Fiscal year to date information regarding the Fund's investments in Fidelity Central Funds, including the ownership percentage, is presented below.
| Affiliate | Value, beginning of period ($) | Purchases ($) | Sales Proceeds ($) | Dividend Income ($) | Realized Gain (loss) ($) | Change in Unrealized appreciation (depreciation) ($) | Value, end of period ($) | % ownership, end of period |
| Fidelity Cash Central Fund 4.87% | 68,161,995 | 238,912,807 | 272,849,337 | 1,943,122 | (156) | - | 34,225,309 | 0.1% |
| Fidelity Securities Lending Cash Central Fund 4.87% | - | 51,496,218 | 34,828,058 | 16,559 | - | - | 16,668,160 | 0.1% |
| Total | 68,161,995 | 290,409,025 | 307,677,395 | 1,959,681 | (156) | - | 50,893,469 | |
| | | | | | | | | |
Amounts in the dividend income column in the above table include any capital gain distributions from underlying funds, which are presented in the corresponding line item in the Statement of Operations, if applicable.
Amounts in the dividend income column for Fidelity Securities Lending Cash Central Fund represents the income earned on investing cash collateral, less rebates paid to borrowers and any lending agent fees associated with the loan, plus any premium payments received for lending certain types of securities.
Amounts included in the purchases and sales proceeds columns may include in-kind transactions, if applicable.
Investment Valuation
The following is a summary of the inputs used, as of October 31, 2024, involving the Fund's assets and liabilities carried at fair value. The inputs or methodology used for valuing securities may not be an indication of the risk associated with investing in those securities. For more information on valuation inputs, and their aggregation into the levels used below, please refer to the Investment Valuation section in the accompanying Notes to Financial Statements.
| Valuation Inputs at Reporting Date: |
| Description | Total ($) | Level 1 ($) | Level 2 ($) | Level 3 ($) |
Investments in Securities: | | | | |
|
| Equities: | | | | |
Communication Services | 14,496,187 | - | 14,496,187 | - |
Consumer Discretionary | 57,550,335 | 11,374,907 | 46,175,428 | - |
Consumer Staples | 27,974,453 | 23,211,629 | 4,762,824 | - |
Energy | 31,360,932 | 8,750,248 | 22,610,684 | - |
Financials | 161,736,797 | 91,361,627 | 70,375,170 | - |
Health Care | 43,440,612 | 43,440,612 | - | - |
Industrials | 270,244,994 | 113,926,717 | 156,318,277 | - |
Information Technology | 107,084,119 | 59,877,502 | 47,206,616 | 1 |
Materials | 53,122,294 | 49,775,388 | 3,346,906 | - |
Real Estate | 6,682,343 | 6,682,343 | - | - |
|
| Money Market Funds | 50,893,469 | 50,893,469 | - | - |
| Total Investments in Securities: | 824,586,535 | 459,294,442 | 365,292,092 | 1 |
Financial Statements
| Statement of Assets and Liabilities |
As of October 31, 2024 |
| Assets | | | | |
| Investment in securities, at value (including securities loaned of $14,839,468) - See accompanying schedule: | | | | |
Unaffiliated issuers (cost $652,981,434) | $ | 773,693,066 | | |
Fidelity Central Funds (cost $50,893,469) | | 50,893,469 | | |
| | | | | |
| | | | | |
| Total Investment in Securities (cost $703,874,903) | | | $ | 824,586,535 |
| Foreign currency held at value (cost $43,437) | | | | 43,427 |
| Receivable for fund shares sold | | | | 1,171,569 |
| Dividends receivable | | | | 1,097,650 |
| Reclaims receivable | | | | 601,641 |
| Distributions receivable from Fidelity Central Funds | | | | 93,752 |
Total assets | | | | 827,594,574 |
| Liabilities | | | | |
| Payable for investments purchased | $ | 649,265 | | |
| Payable for fund shares redeemed | | 539,138 | | |
| Deferred taxes | | 1,513,832 | | |
| Other payables and accrued expenses | | 22,892 | | |
| Collateral on securities loaned | | 16,668,160 | | |
| Total liabilities | | | | 19,393,287 |
| Net Assets | | | $ | 808,201,287 |
| Net Assets consist of: | | | | |
| Paid in capital | | | $ | 777,755,223 |
| Total accumulated earnings (loss) | | | | 30,446,064 |
| Net Assets | | | $ | 808,201,287 |
Net Asset Value, offering price and redemption price per share ($808,201,287 ÷ 66,294,384 shares) | | | $ | 12.19 |
| Statement of Operations |
| Year ended October 31, 2024 |
| Investment Income | | | | |
| Dividends | | | $ | 12,694,219 |
| Interest | | | | 5,199 |
| Income from Fidelity Central Funds (including $16,559 from security lending) | | | | 1,959,681 |
| Income before foreign taxes withheld | | | $ | 14,659,099 |
| Less foreign taxes withheld | | | | (1,378,632) |
| Total income | | | | 13,280,467 |
| Expenses | | | | |
| Independent trustees' fees and expenses | $ | 2,971 | | |
| Interest | | 1,346 | | |
| Proxy fee | | 19,309 | | |
| Total expenses before reductions | | 23,626 | | |
| Expense reductions | | (1) | | |
| Total expenses after reductions | | | | 23,625 |
| Net Investment income (loss) | | | | 13,256,842 |
| Realized and Unrealized Gain (Loss) | | | | |
| Net realized gain (loss) on: | | | | |
| Investment Securities: | | | | |
| Unaffiliated issuers (net of foreign taxes of $315,852) | | (22,390,990) | | |
| Fidelity Central Funds | | (156) | | |
| Foreign currency transactions | | (204,942) | | |
| Total net realized gain (loss) | | | | (22,596,088) |
| Change in net unrealized appreciation (depreciation) on: | | | | |
| Investment Securities: | | | | |
| Unaffiliated issuers (net of increase in deferred foreign taxes of $1,392,646) | | 133,324,522 | | |
| Assets and liabilities in foreign currencies | | (20,897) | | |
| Total change in net unrealized appreciation (depreciation) | | | | 133,303,625 |
| Net gain (loss) | | | | 110,707,537 |
| Net increase (decrease) in net assets resulting from operations | | | $ | 123,964,379 |
| Statement of Changes in Net Assets |
| |
| | Year ended October 31, 2024 | | Year ended October 31, 2023 |
| Increase (Decrease) in Net Assets | | | | |
| Operations | | | | |
| Net investment income (loss) | $ | 13,256,842 | $ | 12,058,422 |
| Net realized gain (loss) | | (22,596,088) | | (33,839,849) |
| Change in net unrealized appreciation (depreciation) | | 133,303,625 | | 46,040,455 |
| Net increase (decrease) in net assets resulting from operations | | 123,964,379 | | 24,259,028 |
| Distributions to shareholders | | (11,534,142) | | (6,168,818) |
| | | | | |
| Share transactions | | | | |
| Proceeds from sales of shares | | 256,386,701 | | 179,578,134 |
| Reinvestment of distributions | | 3,673,934 | | 1,847,861 |
| Cost of shares redeemed | | (92,749,910) | | (109,762,922) |
| | | | | |
Net increase (decrease) in net assets resulting from share transactions | | 167,310,725 | | 71,663,073 |
| Total increase (decrease) in net assets | | 279,740,962 | | 89,753,283 |
| | | | | |
| Net Assets | | | | |
| Beginning of period | | 528,460,325 | | 438,707,042 |
| End of period | $ | 808,201,287 | $ | 528,460,325 |
| | | | | |
| Other Information | | | | |
| Shares | | | | |
| Sold | | 21,593,533 | | 16,763,788 |
| Issued in reinvestment of distributions | | 332,182 | | 177,850 |
| Redeemed | | (7,904,001) | | (10,338,376) |
| Net increase (decrease) | | 14,021,714 | | 6,603,262 |
| | | | | |
Financial Highlights
Fidelity® SAI International SMA Completion Fund |
| |
| Years ended October 31, | | 2024 | | 2023 | | 2022 | | 2021 | | 2020 |
Selected Per-Share Data | | | | | | | | | | |
| Net asset value, beginning of period | $ | 10.11 | $ | 9.61 | $ | 15.46 | $ | 12.38 | $ | 10.47 |
| Income from Investment Operations | | | | | | | | | | |
Net investment income (loss) A,B | | .23 | | .25 | | .18 | | .19 | | .17 C |
| Net realized and unrealized gain (loss) | | 2.07 | | .39 | | (5.16) | | 3.01 | | 1.77 |
| Total from investment operations | | 2.30 | | .64 | | (4.98) | | 3.20 | | 1.94 |
| Distributions from net investment income | | (.22) | | (.14) | | (.16) | | (.12) | | (.03) |
| Distributions from net realized gain | | - | | - | | (.71) | | - | | - |
| Total distributions | | (.22) | | (.14) | | (.87) | | (.12) | | (.03) |
| Net asset value, end of period | $ | 12.19 | $ | 10.11 | $ | 9.61 | $ | 15.46 | $ | 12.38 |
Total Return D | | | | 6.61% | | (34.09)% | | 26.03% | | 18.57% |
Ratios to Average Net Assets B,E,F | | | | | | | | | | |
Expenses before reductions G | | -% | | -% | | -% | | -% | | -% |
Expenses net of fee waivers, if any G | | | | -% | | -% | | -% | | -% |
Expenses net of all reductions G | | -% | | -% | | -% | | -% | | -% |
| Net investment income (loss) | | 1.90% | | 2.36% | | 1.56% | | 1.30% | | 1.45% C |
| Supplemental Data | | | | | | | | | | |
| Net assets, end of period (000 omitted) | $ | 808,201 | $ | 528,460 | $ | 438,707 | $ | 583,710 | $ | 318,362 |
Portfolio turnover rate H | | | | 31% | | 40% | | 37% | | 17% |
ACalculated based on average shares outstanding during the period.
BNet investment income (loss) is affected by the timing of the declaration of dividends by any underlying mutual funds or exchange-traded funds (ETFs). Net investment income (loss) of any mutual funds or ETFs is not included in the Fund's net investment income (loss) ratio.
CNet investment income per share reflects one or more large, non-recurring dividend(s) which amounted to $.02 per share. Excluding such non-recurring dividend(s), the ratio of net investment income (loss) to average net assets would have been 1.28%.
DTotal returns would have been lower if certain expenses had not been reduced during the applicable periods shown.
EFees and expenses of any underlying mutual funds or exchange-traded funds (ETFs) are not included in the Fund's expense ratio. The Fund indirectly bears its proportionate share of these expenses. For additional expense information related to investments in Fidelity Central Funds, please refer to the "Investments in Fidelity Central Funds" note found in the Notes to Financial Statements section of the most recent Annual or Semi-Annual report.
FExpense ratios reflect operating expenses of the class. Expenses before reductions do not reflect amounts reimbursed, waived, or reduced through arrangements with the investment adviser, brokerage services, or other offset arrangements, if applicable, and do not represent the amount paid by the class during periods when reimbursements, waivers or reductions occur.
GAmount represents less than .005%.
HAmount does not include the portfolio activity of any underlying mutual funds or exchange-traded funds (ETFs).
Notes to Financial Statements
For the period ended October 31, 2024
1. Organization.
Fidelity SAI International SMA Completion Fund (the Fund) is a fund of Fidelity Investment Trust (the Trust) and is authorized to issue an unlimited number of shares. Shares are offered exclusively to certain clients of Fidelity Management & Research Company LLC (FMR) or its affiliates. The Trust is registered under the Investment Company Act of 1940, as amended (the 1940 Act), as an open-end management investment company organized as a Massachusetts business trust.
2. Investments in Fidelity Central Funds.
Funds may invest in Fidelity Central Funds, which are open-end investment companies generally available only to other investment companies and accounts managed by the investment adviser and its affiliates. The Schedule of Investments lists any Fidelity Central Funds held as an investment as of period end, but does not include the underlying holdings of each Fidelity Central Fund. An investing fund indirectly bears its proportionate share of the expenses of the underlying Fidelity Central Funds.
Based on its investment objective, each Fidelity Central Fund may invest or participate in various investment vehicles or strategies that are similar to those of the investing fund. These strategies are consistent with the investment objectives of the investing fund and may involve certain economic risks which may cause a decline in value of each of the Fidelity Central Funds and thus a decline in the value of the investing fund.
| Fidelity Central Fund | Investment Manager | Investment Objective | Investment Practices | Expense RatioA |
| Fidelity Money Market Central Funds | Fidelity Management & Research Company LLC (FMR) | Each fund seeks to obtain a high level of current income consistent with the preservation of capital and liquidity. | Short-term Investments | Less than .005% |
A Expenses expressed as a percentage of average net assets and are as of each underlying Central Fund's most recent annual or semi-annual shareholder report.
A complete unaudited list of holdings for each Fidelity Central Fund is available upon request or at the Securities and Exchange Commission website at www.sec.gov. In addition, the financial statements of the Fidelity Central Funds which contain the significant accounting policies (including investment valuation policies) of those funds, and are not covered by the Report of Independent Registered Public Accounting Firm, are available on the Securities and Exchange Commission website or upon request.
3. Significant Accounting Policies.
The Fund is an investment company and applies the accounting and reporting guidance of the Financial Accounting Standards Board (FASB) Accounting Standards Codification Topic 946 Financial Services - Investment Companies. The financial statements have been prepared in conformity with accounting principles generally accepted in the United States of America (GAAP), which require management to make certain estimates and assumptions at the date of the financial statements. Actual results could differ from those estimates. Subsequent events, if any, through the date that the financial statements were issued have been evaluated in the preparation of the financial statements. The Fund's Schedule of Investments lists any underlying mutual funds or exchange-traded funds (ETFs) but does not include the underlying holdings of these funds. The following summarizes the significant accounting policies of the Fund:
Investment Valuation. Investments are valued as of 4:00 p.m. Eastern time on the last calendar day of the period. The Board of Trustees (the Board) has designated the Fund's investment adviser as the valuation designee responsible for the fair valuation function and performing fair value determinations as needed. The investment adviser has established a Fair Value Committee (the Committee) to carry out the day-to-day fair valuation responsibilities and has adopted policies and procedures to govern the fair valuation process and the activities of the Committee. In accordance with these fair valuation policies and procedures, which have been approved by the Board, the Fund attempts to obtain prices from one or more third party pricing services or brokers to value its investments. When current market prices, quotations or currency exchange rates are not readily available or reliable, investments will be fair valued in good faith by the Committee, in accordance with the policies and procedures. Factors used in determining fair value vary by investment type and may include market or investment specific events, transaction data, estimated cash flows, and market observations of comparable investments. The frequency that the fair valuation procedures are used cannot be predicted and they may be utilized to a significant extent. The Committee manages the Fund's fair valuation practices and maintains the fair valuation policies and procedures. The Fund's investment adviser reports to the Board information regarding the fair valuation process and related material matters.
The Fund categorizes the inputs to valuation techniques used to value its investments into a disclosure hierarchy consisting of three levels as shown below:
Level 1 - unadjusted quoted prices in active markets for identical investments
Level 2 - other significant observable inputs (including quoted prices for similar investments, interest rates, prepayment speeds, etc.)
Level 3 - unobservable inputs (including the Fund's own assumptions based on the best information available)
Valuation techniques used to value the Fund's investments by major category are as follows:
Equity securities, including restricted securities, for which market quotations are readily available, are valued at the last reported sale price or official closing price as reported by a third party pricing service on the primary market or exchange on which they are traded and are categorized as Level 1 in the hierarchy. In the event there were no sales during the day or closing prices are not available, securities are valued at the last quoted bid price or may be valued using the last available price and are generally categorized as Level 2 in the hierarchy. For foreign equity securities, when market or security specific events arise, comparisons to the valuation of American Depositary Receipts (ADRs), futures contracts, Exchange-Traded Funds (ETFs) and certain indexes as well as quoted prices for similar securities may be used and would be categorized as Level 2 in the hierarchy. For equity securities, including restricted securities, where observable inputs are limited, assumptions about market activity and risk are used and these securities may be categorized as Level 3 in the hierarchy.
Investments in open-end mutual funds, including the Fidelity Central Funds, are valued at their closing net asset value (NAV) each business day and are categorized as Level 1 in the hierarchy.
Changes in valuation techniques may result in transfers in or out of an assigned level within the disclosure hierarchy. The aggregate value of investments by input level as of October 31, 2024 is included at the end of the Fund's Schedule of Investments.
Foreign Currency. Certain Funds may use foreign currency contracts to facilitate transactions in foreign-denominated securities. Gains and losses from these transactions may arise from changes in the value of the foreign currency or if the counterparties do not perform under the contracts' terms.
Foreign-denominated assets, including investment securities, and liabilities are translated into U.S. dollars at the exchange rates at period end. Purchases and sales of investment securities, income and dividends received, and expenses denominated in foreign currencies are translated into U.S. dollars at the exchange rate in effect on the transaction date.
The effects of exchange rate fluctuations on investments are included with the net realized and unrealized gain (loss) on investment securities. Other foreign currency transactions resulting in realized and unrealized gain (loss) are disclosed separately.
Investment Transactions and Income. For financial reporting purposes, the Fund's investment holdings and NAV include trades executed through the end of the last business day of the period. The NAV per share for processing shareholder transactions is calculated as of the close of business of the New York Stock Exchange (NYSE), normally 4:00 p.m. Eastern time and includes trades executed through the end of the prior business day. Gains and losses on securities sold are determined on the basis of identified cost. Commissions paid to certain brokers with whom the investment adviser, or its affiliates, places trades on behalf of a fund include an amount in addition to trade execution, which may be rebated back to a fund. Any such rebates are included in net realized gain (loss) on investments in the Statement of Operations. Dividend income is recorded on the ex-dividend date, except for certain dividends from foreign securities where the ex-dividend date may have passed, which are recorded as soon as the Fund is informed of the ex-dividend date. Non-cash dividends included in dividend income, if any, are recorded at the fair market value of the securities received. Income and capital gain distributions from Fidelity Central Funds, if any, are recorded on the ex-dividend date. Interest income is accrued as earned and includes coupon interest and amortization of premium and accretion of discount on debt securities as applicable. Investment income is recorded net of foreign taxes withheld where recovery of such taxes is uncertain. Funds may file withholding tax reclaims in certain jurisdictions to recover a portion of amounts previously withheld. Any withholding tax reclaims income is included in the Statement of Operations in foreign taxes withheld. Any receivables for withholding tax reclaims are included in the Statement of Assets and Liabilities in reclaims receivable. The Fund has filed tax reclaims for previously withheld taxes on dividends earned in certain European Union (EU) countries. These additional filings are subject to various administrative proceedings by the local jurisdictions' tax authorities within the EU, as well as a number of related judicial proceedings. Income recognized for EU reclaims is included with other reclaims in the Statement of Operations in foreign taxes withheld. These reclaims are recorded when the amount is known and there are no significant uncertainties on collectability.
Expenses. Expenses directly attributable to a fund are charged to that fund. Expenses attributable to more than one fund are allocated among the respective funds on the basis of relative net assets or other appropriate methods. Expenses included in the accompanying financial statements reflect the expenses of that fund and do not include any expenses associated with any underlying mutual funds or exchange-traded funds. Although not included in a fund's expenses, a fund indirectly bears its proportionate share of these expenses through the net asset value of each underlying mutual fund or exchange-traded fund. Expense estimates are accrued in the period to which they relate and adjustments are made when actual amounts are known.
Income Tax Information and Distributions to Shareholders. Each year, the Fund intends to qualify as a regulated investment company under Subchapter M of the Internal Revenue Code, including distributing substantially all of its taxable income and realized gains. As a result, no provision for U.S. Federal income taxes is required. As of October 31, 2024, the Fund did not have any unrecognized tax benefits in the financial statements; nor is the Fund aware of any tax positions for which it is reasonably possible that the total amounts of unrecognized tax benefits will significantly change in the next twelve months. The Fund files a U.S. federal tax return, in addition to state and local tax returns as required. The Fund's federal income tax returns are subject to examination by the Internal Revenue Service (IRS) for a period of three fiscal years after they are filed. State and local tax returns may be subject to examination for an additional fiscal year depending on the jurisdiction. Foreign taxes are provided for based on the Fund's understanding of the tax rules and rates that exist in the foreign markets in which it invests. The Fund is subject to a tax imposed on capital gains by certain countries in which it invests. An estimated deferred tax liability for net unrealized appreciation on the applicable securities is included in Deferred taxes on the Statement of Assets and Liabilities.
Distributions are declared and recorded on the ex-dividend date. Income and capital gain distributions are determined in accordance with income tax regulations, which may differ from GAAP. In addition, the Fund claimed a portion of the payment made to redeeming shareholders as a distribution for income tax purposes.
Capital accounts within the financial statements are adjusted for permanent book-tax differences. These adjustments have no impact on net assets or the results of operations. Capital accounts are not adjusted for temporary book-tax differences which will reverse in a subsequent period.
Book-tax differences are primarily due to foreign currency transactions, certain foreign taxes, passive foreign investment companies (PFIC), capital loss carryforwards and losses deferred due to wash sales.
As of period end, the cost and unrealized appreciation (depreciation) in securities, and derivatives if applicable, for federal income tax purposes were as follows:
| Gross unrealized appreciation | $140,533,799 |
| Gross unrealized depreciation | (32,905,230) |
| Net unrealized appreciation (depreciation) | $107,628,569 |
| Tax Cost | $716,957,966 |
The tax-based components of distributable earnings as of period end were as follows:
| Undistributed ordinary income | $18,511,675 |
| Capital loss carryforward | $(94,105,597) |
| Net unrealized appreciation (depreciation) on securities and other investments | $107,553,827 |
Capital loss carryforwards are only available to offset future capital gains of the Fund to the extent provided by regulations and may be limited. The capital loss carryforward information presented below, including any applicable limitation, is estimated as of fiscal period end and is subject to adjustment.
Short-term | $(24,809,453) |
Long-term | (69,296,144) |
| Total capital loss carryforward | $(94,105,597) |
The tax character of distributions paid was as follows:
| | October 31, 2024 | October 31, 2023 |
| Ordinary Income | $11,534,142 | $6,168,818 |
| Total | $11,534,142 | $6,168,818 |
Restricted Securities (including Private Placements). Funds may invest in securities that are subject to legal or contractual restrictions on resale. These securities generally may be resold in transactions exempt from registration or to the public if the securities are registered. Disposal of these securities may involve time-consuming negotiations and expense, and prompt sale at an acceptable price may be difficult. Information regarding restricted securities held at period end is included at the end of the Schedule of Investments, if applicable.
New Accounting Pronouncement. In November 2023, the FASB issued Accounting Standards Update (ASU) 2023-07 Segment Reporting (Topic 280): Improvements to Reportable Segment Disclosures. Effective for fiscal years beginning after December 15, 2023 and interim periods within fiscal years beginning after December 15, 2024, the amendments enhance required disclosures of segment information for public entities on an annual and interim basis. The ASU allows for early adoption with updates applied retrospectively. Management is currently evaluating the impact of the ASU but does not expect this guidance to materially impact the financial statements.
4. Purchases and Sales of Investments.
Purchases and sales of securities, other than short-term securities and in-kind transactions, as applicable, are noted in the table below.
| | Purchases ($) | Sales ($) |
| Fidelity SAI International SMA Completion Fund | 424,008,279 | 220,765,532 |
5. Fees and Other Transactions with Affiliates.
Management Fee. Fidelity Management & Research Company LLC (the investment adviser) and its affiliates provide the Fund with investment management related services and the Fund does not pay any fees for these services. Under the management contract, the investment adviser or an affiliate pays all other expenses of the Fund, excluding fees and expenses of the independent Trustees, and certain miscellaneous expenses such as proxy and shareholder meeting expenses.
Brokerage Commissions. A portion of portfolio transactions were placed with brokerage firms which are affiliates of the investment adviser. Brokerage commissions are included in net realized gain (loss) and change in net unrealized appreciation (depreciation) in the Statement of Operations. The commissions paid to these affiliated firms were as follows:
| | Amount ($) |
| Fidelity SAI International SMA Completion Fund | 180 |
Interfund Lending Program. Pursuant to an Exemptive Order issued by the Securities and Exchange Commission (the SEC), the Fund, along with other registered investment companies having management contracts with Fidelity Management & Research Company LLC (FMR), or other affiliated entities of FMR, may participate in an interfund lending program. This program provides an alternative credit facility allowing the Fund to borrow from, or lend money to, other participating affiliated funds at rates that are beneficial to both the borrowing and lending fund. Borrowings under the program are generally for temporary or emergency purposes, including meeting fund shareholder redemptions. The interfund loan rate is determined, as specified in the Exemptive Order, by averaging, (1) the higher of the overnight time deposit rate and the current overnight repurchase agreement rate, and (2) a benchmark rate representing the lowest bank loan rate available to the funds. At period end, there were no interfund loans outstanding. Activity in this program during the period for which loans were outstanding was as follows:
| | Borrower or Lender | Average Loan Balance ($) | Weighted Average Interest Rate | Interest Expense ($) |
Fidelity SAI International SMA Completion Fund | Borrower | 4,341,000 | 5.58% | 1,346 |
Interfund Trades. Funds may purchase from or sell securities to other Fidelity Funds under procedures adopted by the Board. The procedures have been designed to ensure these interfund trades are executed in accordance with Rule 17a-7 of the 1940 Act. Any interfund trades are included within the respective purchases and sales amounts shown in the Purchases and Sales of Investments note. Interfund trades during the period are noted in the table below.
| | Purchases ($) | Sales ($) | Realized Gain (Loss) ($) |
| Fidelity SAI International SMA Completion Fund | 19,575,237 | 9,889,913 | (3,605,604) |
Sub-Advisory Arrangements. Effective March 1, 2024, the Fund's sub-advisory agreements with FMR Investment Management (UK) Limited, Fidelity Management & Research (Hong Kong) Limited, and Fidelity Management & Research (Japan) Limited were amended to provide that the investment adviser pays each sub-adviser monthly fees equal to 110% of the sub-adviser's costs for providing sub-advisory services.
6. Committed Line of Credit.
Certain Funds participate with other funds managed by the investment adviser or an affiliate in a $4.25 billion credit facility (the "line of credit") to be utilized for temporary or emergency purposes to fund shareholder redemptions or for other short-term liquidity purposes. The commitment fees on the pro-rata portion of the line of credit are borne by the investment adviser. During the period, there were no borrowings on this line of credit.
7. Security Lending.
Funds lend portfolio securities from time to time in order to earn additional income. Lending agents are used, including National Financial Services (NFS), an affiliate of the investment adviser. Pursuant to a securities lending agreement, NFS will receive a fee, which is capped at 9.9% of a fund's daily lending revenue, for its services as lending agent. A fund may lend securities to certain qualified borrowers, including NFS. On the settlement date of the loan, a fund receives collateral (in the form of U.S. Treasury obligations, letters of credit and/or cash) against the loaned securities and maintains collateral in an amount not less than 100% of the market value of the loaned securities during the period of the loan. The market value of the loaned securities is determined at the close of business of a fund and any additional required collateral is delivered to a fund on the next business day. A fund or borrower may terminate the loan at any time, and if the borrower defaults on its obligation to return the securities loaned because of insolvency or other reasons, a fund may apply collateral received from the borrower against the obligation. A fund may experience delays and costs in recovering the securities loaned. Any cash collateral received is invested in the Fidelity Securities Lending Cash Central Fund. Any loaned securities are identified as such in the Schedule of Investments, and the value of loaned securities and cash collateral at period end, as applicable, are presented in the Statement of Assets and Liabilities. Security lending income represents the income earned on investing cash collateral, less rebates paid to borrowers and any lending agent fees associated with the loan, plus any premium payments received for lending certain types of securities. Security lending income is presented in the Statement of Operations as a component of income from Fidelity Central Funds. Affiliated security lending activity, if any, was as follows:
| | Total Security Lending Fees Paid to NFS ($) | Security Lending Income From Securities Loaned to NFS ($) | Value of Securities Loaned to NFS at Period End ($) |
| Fidelity SAI International SMA Completion Fund | 1,772 | - | - |
8. Expense Reductions.
Through arrangements with the Fund's custodian, credits realized as a result of certain uninvested cash balances were used to reduce the Fund's expenses by $1.
9. Other.
A fund's organizational documents provide former and current trustees and officers with a limited indemnification against liabilities arising in connection with the performance of their duties to the fund. In the normal course of business, a fund may also enter into contracts that provide general indemnifications. A fund's maximum exposure under these arrangements is unknown as this would be dependent on future claims that may be made against a fund. The risk of material loss from such claims is considered remote.
10. Risk and Uncertainties.
Many factors affect a fund's performance. Developments that disrupt global economies and financial markets, such as pandemics, epidemics, outbreaks of infectious diseases, war, terrorism, and environmental disasters, may significantly affect a fund's investment performance. The effects of these developments to a fund will be impacted by the types of securities in which a fund invests, the financial condition, industry, economic sector, and geographic location of an issuer, and a fund's level of investment in the securities of that issuer. Significant concentrations in security types, issuers, industries, sectors, and geographic locations may magnify the factors that affect a fund's performance.
Report of Independent Registered Public Accounting Firm
To the Board of Trustees of Fidelity Investment Trust and the Shareholders of Fidelity SAI International SMA Completion Fund:
Opinion on the Financial Statements and Financial Highlights
We have audited the accompanying statement of assets and liabilities of Fidelity SAI International SMA Completion Fund (the "Fund"), a fund of Fidelity Investment Trust, including the schedule of investments, as of October 31, 2024, the related statement of operations for the year then ended, the statement of changes in net assets for each of the two years in the period then ended, the financial highlights for each of the five years in the period then ended, and the related notes. In our opinion, the financial statements and financial highlights present fairly, in all material respects, the financial position of the Fund as of October 31, 2024, and the results of its operations for the year then ended, the changes in its net assets for each of the two years in the period then ended, and the financial highlights for each of the five years in the period then ended in conformity with accounting principles generally accepted in the United States of America.
Basis for Opinion
These financial statements and financial highlights are the responsibility of the Fund's management. Our responsibility is to express an opinion on the Fund's financial statements and financial highlights based on our audits. We are a public accounting firm registered with the Public Company Accounting Oversight Board (United States) (PCAOB) and are required to be independent with respect to the Fund in accordance with the U.S. federal securities laws and the applicable rules and regulations of the Securities and Exchange Commission and the PCAOB.
We conducted our audits in accordance with the standards of the PCAOB. Those standards require that we plan and perform the audit to obtain reasonable assurance about whether the financial statements and financial highlights are free of material misstatement, whether due to error or fraud. The Fund is not required to have, nor were we engaged to perform, an audit of its internal control over financial reporting. As part of our audits, we are required to obtain an understanding of internal control over financial reporting but not for the purpose of expressing an opinion on the effectiveness of the Fund's internal control over financial reporting. Accordingly, we express no such opinion.
Our audits included performing procedures to assess the risks of material misstatement of the financial statements and financial highlights, whether due to error or fraud, and performing procedures that respond to those risks. Such procedures included examining, on a test basis, evidence regarding the amounts and disclosures in the financial statements and financial highlights. Our audits also included evaluating the accounting principles used and significant estimates made by management, as well as evaluating the overall presentation of the financial statements and financial highlights. Our procedures included confirmation of securities owned as of October 31, 2024, by correspondence with the custodian and brokers; when replies were not received from brokers, we performed other auditing procedures. We believe that our audits provide a reasonable basis for our opinion.
/s/ Deloitte & Touche LLP
Boston, Massachusetts
December 16, 2024
We have served as the auditor of one or more of the Fidelity investment companies since 1999.
Distributions
(Unaudited)
The dividend and capital gains distributions for the fund(s) are available on Fidelity.com or Institutional.Fidelity.com.
The fund designates $2,853,325 of distributions paid during the fiscal year ended 2024 as qualifying to be taxed as section 163(j) interest dividends.
The fund designates 77.99% of the dividend distributed during the fiscal year as amounts which may be taken into account as a dividend for the purposes of the maximum rate under section 1(h)(11) of the Internal Revenue Code.
The amounts per share which represent income derived from sources within, and taxes paid to, foreign countries or possessions of the United States are $0.2014 and $0.0272 for the dividend paid December 11, 2023.
The fund will notify shareholders in January 2025 of amounts for use in preparing 2024 income tax returns.
Item 8: Changes in and Disagreements with Accountants for Open-End Management Investment Companies
(Unaudited)
Note: This is not applicable for any fund included in this document.
Item 9: Proxy Disclosures for Open-End Management Investment Companies
(Unaudited)
| A special meeting of shareholders was held on July 16, 2024. The results of votes taken among shareholders on the proposal before them are reported below. Each vote reported represents one dollar of net asset value held on the record date for the meeting. |
| Proposal 1 |
| To elect a Board of Trustees. |
| | # of Votes | % of Votes |
| Bettina Doulton |
| Affirmative | 128,529,177,643.56 | 98.18 |
| Withheld | 2,378,037,364.30 | 1.82 |
| TOTAL | 130,907,215,007.85 | 100.00 |
| Robert A. Lawrence |
| Affirmative | 128,253,389,899.05 | 97.97 |
| Withheld | 2,653,825,108.81 | 2.03 |
| TOTAL | 130,907,215,007.85 | 100.00 |
| Vijay C. Advani |
| Affirmative | 128,531,418,228.19 | 98.19 |
| Withheld | 2,375,796,779.66 | 1.81 |
| TOTAL | 130,907,215,007.85 | 100.00 |
| Thomas P. Bostick |
| Affirmative | 128,495,261,591.41 | 98.16 |
| Withheld | 2,411,953,416.44 | 1.84 |
| TOTAL | 130,907,215,007.85 | 100.00 |
| Donald F. Donahue |
| Affirmative | 128,407,878,996.00 | 98.09 |
| Withheld | 2,499,336,011.85 | 1.91 |
| TOTAL | 130,907,215,007.85 | 100.00 |
| Vicki L. Fuller |
| Affirmative | 128,625,540,095.19 | 98.26 |
| Withheld | 2,281,674,912.66 | 1.74 |
| TOTAL | 130,907,215,007.85 | 100.00 |
| Patricia L. Kampling |
| Affirmative | 128,668,729,281.34 | 98.29 |
| Withheld | 2,238,485,726.51 | 1.71 |
| TOTAL | 130,907,215,007.85 | 100.00 |
| Thomas A. Kennedy |
| Affirmative | 128,499,824,239.79 | 98.16 |
| Withheld | 2,407,390,768.06 | 1.84 |
| TOTAL | 130,907,215,007.85 | 100.00 |
| Oscar Munoz |
| Affirmative | 128,386,109,391.05 | 98.07 |
| Withheld | 2,521,105,616.80 | 1.93 |
| TOTAL | 130,907,215,007.85 | 100.00 |
| Karen B. Peetz |
| Affirmative | 128,603,731,113.82 | 98.24 |
| Withheld | 2,303,483,894.03 | 1.76 |
| TOTAL | 130,907,215,007.85 | 100.00 |
| David M. Thomas |
| Affirmative | 128,384,899,342.98 | 98.07 |
| Withheld | 2,522,315,664.88 | 1.93 |
| TOTAL | 130,907,215,007.85 | 100.00 |
| Susan Tomasky |
| Affirmative | 128,556,148,461.60 | 98.20 |
| Withheld | 2,351,066,546.25 | 1.80 |
| TOTAL | 130,907,215,007.85 | 100.00 |
| Michael E. Wiley |
| Affirmative | 128,264,934,978.34 | 97.98 |
| Withheld | 2,642,280,029.51 | 2.02 |
| TOTAL | 130,907,215,007.85 | 100.00 |
| | | |
| Proposal 1 reflects trust-wide proposal and voting results. |
Item 10: Remuneration Paid to Directors, Officers, and others of Open-End Management Investment Companies
(Unaudited)
Note: This information is disclosed as part of the financial statements for each Fund as part of Item 7: Financial Statements and Financial Highlights for Open-End Management Investment companies.
Item 11: Statement Regarding Basis for Approval of Investment Advisory Contract
(Unaudited)
Board Approval of Investment Advisory Contracts and Management Fees
Fidelity SAI International SMA Completion Fund
Each year, the Board of Trustees, including the Independent Trustees (together, the Board), considers the renewal of the fund's management contract with Fidelity Management & Research Company LLC (FMR) and the sub-advisory agreements (together, the Advisory Contracts) for the fund. FMR and the sub-advisers are referred to herein as the Investment Advisers. The Board, assisted by the advice of fund counsel and Independent Trustees' counsel, requests and considers a broad range of information relevant to the renewal of the Advisory Contracts throughout the year.
The Board meets regularly and, at each of its meetings, covers an extensive agenda of topics and materials and considers factors that are relevant to its annual consideration of the renewal of the fund's Advisory Contracts, including the services and support provided to the fund and its shareholders. The Board, acting directly and through its Committees (each of which is composed of and chaired by Independent Trustees), requests and receives information concerning the annual consideration of the renewal of the fund's Advisory Contracts. The Board also meets as needed to review matters specifically related to the Board's annual consideration of the renewal of the Advisory Contracts. Members of the Board may also meet with trustees of other Fidelity funds through joint ad hoc committees to discuss certain matters relevant to all of the Fidelity funds.
At its May 2024 meeting, the Board unanimously determined to renew the fund's Advisory Contracts. In considering whether to renew the Advisory Contracts for the fund, the Board considered all factors it believed relevant and reached a determination, with the assistance of fund counsel and Independent Trustees' counsel and through the exercise of its business judgment, that the renewal of the Advisory Contracts was in the best interests of the fund and its shareholders and the fact that no fee is payable under the management contract was fair and reasonable in light of all of the surrounding circumstances.
Nature, Extent, and Quality of Services Provided. The Board considered staffing as it relates to the fund, including the backgrounds and experience of investment personnel of the Investment Advisers, and also considered the Investment Advisers' implementation of the fund's investment program. The Independent Trustees also had discussions with senior management of Fidelity's investment operations and investment groups. The Board considered the structure of the investment personnel compensation program and whether this structure provides appropriate incentives to act in the best interests of the fund. Additionally, the Board considered the portfolio managers' investments, if any, in the funds that they manage.
Resources Dedicated to Investment Management and Support Services. The Board and the Fund Oversight and Research Committees reviewed the general qualifications and capabilities of Fidelity's investment staff, including its size, education, experience, and resources, as well as Fidelity's approach to recruiting, training, managing, and compensating investment personnel. The Board noted the resources devoted to expansion of Fidelity's global investment organization, and that Fidelity's analysts have extensive resources, tools, and capabilities that allow them to conduct sophisticated quantitative and fundamental analysis, as well as credit analysis of issuers, counterparties, and guarantors. Further, the Board considered that Fidelity's investment professionals have sufficient access to global information and data so as to provide competitive investment results over time, and that those professionals also have access to sophisticated tools that permit them to assess portfolio construction and risk and performance attribution characteristics continuously, as well as to transmit new information and research conclusions rapidly around the world. Additionally, in its deliberations, the Board considered Fidelity's trading, risk management, compliance, and technology and operations capabilities and resources, which are integral parts of the investment management process.
Shareholder and Administrative Services. The Board considered (i) the nature, extent, quality, and cost of advisory, administrative, and shareholder services performed by the Investment Advisers and their affiliates under the Advisory Contracts and under separate agreements covering transfer agency and pricing and bookkeeping services for the fund; (ii) the nature and extent of Fidelity's supervision of third party service providers, principally custodians, subcustodians, and pricing vendors; and (iii) the resources devoted by Fidelity to, and the record of compliance with, the fund's compliance policies and procedures. The Board also reviewed the allocation of fund brokerage, including allocations to brokers affiliated with the Investment Advisers, the use of brokerage commissions to pay fund expenses, and the use of "soft" commission dollars to pay for research services. The Board also considered the fund's securities lending activities and any payments made to Fidelity relating to securities lending under a separate agreement.
The Board noted that the growth of fund assets over time across the complex allows Fidelity to reinvest in the development of services designed to enhance the value and convenience of the Fidelity funds as investment vehicles. These services include 24-hour access to account information and market information over the Internet and through telephone representatives, investor education materials, and asset allocation tools. The Board also considered that it reviews customer service metrics such as telephone response times, continuity of services on the website and metrics addressing services at Fidelity Investor Centers.
Investment in a Large Fund Family. The Board considered the benefits to shareholders of investing in a fund that is part of a large family of funds offering a variety of investment disciplines and providing a large variety of fund investor services. The Board noted that Fidelity had taken, or had made recommendations that resulted in the Fidelity funds taking, a number of actions over the previous year that benefited particular funds and/or the Fidelity funds in general.
Investment Performance. The Board reviewed the fund's absolute investment performance, as well as the fund's relative investment performance, and considered the fund's underperformance for different time periods ended February 29, 2024. The Board noted that the fund is not publicly offered as a stand-alone investment product.
Based on its review, the Board concluded that the nature, extent, and quality of services provided to the fund under the Advisory Contracts should continue to benefit the shareholders of the fund.
Competitiveness of Management Fee and Total Expense Ratio. The Board considered that the fund does not pay FMR a management fee for investment advisory services. The Board also considered that the fund is available through fee-based programs and products offered by Fidelity and that FMR is compensated for its services out of such fees. The Board also noted that FMR or an affiliate undertakes to pay all operating expenses of the fund with limited exceptions.
Based on its review, the Board considered that the fund does not pay a management fee and concluded that the total expense ratio of the fund was reasonable in light of the services that the fund and its shareholders receive and the other factors considered.
Costs of the Services and Profitability. The Board considered the level of Fidelity's profits in respect of all the Fidelity funds.
A public accounting firm has been engaged annually by the Board as part of the Board's assessment of Fidelity's profitability analysis. The engagement includes the review and assessment of the methodologies used by Fidelity in determining the revenues and expenses attributable to Fidelity's fund business, and completion of agreed-upon procedures in respect of the mathematical accuracy of certain fund profitability information and its conformity to established allocation methodologies. After considering the reports issued under the engagement and information provided by Fidelity, the Board concluded that while other allocation methods may also be reasonable, Fidelity's profitability methodologies are reasonable in all material respects.
The Board also reviewed Fidelity's non-fund businesses and potential indirect benefits such businesses may have received as a result of their association with Fidelity's fund business (i.e., fall-out benefits) as well as cases where Fidelity's affiliates may benefit from the funds' business. The Board considered areas where potential indirect benefits to the Fidelity funds from their relationships with Fidelity may exist. The Board's consideration of these matters was informed by the findings of a joint ad hoc committee created by it and the boards of other Fidelity funds to evaluate potential fall-out benefits.
The Board concluded that the costs of the services provided by and the profits realized by Fidelity in connection with the operation of the fund were not relevant to the renewal of the Advisory Contracts because the fund pays no advisory fees and FMR or an affiliate bears all expenses of the fund with limited exceptions.
Economies of Scale. The Board concluded that because the fund pays no advisory fees and FMR bears all expenses of the fund with limited exceptions, the realization of economies of scale was not a material factor in the Board's decision to renew the fund's Advisory Contract.
Additional Information Requested by the Board. In order to develop fully the factual basis for consideration of the Fidelity funds' advisory contracts, the Board requested and received additional information on certain topics, including but not limited to: (i) fund flow and performance trends, in particular the underperformance of certain funds and strategies, and Fidelity's long-term strategies for certain funds; (ii) the operation of performance fees and the rationale for implementing performance fees on certain categories of funds but not others; (iii) Fidelity's pricing philosophy compared to competitors; (iv) fund profitability methodology and data; (v) evaluation of competitive fund data and peer group classifications and fee and expense comparisons; (vi) the management fee and expense structures for different funds and classes and information about the differences between various fee and expense structures; (vii) the variable management fee implemented for certain funds effective March 1, 2024; and (viii) information regarding other accounts managed by Fidelity and the funds' sub-advisory arrangements.
Conclusion. Based on its evaluation of all of the conclusions noted above, and after considering all factors it believed relevant, the Board, including the Independent Trustees, concluded that the advisory and sub-advisory fee arrangements are fair and reasonable in light of all of the surrounding circumstances and that the fund's Advisory Contracts should be renewed through May 31, 2025.
1.9893098.105
ISM-ANN-1224
Fidelity® Series Sustainable Emerging Markets Fund
Fidelity® Series Sustainable Non-U.S. Developed Markets Fund
Annual Report
October 31, 2024
Contents
To view a fund's proxy voting guidelines and proxy voting record for the 12-month period ended June 30, visit http://www.fidelity.com/proxyvotingresults or visit the Securities and Exchange Commission's (SEC) web site at http://www.sec.gov.
You may also call 1-800-544-8544 to request a free copy of the proxy voting guidelines.
Standard & Poor's, S&P and S&P 500 are registered service marks of The McGraw-Hill Companies, Inc. and have been licensed for use by Fidelity Distributors Corporation.
Other third-party marks appearing herein are the property of their respective owners.
All other marks appearing herein are registered or unregistered trademarks or service marks of FMR LLC or an affiliated company. © 2024 FMR LLC. All rights reserved.
This report and the financial statements contained herein are submitted for the general information of the shareholders of the Funds. This report is not authorized for distribution to prospective investors in the Funds unless preceded or accompanied by an effective prospectus.
A fund files its complete schedule of portfolio holdings with the SEC for the first and third quarters of each fiscal year on Form N-PORT. Forms N-PORT are available on the SEC's web site at http://www.sec.gov. A fund's Forms N-PORT may be reviewed and copied at the SEC's Public Reference Room in Washington, DC. Information regarding the operation of the SEC's Public Reference Room may be obtained by calling 1-800-SEC-0330.
For a complete list of a fund's portfolio holdings, view the most recent holdings listing, semiannual report, or annual report on Fidelity's web site at http://www.fidelity.com, http://www.institutional.fidelity.com, or http://www.401k.com, as applicable.
NOT FDIC INSURED •MAY LOSE VALUE •NO BANK GUARANTEE
Neither the Funds nor Fidelity Distributors Corporation is a bank.
Item 7: Financial Statements and Financial Highlights for Open-End Management Investment Companies (Annual Report)
Fidelity® Series Sustainable Emerging Markets Fund
Schedule of Investments October 31, 2024
Showing Percentage of Net Assets
| Common Stocks - 92.6% |
| | | Shares | Value ($) |
| Australia - 0.1% | | | |
| Paladin Energy Ltd. (Australia) (a) | | 1,220 | 8,032 |
| Brazil - 6.1% | | | |
| Banco Bradesco SA | | 7,300 | 16,088 |
| Banco do Brasil SA | | 1,392 | 6,340 |
| Companhia de Saneamento Basico do Estado de Sao Paulo (SABESP) | | 600 | 9,557 |
| Companhia de Transmissao de Energia Eletrica Paulista (PN) | | 4,014 | 16,866 |
| Cury Construtora e Incorporado SA | | 4,885 | 20,652 |
| Dexco SA (a) | | 16,900 | 24,206 |
| ENGIE Brasil Energia SA | | 6,375 | 45,732 |
| Equatorial Energia SA | | 3,400 | 18,891 |
| Hapvida Participacoes e Investimentos SA (a)(b) | | 36,501 | 22,226 |
| Itau Unibanco Holding SA sponsored ADR | | 12,481 | 75,510 |
| Localiza Rent a Car SA | | 7,960 | 57,859 |
| LOG Commercial Properties e Participacoes SA | | 2,800 | 10,956 |
| MercadoLibre, Inc. (a) | | 19 | 38,706 |
| Metalurgica Gerdau SA (PN) | | 21,364 | 37,954 |
| Petroleo Brasileiro SA - Petrobras: | | | |
| (PN) sponsored ADR (non-vtg.) | | 1,144 | 14,151 |
| sponsored ADR | | 1,701 | 22,878 |
| PRIO SA | | 2,600 | 18,431 |
| Raia Drogasil SA | | 13,473 | 56,727 |
| Transmissora Alianca de Energia Eletrica SA | | 4,372 | 26,485 |
| Vamos Locacao de Caminhoes Maquinas e Equipamentos SA | | 3,800 | 4,135 |
| Weg SA | | 1,600 | 14,976 |
| XP, Inc. Class A | | 1,842 | 32,161 |
TOTAL BRAZIL | | | 591,487 |
| Chile - 0.4% | | | |
| Banco de Chile | | 352,481 | 41,062 |
| China - 28.7% | | | |
| Airtac International Group | | 1,000 | 27,770 |
| Akeso, Inc. (a)(b) | | 1,000 | 8,060 |
| Alibaba Group Holding Ltd. | | 20,623 | 252,267 |
| BeiGene Ltd. ADR (a) | | 125 | 25,330 |
| Beijing Roborock Technology Co. Ltd. (A Shares) | | 375 | 12,430 |
| Bilibili, Inc. ADR (a) | | 602 | 13,316 |
| BYD Co. Ltd. (H Shares) | | 2,710 | 97,881 |
| China Communications Services Corp. Ltd. (H Shares) | | 32,735 | 17,587 |
| China Construction Bank Corp. (H Shares) | | 262,178 | 203,512 |
| China Gas Holdings Ltd. | | 13,715 | 11,778 |
| China Jushi Co. Ltd. (A Shares) | | 17,400 | 27,640 |
| China Life Insurance Co. Ltd. (H Shares) | | 20,358 | 43,154 |
| China Merchants Bank Co. Ltd. (H Shares) | | 1,000 | 4,894 |
| Contemporary Amperex Technology Co. Ltd. | | 800 | 27,756 |
| ENN Energy Holdings Ltd. | | 3,487 | 24,567 |
| Foxconn Industrial Internet Co. Ltd. (A Shares) | | 2,300 | 7,711 |
| Fuyao Glass Industries Group Co. Ltd. (A Shares) | | 6,500 | 51,991 |
| Guangdong Investment Ltd. | | 13,959 | 8,886 |
| Haier Smart Home Co. Ltd. | | 22,571 | 81,915 |
| Haier Smart Home Co. Ltd. (A Shares) | | 10,800 | 44,369 |
| Haitian International Holdings Ltd. | | 7,755 | 21,450 |
| Hansoh Pharmaceutical Group Co. Ltd. (b) | | 12,000 | 27,979 |
| Industrial & Commercial Bank of China Ltd. (H Shares) | | 46,036 | 27,615 |
| Innovent Biologics, Inc. (a)(b) | | 5,762 | 25,048 |
| JD.com, Inc.: | | | |
| Class A | | 3,308 | 67,084 |
| sponsored ADR | | 2,085 | 84,693 |
| Kanzhun Ltd. ADR | | 1,116 | 16,238 |
| KE Holdings, Inc. ADR | | 1,240 | 27,193 |
| Kuaishou Technology Class B (a)(b) | | 800 | 4,714 |
| Kunlun Energy Co. Ltd. | | 15,844 | 15,026 |
| Lenovo Group Ltd. | | 39,229 | 51,729 |
| Li Auto, Inc.: | | | |
| ADR (a) | | 910 | 22,759 |
| Class A (a) | | 3,900 | 49,043 |
| Li Ning Co. Ltd. | | 2,500 | 5,101 |
| Medlive Technology Co. Ltd. (b) | | 6,000 | 6,531 |
| Meituan Class B (a)(b) | | 8,750 | 206,766 |
| NetEase, Inc. ADR | | 207 | 16,666 |
| New Oriental Education & Technology Group, Inc. sponsored ADR | | 518 | 32,427 |
| Ping An Insurance Group Co. of China Ltd. (H Shares) | | 16,006 | 99,170 |
| Proya Cosmetics Co. Ltd. (A Shares) | | 1,700 | 22,914 |
| Shenzhen Inovance Technology Co. Ltd. (A Shares) | | 3,600 | 28,098 |
| Shenzhen Mindray Bio-Medical Electronics Co. Ltd. (A Shares) | | 1,000 | 37,453 |
| Shenzhou International Group Holdings Ltd. | | 1,200 | 9,266 |
| Sichuan Kelun-Biotech Biopharmaceutical Co. Ltd. (H Shares) (a) | | 300 | 6,661 |
| Sinopec Engineering Group Co. Ltd. (H Shares) | | 32,900 | 22,845 |
| Sinopharm Group Co. Ltd. (H Shares) | | 1,519 | 3,784 |
| Sinotruk Hong Kong Ltd. | | 9,782 | 26,402 |
| Tencent Holdings Ltd. | | 9,470 | 493,786 |
| TravelSky Technology Ltd. (H Shares) | | 14,198 | 19,900 |
| Trip.com Group Ltd. (a) | | 500 | 32,177 |
| Trip.com Group Ltd. ADR (a) | | 1,464 | 94,282 |
| Tsingtao Brewery Co. Ltd. (H Shares) | | 2,320 | 14,939 |
| Uni-President China Holdings Ltd. | | 21,000 | 19,655 |
| Xiaomi Corp. Class B (a)(b) | | 13,200 | 45,275 |
| Yifeng Pharmacy Chain Co. Ltd. | | 720 | 2,401 |
| Yum China Holdings, Inc. | | 746 | 32,906 |
| Zai Lab Ltd. (a) | | 3,945 | 12,029 |
| Zai Lab Ltd. ADR (a) | | 588 | 17,769 |
| Zeekr Intelligent Technology Holding Ltd. ADR | | 597 | 14,991 |
| ZTO Express, Inc. sponsored ADR Class A | | 1,896 | 43,817 |
TOTAL CHINA | | | 2,801,396 |
| Greece - 1.0% | | | |
| Alpha Services and Holdings SA | | 26,353 | 39,544 |
| OPAP SA | | 1,855 | 31,639 |
| Piraeus Financial Holdings SA | | 7,538 | 28,190 |
TOTAL GREECE | | | 99,373 |
| Hong Kong - 0.8% | | | |
| ASMPT Ltd. | | 1,966 | 21,313 |
| Huanxi Media Group Ltd. (a) | | 61,876 | 4,683 |
| Kerry Properties Ltd. | | 9,052 | 19,120 |
| Prudential PLC | | 4,394 | 36,579 |
TOTAL HONG KONG | | | 81,695 |
| Hungary - 0.3% | | | |
| OTP Bank PLC | | 569 | 28,323 |
| India - 13.4% | | | |
| Axis Bank Ltd. sponsored GDR (Reg. S) | | 2,602 | 179,538 |
| HDFC Bank Ltd. sponsored ADR | | 3,210 | 202,326 |
| ICICI Bank Ltd. sponsored ADR | | 8,933 | 271,653 |
| Infosys Ltd. sponsored ADR | | 9,057 | 189,382 |
| Larsen & Toubro Ltd. GDR | | 2,406 | 103,217 |
| Mahindra & Mahindra Ltd. sponsored GDR | | 272 | 8,922 |
| Reliance Industries Ltd. GDR (b) | | 5,556 | 347,806 |
TOTAL INDIA | | | 1,302,844 |
| Indonesia - 2.2% | | | |
| PT Bank Central Asia Tbk | | 155,230 | 100,464 |
| PT Bank Mandiri (Persero) Tbk | | 23,700 | 10,061 |
| PT Bank Rakyat Indonesia (Persero) Tbk | | 250,966 | 76,508 |
| PT Sumber Alfaria Trijaya Tbk | | 54,828 | 11,494 |
| PT Telkom Indonesia Persero Tbk | | 63,603 | 11,369 |
TOTAL INDONESIA | | | 209,896 |
| Korea (South) - 7.9% | | | |
| AMOREPACIFIC Corp. | | 393 | 33,280 |
| Coway Co. Ltd. | | 836 | 38,319 |
| Delivery Hero AG (a)(b) | | 542 | 23,009 |
| Hana Financial Group, Inc. | | 474 | 20,517 |
| HLB, Inc. (a) | | 119 | 5,664 |
| Hyundai Motor Co. Ltd. | | 65 | 10,045 |
| Kakao Corp. | | 649 | 17,330 |
| KB Financial Group, Inc. | | 648 | 42,303 |
| LG Corp. | | 146 | 8,004 |
| LS Electric Co. Ltd. | | 114 | 11,987 |
| NAVER Corp. | | 581 | 71,302 |
| Samsung Biologics Co. Ltd. (a)(b) | | 53 | 38,457 |
| Samsung Electronics Co. Ltd. | | 6,895 | 293,727 |
| Samsung Fire & Marine Insurance Co. Ltd. | | 34 | 8,270 |
| SK Hynix, Inc. | | 902 | 118,471 |
| SK Square Co. Ltd. (a) | | 273 | 16,540 |
| Webtoon Entertainment, Inc. | | 794 | 8,258 |
TOTAL KOREA (SOUTH) | | | 765,483 |
| Malaysia - 1.1% | | | |
| CIMB Group Holdings Bhd | | 40,500 | 73,440 |
| Tenaga Nasional Bhd | | 9,800 | 31,352 |
TOTAL MALAYSIA | | | 104,792 |
| Mexico - 1.7% | | | |
| Corporacion Inmobiliaria Vesta S.A.B. de CV | | 3,991 | 10,430 |
| Corporacion Inmobiliaria Vesta S.A.B. de CV ADR | | 432 | 11,258 |
| Fibra Uno Administracion SA de CV | | 9,400 | 10,824 |
| Gruma S.A.B. de CV Series B | | 239 | 4,128 |
| Grupo Financiero Banorte S.A.B. de CV | | 11,591 | 80,710 |
| Wal-Mart de Mexico SA de CV Series V | | 18,723 | 51,483 |
TOTAL MEXICO | | | 168,833 |
| Netherlands - 0.3% | | | |
| CTP BV (b) | | 1,881 | 31,346 |
| Panama - 0.3% | | | |
| Copa Holdings SA Class A | | 340 | 33,082 |
| Philippines - 0.5% | | | |
| Ayala Land, Inc. | | 40,000 | 22,349 |
| International Container Terminal Services, Inc. | | 2,300 | 15,568 |
| SM Investments Corp. | | 510 | 8,191 |
| SM Prime Holdings, Inc. | | 3,900 | 2,043 |
TOTAL PHILIPPINES | | | 48,151 |
| Poland - 0.9% | | | |
| Allegro.eu SA (a)(b) | | 7,526 | 66,033 |
| CD Projekt SA | | 478 | 19,196 |
| Dino Polska SA (a)(b) | | 51 | 4,226 |
TOTAL POLAND | | | 89,455 |
| Puerto Rico - 0.2% | | | |
| Liberty Latin America Ltd. Class C (a) | | 1,778 | 17,211 |
| Saudi Arabia - 2.9% | | | |
| Al Rajhi Bank | | 4,938 | 115,703 |
| Alinma Bank | | 4,646 | 34,761 |
| Bupa Arabia for Cooperative Insurance Co. | | 583 | 31,263 |
| Dr Sulaiman Al Habib Medical Services Group Co. | | 457 | 34,825 |
| Sabic Agriculture-Nutrients Co. | | 902 | 27,331 |
| The Saudi National Bank | | 4,331 | 38,228 |
TOTAL SAUDI ARABIA | | | 282,111 |
| South Africa - 3.8% | | | |
| Capitec Bank Holdings Ltd. | | 609 | 110,016 |
| Discovery Ltd. | | 3,533 | 36,229 |
| FirstRand Ltd. | | 8,897 | 39,091 |
| Impala Platinum Holdings Ltd. (a) | | 4,430 | 29,240 |
| Northam Platinum Holdings Ltd. | | 2,735 | 20,235 |
| Pepkor Holdings Ltd. (b) | | 41,881 | 54,365 |
| Pick 'n Pay Stores Ltd. (a) | | 12,495 | 18,109 |
| Shoprite Holdings Ltd. | | 3,283 | 56,699 |
| Standard Bank Group Ltd. | | 784 | 10,794 |
TOTAL SOUTH AFRICA | | | 374,778 |
| Taiwan - 17.5% | | | |
| Accton Technology Corp. | | 1,000 | 16,858 |
| ASE Technology Holding Co. Ltd. | | 3,242 | 15,338 |
| Asia Vital Components Co. Ltd. | | 1,073 | 20,622 |
| AURAS Technology Co. Ltd. | | 1,000 | 20,159 |
| BizLink Holding, Inc. | | 3,225 | 46,641 |
| Chailease Holding Co. Ltd. | | 12,472 | 58,594 |
| Delta Electronics, Inc. | | 3,000 | 37,173 |
| E Ink Holdings, Inc. | | 3,000 | 28,169 |
| Formosa Plastics Corp. | | 8,000 | 11,770 |
| Hon Hai Precision Industry Co. Ltd. (Foxconn) | | 15,000 | 96,459 |
| King Yuan Electronics Co. Ltd. | | 4,755 | 17,979 |
| MediaTek, Inc. | | 1,000 | 39,055 |
| PharmaEssentia Corp. (a) | | 1,000 | 19,620 |
| Quanta Computer, Inc. | | 3,073 | 27,998 |
| Taiwan Semiconductor Manufacturing Co. Ltd. | | 37,437 | 1,177,830 |
| Uni-President Enterprises Corp. | | 19,473 | 54,710 |
| Yageo Corp. | | 1,087 | 18,548 |
TOTAL TAIWAN | | | 1,707,523 |
| Tanzania - 0.3% | | | |
| Helios Towers PLC (a) | | 19,729 | 27,068 |
| Thailand - 0.1% | | | |
| CP ALL PCL (For. Reg.) | | 3,900 | 7,305 |
| United Arab Emirates - 0.6% | | | |
| ADNOC Drilling Co. PJSC | | 16,224 | 22,394 |
| Aldar Properties PJSC | | 8,664 | 17,974 |
| Emaar Properties PJSC | | 5,676 | 13,429 |
TOTAL UNITED ARAB EMIRATES | | | 53,797 |
| United Kingdom - 1.0% | | | |
| AngloGold Ashanti PLC | | 1,699 | 47,232 |
| AngloGold Ashanti PLC | | 1,869 | 52,143 |
TOTAL UNITED KINGDOM | | | 99,375 |
| United States of America - 0.5% | | | |
| FirstCash Holdings, Inc. | | 187 | 19,349 |
| Tenaris SA sponsored ADR | | 194 | 6,379 |
| Titan Cement International Trading SA | | 753 | 26,620 |
TOTAL UNITED STATES OF AMERICA | | | 52,348 |
| TOTAL COMMON STOCKS (Cost $8,053,747) | | | 9,026,766 |
| | | | |
| Nonconvertible Preferred Stocks - 0.3% |
| | | Shares | Value ($) |
| Korea (South) - 0.3% | | | |
Hyundai Motor Co. Ltd. Series 2 (Cost $26,486) | | 290 | 33,615 |
| | | | |
| Money Market Funds - 5.9% |
| | | Shares | Value ($) |
Fidelity Cash Central Fund 4.87% (c) (Cost $575,973) | | 575,858 | 575,973 |
| | | | |
| TOTAL INVESTMENT IN SECURITIES - 98.8% (Cost $8,656,206) | 9,636,354 |
NET OTHER ASSETS (LIABILITIES) - 1.2% | 121,324 |
| NET ASSETS - 100.0% | 9,757,678 |
| | |
| Futures Contracts |
| | Number of contracts | Expiration Date | Notional Amount ($) | Value ($) | Unrealized Appreciation/ (Depreciation) ($) |
| Purchased | | | | | |
| | | | | | |
| Equity Index Contracts | | | | | |
| ICE E-mini MSCI Emerging Markets Index Contracts (United States) | 10 | Dec 2024 | 563,250 | 1,770 | 1,770 |
| | | | | | |
| The notional amount of futures purchased as a percentage of Net Assets is 5.8% |
Legend
| (b) | Security exempt from registration under Rule 144A of the Securities Act of 1933. These securities may be resold in transactions exempt from registration, normally to qualified institutional buyers. At the end of the period, the value of these securities amounted to $911,841 or 9.3% of net assets. |
| (c) | Affiliated fund that is generally available only to investment companies and other accounts managed by Fidelity Investments. The rate quoted is the annualized seven-day yield of the fund at period end. A complete unaudited listing of the fund's holdings as of its most recent quarter end is available upon request. In addition, each Fidelity Central Fund's financial statements, which are not covered by the Fund's Report of Independent Registered Public Accounting Firm, are available on the SEC's website or upon request. |
Affiliated Central Funds
Fiscal year to date information regarding the Fund's investments in Fidelity Central Funds, including the ownership percentage, is presented below.
| Affiliate | Value, beginning of period ($) | Purchases ($) | Sales Proceeds ($) | Dividend Income ($) | Realized Gain (loss) ($) | Change in Unrealized appreciation (depreciation) ($) | Value, end of period ($) | % ownership, end of period |
| Fidelity Cash Central Fund 4.87% | 118,523 | 4,010,740 | 3,553,283 | 14,193 | (7) | - | 575,973 | 0.0% |
| Total | 118,523 | 4,010,740 | 3,553,283 | 14,193 | (7) | - | 575,973 | |
| | | | | | | | | |
Amounts in the dividend income column in the above table include any capital gain distributions from underlying funds, which are presented in the corresponding line item in the Statement of Operations, if applicable.
Amounts included in the purchases and sales proceeds columns may include in-kind transactions, if applicable.
Investment Valuation
The following is a summary of the inputs used, as of October 31, 2024, involving the Fund's assets and liabilities carried at fair value. The inputs or methodology used for valuing securities may not be an indication of the risk associated with investing in those securities. For more information on valuation inputs, and their aggregation into the levels used below, please refer to the Investment Valuation section in the accompanying Notes to Financial Statements.
| Valuation Inputs at Reporting Date: |
| Description | Total ($) | Level 1 ($) | Level 2 ($) | Level 3 ($) |
Investments in Securities: | | | | |
|
| Equities: | | | | |
Communication Services | 721,137 | 117,953 | 603,184 | - |
Consumer Discretionary | 1,537,553 | 448,010 | 1,089,543 | - |
Consumer Staples | 358,070 | 116,564 | 241,506 | - |
Energy | 440,071 | 432,039 | 8,032 | - |
Financials | 2,241,960 | 1,240,749 | 1,001,211 | - |
Health Care | 291,436 | 100,150 | 191,286 | - |
Industrials | 535,925 | 257,086 | 278,839 | - |
Information Technology | 2,243,796 | 189,382 | 2,054,414 | - |
Materials | 304,371 | 163,343 | 141,028 | - |
Real Estate | 176,922 | 133,410 | 43,512 | - |
Utilities | 209,140 | 117,531 | 91,609 | - |
|
| Money Market Funds | 575,973 | 575,973 | - | - |
| Total Investments in Securities: | 9,636,354 | 3,892,190 | 5,744,164 | - |
Derivative Instruments: Assets | | | | |
Futures Contracts | 1,770 | 1,770 | - | - |
| Total Assets | 1,770 | 1,770 | - | - |
| Total Derivative Instruments: | 1,770 | 1,770 | - | - |
Value of Derivative Instruments
The following table is a summary of the Fund's value of derivative instruments by primary risk exposure as of October 31, 2024. For additional information on derivative instruments, please refer to the Derivative Instruments section in the accompanying Notes to Financial Statements.
Primary Risk Exposure / Derivative Type | Value |
| Asset ($) | Liability ($) |
| Equity Risk | | |
Futures Contracts (a) | 1,770 | 0 |
| Total Equity Risk | 1,770 | 0 |
| Total Value of Derivatives | 1,770 | 0 |
(a)Reflects gross cumulative appreciation (depreciation) on futures contracts as presented in the Schedule of Investments. In the Statement of Assets and Liabilities, the period end daily variation margin is included in receivable or payable for daily variation margin on futures contracts, and the net cumulative appreciation (depreciation) is included in Total accumulated earnings (loss).
Fidelity® Series Sustainable Emerging Markets Fund
Financial Statements
| Statement of Assets and Liabilities |
As of October 31, 2024 |
| Assets | | | | |
| Investment in securities, at value - See accompanying schedule: | | | | |
Unaffiliated issuers (cost $8,080,233) | $ | 9,060,381 | | |
Fidelity Central Funds (cost $575,973) | | 575,973 | | |
| | | | | |
| | | | | |
| Total Investment in Securities (cost $8,656,206) | | | $ | 9,636,354 |
| Segregated cash with brokers for derivative instruments | | | | 16,524 |
| Cash | | | | 13,853 |
| Foreign currency held at value (cost $1,411) | | | | 1,411 |
| Receivable for investments sold | | | | 208,151 |
| Receivable for fund shares sold | | | | 121,202 |
| Dividends receivable | | | | 10,058 |
| Distributions receivable from Fidelity Central Funds | | | | 1,658 |
Total assets | | | | 10,009,211 |
| Liabilities | | | | |
| Payable for investments purchased | $ | 235,358 | | |
| Payable for daily variation margin on futures contracts | | 3,002 | | |
| Other affiliated payables | | 2,385 | | |
| Other payables and accrued expenses | | 10,788 | | |
| Total liabilities | | | | 251,533 |
| Net Assets | | | $ | 9,757,678 |
| Net Assets consist of: | | | | |
| Paid in capital | | | $ | 8,768,758 |
| Total accumulated earnings (loss) | | | | 988,920 |
| Net Assets | | | $ | 9,757,678 |
Net Asset Value, offering price and redemption price per share ($9,757,678 ÷ 838,916 shares) | | | $ | 11.63 |
| Statement of Operations |
| Year ended October 31, 2024 |
| Investment Income | | | | |
| Dividends | | | $ | 184,339 |
| Interest | | | | 433 |
| Income from Fidelity Central Funds | | | | 14,193 |
| Income before foreign taxes withheld | | | $ | 198,965 |
| Less foreign taxes withheld | | | | (18,815) |
| Total income | | | | 180,150 |
| Expenses | | | | |
| Custodian fees and expenses | $ | 22,329 | | |
| Independent trustees' fees and expenses | | 28 | | |
| Miscellaneous | | 6 | | |
| Total expenses before reductions | | 22,363 | | |
| Expense reductions | | (22,142) | | |
| Total expenses after reductions | | | | 221 |
| Net Investment income (loss) | | | | 179,929 |
| Realized and Unrealized Gain (Loss) | | | | |
| Net realized gain (loss) on: | | | | |
| Investment Securities: | | | | |
| Unaffiliated issuers | | (74,901) | | |
| Fidelity Central Funds | | (7) | | |
| Foreign currency transactions | | (4,846) | | |
| Futures contracts | | (26,847) | | |
| Total net realized gain (loss) | | | | (106,601) |
| Change in net unrealized appreciation (depreciation) on: | | | | |
| Investment Securities: | | | | |
| Unaffiliated issuers | | 1,202,838 | | |
| Assets and liabilities in foreign currencies | | (271) | | |
| Futures contracts | | 4,729 | | |
| Total change in net unrealized appreciation (depreciation) | | | | 1,207,296 |
| Net gain (loss) | | | | 1,100,695 |
| Net increase (decrease) in net assets resulting from operations | | | $ | 1,280,624 |
| Statement of Changes in Net Assets |
| |
| | Year ended October 31, 2024 | | For the period May 11, 2023 (commencement of operations) through October 31, 2023 |
| Increase (Decrease) in Net Assets | | | | |
| Operations | | | | |
| Net investment income (loss) | $ | 179,929 | $ | 69,905 |
| Net realized gain (loss) | | (106,601) | | (38,471) |
| Change in net unrealized appreciation (depreciation) | | 1,207,296 | | (225,646) |
| Net increase (decrease) in net assets resulting from operations | | 1,280,624 | | (194,212) |
| Distributions to shareholders | | (97,501) | | - |
| | | | | |
| Share transactions | | | | |
| Proceeds from sales of shares | | 4,545,822 | | 4,692,849 |
| Reinvestment of distributions | | 97,501 | | - |
| Cost of shares redeemed | | (409,939) | | (157,466) |
| | | | | |
Net increase (decrease) in net assets resulting from share transactions | | 4,233,384 | | 4,535,383 |
| Total increase (decrease) in net assets | | 5,416,507 | | 4,341,171 |
| | | | | |
| Net Assets | | | | |
| Beginning of period | | 4,341,171 | | - |
| End of period | $ | 9,757,678 | $ | 4,341,171 |
| | | | | |
| Other Information | | | | |
| Shares | | | | |
| Sold | | 415,045 | | 466,593 |
| Issued in reinvestment of distributions | | 9,663 | | - |
| Redeemed | | (36,950) | | (15,435) |
| Net increase (decrease) | | 387,758 | | 451,158 |
| | | | | |
Financial Highlights
Fidelity® Series Sustainable Emerging Markets Fund |
| |
| Years ended October 31, | | 2024 | | 2023 A |
Selected Per-Share Data | | | | |
| Net asset value, beginning of period | $ | 9.62 | $ | 10.00 |
| Income from Investment Operations | | | | |
Net investment income (loss) B,C | | .28 | | .16 |
| Net realized and unrealized gain (loss) | | 1.95 | | (.54) |
| Total from investment operations | | 2.23 | | (.38) |
| Distributions from net investment income | | (.22) | | - |
| Total distributions | | (.22) | | - |
| Net asset value, end of period | $ | 11.63 | $ | 9.62 |
Total Return D,E | | | | (3.80)% |
Ratios to Average Net Assets C,F,G | | | | |
| Expenses before reductions | | .32% | | .31% H |
| Expenses net of fee waivers, if any | | | | .01% H |
| Expenses net of all reductions | | -% I | | .01% H |
| Net investment income (loss) | | 2.56% | | 3.40% H |
| Supplemental Data | | | | |
| Net assets, end of period (000 omitted) | $ | 9,758 | $ | 4,341 |
Portfolio turnover rate J | | | | 36% K |
AFor the period May 11, 2023 (commencement of operations) through October 31, 2023.
BCalculated based on average shares outstanding during the period.
CNet investment income (loss) is affected by the timing of the declaration of dividends by any underlying mutual funds or exchange-traded funds (ETFs). Net investment income (loss) of any mutual funds or ETFs is not included in the Fund's net investment income (loss) ratio.
DTotal returns for periods of less than one year are not annualized.
ETotal returns would have been lower if certain expenses had not been reduced during the applicable periods shown.
FFees and expenses of any underlying mutual funds or exchange-traded funds (ETFs) are not included in the Fund's expense ratio. The Fund indirectly bears its proportionate share of these expenses. For additional expense information related to investments in Fidelity Central Funds, please refer to the "Investments in Fidelity Central Funds" note found in the Notes to Financial Statements section of the most recent Annual or Semi-Annual report.
GExpense ratios reflect operating expenses of the class. Expenses before reductions do not reflect amounts reimbursed, waived, or reduced through arrangements with the investment adviser, brokerage services, or other offset arrangements, if applicable, and do not represent the amount paid by the class during periods when reimbursements, waivers or reductions occur.
HAnnualized.
IAmount represents less than .005%.
JAmount does not include the portfolio activity of any underlying mutual funds or exchange-traded funds (ETFs).
KAmount not annualized.
Fidelity® Series Sustainable Non-U.S. Developed Markets Fund
Schedule of Investments October 31, 2024
Showing Percentage of Net Assets
| Common Stocks - 93.7% |
| | | Shares | Value ($) |
| Australia - 2.2% | | | |
| ASX Ltd. | | 182 | 7,751 |
| Brambles Ltd. | | 2,880 | 34,675 |
| Cochlear Ltd. | | 88 | 16,292 |
| Commonwealth Bank of Australia | | 60 | 5,596 |
| Macquarie Group Ltd. | | 380 | 57,512 |
| Mineral Resources Ltd. | | 480 | 12,335 |
| Pilbara Minerals Ltd. (a) | | 6,622 | 12,265 |
| QBE Insurance Group Ltd. | | 1,405 | 15,863 |
| REA Group Ltd. | | 76 | 11,235 |
| Suncorp Group Ltd. | | 2,707 | 31,754 |
| Transurban Group unit | | 5,690 | 47,420 |
| WiseTech Global Ltd. | | 257 | 19,732 |
| Woodside Energy Group Ltd. | | 4,249 | 66,873 |
TOTAL AUSTRALIA | | | 339,303 |
| Austria - 0.2% | | | |
| Mondi PLC | | 898 | 14,532 |
| OMV AG | | 394 | 16,329 |
| Verbund AG | | 1 | 82 |
TOTAL AUSTRIA | | | 30,943 |
| Belgium - 1.0% | | | |
| Azelis Group NV | | 1,419 | 28,138 |
| Fagron NV | | 476 | 9,599 |
| KBC Ancora | | 426 | 21,501 |
| KBC Group NV | | 1,379 | 100,020 |
TOTAL BELGIUM | | | 159,258 |
| Brazil - 0.4% | | | |
| Wheaton Precious Metals Corp. | | 1,025 | 67,690 |
| Canada - 12.0% | | | |
| Alimentation Couche-Tard, Inc. (multi-vtg.) | | 1,939 | 101,117 |
| Andlauer Healthcare Group, Inc. | | 527 | 15,545 |
| Aritzia, Inc. (a) | | 289 | 9,305 |
| Bank of Montreal | | 1,148 | 104,613 |
| Brookfield Asset Management Ltd. Class A | | 529 | 28,066 |
| Brookfield Corp. (Canada) Class A | | 1,525 | 80,864 |
| CAE, Inc. (a) | | 2,825 | 49,709 |
| Cameco Corp. | | 871 | 45,516 |
| Canadian Imperial Bank of Commerce | | 1,254 | 78,454 |
| Canadian National Railway Co. | | 714 | 77,100 |
| Canadian Natural Resources Ltd. | | 1,157 | 39,346 |
| Canadian Pacific Kansas City Ltd. | | 2,052 | 158,297 |
| CCL Industries, Inc. Class B | | 142 | 8,283 |
| Computer Modelling Group Ltd. | | 781 | 6,417 |
| Constellation Software, Inc. | | 26 | 78,411 |
| Definity Financial Corp. | | 825 | 31,836 |
| Dollarama, Inc. | | 496 | 51,614 |
| Enbridge, Inc. | | 1,478 | 59,700 |
| Franco-Nevada Corp. | | 515 | 68,361 |
| Intact Financial Corp. | | 224 | 42,778 |
| Metro, Inc. | | 263 | 15,619 |
| North West Co., Inc. | | 224 | 8,432 |
| Nutrien Ltd. | | 1,061 | 50,591 |
| Osisko Gold Royalties Ltd. | | 332 | 6,681 |
| Pason Systems, Inc. | | 1,984 | 19,194 |
| Pet Valu Holdings Ltd. | | 216 | 3,951 |
| PrairieSky Royalty Ltd. | | 1,766 | 35,336 |
| Restaurant Brands International, Inc. | | 249 | 17,318 |
| Richelieu Hardware Ltd. | | 766 | 20,185 |
| Royal Bank of Canada | | 1,198 | 144,885 |
| Shopify, Inc. Class A (a) | | 930 | 72,752 |
| Stella-Jones, Inc. | | 227 | 13,724 |
| Sun Life Financial, Inc. | | 1,918 | 106,345 |
| Suncor Energy, Inc. | | 1,200 | 45,299 |
| The Toronto-Dominion Bank | | 1,661 | 91,821 |
| Thomson Reuters Corp. | | 209 | 34,211 |
| TMX Group Ltd. | | 1,967 | 61,439 |
| Triple Flag Precious Metals Corp. | | 391 | 6,700 |
TOTAL CANADA | | | 1,889,815 |
| Chile - 0.1% | | | |
| Lundin Mining Corp. | | 1,550 | 15,073 |
| Denmark - 2.6% | | | |
| A.P. Moller - Maersk A/S Series A | | 2 | 3,042 |
| Carlsberg A/S Series B | | 88 | 9,725 |
| Novo Nordisk A/S Series B | | 3,214 | 360,498 |
| Novonesis (NOVOZYMES) B Series B | | 97 | 6,078 |
| ORSTED A/S (a)(b) | | 111 | 6,486 |
| Pandora A/S | | 94 | 14,173 |
| Vestas Wind Systems A/S (a) | | 311 | 5,927 |
TOTAL DENMARK | | | 405,929 |
| Finland - 0.8% | | | |
| Elisa Corp. (A Shares) | | 275 | 13,090 |
| Kesko Oyj | | 543 | 11,615 |
| Metso Corp. | | 1,088 | 10,303 |
| Neste OYJ | | 277 | 4,448 |
| Nokia Corp. | | 3,806 | 18,010 |
| Sampo Oyj (A Shares) | | 824 | 36,480 |
| Stora Enso Oyj (R Shares) | | 1,080 | 12,006 |
| UPM-Kymmene Corp. | | 294 | 8,612 |
| Wartsila Corp. | | 866 | 16,494 |
TOTAL FINLAND | | | 131,058 |
| France - 7.9% | | | |
| Accor SA | | 606 | 27,461 |
| Air Liquide SA | | 400 | 71,721 |
| Airbus Group NV | | 692 | 105,559 |
| Alten SA | | 254 | 21,468 |
| ARGAN SA | | 33 | 2,441 |
| AXA SA | | 2,756 | 103,485 |
| BNP Paribas SA | | 662 | 45,211 |
| Capgemini SA | | 322 | 55,861 |
| Compagnie Generale des Etablissements Michelin SCA Series B | | 1,560 | 52,721 |
| Covivio | | 369 | 20,992 |
| Danone SA | | 899 | 64,223 |
| Dassault Systemes SA | | 1,593 | 54,521 |
| Edenred SA | | 638 | 20,507 |
| Elis SA | | 181 | 4,095 |
| EssilorLuxottica SA | | 230 | 53,889 |
| Eurazeo SA | | 263 | 20,011 |
| Kering SA | | 14 | 3,497 |
| L'Oreal SA | | 135 | 50,648 |
| Lectra | | 644 | 17,863 |
| Legrand SA | | 365 | 41,197 |
| LVMH Moet Hennessy Louis Vuitton SE | | 270 | 179,745 |
| Rexel SA | | 1,141 | 31,251 |
| Societe Generale Series A | | 84 | 2,413 |
| Stef SA | | 73 | 10,910 |
| Thales SA | | 111 | 17,888 |
| Thermador Groupe SA | | 116 | 9,009 |
| TotalEnergies SE | | 2,375 | 149,045 |
TOTAL FRANCE | | | 1,237,632 |
| Germany - 7.0% | | | |
| adidas AG | | 15 | 3,592 |
| Allianz SE | | 175 | 55,091 |
| Deutsche Borse AG | | 561 | 130,308 |
| GEA Group AG | | 255 | 12,560 |
| Hannover Reuck SE | | 299 | 78,545 |
| HeidelbergCement AG | | 148 | 16,292 |
| Henkel AG & Co. KGaA | | 552 | 43,051 |
| Infineon Technologies AG | | 688 | 21,758 |
| Knorr-Bremse AG | | 171 | 14,062 |
| Merck KGaA | | 385 | 63,655 |
| Muenchener Rueckversicherungs-Gesellschaft AG in Muenchen | | 173 | 88,469 |
| Nexus AG | | 276 | 14,456 |
| Puma AG | | 149 | 6,771 |
| Rheinmetall AG | | 164 | 84,415 |
| SAP SE | | 1,629 | 380,349 |
| Siemens AG | | 402 | 78,209 |
| Siemens Healthineers AG (b) | | 47 | 2,452 |
| Stabilus Se | | 66 | 2,610 |
| Symrise AG | | 34 | 4,090 |
TOTAL GERMANY | | | 1,100,735 |
| Hong Kong - 0.2% | | | |
| AIA Group Ltd. | | 194 | 1,531 |
| Hang Seng Bank Ltd. | | 1,300 | 15,902 |
| Hong Kong Exchanges and Clearing Ltd. | | 3 | 120 |
| Prudential PLC | | 2,103 | 17,507 |
TOTAL HONG KONG | | | 35,060 |
| India - 0.2% | | | |
| Reliance Industries Ltd. GDR (b) | | 488 | 30,549 |
| Indonesia - 0.2% | | | |
| PT Bank Central Asia Tbk | | 37,289 | 24,133 |
| Ireland - 0.8% | | | |
| AerCap Holdings NV | | 184 | 17,213 |
| Bank of Ireland Group PLC | | 2,047 | 18,842 |
| Cairn Homes PLC | | 3,126 | 7,239 |
| Cairn Homes PLC | | 1,983 | 4,605 |
| Kerry Group PLC Class A | | 339 | 33,740 |
| Kingspan Group PLC (Ireland) | | 563 | 49,390 |
TOTAL IRELAND | | | 131,029 |
| Israel - 0.1% | | | |
| Ituran Location & Control Ltd. | | 143 | 3,822 |
| NICE Ltd. (a) | | 36 | 6,362 |
| Wix.com Ltd. (a) | | 68 | 11,364 |
TOTAL ISRAEL | | | 21,548 |
| Italy - 2.6% | | | |
| Eni SpA | | 2,427 | 36,971 |
| Generali | | 3,057 | 84,960 |
| Industrie de Nora SpA | | 119 | 1,119 |
| Intercos SpA | | 247 | 3,960 |
| Interpump Group SpA | | 704 | 31,274 |
| Intesa Sanpaolo SpA | | 7,843 | 33,568 |
| Moncler SpA | | 388 | 21,499 |
| Prada SpA | | 3,671 | 28,184 |
| Prysmian SpA | | 295 | 20,800 |
| Recordati SpA | | 443 | 25,106 |
| UniCredit SpA | | 2,597 | 114,889 |
TOTAL ITALY | | | 402,330 |
| Japan - 15.3% | | | |
| Advantest Corp. | | 100 | 5,790 |
| Ajinomoto Co., Inc. | | 1,561 | 59,967 |
| Asahi Kasei Corp. | | 3,378 | 23,304 |
| Asics Corp. | | 400 | 6,987 |
| Azbil Corp. | | 8,000 | 62,208 |
| BayCurrent Consulting, Inc. | | 196 | 6,370 |
| Bridgestone Corp. | | 1,662 | 59,226 |
| Capcom Co. Ltd. | | 396 | 7,836 |
| Chugai Pharmaceutical Co. Ltd. | | 200 | 9,516 |
| CTS Co. Ltd. | | 600 | 3,572 |
| Curves Holdings Co. Ltd. | | 1,618 | 8,564 |
| Daiichi Sankyo Co. Ltd. | | 806 | 26,234 |
| Daiwa Securities Group, Inc. | | 3,597 | 23,533 |
| DENSO Corp. | | 3,800 | 53,973 |
| Eisai Co. Ltd. | | 301 | 10,198 |
| Elan Corp. | | 507 | 2,884 |
| ENEOS Holdings, Inc. | | 1,499 | 7,562 |
| FANUC Corp. | | 832 | 22,074 |
| Fuji Electric Co. Ltd. | | 100 | 5,093 |
| FUJIFILM Holdings Corp. | | 3,292 | 78,311 |
| Fujitsu Ltd. | | 2,890 | 55,563 |
| Hankyu Hanshin Holdings, Inc. | | 1,247 | 33,906 |
| Hitachi Ltd. | | 8,250 | 207,280 |
| Hoya Corp. | | 963 | 128,844 |
| Ibiden Co. Ltd. | | 957 | 30,399 |
| Isuzu Motors Ltd. | | 800 | 10,345 |
| Itochu Corp. | | 2,481 | 122,730 |
| JFE Holdings, Inc. | | 678 | 8,163 |
| KDDI Corp. | | 1,146 | 35,732 |
| Komatsu Ltd. | | 400 | 10,354 |
| Koshidaka Holdings Co. Ltd. | | 592 | 4,644 |
| Kubota Corp. | | 494 | 6,312 |
| LY Corp. | | 1,100 | 3,001 |
| Marubeni Corp. | | 1,339 | 20,017 |
| Minebea Mitsumi, Inc. | | 298 | 5,246 |
| Misumi Group, Inc. | | 600 | 9,765 |
| Mitsubishi Chemical Group Corp. | | 400 | 2,158 |
| Mitsubishi Electric Corp. | | 600 | 10,556 |
| Mitsubishi Heavy Industries Ltd. | | 10,240 | 144,558 |
| Mitsubishi UFJ Financial Group, Inc. | | 6,000 | 63,241 |
| Mizuho Financial Group, Inc. | | 500 | 10,386 |
| NEC Corp. | | 97 | 8,254 |
| Nintendo Co. Ltd. | | 100 | 5,282 |
| Nitto Denko Corp. | | 500 | 8,227 |
| Nitto Kohki Co. Ltd. | | 200 | 3,375 |
| NOF Corp. | | 700 | 11,373 |
| Nomura Holdings, Inc. | | 2,597 | 13,317 |
| Nomura Research Institute Ltd. | | 639 | 19,115 |
| OMRON Corp. | | 362 | 14,292 |
| Oriental Land Co. Ltd. | | 278 | 6,718 |
| ORIX Corp. | | 1,492 | 31,436 |
| ProNexus, Inc. | | 700 | 5,941 |
| Rakuten Group, Inc. (a) | | 1,000 | 5,969 |
| Recruit Holdings Co. Ltd. | | 1,906 | 116,385 |
| Renesas Electronics Corp. | | 4,835 | 64,781 |
| Ricoh Co. Ltd. | | 2,200 | 23,832 |
| San-Ai Obbli Co. Ltd. | | 200 | 2,442 |
| Seiko Epson Corp. | | 700 | 12,723 |
| Sekisui House Ltd. | | 1,000 | 24,152 |
| SG Holdings Co. Ltd. | | 1,191 | 11,944 |
| Shin-Etsu Chemical Co. Ltd. | | 2,923 | 107,110 |
| SoftBank Corp. | | 7,740 | 9,744 |
| SoftBank Group Corp. | | 499 | 29,750 |
| Softcreate Co. Ltd. | | 200 | 2,834 |
| Software Service, Inc. | | 100 | 8,311 |
| Sompo Holdings, Inc. | | 995 | 21,332 |
| Sony Group Corp. | | 3,205 | 56,400 |
| Sumitomo Mitsui Financial Group, Inc. | | 3,300 | 70,008 |
| SWCC Showa Holdings Co. Ltd. | | 100 | 3,507 |
| Sysmex Corp. | | 903 | 16,754 |
| TIS, Inc. | | 821 | 20,473 |
| Tokio Marine Holdings, Inc. | | 3,613 | 130,126 |
| Tokyo Electron Ltd. | | 388 | 57,095 |
| Tokyu Corp. | | 800 | 9,863 |
| Toray Industries, Inc. | | 1,769 | 9,620 |
| USS Co. Ltd. | | 928 | 7,772 |
| YAKUODO Holdings Co. Ltd. | | 200 | 2,782 |
| Yamaha Motor Co. Ltd. | | 3,224 | 28,181 |
| Yokogawa Electric Corp. | | 976 | 21,640 |
TOTAL JAPAN | | | 2,409,262 |
| Korea (South) - 0.0% | | | |
| Samsung Electronics Co. Ltd. | | 89 | 3,791 |
| Luxembourg - 0.0% | | | |
| Eurofins Scientific SA | | 164 | 8,060 |
| Netherlands - 3.9% | | | |
| Akzo Nobel NV | | 219 | 13,975 |
| ASM International NV (Netherlands) | | 14 | 7,800 |
| ASML Holding NV (Netherlands) | | 506 | 341,909 |
| BE Semiconductor Industries NV | | 110 | 11,719 |
| IMCD NV | | 424 | 67,359 |
| ING Groep NV (Certificaten Van Aandelen) | | 709 | 12,032 |
| Koninklijke Heijmans NV (Certificaten Van Aandelen) | | 197 | 5,304 |
| Koninklijke KPN NV | | 7,261 | 28,378 |
| TKH Group NV (bearer) (depositary receipt) | | 70 | 2,840 |
| Topicus.Com, Inc. | | 65 | 5,564 |
| Universal Music Group NV | | 343 | 8,632 |
| Wolters Kluwer NV | | 619 | 104,162 |
TOTAL NETHERLANDS | | | 609,674 |
| New Zealand - 0.1% | | | |
| Meridian Energy Ltd. | | 2,263 | 8,037 |
| Xero Ltd. (a) | | 53 | 5,149 |
TOTAL NEW ZEALAND | | | 13,186 |
| Norway - 0.8% | | | |
| DNB Bank ASA | | 737 | 15,222 |
| Equinor ASA | | 1,492 | 35,453 |
| Gjensidige Forsikring ASA | | 746 | 13,462 |
| Kongsberg Gruppen ASA | | 387 | 40,282 |
| Norsk Hydro ASA | | 1,031 | 6,400 |
| Orkla ASA | | 1,604 | 14,829 |
TOTAL NORWAY | | | 125,648 |
| Portugal - 0.2% | | | |
| Galp Energia SGPS SA | | 1,809 | 30,834 |
| Singapore - 0.7% | | | |
| CapitaLand Investment Ltd. | | 12,233 | 25,843 |
| Keppel Ltd. | | 6,796 | 32,719 |
| STMicroelectronics NV (France) | | 718 | 19,545 |
| United Overseas Bank Ltd. | | 1,527 | 37,120 |
TOTAL SINGAPORE | | | 115,227 |
| South Africa - 0.1% | | | |
| Anglo American PLC (United Kingdom) | | 629 | 19,499 |
| Spain - 1.6% | | | |
| ACS Actividades de Construccion y Servicios SA | | 316 | 15,124 |
| Amadeus IT Holding SA Class A | | 1,075 | 77,877 |
| Banco Bilbao Vizcaya Argentaria SA | | 1,331 | 13,250 |
| Banco de Sabadell SA | | 6,646 | 12,929 |
| CaixaBank SA | | 5,109 | 31,133 |
| Cellnex Telecom SA (b) | | 564 | 20,675 |
| Fluidra SA | | 124 | 3,334 |
| Iberdrola SA | | 1,337 | 19,844 |
| Industria de Diseno Textil SA | | 216 | 12,288 |
| Redeia Corp. SA | | 1,213 | 22,430 |
| Repsol SA | | 565 | 7,073 |
| Unicaja Banco SA (b) | | 8,537 | 10,698 |
TOTAL SPAIN | | | 246,655 |
| Sweden - 3.3% | | | |
| Addlife AB B Shares | | 216 | 2,745 |
| AddTech AB (B Shares) | | 1,220 | 33,825 |
| ASSA ABLOY AB (B Shares) | | 1,441 | 45,136 |
| Atlas Copco AB (A Shares) | | 9,799 | 161,717 |
| Autoliv, Inc. | | 205 | 19,040 |
| Bergman & Beving AB (B Shares) | | 290 | 8,152 |
| Boliden AB | | 1,430 | 44,398 |
| Dometic Group AB (b) | | 239 | 1,298 |
| Epiroc AB: | | | |
| (A Shares) | | 1,807 | 35,291 |
| (B Shares) | | 643 | 11,038 |
| EQT AB | | 298 | 8,643 |
| Essity AB (B Shares) | | 477 | 13,467 |
| Evolution AB (b) | | 49 | 4,633 |
| H&M Hennes & Mauritz AB (B Shares) | | 244 | 3,624 |
| Hemnet Group AB | | 90 | 2,825 |
| Indutrade AB | | 1,377 | 37,299 |
| INVISIO AB | | 692 | 17,406 |
| John Mattson Fastighetsforetagen AB (a) | | 377 | 2,328 |
| Lagercrantz Group AB (B Shares) | | 501 | 9,771 |
| Svenska Cellulosa AB SCA (B Shares) | | 1,966 | 25,990 |
| Svenska Handelsbanken AB (A Shares) | | 972 | 10,100 |
| Tele2 AB (B Shares) | | 827 | 8,666 |
| Telia Co. AB | | 4,268 | 12,402 |
TOTAL SWEDEN | | | 519,794 |
| Switzerland - 3.7% | | | |
| ABB Ltd. (Reg.) | | 1,788 | 99,361 |
| Banque Cantonale Vaudoise | | 76 | 7,578 |
| Clariant AG (Reg.) | | 201 | 2,791 |
| Compagnie Financiere Richemont SA Series A | | 160 | 23,296 |
| DSM-Firmenich AG | | 136 | 16,140 |
| Givaudan SA | | 7 | 33,211 |
| Kuehne & Nagel International AG | | 113 | 28,212 |
| Logitech International SA (Reg.) | | 215 | 17,617 |
| Novartis AG | | 288 | 31,250 |
| Partners Group Holding AG | | 23 | 31,775 |
| SGS SA (Reg.) | | 114 | 12,079 |
| Sig Group AG | | 1,237 | 26,629 |
| Sonova Holding AG | | 63 | 23,054 |
| Swiss Life Holding AG | | 21 | 17,130 |
| Swiss Prime Site AG | | 373 | 40,451 |
| Tecan Group AG | | 50 | 12,622 |
| VAT Group AG (b) | | 55 | 22,897 |
| Zurich Insurance Group Ltd. | | 223 | 131,482 |
TOTAL SWITZERLAND | | | 577,575 |
| Taiwan - 1.0% | | | |
| Taiwan Semiconductor Manufacturing Co. Ltd. | | 4,823 | 151,739 |
| United Kingdom - 14.0% | | | |
| 3i Group PLC | | 2,732 | 112,033 |
| Admiral Group PLC | | 336 | 11,109 |
| AstraZeneca PLC (United Kingdom) | | 972 | 138,309 |
| Aviva PLC | | 5,139 | 30,025 |
| B&M European Value Retail SA | | 837 | 4,183 |
| BAE Systems PLC | | 14,713 | 237,134 |
| Barclays PLC | | 5,993 | 18,372 |
| Barratt Developments PLC | | 9,019 | 51,914 |
| Beazley PLC | | 1,513 | 14,739 |
| Berkeley Group Holdings PLC | | 213 | 12,155 |
| Bunzl PLC | | 556 | 24,462 |
| Clarkson PLC | | 144 | 6,527 |
| Coca-Cola Europacific Partners PLC | | 218 | 16,568 |
| Compass Group PLC | | 4,573 | 148,515 |
| Croda International PLC | | 248 | 11,848 |
| DCC PLC (United Kingdom) | | 534 | 33,767 |
| Diageo PLC | | 1,212 | 37,429 |
| Diploma PLC | | 517 | 28,386 |
| Flutter Entertainment PLC (a) | | 136 | 31,811 |
| Halma PLC | | 741 | 23,648 |
| Hill & Smith Holdings PLC | | 380 | 9,971 |
| Howden Joinery Group PLC | | 1,847 | 20,053 |
| HSBC Holdings PLC (United Kingdom) | | 6,616 | 60,722 |
| Informa PLC | | 2,656 | 27,693 |
| InterContinental Hotel Group PLC | | 389 | 42,906 |
| InterContinental Hotel Group PLC ADR | | 840 | 93,618 |
| Intertek Group PLC | | 228 | 13,665 |
| J Sainsbury PLC | | 6,893 | 23,660 |
| JD Sports Fashion PLC | | 5,218 | 8,343 |
| Kingfisher PLC | | 5,959 | 22,536 |
| Lloyds Banking Group PLC | | 151,203 | 103,786 |
| London Stock Exchange Group PLC | | 1,170 | 158,577 |
| Mears Group PLC | | 1,720 | 7,552 |
| Melrose Industries PLC | | 1,933 | 11,839 |
| NatWest Group PLC | | 1,966 | 9,315 |
| On The Beach Group PLC (b) | | 1,107 | 2,070 |
| Premier Foods PLC | | 2,658 | 6,457 |
| RELX PLC (London Stock Exchange) | | 4,375 | 200,636 |
| Rentokil Initial PLC | | 859 | 4,309 |
| Rightmove PLC | | 1,854 | 14,076 |
| RS GROUP PLC | | 565 | 5,063 |
| Sabre Insurance Group PLC (b) | | 986 | 1,739 |
| Sage Group PLC | | 6,625 | 82,812 |
| Schroders PLC | | 3,910 | 17,344 |
| Segro PLC | | 1,677 | 16,979 |
| Smiths Group PLC | | 455 | 8,971 |
| Spectris PLC | | 1,272 | 41,267 |
| SSE PLC | | 426 | 9,673 |
| Standard Chartered PLC (United Kingdom) | | 4,478 | 51,929 |
| Synthomer PLC (a) | | 22 | 51 |
| Taylor Wimpey PLC | | 3,269 | 6,181 |
| Tesco PLC | | 6,217 | 27,452 |
| Unilever PLC | | 1,680 | 102,483 |
TOTAL UNITED KINGDOM | | | 2,206,662 |
| United States of America - 10.7% | | | |
| Alcon, Inc. (Switzerland) | | 906 | 83,492 |
| CRH PLC | | 2,943 | 280,850 |
| CSL Ltd. | | 48 | 9,012 |
| CyberArk Software Ltd. (a) | | 55 | 15,209 |
| Experian PLC | | 2,207 | 107,486 |
| Ferguson Enterprises, Inc. | | 337 | 66,572 |
| GE Vernova LLC | | 208 | 62,745 |
| GFL Environmental, Inc. | | 246 | 10,292 |
| GSK PLC | | 1,568 | 28,316 |
| ICON PLC (a) | | 41 | 9,107 |
| Linde PLC | | 508 | 231,724 |
| Marsh & McLennan Companies, Inc. | | 439 | 95,807 |
| MasterCard, Inc. Class A | | 79 | 39,468 |
| Microsoft Corp. | | 23 | 9,346 |
| Moody's Corp. | | 148 | 67,198 |
| Morningstar, Inc. | | 24 | 7,873 |
| S&P Global, Inc. | | 261 | 125,374 |
| Schneider Electric SA | | 631 | 163,460 |
| Shell PLC: | | | |
| ADR | | 498 | 33,640 |
| (London) | | 1,216 | 40,599 |
| Sherwin-Williams Co. | | 203 | 72,830 |
| Swiss Re Ltd. | | 282 | 36,134 |
| Visa, Inc. Class A | | 310 | 89,854 |
TOTAL UNITED STATES OF AMERICA | | | 1,686,388 |
| TOTAL COMMON STOCKS (Cost $13,697,180) | | | 14,746,079 |
| | | | |
| Nonconvertible Preferred Stocks - 0.1% |
| | | Shares | Value ($) |
| Germany - 0.1% | | | |
| Henkel AG & Co. KGaA | | 46 | 3,982 |
| Sartorius AG (non-vtg.) | | 37 | 9,567 |
| | | | |
| TOTAL NONCONVERTIBLE PREFERRED STOCKS (Cost $15,646) | | | 13,549 |
| | | | |
| Money Market Funds - 4.4% |
| | | Shares | Value ($) |
Fidelity Cash Central Fund 4.87% (c) (Cost $690,934) | | 690,796 | 690,934 |
| | | | |
| TOTAL INVESTMENT IN SECURITIES - 98.2% (Cost $14,403,760) | 15,450,562 |
NET OTHER ASSETS (LIABILITIES) - 1.8% | 281,012 |
| NET ASSETS - 100.0% | 15,731,574 |
| | |
| Futures Contracts |
| | Number of contracts | Expiration Date | Notional Amount ($) | Value ($) | Unrealized Appreciation/ (Depreciation) ($) |
| Purchased | | | | | |
| | | | | | |
| Equity Index Contracts | | | | | |
| ICE MSCI EAFE Index Contracts (United States) | 6 | Dec 2024 | 705,060 | 446 | 446 |
| | | | | | |
| The notional amount of futures purchased as a percentage of Net Assets is 4.5% |
Legend
| (b) | Security exempt from registration under Rule 144A of the Securities Act of 1933. These securities may be resold in transactions exempt from registration, normally to qualified institutional buyers. At the end of the period, the value of these securities amounted to $103,497 or 0.7% of net assets. |
| (c) | Affiliated fund that is generally available only to investment companies and other accounts managed by Fidelity Investments. The rate quoted is the annualized seven-day yield of the fund at period end. A complete unaudited listing of the fund's holdings as of its most recent quarter end is available upon request. In addition, each Fidelity Central Fund's financial statements, which are not covered by the Fund's Report of Independent Registered Public Accounting Firm, are available on the SEC's website or upon request. |
Affiliated Central Funds
Fiscal year to date information regarding the Fund's investments in Fidelity Central Funds, including the ownership percentage, is presented below.
| Affiliate | Value, beginning of period ($) | Purchases ($) | Sales Proceeds ($) | Dividend Income ($) | Realized Gain (loss) ($) | Change in Unrealized appreciation (depreciation) ($) | Value, end of period ($) | % ownership, end of period |
| Fidelity Cash Central Fund 4.87% | 246,454 | 6,974,794 | 6,530,308 | 24,165 | (6) | - | 690,934 | 0.0% |
| Total | 246,454 | 6,974,794 | 6,530,308 | 24,165 | (6) | - | 690,934 | |
| | | | | | | | | |
Amounts in the dividend income column in the above table include any capital gain distributions from underlying funds, which are presented in the corresponding line item in the Statement of Operations, if applicable.
Amounts included in the purchases and sales proceeds columns may include in-kind transactions, if applicable.
Investment Valuation
The following is a summary of the inputs used, as of October 31, 2024, involving the Fund's assets and liabilities carried at fair value. The inputs or methodology used for valuing securities may not be an indication of the risk associated with investing in those securities. For more information on valuation inputs, and their aggregation into the levels used below, please refer to the Investment Valuation section in the accompanying Notes to Financial Statements.
| Valuation Inputs at Reporting Date: |
| Description | Total ($) | Level 1 ($) | Level 2 ($) | Level 3 ($) |
Investments in Securities: | | | | |
|
| Equities: | | | | |
Communication Services | 239,017 | 127,805 | 111,212 | - |
Consumer Discretionary | 1,270,894 | 470,002 | 800,892 | - |
Consumer Staples | 651,206 | 296,497 | 354,709 | - |
Energy | 706,209 | 355,743 | 350,466 | - |
Financials | 3,670,401 | 1,909,553 | 1,760,848 | - |
Health Care | 1,119,767 | 310,295 | 809,472 | - |
Industrials | 3,572,366 | 1,520,768 | 2,051,598 | - |
Information Technology | 1,992,886 | 804,666 | 1,188,220 | - |
Materials | 1,361,296 | 1,055,146 | 306,150 | - |
Real Estate | 109,034 | 83,191 | 25,843 | - |
Utilities | 66,552 | 58,515 | 8,037 | - |
|
| Money Market Funds | 690,934 | 690,934 | - | - |
| Total Investments in Securities: | 15,450,562 | 7,683,115 | 7,767,447 | - |
Derivative Instruments: Assets | | | | |
Futures Contracts | 446 | 446 | - | - |
| Total Assets | 446 | 446 | - | - |
| Total Derivative Instruments: | 446 | 446 | - | - |
Value of Derivative Instruments
The following table is a summary of the Fund's value of derivative instruments by primary risk exposure as of October 31, 2024. For additional information on derivative instruments, please refer to the Derivative Instruments section in the accompanying Notes to Financial Statements.
Primary Risk Exposure / Derivative Type | Value |
| Asset ($) | Liability ($) |
| Equity Risk | | |
Futures Contracts (a) | 446 | 0 |
| Total Equity Risk | 446 | 0 |
| Total Value of Derivatives | 446 | 0 |
(a)Reflects gross cumulative appreciation (depreciation) on futures contracts as presented in the Schedule of Investments. In the Statement of Assets and Liabilities, the period end daily variation margin is included in receivable or payable for daily variation margin on futures contracts, and the net cumulative appreciation (depreciation) is included in Total accumulated earnings (loss).
Fidelity® Series Sustainable Non-U.S. Developed Markets Fund
Financial Statements
| Statement of Assets and Liabilities |
As of October 31, 2024 |
| Assets | | | | |
| Investment in securities, at value - See accompanying schedule: | | | | |
Unaffiliated issuers (cost $13,712,826) | $ | 14,759,628 | | |
Fidelity Central Funds (cost $690,934) | | 690,934 | | |
| | | | | |
| | | | | |
| Total Investment in Securities (cost $14,403,760) | | | $ | 15,450,562 |
| Segregated cash with brokers for derivative instruments | | | | 18,796 |
| Cash | | | | 33,688 |
| Foreign currency held at value (cost $1,568) | | | | 1,568 |
| Receivable for investments sold | | | | 83,497 |
| Receivable for fund shares sold | | | | 362,237 |
| Dividends receivable | | | | 36,917 |
| Distributions receivable from Fidelity Central Funds | | | | 1,793 |
| Receivable from investment adviser for expense reductions | | | | 69 |
Total assets | | | | 15,989,127 |
| Liabilities | | | | |
| Payable for investments purchased | $ | 244,993 | | |
| Payable for daily variation margin on futures contracts | | 5,218 | | |
| Other payables and accrued expenses | | 7,342 | | |
| Total liabilities | | | | 257,553 |
| Net Assets | | | $ | 15,731,574 |
| Net Assets consist of: | | | | |
| Paid in capital | | | $ | 14,481,703 |
| Total accumulated earnings (loss) | | | | 1,249,871 |
| Net Assets | | | $ | 15,731,574 |
Net Asset Value, offering price and redemption price per share ($15,731,574 ÷ 1,359,596 shares) | | | $ | 11.57 |
| Statement of Operations |
| Year ended October 31, 2024 |
| Investment Income | | | | |
| Dividends | | | $ | 273,539 |
| Interest | | | | 588 |
| Income from Fidelity Central Funds | | | | 24,165 |
| Income before foreign taxes withheld | | | $ | 298,292 |
| Less foreign taxes withheld | | | | (33,422) |
| Total income | | | | 264,870 |
| Expenses | | | | |
| Custodian fees and expenses | $ | 19,546 | | |
| Independent trustees' fees and expenses | | 45 | | |
| Miscellaneous | | 6 | | |
| Total expenses before reductions | | 19,597 | | |
| Expense reductions | | (18,739) | | |
| Total expenses after reductions | | | | 858 |
| Net Investment income (loss) | | | | 264,012 |
| Realized and Unrealized Gain (Loss) | | | | |
| Net realized gain (loss) on: | | | | |
| Investment Securities: | | | | |
| Unaffiliated issuers | | (12,906) | | |
| Fidelity Central Funds | | (6) | | |
| Foreign currency transactions | | 4,369 | | |
| Futures contracts | | 19,160 | | |
| Total net realized gain (loss) | | | | 10,617 |
| Change in net unrealized appreciation (depreciation) on: | | | | |
| Investment Securities: | | | | |
| Unaffiliated issuers | | 1,573,724 | | |
| Assets and liabilities in foreign currencies | | (1,051) | | |
| Futures contracts | | 781 | | |
| Total change in net unrealized appreciation (depreciation) | | | | 1,573,454 |
| Net gain (loss) | | | | 1,584,071 |
| Net increase (decrease) in net assets resulting from operations | | | $ | 1,848,083 |
| Statement of Changes in Net Assets |
| |
| | Year ended October 31, 2024 | | For the period May 11, 2023 (commencement of operations) through October 31, 2023 |
| Increase (Decrease) in Net Assets | | | | |
| Operations | | | | |
| Net investment income (loss) | $ | 264,012 | $ | 73,251 |
| Net realized gain (loss) | | 10,617 | | (43,017) |
| Change in net unrealized appreciation (depreciation) | | 1,573,454 | | (527,429) |
| Net increase (decrease) in net assets resulting from operations | | 1,848,083 | | (497,195) |
| Distributions to shareholders | | (94,899) | | - |
| | | | | |
| Share transactions | | | | |
| Proceeds from sales of shares | | 8,041,254 | | 7,829,024 |
| Reinvestment of distributions | | 94,899 | | - |
| Cost of shares redeemed | | (1,002,165) | | (487,427) |
| | | | | |
Net increase (decrease) in net assets resulting from share transactions | | 7,133,988 | | 7,341,597 |
| Total increase (decrease) in net assets | | 8,887,172 | | 6,844,402 |
| | | | | |
| Net Assets | | | | |
| Beginning of period | | 6,844,402 | | - |
| End of period | $ | 15,731,574 | $ | 6,844,402 |
| | | | | |
| Other Information | | | | |
| Shares | | | | |
| Sold | | 707,142 | | 782,048 |
| Issued in reinvestment of distributions | | 9,304 | | - |
| Redeemed | | (89,743) | | (49,155) |
| Net increase (decrease) | | 626,703 | | 732,893 |
| | | | | |
Financial Highlights
Fidelity® Series Sustainable Non-U.S. Developed Markets Fund |
| |
| Years ended October 31, | | 2024 | | 2023 A |
Selected Per-Share Data | | | | |
| Net asset value, beginning of period | $ | 9.34 | $ | 10.00 |
| Income from Investment Operations | | | | |
Net investment income (loss) B,C | | .26 | | .11 |
| Net realized and unrealized gain (loss) | | 2.10 | | (.77) |
| Total from investment operations | | 2.36 | | (.66) |
| Distributions from net investment income | | (.13) | | - |
| Total distributions | | (.13) | | - |
| Net asset value, end of period | $ | 11.57 | $ | 9.34 |
Total Return D,E | | | | (6.60)% |
Ratios to Average Net Assets C,F,G | | | | |
| Expenses before reductions | | .17% | | .29% H |
| Expenses net of fee waivers, if any | | | | .01% H |
| Expenses net of all reductions | | .01% | | .01% H |
| Net investment income (loss) | | 2.32% | | 2.35% H |
| Supplemental Data | | | | |
| Net assets, end of period (000 omitted) | $ | 15,732 | $ | 6,844 |
Portfolio turnover rate I | | | | 8% J |
AFor the period May 11, 2023 (commencement of operations) through October 31, 2023.
BCalculated based on average shares outstanding during the period.
CNet investment income (loss) is affected by the timing of the declaration of dividends by any underlying mutual funds or exchange-traded funds (ETFs). Net investment income (loss) of any mutual funds or ETFs is not included in the Fund's net investment income (loss) ratio.
DTotal returns for periods of less than one year are not annualized.
ETotal returns would have been lower if certain expenses had not been reduced during the applicable periods shown.
FFees and expenses of any underlying mutual funds or exchange-traded funds (ETFs) are not included in the Fund's expense ratio. The Fund indirectly bears its proportionate share of these expenses. For additional expense information related to investments in Fidelity Central Funds, please refer to the "Investments in Fidelity Central Funds" note found in the Notes to Financial Statements section of the most recent Annual or Semi-Annual report.
GExpense ratios reflect operating expenses of the class. Expenses before reductions do not reflect amounts reimbursed, waived, or reduced through arrangements with the investment adviser, brokerage services, or other offset arrangements, if applicable, and do not represent the amount paid by the class during periods when reimbursements, waivers or reductions occur.
HAnnualized.
IAmount does not include the portfolio activity of any underlying mutual funds or exchange-traded funds (ETFs).
JAmount not annualized.
Notes to Financial Statements
For the period ended October 31, 2024
1. Organization.
Fidelity Series Sustainable Emerging Markets Fund and Fidelity Series Sustainable Non-U.S. Developed Markets Fund (the Funds) are funds of Fidelity Investment Trust (the Trust). The Trust is registered under the Investment Company Act of 1940, as amended (the 1940 Act), as an open-end management investment company organized as a Massachusetts business trust. Each Fund is authorized to issue an unlimited number of shares. Shares are offered only to certain other Fidelity funds, Fidelity managed 529 plans, and Fidelity managed collective investment trusts. Investments in emerging markets, if applicable, can be subject to social, economic, regulatory, and political uncertainties and can be extremely volatile.
2. Investments in Fidelity Central Funds.
Funds may invest in Fidelity Central Funds, which are open-end investment companies generally available only to other investment companies and accounts managed by the investment adviser and its affiliates. The Schedule of Investments lists any Fidelity Central Funds held as an investment as of period end, but does not include the underlying holdings of each Fidelity Central Fund. An investing fund indirectly bears its proportionate share of the expenses of the underlying Fidelity Central Funds.
Based on its investment objective, each Fidelity Central Fund may invest or participate in various investment vehicles or strategies that are similar to those of the investing fund. These strategies are consistent with the investment objectives of the investing fund and may involve certain economic risks which may cause a decline in value of each of the Fidelity Central Funds and thus a decline in the value of the investing fund.
| Fidelity Central Fund | Investment Manager | Investment Objective | Investment Practices | Expense RatioA |
| Fidelity Money Market Central Funds | Fidelity Management & Research Company LLC (FMR) | Each fund seeks to obtain a high level of current income consistent with the preservation of capital and liquidity. | Short-term Investments | Less than .005% |
A Expenses expressed as a percentage of average net assets and are as of each underlying Central Fund's most recent annual or semi-annual shareholder report.
A complete unaudited list of holdings for each Fidelity Central Fund is available upon request or at the Securities and Exchange Commission website at www.sec.gov. In addition, the financial statements of the Fidelity Central Funds which contain the significant accounting policies (including investment valuation policies) of those funds, and are not covered by the Report of Independent Registered Public Accounting Firm, are available on the Securities and Exchange Commission website or upon request.
3. Significant Accounting Policies.
Each Fund is an investment company and applies the accounting and reporting guidance of the Financial Accounting Standards Board (FASB) Accounting Standards Codification Topic 946 Financial Services - Investment Companies. The financial statements have been prepared in conformity with accounting principles generally accepted in the United States of America (GAAP), which require management to make certain estimates and assumptions at the date of the financial statements. Actual results could differ from those estimates. Subsequent events, if any, through the date that the financial statements were issued have been evaluated in the preparation of the financial statements. Each Fund's Schedule of Investments lists any underlying mutual funds or exchange-traded funds (ETFs) but does not include the underlying holdings of these funds. The following summarizes the significant accounting policies of each Fund:
Investment Valuation. Investments are valued as of 4:00 p.m. Eastern time on the last calendar day of the period. The Board of Trustees (the Board) has designated each Fund's investment adviser as the valuation designee responsible for the fair valuation function and performing fair value determinations as needed. The investment adviser has established a Fair Value Committee (the Committee) to carry out the day-to-day fair valuation responsibilities and has adopted policies and procedures to govern the fair valuation process and the activities of the Committee. In accordance with these fair valuation policies and procedures, which have been approved by the Board, each Fund attempts to obtain prices from one or more third party pricing services or brokers to value its investments. When current market prices, quotations or currency exchange rates are not readily available or reliable, investments will be fair valued in good faith by the Committee, in accordance with the policies and procedures. Factors used in determining fair value vary by investment type and may include market or investment specific events, transaction data, estimated cash flows, and market observations of comparable investments. The frequency that the fair valuation procedures are used cannot be predicted and they may be utilized to a significant extent. The Committee manages each Fund's fair valuation practices and maintains the fair valuation policies and procedures. Each Fund's investment adviser reports to the Board information regarding the fair valuation process and related material matters.
Each Fund categorizes the inputs to valuation techniques used to value its investments into a disclosure hierarchy consisting of three levels as shown below:
Level 1 - unadjusted quoted prices in active markets for identical investments
Level 2 - other significant observable inputs (including quoted prices for similar investments, interest rates, prepayment speeds, etc.)
Level 3 - unobservable inputs (including the Fund's own assumptions based on the best information available)
Valuation techniques used to value each Fund's investments by major category are as follows:
Equity securities, including restricted securities, for which market quotations are readily available, are valued at the last reported sale price or official closing price as reported by a third party pricing service on the primary market or exchange on which they are traded and are categorized as Level 1 in the hierarchy. In the event there were no sales during the day or closing prices are not available, securities are valued at the last quoted bid price or may be valued using the last available price and are generally categorized as Level 2 in the hierarchy. For foreign equity securities, when market or security specific events arise, comparisons to the valuation of American Depositary Receipts (ADRs), futures contracts, Exchange-Traded Funds (ETFs) and certain indexes as well as quoted prices for similar securities may be used and would be categorized as Level 2 in the hierarchy. For equity securities, including restricted securities, where observable inputs are limited, assumptions about market activity and risk are used and these securities may be categorized as Level 3 in the hierarchy.
Futures contracts are valued at the settlement price established each day by the board of trade or exchange on which they are traded and are categorized as Level 1 in the hierarchy. Investments in open-end mutual funds, including the Fidelity Central Funds, are valued at their closing net asset value (NAV) each business day and are categorized as Level 1 in the hierarchy.
Changes in valuation techniques may result in transfers in or out of an assigned level within the disclosure hierarchy. The aggregate value of investments by input level as of October 31, 2024 is included at the end of each Fund's Schedule of Investments.
Foreign Currency. Certain Funds may use foreign currency contracts to facilitate transactions in foreign-denominated securities. Gains and losses from these transactions may arise from changes in the value of the foreign currency or if the counterparties do not perform under the contracts' terms.
Foreign-denominated assets, including investment securities, and liabilities are translated into U.S. dollars at the exchange rates at period end. Purchases and sales of investment securities, income and dividends received, and expenses denominated in foreign currencies are translated into U.S. dollars at the exchange rate in effect on the transaction date.
The effects of exchange rate fluctuations on investments are included with the net realized and unrealized gain (loss) on investment securities. Other foreign currency transactions resulting in realized and unrealized gain (loss) are disclosed separately.
Investment Transactions and Income. For financial reporting purposes, the Funds' investment holdings and NAV include trades executed through the end of the last business day of the period. The NAV per share for processing shareholder transactions is calculated as of the close of business of the New York Stock Exchange (NYSE), normally 4:00 p.m. Eastern time and includes trades executed through the end of the prior business day. Gains and losses on securities sold are determined on the basis of identified cost. Commissions paid to certain brokers with whom the investment adviser, or its affiliates, places trades on behalf of a fund include an amount in addition to trade execution, which may be rebated back to a fund. Any such rebates are included in net realized gain (loss) on investments in the Statement of Operations. Dividend income is recorded on the ex-dividend date, except for certain dividends from foreign securities where the ex-dividend date may have passed, which are recorded as soon as the Funds are informed of the ex-dividend date. Non-cash dividends included in dividend income, if any, are recorded at the fair market value of the securities received. Income and capital gain distributions from Fidelity Central Funds, if any, are recorded on the ex-dividend date. Certain distributions received by the Funds represent a return of capital or capital gain. The Funds determine the components of these distributions subsequent to the ex-dividend date, based upon receipt of tax filings or other correspondence relating to the underlying investment. These distributions are recorded as a reduction of cost of investments and/or as a realized gain. Interest income is accrued as earned and includes coupon interest and amortization of premium and accretion of discount on debt securities as applicable. Investment income is recorded net of foreign taxes withheld where recovery of such taxes is uncertain. Funds may file withholding tax reclaims in certain jurisdictions to recover a portion of amounts previously withheld. Any withholding tax reclaims income is included in the Statement of Operations in foreign taxes withheld. Any receivables for withholding tax reclaims are included in the Statement of Assets and Liabilities in dividends receivable.
Expenses. Expenses directly attributable to a fund are charged to that fund. Expenses attributable to more than one fund are allocated among the respective funds on the basis of relative net assets or other appropriate methods. Expenses included in the accompanying financial statements reflect the expenses of that fund and do not include any expenses associated with any underlying mutual funds or exchange-traded funds. Although not included in a fund's expenses, a fund indirectly bears its proportionate share of these expenses through the net asset value of each underlying mutual fund or exchange-traded fund. Expense estimates are accrued in the period to which they relate and adjustments are made when actual amounts are known.
Income Tax Information and Distributions to Shareholders. Each year, each Fund intends to qualify as a regulated investment company under Subchapter M of the Internal Revenue Code, including distributing substantially all of its taxable income and realized gains. As a result, no provision for U.S. Federal income taxes is required. As of October 31, 2024, each Fund did not have any unrecognized tax benefits in the financial statements; nor is each Fund aware of any tax positions for which it is reasonably possible that the total amounts of unrecognized tax benefits will significantly change in the next twelve months. Each Fund files a U.S. federal tax return, in addition to state and local tax returns as required. Each Fund's federal income tax returns are subject to examination by the Internal Revenue Service (IRS) for a period of three fiscal years after they are filed. State and local tax returns may be subject to examination for an additional fiscal year depending on the jurisdiction. Foreign taxes are provided for based on each Fund's understanding of the tax rules and rates that exist in the foreign markets in which it invests.
Distributions are declared and recorded on the ex-dividend date. Income and capital gain distributions are determined in accordance with income tax regulations, which may differ from GAAP. In addition, certain Funds claimed a portion of the payment made to redeeming shareholders as a distribution for income tax purposes.
Capital accounts within the financial statements are adjusted for permanent book-tax differences. These adjustments have no impact on net assets or the results of operations. Capital accounts are not adjusted for temporary book-tax differences which will reverse in a subsequent period.
Book-tax differences are primarily due to foreign currency transactions, passive foreign investment companies (PFIC), capital loss carryforwards, future transactions and losses deferred due to wash sales.
As of period end, the cost and unrealized appreciation (depreciation) in securities, and derivatives if applicable, for federal income tax purposes were as follows for each Fund:
| | Tax cost ($) | Gross unrealized appreciation ($) | Gross unrealized depreciation ($) | Net unrealized appreciation (depreciation)($) |
Fidelity Series Sustainable Emerging Markets Fund | 8,682,957 | 1,382,656 | (429,259) | 953,397 |
Fidelity Series Sustainable Non-U.S. Developed Markets Fund | 14,459,632 | 1,720,357 | (729,427) | 990,930 |
The tax-based components of distributable earnings as of period end were as follows for each Fund:
| | Undistributed ordinary income ($) | Capital loss carryforward ($) | Net unrealized appreciation (depreciation) on securities and other investments ($) |
Fidelity Series Sustainable Emerging Markets Fund | 172,310 | (136,521) | 953,129 |
Fidelity Series Sustainable Non-U.S. Developed Markets Fund | 291,971 | (31,807) | 989,707 |
Capital loss carryforwards are only available to offset future capital gains of the Funds to the extent provided by regulations and may be limited. The capital loss carryforward information presented below, including any applicable limitation, is estimated as of fiscal period end and is subject to adjustment.
| | Short-term ($) | Long-term ($) | Total capital loss carryforward ($) |
Fidelity Series Sustainable Emerging Markets Fund | (135,186) | (1,335) | (136,521) |
Fidelity Series Sustainable Non-U.S. Developed Markets Fund | (31,807) | - | (31,807) |
The tax character of distributions paid was as follows:
| October 31, 2024 | | |
| | Ordinary Income ($) | Total ($) |
Fidelity Series Sustainable Emerging Markets Fund | 97,501 | 97,501 |
Fidelity Series Sustainable Non-U.S. Developed Markets Fund | 94,899 | 94,899 |
October 31, 2023A | | |
| | Ordinary Income ($) | Total ($) |
Fidelity Series Sustainable Emerging Markets Fund | - | - |
Fidelity Series Sustainable Non-U.S. Developed Markets Fund | - | - |
A For the period May 11,2023 (commencement of operations) through October 31,2023.
Restricted Securities (including Private Placements). Funds may invest in securities that are subject to legal or contractual restrictions on resale. These securities generally may be resold in transactions exempt from registration or to the public if the securities are registered. Disposal of these securities may involve time-consuming negotiations and expense, and prompt sale at an acceptable price may be difficult. Information regarding restricted securities held at period end is included at the end of the Schedule of Investments, if applicable.
New Accounting Pronouncement. In November 2023, the FASB issued Accounting Standards Update (ASU) 2023-07 Segment Reporting (Topic 280): Improvements to Reportable Segment Disclosures. Effective for fiscal years beginning after December 15, 2023 and interim periods within fiscal years beginning after December 15, 2024, the amendments enhance required disclosures of segment information for public entities on an annual and interim basis. The ASU allows for early adoption with updates applied retrospectively. Management is currently evaluating the impact of the ASU but does not expect this guidance to materially impact the financial statements.
4. Derivative Instruments.
Risk Exposures and the Use of Derivative Instruments. Each Fund's investment objectives allow for various types of derivative instruments, including futures contracts. Derivatives are investments whose value is primarily derived from underlying assets, indices or reference rates and may be transacted on an exchange or over-the-counter (OTC). Derivatives may involve a future commitment to buy or sell a specified asset based on specified terms, to exchange future cash flows at periodic intervals based on a notional principal amount, or for one party to make one or more payments upon the occurrence of specified events in exchange for periodic payments from the other party.
Derivatives were used to increase returns and to manage exposure to certain risks as defined below. The success of any strategy involving derivatives depends on analysis of numerous economic factors, and if the strategies for investment do not work as intended, the objectives may not be achieved.
Derivatives were used to increase or decrease exposure to the following risk(s):
| | |
| Equity Risk | Equity risk relates to the fluctuations in the value of financial instruments as a result of changes in market prices (other than those arising from interest rate risk or foreign exchange risk), whether caused by factors specific to an individual investment, its issuer, or all factors affecting all instruments traded in a market or market segment. |
Funds are also exposed to additional risks from investing in derivatives, such as liquidity risk and counterparty credit risk. Liquidity risk is the risk that a fund will be unable to close out the derivative in the open market in a timely manner. Counterparty credit risk is the risk that the counterparty will not be able to fulfill its obligation to a fund. Counterparty credit risk related to exchange-traded contracts may be mitigated by the protection provided by the exchange on which they trade.
Investing in derivatives may involve greater risks than investing in the underlying assets directly and, to varying degrees, may involve risk of loss in excess of any initial investment and collateral received and amounts recognized in the Statement of Assets and Liabilities. In addition, there may be the risk that the change in value of the derivative contract does not correspond to the change in value of the underlying instrument.
Futures Contracts. A futures contract is an agreement between two parties to buy or sell a specified underlying instrument for a fixed price at a specified future date. Futures contracts were used to manage exposure to the stock market.
Upon entering into a futures contract, a fund is required to deposit either cash or securities (initial margin) with a clearing broker in an amount equal to a certain percentage of the face value of the contract. Futures contracts are marked-to-market daily and subsequent daily payments are made or received by a fund depending on the daily fluctuations in the value of the futures contracts and are recorded as unrealized appreciation or (depreciation). This receivable and/or payable, if any, is included in daily variation margin on futures contracts in the Statement of Assets and Liabilities. Realized gain or (loss) is recorded upon the expiration or closing of a futures contract. The net realized gain (loss) and change in net unrealized appreciation (depreciation) on futures contracts during the period is presented in the Statement of Operations.
Any open futures contracts at period end are presented in the Schedule of Investments under the caption "Futures Contracts". The notional amount at value reflects each contract's exposure to the underlying instrument or index at period end, and is representative of volume of activity during the period unless an average notional amount is presented. Any securities deposited to meet initial margin requirements are identified in the Schedule of Investments. Any cash deposited to meet initial margin requirements is presented as segregated cash with brokers for derivative instruments in the Statement of Assets and Liabilities.
5. Purchases and Sales of Investments.
Purchases and sales of securities, other than short-term securities and in-kind transactions, as applicable, are noted in the table below.
| | Purchases ($) | Sales ($) |
| Fidelity Series Sustainable Emerging Markets Fund | 6,929,882 | 3,151,533 |
| Fidelity Series Sustainable Non-U.S. Developed Markets Fund | 10,174,561 | 3,533,796 |
6. Fees and Other Transactions with Affiliates.
Management Fee. Fidelity Management & Research Company LLC (the investment adviser) and its affiliates provide the Funds with investment management related services for which the Funds do not pay a management fee. Under the management contract, the investment adviser or an affiliate pays all ordinary operating expenses of the Funds, except custody fees, fees and expenses of the independent Trustees, and certain miscellaneous expenses such as proxy and shareholder meeting expenses.
Brokerage Commissions. A portion of portfolio transactions were placed with brokerage firms which are affiliates of the investment adviser. Brokerage commissions are included in net realized gain (loss) and change in net unrealized appreciation (depreciation) in the Statement of Operations. The commissions paid to these affiliated firms were as follows:
| | Amount ($) |
| Fidelity Series Sustainable Emerging Markets Fund | 90 |
| Fidelity Series Sustainable Non-U.S. Developed Markets Fund | 3 |
Interfund Trades. Funds may purchase from or sell securities to other Fidelity Funds under procedures adopted by the Board. The procedures have been designed to ensure these interfund trades are executed in accordance with Rule 17a-7 of the 1940 Act. Any interfund trades are included within the respective purchases and sales amounts shown in the Purchases and Sales of Investments note. Interfund trades during the period are noted in the table below.
| | Purchases ($) | Sales ($) | Realized Gain (Loss)($) |
| Fidelity Series Sustainable Emerging Markets Fund | 82,555 | 52,034 | (4,618) |
| Fidelity Series Sustainable Non-U.S. Developed Markets Fund | 238,425 | 84,409 | (3,640) |
Sub-Advisory Arrangements. Effective March 1, 2024, each Fund's sub-advisory agreements with FMR Investment Management (UK) Limited, Fidelity Management & Research (Hong Kong) Limited, and Fidelity Management & Research (Japan) Limited were amended to provide that the investment adviser pays each sub-adviser monthly fees equal to 110% of the sub-adviser's costs for providing sub-advisory services.
7. Committed Line of Credit.
Certain Funds participate with other funds managed by the investment adviser or an affiliate in a $4.25 billion credit facility (the "line of credit") to be utilized for temporary or emergency purposes to fund shareholder redemptions or for other short-term liquidity purposes. The participating funds have agreed to pay commitment fees on their pro-rata portion of the line of credit, which are reflected in Miscellaneous expenses on the Statement of Operations, and are listed below. During the period, there were no borrowings on this line of credit.
8. Expense Reductions.
The investment adviser contractually agreed to reimburse each Fund to the extent annual operating expenses exceeded certain levels of average net assets as noted in the table below. This reimbursement will remain in place through February 28, 2028. Some expenses, for example the compensation of the independent Trustees, and certain other expenses such as interest expense, are excluded from this reimbursement.
The following Funds were in reimbursement during the period:
| | Expense Limitations | Reimbursement ($) |
| Fidelity Series Sustainable Emerging Markets Fund | .013% | 21,422 |
| Fidelity Series Sustainable Non-U.S. Developed Markets Fund | .013% | 18,075 |
Through arrangements with each applicable Fund's custodian, credits realized as a result of certain uninvested cash balances were used to reduce each applicable Fund's expenses. All of the applicable expense reductions are noted in the table below.
| | Custodian credits ($) |
Fidelity Series Sustainable Emerging Markets Fund | 720 |
Fidelity Series Sustainable Non-U.S. Developed Markets Fund | 664 |
9. Other.
A fund's organizational documents provide former and current trustees and officers with a limited indemnification against liabilities arising in connection with the performance of their duties to the fund. In the normal course of business, a fund may also enter into contracts that provide general indemnifications. A fund's maximum exposure under these arrangements is unknown as this would be dependent on future claims that may be made against a fund. The risk of material loss from such claims is considered remote.
At the end of the period, mutual funds and accounts managed by the investment adviser or its affiliates were the owners of record of all of the outstanding shares of the Funds.
10. Risk and Uncertainties.
Many factors affect a fund's performance. Developments that disrupt global economies and financial markets, such as pandemics, epidemics, outbreaks of infectious diseases, war, terrorism, and environmental disasters, may significantly affect a fund's investment performance. The effects of these developments to a fund will be impacted by the types of securities in which a fund invests, the financial condition, industry, economic sector, and geographic location of an issuer, and a fund's level of investment in the securities of that issuer. Significant concentrations in security types, issuers, industries, sectors, and geographic locations may magnify the factors that affect a fund's performance.
Report of Independent Registered Public Accounting Firm
To the Board of Trustees of Fidelity Investment Trust and the Shareholders of Fidelity Series Sustainable Emerging Markets Fund and Fidelity Series Sustainable Non-U.S. Developed Markets Fund:
Opinion on the Financial Statements and Financial Highlights
We have audited the accompanying statements of assets and liabilities of Fidelity Series Sustainable Emerging Markets Fund and Fidelity Series Sustainable Non-U.S. Developed Markets Fund (the "Funds"), each a fund of Fidelity Investment Trust, including the schedules of investments, as of October 31, 2024, the related statements of operations for the year then ended, and the statements of changes in net assets and the financial highlights for the year then ended and for the period from May 11, 2023 (commencement of operations) through October 31, 2023, and the related notes. In our opinion, the financial statements and financial highlights present fairly, in all material respects, the financial position of each of the Funds as of October 31, 2024, and the results of their operations for the year then ended, and the changes in their net assets and the financial highlights for the year then ended and for the period from May 11, 2023 (commencement of operations) through October 31, 2023, in conformity with accounting principles generally accepted in the United States of America.
Basis for Opinion
These financial statements and financial highlights are the responsibility of the Funds' management. Our responsibility is to express an opinion on the Funds' financial statements and financial highlights based on our audits. We are a public accounting firm registered with the Public Company Accounting Oversight Board (United States) (PCAOB) and are required to be independent with respect to the Funds in accordance with the U.S. federal securities laws and the applicable rules and regulations of the Securities and Exchange Commission and the PCAOB.
We conducted our audits in accordance with the standards of the PCAOB. Those standards require that we plan and perform the audit to obtain reasonable assurance about whether the financial statements and financial highlights are free of material misstatement, whether due to error or fraud. The Funds are not required to have, nor were we engaged to perform, an audit of their internal control over financial reporting. As part of our audits, we are required to obtain an understanding of internal control over financial reporting but not for the purpose of expressing an opinion on the effectiveness of the Funds' internal control over financial reporting. Accordingly, we express no such opinion.
Our audits included performing procedures to assess the risks of material misstatement of the financial statements and financial highlights, whether due to error or fraud, and performing procedures that respond to those risks. Such procedures included examining, on a test basis, evidence regarding the amounts and disclosures in the financial statements and financial highlights. Our audits also included evaluating the accounting principles used and significant estimates made by management, as well as evaluating the overall presentation of the financial statements and financial highlights. Our procedures included confirmation of securities owned as of October 31, 2024, by correspondence with the custodian and brokers; when replies were not received from brokers, we performed other auditing procedures. We believe that our audits provide a reasonable basis for our opinion.
/s/ Deloitte & Touche LLP
Boston, Massachusetts
December 17, 2024
We have served as the auditor of one or more of the Fidelity investment companies since 1999.
Distributions
(Unaudited)The dividend and capital gains distributions for the fund(s) are available on Fidelity.com or Institutional.Fidelity.com.
A percentage of the dividends distributed during the fiscal year for the following funds were derived from interest on U.S. Government securities which is generally exempt from state income tax:
| Fidelity Series Sustainable Emerging Markets Fund | 1.49% |
| Fidelity Series Sustainable Non-U.S. Developed Markets Fund | 1.73% |
A percentage of the dividends distributed during the fiscal year for the following funds qualify for the dividends-received deduction for corporate shareholders:
| Fidelity Series Sustainable Non-U.S. Developed Markets Fund | |
| December 2023 | 2% |
A percentage of the dividends distributed during the fiscal year for the following funds may be taken into account as a dividend for purposes of the maximum rate under section 1(h)(11) of the Internal Revenue Code.
| Fidelity Series Sustainable Emerging Markets Fund | |
| December 2023 | 67.84% |
| Fidelity Series Sustainable Non-U.S. Developed Markets Fund | |
| December 2023 | 77.04% |
A percentage of the dividends distributed during the fiscal year for the following funds qualify as a section 199A dividend:
| Fidelity Series Sustainable Emerging Markets Fund | |
| December 2023 | 0.02% |
The funds hereby designate the amounts noted below as distributions paid during the fiscal year ended 2024 as qualifying to be taxed as section 163(j) interest dividends:
| Fidelity Series Sustainable Emerging Markets Fund | $1,520 |
| Fidelity Series Sustainable Non-U.S. Developed Markets Fund | $2,201 |
The amounts per share which represent income derived from sources within, and taxes paid to, foreign countries or possessions of the United States are as follows:
| | Pay Date | Income | Taxes |
| Fidelity Series Sustainable Emerging Markets Fund | 12/11/2023 | $0.2126 | $0.0134 |
| Fidelity Series Sustainable Non-U.S. Developed Markets Fund | 12/11/2023 | $0.1166 | $0.0080 |
The funds will notify shareholders in January 2025 of amounts for use in preparing 2024 income tax returns.
Item 8: Changes in and Disagreements with Accountants for Open-End Management Investment Companies
(Unaudited)
Note: This is not applicable for any fund included in this document.
Item 9: Proxy Disclosures for Open-End Management Investment Companies
(Unaudited)
| A special meeting of shareholders was held on July 16, 2024. The results of votes taken among shareholders on the proposal before them are reported below. Each vote reported represents one dollar of net asset value held on the record date for the meeting. |
| Proposal 1 |
| To elect a Board of Trustees. |
| | # of Votes | % of Votes |
| Bettina Doulton |
| Affirmative | 128,529,177,643.56 | 98.18 |
| Withheld | 2,378,037,364.30 | 1.82 |
| TOTAL | 130,907,215,007.85 | 100.00 |
| Robert A. Lawrence |
| Affirmative | 128,253,389,899.05 | 97.97 |
| Withheld | 2,653,825,108.81 | 2.03 |
| TOTAL | 130,907,215,007.85 | 100.00 |
| Vijay C. Advani |
| Affirmative | 128,531,418,228.19 | 98.19 |
| Withheld | 2,375,796,779.66 | 1.81 |
| TOTAL | 130,907,215,007.85 | 100.00 |
| Thomas P. Bostick |
| Affirmative | 128,495,261,591.41 | 98.16 |
| Withheld | 2,411,953,416.44 | 1.84 |
| TOTAL | 130,907,215,007.85 | 100.00 |
| Donald F. Donahue |
| Affirmative | 128,407,878,996.00 | 98.09 |
| Withheld | 2,499,336,011.85 | 1.91 |
| TOTAL | 130,907,215,007.85 | 100.00 |
| Vicki L. Fuller |
| Affirmative | 128,625,540,095.19 | 98.26 |
| Withheld | 2,281,674,912.66 | 1.74 |
| TOTAL | 130,907,215,007.85 | 100.00 |
| Patricia L. Kampling |
| Affirmative | 128,668,729,281.34 | 98.29 |
| Withheld | 2,238,485,726.51 | 1.71 |
| TOTAL | 130,907,215,007.85 | 100.00 |
| Thomas A. Kennedy |
| Affirmative | 128,499,824,239.79 | 98.16 |
| Withheld | 2,407,390,768.06 | 1.84 |
| TOTAL | 130,907,215,007.85 | 100.00 |
| Oscar Munoz |
| Affirmative | 128,386,109,391.05 | 98.07 |
| Withheld | 2,521,105,616.80 | 1.93 |
| TOTAL | 130,907,215,007.85 | 100.00 |
| Karen B. Peetz |
| Affirmative | 128,603,731,113.82 | 98.24 |
| Withheld | 2,303,483,894.03 | 1.76 |
| TOTAL | 130,907,215,007.85 | 100.00 |
| David M. Thomas |
| Affirmative | 128,384,899,342.98 | 98.07 |
| Withheld | 2,522,315,664.88 | 1.93 |
| TOTAL | 130,907,215,007.85 | 100.00 |
| Susan Tomasky |
| Affirmative | 128,556,148,461.60 | 98.20 |
| Withheld | 2,351,066,546.25 | 1.80 |
| TOTAL | 130,907,215,007.85 | 100.00 |
| Michael E. Wiley |
| Affirmative | 128,264,934,978.34 | 97.98 |
| Withheld | 2,642,280,029.51 | 2.02 |
| TOTAL | 130,907,215,007.85 | 100.00 |
| | | |
| Proposal 1 reflects trust-wide proposal and voting results. |
Item 10: Remuneration Paid to Directors, Officers, and others of Open-End Management Investment Companies
(Unaudited)
Note: This information is disclosed as part of the financial statements for each Fund as part of Item 7: Financial Statements and Financial Highlights for Open-End Management Investment companies.
Item 11: Statement Regarding Basis for Approval of Investment Advisory Contract
(Unaudited)
Board Approval of Investment Advisory Contracts and Management Fees
Fidelity Series Sustainable Emerging Markets Fund
Fidelity Series Sustainable Non-U.S. Developed Markets Fund
Each year, the Board of Trustees, including the Independent Trustees (together, the Board), considers the renewal of the fund's management contract with Fidelity Management & Research Company LLC (FMR) and the sub-advisory agreements (together, the Advisory Contracts) for the fund. FMR and the sub-advisers are referred to herein as the Investment Advisers. The Board, assisted by the advice of fund counsel and Independent Trustees' counsel, requests and considers a broad range of information relevant to the renewal of the Advisory Contracts throughout the year.
The Board meets regularly and, at each of its meetings, covers an extensive agenda of topics and materials and considers factors that are relevant to its annual consideration of the renewal of the fund's Advisory Contracts, including the services and support provided to the fund and its shareholders. The Board, acting directly and through its Committees (each of which is composed of and chaired by Independent Trustees), requests and receives information concerning the annual consideration of the renewal of the fund's Advisory Contracts. The Board also meets as needed to review matters specifically related to the Board's annual consideration of the renewal of the Advisory Contracts. Members of the Board may also meet with trustees of other Fidelity funds through joint ad hoc committees to discuss certain matters relevant to all of the Fidelity funds.
At its May 2024 meeting, the Board unanimously determined to renew the fund's Advisory Contracts. The Board considered all factors it believed relevant and reached a determination, with the assistance of fund counsel and Independent Trustees' counsel and through the exercise of its business judgment, that the renewal of the Advisory Contracts was in the best interests of the fund and its shareholders and the fact that no fee is payable under the management contract was fair and reasonable in light of all of the surrounding circumstances.
Nature, Extent, and Quality of Services Provided. The Board considered staffing as it relates to the fund, including the backgrounds and experience of investment personnel of the Investment Advisers, and also considered the Investment Advisers' implementation of the fund's investment program. The Independent Trustees also had discussions with senior management of Fidelity's investment operations and investment groups. The Board considered the structure of the investment personnel compensation program and whether this structure provides appropriate incentives to act in the best interests of the fund.
Resources Dedicated to Investment Management and Support Services. The Board and the Fund Oversight and Research Committees reviewed the general qualifications and capabilities of Fidelity's investment staff, including its size, education, experience, and resources, as well as Fidelity's approach to recruiting, training, managing, and compensating investment personnel. The Board noted the resources devoted to expansion of Fidelity's global investment organization, and that Fidelity's analysts have extensive resources, tools, and capabilities that allow them to conduct sophisticated quantitative and fundamental analysis, as well as credit analysis of issuers, counterparties, and guarantors. Further, the Board considered that Fidelity's investment professionals have sufficient access to global information and data so as to provide competitive investment results over time, and that those professionals also have access to sophisticated tools that permit them to assess portfolio construction and risk and performance attribution characteristics continuously, as well as to transmit new information and research conclusions rapidly around the world. Additionally, in its deliberations, the Board considered Fidelity's trading, risk management, compliance, and technology and operations capabilities and resources, which are integral parts of the investment management process.
Administrative Services. The Board considered (i) the nature, extent, quality, and cost of advisory and administrative services performed by the Investment Advisers and their affiliates under the Advisory Contracts and under separate agreements covering transfer agency and pricing and bookkeeping services for the fund; (ii) the nature and extent of Fidelity's supervision of third party service providers, principally custodians, subcustodians, and pricing vendors; and (iii) the resources devoted by Fidelity to, and the record of compliance with, the fund's compliance policies and procedures. The Board also reviewed the allocation of fund brokerage, including allocations to brokers affiliated with the Investment Advisers, the use of brokerage commissions to pay fund expenses, and the use of "soft" commission dollars to pay for research services. The Board also considered the fund's securities lending activities and any payments made to Fidelity relating to securities lending under a separate agreement.
Investment Performance. The Board reviewed the fund's absolute investment performance, as well as the fund's relative investment performance and noted that the fund is not publicly offered as a stand-alone investment product. In this regard, the Board noted that the fund is designed to offer an investment option for other investment companies, 529 plans, and collective investment trusts managed by Fidelity and ultimately to enhance the performance of those investment companies, 529 plans, and collective investment trusts.
Based on its review, the Board concluded that the nature, extent, and quality of services provided to the fund under the Advisory Contracts should continue to benefit the shareholders of the fund.
Competitiveness of Management Fee and Total Expense Ratio. The Board considered that the fund does not pay FMR a management fee for investment advisory services, but that FMR receives fees for providing services to funds that invest in the fund. The Board noted that FMR or an affiliate undertakes to pay all operating expenses of the fund, except transfer agent fees, 12b-1 fees, Independent Trustee fees and expenses, custodian fees and expenses, proxy and shareholder meeting expenses, interest, taxes, and extraordinary expenses (such as litigation expenses). The Board further noted that the fund pays its non-operating expenses, including brokerage commissions and fees and expenses associated with the fund's securities lending program, if applicable.
The Board further considered that FMR has contractually agreed to reimburse the fund to the extent that total operating expenses, with certain exceptions, as a percentage of its average net assets, exceed 0.013% through February 28, 2027.
Based on its review, the Board considered that the fund does not pay a management fee and concluded that the total expense ratio of the fund was reasonable in light of the services that the fund and its shareholders receive and the other factors considered.
Costs of the Services and Profitability. The Board considered the level of Fidelity's profits in respect of all the Fidelity funds.
A public accounting firm has been engaged annually by the Board as part of the Board's assessment of Fidelity's profitability analysis. The engagement includes the review and assessment of the methodologies used by Fidelity in determining the revenues and expenses attributable to Fidelity's fund business, and completion of agreed-upon procedures in respect of the mathematical accuracy of certain fund profitability information and its conformity to established allocation methodologies. After considering the reports issued under the engagement and information provided by Fidelity, the Board concluded that while other allocation methods may also be reasonable, Fidelity's profitability methodologies are reasonable in all material respects.
The Board also reviewed Fidelity's non-fund businesses and potential indirect benefits such businesses may have received as a result of their association with Fidelity's fund business (i.e., fall-out benefits) as well as cases where Fidelity's affiliates may benefit from the funds' business. The Board considered areas where potential indirect benefits to the Fidelity funds from their relationships with Fidelity may exist. The Board's consideration of these matters was informed by the findings of a joint ad hoc committee created by it and the boards of other Fidelity funds to evaluate potential fall-out benefits.
The Board concluded that the costs of the services provided by and the profits realized by Fidelity in connection with the operation of the fund were not relevant to the renewal of the Advisory Contracts because the fund pays no advisory fees and FMR bears all expenses of the fund with certain exceptions.
Economies of Scale. The Board concluded that because the fund pays no advisory fees and FMR bears all expenses of the fund with certain exceptions, the realization of economies of scale was not a material factor in the Board's decision to renew the fund's Advisory Contracts.
Additional Information Requested by the Board. In order to develop fully the factual basis for consideration of the Fidelity funds' advisory contracts, the Board requested and received additional information on certain topics, including but not limited to: (i) fund flow and performance trends, in particular the underperformance of certain funds and strategies, and Fidelity's long-term strategies for certain funds; (ii) the operation of performance fees and the rationale for implementing performance fees on certain categories of funds but not others; (iii) Fidelity's pricing philosophy compared to competitors; (iv) fund profitability methodology and data; (v) evaluation of competitive fund data and peer group classifications and fee and expense comparisons; (vi) the management fee and expense structures for different funds and classes and information about the differences between various fee and expense structures; (vii) the variable management fee implemented for certain funds effective March 1, 2024; and (viii) information regarding other accounts managed by Fidelity and the funds' sub-advisory arrangements.
Conclusion. Based on its evaluation of all of the conclusions noted above, and after considering all factors it believed relevant, the Board, including the Independent Trustees, concluded that the advisory and sub-advisory fee arrangements are fair and reasonable in light of all of the surrounding circumstances and that the fund's Advisory Contracts should be renewed through May 31, 2025.
1.9908948.101
SMKC-ANN-1224
Fidelity® Series Select International Small Cap Fund
Annual Report
October 31, 2024
Contents
To view a fund's proxy voting guidelines and proxy voting record for the 12-month period ended June 30, visit http://www.fidelity.com/proxyvotingresults or visit the Securities and Exchange Commission's (SEC) web site at http://www.sec.gov.
You may also call 1-800-544-8544 to request a free copy of the proxy voting guidelines.
Standard & Poor's, S&P and S&P 500 are registered service marks of The McGraw-Hill Companies, Inc. and have been licensed for use by Fidelity Distributors Corporation.
Other third-party marks appearing herein are the property of their respective owners.
All other marks appearing herein are registered or unregistered trademarks or service marks of FMR LLC or an affiliated company. © 2024 FMR LLC. All rights reserved.
This report and the financial statements contained herein are submitted for the general information of the shareholders of the Fund. This report is not authorized for distribution to prospective investors in the Fund unless preceded or accompanied by an effective prospectus.
A fund files its complete schedule of portfolio holdings with the SEC for the first and third quarters of each fiscal year on Form N-PORT. Forms N-PORT are available on the SEC's web site at http://www.sec.gov. A fund's Forms N-PORT may be reviewed and copied at the SEC's Public Reference Room in Washington, DC. Information regarding the operation of the SEC's Public Reference Room may be obtained by calling 1-800-SEC-0330.
For a complete list of a fund's portfolio holdings, view the most recent holdings listing, semiannual report, or annual report on Fidelity's web site at http://www.fidelity.com, http://www.institutional.fidelity.com, or http://www.401k.com, as applicable.
NOT FDIC INSURED •MAY LOSE VALUE •NO BANK GUARANTEE
Neither the Fund nor Fidelity Distributors Corporation is a bank.
Item 7: Financial Statements and Financial Highlights for Open-End Management Investment Companies (Annual Report)
Fidelity® Series Select International Small Cap Fund
Schedule of Investments October 31, 2024
Showing Percentage of Net Assets
| Common Stocks - 96.8% |
| | | Shares | Value ($) |
| Australia - 7.7% | | | |
| ALS Ltd. | | 939 | 8,668 |
| Amotiv Ltd. | | 1,090 | 7,587 |
| Ansell Ltd. | | 380 | 7,727 |
| Aurizon Holdings Ltd. | | 2,153 | 4,774 |
| Beach Energy Ltd. | | 6,020 | 4,931 |
| CAR Group Ltd. | | 347 | 8,547 |
| Evolution Mining Ltd. | | 2,578 | 8,839 |
| Flight Centre Travel Group Ltd. | | 271 | 2,834 |
| Imdex Ltd. | | 4,244 | 7,210 |
| Incitec Pivot Ltd. | | 3,196 | 6,305 |
| National Storage REIT unit | | 5,522 | 9,085 |
| NIB Holdings Ltd. | | 1,504 | 5,693 |
| Steadfast Group Ltd. | | 2,981 | 10,736 |
| Whitehaven Coal Ltd. | | 1,210 | 5,412 |
TOTAL AUSTRALIA | | | 98,348 |
| Austria - 1.3% | | | |
| AT&S Austria Technologie & Systemtechnik AG (a) | | 127 | 2,322 |
| Schoeller-Bleckmann Oilfield Equipment AG | | 107 | 3,218 |
| Wienerberger AG | | 268 | 8,075 |
| Zumtobel AG | | 440 | 2,537 |
TOTAL AUSTRIA | | | 16,152 |
| Bailiwick of Jersey - 0.7% | | | |
| JTC PLC (b) | | 725 | 9,610 |
| Belgium - 1.4% | | | |
| Azelis Group NV | | 277 | 5,493 |
| Econocom Group SA | | 2,021 | 4,335 |
| Fagron NV | | 406 | 8,188 |
TOTAL BELGIUM | | | 18,016 |
| Finland - 1.5% | | | |
| Fortum Corp. | | 460 | 6,770 |
| Huhtamaki Oyj | | 173 | 6,782 |
| Kemira Oyj | | 250 | 5,308 |
TOTAL FINLAND | | | 18,860 |
| France - 5.4% | | | |
| Altarea SCA | | 44 | 4,834 |
| Alten SA | | 56 | 4,733 |
| Elis SA | | 300 | 6,788 |
| Euroapi SASU (a) | | 363 | 1,410 |
| Ipsos SA | | 117 | 5,737 |
| Nexans SA | | 35 | 4,854 |
| Rexel SA | | 413 | 11,312 |
| SEB SA | | 40 | 4,194 |
| Ubisoft Entertainment SA (a) | | 200 | 3,014 |
| Vallourec SA (a) | | 514 | 8,415 |
| Vicat SA | | 127 | 4,704 |
| Virbac SA | | 23 | 8,694 |
TOTAL FRANCE | | | 68,689 |
| Germany - 3.9% | | | |
| Bilfinger Berger AG | | 141 | 6,764 |
| Gerresheimer AG | | 65 | 5,480 |
| Hensoldt AG | | 100 | 3,398 |
| Lanxess AG | | 140 | 4,048 |
| Mensch und Maschine Software SE | | 82 | 4,772 |
| Patrizia Immobilien AG | | 474 | 4,011 |
| PVA TePla AG (a) | | 189 | 2,385 |
| SAF-Holland SA | | 523 | 8,090 |
| Stabilus Se | | 146 | 5,773 |
| Takkt AG | | 390 | 3,810 |
| Wacker Chemie AG | | 20 | 1,683 |
TOTAL GERMANY | | | 50,214 |
| Hong Kong - 1.8% | | | |
| ASMPT Ltd. | | 569 | 6,168 |
| Fortune (REIT) | | 3,496 | 1,822 |
| Hysan Development Co. Ltd. | | 2,024 | 3,283 |
| Luk Fook Holdings International Ltd. | | 2,586 | 4,955 |
| Melco International Development Ltd. (a) | | 3,000 | 1,846 |
| Pacific Basin Shipping Ltd. | | 18,000 | 4,958 |
TOTAL HONG KONG | | | 23,032 |
| Ireland - 1.6% | | | |
| Bank of Ireland Group PLC | | 675 | 6,213 |
| C&C Group PLC (United Kingdom) | | 4,268 | 8,112 |
| Dalata Hotel Group PLC | | 1,460 | 6,797 |
TOTAL IRELAND | | | 21,122 |
| Israel - 1.9% | | | |
| Bezeq The Israel Telecommunication Corp. Ltd. | | 5,830 | 7,490 |
| Nova Ltd. (a) | | 50 | 9,396 |
| Rami Levi Chain Stores Hashikma Marketing 2006 Ltd. | | 128 | 7,744 |
TOTAL ISRAEL | | | 24,630 |
| Italy - 2.6% | | | |
| Banca Generali SpA | | 257 | 11,389 |
| Banco BPM SpA | | 1,000 | 6,740 |
| Brembo N.V. | | 654 | 6,857 |
| Carel Industries SpA (b) | | 144 | 2,960 |
| GVS SpA (a)(b) | | 739 | 4,952 |
TOTAL ITALY | | | 32,898 |
| Japan - 38.6% | | | |
| Aeon Delight Co. Ltd. | | 230 | 6,533 |
| Anritsu Corp. | | 491 | 3,698 |
| As One Corp. | | 400 | 7,480 |
| ASKUL Corp. | | 541 | 6,822 |
| AZ-Com Maruwa Holdings, Inc. | | 500 | 3,374 |
| Azbil Corp. | | 784 | 6,096 |
| BayCurrent Consulting, Inc. | | 250 | 8,125 |
| Cosmos Pharmaceutical Corp. | | 142 | 6,825 |
| Daido Steel Co. Ltd. | | 650 | 5,033 |
| Daiei Kankyo Co. Ltd. | | 350 | 7,219 |
| Daihatsu Diesel Manufacturing Co. Ltd. | | 500 | 4,285 |
| Daiichikosho Co. Ltd. | | 556 | 6,948 |
| Daiwa Securities Living Invest | | 8 | 4,812 |
| Daiwabo Holdings Co. Ltd. | | 300 | 5,400 |
| Dexerials Corp. | | 350 | 5,344 |
| Dowa Holdings Co. Ltd. | | 182 | 6,183 |
| Food & Life Companies Ltd. | | 350 | 6,902 |
| FP Corp. | | 291 | 5,098 |
| Fujitec Co. Ltd. | | 230 | 8,276 |
| Fukushima Galilei Co. Ltd. | | 180 | 6,500 |
| Fuyo General Lease Co. Ltd. | | 110 | 7,784 |
| H.U. Group Holdings, Inc. | | 340 | 5,851 |
| Haseko Corp. | | 668 | 8,074 |
| Hosokawa Micron Corp. | | 180 | 4,706 |
| Inaba Denki Sangyo Co. Ltd. | | 400 | 10,033 |
| Kamigumi Co. Ltd. | | 398 | 8,307 |
| Kaneka Corp. | | 248 | 6,079 |
| Kawasaki Heavy Industries Ltd. | | 190 | 7,275 |
| Kissei Pharmaceutical Co. Ltd. | | 235 | 5,735 |
| Koshidaka Holdings Co. Ltd. | | 950 | 7,452 |
| Kotobuki Spirits Co. Ltd. | | 630 | 8,507 |
| Kyoritsu Maintenance Co. Ltd. | | 346 | 5,555 |
| Kyoto Financial Group, Inc. | | 526 | 7,720 |
| Kyushu Railway Co. | | 310 | 8,156 |
| Maruwa Ceramic Co. Ltd. | | 27 | 7,448 |
| Meidensha Corp. | | 200 | 5,249 |
| Milbon Co. Ltd. | | 182 | 3,847 |
| Mitsubishi Logisnext Co. Ltd. | | 900 | 6,693 |
| Miura Co. Ltd. | | 250 | 5,838 |
| Morinaga & Co. Ltd. | | 444 | 8,305 |
| Nabtesco Corp. | | 291 | 4,717 |
| Nagaileben Co. Ltd. | | 290 | 4,351 |
| Net One Systems Co. Ltd. | | 138 | 3,350 |
| Nextage Co. Ltd. | | 570 | 5,471 |
| Nikkiso Co. Ltd. | | 978 | 6,573 |
| Nippon Gas Co. Ltd. | | 363 | 4,961 |
| NSD Co. Ltd. | | 250 | 5,400 |
| Okinawa Cellular Telephone Co. | | 299 | 8,506 |
| PALTAC Corp. | | 232 | 6,261 |
| Park24 Co. Ltd. (a) | | 516 | 6,413 |
| Penta-Ocean Construction Co. Ltd. | | 1,408 | 5,848 |
| Relo Group, Inc. | | 488 | 5,936 |
| Resonac Holdings Corp. | | 325 | 7,730 |
| Riken Keiki Co. Ltd. | | 240 | 6,800 |
| Rinnai Corp. | | 260 | 5,696 |
| Roland Corp. | | 186 | 4,758 |
| Santen Pharmaceutical Co. Ltd. | | 600 | 7,175 |
| Sanwa Holdings Corp. | | 568 | 14,390 |
| Sega Sammy Holdings, Inc. | | 280 | 5,269 |
| Shoei Co. Ltd. | | 430 | 6,599 |
| SOSiLA Logistics REIT, Inc. | | 7 | 5,050 |
| Stanley Electric Co. Ltd. | | 358 | 6,123 |
| Sumco Corp. | | 559 | 5,345 |
| Suruga Bank Ltd. | | 1,488 | 10,598 |
| SWCC Showa Holdings Co. Ltd. | | 250 | 8,767 |
| Taiyo Yuden Co. Ltd. | | 200 | 3,498 |
| Takeuchi Manufacturing Co. Ltd. | | 160 | 4,986 |
| Tohoku Electric Power Co., Inc. | | 500 | 4,904 |
| Tokyo Tatemono Co. Ltd. | | 573 | 9,357 |
| Toyo Gosei Co. Ltd. | | 100 | 4,662 |
| Toyo Suisan Kaisha Ltd. | | 125 | 7,343 |
| Tsumura & Co. | | 219 | 7,158 |
| Uacj Corp. | | 150 | 4,937 |
| Valqua Ltd. | | 198 | 4,248 |
| WingArc1st, Inc. | | 250 | 5,326 |
| Workman Co. Ltd. | | 133 | 3,395 |
| Zenkoku Hosho Co. Ltd. | | 220 | 7,949 |
| Zuken, Inc. | | 230 | 5,450 |
TOTAL JAPAN | | | 494,867 |
| Netherlands - 1.3% | | | |
| Eurocommercial Properties NV | | 356 | 9,042 |
| OCI NV | | 140 | 1,700 |
| TKH Group NV (bearer) (depositary receipt) | | 130 | 5,275 |
TOTAL NETHERLANDS | | | 16,017 |
| New Zealand - 0.8% | | | |
| Contact Energy Ltd. | | 1,910 | 9,718 |
| Norway - 2.0% | | | |
| DOF Group ASA (a) | | 847 | 6,730 |
| Schibsted ASA (A Shares) | | 210 | 7,071 |
| Sparebanken Midt-Norge | | 550 | 8,118 |
| TGS ASA | | 389 | 3,533 |
TOTAL NORWAY | | | 25,452 |
| Singapore - 1.4% | | | |
| CDL Hospitality Trusts unit | | 9,532 | 6,462 |
| Mapletree Industrial (REIT) | | 3,885 | 7,015 |
| Wing Tai Holdings Ltd. | | 4,256 | 4,311 |
TOTAL SINGAPORE | | | 17,788 |
| Spain - 2.6% | | | |
| Bankinter SA | | 1,087 | 8,856 |
| Cie Automotive SA | | 179 | 4,790 |
| Fluidra SA | | 360 | 9,680 |
| Logista Integral SA | | 317 | 9,689 |
TOTAL SPAIN | | | 33,015 |
| Sweden - 4.6% | | | |
| AAK AB | | 310 | 8,874 |
| AddTech AB (B Shares) | | 341 | 9,454 |
| Arjo AB | | 1,090 | 3,591 |
| Avanza Bank Holding AB | | 310 | 6,448 |
| Granges AB | | 500 | 5,904 |
| HEXPOL AB (B Shares) | | 565 | 5,351 |
| JM AB | | 340 | 5,722 |
| Loomis AB | | 210 | 6,575 |
| Munters Group AB (b) | | 455 | 7,349 |
TOTAL SWEDEN | | | 59,268 |
| Switzerland - 3.1% | | | |
| Bucher Industries AG | | 16 | 6,235 |
| OC Oerlikon Corp. AG (Reg.) | | 793 | 3,624 |
| PSP Swiss Property AG | | 57 | 8,092 |
| Sensirion Holding AG (a)(b) | | 25 | 1,824 |
| Tecan Group AG | | 18 | 4,544 |
| VZ Holding AG | | 94 | 15,167 |
TOTAL SWITZERLAND | | | 39,486 |
| United Kingdom - 12.6% | | | |
| B&M European Value Retail SA | | 1,566 | 7,827 |
| ConvaTec Group PLC (b) | | 1,900 | 5,228 |
| DCC PLC (United Kingdom) | | 110 | 6,956 |
| Elementis PLC | | 2,300 | 3,956 |
| Grainger Trust PLC | | 2,272 | 6,650 |
| Harbour Energy PLC | | 1,109 | 3,953 |
| Hill & Smith Holdings PLC | | 344 | 9,027 |
| Inchcape PLC | | 797 | 7,358 |
| J.D. Wetherspoon PLC | | 807 | 6,389 |
| Jet2 PLC | | 516 | 9,561 |
| John Wood Group PLC (a) | | 3,300 | 5,383 |
| Lancashire Holdings Ltd. | | 1,523 | 12,392 |
| Mitie Group PLC | | 7,896 | 11,872 |
| Pets At Home Group PLC | | 1,177 | 4,495 |
| Renewi PLC | | 612 | 4,798 |
| RS GROUP PLC | | 600 | 5,377 |
| Sabre Insurance Group PLC (b) | | 5,571 | 9,827 |
| Savills PLC | | 600 | 8,309 |
| Senior Engineering Group PLC | | 4,031 | 6,882 |
| Spectris PLC | | 192 | 6,229 |
| Unite Group PLC | | 823 | 9,291 |
| Vistry Group PLC (a) | | 864 | 10,133 |
TOTAL UNITED KINGDOM | | | 161,893 |
| TOTAL COMMON STOCKS (Cost $1,099,879) | | | 1,239,075 |
| | | | |
| Nonconvertible Preferred Stocks - 0.4% |
| | | Shares | Value ($) |
| Germany - 0.4% | | | |
Jungheinrich AG (Cost $5,082) | | 201 | 5,492 |
| | | | |
| TOTAL INVESTMENT IN SECURITIES - 97.2% (Cost $1,104,961) | 1,244,567 |
NET OTHER ASSETS (LIABILITIES) - 2.8% | 36,068 |
| NET ASSETS - 100.0% | 1,280,635 |
| | |
Legend
| (b) | Security exempt from registration under Rule 144A of the Securities Act of 1933. These securities may be resold in transactions exempt from registration, normally to qualified institutional buyers. At the end of the period, the value of these securities amounted to $41,750 or 3.3% of net assets. |
Investment Valuation
The following is a summary of the inputs used, as of October 31, 2024, involving the Fund's assets and liabilities carried at fair value. The inputs or methodology used for valuing securities may not be an indication of the risk associated with investing in those securities. For more information on valuation inputs, and their aggregation into the levels used below, please refer to the Investment Valuation section in the accompanying Notes to Financial Statements.
| Valuation Inputs at Reporting Date: |
| Description | Total ($) | Level 1 ($) | Level 2 ($) | Level 3 ($) |
Investments in Securities: | | | | |
|
| Equities: | | | | |
Communication Services | 47,313 | 20,298 | 27,015 | - |
Consumer Discretionary | 168,251 | 72,652 | 95,599 | - |
Consumer Staples | 59,557 | 24,730 | 34,827 | - |
Energy | 41,575 | 31,232 | 10,343 | - |
Financials | 145,240 | 94,760 | 50,480 | - |
Health Care | 82,612 | 37,135 | 45,477 | - |
Industrials | 338,123 | 167,460 | 170,663 | - |
Information Technology | 105,319 | 35,996 | 69,323 | - |
Materials | 122,862 | 56,538 | 66,324 | - |
Real Estate | 107,362 | 50,229 | 57,133 | - |
Utilities | 26,353 | 6,770 | 19,583 | - |
| | | | | |
| Total Investments in Securities: | 1,244,567 | 597,800 | 646,767 | - |
Financial Statements
| Statement of Assets and Liabilities |
As of October 31, 2024 |
| Assets | | | | |
Investment in securities, at value - See accompanying schedule Unaffiliated issuers (cost $1,104,961): | | | $ | 1,244,567 |
| Cash | | | | 28,761 |
| Foreign currency held at value (cost $1,348) | | | | 1,347 |
| Dividends receivable | | | | 7,007 |
| Receivable from investment adviser for expense reductions | | | | 557 |
Total assets | | | | 1,282,239 |
| Liabilities | | | | |
| Accrued management fee | $ | 146 | | |
| Custody fee payable | | 900 | | |
| Other payables and accrued expenses | | 558 | | |
| Total liabilities | | | | 1,604 |
| Net Assets | | | $ | 1,280,635 |
| Net Assets consist of: | | | | |
| Paid in capital | | | $ | 1,071,405 |
| Total accumulated earnings (loss) | | | | 209,230 |
| Net Assets | | | $ | 1,280,635 |
Net Asset Value, offering price and redemption price per share ($1,280,635 ÷ 106,383 shares) | | | $ | 12.04 |
| Statement of Operations |
| Year ended October 31, 2024 |
| Investment Income | | | | |
| Dividends | | | $ | 44,330 |
| Income before foreign taxes withheld | | | $ | 44,330 |
| Less foreign taxes withheld | | | | (4,143) |
| Total income | | | | 40,187 |
| Expenses | | | | |
| Custodian fees and expenses | $ | 2,838 | | |
| Independent trustees' fees and expenses | | 6 | | |
| Total expenses before reductions | | 2,844 | | |
| Expense reductions | | (2,673) | | |
| Total expenses after reductions | | | | 171 |
| Net Investment income (loss) | | | | 40,016 |
| Realized and Unrealized Gain (Loss) | | | | |
| Net realized gain (loss) on: | | | | |
| Investment Securities: | | | | |
| Unaffiliated issuers | | 40,619 | | |
| Foreign currency transactions | | 31 | | |
| Total net realized gain (loss) | | | | 40,650 |
| Change in net unrealized appreciation (depreciation) on: | | | | |
| Investment Securities: | | | | |
| Unaffiliated issuers | | 119,782 | | |
| Assets and liabilities in foreign currencies | | (210) | | |
| Total change in net unrealized appreciation (depreciation) | | | | 119,572 |
| Net gain (loss) | | | | 160,222 |
| Net increase (decrease) in net assets resulting from operations | | | $ | 200,238 |
| Statement of Changes in Net Assets |
| |
| | Year ended October 31, 2024 | | For the period November 4, 2022 (commencement of operations) through October 31, 2023 |
| Increase (Decrease) in Net Assets | | | | |
| Operations | | | | |
| Net investment income (loss) | $ | 40,016 | $ | 30,656 |
| Net realized gain (loss) | | 40,650 | | 29,962 |
| Change in net unrealized appreciation (depreciation) | | 119,572 | | 19,779 |
| Net increase (decrease) in net assets resulting from operations | | 200,238 | | 80,397 |
| Distributions to shareholders | | (68,011) | | (3,400) |
| | | | | |
| Share transactions | | | | |
| Proceeds from sales of shares | | - | | 1,000,000 |
| Reinvestment of distributions | | 68,011 | | 3,400 |
| | | | | |
Net increase (decrease) in net assets resulting from share transactions | | 68,011 | | 1,003,400 |
| Total increase (decrease) in net assets | | 200,238 | | 1,080,397 |
| | | | | |
| Net Assets | | | | |
| Beginning of period | | 1,080,397 | | - |
| End of period | $ | 1,280,635 | $ | 1,080,397 |
| | | | | |
| Other Information | | | | |
| Shares | | | | |
| Sold | | - | | 100,000 |
| Issued in reinvestment of distributions | | 6,072 | | 311 |
| Net increase (decrease) | | 6,072 | | 100,311 |
| | | | | |
Financial Highlights
Fidelity® Series Select International Small Cap Fund |
| |
| Years ended October 31, | | 2024 | | 2023 A |
Selected Per-Share Data | | | | |
| Net asset value, beginning of period | $ | 10.77 | $ | 10.00 |
| Income from Investment Operations | | | | |
Net investment income (loss) B,C | | .38 | | .31 |
| Net realized and unrealized gain (loss) | | 1.57 | | .49 |
| Total from investment operations | | 1.95 | | .80 |
| Distributions from net investment income | | (.43) | | (.03) |
| Distributions from net realized gain | | (.25) | | - |
| Total distributions | | (.68) | | (.03) |
| Net asset value, end of period | $ | 12.04 | $ | 10.77 |
Total Return D,E | | | | 8.03% |
Ratios to Average Net Assets C,F,G | | | | |
| Expenses before reductions | | .22% | | .23% H |
| Expenses net of fee waivers, if any | | | | .01% H |
| Expenses net of all reductions | | .01% | | .01% H |
| Net investment income (loss) | | 3.14% | | 2.69% H |
| Supplemental Data | | | | |
| Net assets, end of period (000 omitted) | $ | 1,281 | $ | 1,080 |
Portfolio turnover rate I | | | | 23% H |
AFor the period November 4, 2022 (commencement of operations) through October 31, 2023.
BCalculated based on average shares outstanding during the period.
CNet investment income (loss) is affected by the timing of the declaration of dividends by any underlying mutual funds or exchange-traded funds (ETFs). Net investment income (loss) of any mutual funds or ETFs is not included in the Fund's net investment income (loss) ratio.
DTotal returns for periods of less than one year are not annualized.
ETotal returns would have been lower if certain expenses had not been reduced during the applicable periods shown.
FFees and expenses of any underlying mutual funds or exchange-traded funds (ETFs) are not included in the Fund's expense ratio. The Fund indirectly bears its proportionate share of these expenses.
GExpense ratios reflect operating expenses of the class. Expenses before reductions do not reflect amounts reimbursed, waived, or reduced through arrangements with the investment adviser, brokerage services, or other offset arrangements, if applicable, and do not represent the amount paid by the class during periods when reimbursements, waivers or reductions occur.
HAnnualized.
IAmount does not include the portfolio activity of any underlying mutual funds or exchange-traded funds (ETFs).
Notes to Financial Statements
For the period ended October 31, 2024
1. Organization.
Fidelity Series Select International Small Cap Fund (the Fund) is a fund of Fidelity Investment Trust (the Trust) and is authorized to issue an unlimited number of shares. Shares are offered only to certain other Fidelity funds, Fidelity managed 529 plans, and Fidelity managed collective investment trusts. The Trust is registered under the Investment Company Act of 1940, as amended (the 1940 Act), as an open-end management investment company organized as a Massachusetts business trust.
2. Significant Accounting Policies.
The Fund is an investment company and applies the accounting and reporting guidance of the Financial Accounting Standards Board (FASB) Accounting Standards Codification Topic 946 Financial Services - Investment Companies. The financial statements have been prepared in conformity with accounting principles generally accepted in the United States of America (GAAP), which require management to make certain estimates and assumptions at the date of the financial statements. Actual results could differ from those estimates. Subsequent events, if any, through the date that the financial statements were issued have been evaluated in the preparation of the financial statements. The Fund's Schedule of Investments lists any underlying mutual funds or exchange-traded funds (ETFs) but does not include the underlying holdings of these funds. The following summarizes the significant accounting policies of the Fund:
Investment Valuation. Investments are valued as of 4:00 p.m. Eastern time on the last calendar day of the period. The Board of Trustees (the Board) has designated the Fund's investment adviser as the valuation designee responsible for the fair valuation function and performing fair value determinations as needed. The investment adviser has established a Fair Value Committee (the Committee) to carry out the day-to-day fair valuation responsibilities and has adopted policies and procedures to govern the fair valuation process and the activities of the Committee. In accordance with these fair valuation policies and procedures, which have been approved by the Board, the Fund attempts to obtain prices from one or more third party pricing services or brokers to value its investments. When current market prices, quotations or currency exchange rates are not readily available or reliable, investments will be fair valued in good faith by the Committee, in accordance with the policies and procedures. Factors used in determining fair value vary by investment type and may include market or investment specific events, transaction data, estimated cash flows, and market observations of comparable investments. The frequency that the fair valuation procedures are used cannot be predicted and they may be utilized to a significant extent. The Committee manages the Fund's fair valuation practices and maintains the fair valuation policies and procedures. The Fund's investment adviser reports to the Board information regarding the fair valuation process and related material matters.
The Fund categorizes the inputs to valuation techniques used to value its investments into a disclosure hierarchy consisting of three levels as shown below:
Level 1 - unadjusted quoted prices in active markets for identical investments
Level 2 - other significant observable inputs (including quoted prices for similar investments, interest rates, prepayment speeds, etc.)
Level 3 - unobservable inputs (including the Fund's own assumptions based on the best information available)
Valuation techniques used to value the Fund's investments by major category are as follows:
Equity securities, including restricted securities, for which market quotations are readily available, are valued at the last reported sale price or official closing price as reported by a third party pricing service on the primary market or exchange on which they are traded and are categorized as Level 1 in the hierarchy. In the event there were no sales during the day or closing prices are not available, securities are valued at the last quoted bid price or may be valued using the last available price and are generally categorized as Level 2 in the hierarchy. For foreign equity securities, when market or security specific events arise, comparisons to the valuation of American Depositary Receipts (ADRs), futures contracts, Exchange-Traded Funds (ETFs) and certain indexes as well as quoted prices for similar securities may be used and would be categorized as Level 2 in the hierarchy. For equity securities, including restricted securities, where observable inputs are limited, assumptions about market activity and risk are used and these securities may be categorized as Level 3 in the hierarchy.
Changes in valuation techniques may result in transfers in or out of an assigned level within the disclosure hierarchy. The aggregate value of investments by input level as of October 31, 2024 is included at the end of the Fund's Schedule of Investments.
Foreign Currency. Certain Funds may use foreign currency contracts to facilitate transactions in foreign-denominated securities. Gains and losses from these transactions may arise from changes in the value of the foreign currency or if the counterparties do not perform under the contracts' terms.
Foreign-denominated assets, including investment securities, and liabilities are translated into U.S. dollars at the exchange rates at period end. Purchases and sales of investment securities, income and dividends received, and expenses denominated in foreign currencies are translated into U.S. dollars at the exchange rate in effect on the transaction date.
The effects of exchange rate fluctuations on investments are included with the net realized and unrealized gain (loss) on investment securities. Other foreign currency transactions resulting in realized and unrealized gain (loss) are disclosed separately.
Investment Transactions and Income. For financial reporting purposes, the Fund's investment holdings and NAV include trades executed through the end of the last business day of the period. The NAV per share for processing shareholder transactions is calculated as of the close of business of the New York Stock Exchange (NYSE), normally 4:00 p.m. Eastern time and includes trades executed through the end of the prior business day. Gains and losses on securities sold are determined on the basis of identified cost. Commissions paid to certain brokers with whom the investment adviser, or its affiliates, places trades on behalf of a fund include an amount in addition to trade execution, which may be rebated back to a fund. Any such rebates are included in net realized gain (loss) on investments in the Statement of Operations. Dividend income is recorded on the ex-dividend date, except for certain dividends from foreign securities where the ex-dividend date may have passed, which are recorded as soon as the Fund is informed of the ex-dividend date. Non-cash dividends included in dividend income, if any, are recorded at the fair market value of the securities received. Investment income is recorded net of foreign taxes withheld where recovery of such taxes is uncertain. Funds may file withholding tax reclaims in certain jurisdictions to recover a portion of amounts previously withheld. Any withholding tax reclaims income is included in the Statement of Operations in foreign taxes withheld. Any receivables for withholding tax reclaims are included in the Statement of Assets and Liabilities in dividends receivable
Expenses. Expenses directly attributable to a fund are charged to that fund. Expenses attributable to more than one fund are allocated among the respective funds on the basis of relative net assets or other appropriate methods. Expenses included in the accompanying financial statements reflect the expenses of that fund and do not include any expenses associated with any underlying mutual funds or exchange-traded funds. Although not included in a fund's expenses, a fund indirectly bears its proportionate share of these expenses through the net asset value of each underlying mutual fund or exchange-traded fund. Expense estimates are accrued in the period to which they relate and adjustments are made when actual amounts are known.
Income Tax Information and Distributions to Shareholders. Each year, the Fund intends to qualify as a regulated investment company under Subchapter M of the Internal Revenue Code, including distributing substantially all of its taxable income and realized gains. As a result, no provision for U.S. Federal income taxes is required. As of October 31, 2024, the Fund did not have any unrecognized tax benefits in the financial statements; nor is the Fund aware of any tax positions for which it is reasonably possible that the total amounts of unrecognized tax benefits will significantly change in the next twelve months. The Fund files a U.S. federal tax return, in addition to state and local tax returns as required. The Fund's federal income tax returns are subject to examination by the Internal Revenue Service (IRS) for a period of three fiscal years after they are filed. State and local tax returns may be subject to examination for an additional fiscal year depending on the jurisdiction. Foreign taxes are provided for based on the Fund's understanding of the tax rules and rates that exist in the foreign markets in which it invests.
Distributions are declared and recorded on the ex-dividend date. Income and capital gain distributions are determined in accordance with income tax regulations, which may differ from GAAP.
Capital accounts within the financial statements are adjusted for permanent book-tax differences. These adjustments have no impact on net assets or the results of operations. Capital accounts are not adjusted for temporary book-tax differences which will reverse in a subsequent period.
Book-tax differences are primarily due to foreign currency transactions and passive foreign investment companies (PFIC).
As of period end, the cost and unrealized appreciation (depreciation) in securities, and derivatives if applicable, for federal income tax purposes were as follows:
| Gross unrealized appreciation | $214,890 |
| Gross unrealized depreciation | (88,563) |
| Net unrealized appreciation (depreciation) | $126,327 |
| Tax Cost | $1,118,240 |
The tax-based components of distributable earnings as of period end were as follows:
| Undistributed ordinary income | $44,203 |
| Undistributed long-term capital gain | $38,955 |
| Net unrealized appreciation (depreciation) on securities and other investments | $126,071 |
The tax character of distributions paid was as follows:
| | October 31, 2024 | October 31, 2023A |
| Ordinary Income | $68,011 | $ 3,400 |
| Total | $68,011 | $ 3,400 |
A For the period November 4, 2022 (commencement of operations) through October 31, 2023.
Restricted Securities (including Private Placements). Funds may invest in securities that are subject to legal or contractual restrictions on resale. These securities generally may be resold in transactions exempt from registration or to the public if the securities are registered. Disposal of these securities may involve time-consuming negotiations and expense, and prompt sale at an acceptable price may be difficult. Information regarding restricted securities held at period end is included at the end of the Schedule of Investments, if applicable.
New Accounting Pronouncement. In November 2023, the FASB issued Accounting Standards Update (ASU) 2023-07 Segment Reporting (Topic 280): Improvements to Reportable Segment Disclosures. Effective for fiscal years beginning after December 15, 2023 and interim periods within fiscal years beginning after December 15, 2024, the amendments enhance required disclosures of segment information for public entities on an annual and interim basis. The ASU allows for early adoption with updates applied retrospectively. Management is currently evaluating the impact of the ASU but does not expect this guidance to materially impact the financial statements.
3. Purchases and Sales of Investments.
Purchases and sales of securities, other than short-term securities and in-kind transactions, as applicable, are noted in the table below.
| | Purchases ($) | Sales ($) |
| Fidelity Series Select International Small Cap Fund | 260,168 | 224,523 |
4. Fees and Other Transactions with Affiliates.
Management Fee. Fidelity Management & Research Company LLC (the investment adviser) and its affiliates provide the Fund with investment management related services for which the Fund does not pay a management fee. Under the management contract, the investment adviser or an affiliate pays all ordinary operating expenses of the Fund, except custody fees, fees and expenses of the independent Trustees, and certain miscellaneous expenses such as proxy and shareholder meeting expenses.
Interfund Trades. Funds may purchase from or sell securities to other Fidelity Funds under procedures adopted by the Board. The procedures have been designed to ensure these interfund trades are executed in accordance with Rule 17a-7 of the 1940 Act. Any interfund trades are included within the respective purchases and sales amounts shown in the Purchases and Sales of Investments note. Interfund trades during the period are noted in the table below.
| | Purchases ($) | Sales ($) | Realized Gain (Loss)($) |
| Fidelity Series Select International Small Cap Fund | 1,887 | 927 | 379 |
Sub-Advisory Arrangements. Effective March 1, 2024, the Fund's sub-advisory agreements with FMR Investment Management (UK) Limited, Fidelity Management & Research (Hong Kong) Limited, and Fidelity Management & Research (Japan) Limited were amended to provide that the investment adviser pays each sub-adviser monthly fees equal to 110% of the sub-adviser's costs for providing sub-advisory services.
5. Committed Line of Credit.
Certain Funds participate with other funds managed by the investment adviser or an affiliate in a $4.25 billion credit facility (the "line of credit") to be utilized for temporary or emergency purposes to fund shareholder redemptions or for other short-term liquidity purposes. The commitment fees on the pro-rata portion of the line of credit are borne by the investment adviser. During the period, there were no borrowings on this line of credit.
6. Expense Reductions.
The investment adviser contractually agreed to reimburse the Fund to the extent annual operating expenses exceeded .013% of average net assets. This reimbursement will remain in place through February 28, 2028. Some expenses, for example the compensation of the independent Trustees, and certain other expenses such as interest expense, are excluded from this reimbursement. During the period this reimbursement reduced the Fund's expenses by $2,673.
7. Other.
A fund's organizational documents provide former and current trustees and officers with a limited indemnification against liabilities arising in connection with the performance of their duties to the fund. In the normal course of business, a fund may also enter into contracts that provide general indemnifications. A fund's maximum exposure under these arrangements is unknown as this would be dependent on future claims that may be made against a fund. The risk of material loss from such claims is considered remote.
At the end of the period, accounts managed by the investment adviser or its affiliates were the owners of record of all of the outstanding shares of the Fund.
8. Risk and Uncertainties.
Many factors affect a fund's performance. Developments that disrupt global economies and financial markets, such as pandemics, epidemics, outbreaks of infectious diseases, war, terrorism, and environmental disasters, may significantly affect a fund's investment performance. The effects of these developments to a fund will be impacted by the types of securities in which a fund invests, the financial condition, industry, economic sector, and geographic location of an issuer, and a fund's level of investment in the securities of that issuer. Significant concentrations in security types, issuers, industries, sectors, and geographic locations may magnify the factors that affect a fund's performance.
Report of Independent Registered Public Accounting Firm
To the Board of Trustees of Fidelity Investment Trust and the Shareholders of Fidelity Series Select International Small Cap Fund:
Opinion on the Financial Statements and Financial Highlights
We have audited the accompanying statement of assets and liabilities of Fidelity Series Select International Small Cap Fund (the "Fund"), a fund of Fidelity Investment Trust, including the schedule of investments, as of October 31, 2024, the related statement of operations for the year then ended, the statement of changes in net assets and the financial highlights for the year then ended and for the period from November 4, 2022 (commencement of operations) through October 31, 2023, and the related notes. In our opinion, the financial statements and financial highlights present fairly, in all material respects, the financial position of the Fund as of October 31, 2024, and the results of its operations for the year then ended, the changes in its net assets and the financial highlights for the year then ended and for the period from November 4, 2022 (commencement of operations) through October 31, 2023, in conformity with accounting principles generally accepted in the United States of America.
Basis for Opinion
These financial statements and financial highlights are the responsibility of the Fund's management. Our responsibility is to express an opinion on the Fund's financial statements and financial highlights based on our audits. We are a public accounting firm registered with the Public Company Accounting Oversight Board (United States) (PCAOB) and are required to be independent with respect to the Fund in accordance with the U.S. federal securities laws and the applicable rules and regulations of the Securities and Exchange Commission and the PCAOB.
We conducted our audits in accordance with the standards of the PCAOB. Those standards require that we plan and perform the audit to obtain reasonable assurance about whether the financial statements and financial highlights are free of material misstatement, whether due to error or fraud. The Fund is not required to have, nor were we engaged to perform, an audit of its internal control over financial reporting. As part of our audits, we are required to obtain an understanding of internal control over financial reporting but not for the purpose of expressing an opinion on the effectiveness of the Fund's internal control over financial reporting. Accordingly, we express no such opinion.
Our audits included performing procedures to assess the risks of material misstatement of the financial statements and financial highlights, whether due to error or fraud, and performing procedures that respond to those risks. Such procedures included examining, on a test basis, evidence regarding the amounts and disclosures in the financial statements and financial highlights. Our audits also included evaluating the accounting principles used and significant estimates made by management, as well as evaluating the overall presentation of the financial statements and financial highlights. Our procedures included confirmation of securities owned as of October 31, 2024, by correspondence with the custodian and brokers; when replies were not received from brokers, we performed other auditing procedures. We believe that our audits provide a reasonable basis for our opinion.
/s/ Deloitte & Touche LLP
Boston, Massachusetts
December 17, 2024
We have served as the auditor of one or more of the Fidelity investment companies since 1999.
Distributions
(Unaudited)
The dividend and capital gains distributions for the fund(s) are available on Fidelity.com or Institutional.Fidelity.com.
The fund hereby designates as a capital gain dividend with respect to the taxable year ended October 31, 2024, $38,955, or, if subsequently determined to be different, the net capital gain of such year.
The fund designates 36.29% of the dividends distributed during the fiscal year as amounts which may be taken into account as a dividend for the purposes of the maximum rate under section 1(h)(11) of the Internal Revenue Code.
The fund designates 0.50% of the dividends distributed during the fiscal year as a section 199A dividend.
The amounts per share which represent income derived from sources within, and taxes paid to, foreign countries or possessions of the United States are $0.4341 and $0.0332 for the dividend paid December 11, 2023.
The fund will notify shareholders in January 2025 of amounts for use in preparing 2024 income tax returns.
Item 8: Changes in and Disagreements with Accountants for Open-End Management Investment Companies
(Unaudited)
Note: This is not applicable for any fund included in this document.
Item 9: Proxy Disclosures for Open-End Management Investment Companies
(Unaudited)
| A special meeting of shareholders was held on July 16, 2024. The results of votes taken among shareholders on the proposal before them are reported below. Each vote reported represents one dollar of net asset value held on the record date for the meeting. |
| Proposal 1 |
| To elect a Board of Trustees. |
| | # of Votes | % of Votes |
| Bettina Doulton |
| Affirmative | 128,529,177,643.56 | 98.18 |
| Withheld | 2,378,037,364.30 | 1.82 |
| TOTAL | 130,907,215,007.85 | 100.00 |
| Robert A. Lawrence |
| Affirmative | 128,253,389,899.05 | 97.97 |
| Withheld | 2,653,825,108.81 | 2.03 |
| TOTAL | 130,907,215,007.85 | 100.00 |
| Vijay C. Advani |
| Affirmative | 128,531,418,228.19 | 98.19 |
| Withheld | 2,375,796,779.66 | 1.81 |
| TOTAL | 130,907,215,007.85 | 100.00 |
| Thomas P. Bostick |
| Affirmative | 128,495,261,591.41 | 98.16 |
| Withheld | 2,411,953,416.44 | 1.84 |
| TOTAL | 130,907,215,007.85 | 100.00 |
| Donald F. Donahue |
| Affirmative | 128,407,878,996.00 | 98.09 |
| Withheld | 2,499,336,011.85 | 1.91 |
| TOTAL | 130,907,215,007.85 | 100.00 |
| Vicki L. Fuller |
| Affirmative | 128,625,540,095.19 | 98.26 |
| Withheld | 2,281,674,912.66 | 1.74 |
| TOTAL | 130,907,215,007.85 | 100.00 |
| Patricia L. Kampling |
| Affirmative | 128,668,729,281.34 | 98.29 |
| Withheld | 2,238,485,726.51 | 1.71 |
| TOTAL | 130,907,215,007.85 | 100.00 |
| Thomas A. Kennedy |
| Affirmative | 128,499,824,239.79 | 98.16 |
| Withheld | 2,407,390,768.06 | 1.84 |
| TOTAL | 130,907,215,007.85 | 100.00 |
| Oscar Munoz |
| Affirmative | 128,386,109,391.05 | 98.07 |
| Withheld | 2,521,105,616.80 | 1.93 |
| TOTAL | 130,907,215,007.85 | 100.00 |
| Karen B. Peetz |
| Affirmative | 128,603,731,113.82 | 98.24 |
| Withheld | 2,303,483,894.03 | 1.76 |
| TOTAL | 130,907,215,007.85 | 100.00 |
| David M. Thomas |
| Affirmative | 128,384,899,342.98 | 98.07 |
| Withheld | 2,522,315,664.88 | 1.93 |
| TOTAL | 130,907,215,007.85 | 100.00 |
| Susan Tomasky |
| Affirmative | 128,556,148,461.60 | 98.20 |
| Withheld | 2,351,066,546.25 | 1.80 |
| TOTAL | 130,907,215,007.85 | 100.00 |
| Michael E. Wiley |
| Affirmative | 128,264,934,978.34 | 97.98 |
| Withheld | 2,642,280,029.51 | 2.02 |
| TOTAL | 130,907,215,007.85 | 100.00 |
| | | |
| Proposal 1 reflects trust-wide proposal and voting results. |
Item 10: Remuneration Paid to Directors, Officers, and others of Open-End Management Investment Companies
(Unaudited)
Note: This information is disclosed as part of the financial statements for each Fund as part of Item 7: Financial Statements and Financial Highlights for Open-End Management Investment companies.
Item 11: Statement Regarding Basis for Approval of Investment Advisory Contract
(Unaudited)
Board Approval of Investment Advisory Contracts and Management Fees
Fidelity Series Select International Small Cap Fund
Each year, the Board of Trustees, including the Independent Trustees (together, the Board), considers the renewal of the fund's management contract with Fidelity Management & Research Company LLC (FMR) and the sub-advisory agreements (together, the Advisory Contracts) for the fund. FMR and the sub-advisers are referred to herein as the Investment Advisers. The Board, assisted by the advice of fund counsel and Independent Trustees' counsel, requests and considers a broad range of information relevant to the renewal of the Advisory Contracts throughout the year.
The Board meets regularly and, at each of its meetings, covers an extensive agenda of topics and materials and considers factors that are relevant to its annual consideration of the renewal of the fund's Advisory Contracts, including the services and support provided to the fund and its shareholders. The Board, acting directly and through its Committees (each of which is composed of and chaired by Independent Trustees), requests and receives information concerning the annual consideration of the renewal of the fund's Advisory Contracts. The Board also meets as needed to review matters specifically related to the Board's annual consideration of the renewal of the Advisory Contracts. Members of the Board may also meet with trustees of other Fidelity funds through joint ad hoc committees to discuss certain matters relevant to all of the Fidelity funds.
At its May 2024 meeting, the Board unanimously determined to renew the fund's Advisory Contracts. The Board considered all factors it believed relevant and reached a determination, with the assistance of fund counsel and Independent Trustees' counsel and through the exercise of its business judgment, that the renewal of the Advisory Contracts was in the best interests of the fund and its shareholders and the fact that no fee is payable under the management contract was fair and reasonable in light of all of the surrounding circumstances.
Nature, Extent, and Quality of Services Provided. The Board considered staffing as it relates to the fund, including the backgrounds and experience of investment personnel of the Investment Advisers, and also considered the Investment Advisers' implementation of the fund's investment program. The Independent Trustees also had discussions with senior management of Fidelity's investment operations and investment groups. The Board considered the structure of the investment personnel compensation program and whether this structure provides appropriate incentives to act in the best interests of the fund.
Resources Dedicated to Investment Management and Support Services. The Board and the Fund Oversight and Research Committees reviewed the general qualifications and capabilities of Fidelity's investment staff, including its size, education, experience, and resources, as well as Fidelity's approach to recruiting, training, managing, and compensating investment personnel. The Board noted the resources devoted to expansion of Fidelity's global investment organization, and that Fidelity's analysts have extensive resources, tools, and capabilities that allow them to conduct sophisticated quantitative and fundamental analysis, as well as credit analysis of issuers, counterparties, and guarantors. Further, the Board considered that Fidelity's investment professionals have sufficient access to global information and data so as to provide competitive investment results over time, and that those professionals also have access to sophisticated tools that permit them to assess portfolio construction and risk and performance attribution characteristics continuously, as well as to transmit new information and research conclusions rapidly around the world. Additionally, in its deliberations, the Board considered Fidelity's trading, risk management, compliance, and technology and operations capabilities and resources, which are integral parts of the investment management process.
Administrative Services. The Board considered (i) the nature, extent, quality, and cost of advisory and administrative services performed by the Investment Advisers and their affiliates under the Advisory Contracts and under separate agreements covering transfer agency and pricing and bookkeeping services for the fund; (ii) the nature and extent of Fidelity's supervision of third party service providers, principally custodians, subcustodians, and pricing vendors; and (iii) the resources devoted by Fidelity to, and the record of compliance with, the fund's compliance policies and procedures. The Board also reviewed the allocation of fund brokerage, including allocations to brokers affiliated with the Investment Advisers, the use of brokerage commissions to pay fund expenses, and the use of "soft" commission dollars to pay for research services. The Board also considered the fund's securities lending activities and any payments made to Fidelity relating to securities lending under a separate agreement.
Investment Performance. The Board reviewed the fund's absolute investment performance, as well as the fund's relative investment performance and noted that the fund is not publicly offered as a stand-alone investment product. In this regard, the Board noted that the fund is designed to offer an investment option for other investment companies, 529 plans, and collective investment trusts managed by Fidelity and ultimately to enhance the performance of those investment companies, 529 plans, and collective investment trusts.
Based on its review, the Board concluded that the nature, extent, and quality of services provided to the fund under the Advisory Contracts should continue to benefit the shareholders of the fund.
Competitiveness of Management Fee and Total Expense Ratio. The Board considered that the fund does not pay FMR a management fee for investment advisory services, but that FMR receives fees for providing services to funds that invest in the fund. The Board noted that FMR or an affiliate undertakes to pay all operating expenses of the fund, except transfer agent fees, 12b-1 fees, Independent Trustee fees and expenses, custodian fees and expenses, proxy and shareholder meeting expenses, interest, taxes, and extraordinary expenses (such as litigation expenses). The Board further noted that the fund pays its non-operating expenses, including brokerage commissions and fees and expenses associated with the fund's securities lending program, if applicable.
The Board further considered that FMR has contractually agreed to reimburse the fund to the extent that total operating expenses, with certain exceptions, as a percentage of its average net assets, exceed 0.013% through February 28, 2027.
Based on its review, the Board considered that the fund does not pay a management fee and concluded that the total expense ratio of the fund was reasonable in light of the services that the fund and its shareholders receive and the other factors considered.
Costs of the Services and Profitability. The Board considered the level of Fidelity's profits in respect of all the Fidelity funds.
A public accounting firm has been engaged annually by the Board as part of the Board's assessment of Fidelity's profitability analysis. The engagement includes the review and assessment of the methodologies used by Fidelity in determining the revenues and expenses attributable to Fidelity's fund business, and completion of agreed-upon procedures in respect of the mathematical accuracy of certain fund profitability information and its conformity to established allocation methodologies. After considering the reports issued under the engagement and information provided by Fidelity, the Board concluded that while other allocation methods may also be reasonable, Fidelity's profitability methodologies are reasonable in all material respects.
The Board also reviewed Fidelity's non-fund businesses and potential indirect benefits such businesses may have received as a result of their association with Fidelity's fund business (i.e., fall-out benefits) as well as cases where Fidelity's affiliates may benefit from the funds' business. The Board considered areas where potential indirect benefits to the Fidelity funds from their relationships with Fidelity may exist. The Board's consideration of these matters was informed by the findings of a joint ad hoc committee created by it and the boards of other Fidelity funds to evaluate potential fall-out benefits.
The Board concluded that the costs of the services provided by and the profits realized by Fidelity in connection with the operation of the fund were not relevant to the renewal of the Advisory Contracts because the fund pays no advisory fees and FMR bears all expenses of the fund with certain exceptions.
Economies of Scale. The Board concluded that because the fund pays no advisory fees and FMR bears all expenses of the fund with certain exceptions, the realization of economies of scale was not a material factor in the Board's decision to renew the fund's Advisory Contracts.
Additional Information Requested by the Board. In order to develop fully the factual basis for consideration of the Fidelity funds' advisory contracts, the Board requested and received additional information on certain topics, including but not limited to: (i) fund flow and performance trends, in particular the underperformance of certain funds and strategies, and Fidelity's long-term strategies for certain funds; (ii) the operation of performance fees and the rationale for implementing performance fees on certain categories of funds but not others; (iii) Fidelity's pricing philosophy compared to competitors; (iv) fund profitability methodology and data; (v) evaluation of competitive fund data and peer group classifications and fee and expense comparisons; (vi) the management fee and expense structures for different funds and classes and information about the differences between various fee and expense structures; (vii) the variable management fee implemented for certain funds effective March 1, 2024; and (viii) information regarding other accounts managed by Fidelity and the funds' sub-advisory arrangements.
Conclusion. Based on its evaluation of all of the conclusions noted above, and after considering all factors it believed relevant, the Board, including the Independent Trustees, concluded that the advisory and sub-advisory fee arrangements are fair and reasonable in light of all of the surrounding circumstances and that the fund's Advisory Contracts should be renewed through May 31, 2025.
1.9906198.101
SSI-ANN-1224
Fidelity® Infrastructure Fund
Annual Report
October 31, 2024
Contents
To view a fund's proxy voting guidelines and proxy voting record for the 12-month period ended June 30, visit http://www.fidelity.com/proxyvotingresults or visit the Securities and Exchange Commission's (SEC) web site at http://www.sec.gov.
You may also call 1-800-544-8544 to request a free copy of the proxy voting guidelines.
Standard & Poor's, S&P and S&P 500 are registered service marks of The McGraw-Hill Companies, Inc. and have been licensed for use by Fidelity Distributors Corporation.
Other third-party marks appearing herein are the property of their respective owners.
All other marks appearing herein are registered or unregistered trademarks or service marks of FMR LLC or an affiliated company. © 2024 FMR LLC. All rights reserved.
This report and the financial statements contained herein are submitted for the general information of the shareholders of the Fund. This report is not authorized for distribution to prospective investors in the Fund unless preceded or accompanied by an effective prospectus.
A fund files its complete schedule of portfolio holdings with the SEC for the first and third quarters of each fiscal year on Form N-PORT. Forms N-PORT are available on the SEC's web site at http://www.sec.gov. A fund's Forms N-PORT may be reviewed and copied at the SEC's Public Reference Room in Washington, DC. Information regarding the operation of the SEC's Public Reference Room may be obtained by calling 1-800-SEC-0330.
For a complete list of a fund's portfolio holdings, view the most recent holdings listing, semiannual report, or annual report on Fidelity's web site at http://www.fidelity.com, http://www.institutional.fidelity.com, or http://www.401k.com, as applicable.
NOT FDIC INSURED •MAY LOSE VALUE •NO BANK GUARANTEE
Neither the Fund nor Fidelity Distributors Corporation is a bank.
Item 7: Financial Statements and Financial Highlights for Open-End Management Investment Companies (Annual Report)
Fidelity® Infrastructure Fund
Schedule of Investments October 31, 2024
Showing Percentage of Net Assets
| Common Stocks - 95.5% |
| | | Shares | Value ($) |
| COMMUNICATION SERVICES - 6.5% | | | |
| Diversified Telecommunication Services - 3.9% | | | |
| AT&T, Inc. | | 21,800 | 491,372 |
| Cellnex Telecom SA (a) | | 26,538 | 972,808 |
| Helios Towers PLC (b) | | 236,662 | 324,694 |
| | | | 1,788,874 |
| Wireless Telecommunication Services - 2.6% | | | |
| T-Mobile U.S., Inc. | | 5,200 | 1,160,432 |
TOTAL COMMUNICATION SERVICES | | | 2,949,306 |
| ENERGY - 18.0% | | | |
| Oil, Gas & Consumable Fuels - 18.0% | | | |
| Cheniere Energy, Inc. | | 11,402 | 2,182,115 |
| Energy Transfer LP | | 12,600 | 207,648 |
| Kinder Morgan, Inc. | | 31,500 | 772,065 |
| ONEOK, Inc. | | 4,700 | 455,336 |
| South Bow Corp. | | 8,000 | 199,777 |
| Targa Resources Corp. | | 11,709 | 1,954,935 |
| The Williams Companies, Inc. | | 44,637 | 2,337,640 |
| | | | 8,109,516 |
| INDUSTRIALS - 26.6% | | | |
| Commercial Services & Supplies - 7.1% | | | |
| GFL Environmental, Inc. | | 29,525 | 1,234,145 |
| Republic Services, Inc. | | 4,880 | 966,240 |
| Waste Connections, Inc. (United States) | | 5,658 | 1,000,052 |
| | | | 3,200,437 |
| Construction & Engineering - 2.2% | | | |
| Ferrovial SE | | 12,464 | 500,009 |
| Quanta Services, Inc. | | 1,700 | 512,771 |
| | | | 1,012,780 |
| Electrical Equipment - 1.8% | | | |
| Eaton Corp. PLC | | 2,500 | 828,950 |
| Ground Transportation - 5.3% | | | |
| Canadian Pacific Kansas City Ltd. | | 4,894 | 377,621 |
| CSX Corp. | | 13,679 | 460,162 |
| Norfolk Southern Corp. | | 3,600 | 901,548 |
| Union Pacific Corp. | | 2,860 | 663,720 |
| | | | 2,403,051 |
| Transportation Infrastructure - 10.2% | | | |
| Aena SME SA (a) | | 13,399 | 2,958,674 |
| Beijing Capital International Airport Co. Ltd. (H Shares) (b) | | 1,050,000 | 381,633 |
| Grupo Aeroportuario del Pacifico S.A.B. de CV sponsored ADR | | 3,500 | 609,315 |
| Grupo Aeroportuario Norte S.A.B. de CV ADR | | 9,558 | 640,864 |
| | | | 4,590,486 |
TOTAL INDUSTRIALS | | | 12,035,704 |
| INFORMATION TECHNOLOGY - 3.8% | | | |
| Communications Equipment - 1.0% | | | |
| Lumentum Holdings, Inc. (b) | | 7,000 | 447,090 |
| Electronic Equipment, Instruments & Components - 0.8% | | | |
| Coherent Corp. (b) | | 3,700 | 342,028 |
| Semiconductors & Semiconductor Equipment - 2.0% | | | |
| Advanced Micro Devices, Inc. (b) | | 2,500 | 360,175 |
| Broadcom, Inc. | | 2,500 | 424,425 |
| Marvell Technology, Inc. | | 1,500 | 120,165 |
| | | | 904,765 |
TOTAL INFORMATION TECHNOLOGY | | | 1,693,883 |
| REAL ESTATE - 11.2% | | | |
| Equity Real Estate Investment Trusts (REITs) - 11.2% | | | |
| American Tower Corp. | | 4,477 | 956,019 |
| Equinix, Inc. | | 1,181 | 1,072,442 |
| Prologis, Inc. | | 3,505 | 395,855 |
| Segro PLC | | 42,151 | 426,769 |
| Ventas, Inc. | | 16,200 | 1,060,938 |
| Welltower, Inc. | | 8,500 | 1,146,480 |
| | | | 5,058,503 |
| UTILITIES - 29.4% | | | |
| Electric Utilities - 19.0% | | | |
| Constellation Energy Corp. | | 4,670 | 1,228,023 |
| Duke Energy Corp. | | 1,900 | 219,013 |
| Entergy Corp. | | 3,700 | 572,686 |
| NextEra Energy, Inc. | | 33,645 | 2,666,366 |
| PG&E Corp. | | 45,300 | 915,966 |
| Southern Co. | | 30,600 | 2,785,518 |
| SSE PLC | | 9,100 | 206,636 |
| | | | 8,594,208 |
| Independent Power and Renewable Electricity Producers - 1.2% | | | |
| Vistra Corp. | | 4,300 | 537,328 |
| Multi-Utilities - 9.2% | | | |
| National Grid PLC | | 131,704 | 1,653,695 |
| Public Service Enterprise Group, Inc. | | 6,000 | 536,460 |
| Sempra | | 23,700 | 1,975,869 |
| | | | 4,166,024 |
TOTAL UTILITIES | | | 13,297,560 |
| TOTAL COMMON STOCKS (Cost $32,373,144) | | | 43,144,472 |
| | | | |
| Money Market Funds - 4.4% |
| | | Shares | Value ($) |
Fidelity Cash Central Fund 4.87% (c) (Cost $1,962,511) | | 1,962,118 | 1,962,511 |
| | | | |
| TOTAL INVESTMENT IN SECURITIES - 99.9% (Cost $34,335,655) | 45,106,983 |
NET OTHER ASSETS (LIABILITIES) - 0.1% | 60,284 |
| NET ASSETS - 100.0% | 45,167,267 |
| | |
Legend
| (a) | Security exempt from registration under Rule 144A of the Securities Act of 1933. These securities may be resold in transactions exempt from registration, normally to qualified institutional buyers. At the end of the period, the value of these securities amounted to $3,931,482 or 8.7% of net assets. |
| (c) | Affiliated fund that is generally available only to investment companies and other accounts managed by Fidelity Investments. The rate quoted is the annualized seven-day yield of the fund at period end. A complete unaudited listing of the fund's holdings as of its most recent quarter end is available upon request. In addition, each Fidelity Central Fund's financial statements, which are not covered by the Fund's Report of Independent Registered Public Accounting Firm, are available on the SEC's website or upon request. |
Affiliated Central Funds
Fiscal year to date information regarding the Fund's investments in Fidelity Central Funds, including the ownership percentage, is presented below.
| Affiliate | Value, beginning of period ($) | Purchases ($) | Sales Proceeds ($) | Dividend Income ($) | Realized Gain (loss) ($) | Change in Unrealized appreciation (depreciation) ($) | Value, end of period ($) | % ownership, end of period |
| Fidelity Cash Central Fund 4.87% | 1,745,398 | 16,416,200 | 16,199,072 | 69,914 | (15) | - | 1,962,511 | 0.0% |
| Fidelity Securities Lending Cash Central Fund 4.87% | - | 15,885,314 | 15,885,314 | 1,927 | - | - | - | 0.0% |
| Total | 1,745,398 | 32,301,514 | 32,084,386 | 71,841 | (15) | - | 1,962,511 | |
| | | | | | | | | |
Amounts in the dividend income column in the above table include any capital gain distributions from underlying funds, which are presented in the corresponding line item in the Statement of Operations, if applicable.
Amounts in the dividend income column for Fidelity Securities Lending Cash Central Fund represents the income earned on investing cash collateral, less rebates paid to borrowers and any lending agent fees associated with the loan, plus any premium payments received for lending certain types of securities.
Amounts included in the purchases and sales proceeds columns may include in-kind transactions, if applicable.
Investment Valuation
The following is a summary of the inputs used, as of October 31, 2024, involving the Fund's assets and liabilities carried at fair value. The inputs or methodology used for valuing securities may not be an indication of the risk associated with investing in those securities. For more information on valuation inputs, and their aggregation into the levels used below, please refer to the Investment Valuation section in the accompanying Notes to Financial Statements.
| Valuation Inputs at Reporting Date: |
| Description | Total ($) | Level 1 ($) | Level 2 ($) | Level 3 ($) |
Investments in Securities: | | | | |
|
| Equities: | | | | |
Communication Services | 2,949,306 | 2,949,306 | - | - |
Energy | 8,109,516 | 8,109,516 | - | - |
Industrials | 12,035,704 | 11,654,071 | 381,633 | - |
Information Technology | 1,693,883 | 1,693,883 | - | - |
Real Estate | 5,058,503 | 5,058,503 | - | - |
Utilities | 13,297,560 | 11,643,865 | 1,653,695 | - |
|
| Money Market Funds | 1,962,511 | 1,962,511 | - | - |
| Total Investments in Securities: | 45,106,983 | 43,071,655 | 2,035,328 | - |
Financial Statements
| Statement of Assets and Liabilities |
As of October 31, 2024 |
| Assets | | | | |
| Investment in securities, at value - See accompanying schedule: | | | | |
Unaffiliated issuers (cost $32,373,144) | $ | 43,144,472 | | |
Fidelity Central Funds (cost $1,962,511) | | 1,962,511 | | |
| | | | | |
| | | | | |
| Total Investment in Securities (cost $34,335,655) | | | $ | 45,106,983 |
| Receivable for investments sold | | | | 22,051 |
| Receivable for fund shares sold | | | | 62,713 |
| Dividends receivable | | | | 42,852 |
| Distributions receivable from Fidelity Central Funds | | | | 8,398 |
| Prepaid expenses | | | | 50 |
| Receivable from investment adviser for expense reductions | | | | 13,998 |
Total assets | | | | 45,257,045 |
| Liabilities | | | | |
| Payable for investments purchased | $ | 4,163 | | |
| Payable for fund shares redeemed | | 9,244 | | |
| Accrued management fee | | 31,230 | | |
| Audit fee payable | | 41,539 | | |
| Other payables and accrued expenses | | 3,602 | | |
| Total liabilities | | | | 89,778 |
| Net Assets | | | $ | 45,167,267 |
| Net Assets consist of: | | | | |
| Paid in capital | | | $ | 39,283,583 |
| Total accumulated earnings (loss) | | | | 5,883,684 |
| Net Assets | | | $ | 45,167,267 |
Net Asset Value, offering price and redemption price per share ($45,167,267 ÷ 3,267,214 shares) | | | $ | 13.82 |
| Statement of Operations |
| Year ended October 31, 2024 |
| Investment Income | | | | |
| Dividends | | | $ | 1,104,363 |
| Income from Fidelity Central Funds (including $1,927 from security lending) | | | | 71,841 |
| Income before foreign taxes withheld | | | $ | 1,176,204 |
| Less foreign taxes withheld | | | | (43,774) |
| Total income | | | | 1,132,430 |
| Expenses | | | | |
| Management fee | $ | 333,122 | | |
| Transfer agent fees | | 30,060 | | |
| Accounting fees | | 5,123 | | |
| Custodian fees and expenses | | 7,181 | | |
| Independent trustees' fees and expenses | | 197 | | |
| Registration fees | | 23,094 | | |
| Audit fees | | 50,149 | | |
| Legal | | 32 | | |
| Miscellaneous | | 1,840 | | |
| Total expenses before reductions | | 450,798 | | |
| Expense reductions | | (42,354) | | |
| Total expenses after reductions | | | | 408,444 |
| Net Investment income (loss) | | | | 723,986 |
| Realized and Unrealized Gain (Loss) | | | | |
| Net realized gain (loss) on: | | | | |
| Investment Securities: | | | | |
| Unaffiliated issuers | | 1,229,322 | | |
| Fidelity Central Funds | | (15) | | |
| Foreign currency transactions | | 1,766 | | |
| Total net realized gain (loss) | | | | 1,231,073 |
| Change in net unrealized appreciation (depreciation) on: | | | | |
| Investment Securities: | | | | |
| Unaffiliated issuers | | 9,684,630 | | |
| Assets and liabilities in foreign currencies | | 1,095 | | |
| Total change in net unrealized appreciation (depreciation) | | | | 9,685,725 |
| Net gain (loss) | | | | 10,916,798 |
| Net increase (decrease) in net assets resulting from operations | | | $ | 11,640,784 |
| Statement of Changes in Net Assets |
| |
| | Year ended October 31, 2024 | | Year ended October 31, 2023 |
| Increase (Decrease) in Net Assets | | | | |
| Operations | | | | |
| Net investment income (loss) | $ | 723,986 | $ | 889,062 |
| Net realized gain (loss) | | 1,231,073 | | (2,463,849) |
| Change in net unrealized appreciation (depreciation) | | 9,685,725 | | (50,983) |
| Net increase (decrease) in net assets resulting from operations | | 11,640,784 | | (1,625,770) |
| Distributions to shareholders | | (730,570) | | (954,622) |
| | | | | |
| Share transactions | | | | |
| Proceeds from sales of shares | | 6,385,371 | | 20,419,990 |
| Reinvestment of distributions | | 680,045 | | 885,226 |
| Cost of shares redeemed | | (14,732,198) | | (14,157,019) |
| | | | | |
Net increase (decrease) in net assets resulting from share transactions | | (7,666,782) | | 7,148,197 |
| Total increase (decrease) in net assets | | 3,243,432 | | 4,567,805 |
| | | | | |
| Net Assets | | | | |
| Beginning of period | | 41,923,835 | | 37,356,030 |
| End of period | $ | 45,167,267 | $ | 41,923,835 |
| | | | | |
| Other Information | | | | |
| Shares | | | | |
| Sold | | 498,985 | | 1,707,795 |
| Issued in reinvestment of distributions | | 54,326 | | 75,822 |
| Redeemed | | (1,195,991) | | (1,203,495) |
| Net increase (decrease) | | (642,680) | | 580,122 |
| | | | | |
Financial Highlights
Fidelity® Infrastructure Fund |
| |
| Years ended October 31, | | 2024 | | 2023 | | 2022 | | 2021 | | 2020 A |
Selected Per-Share Data | | | | | | | | | | |
| Net asset value, beginning of period | $ | 10.72 | $ | 11.22 | $ | 12.63 | $ | 10.44 | $ | 10.00 |
| Income from Investment Operations | | | | | | | | | | |
Net investment income (loss) B,C | | .21 | | .22 | | .13 D | | .07 | | .17 |
| Net realized and unrealized gain (loss) | | 3.10 | | (.47) | | (1.38) | | 2.21 | | .31 |
| Total from investment operations | | 3.31 | | (.25) | | (1.25) | | 2.28 | | .48 |
| Distributions from net investment income | | (.21) | | (.25) | | (.16) | | (.09) | | (.04) |
| Total distributions | | (.21) | | (.25) | | (.16) | | (.09) | | (.04) |
| Net asset value, end of period | $ | 13.82 | $ | 10.72 | $ | 11.22 | $ | 12.63 | $ | 10.44 |
Total Return E,F | | | | (2.43)% | | (9.95)% | | 21.96% | | 4.79% |
Ratios to Average Net Assets C,G,H | | | | | | | | | | |
| Expenses before reductions | | 1.05% | | 1.15% | | 1.13% | | 1.24% | | 2.24% I |
| Expenses net of fee waivers, if any | | | | .94% | | .98% | | 1.00% | | 1.00% I |
| Expenses net of all reductions | | .95% | | .94% | | .98% | | 1.00% | | .98% I |
| Net investment income (loss) | | 1.68% | | 1.88% | | 1.08% D | | .61% | | 1.67% I |
| Supplemental Data | | | | | | | | | | |
| Net assets, end of period (000 omitted) | $ | 45,167 | $ | 41,924 | $ | 37,356 | $ | 46,046 | $ | 12,762 |
Portfolio turnover rate J | | | | 55% | | 91% | | 46% | | 50% I |
AFor the period November 5, 2019 (commencement of operations) through October 31, 2020.
BCalculated based on average shares outstanding during the period.
CNet investment income (loss) is affected by the timing of the declaration of dividends by any underlying mutual funds or exchange-traded funds (ETFs). Net investment income (loss) of any mutual funds or ETFs is not included in the Fund's net investment income (loss) ratio.
DNet investment income per share reflects one or more large, non-recurring dividend(s) which amounted to $.03 per share. Excluding such non-recurring dividend(s), the ratio of net investment income (loss) to average net assets would have been .86%.
ETotal returns for periods of less than one year are not annualized.
FTotal returns would have been lower if certain expenses had not been reduced during the applicable periods shown.
GFees and expenses of any underlying mutual funds or exchange-traded funds (ETFs) are not included in the Fund's expense ratio. The Fund indirectly bears its proportionate share of these expenses. For additional expense information related to investments in Fidelity Central Funds, please refer to the "Investments in Fidelity Central Funds" note found in the Notes to Financial Statements section of the most recent Annual or Semi-Annual report.
HExpense ratios reflect operating expenses of the class. Expenses before reductions do not reflect amounts reimbursed, waived, or reduced through arrangements with the investment adviser, brokerage services, or other offset arrangements, if applicable, and do not represent the amount paid by the class during periods when reimbursements, waivers or reductions occur.
IAnnualized.
JAmount does not include the portfolio activity of any underlying mutual funds or exchange-traded funds (ETFs).
Notes to Financial Statements
For the period ended October 31, 2024
1. Organization.
Fidelity Infrastructure Fund (the Fund) is a non-diversified fund of Fidelity Investment Trust (the Trust) and is authorized to issue an unlimited number of shares. Share transactions on the Statement of Changes in Net Assets may contain exchanges between affiliated funds. The Trust is registered under the Investment Company Act of 1940, as amended (the 1940 Act), as an open-end management investment company organized as a Massachusetts business trust.
2. Investments in Fidelity Central Funds.
Funds may invest in Fidelity Central Funds, which are open-end investment companies generally available only to other investment companies and accounts managed by the investment adviser and its affiliates. The Schedule of Investments lists any Fidelity Central Funds held as an investment as of period end, but does not include the underlying holdings of each Fidelity Central Fund. An investing fund indirectly bears its proportionate share of the expenses of the underlying Fidelity Central Funds.
Based on its investment objective, each Fidelity Central Fund may invest or participate in various investment vehicles or strategies that are similar to those of the investing fund. These strategies are consistent with the investment objectives of the investing fund and may involve certain economic risks which may cause a decline in value of each of the Fidelity Central Funds and thus a decline in the value of the investing fund.
| Fidelity Central Fund | Investment Manager | Investment Objective | Investment Practices | Expense RatioA |
| Fidelity Money Market Central Funds | Fidelity Management & Research Company LLC (FMR) | Each fund seeks to obtain a high level of current income consistent with the preservation of capital and liquidity. | Short-term Investments | Less than .005% |
A Expenses expressed as a percentage of average net assets and are as of each underlying Central Fund's most recent annual or semi-annual shareholder report.
A complete unaudited list of holdings for each Fidelity Central Fund is available upon request or at the Securities and Exchange Commission website at www.sec.gov. In addition, the financial statements of the Fidelity Central Funds which contain the significant accounting policies (including investment valuation policies) of those funds, and are not covered by the Report of Independent Registered Public Accounting Firm, are available on the Securities and Exchange Commission website or upon request.
3. Significant Accounting Policies.
The Fund is an investment company and applies the accounting and reporting guidance of the Financial Accounting Standards Board (FASB) Accounting Standards Codification Topic 946 Financial Services - Investment Companies. The financial statements have been prepared in conformity with accounting principles generally accepted in the United States of America (GAAP), which require management to make certain estimates and assumptions at the date of the financial statements. Actual results could differ from those estimates. Subsequent events, if any, through the date that the financial statements were issued have been evaluated in the preparation of the financial statements. The Fund's Schedule of Investments lists any underlying mutual funds or exchange-traded funds (ETFs) but does not include the underlying holdings of these funds. The following summarizes the significant accounting policies of the Fund:
Investment Valuation. Investments are valued as of 4:00 p.m. Eastern time on the last calendar day of the period. The Board of Trustees (the Board) has designated the Fund's investment adviser as the valuation designee responsible for the fair valuation function and performing fair value determinations as needed. The investment adviser has established a Fair Value Committee (the Committee) to carry out the day-to-day fair valuation responsibilities and has adopted policies and procedures to govern the fair valuation process and the activities of the Committee. In accordance with these fair valuation policies and procedures, which have been approved by the Board, the Fund attempts to obtain prices from one or more third party pricing services or brokers to value its investments. When current market prices, quotations or currency exchange rates are not readily available or reliable, investments will be fair valued in good faith by the Committee, in accordance with the policies and procedures. Factors used in determining fair value vary by investment type and may include market or investment specific events, transaction data, estimated cash flows, and market observations of comparable investments. The frequency that the fair valuation procedures are used cannot be predicted and they may be utilized to a significant extent. The Committee manages the Fund's fair valuation practices and maintains the fair valuation policies and procedures. The Fund's investment adviser reports to the Board information regarding the fair valuation process and related material matters.
The Fund categorizes the inputs to valuation techniques used to value its investments into a disclosure hierarchy consisting of three levels as shown below:
Level 1 - unadjusted quoted prices in active markets for identical investments
Level 2 - other significant observable inputs (including quoted prices for similar investments, interest rates, prepayment speeds, etc.)
Level 3 - unobservable inputs (including the Fund's own assumptions based on the best information available)
Valuation techniques used to value the Fund's investments by major category are as follows:
Equity securities, including restricted securities, for which market quotations are readily available, are valued at the last reported sale price or official closing price as reported by a third party pricing service on the primary market or exchange on which they are traded and are categorized as Level 1 in the hierarchy. In the event there were no sales during the day or closing prices are not available, securities are valued at the last quoted bid price or may be valued using the last available price and are generally categorized as Level 2 in the hierarchy. For foreign equity securities, when market or security specific events arise, comparisons to the valuation of American Depositary Receipts (ADRs), futures contracts, Exchange-Traded Funds (ETFs) and certain indexes as well as quoted prices for similar securities may be used and would be categorized as Level 2 in the hierarchy. For equity securities, including restricted securities, where observable inputs are limited, assumptions about market activity and risk are used and these securities may be categorized as Level 3 in the hierarchy.
Investments in open-end mutual funds, including the Fidelity Central Funds, are valued at their closing net asset value (NAV) each business day and are categorized as Level 1 in the hierarchy.
Changes in valuation techniques may result in transfers in or out of an assigned level within the disclosure hierarchy. The aggregate value of investments by input level as of October 31, 2024 is included at the end of the Fund's Schedule of Investments.
Foreign Currency. Certain Funds may use foreign currency contracts to facilitate transactions in foreign-denominated securities. Gains and losses from these transactions may arise from changes in the value of the foreign currency or if the counterparties do not perform under the contracts' terms.
Foreign-denominated assets, including investment securities, and liabilities are translated into U.S. dollars at the exchange rates at period end. Purchases and sales of investment securities, income and dividends received, and expenses denominated in foreign currencies are translated into U.S. dollars at the exchange rate in effect on the transaction date.
The effects of exchange rate fluctuations on investments are included with the net realized and unrealized gain (loss) on investment securities. Other foreign currency transactions resulting in realized and unrealized gain (loss) are disclosed separately.
Investment Transactions and Income. For financial reporting purposes, the Fund's investment holdings and NAV include trades executed through the end of the last business day of the period. The NAV per share for processing shareholder transactions is calculated as of the close of business of the New York Stock Exchange (NYSE), normally 4:00 p.m. Eastern time and includes trades executed through the end of the prior business day. Gains and losses on securities sold are determined on the basis of identified cost. Commissions paid to certain brokers with whom the investment adviser, or its affiliates, places trades on behalf of a fund include an amount in addition to trade execution, which may be rebated back to a fund. Any such rebates are included in net realized gain (loss) on investments in the Statement of Operations. Dividend income is recorded on the ex-dividend date, except for certain dividends from foreign securities where the ex-dividend date may have passed, which are recorded as soon as the Fund is informed of the ex-dividend date. Non-cash dividends included in dividend income, if any, are recorded at the fair market value of the securities received. Income and capital gain distributions from Fidelity Central Funds, if any, are recorded on the ex-dividend date. Certain distributions received by the Fund represent a return of capital or capital gain. The Fund determines the components of these distributions subsequent to the ex-dividend date, based upon receipt of tax filings or other correspondence relating to the underlying investment. These distributions are recorded as a reduction of cost of investments and/or as a realized gain. Investment income is recorded net of foreign taxes withheld where recovery of such taxes is uncertain. Funds may file withholding tax reclaims in certain jurisdictions to recover a portion of amounts previously withheld. Any withholding tax reclaims income is included in the Statement of Operations in foreign taxes withheld. Any receivables for withholding tax reclaims are included in the Statement of Assets and Liabilities in dividends receivable.
Expenses. Expenses directly attributable to a fund are charged to that fund. Expenses attributable to more than one fund are allocated among the respective funds on the basis of relative net assets or other appropriate methods. Expenses included in the accompanying financial statements reflect the expenses of that fund and do not include any expenses associated with any underlying mutual funds or exchange-traded funds. Although not included in a fund's expenses, a fund indirectly bears its proportionate share of these expenses through the net asset value of each underlying mutual fund or exchange-traded fund. Expense estimates are accrued in the period to which they relate and adjustments are made when actual amounts are known.
Income Tax Information and Distributions to Shareholders. Each year, the Fund intends to qualify as a regulated investment company under Subchapter M of the Internal Revenue Code, including distributing substantially all of its taxable income and realized gains. As a result, no provision for U.S. Federal income taxes is required. As of October 31, 2024, the Fund did not have any unrecognized tax benefits in the financial statements; nor is the Fund aware of any tax positions for which it is reasonably possible that the total amounts of unrecognized tax benefits will significantly change in the next twelve months. The Fund files a U.S. federal tax return, in addition to state and local tax returns as required. The Fund's federal income tax returns are subject to examination by the Internal Revenue Service (IRS) for a period of three fiscal years after they are filed. State and local tax returns may be subject to examination for an additional fiscal year depending on the jurisdiction. Foreign taxes are provided for based on the Fund's understanding of the tax rules and rates that exist in the foreign markets in which it invests.
Distributions are declared and recorded on the ex-dividend date. Income and capital gain distributions are determined in accordance with income tax regulations, which may differ from GAAP.
Capital accounts within the financial statements are adjusted for permanent book-tax differences. These adjustments have no impact on net assets or the results of operations. Capital accounts are not adjusted for temporary book-tax differences which will reverse in a subsequent period.
Book-tax differences are primarily due to foreign currency transactions, passive foreign investment companies (PFIC), partnerships, capital loss carryforwards and losses deferred due to wash sales.
As of period end, the cost and unrealized appreciation (depreciation) in securities, and derivatives if applicable, for federal income tax purposes were as follows:
| Gross unrealized appreciation | $11,042,132 |
| Gross unrealized depreciation | (298,149) |
| Net unrealized appreciation (depreciation) | $10,743,983 |
| Tax Cost | $34,363,000 |
The tax-based components of distributable earnings as of period end were as follows:
| Undistributed ordinary income | $35,121 |
| Capital loss carryforward | $(4,895,178) |
| Net unrealized appreciation (depreciation) on securities and other investments | $10,743,740 |
Capital loss carryforwards are only available to offset future capital gains of the Fund to the extent provided by regulations and may be limited. The capital loss carryforward information presented below, including any applicable limitation, is estimated as of fiscal period end and is subject to adjustment.
Short-term | $(4,895,178) |
Long-term | - |
| Total capital loss carryforward | $(4,895,178) |
The tax character of distributions paid was as follows:
| | October 31, 2024 | October 31, 2023 |
| Ordinary Income | $730,570 | $954,622 |
Restricted Securities (including Private Placements). Funds may invest in securities that are subject to legal or contractual restrictions on resale. These securities generally may be resold in transactions exempt from registration or to the public if the securities are registered. Disposal of these securities may involve time-consuming negotiations and expense, and prompt sale at an acceptable price may be difficult. Information regarding restricted securities held at period end is included at the end of the Schedule of Investments, if applicable.
New Accounting Pronouncement. In November 2023, the FASB issued Accounting Standards Update (ASU) 2023-07 Segment Reporting (Topic 280): Improvements to Reportable Segment Disclosures. Effective for fiscal years beginning after December 15, 2023 and interim periods within fiscal years beginning after December 15, 2024, the amendments enhance required disclosures of segment information for public entities on an annual and interim basis. The ASU allows for early adoption with updates applied retrospectively. Management is currently evaluating the impact of the ASU but does not expect this guidance to materially impact the financial statements.
4. Purchases and Sales of Investments.
Purchases and sales of securities, other than short-term securities and in-kind transactions, as applicable, are noted in the table below.
| | Purchases ($) | Sales ($) |
| Fidelity Infrastructure Fund | 31,024,433 | 39,373,540 |
5. Fees and Other Transactions with Affiliates.
Management Fee. Fidelity Management & Research Company LLC (the investment adviser) and its affiliates provide the Fund with investment management related services for which the Fund pays a monthly management fee.
Effective March 1, 2024, the Fund's management contract was amended to incorporate administrative services previously covered under separate services agreements (Transfer Agent and Accounting agreements). Any reference to "class" in this note shall mean "the Fund" as the Fund currently offers only one class of shares. The amended contract incorporates a management fee rate that may vary by class. The investment adviser or an affiliate pays certain expenses of managing and operating the Fund out of each class's management fee. Each class of the Fund pays a management fee to the investment adviser. The management fee is calculated and paid to the investment adviser every month. When determining a class's management fee, a mandate rate is calculated based on the monthly average net assets of a group of funds advised by FMR within a designated asset class. A discount rate is subtracted from the mandate rate once the Fund's monthly average net assets reach a certain level. The mandate rate and discount rate may vary by class. The annual management fee rate for a class of shares of the Fund is the lesser of (1) the class's mandate rate reduced by the class's discount rate (if applicable) or (2) the amount set forth in the following table.| | Maximum Management Fee Rate % |
| Fidelity Infrastructure Fund | .87 |
One-twelfth of the management fee rate for a class is applied to the average net assets of the class for the month, giving a dollar amount which is the management fee for the class for that month. A different management fee rate may be applicable to each class of the Fund. The difference between classes is the result of separate arrangements for class-level services and/or waivers of certain expenses. It is not the result of any difference in advisory or custodial fees or other expenses related to the management of the Fund's assets, which do not vary by class. For the portion of the reporting period on or after March 1, 2024, the total annualized management fee rates were as follows:
| | Total Management Fee Rate % |
| Fidelity Infrastructure Fund | .83 |
Prior to March 1, 2024, the management fee was the sum of an individual fund fee rate that was based on an annual rate of .45% of the Fund's average net assets and an annualized group fee rate that averaged .22% during the period. The group fee rate was based upon the monthly average net assets of a group of registered investment companies with which the investment adviser has management contracts. The group fee rate decreased as assets under management increased and increased as assets under management decreased. For the portion of the reporting period prior to March 1, 2024, the total annualized management fee rate was .67%.
Effective March 1, 2024, the Fund's sub-advisory agreements with FMR Investment Management (UK) Limited, Fidelity Management & Research (Hong Kong) Limited, and Fidelity Management & Research (Japan) Limited were amended to provide that the investment adviser pays each sub-adviser monthly fees equal to 110% of the sub-adviser's costs for providing sub-advisory services.
Transfer Agent Fees. Fidelity Investments Institutional Operations Company LLC (FIIOC), an affiliate of the investment adviser, is the Fund's transfer, dividend disbursing and shareholder servicing agent. Effective March 1, 2024, each Fund's management contract was amended to incorporate transfer agent services and associated fees previously covered under a separate services agreement. FIIOC pays for typesetting, printing and mailing of shareholder reports, except proxy statements.
During the period December 1, 2023 through February 29, 2024, the transfer agent fees were a fixed annual rate of average net assets of .2000%.
Prior to December 1, 2023, FIIOC received account fees and asset-based fees that varied according to account size and type of account.
For the portion of the reporting period prior to March 1, 2024, the fees were equivalent to the annualized rate of .21% of average net assets.
Accounting Fees. Fidelity Service Company, Inc. (FSC), an affiliate of the investment adviser, maintains the Fund's accounting records. Effective March 1, 2024, the Fund's management contract was amended to incorporate accounting services and associated fees previously covered under a separate services agreement.
During the period December 1, 2023 through February 29, 2024, the accounting fees were a fixed annual rate of average net assets as follows:
| | % of Average Net Assets |
| Fidelity Infrastructure Fund | .0354 |
Prior to December 1, 2023, the accounting fee was based on the level of average net assets for each month. For the portion of the reporting period prior to March 1, 2024, the fees were equivalent to the following annualized rates:
| | % of Average Net Assets |
| Fidelity Infrastructure Fund | .04 |
Brokerage Commissions. A portion of portfolio transactions were placed with brokerage firms which are affiliates of the investment adviser. Brokerage commissions are included in net realized gain (loss) and change in net unrealized appreciation (depreciation) in the Statement of Operations. The commissions paid to these affiliated firms were as follows:
| | Amount ($) |
| Fidelity Infrastructure Fund | 546 |
Interfund Trades. Funds may purchase from or sell securities to other Fidelity Funds under procedures adopted by the Board. The procedures have been designed to ensure these interfund trades are executed in accordance with Rule 17a-7 of the 1940 Act. Any interfund trades are included within the respective purchases and sales amounts shown in the Purchases and Sales of Investments note. Interfund trades during the period are noted in the table below.
| | Purchases ($) | Sales ($) | Realized Gain (Loss)($) |
| Fidelity Infrastructure Fund | 1,143,979 | 1,686,230 | 150,956 |
6. Committed Line of Credit.
Certain Funds participate with other funds managed by the investment adviser or an affiliate in a $4.25 billion credit facility (the "line of credit") to be utilized for temporary or emergency purposes to fund shareholder redemptions or for other short-term liquidity purposes. The participating funds have agreed to pay commitment fees on their pro-rata portion of the line of credit, which are reflected in Miscellaneous expenses on the Statement of Operations, and are listed below. During the period, there were no borrowings on this line of credit.
| | Amount ($) |
| Fidelity Infrastructure Fund | 69 |
7. Security Lending.
Funds lend portfolio securities from time to time in order to earn additional income. Lending agents are used, including National Financial Services (NFS), an affiliate of the investment adviser. Pursuant to a securities lending agreement, NFS will receive a fee, which is capped at 9.9% of a fund's daily lending revenue, for its services as lending agent. A fund may lend securities to certain qualified borrowers, including NFS. On the settlement date of the loan, a fund receives collateral (in the form of U.S. Treasury obligations, letters of credit and/or cash) against the loaned securities and maintains collateral in an amount not less than 100% of the market value of the loaned securities during the period of the loan. The market value of the loaned securities is determined at the close of business of a fund and any additional required collateral is delivered to a fund on the next business day. A fund or borrower may terminate the loan at any time, and if the borrower defaults on its obligation to return the securities loaned because of insolvency or other reasons, a fund may apply collateral received from the borrower against the obligation. A fund may experience delays and costs in recovering the securities loaned. Any cash collateral received is invested in the Fidelity Securities Lending Cash Central Fund. Any loaned securities are identified as such in the Schedule of Investments, and the value of loaned securities and cash collateral at period end, as applicable, are presented in the Statement of Assets and Liabilities. Security lending income represents the income earned on investing cash collateral, less rebates paid to borrowers and any lending agent fees associated with the loan, plus any premium payments received for lending certain types of securities. Security lending income is presented in the Statement of Operations as a component of income from Fidelity Central Funds. Affiliated security lending activity, if any, was as follows:
| | Total Security Lending Fees Paid to NFS ($) | Security Lending Income From Securities Loaned to NFS ($) | Value of Securities Loaned to NFS at Period End ($) |
| Fidelity Infrastructure Fund | 205 | - | - |
8. Expense Reductions.
The investment adviser contractually agreed to reimburse the Fund to the extent annual operating expenses exceeded .95% of average net assets. This reimbursement will remain in place through February 28, 2026. Some expenses, for example the compensation of the independent Trustees, and certain miscellaneous expenses such as proxy and shareholder meeting expenses, are excluded from this reimbursement. During the period this reimbursement reduced the Fund's expenses by $40,226.
Through arrangements with the Fund's custodian, credits realized as a result of certain uninvested cash balances were used to reduce the Fund's expenses by $172.
In addition, during the period the investment adviser or an affiliate reimbursed and/or waived a portion of operating expenses in the amount of $1,956.
9. Other.
A fund's organizational documents provide former and current trustees and officers with a limited indemnification against liabilities arising in connection with the performance of their duties to the fund. In the normal course of business, a fund may also enter into contracts that provide general indemnifications. A fund's maximum exposure under these arrangements is unknown as this would be dependent on future claims that may be made against a fund. The risk of material loss from such claims is considered remote.
At the end of the period, the following mutual funds managed by the investment adviser or its affiliates were the owners of record of 10% or more of the total outstanding shares.
| | VIP FundsManager 60% Portfolio |
| Fidelity Infrastructure Fund | 15% |
Mutual funds managed by the investment adviser or its affiliates, in aggregate, were the owners of record of more than 20% of the total outstanding shares.
| Fund | % of shares held |
| Fidelity Infrastructure Fund | 32% |
10. Risk and Uncertainties.
Many factors affect a fund's performance. Developments that disrupt global economies and financial markets, such as pandemics, epidemics, outbreaks of infectious diseases, war, terrorism, and environmental disasters, may significantly affect a fund's investment performance. The effects of these developments to a fund will be impacted by the types of securities in which a fund invests, the financial condition, industry, economic sector, and geographic location of an issuer, and a fund's level of investment in the securities of that issuer. Significant concentrations in security types, issuers, industries, sectors, and geographic locations may magnify the factors that affect a fund's performance.
Report of Independent Registered Public Accounting Firm
To the Board of Trustees of Fidelity Investment Trust and Shareholders of Fidelity Infrastructure Fund
Opinion on the Financial Statements
We have audited the accompanying statement of assets and liabilities, including the schedule of investments, of Fidelity Infrastructure Fund (one of the funds constituting Fidelity Investment Trust, referred to hereafter as the "Fund") as of October 31, 2024, the related statement of operations for the year ended October 31, 2024, the statement of changes in net assets for each of the two years in the period ended October 31, 2024, including the related notes, and the financial highlights for each of the four years in the period ended October 31, 2024 and for the period November 5, 2019 (commencement of operations) through October 31, 2020 (collectively referred to as the "financial statements"). In our opinion, the financial statements present fairly, in all material respects, the financial position of the Fund as of October 31, 2024, the results of its operations for the year then ended, the changes in its net assets for each of the two years in the period ended October 31, 2024 and the financial highlights for each of the four years in the period ended October 31, 2024 and for the period November 5, 2019 (commencement of operations) through October 31, 2020 in conformity with accounting principles generally accepted in the United States of America.
Basis for Opinion
These financial statements are the responsibility of the Fund's management. Our responsibility is to express an opinion on the Fund's financial statements based on our audits. We are a public accounting firm registered with the Public Company Accounting Oversight Board (United States) (PCAOB) and are required to be independent with respect to the Fund in accordance with the U.S. federal securities laws and the applicable rules and regulations of the Securities and Exchange Commission and the PCAOB.
We conducted our audits of these financial statements in accordance with the standards of the PCAOB. Those standards require that we plan and perform the audit to obtain reasonable assurance about whether the financial statements are free of material misstatement, whether due to error or fraud.
Our audits included performing procedures to assess the risks of material misstatement of the financial statements, whether due to error or fraud, and performing procedures that respond to those risks. Such procedures included examining, on a test basis, evidence regarding the amounts and disclosures in the financial statements. Our audits also included evaluating the accounting principles used and significant estimates made by management, as well as evaluating the overall presentation of the financial statements. Our procedures included confirmation of securities owned as of October 31, 2024 by correspondence with the custodian and brokers; when replies were not received from brokers, we performed other auditing procedures. We believe that our audits provide a reasonable basis for our opinion.
/s/ PricewaterhouseCoopers LLP
Boston, Massachusetts
December 16, 2024
We have served as the auditor of one or more investment companies in the Fidelity group of funds since 1932.
Distributions
(Unaudited)
The dividend and capital gains distributions for the fund(s) are available on Fidelity.com or Institutional.Fidelity.com.
A total of 0.96% of the dividends distributed during the fiscal year was derived from interest on U.S. Government securities which is generally exempt from state income tax.
The fund designates $31,169 of distributions paid during the fiscal year ended 2024 as qualifying to be taxed as section 163(j) interest dividends.
The fund designates 63%,74%,74%, and 74% of the dividends distributed in December, April, July, and October, respectively during the fiscal year as qualifying for the dividends-received deduction for corporate shareholders.
The fund designates 100% of the dividends distributed during the fiscal year as amounts which may be taken into account as a dividend for the purposes of the maximum rate under section 1(h)(11) of the Internal Revenue Code.
The fund will notify shareholders in January 2025 of amounts for use in preparing 2024 income tax returns.
Item 8: Changes in and Disagreements with Accountants for Open-End Management Investment Companies
(Unaudited)
Note: This is not applicable for any fund included in this document.
Item 9: Proxy Disclosures for Open-End Management Investment Companies
(Unaudited)
| A special meeting of shareholders was held on July 16, 2024. The results of votes taken among shareholders on the proposal before them are reported below. Each vote reported represents one dollar of net asset value held on the record date for the meeting. |
| Proposal 1 |
| To elect a Board of Trustees. |
| | # of Votes | % of Votes |
| Bettina Doulton |
| Affirmative | 128,529,177,643.56 | 98.18 |
| Withheld | 2,378,037,364.30 | 1.82 |
| TOTAL | 130,907,215,007.85 | 100.00 |
| Robert A. Lawrence |
| Affirmative | 128,253,389,899.05 | 97.97 |
| Withheld | 2,653,825,108.81 | 2.03 |
| TOTAL | 130,907,215,007.85 | 100.00 |
| Vijay C. Advani |
| Affirmative | 128,531,418,228.19 | 98.19 |
| Withheld | 2,375,796,779.66 | 1.81 |
| TOTAL | 130,907,215,007.85 | 100.00 |
| Thomas P. Bostick |
| Affirmative | 128,495,261,591.41 | 98.16 |
| Withheld | 2,411,953,416.44 | 1.84 |
| TOTAL | 130,907,215,007.85 | 100.00 |
| Donald F. Donahue |
| Affirmative | 128,407,878,996.00 | 98.09 |
| Withheld | 2,499,336,011.85 | 1.91 |
| TOTAL | 130,907,215,007.85 | 100.00 |
| Vicki L. Fuller |
| Affirmative | 128,625,540,095.19 | 98.26 |
| Withheld | 2,281,674,912.66 | 1.74 |
| TOTAL | 130,907,215,007.85 | 100.00 |
| Patricia L. Kampling |
| Affirmative | 128,668,729,281.34 | 98.29 |
| Withheld | 2,238,485,726.51 | 1.71 |
| TOTAL | 130,907,215,007.85 | 100.00 |
| Thomas A. Kennedy |
| Affirmative | 128,499,824,239.79 | 98.16 |
| Withheld | 2,407,390,768.06 | 1.84 |
| TOTAL | 130,907,215,007.85 | 100.00 |
| Oscar Munoz |
| Affirmative | 128,386,109,391.05 | 98.07 |
| Withheld | 2,521,105,616.80 | 1.93 |
| TOTAL | 130,907,215,007.85 | 100.00 |
| Karen B. Peetz |
| Affirmative | 128,603,731,113.82 | 98.24 |
| Withheld | 2,303,483,894.03 | 1.76 |
| TOTAL | 130,907,215,007.85 | 100.00 |
| David M. Thomas |
| Affirmative | 128,384,899,342.98 | 98.07 |
| Withheld | 2,522,315,664.88 | 1.93 |
| TOTAL | 130,907,215,007.85 | 100.00 |
| Susan Tomasky |
| Affirmative | 128,556,148,461.60 | 98.20 |
| Withheld | 2,351,066,546.25 | 1.80 |
| TOTAL | 130,907,215,007.85 | 100.00 |
| Michael E. Wiley |
| Affirmative | 128,264,934,978.34 | 97.98 |
| Withheld | 2,642,280,029.51 | 2.02 |
| TOTAL | 130,907,215,007.85 | 100.00 |
| | | |
| Proposal 1 reflects trust-wide proposal and voting results. |
Item 10: Remuneration Paid to Directors, Officers, and others of Open-End Management Investment Companies
(Unaudited)
Note: This information is disclosed as part of the financial statements for each Fund as part of Item 7: Financial Statements and Financial Highlights for Open-End Management Investment companies.
Item 11: Statement Regarding Basis for Approval of Investment Advisory Contract
(Unaudited)
Board Approval of Investment Advisory Contracts and Management Fees
Fidelity Infrastructure Fund
Each year, the Board of Trustees, including the Independent Trustees (together, the Board), considers the renewal of the fund's management contract with Fidelity Management & Research Company LLC (FMR) and certain affiliates and the sub-advisory agreements (together, the Advisory Contracts) for the fund. FMR and the sub-advisers are referred to herein as the Investment Advisers. The Board, assisted by the advice of fund counsel and Independent Trustees' counsel, requests and considers a broad range of information relevant to the renewal of the Advisory Contracts throughout the year.
The Board meets regularly and, at each of its meetings, covers an extensive agenda of topics and materials and considers factors that are relevant to its annual consideration of the renewal of the fund's Advisory Contracts, including the services and support provided to the fund and its shareholders. The Board, acting directly and through its Committees (each of which is composed of and chaired by Independent Trustees), requests and receives information concerning the annual consideration of the renewal of the fund's Advisory Contracts. The Board also meets as needed to review matters specifically related to the Board's annual consideration of the renewal of the Advisory Contracts. Members of the Board may also meet with trustees of other Fidelity funds through joint ad hoc committees to discuss certain matters relevant to all of the Fidelity funds.
At its May 2024 meeting, the Board unanimously determined to renew the fund's Advisory Contracts. In reaching its determination, the Board considered all factors it believed relevant, including (i) the nature, extent, and quality of the services provided to the fund and its shareholders (including the investment performance of the fund); (ii) the competitiveness relative to peer funds of the fund's management fee and total expense ratio; (iii) the total costs of the services provided by and the profits realized by FMR and its affiliates (Fidelity) from its relationships with the fund; and (iv) the extent to which, if any, economies of scale exist and are realized as the fund grows, and whether any economies of scale are appropriately shared with fund shareholders. The Board also considered the broad range of investment choices available to shareholders from FMR's competitors and that the fund's shareholders have chosen to invest in the fund, which is part of the Fidelity family of funds. The Board's decision to renew the Advisory Contracts was not based on any single factor.
The Board reached a determination, with the assistance of fund counsel and Independent Trustees' counsel and through the exercise of its business judgment, that the renewal of the Advisory Contracts was in the best interests of the fund and its shareholders and that the compensation payable under the Advisory Contracts was fair and reasonable in light of all of the surrounding circumstances.
Nature, Extent, and Quality of Services Provided. The Board considered staffing as it relates to the fund, including the backgrounds and experience of investment personnel of the Investment Advisers, and also considered the Investment Advisers' implementation of the fund's investment program. The Independent Trustees also had discussions with senior management of Fidelity's investment operations and investment groups. The Board considered the structure of the investment personnel compensation program and whether this structure provides appropriate incentives to act in the best interests of the fund. Additionally, the Board considered the portfolio managers' investments, if any, in the funds that they manage.
Resources Dedicated to Investment Management and Support Services. The Board and the Fund Oversight and Research Committees reviewed the general qualifications and capabilities of Fidelity's investment staff, including its size, education, experience, and resources, as well as Fidelity's approach to recruiting, training, managing, and compensating investment personnel. The Board noted the resources devoted to expansion of Fidelity's global investment organization, and that Fidelity's analysts have extensive resources, tools, and capabilities that allow them to conduct sophisticated quantitative and fundamental analysis, as well as credit analysis of issuers, counterparties, and guarantors. Further, the Board considered that Fidelity's investment professionals have sufficient access to global information and data so as to provide competitive investment results over time, and that those professionals also have access to sophisticated tools that permit them to assess portfolio construction and risk and performance attribution characteristics continuously, as well as to transmit new information and research conclusions rapidly around the world. Additionally, in its deliberations, the Board considered Fidelity's trading, risk management, compliance, and technology and operations capabilities and resources, which are integral parts of the investment management process.
Shareholder and Administrative Services. The Board considered (i) the nature, extent, quality, and cost of advisory, administrative, shareholder, transfer agency, and pricing and bookkeeping services performed by the Investment Advisers and their affiliates under the Advisory Contracts; (ii) the nature and extent of Fidelity's supervision of third party service providers, principally custodians, subcustodians, and pricing vendors; and (iii) the resources devoted by Fidelity to, and the record of compliance with, the fund's compliance policies and procedures. The Board also reviewed the allocation of fund brokerage, including allocations to brokers affiliated with the Investment Advisers, the use of brokerage commissions to pay fund expenses, and the use of "soft" commission dollars to pay for research services. The Board also considered the fund's securities lending activities and any payments made to Fidelity relating to securities lending under a separate agreement.
The Board noted that the growth of fund assets over time across the complex allows Fidelity to reinvest in the development of services designed to enhance the value and convenience of the Fidelity funds as investment vehicles. These services include 24-hour access to account information and market information over the Internet and through telephone representatives, investor education materials, and asset allocation tools. The Board also considered that it reviews customer service metrics such as telephone response times, continuity of services on the website and metrics addressing services at Fidelity Investor Centers.
Investment in a Large Fund Family. The Board considered the benefits to shareholders of investing in a fund that is part of a large family of funds offering a variety of investment disciplines and providing a large variety of fund investor services. The Board noted that Fidelity had taken, or had made recommendations that resulted in the Fidelity funds taking, a number of actions over the previous year that benefited particular funds and/or the Fidelity funds in general.
Investment Performance. The Board took into account discussions that occur with representatives of the Investment Advisers, and reports that it receives, at Board meetings throughout the year, relating to fund investment performance. In this regard the Board noted that as part of regularly scheduled fund reviews and other reports to the Board on fund performance, the Board considered annualized return information for the fund for different time periods, measured against an appropriate securities market index (benchmark index). The Board also considered information about performance attribution. In its ongoing evaluation of fund investment performance, the Board gives particular attention to information indicating changes in performance of the funds over different time periods and discussed with the Investment Advisers the reasons for any overperformance or underperformance.
In addition to reviewing absolute and relative fund performance, the Independent Trustees periodically consider the appropriateness of fund performance metrics in evaluating the results achieved. The Independent Trustees generally give greater weight to fund performance over longer time periods than over shorter time periods. Depending on the circumstances, the Independent Trustees may be satisfied with a fund's performance notwithstanding that it lags its benchmark index for certain periods.
Based on its review, the Board concluded that the nature, extent, and quality of services provided to the fund under the Advisory Contracts should continue to benefit the shareholders of the fund.
Competitiveness of Management Fee and Total Expense Ratio. The Board was provided with information regarding industry trends in management fees and expenses. The Board considered that, effective March 1, 2024, an amended Advisory Contract with FMR went into effect with a fee based on tiered schedules and subject to a maximum class-level rate (the management fee). The Board also considered that in exchange for the management fee, the fund will receive investment advisory, management, administrative, transfer agent, and pricing and bookkeeping services. In its review of the fund's management fee and total expense ratio, the Board considered the fund's pro forma management fee rate as if it had been in effect for the 12-month period ended September 30, 2023, as well as other third-party fund expenses, such as custodial, legal, and audit fees. The Board noted that Fidelity may agree to waive fees or reimburse expenses from time to time, and the extent to which, if any, it has done so for the fund.
Comparisons of Management Fees and Total Expense Ratios. Among other things, the Board reviewed data for selected groups of competitive funds and classes (referred to as "mapped groups") that were compiled by Fidelity based on combining similar investment objective categories (as classified by Morningstar) that have comparable investment mandates. The data reviewed by the Board included (i) gross management fee comparisons (before taking into account expense reimbursements or caps) relative to the total universe of funds within the mapped group; (ii) gross management fee comparisons relative to a subset of non-Fidelity funds in the mapped group that are similar in size and management fee structure to the fund (referred to as the "asset size peer group"); (iii) total expense comparisons of the fund relative to funds and classes in the mapped group that have a similar sales load structure to the fund (referred to as the "similar sales load structure group"); and (iv) total expense comparisons of the fund relative to funds and classes in the similar sales load structure group that are similar in size and management fee structure to the fund (referred to as the "total expense asset size peer group"). The total expense asset size peer group comparison excludes performance adjustments and fund-paid 12b-1 fees to eliminate variability in fee structures.
The information provided to the Board indicated that the fund's management fee rate ranked above the competitive median of the mapped group for the 12-month period ended September 30, 2023 and below the competitive median of the asset size peer group for the 12-month period ended September 30, 2023. Further, the information provided to the Board indicated that the total expense ratio of the fund ranked below the competitive median of the similar sales load structure group for the 12-month period ended September 30, 2023 and below the competitive median of the total expense asset size peer group for the 12-month period ended September 30, 2023. The Board considered that the fund has a variable unified management fee that covers expenses for services beyond portfolio management.
Fees Charged to Other Fidelity Clients. The Board also considered Fidelity fee structures and other information with respect to clients of Fidelity, such as other funds advised or subadvised by Fidelity, pension plan clients, and other institutional clients with similar mandates. The Board noted that a joint ad hoc committee created by it and the boards of other Fidelity funds periodically reviews and compares Fidelity's institutional investment advisory business with its business of providing services to the Fidelity funds and also noted the most recent findings of the committee. The Board noted that the committee's review included a consideration of the differences in services provided, fees charged, and costs incurred, as well as competition in the markets serving the different categories of clients.
Based on its review, the Board concluded that the fund's management fee is fair and reasonable in light of the services that the fund receives and the other factors considered. Further, based on its review of total expense ratios and fees charged to other Fidelity clients, the Board concluded that the fund's total expense ratio was reasonable in light of the services that the fund and its shareholders receive and the other factors considered.
Costs of the Services and Profitability. The Board considered the revenues earned and the expenses incurred by Fidelity in conducting the business of developing, marketing, distributing, managing, administering and servicing the fund and servicing the fund's shareholders. The Board also considered the level of Fidelity's profits in respect of all the Fidelity funds.
On an annual basis, Fidelity presents to the Board information about the profitability of its relationships with the fund. Fidelity calculates profitability information for each fund, as well as aggregate profitability information for groups of Fidelity funds and all Fidelity funds, using a series of detailed revenue and cost allocation methodologies which originate with the books and records of Fidelity on which Fidelity's audited financial statements are based. The Audit Committee of the Board reviews any significant changes from the prior year's methodologies.
A public accounting firm has been engaged annually by the Board as part of the Board's assessment of Fidelity's profitability analysis. The engagement includes the review and assessment of the methodologies used by Fidelity in determining the revenues and expenses attributable to Fidelity's fund business, and completion of agreed-upon procedures in respect of the mathematical accuracy of certain fund profitability information and its conformity to established allocation methodologies. After considering the reports issued under the engagement and information provided by Fidelity, the Board concluded that while other allocation methods may also be reasonable, Fidelity's profitability methodologies are reasonable in all material respects.
The Board also reviewed Fidelity's non-fund businesses and potential indirect benefits such businesses may have received as a result of their association with Fidelity's fund business (i.e., fall-out benefits) as well as cases where Fidelity's affiliates may benefit from the funds' business. The Board considered areas where potential indirect benefits to the Fidelity funds from their relationships with Fidelity may exist. The Board's consideration of these matters was informed by the findings of a joint ad hoc committee created by it and the boards of other Fidelity funds to evaluate potential fall-out benefits.
The Board considered the costs of the services provided by and the profits realized by Fidelity in connection with the operation of the fund and was satisfied that the profitability was not excessive.
Economies of Scale. The Board considered whether there have been economies of scale in respect of the management of the Fidelity funds, whether the Fidelity funds (including the fund) have appropriately benefited from any such economies of scale, and whether there is potential for realization of any further economies of scale. The Board considered the extent to which the fund will benefit from economies of scale as assets grow through increased services to the fund, through waivers or reimbursements, or through fee or expense ratio reductions. The Board also noted that a committee created by it and the boards of other Fidelity funds periodically analyzes whether Fidelity attains economies of scale in respect of the management and servicing of the Fidelity funds, whether the Fidelity funds have appropriately benefited from such economies of scale, and whether there is potential for realization of any further economies of scale.
The Board recognized that the fund's management contract incorporates a variable management fee structure, which provides breakpoints as a way to share, in part, any potential economies of scale that may exist at the asset class level and through a discount that considers both fund size and total assets of the four applicable asset classes. The Board considered that the variable management fee is designed to deliver the benefits of economies of scale to fund shareholders even if assets of any particular fund are unchanged or have declined, because some portion of Fidelity's costs are attributable to services provided to all funds subject to the variable management fee, and all such funds benefit if those costs can be allocated among more assets. The Board concluded that, given the variable management fee structure, fund shareholders will benefit from lower management fees due to the application of the breakpoints and discount factor, regardless of whether Fidelity achieves any such economies of scale.
The Board concluded, taking into account the analysis of the committee, that economies of scale, if any, are being appropriately shared between fund shareholders and Fidelity.
Additional Information Requested by the Board. In order to develop fully the factual basis for consideration of the Fidelity funds' advisory contracts, the Board requested and received additional information on certain topics, including but not limited to: (i) fund flow and performance trends, in particular the underperformance of certain funds and strategies, and Fidelity's long-term strategies for certain funds; (ii) the operation of performance fees and the rationale for implementing performance fees on certain categories of funds but not others; (iii) Fidelity's pricing philosophy compared to competitors; (iv) fund profitability methodology and data; (v) evaluation of competitive fund data and peer group classifications and fee and expense comparisons; (vi) the management fee and expense structures for different funds and classes and information about the differences between various fee and expense structures; (vii) the variable management fee implemented for certain funds effective March 1, 2024; and (viii) information regarding other accounts managed by Fidelity and the funds' sub-advisory arrangements.
Conclusion. Based on its evaluation of all of the conclusions noted above, and after considering all factors it believed relevant, the Board, including the Independent Trustees, concluded that the advisory and sub-advisory fee arrangements are fair and reasonable in light of all of the surrounding circumstances and that the fund's Advisory Contracts should be renewed through May 31, 2025.
1.9896235.104
ISF-ANN-1224
Fidelity® Enduring Opportunities Fund
Annual Report
October 31, 2024
Contents
To view a fund's proxy voting guidelines and proxy voting record for the 12-month period ended June 30, visit http://www.fidelity.com/proxyvotingresults or visit the Securities and Exchange Commission's (SEC) web site at http://www.sec.gov.
You may also call 1-800-544-8544 to request a free copy of the proxy voting guidelines.
Standard & Poor's, S&P and S&P 500 are registered service marks of The McGraw-Hill Companies, Inc. and have been licensed for use by Fidelity Distributors Corporation.
Other third-party marks appearing herein are the property of their respective owners.
All other marks appearing herein are registered or unregistered trademarks or service marks of FMR LLC or an affiliated company. © 2024 FMR LLC. All rights reserved.
This report and the financial statements contained herein are submitted for the general information of the shareholders of the Fund. This report is not authorized for distribution to prospective investors in the Fund unless preceded or accompanied by an effective prospectus.
A fund files its complete schedule of portfolio holdings with the SEC for the first and third quarters of each fiscal year on Form N-PORT. Forms N-PORT are available on the SEC's web site at http://www.sec.gov. A fund's Forms N-PORT may be reviewed and copied at the SEC's Public Reference Room in Washington, DC. Information regarding the operation of the SEC's Public Reference Room may be obtained by calling 1-800-SEC-0330.
For a complete list of a fund's portfolio holdings, view the most recent holdings listing, semiannual report, or annual report on Fidelity's web site at http://www.fidelity.com, http://www.institutional.fidelity.com, or http://www.401k.com, as applicable.
NOT FDIC INSURED •MAY LOSE VALUE •NO BANK GUARANTEE
Neither the Fund nor Fidelity Distributors Corporation is a bank.
Item 7: Financial Statements and Financial Highlights for Open-End Management Investment Companies (Annual Report)
Fidelity® Enduring Opportunities Fund
Schedule of Investments October 31, 2024
Showing Percentage of Net Assets
| Common Stocks - 99.1% |
| | | Shares | Value ($) |
| COMMUNICATION SERVICES - 9.0% | | | |
| Diversified Telecommunication Services - 0.3% | | | |
| Liberty Latin America Ltd. Class C (a) | | 4,540 | 43,947 |
| Entertainment - 2.0% | | | |
| Live Nation Entertainment, Inc. (a) | | 464 | 54,353 |
| Netflix, Inc. (a) | | 159 | 120,209 |
| Sea Ltd. ADR Class A (a) | | 656 | 61,697 |
| The Walt Disney Co. | | 641 | 61,664 |
| | | | 297,923 |
| Interactive Media & Services - 6.7% | | | |
| Alphabet, Inc.: | | | |
| Class A | | 1,326 | 226,892 |
| Class C | | 1,168 | 201,702 |
| Baltic Classifieds Group PLC | | 7,416 | 30,170 |
| Hemnet Group AB | | 809 | 25,391 |
| LY Corp. | | 7,791 | 21,252 |
| Meta Platforms, Inc. Class A | | 539 | 305,926 |
| NAVER Corp. | | 245 | 30,067 |
| Rightmove PLC | | 3,529 | 26,793 |
| Tencent Holdings Ltd. | | 2,028 | 105,744 |
| | | | 973,937 |
TOTAL COMMUNICATION SERVICES | | | 1,315,807 |
| CONSUMER DISCRETIONARY - 16.1% | | | |
| Automobile Components - 0.2% | | | |
| DENSO Corp. | | 2,140 | 30,395 |
| Automobiles - 0.6% | | | |
| BYD Co. Ltd. (H Shares) | | 1,258 | 45,437 |
| Ferrari NV (Italy) | | 90 | 43,055 |
| | | | 88,492 |
| Broadline Retail - 3.6% | | | |
| Amazon.com, Inc. (a) | | 2,023 | 377,087 |
| B&M European Value Retail SA | | 4,226 | 21,121 |
| Dollarama, Inc. | | 412 | 42,873 |
| MercadoLibre, Inc. (a) | | 27 | 55,004 |
| Prosus NV | | 642 | 27,010 |
| | | | 523,095 |
| Diversified Consumer Services - 1.0% | | | |
| Duolingo, Inc. Class A (a) | | 193 | 56,543 |
| OneSpaWorld Holdings Ltd. | | 2,589 | 45,333 |
| Service Corp. International | | 549 | 44,826 |
| | | | 146,702 |
| Hotels, Restaurants & Leisure - 3.9% | | | |
| Airbnb, Inc. Class A (a) | | 360 | 48,524 |
| Cava Group, Inc. (a) | | 508 | 67,848 |
| Chipotle Mexican Grill, Inc. (a) | | 999 | 55,714 |
| Churchill Downs, Inc. | | 371 | 51,977 |
| Compass Group PLC | | 1,263 | 41,018 |
| Domino's Pizza, Inc. | | 97 | 40,132 |
| Dominos Pizza Enterprises Ltd. | | 1,039 | 22,739 |
| Flutter Entertainment PLC (a) | | 146 | 34,150 |
| Hilton Worldwide Holdings, Inc. | | 280 | 65,758 |
| Oriental Land Co. Ltd. | | 1,008 | 24,360 |
| Restaurant Brands Asia Ltd. (a) | | 19,425 | 20,877 |
| Yum! Brands, Inc. | | 300 | 39,348 |
| Zomato Ltd. (a) | | 17,876 | 51,285 |
| | | | 563,730 |
| Household Durables - 1.0% | | | |
| Berkeley Group Holdings PLC | | 383 | 21,856 |
| Neinor Homes SLU (b) | | 1,770 | 29,034 |
| NVR, Inc. (a) | | 7 | 64,070 |
| TopBuild Corp. (a) | | 98 | 34,631 |
| | | | 149,591 |
| Leisure Products - 0.3% | | | |
| Roland Corp. | | 647 | 16,551 |
| SHIMANO, Inc. | | 129 | 18,951 |
| | | | 35,502 |
| Specialty Retail - 3.9% | | | |
| Carvana Co. Class A (a) | | 424 | 104,859 |
| Dick's Sporting Goods, Inc. | | 195 | 38,171 |
| Fast Retailing Co. Ltd. | | 142 | 45,400 |
| Floor & Decor Holdings, Inc. Class A (a) | | 404 | 41,632 |
| Lowe's Companies, Inc. | | 292 | 76,454 |
| National Vision Holdings, Inc. (a) | | 2,205 | 22,932 |
| Nitori Holdings Co. Ltd. | | 184 | 23,433 |
| The Home Depot, Inc. | | 283 | 111,431 |
| Ulta Beauty, Inc. (a) | | 102 | 37,636 |
| Wayfair LLC Class A (a) | | 635 | 27,197 |
| Workman Co. Ltd. | | 659 | 16,821 |
| ZOZO, Inc. | | 833 | 27,010 |
| | | | 572,976 |
| Textiles, Apparel & Luxury Goods - 1.6% | | | |
| Brunello Cucinelli SpA | | 304 | 30,025 |
| Hermes International SCA | | 16 | 36,096 |
| lululemon athletica, Inc. (a) | | 170 | 50,643 |
| LVMH Moet Hennessy Louis Vuitton SE | | 76 | 50,595 |
| Moncler SpA | | 333 | 18,452 |
| Prada SpA | | 2,910 | 22,342 |
| Shenzhou International Group Holdings Ltd. | | 3,057 | 23,606 |
| | | | 231,759 |
TOTAL CONSUMER DISCRETIONARY | | | 2,342,242 |
| CONSUMER STAPLES - 5.0% | | | |
| Beverages - 0.9% | | | |
| Ambev SA | | 10,151 | 22,195 |
| Davide Campari Milano NV | | 2,695 | 18,094 |
| Kweichow Moutai Co. Ltd. (A Shares) | | 115 | 24,691 |
| Monster Beverage Corp. (a) | | 779 | 41,038 |
| Pernod Ricard SA | | 175 | 21,748 |
| | | | 127,766 |
| Consumer Staples Distribution & Retail - 2.9% | | | |
| Alimentation Couche-Tard, Inc. (multi-vtg.) | | 541 | 28,213 |
| Casey's General Stores, Inc. | | 139 | 54,769 |
| Clicks Group Ltd. | | 1,582 | 33,905 |
| Cosmos Pharmaceutical Corp. | | 546 | 26,242 |
| Costco Wholesale Corp. | | 152 | 132,875 |
| Wal-Mart de Mexico SA de CV Series V | | 8,849 | 24,332 |
| Walmart, Inc. | | 1,408 | 115,386 |
| | | | 415,722 |
| Food Products - 0.7% | | | |
| Freshpet, Inc. (a) | | 417 | 55,269 |
| McCormick & Co., Inc. (non-vtg.) | | 620 | 48,509 |
| | | | 103,778 |
| Household Products - 0.1% | | | |
| Unicharm Corp. | | 664 | 21,411 |
| Personal Care Products - 0.4% | | | |
| Hindustan Unilever Ltd. | | 930 | 27,921 |
| L'Oreal SA | | 97 | 36,392 |
| | | | 64,313 |
TOTAL CONSUMER STAPLES | | | 732,990 |
| ENERGY - 1.8% | | | |
| Energy Equipment & Services - 0.3% | | | |
| Schlumberger Ltd. | | 992 | 39,749 |
| Oil, Gas & Consumable Fuels - 1.5% | | | |
| Cheniere Energy, Inc. | | 259 | 49,567 |
| Hess Corp. | | 312 | 41,958 |
| Parkland Corp. | | 761 | 17,708 |
| PrairieSky Royalty Ltd. | | 2,270 | 45,421 |
| Reliance Industries Ltd. (a) | | 1,182 | 18,556 |
| Reliance Industries Ltd. | | 1,182 | 18,689 |
| Saudi Arabian Oil Co. (b) | | 4,111 | 29,554 |
| | | | 221,453 |
TOTAL ENERGY | | | 261,202 |
| FINANCIALS - 11.8% | | | |
| Banks - 3.1% | | | |
| Bank of America Corp. | | 2,346 | 98,110 |
| Credicorp Ltd. (United States) | | 229 | 42,166 |
| FinecoBank SpA | | 1,536 | 24,535 |
| JPMorgan Chase & Co. | | 768 | 170,435 |
| KBC Group NV | | 396 | 28,722 |
| PNC Financial Services Group, Inc. | | 267 | 50,268 |
| PT Bank Central Asia Tbk | | 55,476 | 35,904 |
| | | | 450,140 |
| Capital Markets - 2.9% | | | |
| Avanza Bank Holding AB | | 742 | 15,433 |
| Banca Generali SpA | | 585 | 25,924 |
| Bolsa Mexicana de Valores S.A.B. de CV | | 13,132 | 21,474 |
| Brookfield Corp. (Canada) Class A | | 857 | 45,443 |
| HUB24 Ltd. | | 1,195 | 53,784 |
| Moody's Corp. | | 116 | 52,669 |
| Morningstar, Inc. | | 149 | 48,879 |
| Nordnet AB | | 1,221 | 25,372 |
| Partners Group Holding AG | | 19 | 26,249 |
| S&P Global, Inc. | | 140 | 67,250 |
| VZ Holding AG | | 239 | 38,581 |
| | | | 421,058 |
| Financial Services - 3.1% | | | |
| Adyen BV (a)(b) | | 21 | 32,081 |
| Banca Mediolanum S.p.A. | | 2,233 | 27,641 |
| BFF Bank SpA (b) | | 2,091 | 20,414 |
| Fiserv, Inc. (a) | | 382 | 75,598 |
| Flywire Corp. (a) | | 1,341 | 23,360 |
| MasterCard, Inc. Class A | | 245 | 122,400 |
| Visa, Inc. Class A | | 455 | 131,882 |
| Zenkoku Hosho Co. Ltd. | | 657 | 23,740 |
| | | | 457,116 |
| Insurance - 2.7% | | | |
| American Financial Group, Inc. | | 313 | 40,355 |
| Arch Capital Group Ltd. | | 515 | 50,758 |
| Arthur J. Gallagher & Co. | | 179 | 50,335 |
| Assurant, Inc. | | 239 | 45,816 |
| Chubb Ltd. | | 251 | 70,892 |
| Hannover Reuck SE | | 148 | 38,878 |
| Qualitas Controladora S.A.B. de CV | | 3,072 | 21,492 |
| Steadfast Group Ltd. | | 5,820 | 20,960 |
| The Travelers Companies, Inc. | | 238 | 58,534 |
| | | | 398,020 |
TOTAL FINANCIALS | | | 1,726,334 |
| HEALTH CARE - 9.0% | | | |
| Biotechnology - 0.3% | | | |
| Zai Lab Ltd. (a) | | 14,460 | 44,090 |
| Health Care Equipment & Supplies - 3.9% | | | |
| Alcon, Inc. (Switzerland) | | 393 | 36,217 |
| Align Technology, Inc. (a) | | 133 | 27,269 |
| Boston Scientific Corp. (a) | | 918 | 77,130 |
| Coloplast A/S Series B | | 165 | 20,576 |
| Hoya Corp. | | 287 | 38,399 |
| IDEXX Laboratories, Inc. (a) | | 83 | 33,774 |
| Inspire Medical Systems, Inc. (a) | | 165 | 32,182 |
| Intuitive Surgical, Inc. (a) | | 151 | 76,080 |
| Masimo Corp. (a) | | 393 | 56,596 |
| ResMed, Inc. | | 245 | 59,405 |
| Shenzhen Mindray Bio-Medical Electronics Co. Ltd. (A Shares) | | 764 | 28,614 |
| Straumann Holding AG | | 201 | 26,500 |
| The Cooper Companies, Inc. (a) | | 452 | 47,315 |
| | | | 560,057 |
| Health Care Providers & Services - 1.4% | | | |
| Apollo Hospitals Enterprise Ltd. | | 425 | 35,405 |
| Surgery Partners, Inc. (a) | | 909 | 26,179 |
| UnitedHealth Group, Inc. | | 239 | 134,916 |
| | | | 196,500 |
| Health Care Technology - 0.2% | | | |
| Veeva Systems, Inc. Class A (a) | | 159 | 33,204 |
| Life Sciences Tools & Services - 1.5% | | | |
| 10X Genomics, Inc. Class A (a) | | 566 | 9,073 |
| Danaher Corp. | | 271 | 66,574 |
| Lonza Group AG | | 45 | 27,754 |
| Thermo Fisher Scientific, Inc. | | 141 | 77,031 |
| West Pharmaceutical Services, Inc. | | 131 | 40,339 |
| | | | 220,771 |
| Pharmaceuticals - 1.7% | | | |
| Eli Lilly & Co. | | 200 | 165,948 |
| Novo Nordisk A/S Series B | | 784 | 87,937 |
| | | | 253,885 |
TOTAL HEALTH CARE | | | 1,308,507 |
| INDUSTRIALS - 14.8% | | | |
| Aerospace & Defense - 1.9% | | | |
| GE Aerospace | | 525 | 90,185 |
| HEICO Corp. | | 214 | 52,419 |
| INVISIO AB | | 1,159 | 29,153 |
| Northrop Grumman Corp. | | 108 | 54,974 |
| Safran SA | | 209 | 47,310 |
| | | | 274,041 |
| Air Freight & Logistics - 0.9% | | | |
| C.H. Robinson Worldwide, Inc. | | 444 | 45,750 |
| Delhivery Private Ltd. (a) | | 4,535 | 19,156 |
| Deutsche Post AG ADR | | 752 | 30,207 |
| ZTO Express, Inc. sponsored ADR Class A | | 1,725 | 39,865 |
| | | | 134,978 |
| Building Products - 1.6% | | | |
| ASSA ABLOY AB (B Shares) | | 1,243 | 38,934 |
| Builders FirstSource, Inc. (a) | | 266 | 45,592 |
| Kingspan Group PLC (Ireland) | | 315 | 27,634 |
| Simpson Manufacturing Co. Ltd. | | 195 | 35,059 |
| The AZEK Co., Inc. Class A, (a) | | 1,035 | 45,540 |
| Trex Co., Inc. (a) | | 506 | 35,850 |
| | | | 228,609 |
| Commercial Services & Supplies - 1.5% | | | |
| Casella Waste Systems, Inc. Class A (a) | | 441 | 43,165 |
| Cintas Corp. | | 328 | 67,506 |
| Copart, Inc. (a) | | 1,106 | 56,926 |
| GFL Environmental, Inc. | | 625 | 26,147 |
| Waste Connections, Inc. (Canada) | | 135 | 23,864 |
| | | | 217,608 |
| Construction & Engineering - 0.2% | | | |
| Larsen & Toubro Ltd. | | 646 | 27,749 |
| Electrical Equipment - 1.2% | | | |
| AMETEK, Inc. | | 274 | 50,235 |
| Eaton Corp. PLC | | 223 | 73,942 |
| Nidec Corp. | | 1,448 | 28,845 |
| Weg SA | | 3,151 | 29,494 |
| | | | 182,516 |
| Ground Transportation - 0.5% | | | |
| Localiza Rent a Car SA | | 2,415 | 17,554 |
| Old Dominion Freight Lines, Inc. | | 206 | 41,472 |
| Vamos Locacao de Caminhoes Maquinas e Equipamentos SA | | 13,622 | 14,822 |
| | | | 73,848 |
| Machinery - 1.5% | | | |
| Atlas Copco AB (A Shares) | | 2,227 | 36,753 |
| Indutrade AB | | 1,261 | 34,157 |
| Minebea Mitsumi, Inc. | | 1,199 | 21,108 |
| Rational AG | | 33 | 32,306 |
| Shenzhen Inovance Technology Co. Ltd. (A Shares) | | 3,307 | 25,812 |
| SMC Corp. | | 48 | 20,378 |
| Spirax-Sarco Engineering PLC | | 231 | 19,227 |
| VAT Group AG (b) | | 53 | 22,064 |
| | | | 211,805 |
| Marine Transportation - 0.3% | | | |
| SITC International Holdings Co. Ltd. | | 13,363 | 37,768 |
| Passenger Airlines - 0.2% | | | |
| Ryanair Holdings PLC sponsored ADR | | 552 | 24,432 |
| Professional Services - 2.8% | | | |
| BayCurrent Consulting, Inc. | | 987 | 32,077 |
| Dayforce, Inc. (a) | | 605 | 42,925 |
| Equifax, Inc. | | 190 | 50,354 |
| Experian PLC | | 892 | 43,443 |
| Funai Soken Holdings, Inc. | | 1,334 | 21,233 |
| Recruit Holdings Co. Ltd. | | 876 | 53,491 |
| RELX PLC (London Stock Exchange) | | 951 | 43,613 |
| Thomson Reuters Corp. | | 235 | 38,467 |
| Verisk Analytics, Inc. | | 189 | 51,922 |
| Wolters Kluwer NV | | 218 | 36,684 |
| | | | 414,209 |
| Trading Companies & Distributors - 1.8% | | | |
| AddTech AB (B Shares) | | 979 | 27,143 |
| Ashtead Group PLC | | 500 | 37,317 |
| Azelis Group NV | | 826 | 16,379 |
| Fastenal Co. | | 676 | 52,850 |
| Ferguson Enterprises, Inc. | | 269 | 52,923 |
| IMCD NV | | 158 | 25,101 |
| Watsco, Inc. | | 108 | 51,085 |
| | | | 262,798 |
| Transportation Infrastructure - 0.4% | | | |
| Athens International Airport SA | | 3,235 | 27,623 |
| International Container Terminal Services, Inc. | | 5,594 | 37,863 |
| | | | 65,486 |
TOTAL INDUSTRIALS | | | 2,155,847 |
| INFORMATION TECHNOLOGY - 22.5% | | | |
| Communications Equipment - 0.9% | | | |
| Arista Networks, Inc. (a) | | 183 | 70,719 |
| Motorola Solutions, Inc. | | 132 | 59,314 |
| | | | 130,033 |
| Electronic Equipment, Instruments & Components - 1.5% | | | |
| Amphenol Corp. Class A | | 990 | 66,350 |
| Azbil Corp. | | 2,664 | 20,715 |
| CDW Corp. | | 216 | 40,658 |
| Keyence Corp. | | 88 | 39,724 |
| Lagercrantz Group AB (B Shares) | | 2,284 | 44,546 |
| | | | 211,993 |
| IT Services - 1.2% | | | |
| Cloudflare, Inc. Class A (a) | | 592 | 51,924 |
| Nagarro SE (a) | | 231 | 22,501 |
| SHIFT, Inc. (a) | | 109 | 10,954 |
| Shopify, Inc. Class A (a) | | 364 | 28,468 |
| Softcat PLC | | 1,104 | 24,129 |
| Tata Consultancy Services Ltd. | | 812 | 38,193 |
| | | | 176,169 |
| Semiconductors & Semiconductor Equipment - 8.7% | | | |
| Advantest Corp. | | 692 | 40,067 |
| ASM International NV (Netherlands) | | 56 | 31,200 |
| ASML Holding NV (Netherlands) | | 103 | 69,598 |
| BE Semiconductor Industries NV | | 189 | 20,135 |
| Disco Corp. | | 98 | 27,884 |
| eMemory Technology, Inc. | | 516 | 50,337 |
| Monolithic Power Systems, Inc. | | 82 | 62,263 |
| NVIDIA Corp. | | 5,341 | 709,082 |
| Taiwan Semiconductor Manufacturing Co. Ltd. | | 6,243 | 196,415 |
| Teradyne, Inc. | | 347 | 36,855 |
| Tokyo Electron Ltd. | | 186 | 27,370 |
| | | | 1,271,206 |
| Software - 9.8% | | | |
| Adobe, Inc. (a) | | 138 | 65,975 |
| ANSYS, Inc. (a) | | 124 | 39,731 |
| Aspen Technology, Inc. (a) | | 204 | 47,885 |
| Atlassian Corp. PLC Class A, (a) | | 149 | 28,092 |
| ATOSS Software AG | | 180 | 23,730 |
| Cadence Design Systems, Inc. (a) | | 186 | 51,358 |
| Constellation Software, Inc. | | 17 | 51,268 |
| Constellation Software, Inc. warrants 3/31/40 (a)(c) | | 17 | 0 |
| Dassault Systemes SA | | 787 | 26,935 |
| Fortnox AB | | 3,520 | 21,474 |
| HubSpot, Inc. (a) | | 95 | 52,705 |
| Lumine Group, Inc. (a) | | 1,233 | 28,710 |
| Microsoft Corp. | | 1,489 | 605,055 |
| Money Forward, Inc. (a) | | 614 | 20,032 |
| Procore Technologies, Inc. (a) | | 586 | 38,471 |
| Salesforce, Inc. | | 354 | 103,145 |
| SAP SE | | 310 | 72,380 |
| ServiceNow, Inc. (a) | | 82 | 76,505 |
| Synopsys, Inc. (a) | | 96 | 49,307 |
| Topicus.Com, Inc. | | 259 | 22,171 |
| | | | 1,424,929 |
| Technology Hardware, Storage & Peripherals - 0.4% | | | |
| Seagate Technology Holdings PLC | | 570 | 57,211 |
TOTAL INFORMATION TECHNOLOGY | | | 3,271,541 |
| MATERIALS - 3.5% | | | |
| Chemicals - 2.4% | | | |
| Air Products & Chemicals, Inc. | | 212 | 65,832 |
| Ecolab, Inc. | | 215 | 52,832 |
| Givaudan SA | | 8 | 37,955 |
| Linde PLC | | 147 | 67,054 |
| Shin-Etsu Chemical Co. Ltd. | | 1,083 | 39,685 |
| Sika AG | | 124 | 34,534 |
| Solar Industries India Ltd. | | 374 | 45,353 |
| | | | 343,245 |
| Construction Materials - 0.8% | | | |
| Martin Marietta Materials, Inc. | | 98 | 58,049 |
| Vulcan Materials Co. | | 207 | 56,704 |
| | | | 114,753 |
| Metals & Mining - 0.3% | | | |
| Freeport-McMoRan, Inc. | | 1,071 | 48,216 |
TOTAL MATERIALS | | | 506,214 |
| REAL ESTATE - 4.7% | | | |
| Equity Real Estate Investment Trusts (REITs) - 2.9% | | | |
| American Tower Corp. | | 246 | 52,531 |
| Big Yellow Group PLC | | 1,993 | 31,044 |
| Embassy Office Parks (REIT) | | 6,240 | 29,302 |
| Equinix, Inc. | | 63 | 57,209 |
| Equity Lifestyle Properties, Inc. | | 537 | 37,654 |
| Extra Space Storage, Inc. | | 301 | 49,153 |
| National Storage REIT unit | | 15,992 | 26,310 |
| Prologis, Inc. | | 442 | 49,919 |
| Safestore Holdings PLC | | 2,266 | 23,638 |
| Segro PLC | | 1,591 | 16,108 |
| Sun Communities, Inc. | | 258 | 34,231 |
| Warehouses de Pauw | | 849 | 20,151 |
| | | | 427,250 |
| Real Estate Management & Development - 1.8% | | | |
| Ayala Land, Inc. | | 36,338 | 20,303 |
| CBRE Group, Inc. (a) | | 470 | 61,556 |
| Colliers International Group, Inc. | | 176 | 26,904 |
| Corporacion Inmobiliaria Vesta S.A.B. de CV | | 9,544 | 24,941 |
| CoStar Group, Inc. (a) | | 490 | 35,667 |
| Grainger Trust PLC | | 6,793 | 19,883 |
| Katitas Co. Ltd. | | 1,802 | 22,848 |
| Oberoi Realty Ltd. | | 1,813 | 42,242 |
| | | | 254,344 |
TOTAL REAL ESTATE | | | 681,594 |
| UTILITIES - 0.9% | | | |
| Electric Utilities - 0.5% | | | |
| Constellation Energy Corp. | | 287 | 75,470 |
| Multi-Utilities - 0.4% | | | |
| Public Service Enterprise Group, Inc. | | 616 | 55,077 |
TOTAL UTILITIES | | | 130,547 |
| TOTAL COMMON STOCKS (Cost $9,759,263) | | | 14,432,825 |
| | | | |
| Money Market Funds - 1.1% |
| | | Shares | Value ($) |
Fidelity Cash Central Fund 4.87% (d) (Cost $160,085) | | 160,053 | 160,085 |
| | | | |
| TOTAL INVESTMENT IN SECURITIES - 100.2% (Cost $9,919,348) | 14,592,910 |
NET OTHER ASSETS (LIABILITIES) - (0.2)% | (32,933) |
| NET ASSETS - 100.0% | 14,559,977 |
| | |
Legend
| (b) | Security exempt from registration under Rule 144A of the Securities Act of 1933. These securities may be resold in transactions exempt from registration, normally to qualified institutional buyers. At the end of the period, the value of these securities amounted to $133,147 or 0.9% of net assets. |
| (d) | Affiliated fund that is generally available only to investment companies and other accounts managed by Fidelity Investments. The rate quoted is the annualized seven-day yield of the fund at period end. A complete unaudited listing of the fund's holdings as of its most recent quarter end is available upon request. In addition, each Fidelity Central Fund's financial statements, which are not covered by the Fund's Report of Independent Registered Public Accounting Firm, are available on the SEC's website or upon request. |
Affiliated Central Funds
Fiscal year to date information regarding the Fund's investments in Fidelity Central Funds, including the ownership percentage, is presented below.
| Affiliate | Value, beginning of period ($) | Purchases ($) | Sales Proceeds ($) | Dividend Income ($) | Realized Gain (loss) ($) | Change in Unrealized appreciation (depreciation) ($) | Value, end of period ($) | % ownership, end of period |
| Fidelity Cash Central Fund 4.87% | 160,448 | 2,436,902 | 2,437,265 | 9,974 | - | - | 160,085 | 0.0% |
| Total | 160,448 | 2,436,902 | 2,437,265 | 9,974 | - | - | 160,085 | |
| | | | | | | | | |
Amounts in the dividend income column in the above table include any capital gain distributions from underlying funds, which are presented in the corresponding line item in the Statement of Operations, if applicable.
Amounts included in the purchases and sales proceeds columns may include in-kind transactions, if applicable.
Investment Valuation
The following is a summary of the inputs used, as of October 31, 2024, involving the Fund's assets and liabilities carried at fair value. The inputs or methodology used for valuing securities may not be an indication of the risk associated with investing in those securities. For more information on valuation inputs, and their aggregation into the levels used below, please refer to the Investment Valuation section in the accompanying Notes to Financial Statements.
| Valuation Inputs at Reporting Date: |
| Description | Total ($) | Level 1 ($) | Level 2 ($) | Level 3 ($) |
Investments in Securities: | | | | |
|
| Equities: | | | | |
Communication Services | 1,315,807 | 1,158,744 | 157,063 | - |
Consumer Discretionary | 2,342,242 | 1,812,556 | 529,686 | - |
Consumer Staples | 732,990 | 544,334 | 188,656 | - |
Energy | 261,202 | 223,957 | 37,245 | - |
Financials | 1,726,334 | 1,559,865 | 166,469 | - |
Health Care | 1,308,507 | 1,047,562 | 260,945 | - |
Industrials | 2,155,847 | 1,633,550 | 522,297 | - |
Information Technology | 3,271,541 | 2,700,535 | 571,006 | - |
Materials | 506,214 | 421,176 | 85,038 | - |
Real Estate | 681,594 | 540,589 | 141,005 | - |
Utilities | 130,547 | 130,547 | - | - |
|
| Money Market Funds | 160,085 | 160,085 | - | - |
| Total Investments in Securities: | 14,592,910 | 11,933,500 | 2,659,410 | - |
Financial Statements
| Statement of Assets and Liabilities |
As of October 31, 2024 |
| Assets | | | | |
| Investment in securities, at value - See accompanying schedule: | | | | |
Unaffiliated issuers (cost $9,759,263) | $ | 14,432,825 | | |
Fidelity Central Funds (cost $160,085) | | 160,085 | | |
| | | | | |
| | | | | |
| Total Investment in Securities (cost $9,919,348) | | | $ | 14,592,910 |
| Cash | | | | 1,421 |
| Foreign currency held at value (cost $349) | | | | 350 |
| Receivable for fund shares sold | | | | 1,004 |
| Dividends receivable | | | | 10,725 |
| Distributions receivable from Fidelity Central Funds | | | | 788 |
| Prepaid expenses | | | | 17 |
| Receivable from investment adviser for expense reductions | | | | 10,886 |
Total assets | | | | 14,618,101 |
| Liabilities | | | | |
| Accrued management fee | $ | 6,631 | | |
| Deferred taxes | | 16,890 | | |
| Audit fee payable | | 32,725 | | |
| Other payables and accrued expenses | | 1,878 | | |
| Total liabilities | | | | 58,124 |
| Net Assets | | | $ | 14,559,977 |
| Net Assets consist of: | | | | |
| Paid in capital | | | $ | 10,838,560 |
| Total accumulated earnings (loss) | | | | 3,721,417 |
| Net Assets | | | $ | 14,559,977 |
Net Asset Value, offering price and redemption price per share ($14,559,977 ÷ 898,799 shares) | | | $ | 16.20 |
| Statement of Operations |
| Year ended October 31, 2024 |
| Investment Income | | | | |
| Dividends | | | $ | 156,262 |
| Income from Fidelity Central Funds | | | | 9,974 |
| Income before foreign taxes withheld | | | $ | 166,236 |
| Less foreign taxes withheld | | | | (9,941) |
| Total income | | | | 156,295 |
| Expenses | | | | |
| Management fee | | | | |
| Basic fee | $ | 95,201 | | |
| Performance adjustment | | (29,657) | | |
| Transfer agent fees | | 9,231 | | |
| Accounting fees and expenses | | 1,543 | | |
| Custodian fees and expenses | | 4,322 | | |
| Independent trustees' fees and expenses | | 62 | | |
| Registration fees | | 21,323 | | |
| Audit fees | | 61,999 | | |
| Legal | | 317 | | |
| Miscellaneous | | 779 | | |
| Total expenses before reductions | | 165,120 | | |
| Expense reductions | | (32,042) | | |
| Total expenses after reductions | | | | 133,078 |
| Net Investment income (loss) | | | | 23,217 |
| Realized and Unrealized Gain (Loss) | | | | |
| Net realized gain (loss) on: | | | | |
| Investment Securities: | | | | |
| Unaffiliated issuers (net of foreign taxes of $2,620) | | 115,214 | | |
| Foreign currency transactions | | (114) | | |
| Total net realized gain (loss) | | | | 115,100 |
| Change in net unrealized appreciation (depreciation) on: | | | | |
| Investment Securities: | | | | |
| Unaffiliated issuers (net of increase in deferred foreign taxes of $13,066) | | 3,784,346 | | |
| Assets and liabilities in foreign currencies | | 4 | | |
| Total change in net unrealized appreciation (depreciation) | | | | 3,784,350 |
| Net gain (loss) | | | | 3,899,450 |
| Net increase (decrease) in net assets resulting from operations | | | $ | 3,922,667 |
| Statement of Changes in Net Assets |
| |
| | Year ended October 31, 2024 | | Year ended October 31, 2023 |
| Increase (Decrease) in Net Assets | | | | |
| Operations | | | | |
| Net investment income (loss) | $ | 23,217 | $ | 29,376 |
| Net realized gain (loss) | | 115,100 | | (24,988) |
| Change in net unrealized appreciation (depreciation) | | 3,784,350 | | 1,077,041 |
| Net increase (decrease) in net assets resulting from operations | | 3,922,667 | | 1,081,429 |
| Distributions to shareholders | | (40,077) | | - |
| | | | | |
| Share transactions | | | | |
| Proceeds from sales of shares | | 3,151,353 | | 1,803,511 |
| Reinvestment of distributions | | 37,070 | | - |
| Cost of shares redeemed | | (3,644,639) | | (2,959,519) |
| | | | | |
Net increase (decrease) in net assets resulting from share transactions | | (456,216) | | (1,156,008) |
| Total increase (decrease) in net assets | | 3,426,374 | | (74,579) |
| | | | | |
| Net Assets | | | | |
| Beginning of period | | 11,133,603 | | 11,208,182 |
| End of period | $ | 14,559,977 | $ | 11,133,603 |
| | | | | |
| Other Information | | | | |
| Shares | | | | |
| Sold | | 214,984 | | 142,807 |
| Issued in reinvestment of distributions | | 2,733 | | - |
| Redeemed | | (244,199) | | (242,007) |
| Net increase (decrease) | | (26,482) | | (99,200) |
| | | | | |
Financial Highlights
Fidelity® Enduring Opportunities Fund |
| |
| Years ended October 31, | | 2024 | | 2023 | | 2022 | | 2021 | | 2020 A |
Selected Per-Share Data | | | | | | | | | | |
| Net asset value, beginning of period | $ | 12.03 | $ | 10.94 | $ | 16.69 | $ | 11.91 | $ | 10.00 |
| Income from Investment Operations | | | | | | | | | | |
Net investment income (loss) B,C | | .02 | | .03 | | .01 | | (.04) | | (.01) |
| Net realized and unrealized gain (loss) | | 4.19 | | 1.06 | | (5.32) | | 4.82 | | 1.93 |
| Total from investment operations | | 4.21 | | 1.09 | | (5.31) | | 4.78 | | 1.92 |
| Distributions from net investment income | | (.04) | | - | | (.03) | | - | | - D |
| Distributions from net realized gain | | - | | - | | (.41) | | - | | - |
| Distributions from tax return of capital | | - | | - | | - | | - | | (.01) |
| Total distributions | | (.04) | | - | | (.44) | | - | | (.01) |
| Net asset value, end of period | $ | 16.20 | $ | 12.03 | $ | 10.94 | $ | 16.69 | $ | 11.91 |
Total Return E,F | | | | 9.96% | | (32.65)% | | 40.13% | | 19.22% |
Ratios to Average Net Assets C,G,H | | | | | | | | | | |
| Expenses before reductions | | 1.18% | | 1.51% | | 1.41% | | 1.70% | | 2.63% I |
| Expenses net of fee waivers, if any | | | | .94% | | .98% | | 1.08% | | 1.10% I |
| Expenses net of all reductions | | .95% | | .94% | | .98% | | 1.08% | | 1.09% I |
| Net investment income (loss) | | .17% | | .25% | | .05% | | (.25)% | | (.10)% I |
| Supplemental Data | | | | | | | | | | |
| Net assets, end of period (000 omitted) | $ | 14,560 | $ | 11,134 | $ | 11,208 | $ | 21,492 | $ | 10,055 |
Portfolio turnover rate J | | | | 19% | | 15% | | 23% | | 17% I |
AFor the period November 5, 2019 (commencement of operations) through October 31, 2020.
BCalculated based on average shares outstanding during the period.
CNet investment income (loss) is affected by the timing of the declaration of dividends by any underlying mutual funds or exchange-traded funds (ETFs). Net investment income (loss) of any mutual funds or ETFs is not included in the Fund's net investment income (loss) ratio.
DAmount represents less than $.005 per share.
ETotal returns for periods of less than one year are not annualized.
FTotal returns would have been lower if certain expenses had not been reduced during the applicable periods shown.
GFees and expenses of any underlying mutual funds or exchange-traded funds (ETFs) are not included in the Fund's expense ratio. The Fund indirectly bears its proportionate share of these expenses. For additional expense information related to investments in Fidelity Central Funds, please refer to the "Investments in Fidelity Central Funds" note found in the Notes to Financial Statements section of the most recent Annual or Semi-Annual report.
HExpense ratios reflect operating expenses of the class. Expenses before reductions do not reflect amounts reimbursed, waived, or reduced through arrangements with the investment adviser, brokerage services, or other offset arrangements, if applicable, and do not represent the amount paid by the class during periods when reimbursements, waivers or reductions occur.
IAnnualized.
JAmount does not include the portfolio activity of any underlying mutual funds or exchange-traded funds (ETFs).
Notes to Financial Statements
For the period ended October 31, 2024
1. Organization.
Fidelity Enduring Opportunities Fund (the Fund) is a fund of Fidelity Investment Trust (the Trust) and is authorized to issue an unlimited number of shares. Share transactions on the Statement of Changes in Net Assets may contain exchanges between affiliated funds. The Trust is registered under the Investment Company Act of 1940, as amended (the 1940 Act), as an open-end management investment company organized as a Massachusetts business trust. The Fund's investments in emerging markets can be subject to social, economic, regulatory, and political uncertainties and can be extremely volatile.
2. Investments in Fidelity Central Funds.
Funds may invest in Fidelity Central Funds, which are open-end investment companies generally available only to other investment companies and accounts managed by the investment adviser and its affiliates. The Schedule of Investments lists any Fidelity Central Funds held as an investment as of period end, but does not include the underlying holdings of each Fidelity Central Fund. An investing fund indirectly bears its proportionate share of the expenses of the underlying Fidelity Central Funds.
Based on its investment objective, each Fidelity Central Fund may invest or participate in various investment vehicles or strategies that are similar to those of the investing fund. These strategies are consistent with the investment objectives of the investing fund and may involve certain economic risks which may cause a decline in value of each of the Fidelity Central Funds and thus a decline in the value of the investing fund.
| Fidelity Central Fund | Investment Manager | Investment Objective | Investment Practices | Expense RatioA |
| Fidelity Money Market Central Funds | Fidelity Management & Research Company LLC (FMR) | Each fund seeks to obtain a high level of current income consistent with the preservation of capital and liquidity. | Short-term Investments | Less than .005% |
A Expenses expressed as a percentage of average net assets and are as of each underlying Central Fund's most recent annual or semi-annual shareholder report.
A complete unaudited list of holdings for each Fidelity Central Fund is available upon request or at the Securities and Exchange Commission website at www.sec.gov. In addition, the financial statements of the Fidelity Central Funds which contain the significant accounting policies (including investment valuation policies) of those funds, and are not covered by the Report of Independent Registered Public Accounting Firm, are available on the Securities and Exchange Commission website or upon request.
3. Significant Accounting Policies.
The Fund is an investment company and applies the accounting and reporting guidance of the Financial Accounting Standards Board (FASB) Accounting Standards Codification Topic 946 Financial Services - Investment Companies. The financial statements have been prepared in conformity with accounting principles generally accepted in the United States of America (GAAP), which require management to make certain estimates and assumptions at the date of the financial statements. Actual results could differ from those estimates. Subsequent events, if any, through the date that the financial statements were issued have been evaluated in the preparation of the financial statements. The Fund's Schedule of Investments lists any underlying mutual funds or exchange-traded funds (ETFs) but does not include the underlying holdings of these funds. The following summarizes the significant accounting policies of the Fund:
Investment Valuation. Investments are valued as of 4:00 p.m. Eastern time on the last calendar day of the period. The Board of Trustees (the Board) has designated the Fund's investment adviser as the valuation designee responsible for the fair valuation function and performing fair value determinations as needed. The investment adviser has established a Fair Value Committee (the Committee) to carry out the day-to-day fair valuation responsibilities and has adopted policies and procedures to govern the fair valuation process and the activities of the Committee. In accordance with these fair valuation policies and procedures, which have been approved by the Board, the Fund attempts to obtain prices from one or more third party pricing services or brokers to value its investments. When current market prices, quotations or currency exchange rates are not readily available or reliable, investments will be fair valued in good faith by the Committee, in accordance with the policies and procedures. Factors used in determining fair value vary by investment type and may include market or investment specific events, transaction data, estimated cash flows, and market observations of comparable investments. The frequency that the fair valuation procedures are used cannot be predicted and they may be utilized to a significant extent. The Committee manages the Fund's fair valuation practices and maintains the fair valuation policies and procedures. The Fund's investment adviser reports to the Board information regarding the fair valuation process and related material matters.
The Fund categorizes the inputs to valuation techniques used to value its investments into a disclosure hierarchy consisting of three levels as shown below:
Level 1 - unadjusted quoted prices in active markets for identical investments
Level 2 - other significant observable inputs (including quoted prices for similar investments, interest rates, prepayment speeds, etc.)
Level 3 - unobservable inputs (including the Fund's own assumptions based on the best information available)
Valuation techniques used to value the Fund's investments by major category are as follows:
Equity securities, including restricted securities, for which market quotations are readily available, are valued at the last reported sale price or official closing price as reported by a third party pricing service on the primary market or exchange on which they are traded and are categorized as Level 1 in the hierarchy. In the event there were no sales during the day or closing prices are not available, securities are valued at the last quoted bid price or may be valued using the last available price and are generally categorized as Level 2 in the hierarchy. For foreign equity securities, when market or security specific events arise, comparisons to the valuation of American Depositary Receipts (ADRs), futures contracts, Exchange-Traded Funds (ETFs) and certain indexes as well as quoted prices for similar securities may be used and would be categorized as Level 2 in the hierarchy. For equity securities, including restricted securities, where observable inputs are limited, assumptions about market activity and risk are used and these securities may be categorized as Level 3 in the hierarchy.
Investments in open-end mutual funds, including the Fidelity Central Funds, are valued at their closing net asset value (NAV) each business day and are categorized as Level 1 in the hierarchy.
Changes in valuation techniques may result in transfers in or out of an assigned level within the disclosure hierarchy. The aggregate value of investments by input level as of October 31, 2024 is included at the end of the Fund's Schedule of Investments.
Foreign Currency. Certain Funds may use foreign currency contracts to facilitate transactions in foreign-denominated securities. Gains and losses from these transactions may arise from changes in the value of the foreign currency or if the counterparties do not perform under the contracts' terms.
Foreign-denominated assets, including investment securities, and liabilities are translated into U.S. dollars at the exchange rates at period end. Purchases and sales of investment securities, income and dividends received, and expenses denominated in foreign currencies are translated into U.S. dollars at the exchange rate in effect on the transaction date.
The effects of exchange rate fluctuations on investments are included with the net realized and unrealized gain (loss) on investment securities. Other foreign currency transactions resulting in realized and unrealized gain (loss) are disclosed separately.
Investment Transactions and Income. For financial reporting purposes, the Fund's investment holdings and NAV include trades executed through the end of the last business day of the period. The NAV per share for processing shareholder transactions is calculated as of the close of business of the New York Stock Exchange (NYSE), normally 4:00 p.m. Eastern time and includes trades executed through the end of the prior business day. Gains and losses on securities sold are determined on the basis of identified cost. Commissions paid to certain brokers with whom the investment adviser, or its affiliates, places trades on behalf of a fund include an amount in addition to trade execution, which may be rebated back to a fund. Any such rebates are included in net realized gain (loss) on investments in the Statement of Operations. Dividend income is recorded on the ex-dividend date, except for certain dividends from foreign securities where the ex-dividend date may have passed, which are recorded as soon as the Fund is informed of the ex-dividend date. Non-cash dividends included in dividend income, if any, are recorded at the fair market value of the securities received. Income and capital gain distributions from Fidelity Central Funds, if any, are recorded on the ex-dividend date. Certain distributions received by the Fund represent a return of capital or capital gain. The Fund determines the components of these distributions subsequent to the ex-dividend date, based upon receipt of tax filings or other correspondence relating to the underlying investment. These distributions are recorded as a reduction of cost of investments and/or as a realized gain. Investment income is recorded net of foreign taxes withheld where recovery of such taxes is uncertain. Funds may file withholding tax reclaims in certain jurisdictions to recover a portion of amounts previously withheld. Any withholding tax reclaims income is included in the Statement of Operations in foreign taxes withheld. Any receivables for withholding tax reclaims are included in the Statement of Assets and Liabilities in dividends receivable.
Expenses. Expenses directly attributable to a fund are charged to that fund. Expenses attributable to more than one fund are allocated among the respective funds on the basis of relative net assets or other appropriate methods. Expenses included in the accompanying financial statements reflect the expenses of that fund and do not include any expenses associated with any underlying mutual funds or exchange-traded funds. Although not included in a fund's expenses, a fund indirectly bears its proportionate share of these expenses through the net asset value of each underlying mutual fund or exchange-traded fund. Expense estimates are accrued in the period to which they relate and adjustments are made when actual amounts are known.
Income Tax Information and Distributions to Shareholders. Each year, the Fund intends to qualify as a regulated investment company under Subchapter M of the Internal Revenue Code, including distributing substantially all of its taxable income and realized gains. As a result, no provision for U.S. Federal income taxes is required. As of October 31, 2024, the Fund did not have any unrecognized tax benefits in the financial statements; nor is the Fund aware of any tax positions for which it is reasonably possible that the total amounts of unrecognized tax benefits will significantly change in the next twelve months. The Fund files a U.S. federal tax return, in addition to state and local tax returns as required. The Fund's federal income tax returns are subject to examination by the Internal Revenue Service (IRS) for a period of three fiscal years after they are filed. State and local tax returns may be subject to examination for an additional fiscal year depending on the jurisdiction. Foreign taxes are provided for based on the Fund's understanding of the tax rules and rates that exist in the foreign markets in which it invests. The Fund is subject to a tax imposed on capital gains by certain countries in which it invests. An estimated deferred tax liability for net unrealized appreciation on the applicable securities is included in Deferred taxes on the Statement of Assets and Liabilities.
Distributions are declared and recorded on the ex-dividend date. Income and capital gain distributions are determined in accordance with income tax regulations, which may differ from GAAP. In addition, the Fund claimed a portion of the payment made to redeeming shareholders as a distribution for income tax purposes.
Capital accounts within the financial statements are adjusted for permanent book-tax differences. These adjustments have no impact on net assets or the results of operations. Capital accounts are not adjusted for temporary book-tax differences which will reverse in a subsequent period.
Book-tax differences are primarily due to foreign currency transactions, certain foreign taxes, passive foreign investment companies (PFIC), capital loss carryforwards and losses deferred due to wash sales.
As of period end, the cost and unrealized appreciation (depreciation) in securities, and derivatives if applicable, for federal income tax purposes were as follows:
| Gross unrealized appreciation | $5,265,398 |
| Gross unrealized depreciation | (649,637) |
| Net unrealized appreciation (depreciation) | $4,615,761 |
| Tax Cost | $9,977,149 |
The tax-based components of distributable earnings as of period end were as follows:
| Undistributed ordinary income | $35,168 |
| Capital loss carryforward | $(912,463) |
| Net unrealized appreciation (depreciation) on securities and other investments | $4,615,762 |
Capital loss carryforwards are only available to offset future capital gains of the Fund to the extent provided by regulations and may be limited. The capital loss carryforward information presented below, including any applicable limitation, is estimated as of fiscal period end and is subject to adjustment.
Short-term | $(449,844) |
Long-term | (462,619) |
| Total capital loss carryforward | $(912,463) |
The tax character of distributions paid was as follows:
| | October 31, 2024 | October 31, 2023 |
| Ordinary Income | $40,077 | $- |
Restricted Securities (including Private Placements). Funds may invest in securities that are subject to legal or contractual restrictions on resale. These securities generally may be resold in transactions exempt from registration or to the public if the securities are registered. Disposal of these securities may involve time-consuming negotiations and expense, and prompt sale at an acceptable price may be difficult. Information regarding restricted securities held at period end is included at the end of the Schedule of Investments, if applicable.
New Accounting Pronouncement. In November 2023, the FASB issued Accounting Standards Update (ASU) 2023-07 Segment Reporting (Topic 280): Improvements to Reportable Segment Disclosures. Effective for fiscal years beginning after December 15, 2023 and interim periods within fiscal years beginning after December 15, 2024, the amendments enhance required disclosures of segment information for public entities on an annual and interim basis. The ASU allows for early adoption with updates applied retrospectively. Management is currently evaluating the impact of the ASU but does not expect this guidance to materially impact the financial statements.
4. Purchases and Sales of Investments.
Purchases and sales of securities, other than short-term securities and in-kind transactions, as applicable, are noted in the table below.
| | Purchases ($) | Sales ($) |
| Fidelity Enduring Opportunities Fund | 2,507,084 | 2,909,895 |
5. Fees and Other Transactions with Affiliates.
Management Fee. Fidelity Management & Research Company LLC (the investment adviser) and its affiliates provide the Fund with investment management related services for which the Fund pays a monthly management fee.
Effective March 1, 2024, the Fund's management contract was amended to incorporate administrative services previously covered under separate services agreements (Transfer Agent and Accounting agreements). Any reference to "class" in this note shall mean "the Fund" as the Fund currently offers only one class of shares. The amended contract incorporates a basic fee rate that may vary by class (subject to a performance adjustment). The investment adviser or an affiliate pays certain expenses of managing and operating the Fund out of each class's management fee. Each class of the Fund pays a management fee to the investment adviser. The management fee is calculated and paid to the investment adviser every month. The management fee is determined by calculating a basic fee and then applying a performance adjustment. When determining a class's basic fee, a mandate rate is calculated based on the monthly average net assets of a group of funds advised by FMR within a designated asset class. A discount rate is subtracted from the mandate rate once the Fund's monthly average net assets reach a certain level. The mandate rate and discount rate may vary by class. The annual basic fee rate for a class of shares of the Fund is the lesser of (1) the class's mandate rate reduced by the class's discount rate (if applicable) or (2) the amount set forth in the following table.
| | Maximum Management Fee Rate % |
| Fidelity Enduring Opportunities Fund | .77 |
One-twelfth of the basic fee rate for a class is applied to the average net assets of the class for the month, giving a dollar amount which is the basic fee for the class for that month. A different management fee rate may be applicable to each class of the Fund. The difference between classes is the result of separate arrangements for class-level services and/or waivers of certain expenses. It is not the result of any difference in advisory or custodial fees or other expenses related to the management of the Fund's assets, which do not vary by class. For the portion of the reporting period on or after March 1, 2024, the total annualized management fee rates were as follows:
| | Total Management Fee Rate % |
| Fidelity Enduring Opportunities Fund | .73 |
Prior to March 1, 2024, the management fee was the sum of an individual fund fee rate that was based on an annual rate of .35% of the Fund's average net assets and an annualized group fee rate that averaged .22% during the period. The group fee rate was based upon the monthly average net assets of a group of registered investment companies with which the investment adviser has management contracts. The group fee rate decreased as assets under management increased and increased as assets under management decreased. For the portion of the reporting period prior to March 1, 2024, the total annualized management fee rate was .57%.
The performance adjustment rate is calculated monthly by comparing over the performance period the Fund's performance to that of the performance adjustment index listed below.
| | Performance Adjustment Index |
| Fidelity Enduring Opportunities Fund | MSCI ACWI (All Country World Index) Index |
For the purposes of calculating the performance adjustment for the Fund, the Fund's investment performance is based on the performance of the Fund. To the extent that other classes of the Fund have higher expenses, this could result in those classes bearing a larger positive performance adjustment and smaller negative performance adjustment than would be the case if each class's own performance were considered. The performance period is the most recent 36 month period. The maximum annualized performance adjustment rate is ±.20% of the Fund's average net assets over the performance period. The performance adjustment rate is divided by twelve and multiplied by the Fund's average net assets over the performance period, and the resulting dollar amount is proportionately added to or subtracted from a class's basic fee. For the entire reporting period, the total annual performance adjustment was (.21)%.
Effective March 1, 2024, the Fund's sub-advisory agreements with FMR Investment Management (UK) Limited, Fidelity Management & Research (Hong Kong) Limited, and Fidelity Management & Research (Japan) Limited were amended to provide that the investment adviser pays each sub-adviser monthly fees equal to 110% of the sub-adviser's costs for providing sub-advisory services.
Transfer Agent Fees. Fidelity Investments Institutional Operations Company LLC (FIIOC), an affiliate of the investment adviser, is the Fund's transfer, dividend disbursing and shareholder servicing agent. Effective March 1, 2024, each Fund's management contract was amended to incorporate transfer agent services and associated fees previously covered under a separate services agreement. FIIOC pays for typesetting, printing and mailing of shareholder reports, except proxy statements.
During the period December 1, 2023 through February 29, 2024, the transfer agent fees were a fixed annual rate of average net assets of .2000%.
Prior to December 1, 2023, FIIOC received account fees and asset-based fees that varied according to account size and type of account.
For the portion of the reporting period prior to March 1, 2024, the fees were equivalent to the annualized rate of .21% of average net assets.
Accounting Fees. Fidelity Service Company, Inc. (FSC), an affiliate of the investment adviser, maintains the Fund's accounting records. Effective March 1, 2024, the Fund's management contract was amended to incorporate accounting services and associated fees previously covered under a separate services agreement.
During the period December 1, 2023 through February 29, 2024, the accounting fees were a fixed annual rate of average net assets as follows:
| | % of Average Net Assets |
| Fidelity Enduring Opportunities Fund | .0354 |
Prior to December 1, 2023, the accounting fee was based on the level of average net assets for each month. For the portion of the reporting period prior to March 1, 2024, the fees were equivalent to the following annualized rates:
| | % of Average Net Assets |
| Fidelity Enduring Opportunities Fund | .04 |
Brokerage Commissions. A portion of portfolio transactions were placed with brokerage firms which are affiliates of the investment adviser. Brokerage commissions are included in net realized gain (loss) and change in net unrealized appreciation (depreciation) in the Statement of Operations. The commissions paid to these affiliated firms were as follows:
| | Amount ($) |
| Fidelity Enduring Opportunities Fund | 18 |
Interfund Trades. Funds may purchase from or sell securities to other Fidelity Funds under procedures adopted by the Board. The procedures have been designed to ensure these interfund trades are executed in accordance with Rule 17a-7 of the 1940 Act. Any interfund trades are included within the respective purchases and sales amounts shown in the Purchases and Sales of Investments note. Interfund trades during the period are noted in the table below.
| | Purchases ($) | Sales ($) | Realized Gain (Loss)($) |
| Fidelity Enduring Opportunities Fund | 202,195 | 71,440 | (39,659) |
6. Committed Line of Credit.
Certain Funds participate with other funds managed by the investment adviser or an affiliate in a $4.25 billion credit facility (the "line of credit") to be utilized for temporary or emergency purposes to fund shareholder redemptions or for other short-term liquidity purposes. The participating funds have agreed to pay commitment fees on their pro-rata portion of the line of credit, which are reflected in Miscellaneous expenses on the Statement of Operations, and are listed below. During the period, there were no borrowings on this line of credit.
| | Amount ($) |
| Fidelity Enduring Opportunities Fund | 22 |
7. Expense Reductions.
The investment adviser contractually agreed to reimburse the Fund to the extent annual operating expenses exceeded .95% of average net assets. This reimbursement will remain in place through February 28, 2026. Some expenses, for example the compensation of the independent Trustees, and certain miscellaneous expenses such as proxy and shareholder meeting expenses, are excluded from this reimbursement. During the period this reimbursement reduced the Fund's expenses by $31,015.
Through arrangements with the Fund's custodian, credits realized as a result of certain uninvested cash balances were used to reduce the Fund's expenses by $427.
In addition, during the period the investment adviser or an affiliate reimbursed and/or waived a portion of operating expenses in the amount of $600.
8. Other.
A fund's organizational documents provide former and current trustees and officers with a limited indemnification against liabilities arising in connection with the performance of their duties to the fund. In the normal course of business, a fund may also enter into contracts that provide general indemnifications. A fund's maximum exposure under these arrangements is unknown as this would be dependent on future claims that may be made against a fund. The risk of material loss from such claims is considered remote.
At the end of the period, the investment adviser or its affiliates were owners of record of more than 10% of the outstanding shares as follows:
| Fund | Affiliated % |
| Fidelity Enduring Opportunities Fund. | 21% |
9. Risk and Uncertainties.
Many factors affect a fund's performance. Developments that disrupt global economies and financial markets, such as pandemics, epidemics, outbreaks of infectious diseases, war, terrorism, and environmental disasters, may significantly affect a fund's investment performance. The effects of these developments to a fund will be impacted by the types of securities in which a fund invests, the financial condition, industry, economic sector, and geographic location of an issuer, and a fund's level of investment in the securities of that issuer. Significant concentrations in security types, issuers, industries, sectors, and geographic locations may magnify the factors that affect a fund's performance.
Report of Independent Registered Public Accounting Firm
To the Board of Trustees of Fidelity Investment Trust and Shareholders of Fidelity Enduring Opportunities Fund
Opinion on the Financial Statements
We have audited the accompanying statement of assets and liabilities, including the schedule of investments, of Fidelity Enduring Opportunities Fund (one of the funds constituting Fidelity Investment Trust, referred to hereafter as the "Fund") as of October 31, 2024, the related statement of operations for the year ended October 31, 2024, the statement of changes in net assets for each of the two years in the period ended October 31, 2024, including the related notes, and the financial highlights for each of the four years in the period ended October 31, 2024 and for the period November 5, 2019 (commencement of operations) through October 31, 2020 (collectively referred to as the "financial statements"). In our opinion, the financial statements present fairly, in all material respects, the financial position of the Fund as of October 31, 2024, the results of its operations for the year then ended, the changes in its net assets for each of the two years in the period ended October 31, 2024 and the financial highlights for each of the four years in the period ended October 31, 2024 and for the period November 5, 2019 (commencement of operations) through October 31, 2020 in conformity with accounting principles generally accepted in the United States of America.
Basis for Opinion
These financial statements are the responsibility of the Fund's management. Our responsibility is to express an opinion on the Fund's financial statements based on our audits. We are a public accounting firm registered with the Public Company Accounting Oversight Board (United States) (PCAOB) and are required to be independent with respect to the Fund in accordance with the U.S. federal securities laws and the applicable rules and regulations of the Securities and Exchange Commission and the PCAOB.
We conducted our audits of these financial statements in accordance with the standards of the PCAOB. Those standards require that we plan and perform the audit to obtain reasonable assurance about whether the financial statements are free of material misstatement, whether due to error or fraud.
Our audits included performing procedures to assess the risks of material misstatement of the financial statements, whether due to error or fraud, and performing procedures that respond to those risks. Such procedures included examining, on a test basis, evidence regarding the amounts and disclosures in the financial statements. Our audits also included evaluating the accounting principles used and significant estimates made by management, as well as evaluating the overall presentation of the financial statements. Our procedures included confirmation of securities owned as of October 31, 2024 by correspondence with the custodian. We believe that our audits provide a reasonable basis for our opinion.
/s/ PricewaterhouseCoopers LLP
Boston, Massachusetts
December 16, 2024
We have served as the auditor of one or more investment companies in the Fidelity group of funds since 1932.
Distributions
(Unaudited)
The dividend and capital gains distributions for the fund(s) are available on Fidelity.com or Institutional.Fidelity.com.
The fund designates 100% of the dividend distributed during the fiscal year as qualifying for the dividends-received deduction for corporate shareholders.
The fund designates 100% of the dividend distributed during the fiscal year as amounts which may be taken into account as a dividend for the purposes of the maximum rate under section 1(h)(11) of the Internal Revenue Code.
The fund will notify shareholders in January 2025 of amounts for use in preparing 2024 income tax returns.
Item 8: Changes in and Disagreements with Accountants for Open-End Management Investment Companies
(Unaudited)
Note: This is not applicable for any fund included in this document.
Item 9: Proxy Disclosures for Open-End Management Investment Companies
(Unaudited)
| A special meeting of shareholders was held on July 16, 2024. The results of votes taken among shareholders on the proposal before them are reported below. Each vote reported represents one dollar of net asset value held on the record date for the meeting. |
| Proposal 1 |
| To elect a Board of Trustees. |
| | # of Votes | % of Votes |
| Bettina Doulton |
| Affirmative | 128,529,177,643.56 | 98.18 |
| Withheld | 2,378,037,364.30 | 1.82 |
| TOTAL | 130,907,215,007.85 | 100.00 |
| Robert A. Lawrence |
| Affirmative | 128,253,389,899.05 | 97.97 |
| Withheld | 2,653,825,108.81 | 2.03 |
| TOTAL | 130,907,215,007.85 | 100.00 |
| Vijay C. Advani |
| Affirmative | 128,531,418,228.19 | 98.19 |
| Withheld | 2,375,796,779.66 | 1.81 |
| TOTAL | 130,907,215,007.85 | 100.00 |
| Thomas P. Bostick |
| Affirmative | 128,495,261,591.41 | 98.16 |
| Withheld | 2,411,953,416.44 | 1.84 |
| TOTAL | 130,907,215,007.85 | 100.00 |
| Donald F. Donahue |
| Affirmative | 128,407,878,996.00 | 98.09 |
| Withheld | 2,499,336,011.85 | 1.91 |
| TOTAL | 130,907,215,007.85 | 100.00 |
| Vicki L. Fuller |
| Affirmative | 128,625,540,095.19 | 98.26 |
| Withheld | 2,281,674,912.66 | 1.74 |
| TOTAL | 130,907,215,007.85 | 100.00 |
| Patricia L. Kampling |
| Affirmative | 128,668,729,281.34 | 98.29 |
| Withheld | 2,238,485,726.51 | 1.71 |
| TOTAL | 130,907,215,007.85 | 100.00 |
| Thomas A. Kennedy |
| Affirmative | 128,499,824,239.79 | 98.16 |
| Withheld | 2,407,390,768.06 | 1.84 |
| TOTAL | 130,907,215,007.85 | 100.00 |
| Oscar Munoz |
| Affirmative | 128,386,109,391.05 | 98.07 |
| Withheld | 2,521,105,616.80 | 1.93 |
| TOTAL | 130,907,215,007.85 | 100.00 |
| Karen B. Peetz |
| Affirmative | 128,603,731,113.82 | 98.24 |
| Withheld | 2,303,483,894.03 | 1.76 |
| TOTAL | 130,907,215,007.85 | 100.00 |
| David M. Thomas |
| Affirmative | 128,384,899,342.98 | 98.07 |
| Withheld | 2,522,315,664.88 | 1.93 |
| TOTAL | 130,907,215,007.85 | 100.00 |
| Susan Tomasky |
| Affirmative | 128,556,148,461.60 | 98.20 |
| Withheld | 2,351,066,546.25 | 1.80 |
| TOTAL | 130,907,215,007.85 | 100.00 |
| Michael E. Wiley |
| Affirmative | 128,264,934,978.34 | 97.98 |
| Withheld | 2,642,280,029.51 | 2.02 |
| TOTAL | 130,907,215,007.85 | 100.00 |
| | | |
| Proposal 1 reflects trust-wide proposal and voting results. |
Item 10: Remuneration Paid to Directors, Officers, and others of Open-End Management Investment Companies
(Unaudited)
Note: This information is disclosed as part of the financial statements for each Fund as part of Item 7: Financial Statements and Financial Highlights for Open-End Management Investment companies.
Item 11: Statement Regarding Basis for Approval of Investment Advisory Contract
(Unaudited)
Board Approval of Investment Advisory Contracts and Management Fees
Fidelity Enduring Opportunities Fund
Each year, the Board of Trustees, including the Independent Trustees (together, the Board), considers the renewal of the fund's management contract with Fidelity Management & Research Company LLC (FMR) and certain affiliates and the sub-advisory agreements (together, the Advisory Contracts) for the fund. FMR and the sub-advisers are referred to herein as the Investment Advisers. The Board, assisted by the advice of fund counsel and Independent Trustees' counsel, requests and considers a broad range of information relevant to the renewal of the Advisory Contracts throughout the year.
The Board meets regularly and, at each of its meetings, covers an extensive agenda of topics and materials and considers factors that are relevant to its annual consideration of the renewal of the fund's Advisory Contracts, including the services and support provided to the fund and its shareholders. The Board, acting directly and through its Committees (each of which is composed of and chaired by Independent Trustees), requests and receives information concerning the annual consideration of the renewal of the fund's Advisory Contracts. The Board also meets as needed to review matters specifically related to the Board's annual consideration of the renewal of the Advisory Contracts. Members of the Board may also meet with trustees of other Fidelity funds through joint ad hoc committees to discuss certain matters relevant to all of the Fidelity funds.
At its May 2024 meeting, the Board unanimously determined to renew the fund's Advisory Contracts. In reaching its determination, the Board considered all factors it believed relevant, including (i) the nature, extent, and quality of the services provided to the fund and its shareholders (including the investment performance of the fund); (ii) the competitiveness relative to peer funds of the fund's management fee and total expense ratio; (iii) the total costs of the services provided by and the profits realized by FMR and its affiliates (Fidelity) from its relationships with the fund; and (iv) the extent to which, if any, economies of scale exist and are realized as the fund grows, and whether any economies of scale are appropriately shared with fund shareholders. The Board also considered the broad range of investment choices available to shareholders from FMR's competitors and that the fund's shareholders have chosen to invest in the fund, which is part of the Fidelity family of funds. The Board's decision to renew the Advisory Contracts was not based on any single factor.
The Board reached a determination, with the assistance of fund counsel and Independent Trustees' counsel and through the exercise of its business judgment, that the renewal of the Advisory Contracts was in the best interests of the fund and its shareholders and that the compensation payable under the Advisory Contracts was fair and reasonable in light of all of the surrounding circumstances.
Nature, Extent, and Quality of Services Provided. The Board considered staffing as it relates to the fund, including the backgrounds and experience of investment personnel of the Investment Advisers, and also considered the Investment Advisers' implementation of the fund's investment program. The Independent Trustees also had discussions with senior management of Fidelity's investment operations and investment groups. The Board considered the structure of the investment personnel compensation program and whether this structure provides appropriate incentives to act in the best interests of the fund. Additionally, the Board considered the portfolio managers' investments, if any, in the funds that they manage.
Resources Dedicated to Investment Management and Support Services. The Board and the Fund Oversight and Research Committees reviewed the general qualifications and capabilities of Fidelity's investment staff, including its size, education, experience, and resources, as well as Fidelity's approach to recruiting, training, managing, and compensating investment personnel. The Board noted the resources devoted to expansion of Fidelity's global investment organization, and that Fidelity's analysts have extensive resources, tools, and capabilities that allow them to conduct sophisticated quantitative and fundamental analysis, as well as credit analysis of issuers, counterparties, and guarantors. Further, the Board considered that Fidelity's investment professionals have sufficient access to global information and data so as to provide competitive investment results over time, and that those professionals also have access to sophisticated tools that permit them to assess portfolio construction and risk and performance attribution characteristics continuously, as well as to transmit new information and research conclusions rapidly around the world. Additionally, in its deliberations, the Board considered Fidelity's trading, risk management, compliance, and technology and operations capabilities and resources, which are integral parts of the investment management process.
Shareholder and Administrative Services. The Board considered (i) the nature, extent, quality, and cost of advisory, administrative, shareholder, transfer agency, and pricing and bookkeeping services performed by the Investment Advisers and their affiliates under the Advisory Contracts; (ii) the nature and extent of Fidelity's supervision of third party service providers, principally custodians, subcustodians, and pricing vendors; and (iii) the resources devoted by Fidelity to, and the record of compliance with, the fund's compliance policies and procedures. The Board also reviewed the allocation of fund brokerage, including allocations to brokers affiliated with the Investment Advisers, the use of brokerage commissions to pay fund expenses, and the use of "soft" commission dollars to pay for research services. The Board also considered the fund's securities lending activities and any payments made to Fidelity relating to securities lending under a separate agreement.
The Board noted that the growth of fund assets over time across the complex allows Fidelity to reinvest in the development of services designed to enhance the value and convenience of the Fidelity funds as investment vehicles. These services include 24-hour access to account information and market information over the Internet and through telephone representatives, investor education materials, and asset allocation tools. The Board also considered that it reviews customer service metrics such as telephone response times, continuity of services on the website and metrics addressing services at Fidelity Investor Centers.
Investment in a Large Fund Family. The Board considered the benefits to shareholders of investing in a fund that is part of a large family of funds offering a variety of investment disciplines and providing a large variety of fund investor services. The Board noted that Fidelity had taken, or had made recommendations that resulted in the Fidelity funds taking, a number of actions over the previous year that benefited particular funds and/or the Fidelity funds in general.
Investment Performance. The Board took into account discussions that occur with representatives of the Investment Advisers, and reports that it receives, at Board meetings throughout the year, relating to fund investment performance. In this regard the Board noted that as part of regularly scheduled fund reviews and other reports to the Board on fund performance, the Board considered annualized return information for the fund for different time periods, measured against an appropriate securities market index (benchmark index) and an appropriate peer group of funds with similar objectives (peer group). The Board also considered information about performance attribution. In its ongoing evaluation of fund investment performance, the Board gives particular attention to information indicating changes in performance of the funds over different time periods and discussed with the Investment Advisers the reasons for any overperformance or underperformance.
In addition to reviewing absolute and relative fund performance, the Independent Trustees periodically consider the appropriateness of fund performance metrics in evaluating the results achieved. The Independent Trustees generally give greater weight to fund performance over longer time periods than over shorter time periods. Depending on the circumstances, the Independent Trustees may be satisfied with a fund's performance notwithstanding that it lags its benchmark index or peer group for certain periods.
Based on its review, the Board concluded that the nature, extent, and quality of services provided to the fund under the Advisory Contracts should continue to benefit the shareholders of the fund.
Competitiveness of Management Fee and Total Expense Ratio. The Board was provided with information regarding industry trends in management fees and expenses. The Board considered that, effective March 1, 2024, an amended Advisory Contract with FMR went into effect with a fee based on tiered schedules and subject to a maximum class-level rate (the management fee). The Board also considered that in exchange for the management fee, the fund will receive investment advisory, management, administrative, transfer agent, and pricing and bookkeeping services. In its review of the fund's management fee and total expense ratio, the Board considered the fund's pro forma management fee rate as if it had been in effect for the 12-month period ended September 30, 2023, as well as other third-party fund expenses, such as custodial, legal, and audit fees. The Board noted that Fidelity may agree to waive fees or reimburse expenses from time to time, and the extent to which, if any, it has done so for the fund.
Comparisons of Management Fees and Total Expense Ratios. Among other things, the Board reviewed data for selected groups of competitive funds and classes (referred to as "mapped groups") that were compiled by Fidelity based on combining similar investment objective categories (as classified by Morningstar) that have comparable investment mandates. The data reviewed by the Board included (i) gross management fee comparisons (before taking into account expense reimbursements or caps) relative to the total universe of funds within the mapped group; (ii) gross management fee comparisons relative to a subset of non-Fidelity funds in the mapped group that are similar in size and management fee structure to the fund (referred to as the "asset size peer group"); (iii) total expense comparisons of the fund relative to funds and classes in the mapped group that have a similar sales load structure to the fund (referred to as the "similar sales load structure group"); and (iv) total expense comparisons of the fund relative to funds and classes in the similar sales load structure group that are similar in size and management fee structure to the fund (referred to as the "total expense asset size peer group"). The total expense asset size peer group comparison excludes performance adjustments and fund-paid 12b-1 fees to eliminate variability in fee structures.
The information provided to the Board indicated that the fund's management fee rate ranked below the competitive median of the mapped group for the 12-month period ended September 30, 2023 and below the competitive median of the asset size peer group for the 12-month period ended September 30, 2023. Further, the information provided to the Board indicated that the total expense ratio of the fund ranked below the competitive median of the similar sales load structure group for the 12-month period ended September 30, 2023 and above the competitive median of the total expense asset size peer group for the 12-month period ended September 30, 2023.
The Board also considered that the fund's management fee is subject to upward or downward adjustment depending upon whether, and to what extent, the fund's investment performance for the performance period (a rolling 36-month period) exceeds, or is exceeded by, a securities index, thus leading to a performance adjustment for the same period. The Board noted that the performance adjustment provides FMR with a strong economic incentive to seek to achieve superior long-term performance for the fund's shareholders and helps to more closely align the interests of FMR and the shareholders of the fund.
Other Contractual Arrangements. The Board further considered that FMR has contractually agreed to reimburse the fund to the extent that total operating expenses, with certain exceptions, as a percentage of its average net assets, exceed 0.95% through February 28, 2025.
Fees Charged to Other Fidelity Clients. The Board also considered Fidelity fee structures and other information with respect to clients of Fidelity, such as other funds advised or subadvised by Fidelity, pension plan clients, and other institutional clients with similar mandates. The Board noted that a joint ad hoc committee created by it and the boards of other Fidelity funds periodically reviews and compares Fidelity's institutional investment advisory business with its business of providing services to the Fidelity funds and also noted the most recent findings of the committee. The Board noted that the committee's review included a consideration of the differences in services provided, fees charged, and costs incurred, as well as competition in the markets serving the different categories of clients.
Based on its review, the Board concluded that the fund's management fee is fair and reasonable in light of the services that the fund receives and the other factors considered. Further based on its review of total expense ratios and fees charged to other Fidelity clients, the Board concluded that the fund's total expense ratio was reasonable in light of the services that the fund and its shareholders receive and the other factors considered.
Costs of the Services and Profitability. The Board considered the revenues earned and the expenses incurred by Fidelity in conducting the business of developing, marketing, distributing, managing, administering and servicing the fund and servicing the fund's shareholders. The Board also considered the level of Fidelity's profits in respect of all the Fidelity funds.
On an annual basis, Fidelity presents to the Board information about the profitability of its relationships with the fund. Fidelity calculates profitability information for each fund, as well as aggregate profitability information for groups of Fidelity funds and all Fidelity funds, using a series of detailed revenue and cost allocation methodologies which originate with the books and records of Fidelity on which Fidelity's audited financial statements are based. The Audit Committee of the Board reviews any significant changes from the prior year's methodologies.
A public accounting firm has been engaged annually by the Board as part of the Board's assessment of Fidelity's profitability analysis. The engagement includes the review and assessment of the methodologies used by Fidelity in determining the revenues and expenses attributable to Fidelity's fund business, and completion of agreed-upon procedures in respect of the mathematical accuracy of certain fund profitability information and its conformity to established allocation methodologies. After considering the reports issued under the engagement and information provided by Fidelity, the Board concluded that while other allocation methods may also be reasonable, Fidelity's profitability methodologies are reasonable in all material respects.
The Board also reviewed Fidelity's non-fund businesses and potential indirect benefits such businesses may have received as a result of their association with Fidelity's fund business (i.e., fall-out benefits) as well as cases where Fidelity's affiliates may benefit from the funds' business. The Board considered areas where potential indirect benefits to the Fidelity funds from their relationships with Fidelity may exist. The Board's consideration of these matters was informed by the findings of a joint ad hoc committee created by it and the boards of other Fidelity funds to evaluate potential fall-out benefits.
The Board considered the costs of the services provided by and the profits realized by Fidelity in connection with the operation of the fund and was satisfied that the profitability was not excessive.
Economies of Scale. The Board considered whether there have been economies of scale in respect of the management of the Fidelity funds, whether the Fidelity funds (including the fund) have appropriately benefited from any such economies of scale, and whether there is potential for realization of any further economies of scale. The Board considered the extent to which the fund will benefit from economies of scale as assets grow through increased services to the fund, through waivers or reimbursements, or through fee or expense ratio reductions. The Board also noted that a committee created by it and the boards of other Fidelity funds periodically analyzes whether Fidelity attains economies of scale in respect of the management and servicing of the Fidelity funds, whether the Fidelity funds have appropriately benefited from such economies of scale, and whether there is potential for realization of any further economies of scale.
The Board recognized that the fund's management contract incorporates a variable management fee structure, which provides breakpoints as a way to share, in part, any potential economies of scale that may exist at the asset class level and through a discount that considers both fund size and total assets of the four applicable asset classes. The Board considered that the variable management fee is designed to deliver the benefits of economies of scale to fund shareholders even if assets of any particular fund are unchanged or have declined, because some portion of Fidelity's costs are attributable to services provided to all funds subject to the variable management fee, and all such funds benefit if those costs can be allocated among more assets. The Board concluded that, given the variable management fee structure, fund shareholders will benefit from lower management fees due to the application of the breakpoints and discount factor, regardless of whether Fidelity achieves any such economies of scale.
The Board concluded, taking into account the analysis of the committee, that economies of scale, if any, are being appropriately shared between fund shareholders and Fidelity.
Additional Information Requested by the Board. In order to develop fully the factual basis for consideration of the Fidelity funds' advisory contracts, the Board requested and received additional information on certain topics, including but not limited to: (i) fund flow and performance trends, in particular the underperformance of certain funds and strategies, and Fidelity's long-term strategies for certain funds; (ii) the operation of performance fees and the rationale for implementing performance fees on certain categories of funds but not others; (iii) Fidelity's pricing philosophy compared to competitors; (iv) fund profitability methodology and data; (v) evaluation of competitive fund data and peer group classifications and fee and expense comparisons; (vi) the management fee and expense structures for different funds and classes and information about the differences between various fee and expense structures; (vii) the variable management fee implemented for certain funds effective March 1, 2024; and (viii) information regarding other accounts managed by Fidelity and the funds' sub-advisory arrangements.
Conclusion. Based on its evaluation of all of the conclusions noted above, and after considering all factors it believed relevant, the Board, including the Independent Trustees, concluded that the advisory and sub-advisory fee arrangements are fair and reasonable in light of all of the surrounding circumstances and that the fund's Advisory Contracts should be renewed through May 31, 2025.
1.9896221.104
IDF-ANN-1224
Fidelity® SAI Sustainable Emerging Markets Equity Fund
Annual Report
October 31, 2024
Offered exclusively to certain clients of the Adviser, or its affiliates, including Strategic Advisers LLC (Strategic Advisers) - not available for sale to the general public. Fidelity® SAI is a product name of Fidelity® funds dedicated to certain programs affiliated with Strategic Advisers.
Contents
To view a fund's proxy voting guidelines and proxy voting record for the 12-month period ended June 30, visit http://www.fidelity.com/proxyvotingresults or visit the Securities and Exchange Commission's (SEC) web site at http://www.sec.gov.
You may also call 1-800-544-3455 to request a free copy of the proxy voting guidelines.
Standard & Poor's, S&P and S&P 500 are registered service marks of The McGraw-Hill Companies, Inc. and have been licensed for use by Fidelity Distributors Corporation.
Other third-party marks appearing herein are the property of their respective owners.
All other marks appearing herein are registered or unregistered trademarks or service marks of FMR LLC or an affiliated company. © 2024 FMR LLC. All rights reserved.
This report and the financial statements contained herein are submitted for the general information of the shareholders of the Fund. This report is not authorized for distribution to prospective investors in the Fund unless preceded or accompanied by an effective prospectus.
A fund files its complete schedule of portfolio holdings with the SEC for the first and third quarters of each fiscal year on Form N-PORT. Forms N-PORT are available on the SEC's web site at http://www.sec.gov. A fund's Forms N-PORT may be reviewed and copied at the SEC's Public Reference Room in Washington, DC. Information regarding the operation of the SEC's Public Reference Room may be obtained by calling 1-800-SEC-0330.
For a complete list of a fund's portfolio holdings, view the most recent holdings listing, semiannual report, or annual report on Fidelity's web site at http://www.fidelity.com, http://www.institutional.fidelity.com, or http://www.401k.com, as applicable.
NOT FDIC INSURED •MAY LOSE VALUE •NO BANK GUARANTEE
Neither the Fund nor Fidelity Distributors Corporation is a bank.
Item 7: Financial Statements and Financial Highlights for Open-End Management Investment Companies (Annual Report)
Fidelity® SAI Sustainable Emerging Markets Equity Fund
Schedule of Investments October 31, 2024
Showing Percentage of Net Assets
| Common Stocks - 95.7% |
| | | Shares | Value ($) |
| Brazil - 6.3% | | | |
| Banco Bradesco SA | | 25,042 | 55,188 |
| Banco BTG Pactual SA unit | | 42,787 | 240,695 |
| Banco do Brasil SA | | 22,811 | 103,896 |
| Gerdau SA sponsored ADR | | 60,550 | 188,916 |
| Hapvida Participacoes e Investimentos SA (a)(b) | | 66,452 | 40,463 |
| Itau Unibanco Holding SA | | 79,493 | 481,559 |
| Localiza Rent a Car SA | | 36,289 | 263,776 |
| Nu Holdings Ltd. Class A (a) | | 28,924 | 436,463 |
| Raia Drogasil SA | | 23,275 | 97,997 |
| Vale SA sponsored ADR | | 7,346 | 78,602 |
| Vamos Locacao de Caminhoes Maquinas e Equipamentos SA | | 150,484 | 163,737 |
| Weg SA | | 30,780 | 288,105 |
TOTAL BRAZIL | | | 2,439,397 |
| China - 31.1% | | | |
| Airtac International Group | | 2,112 | 58,650 |
| Alibaba Group Holding Ltd. | | 134,216 | 1,641,772 |
| BYD Co. Ltd. (H Shares) | | 12,583 | 454,481 |
| China Construction Bank Corp. (H Shares) | | 832,353 | 646,103 |
| China Life Insurance Co. Ltd. (H Shares) | | 160,511 | 340,242 |
| China Merchants Bank Co. Ltd. (H Shares) | | 51,842 | 253,690 |
| China Pacific Insurance (Group) Co. Ltd. (H Shares) | | 7,540 | 26,185 |
| China Resources Beverage Holdings Co. Ltd. | | 43,325 | 84,032 |
| Contemporary Amperex Technology Co. Ltd. | | 13,065 | 453,287 |
| Flat Glass Group Co. Ltd. | | 19,405 | 39,545 |
| Flat Glass Group Co. Ltd. (A Shares) | | 8,100 | 32,745 |
| Fuyao Glass Industries Group Co. Ltd. (A Shares) | | 8,156 | 65,237 |
| Haier Smart Home Co. Ltd. | | 112,703 | 409,025 |
| Innovent Biologics, Inc. (a)(b) | | 21,599 | 93,895 |
| JD.com, Inc.: | | | |
| Class A | | 4,061 | 82,354 |
| sponsored ADR | | 11,301 | 459,047 |
| KE Holdings, Inc. ADR | | 6,949 | 152,392 |
| Kweichow Moutai Co. Ltd. (A Shares) | | 215 | 46,161 |
| Li Auto, Inc. Class A (a) | | 23,487 | 295,351 |
| Meituan Class B (a)(b) | | 23,186 | 547,894 |
| Midea Group Co. Ltd. (H Shares) | | 21,872 | 203,878 |
| NAURA Technology Group Co. Ltd. | | 2,784 | 153,199 |
| New Oriental Education & Technology Group, Inc. sponsored ADR | | 2,784 | 174,278 |
| PDD Holdings, Inc. ADR (a) | | 4,498 | 542,414 |
| Ping An Insurance Group Co. of China Ltd. (H Shares) | | 95,456 | 591,425 |
| Shenzhen Mindray Bio-Medical Electronics Co. Ltd. (A Shares) | | 3,647 | 136,590 |
| Shenzhou International Group Holdings Ltd. | | 7,439 | 57,444 |
| Sinotruk Hong Kong Ltd. | | 14,568 | 39,320 |
| Tencent Holdings Ltd. | | 46,714 | 2,435,768 |
| Trip.com Group Ltd. ADR (a) | | 3,578 | 230,423 |
| Xiaomi Corp. Class B (a)(b) | | 172,728 | 592,439 |
| Yum China Holdings, Inc. | | 4,087 | 180,278 |
| Zai Lab Ltd. ADR (a) | | 6,351 | 191,927 |
| Zijin Mining Group Co. Ltd. (H Shares) | | 166,052 | 353,703 |
TOTAL CHINA | | | 12,065,174 |
| Greece - 0.3% | | | |
| OPAP SA | | 6,507 | 110,983 |
| Hungary - 1.4% | | | |
| OTP Bank PLC | | 7,688 | 382,689 |
| Richter Gedeon PLC | | 4,948 | 142,927 |
TOTAL HUNGARY | | | 525,616 |
| India - 13.2% | | | |
| Axis Bank Ltd. | | 39,415 | 541,436 |
| Bharti Airtel Ltd. | | 32,260 | 617,456 |
| Computer Age Management Services Private Ltd. | | 3,296 | 173,648 |
| HDFC Bank Ltd. | | 30,618 | 629,327 |
| HDFC Bank Ltd. sponsored ADR | | 3,688 | 232,455 |
| HDFC Standard Life Insurance Co. Ltd. (b) | | 19,117 | 163,284 |
| Hyundai Motor India Ltd. | | 1,811 | 38,899 |
| ICICI Bank Ltd. | | 25,185 | 386,316 |
| Infosys Ltd. sponsored ADR | | 10,363 | 216,690 |
| Larsen & Toubro Ltd. | | 5,078 | 218,128 |
| Mankind Pharma Ltd. (a) | | 5,446 | 172,334 |
| NTPC Ltd. | | 55,525 | 268,544 |
| Reliance Industries Ltd. (a) | | 12,429 | 195,116 |
| Reliance Industries Ltd. | | 12,429 | 196,522 |
| Reliance Industries Ltd. GDR (b) | | 3,258 | 203,951 |
| Tata Consultancy Services Ltd. | | 5,983 | 281,415 |
| Tata Steel Ltd. | | 29,536 | 51,909 |
| Zomato Ltd. (a) | | 191,980 | 550,777 |
TOTAL INDIA | | | 5,138,207 |
| Indonesia - 2.3% | | | |
| PT Bank Central Asia Tbk | | 1,171,969 | 758,494 |
| PT Bank Mandiri (Persero) Tbk | | 353,881 | 150,229 |
| PT Bank Rakyat Indonesia (Persero) Tbk | | 8,173 | 2,492 |
TOTAL INDONESIA | | | 911,215 |
| Korea (South) - 9.6% | | | |
| BGF Retail Co. Ltd. | | 1,512 | 126,924 |
| Coupang, Inc. Class A (a) | | 2,534 | 65,352 |
| Hana Financial Group, Inc. | | 1,602 | 69,344 |
| Hyundai Motor Co. Ltd. | | 660 | 101,993 |
| KB Financial Group, Inc. | | 3,341 | 218,107 |
| KT Corp. | | 1,500 | 47,984 |
| NAVER Corp. | | 966 | 118,550 |
| Samsung Biologics Co. Ltd. (a)(b) | | 711 | 515,908 |
| Samsung Electronics Co. Ltd. | | 38,073 | 1,621,912 |
| Samsung Fire & Marine Insurance Co. Ltd. | | 494 | 120,158 |
| SK Hynix, Inc. | | 5,210 | 684,295 |
| SK Square Co. Ltd. (a) | | 583 | 35,323 |
TOTAL KOREA (SOUTH) | | | 3,725,850 |
| Malaysia - 0.6% | | | |
| CIMB Group Holdings Bhd | | 115,237 | 208,963 |
| MR DIY Group M Sdn Bhd (b) | | 64,700 | 32,243 |
TOTAL MALAYSIA | | | 241,206 |
| Mexico - 3.5% | | | |
| Corporacion Inmobiliaria Vesta S.A.B. de CV ADR | | 4,687 | 122,143 |
| Fomento Economico Mexicano S.A.B. de CV sponsored ADR | | 796 | 77,124 |
| Genomma Lab Internacional SA de CV | | 247,594 | 330,629 |
| Grupo Financiero Banorte S.A.B. de CV | | 74,296 | 517,337 |
| Wal-Mart de Mexico SA de CV Series V | | 111,285 | 306,000 |
TOTAL MEXICO | | | 1,353,233 |
| Peru - 0.7% | | | |
| Credicorp Ltd. (United States) | | 1,459 | 268,646 |
| Philippines - 1.5% | | | |
| Ayala Land, Inc. | | 403,015 | 225,174 |
| International Container Terminal Services, Inc. | | 52,500 | 355,346 |
TOTAL PHILIPPINES | | | 580,520 |
| Poland - 0.9% | | | |
| Allegro.eu SA (a)(b) | | 14,668 | 128,697 |
| Powszechna Kasa Oszczednosci Bank SA | | 16,815 | 234,408 |
TOTAL POLAND | | | 363,105 |
| Saudi Arabia - 1.1% | | | |
| Al Rajhi Bank | | 10,197 | 238,926 |
| Alinma Bank | | 6,611 | 49,463 |
| The Saudi National Bank | | 14,235 | 125,646 |
TOTAL SAUDI ARABIA | | | 414,035 |
| Singapore - 0.5% | | | |
| Sea Ltd. ADR Class A (a) | | 2,041 | 191,956 |
| South Africa - 5.1% | | | |
| Absa Group Ltd. | | 7,847 | 75,203 |
| Capitec Bank Holdings Ltd. | | 1,558 | 281,454 |
| FirstRand Ltd. | | 39,724 | 174,535 |
| Impala Platinum Holdings Ltd. (a) | | 33,928 | 223,943 |
| MTN Group Ltd. | | 11,693 | 58,074 |
| Naspers Ltd. Class N | | 1,170 | 276,527 |
| Northam Platinum Holdings Ltd. | | 25,427 | 188,121 |
| Pepkor Holdings Ltd. (b) | | 102,595 | 133,176 |
| Shoprite Holdings Ltd. | | 17,474 | 301,783 |
| Standard Bank Group Ltd. | | 18,539 | 255,236 |
TOTAL SOUTH AFRICA | | | 1,968,052 |
| Taiwan - 15.9% | | | |
| Alchip Technologies Ltd. | | 1,017 | 63,202 |
| Chailease Holding Co. Ltd. | | 42,877 | 201,438 |
| E Ink Holdings, Inc. | | 20,981 | 197,005 |
| E.SUN Financial Holdings Co. Ltd. | | 104,995 | 89,571 |
| Hon Hai Precision Industry Co. Ltd. (Foxconn) | | 120,891 | 777,401 |
| MediaTek, Inc. | | 15,500 | 605,352 |
| Taiwan Semiconductor Manufacturing Co. Ltd. | | 129,754 | 4,082,270 |
| Yageo Corp. | | 8,559 | 146,049 |
TOTAL TAIWAN | | | 6,162,288 |
| Thailand - 0.4% | | | |
| CP ALL PCL (For. Reg.) | | 33,143 | 62,077 |
| PTT Exploration and Production PCL (For. Reg.) | | 20,907 | 78,465 |
TOTAL THAILAND | | | 140,542 |
| United Arab Emirates - 0.5% | | | |
| ADNOC Drilling Co. PJSC | | 139,368 | 192,373 |
| United Kingdom - 0.8% | | | |
| AngloGold Ashanti PLC | | 10,538 | 292,956 |
| TOTAL COMMON STOCKS (Cost $34,257,419) | | | 37,085,354 |
| | | | |
| Government Obligations - 0.2% |
| | | Principal Amount (c) | Value ($) |
| United States of America - 0.2% | | | |
U.S. Treasury Bills, yield at date of purchase 4.55% to 5.12% 11/7/24 to 1/23/25 (Cost $89,534) | | 90,000 | 89,545 |
| | | | |
| Money Market Funds - 4.4% |
| | | Shares | Value ($) |
Fidelity Cash Central Fund 4.87% (d) (Cost $1,716,024) | | 1,715,681 | 1,716,024 |
| | | | |
| TOTAL INVESTMENT IN SECURITIES - 100.3% (Cost $36,062,977) | 38,890,923 |
NET OTHER ASSETS (LIABILITIES) - (0.3)% | (100,322) |
| NET ASSETS - 100.0% | 38,790,601 |
| | |
| Futures Contracts |
| | Number of contracts | Expiration Date | Notional Amount ($) | Value ($) | Unrealized Appreciation/ (Depreciation) ($) |
| Purchased | | | | | |
| | | | | | |
| Equity Index Contracts | | | | | |
| ICE E-mini MSCI Emerging Markets Index Contracts (United States) | 1 | Dec 2024 | 56,325 | 35 | 35 |
| | | | | | |
| The notional amount of futures purchased as a percentage of Net Assets is 0.1% |
Legend
| (b) | Security exempt from registration under Rule 144A of the Securities Act of 1933. These securities may be resold in transactions exempt from registration, normally to qualified institutional buyers. At the end of the period, the value of these securities amounted to $2,451,950 or 6.3% of net assets. |
| (c) | Amount is stated in United States dollars unless otherwise noted. |
| (d) | Affiliated fund that is generally available only to investment companies and other accounts managed by Fidelity Investments. The rate quoted is the annualized seven-day yield of the fund at period end. A complete unaudited listing of the fund's holdings as of its most recent quarter end is available upon request. In addition, each Fidelity Central Fund's financial statements, which are not covered by the Fund's Report of Independent Registered Public Accounting Firm, are available on the SEC's website or upon request. |
Affiliated Central Funds
Fiscal year to date information regarding the Fund's investments in Fidelity Central Funds, including the ownership percentage, is presented below.
| Affiliate | Value, beginning of period ($) | Purchases ($) | Sales Proceeds ($) | Dividend Income ($) | Realized Gain (loss) ($) | Change in Unrealized appreciation (depreciation) ($) | Value, end of period ($) | % ownership, end of period |
| Fidelity Cash Central Fund 4.87% | 633,452 | 28,170,570 | 27,087,975 | 103,611 | (23) | - | 1,716,024 | 0.0% |
| Total | 633,452 | 28,170,570 | 27,087,975 | 103,611 | (23) | - | 1,716,024 | |
| | | | | | | | | |
Amounts in the dividend income column in the above table include any capital gain distributions from underlying funds, which are presented in the corresponding line item in the Statement of Operations, if applicable.
Amounts included in the purchases and sales proceeds columns may include in-kind transactions, if applicable.
Investment Valuation
The following is a summary of the inputs used, as of October 31, 2024, involving the Fund's assets and liabilities carried at fair value. The inputs or methodology used for valuing securities may not be an indication of the risk associated with investing in those securities. For more information on valuation inputs, and their aggregation into the levels used below, please refer to the Investment Valuation section in the accompanying Notes to Financial Statements.
| Valuation Inputs at Reporting Date: |
| Description | Total ($) | Level 1 ($) | Level 2 ($) | Level 3 ($) |
Investments in Securities: | | | | |
|
| Equities: | | | | |
Communication Services | 3,469,788 | 191,956 | 3,277,832 | - |
Consumer Discretionary | 6,782,523 | 1,891,472 | 4,891,051 | - |
Consumer Staples | 1,102,098 | 481,121 | 620,977 | - |
Energy | 866,427 | 396,324 | 470,103 | - |
Financials | 9,550,603 | 3,367,371 | 6,183,232 | - |
Health Care | 1,624,673 | 705,946 | 918,727 | - |
Industrials | 2,049,320 | 715,618 | 1,333,702 | - |
Information Technology | 9,493,519 | 216,690 | 9,276,829 | - |
Materials | 1,378,150 | 560,474 | 817,676 | - |
Real Estate | 499,709 | 274,535 | 225,174 | - |
Utilities | 268,544 | - | 268,544 | - |
|
| Government Obligations | 89,545 | - | 89,545 | - |
|
| Money Market Funds | 1,716,024 | 1,716,024 | - | - |
| Total Investments in Securities: | 38,890,923 | 10,517,531 | 28,373,392 | - |
Derivative Instruments: Assets | | | | |
Futures Contracts | 35 | 35 | - | - |
| Total Assets | 35 | 35 | - | - |
| Total Derivative Instruments: | 35 | 35 | - | - |
Value of Derivative Instruments
The following table is a summary of the Fund's value of derivative instruments by primary risk exposure as of October 31, 2024. For additional information on derivative instruments, please refer to the Derivative Instruments section in the accompanying Notes to Financial Statements.
Primary Risk Exposure / Derivative Type | Value |
| Asset ($) | Liability ($) |
| Equity Risk | | |
Futures Contracts (a) | 35 | 0 |
| Total Equity Risk | 35 | 0 |
| Total Value of Derivatives | 35 | 0 |
(a)Reflects gross cumulative appreciation (depreciation) on futures contracts as presented in the Schedule of Investments. In the Statement of Assets and Liabilities, the period end daily variation margin is included in receivable or payable for daily variation margin on futures contracts, and the net cumulative appreciation (depreciation) is included in Total accumulated earnings (loss).
Financial Statements
| Statement of Assets and Liabilities |
As of October 31, 2024 |
| Assets | | | | |
| Investment in securities, at value - See accompanying schedule: | | | | |
Unaffiliated issuers (cost $34,346,953) | $ | 37,174,899 | | |
Fidelity Central Funds (cost $1,716,024) | | 1,716,024 | | |
| | | | | |
| | | | | |
| Total Investment in Securities (cost $36,062,977) | | | $ | 38,890,923 |
| Foreign currency held at value (cost $2,521) | | | | 2,524 |
| Receivable for investments sold | | | | 224,624 |
| Receivable for fund shares sold | | | | 95,045 |
| Dividends receivable | | | | 27,100 |
| Distributions receivable from Fidelity Central Funds | | | | 12,981 |
| Receivable for daily variation margin on futures contracts | | | | 35 |
| Prepaid expenses | | | | 36 |
| Receivable from investment adviser for expense reductions | | | | 2,359 |
| Other receivables | | | | 16 |
Total assets | | | | 39,255,643 |
| Liabilities | | | | |
| Payable for investments purchased | $ | 249,840 | | |
| Payable for fund shares redeemed | | 42,923 | | |
| Accrued management fee | | 24,831 | | |
| Deferred taxes | | 75,116 | | |
| Audit fee payable | | 41,305 | | |
| Custody fee payable | | 30,367 | | |
| Other payables and accrued expenses | | 660 | | |
| Total liabilities | | | | 465,042 |
| Net Assets | | | $ | 38,790,601 |
| Net Assets consist of: | | | | |
| Paid in capital | | | $ | 35,750,025 |
| Total accumulated earnings (loss) | | | | 3,040,576 |
| Net Assets | | | $ | 38,790,601 |
Net Asset Value, offering price and redemption price per share ($38,790,601 ÷ 3,656,102 shares) | | | $ | 10.61 |
| Statement of Operations |
| Year ended October 31, 2024 |
| Investment Income | | | | |
| Dividends | | | $ | 591,005 |
| Interest | | | | 2,555 |
| Income from Fidelity Central Funds | | | | 103,611 |
| Income before foreign taxes withheld | | | $ | 697,171 |
| Less foreign taxes withheld | | | | (68,000) |
| Total income | | | | 629,171 |
| Expenses | | | | |
| Management fee | $ | 179,080 | | |
| Custodian fees and expenses | | 82,271 | | |
| Independent trustees' fees and expenses | | 83 | | |
| Registration fees | | 22,322 | | |
| Audit fees | | 93,977 | | |
| Legal | | 10 | | |
| Miscellaneous | | 876 | | |
| Total expenses before reductions | | 378,619 | | |
| Expense reductions | | (150,847) | | |
| Total expenses after reductions | | | | 227,772 |
| Net Investment income (loss) | | | | 401,399 |
| Realized and Unrealized Gain (Loss) | | | | |
| Net realized gain (loss) on: | | | | |
| Investment Securities: | | | | |
| Unaffiliated issuers (net of foreign taxes of $55,424) | | 389,434 | | |
| Fidelity Central Funds | | (23) | | |
| Foreign currency transactions | | (37,233) | | |
| Futures contracts | | 55,667 | | |
| Total net realized gain (loss) | | | | 407,845 |
| Change in net unrealized appreciation (depreciation) on: | | | | |
| Investment Securities: | | | | |
| Unaffiliated issuers (net of increase in deferred foreign taxes of $72,432) | | 2,919,337 | | |
| Assets and liabilities in foreign currencies | | (931) | | |
| Futures contracts | | (159) | | |
| Total change in net unrealized appreciation (depreciation) | | | | 2,918,247 |
| Net gain (loss) | | | | 3,326,092 |
| Net increase (decrease) in net assets resulting from operations | | | $ | 3,727,491 |
| Statement of Changes in Net Assets |
| |
| | Year ended October 31, 2024 | | Year ended October 31, 2023 |
| Increase (Decrease) in Net Assets | | | | |
| Operations | | | | |
| Net investment income (loss) | $ | 401,399 | $ | 54,873 |
| Net realized gain (loss) | | 407,845 | | (226,900) |
| Change in net unrealized appreciation (depreciation) | | 2,918,247 | | 215,084 |
| Net increase (decrease) in net assets resulting from operations | | 3,727,491 | | 43,057 |
| Distributions to shareholders | | (102,380) | | (19,218) |
| | | | | |
| Share transactions | | | | |
| Proceeds from sales of shares | | 37,001,595 | | 4,888,662 |
| Reinvestment of distributions | | 89,859 | | 18,756 |
| Cost of shares redeemed | | (8,183,308) | | (446,184) |
| | | | | |
Net increase (decrease) in net assets resulting from share transactions | | 28,908,146 | | 4,461,234 |
| Total increase (decrease) in net assets | | 32,533,257 | | 4,485,073 |
| | | | | |
| Net Assets | | | | |
| Beginning of period | | 6,257,344 | | 1,772,271 |
| End of period | $ | 38,790,601 | $ | 6,257,344 |
| | | | | |
| Other Information | | | | |
| Shares | | | | |
| Sold | | 3,702,863 | | 544,845 |
| Issued in reinvestment of distributions | | 9,810 | | 2,130 |
| Redeemed | | (787,099) | | (49,495) |
| Net increase (decrease) | | 2,925,574 | | 497,480 |
| | | | | |
Financial Highlights
Fidelity® SAI Sustainable Emerging Markets Equity Fund |
| |
| Years ended October 31, | | 2024 | | 2023 | | 2022 A |
Selected Per-Share Data | | | | | | |
| Net asset value, beginning of period | $ | 8.57 | $ | 7.60 | $ | 10.00 |
| Income from Investment Operations | | | | | | |
Net investment income (loss) B,C | | .17 | | .15 | | .06 |
| Net realized and unrealized gain (loss) | | 1.97 | | .90 D | | (2.46) |
| Total from investment operations | | 2.14 | | 1.05 | | (2.40) |
| Distributions from net investment income | | (.10) | | (.08) | | - |
| Total distributions | | (.10) | | (.08) | | - |
| Net asset value, end of period | $ | 10.61 | $ | 8.57 | $ | 7.60 |
Total Return E,F | | | | 13.74% | | (24.00)% |
Ratios to Average Net Assets C,G,H | | | | | | |
| Expenses before reductions | | 1.58% | | 4.99% | | 6.38% I,J |
| Expenses net of fee waivers, if any | | | | .94% | | .96% I |
| Expenses net of all reductions | | .95% | | .93% | | .96% I |
| Net investment income (loss) | | 1.67% | | 1.65% | | 1.27% I |
| Supplemental Data | | | | | | |
| Net assets, end of period (000 omitted) | $ | 38,791 | $ | 6,257 | $ | 1,772 |
Portfolio turnover rate K | | | | 87% | | 74% I |
AFor the period April 14, 2022 (commencement of operations) through October 31, 2022.
BCalculated based on average shares outstanding during the period.
CNet investment income (loss) is affected by the timing of the declaration of dividends by any underlying mutual funds or exchange-traded funds (ETFs). Net investment income (loss) of any mutual funds or ETFs is not included in the Fund's net investment income (loss) ratio.
DThe amount shown for a share outstanding does not correspond with the aggregate net gain (loss) on investments for the period due to the timing of sales and repurchases of shares in relation to fluctuating market values of the investments of the Fund.
ETotal returns for periods of less than one year are not annualized.
FTotal returns would have been lower if certain expenses had not been reduced during the applicable periods shown.
GFees and expenses of any underlying mutual funds or exchange-traded funds (ETFs) are not included in the Fund's expense ratio. The Fund indirectly bears its proportionate share of these expenses.
HExpense ratios reflect operating expenses of the class. Expenses before reductions do not reflect amounts reimbursed, waived, or reduced through arrangements with the investment adviser, brokerage services, or other offset arrangements, if applicable, and do not represent the amount paid by the class during periods when reimbursements, waivers or reductions occur.
IAnnualized.
JAudit fees are not annualized.
KAmount does not include the portfolio activity of any underlying mutual funds or exchange-traded funds (ETFs).
Notes to Financial Statements
For the period ended October 31, 2024
1. Organization.
Fidelity SAI Sustainable Emerging Markets Equity Fund (the Fund) is a fund of Fidelity Investment Trust (the Trust) and is authorized to issue an unlimited number of shares. Shares are offered exclusively to certain clients of Fidelity Management & Research Company LLC (FMR) or its affiliates. The Trust is registered under the Investment Company Act of 1940, as amended (the 1940 Act), as an open-end management investment company organized as a Massachusetts business trust. The Fund's investments in emerging markets can be subject to social, economic, regulatory, and political uncertainties and can be extremely volatile.
2. Investments in Fidelity Central Funds.
Funds may invest in Fidelity Central Funds, which are open-end investment companies generally available only to other investment companies and accounts managed by the investment adviser and its affiliates. The Schedule of Investments lists any Fidelity Central Funds held as an investment as of period end, but does not include the underlying holdings of each Fidelity Central Fund. An investing fund indirectly bears its proportionate share of the expenses of the underlying Fidelity Central Funds.
Based on its investment objective, each Fidelity Central Fund may invest or participate in various investment vehicles or strategies that are similar to those of the investing fund. These strategies are consistent with the investment objectives of the investing fund and may involve certain economic risks which may cause a decline in value of each of the Fidelity Central Funds and thus a decline in the value of the investing fund.
| Fidelity Central Fund | Investment Manager | Investment Objective | Investment Practices | Expense RatioA |
| Fidelity Money Market Central Funds | Fidelity Management & Research Company LLC (FMR) | Each fund seeks to obtain a high level of current income consistent with the preservation of capital and liquidity. | Short-term Investments | Less than .005% |
A Expenses expressed as a percentage of average net assets and are as of each underlying Central Fund's most recent annual or semi-annual shareholder report.
A complete unaudited list of holdings for each Fidelity Central Fund is available upon request or at the Securities and Exchange Commission website at www.sec.gov. In addition, the financial statements of the Fidelity Central Funds which contain the significant accounting policies (including investment valuation policies) of those funds, and are not covered by the Report of Independent Registered Public Accounting Firm, are available on the Securities and Exchange Commission website or upon request.
3. Significant Accounting Policies.
The Fund is an investment company and applies the accounting and reporting guidance of the Financial Accounting Standards Board (FASB) Accounting Standards Codification Topic 946 Financial Services - Investment Companies. The financial statements have been prepared in conformity with accounting principles generally accepted in the United States of America (GAAP), which require management to make certain estimates and assumptions at the date of the financial statements. Actual results could differ from those estimates. Subsequent events, if any, through the date that the financial statements were issued have been evaluated in the preparation of the financial statements. The Fund's Schedule of Investments lists any underlying mutual funds or exchange-traded funds (ETFs) but does not include the underlying holdings of these funds. The following summarizes the significant accounting policies of the Fund:
Investment Valuation. Investments are valued as of 4:00 p.m. Eastern time on the last calendar day of the period. The Board of Trustees (the Board) has designated the Fund's investment adviser as the valuation designee responsible for the fair valuation function and performing fair value determinations as needed. The investment adviser has established a Fair Value Committee (the Committee) to carry out the day-to-day fair valuation responsibilities and has adopted policies and procedures to govern the fair valuation process and the activities of the Committee. In accordance with these fair valuation policies and procedures, which have been approved by the Board, the Fund attempts to obtain prices from one or more third party pricing services or brokers to value its investments. When current market prices, quotations or currency exchange rates are not readily available or reliable, investments will be fair valued in good faith by the Committee, in accordance with the policies and procedures. Factors used in determining fair value vary by investment type and may include market or investment specific events, transaction data, estimated cash flows, and market observations of comparable investments. The frequency that the fair valuation procedures are used cannot be predicted and they may be utilized to a significant extent. The Committee manages the Fund's fair valuation practices and maintains the fair valuation policies and procedures. The Fund's investment adviser reports to the Board information regarding the fair valuation process and related material matters.
The Fund categorizes the inputs to valuation techniques used to value its investments into a disclosure hierarchy consisting of three levels as shown below:
Level 1 - unadjusted quoted prices in active markets for identical investments
Level 2 - other significant observable inputs (including quoted prices for similar investments, interest rates, prepayment speeds, etc.)
Level 3 - unobservable inputs (including the Fund's own assumptions based on the best information available)
Valuation techniques used to value the Fund's investments by major category are as follows:
Equity securities, including restricted securities, for which market quotations are readily available, are valued at the last reported sale price or official closing price as reported by a third party pricing service on the primary market or exchange on which they are traded and are categorized as Level 1 in the hierarchy. In the event there were no sales during the day or closing prices are not available, securities are valued at the last quoted bid price or may be valued using the last available price and are generally categorized as Level 2 in the hierarchy. For foreign equity securities, when market or security specific events arise, comparisons to the valuation of American Depositary Receipts (ADRs), futures contracts, Exchange-Traded Funds (ETFs) and certain indexes as well as quoted prices for similar securities may be used and would be categorized as Level 2 in the hierarchy. For equity securities, including restricted securities, where observable inputs are limited, assumptions about market activity and risk are used and these securities may be categorized as Level 3 in the hierarchy.
Debt securities, including restricted securities, are valued based on evaluated prices received from third party pricing services or from brokers who make markets in such securities. U.S. government and government agency obligations are valued by pricing services who utilize matrix pricing which considers yield or price of bonds of comparable quality, coupon, maturity and type or by broker-supplied prices. When independent prices are unavailable or unreliable, debt securities may be valued utilizing pricing methodologies which consider similar factors that would be used by third party pricing services. Debt securities are generally categorized as Level 2 in the hierarchy but may be Level 3 depending on the circumstances. Exchange-Traded Funds (ETFs) are valued at their last sale price or official closing price as reported by a third party pricing service on the primary market or exchange on which they are traded and are categorized as Level 1 in the hierarchy. In the event there were no sales during the day but the exchange reports a closing bid level, ETFs are valued at the closing bid and would be categorized as Level 1 in the hierarchy. In the event there was no closing bid, ETFs may be valued by another method that the Board believes reflects fair value in accordance with the Board's fair value pricing policies and may be categorized as Level 2 in the hierarchy.
Futures contracts are valued at the settlement price established each day by the board of trade or exchange on which they are traded and are categorized as Level 1 in the hierarchy. Investments in open-end mutual funds, including the Fidelity Central Funds, are valued at their closing net asset value (NAV) each business day and are categorized as Level 1 in the hierarchy.
Changes in valuation techniques may result in transfers in or out of an assigned level within the disclosure hierarchy. The aggregate value of investments by input level as of October 31, 2024 is included at the end of the Fund's Schedule of Investments.
Foreign Currency. Certain Funds may use foreign currency contracts to facilitate transactions in foreign-denominated securities. Gains and losses from these transactions may arise from changes in the value of the foreign currency or if the counterparties do not perform under the contracts' terms.
Foreign-denominated assets, including investment securities, and liabilities are translated into U.S. dollars at the exchange rates at period end. Purchases and sales of investment securities, income and dividends received, and expenses denominated in foreign currencies are translated into U.S. dollars at the exchange rate in effect on the transaction date.
The effects of exchange rate fluctuations on investments are included with the net realized and unrealized gain (loss) on investment securities. Other foreign currency transactions resulting in realized and unrealized gain (loss) are disclosed separately.
Investment Transactions and Income. For financial reporting purposes, the Fund's investment holdings and NAV include trades executed through the end of the last business day of the period. The NAV per share for processing shareholder transactions is calculated as of the close of business of the New York Stock Exchange (NYSE), normally 4:00 p.m. Eastern time and includes trades executed through the end of the prior business day. Gains and losses on securities sold are determined on the basis of identified cost. Commissions paid to certain brokers with whom the investment adviser, or its affiliates, places trades on behalf of a fund include an amount in addition to trade execution, which may be rebated back to a fund. Any such rebates are included in net realized gain (loss) on investments in the Statement of Operations. Dividend income is recorded on the ex-dividend date, except for certain dividends from foreign securities where the ex-dividend date may have passed, which are recorded as soon as the Fund is informed of the ex-dividend date. Non-cash dividends included in dividend income, if any, are recorded at the fair market value of the securities received. Income and capital gain distributions from Fidelity Central Funds, if any, are recorded on the ex-dividend date. Interest income is accrued as earned and includes coupon interest and amortization of premium and accretion of discount on debt securities as applicable. Investment income is recorded net of foreign taxes withheld where recovery of such taxes is uncertain.
Expenses. Expenses directly attributable to a fund are charged to that fund. Expenses attributable to more than one fund are allocated among the respective funds on the basis of relative net assets or other appropriate methods. Expenses included in the accompanying financial statements reflect the expenses of that fund and do not include any expenses associated with any underlying mutual funds or exchange-traded funds. Although not included in a fund's expenses, a fund indirectly bears its proportionate share of these expenses through the net asset value of each underlying mutual fund or exchange-traded fund. Expense estimates are accrued in the period to which they relate and adjustments are made when actual amounts are known.
Income Tax Information and Distributions to Shareholders. Each year, the Fund intends to qualify as a regulated investment company under Subchapter M of the Internal Revenue Code, including distributing substantially all of its taxable income and realized gains. As a result, no provision for U.S. Federal income taxes is required. As of October 31, 2024, the Fund did not have any unrecognized tax benefits in the financial statements; nor is the Fund aware of any tax positions for which it is reasonably possible that the total amounts of unrecognized tax benefits will significantly change in the next twelve months. The Fund files a U.S. federal tax return, in addition to state and local tax returns as required. The Fund's federal income tax returns are subject to examination by the Internal Revenue Service (IRS) for a period of three fiscal years after they are filed. State and local tax returns may be subject to examination for an additional fiscal year depending on the jurisdiction. Foreign taxes are provided for based on the Fund's understanding of the tax rules and rates that exist in the foreign markets in which it invests. The Fund is subject to a tax imposed on capital gains by certain countries in which it invests. An estimated deferred tax liability for net unrealized appreciation on the applicable securities is included in Deferred taxes on the Statement of Assets and Liabilities.
Distributions are declared and recorded on the ex-dividend date. Income and capital gain distributions are determined in accordance with income tax regulations, which may differ from GAAP. In addition, the Fund claimed a portion of the payment made to redeeming shareholders as a distribution for income tax purposes.
Capital accounts within the financial statements are adjusted for permanent book-tax differences. These adjustments have no impact on net assets or the results of operations. Capital accounts are not adjusted for temporary book-tax differences which will reverse in a subsequent period.
Book-tax differences are primarily due to futures contracts, foreign currency transactions, certain foreign taxes, passive foreign investment companies (PFIC), capital loss carryforwards and losses deferred due to wash sales.
As of period end, the cost and unrealized appreciation (depreciation) in securities, and derivatives if applicable, for federal income tax purposes were as follows:
| Gross unrealized appreciation | $4,131,712 |
| Gross unrealized depreciation | (1,674,515) |
| Net unrealized appreciation (depreciation) | $2,457,197 |
| Tax Cost | $36,433,726 |
The tax-based components of distributable earnings as of period end were as follows:
| Undistributed ordinary income | $488,689 |
| Undistributed long-term capital gain | $216,281 |
| Net unrealized appreciation (depreciation) on securities and other investments | $2,456,233 |
Capital loss carryforwards are only available to offset future capital gains of the Fund to the extent provided by regulations and may be limited. The capital loss carryforward information presented below, including any applicable limitation, is estimated as of fiscal period end and is subject to adjustment.
Short-term | $(29,047) |
Long-term | (16,465) |
| Total capital loss carryforward | $(45,512) |
The tax character of distributions paid was as follows:
| | October 31, 2024 | October 31, 2023 |
| Ordinary Income | $102,380 | $ 19,218 |
Restricted Securities (including Private Placements). Funds may invest in securities that are subject to legal or contractual restrictions on resale. These securities generally may be resold in transactions exempt from registration or to the public if the securities are registered. Disposal of these securities may involve time-consuming negotiations and expense, and prompt sale at an acceptable price may be difficult. Information regarding restricted securities held at period end is included at the end of the Schedule of Investments, if applicable.
New Accounting Pronouncement. In November 2023, the FASB issued Accounting Standards Update (ASU) 2023-07 Segment Reporting (Topic 280): Improvements to Reportable Segment Disclosures. Effective for fiscal years beginning after December 15, 2023 and interim periods within fiscal years beginning after December 15, 2024, the amendments enhance required disclosures of segment information for public entities on an annual and interim basis. The ASU allows for early adoption with updates applied retrospectively. Management is currently evaluating the impact of the ASU but does not expect this guidance to materially impact the financial statements.
4. Derivative Instruments.
Risk Exposures and the Use of Derivative Instruments. The Fund's investment objectives allow for various types of derivative instruments, including futures contracts. Derivatives are investments whose value is primarily derived from underlying assets, indices or reference rates and may be transacted on an exchange or over-the-counter (OTC). Derivatives may involve a future commitment to buy or sell a specified asset based on specified terms, to exchange future cash flows at periodic intervals based on a notional principal amount, or for one party to make one or more payments upon the occurrence of specified events in exchange for periodic payments from the other party.
Derivatives were used to increase returns and to manage exposure to certain risks as defined below. The success of any strategy involving derivatives depends on analysis of numerous economic factors, and if the strategies for investment do not work as intended, the objectives may not be achieved.
Derivatives were used to increase or decrease exposure to the following risk(s):
| | |
| Equity Risk | Equity risk relates to the fluctuations in the value of financial instruments as a result of changes in market prices (other than those arising from interest rate risk or foreign exchange risk), whether caused by factors specific to an individual investment, its issuer, or all factors affecting all instruments traded in a market or market segment. |
Funds are also exposed to additional risks from investing in derivatives, such as liquidity risk and counterparty credit risk. Liquidity risk is the risk that a fund will be unable to close out the derivative in the open market in a timely manner. Counterparty credit risk is the risk that the counterparty will not be able to fulfill its obligation to a fund. Counterparty credit risk related to exchange-traded contracts may be mitigated by the protection provided by the exchange on which they trade.
Investing in derivatives may involve greater risks than investing in the underlying assets directly and, to varying degrees, may involve risk of loss in excess of any initial investment and collateral received and amounts recognized in the Statement of Assets and Liabilities. In addition, there may be the risk that the change in value of the derivative contract does not correspond to the change in value of the underlying instrument.
Futures Contracts. A futures contract is an agreement between two parties to buy or sell a specified underlying instrument for a fixed price at a specified future date. Futures contracts were used to manage exposure to the stock market.
Upon entering into a futures contract, a fund is required to deposit either cash or securities (initial margin) with a clearing broker in an amount equal to a certain percentage of the face value of the contract. Futures contracts are marked-to-market daily and subsequent daily payments are made or received by a fund depending on the daily fluctuations in the value of the futures contracts and are recorded as unrealized appreciation or (depreciation). This receivable and/or payable, if any, is included in daily variation margin on futures contracts in the Statement of Assets and Liabilities. Realized gain or (loss) is recorded upon the expiration or closing of a futures contract. The net realized gain (loss) and change in net unrealized appreciation (depreciation) on futures contracts during the period is presented in the Statement of Operations.
Any open futures contracts at period end are presented in the Schedule of Investments under the caption "Futures Contracts". The notional amount at value reflects each contract's exposure to the underlying instrument or index at period end, and is representative of volume of activity during the period unless an average notional amount is presented. Any securities deposited to meet initial margin requirements are identified in the Schedule of Investments. Any cash deposited to meet initial margin requirements is presented as segregated cash with brokers for derivative instruments in the Statement of Assets and Liabilities.
5. Purchases and Sales of Investments.
Purchases and sales of securities, other than short-term securities, U.S. government securities and in-kind transactions, as applicable, are noted in the table below.
| | Purchases ($) | Sales ($) |
| Fidelity SAI Sustainable Emerging Markets Equity Fund | 50,198,336 | 22,507,805 |
6. Fees and Other Transactions with Affiliates.
Management Fee. Fidelity Management & Research Company LLC (the investment adviser) and its affiliates provide the Fund with investment management related services for which the Fund pays a monthly management fee. Effective March 1, 2024, the Fund pays a monthly management fee that is based on an annual rate of .748% of the Fund's average net assets.
Prior to March 1, 2024, the management fee was the sum of an individual fund fee rate that was based on an annual rate of .55% of the Fund's average net assets and an annualized group fee rate that averaged .22% during the period. The group fee rate was based upon the monthly average net assets of a group of registered investment companies with which the investment adviser has management contracts. The group fee rate decreased as assets under management increased and increased as assets under management decreased.
For the reporting period, the total annual management fee rate was .75% of the Fund's average net assets.
Brokerage Commissions. A portion of portfolio transactions were placed with brokerage firms which are affiliates of the investment adviser. Brokerage commissions are included in net realized gain (loss) and change in net unrealized appreciation (depreciation) in the Statement of Operations. The commissions paid to these affiliated firms were as follows:
| | Amount ($) |
| Fidelity SAI Sustainable Emerging Markets Equity Fund | 49 |
Interfund Trades. Funds may purchase from or sell securities to other Fidelity Funds under procedures adopted by the Board. The procedures have been designed to ensure these interfund trades are executed in accordance with Rule 17a-7 of the 1940 Act. Any interfund trades are included within the respective purchases and sales amounts shown in the Purchases and Sales of Investments note. Interfund trades during the period are noted in the table below.
| | Purchases ($) | Sales ($) | Realized Gain (Loss)($) |
| Fidelity SAI Sustainable Emerging Markets Equity Fund | 170,990 | 417,161 | (9,035) |
Sub-Advisory Arrangements. Effective March 1, 2024, the Fund's sub-advisory agreements with FMR Investment Management (UK) Limited, Fidelity Management & Research (Hong Kong) Limited, and Fidelity Management & Research (Japan) Limited were amended to provide that the investment adviser pays each sub-adviser monthly fees equal to 110% of the sub-adviser's costs for providing sub-advisory services.
7. Committed Line of Credit.
Certain Funds participate with other funds managed by the investment adviser or an affiliate in a $4.25 billion credit facility (the "line of credit") to be utilized for temporary or emergency purposes to fund shareholder redemptions or for other short-term liquidity purposes. The participating funds have agreed to pay commitment fees on their pro-rata portion of the line of credit, which are reflected in Miscellaneous expenses on the Statement of Operations, and are listed below. During the period, there were no borrowings on this line of credit.
| | Amount ($) |
| Fidelity SAI Sustainable Emerging Markets Equity Fund | 32 |
8. Expense Reductions.
The investment adviser contractually agreed to reimburse the Fund to the extent annual operating expenses exceeded .95% of average net assets. This reimbursement will remain in place through February 28, 2026. Some expenses, for example the compensation of the independent Trustees, and certain miscellaneous expenses such as proxy and shareholder meeting expenses, are excluded from this reimbursement. During the period this reimbursement reduced the Fund's expenses by $150,049.
Through arrangements with the Fund's custodian, credits realized as a result of certain uninvested cash balances were used to reduce the Fund's expenses by $224
In addition, during the period the investment adviser or an affiliate reimbursed and/or waived a portion of operating expenses in the amount of $574.
9. Other.
A fund's organizational documents provide former and current trustees and officers with a limited indemnification against liabilities arising in connection with the performance of their duties to the fund. In the normal course of business, a fund may also enter into contracts that provide general indemnifications. A fund's maximum exposure under these arrangements is unknown as this would be dependent on future claims that may be made against a fund. The risk of material loss from such claims is considered remote.
10. Risk and Uncertainties.
Many factors affect a fund's performance. Developments that disrupt global economies and financial markets, such as pandemics, epidemics, outbreaks of infectious diseases, war, terrorism, and environmental disasters, may significantly affect a fund's investment performance. The effects of these developments to a fund will be impacted by the types of securities in which a fund invests, the financial condition, industry, economic sector, and geographic location of an issuer, and a fund's level of investment in the securities of that issuer. Significant concentrations in security types, issuers, industries, sectors, and geographic locations may magnify the factors that affect a fund's performance.
Report of Independent Registered Public Accounting Firm
To the Board of Trustees of Fidelity Investment Trust and the Shareholders of Fidelity SAI Sustainable Emerging Markets Equity Fund:
Opinion on the Financial Statements and Financial Highlights
We have audited the accompanying statement of assets and liabilities of Fidelity SAI Sustainable Emerging Markets Equity Fund (the "Fund"), a fund of Fidelity Investment Trust, including the schedule of investments, as of October 31, 2024, the related statement of operations for the year then ended, the statement of changes in net assets for each of the two years in the period then ended, the financial highlights for each of the two years in the period then ended and for the period from April 14, 2022 (commencement of operations) through October 31, 2022, and the related notes. In our opinion, the financial statements and financial highlights present fairly, in all material respects, the financial position of the Fund as of October 31, 2024, and the results of its operations for the year then ended, the changes in its net assets for each of the two years in the period then ended, and the financial highlights for each of the two years in the period then ended and for the period from April 14, 2022 (commencement of operations) through October 31, 2022, in conformity with accounting principles generally accepted in the United States of America.
Basis for Opinion
These financial statements and financial highlights are the responsibility of the Fund's management. Our responsibility is to express an opinion on the Fund's financial statements and financial highlights based on our audits. We are a public accounting firm registered with the Public Company Accounting Oversight Board (United States) (PCAOB) and are required to be independent with respect to the Fund in accordance with the U.S. federal securities laws and the applicable rules and regulations of the Securities and Exchange Commission and the PCAOB.
We conducted our audits in accordance with the standards of the PCAOB. Those standards require that we plan and perform the audit to obtain reasonable assurance about whether the financial statements and financial highlights are free of material misstatement, whether due to error or fraud. The Fund is not required to have, nor were we engaged to perform, an audit of its internal control over financial reporting. As part of our audits, we are required to obtain an understanding of internal control over financial reporting but not for the purpose of expressing an opinion on the effectiveness of the Fund's internal control over financial reporting. Accordingly, we express no such opinion.
Our audits included performing procedures to assess the risks of material misstatement of the financial statements and financial highlights, whether due to error or fraud, and performing procedures that respond to those risks. Such procedures included examining, on a test basis, evidence regarding the amounts and disclosures in the financial statements and financial highlights. Our audits also included evaluating the accounting principles used and significant estimates made by management, as well as evaluating the overall presentation of the financial statements and financial highlights. Our procedures included confirmation of securities owned as of October 31, 2024, by correspondence with the custodian and brokers; when replies were not received from brokers, we performed other auditing procedures. We believe that our audits provide a reasonable basis for our opinion.
/s/ Deloitte & Touche LLP
Boston, Massachusetts
December 16, 2024
We have served as the auditor of one or more of the Fidelity investment companies since 1999.
Distributions
(Unaudited)
The dividend and capital gains distributions for the fund(s) are available on Fidelity.com or Institutional.Fidelity.com.
The fund hereby designates as a capital gain dividend with respect to the taxable year ended October 31, 2024, $216,281, or, if subsequently determined to be different, the net capital gain of such year.
The fund designates $9,414 of distributions paid during the fiscal year ended 2024 as qualifying to be taxed as section 163(j) interest dividends.
The fund designates 66.05%, and 77.12%, of the dividends distributed in December, during the fiscal year as amounts which may be taken into account as a dividend for the purposes of the maximum rate under section 1(h)(11) of the Internal Revenue Code.
The amounts per share which represent income derived from sources within, and taxes paid to, foreign countries or possessions of the United States are $.0910 and $.0102 for the dividend paid December 11, 2023.
The fund will notify shareholders in January 2025 of amounts for use in preparing 2024 income tax returns.
Item 8: Changes in and Disagreements with Accountants for Open-End Management Investment Companies
(Unaudited)
Note: This is not applicable for any fund included in this document.
Item 9: Proxy Disclosures for Open-End Management Investment Companies
(Unaudited)
| A special meeting of shareholders was held on July 16, 2024. The results of votes taken among shareholders on the proposal before them are reported below. Each vote reported represents one dollar of net asset value held on the record date for the meeting. |
| Proposal 1 |
| To elect a Board of Trustees. |
| | # of Votes | % of Votes |
| Bettina Doulton |
| Affirmative | 128,529,177,643.56 | 98.18 |
| Withheld | 2,378,037,364.30 | 1.82 |
| TOTAL | 130,907,215,007.85 | 100.00 |
| Robert A. Lawrence |
| Affirmative | 128,253,389,899.05 | 97.97 |
| Withheld | 2,653,825,108.81 | 2.03 |
| TOTAL | 130,907,215,007.85 | 100.00 |
| Vijay C. Advani |
| Affirmative | 128,531,418,228.19 | 98.19 |
| Withheld | 2,375,796,779.66 | 1.81 |
| TOTAL | 130,907,215,007.85 | 100.00 |
| Thomas P. Bostick |
| Affirmative | 128,495,261,591.41 | 98.16 |
| Withheld | 2,411,953,416.44 | 1.84 |
| TOTAL | 130,907,215,007.85 | 100.00 |
| Donald F. Donahue |
| Affirmative | 128,407,878,996.00 | 98.09 |
| Withheld | 2,499,336,011.85 | 1.91 |
| TOTAL | 130,907,215,007.85 | 100.00 |
| Vicki L. Fuller |
| Affirmative | 128,625,540,095.19 | 98.26 |
| Withheld | 2,281,674,912.66 | 1.74 |
| TOTAL | 130,907,215,007.85 | 100.00 |
| Patricia L. Kampling |
| Affirmative | 128,668,729,281.34 | 98.29 |
| Withheld | 2,238,485,726.51 | 1.71 |
| TOTAL | 130,907,215,007.85 | 100.00 |
| Thomas A. Kennedy |
| Affirmative | 128,499,824,239.79 | 98.16 |
| Withheld | 2,407,390,768.06 | 1.84 |
| TOTAL | 130,907,215,007.85 | 100.00 |
| Oscar Munoz |
| Affirmative | 128,386,109,391.05 | 98.07 |
| Withheld | 2,521,105,616.80 | 1.93 |
| TOTAL | 130,907,215,007.85 | 100.00 |
| Karen B. Peetz |
| Affirmative | 128,603,731,113.82 | 98.24 |
| Withheld | 2,303,483,894.03 | 1.76 |
| TOTAL | 130,907,215,007.85 | 100.00 |
| David M. Thomas |
| Affirmative | 128,384,899,342.98 | 98.07 |
| Withheld | 2,522,315,664.88 | 1.93 |
| TOTAL | 130,907,215,007.85 | 100.00 |
| Susan Tomasky |
| Affirmative | 128,556,148,461.60 | 98.20 |
| Withheld | 2,351,066,546.25 | 1.80 |
| TOTAL | 130,907,215,007.85 | 100.00 |
| Michael E. Wiley |
| Affirmative | 128,264,934,978.34 | 97.98 |
| Withheld | 2,642,280,029.51 | 2.02 |
| TOTAL | 130,907,215,007.85 | 100.00 |
| | | |
| Proposal 1 reflects trust-wide proposal and voting results. |
Item 10: Remuneration Paid to Directors, Officers, and others of Open-End Management Investment Companies
(Unaudited)
Note: This information is disclosed as part of the financial statements for each Fund as part of Item 7: Financial Statements and Financial Highlights for Open-End Management Investment companies.
Item 11: Statement Regarding Basis for Approval of Investment Advisory Contract
(Unaudited)
Board Approval of Investment Advisory Contracts and Management Fees
Fidelity SAI Sustainable Emerging Markets Equity Fund
Each year, the Board of Trustees, including the Independent Trustees (together, the Board), considers the renewal of the fund's management contract with Fidelity Management & Research Company LLC (FMR) and the sub-advisory agreements (together, the Advisory Contracts) for the fund. FMR and the sub-advisers are referred to herein as the Investment Advisers. The Board, assisted by the advice of fund counsel and Independent Trustees' counsel, requests and considers a broad range of information relevant to the renewal of the Advisory Contracts throughout the year.
The Board meets regularly and, at each of its meetings, covers an extensive agenda of topics and materials and considers factors that are relevant to its annual consideration of the renewal of the fund's Advisory Contracts, including the services and support provided to the fund and its shareholders. The Board, acting directly and through its Committees (each of which is composed of and chaired by Independent Trustees), requests and receives information concerning the annual consideration of the renewal of the fund's Advisory Contracts. The Board also meets as needed to review matters specifically related to the Board's annual consideration of the renewal of the Advisory Contracts. Members of the Board may also meet with trustees of other Fidelity funds through joint ad hoc committees to discuss certain matters relevant to all of the Fidelity funds.
At its May 2024 meeting, the Board unanimously determined to renew the fund's Advisory Contracts. In reaching its determination, the Board considered all factors it believed relevant, including (i) the nature, extent, and quality of the services provided to the fund and its shareholders (including the investment performance of the fund); (ii) the competitiveness relative to peer funds of the fund's management fee and total expense ratio; (iii) the total costs of the services provided by and the profits realized by FMR and its affiliates (Fidelity) from its relationships with the fund; and (iv) the extent to which, if any, economies of scale exist and are realized as the fund grows, and whether any economies of scale are appropriately shared with fund shareholders. The Board also considered the broad range of investment choices available to shareholders from FMR's competitors and that the fund's shareholders have chosen to invest in the fund, which is part of the Fidelity family of funds. The Board's decision to renew the Advisory Contracts was not based on any single factor.
The Board reached a determination, with the assistance of fund counsel and Independent Trustees' counsel and through the exercise of its business judgment, that the renewal of the Advisory Contracts was in the best interests of the fund and its shareholders and that the compensation payable under the Advisory Contracts was fair and reasonable in light of all of the surrounding circumstances.
Nature, Extent, and Quality of Services Provided. The Board considered staffing as it relates to the fund, including the backgrounds and experience of investment personnel of the Investment Advisers, and also considered the Investment Advisers' implementation of the fund's investment program. The Independent Trustees also had discussions with senior management of Fidelity's investment operations and investment groups. The Board considered the structure of the investment personnel compensation program and whether this structure provides appropriate incentives to act in the best interests of the fund. Additionally, the Board considered the portfolio managers' investments, if any, in the funds that they manage.
Resources Dedicated to Investment Management and Support Services. The Board and the Fund Oversight and Research Committees reviewed the general qualifications and capabilities of Fidelity's investment staff, including its size, education, experience, and resources, as well as Fidelity's approach to recruiting, training, managing, and compensating investment personnel. The Board noted the resources devoted to expansion of Fidelity's global investment organization, and that Fidelity's analysts have extensive resources, tools, and capabilities that allow them to conduct sophisticated quantitative and fundamental analysis, as well as credit analysis of issuers, counterparties, and guarantors. Further, the Board considered that Fidelity's investment professionals have sufficient access to global information and data so as to provide competitive investment results over time, and that those professionals also have access to sophisticated tools that permit them to assess portfolio construction and risk and performance attribution characteristics continuously, as well as to transmit new information and research conclusions rapidly around the world. Additionally, in its deliberations, the Board considered Fidelity's trading, risk management, compliance, and technology and operations capabilities and resources, which are integral parts of the investment management process.
Shareholder and Administrative Services. The Board considered (i) the nature, extent, quality, and cost of advisory, administrative, and shareholder services performed by the Investment Advisers and their affiliates under the Advisory Contracts and under separate agreements covering transfer agency and pricing and bookkeeping services for the fund; (ii) the nature and extent of Fidelity's supervision of third party service providers, principally custodians, subcustodians, and pricing vendors; and (iii) the resources devoted by Fidelity to, and the record of compliance with, the fund's compliance policies and procedures. The Board also reviewed the allocation of fund brokerage, including allocations to brokers affiliated with the Investment Advisers, the use of brokerage commissions to pay fund expenses, and the use of "soft" commission dollars to pay for research services. The Board also considered the fund's securities lending activities and any payments made to Fidelity relating to securities lending under a separate agreement.
The Board noted that the growth of fund assets over time across the complex allows Fidelity to reinvest in the development of services designed to enhance the value and convenience of the Fidelity funds as investment vehicles. These services include 24-hour access to account information and market information over the Internet and through telephone representatives, investor education materials, and asset allocation tools. The Board also considered that it reviews customer service metrics such as telephone response times, continuity of services on the website and metrics addressing services at Fidelity Investor Centers.
Investment in a Large Fund Family. The Board considered the benefits to shareholders of investing in a fund that is part of a large family of funds offering a variety of investment disciplines and providing a large variety of fund investor services. The Board noted that Fidelity had taken, or had made recommendations that resulted in the Fidelity funds taking, a number of actions over the previous year that benefited particular funds and/or the Fidelity funds in general.
Investment Performance. The Board took into account discussions that occur with representatives of the Investment Advisers, and reports that it receives, at Board meetings throughout the year, relating to fund investment performance. In this regard the Board noted that as part of regularly scheduled fund reviews and other reports to the Board on fund performance, the Board considered annualized return information for the fund for different time periods, measured against an appropriate securities market index (benchmark index). The Board also considered information about performance attribution. In its ongoing evaluation of fund investment performance, the Board gives particular attention to information indicating changes in performance of the funds over different time periods and discussed with the Investment Advisers the reasons for any overperformance or underperformance.
In addition to reviewing absolute and relative fund performance, the Independent Trustees periodically consider the appropriateness of fund performance metrics in evaluating the results achieved. The Independent Trustees generally give greater weight to fund performance over longer time periods than over shorter time periods. Depending on the circumstances, the Independent Trustees may be satisfied with a fund's performance notwithstanding that it lags its benchmark index for certain periods.
Based on its review, the Board concluded that the nature, extent, and quality of services provided to the fund under the Advisory Contracts should continue to benefit the shareholders of the fund.
Competitiveness of Management Fee and Total Expense Ratio. The Board was provided with information regarding industry trends in management fees and expenses. The Board considered that, effective March 1, 2024, an amended Advisory Contract with FMR went into effect with a flat management fee that replaced the prior management fee structure. In its review of the fund's management fee and total expense ratio, the Board considered the fund's pro forma management fee rate as if it had been in effect for the 12-month period ended September 30, 2023, as well as other fund expenses. The Board noted that Fidelity may agree to waive fees or reimburse expenses from time to time, and the extent to which, if any, it has done so for the fund.
Comparisons of Management Fees and Total Expense Ratios. Among other things, the Board reviewed data for selected groups of competitive funds and classes (referred to as "mapped groups") that were compiled by Fidelity based on combining similar investment objective categories (as classified by Lipper) that have comparable investment mandates. The data reviewed by the Board included (i) gross management fee comparisons (before taking into account expense reimbursements or caps) relative to the total universe of funds within the mapped group; (ii) gross management fee comparisons relative to a subset of non-Fidelity funds in the mapped group that are similar in size and management fee structure to the fund (referred to as the "asset size peer group"); (iii) total expense comparisons of the fund relative to funds and classes in the mapped group that have a similar sales load structure to the fund (referred to as the "similar sales load structure group"); and (iv) total expense comparisons of the fund relative to funds and classes in the similar sales load structure group that are similar in size and management fee structure to the fund (referred to as the "total expense asset size peer group"). The total expense asset size peer group comparison excludes performance adjustments and fund-paid 12b-1 fees to eliminate variability in fee structures.
The information provided to the Board indicated that the fund's management fee rate ranked below the competitive median of the mapped group for the period ended September 30, 2023 and below the competitive median of the asset size peer group for the period ended September 30, 2023. Further, the information provided to the Board indicated that the total expense ratio of the fund ranked below the competitive median of the similar sales load structure group for the period ended September 30, 2023 and below the competitive median of the total expense asset size peer group for the period ended September 30, 2023.
Other Contractual Arrangements. The Board further considered that FMR has contractually agreed to reimburse the fund to the extent that total operating expenses, with certain exceptions, as a percentage of its average net assets, exceed 0.95% through February 28, 2025.
Fees Charged to Other Fidelity Clients. The Board also considered Fidelity fee structures and other information with respect to clients of Fidelity, such as other funds advised or subadvised by Fidelity, pension plan clients, and other institutional clients with similar mandates. The Board noted that a joint ad hoc committee created by it and the boards of other Fidelity funds periodically reviews and compares Fidelity's institutional investment advisory business with its business of providing services to the Fidelity funds and also noted the most recent findings of the committee. The Board noted that the committee's review included a consideration of the differences in services provided, fees charged, and costs incurred, as well as competition in the markets serving the different categories of clients.
Based on its review, the Board concluded that the fund's management fee is fair and reasonable in light of the services that the fund receives and the other factors considered. Further, based on its review of total expense ratios and fees charged to other Fidelity clients, the Board concluded that the fund's total expense ratio was reasonable in light of the services that the fund and its shareholders receive and the other factors considered.
Costs of the Services and Profitability. The Board considered the revenues earned and the expenses incurred by Fidelity in conducting the business of developing, marketing, distributing, managing, administering and servicing the fund and servicing the fund's shareholders. The Board also considered the level of Fidelity's profits in respect of all the Fidelity funds.
On an annual basis, Fidelity presents to the Board information about the profitability of its relationships with the fund. Fidelity calculates profitability information for each fund, as well as aggregate profitability information for groups of Fidelity funds and all Fidelity funds, using a series of detailed revenue and cost allocation methodologies which originate with the books and records of Fidelity on which Fidelity's audited financial statements are based. The Audit Committee of the Board reviews any significant changes from the prior year's methodologies.
A public accounting firm has been engaged annually by the Board as part of the Board's assessment of Fidelity's profitability analysis. The engagement includes the review and assessment of the methodologies used by Fidelity in determining the revenues and expenses attributable to Fidelity's fund business, and completion of agreed-upon procedures in respect of the mathematical accuracy of certain fund profitability information and its conformity to established allocation methodologies. After considering the reports issued under the engagement and information provided by Fidelity, the Board concluded that while other allocation methods may also be reasonable, Fidelity's profitability methodologies are reasonable in all material respects.
The Board also reviewed Fidelity's non-fund businesses and potential indirect benefits such businesses may have received as a result of their association with Fidelity's fund business (i.e., fall-out benefits) as well as cases where Fidelity's affiliates may benefit from the funds' business. The Board considered areas where potential indirect benefits to the Fidelity funds from their relationships with Fidelity may exist. The Board's consideration of these matters was informed by the findings of a joint ad hoc committee created by it and the boards of other Fidelity funds to evaluate potential fall-out benefits.
The Board considered the costs of the services provided by and the profits realized by Fidelity in connection with the operation of the fund and was satisfied that the profitability was not excessive.
Economies of Scale. The Board considered whether there have been economies of scale in respect of the management of the Fidelity funds, whether the Fidelity funds (including the fund) have appropriately benefited from any such economies of scale, and whether there is potential for realization of any further economies of scale. The Board considered the extent to which the fund will benefit from economies of scale as assets grow through increased services to the fund, through waivers or reimbursements, or through fee or expense ratio reductions. The Board also noted that a committee created by it and the boards of other Fidelity funds periodically analyzes whether Fidelity attains economies of scale in respect of the management and servicing of the Fidelity funds, whether the Fidelity funds have appropriately benefited from such economies of scale, and whether there is potential for realization of any further economies of scale.
The Board concluded, taking into account the analysis of the committee, that economies of scale, if any, are being appropriately shared between fund shareholders and Fidelity.
Additional Information Requested by the Board. In order to develop fully the factual basis for consideration of the Fidelity funds' advisory contracts, the Board requested and received additional information on certain topics, including but not limited to: (i) fund flow and performance trends, in particular the underperformance of certain funds and strategies, and Fidelity's long-term strategies for certain funds; (ii) the operation of performance fees and the rationale for implementing performance fees on certain categories of funds but not others; (iii) Fidelity's pricing philosophy compared to competitors; (iv) fund profitability methodology and data; (v) evaluation of competitive fund data and peer group classifications and fee and expense comparisons; (vi) the management fee and expense structures for different funds and classes and information about the differences between various fee and expense structures; (vii) the variable management fee implemented for certain funds effective March 1, 2024; and (viii) information regarding other accounts managed by Fidelity and the funds' sub-advisory arrangements.
Conclusion. Based on its evaluation of all of the conclusions noted above, and after considering all factors it believed relevant, the Board, including the Independent Trustees, concluded that the advisory and sub-advisory fee arrangements are fair and reasonable in light of all of the surrounding circumstances and that the fund's Advisory Contracts should be renewed through May 31, 2025.
1.9905647.102
ESP-ANN-1224
Item 8.
Changes in and Disagreements with Accountants for Open-End Management Investment Companies
See Item 7.
Item 9.
Proxy Disclosures for Open-End Management Investment Companies
See Item 7.
Item 10.
Remuneration Paid to Directors, Officers, and Others of Open-End Management Investment Companies
See Item 7.
Item 11.
Statement Regarding Basis for Approval of Investment Advisory Contract
See Item 7.
Item 12.
Disclosure of Proxy Voting Policies and Procedures for Closed-End Management Investment Companies
Not applicable.
Item 13.
Portfolio Managers of Closed-End Management Investment Companies
Not applicable.
Item 14.
Purchase of Equity Securities by Closed-End Management Investment Company and Affiliated Purchasers
Not applicable.
Item 15.
Submission of Matters to a Vote of Security Holders
There were no material changes to the procedures by which shareholders may recommend nominees to the trust’s Board of Trustees.
Item 16.
Controls and Procedures
(a)(i) The President and Treasurer and the Chief Financial Officer have concluded that the trust’s disclosure controls and procedures (as defined in Rule 30a-3(c) under the Investment Company Act) provide reasonable assurances that material information relating to the trust is made known to them by the appropriate persons, based on their evaluation of these controls and procedures as of a date within 90 days of the filing date of this report.
(a)(ii) There was no change in the trust’s internal control over financial reporting (as defined in Rule 30a-3(d) under the Investment Company Act) that occurred during the period covered by this report that has materially affected, or is reasonably likely to materially affect, the trust’s internal control over financial reporting.
Item 17.
Disclosure of Securities Lending Activities for Closed-End Management Investment Companies
Not applicable.
Item 18.
Recovery of Erroneously Awarded Compensation
(a)
Not applicable.
(b)
Not applicable.
Item 19.
Exhibits
SIGNATURES
Pursuant to the requirements of the Securities Exchange Act of 1934 and the Investment Company Act of 1940, the registrant has duly caused this report to be signed on its behalf by the undersigned, thereunto duly authorized.
Fidelity Investment Trust
|
By: | /s/Stacie M. Smith |
| Stacie M. Smith |
| President and Treasurer (Principal Executive Officer) |
|
|
Date: | December 20, 2024 |
Pursuant to the requirements of the Securities Exchange Act of 1934 and the Investment Company Act of 1940, this report has been signed below by the following persons on behalf of the registrant and in the capacities and on the dates indicated.
|
By: | /s/Stacie M. Smith |
| Stacie M. Smith |
| President and Treasurer (Principal Executive Officer) |
|
|
Date: | December 20, 2024 |
|
By: | /s/Stephanie Caron |
| Stephanie Caron |
| Chief Financial Officer (Principal Financial Officer) |
|
|
Date: | December 20, 2024 |